| | |
| UNITED STATES |
| SECURITIES AND EXCHANGE COMMISSION |
| Washington, D.C. 20549 |
| |
| FORM N-CSR |
| |
| CERTIFIED SHAREHOLDER REPORT OF REGISTERED |
| MANAGEMENT INVESTMENT COMPANIES |
| |
| Investment Company Act file number | 811-04363 |
| |
| AMERICAN CENTURY GOVERNMENT INCOME TRUST |
| (Exact name of registrant as specified in charter) |
| |
| 4500 MAIN STREET, KANSAS CITY, MISSOURI | 64111 |
| (Address of principal executive offices) | (Zip Code) |
| |
| CHARLES A. ETHERINGTON |
| 4500 MAIN STREET, KANSAS CITY, MISSOURI 64111 |
| (Name and address of agent for service) |
|
| Registrant’s telephone number, including area code: | 816-531-5575 |
| |
| Date of fiscal year end: | 03-31 |
| |
| Date of reporting period: | 03-31-2010 |
| |
| ITEM 1. REPORTS TO STOCKHOLDERS |
|
| Annual Report | |
| March 31, 2010 | |

|
| American Century Investments® |
Capital Preservation Fund
| |
| President’s Letter | 2 |
| Market Perspective | 3 |
| U.S. Fixed-Income Total Returns | 3 |
| |
| Capital Preservation | |
| |
| Performance | 4 |
| Yields | 5 |
| Weighted Average Maturity/Life | 5 |
| Portfolio Composition by Maturity | 5 |
| |
| Shareholder Fee Example | 6 |
| |
| Financial Statements | |
| |
| Schedule of Investments | 8 |
| Statement of Assets and Liabilities | 9 |
| Statement of Operations | 10 |
| Statement of Changes in Net Assets | 11 |
| Notes to Financial Statements | 12 |
| Financial Highlights | 16 |
| Report of Independent Registered Public Accounting Firm | 17 |
| |
| Other Information | |
| |
| Management | 18 |
| Board Approval of Management Agreements | 22 |
| Additional Information | 28 |
| Index Definitions | 29 |
Any opinions expressed in this report reflect those of the author as of the date of the report, and do not necessarily represent the opinions of American Century Investments or any other person in the American Century Investments organization. Any such opinions are subject to change at any time based upon market or other conditions and American Century Investments disclaims any responsibility to update such opinions. These opinions may not be relied upon as investment advice and, because investment decisions made by American Century Investments funds are based on numerous factors, may not be relied upon as an indication of trading intent on behalf of any American Century Investments fund. Security examples are used for representational purposes only and are not intended as recommendations to purchase or sell securities. Performance information for comparative indices and securities is provided to American Century Investments by third party vendors. To the best of American Century Investments’ knowledge, such information is accurate at the time of printing.

Dear Investor:
To learn more about the capital markets, your investment, and the portfolio management strategies American Century Investments provides, we encourage you to review this shareholder report for the financial reporting period ended March 31, 2010.
On the following pages, you will find investment performance and portfolio information, presented with the expert perspective and commentary of our portfolio management team. This report remains one of our most important vehicles for conveying the information you need about your investment performance, and about the market factors and strategies that affect fund returns. For additional information on the markets, we encourage you to visit the “Insights & News” tab at our Web site, americancentury.com, for updates and further expert commentary.
The top of our Web site’s home page also provides a link to “Our Story,” which, first and foremost, outlines our commitment—since 1958—to helping clients reach their financial goals. We believe strongly that we will only be successful when our clients are successful. That’s who we are.
Another important, unique facet of our story and who we are is “Profits with a Purpose,” which describes our bond with the Stowers Institute for Medical Research (SIMR). SIMR is a world-class biomedical organization—founded by our company founder James E. Stowers, Jr. and his wife Virginia—that is dedicated to researching the causes, treatment, and prevention of gene-based diseases, including cancer. Through American Century Investments’ private ownership structure, more than 40% of our profits support SIMR.
Mr. Stowers’ example of achieving financial success and using that platform to help humanity motivates our entire American Century Investments team. His story inspires us to help each of our clients achieve success. Thank you for sharing your financial journey with us.
Sincerely,

Jonathan Thomas
President and Chief Executive Officer
American Century Investments
2

By David MacEwen, Chief Investment Officer, Fixed Income
Economic and Market Rebound
Fixed-income markets witnessed a historically wide dispersion of returns in the 12 months ended March 31, 2010 (see the table below), which captured the rebound of the U.S. economy and financial markets from the depths of the recession and credit crisis. The foundation for this dramatic turnaround was laid by the government’s extraordinary monetary and fiscal stimulus policies taken in response to the financial crisis in late 2008.
These stimulus measures helped the U.S. economy emerge from the Great Recession and return to positive growth in the second half of 2009, while inflation remained tame. Nevertheless, the unemployment rate stood at 9.7% in March 2010 and bank lending—a key driver of economic growth—remained weak. In that environment, the Federal Reserve (the Fed) held its short-term rate target near 0%, where it’s stood since December 2008.
Historic Extremes in Bond Performance
Better economic and market conditions caused a reversal of the trading that colored the credit crisis, when the lowest-rated bonds performed worst and investors favored the safety of Treasuries over virtually every other type of investment. This sharp reversal meant calendar 2009 was the worst year on record for longer-term Treasury bonds, while credit-sensitive bonds enjoyed their best year ever. These performance trends continued into 2010; as a result, high-yield and investment-grade corporate bonds enjoyed remarkable returns in the 12 months ended in March. At the same time, intermediate- and long-term Treasuries produced very poor performance as investors worried about the effect of massive debt and unprecedented monetary policies on future inflation and interest rates. With short rates anchored by the Fed, declining prices and rising yields for longer-dated Treasuries meant the difference in yield between sh ort- and long-term bonds approached historic wides (the yield curve steepened).
Mortgage-backed securities had modest, positive returns, buoyed by the Fed’s active support for this market, which ended in March 2010. Cash returns were essentially flat, reflecting the Fed’s policy of extremely low rates. For the fiscal year, the Barclays Capital U.S. Aggregate Index (a broad-based bond index) rose 7.69%, as Treasuries’ negative returns offset the strong performance of credit-sensitive sectors.
| | | | |
| U.S. Fixed-Income Total Returns | | | | |
| For the 12 months ended March 31, 2010 | | | | |
| Treasury Bellwethers | | | Barclays Capital U.S. Bond Market Indices | |
| 3-Month Bill | 0.19% | | Corporate High-Yield | 56.18% |
| 2-Year Note | 1.58% | | Corporate Investment-Grade | 23.80% |
| 10-Year Note | –6.35% | | Aggregate | 7.69% |
| 30-Year Bond | –14.43% | | TIPS (inflation-linked) | 6.18% |
| | | | Mortgage (mortgage-backed) | 5.21% |
| | | | Treasury | –1.18% |
3
| | | | | | | |
| Capital Preservation | | | | | |
| |
| Total Returns as of March 31, 2010 | | | | | |
| | | | | Average Annual Returns | |
| | | Ticker | | | | Since | Inception |
| | | Symbol | 1 year | 5 years | 10 years | Inception | Date |
| Capital Preservation | CPFXX | 0.01%(1) | 2.48%(1) | 2.38% | 4.49% | 10/13/72 |
| Barclays Capital U.S. | | | | | | |
| 1- to 3-Month Treasury | | | | | | |
| Bill Index(2) | — | 0.13% | 2.77% | 2.71% | N/A(3) | — |
| 90-Day U.S. Treasury | | | | | | |
| Bill Index(4) | — | 0.12% | 2.61% | 2.56% | 5.82%(5) | — |
| Lipper U.S. Treasury Money | | | | | | |
| Market Funds Average Return(4) | — | 0.02% | 2.19% | 2.12% | 5.46%(6) | — |
| Fund’s Lipper Ranking Among U.S. | | | | | | |
| Treasury Money Market Funds(4) | — | 34 of 71 | 7 of 65 | 6 of 45 | 1 of 1(6) | — |
| (1) | Fund returns would have been lower if American Century Investments had not voluntarily waived a portion of its management fees. |
| (2) | In January 2010, the fund’s benchmark changed from the 90-Day U.S. Treasury Bill Index to the Barclays Capital U.S. 1- to 3-Month Treasury |
| | Bill Index. This reflects a change in the portfolio management analytics software used by American Century Investments’ fixed-income teams. |
| | The investment process is unchanged. | | | | | | |
| (3) | Index data not available prior to 2/1/89. | | | | | | |
| (4) | Data provided by Lipper Inc. – A Reuters Company. © 2010 Reuters. All rights reserved. Any copying, republication or redistribution of Lipper |
| | content, including by caching, framing or similar means, is expressly prohibited without the prior written consent of Lipper. Lipper shall not be |
| | liable for any errors or delays in the content, or for any actions taken in reliance thereon. | | | |
| | Lipper Fund Performance — Performance data is total return, and is preliminary and subject to revision. | | |
| | Lipper Rankings — Rankings are based only on the universe shown and are based on average annual total returns. This listing might not |
| | represent the complete universe of funds tracked by Lipper. | | | | | |
| | The data contained herein has been obtained from company reports, financial reporting services, periodicals and other resources believed to be |
| | reliable. Although carefully verified, data on compilations is not guaranteed by Lipper and may be incomplete. No offer or solicitations to buy or |
| | sell any of the securities herein is being made by Lipper. | | | | | |
| (5) | Since 9/30/72, the date nearest the fund’s inception for which data are available. | | | |
| (6) | Since 10/31/72, the date nearest the fund’s inception for which data are available. | | | |
| |
| Total Annual Fund Operating Expenses |
| Capital Preservation | 0.49% |
The total annual fund operating expenses shown is as stated in the fund’s prospectus current as of the date of this report. The prospectus may vary from the expense ratio shown elsewhere in this report because it is based on a different time period, includes acquired fund fees and expenses, and, if applicable, does not include fee waivers or expense reimbursements.
Data presented reflect past performance. Past performance is no guarantee of future results. Current performance may be higher or lower than the performance shown. To obtain performance data current to the most recent month end, please call 1-800-345-2021 or visit americancentury.com.
An investment in the fund is not insured or guaranteed by the Federal Deposit Insurance Corporation or any other government agency. Although the fund seeks to preserve the value of your investment at $1.00 per share, it is possible to lose money by investing in the fund.
The 7-day current yield more closely reflects the current earnings of the fund than the total return.
4
| |
| Capital Preservation | |
| |
| Yields as of March 31, 2010 | |
| 7-Day Current Yield | |
| After waiver* | 0.01% |
| Before waiver | -0.29% |
| 7-Day Effective Yield* | |
| | 0.01% |
| *The yields presented reflect the waiver of a portion of the fund’s management fees. Without such waiver, the 7-day yields would have been lower. |
| |
| Weighted Average Maturity/Life | |
| | 3/31/10 |
| Weighted Average Maturity | 48 days |
| Weighted Average Life | 48 days |
| |
| Portfolio Composition by Maturity | |
| | % of fund investments |
| | as of 3/31/10 |
| 1 – 30 days | 60% |
| 31 – 90 days | 24% |
| 91 – 180 days | 7% |
| More than 180 days | 9% |
Data presented reflect past performance. Past performance is no guarantee of future results. Current performance may be higher or lower than the performance shown. To obtain performance data current to the most recent month end, please call 1-800-345-2021 or visit americancentury.com.
An investment in the fund is not insured or guaranteed by the Federal Deposit Insurance Corporation or any other government agency. Although the fund seeks to preserve the value of your investment at $1.00 per share, it is possible to lose money by investing in the fund.
The 7-day current yield more closely reflects the current earnings of the fund than the total return.
5
|
| Shareholder Fee Example (Unaudited) |
Fund shareholders may incur two types of costs: (1) transaction costs, including sales charges (loads) on purchase payments and redemption/ exchange fees; and (2) ongoing costs, including management fees; distribution and service (12b-1) fees; and other fund expenses. This example is intended to help you understand your ongoing costs (in dollars) of investing in your fund and to compare these costs with the ongoing cost of investing in other mutual funds.
The example is based on an investment of $1,000 made at the beginning of the period and held for the entire period from October 1, 2009 to March 31, 2010.
Actual Expenses
The table provides information about actual account values and actual expenses for each class. You may use the information, together with the amount you invested, to estimate the expenses that you paid over the period. First, identify the share class you own. Then simply divide your account value by $1,000 (for example, an $8,600 account value divided by $1,000 = 8.6), then multiply the result by the number under the heading “Expenses Paid During Period” to estimate the expenses you paid on your account during this period.
If you hold Investor Class shares of any American Century Investments fund, or Institutional Class shares of the American Century Diversified Bond Fund, in an American Century Investments account (i.e., not a financial intermediary or retirement plan account), American Century Investments may charge you a $12.50 semiannual account maintenance fee if the value of those shares is less than $10,000. We will redeem shares automatically in one of your accounts to pay the $12.50 fee. In determining your total eligible investment amount, we will include your investments in all personal accounts (including American Century Investments Brokerage accounts) registered under your Social Security number. Personal accounts include individual accounts, joint accounts, UGMA/UTMA accounts, personal trusts, Coverdell Education Savings Accounts and IRAs (including traditional, Roth, Rollover, SEP-, SARSEP- and SIMPLE-IRAs), and certain other retirement accounts. If you have only business, business retirement, employer-sponsored or American Century Investments Brokerage accounts, you are currently not subject to this fee. We will not charge the fee as long as you choose to manage your accounts exclusively online. If you are subject to the Account Maintenance Fee, your account value could be reduced by the fee amount.
Hypothetical Example for Comparison Purposes
The table also provides information about hypothetical account values and hypothetical expenses based on the actual expense ratio of each class of your fund and an assumed rate of return of 5% per year before expenses, which is not the actual return of a fund’s share class. The hypothetical account values and expenses may not be used to estimate the actual ending account balance or expenses you paid for the period. You may use this information to compare the ongoing costs of investing in your fund and other funds. To do so, compare this 5% hypothetical example with the 5% hypothetical examples that appear in the shareholder reports of the other funds.
6
Please note that the expenses shown in the table are meant to highlight your ongoing costs only and do not reflect any transactional costs, such as sales charges (loads) or redemption/exchange fees. Therefore, the table is useful in comparing ongoing costs only, and will not help you determine the relative total costs of owning different funds. In addition, if these transactional costs were included, your costs would have been higher.
| | | | | |
| | | Beginning | Ending | Expenses Paid | |
| | | Account Value | Account Value | During Period(1) | Annualized |
| | | 10/1/09 | 3/31/10 | 10/1/09 – 3/31/10 | Expense Ratio(1) |
| Actual (after waiver)(2) | $1,000 | $1,000.00 | $0.75 | 0.15% |
| Actual (before waiver) | $1,000 | $1,000.00(3) | $2.34 | 0.47% |
| Hypothetical (after waiver)(2) | $1,000 | $1,024.18 | $0.76 | 0.15% |
| Hypothetical (before waiver) | $1,000 | $1,022.59 | $2.37 | 0.47% |
| (1) | Expenses are equal to the fund’s annualized expense ratio listed in the table above, multiplied by the average account value over the period, |
| | multiplied by 182, the number of days in the most recent fiscal half-year, divided by 365, to reflect the one-half year period. |
| (2) | During the six months ended March 31, 2010, the fund received a partial waiver of its management fee. | |
| (3) | Ending account value assumes the return earned after waiver. The return would have been lower had fees not been waived and would have |
| | resulted in a lower ending account value. | | | |
7
| | | | | | |
| Capital Preservation | | | | | |
| |
| MARCH 31, 2010 | | | | | | |
| | Principal | | | | Principal | |
| | Amount | Value | | | Amount | Value |
| U.S. Treasury Bills(1) — 91.0% | | | U.S. Treasury Bills, | | |
| | | | | 0.32%, 11/18/10(2) | $ 10,000,000 | $ 9,979,467 |
| U.S. Treasury Bills, | | | | U.S. Treasury Bills, | | |
| 0.18%, 4/1/10(2) | $335,000,000 | $ 335,000,000 | | | | |
| | | | | 0.34%, 1/13/11(2) | 50,000,000 | 49,863,476 |
| U.S. Treasury Bills, | | | | U.S. Treasury Bills, | | |
| 0.10%, 4/8/10(2) | 270,000,000 | 269,994,925 | | | | |
| | | | | 0.34%, 2/10/11(2) | 10,000,000 | 9,970,688 |
| U.S. Treasury Bills, | | | | TOTAL U.S. TREASURY BILLS | 2,869,296,769 |
| 0.12%, 4/15/10(2) | 390,000,000 | 389,981,454 | | | | |
| U.S. Treasury Bills, | | | | U.S. Treasury Notes(1) — 9.8% | |
| 0.14%, 4/19/10(3) | 100,000,000 | 99,993,000 | | U.S. Treasury Notes, | | |
| U.S. Treasury Bills, | | | | 3.625%, 6/15/10(2) | 15,768,000 | 15,879,423 |
| 0.11%, 4/22/10(2) | 495,000,000 | 494,967,788 | | U.S. Treasury Notes, | | |
| U.S. Treasury Bills, | | | | 2.875%, 6/30/10(2) | 75,000,000 | 75,404,914 |
| 0.13%, 4/29/10(2) | 305,000,000 | 304,968,189 | | U.S. Treasury Notes, | | |
| U.S. Treasury Bills, | | | | 3.875%, 7/15/10(2) | 25,000,000 | 25,245,972 |
| 0.15%, 5/6/10(2) | 125,000,000 | 124,982,378 | | U.S. Treasury Notes, | | |
| U.S. Treasury Bills, | | | | 2.375%, 8/31/10(2) | 15,000,000 | 15,125,404 |
| 0.11%, 5/13/10(2) | 310,000,000 | 309,958,519 | | U.S. Treasury Notes, | | |
| U.S. Treasury Bills, | | | | 4.25%, 10/15/10(2) | 55,000,000 | 56,134,778 |
| 0.13%, 5/20/10(2) | 200,000,000 | 199,964,611 | | U.S. Treasury Notes, | | |
| U.S. Treasury Bills, | | | | 4.375%, 12/15/10(2) | 50,000,000 | 51,402,686 |
| 0.13%, 5/27/10(2) | 85,000,000 | 84,983,472 | | U.S. Treasury Notes, | | |
| U.S. Treasury Bills, | | | | 0.875%, 1/31/11(2) | 70,000,000 | 70,281,398 |
| 0.17%, 6/17/10(2) | 30,000,000 | 29,989,413 | | TOTAL U.S. TREASURY NOTES | 309,474,575 |
| U.S. Treasury Bills, | | | | TOTAL INVESTMENT | | |
| 0.51%, 7/29/10(2) | 10,000,000 | 9,983,307 | | SECURITIES — 100.8% | | 3,178,771,344 |
| U.S. Treasury Bills, | | | | OTHER ASSETS AND | | |
| 0.45%, 8/26/10(2) | 75,000,000 | 74,863,413 | | LIABILITIES — (0.8)% | | (25,404,767) |
| U.S. Treasury Bills, | | | | TOTAL NET ASSETS — 100.0% | $3,153,366,577 |
| 0.40%, 9/23/10(2) | 20,000,000 | 19,961,500 | | | | |
| U.S. Treasury Bills, | | | | | | |
| 0.39%, 10/21/10(2) | 50,000,000 | 49,891,169 | | | | |
| |
| Notes to Schedule of Investments |
| (1) | The rates for U.S. Treasury Bills are the yield to maturity at purchase. The rates for U.S. Treasury Notes are the stated coupon rates. |
| (2) | Security, or a portion thereof, has been segregated for when-issued securities. At the period end, the aggregate value of securities pledged |
| | was $99,993,000. |
| (3) | When-issued security. |
See Notes to Financial Statements.
8
|
| Statement of Assets and Liabilities |
| |
| MARCH 31, 2010 | |
| Assets | |
| Investment securities, at value (amortized cost and cost for federal income tax purposes) | $3,178,771,344 |
| Cash | 3,937,248 |
| Receivable for investments sold | 367,999,489 |
| Receivable for capital shares sold | 2,869,343 |
| Interest receivable | 2,766,367 |
| | 3,556,343,791 |
| |
| Liabilities | |
| Payable for investments purchased | 399,952,750 |
| Payable for capital shares redeemed | 2,624,696 |
| Accrued management fees | 399,415 |
| Dividends payable | 353 |
| | 402,977,214 |
| |
| Net Assets | $3,153,366,577 |
| |
| Capital Shares | |
| Outstanding (unlimited number of shares authorized) | 3,153,359,841 |
| |
| Net Asset Value Per Share | $1.00 |
| |
| Net Assets Consist of: | |
| Capital paid in | $3,153,360,737 |
| Undistributed net realized gain on investment transactions | 5,840 |
| | $3,153,366,577 |
| |
| |
| See Notes to Financial Statements. | |
9
| |
| YEAR ENDED MARCH 31, 2010 | |
| Investment Income (Loss) | |
| Income: | |
| Interest | $ 9,456,575 |
| | |
| Expenses: | |
| Management fees | 15,730,790 |
| Temporary guarantee program fees | 109,295 |
| Trustees’ fees and expenses | 136,882 |
| Other expenses | 4,292 |
| | 15,981,259 |
| Fees waived | (6,774,971) |
| | 9,206,288 |
| | |
| Net investment income (loss) | 250,287 |
| | |
| Net realized gain (loss) on investment transactions | 5,839 |
| | |
| Net Increase (Decrease) in Net Assets Resulting from Operations | $ 256,126 |
| |
| |
| See Notes to Financial Statements. | |
10
|
| Statement of Changes in Net Assets |
| | |
| YEARS ENDED MARCH 31, 2010 AND MARCH 31, 2009 | | |
| Increase (Decrease) in Net Assets | 2010 | 2009 |
| Operations | | |
| Net investment income (loss) | $ 250,287 | $ 29,672,718 |
| Net realized gain (loss) | 5,839 | 240,086 |
| Net increase (decrease) in net assets resulting from operations | 256,126 | 29,912,804 |
| | | |
| Distributions to Shareholders | | |
| From net investment income | (331,749) | (29,591,256) |
| From net realized gains | (85,586) | — |
| Decrease in net assets from distributions | (417,335) | (29,591,256) |
| | | |
| Capital Share Transactions | | |
| Proceeds from shares sold | 1,086,059,699 | 2,075,342,915 |
| Proceeds from reinvestment of distributions | 409,766 | 28,736,516 |
| Payments for shares redeemed | (1,501,227,094) | (1,806,949,726) |
| Net increase (decrease) in net assets from capital share transactions | (414,757,629) | 297,129,705 |
| | | |
| Net increase (decrease) in net assets | (414,918,838) | 297,451,253 |
| | | |
| Net Assets | | |
| Beginning of period | 3,568,285,415 | 3,270,834,162 |
| End of period | $ 3,153,366,577 | $ 3,568,285,415 |
| | | |
| Undistributed net investment income | — | $81,462 |
| | | |
| Transactions in Shares of the Fund | | |
| Sold | 1,086,059,699 | 2,075,342,915 |
| Issued in reinvestment of distributions | 409,766 | 28,736,516 |
| Redeemed | (1,501,227,094) | (1,806,949,726) |
| Net increase (decrease) in shares of the fund | (414,757,629) | 297,129,705 |
| |
| |
| |
| See Notes to Financial Statements. | | |
11
|
| Notes to Financial Statements |
MARCH 31, 2010
1. Organization and Summary of Significant Accounting Policies
Organization — American Century Government Income Trust (the trust) is registered under the Investment Company Act of 1940 (the 1940 Act) as an open-end management investment company. Capital Preservation Fund (the fund) is one fund in a series issued by the trust. The fund is diversified under Rule 2a-7 of the 1940 Act. The fund’s investment objective is to seek maximum safety and liquidity by investing in short-term money market securities issued by the U.S. Treasury that are guaranteed by the direct full faith and credit pledge of the U.S. government. Its secondary objective is to seek to pay shareholders the highest rate of return consistent with safety and liquidity. The following is a summary of the fund’s significant accounting policies.
Security Valuations — Securities are generally valued at amortized cost, which approximates current market value. Investments in open-end management investment companies are valued at the reported net asset value. When such valuations do not reflect market value, securities may be valued as determined by the Board of Trustees or its designee, in accordance with procedures adopted by the Board of Trustees.
Security Transactions — For financial reporting purposes, security transactions are accounted for as of the trade date. Net realized gains and losses are determined on the identified cost basis, which is also used for federal income tax purposes.
Investment Income — Interest income is recorded on the accrual basis and includes accretion of discounts and amortization of premiums.
When-Issued and Forward Commitments — The fund may engage in securities transactions on a when-issued or forward commitment basis. In these transactions, the securities’ prices and yields are fixed on the date of the commitment. In a when-issued transaction, the payment and delivery are scheduled for a future date and during this period, securities are subject to market fluctuations. In a forward commitment transaction, the fund may sell a security and at the same time make a commitment to purchase the same security at a future date at a specified price. Conversely, the fund may purchase a security and at the same time make a commitment to sell the same security at a future date at a specified price. These types of transactions are executed simultaneously in what are known as “roll” transactions. The fund will segregate cash, cash equivalents or other appropriate liquid securities on its records in amounts sufficient to meet the purchase price.
Income Tax Status — It is the fund’s policy to distribute substantially all net investment income and net realized gains to shareholders and to otherwise qualify as a regulated investment company under provisions of the Internal Revenue Code. The fund is no longer subject to examination by tax authorities for years prior to 2007. At this time, management believes there are no uncertain tax positions which, based on their technical merit, would not be sustained upon examination and for which it is reasonably possible that the total amounts of unrecognized tax benefits will significantly change in the next twelve months. Accordingly, no provision has been made for federal or state income taxes.
Distributions to Shareholders — Distributions from net investment income and short-term capital gains, if any, are declared daily and paid monthly. The fund does not expect to realize any long-term capital gains, and accordingly, does not expect to pay any capital gains distributions.
Indemnifications — Under the trust’s organizational documents, its officers and trustees are indemnified against certain liabilities arising out of the performance of their duties to the fund. In addition, in the normal course of business, the fund enters into contracts that provide general indemnifications. The maximum exposure under these arrangements is unknown as this would involve future claims that may be made against a fund. The risk of material loss from such claims is considered by management to be remote.
12
Use of Estimates — The financial statements are prepared in conformity with accounting principles generally accepted in the United States of America, which may require management to make certain estimates and assumptions at the date of the financial statements. Actual results could differ from these estimates.
Subsequent Events — In preparing the financial statements, management evaluated the impact of events or transactions occurring through the date the financial statements were issued that would merit recognition or disclosure.
2. Fees and Transactions with Related Parties
Management Fees — The trust has entered into a Management Agreement with American Century Investment Management, Inc. (ACIM) (the investment advisor), under which ACIM provides the fund with investment advisory and management services in exchange for a single, unified management fee (the fee). The Agreement provides that all expenses of managing and operating the fund, except brokerage expenses, taxes, interest, fees and expenses of the independent trustees (including legal counsel fees), and extraordinary expenses, will be paid by ACIM. The fee is computed and accrued daily based on the daily net assets of each specific class of shares of the fund and paid monthly in arrears. The fee consists of (1) an Investment Category Fee based on the daily net assets of the fund and certain other accounts managed by the investment a dvisor that are in the same broad investment category as the fund and (2) a Complex Fee based on the assets of all the funds in the American Century Investments family of funds. The rates for the Investment Category Fee range from 0.1370% to 0.2500% and the rates for the Complex Fee range from 0.2500% to 0.3100%.
Effective August 1, 2009, the investment advisor agreed to waive 0.021% of the fund’s management fee. The investment advisor expects this fee waiver to continue through July 31, 2010 and cannot terminate it without consulting the Board of Trustees. In order to maintain a positive yield, the investment advisor may also voluntarily waive a portion of its management fee as needed on a daily basis. This fee waiver may be revised or terminated at any time without notice. The effective annual management fee before waiver for the year ended March 31, 2010 was 0.47%. The effective annual management fee after waiver for the year ended March 31, 2010 was 0.27%.
Temporary Guarantee Program — On October 3, 2008, the Board of Trustees approved the fund to participate in the U.S. Treasury Department’s Temporary Guarantee Program for Money Market Funds (the program). The program provides coverage to guarantee the account values of shareholders in the event the fund’s net asset value falls below $0.995 and the Trustees liquidate the fund. The program covers the lesser of a shareholder’s account value on September 19, 2008, or on the date of liquidation. Participation in the program requires the fund to pay a fee based on the net assets of the fund as of the close of business on September 19, 2008, which is amortized daily over the period. The fund participated in the program from September 19, 2008 through December 19, 2008 and was subject to a fee of 0.01% of its n et assets as of September 19, 2008, half of which was paid by the fund and the remainder was paid by the investment advisor. The fund continued its participation in the program from December 20, 2008 through April 30, 2009 and paid a fee of 0.015% of its net assets as of September 19, 2008. The Board of Trustees elected not to continue participation by the fund in a program extension from May 1, 2009 through September 18, 2009. The program expired on September 18, 2009. For the year ended March 31, 2010, the ratio of the program fee to average net assets was 0.003%.
Related Parties — Certain officers and trustees of the trust are also officers and/or directors of American Century Companies, Inc. (ACC), the parent of the trust‘s investment advisor, ACIM, the distributor of the trust, American Century Investment Services, Inc., and the trust’s transfer agent, American Century Services, LLC.
The fund is eligible to invest in a money market fund for temporary purposes, which is managed by J.P. Morgan Investment Management, Inc. (JPMIM). The fund has a Mutual Funds Services Agreement with J.P. Morgan Investor Services Co. (JPMIS). JPMorgan Chase Bank (JPMCB) is a custodian of the fund. JPMIM, JPMIS and JPMCB are wholly owned subsidiaries of JPMorgan Chase & Co. (JPM). JPM is an equity investor in ACC.
13
3. Fair Value Measurements
The fund’s securities valuation process is based on several considerations and may use multiple inputs to determine the fair value of the positions held by the fund. In conformity with accounting principles generally accepted in the United States of America, the inputs used to determine a valuation are classified into three broad levels as follows:
• Level 1 valuation inputs consist of unadjusted quoted prices in an active market for identical securities;
• Level 2 valuation inputs consist of significant direct or indirect observable market data (including quoted prices for similar securities, evaluations of subsequent market events, interest rates, prepayment speeds, credit risk, etc.); or
• Level 3 valuation inputs consist of significant unobservable inputs (including a fund’s own assumptions).
The level classification is based on the lowest level input that is significant to the fair valuation measurement. The valuation inputs are not an indication of the risks associated with investing in these securities or other financial instruments.
As of March 31, 2010, the valuation inputs used to determine the fair value of the fund’s investment securities were classified as Level 2.
4. Interfund Lending
The fund, along with certain other funds in the American Century Investments family of funds, may participate in an interfund lending program, pursuant to an Exemptive Order issued by the Securities and Exchange Commission (SEC). This program provides an alternative credit facility allowing the fund to borrow from or lend to other funds in the American Century Investments family of funds that permit such transactions. Interfund lending transactions are subject to each fund’s investment policies and borrowing and lending limits. The interfund loan rate earned/paid on interfund lending transactions is determined daily based on the average of certain current market rates. Interfund lending transactions normally extend only overnight, but can have a maximum duration of seven days. The program is subject to annual approval by the Board of Trustees. During the year ended March 31, 2010, the fund did not utilize the program.
5. Federal Tax Information
The tax character of distributions paid during the years ended March 31, 2010 and March 31, 2009 were as follows:
| | |
| | 2010 | 2009 |
| Distributions Paid From | | |
| Ordinary income | $417,335 | $29,591,256 |
| Long-term capital gains | — | — |
The book-basis character of distributions made during the year from net investment income or net realized gains may differ from their ultimate characterization for federal income tax purposes. These differences reflect the differing character of certain income items and net realized gains and losses for financial statement and tax purposes, and may result in reclassification among certain capital accounts on the financial statements.
As of March 31, 2010, the fund has undistributed ordinary income for federal income tax purposes of $5,840.
14
6. Corporate Event
As part of a long-standing estate and business succession plan established by ACC Co-Chairman James E. Stowers, Jr., the founder of American Century Investments, ACC Co-Chairman Richard W. Brown succeeded Mr. Stowers as trustee of a trust that holds a greater-than-25% voting interest in ACC, the parent corporation of each fund’s advisor. Under the 1940 Act, this is presumed to represent control of ACC even though it is less than a majority interest. The change of trustee may technically be considered a “change of control” of ACC and therefore also a change of control of each fund’s advisor even though there has been no change to their management and none is anticipated. The “change of control” resulted in the assignment of each fund’s investment advisory agreement. Under the 1940 Act, an assignment automatically terminated such agreement, making the approval of a new agreement necessary.
On February 18, 2010, the Board of Trustees approved interim investment advisory agreements under which each fund will be managed until new agreements are approved by fund shareholders. On April 1, 2010, the Board of Trustees approved new investment advisory agreements. The interim agreements and the new agreements are substantially identical to the terminated agreements (with the exception of different effective and termination dates) and will not result in changes in the management of American Century Investments, the funds, their investment objectives, fees or services provided. The new agreements have been submitted to shareholders for approval at a Special Meeting of Shareholders to be held on June 16, 2010.
7. Other Tax Information (Unaudited)
The following information is provided pursuant to provisions of the Internal Revenue Code.
The fund hereby designates $85,586 of distributions as qualified short-term capital gains for purposes of Internal Revenue Code Section 871.
15
| | | | | | |
| Capital Preservation | | | | | |
| |
| For a Share Outstanding Throughout the Years Ended March 31 | | | |
| | | 2010 | 2009 | 2008 | 2007 | 2006 |
| Per-Share Data | | | | | |
| Net Asset Value, Beginning of Period | $1.00 | $1.00 | $1.00 | $1.00 | $1.00 |
| Income From Investment Operations | | | | | |
| Net Investment Income (Loss) | —(1) | 0.01 | 0.04 | 0.04 | 0.03 |
| Distributions | | | | | |
| From Net Investment Income | —(1) | (0.01) | (0.04) | (0.04) | (0.03) |
| From Net Realized Gains | —(1) | — | — | — | — |
| Total Distributions | —(1) | (0.01) | (0.04) | (0.04) | (0.03) |
| Net Asset Value, End of Period | $1.00 | $1.00 | $1.00 | $1.00 | $1.00 |
| |
| Total Return(2) | 0.01% | 0.91% | 3.90% | 4.59% | 3.06% |
| | | | | | |
| Ratios/Supplemental Data | | | | | |
| Ratio of Operating Expenses | | | | | |
| to Average Net Assets | 0.28%(3) | 0.49%(3) | 0.47% | 0.48% | 0.48% |
| Ratio of Operating Expenses | | | | | |
| to Average Net Assets | | | | | |
| (Before Expense Waiver) | 0.48% | 0.49% | 0.47% | 0.48% | 0.48% |
| Ratio of Net Investment Income (Loss) | | | | | |
| to Average Net Assets | 0.01%(3) | 0.87%(3) | 3.78% | 4.50% | 3.01% |
| Ratio of Net Investment Income (Loss) | | | | | |
| to Average Net Assets | | | | | |
| (Before Expense Waiver) | (0.19)% | 0.87% | 3.78% | 4.50% | 3.01% |
| Net Assets, End of Period (in thousands) | $3,153,367 | $3,568,285 | $3,270,834 | $2,656,986 | $2,647,714 |
| (1) | Per-share amount was less than $0.005. | | | | | |
| (2) | Total return assumes reinvestment of net investment income and capital gains distributions, if any. Total returns for periods less than one year |
| | are not annualized. Total returns are calculated based on the net asset value of the last business day. | | |
| (3) | The investment advisor voluntarily agreed to waive a portion of its management fee. The waiver did not impact the ratio for the period ended |
| | March 31, 2009. | | | | | |
See Notes to Financial Statements.
16
|
| Report of Independent Registered Public Accounting Firm |
To the Trustees of the American Century Government Income Trust and
Shareholders of the Capital Preservation Fund:
In our opinion, the accompanying statement of assets and liabilities, including the schedule of investments, and the related statements of operations and of changes in net assets and the financial highlights present fairly, in all material respects, the financial position of the Capital Preservation Fund (one of the five funds comprising the American Century Government Income Trust; hereafter referred to as the “Fund”) at March 31, 2010, the results of its operations for the year then ended, the changes in its net assets for each of the two years in the period then ended and the financial highlights for each of the five years in the period then ended, in conformity with accounting principles generally accepted in the United States of America. These financial statements and financial highlights (hereafter referred to as “financial statements”) are the responsibility of the Fund’s management ; our responsibility is to express an opinion on these financial statements based on our audits. We conducted our audits of these financial statements in accordance with the standards of the Public Company Accounting Oversight Board (United States). Those standards require that we plan and perform the audit to obtain reasonable assurance about whether the financial statements are free of material misstatement. An audit includes examining, on a test basis, evidence supporting the amounts and disclosures in the financial statements, assessing the accounting principles used and significant estimates made by management, and evaluating the overall financial statement presentation. We believe that our audits, which included confirmation of securities at March 31, 2010 by correspondence with the custodian, provide a reasonable basis for our opinion.
PricewaterhouseCoopers LLP
Kansas City, Missouri
May 21, 2010
17
The Board of Trustees
The individuals listed below serve as trustees of the fund. Each trustee will continue to serve in this capacity until death, retirement, resignation or removal from office. The mandatory retirement age for trustees who are not “interested persons,” as that term is defined in the Investment Company Act (independent trustees), is 73. However, the mandatory retirement age may be extended for a period not to exceed two years with the approval of the remaining independent trustees.
Mr. Thomas is the only trustee who is an “interested person” because he currently serves as President and Chief Executive Officer of American Century Companies, Inc. (ACC), the parent company of American Century Investment Management, Inc. (ACIM or the advisor).
The other trustees (more than three-fourths of the total number) are independent; that is, they have never been employees, directors or officers of, and have no financial interest in, ACC or any of its wholly owned, direct or indirect, subsidiaries, including ACIM, American Century Investment Services, Inc. (ACIS) and American Century Services, LLC (ACS). The trustees serve in this capacity for eight (in the case of Mr. Thomas, 15) registered investment companies in the American Century Investments family of funds.
The following presents additional information about the trustees. The mailing address for each trustee other than Mr. Thomas is 1665 Charleston Road, Mountain View, California 94043. The mailing address for Mr. Thomas is 4500 Main Street, Kansas City, Missouri 64111.
Independent Trustees
John Freidenrich
Year of Birth: 1937
Position(s) with the Fund: Trustee
Length of Time Served: Since 2005
Principal Occupation(s) During the Past Five Years: Founder, Member and Manager, Regis
Management Company, LLC (investment management firm) (April 2004 to present)
Number of Funds in Fund Complex Overseen by Trustee: 41
Other Directorships Held by Trustee: None
Education/Other Professional Experience: AB in Economics, Stanford University; LLB,
Stanford Law School; formerly, partner and founder, Ware and Freidenrich Law
Firm and Bay Partners; formerly, President, Board of Trustees, Stanford University
Ronald J. Gilson
Year of Birth: 1946
Position(s) with the Fund: Trustee and Chairman of the Board
Length of Time Served: Since 1995
Principal Occupation(s) During the Past Five Years: Charles J. Meyers Professor of Law and
Business, Stanford Law School (1979 to present); Marc and Eva Stern Professor of
Law and Business, Columbia University School of Law (1992 to present)
Number of Funds in Fund Complex Overseen by Trustee: 41
Other Directorships Held by Trustee: None
Education/Other Professional Experience: BA, Washington University; JD, Yale Law School;
formerly, attorney, Steinhart, Goldberg, Feigenbaum & Ladar
18
Frederick L. A. Grauer
Year of Birth: 1946
Position(s) with the Fund: Trustee
Length of Time Served: Since 2008
Principal Occupation(s) During the Past Five Years: Senior Advisor, BlackRock, Inc. (investment
management firm) (2010 to present); Senior Advisor, Barclays Global Investors
(investment management firm) (2003 to 2009)
Number of Funds in Fund Complex Overseen by Trustee: 41
Other Directorships Held by Trustee: None
Education/Other Professional Experience: BA in Economics, University of British Columbia;
MA in Economics, University of Chicago; PhD in Business, Stanford University;
formerly, Executive Chairman, Barclays Global Investors; Chairman and Chief
Executive Officer, Wells Fargo Nikko Investment Advisors; and Vice President,
Merrill Lynch Capital Markets Group; formerly, Director, New York Stock Exchange,
Chicago Mercantile Exchange and Columbia University; formerly, faculty member,
Graduate School of Business, Columbia University and Alfred P. Sloan School of
Management, Massachusetts Institute of Technology
Peter F. Pervere
Year of Birth: 1947
Position(s) with the Fund: Trustee
Length of Time Served: Since 2007
Principal Occupation(s) During the Past Five Years: Retired
Number of Funds in Fund Complex Overseen by Trustee: 41
Other Directorships Held by Trustee: Intraware, Inc. (2003 to 2009); Digital Impact, Inc.
(2003 to 2005)
Education/Other Professional Experience: BA in History, Stanford University; CPA; formerly,
Vice President and Chief Financial Officer, Commerce One, Inc. (software and
services provider); formerly, Vice President and Corporate Controller, Sybase, Inc.;
formerly with accounting firm of Arthur Young & Co.
Myron S. Scholes
Year of Birth: 1941
Position(s) with the Fund: Trustee
Length of Time Served: Since 1980
Principal Occupation(s) During the Past Five Years: Chairman, Platinum Grove Asset
Management, L.P. (asset manager) (1999 to 2009); Frank E. Buck Professor of
Finance-Emeritus, Stanford Graduate School of Business (1996 to present)
Number of Funds in Fund Complex Overseen by Trustee: 41
Other Directorships Held by Trustee: Dimensional Fund Advisors (investment advisor); CME
Group, Inc. (futures and options exchange)
Education/Other Professional Experience: BA in Economics, McMaster University (Ontario);
MBA and PhD, University of Chicago; formerly, Senior Research Fellow at the
Hoover Institute; formerly, Edward Eagle Brown Professor of Finance, University of
Chicago; recipient of the Alfred Nobel Memorial Prize in Economic Sciences
19
John B. Shoven
Year of Birth: 1947
Position(s) with the Fund: Trustee
Length of Time Served: Since 2002
Principal Occupation(s) During the Past Five Years: Professor of Economics, Stanford University
(1973 to present)
Number of Funds in Fund Complex Overseen by Trustee: 41
Other Directorships Held by Trustee: Cadence Design Systems; Exponent; Financial Engines;
PalmSource, Inc. (2002 to 2005); Watson Wyatt Worldwide (2002 to 2006)
Education/Other Professional Experience: BA in Physics, University of California; PhD in
Economics, Yale University; Director of the Stanford Institute for Economic Policy
Research (1999 to present); formerly, Chair of Economics and Dean of Humanities
and Sciences, Stanford University
Jeanne D. Wohlers
Year of Birth: 1945
Position(s) with the Fund: Trustee
Length of Time Served: Since 1984
Principal Occupation(s) During the Past Five Years: Retired
Number of Funds in Fund Complex Overseen by Trustee: 41
Other Directorships Held by Trustee: None
Education/Other Professional Experience: BA in Mathematics, Skidmore College; MBA,
Columbia University; Chartered Financial Analyst (CFA); formerly, Vice President,
Chief Financial Officer and Secretary, Sybase, Inc.; prior experience as an investment
officer and investment analyst
Interested Trustee
Jonathan S. Thomas
Year of Birth: 1963
Position(s) with the Fund: Trustee and President
Length of Time Served: Since 2007
Principal Occupation(s) During the Past Five Years: President and Chief Executive Officer,
ACC (March 2007 to present); Chief Administrative Officer, ACC (February 2006 to
February 2007); Executive Vice President, ACC (November 2005 to February 2007).
Also serves as: Chief Executive Officer and Manager, ACS; Executive Vice President,
ACIM; Director, ACIM and other ACC subsidiaries. Global Chief Operating Officer
and Managing Director, Morgan Stanley (investment management) (March 2000 to
November 2005)
Number of Funds in Fund Complex Overseen by Trustee: 104
Other Directorships Held by Trustee: None
Education/Other Professional Experience: BA in Economics, University of Massachusetts;
MBA, Boston College; formerly held senior leadership roles with Fidelity
Investments, Boston Financial Services and Bank of America; serves on the Board of
Governors of the Investment Company Institute
20
Officers
The following table presents certain information about the executive officers of the fund. Each officer serves as an officer for each of the 15 investment companies in the American Century family of funds, unless otherwise noted. No officer is compensated for his or her service as an officer of the fund. The listed officers are interested persons of the fund and are appointed or re-appointed on an annual basis. The mailing address for each of the officers listed below is 4500 Main Street, Kansas City, Missouri 64111.
| | |
| Name | Offices with | |
| (Year of Birth) | the Fund | Principal Occupation(s) During the Past Five Years |
| Jonathan S. | Trustee and | President and Chief Executive Officer, ACC (March 2007 to present); Chief |
| Thomas | President | Administrative Officer, ACC (February 2006 to March 2007); Executive |
| (1963) | since 2007 | Vice President, ACC (November 2005 to February 2007). Also serves as: |
| | | Chief Executive Officer and Manager, ACS; Executive Vice President, ACIM; |
| | | Director, ACIM and other ACC subsidiaries. Global Chief Operating Officer |
| | | and Managing Director, Morgan Stanley (March 2000 to November 2005) |
| Barry Fink | Executive | Chief Operating Officer and Executive Vice President, ACC (September 2007 |
| (1955) | Vice President | to present); President, ACS (October 2007 to present); Managing Director, |
| | since 2007 | Morgan Stanley (2000 to 2007); Global General Counsel, Morgan Stanley |
| | | (2000 to 2006). Also serves as: Manager, ACS, and Director, ACC and |
| | | certain ACC subsidiaries |
| Maryanne L. | Chief Compliance | Chief Compliance Officer, American Century funds, ACIM and ACS (August |
| Roepke | Officer since 2006 | 2006 to present); Assistant Treasurer, ACC (January 1995 to August 2006); |
| (1956) | and Senior | and Treasurer and Chief Financial Officer, various American Century funds |
| | Vice President | (July 2000 to August 2006). Also serves as: Senior Vice President, ACS |
| | since 2000 | |
| Charles A. | General Counsel | Attorney, ACC (February 1994 to present); Vice President, ACC (November |
| Etherington | since 2007 and | 2005 to present); General Counsel, ACC (March 2007 to present); Also |
| (1957) | Senior Vice | serves as General Counsel, ACIM, ACS, ACIS and other ACC subsidiaries; |
| | President | and Senior Vice President, ACIM and ACS |
| | since 2006 | |
| Robert J. Leach | Vice President, | Vice President, ACS (February 2000 to present); and Controller, various |
| (1966) | Treasurer and | American Century funds (1997 to September 2006) |
| | Chief Financial | |
| | Officer since 2006 | |
| David H. Reinmiller | Vice President | Attorney, ACC (January 1994 to present); Associate General Counsel, ACC |
| (1963) | since 2001 | (January 2001 to present); Chief Compliance Officer, American Century |
| | | funds and ACIM (January 2001 to February 2005). Also serves as: Vice |
| | | President, ACIM and ACS |
| Ward D. Stauffer | Secretary | Attorney, ACC (June 2003 to Present) |
| (1960) | since 2005 | |
The SAI has additional information about the fund’s trustees and is available without charge, upon request, by calling 1-800-345-2021.
21
|
| Board Approval of Management Agreements |
American Century Investment Management, Inc. (“ACIM” or the “Advisor”) currently serves as investment advisor to the Fund under an interim management agreement (the “Interim Management Agreement”) between the Advisor and the Fund approved by the Fund’s Board of Trustees (the “Board”). The Advisor previously served as investment advisor to the Fund pursuant to a management agreement (the “Prior Management Agreement”) that terminated in accordance with its terms on February 16, 2010, as a result of a change of control of the Advisor’s parent company, American Century Companies, Inc. (“ACC”). The change in control occurred as the result of a change in the trustee of a trust created by James E. Stowers, Jr., the founder of American Century Investments that holds shares representing a significant interest in ACC stock. Mr. Stowers previously served a s the trustee of the trust. On February 16, 2010, Richard W. Brown, Co-Chairman of ACC with Mr. Stowers, became the trustee in accordance with the terms of the trust and Mr. Stowers’ long-standing estate and succession plan.
On February 18, 2010, the Board approved the Interim Management Agreement in accordance with Rule 15a-4 under the Investment Company Act to ensure continued management of the Fund by the Advisor after the termination of the Prior Management Agreement and until shareholder approval of a new management agreement (the “Proposed Management Agreement”) as required under the Act. The Board has approved the Proposed Management Agreement and has recommended its approval to shareholders. Fund shareholders are scheduled to consider approval of the Proposed Management Agreement at a meeting to be held on June 16, 2010.
The Interim Management Agreement and the Proposed Management Agreement are substantially identical to the Prior Management Agreement except for their effective dates and the termination provisions of the Interim Management Agreement. Under the Interim and Proposed Management Agreements, the Advisor will provide the same services to the Fund and receive the same compensation rate as under the Prior Management Agreement.
Basis for Board Approval of Interim Management Agreement
In considering the approval of the Interim Management Agreement, Rule 15a-4 requires the Board to approve the contract within ten business days of the termination of the prior agreement and to determine that the compensation to be received under the interim agreement is no greater than would have been received under the prior agreement. In connection with the approval, the Board noted that it oversees on a continuous basis and evaluates at its quarterly meetings, directly and through the committees of the Board, the nature and quality of significant services provided by the Advisor, the investment performance of the Fund, shareholder services, audit and compliance functions and a variety of other matters relating to the Fund’s operations.
22
In evaluating the Interim Management Agreement, the Board, assisted by the advice of its independent legal counsel, considered a number of factors in addition to those required by the rule with no one factor being determinative to its analysis. Among the factors considered by the Board were the circumstances and effect of the change of control, the fact that the Advisor will provide the same services and receive the same compensation rate as under the Prior Management Agreements, and that the change of control did not result in a change of the personnel managing the Fund. Upon completion of its analysis, the Board approved the Interim Management Agreement, determining that the continued management of the Fund by the Advisor was in the best interests of the Fund and Fund shareholders.
Basis for Board Approval of Proposed Management Agreement
At a meeting held on April 1, 2010, after considering all information presented, the Board approved, and determined to recommend that shareholders approve, the Proposed Management Agreement. In connection with that approval, the Board requested and reviewed extensive data and information compiled by the Advisor and certain independent providers of evaluation data concerning the Fund and services provided to the Fund by the Advisor. The Board oversees on a continuous basis and evaluates at its quarterly meetings, directly and through the committees of the Board, the nature and quality of significant services provided by the Advisor, the investment performance of the Fund, shareholder services, audit and compliance functions and a variety of other matters relating to the Fund’s operations. The information considered and the discussions held at the meetings included, but were not limited to:
• the nature, extent and quality of investment management, shareholder services and other services provided to the Fund;
• the wide range of programs and services the Advisor provides to the Fund and its shareholders on a routine and non-routine basis;
• the compliance policies, procedures, and regulatory experience of the Advisor;
• data comparing the cost of owning the Fund to the cost of owning similar funds;
• the fact that there will be no changes to the fees, services, or personnel who provide such services as compared to the Prior Management Agreement;
• data comparing the Fund’s performance to appropriate benchmarks and/or a peer group of other mutual funds with similar investment objectives and strategies;
• financial data showing the profitability of the Fund to the Advisor and the overall profitability of the Advisor;
• data comparing services provided and charges to the Fund with those for other non-fund investment management clients of the Advisor; and
23
• consideration of collateral or “fall-out” benefits derived by the Advisor from the management of the Fund and potential sharing of economies of scale in connection with the management of the Fund.
The Board also considered whether there was any reason for not continuing the existing arrangement with the Advisor. In particular, the Board recognized that shareholders may have invested in the Fund on the strength of the Advisor’s industry standing and reputation and in the expectation that the Advisor will have a continuing role in providing advisory services to the Fund.
The Board considered all of the information provided by the Advisor, the independent data providers, and the Board’s independent legal counsel, and evaluated such information for the Fund. The Board did not identify any single factor as being all-important or controlling, and each Board member may have attributed different levels of importance to different factors. In deciding to approve the Proposed Management Agreement under the terms ultimately determined by the Board to be appropriate, the Board based its decision on a number of factors, including the following:
Nature, Extent and Quality of Services — Generally. Under the Proposed Management Agreement, the Advisor is responsible for providing or arranging for all services necessary for the operation of the Fund. The Board noted that under the Proposed Management Agreement, the Advisor provides or arranges at its own expense a wide variety of services including:
• constructing and designing the Fund
• portfolio research and security selection
• initial capitalization/funding
• securities trading
• Fund administration
• custody of Fund assets
• daily valuation of the Fund’s portfolio
• shareholder servicing and transfer agency, including shareholder
confirmations, recordkeeping and communications
• legal services
• regulatory and portfolio compliance
• financial reporting
• marketing and distribution
24
The Board noted that many of these services have expanded over time both in terms of quantity and complexity in response to shareholder demands, competition in the industry, changing distribution channels and the changing regulatory environment.
Investment Management Services. The investment management services provided to the Fund are complex and provide Fund shareholders access to professional money management, instant diversification of their investments within an asset class, the opportunity to easily diversify among asset classes, and liquidity. As a part of its general oversight and in evaluating investment performance, the Board expects the Advisor to manage the Fund in accordance with its investment objectives and approved strategies. In providing these services, the Advisor utilizes teams of investment professionals who require extensive information technology, research, training, compliance and other systems to conduct their business. The Board, directly and through its Portfolio Committee, regularly reviews investment performance information for the Fund, t ogether with comparative information for appropriate benchmarks and/or peer groups of similarly-managed funds, over different time horizons. If performance concerns are identified, the underperforming Fund receives special reviews until performance improves, during which time the Board discusses with the Advisor the reasons for such underperformance and any efforts being undertaken to improve performance.
Shareholder and Other Services. Under the Proposed Management Agreement, the Advisor will also provide the Fund with a comprehensive package of transfer agency, shareholder, and other services. The Board, directly and through the various committees of the Board, regularly reviews reports and evaluations of such services. These reports include, but are not limited to, information regarding the operational efficiency and accuracy of the shareholder and transfer agency services provided, staffing levels, shareholder satisfaction (as measured by external as well as internal sources), technology support, new products and services offered to Fund shareholders, securities trading activities, portfolio valuation services, auditing services, and legal and operational compliance activities. Certain aspects of shareholder and transfer ag ency service level efficiency and the quality of securities trading activities are measured by independent third party providers and are presented in comparison to other fund groups not managed by the Advisor.
Costs of Services Provided and Profitability. The Advisor provided detailed information concerning its cost of providing various services to the Fund, its profitability in managing the Fund, its overall profitability, and its financial condition. The Board reviewed with the Advisor the methodology used to prepare this financial information. The Board has also reviewed with the Advisor its methodology for compensating the investment professionals that provide services to the Fund as well as compensation to the five highest paid personnel of the Advisor. This financial information regarding the Advisor is considered in order to evaluate the Advisor’s financial condition, its ability to continue to provide services under the Proposed Management Agreement, and the reasonableness of the proposed management fees.
25
Ethics. The Board generally considers the Advisor’s commitment to providing quality services to shareholders and to conducting its business ethically. It noted that the Advisor’s practices generally meet or exceed industry best practices.
Economies of Scale. The Board also reviewed information provided by the Advisor regarding the possible existence of economies of scale in connection with the management of the Fund. The Board concluded that economies of scale are difficult to measure and predict with precision, especially on a fund-by-fund basis. The analysis of economies of scale is further complicated by the additional services and content provided by the Advisor and its reinvestment in its ability to provide and expand those services. Accordingly, the Board seeks to evaluate economies of scale by reviewing information, such as year-over-year profitability of the Advisor generally, the profitability of its management of the Fund specifically, and the expenses incurred by the Advisor in providing various functions to the Fund. The Board believes the Advisor i s appropriately sharing economies of scale through its competitive fee structure, offering competitive fees from fund inception, fee breakpoints as the fund complex and the Fund increases in size, and through reinvestment in its business to provide shareholders additional services and enhancements to existing services. In particular, separate breakpoint schedules based on the size of the entire fund complex and on the size of the Fund reflect the complexity of assessing economies of scale.
Comparison to Fees of Funds not Managed by the Advisor. Both the Prior and Proposed Management Agreements provide that the Fund pays the Advisor a single, all-inclusive (or unified) management fee for providing all services necessary for the management and operation of the Fund, other than brokerage expenses, taxes, interest, extraordinary expenses, and the fees and expenses of the Fund’s Independent Trustees (including their independent legal counsel) and expenses incurred in connection with the provision of shareholder services and distribution services under a plan adopted pursuant to Rule 12b-1 under the 1940 Act. Under the unified fee structure, the Advisor is responsible for providing all investment advisory, custody, audit, administrative, compliance, recordkeeping, marketing and shareholder services, or arranging and supervising third parties that provide such services. By contrast, most other funds are charged a variety of fees, including an investment advisory fee, a transfer agency fee, an administrative fee, distribution charges and other expenses. Other than their investment advisory fees and any applicable Rule 12b-1 distribution fees, the components of the total fees charged by these other funds may be increased without shareholder approval. The Board believes the unified fee structure is a benefit to Fund shareholders because it clearly discloses to shareholders the cost of owning Fund shares, and, since the unified fee cannot be increased without a vote of Fund shareholders, it shifts to the Advisor the risk of increased costs of operating the Fund and provides a direct incentive to minimize administrative inefficiencies. Part of the Board’s analysis of fee levels involves reviewing certain evaluative data compiled by an independent provider comparing the Fund’s unified fee to the total expense rat ios of similar funds not managed by the Advisor.
26
The Board concluded that the management fee to be paid by the Fund to the Advisor under the Proposed Management Agreement is reasonable in light of the services to be provided to the Fund.
Comparison to Fees and Services Provided to Other Clients of the Advisor. The Board also requested and received information from the Advisor concerning the nature and extent of the services, fees, and profitability of its advisory services to advisory clients other than the Fund. They observed that these varying types of client accounts require different services and involve different regulatory and entrepreneurial risks than the management of the Fund. The Board analyzed this information and concluded that the fees charged and services provided to the Fund were reasonable by comparison.
Collateral or “Fall-Out” Benefits Derived by the Advisor. The Board considered the existence of collateral benefits the Advisor may receive as a result of its relationship with the Fund. The Board concluded that the Advisor’s primary business is managing mutual funds and it generally does not use Fund or shareholder information to generate profits in other lines of business, and therefore does not derive any significant collateral benefits from them. The Board noted that the Advisor receives proprietary research from broker-dealers that execute Fund portfolio transactions and concluded that this research is likely to benefit Fund shareholders. The Board also determined that the Advisor is able to provide investment management services to certain clients other than the Fund, at least in part, due to its existing infrastructure built to serve the fund complex. The Board concluded, however, that the assets of those other clients are not material to the analysis and, in any event, are included with the assets of the Fund to determine breakpoints in the Fund’s fee schedule, provided they are managed using the same investment team and strategy.
Conclusion of the Board. As a result of this process, the Board, in the absence of particular circumstances and assisted by the advice of its independent legal counsel, taking into account all of the factors discussed above and the information provided by the Advisor and others, concluded that the Proposed Management Agreement be approved and recommended its approval to Fund shareholders.
27
Retirement Account Information
As required by law, distributions you receive from certain IRAs, or 403(b), 457 and qualified plans are subject to federal income tax withholding, unless you elect not to have withholding apply. Tax will be withheld on the total amount withdrawn even though you may be receiving amounts that are not subject to withholding, such as nondeductible contributions. In such case, excess amounts of withholding could occur. You may adjust your withholding election so that a greater or lesser amount will be withheld.
If you don’t want us to withhold on this amount, you must notify us to not withhold the federal income tax. You may notify us in writing or in certain situations by telephone or through other electronic means. You have the right to revoke your withholding election at any time and any election you make may remain in effect until revoked by filing a new election.
Remember, even if you elect not to have income tax withheld, you are liable for paying income tax on the taxable portion of your withdrawal. If you elect not to have income tax withheld or you don’t have enough income tax withheld, you may be responsible for payment of estimated tax. You may incur penalties under the estimated tax rules if your withholding and estimated tax payments are not sufficient. You can reduce or defer the income tax on a distribution by directly or indirectly rolling such distribution over to another IRA or eligible plan. You should consult your tax advisor for additional information.
State tax will be withheld if, at the time of your distribution, your address is within one of the mandatory withholding states and you have federal income tax withheld. State taxes will be withheld from your distribution in accordance with the respective state rules.
Proxy Voting Guidelines
American Century Investment Management, Inc., the fund’s investment advisor, is responsible for exercising the voting rights associated with the securities purchased and/or held by the fund. A description of the policies and procedures the advisor uses in fulfilling this responsibility is available without charge, upon request, by calling 1-800-345-2021. It is also available on American Century Investments’ website at americancentury.com and on the Securities and Exchange Commission’s website at sec.gov. Information regarding how the investment advisor voted proxies relating to portfolio securities during the most recent 12-month period ended June 30 is available on the “About Us” page at americancentury.com. It is also available at sec.gov.
Quarterly Portfolio Disclosure
The fund files its complete schedule of portfolio holdings with the Securities and Exchange Commission (SEC) for the first and third quarters of each fiscal year on Form N-Q. The fund’s Form N-Q is available on the SEC’s website at sec.gov, and may be reviewed and copied at the SEC’s Public Reference Room in Washington, DC. Information on the operation of the Public Reference Room may be obtained by calling 1-800-SEC-0330. The fund also makes its complete schedule of portfolio holdings for the most recent quarter of its fiscal year available on its website at americancentury.com and, upon request, by calling 1-800-345-2021.
28
The following indices are used to illustrate investment market, sector, or style performance or to serve as fund performance comparisons. They are not investment products available for purchase.
The 90-Day U.S. Treasury Bill Index is derived from secondary market interest rates for three-month instruments as published by the Federal Reserve Bank.
The Barclays Capital U.S. 1- to 3-Month Treasury Bill Index is the 1- to 3-month component of the U.S. Treasury Bill Index, which includes U.S. Treasury bills with a remaining maturity from 1 up to 12 months and excludes zero coupon strips.
The Barclays Capital U.S. Aggregate Index represents securities that are taxable, registered with the Securities and Exchange Commission, and U.S. dollar-denominated. The index covers the U.S. investment-grade fixed-rate bond market, with index components for government and corporate securities, mortgage pass-through securities, and asset-backed securities.
The Barclays Capital U.S. Corporate High-Yield Index covers the universe of fixed-rate, non-investment grade corporate debt of issuers in non-emerging market countries.
The Barclays Capital U.S. Corporate Investment-Grade Index is a component of the U.S. Aggregate Index and includes publicly issued U.S. corporate debentures and secured notes.
The Barclays Capital U.S. Mortgage-Backed Securities Index is a component of the U.S. Aggregate Index and covers the mortgage-backed pass-through securities of Ginnie Mae (GNMA), Fannie Mae (FNMA) and Freddie Mac (FHLMC).
The Barclays Capital U.S. Treasury Index includes public obligations of the U.S. Treasury with a remaining maturity of one year or more and excludes zero coupon strips.
The Barclays Capital U.S. Treasury Inflation Protected Securities (TIPS) Index consists of Treasury inflation-protected securities with a remaining maturity of one year or more.
29
30
31
32

| |
| |
| Contact Us | |
| americancentury.com | |
| Automated Information Line | 1-800-345-8765 |
| Investor Services Representative | 1-800-345-2021 or |
| | 816-531-5575 |
| Business, Not-For-Profit, Employer-Sponsored | |
| Retirement Plans | 1-800-345-3533 |
| Banks and Trust Companies, Broker-Dealers, | |
| Financial Professionals, Insurance Companies | 1-800-345-6488 |
| Telecommunications Device for the Deaf | 1-800-634-4113 |
| American Century Government Income Trust | |
| Investment Advisor: | |
| American Century Investment Management, Inc. | |
| Kansas City, Missouri | |
This report and the statements it contains are submitted for the general
information of our shareholders. The report is not authorized for distribution to
prospective investors unless preceded or accompanied by an effective prospectus.
American Century Investment Services, Inc., Distributor
©2010 American Century Proprietary Holdings, Inc. All rights reserved.
1005
CL-ANN-68268S
|
| Annual Report |
| March 31, 2010 |

|
| American Century Investments® |
Ginnie Mae Fund
Government Bond Fund
Inflation-Adjusted Bond Fund
Short-Term Government Fund
| |
| President’s Letter | 2 |
| Market Perspective | 3 |
| U.S. Fixed-Income Total Returns | 3 |
| |
| Ginnie Mae | |
| Performance | 4 |
| Portfolio Commentary | 6 |
| Portfolio at a Glance, Yields and | |
| Types of Investments in Portfolio | 8 |
| |
| Government Bond | |
| Performance | 9 |
| Portfolio Commentary | 11 |
| Portfolio at a Glance, Yields and | |
| Types of Investments in Portfolio | 13 |
| |
| Inflation-Adjusted Bond | |
| Performance | 14 |
| Portfolio Commentary | 16 |
| Portfolio at a Glance, Yields, Portfolio Composition by Weighted |
| Average Life and Types of Investments in Portfolio | 18 |
| |
| Short-Term Government | |
| Performance | 19 |
| Portfolio Commentary | 21 |
| Portfolio at a Glance, Yields and | |
| Types of Investments in Portfolio | 23 |
| |
| Shareholder Fee Examples | 24 |
| |
| Financial Statements | |
| Schedule of Investments | 28 |
| Statement of Assets and Liabilities | 46 |
| Statement of Operations | 48 |
| Statement of Changes in Net Assets | 49 |
| Notes to Financial Statements | 51 |
| Financial Highlights | 65 |
| Report of Independent Registered Public Accounting Firm | 85 |
| |
| Other Information | |
| Management | 86 |
| Board Approval of Management Agreements | 90 |
| Additional Information | 96 |
| Index Definitions | 97 |
Any opinions expressed in this report reflect those of the author as of the date of the report, and do not necessarily represent the opinions of American Century Investments or any other person in the American Century Investments organization. Any such opinions are subject to change at any time based upon market or other conditions and American Century Investments disclaims any responsibility to update such opinions. These opinions may not be relied upon as investment advice and, because investment decisions made by American Century Investments funds are based on numerous factors, may not be relied upon as an indication of trading intent on behalf of any American Century Investments fund. Security examples are used for representational purposes only and are not intended as recommendations to purchase or sell securities. Performance information for comparative indices and securities is provided to American Century Investments by third party vendors. To the best of American Century Investments’ knowledge, such information is accurate at the time of printing.

Dear Investor:
To learn more about the capital markets, your investment, and the portfolio management strategies American Century Investments provides, we encourage you to review this shareholder report for the financial reporting period ended March 31, 2010.
On the following pages, you will find investment performance and portfolio information, presented with the expert perspective and commentary of our portfolio management team. This report remains one of our most important vehicles for conveying the information you need about your investment performance, and about the market factors and strategies that affect fund returns. For additional information on the markets, we encourage you to visit the “Insights & News” tab at our Web site, americancentury.com, for updates and further expert commentary.
The top of our Web site’s home page also provides a link to “Our Story,” which, first and foremost, outlines our commitment—since 1958—to helping clients reach their financial goals. We believe strongly that we will only be successful when our clients are successful. That’s who we are.
Another important, unique facet of our story and who we are is “Profits with a Purpose,” which describes our bond with the Stowers Institute for Medical Research (SIMR). SIMR is a world-class biomedical organization—founded by our company founder James E. Stowers, Jr. and his wife Virginia—that is dedicated to researching the causes, treatment, and prevention of gene-based diseases, including cancer. Through American Century Investments’ private ownership structure, more than 40% of our profits support SIMR.
Mr. Stowers’ example of achieving financial success and using that platform to help humanity motivates our entire American Century Investments team. His story inspires us to help each of our clients achieve success. Thank you for sharing your financial journey with us.
Sincerely,

Jonathan Thomas
President and Chief Executive Officer
American Century Investments
2

By David MacEwen, Chief Investment Officer, Fixed Income
Economic and Market Rebound
Fixed-income markets witnessed a historically wide dispersion of returns in the 12 months ended March 31, 2010 (see the table below), which captured the rebound of the U.S. economy and financial markets from the depths of the recession and credit crisis. The foundation for this dramatic turnaround was laid by the government’s extraordinary monetary and fiscal stimulus policies taken in response to the financial crisis in late 2008.
These stimulus measures helped the U.S. economy emerge from the Great Recession and return to positive growth in the second half of 2009, while inflation remained tame. Nevertheless, the unemployment rate stood at 9.7% in March 2010 and bank lending—a key driver of economic growth—remained weak. In that environment, the Federal Reserve (the Fed) held its short-term rate target near 0%, where it’s stood since December 2008.
Historic Extremes in Bond Performance
Better economic and market conditions caused a reversal of the trading that colored the credit crisis, when the lowest-rated bonds performed worst and investors favored the safety of Treasuries over virtually every other type of investment. This sharp reversal meant calendar 2009 was the worst year on record for longer-term Treasury bonds, while credit-sensitive bonds enjoyed their best year ever. These performance trends continued into 2010; as a result, high-yield and investment-grade corporate bonds enjoyed remarkable returns in the 12 months ended in March. At the same time, intermediate- and long-term Treasuries produced very poor performance as investors worried about the effect of massive debt and unprecedented monetary policies on future inflation and interest rates. With short rates anchored by the Fed, declining prices and rising yields for longer-dated Treasuries meant the difference in yield between sh ort- and long-term bonds approached historic wides (the yield curve steepened).
Mortgage-backed securities had modest, positive returns, buoyed by the Fed’s active support for this market, which ended in March 2010. Cash returns were essentially flat, reflecting the Fed’s policy of extremely low rates. For the fiscal year, the Barclays Capital U.S. Aggregate Index (a broad-based bond index) rose 7.69%, as Treasuries’ negative returns offset the strong performance of credit-sensitive sectors.
| | | | |
| U.S. Fixed-Income Total Returns | | | | |
| For the 12 months ended March 31, 2010 | | | | |
| Treasury Bellwethers | | | Barclays Capital U.S. Bond Market Indices | |
| 3-Month Bill | 0.19% | | Corporate High-Yield | 56.18% |
| 2-Year Note | 1.58% | | Corporate Investment-Grade | 23.80% |
| 10-Year Note | –6.35% | | Aggregate | 7.69% |
| 30-Year Bond | –14.43% | | TIPS (inflation-linked) | 6.18% |
| | | | Mortgage (mortgage-backed) | 5.21% |
| | | | Treasury | –1.18% |
3
| | | | | | | |
| Ginnie Mae | | | | | | |
| |
| Total Returns as of March 31, 2010 | | | | | |
| | | | | Average Annual Returns | |
| | | Ticker | | | | Since | Inception |
| | | Symbol | 1 year | 5 years | 10 years | Inception | Date |
| Investor Class | BGNMX | 5.12% | 5.56% | 5.72% | 7.14% | 9/23/85 |
| Barclays Capital | | | | | | |
| U.S. GNMA Index(1) | — | 5.13% | 5.98% | 6.29% | 7.88%(2) | — |
| Citigroup GNMA Index | — | 5.08% | 5.97% | 6.33% | 7.91%(2) | — |
| Institutional Class | AGMNX | 5.33% | — | — | 7.31%(3) | 9/28/07 |
| A Class(4) | BGNAX | | | | | 10/9/97 |
| No sales charge* | | 4.86% | 5.30% | 5.45% | 5.21% | |
| With sales charge* | | 0.17% | 4.33% | 4.97% | 4.82% | |
| C Class | BGNCX | | | | | 3/1/10 |
| No sales charge* | | — | — | — | 0.08%(5) | |
| With sales charge* | | — | — | — | -0.92%(5) | |
| R Class | AGMWX | 4.58% | — | — | 6.56%(3) | 9/28/07 |
| *Sales charges include initial sales charges and contingent deferred sales charges (CDSCs), as applicable. A Class shares have a |
| 4.50% maximum initial sales charge and may be subject to a maximum CDSC of 1.00%. C Class shares redeemed within 12 months |
| of purchase are subject to a maximum CDSC of 1.00%. The SEC requires that mutual funds provide performance information net of |
| maximum sales charges in all cases where charges could be applied. | | | | |
| |
| (1) | In January 2010, the fund’s benchmark changed from the Citigroup GNMA Index to the Barclays Capital U.S. GNMA Index. This reflects a |
| | change in the portfolio management analytics software used by American Century Investments’ fixed-income teams. The investment process |
| | is unchanged. | | | | | | |
| (2) | Since 9/30/85, the date nearest the Investor Class’s inception for which data are available. | | | |
| (3) | Class returns would have been lower if American Century Investments had not voluntarily waived a portion of its management fee. |
| (4) | Prior to March 1, 2010, the A Class was referred to as the Advisor Class and did not have a front-end sales charge. Performance prior to that |
| | date has been adjusted to reflect this charge. | | | | | |
| (5) | Total returns for periods less than one year are not annualized. | | | | |
Data presented reflect past performance. Past performance is no guarantee of future results. Current performance may be higher or lower than the performance shown. Investment return and principal value will fluctuate, and redemption value may be more or less than original cost. To obtain performance data current to the most recent month end, please call 1-800-345-2021 or visit americancentury.com. As interest rates rise, bond values will decline.
Unless otherwise indicated, performance reflects Investor Class shares; performance for other share classes will vary due to differences in fee structure. For information about other share classes available, please consult the prospectus. Data assumes reinvestment of dividends and capital gains, and none of the charts reflect the deduction of taxes that a shareholder would pay on fund distributions or the redemption of fund shares. Returns for the indices are provided for comparison. The fund’s total returns include operating expenses (such as transaction costs and management fees) that reduce returns, while the total returns of the indices do not.
4
Ginnie Mae

| | | | |
| *Ending value would have been lower if a portion of the class’s management fee had not been waived during the period. | |
| |
| Total Annual Fund Operating Expenses | | | |
| Investor Class | Institutional Class | A Class | C Class | R Class |
| 0.57% | 0.37% | 0.82% | 1.57% | 1.07% |
The total annual fund operating expenses shown is as stated in the fund’s prospectus current as of the date of this report. The prospectus may vary from the expense ratio shown elsewhere in this report because it is based on a different time period, includes acquired fund fees and expenses, and, if applicable, does not include fee waivers or expense reimbursements.
Data presented reflect past performance. Past performance is no guarantee of future results. Current performance may be higher or lower than the performance shown. Investment return and principal value will fluctuate, and redemption value may be more or less than original cost. To obtain performance data current to the most recent month end, please call 1-800-345-2021 or visit americancentury.com. As interest rates rise, bond values will decline.
Unless otherwise indicated, performance reflects Investor Class shares; performance for other share classes will vary due to differences in fee structure. For information about other share classes available, please consult the prospectus. Data assumes reinvestment of dividends and capital gains, and none of the charts reflect the deduction of taxes that a shareholder would pay on fund distributions or the redemption of fund shares. Returns for the indices are provided for comparison. The fund’s total returns include operating expenses (such as transaction costs and management fees) that reduce returns, while the total returns of the indices do not.
5
Ginnie Mae
Portfolio Managers: Bob Gahagan, Hando Aguilar, and Dan Shiffman
Performance Summary
Ginnie Mae returned 5.12%* for the 12 months ended March 31, 2010. By comparison, the Barclays Capital U.S. GNMA Index and Citigroup GNMA Index returned 5.13% and 5.08%, respectively. See page 4 for additional performance comparisons. Portfolio returns reflect operating expenses, while index returns do not.
Going forward, the portfolio’s performance will be presented solely against the Barclays Capital U.S. GNMA Index, as opposed to the Citigroup GNMA Index, to reflect a change in the portfolio management analytic system used by American Century Investments’ Fixed Income team. The portfolio’s investment process remains unchanged.
Ginnie Mae’s absolute return reflected the market performance for high-quality mortgage-backed securities (MBS), which produced solid, positive results in an otherwise challenging period for government-backed bonds (see page 3). The portfolio performed in line with the GNMA indices, benefiting from some of our sector and security-selection decisions.
Mortgage Market Review
In the mortgage market, home sales volumes and prices dipped modestly in early 2010 in the wake of a rush of sales to beat the late-2009 expiration of a government tax credit for first-time home buyers. This tax credit was eventually extended by Congress into 2010, and should provide ongoing support for the housing market. At the same time, the Federal Reserve’s (the Fed’s) direct participation in the market for mortgage-backed securities helped keep mortgage rates relatively low. Nevertheless, refinancing activity moderated as mortgage rates inched up over the course of the fiscal year. Relatively stable rates and modest refinancing activity meant ideal conditions for MBS, whose higher income payouts enabled them to outperform Treasury and government agency debentures in the fiscal year.
Positioning for Higher Interest Rates
We made a number of trades during the fiscal year to reposition the portfolio for higher, more volatile interest rates. For example, we favored intermediate (5.5%–6%) and premium (higher than prevailing rates) coupon bonds over discounts (those with coupons below prevailing rates). Discounts typically underperform when rates rise because of their lower coupons and tendency to experience more pronounced duration extension. In addition, the Fed’s MBS purchases had been concentrated in lower-coupon bonds, leaving these securities vulnerable to underperformance after the expiration of the Fed program in early 2010. This positioning helped performance over the last 12 months.
*All fund returns referenced in this commentary are for Investor Class shares.
6
Ginnie Mae
Another way we managed the portfolio’s exposure to rising rates was to hold a stake in “structured products”—collateralized mortgage obligations (CMOs) whose payments are more predictable than traditional pass-through MBS. GNMA CMOs did better than pass-through securities, so this positioning helped relative results.
It was also beneficial to favor GNMA IIs (multi-issuer mortgage pools) relative to GNMA Is (single-issuer pools). We preferred GNMA IIs over Is because the difference in yield, or spread, on these securities was at historically wide levels early in the reporting period. But that yield spread narrowed over time as IIs outperformed Is, and we took our profits from this trade.
Other Notable Trades
We also put in place a trade designed to benefit from changes in the shape of the Treasury yield curve (a “curve flattener” trade). We implemented the trade in late 2009 when the yield difference, or spread, between two- and 30-year securities approached the widest levels on record. This is another good example of a long-term trade designed to exploit market inefficiencies and tendencies to “revert to the mean” after periods of significant divergence from typical yield relationships. To execute this trade, we sold two-year Treasury futures short (anticipating value declines as short-term interest rates rise) and bought longer-term Treasury futures long.
Outlook
“We believe we are at an important juncture for the economy and fixed-income markets,” said Portfolio Manager Bob Gahagan. “On the economic front, we expect a relatively modest, bumpy recovery. That’s because while profitability has returned to Wall Street and big businesses with global reach, U.S. consumers and small businesses still face headwinds—credit remains tight, debt burdens are stubbornly high, and wages are under pressure from the weak job market. Similarly, we believe we are at an inflection point for fixed-income markets in terms of bond yields, performance, and the shape of the yield curve. As a result, we expect to continue our yield curve flattener trade and to position the portfolio for higher rates.”
Portfolio Manager Hando Aguilar explained what that implies for the portfolio: “We expect to favor CMOs and other structured products going forward because we think they can do better than traditional MBS when rates rise. Similarly, we expect to continue to hold an overweight position in current and premium coupon bonds, while underweighting discount MBS.”
7
| |
| Ginnie Mae | |
| |
| Portfolio at a Glance | |
| | As of 3/31/10 |
| Average Duration (effective) | 4.0 years |
| Weighted Average Life | 4.9 years |
| |
| Yields as of March 31, 2010(1) | |
| 30-Day SEC Yield | |
| Investor Class | 3.76% |
| Institutional Class | 3.96% |
| A Class�� | 3.35% |
| C Class | 2.76% |
| R Class | 3.26% |
| (1) The yields presented reflect the waiver of a portion of the fund’s management fee. Without such waiver, the 30-day yields would have been lower. |
| |
| Types of Investments in Portfolio | |
| | % of fund investments |
| | as of 3/31/10 |
| U.S. Government Agency Mortgage-Backed Securities (all GNMAs) | 93.0% |
| U.S. Government Agency Collateralized Mortgage Obligations (all GNMAs) | 6.0% |
| Temporary Cash Investments | 1.0% |
8
| | | | | | | |
| Government Bond | | | | | |
| |
| Total Returns as of March 31, 2010 | | | | | |
| | | | | Average Annual Returns | |
| | | Ticker | | | | Since | Inception |
| | | Symbol | 1 year | 5 years | 10 years | Inception | Date |
| Investor Class | CPTNX | 2.77% | 5.63% | 5.97% | 7.51% | 5/16/80 |
| Barclays Capital U.S. | | | | | | |
| Government/MBS Index(1) | — | 2.58% | 5.65% | 6.19% | 8.59%(2) | — |
| Citigroup Treasury/ | | | | | | |
| Mortgage Index | — | 2.31% | 5.72% | 6.21% | 8.60%(2) | — |
| Institutional Class | ABTIX | — | — | — | -0.26%(3) | 3/1/10 |
| A Class(4) | ABTAX | | | | | 10/9/97 |
| No sales charge* | | 2.52% | 5.37% | 5.70% | 5.45% | |
| With sales charge* | | -2.09% | 4.39% | 5.22% | 5.06% | |
| C Class | ABTCX | | | | | 3/1/10 |
| No sales charge* | | — | — | — | -0.36%(3) | |
| With sales charge* | | — | — | — | -1.35%(3) | |
| R Class | ABTRX | — | — | — | -0.32%(3) | 3/1/10 |
| *Sales charges include initial sales charges and contingent deferred sales charges (CDSCs), as applicable. A Class shares have a |
| 4.50% maximum initial sales charge and may be subject to a maximum CDSC of 1.00%. C Class shares redeemed within 12 months |
| of purchase are subject to a maximum CDSC of 1.00%. The SEC requires that mutual funds provide performance information net of |
| maximum sales charges in all cases where charges could be applied. | | | | |
| |
| Performance information prior to September 3, 2002, is that of the American Century Treasury Fund, all of the net assets of which were acquired by |
| Government Bond pursuant to a plan of reorganization approved by Treasury shareholders on August 2, 2002. | | |
| (1) | In January 2010, the fund’s benchmark changed from the Citigroup Treasury/Mortgage Index to the Barclays Capital U.S. Government/MBS |
| | Index. This reflects a change in the portfolio management analytics software used by American Century Investments’ fixed-income teams. The |
| | investment process is unchanged. | | | | | | |
| (2) | Since 5/31/80, the date nearest the Investor Class’s inception for which data are available. | | | |
| (3) | Total returns for periods less than one year are not annualized. | | | | |
| (4) | Prior to March 1, 2010, the A Class was referred to as the Advisor Class and did not have a front-end sales charge. Performance prior to that |
| | date has been adjusted to reflect this charge. | | | | | |
Data presented reflect past performance. Past performance is no guarantee of future results. Current performance may be higher or lower than the performance shown. Investment return and principal value will fluctuate, and redemption value may be more or less than original cost. To obtain performance data current to the most recent month end, please call 1-800-345-2021 or visit americancentury.com. As interest rates rise, bond values will decline.
Unless otherwise indicated, performance reflects Investor Class shares; performance for other share classes will vary due to differences in fee structure. For information about other share classes available, please consult the prospectus. Data assumes reinvestment of dividends and capital gains, and none of the charts reflect the deduction of taxes that a shareholder would pay on fund distributions or the redemption of fund shares. Returns for the indices are provided for comparison. The fund’s total returns include operating expenses (such as transaction costs and management fees) that reduce returns, while the total returns of the indices do not.
9
Government Bond
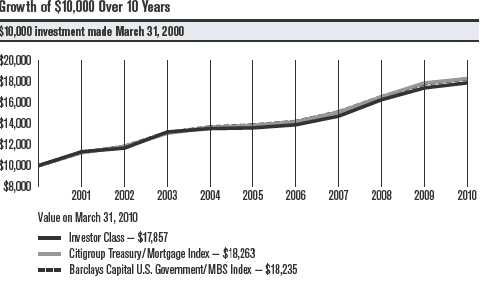
| | | | |
| Total Annual Fund Operating Expenses | | | |
| Investor Class | Institutional Class | A Class | C Class | R Class |
| 0.49% | 0.29% | 0.74% | 1.49% | 0.99% |
The total annual fund operating expenses shown is as stated in the fund’s prospectus current as of the date of this report. The prospectus may vary from the expense ratio shown elsewhere in this report because it is based on a different time period, includes acquired fund fees and expenses, and, if applicable, does not include fee waivers or expense reimbursements.
Data presented reflect past performance. Past performance is no guarantee of future results. Current performance may be higher or lower than the performance shown. Investment return and principal value will fluctuate, and redemption value may be more or less than original cost. To obtain performance data current to the most recent month end, please call 1-800-345-2021 or visit americancentury.com. As interest rates rise, bond values will decline.
Unless otherwise indicated, performance reflects Investor Class shares; performance for other share classes will vary due to differences in fee structure. For information about other share classes available, please consult the prospectus. Data assumes reinvestment of dividends and capital gains, and none of the charts reflect the deduction of taxes that a shareholder would pay on fund distributions or the redemption of fund shares. Returns for the indices are provided for comparison. The fund’s total returns include operating expenses (such as transaction costs and management fees) that reduce returns, while the total returns of the indices do not.
10
Government Bond
Portfolio Managers: Bob Gahagan, Hando Aguilar, Brian Howell, Dan Shiffman, and Jim Platz
Performance Summary
Government Bond returned 2.77%* for the 12 months ended March 31, 2010. By comparison, the Barclays Capital U.S. Government/MBS Index and Citigroup Treasury/Mortgage Index returned 2.58% and 2.31%, respectively. See page 9 for additional performance comparisons. Portfolio returns reflect operating expenses, while index returns do not.
Going forward, the portfolio’s performance will be presented solely against the Barclays Capital U.S. Government/MBS Index as opposed to the Citigroup Treasury/Mortgage Index to reflect a change in the portfolio management analytic system used by American Century Investments’ Fixed Income team. The portfolio’s investment process remains unchanged.
Government Bond’s absolute return reflected the challenging environment for government-backed securities. The portfolio’s sector allocation made the key contribution to relative results.
Underweight to Treasuries Helped
We manage the portfolio using a relative value approach to investing, believing that significant areas of the bond market are inherently inefficient and respond predictably to extremes. Our Treasury underweight position is an example of this approach at work. We found this sector unattractive because of historically low Treasury yields, record high government budget deficits, and the threat of future inflation as a result of unprecedented stimulus measures. We believe these factors argue for higher Treasury yields (and lower prices) down the road. That positioning aided performance during the fiscal year, when intermediate- and longer-term Treasuries had negative absolute results.
And within this sector, we held an allocation to Treasury inflation-indexed securities (TIIS), which outperformed plain vanilla Treasuries. The key contribution to return from this trade took place early in the fiscal year, as we pared back our TIIS position after a run of outperformance. That helped because TIIS produced rather modest, though positive, returns in recent months.
Mortgage Overweight Also Contributed
It was also beneficial to favor mortgage-backed securities (MBS) over Treasuries, though we drew down this overweight over the course of the fiscal year as mortgages outperformed. Within the mortgage allocation, we found government agency MBS relatively less attractive as their yields approached record lows relative to Treasuries at the same time the Federal Reserve approached the end of its explicit participation in the market to support these securities. As a result, we found the risk/reward trade-off offered by agency MBS to be increasingly unattractive. In place of agency MBS we held collateralized mortgage obligations and commercial mortgage-backed securities, which did well for the fiscal year.
*All fund returns referenced in this commentary are for Investor Class shares.
11
Government Bond
Other Notable Trades
We also put in place a trade designed to benefit from changes in the shape of the Treasury yield curve (a “curve flattener” trade). We implemented the trade in late 2009 when the yield difference, or spread, between two- and 30-year securities approached the widest levels on record. This is another good example of a long-term trade designed to exploit market inefficiencies and tendency to “revert to the mean” after periods of significant divergence from typical yield relationships. To execute this trade, we sold two-year Treasury futures short (anticipating value declines as short-term interest rates rise) and bought longer-term Treasury futures long. The portfolio enjoyed a modest positive contribution to return from this trade in the fiscal year.
Outlook
“We believe we are at an important juncture for the economy and fixed-income markets,” said Portfolio Manager Bob Gahagan. “On the economic front, we expect a relatively modest, bumpy recovery. That’s because while profitability has returned to Wall Street and big businesses with global reach, U.S. consumers and small businesses still face headwinds—credit remains tight, debt burdens are stubbornly high, and wages are under pressure from the weak job market. Under those sorts of conditions, we think the Federal Reserve will continue to keep short-term interest rates low for an extended period.”
“Similarly, we believe we are at an inflection point for fixed-income markets in terms of bond yields, performance, and the shape of the yield curve. As a result, we expect to continue our Treasury bond underweight and yield curve flattener trades. In addition, because we expect the government’s unprecedented stimulus policies to result in inflation down the road, we’re likely to continue to look for opportunities to add inflation-protected securities. Finally, we think investor expectations for bond returns going forward should be more modest than in years past—we don’t expect the historically broad dispersion of returns we saw across the bond market in 2008 and 2009.”
12
| |
| Government Bond | |
| |
| Portfolio at a Glance | |
| | As of 3/31/10 |
| Average Duration (effective) | 4.2 years |
| Weighted Average Life | 5.2 years |
| |
| Yields as of March 31, 2010 | |
| 30-Day SEC Yield | |
| Investor Class | 2.94% |
| Institutional Class | 3.13% |
| A Class | 2.57% |
| C Class | 2.03% |
| R Class | 2.43% |
| |
| Types of Investments in Portfolio | |
| | % of fund investments |
| | as of 3/31/10 |
| U.S. Government Agency Mortgage-Backed Securities | 42.2% |
| U.S. Treasury Securities | 28.0% |
| U.S. Government Agency Securities and Equivalents | 21.0% |
| Collateralized Mortgage Obligations | 7.3% |
| Temporary Cash Investments | 1.5% |
13
| | | | | | | |
| Inflation-Adjusted Bond | | | | | |
| |
| Total Returns as of March 31, 2010 | | | | | |
| | | | | Average Annual Returns | |
| | | Ticker | | | | Since | Inception |
| | | Symbol | 1 year | 5 years | 10 years | Inception | Date |
| Investor Class | ACITX | 5.76% | 4.58% | 6.78% | 5.93% | 2/10/97 |
| Barclays Capital | | | | | | |
| U.S. TIPS Index(1) | — | 6.18% | 4.82% | 7.30% | 6.55%(2) | — |
| Citigroup US Inflation- | | | | | | |
| Linked Securities Index | — | 5.95% | 4.77% | 7.25% | 6.53%(2) | — |
| Institutional Class | AIANX | 5.98% | 4.79% | — | 5.39% | 10/1/02 |
| A Class(3) | AIAVX | | | | | 6/15/98 |
| No sales charge* | | 5.52% | 4.33% | 6.53% | 6.14% | |
| With sales charge* | | 0.77% | 3.38% | 6.04% | 5.73% | |
| C Class | AINOX | | | | | 3/1/10 |
| No sales charge* | | — | — | — | 0.00%(4) | |
| With sales charge* | | — | — | — | -1.00%(4) | |
| R Class | AIARX | — | — | — | 0.09%(4) | 3/1/10 |
| *Sales charges include initial sales charges and contingent deferred sales charges (CDSCs), as applicable. A Class shares have a |
| 4.50% maximum initial sales charge and may be subject to a maximum CDSC of 1.00%. C Class shares redeemed within 12 months |
| of purchase are subject to a maximum CDSC of 1.00%. The SEC requires that mutual funds provide performance information net of |
| maximum sales charges in all cases where charges could be applied. | | | | |
| |
| (1) | In January 2010, the fund’s benchmark changed from the Citigroup US Inflation-Linked Securities Index to the Barclays Capital U.S. TIPS |
| | Index. This reflects a change in the portfolio management analytics software used by American Century Investments’ fixed-income teams. The |
| | investment process is unchanged. | | | | | | |
| (2) | Since 2/28/97, the date nearest the Investor Class’s inception for which data are available. | | | |
| (3) | Prior to March 1, 2010, the A Class was referred to as the Advisor Class and did not have a front-end sales charge. Performance prior to that |
| | date has been adjusted to reflect this charge. | | | | | |
| (4) | Total returns for periods less than one year are not annualized. | | | | |
Data presented reflect past performance. Past performance is no guarantee of future results. Current performance may be higher or lower than the performance shown. Investment return and principal value will fluctuate, and redemption value may be more or less than original cost. To obtain performance data current to the most recent month end, please call 1-800-345-2021 or visit americancentury.com. As interest rates rise, bond values will decline.
Unless otherwise indicated, performance reflects Investor Class shares; performance for other share classes will vary due to differences in fee structure. For information about other share classes available, please consult the prospectus. Data assumes reinvestment of dividends and capital gains, and none of the charts reflect the deduction of taxes that a shareholder would pay on fund distributions or the redemption of fund shares. Returns for the indices are provided for comparison. The fund’s total returns include operating expenses (such as transaction costs and management fees) that reduce returns, while the total returns of the indices do not.
14
Inflation-Adjusted Bond
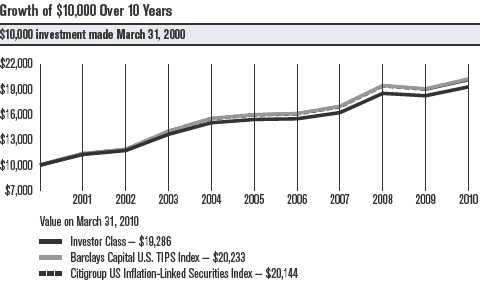
| | | | |
| Total Annual Fund Operating Expenses | | | |
| Investor Class | Institutional Class | A Class | C Class | R Class |
| 0.49% | 0.29% | 0.74% | 1.49% | 0.99% |
The total annual fund operating expenses shown is as stated in the fund’s prospectus current as of the date of this report. The prospectus may vary from the expense ratio shown elsewhere in this report because it is based on a different time period, includes acquired fund fees and expenses, and, if applicable, does not include fee waivers or expense reimbursements.
Data presented reflect past performance. Past performance is no guarantee of future results. Current performance may be higher or lower than the performance shown. Investment return and principal value will fluctuate, and redemption value may be more or less than original cost. To obtain performance data current to the most recent month end, please call 1-800-345-2021 or visit americancentury.com. As interest rates rise, bond values will decline.
Unless otherwise indicated, performance reflects Investor Class shares; performance for other share classes will vary due to differences in fee structure. For information about other share classes available, please consult the prospectus. Data assumes reinvestment of dividends and capital gains, and none of the charts reflect the deduction of taxes that a shareholder would pay on fund distributions or the redemption of fund shares. Returns for the indices are provided for comparison. The fund’s total returns include operating expenses (such as transaction costs and management fees) that reduce returns, while the total returns of the indices do not.
15
Inflation-Adjusted Bond
Portfolio Managers: Bob Gahagan, Brian Howell, and Jim Platz
Performance Summary
Inflation-Adjusted Bond returned 5.76%* for the 12 months ended March 31, 2010. By comparison, the fund’s new benchmark, the Barclays Capital U.S. TIPS Index, returned 6.18%, and its old benchmark, the Citigroup US Inflation-Linked Securities Index, returned 5.95%. Effective January 1, 2010, the benchmark changed to reflect a change in the portfolio management analytic system used by the investment management team. The portfolio’s investment process remains unchanged. Portfolio returns reflect operating expenses, while index returns do not.
The portfolio’s absolute performance benefited from the generally favorable climate for TIPS (Treasury inflation-protected securities) through the first nine months of the period, when the market’s longer-term expectations for rising inflation and a relatively tight supply of inflation-linked securities boosted TIPS performance. But, demand for TIPS softened during the remainder of the period. The mounting U.S. budget deficit—and the burgeoning Treasury issuance to finance the deficit in the face of waning investor demand for Treasuries—overshadowed investors’ long-term inflation worries. TIPS, along with their traditional-Treasury brethren, responded to these concerns with higher yields and lower prices. The portfolio’s underperformance relative to the benchmark was primarily due to an overweight in longer-maturity TIPS, which lagged late in the period, as supply mounted and the yiel d curve steepened.
Oil Prices Soared, Pushing Inflation Higher
As the global economy continued to recover, the emerging market countries showed greater improvements than the developed markets, fueling expectations for growing demand for energy and other commodities. Oil prices skyrocketed, jumping from $50 a barrel on March 31, 2009, to $84 at the end of March 2010—an increase of 68%. Similarly, the Rogers International Commodities Index, a measure of prices for energy, agricultural, and metals products, advanced 32%.
Rising commodity prices helped generate a 2.3% increase in headline inflation, as measured by change in the Consumer Price Index (CPI) over the 12-month period. At the same time, core inflation (minus volatile food and energy prices) increased only 1.1%.
Meanwhile, the market’s long-term inflation expectations were on the rise. The yield difference (or breakeven rate) between 10-year TIPS and nominal 10-year Treasuries increased during the period, from 1.31 percentage points at the end of March 2009 to 2.26 percentage points at the end of March 2010. The 10-year breakeven rate equals the market’s expectations for inflation for the next 10 years and also reflects the inflation rate required for TIPS to outperform nominal Treasuries during that time frame.
*All fund returns referenced in this commentary are for Investor Class shares.
16
Inflation-Adjusted Bond
Portfolio Strategy
We continued to invest the majority of the portfolio in TIPS (89% as of March 31, 2010), with smaller allocations to investment-grade “spread” (non-Treasury) sectors, including corporate, mortgage, and agency securities. This strategy generated mixed results, as investment-grade corporate securities significantly outperformed TIPS for the 12-month period, while mortgage and agency securities underperformed TIPS.
Late in 2009, yield spreads between short- and long-term Treasuries reached historically wide levels. We positioned the portfolio for an expected reversal of this trend by overweighting longer-term TIPS. While this strategy slightly detracted from recent performance, given the steepening of the yield curve, we believe it should provide longer-term value, as yield spreads eventually retreat from these peak levels.
In an effort to maintain maximum inflation protection without investing further in TIPS, we used inflation “swaps” to synthetically create an inflation-linked “overlay” for the non-inflation-linked spread securities. Inflation swaps are fixed-maturity instruments, negotiated through a counterparty (investment bank), that return the rate of inflation, as measured by CPI, throughout the life of the swap. All swaps bear counterparty credit risk, but American Century Investments applies the same stringent controls and oversight with regard to counterparty credit risk as it applies to all its corporate and municipal credit portfolios.
Outlook
Despite data suggesting select areas of the economy are improving, the overall economy remains relatively weak, primarily due to still-high unemployment and sluggish consumer spending. These factors have helped temper the market’s near-term inflation concerns. Nevertheless, the significant monetary and fiscal stimulus from the Federal Reserve and U.S. Treasury run the risk of creating significantly higher inflation and a weaker dollar than are currently priced into the market. Therefore, we believe TIPS remain attractively valued at current levels, given long-term inflation averages and the potential for higher-than-usual inflation in the years ahead.
17
| |
| Inflation-Adjusted Bond | |
| |
| Portfolio at a Glance | |
| | As of 3/31/10 |
| Weighted Average Life | 9.0 years |
| Average Duration (effective) | 4.8 years |
| |
| Yields as of March 31, 2010 | |
| 30-Day SEC Yield | |
| Investor Class | 4.20% |
| Institutional Class | 4.40% |
| A Class | 3.77% |
| C Class | 3.20% |
| R Class | 3.70% |
| |
| Portfolio Composition by Weighted Average Life | |
| | % of fund investments |
| | as of 3/31/10 |
| 0 – 5-Year Notes(1) | 40.0% |
| 5 – 10-Year Notes | 26.9% |
| 10 – 35-Year Bonds | 33.1% |
| (1) Includes temporary cash investments. | |
| |
| Types of Investments in Portfolio | |
| | % of fund investments |
| | as of 3/31/10 |
| U.S. Treasury Securities | 89.4% |
| Corporate Bonds | 5.8% |
| Commercial Mortgage-Backed Securities | 1.5% |
| Asset-Backed Securities | 0.5% |
| U.S. Government Agency Securities | 0.5% |
| Municipal Securities | 0.2% |
| Temporary Cash Investments | 2.1% |
18
| | | | | | | |
| Short-Term Government | | | | | |
| |
| Total Returns as of March 31, 2010 | | | | | |
| | | | | Average Annual Returns | |
| | | Ticker | | | | Since | Inception |
| | | Symbol | 1 year | 5 years | 10 years | Inception | Date |
| Investor Class | TWUSX | 2.25% | 4.01% | 4.05% | 5.78% | 12/15/82 |
| Barclays Capital | | | | | | |
| U.S. 1- to 3-Year | | | | | | |
| Government Index(1) | — | 1.81% | 4.38% | 4.59% | 6.67%(2) | — |
| Citigroup US Treasury/ | | | | | | |
| Agency 1- to 3-Year Index | — | 1.62% | 4.36% | 4.58% | 6.69%(2) | — |
| Institutional Class | TWUOX | — | — | — | -0.20%(3) | 3/1/10 |
| A Class(4) | TWAVX | | | | | 7/8/98 |
| No sales charge* | | 2.00% | 3.75% | 3.79% | 3.71% | |
| With sales charge* | | -0.27% | 3.28% | 3.55% | 3.51% | |
| C Class | TWACX | | | | | 3/1/10 |
| No sales charge* | | — | — | — | -0.30%(3) | |
| With sales charge* | | — | — | — | -1.29%(3) | |
| R Class | TWARX | — | — | — | -0.26%(3) | 3/1/10 |
| *Sales charges include initial sales charges and contingent deferred sales charges (CDSCs), as applicable. A Class shares have a |
| 2.25% maximum initial sales charge and may be subject to a maximum CDSC of 1.00%. C Class shares redeemed within 12 months |
| of purchase are subject to a maximum CDSC of 1.00%. The SEC requires that mutual funds provide performance information net of |
| maximum sales charges in all cases where charges could be applied. | | | | |
| |
| (1) | In January 2010, the fund’s benchmark changed from the Citigroup US Treasury/Agency 1- to 3-Year Index to the Barclays Capital U.S. |
| | 1- to 3-Year Government Index. This reflects a change in the portfolio management analytics software used by American Century Investments’ |
| | fixed-income teams. The investment process is unchanged. | | | | |
| (2) | Since 12/31/82, the date nearest the Investor Class’s inception for which data are available. | | | |
| (3) | Total returns for periods less than one year are not annualized. | | | | |
| (4) | Prior to March 1, 2010, the A Class was referred to as the Advisor Class and did not have a front-end sales charge. Performance prior to that |
| | date has been adjusted to reflect this charge. | | | | | |
Data presented reflect past performance. Past performance is no guarantee of future results. Current performance may be higher or lower than the performance shown. Investment return and principal value will fluctuate, and redemption value may be more or less than original cost. To obtain performance data current to the most recent month end, please call 1-800-345-2021 or visit americancentury.com. As interest rates rise, bond values will decline.
Unless otherwise indicated, performance reflects Investor Class shares; performance for other share classes will vary due to differences in fee structure. For information about other share classes available, please consult the prospectus. Data assumes reinvestment of dividends and capital gains, and none of the charts reflect the deduction of taxes that a shareholder would pay on fund distributions or the redemption of fund shares. Returns for the indices are provided for comparison. The fund’s total returns include operating expenses (such as transaction costs and management fees) that reduce returns, while the total returns of the indices do not.
19
Short-Term Government

| | | | |
| Total Annual Fund Operating Expenses | | | |
| Investor Class | Institutional Class | A Class | C Class | R Class |
| 0.57% | 0.37% | 0.82% | 1.57% | 1.07% |
The total annual fund operating expenses shown is as stated in the fund’s prospectus current as of the date of this report. The prospectus may vary from the expense ratio shown elsewhere in this report because it is based on a different time period, includes acquired fund fees and expenses, and, if applicable, does not include fee waivers or expense reimbursements.
Data presented reflect past performance. Past performance is no guarantee of future results. Current performance may be higher or lower than the performance shown. Investment return and principal value will fluctuate, and redemption value may be more or less than original cost. To obtain performance data current to the most recent month end, please call 1-800-345-2021 or visit americancentury.com. As interest rates rise, bond values will decline.
Unless otherwise indicated, performance reflects Investor Class shares; performance for other share classes will vary due to differences in fee structure. For information about other share classes available, please consult the prospectus. Data assumes reinvestment of dividends and capital gains, and none of the charts reflect the deduction of taxes that a shareholder would pay on fund distributions or the redemption of fund shares. Returns for the indices are provided for comparison. The fund’s total returns include operating expenses (such as transaction costs and management fees) that reduce returns, while the total returns of the indices do not.
20
Short-Term Government
Portfolio Managers: Bob Gahagan, Hando Aguilar, Brian Howell, Dan Shiffman, and Jim Platz
Performance Summary
Short-Term Government returned 2.25%* for the 12 months ended March 31, 2010. By comparison, the Barclays Capital U.S. 1- to 3-Year Government Index and Citigroup US Treasury/Agency 1- to 3-Year Index returned 1.81% and 1.62%, respectively. See page 19 for additional performance comparisons. Portfolio returns reflect operating expenses, while index returns do not.
Going forward, the portfolio’s performance will be presented solely against the Barclays Capital U.S. 1- to 3-Year Government Index as opposed to the Citigroup US Treasury/Agency 1- to 3-Year Index to reflect a change in the portfolio management analytic system used by American Century Investments’ Fixed Income team. The portfolio’s investment process remains unchanged.
Short-Term Government’s absolute return reflects the prevailing environment of low interest rates and modest returns for short-term government-backed securities (see page 3). The portfolio outperformed the short government bond indices largely as a result of its sector allocation.
Underweight to Treasuries Helped
We manage the portfolio using a relative value approach to investing, believing that significant areas of the bond market are inherently inefficient and respond predictably to extremes. Our Treasury underweight position is an example of this approach at work. We found this sector unattractive because of historically low Treasury yields, record high government budget deficits, and the threat of future inflation as a result of unprecedented stimulus measures. We believe these factors argue for higher Treasury yields (and lower prices) down the road. That positioning aided performance during the fiscal year, when intermediate- and longer-term Treasuries had negative absolute results.
And within this sector, we held an allocation to Treasury inflation-indexed securities (TIIS), which outperformed plain vanilla Treasuries. The key contribution to return from this trade took place early in the fiscal year, as we pared back our TIIS position after a run of outperformance. That helped because TIIS produced rather modest, though positive, returns in recent months.
Mortgage Overweight Also Contributed
It was also beneficial to favor mortgage-backed securities (MBS) over Treasuries, though we drew down this overweight over the course of the fiscal year as mortgages outperformed. Within the mortgage allocation, we found government agency MBS relatively less attractive as their yields approached record lows relative to Treasuries at the same time the Federal Reserve approached the end of its explicit participation in the market to support these securities. As a result, we found the risk/reward trade-off
*All fund returns referenced in this commentary are for Investor Class shares.
21
Short-Term Government
offered by agency MBS to be increasingly unattractive. In place of agency MBS we held collateralized mortgage obligations and commercial mortgage-backed securities, which did well for the fiscal year.
Other Notable Trades
We also put in place a trade designed to benefit from changes in the shape of the Treasury yield curve (a “curve flattener” trade). We implemented the trade in late 2009 when the yield difference, or spread, between two- and five-year securities approached the widest levels on record. This is another good example of a long-term trade designed to exploit market inefficiencies and tendency to “revert to the mean” after periods of significant divergence from typical yield relationships. To execute this trade, we sold two-year Treasury futures short (anticipating value declines as short-term interest rates rise) and bought longer-term Treasury futures long. The portfolio enjoyed a modest positive contribution to return from this trade in the fiscal year.
Outlook
“We believe we are at an important juncture for the economy and fixed-income markets,” said Portfolio Manager Bob Gahagan. “On the economic front, we expect a relatively modest, bumpy recovery. That’s because while profitability has returned to Wall Street and big businesses with global reach, U.S. consumers and small businesses still face headwinds—credit remains tight, debt burdens are stubbornly high, and wages are under pressure from the weak job market. Under those sorts of conditions, we think the Federal Reserve will continue to keep short-term interest rates low for an extended period.”
“Similarly, we believe we are at an inflection point for fixed-income markets in terms of bond yields, performance, and the shape of the yield curve. As a result, we expect to continue our Treasury bond underweight and yield curve flattener trades. In addition, because we expect the government’s unprecedented stimulus policies to result in inflation down the road, we’re likely to continue to look for opportunities to add inflation-protected securities. Finally, we think investor expectations for bond returns going forward should be more modest than in years past—we don’t expect the historically broad dispersion of returns we saw across the bond market in 2008 and 2009.”
22
| |
| Short-Term Government | |
| |
| Portfolio at a Glance | |
| | As of 3/31/10 |
| Average Duration (effective) | 1.9 years |
| Weighted Average Life | 2.1 years |
| |
| Yields as of March 31, 2010 | |
| 30-Day SEC Yield | |
| Investor Class | 0.78% |
| Institutional Class | 0.99% |
| A Class | 0.52% |
| C Class | -0.20% |
| R Class | 0.29% |
| |
| Types of Investments in Portfolio | |
| | % of fund investments |
| | as of 3/31/10 |
| U.S. Treasury Securities | 55.3% |
| U.S. Government Agency Securities and Equivalents | 31.8% |
| Collateralized Mortgage Obligations | 8.6% |
| U.S. Government Agency Mortgage-Backed Securities | 2.6% |
| Asset-Backed Securities | 0.5% |
| Corporate Bonds | 0.5% |
| Temporary Cash Investments | 0.7% |
23
|
| Shareholder Fee Examples (Unaudited) |
Fund shareholders may incur two types of costs: (1) transaction costs, including sales charges (loads) on purchase payments and redemption/ exchange fees; and (2) ongoing costs, including management fees; distribution and service (12b-1) fees; and other fund expenses. This example is intended to help you understand your ongoing costs (in dollars) of investing in your fund and to compare these costs with the ongoing cost of investing in other mutual funds.
The example is based on an investment of $1,000 made at the beginning of the period and held for the entire period from October 1, 2009 to March 31, 2010.
Actual Expenses
The table provides information about actual account values and actual expenses for each class. You may use the information, together with the amount you invested, to estimate the expenses that you paid over the period. First, identify the share class you own. Then simply divide your account value by $1,000 (for example, an $8,600 account value divided by $1,000 = 8.6), then multiply the result by the number under the heading “Expenses Paid During Period” to estimate the expenses you paid on your account during this period.
If you hold Investor Class shares of any American Century Investments fund, or Institutional Class shares of the American Century Diversified Bond Fund, in an American Century Investments account (i.e., not a financial intermediary or retirement plan account), American Century Investments may charge you a $12.50 semiannual account maintenance fee if the value of those shares is less than $10,000. We will redeem shares automatically in one of your accounts to pay the $12.50 fee. In determining your total eligible investment amount, we will include your investments in all personal accounts (including American Century Investments Brokerage accounts) registered under your Social Security number. Personal accounts include individual accounts, joint accounts, UGMA/UTMA accounts, personal trusts, Coverdell Education Savings Accounts and IRAs (including traditional, Roth, Rollover, SEP-, SARSEP- and SIMPLE-IRAs), and certain other retirement accounts. If you have only business, business retirement, employer-sponsored or American Century Investments Brokerage accounts, you are currently not subject to this fee. We will not charge the fee as long as you choose to manage your accounts exclusively online. If you are subject to the Account Maintenance Fee, your account value could be reduced by the fee amount.
Hypothetical Example for Comparison Purposes
The table also provides information about hypothetical account values and hypothetical expenses based on the actual expense ratio of each class of your fund and an assumed rate of return of 5% per year before expenses, which is not the actual return of a fund’s share class. The hypothetical account values and expenses may not be used to estimate the actual ending account balance or expenses you paid for the period. You may use this information to compare the ongoing costs of investing in your fund and other funds. To do so, compare this 5% hypothetical example with the 5% hypothetical examples that appear in the shareholder reports of the other funds.
24
Please note that the expenses shown in the table are meant to highlight your ongoing costs only and do not reflect any transactional costs, such as sales charges (loads) or redemption/exchange fees. Therefore, the table is useful in comparing ongoing costs only, and will not help you determine the relative total costs of owning different funds. In addition, if these transactional costs were included, your costs would have been higher.
| | | | | |
| | | Beginning | Ending | Expenses Paid | |
| | | Account Value | Account Value | During Period(1) | Annualized |
| | | 10/1/09 | 3/31/10 | 10/1/09 – 3/31/10 | Expense Ratio(1) |
| Ginnie Mae | | | | |
| Actual | | | | |
| Investor Class (after waiver)(2) | $1,000 | $1,021.90 | $2.72 | 0.54% |
| Investor Class (before waiver) | $1,000 | $1,021.90(3) | $2.82 | 0.56% |
| Institutional Class (after waiver)(2) | $1,000 | $1,023.00 | $1.71 | 0.34% |
| Institutional Class (before waiver) | $1,000 | $1,023.00(3) | $1.82 | 0.36% |
| A Class (after waiver)(2) | $1,000 | $1,020.70 | $3.98 | 0.79% |
| A Class (before waiver) | $1,000 | $1,020.70(3) | $4.08 | 0.81% |
| C Class (after waiver)(2) | $1,000 | $1,000.80(4) | $1.27(5) | 1.54% |
| C Class (before waiver) | $1,000 | $1,000.80(3)(4) | $1.28(5) | 1.56% |
| R Class (after waiver)(2) | $1,000 | $1,019.40 | $5.24 | 1.04% |
| R Class (before waiver) | $1,000 | $1,019.40(3) | $5.34 | 1.06% |
| Hypothetical | | | | |
| Investor Class (after waiver)(2) | $1,000 | $1,022.24 | $2.72 | 0.54% |
| Investor Class (before waiver) | $1,000 | $1,022.14 | $2.82 | 0.56% |
| Institutional Class (after waiver)(2) | $1,000 | $1,023.24 | $1.72 | 0.34% |
| Institutional Class (before waiver) | $1,000 | $1,023.14 | $1.82 | 0.36% |
| A Class (after waiver)(2) | $1,000 | $1,020.99 | $3.98 | 0.79% |
| A Class (before waiver) | $1,000 | $1,020.89 | $4.08 | 0.81% |
| C Class (after waiver)(2) | $1,000 | $1,017.25(6) | $7.75(6) | 1.54% |
| C Class (before waiver) | $1,000 | $1,017.15(6) | $7.85(6) | 1.56% |
| R Class (after waiver)(2) | $1,000 | $1,019.75 | $5.24 | 1.04% |
| R Class (before waiver) | $1,000 | $1,019.65 | $5.34 | 1.06% |
| (1) | Expenses are equal to the class’s annualized expense ratio listed in the table above, multiplied by the average account value over the period, |
| | multiplied by 182, the number of days in the most recent fiscal half-year, divided by 365, to reflect the one-half year period. |
| (2) | During the six months ended March 31, 2010, the class received a partial waiver of its management fee. | |
| (3) | Ending account value assumes the return earned after waiver. The return would have been lower had fees not been waived and would have |
| | resulted in a lower ending account value. | | | | |
| (4) | Ending account value based on actual return from March 1, 2010 (commencement of sale) through March 31, 2010. | |
| (5) | Expenses are equal to the class’s annualized expense ratio listed in the table above, multiplied by the average account value over the period, |
| | multiplied by 30, the number of days in the period from March 1, 2010 (commencement of sale) through March 31, 2010, divided by 365, to |
| | reflect the period. Had the class been available for the full period, the expenses paid during the period would have been higher. |
| (6) | Ending account value and expenses paid during period assumes the class had been available throughout the entire period and are calculated |
| | using the class’s annualized expense ratio listed in the table above. | | | |
25
| | | | | |
| | | Beginning | Ending | Expenses Paid | |
| | | Account Value | Account Value | During Period(1) | Annualized |
| | | 10/1/09 | 3/31/10 | 10/1/09 – 3/31/10 | Expense Ratio(1) |
| Government Bond | | | | |
| Actual | | | | |
| Investor Class | $1,000 | $1,011.40 | $2.41 | 0.48% |
| Institutional Class | $1,000 | $997.40(2) | $0.23(3) | 0.28% |
| A Class | $1,000 | $1,010.20 | $3.66 | 0.73% |
| C Class | $1,000 | $996.40(2) | $1.21(3) | 1.48% |
| R Class | $1,000 | $996.80(2) | $0.80(3) | 0.98% |
| Hypothetical | | | | |
| Investor Class | $1,000 | $1,022.54 | $2.42 | 0.48% |
| Institutional Class | $1,000 | $1,023.54(4) | $1.41(4) | 0.28% |
| A Class | $1,000 | $1,021.29 | $3.68 | 0.73% |
| C Class | $1,000 | $1,017.55(4) | $7.44(4) | 1.48% |
| R Class | $1,000 | $1,020.04(4) | $4.94(4) | 0.98% |
| Inflation-Adjusted Bond | | | | |
| Actual | | | | |
| Investor Class | $1,000 | $1,021.60 | $2.42 | 0.48% |
| Institutional Class | $1,000 | $1,022.80 | $1.41 | 0.28% |
| A Class | $1,000 | $1,020.90 | $3.68 | 0.73% |
| C Class | $1,000 | $1,000.00(2) | $1.22(3) | 1.48% |
| R Class | $1,000 | $1,000.90(2) | $0.81(3) | 0.98% |
| Hypothetical | | | | |
| Investor Class | $1,000 | $1,022.54 | $2.42 | 0.48% |
| Institutional Class | $1,000 | $1,023.54 | $1.41 | 0.28% |
| A Class | $1,000 | $1,021.29 | $3.68 | 0.73% |
| C Class | $1,000 | $1,017.55(4) | $7.44(4) | 1.48% |
| R Class | $1,000 | $1,020.04(4) | $4.94(4) | 0.98% |
| (1) | Expenses are equal to the class’s annualized expense ratio listed in the table above, multiplied by the average account value over the period, |
| | multiplied by 182, the number of days in the most recent fiscal half-year, divided by 365, to reflect the one-half year period. |
| (2) | Ending account value based on actual return from March 1, 2010 (commencement of sale) through March 31, 2010. | |
| (3) | Expenses are equal to the class’s annualized expense ratio listed in the table above, multiplied by the average account value over the period, |
| | multiplied by 30, the number of days in the period from March 1, 2010 (commencement of sale) through March 31, 2010, divided by 365, to |
| | reflect the period. Had the class been available for the full period, the expenses paid during the period would have been higher. |
| (4) | Ending account value and expenses paid during period assumes the class had been available throughout the entire period and are calculated |
| | using the class’s annualized expense ratio listed in the table above. | | | |
26
| | | | | |
| | | Beginning | Ending | Expenses Paid | |
| | | Account Value | Account Value | During Period(1) | Annualized |
| | | 10/1/09 | 3/31/10 | 10/1/09 – 3/31/10 | Expense Ratio(1) |
| Short-Term Government | | | | |
| Actual | | | | |
| Investor Class | $1,000 | $1,006.10 | $2.80 | 0.56% |
| Institutional Class | $1,000 | $998.00(2) | $0.30(3) | 0.36% |
| A Class | $1,000 | $1,004.90 | $4.05 | 0.81% |
| C Class | $1,000 | $997.00(2) | $1.28(3) | 1.56% |
| R Class | $1,000 | $997.40(2) | $0.87(3) | 1.06% |
| Hypothetical | | | | |
| Investor Class | $1,000 | $1,022.14 | $2.82 | 0.56% |
| Institutional Class | $1,000 | $1,023.14(4) | $1.82(4) | 0.36% |
| A Class | $1,000 | $1,020.89 | $4.08 | 0.81% |
| C Class | $1,000 | $1,017.15(4) | $7.85(4) | 1.56% |
| R Class | $1,000 | $1,019.65(4) | $5.34(4) | 1.06% |
| (1) | Expenses are equal to the class’s annualized expense ratio listed in the table above, multiplied by the average account value over the period, |
| | multiplied by 182, the number of days in the most recent fiscal half-year, divided by 365, to reflect the one-half year period. |
| (2) | Ending account value based on actual return from March 1, 2010 (commencement of sale) through March 31, 2010. | |
| (3) | Expenses are equal to the class’s annualized expense ratio listed in the table above, multiplied by the average account value over the period, |
| | multiplied by 30, the number of days in the period from March 1, 2010 (commencement of sale) through March 31, 2010, divided by 365, to |
| | reflect the period. Had the class been available for the full period, the expenses paid during the period would have been higher. |
| (4) | Ending account value and expenses paid during period assumes the class had been available throughout the entire period and are calculated |
| | using the class’s annualized expense ratio listed in the table above. | | | |
27
| | | | | | |
| Ginnie Mae | | | | | | |
| |
| MARCH 31, 2010 | | | | | | |
| | Principal | | | | Principal | |
| | Amount | Value | | | Amount | Value |
| U.S. Government Agency | | | GNMA, 9.50%, 5/15/16 | | |
| | | | | to 7/20/25(3) | $ 452,552 | $ 516,380 |
| Mortgage-Backed Securities(1) — 98.0% | | | | |
| | | | | GNMA, 9.75%, 8/15/17 | | |
| ADJUSTABLE-RATE U.S. GOVERNMENT AGENCY | | to 11/20/21(3) | 103,706 | 117,628 |
| MORTGAGE-BACKED SECURITIES — 1.2% | | | GNMA, 10.00%, 3/15/16 | | |
| GNMA, VRN, 4.80%, | | | | to 1/15/22(3) | 65,564 | 74,203 |
| 4/1/11 | $ 18,294,926 | $ 18,771,662 | | GNMA, 10.25%, 5/15/12 | | |
| FIXED-RATE U.S. GOVERNMENT AGENCY | | | to 2/15/19(3) | 17,477 | 19,281 |
| MORTGAGE-BACKED SECURITIES — 96.8% | | | GNMA, 10.50%, 3/15/14 | | |
| GNMA, 4.50%, settlement | | | | to 4/20/19(3) | 66,819 | 74,537 |
| date 4/15/10(2) | 87,500,000 | 88,470,725 | | GNMA, 11.00%, 7/15/10 | | |
| GNMA, 4.50%, 7/15/33 | | | | to 6/15/20(3) | 39,065 | 43,486 |
| to 11/15/39 | 167,470,245 | 169,607,820 | | GNMA, 11.25%, 2/20/16(3) | 2,006 | 2,253 |
| GNMA, 5.00%, 6/15/33 | | | | GNMA, 11.50%, 2/15/13 | | |
| to 2/20/40(3) | 415,434,073 | 433,238,569 | | | | |
| | | | | to 10/20/18(3) | 5,449 | 6,119 |
| GNMA, 5.50%, 4/15/33 | | | | GNMA, 12.00%, 3/15/11 | | |
| to 1/20/40(3) | 443,802,724 | 471,183,395 | | | | |
| | | | | to 12/15/12(3) | 5,903 | 6,310 |
| GNMA, 6.00%, 7/20/16 | | | | GNMA, 12.25%, 2/15/14(3) | 3,678 | 4,189 |
| to 2/20/39(3) | 264,050,105 | 283,260,510 | | | | |
| GNMA, 6.50%, 6/15/23 | | | | GNMA, 12.50%, 6/15/10 | | |
| | | | | to 12/15/13(3) | 11,769 | 12,906 |
| to 11/15/38(3) | 62,383,012 | 67,839,302 | | | | |
| GNMA, 7.00%, 5/15/17 | | | | GNMA, 13.00%, 2/15/11 | | |
| | | | | to 8/15/15(3) | 48,785 | 55,811 |
| to 12/20/29(3) | 9,856,024 | 11,057,455 | | | | |
| GNMA, 7.25%, 4/15/23 | | | | GNMA, 13.50%, 4/15/11 | | |
| | | | | to 8/15/14(3) | 19,884 | 23,091 |
| to 6/15/23(3) | 61,408 | 68,759 | | | | |
| GNMA, 7.50%, 6/15/13 | | | | GNMA, 13.75%, | | |
| | | | | 8/15/14(3) | 4,940 | 5,816 |
| to 11/15/31(3) | 7,727,534 | 8,736,056 | | | | |
| GNMA, 7.65%, 6/15/16 | | | | GNMA, 14.00%, 6/15/11 | | |
| | | | | to 7/15/11(3) | 1,080 | 1,174 |
| to 12/15/16(3) | 86,543 | 95,206 | | | | |
| GNMA, 7.75%, 11/15/22 | | | | GNMA, 14.50%, 10/15/12 | | |
| | | | | to 12/15/12(3) | 10,452 | 11,884 |
| to 6/20/23(3) | 55,090 | 62,700 | | | | |
| GNMA, 7.77%, 4/15/20 | | | | GNMA, 15.00%, 7/15/11 | | |
| | | | | to 9/15/12(3) | 10,436 | 11,833 |
| to 6/15/20(3) | 232,922 | 264,866 | | | | |
| GNMA, 7.85%, 9/20/22(3) | 32,689 | 37,246 | | | | 1,542,392,619 |
| | | | | TOTAL U.S. GOVERNMENT AGENCY | |
| GNMA, 7.89%, 9/20/22(3) | 14,300 | 16,310 | | MORTGAGE-BACKED SECURITIES | |
| GNMA, 7.98%, 6/15/19(3) | 90,223 | 102,383 | | (Cost $1,521,481,522) | | 1,561,164,281 |
| GNMA, 8.00%, 2/20/17 | | | | U.S. Government Agency Collateralized |
| to 7/20/30(3) | 2,309,306 | 2,654,813 | | | | |
| | | | | Mortgage Obligations(1) — 6.3% | |
| GNMA, 8.15%, 2/15/21(3) | 58,966 | 67,321 | | | | |
| GNMA, 8.25%, 10/20/16 | | | | GNMA, Series 1998-6, | | |
| to 5/15/27(3) | 525,710 | 593,815 | | Class FA, VRN, 0.74%, | | |
| | | | | 4/16/10, resets monthly | | |
| GNMA, 8.35%, 11/15/20(3) | 42,166 | 47,944 | | off the 1-month LIBOR | | |
| GNMA, 8.50%, 1/20/13 | | | | plus 0.51% with a cap | | |
| to 12/15/30(3) | 1,902,939 | 2,184,599 | | of 9.00%(3) | 3,522,297 | 3,551,166 |
| GNMA, 8.75%, 1/15/17 | | | | GNMA, Series 1998-17, | | |
| to 7/15/27(3) | 178,416 | 203,208 | | Class F, VRN, 0.73%, | | |
| GNMA, 9.00%, 3/15/13 | | | | 4/16/10, resets monthly | | |
| to 1/15/25(3) | 1,174,906 | 1,336,307 | | off the 1-month LIBOR | | |
| | | | | plus 0.50% with a cap | | |
| GNMA, 9.25%, 9/15/16 | | | | of 9.00%(3) | 417,791 | 420,234 |
| to 3/15/25(3) | 243,020 | 276,409 | | | | |
28
| | | | | | |
| Ginnie Mae | | | | | | |
| |
| | Principal | | | | Principal | |
| | Amount | Value | | | Amount | Value |
| GNMA, Series 2000-22, | | | | GNMA, Series 2003-55, | | |
| Class FG, VRN, 0.43%, | | | | Class PG, 5.00%, | | |
| 4/16/10, resets monthly | | | | 6/20/29(3) | $ 4,523,504 | $ 4,569,781 |
| off the 1-month LIBOR | | | | GNMA, Series 2003-66, | | |
| plus 0.20% with a cap | | | | Class EH, 5.00%, | | |
| of 10.00%(3) | $ 174,909 | $ 175,961 | | 5/20/32(3) | 17,650,000 | 18,811,824 |
| GNMA, Series 2001-59, | | | | GNMA, Series 2003-66, | | |
| Class FD, VRN, 0.73%, | | | | Class HF, VRN, 0.69%, | | |
| 4/16/10, resets monthly | | | | 4/20/10, resets monthly | | |
| off the 1-month LIBOR | | | | off the 1-month LIBOR | | |
| plus 0.50% with a cap | | | | plus 0.45% with a cap | | |
| of 8.50%(3) | 2,027,196 | 2,034,410 | | of 7.50% | 3,906,904 | 3,954,388 |
| GNMA, Series 2001-62, | | | | GNMA, Series 2003-85, | | |
| Class FB, VRN, 0.73%, | | | | Class A SEQ, 4.50%, | | |
| 4/16/10, resets monthly | | | | 9/20/27 | 2,514,607 | 2,570,466 |
| off the 1-month LIBOR | | | | | | |
| plus 0.50% with a cap | | | | GNMA, Series 2003-85, | | |
| of 8.50%(3) | 4,134,877 | 4,140,906 | | Class BM SEQ, 5.00%, | | |
| | | | | 2/20/24 | 120,014 | 120,096 |
| GNMA, Series 2002-13, | | | | | | |
| Class FA, VRN, 0.73%, | | | | GNMA, Series 2003-85, | | |
| 4/20/10, resets monthly | | | | Class BX SEQ, 5.50%, | | |
| off the 1-month LIBOR | | | | 2/20/24 | 120,014 | 120,080 |
| plus 0.50% with a cap | | | | GNMA, Series 2003-86, | | |
| of 8.50%(3) | 2,355,462 | 2,358,174 | | Class BD SEQ, 5.50%, | | |
| GNMA, Series 2002-24, | | | | 4/20/30 | 7,437,138 | 7,507,330 |
| Class FA, VRN, 0.73%, | | | | GNMA, Series 2003-110, | | |
| 4/16/10, resets monthly | | | | Class HA SEQ, 5.00%, | | |
| off the 1-month LIBOR | | | | 5/20/29(3) | 382,062 | 383,060 |
| plus 0.50% with a cap | | | | GNMA, Series 2004-30, | | |
| of 8.50%(3) | 4,100,315 | 4,108,934 | | Class PD, 5.00%, | | |
| GNMA, Series 2002-29, | | | | 2/20/33(3) | 22,223,224 | 23,660,304 |
| Class FA SEQ, VRN, | | | | GNMA, Series 2004-39, | | |
| 0.59%, 4/20/10, resets | | | | Class XF SEQ, VRN, | | |
| monthly off the 1-month | | | | 0.48%, 4/16/10, resets | | |
| LIBOR plus 0.35% with a | | | | monthly off the 1-month | | |
| cap of 9.00%(3) | 1,169,950 | 1,181,367 | | LIBOR plus 0.25% with a | | |
| GNMA, Series 2002-31, | | | | cap of 7.50%(3) | 2,757,439 | 2,771,351 |
| Class FW, VRN, 0.63%, | | | | GNMA, Series 2004-46, | | |
| 4/16/10, resets monthly | | | | Class BG SEQ, 5.00%, | | |
| off the 1-month LIBOR | | | | 5/20/25 | 1,237,088 | 1,245,971 |
| plus 0.40% with a cap | | | | GNMA, Series 2004-87, | | |
| of 8.50%(3) | 1,224,561 | 1,232,080 | | Class LA, 3.625%, | | |
| GNMA, Series 2003-14, | | | | 12/20/28(3) | 1,120,051 | 1,121,044 |
| Class F, VRN, 0.59%, | | | | GNMA, Series 2007-6, | | |
| 4/20/10, resets monthly | | | | Class LA, 5.50%, | | |
| off the 1-month LIBOR | | | | 10/20/30 | 727,855 | 728,878 |
| plus 0.35% with a cap | | | | | | |
| of 7.50%(3) | 16,156 | 16,161 | | GNMA, Series 2007-33, | | |
| | | | | Class LA, 5.50%, 4/20/31 | 1,752,255 | 1,756,852 |
| GNMA, Series 2003-42, | | | | | | |
| Class FW, VRN, 0.59%, | | | | GNMA, Series 2009-45, | | |
| 4/20/10, resets monthly | | | | Class AB, 5.00%, | | |
| off the 1-month LIBOR | | | | 12/20/29 | 7,619,845 | 7,931,337 |
| plus 0.35% with a cap | | | | TOTAL U.S. GOVERNMENT | | |
| of 7.00%(3) | 1,970,371 | 1,966,930 | | AGENCY COLLATERALIZED | | |
| GNMA, Series 2003-46, | | | | MORTGAGE OBLIGATIONS | | |
| Class PA, 5.00%, | | | | (Cost $97,269,322) | | 101,144,194 |
| 5/20/29(3) | 2,689,194 | 2,705,109 | | | | |
29
| | |
| Ginnie Mae | | |
| |
| | Shares | Value |
| Temporary Cash Investments — 1.0% |
| JPMorgan U.S. Treasury | | |
| Plus Money Market Fund | | |
| Agency Shares(3) | 364,462 | $ 364,462 |
| Repurchase Agreement, Goldman Sachs | |
| Group, Inc., (collateralized by various U.S. | |
| Treasury obligations, 4.50%, 5/15/38, | |
| valued at $16,180,075), in a joint trading | |
| account at 0.00%, dated 3/31/10, due | |
| 4/1/10 (Delivery value $15,852,000) | 15,852,000 |
| TOTAL TEMPORARY | | |
| CASH INVESTMENTS | | |
| (Cost $16,216,462) | | 16,216,462 |
| TOTAL INVESTMENT | | |
| SECURITIES — 105.3% | | |
| (Cost $1,634,967,306) | | 1,678,524,937 |
| OTHER ASSETS AND | | |
| LIABILITIES — (5.3)% | | (85,147,642) |
| TOTAL NET ASSETS — 100.0% | $1,593,377,295 |
| | | | | |
| Futures Contracts | | | |
| | | | | Underlying Face | |
| | Contracts Purchased | Expiration Date | Amount at Value | Unrealized Gain (Loss) |
| | 239 | U.S. Long Bond | June 2010 | $27,753,875 | $(35,124) |
| |
| | | | | Underlying Face | |
| | | Contracts Sold | Expiration Date | Amount at Value | Unrealized Gain (Loss) |
| | 758 | U.S. Treasury 2-Year Notes | June 2010 | $164,450,469 | $3,115 |
| |
| Notes to Schedule of Investments | | |
| GNMA = Government National Mortgage Association | | | |
| LIBOR = London Interbank Offered Rate | | | |
| resets = The frequency with which a security’s coupon changes, based on current market conditions or an underlying index. The more frequently a |
| security resets, the less risk the investor is taking that the coupon will vary significantly from current market rates. | |
| SEQ = Sequential Payer | | | |
| VRN = Variable Rate Note. Interest reset date is indicated. Rate shown is effective at the period end. | |
| (1) | Final maturity indicated, unless otherwise noted. | | | |
| (2) | Forward commitment. | | | |
| (3) | Security, or a portion thereof, has been segregated for forward commitments and/or futures contracts. At the period end, the aggregate value of |
| | securities pledged was $280,676,000. | | | |
| |
| See Notes to Financial Statements. | | | |
30
| | | | | | |
| Government Bond | | | | | |
| |
| MARCH 31, 2010 | | | | | | |
| | Principal | | | | Principal | |
| | Amount | Value | | | Amount | Value |
| U.S. Government Agency | | | FNMA, 6.50%, 9/1/47(2) | $ 778,067 | $ 836,555 |
| Mortgage-Backed Securities(1) — 43.2% | | FNMA, 6.50%, 9/1/47(2) | 1,971,410 | 2,119,604 |
| | | | | FNMA, 6.00%, 4/1/48(2) | 7,994,408 | 8,450,460 |
| ADJUSTABLE-RATE U.S. GOVERNMENT AGENCY | | | | |
| MORTGAGE-BACKED SECURITIES — 0.3% | | | GNMA, 6.00%, settlement | | |
| | | | | date 4/15/10(3) | 14,000,000 | 14,951,566 |
| FNMA, VRN, 5.73%, | | | | | | |
| 12/1/12(2) | $ 3,945,685 | $ 4,126,470 | | GNMA, 5.50%, 12/20/38 | 22,352,899 | 23,658,052 |
| FIXED-RATE U.S. GOVERNMENT AGENCY | | | GNMA, 6.00%, 1/20/39 | 4,633,288 | 4,968,342 |
| MORTGAGE-BACKED SECURITIES — 42.9% | | | GNMA, 5.00%, 3/20/39 | 22,469,290 | 23,347,678 |
| FHLMC, 4.50%, 1/1/19(2) | 3,189,960 | 3,357,462 | | GNMA, 5.50%, 3/20/39 | 7,457,367 | 7,892,937 |
| FHLMC, 5.00%, 5/1/23(2) | 19,851,415 | 20,966,393 | | GNMA, 5.50%, 4/20/39 | 12,054,535 | 12,758,617 |
| FHLMC, 5.50%, 10/1/34(2) | 4,851,170 | 5,140,798 | | GNMA, 5.00%, 12/15/39 | 14,908,384 | 15,525,909 |
| FHLMC, 5.50%, 4/1/38(2) | 49,305,244 | 52,115,156 | | | | 506,093,602 |
| FHLMC, 6.50%, 7/1/47(2) | 281,871 | 305,262 | | TOTAL U.S. GOVERNMENT AGENCY | |
| | | | | MORTGAGE-BACKED SECURITIES | |
| FNMA, 6.50%, settlement | | | | (Cost $489,777,360) | | 510,220,072 |
| date 4/15/10(3) | 15,170,000 | 16,438,121 | | | | |
| FNMA, 4.50%, 6/1/18 | 1,839,114 | 1,935,972 | | U.S. Treasury Securities — 28.6% | |
| FNMA, 4.50%, 5/1/19(2) | 9,182,194 | 9,651,432 | | U.S. Treasury Bonds, | | |
| | | | | 11.25%, 2/15/15(2) | 20,500,000 | 28,780,093 |
| FNMA, 5.00%, 9/1/20(2) | 1,025,591 | 1,090,463 | | | | |
| FNMA, 4.50%, 11/1/20 | 834,805 | 877,466 | | U.S. Treasury Bonds, | | |
| | | | | 10.625%, 8/15/15(2) | 11,500,000 | 16,092,813 |
| FNMA, 6.50%, 3/1/32(2) | 506,785 | 559,847 | | | | |
| | | | | U.S. Treasury Bonds, | | |
| FNMA, 7.00%, 6/1/32(2) | 459,910 | 517,286 | | 8.125%, 8/15/19(2) | 7,600,000 | 10,222,000 |
| FNMA, 6.50%, 8/1/32(2) | 649,969 | 718,023 | | U.S. Treasury Bonds, | | |
| FNMA, 5.50%, 7/1/33(2) | 7,488,845 | 7,944,139 | | 8.125%, 8/15/21(2) | 14,247,000 | 19,551,785 |
| FNMA, 5.00%, 11/1/33(2) | 37,240,274 | 38,628,152 | | U.S. Treasury Bonds, | | |
| | | | | 7.125%, 2/15/23(2) | 10,700,000 | 13,791,305 |
| FNMA, 5.50%, 8/1/34 | 28,470,094 | 30,138,693 | | | | |
| | | | | U.S. Treasury Bonds, | | |
| FNMA, 5.50%, 9/1/34(2) | 1,571,999 | 1,664,132 | | 6.625%, 2/15/27(2) | 4,500,000 | 5,656,644 |
| FNMA, 5.50%, 10/1/34(2) | 12,386,908 | 13,112,890 | | U.S. Treasury Bonds, | | |
| FNMA, 5.00%, 8/1/35(2) | 8,103,678 | 8,380,364 | | 6.125%, 11/15/27(2) | 6,000,000 | 7,186,878 |
| FNMA, 5.50%, 1/1/36(2) | 29,585,025 | 31,263,496 | | U.S. Treasury Bonds, | | |
| | | | | 5.50%, 8/15/28(2) | 5,000,000 | 5,601,565 |
| FNMA, 5.00%, 2/1/36(2) | 3,420,029 | 3,536,800 | | | | |
| FNMA, 5.50%, 4/1/36(2) | 9,747,402 | 10,300,409 | | U.S. Treasury Bonds, | | |
| | | | | 5.25%, 2/15/29(2) | 5,000,000 | 5,442,190 |
| FNMA, 5.00%, 5/1/36(2) | 16,251,426 | 16,806,302 | | U.S. Treasury Bonds, | | |
| FNMA, 5.50%, 12/1/36(2) | 8,493,823 | 8,962,438 | | 3.50%, 2/15/39(2) | 12,000,000 | 9,714,384 |
| FNMA, 5.50%, 2/1/37(2) | 30,663,496 | 32,355,241 | | U.S. Treasury Bonds, | | |
| | | | | 4.25%, 5/15/39(2) | 9,500,000 | 8,805,322 |
| FNMA, 6.50%, 8/1/37(2) | 5,178,647 | 5,579,261 | | | | |
| FNMA, 6.00%, 11/1/37 | 41,166,317 | 43,791,292 | | U.S. Treasury Bonds, | | |
| | | | | 4.375%, 11/15/39(2) | 13,500,000 | 12,770,163 |
| FNMA, 6.00%, 9/1/38 | 3,306,399 | 3,491,918 | | U.S. Treasury Inflation | | |
| FNMA, 6.00%, 11/1/38 | 4,861,409 | 5,134,177 | | Indexed Notes, 1.625%, | | |
| FNMA, 4.50%, 2/1/39 | 13,993,599 | 14,038,305 | | 1/15/15(2) | 21,561,390 | 22,548,492 |
| FNMA, 6.50%, 6/1/47(2) | 281,827 | 303,013 | | U.S. Treasury Notes, | | |
| | | | | 4.125%, 8/31/12(2) | 5,650,000 | 6,040,206 |
| FNMA, 6.50%, 8/1/47(2) | 663,106 | 712,952 | | | | |
| FNMA, 6.50%, 8/1/47(2) | 851,297 | 915,290 | | U.S. Treasury Notes, | | |
| | | | | 1.375%, 3/15/13(2) | 10,000,000 | 9,943,730 |
| FNMA, 6.50%, 9/1/47(2) | 104,172 | 112,003 | | | | |
| | | | | U.S. Treasury Notes, | | |
| FNMA, 6.50%, 9/1/47(2) | 687,271 | 738,934 | | 1.875%, 4/30/14(2) | 38,000,000 | 37,551,752 |
31
| | | | | | |
| Government Bond | | | | | |
| |
| | Principal | | | | Principal | |
| | Amount | Value | | | Amount | Value |
| U.S. Treasury Notes, | | | | Citigroup Funding, Inc., | | |
| 2.375%, 8/31/14(2) | $12,000,000 | $ 12,029,064 | | 1.875%, 11/15/12(2) | $ 8,000,000 | $ 8,063,096 |
| U.S. Treasury Notes, | | | | General Electric Capital | | |
| 2.125%, 11/30/14(2) | 10,000,000 | 9,871,100 | | Corp., 1.80%, 3/11/11(2) | 5,000,000 | 5,060,650 |
| U.S. Treasury Notes, | | | | General Electric Capital | | |
| 2.625%, 12/31/14(2) | 10,000,000 | 10,075,010 | | Corp., 2.25%, 3/12/12(2) | 15,000,000 | 15,326,265 |
| U.S. Treasury Notes, | | | | General Electric Capital | | |
| 2.375%, 2/28/15(2) | 2,000,000 | 1,986,726 | | Corp., 2.625%, 12/28/12(2) | 1,500,000 | 1,541,376 |
| U.S. Treasury Notes, | | | | GMAC, Inc., 1.75%, | | |
| 4.875%, 8/15/16(2) | 14,000,000 | 15,515,948 | | 10/30/12(2) | 14,000,000 | 14,089,810 |
| U.S. Treasury Notes, | | | | GMAC, Inc., 2.20%, | | |
| 4.75%, 8/15/17(2) | 28,950,000 | 31,655,030 | | 12/19/12(2) | 5,150,000 | 5,229,557 |
| U.S. Treasury Notes, | | | | Goldman Sachs Group, | | |
| 4.00%, 8/15/18(2) | 12,085,000 | 12,451,333 | | Inc. (The), 1.625%, | | |
| U.S. Treasury Notes, | | | | 7/15/11(2) | 3,500,000 | 3,540,554 |
| 3.625%, 8/15/19(2) | 5,000,000 | 4,940,630 | | Goldman Sachs Group, | | |
| U.S. Treasury Notes, | | | | Inc. (The), 3.25%, | | |
| 3.625%, 2/15/20(2) | 20,000,000 | 19,665,640 | | 6/15/12(2) | 5,000,000 | 5,216,245 |
| TOTAL U.S. TREASURY SECURITIES | | | HSBC USA, Inc., 3.125%, | | |
| (Cost $338,552,295) | | 337,889,803 | | 12/16/11(2) | 5,000,000 | 5,178,650 |
| | | | | John Deere Capital Corp., | | |
| U.S. Government Agency Securities | | 2.875%, 6/19/12(2) | 3,950,000 | 4,089,206 |
| and Equivalents — 21.5% | | | JPMorgan Chase & Co., | | |
| FIXED-RATE U.S. GOVERNMENT | | | 2.20%, 6/15/12(2) | 17,500,000 | 17,853,220 |
| AGENCY SECURITIES — 7.9% | | | JPMorgan Chase & Co., | | |
| FHLMC, 1.125%, | | | | 2.125%, 12/26/12(2) | 5,000,000 | 5,074,500 |
| 12/15/11(2) | 5,000,000 | 5,013,535 | | Morgan Stanley, 2.00%, | | |
| FHLMC, 2.125%, | | | | 9/22/11(2) | 10,000,000 | 10,171,640 |
| 9/21/12(2) | 10,000,000 | 10,163,130 | | State Street Corp., 2.15%, | | |
| FHLMC, 1.625%, | | | | 4/30/12(2) | 7,500,000 | 7,648,065 |
| 4/15/13(2) | 34,000,000 | 33,827,586 | | US Bancorp., 1.80%, | | |
| FHLMC, 2.50%, 4/23/14 | 5,000,000 | 5,045,630 | | 5/15/12 | 10,000,000 | 10,118,780 |
| FHLMC, 3.625%, | | | | Wells Fargo & Co., 3.00%, | | |
| 8/25/14(2) | 10,000,000 | 10,122,420 | | 12/9/11(2) | 4,500,000 | 4,648,369 |
| FNMA, 2.75%, 3/13/14(2) | 10,000,000 | 10,188,510 | | | | 161,118,027 |
| FNMA, 2.75%, 12/29/14(2) | 10,000,000 | 9,982,010 | | TOTAL U.S. GOVERNMENT AGENCY | |
| | | | | SECURITIES AND EQUIVALENTS | |
| FNMA, 5.00%, 2/13/17(2) | 7,250,000 | 7,903,247 | | (Cost $250,388,314) | | 253,364,095 |
| | | 92,246,068 | | Collateralized Mortgage | |
| GOVERNMENT-BACKED CORPORATE BONDS(4) — 13.6% | | | | |
| | | | | Obligations(1) — 7.5% | |
| Bank of America Corp., | | | | | | |
| 2.10%, 4/30/12(2) | 3,500,000 | 3,566,255 | | FHLMC, Series 2560, | | |
| Bank of America Corp., | | | | Class FG SEQ, VRN, | | |
| 3.125%, 6/15/12(2) | 18,800,000 | 19,545,834 | | 0.73%, 4/15/10, resets | | |
| | | | | monthly off the 1-month | | |
| Citigroup Funding, Inc., | | | | LIBOR plus 0.50% with a | | |
| 1.375%, 5/5/11(2) | 5,000,000 | 5,040,725 | | cap of 8.50%(2) | 141,216 | 141,194 |
| Citigroup Funding, Inc., | | | | FHLMC, Series 2625, | | |
| 1.25%, 6/3/11 | 4,000,000 | 4,024,044 | | Class FJ SEQ, VRN, | | |
| Citigroup Funding, Inc., | | | | 0.53%, 4/15/10, resets | | |
| 2.125%, 7/12/12(2) | 4,000,000 | 4,073,980 | | monthly off the 1-month | | |
| Citigroup Funding, Inc., | | | | LIBOR plus 0.30% with a | | |
| 1.875%, 10/22/12 | 2,000,000 | 2,017,206 | | cap of 7.50%(2) | 1,892,803 | 1,885,085 |
32
| | | | | | |
| Government Bond | | | | | |
| |
| | Principal | | | | Principal | |
| | Amount | Value | | | Amount/ | |
| FHLMC, Series 2706, | | | | | Shares | Value |
| Class EB, 5.00%, | | | | FNMA, Series 2003-52, | | |
| 9/15/20(2) | $ 4,037,395 | $ 4,201,072 | | Class KF SEQ, VRN, | | |
| FHLMC, Series 2779, | | | | 0.65%, 4/25/10, resets | | |
| Class FM SEQ, VRN, | | | | monthly off the 1-month | | |
| 0.58%, 4/15/10, resets | | | | LIBOR plus 0.40% with a | | |
| monthly off the 1-month | | | | cap of 7.50%(2) | $ 3,312,178 | $ 3,303,701 |
| LIBOR plus 0.35% with a | | | | FNMA, Series 2004 W5, | | |
| cap of 7.50%(2) | 2,231,125 | 2,222,672 | | Class F1, VRN, 0.70%, | | |
| FHLMC, Series 2780, | | | | 4/25/10, resets monthly | | |
| Class BD SEQ, 4.50%, | | | | off the 1-month LIBOR | | |
| 10/15/17(2) | 562,610 | 563,492 | | plus 0.45% with a cap | | |
| | | | | of 7.50%(2) | 4,513,525 | 4,407,716 |
| FHLMC, Series 2784, | | | | | | |
| Class HJ SEQ, 4.00%, | | | | FNMA, Series 2005-47, | | |
| 4/15/19 | 8,813,000 | 9,053,397 | | Class AN SEQ, 5.00%, | | |
| | | | | 12/25/16(2) | 569,241 | 581,855 |
| FHLMC, Series 2892, | | | | | | |
| Class A SEQ, 5.00%, | | | | FNMA, Series 2005-121, | | |
| 5/15/21(2) | 1,659,068 | 1,692,762 | | Class V SEQ, 4.50%, | | |
| FHLMC, Series 3076, | | | | 6/25/29 | 12,414,442 | 12,692,398 |
| Class BM SEQ, 4.50%, | | | | GNMA, Series 2004-30, | | |
| 11/15/25 | 13,500,000 | 13,698,216 | | Class PD, 5.00%, | | |
| | | | | 2/20/33(2) | 12,000,000 | 12,775,988 |
| FHLMC, Series 3203, | | | | | | |
| Class VN SEQ, 5.00%, | | | | TOTAL COLLATERALIZED | | |
| 6/15/22(2) | 10,000,000 | 10,653,624 | | MORTGAGE OBLIGATIONS | | |
| FNMA, Series 2002-5, | | | | (Cost $84,691,190) | | 88,071,159 |
| Class PJ, 6.00%, | | | | Temporary Cash Investments — 1.5% |
| 10/25/21(2) | 1,946,829 | 2,068,205 | | | | |
| | | | | JPMorgan U.S. Treasury | | |
| FNMA, Series 2002-89, | | | | Plus Money Market Fund | | |
| Class CA SEQ, 5.00%, | | | | Agency Shares(2) | 104,044 | 104,044 |
| 4/25/16(2) | 54,188 | 54,261 | | | | |
| | | | | Repurchase Agreement, Goldman Sachs | |
| FNMA, Series 2003-10, | | | | Group, Inc., (collateralized by various U.S. | |
| Class HW SEQ, 5.00%, | | | | Treasury obligations, 4.50%, 5/15/38, | |
| 11/25/16(2) | 1,498,463 | 1,529,053 | | valued at $18,054,073), in a joint trading | |
| FNMA, Series 2003-14, | | | | account at 0.00%, dated 3/31/10, due | |
| Class LA SEQ, 5.00%, | | | | 4/1/10 (Delivery value $17,688,000) | 17,688,000 |
| 8/25/16(2) | 436,800 | 442,030 | | TOTAL TEMPORARY | | |
| FNMA, Series 2003-42, | | | | CASH INVESTMENTS | | |
| Class FK, VRN, 0.65%, | | | | (Cost $17,792,044) | | 17,792,044 |
| 4/25/10, resets monthly | | | | TOTAL INVESTMENT | | |
| off the 1-month LIBOR | | | | SECURITIES — 102.3% | | |
| plus 0.40% with a cap | | | | (Cost $1,181,201,203) | | 1,207,337,173 |
| of 7.50%(2) | 2,130,479 | 2,121,679 | | | | |
| | | | | OTHER ASSETS AND | | |
| FNMA, Series 2003-43, | | | | LIABILITIES — (2.3)% | | (27,370,775) |
| Class LF, VRN, 0.60%, | | | | | | |
| 4/25/10, resets monthly | | | | TOTAL NET ASSETS — 100.0% | $1,179,966,398 |
| off the 1-month LIBOR | | | | | | |
| plus 0.35% with a cap | | | | | | |
| of 8.00%(2) | 4,003,079 | 3,982,759 | | | | |
33
| | | | |
| Government Bond | | | |
| |
| Futures Contracts | | | |
| | | | Underlying Face | |
| Contracts Purchased | Expiration Date | Amount at Value | Unrealized Gain (Loss) |
| 551 | U.S. Long Bond | June 2010 | $63,984,875 | $(40,953) |
| |
| | | | Underlying Face | |
| Contracts Sold | Expiration Date | Amount at Value | Unrealized Gain (Loss) |
| 1,748 | U.S. Treasury 2-Year Notes | June 2010 | $379,234,063 | $(58,546) |
| |
| Notes to Schedule of Investments |
| Equivalent = Security whose principal payments are backed by the full faith and credit of the United States |
| FHLMC = Federal Home Loan Mortgage Corporation |
| FNMA = Federal National Mortgage Association |
| GMAC = General Motors Acceptance Corporation |
| GNMA = Government National Mortgage Association |
| LIBOR = London Interbank Offered Rate |
| resets = The frequency with which a security’s coupon changes, based on current market conditions or an underlying index. The more frequently a |
| security resets, the less risk the investor is taking that the coupon will vary significantly from current market rates. |
| SEQ = Sequential Payer |
| VRN = Variable Rate Note. Interest reset date is indicated. Rate shown is effective at the period end. |
| (1) | Final maturity indicated, unless otherwise noted. |
| (2) | Security, or a portion thereof, has been segregated for forward commitments and/or futures contracts. At the period end, the aggregate value of |
| | securities pledged was $474,609,000. |
| (3) | Forward commitment. |
| (4) | The debt is guaranteed under the Federal Deposit Insurance Corporation’s (FDIC) Temporary Liquidity Guarantee Program and is backed by |
| | the full faith and credit of the United States. The expiration date of the FDIC’s guarantee is the earlier of the maturity date of the debt or |
| | December 31, 2012. |
See Notes to Financial Statements.
34
| | | | | | |
| Inflation-Adjusted Bond | | | | |
| |
| MARCH 31, 2010 | | | | | | |
| | Principal | | | | Principal | |
| | Amount | Value | | | Amount | Value |
| U.S. Treasury Securities — 89.3% | | | U.S. Treasury Inflation | | |
| | | | | Indexed Notes, 1.875%, | | |
| U.S. Treasury Inflation | | | | 7/15/13(1) | $ 18,316,395 | $ 19,396,769 |
| Indexed Bonds, 1.375%, | | | | U.S. Treasury Inflation | | |
| 1/15/20(1) | $ 33,468,136 | $ 32,856,305 | | | | |
| | | | | Indexed Notes, 2.00%, | | |
| U.S. Treasury Inflation | | | | 1/15/14(1) | 121,574,846 | 129,201,722 |
| Indexed Bonds, 2.375%, | | | | U.S. Treasury Inflation | | |
| 1/15/25(1) | 262,368,694 | 275,118,238 | | | | |
| | | | | Indexed Notes, 1.25%, | | |
| U.S. Treasury Inflation | | | | 4/15/14(1) | 69,623,840 | 72,038,952 |
| Indexed Bonds, 2.00%, | | | | U.S. Treasury Inflation | | |
| 1/15/26(1) | 171,186,400 | 170,705,024 | | | | |
| | | | | Indexed Notes, 2.00%, | | |
| U.S. Treasury Inflation | | | | 7/15/14(1) | 138,980,595 | 147,981,812 |
| Indexed Bonds, 2.375%, | | | | U.S. Treasury Inflation | | |
| 1/15/27(1) | 109,786,016 | 114,614,844 | | | | |
| | | | | Indexed Notes, 1.625%, | | |
| U.S. Treasury Inflation | | | | 1/15/15(1) | 187,879,144 | 196,480,439 |
| Indexed Bonds, 1.75%, | | | | U.S. Treasury Inflation | | |
| 1/15/28(1) | 76,995,815 | 73,049,780 | | | | |
| | | | | Indexed Notes, 1.875%, | | |
| U.S. Treasury Inflation | | | | 7/15/15(1) | 102,963,299 | 109,076,744 |
| Indexed Bonds, 3.625%, | | | | U.S. Treasury Inflation | | |
| 4/15/28(1) | 95,436,294 | 116,544,130 | | | | |
| | | | | Indexed Notes, 2.00%, | | |
| U.S. Treasury Inflation | | | | 1/15/16(1) | 142,582,550 | 151,471,716 |
| Indexed Bonds, 2.50%, | | | | U.S. Treasury Inflation | | |
| 1/15/29(1) | 63,206,926 | 66,964,767 | | | | |
| | | | | Indexed Notes, 2.50%, | | |
| U.S. Treasury Inflation | | | | 7/15/16(1) | 119,125,384 | 130,311,972 |
| Indexed Bonds, 3.875%, | | | | U.S. Treasury Inflation | | |
| 4/15/29(1) | 104,591,235 | 132,928,975 | | | | |
| | | | | Indexed Notes, 2.375%, | | |
| U.S. Treasury Inflation | | | | 1/15/17(1) | 66,607,635 | 72,024,701 |
| Indexed Bonds, 3.375%, | | | | U.S. Treasury Inflation | | |
| 4/15/32(1) | 40,691,926 | 49,485,208 | | | | |
| | | | | Indexed Notes, 2.625%, | | |
| U.S. Treasury Inflation | | | | 7/15/17(1) | 58,652,550 | 64,540,738 |
| Indexed Bonds, 2.125%, | | | | U.S. Treasury Inflation | | |
| 2/15/40(1) | 48,181,592 | 47,895,489 | | | | |
| | | | | Indexed Notes, 1.625%, | | |
| U.S. Treasury Inflation | | | | 1/15/18(1) | 68,032,398 | 69,690,688 |
| Indexed Notes, 3.50%, | | | | U.S. Treasury Inflation | | |
| 1/15/11(1) | 111,489,750 | 115,496,469 | | | | |
| | | | | Indexed Notes, 1.375%, | | |
| U.S. Treasury Inflation | | | | 7/15/18(1) | 48,184,042 | 48,293,227 |
| Indexed Notes, 2.375%, | | | | U.S. Treasury Inflation | | |
| 4/15/11(1) | 126,691,785 | 130,868,686 | | | | |
| | | | | Indexed Notes, 2.125%, | | |
| U.S. Treasury Inflation | | | | 1/15/19(1) | 87,603,768 | 92,415,142 |
| Indexed Notes, 3.375%, | | | | U.S. Treasury Inflation | | |
| 1/15/12(1) | 53,969,094 | 57,797,554 | | | | |
| | | | | Indexed Notes, 1.875%, | | |
| U.S. Treasury Inflation | | | | 7/15/19(1) | 36,026,820 | 37,172,365 |
| Indexed Notes, 2.00%, | | | | TOTAL U.S. TREASURY SECURITIES | |
| 4/15/12(1) | 111,802,848 | 117,174,639 | | | | |
| | | | | (Cost $2,922,458,406) | | 3,021,383,111 |
| U.S. Treasury Inflation | | | | | | |
| Indexed Notes, 3.00%, | | | | Corporate Bonds — 5.8% | |
| 7/15/12(1) | 120,594,335 | 130,015,768 | | AEROSPACE & DEFENSE — 0.1% | |
| U.S. Treasury Inflation | | | | L-3 Communications Corp., | | |
| Indexed Notes, 0.625%, | | | | 5.20%, 10/15/19(1)(2) | 900,000 | 906,169 |
| 4/15/13(1) | 48,798,092 | 49,770,248 | | | | |
| | | | | United Technologies Corp., | | |
| | | | | 5.70%, 4/15/40(1) | 3,290,000 | 3,339,304 |
| | | | | | | 4,245,473 |
35
| | | | | | | | |
| Inflation-Adjusted Bond | | | | | |
| |
| | | Principal | | | | Principal | | |
| | | Amount | Value | | | Amount | | Value |
| BEVERAGES — 0.4% | | | | | General Electric Capital | | | |
| Anheuser-Busch InBev | | | | | Corp., 5.625%, 9/15/17(1) | $ 200,000 | $ 210,837 |
| Worldwide, Inc., 6.875%, | | | | | General Electric Capital | | | |
| 11/15/19(2) | $ 3,120,000 | $ 3,588,814 | | Corp., 5.50%, 1/8/20 | 2,400,000 | | 2,453,237 |
| Coca-Cola Co. (The), | | | | | John Deere Capital Corp., | | | |
| 3.625%, 3/15/14(1) | | 2,440,000 | 2,540,604 | | 4.90%, 9/9/13(1) | 1,500,000 | | 1,622,257 |
| Coca-Cola Enterprises, | | | | | | | | 8,991,973 |
| Inc., 4.25%, 3/1/15(1) | | 2,490,000 | 2,638,449 | | DIVERSIFIED FINANCIAL SERVICES — 0.4% | |
| PepsiCo, Inc., 3.10%, | | | | | Bank of America Corp., | | | |
| 1/15/15(1) | | 3,250,000 | 3,288,119 | | 6.50%, 8/1/16(1) | 4,570,000 | | 4,944,004 |
| | | | 12,055,986 | | BP Capital Markets plc, | | | |
| BIOTECHNOLOGY — 0.2% | | | | 3.125%, 3/10/12(1) | 1,700,000 | | 1,761,872 |
| Amgen, Inc., 5.85%, | | | | | Citigroup, Inc., 6.01%, | | | |
| 6/1/17(1) | | 2,590,000 | 2,875,115 | | 1/15/15(1) | 3,900,000 | | 4,101,119 |
| Amgen, Inc., 5.75%, | | | | | CME Group Index Services | | | |
| 3/15/40(1) | | 2,150,000 | 2,136,206 | | LLC, 4.40%, 3/15/18(1)(2) | 2,160,000 | | 2,120,714 |
| | | | 5,011,321 | | | | | 12,927,709 |
| CAPITAL MARKETS — 0.6% | | | | DIVERSIFIED TELECOMMUNICATION | | |
| Credit Suisse (New York), | | | | SERVICES — 0.4% | | | |
| 5.50%, 5/1/14(1) | | 3,710,000 | 4,041,782 | | AT&T, Inc., 6.70%, | | | |
| Credit Suisse (New York), | | | | 11/15/13(1) | 1,820,000 | | 2,078,265 |
| 5.30%, 8/13/19(1) | | 3,240,000 | 3,328,549 | | AT&T, Inc., 6.55%, | | | |
| Credit Suisse AG, 5.40%, | | | | | 2/15/39(1) | 3,250,000 | | 3,427,892 |
| 1/14/20(1) | | 980,000 | 989,523 | | Cellco Partnership/Verizon | | | |
| Goldman Sachs Group, | | | | | Wireless Capital LLC, | | | |
| Inc. (The), 7.50%, | | | | | 5.55%, 2/1/14(1) | 2,320,000 | | 2,537,412 |
| 2/15/19(1) | | 3,980,000 | 4,555,870 | | Cellco Partnership/Verizon | | | |
| Goldman Sachs Group, | | | | | Wireless Capital LLC, | | | |
| Inc. (The), 5.375%, | | | | | 8.50%, 11/15/18(1) | 1,560,000 | | 1,949,462 |
| 3/15/20(1) | | 2,000,000 | 1,985,276 | | Deutsche Telekom | | | |
| Morgan Stanley, 4.20%, | | | | | International Finance BV, | | | |
| 11/20/14(1) | | 3,230,000 | 3,240,497 | | 6.75%, 8/20/18(1) | 3,900,000 | | 4,376,685 |
| Morgan Stanley, 7.30%, | | | | | | | | 14,369,716 |
| 5/13/19(1) | | 3,190,000 | 3,530,287 | | ELECTRIC UTILITIES — 0.2% | | |
| | | | 21,671,784 | | Duke Energy Ohio, Inc., | | | |
| CHEMICALS — 0.1% | | | | | 2.10%, 6/15/13(1) | 1,950,000 | | 1,953,754 |
| Dow Chemical Co. (The), | | | | | EDF SA, 4.60%, 1/27/20(1)(2) | 3,270,000 | | 3,229,671 |
| 8.55%, 5/15/19(1) | | 1,560,000 | 1,890,308 | | FirstEnergy Solutions | | | |
| COMMERCIAL BANKS — 0.1% | | | Corp., 6.05%, 8/15/21(1) | 2,600,000 | | 2,608,660 |
| PNC Funding Corp., | | | | | | | | 7,792,085 |
| 3.625%, 2/8/15(1) | | 980,000 | 986,958 | | FOOD & STAPLES RETAILING — 0.1% | | |
| Westpac Banking Corp., | | | | | Wal-Mart Stores, Inc., | | | |
| 4.875%, 11/19/19(1) | | 1,610,000 | 1,602,221 | | 2.875%, 4/1/15(3) | 2,040,000 | | 2,040,800 |
| | | | 2,589,179 | | FOOD PRODUCTS — 0.2% | | | |
| COMMUNICATIONS EQUIPMENT — 0.1% | | | Kraft Foods, Inc., 6.50%, | | | |
| Cisco Systems, Inc., | | | | | 2/9/40(1) | 4,900,000 | | 5,094,800 |
| 5.90%, 2/15/39(1) | | 4,400,000 | 4,482,676 | | Mead Johnson Nutrition | | | |
| CONSUMER FINANCE — 0.3% | | | Co., 5.90%, 11/1/39(1)(2) | 1,300,000 | | 1,270,612 |
| General Electric Capital | | | | | | | | 6,365,412 |
| Corp., 3.75%, 11/14/14(1) | | 4,640,000 | 4,705,642 | | | | | |
36
| | | | | | | |
| Inflation-Adjusted Bond | | | | |
| |
| | | Principal | | | | Principal | |
| | | Amount | Value | | | Amount | Value |
| HEALTH CARE EQUIPMENT & SUPPLIES — 0.2% | | ConocoPhillips, 4.75%, | | |
| Medtronic, Inc., 3.00%, | | | | | 2/1/14(1) | $ 5,990,000 | $ 6,446,845 |
| 3/15/15(1) | $ 5,770,000 | $ 5,747,618 | | Shell International Finance | | |
| Stryker Corp., 3.00%, | | | | | BV, 4.30%, 9/22/19(1) | 3,240,000 | 3,200,780 |
| 1/15/15(1) | | 1,450,000 | 1,450,921 | | Shell International Finance | | |
| | | | 7,198,539 | | BV, 5.50%, 3/25/40(1) | 1,880,000 | 1,849,584 |
| INDUSTRIAL CONGLOMERATES — 0.1% | | | Talisman Energy, Inc., | | |
| | | | | | 7.75%, 6/1/19(1) | 1,700,000 | 2,029,072 |
| General Electric Co., | | | | | | | |
| 5.25%, 12/6/17(1) | | 2,970,000 | 3,119,376 | | Williams Partners LP, | | |
| | | | | | 5.25%, 3/15/20(1)(2) | 1,330,000 | 1,335,271 |
| INSURANCE(4) | | | | | | | |
| | | | | | XTO Energy, Inc., 6.50%, | | |
| Prudential Financial, Inc., | | | | | 12/15/18(1) | 1,870,000 | 2,161,918 |
| 2.75%, 1/14/13(1) | | 1,300,000 | 1,302,445 | | | | |
| | | | | | | | 21,548,433 |
| MACHINERY — 0.1% | | | | | | | |
| | | | | | PAPER & FOREST PRODUCTS — 0.1% | |
| Deere & Co., 5.375%, | | | | | | | |
| 10/16/29(1) | | 1,950,000 | 1,949,963 | | International Paper Co., | | |
| | | | | | 9.375%, 5/15/19(1) | 2,000,000 | 2,504,234 |
| MEDIA — 0.4% | | | | | | | |
| | | | | | International Paper Co., | | |
| Comcast Corp., 5.90%, | | | | | 7.30%, 11/15/39(1) | 1,920,000 | 2,058,275 |
| 3/15/16(1) | | 1,880,000 | 2,056,069 | | | | |
| | | | | | | | 4,562,509 |
| DirecTV Holdings LLC, | | | | | | | |
| 3.55%, 3/15/15(1)(2) | | 3,300,000 | 3,250,378 | | PHARMACEUTICALS — 0.2% | |
| News America, Inc., | | | | | Pfizer, Inc., 6.20%, | | |
| 6.90%, 8/15/39(1) | | 3,630,000 | 3,975,783 | | 3/15/19(1) | 3,250,000 | 3,677,222 |
| Time Warner Cable, Inc., | | | | | Roche Holdings, Inc., | | |
| 8.25%, 2/14/14(1) | | 1,210,000 | 1,420,927 | | 6.00%, 3/1/19(1)(2) | 2,130,000 | 2,358,025 |
| Time Warner, Inc., | | | | | | | 6,035,247 |
| 4.875%, 3/15/20(1) | | 3,270,000 | 3,201,108 | | REAL ESTATE INVESTMENT TRUSTS (REITs)(4) |
| | | | 13,904,265 | | ProLogis, 7.375%, | | |
| METALS & MINING — 0.2% | | | | 10/30/19(1) | 1,300,000 | 1,336,759 |
| Newmont Mining Corp., | | | | | SOFTWARE — 0.3% | | |
| 6.25%, 10/1/39(1) | | 3,700,000 | 3,712,314 | | Adobe Systems, Inc., | | |
| Rio Tinto Finance USA | | | | | 3.25%, 2/1/15(1) | 4,800,000 | 4,824,374 |
| Ltd., 5.875%, 7/15/13(1) | | 2,000,000 | 2,199,840 | | Oracle Corp., 5.75%, | | |
| | | | 5,912,154 | | 4/15/18(1) | 5,000,000 | 5,492,935 |
| MULTI-UTILITIES — 0.4% | | | | | | 10,317,309 |
| Dominion Resources, Inc., | | | | WIRELESS TELECOMMUNICATION SERVICES(4) |
| 6.40%, 6/15/18(1) | | 3,250,000 | 3,626,938 | | America Movil SAB de CV, | | |
| Pacific Gas & Electric Co., | | | | 5.00%, 3/30/20(1)(2) | 1,350,000 | 1,337,669 |
| 6.25%, 12/1/13(1) | | 1,820,000 | 2,056,296 | | TOTAL CORPORATE BONDS | | |
| Pacific Gas & Electric Co., | | | | (Cost $189,551,807) | | 195,656,448 |
| 5.80%, 3/1/37 | | 2,050,000 | 2,041,015 | | Commercial Mortgage-Backed | |
| PG&E Corp., 5.75%, | | | | | | | |
| 4/1/14(1) | | 3,270,000 | 3,574,980 | | Securities(5) — 1.5% | | |
| Sempra Energy, 6.50%, | | | | | Credit Suisse Mortgage | | |
| 6/1/16(1) | | 1,250,000 | 1,398,129 | | Capital Certificates, Series | | |
| | | | | | 2007 TF2A, Class A1, VRN, | | |
| | | | 12,697,358 | | 0.41%, 4/15/10, resets | | |
| OIL, GAS & CONSUMABLE FUELS — 0.6% | | | monthly off the 1-month | | |
| Anadarko Petroleum Corp., | | | | LIBOR plus 0.18% with | | |
| 6.20%, 3/15/40(1) | | 2,000,000 | 1,974,446 | | no caps(1)(2) | 11,245,944 | 9,640,403 |
| Chevron Corp., 3.95%, | | | | | | | |
| 3/3/14 | | 2,440,000 | 2,550,517 | | | | |
37
| | | | | | |
| Inflation-Adjusted Bond | | | | |
| |
| | Principal | | | | Principal | |
| | Amount | Value | | | Amount/ | |
| GS Mortgage Securities | | | | | Shares | Value |
| Corp. II, Series 2004 GG2, | | | | U.S. Government Agency | |
| Class A4 SEQ, 4.96%, | | | | | | |
| 8/10/38(1) | $ 10,659,000 | $ 10,966,793 | | Securities — 0.5% | | |
| GS Mortgage Securities | | | | FNMA, 5.625%, 7/15/37(1) | | |
| Corp. II, Series 2005 GG4, | | | | (Cost $16,284,235) | $ 15,500,000 | $ 16,271,947 |
| Class A4A SEQ, 4.75%, | | | | | | |
| 7/10/39(1) | 7,000,000 | 7,072,896 | | Municipal Securities — 0.1% | |
| Lehman Brothers Floating | | | | California GO, (Building | | |
| Rate Commercial | | | | Bonds), 7.55%, 4/1/39(1) | 1,710,000 | 1,784,573 |
| Mortgage Trust, Series | | | | New York State Dormitory | | |
| 2007 LLFA, Class A1, VRN, | | | | Auth. Rev., (Building | | |
| 0.53%, 4/15/10, resets | | | | Bonds), 5.63%, 3/15/39(1) | 1,750,000 | 1,726,323 |
| monthly off the 1-month | | | | Texas GO, (Building | | |
| LIBOR plus 0.30% with | | | | Bonds), 5.52%, 4/1/39(1) | 1,750,000 | 1,746,727 |
| no caps(1)(2) | 8,927,324 | 8,260,909 | | | | |
| | | | | TOTAL MUNICIPAL SECURITIES | |
| Wachovia Bank | | | | (Cost $5,065,625) | | 5,257,623 |
| Commercial Mortgage | | | | | | |
| Trust, Series 2006 C23, | | | | Temporary Cash Investments — 2.1% |
| Class A4, VRN, 5.42%, | | | | FHLB Discount Notes, | | |
| 4/1/10(1) | 15,100,000 | 15,324,348 | | | | |
| | | | | 0.001%, 4/1/10(6) | 49,568,000 | 49,568,000 |
| TOTAL COMMERCIAL | | | | JPMorgan U.S. Treasury | | |
| MORTGAGE-BACKED SECURITIES | | | Plus Money Market Fund | | |
| (Cost $52,893,036) | | 51,265,349 | | Agency Shares(1) | 183,045 | 183,045 |
| Asset-Backed Securities(5) — 0.5% | | Repurchase Agreement, Goldman Sachs | |
| CenterPoint Energy | | | | Group, Inc., (collateralized by various U.S. | |
| Transition Bond Co. LLC, | | | | Treasury obligations, 4.50%, 5/15/38, | |
| Series 2009-1, Class A1 | | | | valued at $20,365,950), in a joint trading | |
| SEQ, 1.83%, 2/15/16 | 11,800,000 | 11,833,583 | | account at 0.00%, dated 3/31/10, due | |
| | | | | 4/1/10 (Delivery value $19,953,000) | 19,953,000 |
| Entergy Texas Restoration | | | | | | |
| Funding LLC, Series | | | | TOTAL TEMPORARY | | |
| 2009 A, Class A1 SEQ, | | | | CASH INVESTMENTS | | |
| 2.12%, 2/1/16(1) | 6,500,000 | 6,570,032 | | (Cost $69,704,045) | | 69,704,045 |
| TOTAL ASSET-BACKED SECURITIES | | | TOTAL INVESTMENT | | |
| (Cost $18,299,288) | | 18,403,615 | | SECURITIES — 99.8% | | |
| | | | | (Cost $3,274,256,442) | | 3,377,942,138 |
| | | | | OTHER ASSETS AND | | |
| | | | | LIABILITIES — 0.2% | | 6,612,485 |
| | | | | TOTAL NET ASSETS — 100.0% | $3,384,554,623 |
| | | | |
| Futures Contracts | | | |
| | | | Underlying Face | |
| Contracts Purchased | Expiration Date | Amount at Value | Unrealized Gain (Loss) |
| 667 | U.S. Long Bond | June 2010 | $77,455,375 | $(97,214) |
| |
| | | | Underlying Face | |
| | Contracts Sold | Expiration Date | Amount at Value | Unrealized Gain (Loss) |
| 2,117 | U.S. Treasury 2-Year Notes | June 2010 | $459,289,766 | $8,540 |
38
| | | | |
| Inflation-Adjusted Bond | | |
| |
| Swap Agreements | | |
| Notional Amount | | Description of Agreement | Premiums Paid (Received) | Value |
| TOTAL RETURN | | | | |
| $44,200,000 | | Pay a fixed rate equal to 1.13 multiplied by the notional | — | $(1,060,134) |
| | | amount and receive the return of the U.S. CPI Urban | | |
| | | Consumers NSA Index upon the termination date with | | |
| | | Barclays Bank plc. Expires January 2012. | | |
| 8,000,000 | | Pay a fixed rate equal to 0.08 multiplied by the notional | — | (135,375) |
| | | amount and receive the return of the U.S. CPI Urban | | |
| | | Consumers NSA Index upon the termination date with | | |
| | | UBS AG. Expires November 2013. | | |
| 32,000,000 | | Pay a fixed rate equal to 0.12 multiplied by the notional | — | (468,002) |
| | | amount and receive the return of the U.S. CPI Urban | | |
| | | Consumers NSA Index upon the termination date with | | |
| | | Bank of America N.A. Expires January 2015. | | |
| 24,000,000 | | Pay a fixed rate equal to 1.31 multiplied by the notional | — | (1,049,314) |
| | | amount and receive the return of the U.S. CPI Urban | | |
| | | Consumers NSA Index upon the termination date with | | |
| | | Barclays Bank plc. Expires April 2017. | | |
| 4,000,000 | | Pay a fixed rate equal to 0.21 multiplied by the notional | — | (1,419) |
| | | amount and receive the return of the U.S. CPI Urban | | |
| | | Consumers NSA Index upon the termination date with | | |
| | | Bank of America N.A. Expires April 2018. | | |
| 8,700,000 | | Pay a fixed rate equal to 0.25 multiplied by the notional | — | (17,338) |
| | | amount and receive the return of the U.S. CPI Urban | | |
| | | Consumers NSA Index upon the termination date with | | |
| | | Bank of America N.A. Expires March 2019. | | |
| 32,000,000 | | Pay a fixed rate equal to 0.30 multiplied by the notional | — | (382,202) |
| | | amount and receive the return of the U.S. CPI Urban | | |
| | | Consumers NSA Index upon the termination date with | | |
| | | Bank of America N.A. Expires December 2019. | | |
| 50,000,000 | | Pay a fixed rate equal to 0.30 multiplied by the notional | — | (316,484) |
| | | amount and receive the return of the U.S. CPI Urban | | |
| | | Consumers NSA Index upon the termination date with | | |
| | | Bank of America N.A. Expires March 2020. | | |
| 24,000,000 | | Pay a fixed rate equal to 0.30 multiplied by the notional | — | (182,529) |
| | | amount and receive the return of the U.S. CPI Urban | | |
| | | Consumers NSA Index upon the termination date with | | |
| | | Bank of America N.A. Expires March 2020. | | |
| 4,500,000 | | Pay a fixed rate equal to 0.37 multiplied by the notional | — | (13,555) |
| | | amount and receive the return of the U.S. CPI Urban | | |
| | | Consumers NSA Index upon the termination date with | | |
| | | Bank of America N.A. Expires April 2022. | | |
| 58,300,000 | | Pay a fixed rate equal to 1.77 multiplied by the notional | — | (1,683,530) |
| | | amount and receive the return of the U.S. CPI Urban | | |
| | | Consumers NSA Index upon the termination date with | | |
| | | Barclays Bank plc. Expires December 2027. | | |
| 7,600,000 | | Pay a fixed rate equal to 0.81 multiplied by the notional | — | (169,681) |
| | | amount and receive the return of the U.S. CPI Urban | | |
| | | Consumers NSA Index upon the termination date with | | |
| | | Bank of America N.A. Expires February 2030. | | |
| | | | | $(5,479,563) |
39
| |
| Inflation-Adjusted Bond |
| |
| Notes to Schedule of Investments |
| CPI = Consumer Price Index |
| FHLB = Federal Home Loan Bank |
| FNMA = Federal National Mortgage Association |
| GO = General Obligation |
| LIBOR = London Interbank Offered Rate |
| NSA = Not Seasonally Adjusted |
| resets = The frequency with which a security’s coupon changes, based on current market conditions or an underlying index. The more frequently a |
| security resets, the less risk the investor is taking that the coupon will vary significantly from current market rates. |
| SEQ = Sequential Payer |
| VRN = Variable Rate Note. Interest reset date is indicated. Rate shown is effective at the period end. |
| (1) | Security, or a portion thereof, has been segregated for when-issued securities, futures contracts and/or swap agreements. At the period end, the |
| | aggregate value of securities pledged was $544,266,000. |
| (2) | Security was purchased under Rule 144A of the Securities Act of 1933 or is a private placement and, unless registered under the Act or |
| | exempted from registration, may only be sold to qualified institutional investors. The aggregate value of these securities at the period end was |
| | $37,298,635, which represented 1.1% of total net assets. |
| (3) | When-issued security. |
| (4) | Industry is less than 0.05% of total net assets. |
| (5) | Final maturity indicated, unless otherwise noted. |
| (6) | The rate indicated is the yield to maturity at purchase. |
| |
| Industry classifications are unaudited. |
See Notes to Financial Statements.
40
| | | | | | |
| Short-Term Government | | | | |
| |
| MARCH 31, 2010 | | | | | | |
| | Principal | | | | Principal | |
| | Amount | Value | | | Amount | Value |
| U.S. Treasury Securities — 55.1% | | | GOVERNMENT-BACKED CORPORATE BONDS(2) — 17.5% |
| U.S. Treasury Inflation | | | | American Express Bank | | |
| | | | | FSB, 3.15%, 12/9/11(1) | $ 10,000,000 | $ 10,369,840 |
| Indexed Notes, 1.625%, | | | | | | |
| 1/15/15(1) | $ 21,561,390 | $ 22,548,492 | | Bank of America Corp., | | |
| | | | | 2.10%, 4/30/12(1) | 5,000,000 | 5,094,650 |
| U.S. Treasury Notes, | | | | | | |
| 1.125%, 6/30/11(1) | 50,000,000 | 50,378,950 | | Bank of America Corp., | | |
| | | | | 3.125%, 6/15/12(1) | 17,000,000 | 17,674,424 |
| U.S. Treasury Notes, | | | | | | |
| 1.00%, 10/31/11(1) | 109,000,000 | 109,413,110 | | Citigroup Funding, Inc., | | |
| | | | | 1.375%, 5/5/11(1) | 14,500,000 | 14,618,103 |
| U.S. Treasury Notes, | | | | | | |
| 1.75%, 11/15/11(1) | 22,500,000 | 22,847,175 | | Citigroup Funding, Inc., | | |
| U.S. Treasury Notes, | | | | 1.875%, 10/22/12 | 5,000,000 | 5,043,015 |
| 0.75%, 11/30/11(1) | 36,000,000 | 35,962,056 | | FDIC Structured Sale | | |
| U.S. Treasury Notes, | | | | Guaranteed Notes, Series | | |
| | | | | A-1, 1.05%, 10/25/11(3)(4) | 3,000,000 | 2,949,870 |
| 1.125%, 1/15/12(1) | 50,000,000 | 50,199,250 | | | | |
| U.S. Treasury Notes, | | | | General Electric Capital | | |
| | | | | Corp., 2.25%, 3/12/12(1) | 15,000,000 | 15,326,265 |
| 0.875%, 2/29/12(1) | 15,000,000 | 14,973,645 | | | | |
| U.S. Treasury Notes, | | | | GMAC, Inc., 1.75%, | | |
| | | | | 10/30/12(1) | 13,000,000 | 13,083,395 |
| 1.875%, 6/15/12(1) | 90,000,000 | 91,490,670 | | | | |
| U.S. Treasury Notes, | | | | GMAC, Inc., 2.20%, | | |
| | | | | 12/19/12(1) | 9,500,000 | 9,646,756 |
| 1.375%, 9/15/12(1) | 30,000,000 | 30,075,030 | | | | |
| U.S. Treasury Notes, | | | | Goldman Sachs Group, | | |
| 1.375%, 10/15/12(1) | 34,500,000 | 34,553,923 | | Inc. (The), 1.625%, | | |
| | | | | 7/15/11(1) | 6,000,000 | 6,069,522 |
| U.S. Treasury Notes, | | | | | | |
| 1.375%, 11/15/12(1) | 25,000,000 | 25,000,025 | | Goldman Sachs Group, | | |
| | | | | Inc. (The), 2.15%, | | |
| U.S. Treasury Notes, | | | | 3/15/12(1) | 10,000,000 | 10,192,350 |
| 1.375%, 1/15/13(1) | 25,000,000 | 24,923,850 | | | | |
| | | | | Goldman Sachs Group, | | |
| U.S. Treasury Notes, | | | | Inc. (The), 3.25%, | | |
| 1.375%, 3/15/13(1) | 75,000,000 | 74,577,975 | | 6/15/12(1) | 6,500,000 | 6,781,118 |
| TOTAL U.S. TREASURY SECURITIES | | | HSBC USA, Inc., 3.125%, | | |
| (Cost $584,956,847) | | 586,944,151 | | 12/16/11(1) | 7,000,000 | 7,250,110 |
| U.S. Government Agency Securities | | John Deere Capital Corp., | | |
| | | | | 2.875%, 6/19/12(1) | 5,000,000 | 5,176,210 |
| and Equivalents — 31.6% | | | | | |
| | | | | JPMorgan Chase & Co., | | |
| FIXED-RATE U.S. GOVERNMENT AGENCY | | | 2.125%, 12/26/12(1) | 16,000,000 | 16,238,400 |
| SECURITIES — 14.1% | | | | | | |
| | | | | Morgan Stanley, 2.00%, | | |
| FHLMC, 1.125%, | | | | 9/22/11(1) | 10,000,000 | 10,171,640 |
| 12/15/11(1) | 5,000,000 | 5,013,535 | | | | |
| | | | | Morgan Stanley, 3.25%, | | |
| FHLMC, 2.125%, | | | | 12/1/11(1) | 10,000,000 | 10,372,170 |
| 3/23/12(1) | 34,750,000 | 35,395,342 | | | | |
| | | | | State Street Corp., 2.15%, | | |
| FHLMC, 1.75%, 6/15/12 | 15,000,000 | 15,153,045 | | 4/30/12(1) | 5,000,000 | 5,098,710 |
| FHLMC, 2.125%, | | | | US Bancorp., 1.80%, | | |
| 9/21/12(1) | 40,000,000 | 40,652,520 | | 5/15/12 | 15,000,000 | 15,178,170 |
| FHLMC, 1.625%, | | | | | | 186,334,718 |
| 4/15/13(1) | 20,000,000 | 19,898,580 | | | | |
| | | | | TOTAL U.S. GOVERNMENT AGENCY | |
| FNMA, 1.00%, 4/4/12(1) | 25,000,000 | 24,909,900 | | SECURITIES AND EQUIVALENTS | |
| FNMA, 1.75%, 12/28/12(1) | 10,000,000 | 9,991,780 | | (Cost $334,270,222) | | 337,349,420 |
| | | 151,014,702 | | | | |
41
| | | | | | |
| Short-Term Government | | | | |
| |
| | Principal | | | | Principal | |
| | Amount | Value | | | Amount | Value |
| Collateralized Mortgage | | | FHLMC, Series 2827, | | |
| | | | | Class F, VRN, 0.58%, | | |
| Obligations(5) — 8.5% | �� | | 4/15/10, resets monthly | | |
| FHLMC, Series 2430, | | | | off the 1-month LIBOR | | |
| Class QC, 5.50%, | | | | plus 0.35% with a cap | | |
| 2/15/17(1) | $ 10,708,090 | $ 11,382,548 | | of 7.50%(1) | $ 3,879,454 | $ 3,881,301 |
| FHLMC, Series 2522, | | | | FHLMC, Series 2890, | | |
| Class XA SEQ, 5.00%, | | | | Class AB SEQ, 3.75%, | | |
| 8/15/16(1) | 259,568 | 261,068 | | 12/15/11(1) | 238,292 | 239,555 |
| FHLMC, Series 2552, | | | | FHLMC, Series 2941, | | |
| Class HA SEQ, 5.00%, | | | | Class XA, 5.00%, | | |
| 9/15/16(1) | 16,284 | 16,282 | | 2/15/25(1) | 1,035,086 | 1,039,629 |
| FHLMC, Series 2624, | | | | FHLMC, Series 2984, | | |
| Class FE SEQ, VRN, | | | | Class NA, 5.50%, | | |
| 0.53%, 4/15/10, resets | | | | 4/15/26(1) | 1,696,612 | 1,722,854 |
| monthly off the 1-month | | | FNMA, Series 2002-5, | | |
| LIBOR plus 0.30% with a | | | Class PJ, 6.00%, | | |
| cap of 8.00%(1) | 4,474,447 | 4,444,961 | | 10/25/21(1) | 1,946,829 | 2,068,205 |
| FHLMC, Series 2625, | | | | FNMA, Series 2002-83, | | |
| Class FJ SEQ, VRN, | | | | Class GM SEQ, 5.00%, | | |
| 0.53%, 4/15/10, resets | | | | 5/25/16(1) | 870,987 | 875,482 |
| monthly off the 1-month | | | FNMA, Series 2002-86, | | |
| LIBOR plus 0.30% with a | | | Class KB SEQ, 5.00%, | | |
| cap of 7.50%(1) | 3,217,766 | 3,204,644 | | 5/25/16(1) | 338,670 | 340,033 |
| FHLMC, Series 2631, | | | | FNMA, Series 2003-3, | | |
| Class PC, 4.50%, | | | | Class HA SEQ, 5.00%, | | |
| 3/15/16(1) | 7,198,411 | 7,357,540 | | 9/25/16(1) | 456,873 | 464,592 |
| FHLMC, Series 2672, | | | | FNMA, Series 2003-17, | | |
| Class QR, 4.00%, | | | | Class FN, VRN, 0.55%, | | |
| 9/15/10(1) | 1,153,654 | 1,169,380 | | 4/25/10, resets monthly | | |
| FHLMC, Series 2688, | | | | off the 1-month LIBOR | | |
| Class DE SEQ, 4.50%, | | | | plus 0.30% with a cap | | |
| 2/15/20(1) | 2,694,452 | 2,759,834 | | of 8.50%(1) | 7,699,790 | 7,632,314 |
| FHLMC, Series 2699, | | | | FNMA, Series 2003-24, | | |
| Class TG SEQ, 4.00%, | | | | Class BF SEQ, VRN, | | |
| 5/15/17(1) | 1,473,604 | 1,529,405 | | 0.60%, 4/25/10, resets | | |
| FHLMC, Series 2709, | | | | monthly off the 1-month | | |
| Class PC, 5.00%, | | | | LIBOR plus 0.35% with a | | |
| 9/15/18(1) | 3,656,454 | 3,690,574 | | cap of 8.00%(1) | 2,484,638 | 2,478,085 |
| FHLMC, Series 2718, | | | | FNMA, Series 2003-29, | | |
| Class FW, VRN, 0.58%, | | | | Class L SEQ, 5.00%, | | |
| 4/15/10, resets monthly | | | | 9/25/30(1) | 1,685,161 | 1,755,741 |
| off the 1-month LIBOR | | | | FNMA, Series 2003-35, | | |
| plus 0.35% with a cap | | | | Class KC SEQ, 4.50%, | | |
| of 8.00%(1) | 6,212,030 | 6,213,165 | | 4/25/17(1) | 1,319,731 | 1,360,974 |
| FHLMC, Series 2779, | | | | FNMA, Series 2003-42, | | |
| Class FM SEQ, VRN, | | | | Class FK, VRN, 0.65%, | | |
| 0.58%, 4/15/10, resets | | | | 4/25/10, resets monthly | | |
| monthly off the 1-month | | | off the 1-month LIBOR | | |
| LIBOR plus 0.35% with a | | | plus 0.40% with a cap | | |
| cap of 7.50%(1) | 2,231,125 | 2,222,672 | | of 7.50%(1) | 3,195,718 | 3,182,519 |
| FHLMC, Series 2780, | | | | | | |
| Class BD SEQ, 4.50%, | | | | | | |
| 10/15/17(1) | 937,684 | 939,153 | | | | |
42
| | | | | | |
| Short-Term Government | | | | |
| |
| | Principal | | | | Principal | |
| | Amount | Value | | | Amount | Value |
| FNMA, Series 2003-43, | | | | FNMA, VRN, 2.73%, | | |
| Class LF, VRN, 0.60%, | | | | 4/1/10(1) | $ 205,324 | $ 212,381 |
| 4/25/10, resets monthly | | | | FNMA, VRN, 2.875%, | | |
| off the 1-month LIBOR | | | | 4/1/10(1) | 36,592 | 37,873 |
| plus 0.35% with a cap | | | | | | |
| of 8.00%(1) | $ 4,003,079 | $ 3,982,759 | | FNMA, VRN, 2.95%, | | |
| | | | | 4/1/10(1) | 49,634 | 51,447 |
| FNMA, Series 2004 W5, | | | | | | |
| Class F1, VRN, 0.70%, | | | | FNMA, VRN, 3.00%, | | |
| | | | | 4/1/10(1) | 85,180 | 87,796 |
| 4/25/10, resets monthly | | | | | | |
| off the 1-month LIBOR | | | | FNMA, VRN, 3.20%, | | |
| plus 0.45% with a cap | | | | 4/1/10(1) | 59,379 | 60,637 |
| of 7.50%(1) | 4,513,525 | 4,407,716 | | FNMA, VRN, 3.38%, | | |
| FNMA, Series 2005-53, | | | | 4/1/10(1) | 38,446 | 39,763 |
| Class WC SEQ, 5.00%, | | | | FNMA, VRN, 3.77%, | | |
| 8/25/18(1) | 2,161,241 | 2,246,776 | | 4/1/10(1) | 13,959 | 14,135 |
| FNMA, Series 2006-4, | | | | FNMA, VRN, 4.74%, | | |
| Class A SEQ, 6.00%, | | | | 4/1/10(1) | 80,843 | 84,606 |
| 11/25/22(1) | 1,688,994 | 1,735,793 | | FNMA, VRN, 7.49%, | | |
| FNMA, Series 2006-77, | | | | 4/1/10(1) | 10,882 | 11,327 |
| Class PD, 6.50%, | | | | FNMA, VRN, 2.83%, | | |
| 10/25/30(1) | 1,537,042 | 1,593,045 | | 5/1/10(1) | 56,342 | 58,048 |
| GNMA, Series 2003-46, | | | | FNMA, VRN, 4.59%, | | |
| Class PA, 5.00%, | | | | 5/1/10(1) | 761,449 | 788,478 |
| 5/20/29(1) | 1,887,154 | 1,898,322 | | | | |
| | | | | FNMA, VRN, 4.81%, | | |
| GNMA, Series 2003-55, | | | | 5/1/10(1) | 16,055 | 16,481 |
| Class PG, 5.00%, | | | | | | |
| 6/20/29(1) | 3,015,669 | 3,046,520 | | FNMA, VRN, 5.40%, | | |
| | | | | 5/1/10(1) | 165,693 | 172,385 |
| TOTAL COLLATERALIZED | | | | | | |
| MORTGAGE OBLIGATIONS | | | | FNMA, VRN, 3.25%, | | |
| (Cost $89,827,366) | | 91,143,441 | | 6/1/10(1) | 22,749 | 23,735 |
| | | | | FNMA, VRN, 4.18%, | | |
| U.S. Government Agency | | | 6/1/10(1) | 22,411 | 22,586 |
| Mortgage-Backed Securities(5) — 2.6% | | FNMA, VRN, 1.89%, | | |
| ADJUSTABLE-RATE U.S. GOVERNMENT AGENCY | | 7/1/10(1) | 1,894,283 | 1,922,105 |
| MORTGAGE-BACKED SECURITIES — 2.0% | | | FNMA, VRN, 2.94%, | | |
| FHLMC, VRN, 3.375%, | | | | 7/1/10(1) | 17,379 | 17,949 |
| 5/1/10(1) | 48,238 | 49,342 | | FNMA, VRN, 5.09%, | | |
| FHLMC, VRN, 2.35%, | | | | 7/1/10(1) | 41,667 | 43,363 |
| 6/1/10(1) | 158,784 | 161,623 | | FNMA, VRN, 2.375%, | | |
| FHLMC, VRN, 5.59%, | | | | 8/1/10(1) | 10,116 | 10,246 |
| 8/1/10(1) | 1,827,022 | 1,931,446 | | FNMA, VRN, 6.17%, | | |
| FHLMC, VRN, 2.88%, | | | | 9/1/10(1) | 6,278 | 6,444 |
| 9/1/10(1) | 63,535 | 65,525 | | FNMA, VRN, 5.77%, | | |
| FHLMC, VRN, 6.32%, | | | | 10/1/10(1) | 6,145,315 | 6,427,026 |
| 7/1/11(1) | 7,904,903 | 8,381,927 | | FNMA, VRN, 3.80%, | | |
| FNMA, VRN, 2.04%, | | | | 1/1/11(1) | 13,430 | 13,868 |
| 4/1/10(1) | 72,503 | 75,773 | | GNMA, VRN, 4.375%, | | |
| FNMA, VRN, 2.46%, | | | | 4/1/10(1) | 582 | 601 |
| 4/1/10(1) | 22,587 | 23,151 | | GNMA, VRN, 4.375%, | | |
| FNMA, VRN, 2.61%, | | | | 7/1/10(1) | 16,435 | 16,899 |
| 4/1/10(1) | 41,850 | 43,105 | | GNMA, VRN, 4.125%, | | |
| | | | | 10/1/10(1) | 14,662 | 15,202 |
43
| | | | | | | | |
| Short-Term Government | | | | | |
| |
| | | Principal | | | | Principal | | |
| | | Amount | Value | | | Amount/ | | |
| GNMA, VRN, 3.625%, | | | | | Shares | | Value |
| 1/1/11(1) | $ 29,880 | $ 30,920 | | Asset-Backed Securities(5) — 0.5% |
| GNMA, VRN, 4.875%, | | | | Ameriquest Mortgage | | | |
| 4/1/11(1) | | 79,241 | 82,045 | | | | | |
| | | | | | Securities, Inc., Series | | | |
| | | | 21,000,238 | | 2003-8, Class AV2, VRN, | | | |
| FIXED-RATE U.S. GOVERNMENT AGENCY | | | 0.68%, 4/26/10, resets | | | |
| MORTGAGE-BACKED SECURITIES — 0.6% | | | monthly off the 1-month | | | |
| FHLMC, 6.50%, 1/1/11(1) | 16,813 | 17,137 | | LIBOR plus 0.43% with | | | |
| | | | | | no caps(1) | $ 126,916 | $ 120,947 |
| FHLMC, 6.50%, 5/1/11(1) | 31,234 | 32,609 | | | | | |
| | | | | | Entergy Texas Restoration | | | |
| FHLMC, 6.50%, 12/1/12(1) | 97,850 | 103,688 | | Funding LLC, Series | | | |
| FHLMC, 6.00%, 2/1/13(1) | 274,957 | 290,514 | | 2009 A, Class A1 SEQ, | | | |
| | | | | | 2.12%, 2/1/16(1) | 5,000,000 | | 5,053,871 |
| FHLMC, 7.00%, 11/1/13(1) | 21,221 | 22,713 | | | | | |
| FHLMC, 7.00%, 12/1/14(1) | 24,108 | 26,121 | | TOTAL ASSET-BACKED SECURITIES | | |
| | | | | | (Cost $5,126,601) | | | 5,174,818 |
| FHLMC, 6.00%, 1/1/15(1) | 771,075 | 833,824 | | | | | |
| FHLMC, 7.50%, 5/1/16(1) | 257,591 | 280,419 | | Corporate Bonds — 0.5% | | |
| FHLMC, 5.50%, 11/1/17(1) | 909,909 | 981,255 | | THRIFTS & MORTGAGE FINANCE — 0.5% | |
| FNMA, 8.00%, 5/1/12(1) | 13,097 | 14,048 | | Western Corporate | | | |
| | | | | | Federal Credit Union, | | | |
| FNMA, 6.50%, 1/1/13(1) | 408,920 | 441,344 | | 1.75%, 11/2/12(1) | | | |
| FNMA, 6.50%, 3/1/13(1) | 3,626 | 3,913 | | (Cost $4,994,594) | 5,000,000 | | 5,017,555 |
| FNMA, 6.00%, 6/1/13(1) | 45,940 | 49,585 | | Temporary Cash Investments — 0.7% |
| FNMA, 6.50%, 6/1/13(1) | 2,197 | 2,379 | | FHLB Discount Notes, | | | |
| FNMA, 6.00%, 1/1/14(1) | 16,151 | 17,445 | | 0.001%, 4/1/10(4) | 7,495,000 | | 7,495,000 |
| FNMA, 6.00%, 7/1/14(1) | 131,606 | 142,152 | | JPMorgan U.S. Treasury | | | |
| | | | | | Plus Money Market Fund | | | |
| FNMA, 5.50%, 4/1/16(1) | 271,648 | 292,439 | | Agency Shares(1) | 93,133 | | 93,133 |
| FNMA, 7.00%, 5/1/32(1) | 471,888 | 530,759 | | TOTAL TEMPORARY | | | |
| FNMA, 7.00%, 5/1/32(1) | 527,935 | 593,798 | | CASH INVESTMENTS | | | |
| FNMA, 7.00%, 6/1/32(1) | 161,304 | 181,365 | | (Cost $7,588,133) | | | 7,588,133 |
| FNMA, 7.00%, 6/1/32(1) | 750,524 | 844,157 | | TOTAL INVESTMENT | | | |
| | | | | | SECURITIES — 99.5% | | | |
| FNMA, 7.00%, 8/1/32(1) | 419,825 | 472,201 | | (Cost $1,052,890,724) | | 1,060,401,899 |
| GNMA, 9.50%, 11/20/19(1) | 8,966 | 10,278 | | OTHER ASSETS AND | | | |
| | | | 6,184,143 | | LIABILITIES — 0.5% | | | 5,790,973 |
| TOTAL U.S. GOVERNMENT AGENCY | | | TOTAL NET ASSETS — 100.0% | $1,066,192,872 |
| MORTGAGE-BACKED SECURITIES | | | | | | |
| (Cost $26,126,961) | | 27,184,381 | | | | | |
| |
| Futures Contracts | | | | | | | |
| | | | | | Underlying Face | | | |
| Contracts Purchased | Expiration Date | | Amount at Value | Unrealized Gain (Loss) |
| 350 | U.S. Treasury 5-Year Notes | June 2010 | | $40,195,313 | $(189,459) |
| |
| | | | | | Underlying Face | | | |
| | Contracts Sold | | Expiration Date | | Amount at Value | Unrealized Gain (Loss) |
| 476 | U.S. Treasury 2-Year Notes | June 2010 | | $103,269,688 | $13,810 |
44
| |
| Short-Term Government |
| |
| Notes to Schedule of Investments |
| Equivalent = Security whose principal payments are backed by the full faith and credit of the United States |
| FDIC = Federal Deposit Insurance Corporation |
| FHLB = Federal Home Loan Bank |
| FHLMC = Federal Home Loan Mortgage Corporation |
| FNMA = Federal National Mortgage Association |
| GMAC = General Motors Acceptance Corporation |
| GNMA = Government National Mortgage Association |
| LIBOR = London Interbank Offered Rate |
| resets = The frequency with which a security’s coupon changes, based on current market conditions or an underlying index. The more frequently a |
| security resets, the less risk the investor is taking that the coupon will vary significantly from current market rates. |
| SEQ = Sequential Payer |
| VRN = Variable Rate Note. Interest reset date is indicated. Rate shown is effective at the period end. |
| (1) | Security, or a portion thereof, has been segregated for futures contracts. At the period end, the aggregate value of securities pledged was |
| | $143,466,000. |
| (2) | The debt is guaranteed under the Federal Deposit Insurance Corporation’s (FDIC) Temporary Liquidity Guarantee Program and is backed by |
| | the full faith and credit of the United States. The expiration date of the FDIC’s guarantee is the earlier of the maturity date of the debt or |
| | December 31, 2012. |
| (3) | Security was purchased under Rule 144A of the Securities Act of 1933 or is a private placement and, unless registered under the Act or |
| | exempted from registration, may only be sold to qualified institutional investors. The aggregate value of these securities at the period end was |
| | $2,949,870, which represented 0.3% of total net assets. |
| (4) | The rate indicated is the yield to maturity at purchase. |
| (5) | Final maturity indicated, unless otherwise noted. |
| |
| Industry classifications are unaudited. |
See Notes to Financial Statements.
45
|
| Statement of Assets and Liabilities |
| | | | |
| MARCH 31, 2010 | | | | |
| | | | Inflation-Adjusted | Short-Term |
| | Ginnie Mae | Government Bond | Bond | Government |
| Assets | | | | |
| Investment securities, at value | | | | |
| (cost of $1,634,967,306, $1,181,201,203, | | | | |
| $3,274,256,442 and $1,052,890,724, | | | | |
| respectively) | $1,678,524,937 | $1,207,337,173 | $3,377,942,138 | $1,060,401,899 |
| Cash | 98,346 | — | — | 65,290 |
| Receivable for investments sold | — | — | 8,500,000 | 2,806,664 |
| Receivable for capital shares sold | 1,539,053 | 1,242,959 | 11,362,223 | 515,404 |
| Receivable for variation margin | | | | |
| on futures contracts | 84,423 | 161,822 | 234,944 | 79,297 |
| Interest receivable | 6,764,694 | 6,094,895 | 20,200,039 | 3,885,183 |
| | 1,687,011,453 | 1,214,836,849 | 3,418,239,344 | 1,067,753,737 |
| | | | | |
| Liabilities | | | | |
| Payable for investments purchased | 89,075,000 | 31,373,891 | 18,298,165 | — |
| Payable for capital shares redeemed | 2,880,825 | 2,342,746 | 8,159,738 | 940,726 |
| Payable for variation margin | | | | |
| on futures contracts | 109,340 | 220,466 | 305,295 | 74,375 |
| Accrued management fees | 717,277 | 481,629 | 1,290,782 | 508,646 |
| Distribution fees payable | 15 | 20 | 81 | 15 |
| Service fees (and distribution fees — | | | | |
| A Class and R Class) payable | 35,139 | 40,879 | 151,097 | 15,881 |
| Dividends payable | 816,562 | 410,820 | — | 21,222 |
| Swap agreements, at value | — | — | 5,479,563 | — |
| | 93,634,158 | 34,870,451 | 33,684,721 | 1,560,865 |
| | | | | |
| Net Assets | $1,593,377,295 | $1,179,966,398 | $3,384,554,623 | $1,066,192,872 |
| |
| |
| See Notes to Financial Statements. | | | | |
46
| | | | |
| MARCH 31, 2010 | | | | |
| | | | Inflation-Adjusted | Short-Term |
| | Ginnie Mae | Government Bond | Bond | Government |
| Net Assets Consist of: | | | | |
| Capital paid in | $1,589,501,784 | $1,155,423,479 | $3,255,286,968 | $1,070,083,800 |
| Accumulated undistributed net | | | | |
| investment income (loss) | 12,768 | (410,820) | 47,642,976 | 9,685 |
| Accumulated net realized loss | | | | |
| on investment transactions | (39,662,879) | (1,082,732) | (16,492,780) | (11,236,139) |
| Net unrealized appreciation | | | | |
| on investments | 43,525,622 | 26,036,471 | 98,117,459 | 7,335,526 |
| | $1,593,377,295 | $1,179,966,398 | $3,384,554,623 | $1,066,192,872 |
| | | | | |
| Investor Class | | | | |
| Net assets | $1,414,742,381 | $988,435,388 | $2,266,660,102 | $991,463,763 |
| Shares outstanding | 131,514,582 | 89,733,514 | 196,701,721 | 101,973,626 |
| Net asset value per share | $10.76 | $11.02 | $11.52 | $9.72 |
| | | | | |
| Institutional Class | | | | |
| Net assets | $17,970,776 | $24,938 | $407,799,162 | $24,942 |
| Shares outstanding | 1,670,682 | 2,265 | 35,386,683 | 2,564 |
| Net asset value per share | $10.76 | $11.01 | $11.52 | $9.73 |
| | | | | |
| A Class | | | | |
| Net assets | $158,818,696 | $191,437,305 | $709,931,201 | $74,654,321 |
| Shares outstanding | 14,763,445 | 17,379,327 | 61,799,720 | 7,677,411 |
| Net asset value per share | $10.76 | $11.02 | $11.49 | $9.72 |
| Maximum offering price (net asset | | | | |
| value divided by 0.9550, 0.9550, | | | | |
| 0.9550 and 0.9775, respectively) | $11.27 | $11.54 | $12.03 | $9.94 |
| | | | | |
| C Class | | | | |
| Net assets | $25,024 | $43,844 | $139,141 | $24,918 |
| Shares outstanding | 2,325 | 3,982 | 12,087 | 2,562 |
| Net asset value per share | $10.76 | $11.01 | $11.51 | $9.73 |
| | | | | |
| R Class | | | | |
| Net assets | $1,820,418 | $24,923 | $25,017 | $24,928 |
| Shares outstanding | 169,259 | 2,264 | 2,172 | 2,563 |
| Net asset value per share | $10.76 | $11.01 | $11.52 | $9.73 |
| |
| |
| See Notes to Financial Statements. | | | | |
47
| | | | |
| YEAR ENDED MARCH 31, 2010 | | | | |
| | | | Inflation-Adjusted | Short-Term |
| | Ginnie Mae | Government Bond | Bond | Government |
| Investment Income (Loss) | | | | |
| Income: | | | | |
| Interest | $66,142,425 | $ 42,551,644 | $108,462,842 | $23,237,908 |
| | | | | |
| Expenses: | | | | |
| Management fees | 8,728,567 | 5,419,402 | 12,475,726 | 6,088,041 |
| Distribution fees — C Class | 15 | 20 | 81 | 15 |
| Service fees — C Class | 5 | 7 | 27 | 5 |
| Distribution and service fees: | | | | |
| A Class | 422,512 | 464,623 | 1,554,022 | 171,758 |
| R Class | 6,084 | 10 | 10 | 10 |
| Trustees’ fees and expenses | 62,725 | 44,297 | 92,709 | 43,661 |
| Other expenses | 13 | 52 | 126 | 10 |
| | 9,219,921 | 5,928,411 | 14,122,701 | 6,303,500 |
| Fees waived | (365,695) | — | — | — |
| | 8,854,226 | 5,928,411 | 14,122,701 | 6,303,500 |
| | | | | |
| Net investment income (loss) | 57,288,199 | 36,623,233 | 94,340,141 | 16,934,408 |
| | | | | |
| Realized and Unrealized Gain (Loss) | | | | |
| Net realized gain (loss) on: | | | | |
| Investment transactions | 13,066,784 | 6,736,658 | 14,798,278 | 9,218,015 |
| Futures contract transactions | (821,149) | (971,474) | (1,715,037) | 1,701,427 |
| | 12,245,635 | 5,765,184 | 13,083,241 | 10,919,442 |
| | | | | |
| Change in net unrealized | | | | |
| appreciation (depreciation) on: | | | | |
| Investments | 8,072,570 | (14,147,255) | 45,622,190 | (2,493,541) |
| Futures contracts | (32,009) | 368,667 | (88,674) | (918,599) |
| Swap agreements | — | — | 1,763,160 | — |
| | 8,040,561 | (13,778,588) | 47,296,676 | (3,412,140) |
| | | | | |
| Net realized and unrealized gain (loss) | 20,286,196 | (8,013,404) | 60,379,917 | 7,507,302 |
| | | | | |
| Net Increase (Decrease) in Net Assets | | | | |
| Resulting from Operations | $77,574,395 | $ 28,609,829 | $154,720,058 | $24,441,710 |
| |
| |
| See Notes to Financial Statements. | | | | |
48
|
| Statement of Changes in Net Assets |
| | | | |
| YEARS ENDED MARCH 31, 2010 AND MARCH 31, 2009 | | | |
| | Ginnie Mae | Government Bond |
| Increase (Decrease) in Net Assets | 2010 | 2009 | 2010 | 2009 |
| Operations | | | | |
| Net investment income (loss) | $ 57,288,199 | $ 54,867,219 | $ 36,623,233 | $ 32,196,554 |
| Net realized gain (loss) | 12,245,635 | 14,152,171 | 5,765,184 | 19,975,998 |
| Change in net unrealized | | | | |
| appreciation (depreciation) | 8,040,561 | 24,977,077 | (13,778,588) | 15,287,541 |
| Net increase (decrease) in net assets | | | | |
| resulting from operations | 77,574,395 | 93,996,467 | 28,609,829 | 67,460,093 |
| | | | | |
| Distributions to Shareholders | | | | |
| From net investment income: | | | | |
| Investor Class | (58,932,371) | (52,903,038) | (32,407,531) | (27,915,316) |
| Institutional Class | (480,395) | (304,250) | (71) | — |
| A Class | (6,770,082) | (4,377,862) | (5,915,261) | (4,581,941) |
| C Class | (66) | — | (67) | — |
| R Class | (45,454) | (5,810) | (57) | — |
| From net realized gains: | | | | |
| Investor Class | — | — | (14,534,572) | (9,207,971) |
| A Class | — | — | (2,722,724) | (1,818,634) |
| Decrease in net assets from distributions | (66,228,368) | (57,590,960) | (55,580,283) | (43,523,862) |
| | | | | |
| Capital Share Transactions | | | | |
| Net increase (decrease) in net assets | | | | |
| from capital share transactions | 90,094,753 | 174,832,895 | 121,147,895 | 294,236,829 |
| | | | | |
| Net increase (decrease) in net assets | 101,440,780 | 211,238,402 | 94,177,441 | 318,173,060 |
| | | | | |
| Net Assets | | | | |
| Beginning of period | 1,491,936,515 | 1,280,698,113 | 1,085,788,957 | 767,615,897 |
| End of period | $1,593,377,295 | $1,491,936,515 | $1,179,966,398 | $1,085,788,957 |
| | | | | |
| Accumulated undistributed | | | | |
| net investment income (loss) | $12,768 | $25,192 | $(410,820) | $24,393 |
| |
| |
| See Notes to Financial Statements. | | | | |
49
| | | | |
| YEARS ENDED MARCH 31, 2010 AND MARCH 31, 2009 | | | |
| | Inflation-Adjusted Bond | Short-Term Government |
| Increase (Decrease) in Net Assets | 2010 | 2009 | 2010 | 2009 |
| Operations | | | | |
| Net investment income (loss) | $ 94,340,141 | $ 25,880,916 | $ 16,934,408 | $ 31,585,318 |
| Net realized gain (loss) | 13,083,241 | (12,148,518) | 10,919,442 | 5,558,102 |
| Change in net unrealized | | | | |
| appreciation (depreciation) | 47,296,676 | (42,996,340) | (3,412,140) | (4,819,809) |
| Net increase (decrease) in net assets | | | | |
| resulting from operations | 154,720,058 | (29,263,942) | 24,441,710 | 32,323,611 |
| | | | | |
| Distributions to Shareholders | | | | |
| From net investment income: | | | | |
| Investor Class | (31,576,120) | (35,773,321) | (16,319,090) | (30,710,941) |
| Institutional Class | (5,848,258) | (6,069,005) | (27) | — |
| A Class | (8,674,827) | (18,030,179) | (907,603) | (1,215,052) |
| C Class | — | — | (3) | — |
| R Class | — | — | (13) | — |
| From tax return of capital: | | | | |
| Investor Class | — | (7,005,146) | — | — |
| Institutional Class | — | (1,188,435) | — | — |
| A Class | — | (3,530,677) | — | — |
| Decrease in net assets from distributions | (46,099,205) | (71,596,763) | (17,226,736) | (31,925,993) |
| | | | | |
| Capital Share Transactions | | | | |
| Net increase (decrease) in net assets | | | | |
| from capital share transactions | 1,377,673,215 | 452,009,246 | 22,577,685 | (102,323,623) |
| | | | | |
| Net increase (decrease) in net assets | 1,486,294,068 | 351,148,541 | 29,792,659 | (101,926,005) |
| | | | | |
| Net Assets | | | | |
| Beginning of period | 1,898,260,555 | 1,547,112,014 | 1,036,400,213 | 1,138,326,218 |
| End of period | $3,384,554,623 | $1,898,260,555 | $1,066,192,872 | $1,036,400,213 |
| | | | | |
| Accumulated undistributed | | | | |
| net investment income (loss) | $47,642,976 | $(623,128) | $9,685 | $14,723 |
See Notes to Financial Statements.
50
|
| Notes to Financial Statements |
MARCH 31, 2010
1. Organization and Summary of Significant Accounting Policies
Organization — American Century Government Income Trust (the trust) is registered under the Investment Company Act of 1940 (the 1940 Act) as an open-end management investment company. Ginnie Mae Fund (Ginnie Mae), Government Bond Fund (Government Bond), Inflation-Adjusted Bond Fund (Inflation-Adjusted Bond), and Short-Term Government Fund (Short-Term Government) (collectively, the funds) are four funds in a series issued by the trust. The funds are diversified under the 1940 Act.
Ginnie Mae seeks high current income while maintaining liquidity and safety of principal by investing primarily in Government National Mortgage Association certificates. In addition, Ginnie Mae may buy other U.S. government securities, including U.S. Treasury securities and other securities issued or guaranteed by the U.S. government and its agencies and instrumentalities. Government Bond seeks high current income and pursues this objective by investing primarily in U.S. government debt securities, including U.S. Treasury securities and other securities issued or guaranteed by the U.S. government and its agencies and instrumentalities. Inflation-Adjusted Bond seeks to provide total return and inflation protection consistent with investment in inflation-indexed securities primarily issued by the U.S. Treasury, by other U.S. government agencies and instrumentalities, and by other, non-U.S. government entities such a s corporations. Short-Term Government seeks high current income while maintaining safety of principal. Short-Term Government pursues its objective by investing primarily in U.S. government securities, including U.S. Treasury securities and other securities issued or guaranteed by the U.S. government and its agencies and instrumentalities. In addition, Short-Term Government may also invest in investment-grade debt securities, including debt securities of U.S. companies, and non-U.S. government mortgage-backed, asset-backed and other fixed-income securities. The following is a summary of the funds’ significant accounting policies.
Multiple Class — The funds are authorized to issue the Investor Class, the Institutional Class, the A Class (formerly Advisor Class), the C Class and the R Class. The A Class may incur an initial sales charge. The A Class and C Class may be subject to a contingent deferred sales charge. The share classes differ principally in their respective distribution and shareholder servicing expenses and arrangements. All shares of the funds represent an equal pro rata interest in the net assets of the class to which such shares belong, and have identical voting, dividend, liquidation and other rights and the same terms and conditions, except for class specific expenses and exclusive rights to vote on matters affecting only individual classes. Income, non-class specific expenses, and realized and unrealized capital gains and losses of t he funds are allocated to each class of shares based on their relative net assets. Sale of Ginnie Mae’s C Class commenced on March 1, 2010. Sale of Government Bond’s Institutional Class, C Class and R Class commenced on March 1, 2010. Sale of Inflation-Adjusted Bond’s C Class and R Class commenced on March 1, 2010. Sale of Short-Term Government’s Institutional Class, C Class and R Class commenced on March 1, 2010.
Security Valuations — Debt securities maturing in greater than 60 days at the time of purchase are valued at current market value as provided by a commercial pricing service or at the mean of the most recent bid and asked prices. Debt securities maturing within 60 days at the time of purchase may be valued at cost, plus or minus any amortized discount or premium. Discount notes may be valued through a commercial pricing service or at amortized cost, which approximates fair value. Investments in open-end management investment companies are valued at the reported net asset value. Securities traded on foreign securities exchanges and over-the-counter markets are normally completed before the close of business on days that the New York Stock Exchange (the Exchange) is open and may also take place on days when the Exchange is not open. If an event occurs after the value of a security was established but before the net asset value per share was determined that was likely to materially change the net asset value, that security would be valued at fair value as determined in accordance with procedures adopted by the Board of Trustees. If the funds determine that the market price of a portfolio security is not readily available, or that the valuation methods mentioned above do not reflect the security’s fair value, such security is valued as determined by the Board of Trustees or its designee, in accordance with procedures adopted by the Board of Trustees, if such determination
51
would materially impact a fund’s net asset value. Certain other circumstances may cause the funds to fair value a security such as: a security had been declared in default; or trading in a security has been halted during the trading day; or there is a foreign market holiday and no trading will commence.
Security Transactions — For financial reporting purposes, security transactions are accounted for as of the trade date. Net realized gains and losses are determined on the identified cost basis, which is also used for federal income tax purposes.
Investment Income — Interest income is recorded on the accrual basis and includes paydown gain (loss) and accretion of discounts and amortization of premiums. Inflation adjustments related to inflation-linked debt securities are reflected as interest income.
Repurchase Agreements — The funds may enter into repurchase agreements with institutions that American Century Investment Management, Inc. (ACIM) (the investment advisor) has determined are creditworthy pursuant to criteria adopted by the Board of Trustees. Each repurchase agreement is recorded at cost. Each fund requires that the collateral, represented by securities, received in a repurchase transaction be transferred to the custodian in a manner sufficient to enable each fund to obtain those securities in the event of a default under the repurchase agreement. ACIM monitors, on a daily basis, the securities transferred to ensure the value, including accrued interest, of the securities under each repurchase agreement is equal to or greater than amounts owed to each fund under each repurchase agreement.
Joint Trading Account — Pursuant to an Exemptive Order issued by the Securities and Exchange Commission, each fund, along with certain other funds in the American Century Investments family of funds, may transfer uninvested cash balances into a joint trading account. These balances are invested in one or more repurchase agreements that are collateralized by U.S. Treasury or Agency obligations.
When-Issued and Forward Commitments — The funds may engage in securities transactions on a when-issued or forward commitment basis. In these transactions, the securities’ prices and yields are fixed on the date of the commitment. In a when-issued transaction, the payment and delivery are scheduled for a future date and during this period, securities are subject to market fluctuations. In a forward commitment transaction, the funds may sell a security and at the same time make a commitment to purchase the same security at a future date at a specified price. Conversely, the funds may purchase a security and at the same time make a commitment to sell the same security at a future date at a specified price. These types of transactions are executed simultaneously in what are known as “roll” transactions. The fun ds will segregate cash, cash equivalents or other appropriate liquid securities on their records in amounts sufficient to meet the purchase price. The funds account for “roll” transactions as purchases and sales; as such these transactions may increase portfolio turnover.
Income Tax Status — It is each fund’s policy to distribute substantially all net investment income and net realized gains to shareholders and to otherwise qualify as a regulated investment company under provisions of the Internal Revenue Code. The funds are no longer subject to examination by tax authorities for years prior to 2007. At this time, management believes there are no uncertain tax positions which, based on their technical merit, would not be sustained upon examination and for which it is reasonably possible that the total amounts of unrecognized tax benefits will significantly change in the next twelve months. Accordingly, no provision has been made for federal or state income taxes.
Distributions to Shareholders — Distributions to shareholders are recorded on the ex-dividend date. Distributions from net investment income for Ginnie Mae, Government Bond and Short-Term Government are declared daily and paid monthly. Distributions from net investment income, if any, for Inflation-Adjusted Bond are declared and paid quarterly. Distributions from net realized gains for the funds, if any, are generally declared and paid annually.
52
Indemnifications — Under the trust’s organizational documents, its officers and trustees are indemnified against certain liabilities arising out of the performance of their duties to the funds. In addition, in the normal course of business, the funds enter into contracts that provide general indemnifications. The maximum exposure under these arrangements is unknown as this would involve future claims that may be made against a fund. The risk of material loss from such claims is considered by management to be remote.
Use of Estimates — The financial statements are prepared in conformity with accounting principles generally accepted in the United States of America, which may require management to make certain estimates and assumptions at the date of the financial statements. Actual results could differ from these estimates.
Subsequent Events — In preparing the financial statements, management evaluated the impact of events or transactions occurring through the date the financial statements were issued that would merit recognition or disclosure.
2. Fees and Transactions with Related Parties
Management Fees — The trust has entered into a Management Agreement with ACIM, under which ACIM provides the funds with investment advisory and management services in exchange for a single, unified management fee (the fee) per class. The Agreement provides that all expenses of managing and operating the funds, except brokerage expenses, taxes, interest, fees and expenses of the independent trustees (including legal counsel fees) and extraordinary expenses, will be paid by ACIM. The fee is computed and accrued daily based on the daily net assets of each specific class of shares of each fund and paid monthly in arrears. The fee consists of (1) an Investment Category Fee based on the daily net assets of the funds and certain other accounts managed by the investment advisor that are in the same broad investment category as each f und and (2) a Complex Fee based on the assets of all the funds in the American Century Investments family of funds. The rates for the Investment Category Fee for Ginnie Mae and Short-Term Government range from 0.2425% to 0.3600%, and for Government Bond and Inflation-Adjusted Bond range from 0.1625% to 0.2800%. The rates for the Complex Fee (Investor Class, A Class, C Class and R Class) for the funds range from 0.2500% to 0.3100%. The Institutional Class is 0.2000% less at each point within the Complex Fee range. From April 1, 2009 to July 31, 2009, the investment advisor agreed to waive 0.02% of its management fee for Ginnie Mae. Effective August 1, 2009, the investment advisor agreed to waive 0.025% of its management fee for Ginnie Mae. The total amount of the waiver for the year ended March 31, 2010, was $323,297, $2,552, $39,551, $1 and $294 for the Investor Class, Institutional Class, A Class, C Class and R Class, respectively. The advisor expects this waiver to continue through July 31, 2010 and cannot terminate it without consulting the Board of Trustees.
The effective annual management fee for each class of each fund for the year ended March 31, 2010, was as follows:
| | |
| | Investor, A, C & R | Institutional |
| Ginnie Mae (before waiver) | 0.56% | 0.36% |
| Ginnie Mae (after waiver) | 0.54% | 0.34% |
| Government Bond | 0.48% | 0.28% |
| Inflation-Adjusted Bond | 0.48% | 0.28% |
| Short-Term Government | 0.56% | 0.36% |
53
Distribution and Service Fees — The Board of Trustees has adopted a separate Master Distribution and Individual Shareholder Services Plan for each of the A Class, C Class and R Class (collectively, the plans), pursuant to Rule 12b-1 of the 1940 Act. The plans provide that the A Class will pay American Century Investment Services, Inc. (ACIS) an annual distribution and service fee of 0.25%. The plans provide that the C Class will pay ACIS an annual distribution fee of 0.75% and service fee of 0.25%. The plans provide that the R Class will pay ACIS an annual distribution and service fee of 0.50%. The fees are computed and accrued daily based on each class’s daily net assets and paid monthly in arrears. The fees are used to pay financial intermediaries for distribution and individual shareholder services. Fees incurred unde r the plans during the year ended March 31, 2010, are detailed in the Statement of Operations.
Related Parties — Certain officers and trustees of the trust are also officers and/or directors of American Century Companies, Inc. (ACC), the parent of the trust’s investment advisor, ACIM, the distributor of the trust, ACIS, and the trust’s transfer agent, American Century Services, LLC. Directors of these entities are officers and directors of other entities and those other entities own 23% of the outstanding shares of Short-Term Government.
The funds are eligible to invest in a money market fund for temporary purposes, which is managed by J.P. Morgan Investment Management, Inc. (JPMIM). The funds have a Mutual Funds Services Agreement with J.P. Morgan Investor Services Co. (JPMIS) and a securities lending agreement with JPMorgan Chase Bank (JPMCB). JPMCB is a custodian of the funds. JPMIM, JPMIS and JPMCB are wholly owned subsidiaries of JPMorgan Chase & Co. (JPM). JPM is an equity investor in ACC.
3. Investment Transactions
Investment transactions, excluding short-term investments, for the year ended March 31, 2010, were as follows:
| | | | |
| | | | Inflation-Adjusted | Short-Term |
| | Ginnie Mae | Government Bond | Bond | Government |
| Purchases | | | | |
| U.S. Treasury & Government | | | | |
| Agency Obligations | $2,746,785,506 | $1,431,973,128 | $1,778,861,661 | $1,637,627,291 |
| Investment securities other than | | | | |
| U.S. Treasury & Government | | | | |
| Agency Obligations | — | — | $235,853,853 | $20,090,120 |
| Sales | | | | |
| U.S. Treasury & Government | | | | |
| Agency Obligations | $2,717,884,415 | $1,397,563,038 | $520,398,093 | $1,440,437,344 |
| Investment securities other than | | | | |
| U.S. Treasury & Government | | | | |
| Agency Obligations | — | — | $182,743,993 | $134,612,164 |
54
4. Capital Share Transactions
Transactions in shares of the funds were as follows (unlimited number of shares authorized):
| | | | |
| | Year ended March 31, 2010(1) | Year ended March 31, 2009 |
| | Shares | Amount | Shares | Amount |
| Ginnie Mae | | | | |
| Investor Class | | | | |
| Sold | 34,274,791 | $ 367,324,551 | 32,829,256 | $ 341,873,728 |
| Issued in reinvestment of distributions | 4,870,410 | 52,221,499 | 4,488,442 | 46,471,540 |
| Redeemed | (32,803,453) | (351,326,924) | (25,489,751) | (263,992,392) |
| | 6,341,748 | 68,219,126 | 11,827,947 | 124,352,876 |
| Institutional Class | | | | |
| Sold | 1,269,346 | 13,671,426 | 355,093 | 3,717,612 |
| Issued in reinvestment of distributions | 34,088 | 365,520 | 29,378 | 304,250 |
| Redeemed | (383,503) | (4,110,012) | (224,249) | (2,344,512) |
| | 919,931 | 9,926,934 | 160,222 | 1,677,350 |
| A Class | | | | |
| Sold | 9,460,117 | 101,309,034 | 8,728,801 | 91,118,476 |
| Issued in reinvestment of distributions | 458,194 | 4,912,262 | 279,999 | 2,905,147 |
| Redeemed | (8,910,133) | (95,549,375) | (4,415,944) | (45,736,617) |
| | 1,008,178 | 10,671,921 | 4,592,856 | 48,287,006 |
| C Class | | | N/A | |
| Sold | 2,319 | 25,000 | | |
| Issued in reinvestment of distributions | 6 | 66 | | |
| | 2,325 | 25,066 | | |
| R Class | | | | |
| Sold | 154,422 | 1,650,125 | 74,033 | 776,100 |
| Issued in reinvestment of distributions | 4,213 | 45,260 | 561 | 5,810 |
| Redeemed | (41,466) | (443,679) | (25,030) | (266,247) |
| | 117,169 | 1,251,706 | 49,564 | 515,663 |
| Net increase (decrease) | 8,389,351 | $ 90,094,753 | 16,630,589 | $ 174,832,895 |
| (1) March 1, 2010 (commencement of sale) through March 31, 2010 for the C Class. | | |
55
| | | | |
| | Year ended March 31, 2010(1) | Year ended March 31, 2009 |
| | Shares | Amount | Shares | Amount |
| Government Bond | | | | |
| Investor Class | | | | |
| Sold | 40,351,769 | $ 450,358,038 | 51,486,232 | $ 565,183,128 |
| Issued in reinvestment of distributions | 3,719,388 | 41,457,457 | 3,215,231 | 35,202,987 |
| Redeemed | (33,866,174) | (376,482,770) | (35,100,499) | (386,343,011) |
| | 10,204,983 | 115,332,725 | 19,600,964 | 214,043,104 |
| Institutional Class | | | N/A | |
| Sold | 2,259 | 25,000 | | |
| Issued in reinvestment of distributions | 6 | 71 | | |
| | 2,265 | 25,071 | | |
| A Class | | | | |
| Sold | 12,266,398 | 136,599,245 | 15,822,548 | 173,684,498 |
| Issued in reinvestment of distributions | 468,859 | 5,226,821 | 413,087 | 4,530,640 |
| Redeemed | (12,219,222) | (136,105,071) | (8,922,286) | (98,021,413) |
| | 516,035 | 5,720,995 | 7,313,349 | 80,193,725 |
| C Class | | | N/A | |
| Sold | 3,978 | 44,000 | | |
| Issued in reinvestment of distributions | 4 | 47 | | |
| | 3,982 | 44,047 | | |
| R Class | | | N/A | |
| Sold | 2,259 | 25,000 | | |
| Issued in reinvestment of distributions | 5 | 57 | | |
| | 2,264 | 25,057 | | |
| Net increase (decrease) | 10,729,529 | $ 121,147,895 | 26,914,313 | $ 294,236,829 |
| (1) March 1, 2010 (commencement of sale) through March 31, 2010 for the Institutional Class, C Class and R Class. | |
56
| | | | |
| | Year ended March 31, 2010(1) | Year ended March 31, 2009 |
| | Shares | Amount | Shares | Amount |
| Inflation-Adjusted Bond | | | | |
| Investor Class | | | | |
| Sold | 135,001,472 | $1,523,997,066 | 76,152,733 | $ 838,312,291 |
| Issued in reinvestment of distributions | 2,137,805 | 24,563,421 | 3,153,599 | 35,201,707 |
| Redeemed | (47,757,972) | (541,816,610) | (48,132,553) | (519,904,532) |
| | 89,381,305 | 1,006,743,877 | 31,173,779 | 353,609,466 |
| Institutional Class | | | | |
| Sold | 20,972,581 | 238,882,151 | 12,820,699 | 137,238,707 |
| Issued in reinvestment of distributions | 312,289 | 3,588,206 | 451,896 | 5,040,691 |
| Redeemed | (4,897,162) | (55,638,455) | (8,437,070) | (91,100,590) |
| | 16,387,708 | 186,831,902 | 4,835,525 | 51,178,808 |
| A Class | | | | |
| Sold | 33,094,921 | 372,937,288 | 25,458,862 | 282,528,812 |
| Issued in reinvestment of distributions | 718,837 | 8,237,868 | 1,861,125 | 20,737,752 |
| Redeemed | (17,433,264) | (197,241,935) | (23,660,020) | (256,045,592) |
| | 16,380,494 | 183,933,221 | 3,659,967 | 47,220,972 |
| C Class | | | N/A | |
| Sold | 12,087 | 139,215 | | |
| R Class | | | N/A | |
| Sold | 2,172 | 25,000 | | |
| Net increase (decrease) | 122,163,766 | $1,377,673,215 | 39,669,271 | $ 452,009,246 |
| (1) March 1, 2010 (commencement of sale) through March 31, 2010 for the C Class and R Class. | | |
57
| | | | | |
| | | Year ended March 31, 2010(1) | Year ended March 31, 2009 |
| | | Shares | Amount | Shares | Amount |
| Short-Term Government | | | | |
| Investor Class | | | | |
| Sold | | 48,506,544 | $ 470,491,702 | 39,340,035 | $ 376,206,636 |
| Issued in reinvestment of distributions | 1,643,435 | 15,953,799 | 3,131,775 | 29,924,118 |
| Redeemed | (48,709,652) | (472,955,017) | (56,518,631) | (540,804,490) |
| | | 1,440,327 | 13,490,484 | (14,046,821) | (134,673,736) |
| Institutional Class | | | N/A | |
| Sold | | 2,561 | 25,000 | | |
| Issued in reinvestment of distributions | 3 | 27 | | |
| | | 2,564 | 25,027 | | |
| A Class | | | | |
| Sold | | 9,047,645 | 87,928,437 | 6,356,507 | 60,744,997 |
| Issued in reinvestment of distributions | 91,030 | 883,746 | 125,967 | 1,204,148 |
| Redeemed | (8,206,772) | (79,800,025) | (3,091,545) | (29,599,032) |
| | | 931,903 | 9,012,158 | 3,390,929 | 32,350,113 |
| C Class | | | N/A | |
| Sold | | 2,562 | 25,000 | | |
| Issued in reinvestment of distributions | —(2) | 3 | | |
| | | 2,562 | 25,003 | | |
| R Class | | | N/A | |
| Sold | | 2,562 | 25,000 | | |
| Issued in reinvestment of distributions | 1 | 13 | | |
| | | 2,563 | 25,013 | | |
| Net increase (decrease) | 2,379,919 | $ 22,577,685 | (10,655,892) | $(102,323,623) |
| (1) | March 1, 2010 (commencement of sale) through March 31, 2010 for the Institutional Class, C Class and R Class. | |
| (2) | Share amount was less than 0.5. | | | | |
5. Fair Value Measurements
The funds’ securities valuation process is based on several considerations and may use multiple inputs to determine the fair value of the positions held by the funds. In conformity with accounting principles generally accepted in the United States of America, the inputs used to determine a valuation are classified into three broad levels as follows:
• Level 1 valuation inputs consist of unadjusted quoted prices in an active market for identical securities;
• Level 2 valuation inputs consist of significant direct or indirect observable market data (including quoted prices for similar securities, evaluations of subsequent market events, interest rates, prepayment speeds, credit risk, etc.); or
• Level 3 valuation inputs consist of significant unobservable inputs (including a fund’s own assumptions).
The level classification is based on the lowest level input that is significant to the fair valuation measurement. The valuation inputs are not an indication of the risks associated with investing in these securities or other financial instruments.
58
The following is a summary of the valuation inputs used to determine the fair value of the funds’ securities and other financial instruments as of March 31, 2010. The Schedule of Investments provides additional details on the funds’ portfolio holdings.
| | | | |
| | Level 1 | Level 2 | Level 3 | |
| Ginnie Mae | | | | |
| Investment Securities | | | | |
| U.S. Government Agency Mortgage-Backed Securities | — | $1,561,164,281 | | — |
| U.S. Government Agency Collateralized Mortgage Obligations | — | 101,144,194 | | — |
| Temporary Cash Investments | $364,462 | 15,852,000 | | — |
| Total Value of Investment Securities | $364,462 | $1,678,160,475 | | — |
| | | | | |
| Other Financial Instruments | | | | |
| Total Unrealized Gain (Loss) on Future Contracts | $(32,009) | — | | — |
| | | | | |
| Government Bond | | | | |
| Investment Securities | | | | |
| U.S. Government Agency Mortgage-Backed Securities | — | $ 510,220,072 | | — |
| U.S. Treasury Securities | — | 337,889,803 | | — |
| U.S. Government Agency Securities and Equivalents | — | 253,364,095 | | — |
| Collateralized Mortgage Obligations | — | 88,071,159 | | — |
| Temporary Cash Investments | $104,044 | 17,688,000 | | — |
| Total Value of Investment Securities | $104,044 | $1,207,233,129 | | — |
| | | | | |
| Other Financial Instruments | | | | |
| Total Unrealized Gain (Loss) on Future Contracts | $(99,499) | — | | — |
| | | | | |
| Inflation-Adjusted Bond | | | | |
| Investment Securities | | | | |
| U.S. Treasury Securities | — | $3,021,383,111 | | — |
| Corporate Bonds | — | 195,656,448 | | — |
| Commercial Mortgage-Backed Securities | — | 51,265,349 | | — |
| Asset-Backed Securities | — | 18,403,615 | | — |
| U.S. Government Agency Securities | — | 16,271,947 | | — |
| Municipal Securities | — | 5,257,623 | | — |
| Temporary Cash Investments | $183,045 | 69,521,000 | | — |
| Total Value of Investment Securities | $183,045 | $3,377,759,093 | | — |
| | | | | |
| Other Financial Instruments | | | | |
| Futures Contracts | $(88,674) | — | | — |
| Swap Agreements | — | $(5,479,563) | | — |
| Total Unrealized Gain (Loss) on | | | | |
| Other Financial Instruments | $(88,674) | $(5,479,563) | | — |
59
| | | | |
| | Level 1 | Level 2 | Level 3 | |
| Short-Term Government | | | | |
| Investment Securities | | | | |
| U.S. Treasury Securities | — | $ 586,944,151 | | — |
| U.S. Government Agency Securities and Equivalents | — | 337,349,420 | | — |
| Collateralized Mortgage Obligations | — | 91,143,441 | | — |
| U.S. Government Agency Mortgage-Backed Securities | — | 27,184,381 | | — |
| Asset-Backed Securities | — | 5,174,818 | | — |
| Corporate Bonds | — | 5,017,555 | | — |
| Temporary Cash Investments | $93,133 | 7,495,000 | | — |
| Total Value of Investment Securities | $93,133 | $1,060,308,766 | | — |
| | | | | |
| Other Financial Instruments | | | | |
| Total Unrealized Gain (Loss) on Futures Contracts | $(175,649) | — | | — |
6. Derivative Instruments
Interest Rate Risk — The funds are subject to interest rate risk in the normal course of pursuing their investment objectives. The value of bonds generally declines as interest rates rise. A fund may enter into futures contracts based on a bond index or a specific underlying security. A fund may purchase futures contracts to gain exposure to increases in market value or sell futures contracts to protect against a decline in market value. Upon entering into a futures contract, a fund will segregate cash, cash equivalents or other appropriate liquid securities on its records in amounts sufficient to meet requirements. Subsequent payments (variation margin) are made or received daily, in cash, by a fund. The variation margin is equal to the daily change in the contract value and is recorded as unrealized gains and losses. A fund recognizes a realized gain or loss when the futures contract is closed or expires. Net realized and unrealized gains or losses occurring during the holding period of futures contracts are a component of net realized gain (loss) on futures contract transactions and change in net unrealized appreciation (depreciation) on futures contracts, respectively. One of the risks of entering into futures contracts is the possibility that the change in value of the contract may not correlate with the changes in value of the underlying securities. For Ginnie Mae, Government Bond and Short-Term Government, the interest rate risk derivative instruments held at period end as disclosed on the Schedule of Investments are indicative of the funds’ typical volume during the period. Inflation-Adjusted Bond began investing in interest rate risk derivatives in November 2009. The interest rate risk derivative instruments at period end as disclosed on the Inflation-Adjusted Bond’s Schedule of Investments are indicative of t he fund’s typical volume since November 2009.
Other Contracts — Inflation-Adjusted Bond may enter into total return swap agreements in order to attempt to obtain or preserve a particular return or spread at a lower cost than obtaining a return or spread through purchases and/or sales of instruments in other markets or gain exposure to certain markets in the most economical way possible. A fund will segregate cash, cash equivalents or other appropriate liquid securities on its records in amounts sufficient to meet requirements. Swap agreements are valued daily at current market value as provided by a commercial pricing service and/or independent brokers. Changes in value, including the periodic amounts of interest to be paid or received on swap agreements, are recorded as unrealized appreciation (depreciation) on swap agreements. Realized gain or loss is recorded upon rec eipt or payment of a periodic settlement or termination of swap agreements. Net realized and unrealized gains or losses occurring during the holding period of swap agreements are a component of net realized gain (loss) on swap agreement transactions and change in net unrealized appreciation (depreciation) on swap agreements, respectively. The risks of entering into swap agreements include the possible lack of liquidity, failure of the counterparty to meet its obligations, and that there may be unfavorable changes in the underlying investments or instruments. The other contract derivative instruments held at period end as disclosed on the Schedule of Investments are indicative of Inflation-Adjusted Bond’s typical volume during the period.
60
| | | | |
| Value of Derivative Instruments as of March 31, 2010 | | |
| | Asset Derivatives | | Liability Derivatives |
| Fund/Type of | Location on Statement | | Location on Statement | |
| Derivative | of Assets and Liabilities | Value | of Assets and Liabilities | Value |
| |
| Ginnie Mae | | | | |
| Interest Rate Risk | Receivable for variation | | Payable for variation | |
| | margin on futures contracts | $84,423 | margin on futures contracts | $ 109,340 |
| | | | | |
| Government Bond | | | |
| Interest Rate Risk | Receivable for variation | | Payable for variation | |
| | margin on futures contracts | $161,822 | margin on futures contracts | $220,466 |
| | | | | |
| Inflation-Adjusted Bond | | | |
| Interest Rate Risk | Receivable for variation | | Payable for variation | |
| | margin on futures contracts | $234,944 | margin on futures contracts | $305,295 |
| Other Contracts | Swap agreements | — | Swap agreements | 5,479,563 |
| | | $234,944 | | $5,784,858 |
| | | | | |
| Short-Term Government | | | |
| Interest Rate Risk | Receivable for variation | | Payable for variation | |
| | margin on futures contracts | $79,297 | margin on futures contracts | $74,375 |
Effect of Derivative Instruments on the Statement of Operations for the Year Ended March 31, 2010
| | | | |
| | | | Change in Net Unrealized |
| | Net Realized Gain (Loss) | Appreciation (Depreciation) |
| Fund/Type of | Location on | | Location on | |
| Derivative | Statement of Operations | Value | Statement of Operations | Value |
| |
| Ginnie Mae | | | | |
| Interest Rate Risk | | | Change in net unrealized | |
| | Net realized gain (loss) on | | appreciation (depreciation) | |
| | futures contract transactions | $(821,149) | on futures contracts | $(32,009) |
| | | | | |
| Government Bond | | | |
| Interest Rate Risk | | | Change in net unrealized | |
| | Net realized gain (loss) on | | appreciation (depreciation) | |
| | futures contract transactions | $(971,474) | on futures contracts | $368,667 |
| | | | | |
| Inflation-Adjusted Bond | | | |
| Interest Rate Risk | | | Change in net unrealized | |
| | Net realized gain (loss) on | | appreciation (depreciation) | |
| | futures contract transactions | $(1,715,037) | on futures contracts | $ (88,674) |
| Other Contracts | | | Change in net unrealized | |
| | Net realized gain (loss) on | | appreciation (depreciation) | |
| | swap agreement transactions | — | on swap agreements | 1,763,160 |
| | | $(1,715,037) | | $1,674,486 |
| | | | | |
| Short-Term Government | | | |
| Interest Rate Risk | | | Change in net unrealized | |
| | Net realized gain (loss) on | | appreciation (depreciation) | |
| | futures contract transactions | $1,701,427 | on futures contracts | $(918,599) |
61
7. Interfund Lending
The funds, along with certain other funds in the American Century Investments family of funds, may participate in an interfund lending program, pursuant to an Exemptive Order issued by the Securities and Exchange Commission (SEC). This program provides an alternative credit facility allowing the funds to borrow from or lend to other funds in the American Century Investments family of funds that permit such transactions. Interfund lending transactions are subject to each fund’s investment policies and borrowing and lending limits. The interfund loan rate earned/paid on interfund lending transactions is determined daily based on the average of certain current market rates. Interfund lending transactions normally extend only overnight, but can have a maximum duration of seven days. The program is subject to annual approval by the Board of Trustees. During the year ended March 31, 2010, the funds did not utilize the program.
8. Federal Tax Information
The tax character of distributions paid during the years ended March 31, 2010 and March 31, 2009 were as follows:
| | | | |
| | Ginnie Mae | Government Bond |
| | 2010 | 2009 | 2010 | 2009 |
| Distributions Paid From | | | | |
| Ordinary income | $66,228,368 | $57,590,960 | $51,349,586 | $38,560,988 |
| Long-term capital gains | — | — | $4,230,697 | $4,962,874 |
| Return of capital | — | — | — | — |
| |
| | Inflation-Adjusted Bond | Short-Term Government |
| | 2010 | 2009 | 2010 | 2009 |
| Distributions Paid From | | | | |
| Ordinary income | $46,099,205 | $59,872,505 | $17,226,736 | $31,925,993 |
| Long-term capital gains | — | — | — | — |
| Return of capital | — | $11,724,258 | — | — |
The book-basis character of distributions made during the year from net investment income or net realized gains may differ from their ultimate characterization for federal income tax purposes. These differences reflect the differing character of paydown losses, certain income items and net realized gains and losses for financial statement and tax purposes, and may result in reclassification among certain capital accounts on the financial statements.
62
As of March 31, 2010, the federal tax cost of investments and the components of distributable earnings on a tax-basis were as follows:
| | | | |
| | | | Inflation-Adjusted | Short-Term |
| | Ginnie Mae | Government Bond | Bond | Government |
| Federal tax cost of investments | $1,635,250,030 | $1,182,022,286 | $3,284,905,058 | $1,055,292,270 |
| Gross tax appreciation | | | | |
| of investments | $45,374,922 | $31,405,667 | $97,315,600 | $ 6,123,515 |
| Gross tax depreciation | | | | |
| of investments | (2,100,015) | (6,090,780) | (4,278,520) | (1,013,886) |
| Net tax appreciation (depreciation) | | | | |
| of investments | $43,274,907 | $25,314,887 | $93,037,080 | $ 5,109,629 |
| Net tax appreciation (depreciation) | | | | |
| on derivatives | — | — | $(5,479,563) | — |
| Net tax appreciation (depreciation) | $43,274,907 | $25,314,887 | $87,557,517 | $5,109,629 |
| Undistributed ordinary income | $12,768 | — | $47,642,976 | $9,685 |
| Accumulated capital losses | $(38,352,481) | — | $(5,932,838) | $(9,010,242) |
| Capital loss deferrals | $(1,059,683) | $(771,968) | — | — |
The difference between book-basis and tax-basis cost and unrealized appreciation (depreciation) is attributable primarily to the tax deferral of losses on wash sales, straddle positions and the realization for tax purposes of unrealized gains (losses) for certain futures contracts.
The accumulated capital losses listed above represent net capital loss carryovers that may be used to offset future realized capital gains for federal income tax purposes. Future capital loss carryover utilization in any given year may be subject to Internal Revenue Code limitations. The capital loss carryovers expire as follows:
| | | | | | |
| | 2012 | 2013 | 2014 | 2015 | 2016 | 2017 |
| Ginnie Mae | $(8,198,327) | $(11,922,927) | $(10,878,793) | $(7,352,434) | — | — |
| Inflation-Adjusted Bond | — | — | — | $(159,657) | — | $(5,773,181) |
| Short-Term Government | — | — | $(1,404,594) | $(7,605,648) | — | — |
The capital loss deferrals listed above represent net capital losses incurred in the five-month period ended March 31, 2010. The funds have elected to treat such losses as having been incurred in the following fiscal year for federal income tax purposes.
63
9. Corporate Event
As part of a long-standing estate and business succession plan established by ACC Co-Chairman James E. Stowers, Jr., the founder of American Century Investments, ACC Co-Chairman Richard W. Brown succeeded Mr. Stowers as trustee of a trust that holds a greater-than-25% voting interest in ACC, the parent corporation of each fund’s advisor. Under the 1940 Act, this is presumed to represent control of ACC even though it is less than a majority interest. The change of trustee may technically be considered a “change of control” of ACC and therefore also a change of control of each fund’s advisor even though there has been no change to their management and none is anticipated. The “change of control” resulted in the assignment of each fund’s investment advisory agreement. Under the 1940 Act, an assignment automatically terminated such agreement, making the approval of a new agreement necessary.
On February 18, 2010, the Board of Trustees approved interim investment advisory agreements under which each fund will be managed until new agreements are approved by fund shareholders. On April 1, 2010, the Board of Trustees approved new investment advisory agreements. The interim agreements and the new agreements are substantially identical to the terminated agreements (with the exception of different effective and termination dates) and will not result in changes in the management of American Century Investments, the funds, their investment objectives, fees or services provided. The new agreements have been submitted to shareholders for approval at a Special Meeting of Shareholders to be held on June 16, 2010. Management agreements for new share classes of the funds that were launched after February 18, 2010 did not terminate, have not been replaced by interim agreements, and do not require approval of new ag reements.
10. Recently Issued Accounting Standards
In March 2008, the Financial Accounting Standards Board (FASB) issued Accounting Standards Codification (ASC) Section 815-10 (formerly Statement of Financial Accounting Standards No. 161, “Disclosures about Derivative Instruments and Hedging Activities —an amendment of FASB Statement No. 133”). ASC Section 815-10 is effective for interim periods beginning after November 15, 2008 and has been adopted by the funds. ASC Section 815-10 amends and expands disclosures about derivative instruments and hedging activities. ASC Section 815-10 requires qualitative disclosures about the objectives and strategies of derivative instruments, quantitative disclosures about the fair value amounts of and gains and losses on derivative instruments, and disclosures of credit-risk-related contingent features in hedging activities.
11. Other Tax Information (Unaudited)
The following information is provided pursuant to provisions of the Internal Revenue Code.
Government Bond hereby designates $4,230,697, or up to the maximum amount allowable, of long-term capital gain distributions, for the fiscal year ended March 31, 2010.
Government Bond hereby designates $13,020,464 of distributions as qualified short-term capital gains for purposes of Internal Revenue Code Section 871.
64
| | | | | | |
| Ginnie Mae | | | | | |
| |
| Investor Class | | | | | |
| For a Share Outstanding Throughout the Years Ended March 31 | | | |
| | | 2010 | 2009 | 2008 | 2007 | 2006 |
| Per-Share Data | | | | | |
| Net Asset Value, Beginning of Period | $10.68 | $10.40 | $10.17 | $10.11 | $10.34 |
| Income From Investment Operations | | | | | |
| Net Investment Income (Loss)(1) | 0.40 | 0.43 | 0.48 | 0.48 | 0.43 |
| Net Realized and Unrealized Gain (Loss) | 0.14 | 0.30 | 0.25 | 0.08 | (0.18) |
| Total From Investment Operations | 0.54 | 0.73 | 0.73 | 0.56 | 0.25 |
| Distributions | | | | | |
| From Net Investment Income | (0.46) | (0.45) | (0.50) | (0.50) | (0.48) |
| Net Asset Value, End of Period | $10.76 | $10.68 | $10.40 | $10.17 | $10.11 |
| |
| Total Return(2) | 5.12% | 7.22% | 7.39% | 5.69% | 2.47% |
| | | | | | |
| Ratios/Supplemental Data | | | | | |
| Ratio of Operating Expenses | | | | | |
| to Average Net Assets | 0.54%(3) | 0.53%(3) | 0.52%(3) | 0.57% | 0.57% |
| Ratio of Operating Expenses | | | | | |
| to Average Net Assets | | | | | |
| (Before Expense Waiver) | 0.56% | 0.57% | 0.57% | 0.57% | 0.57% |
| Ratio of Net Investment Income (Loss) | | | | | |
| to Average Net Assets | 3.69%(3) | 4.12%(3) | 4.73%(3) | 4.71% | 4.15% |
| Ratio of Net Investment Income (Loss) | | | | | |
| to Average Net Assets | | | | | |
| (Before Expense Waiver) | 3.67% | 4.08% | 4.68% | 4.71% | 4.15% |
| Portfolio Turnover Rate | 171% | 330% | 338% | 410% | 315% |
| Net Assets, End of Period (in thousands) | $1,414,742 | $1,336,491 | $1,179,206 | $1,219,743 | $1,382,022 |
| (1) | Computed using average shares outstanding throughout the period. | | | | |
| (2) | Total return assumes reinvestment of net investment income and capital gains distributions, if any. Total returns for periods less than one year |
| | are not annualized. Total returns are calculated based on the net asset value of the last business day. The total return of the classes may not |
| | precisely reflect the class expense differences because of the impact of calculating the net asset values to two decimal places. If net asset |
| | values were calculated to three decimal places, the total return differences would more closely reflect the class expense differences. The |
| | calculation of net asset values to two decimal places is made in accordance with SEC guidelines and does not result in any gain or loss of value |
| | between one class and another. | | | | | |
| (3) | Effective August 1, 2007, the investment advisor voluntarily agreed to waive a portion of its management fee. | | |
See Notes to Financial Statements.
65
| | | | |
| Ginnie Mae | | | |
| |
| Institutional Class | | | |
| For a Share Outstanding Throughout the Years Ended March 31 (except as noted) | | |
| | | 2010 | 2009 | 2008(1) |
| Per-Share Data | | | |
| Net Asset Value, Beginning of Period | $10.68 | $10.40 | $10.11 |
| Income From Investment Operations | | | |
| Net Investment Income (Loss)(2) | 0.42 | 0.45 | 0.25 |
| Net Realized and Unrealized Gain (Loss) | 0.14 | 0.30 | 0.30 |
| Total From Investment Operations | 0.56 | 0.75 | 0.55 |
| Distributions | | | |
| From Net Investment Income | (0.48) | (0.47) | (0.26) |
| Net Asset Value, End of Period | $10.76 | $10.68 | $10.40 |
| |
| Total Return(3) | 5.33% | 7.44% | 5.45% |
| | | | |
| Ratios/Supplemental Data | | | |
| Ratio of Operating Expenses to Average Net Assets(4) | 0.34% | 0.33% | 0.29%(5) |
| Ratio of Operating Expenses to Average Net Assets (Before Expense Waiver) | 0.36% | 0.37% | 0.37%(5) |
| Ratio of Net Investment Income (Loss) to Average Net Assets(4) | 3.89% | 4.32% | 4.86%(5) |
| Ratio of Net Investment Income (Loss) to Average Net Assets | | | |
| (Before Expense Waiver) | 3.87% | 4.28% | 4.78%(5) |
| Portfolio Turnover Rate | 171% | 330% | 338%(6) |
| Net Assets, End of Period (in thousands) | $17,971 | $8,016 | $6,143 |
| (1) | September, 28, 2007 (commencement of sale) through March 31, 2008. | | | |
| (2) | Computed using average shares outstanding throughout the period. | | | |
| (3) | Total return assumes reinvestment of net investment income and capital gains distributions, if any. Total returns for periods less than one year |
| | are not annualized. Total returns are calculated based on the net asset value of the last business day. The total return of the classes may not |
| | precisely reflect the class expense differences because of the impact of calculating the net asset values to two decimal places. If net asset |
| | values were calculated to three decimal places, the total return differences would more closely reflect the class expense differences. The |
| | calculation of net asset values to two decimal places is made in accordance with SEC guidelines and does not result in any gain or loss of value |
| | between one class and another. | | | |
| (4) | Effective August 1, 2007, the investment advisor voluntarily agreed to waive a portion of its management fee. | | |
| (5) | Annualized. | | | |
| (6) | Portfolio turnover is calculated at the fund level. Percentage indicated was calculated for the year ended March 31, 2008. | |
See Notes to Financial Statements.
66
| | | | | | |
| Ginnie Mae | | | | | |
| |
| A Class(1) | | | | | |
| For a Share Outstanding Throughout the Years Ended March 31 | | | |
| | | 2010 | 2009 | 2008 | 2007 | 2006 |
| Per-Share Data | | | | | |
| Net Asset Value, Beginning of Period | $10.68 | $10.40 | $10.17 | $10.11 | $10.34 |
| Income From Investment Operations | | | | | |
| Net Investment Income (Loss)(2) | 0.37 | 0.40 | 0.46 | 0.45 | 0.40 |
| Net Realized and Unrealized Gain (Loss) | 0.14 | 0.30 | 0.24 | 0.08 | (0.17) |
| Total From Investment Operations | 0.51 | 0.70 | 0.70 | 0.53 | 0.23 |
| Distributions | | | | | |
| From Net Investment Income | (0.43) | (0.42) | (0.47) | (0.47) | (0.46) |
| Net Asset Value, End of Period | $10.76 | $10.68 | $10.40 | $10.17 | $10.11 |
| |
| Total Return(3) | 4.86% | 6.96% | 7.12% | 5.42% | 2.22% |
| | | | | | |
| Ratios/Supplemental Data | | | | | |
| Ratio of Operating Expenses | | | | | |
| to Average Net Assets | 0.79%(4) | 0.78%(4) | 0.77%(4) | 0.82% | 0.82% |
| Ratio of Operating Expenses | | | | | |
| to Average Net Assets | | | | | |
| (Before Expense Waiver) | 0.81% | 0.82% | 0.82% | 0.82% | 0.82% |
| Ratio of Net Investment Income (Loss) | | | | | |
| to Average Net Assets | 3.44%(4) | 3.87%(4) | 4.48%(4) | 4.46% | 3.90% |
| Ratio of Net Investment Income (Loss) | | | | | |
| to Average Net Assets | | | | | |
| (Before Expense Waiver) | 3.42% | 3.83% | 4.43% | 4.46% | 3.90% |
| Portfolio Turnover Rate | 171% | 330% | 338% | 410% | 315% |
| Net Assets, End of Period (in thousands) | $158,819 | $146,874 | $95,323 | $85,984 | $73,998 |
| (1) | Prior to March 1, 2010, the A Class was referred to as the Advisor Class. | | | |
| (2) | Computed using average shares outstanding throughout the period. | | | | |
| (3) | Total return assumes reinvestment of net investment income and capital gains distributions, if any, and does not reflect applicable sales charges. |
| | Total returns for periods less than one year are not annualized. Total returns are calculated based on the net asset value of the last business day. |
| | The total return of the classes may not precisely reflect the class expense differences because of the impact of calculating the net asset values |
| | to two decimal places. If net asset values were calculated to three decimal places, the total return differences would more closely reflect the |
| | class expense differences. The calculation of net asset values to two decimal places is made in accordance with SEC guidelines and does not |
| | result in any gain or loss of value between one class and another. | | | | |
| (4) | Effective August 1, 2007, the investment advisor voluntarily agreed to waive a portion of its management fee. | | |
See Notes to Financial Statements.
67
| | |
| Ginnie Mae | |
| |
| C Class | |
| For a Share Outstanding Throughout the Years Ended March 31 (except as noted) | |
| | | 2010(1) |
| Per-Share Data | |
| Net Asset Value, Beginning of Period | $10.78 |
| Income From Investment Operations | |
| Net Investment Income (Loss)(2) | 0.02 |
| Net Realized and Unrealized Gain (Loss) | (0.01) |
| Total From Investment Operations | 0.01 |
| Distributions | |
| From Net Investment Income | (0.03) |
| Net Asset Value, End of Period | $10.76 |
| |
| Total Return(3) | 0.08% |
| | |
| Ratios/Supplemental Data | |
| Ratio of Operating Expenses to Average Net Assets | 1.54%(4)(5) |
| Ratio of Operating Expenses to Average Net Assets (Before Expense Waiver) | 1.56%(4) |
| Ratio of Net Investment Income (Loss) to Average Net Assets | 2.72%(4)(5) |
| Ratio of Net Investment Income (Loss) to Average Net Assets (Before Expense Waiver) | 2.70%(4) |
| Portfolio Turnover Rate | 171%(6) |
| Net Assets, End of Period (in thousands) | $25 |
| (1) | March 1, 2010 (commencement of sale) through March 31, 2010. | |
| (2) | Computed using average shares outstanding throughout the period. | |
| (3) | Total return assumes reinvestment of net investment income and capital gains distributions, if any, and does not reflect applicable sales charges. |
| | Total returns for periods less than one year are not annualized. Total returns are calculated based on the net asset value of the last business day. |
| | The total return of the classes may not precisely reflect the class expense differences because of the impact of calculating the net asset values |
| | to two decimal places. If net asset values were calculated to three decimal places, the total return differences would more closely reflect the |
| | class expense differences. The calculation of net asset values to two decimal places is made in accordance with SEC guidelines and does not |
| | result in any gain or loss of value between one class and another. | |
| (4) | Annualized. | |
| (5) | Effective August 1, 2007, the investment advisor voluntarily agreed to waive a portion of its management fee. | |
| (6) | Portfolio turnover is calculated at the fund level. Percentage indicated was calculated for the year ended March 31, 2010. | |
See Notes to Financial Statements.
68
| | | | |
| Ginnie Mae | | | |
| |
| R Class | | | |
| For a Share Outstanding Throughout the Years Ended March 31 (except as noted) | | |
| | | 2010 | 2009 | 2008(1) |
| Per-Share Data | | | |
| Net Asset Value, Beginning of Period | $10.68 | $10.40 | $10.11 |
| Income From Investment Operations | | | |
| Net Investment Income (Loss)(2) | 0.34 | 0.36 | 0.22 |
| Net Realized and Unrealized Gain (Loss) | 0.14 | 0.32 | 0.29 |
| Total From Investment Operations | 0.48 | 0.68 | 0.51 |
| Distributions | | | |
| From Net Investment Income | (0.40) | (0.40) | (0.22) |
| Net Asset Value, End of Period | $10.76 | $10.68 | $10.40 |
| |
| Total Return(3) | 4.58% | 6.69% | 5.09% |
| | | | |
| Ratios/Supplemental Data | | | |
| Ratio of Operating Expenses to Average Net Assets(4) | 1.04% | 1.03% | 0.99%(5) |
| Ratio of Operating Expenses to Average Net Assets (Before Expense Waiver) | 1.06% | 1.07% | 1.07%(5) |
| Ratio of Net Investment Income (Loss) to Average Net Assets(4) | 3.19% | 3.62% | 4.19%(5) |
| Ratio of Net Investment Income (Loss) to Average Net Assets | | | |
| (Before Expense Waiver) | 3.17% | 3.58% | 4.11%(5) |
| Portfolio Turnover Rate | 171% | 330% | 338%(6) |
| Net Assets, End of Period (in thousands) | $1,820 | $556 | $26 |
| (1) | September 28, 2007 (commencement of sale) through March 31, 2008. | | | |
| (2) | Computed using average shares outstanding throughout the period. | | | |
| (3) | Total return assumes reinvestment of net investment income and capital gains distributions, if any. Total returns for periods less than one year |
| | are not annualized. Total returns are calculated based on the net asset value of the last business day. The total return of the classes may not |
| | precisely reflect the class expense differences because of the impact of calculating the net asset values to two decimal places. If net asset |
| | values were calculated to three decimal places, the total return differences would more closely reflect the class expense differences. The |
| | calculation of net asset values to two decimal places is made in accordance with SEC guidelines and does not result in any gain or loss of value |
| | between one class and another. | | | |
| (4) | Effective August 1, 2007, the investment advisor voluntarily agreed to waive a portion of its management fee. | | |
| (5) | Annualized. | | | |
| (6) | Portfolio turnover is calculated at the fund level. Percentage indicated was calculated for the year ended March 31, 2008. | |
See Notes to Financial Statements.
69
| | | | | | |
| Government Bond | | | | | |
| |
| Investor Class | | | | | |
| For a Share Outstanding Throughout the Years Ended March 31 | | | |
| | | 2010 | 2009 | 2008 | 2007 | 2006 |
| Per-Share Data | | | | | |
| Net Asset Value, Beginning of Period | $11.26 | $11.05 | $10.45 | $10.33 | $10.52 |
| Income From Investment Operations | | | | | |
| Net Investment Income (Loss)(1) | 0.37 | 0.39 | 0.47 | 0.48 | 0.42 |
| Net Realized and Unrealized Gain (Loss) | (0.07) | 0.34 | 0.60 | 0.12 | (0.19) |
| Total From Investment Operations | 0.30 | 0.73 | 1.07 | 0.60 | 0.23 |
| Distributions | | | | | |
| From Net Investment Income | (0.38) | (0.40) | (0.47) | (0.48) | (0.42) |
| From Net Realized Gains | (0.16) | (0.12) | — | — | — |
| Total Distributions | (0.54) | (0.52) | (0.47) | (0.48) | (0.42) |
| Net Asset Value, End of Period | $11.02 | $11.26 | $11.05 | $10.45 | $10.33 |
| |
| Total Return(2) | 2.77% | 6.90% | 10.58% | 5.95% | 2.17% |
| | | | | | |
| Ratios/Supplemental Data | | | | | |
| Ratio of Operating Expenses | | | | | |
| to Average Net Assets | 0.48% | 0.49% | 0.49% | 0.49% | 0.49% |
| Ratio of Net Investment Income (Loss) | | | | | |
| to Average Net Assets | 3.28% | 3.58% | 4.45% | 4.60% | 3.94% |
| Portfolio Turnover Rate | 124% | 335% | 239% | 319% | 416% |
| Net Assets, End of Period (in thousands) | $988,435 | $895,833 | $662,104 | $500,331 | $524,557 |
| (1) | Computed using average shares outstanding throughout the period. | | | | |
| (2) | Total return assumes reinvestment of net investment income and capital gains distributions, if any. Total returns for periods less than one year |
| | are not annualized. Total returns are calculated based on the net asset value of the last business day. The total return of the classes may not |
| | precisely reflect the class expense differences because of the impact of calculating the net asset values to two decimal places. If net asset |
| | values were calculated to three decimal places, the total return differences would more closely reflect the class expense differences. The |
| | calculation of net asset values to two decimal places is made in accordance with SEC guidelines and does not result in any gain or loss of value |
| | between one class and another. | | | | | |
See Notes to Financial Statements.
70
| | |
| Government Bond | |
| |
| Institutional Class | |
| For a Share Outstanding Throughout the Years Ended March 31 (except as noted) | |
| | | 2010(1) |
| Per-Share Data | |
| Net Asset Value, Beginning of Period | $11.07 |
| Income From Investment Operations | |
| Net Investment Income (Loss)(2) | 0.03 |
| Net Realized and Unrealized Gain (Loss) | (0.06) |
| Total From Investment Operations | (0.03) |
| Distributions | |
| From Net Investment Income | (0.03) |
| Net Asset Value, End of Period | $11.01 |
| |
| Total Return(3) | (0.26)% |
| | |
| Ratios/Supplemental Data | |
| Ratio of Operating Expenses to Average Net Assets | 0.28%(4) |
| Ratio of Net Investment Income (Loss) to Average Net Assets | 3.33%(4) |
| Portfolio Turnover Rate | 124%(5) |
| Net Assets, End of Period (in thousands) | $25 |
| (1) | March 1, 2010 (commencement of sale) through March 31, 2010. | |
| (2) | Computed using average shares outstanding throughout the period. | |
| (3) | Total return assumes reinvestment of net investment income and capital gains distributions, if any. Total returns for periods less than one year |
| | are not annualized. Total returns are calculated based on the net asset value of the last business day. The total return of the classes may not |
| | precisely reflect the class expense differences because of the impact of calculating the net asset values to two decimal places. If net asset |
| | values were calculated to three decimal places, the total return differences would more closely reflect the class expense differences. The |
| | calculation of net asset values to two decimal places is made in accordance with SEC guidelines and does not result in any gain or loss of value |
| | between one class and another. | |
| (4) | Annualized. | |
| (5) | Portfolio turnover is calculated at the fund level. Percentage indicated was calculated for the year ended March 31, 2010. | |
See Notes to Financial Statements.
71
| | | | | | |
| Government Bond | | | | | |
| |
| A Class(1) | | | | | |
| For a Share Outstanding Throughout the Years Ended March 31 | | | |
| | | 2010 | 2009 | 2008 | 2007 | 2006 |
| Per-Share Data | | | | | |
| Net Asset Value, Beginning of Period | $11.26 | $11.05 | $10.45 | $10.33 | $10.52 |
| Income From Investment Operations | | | | | |
| Net Investment Income (Loss)(2) | 0.34 | 0.36 | 0.44 | 0.45 | 0.39 |
| Net Realized and Unrealized Gain (Loss) | (0.07) | 0.35 | 0.61 | 0.12 | (0.19) |
| Total From Investment Operations | 0.27 | 0.71 | 1.05 | 0.57 | 0.20 |
| Distributions | | | | | |
| From Net Investment Income | (0.35) | (0.38) | (0.45) | (0.45) | (0.39) |
| From Net Realized Gains | (0.16) | (0.12) | — | — | — |
| Total Distributions | (0.51) | (0.50) | (0.45) | (0.45) | (0.39) |
| Net Asset Value, End of Period | $11.02 | $11.26 | $11.05 | $10.45 | $10.33 |
| |
| Total Return(3) | 2.52% | 6.64% | 10.31% | 5.69% | 1.91% |
| | | | | | |
| Ratios/Supplemental Data | | | | | |
| Ratio of Operating Expenses | | | | | |
| to Average Net Assets | 0.73% | 0.74% | 0.74% | 0.74% | 0.74% |
| Ratio of Net Investment Income (Loss) | | | | | |
| to Average Net Assets | 3.03% | 3.33% | 4.20% | 4.35% | 3.69% |
| Portfolio Turnover Rate | 124% | 335% | 239% | 319% | 416% |
| Net Assets, End of Period (in thousands) | $191,437 | $189,956 | $105,512 | $40,671 | $41,336 |
| (1) | Prior to March 1, 2010, the A Class was referred to as the Advisor Class. | | | |
| (2) | Computed using average shares outstanding throughout the period. | | | | |
| (3) | Total return assumes reinvestment of net investment income and capital gains distributions, if any, and does not reflect applicable sales charges. |
| | Total returns for periods less than one year are not annualized. Total returns are calculated based on the net asset value of the last business day. |
| | The total return of the classes may not precisely reflect the class expense differences because of the impact of calculating the net asset values |
| | to two decimal places. If net asset values were calculated to three decimal places, the total return differences would more closely reflect the |
| | class expense differences. The calculation of net asset values to two decimal places is made in accordance with SEC guidelines and does not |
| | result in any gain or loss of value between one class and another. | | | | |
See Notes to Financial Statements.
72
| | |
| Government Bond | |
| |
| C Class | |
| For a Share Outstanding Throughout the Years Ended March 31 (except as noted) | |
| | | 2010(1) |
| Per-Share Data | |
| Net Asset Value, Beginning of Period | $11.07 |
| Income From Investment Operations | |
| Net Investment Income (Loss)(2) | 0.02 |
| Net Realized and Unrealized Gain (Loss) | (0.06) |
| Total From Investment Operations | (0.04) |
| Distributions | |
| From Net Investment Income | (0.02) |
| Net Asset Value, End of Period | $11.01 |
| |
| Total Return(3) | (0.36)% |
| | |
| Ratios/Supplemental Data | |
| Ratio of Operating Expenses to Average Net Assets | 1.48%(4) |
| Ratio of Net Investment Income (Loss) to Average Net Assets | 2.13%(4) |
| Portfolio Turnover Rate | 124%(5) |
| Net Assets, End of Period (in thousands) | $44 |
| (1) | March 1, 2010 (commencement of sale) through March 31, 2010. | |
| (2) | Computed using average shares outstanding throughout the period. | |
| (3) | Total return assumes reinvestment of net investment income and capital gains distributions, if any, and does not reflect applicable sales charges. |
| | Total returns for periods less than one year are not annualized. Total returns are calculated based on the net asset value of the last business day. |
| | The total return of the classes may not precisely reflect the class expense differences because of the impact of calculating the net asset values |
| | to two decimal places. If net asset values were calculated to three decimal places, the total return differences would more closely reflect the |
| | class expense differences. The calculation of net asset values to two decimal places is made in accordance with SEC guidelines and does not |
| | result in any gain or loss of value between one class and another. | |
| (4) | Annualized. | |
| (5) | Portfolio turnover is calculated at the fund level. Percentage indicated was calculated for the year ended March 31, 2010. | |
See Notes to Financial Statements.
73
| | |
| Government Bond | |
| |
| R Class | |
| For a Share Outstanding Throughout the Years Ended March 31 (except as noted) | |
| | | 2010(1) |
| Per-Share Data | |
| Net Asset Value, Beginning of Period | $11.07 |
| Income From Investment Operations | |
| Net Investment Income (Loss)(2) | 0.02 |
| Net Realized and Unrealized Gain (Loss) | (0.05) |
| Total From Investment Operations | (0.03) |
| Distributions | |
| From Net Investment Income | (0.03) |
| Net Asset Value, End of Period | 11.01 |
| |
| Total Return(3) | (0.32)% |
| | |
| Ratios/Supplemental Data | |
| Ratio of Operating Expenses to Average Net Assets | 0.98%(4) |
| Ratio of Net Investment Income (Loss) to Average Net Assets | 2.63%(4) |
| Portfolio Turnover Rate | 124%(5) |
| Net Assets, End of Period (in thousands) | $25 |
| (1) | March 1, 2010 (commencement of sale) through March 31, 2010. | |
| (2) | Computed using average shares outstanding throughout the period. | |
| (3) | Total return assumes reinvestment of net investment income and capital gains distributions, if any. Total returns for periods less than one year |
| | are not annualized. Total returns are calculated based on the net asset value of the last business day. The total return of the classes may not |
| | precisely reflect the class expense differences because of the impact of calculating the net asset values to two decimal places. If net asset |
| | values were calculated to three decimal places, the total return differences would more closely reflect the class expense differences. The |
| | calculation of net asset values to two decimal places is made in accordance with SEC guidelines and does not result in any gain or loss of value |
| | between one class and another. | |
| (4) | Annualized. | |
| (5) | Portfolio turnover is calculated at the fund level. Percentage indicated was calculated for the year ended March 31, 2010. | |
See Notes to Financial Statements.
74
| | | | | | |
| Inflation-Adjusted Bond | | | | |
| |
| Investor Class | | | | | |
| For a Share Outstanding Throughout the Years Ended March 31 | | | |
| | | 2010 | 2009 | 2008 | 2007 | 2006 |
| Per-Share Data | | | | | |
| Net Asset Value, Beginning of Period | $11.06 | $11.72 | $10.83 | $10.73 | $11.25 |
| Income From Investment Operations | | | | | |
| Net Investment Income (Loss) | 0.40(1) | 0.17(1) | 0.62(1) | 0.38 | 0.56 |
| Net Realized and Unrealized Gain (Loss) | 0.24 | (0.35) | 0.85 | 0.11 | (0.49) |
| Total From Investment Operations | 0.64 | (0.18) | 1.47 | 0.49 | 0.07 |
| Distributions | | | | | |
| From Net Investment Income | (0.18) | (0.40) | (0.58) | (0.38) | (0.56) |
| From Net Realized Gains | — | — | — | — | (0.03) |
| From Tax Return of Capital | — | (0.08) | — | (0.01) | — |
| Total Distributions | (0.18) | (0.48) | (0.58) | (0.39) | (0.59) |
| Net Asset Value, End of Period | $11.52 | $11.06 | $11.72 | $10.83 | $10.73 |
| |
| Total Return(2) | 5.76% | (1.51)% | 14.08% | 4.71% | 0.56% |
| | | | | | |
| Ratios/Supplemental Data | | | | | |
| Ratio of Operating Expenses | | | | | |
| to Average Net Assets | 0.48% | 0.49% | 0.49% | 0.49% | 0.49% |
| Ratio of Net Investment Income (Loss) | | | | | |
| to Average Net Assets | 3.49% | 1.61% | 5.66% | 3.79% | 4.85% |
| Portfolio Turnover Rate | 27% | 18% | 33% | 32% | 27% |
| Net Assets, End of Period (in thousands) | $2,266,660 | $1,187,202 | $892,596 | $590,530 | $704,447 |
| (1) | Computed using average shares outstanding throughout the period. | | | | |
| (2) | Total return assumes reinvestment of net investment income and capital gains distributions, if any. Total returns for periods less than one year |
| | are not annualized. Total returns are calculated based on the net asset value of the last business day. The total return of the classes may not |
| | precisely reflect the class expense differences because of the impact of calculating the net asset values to two decimal places. If net asset |
| | values were calculated to three decimal places, the total return differences would more closely reflect the class expense differences. The |
| | calculation of net asset values to two decimal places is made in accordance with SEC guidelines and does not result in any gain or loss of value |
| | between one class and another. | | | | | |
See Notes to Financial Statements.
75
| | | | | | |
| Inflation-Adjusted Bond | | | | |
| |
| Institutional Class | | | | | |
| For a Share Outstanding Throughout the Years Ended March 31 | | | |
| | | 2010 | 2009 | 2008 | 2007 | 2006 |
| Per-Share Data | | | | | |
| Net Asset Value, Beginning of Period | $11.06 | $11.71 | $10.82 | $10.73 | $11.25 |
| Income From Investment Operations | | | | | |
| Net Investment Income (Loss) | 0.41(1) | 0.16(1) | 0.64(1) | 0.42 | 0.58 |
| Net Realized and Unrealized Gain (Loss) | 0.25 | (0.32) | 0.85 | 0.09 | (0.49) |
| Total From Investment Operations | 0.66 | (0.16) | 1.49 | 0.51 | 0.09 |
| Distributions | | | | | |
| From Net Investment Income | (0.20) | (0.41) | (0.60) | (0.42) | (0.58) |
| From Net Realized Gains | — | — | — | — | (0.03) |
| From Tax Return of Capital | — | (0.08) | — | — | — |
| Total Distributions | (0.20) | (0.49) | (0.60) | (0.42) | (0.61) |
| Net Asset Value, End of Period | $11.52 | $11.06 | $11.71 | $10.82 | $10.73 |
| |
| Total Return(2) | 5.98% | (1.32)% | 14.31% | 4.92% | 0.77% |
| | | | | | |
| Ratios/Supplemental Data | | | | | |
| Ratio of Operating Expenses | | | | | |
| to Average Net Assets | 0.28% | 0.29% | 0.29% | 0.29% | 0.29% |
| Ratio of Net Investment Income (Loss) | | | | | |
| to Average Net Assets | 3.69% | 1.81% | 5.86% | 3.99% | 5.05% |
| Portfolio Turnover Rate | 27% | 18% | 33% | 32% | 27% |
| Net Assets, End of Period (in thousands) | $407,799 | $210,177 | $165,872 | $118,250 | $81,860 |
| (1) | Computed using average shares outstanding throughout the period. | | | | |
| (2) | Total return assumes reinvestment of net investment income and capital gains distributions, if any. Total returns for periods less than one year |
| | are not annualized. Total returns are calculated based on the net asset value of the last business day. The total return of the classes may not |
| | precisely reflect the class expense differences because of the impact of calculating the net asset values to two decimal places. If net asset |
| | values were calculated to three decimal places, the total return differences would more closely reflect the class expense differences. The |
| | calculation of net asset values to two decimal places is made in accordance with SEC guidelines and does not result in any gain or loss of value |
| | between one class and another. | | | | | |
See Notes to Financial Statements.
76
| | | | | | |
| Inflation-Adjusted Bond | | | | |
| |
| A Class(1) | | | | | |
| For a Share Outstanding Throughout the Years Ended March 31 | | | |
| | | 2010 | 2009 | 2008 | 2007 | 2006 |
| Per-Share Data | | | | | |
| Net Asset Value, Beginning of Period | $11.03 | $11.70 | $10.81 | $10.73 | $11.25 |
| Income From Investment Operations | | | | | |
| Net Investment Income (Loss) | 0.37(2) | 0.18(2) | 0.60(2) | 0.36 | 0.54 |
| Net Realized and Unrealized Gain (Loss) | 0.24 | (0.38) | 0.84 | 0.10 | (0.49) |
| Total From Investment Operations | 0.61 | (0.20) | 1.44 | 0.46 | 0.05 |
| Distributions | | | | | |
| From Net Investment Income | (0.15) | (0.39) | (0.55) | (0.36) | (0.54) |
| From Net Realized Gains | — | — | — | — | (0.03) |
| From Tax Return of Capital | — | (0.08) | — | (0.02) | — |
| Total Distributions | (0.15) | (0.47) | (0.55) | (0.38) | (0.57) |
| Net Asset Value, End of Period | $11.49 | $11.03 | $11.70 | $10.81 | $10.73 |
| |
| Total Return(3) | 5.52% | (1.73)% | 13.83% | 4.37% | 0.37% |
| | | | | | |
| Ratios/Supplemental Data | | | | | |
| Ratio of Operating Expenses | | | | | |
| to Average Net Assets | 0.73% | 0.74% | 0.74% | 0.74% | 0.74% |
| Ratio of Net Investment Income (Loss) | | | | | |
| to Average Net Assets | 3.24% | 1.36% | 5.41% | 3.54% | 4.60% |
| Portfolio Turnover Rate | 27% | 18% | 33% | 32% | 27% |
| Net Assets, End of Period (in thousands) | $709,931 | $500,882 | $488,645 | $419,477 | $588,877 |
| (1) | Prior to March 1, 2010, the A Class was referred to as the Advisor Class. | | | |
| (2) | Computed using average shares outstanding throughout the period. | | | | |
| (3) | Total return assumes reinvestment of net investment income and capital gains distributions, if any, and does not reflect applicable sales charges. |
| | Total returns for periods less than one year are not annualized. Total returns are calculated based on the net asset value of the last business day. |
| | The total return of the classes may not precisely reflect the class expense differences because of the impact of calculating the net asset values |
| | to two decimal places. If net asset values were calculated to three decimal places, the total return differences would more closely reflect the |
| | class expense differences. The calculation of net asset values to two decimal places is made in accordance with SEC guidelines and does not |
| | result in any gain or loss of value between one class and another. | | | | |
See Notes to Financial Statements.
77
| | |
| Inflation-Adjusted Bond | |
| |
| C Class | |
| For a Share Outstanding Throughout the Years Ended March 31 (except as noted) | |
| | | 2010(1) |
| Per-Share Data | |
| Net Asset Value, Beginning of Period | $11.51 |
| Income From Investment Operations | |
| Net Investment Income (Loss)(2) | 0.03 |
| Net Realized and Unrealized Gain (Loss) | (0.03) |
| Total From Investment Operations | — |
| Net Asset Value, End of Period | $11.51 |
| |
| Total Return(3) | 0.00% |
| | |
| Ratios/Supplemental Data | |
| Ratio of Operating Expenses to Average Net Assets | 1.48%(4) |
| Ratio of Net Investment Income (Loss) to Average Net Assets | 3.67%(4) |
| Portfolio Turnover Rate | 27%(5) |
| Net Assets, End of Period (in thousands) | $139 |
| (1) | March 1, 2010 (commencement of sale) through March 31, 2010. | |
| (2) | Computed using average shares outstanding throughout the period. | |
| (3) | Total return assumes reinvestment of net investment income and capital gains distributions, if any, and does not reflect applicable sales charges. |
| | Total returns for periods less than one year are not annualized. Total returns are calculated based on the net asset value of the last business day. |
| | The total return of the classes may not precisely reflect the class expense differences because of the impact of calculating the net asset values |
| | to two decimal places. If net asset values were calculated to three decimal places, the total return differences would more closely reflect the |
| | class expense differences. The calculation of net asset values to two decimal places is made in accordance with SEC guidelines and does not |
| | result in any gain or loss of value between one class and another. | |
| (4) | Annualized. | |
| (5) | Portfolio turnover is calculated at the fund level. Percentage indicated was calculated for the year ended March 31, 2010. | |
See Notes to Financial Statements.
78
| | |
| Inflation-Adjusted Bond | |
| |
| R Class | |
| For a Share Outstanding Throughout the Years Ended March 31 (except as noted) | |
| | | 2010(1) |
| Per-Share Data | |
| Net Asset Value, Beginning of Period | $11.51 |
| Income From Investment Operations | |
| Net Investment Income (Loss)(2) | 0.04 |
| Net Realized and Unrealized Gain (Loss) | (0.03) |
| Total From Investment Operations | 0.01 |
| Net Asset Value, End of Period | $11.52 |
| |
| Total Return(3) | 0.09% |
| | |
| Ratios/Supplemental Data | |
| Ratio of Operating Expenses to Average Net Assets | 0.98%(4) |
| Ratio of Net Investment Income (Loss) to Average Net Assets | 4.17%(4) |
| Portfolio Turnover Rate | 27%(5) |
| Net Assets, End of Period (in thousands) | $25 |
| (1) | March 1, 2010 (commencement of sale) through March 31, 2010. | |
| (2) | Computed using average shares outstanding throughout the period. | |
| (3) | Total return assumes reinvestment of net investment income and capital gains distributions, if any. Total returns for periods less than one year |
| | are not annualized. Total returns are calculated based on the net asset value of the last business day. The total return of the classes may not |
| | precisely reflect the class expense differences because of the impact of calculating the net asset values to two decimal places. If net asset |
| | values were calculated to three decimal places, the total return differences would more closely reflect the class expense differences. The |
| | calculation of net asset values to two decimal places is made in accordance with SEC guidelines and does not result in any gain or loss of value |
| | between one class and another. | |
| (4) | Annualized. | |
| (5) | Portfolio turnover is calculated at the fund level. Percentage indicated was calculated for the year ended March 31, 2010. | |
See Notes to Financial Statements.
79
| | | | | | |
| Short-Term Government | | | | |
| |
| Investor Class | | | | | |
| For a Share Outstanding Throughout the Years Ended March 31 | | | |
| | | 2010 | 2009 | 2008 | 2007 | 2006 |
| Per-Share Data | | | | | |
| Net Asset Value, Beginning of Period | $9.66 | $9.65 | $9.37 | $9.32 | $9.44 |
| Income From Investment Operations | | | | | |
| Net Investment Income (Loss)(1) | 0.15 | 0.29 | 0.40 | 0.40 | 0.32 |
| Net Realized and Unrealized Gain (Loss) | 0.07 | 0.01 | 0.29 | 0.06 | (0.11) |
| Total From Investment Operations | 0.22 | 0.30 | 0.69 | 0.46 | 0.21 |
| Distributions | | | | | |
| From Net Investment Income | (0.16) | (0.29) | (0.41) | (0.41) | (0.33) |
| Net Asset Value, End of Period | $9.72 | $9.66 | $9.65 | $9.37 | $9.32 |
| |
| Total Return(2) | 2.25% | 3.17% | 7.50% | 5.02% | 2.22% |
| | | | | | |
| Ratios/Supplemental Data | | | | | |
| Ratio of Operating Expenses | | | | | |
| to Average Net Assets | 0.56% | 0.57% | 0.57% | 0.57% | 0.57% |
| Ratio of Net Investment Income (Loss) | | | | | |
| to Average Net Assets | 1.57% | 2.99% | 4.23% | 4.34% | 3.41% |
| Portfolio Turnover Rate | 158% | 142% | 148% | 210% | 292% |
| Net Assets, End of Period (in thousands) | $991,464 | $971,230 | $1,105,947 | $937,029 | $919,295 |
| (1) | Computed using average shares outstanding throughout the period. | | | | |
| (2) | Total return assumes reinvestment of net investment income and capital gains distributions, if any. Total returns for periods less than one year |
| | are not annualized. Total returns are calculated based on the net asset value of the last business day. The total return of the classes may not |
| | precisely reflect the class expense differences because of the impact of calculating the net asset values to two decimal places. If net asset |
| | values were calculated to three decimal places, the total return differences would more closely reflect the class expense differences. The |
| | calculation of net asset values to two decimal places is made in accordance with SEC guidelines and does not result in any gain or loss of value |
| | between one class and another. | | | | | |
See Notes to Financial Statements.
80
| | |
| Short-Term Government | |
| |
| Institutional Class | |
| For a Share Outstanding Throughout the Years Ended March 31 (except as noted) | |
| | | 2010(1) |
| Per-Share Data | |
| Net Asset Value, Beginning of Period | $9.76 |
| Income From Investment Operations | |
| Net Investment Income (Loss)(2) | 0.01 |
| Net Realized and Unrealized Gain (Loss) | (0.03) |
| Total From Investment Operations | (0.02) |
| Distributions | |
| From Net Investment Income | (0.01) |
| Net Asset Value, End of Period | $9.73 |
| |
| Total Return(3) | (0.20)% |
| | |
| Ratios/Supplemental Data | |
| Ratio of Operating Expenses to Average Net Assets | 0.36%(4) |
| Ratio of Net Investment Income (Loss) to Average Net Assets | 1.33%(4) |
| Portfolio Turnover Rate | 158%(5) |
| Net Assets, End of Period (in thousands) | $25 |
| (1) | March 1, 2010 (commencement of sale) through March 31, 2010. | |
| (2) | Computed using average shares outstanding throughout the period. | |
| (3) | Total return assumes reinvestment of net investment income and capital gains distributions, if any. Total returns for periods less than one year |
| | are not annualized. Total returns are calculated based on the net asset value of the last business day. The total return of the classes may not |
| | precisely reflect the class expense differences because of the impact of calculating the net asset values to two decimal places. If net asset |
| | values were calculated to three decimal places, the total return differences would more closely reflect the class expense differences. The |
| | calculation of net asset values to two decimal places is made in accordance with SEC guidelines and does not result in any gain or loss of value |
| | between one class and another. | |
| (4) | Annualized. | |
| (5) | Portfolio turnover is calculated at the fund level. Percentage indicated was calculated for the year ended March 31, 2010. | |
See Notes to Financial Statements.
81
| | | | | | |
| Short-Term Government | | | | |
| |
| A Class(1) | | | | | |
| For a Share Outstanding Throughout the Years Ended March 31 | | | |
| | | 2010 | 2009 | 2008 | 2007 | 2006 |
| Per-Share Data | | | | | |
| Net Asset Value, Beginning of Period | $9.66 | $9.65 | $9.37 | $9.32 | $9.44 |
| Income From Investment Operations | | | | | |
| Net Investment Income (Loss)(2) | 0.13 | 0.24 | 0.38 | 0.38 | 0.29 |
| Net Realized and Unrealized Gain (Loss) | 0.06 | 0.03 | 0.28 | 0.05 | (0.11) |
| Total From Investment Operations | 0.19 | 0.27 | 0.66 | 0.43 | 0.18 |
| Distributions | | | | | |
| From Net Investment Income | (0.13) | (0.26) | (0.38) | (0.38) | (0.30) |
| Net Asset Value, End of Period | $9.72 | $9.66 | $9.65 | $9.37 | $9.32 |
| |
| Total Return(3) | 2.00% | 2.91% | 7.23% | 4.76% | 1.96% |
| | | | | | |
| Ratios/Supplemental Data | | | | | |
| Ratio of Operating Expenses | | | | | |
| to Average Net Assets | 0.81% | 0.82% | 0.82% | 0.82% | 0.82% |
| Ratio of Net Investment Income (Loss) | | | | | |
| to Average Net Assets | 1.32% | 2.74% | 3.98% | 4.09% | 3.16% |
| Portfolio Turnover Rate | 158% | 142% | 148% | 210% | 292% |
| Net Assets, End of Period (in thousands) | $74,654 | $65,170 | $32,379 | $27,541 | $29,166 |
| (1) | Prior to March 1, 2010, the A Class was referred to as the Advisor Class. | | | |
| (2) | Computed using average shares outstanding throughout the period. | | | | |
| (3) | Total return assumes reinvestment of net investment income and capital gains distributions, if any, and does not reflect applicable sales charges. |
| | Total returns for periods less than one year are not annualized. Total returns are calculated based on the net asset value of the last business day. |
| | The total return of the classes may not precisely reflect the class expense differences because of the impact of calculating the net asset values |
| | to two decimal places. If net asset values were calculated to three decimal places, the total return differences would more closely reflect the |
| | class expense differences. The calculation of net asset values to two decimal places is made in accordance with SEC guidelines and does not |
| | result in any gain or loss of value between one class and another. | | | | |
See Notes to Financial Statements.
82
| | |
| Short-Term Government | |
| |
| C Class | |
| For a Share Outstanding Throughout the Years Ended March 31 (except as noted) | |
| | | 2010(1) |
| Per-Share Data | |
| Net Asset Value, Beginning of Period | $9.76 |
| Income From Investment Operations | |
| Net Investment Income (Loss)(2) | —(3) |
| Net Realized and Unrealized Gain (Loss) | (0.03) |
| Total From Investment Operations | (0.03) |
| Distributions | |
| From Net Investment Income | —(3) |
| Net Asset Value, End of Period | $9.73 |
| |
| Total Return(4) | (0.30)% |
| | |
| Ratios/Supplemental Data | |
| Ratio of Operating Expenses to Average Net Assets | 1.56%(5) |
| Ratio of Net Investment Income (Loss) to Average Net Assets | 0.13%(5) |
| Portfolio Turnover Rate | 158%(6) |
| Net Assets, End of Period (in thousands) | $25 |
| (1) | March 1, 2010 (commencement of sale) through March 31, 2010. | |
| (2) | Computed using average shares outstanding throughout the period. | |
| (3) | Per-share amount was less than $0.005. | |
| (4) | Total return assumes reinvestment of net investment income and capital gains distributions, if any, and does not reflect applicable sales charges. |
| | Total returns for periods less than one year are not annualized. Total returns are calculated based on the net asset value of the last business day. |
| | The total return of the classes may not precisely reflect the class expense differences because of the impact of calculating the net asset values |
| | to two decimal places. If net asset values were calculated to three decimal places, the total return differences would more closely reflect the |
| | class expense differences. The calculation of net asset values to two decimal places is made in accordance with SEC guidelines and does not |
| | result in any gain or loss of value between one class and another. | |
| (5) | Annualized. | |
| (6) | Portfolio turnover is calculated at the fund level. Percentage indicated was calculated for the year ended March 31, 2010. | |
See Notes to Financial Statements.
83
| | |
| Short-Term Government | |
| |
| R Class | |
| For a Share Outstanding Throughout the Years Ended March 31 (except as noted) | |
| | | 2010(1) |
| Per-Share Data | |
| Net Asset Value, Beginning of Period | $9.76 |
| Income From Investment Operations | |
| Net Investment Income (Loss)(2) | 0.01 |
| Net Realized and Unrealized Gain (Loss) | (0.03) |
| Total From Investment Operations | (0.02) |
| Distributions | |
| From Net Investment Income | (0.01) |
| Net Asset Value, End of Period | $9.73 |
| |
| Total Return(3) | (0.26)% |
| | |
| Ratios/Supplemental Data | |
| Ratio of Operating Expenses to Average Net Assets | 1.06%(4) |
| Ratio of Net Investment Income (Loss) to Average Net Assets | 0.63%(4) |
| Portfolio Turnover Rate | 158%(5) |
| Net Assets, End of Period (in thousands) | $25 |
| (1) | March 1, 2010 (commencement of sale) through March 31, 2010. | |
| (2) | Computed using average shares outstanding throughout the period. | |
| (3) | Total return assumes reinvestment of net investment income and capital gains distributions, if any. Total returns for periods less than one year |
| | are not annualized. Total returns are calculated based on the net asset value of the last business day. The total return of the classes may not |
| | precisely reflect the class expense differences because of the impact of calculating the net asset values to two decimal places. If net asset |
| | values were calculated to three decimal places, the total return differences would more closely reflect the class expense differences. The |
| | calculation of net asset values to two decimal places is made in accordance with SEC guidelines and does not result in any gain or loss of value |
| | between one class and another. | |
| (4) | Annualized. | |
| (5) | Portfolio turnover is calculated at the fund level. Percentage indicated was calculated for the year ended March 31, 2010. | |
See Notes to Financial Statements.
84
|
| Report of Independent Registered Public Accounting Firm |
To the Trustees of the American Century Government Income Trust and Shareholders of the Ginnie Mae Fund, the Government Bond Fund, the Inflation-Adjusted Bond Fund, and the Short-Term Government Fund:
In our opinion, the accompanying statements of assets and liabilities, including the schedules of investments, and the related statements of operations and of changes in net assets and the financial highlights present fairly, in all material respects, the financial position of the Ginnie Mae Fund, the Government Bond Fund, the Inflation-Adjusted Bond Fund, and the Short-Term Government Fund (four of the five funds comprising the American Century Government Income Trust; hereafter referred to as the “Funds”) at March 31, 2010, the results of each of their operations for the year then ended, the changes in each of their net assets for each of the two years in the period then ended and the financial highlights for each of the periods presented, in conformity with accounting principles generally accepted in the United States of America. These financial statements and financial highlights (hereafter referred to as “financial statements”) are the responsibility of the Funds’ management; our responsibility is to express an opinion on these financial statements based on our audits. We conducted our audits of these financial statements in accordance with the standards of the Public Company Accounting Oversight Board (United States). Those standards require that we plan and perform the audit to obtain reasonable assurance about whether the financial statements are free of material misstatement. An audit includes examining, on a test basis, evidence supporting the amounts and disclosures in the financial statements, assessing the accounting principles used and significant estimates made by management, and evaluating the overall financial statement presentation. We believe that our audits, which included confirmation of securities at March 31, 2010 by correspondence with the custodian and brokers, provide a reasonable basis for our opinion.
PricewaterhouseCoopers LLP
Kansas City, Missouri
May 21, 2010
85
The Board of Trustees
The individuals listed below serve as trustees of the funds. Each trustee will continue to serve in this capacity until death, retirement, resignation or removal from office. The mandatory retirement age for trustees who are not “interested persons,” as that term is defined in the Investment Company Act (independent trustees), is 73. However, the mandatory retirement age may be extended for a period not to exceed two years with the approval of the remaining independent trustees.
Mr. Thomas is the only trustee who is an “interested person” because he currently serves as President and Chief Executive Officer of American Century Companies, Inc. (ACC), the parent company of American Century Investment Management, Inc. (ACIM or the advisor).
The other trustees (more than three-fourths of the total number) are independent; that is, they have never been employees, directors or officers of, and have no financial interest in, ACC or any of its wholly owned, direct or indirect, subsidiaries, including ACIM, American Century Investment Services, Inc. (ACIS) and American Century Services, LLC (ACS). The trustees serve in this capacity for eight (in the case of Mr. Thomas, 15) registered investment companies in the American Century Investments family of funds.
The following presents additional information about the trustees. The mailing address for each trustee other than Mr. Thomas is 1665 Charleston Road, Mountain View, California 94043. The mailing address for Mr. Thomas is 4500 Main Street, Kansas City, Missouri 64111.
Independent Trustees
John Freidenrich
Year of Birth: 1937
Position(s) with the Funds: Trustee
Length of Time Served: Since 2005
Principal Occupation(s) During the Past Five Years: Founder, Member and Manager, Regis
Management Company, LLC (investment management firm) (April 2004 to present)
Number of Funds in Fund Complex Overseen by Trustee: 41
Other Directorships Held by Trustee: None
Education/Other Professional Experience: AB in Economics, Stanford University; LLB,
Stanford Law School; formerly, partner and founder, Ware and Freidenrich Law
Firm and Bay Partners; formerly, President, Board of Trustees, Stanford University
Ronald J. Gilson
Year of Birth: 1946
Position(s) with the Funds: Trustee and Chairman of the Board
Length of Time Served: Since 1995
Principal Occupation(s) During the Past Five Years: Charles J. Meyers Professor of Law and
Business, Stanford Law School (1979 to present); Marc and Eva Stern Professor of
Law and Business, Columbia University School of Law (1992 to present)
Number of Funds in Fund Complex Overseen by Trustee: 41
Other Directorships Held by Trustee: None
Education/Other Professional Experience: BA, Washington University; JD, Yale Law School;
formerly, attorney, Steinhart, Goldberg, Feigenbaum & Ladar
86
Frederick L. A. Grauer
Year of Birth: 1946
Position(s) with the Funds: Trustee
Length of Time Served: Since 2008
Principal Occupation(s) During the Past Five Years: Senior Advisor, BlackRock, Inc. (investment
management firm) (2010 to present); Senior Advisor, Barclays Global Investors
(investment management firm) (2003 to 2009)
Number of Funds in Fund Complex Overseen by Trustee: 41
Other Directorships Held by Trustee: None
Education/Other Professional Experience: BA in Economics, University of British Columbia;
MA in Economics, University of Chicago; PhD in Business, Stanford University;
formerly, Executive Chairman, Barclays Global Investors; Chairman and Chief
Executive Officer, Wells Fargo Nikko Investment Advisors; and Vice President,
Merrill Lynch Capital Markets Group; formerly, Director, New York Stock Exchange,
Chicago Mercantile Exchange and Columbia University; formerly, faculty member,
Graduate School of Business, Columbia University and Alfred P. Sloan School of
Management, Massachusetts Institute of Technology
Peter F. Pervere
Year of Birth: 1947
Position(s) with the Funds: Trustee
Length of Time Served: Since 2007
Principal Occupation(s) During the Past Five Years: Retired
Number of Funds in Fund Complex Overseen by Trustee: 41
Other Directorships Held by Trustee: Intraware, Inc. (2003 to 2009); Digital Impact, Inc.
(2003 to 2005)
Education/Other Professional Experience: BA in History, Stanford University; CPA; formerly,
Vice President and Chief Financial Officer, Commerce One, Inc. (software and
services provider); formerly, Vice President and Corporate Controller, Sybase, Inc.;
formerly with accounting firm of Arthur Young & Co.
Myron S. Scholes
Year of Birth: 1941
Position(s) with the Funds: Trustee
Length of Time Served: Since 1980
Principal Occupation(s) During the Past Five Years: Chairman, Platinum Grove Asset
Management, L.P. (asset manager) (1999 to 2009); Frank E. Buck Professor of
Finance-Emeritus, Stanford Graduate School of Business (1996 to present)
Number of Funds in Fund Complex Overseen by Trustee: 41
Other Directorships Held by Trustee: Dimensional Fund Advisors (investment advisor); CME
Group, Inc. (futures and options exchange)
Education/Other Professional Experience: BA in Economics, McMaster University (Ontario);
MBA and PhD, University of Chicago; formerly, Senior Research Fellow at the
Hoover Institute; formerly, Edward Eagle Brown Professor of Finance, University of
Chicago; recipient of the Alfred Nobel Memorial Prize in Economic Sciences
87
John B. Shoven
Year of Birth: 1947
Position(s) with the Funds: Trustee
Length of Time Served: Since 2002
Principal Occupation(s) During the Past Five Years: Professor of Economics, Stanford University
(1973 to present)
Number of Funds in Fund Complex Overseen by Trustee: 41
Other Directorships Held by Trustee: Cadence Design Systems; Exponent; Financial Engines;
PalmSource, Inc. (2002 to 2005); Watson Wyatt Worldwide (2002 to 2006)
Education/Other Professional Experience: BA in Physics, University of California; PhD in
Economics, Yale University; Director of the Stanford Institute for Economic Policy
Research (1999 to present); formerly, Chair of Economics and Dean of Humanities
and Sciences, Stanford University
Jeanne D. Wohlers
Year of Birth: 1945
Position(s) with the Funds: Trustee
Length of Time Served: Since 1984
Principal Occupation(s) During the Past Five Years: Retired
Number of Funds in Fund Complex Overseen by Trustee: 41
Other Directorships Held by Trustee: None
Education/Other Professional Experience: BA in Mathematics, Skidmore College; MBA,
Columbia University; Chartered Financial Analyst (CFA); formerly, Vice President,
Chief Financial Officer and Secretary, Sybase, Inc.; prior experience as an investment
officer and investment analyst
Interested Trustee
Jonathan S. Thomas
Year of Birth: 1963
Position(s) with the Funds: Trustee and President
Length of Time Served: Since 2007
Principal Occupation(s) During the Past Five Years: President and Chief Executive Officer,
ACC (March 2007 to present); Chief Administrative Officer, ACC (February 2006 to
February 2007); Executive Vice President, ACC (November 2005 to February 2007).
Also serves as: Chief Executive Officer and Manager, ACS; Executive Vice President,
ACIM; Director, ACIM and other ACC subsidiaries. Global Chief Operating Officer
and Managing Director, Morgan Stanley (investment management)(March 2000 to
November 2005)
Number of Funds in Fund Complex Overseen by Trustee: 104
Other Directorships Held by Trustee: None
Education/Other Professional Experience: BA in Economics, University of Massachusetts;
MBA, Boston College; formerly held senior leadership roles with Fidelity
Investments, Boston Financial Services and Bank of America; serves on the Board of
Governors of the Investment Company Institute
88
Officers
The following table presents certain information about the executive officers of the funds. Each officer serves as an officer for each of the 15 investment companies in the American Century family of funds, unless otherwise noted. No officer is compensated for his or her service as an officer of the funds. The listed officers are interested persons of the funds and are appointed or re-appointed on an annual basis. The mailing address for each of the officers listed below is 4500 Main Street, Kansas City, Missouri 64111.
| | |
| Name | Offices with | |
| (Year of Birth) | the Funds | Principal Occupation(s) During the Past Five Years |
| Jonathan S. | Trustee and | President and Chief Executive Officer, ACC (March 2007 to present); Chief |
| Thomas | President | Administrative Officer, ACC (February 2006 to March 2007); Executive |
| (1963) | since 2007 | Vice President, ACC (November 2005 to February 2007). Also serves as: |
| | | Chief Executive Officer and Manager, ACS; Executive Vice President, ACIM; |
| | | Director, ACIM and other ACC subsidiaries. Global Chief Operating Officer |
| | | and Managing Director, Morgan Stanley (March 2000 to November 2005) |
| Barry Fink | Executive | Chief Operating Officer and Executive Vice President, ACC (September 2007 |
| (1955) | Vice President | to present); President, ACS (October 2007 to present); Managing Director, |
| | since 2007 | Morgan Stanley (2000 to 2007); Global General Counsel, Morgan Stanley |
| | | (2000 to 2006). Also serves as: Manager, ACS, and Director, ACC and |
| | | certain ACC subsidiaries |
| Maryanne L. | Chief Compliance | Chief Compliance Officer, American Century funds, ACIM and ACS (August |
| Roepke | Officer since 2006 | 2006 to present); Assistant Treasurer, ACC (January 1995 to August 2006); |
| (1956) | and Senior | and Treasurer and Chief Financial Officer, various American Century funds |
| | Vice President | (July 2000 to August 2006). Also serves as: Senior Vice President, ACS |
| | since 2000 | |
| Charles A. | General Counsel | Attorney, ACC (February 1994 to present); Vice President, ACC (November |
| Etherington | since 2007 and | 2005 to present); General Counsel, ACC (March 2007 to present); Also |
| (1957) | Senior Vice | serves as General Counsel, ACIM, ACS, ACIS and other ACC subsidiaries; |
| | President | and Senior Vice President, ACIM and ACS |
| | since 2006 | |
| Robert J. Leach | Vice President, | Vice President, ACS (February 2000 to present); and Controller, various |
| (1966) | Treasurer and | American Century funds (1997 to September 2006) |
| | Chief Financial | |
| | Officer since 2006 | |
| David H. Reinmiller | Vice President | Attorney, ACC (January 1994 to present); Associate General Counsel, ACC |
| (1963) | since 2001 | (January 2001 to present); Chief Compliance Officer, American Century |
| | | funds and ACIM (January 2001 to February 2005). Also serves as: Vice |
| | | President, ACIM and ACS |
| Ward D. Stauffer | Secretary | Attorney, ACC (June 2003 to Present) |
| (1960) | since 2005 | |
The SAI has additional information about the funds’ trustees and is available without charge, upon request, by calling 1-800-345-2021.
89
|
| Board Approval of Management Agreements |
American Century Investment Management, Inc. (“ACIM” or the “Advisor”) currently serves as investment advisor to the Funds under an interim management agreement (the “Interim Management Agreement”) between the Advisor and the Funds approved by the Funds’ Board of Trustees (the “Board”). The Advisor previously served as investment advisor to the Funds pursuant to a management agreement (the “Prior Management Agreement”) that terminated in accordance with its terms on February 16, 2010, as a result of a change of control of the Advisor’s parent company, American Century Companies, Inc. (“ACC”). The change in control occurred as the result of a change in the trustee of a trust created by James E. Stowers, Jr., the founder of American Century Investments that holds shares representing a significant interest in ACC stock. Mr. Stowers previously serve d as the trustee of the trust. On February 16, 2010, Richard W. Brown, Co-Chairman of ACC with Mr. Stowers, became the trustee in accordance with the terms of the trust and Mr. Stowers’ long-standing estate and succession plan.
On February 18, 2010, the Board approved the Interim Management Agreement in accordance with Rule 15a-4 under the Investment Company Act to ensure continued management of the Funds by the Advisor after the termination of the Prior Management Agreement and until shareholder approval of a new management agreement (the “Proposed Management Agreement”) as required under the Act. The Board has approved the Proposed Management Agreement and has recommended its approval to shareholders. Fund shareholders are scheduled to consider approval of the Proposed Management Agreement at a meeting to be held on June 16, 2010.*
The Interim Management Agreement and the Proposed Management Agreement are substantially identical to the Prior Management Agreement except for their effective dates and the termination provisions of the Interim Management Agreement. Under the Interim and Proposed Management Agreements, the Advisor will provide the same services to the Funds and receive the same compensation rate as under the Prior Management Agreement.
Basis for Board Approval of Interim Management Agreement
In considering the approval of the Interim Management Agreement, Rule 15a-4 requires the Board to approve the contract within ten business days of the termination of the prior agreement and to determine that the compensation to be received under the interim agreement is no greater than would have been received under the prior agreement. In connection with the approval, the Board noted that it oversees on a continuous basis and evaluates at its quarterly meetings, directly and through the committees of the Board, the nature and quality of significant services provided by the Advisor, the investment performance of the Funds, shareholder services, audit and compliance functions and a variety of other matters relating to the Funds’ operations.
|
| *Management agreements for new share classes of the Fund launched after February 16, 2010, did not terminate, have not been replaced by Interim |
| Management Agreements, and do not require Board or shareholder approval at this time. |
90
In evaluating the Interim Management Agreement, the Board, assisted by the advice of its independent legal counsel, considered a number of factors in addition to those required by the rule with no one factor being determinative to its analysis. Among the factors considered by the Board were the circumstances and effect of the change of control, the fact that the Advisor will provide the same services and receive the same compensation rate as under the Prior Management Agreements, and that the change of control did not result in a change of the personnel managing the Funds. Upon completion of its analysis, the Board approved the Interim Management Agreement, determining that the continued management of the Funds by the Advisor was in the best interests of the Funds and Fund shareholders.
Basis for Board Approval of Proposed Management Agreement
At a meeting held on April 1, 2010, after considering all information presented, the Board approved, and determined to recommend that shareholders approve, the Proposed Management Agreement. In connection with that approval, the Board requested and reviewed extensive data and information compiled by the Advisor and certain independent providers of evaluation data concerning the Funds and services provided to the Funds by the Advisor. The Board oversees on a continuous basis and evaluates at its quarterly meetings, directly and through the committees of the Board, the nature and quality of significant services provided by the Advisor, the investment performance of the Funds, shareholder services, audit and compliance functions and a variety of other matters relating to the Funds’ operations. The information considered and the discussions held at the meetings included, but were not limited to:
• the nature, extent and quality of investment management, shareholder services and other services provided to the Funds;
• the wide range of programs and services the Advisor provides to the Funds and their shareholders on a routine and non-routine basis;
• the compliance policies, procedures, and regulatory experience of the Advisor;
• data comparing the cost of owning the Funds to the cost of owning similar funds;
• the fact that there will be no changes to the fees, services, or personnel who provide such services as compared to the Prior Management Agreement;
• data comparing the Funds’ performance to appropriate benchmarks and/or a peer group of other mutual funds with similar investment objectives and strategies;
• financial data showing the profitability of the Funds to the Advisor and the overall profitability of the Advisor;
• data comparing services provided and charges to the Funds with those for other non-fund investment management clients of the Advisor; and
91
• consideration of collateral or “fall-out” benefits derived by the Advisor from the management of the Funds and potential sharing of economies of scale in connection with the management of the Funds.
The Board also considered whether there was any reason for not continuing the existing arrangement with the Advisor. In particular, the Board recognized that shareholders may have invested in the Funds on the strength of the Advisor’s industry standing and reputation and in the expectation that the Advisor will have a continuing role in providing advisory services to the Funds.
The Board considered all of the information provided by the Advisor, the independent data providers, and the Board’s independent legal counsel, and evaluated such information for each Fund. The Board did not identify any single factor as being all-important or controlling, and each Board member may have attributed different levels of importance to different factors. In deciding to approve the Proposed Management Agreement under the terms ultimately determined by the Board to be appropriate, the Board based its decision on a number of factors, including the following:
Nature, Extent and Quality of Services — Generally. Under the Proposed Management Agreement, the Advisor is responsible for providing or arranging for all services necessary for the operation of the Funds. The Board noted that under the Proposed Management Agreement, the Advisor provides or arranges at its own expense a wide variety of services including:
• constructing and designing the Funds
• portfolio research and security selection
• initial capitalization/funding
• securities trading
• Fund administration
• custody of Fund assets
• daily valuation of each Fund’s portfolio
• shareholder servicing and transfer agency, including shareholder
confirmations, recordkeeping and communications
• legal services
• regulatory and portfolio compliance
• financial reporting
• marketing and distribution
92
The Board noted that many of these services have expanded over time both in terms of quantity and complexity in response to shareholder demands, competition in the industry, changing distribution channels and the changing regulatory environment.
Investment Management Services. The investment management services provided to the Funds are complex and provide Fund shareholders access to professional money management, instant diversification of their investments within an asset class, the opportunity to easily diversify among asset classes, and liquidity. As a part of its general oversight and in evaluating investment performance, the Board expects the Advisor to manage each Fund in accordance with its investment objectives and approved strategies. In providing these services, the Advisor utilizes teams of investment professionals who require extensive information technology, research, training, compliance and other systems to conduct their business. The Board, directly and through its Portfolio Committee, regularly reviews investment performance information for each Fund , together with comparative information for appropriate benchmarks and/or peer groups of similarly-managed funds, over different time horizons. If performance concerns are identified, the underperforming Fund receives special reviews until performance improves, during which time the Board discusses with the Advisor the reasons for such underperformance and any efforts being undertaken to improve performance.
Shareholder and Other Services. Under the Proposed Management Agreement, the Advisor will also provide the Funds with a comprehensive package of transfer agency, shareholder, and other services. The Board, directly and through the various committees of the Board, regularly reviews reports and evaluations of such services. These reports include, but are not limited to, information regarding the operational efficiency and accuracy of the shareholder and transfer agency services provided, staffing levels, shareholder satisfaction (as measured by external as well as internal sources), technology support, new products and services offered to Fund shareholders, securities trading activities, portfolio valuation services, auditing services, and legal and operational compliance activities. Certain aspects of shareholder and transfer a gency service level efficiency and the quality of securities trading activities are measured by independent third party providers and are presented in comparison to other fund groups not managed by the Advisor.
Costs of Services Provided and Profitability. The Advisor provided detailed information concerning its cost of providing various services to the Funds, its profitability in managing the Funds, its overall profitability, and its financial condition. The Board reviewed with the Advisor the methodology used to prepare this financial information. The Board has also reviewed with the Advisor its methodology for compensating the investment professionals that provide services to the Funds as well as compensation to the five highest paid personnel of the Advisor. This financial information regarding the Advisor is considered in order to evaluate the Advisor’s financial condition, its ability to continue to provide services under the Proposed Management Agreement, and the reasonableness of the proposed management fees.
93
Ethics. The Board generally considers the Advisor’s commitment to providing quality services to shareholders and to conducting its business ethically. It noted that the Advisor’s practices generally meet or exceed industry best practices.
Economies of Scale. The Board also reviewed information provided by the Advisor regarding the possible existence of economies of scale in connection with the management of the Funds. The Board concluded that economies of scale are difficult to measure and predict with precision, especially on a fund-by-fund basis. The analysis of economies of scale is further complicated by the additional services and content provided by the Advisor and its reinvestment in its ability to provide and expand those services. Accordingly, the Board seeks to evaluate economies of scale by reviewing information, such as year-over-year profitability of the Advisor generally, the profitability of its management of each Fund specifically, and the expenses incurred by the Advisor in providing various functions to the Funds. The Board believes the Adviso r is appropriately sharing economies of scale through its competitive fee structure, offering competitive fees from fund inception, fee breakpoints as the fund complex and the Funds increase in size, and through reinvestment in its business to provide shareholders additional services and enhancements to existing services. In particular, separate breakpoint schedules based on the size of the entire fund complex and on the size of each Fund reflect the complexity of assessing economies of scale.
Comparison to Fees of Funds not Managed by the Advisor. Both the Prior and Proposed Management Agreements provide that the Funds pay the Advisor a single, all-inclusive (or unified) management fee for providing all services necessary for the management and operation of the Funds, other than brokerage expenses, taxes, interest, extraordinary expenses, and the fees and expenses of the Funds’ Independent Trustees (including their independent legal counsel) and expenses incurred in connection with the provision of shareholder services and distribution services under a plan adopted pursuant to Rule 12b-1 under the 1940 Act. Under the unified fee structure, the Advisor is responsible for providing all investment advisory, custody, audit, administrative, compliance, recordkeeping, marketing and shareholder services, or arranging and supervising third parties that provide such services. By contrast, most other funds are charged a variety of fees, including an investment advisory fee, a transfer agency fee, an administrative fee, distribution charges and other expenses. Other than their investment advisory fees and any applicable Rule 12b-1 distribution fees, the components of the total fees charged by these other funds may be increased without shareholder approval. The Board believes the unified fee structure is a benefit to Fund shareholders because it clearly discloses to shareholders the cost of owning Fund shares, and, since the unified fee cannot be increased without a vote of Fund shareholders, it shifts to the Advisor the risk of increased costs of operating the Funds and provides a direct incentive to minimize administrative inefficiencies. Part of the Board’s analysis of fee levels involves reviewing certain evaluative data compiled by an independent provider comparing each Fund’s unified fee to the total expense ratios of similar funds not managed by the Advisor.
94
The Board concluded that the management fee to be paid by each Fund to the Advisor under the Proposed Management Agreement is reasonable in light of the services to be provided to the Fund.
Comparison to Fees and Services Provided to Other Clients of the Advisor. The Board also requested and received information from the Advisor concerning the nature and extent of the services, fees, and profitability of its advisory services to advisory clients other than the Funds. They observed that these varying types of client accounts require different services and involve different regulatory and entrepreneurial risks than the management of the Funds. The Board analyzed this information and concluded that the fees charged and services provided to the Funds were reasonable by comparison.
Collateral or “Fall-Out” Benefits Derived by the Advisor. The Board considered the existence of collateral benefits the Advisor may receive as a result of its relationship with the Funds. They concluded that the Advisor’s primary business is managing mutual funds and it generally does not use Fund or shareholder information to generate profits in other lines of business, and therefore does not derive any significant collateral benefits from them. The Board noted that the Advisor receives proprietary research from broker-dealers that execute Fund portfolio transactions and concluded that this research is likely to benefit Fund shareholders. The Board also determined that the Advisor is able to provide investment management services to certain clients other than the Funds, at least in part, due to its existing inf rastructure built to serve the fund complex. The Board concluded, however, that the assets of those other clients are not material to the analysis and, in any event, are included with the assets of the Funds to determine breakpoints in each Fund’s fee schedule, provided they are managed using the same investment team and strategy.
Conclusion of the Board. As a result of this process, the Board, in the absence of particular circumstances and assisted by the advice of its independent legal counsel, taking into account all of the factors discussed above and the information provided by the Advisor and others, concluded that the Proposed Management Agreement be approved and recommended its approval to Fund shareholders.
95
Retirement Account Information
As required by law, distributions you receive from certain IRAs, or 403(b), 457 and qualified plans are subject to federal income tax withholding, unless you elect not to have withholding apply. Tax will be withheld on the total amount withdrawn even though you may be receiving amounts that are not subject to withholding, such as nondeductible contributions. In such case, excess amounts of withholding could occur. You may adjust your withholding election so that a greater or lesser amount will be withheld.
If you don’t want us to withhold on this amount, you must notify us to not withhold the federal income tax. You may notify us in writing or in certain situations by telephone or through other electronic means. You have the right to revoke your withholding election at any time and any election you make may remain in effect until revoked by filing a new election.
Remember, even if you elect not to have income tax withheld, you are liable for paying income tax on the taxable portion of your withdrawal. If you elect not to have income tax withheld or you don’t have enough income tax withheld, you may be responsible for payment of estimated tax. You may incur penalties under the estimated tax rules if your withholding and estimated tax payments are not sufficient. You can reduce or defer the income tax on a distribution by directly or indirectly rolling such distribution over to another IRA or eligible plan. You should consult your tax advisor for additional information.
State tax will be withheld if, at the time of your distribution, your address is within one of the mandatory withholding states and you have federal income tax withheld. State taxes will be withheld from your distribution in accordance with the respective state rules.
Proxy Voting Guidelines
American Century Investment Management, Inc., the funds’ investment advisor, is responsible for exercising the voting rights associated with the securities purchased and/or held by the funds. A description of the policies and procedures the advisor uses in fulfilling this responsibility is available without charge, upon request, by calling 1-800-345-2021. It is also available on American Century Investments’ website at americancentury.com and on the Securities and Exchange Commission’s website at sec.gov. Information regarding how the investment advisor voted proxies relating to portfolio securities during the most recent 12-month period ended June 30 is available on the “About Us” page at americancentury.com. It is also available at sec.gov.
Quarterly Portfolio Disclosure
The funds file their complete schedule of portfolio holdings with the Securities and Exchange Commission (SEC) for the first and third quarters of each fiscal year on Form N-Q. The funds’ Forms N-Q are available on the SEC’s website at sec.gov, and may be reviewed and copied at the SEC’s Public Reference Room in Washington, DC. Information on the operation of the Public Reference Room may be obtained by calling 1-800-SEC-0330. The funds also make their complete schedule of portfolio holdings for the most recent quarter of their fiscal year available on their website at americancentury.com and, upon request, by calling 1-800-345-2021.
96
The following indices are used to illustrate investment market, sector, or style performance or to serve as fund performance comparisons. They are not investment products available for purchase.
The Barclays Capital U.S. 1- to 3-Year Government Index is a component of the U.S. Government Index, which includes Treasury and agency securities. The securities have a maturity of one year or more and less than three years.
The Barclays Capital U.S. Aggregate Index represents securities that are taxable, registered with the Securities and Exchange Commission, and U.S. dollar-denominated. The index covers the U.S. investment-grade fixed-rate bond market, with index components for government and corporate securities, mortgage pass-through securities, and asset-backed securities.
The Barclays Capital U.S. Corporate High-Yield Index covers the universe of fixed-rate, non-investment grade corporate debt of issuers in non-emerging market countries.
The Barclays Capital U.S. Corporate Investment-Grade Index is a component of the U.S. Aggregate Index and includes publicly issued U.S. corporate debentures and secured notes.
The Barclays Capital U.S. Government/MBS Index combines two components of the U.S. Aggregate Index. The U.S. Government component includes U.S. Treasury and U.S. government agency securities with remaining maturities of one year or more. The Mortgage-Backed Securities component covers the mortgage-backed pass-through securities of Ginnie Mae (GNMA), Fannie Mae (FNMA) and Freddie Mac (FHLMC).
The Barclays Capital U.S. GNMA Index covers the mortgage-backed pass-through securities of the Government National Mortgage Association (GNMA). It is the GNMA component of the U.S. Mortgage Backed Securities Index. The index is formed by grouping the universe of individual fixed rate GNMA pools into generic aggregates.
The Barclays Capital U.S. Mortgage-Backed Securities Index is a component of the U.S. Aggregate Index and covers the mortgage-backed pass-through securities of Ginnie Mae (GNMA), Fannie Mae (FNMA) and Freddie Mac (FHLMC).
The Barclays Capital U.S. Treasury Index includes public obligations of the U.S. Treasury with a remaining maturity of one year or more and excludes zero coupon strips.
The Barclays Capital U.S. Treasury Inflation Protected Securities (TIPS) Index consists of Treasury inflation-protected securities with a remaining maturity of one year or more.
97
The Citigroup GNMA Index is a market-capitalization-weighted index of 15- and 30-year fixed-rate securities backed by mortgage pools of the Government National Mortgage Association (GNMA).
The Citigroup Treasury/Mortgage Index is comprised of U.S. Treasury securities with an amount outstanding of at least $1 billion, and mortgage-backed securities with an aggregate amount outstanding per coupon of at least $5 billion and an aggregate amount outstanding per origination year of at least $500 million. Both the U.S. Treasury and the mortgage-backed securities included in the index must have a remaining maturity of at least one year.
The Citigroup US Inflation-Linked Securities Index (ILSI)SM measures the return of bonds with fixed-rate coupon payments that adjust for inflation as measured by the Consumer Price Index (CPI).
The Citigroup US Treasury/Agency 1- to 3-Year Index is a market-capitalization-weighted index that includes fixed-rate U.S. Treasury and government agency issues with maturities between one and three years.
The Rogers International Commodities Index (RICI) was developed by Jim Rogers in 1998. It represents the value of a basket of 35 commodities used in the global economy, including agricultural and energy products, metals, and minerals.
98
99
100

| |
| |
| Contact Us | |
| americancentury.com | |
| Automated Information Line | 1-800-345-8765 |
| Investor Services Representative | 1-800-345-2021 or |
| | 816-531-5575 |
| Investors Using Advisors | 1-800-378-9878 |
| Business, Not-For-Profit, Employer-Sponsored | |
| Retirement Plans | 1-800-345-3533 |
| Banks and Trust Companies, Broker-Dealers, | |
| Financial Professionals, Insurance Companies | 1-800-345-6488 |
| Telecommunications Device for the Deaf | 1-800-634-4113 |
| American Century Government Income Trust | |
| Investment Advisor: | |
| American Century Investment Management, Inc. | |
| Kansas City, Missouri | |
This report and the statements it contains are submitted for the general
information of our shareholders. The report is not authorized for distribution to
prospective investors unless preceded or accompanied by an effective prospectus.
American Century Investment Services, Inc., Distributor
©2010 American Century Proprietary Holdings, Inc. All rights reserved.
1005
CL-ANN-68267N
| | | | |
| ITEM 2. CODE OF ETHICS. |
| (a) | The registrant has adopted a Code of Ethics for Senior Financial Officers that applies to the |
| | | registrant’s principal executive officer, principal financial officer, principal accounting officer, |
| | | and persons performing similar functions. |
| |
| (b) | No response required. |
| |
| (c) | None. | | |
| | | |
| (d) | None. | | |
| | | |
| (e) | Not applicable. |
| |
| (f) | The registrant’s Code of Ethics for Senior Financial Officers was filed as Exhibit 12 (a)(1) to |
| | | American Century Asset Allocation Portfolios, Inc.’s Annual Certified Shareholder Report on |
| | | Form N-CSR, File No. 811-21591, on September 29, 2005, and is incorporated herein by |
| | | reference. | | |
|
| ITEM 3. AUDIT COMMITTEE FINANCIAL EXPERT. |
| (a)(1) | The registrant's board has determined that the registrant has at least one audit committee |
| | | financial expert serving on its audit committee. |
| |
| (a)(2) | Peter F. Pervere and Ronald J. Gilson are the registrant's designated audit |
| | | committee financial experts. They are "independent" as defined in Item 3 of Form N-CSR. |
| |
| (a)(3) | Not applicable. |
| |
| (b) | No response required. |
| |
| (c) | No response required. |
| |
| (d) | No response required. |
|
| ITEM 4. PRINCIPAL ACCOUNTANT FEES AND SERVICES. |
| (a) | Audit Fees. | | |
| |
| The aggregate fees billed for each of the last two fiscal years for professional services rendered by the |
| principal accountant for the audit of the registrant’s annual financial statements or services that are |
| normally provided by the accountant in connection with statutory and regulatory filings or engagements |
| for those fiscal years were as follows: |
| | | | |
| | | FY 2009: | $108,376 |
| | | FY 2010: | $107,952 |
| | | | |
| (b) | Audit-Related Fees. |
| |
| The aggregate fees billed in each of the last two fiscal years for assurance and related services by the |
| principal accountant that are reasonably related to the performance of the audit of the registrant’s |
| financial statements and are not reported under paragraph (a) of this Item were as follows: |
| |
| | For services rendered to the registrant: |
| |
| | FY 2009 : | $0 |
| | FY 2010 : | $0 |
| |
| | Fees required to be approved pursuant to paragraph (c)(7)(ii) of Rule 2-01 of Regulation S-X |
| | (relating to certain engagements for non-audit services with the registrant’s investment adviser |
| | and its affiliates): |
| |
| | FY 2009 : | $0 |
| | FY 2010 : | $0 |
| |
| (c) | Tax Fees. | | | |
| |
| The aggregate fees billed in each of the last two fiscal years for professional services rendered by the |
| principal accountant for tax compliance, tax advice, and tax planning were as follows: |
| |
| | For services rendered to the registrant: |
| |
| | FY 2009 : | $0 |
| | FY 2010 : | $0 |
| |
| | Fees required to be approved pursuant to paragraph (c)(7)(ii) of Rule 2-01 of Regulation S-X |
| | (relating to certain engagements for non-audit services with the registrant’s investment adviser |
| | and its affiliates): |
| |
| | FY 2009 : | $0 |
| | FY 2010 : | $0 |
| |
| (d) | All Other Fees. |
| |
| The aggregate fees billed in each of the last two fiscal years for products and services provided by the |
| principal accountant, other than the services reported in paragraphs (a) through (c) of this Item were as |
| follows: | | | | |
| |
| | For services rendered to the registrant: |
| |
| | FY 2009 : | $0 |
| | FY 2010 : | $0 |
| |
| | Fees required to be approved pursuant to paragraph (c)(7)(ii) of Rule 2-01 of Regulation S-X |
| | (relating to certain engagements for non-audit services with the registrant’s investment adviser |
| | and its affiliates): |
| |
| | FY 2009 : | $0 |
| | FY 2010 : | $0 |
| | |
| (e)(1) | In accordance with paragraph (c)(7)(i)(A) of Rule 2-01 of Regulation S-X, before the |
| | accountant is engaged by the registrant to render audit or non-audit services, the engagement is |
| | approved by the registrant’s audit committee. Pursuant to paragraph (c)(7)(ii) of Rule 2-01 of |
| | Regulation S-X, the registrant’s audit committee also pre-approves its accountant’s |
| | engagements for non-audit services with the registrant’s investment adviser, its parent company, |
| | and any entity controlled by, or under common control with the investment adviser that |
| | provides ongoing services to the registrant, if the engagement relates directly to the operations |
| | and financial reporting of the registrant. |
| |
| (e)(2) | All services described in each of paragraphs (b) through (d) of this Item were pre-approved |
| | before the engagement by the registrant’s audit committee pursuant to paragraph (c)(7)(i)(A) of |
| | Rule 2-01 of Regulation S-X. Consequently, none of such services were required to be |
| | approved by the audit committee pursuant to paragraph (c)(7)(i)(C). |
| |
| (f) | The percentage of hours expended on the principal accountant’s engagement to audit the |
| | registrant’s financial statements for the most recent fiscal year that were attributed to work |
| | performed by persons other than the principal accountant’s full-time, permanent employees was |
| | less than 50%. | |
| |
| (g) | The aggregate non-audit fees billed by the registrant’s accountant for services rendered to the |
| | registrant, and rendered to the registrant’s investment adviser (not including any sub-adviser |
| | whose role is primarily portfolio management and is subcontracted with or overseen by another |
| | investment adviser), and any entity controlling, controlled by, or under common control with |
| | the adviser that provides ongoing services to the registrant for each of the last two fiscal years |
| | of the registrant were as follows: |
| |
| | FY 2009: | $121,276 |
| | FY 2010: | $176,524 |
| |
| (h) | The registrant’s investment adviser and accountant have notified the registrant’s audit |
| | committee of all non-audit services that were rendered by the registrant’s accountant to the |
| | registrant’s investment adviser, its parent company, and any entity controlled by, or under |
| | common control with the investment adviser that provides services to the registrant, which |
| | services were not required to be pre-approved pursuant to paragraph (c)(7)(ii) of Rule 2-01 of |
| | Regulation S-X. The notification provided to the registrant’s audit committee included |
| | sufficient details regarding such services to allow the registrant’s audit committee to consider |
| | the continuing independence of its principal accountant. |
| |
| ITEM 5. AUDIT COMMITTEE OF LISTED REGISTRANTS. |
| Not applicable. | |
| |
| ITEM 6. INVESTMENTS. |
| (a) | The schedule of investments is included as part of the report to stockholders filed under Item 1 |
| | of this Form. | |
| |
| (b) | Not applicable. |
| |
| ITEM 7. DISCLOSURE OF PROXY VOTING POLICIES AND PROCEDURES FOR |
| CLOSED-END MANAGEMENT INVESTMENT COMPANIES. |
| Not applicable. | |
| |
| ITEM 8. PORTFOLIO MANAGERS OF CLOSED-END MANAGEMENT |
| INVESTMENT COMPANIES. |
| Not applicable. |
| |
| ITEM 9. PURCHASES OF EQUITY SECURITIES BY CLOSED-END MANAGEMENT |
| INVESTMENT COMPANY AND AFFILIATED PURCHASERS. |
| Not applicable. |
| |
| ITEM 10. SUBMISSION OF MATTERS TO A VOTE OF SECURITY HOLDERS. |
| During the reporting period, there were no material changes to the procedures by which shareholders may |
| recommend nominees to the registrant’s board. |
| |
| ITEM 11. CONTROLS AND PROCEDURES. |
| (a) | The registrant's principal executive officer and principal financial officer have concluded that |
| | the registrant's disclosure controls and procedures (as defined in Rule 30a-3(c) under the |
| | Investment Company Act of 1940) are effective based on their evaluation of these controls and |
| | procedures as of a date within 90 days of the filing date of this report. |
| |
| (b) | There were no changes in the registrant's internal control over financial reporting (as defined in |
| | Rule 30a-3(d) under the Investment Company Act of 1940) that occurred during the registrant's |
| | second fiscal quarter of the period covered by this report that have materially affected, or are |
| | reasonably likely to materially affect, the registrant's internal control over financial reporting. |
| |
| ITEM 12. EXHIBITS. |
| (a)(1) | Registrant’s Code of Ethics for Senior Financial Officers, which is the subject of the disclosure |
| | required by Item 2 of Form N-CSR, was filed as Exhibit 12(a)(1) to American Century Asset |
| | Allocation Portfolios, Inc.’s Certified Shareholder Report on Form N-CSR, File No. 811-21591, |
| | on September 29, 2005. |
| |
| (a)(2) | Separate certifications by the registrant’s principal executive officer and principal financial |
| | officer, pursuant to Section 302 of the Sarbanes-Oxley Act of 2002 and Rule 30a-2(a) under the |
| | Investment Company Act of 1940, are filed and attached hereto as EX-99.CERT. |
| |
| (a)(3) | Not applicable. |
| |
| (b) | A certification by the registrant’s chief executive officer and chief financial officer, pursuant to |
| | Section 906 of the Sarbanes-Oxley Act of 2002, is furnished and attached hereto as EX- |
| | 99.906CERT. |
SIGNATURES
Pursuant to the requirements of the Securities Exchange Act of 1934 and the Investment Company Act of 1940, the registrant has duly caused this report to be signed on its behalf by the undersigned, thereunto duly authorized.
| | |
| Registrant: | American Century Government Income Trust |
| |
| By: | /s/ Jonathan S. Thomas |
| | Name: | Jonathan S. Thomas |
| | Title: | President |
| |
| Date: | May 28, 2010 |
Pursuant to the requirements of the Securities Exchange Act of 1934 and the Investment Company Act of 1940, this report has been signed below by the following persons on behalf of the registrant and in the capacities and on the dates indicated.
| | |
| By: | /s/ Jonathan S. Thomas |
| | Name: | Jonathan S. Thomas |
| | Title: | President |
| | | (principal executive officer) |
| |
| Date: | May 28, 2010 |
| | |
| By: | /s/ Robert J. Leach |
| | Name: | Robert J. Leach |
| | Title: | Vice President, Treasurer, and |
| | | Chief Financial Officer |
| | | (principal financial officer) |
| |
| Date: | May 28, 2010 |