UNITED STATES
SECURITIES AND EXCHANGE COMMISSION
Washington, D.C. 20549
FORM N-CSR
CERTIFIED SHAREHOLDER REPORT OF REGISTERED
MANAGEMENT INVESTMENT COMPANIES
| Investment Company Act file number | 811-04363 |
| | |
| | |
| | |
| AMERICAN CENTURY GOVERNMENT INCOME TRUST |
| (Exact name of registrant as specified in charter) |
| | |
| | |
| | |
| 4500 MAIN STREET, KANSAS CITY, MISSOURI | 64111 |
| (Address of principal executive offices) | (Zip Code) |
| | |
| | |
| | |
CHARLES A. ETHERINGTON 4500 MAIN STREET, KANSAS CITY, MISSOURI 64111 |
| (Name and address of agent for service) |
| | |
| | |
| Registrant’s telephone number, including area code: | 816-531-5575 |
| | |
| | |
| Date of fiscal year end: | 03-31 |
| | |
| | |
| Date of reporting period: | 03-31-2013 |
ITEM 1. REPORTS TO STOCKHOLDERS.
ANNUAL REPORT MARCH 31, 2013
| | Inflation-Adjusted Bond Fund |
| President’s Letter | 2 |
| Market Perspective | 3 |
| Performance | 4 |
| Portfolio Commentary | 6 |
| Fund Characteristics | 8 |
| Shareholder Fee Example | 9 |
| Schedule of Investments | 11 |
| Statement of Assets and Liabilities | 18 |
| Statement of Operations | 19 |
| Statement of Changes in Net Assets | 20 |
| Notes to Financial Statements | 21 |
| Financial Highlights | 28 |
| Report of Independent Registered Public Accounting Firm | 30 |
| Management | 31 |
| Additional Information | 34 |
Any opinions expressed in this report reflect those of the author as of the date of the report, and do not necessarily represent the opinions of American Century Investments® or any other person in the American Century Investments organization. Any such opinions are subject to change at any time based upon market or other conditions and American Century Investments disclaims any responsibility to update such opinions. These opinions may not be relied upon as investment advice and, because investment decisions made by American Century Investments funds are based on numerous factors, may not be relied upon as an indication of trading intent on behalf of any American Century Investments fund. Security examples are used for representational purposes only and are not intended as recommendations to purchase or sell securities. Performance information for comparative indices and securities is provided to American Century Investments by third party vendors. To the best of American Century Investments’ knowledge, such information is accurate at the time of printing.
Dear Investor:
Thank you for reviewing this annual report for the 12 months ended March 31, 2013. It offers investment performance, market analysis, and portfolio information, presented with the expert perspective of our portfolio management team.
Annual reports remain important vehicles for conveying information about fund returns, including key factors that affected fund performance. For additional, updated investment and market insights, we encourage you to visit our website, americancentury.com.
Positive Fiscal-Year Returns for U.S. Stock and Bond Benchmarks
Despite a global economic slowdown, continued concerns about European financial system stability, and uncertainty about U.S. political and fiscal conditions, 12-month U.S. stock and bond index returns were generally positive. Aggressive central bank monetary policies helped motivate investors to take more risk and kept short-term interest rates low.
U.S. mid-cap and value stocks and high-yield bonds achieved performance leadership during the period. U.S. mid-cap and value stock indices outpaced the S&P 500 Index’s 13.96% return, and U.S. corporate high-yield and municipal high-yield benchmarks performed in that 13-14% return range as well. U.S. growth and international index returns were generally lower, but still above average—the MSCI EAFE Index, for example, returned 11.25%.
With the exception of high-yield bond sectors, stocks generally outperformed bonds for the period, though bonds benefitted from economic stagnation, reduced inflation pressures, and low interest rates. The 10-year U.S. Treasury yield declined from 2.21% to 1.85% during the period, and the Barclays U.S. Aggregate Bond Index returned 3.78%.
The U.S. economy showed signs of improvement during the fiscal year, particularly the long-depressed housing market. However, the U.S. economic growth outlook for 2013 remains subpar compared with past recession recoveries, still vulnerable to fiscal and financial factors that could trigger further slowdowns and market volatility.
Under these conditions, we continue to believe in a disciplined, diversified, long-term investment approach, using professionally managed stock and bond portfolios—as appropriate—for meeting financial goals. We appreciate your continued trust in us in this challenging environment.
Sincerely,
Jonathan Thomas
President and Chief Executive Officer
American Century Investments
By David MacEwen, Chief Investment Officer, Fixed Income
Central Banks Set Market Tone
Market sentiment wavered between risk taking and risk aversion during the 12-month period ended March 31, 2013, with risk taking generally prevailing. Persistent concerns about weak global economic growth, combined with Europe’s ongoing financial crisis and bouts of political uncertainty in the U.S. (first from the presidential election and then from the year-end “fiscal cliff” of federal tax hikes and spending cuts), triggered risk aversion, while optimism inspired by aggressive central bank monetary policies led to risk taking.
Early in the period, slowing economic growth, still-high unemployment, and ongoing problems in Europe led to a round of risk aversion that favored U.S. Treasuries. In response to the fragile economic backdrop, the Federal Reserve (the Fed) kept its overnight interest rate target near 0% and announced its third and most aggressive quantitative easing program (QE3), which has the Fed purchasing $40 billion of mortgage-backed securities (MBS) each month until economic growth and employment improve. The Fed expanded QE3 in December to include $45 billion in monthly Treasury purchases. Meanwhile, the European Central Bank launched several programs to help the eurozone’s troubled banks, and the Bank of Japan aggressively expanded its balance sheet.
Investors Favored Risk, Feared Long-Term Inflation
Overall, widespread central bank intervention drove down yields among higher-quality bonds and ultimately sparked investments in riskier asset classes. Both high-yield and investment-grade corporate bonds were among the taxable U.S. fixed-income market’s top performers for the period, benefitting from generally favorable corporate fundamentals and investor demand for yield.
At the same time, longer-term Treasury yields tumbled and the yield curve (which shows the relationship between bond maturities and yields across the maturity spectrum) flattened. These factors, combined with strong safe-haven demand that occasionally emerged and overall sluggish economic growth, led to relative outperformance for longer-maturity Treasuries. Treasury outperformance, combined with some long-term inflation concerns triggered by central bank policies, led to relative outperformance for Treasury inflation-protected securities (TIPS).
| U.S. Fixed-Income Total Returns | |
| For the 12 months ended March 31, 2013 | |
| Barclays U.S. Bond Market Indices | | | Barclays U.S. Treasury Bellwethers | |
| Corporate High-Yield | 13.13% | | | 3-Month Bill | 0.13% | |
| Corporate (investment-grade) | 7.47% | | | 2-Year Note | 0.48% | |
| Treasury Inflation Protected Securities (TIPS) | 5.68% | | | 10-Year Note | 6.20% | |
| Aggregate (multi-sector) | 3.78% | | | 30-Year Bond | 7.48% | |
| Treasury | 3.14% | | | | | |
| MBS (mortgage-backed securities) | 1.97% | | | | | |
| Total Returns as of March 31, 2013 |
| | | | Average Annual Returns | |
| | Ticker Symbol | 1 year | 5 years | 10 years | Since Inception | Inception Date |
| Investor Class | ACITX | 5.36% | 5.66% | 5.97% | 6.34% | 2/10/97 |
| Barclays U.S. Treasury Inflation Protected Securities (TIPS) Index | — | 5.68% | 5.88% | 6.31% | 6.92%(1) | — |
| Institutional Class | AIANX | 5.57% | 5.86% | 6.17% | 6.22% | 10/1/02 |
A Class(2) No sales charge* With sales charge* | AIAVX | 5.12% 0.42% | 5.40% 4.44% | 5.71% 5.22% | 6.48% 6.16% | 6/15/98 |
| C Class | AINOX | 4.34% | — | — | 6.86% | 3/1/10 |
| R Class | AIARX | 4.85% | — | — | 7.40% | 3/1/10 |
| Sales charges include initial sales charges and contingent deferred sales charges (CDSCs), as applicable. A Class shares have a 4.50% maximum initial sales charge and may be subject to a maximum CDSC of 1.00%. C Class shares redeemed within 12 months of purchase are subject to a maximum CDSC of 1.00%. The SEC requires that mutual funds provide performance information net of maximum sales charges in all cases where charges could be applied. |
| (1) | Since 2/28/97, the date nearest the Investor Class’s inception for which data are available. |
| (2) | Prior to March 1, 2010, the A Class was referred to as the Advisor Class and did not have a front-end sales charge. Performance prior to that date has been adjusted to reflect this charge. |
Data presented reflect past performance. Past performance is no guarantee of future results. Current performance may be higher or lower than the performance shown. Investment return and principal value will fluctuate, and redemption value may be more or less than original cost. To obtain performance data current to the most recent month end, please call 1-800-345-2021 or visit americancentury.com. As interest rates rise, bond values will decline.
Unless otherwise indicated, performance reflects Investor Class shares; performance for other share classes will vary due to differences in fee structure. For information about other share classes available, please consult the prospectus. Data assumes reinvestment of dividends and capital gains, and none of the charts reflect the deduction of taxes that a shareholder would pay on fund distributions or the redemption of fund shares. Returns for the index are provided for comparison. The fund’s total returns include operating expenses (such as transaction costs and management fees) that reduce returns, while the total returns of the index do not.
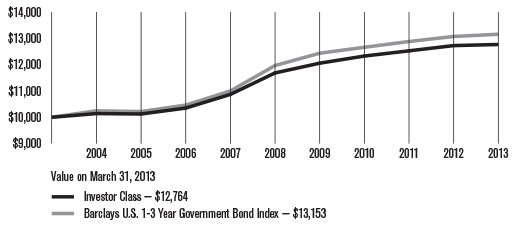
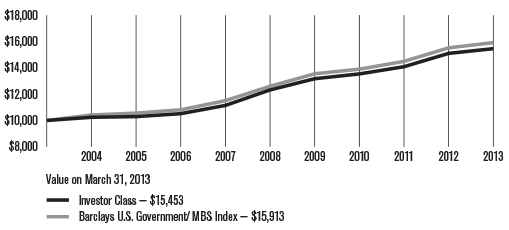
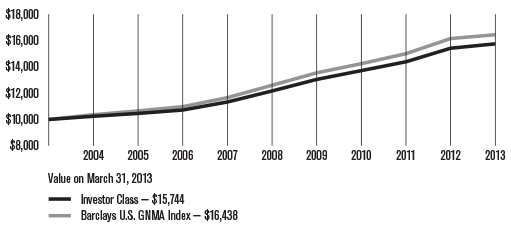
| Growth of $10,000 Over 10 Years |
| $10,000 investment made March 31, 2003 |
| Total Annual Fund Operating Expenses |
| Investor Class | Institutional Class | A Class | C Class | R Class |
| 0.48% | 0.28% | 0.73% | 1.48% | 0.98% |
The total annual fund operating expenses shown is as stated in the fund’s prospectus current as of the date of this report. The prospectus may vary from the expense ratio shown elsewhere in this report because it is based on a different time period, includes acquired fund fees and expenses, and, if applicable, does not include fee waivers or expense reimbursements.
Data presented reflect past performance. Past performance is no guarantee of future results. Current performance may be higher or lower than the performance shown. Investment return and principal value will fluctuate, and redemption value may be more or less than original cost. To obtain performance data current to the most recent month end, please call 1-800-345-2021 or visit americancentury.com. As interest rates rise, bond values will decline.
Unless otherwise indicated, performance reflects Investor Class shares; performance for other share classes will vary due to differences in fee structure. For information about other share classes available, please consult the prospectus. Data assumes reinvestment of dividends and capital gains, and none of the charts reflect the deduction of taxes that a shareholder would pay on fund distributions or the redemption of fund shares. Returns for the index are provided for comparison. The fund’s total returns include operating expenses (such as transaction costs and management fees) that reduce returns, while the total returns of the index do not.
Portfolio Managers: Bob Gahagan, Brian Howell, and Jim Platz
Performance Summary
Inflation-Adjusted Bond returned 5.36%* for the 12 months ended March 31, 2013. By comparison, the fund’s benchmark, the Barclays U.S. Treasury Inflation Protected Securities (TIPS) Index, returned 5.68%. See pages 4 and 5 for additional performance comparisons. Fund returns reflect operating expenses, while index returns do not.
TIPS outperformed their nominal Treasury counterparts and the broad investment-grade fixed-income benchmark for the 12-month period. Slow economic growth and generally falling commodity prices helped keep current inflation in check throughout the period. But, aggressive Federal Reserve (Fed) action, including a third round of quantitative easing that has the Fed purchasing $85 billion in mortgage-backed and Treasury securities each month, led to expectations for higher inflation down the road. These expectations helped drive TIPS returns higher during the period.
Commodity Prices Fell, Inflation Readings Mixed
Despite some intra-period price volatility in the commodities markets, commodity prices declined overall for the 12-month period. For example, the S&P Goldman Sachs Commodities Index, a broad measure of price movements in the global commodities markets, posted a return of -4.96% for the 12 months ended March 31, 2013. Oil prices, which typically have a big influence on the headline inflation rate, showed steeper declines. Brent crude tumbled from $123 a barrel at the end of March 2012 to $110 a barrel at the end of March 2013, for a decline of 11%. Similarly, West Texas Intermediate (WTI) crude futures fell from $103 a barrel to $97, a decline of 6%.
Against this backdrop, headline inflation, based on the year-to-year change in the Consumer Price Index (CPI), increased only 1.5% as of March 31, 2013, compared with an annual inflation rate of 2.7% as of March 31, 2012. The relatively muted one-year inflation rate was largely due to falling energy prices. The year-to-year change in core inflation, which excludes volatile food and energy prices, was 1.9% at the end of March 2013, compared with 2.3% a year earlier.
Although near-term inflation was relatively contained, longer-term inflation expectations increased during the period, according to the 10-year Treasury breakeven rate. After starting the period at 2.34 percentage points, the Treasury breakeven rate (the yield difference between 10-year TIPS and nominal 10-year Treasuries) jumped to 2.52 percentage points by the end of March 2013. Theoretically, the breakeven rate indicates the market’s expectations for inflation for the next 10 years and also reflects the inflation rate required for TIPS to outperform nominal Treasuries during that period.
*All fund returns referenced in this commentary are for Investor Class shares.
Portfolio Strategy
We continued to invest the majority of the portfolio in TIPS (93% as of March 31, 2013), and we invested the remainder in non-Treasury (spread) sectors, including investment-grade corporate, mortgage-backed, and municipal securities.
In an effort to diversify inflation protection while taking advantage of rising long-term inflation expectations, we used inflation “swaps” to create an inflation “overlay” for the non-inflation-linked spread securities. Inflation swaps are fixed-maturity instruments, negotiated through a counterparty (investment bank), that return the rate of inflation, as measured by CPI. All swaps bear counterparty credit risk, but American Century Investments applies stringent controls and oversight with regard to this risk. During the reporting period, the combination of the inflation swaps overlay and non-inflation-linked spread securities had a slightly positive effect on performance.
Outlook
We expect near-term inflation to remain relatively contained primarily due to our outlook for subpar economic growth. Longer term, record federal debt and the Fed’s aggressive monetary policy and stimulus programs eventually may result in higher inflation than what is currently priced into the Treasury market. We believe this scenario underscores the importance of securing potential inflation hedges and protecting purchasing power with professionally managed inflation-indexed portfolios.
| MARCH 31, 2013 | |
| Portfolio at a Glance | |
| Average Duration (effective) | 6.6 years |
| Weighted Average Life | 9.2 years |
| | |
| Types of Investments in Portfolio | % of net assets |
| U.S. Treasury Securities | 93.3% |
| Commercial Mortgage-Backed Securities | 2.1% |
| Corporate Bonds | 2.1% |
| Collateralized Mortgage Obligations | 1.1% |
| Municipal Securities | —* |
| Temporary Cash Investments | 1.1% |
| Other Assets and Liabilities | 0.3% |
*Category is less than 0.05% of total net assets.
Fund shareholders may incur two types of costs: (1) transaction costs, including sales charges (loads) on purchase payments and redemption/exchange fees; and (2) ongoing costs, including management fees; distribution and service (12b-1) fees; and other fund expenses. This example is intended to help you understand your ongoing costs (in dollars) of investing in your fund and to compare these costs with the ongoing cost of investing in other mutual funds.
The example is based on an investment of $1,000 made at the beginning of the period and held for the entire period from October 1, 2012 to March 31, 2013.
Actual Expenses
The table provides information about actual account values and actual expenses for each class. You may use the information, together with the amount you invested, to estimate the expenses that you paid over the period. First, identify the share class you own. Then simply divide your account value by $1,000 (for example, an $8,600 account value divided by $1,000 = 8.6), then multiply the result by the number under the heading “Expenses Paid During Period” to estimate the expenses you paid on your account during this period.
If you hold Investor Class shares of any American Century Investments fund, or Institutional Class shares of the American Century Diversified Bond Fund, in an American Century Investments account (i.e., not a financial intermediary or retirement plan account), American Century Investments may charge you a $12.50 semiannual account maintenance fee if the value of those shares is less than $10,000. We will redeem shares automatically in one of your accounts to pay the $12.50 fee. In determining your total eligible investment amount, we will include your investments in all personal accounts (including American Century Investments Brokerage accounts) registered under your Social Security number. Personal accounts include individual accounts, joint accounts, UGMA/UTMA accounts, personal trusts, Coverdell Education Savings Accounts and IRAs (including traditional, Roth, Rollover, SEP-, SARSEP- and SIMPLE-IRAs), and certain other retirement accounts. If you have only business, business retirement, employer-sponsored or American Century Investments Brokerage accounts, you are currently not subject to this fee. If you are subject to the Account Maintenance Fee, your account value could be reduced by the fee amount.
Hypothetical Example for Comparison Purposes
The table also provides information about hypothetical account values and hypothetical expenses based on the actual expense ratio of each class of your fund and an assumed rate of return of 5% per year before expenses, which is not the actual return of a fund’s share class. The hypothetical account values and expenses may not be used to estimate the actual ending account balance or expenses you paid for the period. You may use this information to compare the ongoing costs of investing in your fund and other funds. To do so, compare this 5% hypothetical example with the 5% hypothetical examples that appear in the shareholder reports of the other funds.
Please note that the expenses shown in the table are meant to highlight your ongoing costs only and do not reflect any transactional costs, such as sales charges (loads) or redemption/exchange fees. Therefore, the table is useful in comparing ongoing costs only, and will not help you determine the relative total costs of owning different funds. In addition, if these transactional costs were included, your costs would have been higher.
| | Beginning Account Value 10/1/12 | Ending Account Value 3/31/13 | Expenses Paid During Period(1) 10/1/12 – 3/31/13 | Annualized Expense Ratio(1) |
| Actual | | | | |
| Investor Class | $1,000 | $1,001.60 | $2.35 | 0.47% |
| Institutional Class | $1,000 | $1,001.90 | $1.35 | 0.27% |
| A Class | $1,000 | $1,001.00 | $3.59 | 0.72% |
| C Class | $1,000 | $996.90 | $7.32 | 1.47% |
| R Class | $1,000 | $998.90 | $4.83 | 0.97% |
| Hypothetical | | | | |
| Investor Class | $1,000 | $1,022.59 | $2.37 | 0.47% |
| Institutional Class | $1,000 | $1,023.59 | $1.36 | 0.27% |
| A Class | $1,000 | $1,021.34 | $3.63 | 0.72% |
| C Class | $1,000 | $1,017.60 | $7.39 | 1.47% |
| R Class | $1,000 | $1,020.10 | $4.89 | 0.97% |
| (1) | Expenses are equal to the class’s annualized expense ratio listed in the table above, multiplied by the average account value over the period, multiplied by 182, the number of days in the most recent fiscal half-year, divided by 365, to reflect the one-half year period. |
| | | Principal Amount | | | Value | |
| U.S. Treasury Securities — 93.3% | |
U.S. Treasury Inflation Indexed Bonds, 2.375%, 1/15/25(1) | | | $170,711,279 | | | | $229,686,734 | |
| U.S. Treasury Inflation Indexed Bonds, 2.00%, 1/15/26 | | | 136,675,094 | | | | 178,339,676 | |
| U.S. Treasury Inflation Indexed Bonds, 2.375%, 1/15/27 | | | 100,687,033 | | | | 137,382,724 | |
| U.S. Treasury Inflation Indexed Bonds, 1.75%, 1/15/28 | | | 76,440,163 | | | | 97,431,319 | |
| U.S. Treasury Inflation Indexed Bonds, 3.625%, 4/15/28 | | | 121,356,460 | | | | 190,008,173 | |
| U.S. Treasury Inflation Indexed Bonds, 2.50%, 1/15/29 | | | 30,811,718 | | | | 43,170,114 | |
| U.S. Treasury Inflation Indexed Bonds, 3.875%, 4/15/29 | | | 147,713,306 | | | | 240,657,324 | |
| U.S. Treasury Inflation Indexed Bonds, 3.375%, 4/15/32 | | | 31,497,063 | | | | 50,808,700 | |
| U.S. Treasury Inflation Indexed Bonds, 2.125%, 2/15/40 | | | 85,627,805 | | | | 121,096,469 | |
| U.S. Treasury Inflation Indexed Bonds, 2.125%, 2/15/41 | | | 109,781,820 | | | | 156,027,412 | |
| U.S. Treasury Inflation Indexed Bonds, 0.75%, 2/15/42 | | | 100,383,320 | | | | 105,324,087 | |
| U.S. Treasury Inflation Indexed Bonds, 0.625%, 2/15/43 | | | 12,019,200 | | | | 12,119,668 | |
| U.S. Treasury Inflation Indexed Notes, 1.25%, 4/15/14 | | | 57,323,811 | | | | 59,249,547 | |
U.S. Treasury Inflation Indexed Notes, 2.00%, 7/15/14(1) | | | 51,670,533 | | | | 54,718,267 | |
| U.S. Treasury Inflation Indexed Notes, 1.625%, 1/15/15 | | | 32,966,010 | | | | 35,183,502 | |
| U.S. Treasury Inflation Indexed Notes, 0.50%, 4/15/15 | | | 129,425,898 | | | | 136,028,690 | |
| U.S. Treasury Inflation Indexed Notes, 1.875%, 7/15/15 | | | 56,146,458 | | | | 61,620,737 | |
| U.S. Treasury Inflation Indexed Notes, 2.00%, 1/15/16 | | | 147,759,931 | | | | 164,786,899 | |
| U.S. Treasury Inflation Indexed Notes, 0.125%, 4/15/16 | | | 225,867,955 | | | | 240,143,487 | |
| U.S. Treasury Inflation Indexed Notes, 2.50%, 7/15/16 | | | 114,055,507 | | | | 132,072,741 | |
| U.S. Treasury Inflation Indexed Notes, 2.375%, 1/15/17 | | | 131,421,271 | | | | 153,413,832 | |
| U.S. Treasury Inflation Indexed Notes, 0.125%, 4/15/17 | | | 243,328,800 | | | | 262,643,024 | |
| U.S. Treasury Inflation Indexed Notes, 2.625%, 7/15/17 | | | 92,000,474 | | | | 110,788,719 | |
| U.S. Treasury Inflation Indexed Notes, 1.625%, 1/15/18 | | | 105,276,838 | | | | 122,869,545 | |
| U.S. Treasury Inflation Indexed Notes, 1.375%, 7/15/18 | | | 51,206,393 | | | | 60,051,479 | |
| U.S. Treasury Inflation Indexed Notes, 2.125%, 1/15/19 | | | 108,115,056 | | | | 132,035,512 | |
| U.S. Treasury Inflation Indexed Notes, 1.875%, 7/15/19 | | | 69,131,850 | | | | 84,745,901 | |
| U.S. Treasury Inflation Indexed Notes, 1.375%, 1/15/20 | | | 130,130,780 | | | | 155,211,406 | |
| U.S. Treasury Inflation Indexed Notes, 1.25%, 7/15/20 | | | 189,643,232 | | | | 226,831,132 | |
| U.S. Treasury Inflation Indexed Notes, 1.125%, 1/15/21 | | | 289,328,279 | | | | 341,565,632 | |
| U.S. Treasury Inflation Indexed Notes, 0.625%, 7/15/21 | | | 280,738,004 | | | | 321,620,476 | |
| U.S. Treasury Inflation Indexed Notes, 0.125%, 1/15/22 | | | 269,618,950 | | | | 293,800,534 | |
| U.S. Treasury Inflation Indexed Notes, 0.125%, 7/15/22 | | | 117,161,460 | | | | 127,879,859 | |
| U.S. Treasury Inflation Indexed Notes, 0.125%, 1/15/23 | | | 141,466,770 | | | | 152,938,876 | |
TOTAL U.S. TREASURY SECURITIES (Cost $4,387,426,697) | | | | 4,992,252,197 | |
| | | Principal Amount | | | Value | |
Commercial Mortgage-Backed Securities(2) — 2.1% | | | | | | | | |
| Banc of America Commercial Mortgage, Inc., Series 2004-1, Class A4 SEQ, 4.76%, 11/10/39 | | | $7,086,103 | | | | $7,245,473 | |
| Banc of America Commercial Mortgage, Inc., Series 2005-5, Class A4, VRN, 5.12%, 4/1/13 | | | 3,050,000 | | | | 3,344,938 | |
| Banc of America Commercial Mortgage, Inc., Series 2005-5, Class AM, VRN, 5.18%, 4/1/13 | | | 5,300,000 | | | | 5,837,330 | |
Bank of America Merrill Lynch Commercial Mortgage Securities Trust, Series 2012-PARK, Class A SEQ, 2.96%, 12/10/30(3) | | | 4,000,000 | | | | 4,069,914 | |
| GE Capital Commercial Mortgage Corp., Series 2005-C3, Class A5, VRN, 4.98%, 4/1/13 | | | 1,133,896 | | | | 1,136,709 | |
| Greenwich Capital Commercial Funding Corp., Series 2005-GG3, Class A3 SEQ, 4.57%, 8/10/42 | | | 1,918,722 | | | | 1,917,292 | |
| Greenwich Capital Commercial Funding Corp., Series 2005-GG3, Class A4, VRN, 4.80%, 4/1/13 | | | 4,450,000 | | | | 4,702,533 | |
| GS Mortgage Securities Corp. II, Series 2004-GG2, Class A6 SEQ, VRN, 5.40%, 4/1/13 | | | 15,850,000 | | | | 16,568,029 | |
| GS Mortgage Securities Corp. II, Series 2005-GG4, Class A4 SEQ, 4.76%, 7/10/39 | | | 5,860,000 | | | | 6,260,024 | |
| GS Mortgage Securities Corp. II, Series 2005-GG4, Class A4A SEQ, 4.75%, 7/10/39 | | | 14,375,000 | | | | 15,326,043 | |
GS Mortgage Securities Corp. II, Series 2012-ALOH, Class A SEQ, 3.55%, 4/10/34(3) | | | 9,000,000 | | | | 9,534,325 | |
| LB-UBS Commercial Mortgage Trust, Series 2004-C4, Class A4, VRN, 5.51%, 4/11/13 | | | 8,650,000 | | | | 9,089,204 | |
| LB-UBS Commercial Mortgage Trust, Series 2005-C5, Class AM, VRN, 5.02%, 4/11/13 | | | 7,500,000 | | | | 8,153,587 | |
| LB-UBS Commercial Mortgage Trust, Series 2005-C7, Class AM SEQ, VRN, 5.26%, 4/11/13 | | | 5,025,000 | | | | 5,531,038 | |
| Morgan Stanley Bank of America Merrill Lynch Trust, Series 2012-C6, Class A4 SEQ, 2.86%, 11/15/45 | | | 8,100,000 | | | | 8,257,298 | |
| Morgan Stanley Bank of America Merrill Lynch Trust, Series 2013-C7, Class A4, 2.92%, 2/15/46 | | | 3,800,000 | | | | 3,868,138 | |
TOTAL COMMERCIAL MORTGAGE-BACKED SECURITIES (Cost $109,886,862) | | | | 110,841,875 | |
| Corporate Bonds — 2.1% | |
| AEROSPACE AND DEFENSE — 0.1% | |
| L-3 Communications Corp., 5.20%, 10/15/19 | | | 900,000 | | | | 1,028,138 | |
| Lockheed Martin Corp., 4.25%, 11/15/19 | | | 1,000,000 | | | | 1,127,540 | |
| United Technologies Corp., 4.50%, 6/1/42 | | | 1,470,000 | | | | 1,576,221 | |
| | | | | | | | 3,731,899 | |
| BEVERAGES — 0.1% | |
| Anheuser-Busch InBev Worldwide, Inc., 7.75%, 1/15/19 | | | 3,120,000 | | | | 4,107,024 | |
| PepsiCo, Inc., 2.75%, 3/1/23 | | | 1,050,000 | | | | 1,054,067 | |
| | | | | | | | 5,161,091 | |
COMMERCIAL BANKS† | |
| PNC Funding Corp., 3.625%, 2/8/15 | | | 980,000 | | | | 1,032,308 | |
| COMMUNICATIONS EQUIPMENT — 0.1% | |
| Cisco Systems, Inc., 5.90%, 2/15/39 | | | 2,675,000 | | | | 3,366,380 | |
| CONSUMER FINANCE — 0.1% | |
| Caterpillar Financial Services Corp., MTN, 1.25%, 11/6/17 | | | 520,000 | | | | 521,853 | |
| Caterpillar Financial Services Corp., MTN, 2.625%, 3/1/23 | | | 1,000,000 | | | | 997,386 | |
| PNC Bank N.A., 6.00%, 12/7/17 | | | 1,200,000 | | | | 1,430,453 | |
| | | | | | | | 2,949,692 | |
DIVERSIFIED CONSUMER SERVICES† | |
| Catholic Health Initiatives, 2.95%, 11/1/22 | | | 550,000 | | | | 557,064 | |
| DIVERSIFIED FINANCIAL SERVICES — 0.1% | |
| General Electric Capital Corp., 5.625%, 9/15/17 | | | 200,000 | | | | 234,724 | |
| General Electric Capital Corp., 4.375%, 9/16/20 | | | 1,200,000 | | | | 1,343,022 | |
| | | | Principal Amount | | | | Value | |
| General Electric Capital Corp., MTN, 6.00%, 8/7/19 | | | $1,350,000 | | | | $1,642,097 | |
| Goldman Sachs Group, Inc. (The), 6.15%, 4/1/18 | | | 3,600,000 | | | | 4,248,634 | |
| | | | | | | | 7,468,477 | |
| DIVERSIFIED TELECOMMUNICATION SERVICES — 0.2% | |
| AT&T, Inc., 6.55%, 2/15/39 | | | 1,250,000 | | | | 1,551,770 | |
| Deutsche Telekom International Finance BV, 6.75%, 8/20/18 | | | 2,700,000 | | | | 3,343,286 | |
| Verizon Communications, Inc., 6.10%, 4/15/18 | | | 3,970,000 | | | | 4,798,555 | |
| | | | | | | | 9,693,611 | |
| FOOD PRODUCTS — 0.1% | |
| Kraft Foods Group, Inc., 5.375%, 2/10/20 | | | 3,649,000 | | | | 4,362,916 | |
| Mondelez International, Inc., 6.125%, 2/1/18 | | | 2,450,000 | | | | 2,942,820 | |
| | | | | | | | 7,305,736 | |
| GAS UTILITIES — 0.1% | |
| Enterprise Products Operating LLC, 3.70%, 6/1/15 | | | 2,500,000 | | | | 2,647,745 | |
| Kinder Morgan Energy Partners LP, 5.30%, 9/15/20 | | | 2,990,000 | | | | 3,505,907 | |
| Williams Partners LP, 4.125%, 11/15/20 | | | 1,690,000 | | | | 1,827,527 | |
| | | | | | | | 7,981,179 | |
HEALTH CARE EQUIPMENT AND SUPPLIES† | |
| Baxter International, Inc., 1.85%, 1/15/17 | | | 1,300,000 | | | | 1,334,074 | |
HEALTH CARE PROVIDERS AND SERVICES† | |
| Aetna, Inc., 2.75%, 11/15/22 | | | 750,000 | | | | 735,961 | |
| UnitedHealth Group, Inc., 4.25%, 3/15/43 | | | 1,200,000 | | | | 1,187,086 | |
| | | | | | | | 1,923,047 | |
| INDUSTRIAL CONGLOMERATES — 0.1% | |
| General Electric Co., 5.25%, 12/6/17 | | | 2,970,000 | | | | 3,484,166 | |
| INSURANCE — 0.1% | |
| Boeing Capital Corp., 2.125%, 8/15/16 | | | 3,680,000 | | | | 3,828,436 | |
Metropolitan Life Global Funding I, 3.00%, 1/10/23(3) | | | 1,000,000 | | | | 1,004,613 | |
| | | | | | | | 4,833,049 | |
IT SERVICES† | |
| International Business Machines Corp., 1.95%, 7/22/16 | | | 980,000 | | | | 1,017,440 | |
MACHINERY† | |
| Deere & Co., 2.60%, 6/8/22 | | | 520,000 | | | | 525,178 | |
| MEDIA — 0.3% | |
| NBCUniversal Media LLC, 4.375%, 4/1/21 | | | 3,600,000 | | | | 4,059,954 | |
| News America, Inc., 6.90%, 8/15/39 | | | 3,630,000 | | | | 4,644,109 | |
| Time Warner Cable, Inc., 8.25%, 2/14/14 | | | 1,210,000 | | | | 1,287,422 | |
| Time Warner, Inc., 4.875%, 3/15/20 | | | 3,270,000 | | | | 3,750,252 | |
| | | | | | | | 13,741,737 | |
| METALS AND MINING — 0.1% | |
| Barrick North America Finance LLC, 4.40%, 5/30/21 | | | 3,000,000 | | | | 3,210,954 | |
| Newmont Mining Corp., 6.25%, 10/1/39 | | | 980,000 | | | | 1,131,145 | |
| Rio Tinto Finance USA Ltd., 3.75%, 9/20/21 | | | 2,310,000 | | | | 2,439,519 | |
| | | | | | | | 6,781,618 | |
| MULTI-UTILITIES — 0.2% | |
| Dominion Resources, Inc., 6.40%, 6/15/18 | | | 3,250,000 | | | | 4,021,638 | |
| Duke Energy Ohio, Inc., 2.10%, 6/15/13 | | | 1,950,000 | | | | 1,956,846 | |
| Pacific Gas & Electric Co., 6.25%, 12/1/13 | | | 1,820,000 | | | | 1,888,199 | |
| Sempra Energy, 6.50%, 6/1/16 | | | 1,250,000 | | | | 1,458,014 | |
| | | | | | | | 9,324,697 | |
| OIL, GAS AND CONSUMABLE FUELS — 0.2% | |
| Apache Corp., 4.75%, 4/15/43 | | | 2,170,000 | | | | 2,231,502 | |
| BP Capital Markets plc, 2.50%, 11/6/22 | | | 520,000 | | | | 507,594 | |
| ConocoPhillips, 4.75%, 2/1/14 | | | 1,598,000 | | | | 1,655,788 | |
| Occidental Petroleum Corp., 1.75%, 2/15/17 | | | 1,000,000 | | | | 1,029,527 | |
| Talisman Energy, Inc., 7.75%, 6/1/19 | | | 500,000 | | | | 634,922 | |
| Talisman Energy, Inc., 3.75%, 2/1/21 | | | 1,950,000 | | | | 2,032,610 | |
| | | | | | | | 8,091,943 | |
| PHARMACEUTICALS — 0.1% | |
AbbVie, Inc., 2.90%, 11/6/22(3) | | | 1,375,000 | | | | 1,380,138 | |
Roche Holdings, Inc., 6.00%, 3/1/19(3) | | | 2,130,000 | | | | 2,653,833 | |
| | | | | | | | 4,033,971 | |
| | | | Principal Amount | | | | Value | |
| SEMICONDUCTORS AND SEMICONDUCTOR EQUIPMENT† | | | �� | | | | | |
| Intel Corp., 2.70%, 12/15/22 | | | $350,000 | | | | $347,773 | |
SOFTWARE† | |
| Microsoft Corp., 2.125%, 11/15/22 | | | 560,000 | | | | 548,967 | |
| Oracle Corp., 2.50%, 10/15/22 | | | 1,100,000 | | | | 1,082,978 | |
| | | | | | | | 1,631,945 | |
| WIRELESS TELECOMMUNICATION SERVICES — 0.1% | |
| Cellco Partnership/Verizon Wireless Capital LLC, 5.55%, 2/1/14 | | | 2,320,000 | | | | 2,411,262 | |
| Cellco Partnership/Verizon Wireless Capital LLC, 8.50%, 11/15/18 | | | 1,560,000 | | | | 2,079,458 | |
| | | | | | | | 4,490,720 | |
TOTAL CORPORATE BONDS (Cost $102,447,094) | | | | 110,808,795 | |
Collateralized Mortgage Obligations(2) — 1.1% | |
| PRIVATE SPONSOR COLLATERALIZED MORTGAGE OBLIGATIONS — 0.9% | |
| ABN Amro Mortgage Corp., Series 2003-4, Class A4, 5.50%, 3/25/33 | | | 2,761,188 | | | | 2,858,683 | |
| ABN Amro Mortgage Corp., Series 2003-6, Class 1A4, 5.50%, 5/25/33 | | | 3,648,985 | | | | 3,775,573 | |
| Banc of America Mortgage Securities, Inc., Series 2004-7, Class 7A1, 5.00%, 8/25/19 | | | 2,342,754 | | | | 2,401,935 | |
| Banc of America Mortgage Securities, Inc., Series 2004-8, Class 5A1, 6.50%, 5/25/32 | | | 3,085,538 | | | | 3,236,994 | |
| Cendant Mortgage Corp., Series 2003-6, Class A3, 5.25%, 7/25/33 | | | 4,763,133 | | | | 4,945,223 | |
| Countrywide Home Loan Mortgage Pass-Through Trust, Series 2004-5, Class 2A4, 5.50%, 5/25/34 | | | 4,998,075 | | | | 5,179,721 | |
| MASTR Asset Securitization Trust, Series 2003-10, Class 3A1, 5.50%, 11/25/33 | | | 3,688,724 | | | | 3,897,183 | |
| PHHMC Mortgage Pass-Through Certificates, Series 2007-6, Class A1, VRN, 5.87%, 4/1/13 | | | 3,260,404 | | | | 3,456,092 | |
| Sequoia Mortgage Trust, Series 2011-1, Class A1, VRN, 4.125%, 4/1/13 | | | 1,493,019 | | | | 1,578,415 | |
| Sequoia Mortgage Trust, Series 2012-1, Class 1A1, VRN, 2.87%, 4/1/13 | | | 3,770,755 | | | | 3,870,995 | |
| Wamu Mortgage Pass-Through Certificates, Series 2003-S11, Class 3A5, 5.95%, 11/25/33 | | | 4,354,686 | | | | 4,622,134 | |
| Wells Fargo Mortgage-Backed Securities Trust, Series 2004-1, Class A10, 5.50%, 2/25/34 | | | 4,666,004 | | | | 4,905,435 | |
| Wells Fargo Mortgage-Backed Securities Trust, Series 2007-3, Class 3A1, 5.50%, 4/25/22 | | | 1,982,344 | | | | 2,050,259 | |
| | | | | | | | 46,778,642 | |
| U.S. GOVERNMENT AGENCY COLLATERALIZED MORTGAGE OBLIGATIONS — 0.2% | |
| FHLMC, Series 2824, Class LB SEQ, 4.50%, 7/15/24 | | | 11,465,363 | | | | 12,570,016 | |
TOTAL COLLATERALIZED MORTGAGE OBLIGATIONS (Cost $58,861,826) | | | | 59,348,658 | |
Municipal Securities† | |
| Bay Area Toll Authority Toll Bridge Rev., Series 2010 S1, (Building Bonds), 6.92%, 4/1/40 | | | 430,000 | | | | 587,143 | |
| Los Angeles Department of Water & Power Rev., (Building Bonds), 5.72%, 7/1/39 | | | 295,000 | | | | 365,709 | |
| Texas GO, (Building Bonds), 5.52%, 4/1/39 | | | 875,000 | | | | 1,121,829 | |
TOTAL MUNICIPAL SECURITIES (Cost $1,599,429) | | | | 2,074,681 | |
| Temporary Cash Investments — 1.1% | |
BNP Paribas Finance, Inc., 0.08%, 4/1/13(4) | | | 6,000,000 | | | | 5,999,906 | |
Liberty Street Funding LLC, 0.10%, 4/1/13(3)(4) | | | 50,000,000 | | | | 49,998,945 | |
| Repurchase Agreement, Bank of America Merrill Lynch, (collateralized by various U.S. Treasury obligations, 0.25%, 2/28/14, valued at $42,884), in a joint trading account at 0.11%, dated 3/28/13, due 4/1/13 (Delivery value $42,036) | | | | | | | 42,035 | |
| | | Shares | | | Value | |
| Repurchase Agreement, Credit Suisse First Boston, Inc., (collateralized by various U.S. Treasury obligations, 4.375%, 5/15/41, valued at $128,722), in a joint trading account at 0.13%, dated 3/28/13, due 4/1/13 (Delivery value $126,106) | | | | | $126,104 | |
| Repurchase Agreement, Goldman Sachs & Co., (collateralized by various U.S. Treasury obligations, 4.25%, 11/15/40, valued at $42,892), in a joint trading account at 0.10%, dated 3/28/13, due 4/1/13 (Delivery value $42,035) | | | | | 42,035 | |
| SSgA U.S. Government Money Market Fund | | | 271,112 | | | | 271,112 | |
TOTAL TEMPORARY CASH INVESTMENTS (Cost $56,481,286) | | | | 56,480,137 | |
TOTAL INVESTMENT SECURITIES — 99.7% (Cost $4,716,703,194) | | | | 5,331,806,343 | |
| OTHER ASSETS AND LIABILITIES — 0.3% | | | | 17,692,919 | |
| TOTAL NET ASSETS — 100.0% | | | | $5,349,499,262 | |
| Futures Contracts | |
| Contracts Purchased | Expiration Date | | Underlying Face Amount at Value | | | Unrealized Gain (Loss) | |
| | 590 | | U.S. Treasury 30-Year Bonds | June 2013 | | | $85,236,563 | | | | $610,128 | |
| Total Return Swap Agreements | |
| Counterparty | | Notional Amount | | Floating Rate Referenced Index | Pay/Receive Total Return of Referenced Index | | Fixed Rate | Termination Date | | Value | |
| Bank of America N.A. | | | $40,800,000 | | U.S. CPI Urban Consumers NSA Index | Receive | | | 1.57 | % | 9/8/14 | | | $419,393 | |
| Bank of America N.A. | | | 32,000,000 | | U.S. CPI Urban Consumers NSA Index | Receive | | | 2.33 | % | 1/22/15 | | | (423,978 | ) |
| Bank of America N.A. | | | 1,075,000 | | U.S. CPI Urban Consumers NSA Index | Receive | | | 2.28 | % | 1/21/16 | | | 5,598 | |
| Bank of America N.A. | | | 44,000,000 | | U.S. CPI Urban Consumers NSA Index | Receive | | | 1.87 | % | 9/21/16 | | | 692,092 | |
| Bank of America N.A. | | | 4,000,000 | | U.S. CPI Urban Consumers NSA Index | Receive | | | 2.42 | % | 4/1/18 | | | (27,525 | ) |
| Bank of America N.A. | | | 8,700,000 | | U.S. CPI Urban Consumers NSA Index | Receive | | | 2.51 | % | 3/30/19 | | | (88,089 | ) |
| Bank of America N.A. | | | 5,000,000 | | U.S. CPI Urban Consumers NSA Index | Receive | | | 2.66 | % | 12/4/19 | | | (118,538 | ) |
| Bank of America N.A. | | | 50,000,000 | | U.S. CPI Urban Consumers NSA Index | Receive | | | 2.62 | % | 3/18/20 | | | (871,977 | ) |
| Bank of America N.A. | | | 4,500,000 | | U.S. CPI Urban Consumers NSA Index | Receive | | | 2.67 | % | 4/1/22 | | | (63,962 | ) |
| Barclays Bank plc | | | 46,100,000 | | U.S. CPI Urban Consumers NSA Index | Receive | | | 1.58 | % | 9/6/13 | | | 241,367 | |
| Barclays Bank plc | | | 54,000,000 | | U.S. CPI Urban Consumers NSA Index | Receive | | | 1.66 | % | 9/12/14 | | | 405,450 | |
| Barclays Bank plc | | | 55,000,000 | | U.S. CPI Urban Consumers NSA Index | Receive | | | 1.69 | % | 9/22/14 | | | 358,108 | |
| Barclays Bank plc | | | 49,000,000 | | U.S. CPI Urban Consumers NSA Index | Receive | | | 1.77 | % | 9/23/14 | | | 201,819 | |
| Barclays Bank plc | | | 55,700,000 | | U.S. CPI Urban Consumers NSA Index | Receive | | | 2.10 | % | 10/23/15 | | | 126,750 | |
| Barclays Bank plc | | | 38,900,000 | | U.S. CPI Urban Consumers NSA Index | Receive | | | 2.30 | % | 1/11/16 | | | 165,883 | |
| Barclays Bank plc | | | 24,000,000 | | U.S. CPI Urban Consumers NSA Index | Receive | | | 2.74 | % | 4/25/17 | | | (1,401,668 | ) |
| Barclays Bank plc | | | 29,200,000 | | U.S. CPI Urban Consumers NSA Index | Receive | | | 2.90 | % | 12/21/27 | | | (1,797,351 | ) |
| | | | | | | | | | | | | | | $(2,176,628 | ) |
Notes to Schedule of Investments
CPI = Consumer Price Index
FHLMC = Federal Home Loan Mortgage Corporation
GO = General Obligation
MTN = Medium Term Note
NSA = Not Seasonally Adjusted
SEQ = Sequential Payer
VRN = Variable Rate Note. Interest reset date is indicated. Rate shown is effective at the period end.
† Category is less than 0.05% of total net assets.
| (1) | Security, or a portion thereof, has been pledged at the custodian bank or with a broker for margin requirements on futures contracts and/or swap agreements. At the period end, the aggregate value of securities pledged was $2,810,233. |
| (2) | Final maturity date indicated, unless otherwise noted. |
| (3) | Security was purchased under Rule 144A or Section 4(2) of the Securities Act of 1933 or is a private placement and, unless registered under the Act or exempted from registration, may only be sold to qualified institutional investors. The aggregate value of these securities at the period end was $68,641,768, which represented 1.3% of total net assets. |
| (4) | The rate indicated is the yield to maturity at purchase. |
See Notes to Financial Statements.
Statement of Assets and Liabilities |
| MARCH 31, 2013 | |
| Assets | |
| Investment securities, at value (cost of $4,716,703,194) | | | $5,331,806,343 | |
| Receivable for investments sold | | | 2,488,059 | |
| Receivable for capital shares sold | | | 9,873,889 | |
| Swap agreements, at value | | | 2,616,460 | |
| Interest receivable | | | 17,174,007 | |
| | | | 5,363,958,758 | |
| | | | | |
| Liabilities | | | | |
| Payable for capital shares redeemed | | | 7,481,208 | |
| Payable for variation margin on futures contracts | | | 55,313 | |
| Swap agreements, at value | | | 4,793,088 | |
| Accrued management fees | | | 1,933,354 | |
| Distribution and service fees payable | | | 196,533 | |
| | | | 14,459,496 | |
| | | | | |
| Net Assets | | | $5,349,499,262 | |
| | | | | |
| Net Assets Consist of: | | | | |
| Capital paid in | | | $4,696,901,701 | |
| Undistributed net investment income | | | 14,871,022 | |
| Undistributed net realized gain | | | 24,189,890 | |
| Net unrealized appreciation | | | 613,536,649 | |
| | | | $5,349,499,262 | |
| | | Net assets | | | Shares outstanding | | | Net asset value per share | |
| Investor Class | | | $3,514,082,019 | | | | 267,681,932 | | | | $13.13 | |
| Institutional Class | | | $1,067,296,999 | | | | 81,259,472 | | | | $13.13 | |
| A Class | | | $708,662,836 | | | | 54,195,794 | | | | $13.08 | * |
| C Class | | | $46,413,903 | | | | 3,546,624 | | | | $13.09 | |
| R Class | | | $13,043,505 | | | | 994,869 | | | | $13.11 | |
*Maximum offering price $13.70 (net asset value divided by 0.955).
See Notes to Financial Statements.
| YEAR ENDED MARCH 31, 2013 | |
| Investment Income (Loss) | |
| Income: | | | |
| Interest | | | $116,419,217 | |
| | | | | |
| Expenses: | | | | |
| Management fees | | | 23,206,764 | |
| Distribution and service fees: | | | | |
| A Class | | | 2,034,643 | |
| C Class | | | 406,383 | |
| R Class | | | 34,717 | |
| Trustees’ fees and expenses | | | 303,122 | |
| Other expenses | | | 15,706 | |
| | | | 26,001,335 | |
| | | | | |
| Net investment income (loss) | | | 90,417,882 | |
| | | | | |
| Realized and Unrealized Gain (Loss) | | | | |
| Net realized gain (loss) on: | | | | |
| Investment transactions | | | 81,229,912 | |
| Futures contract transactions | | | 551,860 | |
| | | | 81,781,772 | |
| | | | | |
| Change in net unrealized appreciation (depreciation) on: | | | | |
| Investments | | | 101,597,772 | |
| Futures contracts | | | 953,112 | |
| Swap agreements | | | (2,067,851 | ) |
| | | | 100,483,033 | |
| | | | | |
| Net realized and unrealized gain (loss) | | | 182,264,805 | |
| | | | | |
| Net Increase (Decrease) in Net Assets Resulting from Operations | | | $272,682,687 | |
See Notes to Financial Statements.
Statement of Changes in Net Assets |
| YEARS ENDED MARCH 31, 2013 AND MARCH 31, 2012 | |
| Increase (Decrease) in Net Assets | March 31, 2013 | | | March 31, 2012 | |
| Operations | |
| Net investment income (loss) | | $90,417,882 | | | | $140,073,135 | |
| Net realized gain (loss) | | 81,781,772 | | | | 50,123,706 | |
| Change in net unrealized appreciation (depreciation) | | 100,483,033 | | | | 285,942,134 | |
| Net increase (decrease) in net assets resulting from operations | | 272,682,687 | | | | 476,138,975 | |
| | | | | | | | |
| Distributions to Shareholders | | | | | | | |
| From net investment income: | | | | | | | |
| Investor Class | | (81,296,441 | ) | | | (106,854,611 | ) |
| Institutional Class | | (23,112,208 | ) | | | (25,345,585 | ) |
| A Class | | (16,441,379 | ) | | | (26,204,890 | ) |
| C Class | | (523,435 | ) | | | (501,750 | ) |
| R Class | | (125,076 | ) | | | (44,403 | ) |
| From net realized gains: | | | | | | | |
| Investor Class | | (31,281,151 | ) | | | (29,589,728 | ) |
| Institutional Class | | (8,299,634 | ) | | | (6,671,596 | ) |
| A Class | | (6,849,383 | ) | | | (7,538,147 | ) |
| C Class | | (376,934 | ) | | | (245,034 | ) |
| R Class | | (70,593 | ) | | | (17,855 | ) |
| Decrease in net assets from distributions | | (168,376,234 | ) | | | (203,013,599 | ) |
| | | | | | | | |
| Capital Share Transactions | | | | | | | |
| Net increase (decrease) in net assets from capital share transactions | | 184,881,843 | | | | 916,605,457 | |
| | | | | | | | |
| Net increase (decrease) in net assets | | 289,188,296 | | | | 1,189,730,833 | |
| | | | | | | | |
| Net Assets | | | | | | | |
| Beginning of period | | 5,060,310,966 | | | | 3,870,580,133 | |
| End of period | | $5,349,499,262 | | | | $5,060,310,966 | |
| | | | | | | | |
| Undistributed net investment income | | $14,871,022 | | | | $45,944,892 | |
See Notes to Financial Statements.
Notes to Financial Statements |
MARCH 31, 2013
1. Organization
American Century Government Income Trust (the trust) is registered under the Investment Company Act of 1940, as amended (the 1940 Act), as an open-end management investment company and is organized as a Massachusetts business trust. Inflation-Adjusted Bond Fund (the fund) is one fund in a series issued by the trust. The fund is diversified as defined under the 1940 Act. The fund’s investment objectives are to seek total return and inflation protection consistent with investment in inflation-indexed securities.
The fund offers the Investor Class, the Institutional Class, the A Class, the C Class and the R Class. The A Class may incur an initial sales charge. The A Class and C Class may be subject to a contingent deferred sales charge. The share classes differ principally in their respective sales charges and distribution and shareholder servicing expenses and arrangements. The Institutional Class is made available to institutional shareholders or through financial intermediaries whose clients do not require the same level of shareholder and administrative services as shareholders of other classes. As a result, the Institutional Class is charged a lower unified management fee.
2. Significant Accounting Policies
The following is a summary of significant accounting policies consistently followed by the fund in preparation of its financial statements. The financial statements are prepared in conformity with accounting principles generally accepted in the United States of America, which may require management to make certain estimates and assumptions at the date of the financial statements. Actual results could differ from these estimates.
Investment Valuations — The fund determines the fair value of its investments and computes its net asset value per share as of the close of regular trading (usually 4 p.m. Eastern time) on the New York Stock Exchange (NYSE) on each day the NYSE is open.
Debt securities maturing in greater than 60 days at the time of purchase are valued at the evaluated mean as provided by independent pricing services or at the mean of the most recent bid and asked prices as provided by investment dealers. Debt securities maturing within 60 days at the time of purchase may be valued at cost, plus or minus any amortized discount or premium or at the evaluated mean as provided by an independent pricing service. Evaluated mean prices are commonly derived through utilization of market models, which may consider, among other factors, trade data, quotations from dealers and active market makers, relevant yield curve and spread data, related sector levels, creditworthiness, and other relevant market information on the same or comparable securities.
Investments in open-end management investment companies are valued at the reported net asset value per share. Repurchase agreements are valued at cost. Exchange-traded futures contracts are valued at the settlement price as provided by the appropriate clearing corporation. Swap agreements are valued at an evaluated price as provided by independent pricing services or investment dealers.
If the fund determines that the market price for a portfolio security is not readily available or the valuation methods mentioned above do not reflect a security’s fair value, such security is valued as determined in good faith by the Board of Trustees or its designee, in accordance with procedures adopted by the Board of Trustees. Circumstances that may cause the fund to use these procedures to value a security include, but are not limited to: a security has been declared in default; trading in a security has been halted during the trading day; there is a foreign market holiday and no trading occurred; or an event occurred between the close of a foreign exchange and the NYSE that may affect the value of a security.
Security Transactions — Security transactions are accounted for as of the trade date. Net realized gains and losses are determined on the identified cost basis, which is also used for federal income tax purposes.
Investment Income — Interest income is recorded on the accrual basis and includes paydown gain (loss) and accretion of discounts and amortization of premiums. Inflation adjustments related to inflation-linked debt securities are reflected as interest income.
Repurchase Agreements — The fund may enter into repurchase agreements with institutions that American Century Investment Management, Inc. (ACIM) (the investment advisor) has determined are creditworthy pursuant to criteria adopted by the Board of Trustees. The fund requires that the collateral, represented by securities, received in a repurchase transaction be transferred to the custodian in a manner sufficient to enable the fund to obtain those securities in the event of a default under the repurchase agreement. ACIM monitors, on a daily basis, the securities transferred to ensure the value, including accrued interest, of the securities under each repurchase agreement is equal to or greater than amounts owed to the fund under each repurchase agreement.
Joint Trading Account — Pursuant to an Exemptive Order issued by the Securities and Exchange Commission, the fund, along with certain other funds in the American Century Investments family of funds, may transfer uninvested cash balances into a joint trading account. These balances are invested in one or more repurchase agreements that are collateralized by U.S. Treasury or Agency obligations.
Segregated Assets — In accordance with the 1940 Act, the fund segregates assets on its books and records to cover certain types of investments, including, but not limited to, futures contracts, forward commitments, when-issued securities, swap agreements and certain forward foreign currency exchange contracts. ACIM monitors, on a daily basis, the securities segregated to ensure the fund designates a sufficient amount of liquid assets, marked-to-market daily. The fund may also receive assets or be required to pledge assets at the custodian bank or with a broker for margin requirements on futures contracts and swap agreements.
Income Tax Status — It is the fund’s policy to distribute substantially all net investment income and net realized gains to shareholders and to otherwise qualify as a regulated investment company under provisions of the Internal Revenue Code. Accordingly, no provision has been made for income taxes. The fund files U.S. federal, state, local and non-U.S. tax returns as applicable. The fund’s tax returns are subject to examination by the relevant taxing authority until expiration of the applicable statute of limitations, which is generally three years from the date of filing but can be longer in certain jurisdictions. At this time, management believes there are no uncertain tax positions which, based on their technical merit, would not be sustained upon examination and for which it is reasonably possible that the total amounts of unrecognized tax benefits will significantly change in the next twelve months.
Multiple Class — All shares of the fund represent an equal pro rata interest in the net assets of the class to which such shares belong, and have identical voting, dividend, liquidation and other rights and the same terms and conditions, except for class specific expenses and exclusive rights to vote on matters affecting only individual classes. Income, non-class specific expenses, and realized and unrealized capital gains and losses of the fund are allocated to each class of shares based on their relative net assets.
Distributions to Shareholders — Distributions from net investment income, if any, are generally declared and paid quarterly, but may be paid less frequently. Distributions from net realized gains, if any, are generally declared and paid annually.
Indemnifications — Under the trust’s organizational documents, its officers and trustees are indemnified against certain liabilities arising out of the performance of their duties to the fund. In addition, in the normal course of business, the fund enters into contracts that provide general indemnifications. The maximum exposure under these arrangements is unknown as this would involve future claims that may be made against a fund. The risk of material loss from such claims is considered by management to be remote.
3. Fees and Transactions with Related Parties
Management Fees — The trust has entered into a management agreement with ACIM, under which ACIM provides the fund with investment advisory and management services in exchange for a single, unified management fee (the fee) per class. The agreement provides that all expenses of managing and operating the fund, except distribution and service fees, brokerage expenses, taxes, interest, fees and expenses of the independent trustees (including legal counsel fees), and extraordinary expenses, will be paid by ACIM. The fee is computed and accrued daily based on each class’s daily net assets and paid monthly in arrears. The fee consists of (1) an Investment Category Fee based on the daily net assets of the fund and certain other accounts managed by the investment advisor that are in the same broad investment category as the fund and (2) a Complex Fee based on the assets of all the funds in the American Century Investments family of funds. The rates for the Investment Category Fee range from 0.1625% to 0.2800%. The rates for the Complex Fee range from 0.2500% to 0.3100% for the Investor Class, A Class, C Class and R Class. The Institutional Class is 0.2000% less at each point within the Complex Fee range. The effective annual management fee for each class for the year ended March 31, 2013 was 0.47% for the Investor Class, A Class, C Class and R Class and 0.27% for the Institutional Class.
Distribution and Service Fees — The Board of Trustees has adopted a separate Master Distribution and Individual Shareholder Services Plan for each of the A Class, C Class and R Class (collectively the plans), pursuant to Rule 12b-1 of the 1940 Act. The plans provide that the A Class will pay American Century Investment Services, Inc. (ACIS) an annual distribution and service fee of 0.25%. The plans provide that the C Class will pay ACIS an annual distribution and service fee of 1.00%, of which 0.25% is paid for individual shareholder services and 0.75% is paid for distribution services. The plans provide that the R Class will pay ACIS an annual distribution and service fee of 0.50%. The fees are computed and accrued daily based on each class’s daily net assets and paid monthly in arrears. The fees are used to pay financial intermediaries for distribution and individual shareholder services. Fees incurred under the plans during the year ended March 31, 2013 are detailed in the Statement of Operations.
Related Parties — Certain officers and trustees of the trust are also officers and/or directors of American Century Companies, Inc. (ACC). The trust’s investment advisor, ACIM, the trust’s distributor, ACIS, and the trust’s transfer agent, American Century Services, LLC are wholly owned, directly or indirectly, by ACC. Various funds issued by American Century Asset Allocation Portfolios, Inc. own, in aggregate, 12% of the shares of the fund.
4. Investment Transactions
Purchases of investment securities, excluding short-term investments, for the year ended March 31, 2013 totaled $1,515,233,542, of which $1,435,864,336 represented U.S. Treasury and Government Agency obligations.
Sales of investment securities, excluding short-term investments, for the year ended March 31, 2013 totaled $1,428,802,962, of which $1,230,319,273 represented U.S. Treasury and Government Agency obligations.
5. Capital Share Transactions
Transactions in shares of the fund were as follows (unlimited number of shares authorized):
| | Year ended March 31, 2013 | | | Year ended March 31, 2012 | |
| | Shares | | | Amount | | | Shares | | | Amount | |
| Investor Class | | | | | | | | | | | |
| Sold | | 95,655,170 | | | | $1,269,012,254 | | | | 112,650,177 | | | | $1,438,700,110 | |
| Issued in reinvestment of distributions | | 6,588,348 | | | | 87,528,593 | | | | 8,847,566 | | | | 111,258,919 | |
| Redeemed | | (98,706,404 | ) | | | (1,305,205,650 | ) | | | (75,009,746 | ) | | | (955,953,493 | ) |
| | | 3,537,114 | | | | 51,335,197 | | | | 46,487,997 | | | | 594,005,536 | |
| Institutional Class | | | | | | | | | | | | | | | |
| Sold | | 34,270,165 | | | | 453,954,848 | | | | 32,801,016 | | | | 419,881,127 | |
| Issued in reinvestment of distributions | | 2,324,995 | | | | 30,891,397 | | | | 2,504,458 | | | | 31,498,086 | |
| Redeemed | | (17,764,483 | ) | | | (235,299,072 | ) | | | (19,460,300 | ) | | | (248,592,301 | ) |
| | | 18,830,677 | | | | 249,547,173 | | | | 15,845,174 | | | | 202,786,912 | |
| A Class | | | | | | | | | | | | | | | |
| Sold | | 17,281,341 | | | | 228,084,319 | | | | 26,291,700 | | | | 334,160,497 | |
| Issued in reinvestment of distributions | | 1,686,694 | | | | 22,340,567 | | | | 2,595,342 | | | | 32,514,637 | |
| Redeemed | | (29,639,631 | ) | | | (390,508,944 | ) | | | (21,759,335 | ) | | | (276,106,942 | ) |
| | | (10,671,596 | ) | | | (140,084,058 | ) | | | 7,127,707 | | | | 90,568,192 | |
| C Class | | | | | | | | | | | | | | | |
| Sold | | 1,673,306 | | | | 22,135,938 | | | | 2,256,037 | | | | 28,872,464 | |
| Issued in reinvestment of distributions | | 45,641 | | | | 606,936 | | | | 40,526 | | | | 513,580 | |
| Redeemed | | (636,846 | ) | | | (8,398,561 | ) | | | (261,946 | ) | | | (3,361,362 | ) |
| | | 1,082,101 | | | | 14,344,313 | | | | 2,034,617 | | | | 26,024,682 | |
| R Class | | | | | | | | | | | | | | | |
| Sold | | 882,087 | | | | 11,669,327 | | | | 363,205 | | | | 4,596,020 | |
| Issued in reinvestment of distributions | | 14,485 | | | | 192,752 | | | | 4,915 | | | | 62,258 | |
| Redeemed | | (160,640 | ) | | | (2,122,861 | ) | | | (112,764 | ) | | | (1,438,143 | ) |
| | | 735,932 | | | | 9,739,218 | | | | 255,356 | | | | 3,220,135 | |
| Net increase (decrease) | | 13,514,228 | | | | $184,881,843 | | | | 71,750,851 | | | | $916,605,457 | |
6. Fair Value Measurements
The fund’s securities valuation process is based on several considerations and may use multiple inputs to determine the fair value of the positions held by the fund. In conformity with accounting principles generally accepted in the United States of America, the inputs used to determine a valuation are classified into three broad levels as follows:
| • | Level 1 valuation inputs consist of unadjusted quoted prices in an active market for identical securities; |
| • | Level 2 valuation inputs consist of direct or indirect observable market data (including quoted prices for similar securities, evaluations of subsequent market events, interest rates, prepayment speeds, credit risk, etc.); or |
| • | Level 3 valuation inputs consist of unobservable data (including a fund’s own assumptions). |
The level classification is based on the lowest level input that is significant to the fair valuation measurement. The valuation inputs are not necessarily an indication of the risks associated with investing in these securities or other financial instruments.
The following is a summary of the level classifications as of period end. The Schedule of Investments provides additional information on the fund’s portfolio holdings.
| | Level 1 | | | Level 2 | | | Level 3 | |
| Investment Securities | | | | | | | | |
| U.S. Treasury Securities | | — | | | | $4,992,252,197 | | | | — | |
| Commercial Mortgage-Backed Securities | | — | | | | 110,841,875 | | | | — | |
| Corporate Bonds | | — | | | | 110,808,795 | | | | — | |
| Collateralized Mortgage Obligations | | — | | | | 59,348,658 | | | | — | |
| Municipal Securities | | — | | | | 2,074,681 | | | | — | |
| Temporary Cash Investments | | $271,112 | | | | 56,209,025 | | | | — | |
| Total Value of Investment Securities | | $271,112 | | | | $5,331,535,231 | | | | — | |
| | | | | | | | | | | | |
| Other Financial Instruments | | | | | | | | | | | |
| Futures Contracts | | $610,128 | | | | — | | | | — | |
| Swap Agreements | | — | | | | $(2,176,628 | ) | | | — | |
| Total Unrealized Gain (Loss) on Other Financial Instruments | | $610,128 | | | | $(2,176,628 | ) | | | — | |
7. Derivative Instruments
Interest Rate Risk — The fund is subject to interest rate risk in the normal course of pursuing its investment objectives. The value of bonds generally declines as interest rates rise. A fund may enter into futures contracts based on a bond index or a specific underlying security. A fund may purchase futures contracts to gain exposure to increases in market value or sell futures contracts to protect against a decline in market value. Upon entering into a futures contract, a fund will segregate cash, cash equivalents or other appropriate liquid securities on its records in amounts sufficient to meet requirements. Subsequent payments (variation margin) are made or received daily, in cash, by a fund. The variation margin is equal to the daily change in the contract value and is recorded as unrealized gains and losses. A fund recognizes a realized gain or loss when the futures contract is closed or expires. Net realized and unrealized gains or losses occurring during the holding period of futures contracts are a component of net realized gain (loss) on futures contract transactions and change in net unrealized appreciation (depreciation) on futures contracts, respectively. One of the risks of entering into futures contracts is the possibility that the change in value of the contract may not correlate with the changes in value of the underlying securities. The interest rate risk derivative instruments held at period end as disclosed on the Schedule of Investments are indicative of the fund’s typical volume during the period.
Other Contracts — A fund may enter into total return swap agreements in order to attempt to obtain or preserve a particular return or spread at a lower cost than obtaining a return or spread through purchases and/or sales of instruments in other markets or gain exposure to certain markets in the most economical way possible. A fund will segregate cash, cash equivalents or other appropriate liquid securities on its records in amounts sufficient to meet requirements. Changes in value, including the periodic amounts of interest to be paid or received on swap agreements, are recorded as unrealized appreciation (depreciation) on swap agreements. Realized gain or loss is recorded upon receipt or payment of a periodic settlement or termination of swap agreements. Net realized and unrealized gains or losses occurring during the holding period of swap agreements are a component of net realized gain (loss) on swap agreement transactions and change in net unrealized appreciation (depreciation) on swap agreements, respectively. The risks of entering into swap agreements include the possible lack of liquidity, failure of the counterparty to meet its obligations, and that there may be unfavorable changes in the underlying investments or instruments. The other contracts derivative instruments held at period end as disclosed on the Schedule of Investments are indicative of the fund’s typical volume during the period.
| Value of Derivative Instruments as of March 31, 2013 | |
| | Asset Derivatives | | Liability Derivatives | |
Type of Risk Exposure | Location on Statement of Assets and Liabilities | | Value | | Location on Statement of Assets and Liabilities | | Value | |
| Interest Rate Risk | Receivable for variation margin on futures contracts* | | | — | | Payable for variation margin on futures contracts* | | | $55,313 | |
| Other Contracts | Swap agreements | | | $2,616,460 | | Swap agreements | | | 4,793,088 | |
| | | | | $2,616,460 | | | | | $4,848,401 | |
*Included in the unrealized gain (loss) on futures contracts as reported in the Schedule of Investments.
Effect of Derivative Instruments on the Statement of Operations for the Year Ended March 31, 2013
| | |
| | Net Realized Gain (Loss) | | Change in Net Unrealized Appreciation (Depreciation) | |
Type of Risk Exposure | Location on Statement of Operations | | Value | | Location on Statement of Operations | | Value | |
| Interest Rate Risk | Net realized gain (loss) on futures contract transactions | | | $551,860 | | Change in net unrealized appreciation (depreciation) on futures contracts | | | $953,112 | |
| Other Contracts | Net realized gain (loss) on swap agreement transactions | | | — | | Change in net unrealized appreciation (depreciation) on swap agreements | | | (2,067,851 | ) |
| | | | | $551,860 | | | | | $(1,114,739 | ) |
8. Federal Tax Information
The tax character of distributions paid during the years ended March 31, 2013 and
March 31, 2012 were as follows:
| | | | | | | |
| | | 2013 | | | 2012 | |
| Distributions Paid From | | | | | | |
| Ordinary income | | | $137,498,462 | | | | $179,798,333 | |
| Long-term capital gains | | | $30,877,772 | | | | $23,215,266 | |
The book-basis character of distributions made during the year from net investment income or net realized gains may differ from their ultimate characterization for federal income tax purposes. These differences reflect the differing character of certain income items and net realized gains and losses for financial statement and tax purposes, and may result in reclassification among certain capital accounts on the financial statements.
As of March 31, 2013, the federal tax cost of investments and the components of distributable earnings on a tax-basis were as follows:
| Federal tax cost of investments | | | $4,724,006,655 | |
| Gross tax appreciation of investments | | | $609,505,490 | |
| Gross tax depreciation of investments | | | (1,705,802 | ) |
| Net tax appreciation (depreciation) of investments | | | $607,799,688 | |
| Net tax appreciation (depreciation) on derivatives | | | $(2,176,629 | ) |
| Net tax appreciation (depreciation) | | | $605,623,059 | |
| Other book-to-tax adjustments | | | $(15,013,410 | ) |
| Undistributed ordinary income | | | $17,321,709 | |
| Accumulated long-term gains | | | $44,666,203 | |
The difference between book-basis and tax-basis unrealized appreciation (depreciation) is attributable primarily to the tax deferral of losses on wash sales. Other book-to-tax adjustments are attributable primarily to the tax deferral of losses on straddle positions.
| For a Share Outstanding Throughout the Years Ended March 31 (except as noted) |
| Per-Share Data | Ratios and Supplemental Data |
| | | Income From Investment Operations: | Distributions From: | | | Ratio to Average Net Assets of: | | |
| | Net Asset Value, Beginning of Period | Net Investment Income (Loss)(1) | Net Realized and Unrealized Gain (Loss) | Total From Investment Operations | Net Investment Income | Net Realized Gains | Tax Return of Capital | Total Distributions | Net Asset Value, End of Period | Total Return(2) | Operating Expenses | Net Investment Income (Loss) | Portfolio Turnover Rate | Net Assets, End of Period (in thousands) |
| Investor Class |
| 2013 | $12.85 | 0.23 | 0.46 | 0.69 | (0.30) | (0.11) | — | (0.41) | $13.13 | 5.36% | 0.47% | 1.69% | 27% | $3,514,082 |
| 2012 | $12.01 | 0.40 | 1.01 | 1.41 | (0.45) | (0.12) | — | (0.57) | $12.85 | 11.99% | 0.48% | 3.15% | 26% | $3,393,055 |
| 2011 | $11.52 | 0.31 | 0.51 | 0.82 | (0.26) | (0.07) | — | (0.33) | $12.01 | 7.18% | 0.48% | 2.58% | 33% | $2,614,427 |
| 2010 | $11.06 | 0.40 | 0.24 | 0.64 | (0.18) | — | — | (0.18) | $11.52 | 5.76% | 0.48% | 3.49% | 27% | $2,266,660 |
| 2009 | $11.72 | 0.17 | (0.35) | (0.18) | (0.40) | — | (0.08) | (0.48) | $11.06 | (1.51)% | 0.49% | 1.61% | 18% | $1,187,202 |
| Institutional Class |
| 2013 | $12.85 | 0.24 | 0.47 | 0.71 | (0.32) | (0.11) | — | (0.43) | $13.13 | 5.57% | 0.27% | 1.89% | 27% | $1,067,297 |
| 2012 | $12.01 | 0.43 | 1.01 | 1.44 | (0.48) | (0.12) | — | (0.60) | $12.85 | 12.16% | 0.28% | 3.35% | 26% | $802,309 |
| 2011 | $11.52 | 0.34 | 0.50 | 0.84 | (0.28) | (0.07) | — | (0.35) | $12.01 | 7.39% | 0.28% | 2.78% | 33% | $559,589 |
| 2010 | $11.06 | 0.41 | 0.25 | 0.66 | (0.20) | — | — | (0.20) | $11.52 | 5.98% | 0.28% | 3.69% | 27% | $407,799 |
| 2009 | $11.71 | 0.16 | (0.32) | (0.16) | (0.41) | — | (0.08) | (0.49) | $11.06 | (1.32)% | 0.29% | 1.81% | 18% | $210,177 |
A Class(3) |
| 2013 | $12.80 | 0.20 | 0.45 | 0.65 | (0.26) | (0.11) | — | (0.37) | $13.08 | 5.12% | 0.72% | 1.44% | 27% | $708,663 |
| 2012 | $11.97 | 0.37 | 1.01 | 1.38 | (0.43) | (0.12) | — | (0.55) | $12.80 | 11.72% | 0.73% | 2.90% | 26% | $830,062 |
| 2011 | $11.49 | 0.27 | 0.51 | 0.78 | (0.23) | (0.07) | — | (0.30) | $11.97 | 6.84% | 0.73% | 2.33% | 33% | $691,362 |
| 2010 | $11.03 | 0.37 | 0.24 | 0.61 | (0.15) | — | — | (0.15) | $11.49 | 5.52% | 0.73% | 3.24% | 27% | $709,931 |
| 2009 | $11.70 | 0.18 | (0.38) | (0.20) | (0.39) | — | (0.08) | (0.47) | $11.03 | (1.73)% | 0.74% | 1.36% | 18% | $500,882 |
| For a Share Outstanding Throughout the Years Ended March 31 (except as noted) |
| Per-Share Data | Ratios and Supplemental Data |
| | | Income From Investment Operations: | Distributions From: | | | Ratio to Average Net Assets of: | | |
| | Net Asset Value, Beginning of Period | Net Investment Income (Loss)(1) | Net Realized and Unrealized Gain (Loss) | Total From Investment Operations | Net Investment Income | Net Realized Gains | Tax Return of Capital | Total Distributions | Net Asset Value, End of Period | Total Return(2) | Operating Expenses | Net Investment Income (Loss) | Portfolio Turnover Rate | Net Assets, End of Period (in thousands) |
| C Class |
| 2013 | $12.81 | 0.07 | 0.49 | 0.56 | (0.17) | (0.11) | — | (0.28) | $13.09 | 4.34% | 1.47% | 0.69% | 27% | $46,414 |
| 2012 | $12.00 | 0.15 | 1.13 | 1.28 | (0.35) | (0.12) | — | (0.47) | $12.81 | 10.85% | 1.48% | 2.15% | 26% | $31,563 |
| 2011 | $11.51 | 0.21 | 0.49 | 0.70 | (0.14) | (0.07) | — | (0.21) | $12.00 | 6.11% | 1.48% | 1.58% | 33% | $5,159 |
2010(4) | $11.51 | 0.03 | (0.03) | — | — | — | — | — | $11.51 | 0.00% | 1.48%(5) | 3.67%(5) | 27%(6) | $139 |
| R Class |
| 2013 | $12.83 | 0.08 | 0.54 | 0.62 | (0.23) | (0.11) | — | (0.34) | $13.11 | 4.85% | 0.97% | 1.19% | 27% | $13,044 |
| 2012 | $12.01 | 0.21 | 1.13 | 1.34 | (0.40) | (0.12) | — | (0.52) | $12.83 | 11.37% | 0.98% | 2.65% | 26% | $3,322 |
| 2011 | $11.52 | 0.26 | 0.50 | 0.76 | (0.20) | (0.07) | — | (0.27) | $12.01 | 6.64% | 0.98% | 2.08% | 33% | $43 |
2010(4) | $11.51 | 0.04 | (0.03) | 0.01 | — | — | — | — | $11.52 | 0.09% | 0.98%(5) | 4.17%(5) | 27%(6) | $25 |
Notes to Financial Highlights
| (1) | Computed using average shares outstanding throughout the period. |
| (2) | Total returns are calculated based on the net asset value of the last business day and do not reflect applicable sales charges, if any. Total returns for periods less than one year are not annualized. |
| (3) | Prior to March 1, 2010, the A Class was referred to as the Advisor Class. |
| (4) | March 1, 2010 (commencement of sale) through March 31, 2010. |
| (6) | Portfolio turnover is calculated at the fund level. Percentage indicated was calculated for the year ended March 31, 2010. |
See Notes to Financial Statements.
Report of Independent Registered Public Accounting Firm |
To the Trustees of the American Century Government Income Trust
and Shareholders of the Inflation-Adjusted Bond Fund:
In our opinion, the accompanying statement of assets and liabilities, including the schedule of investments, and the related statements of operations and of changes in net assets and the financial highlights present fairly, in all material respects, the financial position of the Inflation-Adjusted Bond Fund (one of the five funds comprising the American Century Government Income Trust, hereafter referred to as the “Fund”) at March 31, 2013, the results of its operations for the year then ended, the changes in its net assets for each of the two years in the period then ended and the financial highlights for each of the periods presented, in conformity with accounting principles generally accepted in the United States of America. These financial statements and financial highlights (hereafter referred to as “financial statements”) are the responsibility of the Fund’s management; our responsibility is to express an opinion on these financial statements based on our audits. We conducted our audits of these financial statements in accordance with the standards of the Public Company Accounting Oversight Board (United States). Those standards require that we plan and perform the audit to obtain reasonable assurance about whether the financial statements are free of material misstatement. An audit includes examining, on a test basis, evidence supporting the amounts and disclosures in the financial statements, assessing the accounting principles used and significant estimates made by management, and evaluating the overall financial statement presentation. We believe that our audits, which included confirmation of securities at March 31, 2013 by correspondence with the custodian and brokers, provide a reasonable basis for our opinion.
PricewaterhouseCoopers LLP
Kansas City, Missouri
May 21, 2013
Board of Trustees
The individuals listed below serve as trustees of the funds. Each trustee will continue to serve in this capacity until death, retirement, resignation or removal from office. The board has adopted a mandatory retirement age for trustees who are not “interested persons,” as that term is defined in the Investment Company Act (independent trustees). Independent trustees shall retire on December 31 of the year in which they reach their 75th birthday; provided, however, that on or after January 1, 2022, independent trustees shall retire on December 31 of the year in which they reach their 76th birthday.
Mr. Thomas is the only trustee who is an “interested person” because he currently serves as President and Chief Executive Officer of American Century Companies, Inc. (ACC), the parent company of American Century Investment Management, Inc. (ACIM or the advisor).
The other trustees (more than three-fourths of the total number) are independent; that is, they have never been employees, directors or officers of, and have no financial interest in, ACC or any of its wholly owned, direct or indirect, subsidiaries, including ACIM, American Century Investment Services, Inc. (ACIS) and American Century Services, LLC (ACS). The trustees serve in this capacity for eight (in the case of Mr. Thomas, 15) registered investment companies in the American Century Investments family of funds.
The following table presents additional information about the trustees. The mailing address for each trustee other than Mr. Thomas is 1665 Charleston Road, Mountain View, California 94043. The mailing address for Mr. Thomas is 4500 Main Street, Kansas City, Missouri 64111.
Name (Year of Birth) | Position(s) Held with Funds | Length of Time Served | Principal Occupation(s) During Past 5 Years | | Number of American Century Portfolios Overseen by Trustee | Other Directorships Held During Past 5 Years |
| Independent Trustees |
Tanya S. Beder (1955) | Trustee | Since 2011 | Chairman, SBCC Group Inc. (independent advisory services) (2006 to present) | | 42 | CYS Investments, Inc. (specialty finance company) |
Jeremy I. Bulow (1954) | Trustee | Since 2011 | Professor of Economics, Stanford University, Graduate School of Business (1979 to present) | | 42 | None |
Ronald J. Gilson (1946) | Trustee and Chairman of the Board | Since 1995 | Charles J. Meyers Professor of Law and Business, Stanford Law School (1979 to present); Marc and Eva Stern Professor of Law and Business, Columbia University School of Law (1992 to present) | | 42 | None |
Frederick L. A. Grauer (1946) | Trustee | Since 2008 | Senior Advisor, BlackRock, Inc. (investment management firm) (2010 to 2011); Senior Advisor, Barclays Global Investors (investment management firm) (2003 to 2009) | | 42 | None |
Name (Year of Birth) | Position(s) Held with Funds | Length of Time Served | Principal Occupation(s) During Past 5 Years | | Number of American Century Portfolios Overseen by Trustee | Other Directorships Held During Past 5 Years |
| Independent Trustees |
Peter F. Pervere (1947) | Trustee | Since 2007 | Retired | | 42 | Intraware, Inc. (2003 to 2009) |
Myron S. Scholes (1941) | Trustee | Since 1980 | Chairman, Platinum Grove Asset Management, L.P. (asset manager) (1999 to 2009); Frank E. Buck Professor of Finance-Emeritus, Stanford Graduate School of Business (1996 to present) | | 42 | Dimensional Fund Advisors (investment advisor); CME Group, Inc. (futures and options exchange) |
John B. Shoven (1947) | Trustee | Since 2002 | Professor of Economics, Stanford University (1973 to present) | | 42 | Cadence Design Systems; Exponent; Financial Engines |
| |
| Interested Trustee |
Jonathan S. Thomas (1963) | Trustee and President | Since 2007 | President and Chief Executive Officer, ACC (March 2007 to present). Also serves as Chief Executive Officer and Manager, ACS; Executive Vice President, ACIM; Director, ACC, ACIM and other ACC subsidiaries | | 107 | None |
Officers
The following table presents certain information about the executive officers of the funds. Each officer serves as an officer for each of the 15 investment companies in the American Century family of funds, unless otherwise noted. No officer is compensated for his or her service as an officer of the funds. The listed officers are interested persons of the funds and are appointed or re-appointed on an annual basis. The mailing address for each of the officers listed below is 4500 Main Street, Kansas City, Missouri 64111.
Name (Year of Birth) | Offices with the Funds | Principal Occupation(s) During the Past Five Years |
Jonathan S. Thomas (1963) | Trustee and President since 2007 | President and Chief Executive Officer, ACC (March 2007 to present). Also serves as Chief Executive Officer and Manager, ACS; Executive Vice President, ACIM; Director, ACC, ACIM and other ACC subsidiaries |
Maryanne L. Roepke (1956) | Chief Compliance Officer since 2006 and Senior Vice President since 2000 | Chief Compliance Officer, American Century funds, ACIM and ACS (August 2006 to present). Also serves as Senior Vice President, ACS |
Charles A. Etherington (1957) | General Counsel since 2007 and Senior Vice President since 2006 | Attorney, ACC (February 1994 to present); Vice President, ACC (November 2005 to present); General Counsel, ACC (March 2007 to present). Also serves as General Counsel, ACIM, ACS, ACIS and other ACC subsidiaries; and Senior Vice President, ACIM and ACS |
C. Jean Wade (1964) | Vice President, Treasurer and Chief Financial Officer since 2012 | Vice President, ACS (February 2000 to present) |
Robert J. Leach (1966) | Vice President since 2006 and Assistant Treasurer since 2012 | Vice President, ACS (February 2000 to present) |
David H. Reinmiller (1963) | Vice President since 2001 | Attorney, ACC (January 1994 to present); Associate General Counsel, ACC (January 2001 to present). Also serves as Vice President, ACIM and ACS |
Ward D. Stauffer (1960) | Secretary since 2005 | Attorney, ACC (June 2003 to present) |
The Statement of Additional Information has additional information about the fund’s trustees and is available without charge, upon request, by calling 1-800-345-2021.
Retirement Account Information
As required by law, distributions you receive from certain IRAs are subject to federal income tax withholding, unless you elect not to have withholding apply. Tax will be withheld on the total amount withdrawn even though you may be receiving amounts that are not subject to withholding, such as nondeductible contributions. In such case, excess amounts of withholding could occur. You may adjust your withholding election so that a greater or lesser amount will
be withheld.
If you don’t want us to withhold on this amount, you must notify us to not withhold the federal income tax. You may notify us in writing or in certain situations by telephone or through other electronic means. For systematic withdrawals, your withholding election will remain in effect until revoked or changed by filing a new election. You have the right to revoke your election at any time.
Remember, even if you elect not to have income tax withheld, you are liable for paying income tax on the taxable portion of your withdrawal. If you elect not to have income tax withheld or you don’t have enough income tax withheld, you may be responsible for payment of estimated tax. You may incur penalties under the estimated tax rules if your withholding and estimated tax payments are not sufficient. You can reduce or defer the income tax on a distribution by directly or indirectly rolling such distribution over to another IRA or eligible plan. You should consult your tax advisor for additional information.
State tax will be withheld if, at the time of your distribution, your address is within one of the mandatory withholding states and you have federal income tax withheld (or as otherwise required by state law). State taxes will be withheld from your distribution in accordance with the respective state rules.
Distributions you receive from 403(b), 457 and qualified plans are subject to special tax and withholding rules. Your plan administrator or plan sponsor is required to provide you with a special tax notice explaining those rules at the time you request a distribution. If applicable, federal and/or state taxes may be withheld from your distribution amount.
Proxy Voting Guidelines
American Century Investment Management, Inc., the fund’s investment advisor, is responsible for exercising the voting rights associated with the securities purchased and/or held by the fund. A description of the policies and procedures the advisor uses in fulfilling this responsibility is available without charge, upon request, by calling 1-800-345-2021. It is also available on American Century Investments’ website at americancentury.com and on the Securities and Exchange Commission’s website at sec.gov. Information regarding how the investment advisor voted proxies relating to portfolio securities during the most recent 12-month period ended June 30 is available on the “About Us” page at americancentury.com. It is also available at sec.gov.
Quarterly Portfolio Disclosure
The fund files its complete schedule of portfolio holdings with the Securities and Exchange Commission (SEC) for the first and third quarters of each fiscal year on Form N-Q. The fund’s Forms N-Q are available on the SEC’s website at sec.gov, and may be reviewed and copied at the SEC’s Public Reference Room in Washington, DC. Information on the operation of the Public Reference Room may be obtained by calling 1-800-SEC-0330. The fund also makes its complete schedule of portfolio holdings for the most recent quarter of its fiscal year available on its website at americancentury.com and, upon request, by calling 1-800-345-2021.
Other Tax Information
The following information is provided pursuant to provisions of the Internal Revenue Code.
The fund hereby designates $30,877,772, or up to the maximum amount allowable, as long-term capital gain distributions for the fiscal year ended March 31, 2013.
The fund hereby designates $15,999,923 as qualified short-term capital gain distributions for purposes of Internal Revenue Code Section 871.
| Contact Us | americancentury.com |
| Automated Information Line | 1-800-345-8765 |
| Investor Services Representative | 1-800-345-2021 or 816-531-5575 |
| Investors Using Advisors | 1-800-378-9878 |
Business, Not-For-Profit, Employer-Sponsored Retirement Plans | 1-800-345-3533 |
Banks and Trust Companies, Broker-Dealers, Financial Professionals, Insurance Companies | 1-800-345-6488 |
| Telecommunications Device for the Deaf | 1-800-634-4113 |
American Century Government Income Trust
Investment Advisor:
American Century Investment Management, Inc.
Kansas City, Missouri
This report and the statements it contains are submitted for the general information of our shareholders. The report is not authorized for distribution to prospective investors unless preceded or accompanied by an effective prospectus.
©2013 American Century Proprietary Holdings, Inc. All rights reserved.
CL-ANN-78341 1305
ANNUAL REPORT MARCH 31, 2013
| | Short-Term Government Fund |
| President’s Letter | 2 |
| Market Perspective | 3 |
| Performance | 4 |
| Portfolio Commentary | 6 |
| Fund Characteristics | 8 |
| Shareholder Fee Example | 9 |
| Schedule of Investments | 11 |
| Statement of Assets and Liabilities | 14 |
| Statement of Operations | 15 |
| Statement of Changes in Net Assets | 16 |
| Notes to Financial Statements | 17 |
| Financial Highlights | 22 |
| Report of Independent Registered Public Accounting Firm | 24 |
| Management | 25 |
| Additional Information | 28 |
Any opinions expressed in this report reflect those of the author as of the date of the report, and do not necessarily represent the opinions of American Century Investments® or any other person in the American Century Investments organization. Any such opinions are subject to change at any time based upon market or other conditions and American Century Investments disclaims any responsibility to update such opinions. These opinions may not be relied upon as investment advice and, because investment decisions made by American Century Investments funds are based on numerous factors, may not be relied upon as an indication of trading intent on behalf of any American Century Investments fund. Security examples are used for representational purposes only and are not intended as recommendations to purchase or sell securities. Performance information for comparative indices and securities is provided to American Century Investments by third party vendors. To the best of American Century Investments’ knowledge, such information is accurate at the time of printing.
Dear Investor:
Thank you for reviewing this annual report for the 12 months ended March 31, 2013. It offers investment performance, market analysis, and portfolio information, presented with the expert perspective of our portfolio management team.
Annual reports remain important vehicles for conveying information about fund returns, including key factors that affected fund performance. For additional, updated investment and market insights, we encourage you to visit our website, americancentury.com.
Positive Fiscal-Year Returns for U.S. Stock and Bond Benchmarks
Despite a global economic slowdown, continued concerns about European financial system stability, and uncertainty about U.S. political and fiscal conditions, 12-month U.S. stock and bond index returns were generally positive. Aggressive central bank monetary policies helped motivate investors to take more risk and kept short-term interest rates low.
U.S. mid-cap and value stocks and high-yield bonds achieved performance leadership during the period. U.S. mid-cap and value stock indices outpaced the S&P 500 Index’s 13.96% return, and U.S. corporate high-yield and municipal high-yield benchmarks performed in that 13-14% return range as well. U.S. growth and international index returns were generally lower, but still above average—the MSCI EAFE Index, for example, returned 11.25%.
With the exception of high-yield bond sectors, stocks generally outperformed bonds for the period, though bonds benefitted from economic stagnation, reduced inflation pressures, and low interest rates. The 10-year U.S. Treasury yield declined from 2.21% to 1.85% during the period, and the Barclays U.S. Aggregate Bond Index returned 3.78%.
The U.S. economy showed signs of improvement during the fiscal year, particularly the long-depressed housing market. However, the U.S. economic growth outlook for 2013 remains subpar compared with past recession recoveries, still vulnerable to fiscal and financial factors that could trigger further slowdowns and market volatility.
Under these conditions, we continue to believe in a disciplined, diversified, long-term investment approach, using professionally managed stock and bond portfolios—as appropriate—for meeting financial goals. We appreciate your continued trust in us in this challenging environment.
Sincerely,
Jonathan Thomas
President and Chief Executive Officer
American Century Investments
By David MacEwen, Chief Investment Officer, Fixed Income
Central Banks Set Market Tone
Market sentiment wavered between risk taking and risk aversion during the 12-month period ended March 31, 2013, with risk taking generally prevailing. Persistent concerns about weak global economic growth, combined with Europe’s ongoing financial crisis and bouts of political uncertainty in the U.S. (first from the presidential election and then from the year-end “fiscal cliff” of federal tax hikes and spending cuts), triggered risk aversion, while optimism inspired by aggressive central bank monetary policies led to risk taking.
Early in the period, slowing economic growth, still-high unemployment, and ongoing problems in Europe led to a round of risk aversion that favored U.S. Treasuries. In response to the fragile economic backdrop, the Federal Reserve (the Fed) kept its overnight interest rate target near 0% and announced its third and most aggressive quantitative easing program (QE3), which has the Fed purchasing $40 billion of mortgage-backed securities (MBS) each month until economic growth and employment improve. The Fed expanded QE3 in December to include $45 billion in monthly Treasury purchases. Meanwhile, the European Central Bank launched several programs to help the eurozone’s troubled banks, and the Bank of Japan aggressively expanded its balance sheet.
Investors Favored Risk, Feared Long-Term Inflation
Overall, widespread central bank intervention drove down yields among higher-quality bonds and ultimately sparked investments in riskier asset classes. Both high-yield and investment-grade corporate bonds were among the taxable U.S. fixed-income market’s top performers for the period, benefitting from generally favorable corporate fundamentals and investor demand for yield.
At the same time, longer-term Treasury yields tumbled and the yield curve (which shows the relationship between bond maturities and yields across the maturity spectrum) flattened. These factors, combined with strong safe-haven demand that occasionally emerged and overall sluggish economic growth, led to relative outperformance for longer-maturity Treasuries. Treasury outperformance, combined with some long-term inflation concerns triggered by central bank policies, led to relative outperformance for Treasury inflation-protected securities (TIPS).
| U.S. Fixed-Income Total Returns |
| For the 12 months ended March 31, 2013 |
| Barclays U.S. Bond Market Indices | | | Barclays U.S. Treasury Bellwethers | |
| Corporate High-Yield | 13.13% | | 3-Month Bill | 0.13% |
| Corporate (investment-grade) | 7.47% | | 2-Year Note | 0.48% |
| Treasury Inflation Protected Securities (TIPS) | 5.68% | | 10-Year Note | 6.20% |
| Aggregate (multi-sector) | 3.78% | | 30-Year Bond | 7.48% |
| Treasury | 3.14% | | | |
| MBS (mortgage-backed securities) | 1.97% | | | |
| Total Returns as of March 31, 2013 |
| | | | Average Annual Returns | |
| | Ticker Symbol | 1 year | 5 years | 10 years | Since Inception | Inception Date |
| Investor Class | TWUSX | 0.33% | 1.78% | 2.47% | 5.32% | 12/15/82 |
| Barclays U.S. 1-3 Year Government Bond Index | — | 0.66% | 1.91% | 2.78% | 6.13%(1) | — |
| Institutional Class | TWUOX | 0.64% | — | — | 1.27% | 3/1/10 |
A Class(2) No sales charge* With sales charge* | TWAVX | 0.14% -2.06% | 1.54% 1.09% | 2.22% 1.99% | 3.14% 2.98% | 7/8/98 |
| C Class | TWACX | -0.55% | — | — | 0.07% | 3/1/10 |
| R Class | TWARX | -0.14% | — | — | 0.56% | 3/1/10 |
| Sales charges include initial sales charges and contingent deferred sales charges (CDSCs), as applicable. A Class shares have a 2.25% maximum initial sales charge and may be subject to a maximum CDSC of 1.00%. C Class shares redeemed within 12 months of purchase are subject to a maximum CDSC of 1.00%. The SEC requires that mutual funds provide performance information net of maximum sales charges in all cases where charges could be applied. |
| (1) | Since 12/31/82, the date nearest the Investor Class’s inception for which data are available. |
| (2) | Prior to March 1, 2010, the A Class was referred to as the Advisor Class and did not have a front-end sales charge. Performance prior to that date has been adjusted to reflect this charge. |
Data presented reflect past performance. Past performance is no guarantee of future results. Current performance may be higher or lower than the performance shown. Investment return and principal value will fluctuate, and redemption value may be more or less than original cost. To obtain performance data current to the most recent month end, please call 1-800-345-2021 or visit americancentury.com. As interest rates rise, bond values will decline.
Unless otherwise indicated, performance reflects Investor Class shares; performance for other share classes will vary due to differences in fee structure. For information about other share classes available, please consult the prospectus. Data assumes reinvestment of dividends and capital gains, and none of the charts reflect the deduction of taxes that a shareholder would pay on fund distributions or the redemption of fund shares. Returns for the index are provided for comparison. The fund’s total returns include operating expenses (such as transaction costs and management fees) that reduce returns, while the total returns of the index do not.
| Growth of $10,000 Over 10 Years |
| $10,000 investment made March 31, 2003 |
| Total Annual Fund Operating Expenses |
| Investor Class | Institutional Class | A Class | C Class | R Class |
| 0.56% | 0.36% | 0.81% | 1.56% | 1.06% |
The total annual fund operating expenses shown is as stated in the fund’s prospectus current as of the date of this report. The prospectus may vary from the expense ratio shown elsewhere in this report because it is based on a different time period, includes acquired fund fees and expenses, and, if applicable, does not include fee waivers or expense reimbursements.
Data presented reflect past performance. Past performance is no guarantee of future results. Current performance may be higher or lower than the performance shown. Investment return and principal value will fluctuate, and redemption value may be more or less than original cost. To obtain performance data current to the most recent month end, please call 1-800-345-2021 or visit americancentury.com. As interest rates rise, bond values will decline.
Unless otherwise indicated, performance reflects Investor Class shares; performance for other share classes will vary due to differences in fee structure. For information about other share classes available, please consult the prospectus. Data assumes reinvestment of dividends and capital gains, and none of the charts reflect the deduction of taxes that a shareholder would pay on fund distributions or the redemption of fund shares. Returns for the index are provided for comparison. The fund’s total returns include operating expenses (such as transaction costs and management fees) that reduce returns, while the total returns of the index do not.
Portfolio Managers: Bob Gahagan, Hando Aguilar, Brian Howell, Dan Shiffman, and Jim Platz
Performance Summary
Short-Term Government returned 0.33%* for the 12 months ended March 31, 2013. By comparison, the portfolio’s benchmark, the Barclays U.S. 1-3 Year Government Bond Index, returned 0.66%. See pages 4 and 5 for additional performance comparisons. Portfolio returns reflect operating expenses, while index returns do not.
Short-Term Government’s absolute return reflected the relatively flat performance of short-term government bonds during the period. Relative to the benchmark, the main detractor was an underweight position to agency securities during the reporting period.
Short-Maturity Treasuries Lagged Agencies, MBS
With U.S. Treasury yields remaining at relatively low levels, we maintained underweight positions in Treasuries and agencies and an overweight position in the higher-yielding mortgage-backed securities (MBS) sector throughout the 12-month period. This positioning generated mixed results. MBS and government agency securities generally outperformed Treasuries within the fund’s maturity range. So, the overweight to MBS aided performance, while the underweight to agencies was a slight detractor. The Federal Reserve’s (the Fed’s) ongoing stimulus programs, including an unusually accommodative interest rate policy that has kept the federal funds rate target near 0% for more than four years, essentially “anchored” yields on short-maturity Treasuries, and returns were relatively muted.
Meanwhile, investors in the short-maturity, high-quality market generally favored government agency securities and MBS for their relative yield advantages versus comparable-maturity Treasuries. In addition, both sectors rallied in the fourth quarter of 2012, following the Fed’s mid-September announcement of a third round of quantitative easing (QE3), or the monthly purchase of $40 billion in agency MBS. (The Fed later expanded QE3 to include $45 billion in monthly Treasury purchases.)
Selection Among MBS Helped Results
Security selection within the portfolio’s mortgage component contributed positively to the fund’s 12-month return. In particular, we favored higher-yielding collateralized mortgage obligations (CMOs) while maintaining a neutral weighting to traditional government agency pass-through MBS. CMOs generally outperformed traditional MBS, and the fund’s modest overweight position to CMOs helped lift the fund’s performance. Throughout the 12-month period, investors generally favored “structured mortgage products,” such as CMOs, which generally experience less refinancing-associated price volatility and offer more-predictable cash flows.
*All fund returns referenced in this commentary are for Investor Class shares.
Late in the period, we added exposure to hybrid agency adjustable-rate mortgages (ARMs). These securities combine the characteristics of fixed- and adjustable-rate mortgages, with rates fixed for a set period of time before adjusting periodically according to a specific index. We believe the short duration (price sensitivity to interest rate changes) and low supply of hybrid ARMs should benefit portfolio performance when mortgage rates begin to rise.
Inflation Outlook Prompted TIPS Overweight
Within the fund’s Treasury allocation, we maintained a small overweight position to Treasury inflation-protected securities (TIPS), which aided relative performance during the period. We believe the Fed’s open-ended QE3 likely will lead to higher long-term inflation than is currently accounted for in the financial markets, and TIPS should benefit from such a scenario.
Outlook
“In 2013, we expect economic growth to remain subpar, with U.S. growth remaining between 1% and 3%,” says the Fixed Income Macro Strategy Team at American Century Investments. “Despite improvements in employment and housing, we believe the odds of a sustained upside breakout in growth in 2013 remain limited, given the headwinds of fiscal consolidation, higher taxes, and increased regulation.
“In the near term, we believe interest rates likely will remain in a fairly tight range. Longer term, the bias is for rates to trend higher.”
In that context, we will maintain our disciplined, relative-value approach to portfolio management, emphasizing careful security selection and risk management. We are likely to keep the fund’s duration close to that of the benchmark, and in terms of sector allocation, we continue to favor a modest overweight to MBS, focusing on structured mortgage products over traditional pass-through mortgage securities.
| MARCH 31, 2013 | |
| Portfolio at a Glance | |
| Average Duration (effective) | 1.8 years |
| Weighted Average Life | 2.1 years |
| | |
| Types of Investments in Portfolio | % of net assets |
| U.S. Treasury Securities | 78.1% |
| Collateralized Mortgage Obligations | 11.0% |
| U.S. Government Agency Mortgage-Backed Securities | 6.9% |
| U.S. Government Agency Securities | 3.1% |
| Temporary Cash Investments | 0.5% |
| Other Assets and Liabilities | 0.4% |
Fund shareholders may incur two types of costs: (1) transaction costs, including sales charges (loads) on purchase payments and redemption/exchange fees; and (2) ongoing costs, including management fees; distribution and service (12b-1) fees; and other fund expenses. This example is intended to help you understand your ongoing costs (in dollars) of investing in your fund and to compare these costs with the ongoing cost of investing in other mutual funds.
The example is based on an investment of $1,000 made at the beginning of the period and held for the entire period from October 1, 2012 to March 31, 2013.
Actual Expenses
The table provides information about actual account values and actual expenses for each class. You may use the information, together with the amount you invested, to estimate the expenses that you paid over the period. First, identify the share class you own. Then simply divide your account value by $1,000 (for example, an $8,600 account value divided by $1,000 = 8.6), then multiply the result by the number under the heading “Expenses Paid During Period” to estimate the expenses you paid on your account during this period.
If you hold Investor Class shares of any American Century Investments fund, or Institutional Class shares of the American Century Diversified Bond Fund, in an American Century Investments account (i.e., not a financial intermediary or retirement plan account), American Century Investments may charge you a $12.50 semiannual account maintenance fee if the value of those shares is less than $10,000. We will redeem shares automatically in one of your accounts to pay the $12.50 fee. In determining your total eligible investment amount, we will include your investments in all personal accounts (including American Century Investments Brokerage accounts) registered under your Social Security number. Personal accounts include individual accounts, joint accounts, UGMA/UTMA accounts, personal trusts, Coverdell Education Savings Accounts and IRAs (including traditional, Roth, Rollover, SEP-, SARSEP- and SIMPLE-IRAs), and certain other retirement accounts. If you have only business, business retirement, employer-sponsored or American Century Investments Brokerage accounts, you are currently not subject to this fee. If you are subject to the Account Maintenance Fee, your account value could be reduced by the fee amount.
Hypothetical Example for Comparison Purposes
The table also provides information about hypothetical account values and hypothetical expenses based on the actual expense ratio of each class of your fund and an assumed rate of return of 5% per year before expenses, which is not the actual return of a fund’s share class. The hypothetical account values and expenses may not be used to estimate the actual ending account balance or expenses you paid for the period. You may use this information to compare the ongoing costs of investing in your fund and other funds. To do so, compare this 5% hypothetical example with the 5% hypothetical examples that appear in the shareholder reports of the other funds.
Please note that the expenses shown in the table are meant to highlight your ongoing costs only and do not reflect any transactional costs, such as sales charges (loads) or redemption/exchange fees. Therefore, the table is useful in comparing ongoing costs only, and will not help you determine the relative total costs of owning different funds. In addition, if these transactional costs were included, your costs would have been higher.
| | Beginning Account Value 10/1/12 | Ending Account Value 3/31/13 | Expenses Paid During Period(1) 10/1/12 – 3/31/13 | Annualized Expense Ratio(1) |
| Actual | | | | |
| Investor Class | $1,000 | $999.60 | $2.74 | 0.55% |
| Institutional Class | $1,000 | $1,000.60 | $1.75 | 0.35% |
| A Class | $1,000 | $999.00 | $3.99 | 0.80% |
| C Class | $1,000 | $995.50 | $7.71 | 1.55% |
| R Class | $1,000 | $997.60 | $5.23 | 1.05% |
| Hypothetical | | | | |
| Investor Class | $1,000 | $1,022.19 | $2.77 | 0.55% |
| Institutional Class | $1,000 | $1,023.19 | $1.77 | 0.35% |
| A Class | $1,000 | $1,020.94 | $4.03 | 0.80% |
| C Class | $1,000 | $1,017.20 | $7.80 | 1.55% |
| R Class | $1,000 | $1,019.70 | $5.29 | 1.05% |
| (1) | Expenses are equal to the class’s annualized expense ratio listed in the table above, multiplied by the average account value over the period, multiplied by 182, the number of days in the most recent fiscal half-year, divided by 365, to reflect the one-half year period. |
| | | Principal Amount | | | Value | |
| U.S. Treasury Securities — 78.1% | |
| U.S. Treasury Inflation Indexed Notes, 1.875%, 7/15/15 | | | $11,631,818 | | | | $12,765,920 | |
| U.S. Treasury Inflation Indexed Notes, 0.125%, 4/15/17 | | | 2,281,208 | | | | 2,462,278 | |
| U.S. Treasury Inflation Indexed Notes, 1.625%, 1/15/18 | | | 2,967,867 | | | | 3,463,824 | |
| U.S. Treasury Inflation Indexed Notes, 1.375%, 7/15/18 | | | 1,601,835 | | | | 1,878,526 | |
| U.S. Treasury Notes, 1.25%, 4/15/14 | | | 8,000,000 | | | | 8,090,000 | |
| U.S. Treasury Notes, 0.625%, 7/15/14 | | | 61,000,000 | | | | 61,340,746 | |
| U.S. Treasury Notes, 0.50%, 10/15/14 | | | 38,903,000 | | | | 39,073,201 | |
| U.S. Treasury Notes, 2.125%, 11/30/14 | | | 28,000,000 | | | | 28,881,580 | |
| U.S. Treasury Notes, 2.25%, 1/31/15 | | | 23,000,000 | | | | 23,850,816 | |
| U.S. Treasury Notes, 0.25%, 2/15/15 | | | 13,000,000 | | | | 13,002,028 | |
| U.S. Treasury Notes, 2.375%, 2/28/15 | | | 2,300,000 | | | | 2,393,527 | |
| U.S. Treasury Notes, 1.875%, 6/30/15 | | | 16,700,000 | | | | 17,298,862 | |
| U.S. Treasury Notes, 0.25%, 7/15/15 | | | 14,500,000 | | | | 14,492,069 | |
| U.S. Treasury Notes, 1.75%, 7/31/15 | | | 41,600,000 | | | | 43,020,266 | |
| U.S. Treasury Notes, 0.375%, 11/15/15 | | | 3,000,000 | | | | 3,005,157 | |
| U.S. Treasury Notes, 1.375%, 11/30/15 | | | 24,200,000 | | | | 24,874,962 | |
| U.S. Treasury Notes, 0.25%, 12/15/15 | | | 3,000,000 | | | | 2,994,141 | |
| U.S. Treasury Notes, 2.125%, 12/31/15 | | | 8,000,000 | | | | 8,392,504 | |
| U.S. Treasury Notes, 1.50%, 6/30/16 | | | 19,200,000 | | | | 19,878,010 | |
| U.S. Treasury Notes, 1.50%, 7/31/16 | | | 9,800,000 | | | | 10,149,889 | |
TOTAL U.S. TREASURY SECURITIES (Cost $340,314,843) | | | | 341,308,306 | |
Collateralized Mortgage Obligations(1) — 11.0% | |
| FHLMC, Series 2430, Class QC, 5.50%, 2/15/17 | | | 1,593,910 | | | | 1,648,561 | |
| FHLMC, Series 2624, Class FE SEQ, VRN, 0.50%, 4/15/13 | | | 214,566 | | | | 214,715 | |
| FHLMC, Series 2650, Class PN, 4.50%, 12/15/32 | | | 4,078,493 | | | | 4,320,851 | |
| FHLMC, Series 2684, Class FP, VRN, 0.70%, 4/15/13 | | | 997,636 | | | | 1,000,522 | |
| FHLMC, Series 2718, Class FW, VRN, 0.55%, 4/15/13 | | | 831,043 | | | | 832,189 | |
| FHLMC, Series 2779, Class FM SEQ, VRN, 0.55%, 4/15/13 | | | 150,863 | | | | 151,171 | |
| FHLMC, Series 3501, Class AC SEQ, 4.00%, 8/15/23 | | | 2,014,873 | | | | 2,109,097 | |
| FHLMC, Series 3562, Class KB SEQ, 4.00%, 11/15/22 | | | 1,570,665 | | | | 1,610,225 | |
| FHLMC, Series 3575, Class A SEQ, 4.00%, 11/15/22 | | | 1,370,706 | | | | 1,395,483 | |
| FHLMC, Series 3831, Class CG, 3.00%, 10/15/18 | | | 1,048,188 | | | | 1,087,485 | |
| FHLMC, Series 3842, Class JB, 2.00%, 9/15/18 | | | 3,112,999 | | | | 3,183,487 | |
| FNMA, Series 2002-5, Class PJ, 6.00%, 10/25/21 | | | 112,486 | | | | 113,754 | |
| FNMA, Series 2003-108, Class BE SEQ, 4.00%, 11/25/18 | | | 945,625 | | | | 1,001,279 | |
| FNMA, Series 2003-123, Class AY SEQ, 4.00%, 12/25/18 | | | 2,498,466 | | | | 2,660,061 | |
| FNMA, Series 2003-125, Class AY SEQ, 4.00%, 12/25/18 | | | 4,487,712 | | | | 4,775,675 | |
| FNMA, Series 2003-128, Class NG, 4.00%, 1/25/19 | | | 1,575,110 | | | | 1,666,772 | |
| FNMA, Series 2003-17, Class FN, VRN, 0.50%, 4/25/13 | | | 1,737,550 | | | | 1,747,075 | |
| FNMA, Series 2003-42, Class FK, VRN, 0.60%, 4/25/13 | | | 364,060 | | | | 364,809 | |
| FNMA, Series 2003-43, Class LF, VRN, 0.55%, 4/25/13 | | | 445,137 | | | | 446,021 | |
| FNMA, Series 2004-17, Class CJ SEQ, 4.00%, 4/25/19 | | | 3,852,389 | | | | 4,193,795 | |
| FNMA, Series 2004-32, Class AY SEQ, 4.00%, 5/25/19 | | | 2,380,208 | | | | 2,512,684 | |
| FNMA, Series 2006-60, Class KF, VRN, 0.50%, 4/25/13 | | | $3,765,331 | | | | $3,782,908 | |
| FNMA, Series 2010-83, Class CM SEQ, 4.50%, 3/25/25 | | | 3,570,628 | | | | 3,738,349 | |
| FNMA, Series 2011-3, Class EL, 3.00%, 5/25/20 | | | 720,300 | | | | 748,026 | |
| GNMA, Series 2010-14, Class QF, VRN, 0.65%, 4/16/13 | | | 2,678,130 | | | | 2,718,499 | |
TOTAL COLLATERALIZED MORTGAGE OBLIGATIONS (Cost $47,752,706) | | | | 48,023,493 | |
U.S. Government Agency Mortgage-Backed Securities(1) — 6.9% | |
| ADJUSTABLE-RATE U.S. GOVERNMENT AGENCY MORTGAGE-BACKED SECURITIES — 6.6% | |
| FHLMC, VRN, 2.08%, 4/15/13 | | | 1,477,943 | | | | 1,529,373 | |
| FHLMC, VRN, 2.26%, 4/15/13 | | | 52,106 | | | | 52,794 | |
| FHLMC, VRN, 2.50%, 4/15/13 | | | 24,742 | | | | 24,995 | |
| FHLMC, VRN, 2.58%, 4/15/13 | | | 794,440 | | | | 833,330 | |
| FHLMC, VRN, 2.68%, 4/15/13 | | | 3,293,682 | | | | 3,462,805 | |
| FHLMC, VRN, 2.70%, 4/15/13 | | | 831,291 | | | | 888,652 | |
| FHLMC, VRN, 2.75%, 4/15/13 | | | 3,339,340 | | | | 3,589,306 | |
| FHLMC, VRN, 2.76%, 4/15/13 | | | 34,865 | | | | 35,039 | |
| FHLMC, VRN, 3.57%, 4/15/13 | | | 1,692,879 | | | | 1,797,879 | |
| FHLMC, VRN, 3.76%, 4/15/13 | | | 1,901,145 | | | | 2,014,606 | |
| FHLMC, VRN, 4.02%, 4/15/13 | | | 524,945 | | | | 562,433 | |
| FHLMC, VRN, 4.03%, 4/15/13 | | | 745,616 | | | | 794,461 | |
| FHLMC, VRN, 5.43%, 4/15/13 | | | 371,035 | | | | 398,090 | |
| FHLMC, VRN, 6.14%, 4/15/13 | | | 402,057 | | | | 434,995 | |
| FNMA, VRN, 1.875%, 4/25/13 | | | 23,066 | | | | 24,039 | |
| FNMA, VRN, 1.94%, 4/25/13 | | | 11,326 | | | | 11,900 | |
| FNMA, VRN, 2.00%, 4/25/13 | | | 974,815 | | | | 1,026,543 | |
| FNMA, VRN, 2.02%, 4/25/13 | | | 41,808 | | | | 44,195 | |
| FNMA, VRN, 2.05%, 4/25/13 | | | 1,884,488 | | | | 2,003,243 | |
| FNMA, VRN, 2.08%, 4/25/13 | | | 24,915 | | | | 26,273 | |
| FNMA, VRN, 2.14%, 4/25/13 | | | 24,936 | | | | 25,582 | |
| FNMA, VRN, 2.18%, 4/25/13 | | | 7,747 | | | | 7,796 | |
| FNMA, VRN, 2.20%, 4/25/13 | | | 30,413 | | | | 30,589 | |
| FNMA, VRN, 2.26%, 4/25/13 | | | 9,132 | | | | 9,572 | |
| FNMA, VRN, 2.29%, 4/25/13 | | | 18,474 | | | | 19,710 | |
| FNMA, VRN, 2.375%, 4/25/13 | | | 4,417 | | | | 4,437 | |
| FNMA, VRN, 2.42%, 4/25/13 | | | 10,287 | | | | 10,937 | |
| FNMA, VRN, 2.43%, 4/25/13 | | | 134,015 | | | | 143,235 | |
| FNMA, VRN, 2.50%, 4/25/13 | | | 2,418 | | | | 2,477 | |
| FNMA, VRN, 2.75%, 4/25/13 | | | 13,015 | | | | 13,870 | |
| FNMA, VRN, 2.75%, 4/25/13 | | | 5,411 | | | | 5,723 | |
| FNMA, VRN, 2.77%, 4/25/13 | | | 737,135 | | | | 773,673 | |
| FNMA, VRN, 3.06%, 4/25/13 | | | 1,751,042 | | | | 1,843,905 | |
| FNMA, VRN, 3.35%, 4/25/13 | | | 2,319,389 | | | | 2,446,106 | |
| FNMA, VRN, 3.35%, 4/25/13 | | | 424,131 | | | | 450,412 | |
| FNMA, VRN, 3.85%, 4/25/13 | | | 594,220 | | | | 631,158 | |
| FNMA, VRN, 3.875%, 4/25/13 | | | 6,379 | | | | 6,426 | |
| FNMA, VRN, 3.90%, 4/25/13 | | | 1,531,413 | | | | 1,636,843 | |
| FNMA, VRN, 3.99%, 4/25/13 | | | 26,388 | | | | 28,162 | |
| FNMA, VRN, 4.15%, 4/25/13 | | | 57,050 | | | | 57,251 | |
| FNMA, VRN, 4.16%, 4/25/13 | | | 8,604 | | | | 8,636 | |
| FNMA, VRN, 5.43%, 4/25/13 | | | 485,264 | | | | 524,400 | |
| FNMA, VRN, 5.95%, 4/25/13 | | | 645,824 | | | | 706,705 | |
| FNMA, VRN, 6.19%, 4/25/13 | | | 3,367 | | | | 3,383 | |
| FNMA, VRN, 7.49%, 4/25/13 | | | 2,640 | | | | 2,733 | |
| GNMA, VRN, 1.75%, 4/20/13 | | | 6,386 | | | | 6,718 | |
| GNMA, VRN, 2.125%, 4/20/13 | | | 10,775 | | | | 11,262 | |
| GNMA, VRN, 3.00%, 4/20/13 | | | 38,658 | | | | 40,517 | |
| | | | | | | | 29,007,169 | |
| FIXED-RATE U.S. GOVERNMENT AGENCY MORTGAGE-BACKED SECURITIES — 0.3% | |
| FHLMC, 7.00%, 11/1/13 | | | 858 | | | | 868 | |
| FHLMC, 7.00%, 12/1/14 | | | 2,396 | | | | 2,478 | |
| FHLMC, 6.00%, 1/1/15 | | | 70,834 | | | | 72,775 | |
| FHLMC, 7.50%, 5/1/16 | | | 48,978 | | | | 51,392 | |
| FHLMC, 5.50%, 11/1/17 | | | 180,186 | | | | 193,135 | |
| FNMA, 6.00%, 6/1/13 | | | 533 | | | | 536 | |
| FNMA, 6.00%, 1/1/14 | | | 902 | | | | 913 | |
| FNMA, 6.00%, 7/1/14 | | | 10,891 | | | | 11,185 | |
| FNMA, 5.50%, 4/1/16 | | | 50,401 | | | | 54,031 | |
| FNMA, 7.00%, 5/1/32 | | | 276,912 | | | | 329,913 | |
| FNMA, 7.00%, 5/1/32 | | | 136,909 | | | | 163,113 | |
| FNMA, 7.00%, 6/1/32 | | | 22,130 | | | | 26,391 | |
| FNMA, 7.00%, 6/1/32 | | | 136,058 | | | | 162,099 | |
| FNMA, 7.00%, 8/1/32 | | | 190,449 | | | | 226,901 | |
| GNMA, 9.50%, 11/20/19 | | | 4,415 | | | | 4,653 | |
| | | | | | | | 1,300,383 | |
| | | | Principal Amount | | | | Value | |
| | | | | | | | $30,307,552 | |
| TOTAL U.S. GOVERNMENT AGENCY MORTGAGE-BACKED SECURITIES (Cost $29,342,946) | | | | | | | | |
| U.S. Government Agency Securities — 3.1% | | | | | | | | |
| FHLB, 3.625%, 10/18/13 | | | $141,000 | | | | 143,707 | |
| FHLB, 0.875%, 12/27/13 | | | 159,000 | | | | 159,863 | |
| FHLB, 0.375%, 1/29/14 | | | 127,000 | | | | 127,232 | |
| FHLB, Series 467, 5.25%, 6/18/14 | | | 276,000 | | | | 293,120 | |
| FHLB, Series 1, 1.00%, 6/21/17 | | | 684,000 | | | | 691,582 | |
| FHLMC, 2.00%, 8/25/16 | | | 2,400,000 | | | | 2,520,948 | |
| FHLMC, Series 1, 0.75%, 1/12/18 | | | 1,350,000 | | | | 1,343,959 | |
| FHLMC, 0.875%, 3/7/18 | | | 650,000 | | | | 649,810 | |
| FNMA, 0.50%, 3/30/16 | | | 5,100,000 | | | | 5,109,675 | |
| FNMA, 1.375%, 11/15/16 | | | 1,500,000 | | | | 1,546,308 | |
| FNMA, 0.875%, 2/8/18 | | | 720,000 | | | | 719,078 | |
TOTAL U.S. GOVERNMENT AGENCY SECURITIES (Cost $13,263,898) | | | | 13,305,282 | |
| Temporary Cash Investments — 0.5% | |
Repurchase Agreement, Bank of America Merrill Lynch, (collateralized by various U.S. Treasury obligations, 0.25%, 2/28/14, valued at $197,589), in a joint trading account at 0.11%, dated 3/28/13, due 4/1/13 (Delivery value $193,677) | | | | 193,675 | |
Repurchase Agreement, Credit Suisse First Boston, Inc., (collateralized by various U.S. Treasury obligations, 4.375%, 5/15/41, valued at $593,087), in a joint trading account at 0.13%, dated 3/28/13, due 4/1/13 (Delivery value $581,034) | | | | 581,026 | |
| | | Shares | | | Value | |
Repurchase Agreement, Goldman Sachs & Co., (collateralized by various U.S. Treasury obligations, 4.25%, 11/15/40, valued at $197,623), in a joint trading account at 0.10%, dated 3/28/13, due 4/1/13 (Delivery value $193,678) | | | | $193,676 | |
| SSgA U.S. Government Money Market Fund | | | 1,292,150 | | | | 1,292,150 | |
TOTAL TEMPORARY CASH INVESTMENTS (Cost $2,260,527) | | | | 2,260,527 | |
TOTAL INVESTMENT SECURITIES — 99.6% (Cost $432,934,920) | | | | 435,205,160 | |
| OTHER ASSETS AND LIABILITIES — 0.4% | | | | 1,581,349 | |
| TOTAL NET ASSETS — 100.0% | | | | $436,786,509 | |
Notes to Schedule of Investments
FHLB = Federal Home Loan Bank
FHLMC = Federal Home Loan Mortgage Corporation
FNMA = Federal National Mortgage Association
GNMA = Government National Mortgage Association
SEQ = Sequential Payer
VRN = Variable Rate Note. Interest reset date is indicated. Rate shown is effective at the period end.
| (1) | Final maturity date indicated, unless otherwise noted. |
See Notes to Financial Statements.
Statement of Assets and Liabilities |
| MARCH 31, 2013 | |
| Assets | |
| Investment securities, at value (cost of $432,934,920) | | | $435,205,160 | |
| Receivable for investments sold | | | 11,198,999 | |
| Receivable for capital shares sold | | | 37,043 | |
| Interest receivable | | | 1,301,866 | |
| | | | 447,743,068 | |
| | | | | |
| Liabilities | | | | |
| Payable for investments purchased | | | 10,342,752 | |
| Payable for capital shares redeemed | | | 405,450 | |
| Accrued management fees | | | 196,292 | |
| Distribution and service fees payable | | | 11,321 | |
| Dividends payable | | | 744 | |
| | | | 10,956,559 | |
| | | | | |
| Net Assets | | | $436,786,509 | |
| | | | | |
| Net Assets Consist of: | | | | |
| Capital paid in | | | $434,455,551 | |
| Undistributed net investment income | | | 128,558 | |
| Accumulated net realized loss | | | (67,840 | ) |
| Net unrealized appreciation | | | 2,270,240 | |
| | | | $436,786,509 | |
| | | Net assets | | | Shares outstanding | | | Net asset value per share | |
| Investor Class | | | $346,146,785 | | | | 35,630,242 | | | | $9.71 | |
| Institutional Class | | | $48,241,809 | | | | 4,963,241 | | | | $9.72 | |
| A Class | | | $38,902,365 | | | | 4,006,375 | | | | $9.71 | * |
| C Class | | | $3,322,209 | | | | 345,730 | | | | $9.61 | |
| R Class | | | $173,341 | | | | 17,885 | | | | $9.69 | |
| *Maximum offering price $9.93 (net asset value divided by 0.9775). | |
See Notes to Financial Statements.
| YEAR ENDED MARCH 31, 2013 | |
| Investment Income (Loss) | |
| Income: | | | |
| Interest | | | $3,706,946 | |
| | | | | |
| Expenses: | | | | |
| Management fees | | | 2,856,298 | |
| Distribution and service fees: | | | | |
| A Class | | | 113,214 | |
| C Class | | | 37,160 | |
| R Class | | | 1,452 | |
| Trustees’ fees and expenses | | | 30,162 | |
| Other expenses | | | 1,802 | |
| | | | 3,040,088 | |
| | | | | |
| Net investment income (loss) | | | 666,858 | |
| | | | | |
| Realized and Unrealized Gain (Loss) | | | | |
| Net realized gain (loss) on investment transactions (see Note 4) | | | 3,237,647 | |
| Change in net unrealized appreciation (depreciation) on investments | | | (1,275,260 | ) |
| | | | | |
| Net realized and unrealized gain (loss) | | | 1,962,387 | |
| | | | | |
| Net Increase (Decrease) in Net Assets Resulting from Operations | | | $2,629,245 | |
See Notes to Financial Statements.
Statement of Changes in Net Assets |
| YEARS ENDED MARCH 31, 2013 AND MARCH 31, 2012 | | | | | |
| Increase (Decrease) in Net Assets | March 31, 2013 | | | March 31, 2012 | |
| Operations | | | | | |
| Net investment income (loss) | | $666,858 | | | | $4,470,929 | |
| Net realized gain (loss) | | 3,237,647 | | | | 11,336,756 | |
| Change in net unrealized appreciation (depreciation) | | (1,275,260 | ) | | | (2,024,958 | ) |
| Net increase (decrease) in net assets resulting from operations | | 2,629,245 | | | | 13,782,727 | |
| | | | | | | | |
| Distributions to Shareholders | | | | | | | |
| From net investment income: | | | | | | | |
| Investor Class | | (1,101,074 | ) | | | (4,715,657 | ) |
| Institutional Class | | (602,121 | ) | | | (334,144 | ) |
| A Class | | (35,276 | ) | | | (240,554 | ) |
| R Class | | — | | | | (52 | ) |
| From net realized gains: | | | | | | | |
| Investor Class | | (2,209,500 | ) | | | (4,929,949 | ) |
| Institutional Class | | (204,866 | ) | | | (849 | ) |
| A Class | | (240,344 | ) | | | (818,530 | ) |
| C Class | | (20,594 | ) | | | (24,091 | ) |
| R Class | | (2,341 | ) | | | (663 | ) |
| Decrease in net assets from distributions | | (4,416,116 | ) | | | (11,064,489 | ) |
| | | | | | | | |
| Capital Share Transactions | | | | | | | |
| Net increase (decrease) in net assets from capital share transactions | | (438,075,898 | ) | | | (27,440,524 | ) |
| | | | | | | | |
| Net increase (decrease) in net assets | | (439,862,769 | ) | | | (24,722,286 | ) |
| | | | | | | | |
| Net Assets | | | | | | | |
| Beginning of period | | 876,649,278 | | | | 901,371,564 | |
| End of period | | $436,786,509 | | | | $876,649,278 | |
| | | | | | | | |
| Undistributed net investment income | | $128,558 | | | | $102,749 | |
See Notes to Financial Statements.
Notes to Financial Statements |
MARCH 31, 2013
1. Organization
American Century Government Income Trust (the trust) is registered under the Investment Company Act of 1940, as amended (the 1940 Act), as an open-end management investment company and is organized as a Massachusetts business trust. Short-Term Government Fund (the fund) is one fund in a series issued by the trust. The fund is diversified as defined under the 1940 Act. The fund’s investment objective is to seek high current income while maintaining safety of principal.
The fund offers the Investor Class, the Institutional Class, the A Class, the C Class and the R Class. The A Class may incur an initial sales charge. The A Class and C Class may be subject to a contingent deferred sales charge. The share classes differ principally in their respective sales charges and distribution and shareholder servicing expenses and arrangements. The Institutional Class is made available to institutional shareholders or through financial intermediaries whose clients do not require the same level of shareholder and administrative services as shareholders of other classes. As a result, the Institutional Class is charged a lower unified management fee.
2. Significant Accounting Policies
The following is a summary of significant accounting policies consistently followed by the fund in preparation of its financial statements. The financial statements are prepared in conformity with accounting principles generally accepted in the United States of America, which may require management to make certain estimates and assumptions at the date of the financial statements. Actual results could differ from these estimates.
Investment Valuations — The fund determines the fair value of its investments and computes its net asset value per share as of the close of regular trading (usually 4 p.m. Eastern time) on the New York Stock Exchange (NYSE) on each day the NYSE is open.
Debt securities maturing in greater than 60 days at the time of purchase are valued at the evaluated mean as provided by independent pricing services or at the mean of the most recent bid and asked prices as provided by investment dealers. Debt securities maturing within 60 days at the time of purchase may be valued at cost, plus or minus any amortized discount or premium or at the evaluated mean as provided by an independent pricing service. Evaluated mean prices are commonly derived through utilization of market models, which may consider, among other factors, trade data, quotations from dealers and active market makers, relevant yield curve and spread data, related sector levels, creditworthiness, and other relevant market information on the same or comparable securities.
Investments in open-end management investment companies are valued at the reported net asset value per share. Repurchase agreements are valued at cost.
If the fund determines that the market price for a portfolio security is not readily available or the valuation methods mentioned above do not reflect a security’s fair value, such security is valued as determined in good faith by the Board of Trustees or its designee, in accordance with procedures adopted by the Board of Trustees. Circumstances that may cause the fund to use these procedures to value a security include, but are not limited to: a security has been declared in default; trading in a security has been halted during the trading day; there is a foreign market holiday and no trading occurred; or an event occurred between the close of a foreign exchange and the NYSE that may affect the value of a security.
Security Transactions — Security transactions are accounted for as of the trade date. Net realized gains and losses are determined on the identified cost basis, which is also used for federal income tax purposes.
Investment Income — Interest income is recorded on the accrual basis and includes paydown gain (loss) and accretion of discounts and amortization of premiums. Inflation adjustments related to inflation-linked debt securities are reflected as interest income.
Repurchase Agreements — The fund may enter into repurchase agreements with institutions that American Century Investment Management, Inc. (ACIM) (the investment advisor) has determined are creditworthy pursuant to criteria adopted by the Board of Trustees. The fund requires that the collateral, represented by securities, received in a repurchase transaction be transferred to the custodian in a manner sufficient to enable the fund to obtain those securities in the event of a default under the repurchase agreement. ACIM monitors, on a daily basis, the securities transferred to ensure the value, including accrued interest, of the securities under each repurchase agreement is equal to or greater than amounts owed to the fund under each repurchase agreement.
Joint Trading Account — Pursuant to an Exemptive Order issued by the Securities and Exchange Commission, the fund, along with certain other funds in the American Century Investments family of funds, may transfer uninvested cash balances into a joint trading account. These balances are invested in one or more repurchase agreements that are collateralized by U.S. Treasury or Agency obligations.
Income Tax Status — It is the fund’s policy to distribute substantially all net investment income and net realized gains to shareholders and to otherwise qualify as a regulated investment company under provisions of the Internal Revenue Code. Accordingly, no provision has been made for income taxes. The fund files U.S. federal, state, local and non-U.S. tax returns as applicable. The fund’s tax returns are subject to examination by the relevant taxing authority until expiration of the applicable statute of limitations, which is generally three years from the date of filing but can be longer in certain jurisdictions. At this time, management believes there are no uncertain tax positions which, based on their technical merit, would not be sustained upon examination and for which it is reasonably possible that the total amounts of unrecognized tax benefits will significantly change in the next twelve months.
Multiple Class — All shares of the fund represent an equal pro rata interest in the net assets of the class to which such shares belong, and have identical voting, dividend, liquidation and other rights and the same terms and conditions, except for class specific expenses and exclusive rights to vote on matters affecting only individual classes. Income, non-class specific expenses, and realized and unrealized capital gains and losses of the fund are allocated to each class of shares based on their relative net assets.
Distributions to Shareholders — Distributions from net investment income are declared daily and paid monthly. Distributions from net realized gains, if any, are generally declared and paid annually.
Indemnifications — Under the trust’s organizational documents, its officers and trustees are indemnified against certain liabilities arising out of the performance of their duties to the fund. In addition, in the normal course of business, the fund enters into contracts that provide general indemnifications. The maximum exposure under these arrangements is unknown as this would involve future claims that may be made against a fund. The risk of material loss from such claims is considered by management to be remote.
3. Fees and Transactions with Related Parties
Management Fees — The trust has entered into a management agreement with ACIM, under which ACIM provides the fund with investment advisory and management services in exchange for a single, unified management fee (the fee) per class. The agreement provides that all expenses of managing and operating the fund, except distribution and service fees, brokerage expenses, taxes, interest, fees and expenses of the independent trustees (including legal counsel fees), and extraordinary expenses, will be paid by ACIM. The fee is computed and accrued daily based on each class’s daily net assets and paid monthly in arrears. The fee consists of (1) an Investment Category Fee based on the daily net assets of the fund and certain other accounts managed by the investment advisor that are in the same broad investment category as the fund and (2) a Complex Fee based on the assets of all the funds in the American Century Investments family of funds. The rates for the Investment Category Fee range from 0.2425% to 0.3600%. The rates for the Complex Fee range from 0.2500% to 0.3100% for the Investor Class, A Class, C Class and R Class. The Institutional Class is 0.2000% less at each point within the Complex Fee range. The effective annual management fee for each class for the year ended March 31, 2013 was 0.55% for the Investor Class, A Class, C Class and R Class and 0.35% for the Institutional Class.
Distribution and Service Fees — The Board of Trustees has adopted a separate Master Distribution and Individual Shareholder Services Plan for each of the A Class, C Class and R Class (collectively the plans), pursuant to Rule 12b-1 of the 1940 Act. The plans provide that the A Class will pay American Century Investment Services, Inc. (ACIS) an annual distribution and service fee of 0.25%. The plans provide that the C Class will pay ACIS an annual distribution and service fee of 1.00%, of which 0.25% is paid for individual shareholder services and 0.75% is paid for distribution services. The plans provide that the R Class will pay ACIS an annual distribution and service fee of 0.50%. The fees are computed and accrued daily based on each class’s daily net assets and paid monthly in arrears. The fees are used to pay financial intermediaries for distribution and individual shareholder services. Fees incurred under the plans during the year ended March 31, 2013 are detailed in the Statement of Operations.
Related Parties — Certain officers and trustees of the trust are also officers and/or directors of American Century Companies, Inc. (ACC). The trust’s investment advisor, ACIM, the trust’s distributor, ACIS, and the trust’s transfer agent, American Century Services, LLC are wholly owned, directly or indirectly, by ACC. Certain directors of ACC are officers and directors of other entities which own, in aggregate, 11% of the outstanding shares of the fund.
4. Investment Transactions
Purchases and sales of investment securities, excluding short-term investments, for the year ended March 31, 2013 were $427,789,294 and $848,229,913, respectively, all of which are U.S. Treasury and Government Agency obligations.
For the year ended March 31, 2013, the fund incurred net realized gains of $1,215,725 from redemptions in kind. A redemption in kind occurs when a fund delivers securities from its portfolio in lieu of cash as payment to a redeeming shareholder.
5. Capital Share Transactions
Transactions in shares of the fund were as follows (unlimited number of shares authorized):
| | Year ended March 31, 2013 | | | Year ended March 31, 2012 | |
| | Shares | | | Amount | | | Shares | | | Amount | |
| Investor Class | | | | | | | | | | | |
| Sold | | 5,322,936 | | | | $51,935,819 | | | | 28,084,634 | | | | $274,673,670 | |
| Issued in reinvestment of distributions | | 328,574 | | | | 3,197,224 | | | | 958,404 | | | | 9,379,075 | |
| Redeemed | | (18,777,266 | ) | | | (183,183,924 | ) | | | (67,941,132 | ) | | | (664,494,310 | ) |
| | | (13,125,756 | ) | | | (128,050,881 | ) | | | (38,898,094 | ) | | | (380,441,565 | ) |
| Institutional Class | | | | | | | | | | | | | | | |
| Sold | | 2,209,529 | | | | 21,481,319 | | | | 39,046,598 | | | | 381,485,607 | |
| Issued in reinvestment of distributions | | 69,643 | | | | 679,577 | | | | 34,302 | | | | 334,993 | |
| Redeemed | | (31,455,585 | ) | | | (307,298,472 | ) | | | (4,954,735 | ) | | | (48,268,759 | ) |
| | | (29,176,413 | ) | | | (285,137,576 | ) | | | 34,126,165 | | | | 333,551,841 | |
| A Class | | | | | | | | | | | | | | | |
| Sold | | 2,206,574 | | | | 21,544,169 | | | | 34,121,019 | | | | 335,257,655 | |
| Issued in reinvestment of distributions | | 27,921 | | | | 271,568 | | | | 107,738 | | | | 1,053,627 | |
| Redeemed | | (4,733,059 | ) | | | (46,210,898 | ) | | | (32,625,096 | ) | | | (320,174,410 | ) |
| | | (2,498,564 | ) | | | (24,395,161 | ) | | | 1,603,661 | | | | 16,136,872 | |
| C Class | | | | | | | | | | | | | | | |
| Sold | | 187,464 | | | | 1,821,527 | | | | 369,246 | | | | 3,617,725 | |
| Issued in reinvestment of distributions | | 2,055 | | | | 19,806 | | | | 2,193 | | | | 21,385 | |
| Redeemed | | (223,307 | ) | | | (2,164,714 | ) | | | (66,108 | ) | | | (646,818 | ) |
| | | (33,788 | ) | | | (323,381 | ) | | | 305,331 | | | | 2,992,292 | |
| R Class | | | | | | | | | | | | | | | |
| Sold | | 35,069 | | | | 342,097 | | | | 32,669 | | | | 319,340 | |
| Issued in reinvestment of distributions | | 70 | | | | 682 | | | | 73 | | | | 715 | |
| Redeemed | | (52,582 | ) | | | (511,678 | ) | | | (2 | ) | | | (19 | ) |
| | | (17,443 | ) | | | (168,899 | ) | | | 32,740 | | | | 320,036 | |
| Net increase (decrease) | | (44,851,964 | ) | | | $(438,075,898 | ) | | | (2,830,197 | ) | | | $(27,440,524 | ) |
6. Fair Value Measurements
The fund’s securities valuation process is based on several considerations and may use multiple inputs to determine the fair value of the positions held by the fund. In conformity with accounting principles generally accepted in the United States of America, the inputs used to determine a valuation are classified into three broad levels as follows:
| • | Level 1 valuation inputs consist of unadjusted quoted prices in an active market for identical securities; |
| • | Level 2 valuation inputs consist of direct or indirect observable market data (including quoted prices for similar securities, evaluations of subsequent market events, interest rates, prepayment speeds, credit risk, etc.); or |
| • | Level 3 valuation inputs consist of unobservable data (including a fund’s own assumptions). |
The level classification is based on the lowest level input that is significant to the fair valuation measurement. The valuation inputs are not necessarily an indication of the risks associated with investing in these securities or other financial instruments.
The following is a summary of the level classifications as of period end. The Schedule of Investments provides additional information on the fund’s portfolio holdings.
| | Level 1 | | | Level 2 | | | Level 3 | |
| Investment Securities | | | | | | | | |
| U.S. Treasury Securities | | — | | | | $341,308,306 | | | | — | |
| Collateralized Mortgage Obligations | | — | | | | 48,023,493 | | | | — | |
| U.S. Government Agency Mortgage-Backed Securities | | — | | | | 30,307,552 | | | | — | |
| U.S. Government Agency Securities | | — | | | | 13,305,282 | | | | — | |
| Temporary Cash Investments | | $1,292,150 | | | | 968,377 | | | | — | |
| Total Value of Investment Securities | | $1,292,150 | | | | $433,913,010 | | | | — | |
7. Federal Tax Information
The tax character of distributions paid during the years ended March 31, 2013 and March 31, 2012 were as follows:
| | | 2013 | | | 2012 | |
| Distributions Paid From | | | | | | |
| Ordinary income | | | $2,852,976 | | | | $8,520,284 | |
| Long-term capital gains | | | $1,563,140 | | | | $2,544,205 | |
The book-basis character of distributions made during the year from net investment income or net realized gains may differ from their ultimate characterization for federal income tax purposes. These differences reflect the differing character of certain income items and net realized gains and losses for financial statement and tax purposes, and may result in reclassification among certain capital accounts on the financial statements.
As of March 31, 2013, the federal tax cost of investments and the components of distributable earnings on a tax-basis were as follows:
| Federal tax cost of investments | | | $433,032,421 | |
| Gross tax appreciation of investments | | | $2,270,611 | |
| Gross tax depreciation of investments | | | (97,872 | ) |
| Net tax appreciation (depreciation) of investments | | | $2,172,739 | |
| Other book-to-tax adjustments | | | $(73,954 | ) |
| Undistributed ordinary income | | | $219,313 | |
| Accumulated long-term gains | | | $12,860 | |
The difference between book-basis and tax-basis unrealized appreciation (depreciation) is attributable primarily to inflation adjustments on Treasury inflation-protected securities. Other book-to-tax adjustments are attributable primarily to the tax deferral of losses on straddle positions.
| For a Share Outstanding Throughout the Years Ended March 31 (except as noted) |
| Per-Share Data | Ratios and Supplemental Data |
| | | Income From Investment Operations: | Distributions From: | | | Ratio to Average Net Assets of: | | |
| | Net Asset Value, Beginning of Period | Net Investment Income (Loss)(1) | Net Realized and Unrealized Gain (Loss) | Total From Investment Operations | Net Investment Income | Net Realized Gains | Total Distributions | Net Asset Value, End of Period | Total Return(2) | Operating Expenses | Net Investment Income (Loss) | Portfolio Turnover Rate | Net Assets, End of Period (in thousands) |
| Investor Class |
| 2013 | $9.76 | 0.01 | 0.03 | 0.04 | (0.03) | (0.06) | (0.09) | $9.71 | 0.33% | 0.55% | 0.11% | 77% | $346,147 |
| 2012 | $9.73 | 0.05 | 0.10 | 0.15 | (0.06) | (0.06) | (0.12) | $9.76 | 1.59% | 0.56% | 0.51% | 139% | $475,832 |
| 2011 | $9.72 | 0.09 | 0.07 | 0.16 | (0.10) | (0.05) | (0.15) | $9.73 | 1.60% | 0.56% | 0.94% | 75% | $852,802 |
| 2010 | $9.66 | 0.15 | 0.07 | 0.22 | (0.16) | — | (0.16) | $9.72 | 2.25% | 0.56% | 1.57% | 158% | $991,464 |
| 2009 | $9.65 | 0.29 | 0.01 | 0.30 | (0.29) | — | (0.29) | $9.66 | 3.17% | 0.57% | 2.99% | 142% | $971,230 |
| Institutional Class |
| 2013 | $9.76 | 0.04 | 0.03 | 0.07 | (0.05) | (0.06) | (0.11) | $9.72 | 0.64% | 0.35% | 0.31% | 77% | $48,242 |
| 2012 | $9.73 | 0.04 | 0.13 | 0.17 | (0.08) | (0.06) | (0.14) | $9.76 | 1.79% | 0.36% | 0.71% | 139% | $333,284 |
| 2011 | $9.73 | 0.11 | 0.06 | 0.17 | (0.12) | (0.05) | (0.17) | $9.73 | 1.70% | 0.36% | 1.14% | 75% | $131 |
2010(3) | $9.76 | 0.01 | (0.03) | (0.02) | (0.01) | — | (0.01) | $9.73 | (0.20)% | 0.36%(4) | 1.33%(4) | 158%(5) | $25 |
A Class(6) |
| 2013 | $9.76 | (0.02) | 0.04 | 0.02 | (0.01) | (0.06) | (0.07) | $9.71 | 0.14% | 0.80% | (0.14)% | 77% | $38,902 |
| 2012 | $9.73 | 0.02 | 0.11 | 0.13 | (0.04) | (0.06) | (0.10) | $9.76 | 1.33% | 0.81% | 0.26% | 139% | $63,497 |
| 2011 | $9.72 | 0.07 | 0.06 | 0.13 | (0.07) | (0.05) | (0.12) | $9.73 | 1.35% | 0.81% | 0.69% | 75% | $47,692 |
| 2010 | $9.66 | 0.13 | 0.06 | 0.19 | (0.13) | — | (0.13) | $9.72 | 2.00% | 0.81% | 1.32% | 158% | $74,654 |
| 2009 | $9.65 | 0.24 | 0.03 | 0.27 | (0.26) | — | (0.26) | $9.66 | 2.91% | 0.82% | 2.74% | 142% | $65,170 |
| For a Share Outstanding Throughout the Years Ended March 31 (except as noted) |
| Per-Share Data | Ratios and Supplemental Data |
| | | Income From Investment Operations: | Distributions From: | | | Ratio to Average Net Assets of: | | |
| | Net Asset Value, Beginning of Period | Net Investment Income (Loss)(1) | Net Realized and Unrealized Gain (Loss) | Total From Investment Operations | Net Investment Income | Net Realized Gains | Total Distributions | Net Asset Value, End of Period | Total Return(2) | Operating Expenses | Net Investment Income (Loss) | Portfolio Turnover Rate | Net Assets, End of Period (in thousands) |
| C Class | | | | | | | | | | | | | |
| 2013 | $9.72 | (0.09) | 0.04 | (0.05) | — | (0.06) | (0.06) | $9.61 | (0.55)% | 1.55% | (0.89)% | 77% | $3,322 |
| 2012 | $9.73 | (0.06) | 0.11 | 0.05 | — | (0.06) | (0.06) | $9.72 | 0.55% | 1.56% | (0.49)% | 139% | $3,691 |
| 2011 | $9.73 | (0.01) | 0.06 | 0.05 | —(7) | (0.05) | (0.05) | $9.73 | 0.53% | 1.56% | (0.06)% | 75% | $722 |
2010(3) | $9.76 | —(7) | (0.03) | (0.03) | —(7) | — | —(7) | $9.73 | (0.30)% | 1.56%(4) | 0.13%(4) | 158%(5) | $25 |
| R Class | | | | | | | | | | | | | |
| 2013 | $9.76 | (0.03) | 0.02 | (0.01) | —(7) | (0.06) | (0.06) | $9.69 | (0.14)% | 1.05% | (0.39)% | 77% | $173 |
| 2012 | $9.73 | (0.01) | 0.12 | 0.11 | (0.02) | (0.06) | (0.08) | $9.76 | 1.15% | 1.06% | 0.01% | 139% | $345 |
| 2011 | $9.73 | 0.04 | 0.06 | 0.10 | (0.05) | (0.05) | (0.10) | $9.73 | 0.99% | 1.06% | 0.44% | 75% | $25 |
2010(3) | $9.76 | 0.01 | (0.03) | (0.02) | (0.01) | — | (0.01) | $9.73 | (0.26)% | 1.06%(4) | 0.63%(4) | 158%(5) | $25 |
Notes to Financial Highlights
| (1) | Computed using average shares outstanding throughout the period. |
| (2) | Total returns are calculated based on the net asset value of the last business day and do not reflect applicable sales charges, if any. Total returns for periods less than one year are not annualized. |
| (3) | March 1, 2010 (commencement of sale) through March 31, 2010. |
| (5) | Portfolio turnover is calculated at the fund level. Percentage indicated was calculated for the year ended March 31, 2010. |
| (6) | Prior to March 1, 2010, the A Class was referred to as the Advisor Class. |
| (7) | Per-share amount was less than $0.005. |
See Notes to Financial Statements.
Report of Independent Registered Public Accounting Firm |
To the Trustees of the American Century Government Income Trust
and Shareholders of the Short-Term Government Fund:
In our opinion, the accompanying statement of assets and liabilities, including the schedule of investments, and the related statements of operations and of changes in net assets and the financial highlights present fairly, in all material respects, the financial position of the Short-Term Government Fund (one of the five funds comprising the American Century Government Income Trust, hereafter referred to as the “Fund”) at March 31, 2013, the results of its operations for the year then ended, the changes in its net assets for each of the two years in the period then ended and the financial highlights for each of the periods presented, in conformity with accounting principles generally accepted in the United States of America. These financial statements and financial highlights (hereafter referred to as “financial statements”) are the responsibility of the Fund’s management; our responsibility is to express an opinion on these financial statements based on our audits. We conducted our audits of these financial statements in accordance with the standards of the Public Company Accounting Oversight Board (United States). Those standards require that we plan and perform the audit to obtain reasonable assurance about whether the financial statements are free of material misstatement. An audit includes examining, on a test basis, evidence supporting the amounts and disclosures in the financial statements, assessing the accounting principles used and significant estimates made by management, and evaluating the overall financial statement presentation. We believe that our audits, which included confirmation of securities at March 31, 2013 by correspondence with the custodian and brokers, provide a reasonable basis for our opinion.
PricewaterhouseCoopers LLP
Kansas City, Missouri
May 21, 2013
Board of Trustees
The individuals listed below serve as trustees of the funds. Each trustee will continue to serve in this capacity until death, retirement, resignation or removal from office. The board has adopted a mandatory retirement age for trustees who are not “interested persons,” as that term is defined in the Investment Company Act (independent trustees). Independent trustees shall retire on December 31 of the year in which they reach their 75th birthday; provided, however, that on or after January 1, 2022, independent trustees shall retire on December 31 of the year in which they reach their 76th birthday.
Mr. Thomas is the only trustee who is an “interested person” because he currently serves as President and Chief Executive Officer of American Century Companies, Inc. (ACC), the parent company of American Century Investment Management, Inc. (ACIM or the advisor).
The other trustees (more than three-fourths of the total number) are independent; that is, they have never been employees, directors or officers of, and have no financial interest in, ACC or any of its wholly owned, direct or indirect, subsidiaries, including ACIM, American Century Investment Services, Inc. (ACIS) and American Century Services, LLC (ACS). The trustees serve in this capacity for eight (in the case of Mr. Thomas, 15) registered investment companies in the American Century Investments family of funds.
The following table presents additional information about the trustees. The mailing address for each trustee other than Mr. Thomas is 1665 Charleston Road, Mountain View, California 94043. The mailing address for Mr. Thomas is 4500 Main Street, Kansas City, Missouri 64111.
Name (Year of Birth) | Position(s) Held with Funds | Length of Time Served | Principal Occupation(s) During Past 5 Years | | Number of American Century Portfolios Overseen by Trustee | Other Directorships Held During Past 5 Years |
| Independent Trustees |
Tanya S. Beder (1955) | Trustee | Since 2011 | Chairman, SBCC Group Inc. (independent advisory services) (2006 to present) | | 42 | CYS Investments, Inc. (specialty finance company) |
Jeremy I. Bulow (1954) | Trustee | Since 2011 | Professor of Economics, Stanford University, Graduate School of Business (1979 to present) | | 42 | None |
Ronald J. Gilson (1946) | Trustee and Chairman of the Board | Since 1995 | Charles J. Meyers Professor of Law and Business, Stanford Law School (1979 to present); Marc and Eva Stern Professor of Law and Business, Columbia University School of Law (1992 to present) | | 42 | None |
Frederick L. A. Grauer (1946) | Trustee | Since 2008 | Senior Advisor, BlackRock, Inc. (investment management firm) (2010 to 2011); Senior Advisor, Barclays Global Investors (investment management firm) (2003 to 2009) | | 42 | None |
Name (Year of Birth) | Position(s) Held with Funds | Length of Time Served | Principal Occupation(s) During Past 5 Years | | Number of American Century Portfolios Overseen by Trustee | Other Directorships Held During Past 5 Years |
| Independent Trustees |
Peter F. Pervere (1947) | Trustee | Since 2007 | Retired | | 42 | Intraware, Inc. (2003 to 2009) |
Myron S. Scholes (1941) | Trustee | Since 1980 | Chairman, Platinum Grove Asset Management, L.P. (asset manager) (1999 to 2009); Frank E. Buck Professor of Finance-Emeritus, Stanford Graduate School of Business (1996 to present) | | 42 | Dimensional Fund Advisors(investment advisor); CME Group, Inc. (futures and options exchange) |
John B. Shoven (1947) | Trustee | Since 2002 | Professor of Economics, Stanford University (1973 to present) | | 42 | Cadence Design Systems; Exponent; Financial Engines |
| |
| Interested Trustee |
Jonathan S. Thomas (1963) | Trustee and President | Since 2007 | President and Chief Executive Officer, ACC (March 2007 to present). Also serves as Chief Executive Officer and Manager, ACS; Executive Vice President, ACIM; Director, ACC, ACIM and other ACC subsidiaries | | 107 | None |
Officers
The following table presents certain information about the executive officers of the funds. Each officer serves as an officer for each of the 15 investment companies in the American Century family of funds, unless otherwise noted. No officer is compensated for his or her service as an officer of the funds. The listed officers are interested persons of the funds and are appointed or re-appointed on an annual basis. The mailing address for each of the officers listed below is 4500 Main Street, Kansas City, Missouri 64111.
Name (Year of Birth) | Offices with the Funds | | Principal Occupation(s) During the Past Five Years |
Jonathan S.Thomas (1963) | Trustee and President since 2007 | | President and Chief Executive Officer, ACC (March 2007 to present). Also serves as Chief Executive Officer and Manager, ACS; Executive Vice President, ACIM; Director, ACC, ACIM and other ACC subsidiaries |
Maryanne L. Roepke (1956) | Chief Compliance Officer since 2006 and Senior Vice President since 2000 | | Chief Compliance Officer, American Century funds, ACIM and ACS (August 2006 to present). Also serves as Senior Vice President, ACS |
Charles A. Etherington (1957) | General Counsel since 2007 and Senior Vice President since 2006 | | Attorney, ACC (February 1994 to present); Vice President, ACC (November 2005 to present); General Counsel, ACC (March 2007 to present). Also serves as General Counsel, ACIM, ACS, ACIS and other ACC subsidiaries; and Senior Vice President, ACIM and ACS |
C. Jean Wade (1964) | Vice President, Treasurer and Chief Financial Officer since 2012 | | Vice President, ACS (February 2000 to present) |
Robert J. Leach (1966) | Vice President since 2006 and Assistant Treasurer since 2012 | | Vice President, ACS (February 2000 to present) |
David H. Reinmiller (1963) | Vice President since 2001 | | Attorney, ACC (January 1994 to present); Associate General Counsel, ACC (January 2001 to present). Also serves as Vice President, ACIM and ACS |
Ward D. Stauffer (1960) | Secretary since 2005 | | Attorney, ACC (June 2003 to present) |
The Statement of Additional Information has additional information about the fund’s trustees and is available without charge, upon request, by calling 1-800-345-2021.
Retirement Account Information
As required by law, distributions you receive from certain IRAs are subject to federal income tax withholding, unless you elect not to have withholding apply. Tax will be withheld on the total amount withdrawn even though you may be receiving amounts that are not subject to withholding, such as nondeductible contributions. In such case, excess amounts of withholding could occur. You may adjust your withholding election so that a greater or lesser amount will be withheld.
If you don’t want us to withhold on this amount, you must notify us to not withhold the federal income tax. You may notify us in writing or in certain situations by telephone or through other electronic means. For systematic withdrawals, your withholding election will remain in effect until revoked or changed by filing a new election. You have the right to revoke your election at any time.
Remember, even if you elect not to have income tax withheld, you are liable for paying income tax on the taxable portion of your withdrawal. If you elect not to have income tax withheld or you don’t have enough income tax withheld, you may be responsible for payment of estimated tax. You may incur penalties under the estimated tax rules if your withholding and estimated tax payments are not sufficient. You can reduce or defer the income tax on a distribution by directly or indirectly rolling such distribution over to another IRA or eligible plan. You should consult your tax advisor for additional information.
State tax will be withheld if, at the time of your distribution, your address is within one of the mandatory withholding states and you have federal income tax withheld (or as otherwise required by state law). State taxes will be withheld from your distribution in accordance with the respective state rules.
Distributions you receive from 403(b), 457 and qualified plans are subject to special tax and withholding rules. Your plan administrator or plan sponsor is required to provide you with a special tax notice explaining those rules at the time you request a distribution. If applicable, federal and/or state taxes may be withheld from your distribution amount.
Proxy Voting Guidelines
American Century Investment Management, Inc., the fund’s investment advisor, is responsible for exercising the voting rights associated with the securities purchased and/or held by the fund. A description of the policies and procedures the advisor uses in fulfilling this responsibility is available without charge, upon request, by calling 1-800-345-2021. It is also available on American Century Investments’ website at americancentury.com and on the Securities and Exchange Commission’s website at sec.gov. Information regarding how the investment advisor voted proxies relating to portfolio securities during the most recent 12-month period ended June 30 is available on the “About Us” page at americancentury.com. It is also available at sec.gov.
Quarterly Portfolio Disclosure
The fund files its complete schedule of portfolio holdings with the Securities and Exchange Commission (SEC) for the first and third quarters of each fiscal year on Form N-Q. The fund’s Forms N-Q are available on the SEC’s website at sec.gov, and may be reviewed and copied at the SEC’s Public Reference Room in Washington, DC. Information on the operation of the Public Reference Room may be obtained by calling 1-800-SEC-0330. The fund also makes its complete schedule of portfolio holdings for the most recent quarter of its fiscal year available on its website at americancentury.com and, upon request, by calling 1-800-345-2021.
Other Tax Information
The following information is provided pursuant to provisions of the Internal Revenue Code.
The fund hereby designates $1,563,140, or up to the maximum amount allowable, as long-term capital gain distributions for the fiscal year ended March 31, 2013.
The fund hereby designates $1,110,227 as qualified short-term capital gain distributions for purposes of Internal Revenue Code Section 871.
| Contact Us | americancentury.com |
| Automated Information Line | 1-800-345-8765 |
| Investor Services Representative | 1-800-345-2021 or 816-531-5575 |
| Investors Using Advisors | 1-800-378-9878 |
Business, Not-For-Profit, Employer-Sponsored Retirement Plans | 1-800-345-3533 |
Banks and Trust Companies, Broker-Dealers, Financial Professionals, Insurance Companies | 1-800-345-6488 |
| Telecommunications Device for the Deaf | 1-800-634-4113 |
American Century Government Income Trust
Investment Advisor:
American Century Investment Management, Inc.
Kansas City, Missouri
This report and the statements it contains are submitted for the general information of our shareholders. The report is not authorized for distribution to prospective investors unless preceded or accompanied by an effective prospectus.
©2013 American Century Proprietary Holdings, Inc. All rights reserved.
CL-ANN-78342 1305
ANNUAL REPORT MARCH 31, 2013
| | Capital Preservation Fund |
| President’s Letter | 2 |
| Market Perspective | 3 |
| Performance | 4 |
| Fund Characteristics | 5 |
| Shareholder Fee Example | 6 |
| Schedule of Investments | 8 |
| Statement of Assets and Liabilities | 9 |
| Statement of Operations | 10 |
| Statement of Changes in Net Assets | 11 |
| Notes to Financial Statements | 12 |
| Financial Highlights | 15 |
| Report of Independent Registered Public Accounting Firm | 16 |
| Management | 17 |
| Additional Information | 20 |
Any opinions expressed in this report reflect those of the author as of the date of the report, and do not necessarily represent the opinions of American Century Investments® or any other person in the American Century Investments organization. Any such opinions are subject to change at any time based upon market or other conditions and American Century Investments disclaims any responsibility to update such opinions. These opinions may not be relied upon as investment advice and, because investment decisions made by American Century Investments funds are based on numerous factors, may not be relied upon as an indication of trading intent on behalf of any American Century Investments fund. Security examples are used for representational purposes only and are not intended as recommendations to purchase or sell securities. Performance information for comparative indices and securities is provided to American Century Investments by third party vendors. To the best of American Century Investments’ knowledge, such information is accurate at the time of printing.
Dear Investor:
Thank you for reviewing this annual report for the 12 months ended March 31, 2013. It offers investment performance, market analysis, and portfolio information, presented with the expert perspective of our portfolio management team.
Annual reports remain important vehicles for conveying information about fund returns, including key factors that affected fund performance. For additional, updated investment and market insights, we encourage you to visit our website, americancentury.com.
Positive Fiscal-Year Returns for U.S. Stock and Bond Benchmarks
Despite a global economic slowdown, continued concerns about European financial system stability, and uncertainty about U.S. political and fiscal conditions, 12-month U.S. stock and bond index returns were generally positive. Aggressive central bank monetary policies helped motivate investors to take more risk and kept short-term interest rates low.
U.S. mid-cap and value stocks and high-yield bonds achieved performance leadership during the period. U.S. mid-cap and value stock indices outpaced the S&P 500 Index’s 13.96% return, and U.S. corporate high-yield and municipal high-yield benchmarks performed in that 13-14% return range as well. U.S. growth and international index returns were generally lower, but still above average—the MSCI EAFE Index, for example, returned 11.25%.
With the exception of high-yield bond sectors, stocks generally outperformed bonds for the period, though bonds benefitted from economic stagnation, reduced inflation pressures, and low interest rates. The 10-year U.S. Treasury yield declined from 2.21% to 1.85% during the period, and the Barclays U.S. Aggregate Bond Index returned 3.78%.
The U.S. economy showed signs of improvement during the fiscal year, particularly the long-depressed housing market. However, the U.S. economic growth outlook for 2013 remains subpar compared with past recession recoveries, still vulnerable to fiscal and financial factors that could trigger further slowdowns and market volatility.
Under these conditions, we continue to believe in a disciplined, diversified, long-term investment approach, using professionally managed stock and bond portfolios—as appropriate—for meeting financial goals. We appreciate your continued trust in us in this challenging environment.
Sincerely,
Jonathan Thomas
President and Chief Executive Officer
American Century Investments
By David MacEwen, Chief Investment Officer, Fixed Income
Central Banks Set Market Tone
Market sentiment wavered between risk taking and risk aversion during the 12-month period ended March 31, 2013, with risk taking generally prevailing. Persistent concerns about weak global economic growth, combined with Europe’s ongoing financial crisis and bouts of political uncertainty in the U.S. (first from the presidential election and then from the year-end “fiscal cliff” of federal tax hikes and spending cuts), triggered risk aversion, while optimism inspired by aggressive central bank monetary policies led to risk taking.
Early in the period, slowing economic growth, still-high unemployment, and ongoing problems in Europe led to a round of risk aversion that favored U.S. Treasuries. In response to the fragile economic backdrop, the Federal Reserve (the Fed) kept its overnight interest rate target near 0% and announced its third and most aggressive quantitative easing program (QE3), which has the Fed purchasing $40 billion of mortgage-backed securities (MBS) each month until economic growth and employment improve. The Fed expanded QE3 in December to include $45 billion in monthly Treasury purchases. Meanwhile, the European Central Bank launched several programs to help the eurozone’s troubled banks, and the Bank of Japan aggressively expanded its balance sheet.
Investors Favored Risk, Feared Long-Term Inflation
Overall, widespread central bank intervention drove down yields among higher-quality bonds and ultimately sparked investments in riskier asset classes. Both high-yield and investment-grade corporate bonds were among the taxable U.S. fixed-income market’s top performers for the period, benefitting from generally favorable corporate fundamentals and investor demand for yield.
At the same time, longer-term Treasury yields tumbled and the yield curve (which shows the relationship between bond maturities and yields across the maturity spectrum) flattened. These factors, combined with strong safe-haven demand that occasionally emerged and overall sluggish economic growth, led to relative outperformance for longer-maturity Treasuries. Treasury outperformance, combined with some long-term inflation concerns triggered by central bank policies, led to relative outperformance for Treasury inflation-protected securities (TIPS).
| U.S. Fixed-Income Total Returns |
| For the 12 months ended March 31, 2013 |
| Barclays U.S. Bond Market Indices | | Barclays U.S. Treasury Bellwethers |
| Corporate High-Yield | 13.13% | | 3-Month Bill | 0.13% |
| Corporate (investment-grade) | 7.47% | | 2-Year Note | 0.48% |
| Treasury Inflation Protected Securities (TIPS) | 5.68% | | 10-Year Note | 6.20% |
| Aggregate (multi-sector) | 3.78% | | 30-Year Bond | 7.48% |
| Treasury | 3.14% | | | |
| MBS (mortgage-backed securities) | 1.97% | | | |
| Total Returns as of March 31, 2013 |
| | | | Average Annual Returns | |
| | Ticker Symbol | 1 year | 5 years | 10 years | Since Inception | Inception Date |
| Investor Class | CPFXX | 0.01%(1) | 0.19%(1) | 1.41%(1) | 4.15%(1) | 10/13/72 |
| (1) | Returns would have been lower if a portion of the management fee had not been waived. |
| Total Annual Fund Operating Expenses |
Investor Class 0.48% |
The total annual fund operating expenses shown is as stated in the fund’s prospectus current as of the date of this report. The prospectus may vary from the expense ratio shown elsewhere in this report because it is based on a different time period, includes acquired fund fees and expenses, and, if applicable, does not include fee waivers or expense reimbursements.
Data presented reflect past performance. Past performance is no guarantee of future results. Current performance may be higher or lower than the performance shown. To obtain performance data current to the most recent month end, please call 1-800-345-2021 or visit americancentury.com.
An investment in the fund is not insured or guaranteed by the Federal Deposit Insurance Corporation or any other government agency. Although the fund seeks to preserve the value of your investment at $1.00 per share, it is possible to lose money by investing in the fund.
The 7-day current yield more closely reflects the current earnings of the fund than the total return.
| MARCH 31, 2013 |
| 7-Day Current Yield |
After waiver(1) | 0.01% |
| Before waiver | -0.37% |
| 7-Day Effective Yield |
After waiver(1) | 0.01% |
(1)Yields would have been lower if a portion of the management fee had not been waived. |
| | |
| Portfolio at a Glance |
| Weighted Average Maturity | 57 days |
| Weighted Average Life | 57 days |
| | |
| Portfolio Composition by Maturity | % of fund investments |
| 1-30 days | 35% |
| 31-90 days | 48% |
| 91-180 days | 10% |
| More than 180 days | 7% |
Fund shareholders may incur two types of costs: (1) transaction costs, including sales charges (loads) on purchase payments and redemption/exchange fees; and (2) ongoing costs, including management fees; distribution and service (12b-1) fees; and other fund expenses. This example is intended to help you understand your ongoing costs (in dollars) of investing in your fund and to compare these costs with the ongoing cost of investing in other mutual funds.
The example is based on an investment of $1,000 made at the beginning of the period and held for the entire period from October 1, 2012 to March 31, 2013.
Actual Expenses
The table provides information about actual account values and actual expenses for each class. You may use the information, together with the amount you invested, to estimate the expenses that you paid over the period. First, identify the share class you own. Then simply divide your account value by $1,000 (for example, an $8,600 account value divided by $1,000 = 8.6), then multiply the result by the number under the heading “Expenses Paid During Period” to estimate the expenses you paid on your account during this period.
If you hold Investor Class shares of any American Century Investments fund, or Institutional Class shares of the American Century Diversified Bond Fund, in an American Century Investments account (i.e., not a financial intermediary or retirement plan account), American Century Investments may charge you a $12.50 semiannual account maintenance fee if the value of those shares is less than $10,000. We will redeem shares automatically in one of your accounts to pay the $12.50 fee. In determining your total eligible investment amount, we will include your investments in all personal accounts (including American Century Investments Brokerage accounts) registered under your Social Security number. Personal accounts include individual accounts, joint accounts, UGMA/UTMA accounts, personal trusts, Coverdell Education Savings Accounts and IRAs (including traditional, Roth, Rollover, SEP-, SARSEP- and SIMPLE-IRAs), and certain other retirement accounts. If you have only business, business retirement, employer-sponsored or American Century Investments Brokerage accounts, you are currently not subject to this fee. If you are subject to the Account Maintenance Fee, your account value could be reduced by the fee amount.
Hypothetical Example for Comparison Purposes
The table also provides information about hypothetical account values and hypothetical expenses based on the actual expense ratio of each class of your fund and an assumed rate of return of 5% per year before expenses, which is not the actual return of a fund’s share class. The hypothetical account values and expenses may not be used to estimate the actual ending account balance or expenses you paid for the period. You may use this information to compare the ongoing costs of investing in your fund and other funds. To do so, compare this 5% hypothetical example with the 5% hypothetical examples that appear in the shareholder reports of the other funds.
Please note that the expenses shown in the table are meant to highlight your ongoing costs only and do not reflect any transactional costs, such as sales charges (loads) or redemption/exchange fees. Therefore, the table is useful in comparing ongoing costs only, and will not help you determine the relative total costs of owning different funds. In addition, if these transactional costs were included, your costs would have been higher.
| | Beginning Account Value 10/1/12 | Ending Account Value 3/31/13 | Expenses Paid During Period(1) 10/1/12 – 3/31/13 | Annualized Expense Ratio(1) |
| Actual |
| Investor Class (after waiver) | $1,000 | $1,000.00 | $0.50 | 0.10% |
| Investor Class (before waiver) | $1,000 | $1,000.00(2) | $2.39 | 0.48% |
| Hypothetical |
| Investor Class (after waiver) | $1,000 | $1,024.43 | $0.50 | 0.10% |
| Investor Class (before waiver) | $1,000 | $1,022.54 | $2.42 | 0.48% |
| (1) | Expenses are equal to the class’s annualized expense ratio listed in the table above, multiplied by the average account value over the period, multiplied by 182, the number of days in the most recent fiscal half-year, divided by 365, to reflect the one-half year period. |
| (2) | Ending account value assumes the return earned after waiver and would have been lower if a portion of the management fee had not been waived. |
| | | Principal Amount | | | Value | |
U.S. Treasury Bills(1) — 83.3% | |
| U.S. Treasury Bill, 0.08%, 4/4/13 | | | $125,000,000 | | | | $124,999,167 | |
| U.S. Treasury Bill, 0.07%, 4/11/13 | | | 100,000,000 | | | | 99,998,194 | |
| U.S. Treasury Bill, 0.14%, 4/11/13 | | | 32,000,000 | | | | 31,998,733 | |
| U.S. Treasury Bill, 0.07%, 4/18/13 | | | 120,000,000 | | | | 119,996,033 | |
| U.S. Treasury Bill, 0.10%, 4/18/13 | | | 85,000,000 | | | | 84,996,187 | |
| U.S. Treasury Bill, 0.15%, 4/18/13 | | | 40,000,000 | | | | 39,997,214 | |
| U.S. Treasury Bill, 0.07%, 4/25/13 | | | 250,000,000 | | | | 249,988,333 | |
| U.S. Treasury Bill, 0.13%, 4/25/13 | | | 50,000,000 | | | | 49,995,833 | |
| U.S. Treasury Bill, 0.08%, 5/2/13 | | | 150,000,000 | | | | 149,989,990 | |
| U.S. Treasury Bill, 0.15%, 5/9/13 | | | 70,000,000 | | | | 69,989,286 | |
| U.S. Treasury Bill, 0.15%, 5/16/13 | | | 50,000,000 | | | | 49,990,625 | |
| U.S. Treasury Bill, 0.11%, 5/23/13 | | | 95,000,000 | | | | 94,984,906 | |
| U.S. Treasury Bill, 0.14%, 5/23/13 | | | 40,000,000 | | | | 39,992,200 | |
| U.S. Treasury Bill, 0.12%, 5/30/13 | | | 150,000,000 | | | | 149,969,885 | |
| U.S. Treasury Bill, 0.14%, 5/30/13 | | | 100,000,000 | | | | 99,977,056 | |
| U.S. Treasury Bill, 0.11%, 6/6/13 | | | 175,000,000 | | | | 174,964,708 | |
| U.S. Treasury Bill, 0.09%, 6/13/13 | | | 50,000,000 | | | | 49,990,875 | |
| U.S. Treasury Bill, 0.09%, 6/20/13 | | | 175,000,000 | | | | 174,966,945 | |
| U.S. Treasury Bill, 0.08%, 6/27/13 | | | 65,000,000 | | | | 64,987,433 | |
| | | Principal Amount/Shares | | | Value | |
| U.S. Treasury Bill, 0.09%, 6/27/13 | | | $7,000,000 | | | | $6,998,478 | |
| U.S. Treasury Bill, 0.11%, 7/11/13 | | | 25,000,000 | | | | 24,992,635 | |
| U.S. Treasury Bill, 0.11%, 7/18/13 | | | 50,000,000 | | | | 49,984,250 | |
| U.S. Treasury Bill, 0.11%, 8/8/13 | | | 50,000,000 | | | | 49,980,292 | |
| U.S. Treasury Bill, 0.11%, 9/26/13 | | | 150,000,000 | | | | 149,922,125 | |
| TOTAL U.S. TREASURY BILLS | | | | 2,203,651,383 | |
U.S. Treasury Notes(1) — 11.4% | |
| U.S. Treasury Note, 0.625%, 4/30/13 | | | 82,000,000 | | | | 82,031,065 | |
| U.S. Treasury Note, 3.125%, 4/30/13 | | | 50,000,000 | | | | 50,115,547 | |
| U.S. Treasury Note, 1.375%, 5/15/13 | | | 75,000,000 | | | | 75,116,545 | |
| U.S. Treasury Note, 0.375%, 6/30/13 | | | 50,000,000 | | | | 50,035,858 | |
| U.S. Treasury Note, 3.375%, 6/30/13 | | | 9,000,000 | | | | 9,072,293 | |
| U.S. Treasury Note, 3.125%, 8/31/13 | | | 10,000,000 | | | | 10,121,504 | |
| U.S. Treasury Note, 2.75%, 10/31/13 | | | 25,000,000 | | | | 25,369,512 | |
| TOTAL U.S. TREASURY NOTES | | | | 301,862,324 | |
| Temporary Cash Investments — 0.2% | |
| SSgA U.S. Government Money Market Fund | | | 4,744,744 | | | | 4,744,744 | |
| TOTAL INVESTMENT SECURITIES — 94.9% | | | | 2,510,258,451 | |
OTHER ASSETS AND LIABILITIES(2) — 5.1% | | | | 133,689,287 | |
| NET ASSETS — 100.0% | | | | $2,643,947,738 | |
Notes to Schedule of Investments
| (1) | The rates for U.S. Treasury Bills are the yield to maturity at purchase. The rates for U.S. Treasury Notes are the stated coupon rates. |
| (2) | Amount related primarily to receivable for investments sold, but not settled, at period end. |
See Notes to Financial Statements.
Statement of Assets and Liabilities |
| MARCH 31, 2013 | |
| Assets | |
| Investment securities, at value (amortized cost and cost for federal income tax purposes) | | | $2,510,258,451 | |
| Receivable for investments sold | | | 132,001,797 | |
| Receivable for capital shares sold | | | 1,889,747 | |
| Interest receivable | | | 1,693,772 | |
| | | | 2,645,843,767 | |
| | | | | |
| Liabilities | |
| Payable for capital shares redeemed | | | 1,692,381 | |
| Accrued management fees | | | 203,422 | |
| Dividends payable | | | 226 | |
| | | | 1,896,029 | |
| | | | | |
| Net Assets | | | $2,643,947,738 | |
| | | | | |
| Investor Class Capital Shares | |
| Shares outstanding (unlimited number of shares authorized) | | | 2,643,952,718 | |
| | | | | |
| Net Asset Value Per Share | | | $1.00 | |
| | | | | |
| Net Assets Consist of: | |
| Capital paid in | | | $2,643,948,745 | |
| Disbursements in excess of net investment income | | | (226 | ) |
| Accumulated net realized loss | | | (781 | ) |
| | | | $2,643,947,738 | |
See Notes to Financial Statements.
| YEAR ENDED MARCH 31, 2013 | |
| Investment Income (Loss) | |
| Income: | | | |
| Interest | | | $2,790,246 | |
| | | | | |
| Expenses: | | | | |
| Management fees | | | 12,785,338 | |
| Trustees’ fees and expenses | | | 130,807 | |
| Other expenses | | | 1,931 | |
| | | | 12,918,076 | |
| Fees waived | | | (10,386,131 | ) |
| | | | 2,531,945 | |
| | | | | |
| Net investment income (loss) | | | 258,301 | |
| | | | | |
| Net realized gain (loss) on investment transactions | | | 29,720 | |
| | | | | |
| Net Increase (Decrease) in Net Assets Resulting from Operations | | | $288,021 | |
See Notes to Financial Statements.
Statement of Changes in Net Assets |
| YEARS ENDED MARCH 31, 2013 AND MARCH 31, 2012 | |
| Increase (Decrease) in Net Assets | March 31, 2013 | | | March 31, 2012 | |
| Operations | |
| Net investment income (loss) | | $258,301 | | | | $284,579 | |
| Net realized gain (loss) | | 29,720 | | | | (25,261 | ) |
| Net increase (decrease) in net assets resulting from operations | | 288,021 | | | | 259,318 | |
| | | | | | | | |
| Distributions to Shareholders | |
| From net investment income | | (265,160 | ) | | | (284,579 | ) |
| From net realized gains | | — | | | | (3,628 | ) |
| Decrease in net assets from distributions | | (265,160 | ) | | | (288,207 | ) |
| | | | | | | | |
| Capital Share Transactions | |
| Proceeds from shares sold | | 1,237,771,092 | | | | 1,456,843,983 | |
| Proceeds from reinvestment of distributions | | 261,429 | | | | 260,076 | |
| Payments for shares redeemed | | (1,395,900,397 | ) | | | (1,568,500,998 | ) |
| Net increase (decrease) in net assets from capital share transactions | | (157,867,876 | ) | | | (111,396,939 | ) |
| | | | | | | | |
| Net increase (decrease) in net assets | | (157,845,015 | ) | | | (111,425,828 | ) |
| | | | | | | | |
| Net Assets | |
| Beginning of period | | 2,801,792,753 | | | | 2,913,218,581 | |
| End of period | | $2,643,947,738 | | | | $2,801,792,753 | |
| | | | | | | | |
| Disbursements in excess of net investment income | | $(226 | ) | | | — | |
| | | | | | | | |
| Transactions in Shares of the Fund | |
| Sold | | 1,237,771,092 | | | | 1,456,843,983 | |
| Issued in reinvestment of distributions | | 261,429 | | | | 260,076 | |
| Redeemed | | (1,395,900,397 | ) | | | (1,568,500,998 | ) |
| Net increase (decrease) in shares of the fund | | (157,867,876 | ) | | | (111,396,939 | ) |
See Notes to Financial Statements.
Notes to Financial Statements |
MARCH 31, 2013
1. Organization
American Century Government Income Trust (the trust) is registered under the Investment Company Act of 1940, as amended (the 1940 Act), as an open-end management investment company and is organized as a Massachusetts business trust. Capital Preservation Fund (the fund) is one fund in a series issued by the trust. The fund is diversified as defined under Rule 2a-7 of the 1940 Act. The fund’s investment objective is to seek maximum safety and liquidity. Its secondary objective is to seek to pay shareholders the highest rate of return consistent with safety and liquidity.
2. Significant Accounting Policies
The following is a summary of significant accounting policies consistently followed by the fund in preparation of its financial statements. The financial statements are prepared in conformity with accounting principles generally accepted in the United States of America, which may require management to make certain estimates and assumptions at the date of the financial statements. Actual results could differ from these estimates.
Investment Valuations — The fund determines the fair value of its investments and computes its net asset value per share as of the close of regular trading (usually 4 p.m. Eastern time) on the New York Stock Exchange (NYSE) on each day the NYSE is open. Securities are generally valued at amortized cost, which approximates fair value. Investments in open-end management investment companies are valued at the reported net asset value per share. When such valuations do not reflect fair value, securities are valued as determined in good faith by the Board of Trustees or its designee, in accordance with procedures adopted by the Board of Trustees.
Security Transactions — Security transactions are accounted for as of the trade date. Net realized gains and losses are determined on the identified cost basis, which is also used for federal income tax purposes.
Investment Income — Interest income is recorded on the accrual basis and includes accretion of discounts and amortization of premiums.
Treasury Roll Transactions — The fund purchases a security and at the same time makes a commitment to sell the same security at a future settlement date at a specified price. These types of transactions are known as treasury roll transactions. The difference between the purchase price and the sale price represents interest income reflective of an agreed upon rate between the fund and the counterparty.
Income Tax Status — It is the fund’s policy to distribute substantially all net investment income and net realized gains to shareholders and to otherwise qualify as a regulated investment company under provisions of the Internal Revenue Code. Accordingly, no provision has been made for income taxes. The fund files U.S. federal, state, local and non-U.S. tax returns as applicable. The fund’s tax returns are subject to examination by the relevant taxing authority until expiration of the applicable statute of limitations, which is generally three years from the date of filing but can be longer in certain jurisdictions. At this time, management believes there are no uncertain tax positions which, based on their technical merit, would not be sustained upon examination and for which it is reasonably possible that the total amounts of unrecognized tax benefits will significantly change in the next twelve months.
Distributions to Shareholders — Distributions from net investment income are declared daily and paid monthly. The fund may make short-term capital gains distributions to comply with the distribution requirements of the Internal Revenue Code. The fund does not expect to realize any long-term capital gains, and accordingly, does not expect to pay any long-term capital gains distributions.
Indemnifications — Under the trust’s organizational documents, its officers and trustees are indemnified against certain liabilities arising out of the performance of their duties to the fund. In addition, in the normal course of business, the fund enters into contracts that provide general indemnifications. The maximum exposure under these arrangements is unknown as this would involve future claims that may be made against a fund. The risk of material loss from such claims is considered by management to be remote.
3. Fees and Transactions with Related Parties
Management Fees — The trust has entered into a management agreement with American Century Investment Management, Inc. (ACIM) (the investment advisor), under which ACIM provides the fund with investment advisory and management services in exchange for a single, unified management fee (the fee). The agreement provides that all expenses of managing and operating the fund, except distribution and service fees, brokerage expenses, taxes, interest, fees and expenses of the independent trustees (including legal counsel fees), and extraordinary expenses, will be paid by ACIM. The fee is computed and accrued daily based on the daily net assets of the fund and paid monthly in arrears. The fee consists of (1) an Investment Category Fee based on the daily net assets of the fund and certain other accounts managed by the investment advisor that are in the same broad investment category as the fund and (2) a Complex Fee based on the assets of all the funds in the American Century Investments family of funds. The rates for the Investment Category Fee range from 0.1370% to 0.2500%. The rates for the Complex Fee range from 0.2500% to 0.3100%. In order to maintain a positive yield, ACIM may voluntarily waive a portion of its management fee on a daily basis. This fee waiver may be revised or terminated at any time without notice. The effective annual management fee for the year ended March 31, 2013 was 0.47% before waiver and 0.09% after waiver.
Related Parties — Certain officers and trustees of the trust are also officers and/or directors of American Century Companies, Inc. (ACC). The trust’s investment advisor, ACIM, the trust’s distributor, American Century Investment Services, Inc., and the trust’s transfer agent, American Century Services, LLC are wholly owned, directly or indirectly, by ACC.
4. Fair Value Measurements
The fund’s securities valuation process is based on several considerations and may use multiple inputs to determine the fair value of the positions held by the fund. In conformity with accounting principles generally accepted in the United States of America, the inputs used to determine a valuation are classified into three broad levels as follows:
| • | Level 1 valuation inputs consist of unadjusted quoted prices in an active market for identical securities; |
| • | Level 2 valuation inputs consist of direct or indirect observable market data (including quoted prices for similar securities, evaluations of subsequent market events, interest rates, prepayment speeds, credit risk, etc.); or |
| • | Level 3 valuation inputs consist of unobservable data (including a fund’s own assumptions). |
The level classification is based on the lowest level input that is significant to the fair valuation measurement. The valuation inputs are not necessarily an indication of the risks associated with investing in these securities or other financial instruments.
The following is a summary of the level classifications as of period end. The Schedule of Investments provides additional information on the fund’s portfolio holdings.
| | Level 1 | | | Level 2 | | | Level 3 | |
| Investment Securities | |
| U.S. Treasury Bills | | — | | | | $2,203,651,383 | | | | — | |
| U.S. Treasury Notes | | — | | | | 301,862,324 | | | | — | |
| Temporary Cash Investments | | $4,744,744 | | | | — | | | | — | |
| Total Value of Investment Securities | | $4,744,744 | | | | $2,505,513,707 | | | | — | |
5. Federal Tax Information
The tax character of distributions paid during the years ended March 31, 2013 and March 31, 2012 were as follows:
| | | 2013 | | | 2012 | |
| Distributions Paid From | |
| Ordinary income | | | $260,252 | | | | $288,207 | |
| Long-term capital gains | | | — | | | | — | |
| Tax return of capital | | | $4,908 | | | | — | |
The book-basis character of distributions made during the year from net investment income or net realized gains may differ from their ultimate characterization for federal income tax purposes. These differences reflect the differing character of certain income items and net realized gains and losses for financial statement and tax purposes, and may result in reclassification among certain capital accounts on the financial statements.
As of March 31, 2013, the fund had post-October capital loss deferrals of $(781), which represent certain qualified losses that the fund has elected to treat as having been incurred in the following fiscal year for federal income tax purposes.
| For a Share Outstanding Throughout the Years Ended March 31 (except as noted) |
| Per-Share Data | Ratios and Supplemental Data |
| | | | Distributions From: | | | Ratio to Average Net Assets of: | |
| | Net Asset Value, Beginning of Period | Income From Investment Operations: Net Investment Income (Loss) | Net Investment Income | Net Realized Gains | Total Distributions | Net Asset Value, End of Period | Total Return(1) | Operating Expenses | Operating Expenses (before expense waiver) | Net Investment Income (Loss) | Net Investment Income (Loss) (before expense waiver) | Net Assets, End of Period (in thousands) |
| Investor Class |
| 2013 | $1.00 | —(2) | —(2) | — | —(2) | $1.00 | 0.01% | 0.09% | 0.48% | 0.01% | (0.38)% | $2,643,948 |
| 2012 | $1.00 | —(2) | —(2) | —(2) | —(2) | $1.00 | 0.01% | 0.06% | 0.48% | 0.01% | (0.41)% | $2,801,793 |
| 2011 | $1.00 | —(2) | —(2) | —(2) | —(2) | $1.00 | 0.01% | 0.17% | 0.48% | 0.01% | (0.30)% | $2,913,219 |
| 2010 | $1.00 | —(2) | —(2) | —(2) | —(2) | $1.00 | 0.01% | 0.28% | 0.48% | 0.01% | (0.19)% | $3,153,367 |
| 2009 | $1.00 | 0.01 | (0.01) | — | (0.01) | $1.00 | 0.91% | 0.49% | 0.49% | 0.87% | 0.87% | $3,568,285 |
Notes to Financial Highlights
| (1) | Total returns are calculated based on the net asset value of the last business day. Total returns for periods less than one year are not annualized. |
| (2) | Per-share amount was less than $0.005. |
See Notes to Financial Statements.
Report of Independent Registered Public Accounting Firm |
To the Trustees of the American Century Government Income Trust and
Shareholders of the Capital Preservation Fund:
In our opinion, the accompanying statement of assets and liabilities, including the schedule of investments, and the related statements of operations and of changes in net assets and the financial highlights present fairly, in all material respects, the financial position of the Capital Preservation Fund (one of the five funds comprising the American Century Government Income Trust, hereafter referred to as the “Fund”) at March 31, 2013, the results of its operations for the year then ended, the changes in its net assets for each of the two years in the period then ended and the financial highlights for each of the five years in the period then ended, in conformity with accounting principles generally accepted in the United States of America. These financial statements and financial highlights (hereafter referred to as “financial statements”) are the responsibility of the Fund’s management; our responsibility is to express an opinion on these financial statements based on our audits. We conducted our audits of these financial statements in accordance with the standards of the Public Company Accounting Oversight Board (United States). Those standards require that we plan and perform the audit to obtain reasonable assurance about whether the financial statements are free of material misstatement. An audit includes examining, on a test basis, evidence supporting the amounts and disclosures in the financial statements, assessing the accounting principles used and significant estimates made by management, and evaluating the overall financial statement presentation. We believe that our audits, which included confirmation of securities at March 31, 2013 by correspondence with the custodian, provide a reasonable basis for our opinion.
PricewaterhouseCoopers LLP
Kansas City, Missouri
May 21, 2013
Board of Trustees
The individuals listed below serve as trustees of the funds. Each trustee will continue to serve in this capacity until death, retirement, resignation or removal from office. The board has adopted a mandatory retirement age for trustees who are not “interested persons,” as that term is defined in the Investment Company Act (independent trustees). Independent trustees shall retire on December 31 of the year in which they reach their 75th birthday; provided, however, that on or after January 1, 2022, independent trustees shall retire on December 31 of the year in which they reach their 76th birthday.
Mr. Thomas is the only trustee who is an “interested person” because he currently serves as President and Chief Executive Officer of American Century Companies, Inc. (ACC), the parent company of American Century Investment Management, Inc. (ACIM or the advisor).
The other trustees (more than three-fourths of the total number) are independent; that is, they have never been employees, directors or officers of, and have no financial interest in, ACC or any of its wholly owned, direct or indirect, subsidiaries, including ACIM, American Century Investment Services, Inc. (ACIS) and American Century Services, LLC (ACS). The trustees serve in this capacity for eight (in the case of Mr. Thomas, 15) registered investment companies in the American Century Investments family of funds.
The following table presents additional information about the trustees. The mailing address for each trustee other than Mr. Thomas is 1665 Charleston Road, Mountain View, California 94043. The mailing address for Mr. Thomas is 4500 Main Street, Kansas City, Missouri 64111.
Name (Year of Birth) | Position(s) Held with Funds | Length of Time Served | Principal Occupation(s) During Past 5 Years | | Number of American Century Portfolios Overseen by Trustee | Other Directorships Held During Past 5 Years |
| Independent Trustees |
Tanya S. Beder (1955) | Trustee | Since 2011 | Chairman, SBCC Group Inc. (independent advisory services) (2006 to present) | | 42 | CYS Investments, Inc. (specialty finance company) |
Jeremy I. Bulow (1954) | Trustee | Since 2011 | Professor of Economics, Stanford University, Graduate School of Business (1979 to present) | | 42 | None |
Ronald J. Gilson (1946) | Trustee and Chairman of the Board | Since 1995 | Charles J. Meyers Professor of Law and Business, Stanford Law School (1979 to present); Marc and Eva Stern Professor of Law and Business, Columbia University School of Law (1992 to present) | | 42 | None |
Frederick L. A. Grauer (1946) | Trustee | Since 2008 | Senior Advisor, BlackRock, Inc. (investment management firm) (2010 to 2011); Senior Advisor, Barclays Global Investors (investment management firm) (2003 to 2009) | | 42 | None |
Name (Year of Birth) | Position(s) Held with Funds | Length of Time Served | Principal Occupation(s) During Past 5 Years | | Number of American Century Portfolios Overseen by Trustee | Other Directorships Held During Past 5 Years |
| Independent Trustees |
Peter F. Pervere (1947) | Trustee | Since 2007 | Retired | | 42 | Intraware, Inc. (2003 to 2009) |
Myron S. Scholes (1941) | Trustee | Since 1980 | Chairman, Platinum Grove Asset Management, L.P. (asset manager) (1999 to 2009); Frank E. Buck Professor of Finance-Emeritus, Stanford Graduate School of Business (1996 to present) | | 42 | Dimensional Fund Advisors (investment advisor); CME Group, Inc. (futures and options exchange) |
John B. Shoven (1947) | Trustee | Since 2002 | Professor of Economics, Stanford University (1973 to present) | | 42 | Cadence Design Systems; Exponent; Financial Engines |
| |
| Interested Trustee |
Jonathan S. Thomas (1963) | Trustee and President | Since 2007 | President and Chief Executive Officer, ACC (March 2007 to present). Also serves as Chief Executive Officer and Manager, ACS; Executive Vice President, ACIM; Director, ACC, ACIM and other ACC subsidiaries | | 107 | None |
Officers
The following table presents certain information about the executive officers of the funds. Each officer serves as an officer for each of the 15 investment companies in the American Century family of funds, unless otherwise noted. No officer is compensated for his or her service as an officer of the funds. The listed officers are interested persons of the funds and are appointed or re-appointed on an annual basis. The mailing address for each of the officers listed below is 4500 Main Street, Kansas City, Missouri 64111.
Name (Year of Birth) | Offices with the Funds | Principal Occupation(s) During the Past Five Years |
Jonathan S. Thomas (1963) | Trustee and President since 2007 | President and Chief Executive Officer, ACC (March 2007 to present). Also serves as Chief Executive Officer and Manager, ACS; Executive Vice President, ACIM; Director, ACC, ACIM and other ACC subsidiaries |
Maryanne L. Roepke (1956) | Chief Compliance Officer since 2006 and Senior Vice President since 2000 | Chief Compliance Officer, American Century funds, ACIM and ACS (August 2006 to present). Also serves as Senior Vice President, ACS |
Charles A. Etherington (1957) | General Counsel since 2007 and Senior Vice President since 2006 | Attorney, ACC (February 1994 to present); Vice President, ACC (November 2005 to present); General Counsel, ACC (March 2007 to present). Also serves as General Counsel, ACIM, ACS, ACIS and other ACC subsidiaries; and Senior Vice President, ACIM and ACS |
C. Jean Wade (1964) | Vice President, Treasurer and Chief Financial Officer since 2012 | Vice President, ACS (February 2000 to present) |
Robert J. Leach (1966) | Vice President since 2006 and Assistant Treasurer since 2012 | Vice President, ACS (February 2000 to present) |
David H. Reinmiller (1963) | Vice President since 2001 | Attorney, ACC (January 1994 to present); Associate General Counsel, ACC (January 2001 to present). Also serves as Vice President, ACIM and ACS |
Ward D. Stauffer (1960) | Secretary since 2005 | Attorney, ACC (June 2003 to present) |
The Statement of Additional Information has additional information about the fund’s trustees and is available without charge, upon request, by calling 1-800-345-2021.
Retirement Account Information
As required by law, distributions you receive from certain IRAs are subject to federal income tax withholding, unless you elect not to have withholding apply. Tax will be withheld on the total amount withdrawn even though you may be receiving amounts that are not subject to withholding, such as nondeductible contributions. In such case, excess amounts of withholding could occur. You may adjust your withholding election so that a greater or lesser amount will be withheld.
If you don’t want us to withhold on this amount, you must notify us to not withhold the federal income tax. You may notify us in writing or in certain situations by telephone or through other electronic means. For systematic withdrawals, your withholding election will remain in effect until revoked or changed by filing a new election. You have the right to revoke your election at any time.
Remember, even if you elect not to have income tax withheld, you are liable for paying income tax on the taxable portion of your withdrawal. If you elect not to have income tax withheld or you don’t have enough income tax withheld, you may be responsible for payment of estimated tax. You may incur penalties under the estimated tax rules if your withholding and estimated tax payments are not sufficient. You can reduce or defer the income tax on a distribution by directly or indirectly rolling such distribution over to another IRA or eligible plan. You should consult your tax advisor for additional information.
State tax will be withheld if, at the time of your distribution, your address is within one of the mandatory withholding states and you have federal income tax withheld (or as otherwise required by state law). State taxes will be withheld from your distribution in accordance with the respective state rules.
Distributions you receive from 403(b), 457 and qualified plans are subject to special tax and withholding rules. Your plan administrator or plan sponsor is required to provide you with a special tax notice explaining those rules at the time you request a distribution. If applicable, federal and/or state taxes may be withheld from your distribution amount.
Proxy Voting Guidelines
American Century Investment Management, Inc., the fund’s investment advisor, is responsible for exercising the voting rights associated with the securities purchased and/or held by the fund. A description of the policies and procedures the advisor uses in fulfilling this responsibility is available without charge, upon request, by calling 1-800-345-2021. It is also available on American Century Investments’ website at americancentury.com and on the Securities and Exchange Commission’s website at sec.gov. Information regarding how the investment advisor voted proxies relating to portfolio securities during the most recent 12-month period ended June 30 is available on the “About Us” page at americancentury.com. It is also available at sec.gov.
Quarterly Portfolio Disclosure
The fund files its complete schedule of portfolio holdings with the Securities and Exchange Commission (SEC) for the first and third quarters of each fiscal year on Form N-Q. The fund’s Forms N-Q are available on the SEC’s website at sec.gov, and may be reviewed and copied at the SEC’s Public Reference Room in Washington, DC. Information on the operation of the Public Reference Room may be obtained by calling 1-800-SEC-0330. The fund also makes its complete schedule of portfolio holdings for the most recent quarter of its fiscal year available on its website at americancentury.com and, upon request, by calling 1-800-345-2021.
| Contact Us | americancentury.com |
| Automated Information Line | 1-800-345-8765 |
| Investor Services Representative | 1-800-345-2021 or 816-531-5575 |
| Investors Using Advisors | 1-800-378-9878 |
Business, Not-For-Profit, Employer-Sponsored Retirement Plans | 1-800-345-3533 |
Banks and Trust Companies, Broker-Dealers, Financial Professionals, Insurance Companies | 1-800-345-6488 |
| Telecommunications Device for the Deaf | 1-800-634-4113 |
American Century Government Income Trust
Investment Advisor:
American Century Investment Management, Inc.
Kansas City, Missouri
This report and the statements it contains are submitted for the general information of our shareholders. The report is not authorized for distribution to prospective investors unless preceded or accompanied by an effective prospectus.
©2013 American Century Proprietary Holdings, Inc. All rights reserved.
CL-ANN-78338 1305
ANNUAL REPORT MARCH 31, 2013
| President’s Letter | 2 |
| Market Perspective | 3 |
| Performance | 4 |
| Portfolio Commentary | 6 |
| Fund Characteristics | 8 |
| Shareholder Fee Example | 9 |
| Schedule of Investments | 11 |
| Statement of Assets and Liabilities | 15 |
| Statement of Operations | 16 |
| Statement of Changes in Net Assets | 17 |
| Notes to Financial Statements | 18 |
| Financial Highlights | 24 |
| Report of Independent Registered Public Accounting Firm | 26 |
| Management | 27 |
| Additional Information | 30 |
Any opinions expressed in this report reflect those of the author as of the date of the report, and do not necessarily represent the opinions of American Century Investments® or any other person in the American Century Investments organization. Any such opinions are subject to change at any time based upon market or other conditions and American Century Investments disclaims any responsibility to update such opinions. These opinions may not be relied upon as investment advice and, because investment decisions made by American Century Investments funds are based on numerous factors, may not be relied upon as an indication of trading intent on behalf of any American Century Investments fund. Security examples are used for representational purposes only and are not intended as recommendations to purchase or sell securities. Performance information for comparative indices and securities is provided to American Century Investments by third party vendors. To the best of American Century Investments’ knowledge, such information is accurate at the time of printing.
Dear Investor:
Thank you for reviewing this annual report for the 12 months ended March 31, 2013. It offers investment performance, market analysis, and portfolio information, presented with the expert perspective of our portfolio management team.
Annual reports remain important vehicles for conveying information about fund returns, including key factors that affected fund performance. For additional, updated investment and market insights, we encourage you to visit our website, americancentury.com.
Positive Fiscal-Year Returns for U.S. Stock and Bond Benchmarks
Despite a global economic slowdown, continued concerns about European financial system stability, and uncertainty about U.S. political and fiscal conditions, 12-month U.S. stock and bond index returns were generally positive. Aggressive central bank monetary policies helped motivate investors to take more risk and kept short-term interest rates low.
U.S. mid-cap and value stocks and high-yield bonds achieved performance leadership during the period. U.S. mid-cap and value stock indices outpaced the S&P 500 Index’s 13.96% return, and U.S. corporate high-yield and municipal high-yield benchmarks performed in that 13-14% return range as well. U.S. growth and international index returns were generally lower, but still above average—the MSCI EAFE Index, for example, returned 11.25%.
With the exception of high-yield bond sectors, stocks generally outperformed bonds for the period, though bonds benefitted from economic stagnation, reduced inflation pressures, and low interest rates. The 10-year U.S. Treasury yield declined from 2.21% to 1.85% during the period, and the Barclays U.S. Aggregate Bond Index returned 3.78%.
The U.S. economy showed signs of improvement during the fiscal year, particularly the long-depressed housing market. However, the U.S. economic growth outlook for 2013 remains subpar compared with past recession recoveries, still vulnerable to fiscal and financial factors that could trigger further slowdowns and market volatility.
Under these conditions, we continue to believe in a disciplined, diversified, long-term investment approach, using professionally managed stock and bond portfolios—as appropriate—for meeting financial goals. We appreciate your continued trust in us in this challenging environment.
Sincerely,
Jonathan Thomas
President and Chief Executive Officer
American Century Investments
By David MacEwen, Chief Investment Officer, Fixed Income
Central Banks Set Market Tone
Market sentiment wavered between risk taking and risk aversion during the 12-month period ended March 31, 2013, with risk taking generally prevailing. Persistent concerns about weak global economic growth, combined with Europe’s ongoing financial crisis and bouts of political uncertainty in the U.S. (first from the presidential election and then from the year-end “fiscal cliff” of federal tax hikes and spending cuts), triggered risk aversion, while optimism inspired by aggressive central bank monetary policies led to risk taking.
Early in the period, slowing economic growth, still-high unemployment, and ongoing problems in Europe led to a round of risk aversion that favored U.S. Treasuries. In response to the fragile economic backdrop, the Federal Reserve (the Fed) kept its overnight interest rate target near 0% and announced its third and most aggressive quantitative easing program (QE3), which has the Fed purchasing $40 billion of mortgage-backed securities (MBS) each month until economic growth and employment improve. The Fed expanded QE3 in December to include $45 billion in monthly Treasury purchases. Meanwhile, the European Central Bank launched several programs to help the eurozone’s troubled banks, and the Bank of Japan aggressively expanded its balance sheet.
Investors Favored Risk, Feared Long-Term Inflation
Overall, widespread central bank intervention drove down yields among higher-quality bonds and ultimately sparked investments in riskier asset classes. Both high-yield and investment-grade corporate bonds were among the taxable U.S. fixed-income market’s top performers for the period, benefitting from generally favorable corporate fundamentals and investor demand for yield.
At the same time, longer-term Treasury yields tumbled and the yield curve (which shows the relationship between bond maturities and yields across the maturity spectrum) flattened. These factors, combined with strong safe-haven demand that occasionally emerged and overall sluggish economic growth, led to relative outperformance for longer-maturity Treasuries. Treasury outperformance, combined with some long-term inflation concerns triggered by central bank policies, led to relative outperformance for Treasury inflation-protected securities (TIPS).
| U.S. Fixed-Income Total Returns |
| For the 12 months ended March 31, 2013 |
| Barclays U.S. Bond Market Indices | | Barclays U.S. Treasury Bellwethers |
| Corporate High-Yield | 13.13% | | 3-Month Bill | 0.13% |
| Corporate (investment-grade) | 7.47% | | 2-Year Note | 0.48% |
| Treasury Inflation Protected Securities (TIPS) | 5.68% | | 10-Year Note | 6.20% |
| Aggregate (multi-sector) | 3.78% | | 30-Year Bond | 7.48% |
| Treasury | 3.14% | | |
| MBS (mortgage-backed securities) | 1.97% | | |
| Total Returns as of March 31, 2013 |
| | | | Average Annual Returns | |
| | Ticker Symbol | 1 year | 5 years | 10 years | Since Inception | Inception Date |
| Investor Class | CPTNX | 2.36% | 4.63% | 4.44% | 7.23% | 5/16/80 |
Barclays U.S. Government/MBS Index | — | 2.55% | 4.78% | 4.75% | 8.22%(1) | — |
| Institutional Class | ABTIX | 2.56% | — | — | 4.50% | 3/1/10 |
A Class(2) No sales charge* With sales charge* | ABTAX | 2.10% -2.50% | 4.37% 3.42% | 4.19% 3.71% | 5.22% 4.90% | 10/9/97 |
| C Class | ABTCX | 1.35% | — | — | 3.26% | 3/1/10 |
| R Class | ABTRX | 1.85% | — | — | 3.78% | 3/1/10 |
| Sales charges include initial sales charges and contingent deferred sales charges (CDSCs), as applicable. A Class shares have a 4.50% maximum initial sales charge and may be subject to a maximum CDSC of 1.00%. C Class shares redeemed within 12 months of purchase are subject to a maximum CDSC of 1.00%. The SEC requires that mutual funds provide performance information net of maximum sales charges in all cases where charges could be applied. |
Performance information prior to September 3, 2002, is that of the American Century Treasury Fund, all of the net assets of which were acquired by Government Bond pursuant to a plan of reorganization approved by Treasury Fund shareholders on August 2, 2002.
| (1) | Since 5/31/80, the date nearest the Investor Class’s inception for which data are available. |
| (2) | Prior to March 1, 2010, the A Class was referred to as the Advisor Class and did not have a front-end sales charge. Performance prior to that date has been adjusted to reflect this charge. |
Data presented reflect past performance. Past performance is no guarantee of future results. Current performance may be higher or lower than the performance shown. Investment return and principal value will fluctuate, and redemption value may be more or less than original cost. To obtain performance data current to the most recent month end, please call 1-800-345-2021 or visit americancentury.com. As interest rates rise, bond values will decline. The fund’s investment process may result in high portfolio turnover, which could mean high transaction costs, affecting both performance and capital gains tax liabilities to investors.
Unless otherwise indicated, performance reflects Investor Class shares; performance for other share classes will vary due to differences in fee structure. For information about other share classes available, please consult the prospectus. Data assumes reinvestment of dividends and capital gains, and none of the charts reflect the deduction of taxes that a shareholder would pay on fund distributions or the redemption of fund shares. Returns for the index are provided for comparison. The fund’s total returns include operating expenses (such as transaction costs and management fees) that reduce returns, while the total returns of the index do not.
| Growth of $10,000 Over 10 Years |
| $10,000 investment made March 31, 2003 |
| Total Annual Fund Operating Expenses |
| Investor Class | Institutional Class | A Class | C Class | R Class |
| 0.48% | 0.28% | 0.73% | 1.48% | 0.98% |
The total annual fund operating expenses shown is as stated in the fund’s prospectus current as of the date of this report. The prospectus may vary from the expense ratio shown elsewhere in this report because it is based on a different time period, includes acquired fund fees and expenses, and, if applicable, does not include fee waivers or expense reimbursements.
Data presented reflect past performance. Past performance is no guarantee of future results. Current performance may be higher or lower than the performance shown. Investment return and principal value will fluctuate, and redemption value may be more or less than original cost. To obtain performance data current to the most recent month end, please call 1-800-345-2021 or visit americancentury.com. As interest rates rise, bond values will decline. The fund’s investment process may result in high portfolio turnover, which could mean high transaction costs, affecting both performance and capital gains tax liabilities to investors.
Unless otherwise indicated, performance reflects Investor Class shares; performance for other share classes will vary due to differences in fee structure. For information about other share classes available, please consult the prospectus. Data assumes reinvestment of dividends and capital gains, and none of the charts reflect the deduction of taxes that a shareholder would pay on fund distributions or the redemption of fund shares. Returns for the index are provided for comparison. The fund’s total returns include operating expenses (such as transaction costs and management fees) that reduce returns, while the total returns of the index do not.
Portfolio Managers: Bob Gahagan, Hando Aguilar, Brian Howell, Dan Shiffman, and Jim Platz
Performance Summary
Government Bond returned 2.36%* for the 12 months ended March 31, 2013. By comparison, the portfolio’s benchmark, the Barclays U.S. Government/MBS Index, returned 2.55%. See pages 4 and 5 for additional performance comparisons. Fund returns reflect operating expenses, while index returns do not.
Government Bond’s absolute return reflected the positive performance of intermediate- and long-term government-backed securities during the period. Relative to the benchmark, the main detractor was an overweight position to mortgage-backed securities (MBS) and corresponding underweight positions to Treasury and agency securities during the reporting period, when those sectors outperformed.
Treasuries Outperformed Agencies, MBS
With U.S. Treasury yields remaining at relatively low levels, we maintained an underweight position in Treasuries and agencies and an overweight position in the higher-yielding MBS sector throughout the 12-month period. This positioning slightly detracted from fund performance, as Treasuries generally outperformed MBS and other government agency securities in the portfolio’s maturity range. The Federal Reserve’s (the Fed’s) ongoing stimulus programs, combined with flight-to-quality-inspired demand for Treasuries early in the reporting period, caused yields on longer-term Treasury notes and bonds to decline, generating positive returns for the broad Treasury benchmark.
Meanwhile, rising mortgage prepayment levels (due to mortgage-holders refinancing to take advantage of historically low mortgage rates) weighed on MBS performance for much of the period. Nevertheless, the mortgage sector rallied in late-2012, following the Fed’s mid-September announcement of a third round of quantitative easing (QE3), or the monthly purchase of $40 billion in agency MBS. (The Fed later expanded QE3 to include $45 billion in monthly Treasury purchases.) But, sentiment toward mortgage securities shifted early in 2013. Housing and job market gains sparked economic optimism, which led to speculation the Fed would scale back its MBS purchases earlier than originally expected. Concerns about mortgage prepayments gave way to the potential for extension risk—that is, the risk that mortgage securities will be prepaid at a slower pace, thus limiting investors’ ability to capitalize on higher interest rates because their investments remain locked in at lower rates for longer periods of time.
Selection Among MBS Helped Results
Security selection within the portfolio’s mortgage component contributed positively to the 12-month return. In particular, we maintained a modest overweight to higher-yielding collateralized mortgage obligations (CMOs) and a neutral weighting to traditional government agency pass-through MBS. This positioning helped the portfolio’s performance, because CMOs outperformed traditional MBS. Investors generally favored “structured mortgage products,” such as CMOs, which generally experience less refinancing-associated price volatility, while offering more-predictable cash flows.
*All fund returns referenced in this commentary are for Investor Class shares.
A position in loan balance paper, which provides exposure to mortgage pools with lower average loan balances and less susceptibility to prepayments, also boosted the fund’s relative performance. We exited the position at a profit late in 2012, believing these securities had reached their near-term value potential. At the same time, we added exposure to hybrid agency adjustable-rate mortgages (ARMs). These securities combine the characteristics of fixed- and adjustable-rate mortgages, with rates fixed for a set period of time before adjusting periodically according to a specific index. We believe the short duration (price sensitivity to interest rate changes) and low supply of hybrid ARMs should benefit portfolio performance when mortgage rates begin to rise.
Inflation Outlook Prompted TIPS Overweight
Within the Treasury allocation, we maintained a small overweight position to Treasury inflation-protected securities (TIPS). We believe the Fed’s open-ended quantitative easing program likely will lead to higher long-term inflation than is currently accounted for in the financial markets, and TIPS should benefit from such a scenario.
Outlook
“In 2013, we expect economic growth to remain subpar, with U.S. growth remaining between 1% and 3%,” says the Fixed Income Macro Strategy Team at American Century Investments. “Despite improvements in employment and housing, we believe the odds of a sustained upside breakout in growth in 2013 remain limited, given the headwinds of fiscal consolidation, higher taxes, and increased regulation.
“In the near term, we believe interest rates likely will remain in a fairly tight range. Longer term, the bias is for rates to trend higher.”
In that context, we will maintain our disciplined, relative-value approach to portfolio management, emphasizing careful security selection and risk management. We are likely to keep the fund’s duration close to that of the benchmark, and in terms of sector allocation, we continue to favor a modest overweight to MBS, focusing on structured mortgage products over traditional pass-through mortgage securities.
| MARCH 31, 2013 |
| Portfolio at a Glance | |
| Average Duration (effective) | 4.8 years |
| Weighted Average Life | 5.2 years |
| | |
| Types of Investments in Portfolio | % of net assets |
| U.S. Treasury Securities | 48.2% |
| U.S. Government Agency Mortgage-Backed Securities | 46.1% |
| Collateralized Mortgage Obligations | 7.9% |
| U.S. Government Agency Securities | 3.4% |
| Temporary Cash Investments | 7.3% |
| Other Assets and Liabilities | (12.9)%* |
*Amount relates primarily to payable for investments purchased, but not settled, at period end.
Fund shareholders may incur two types of costs: (1) transaction costs, including sales charges (loads) on purchase payments and redemption/exchange fees; and (2) ongoing costs, including management fees; distribution and service (12b-1) fees; and other fund expenses. This example is intended to help you understand your ongoing costs (in dollars) of investing in your fund and to compare these costs with the ongoing cost of investing in other mutual funds.
The example is based on an investment of $1,000 made at the beginning of the period and held for the entire period from October 1, 2012 to March 31, 2013.
Actual Expenses
The table provides information about actual account values and actual expenses for each class. You may use the information, together with the amount you invested, to estimate the expenses that you paid over the period. First, identify the share class you own. Then simply divide your account value by $1,000 (for example, an $8,600 account value divided by $1,000 = 8.6), then multiply the result by the number under the heading “Expenses Paid During Period” to estimate the expenses you paid on your account during this period.
If you hold Investor Class shares of any American Century Investments fund, or Institutional Class shares of the American Century Diversified Bond Fund, in an American Century Investments account (i.e., not a financial intermediary or retirement plan account), American Century Investments may charge you a $12.50 semiannual account maintenance fee if the value of those shares is less than $10,000. We will redeem shares automatically in one of your accounts to pay the $12.50 fee. In determining your total eligible investment amount, we will include your investments in all personal accounts (including American Century Investments Brokerage accounts) registered under your Social Security number. Personal accounts include individual accounts, joint accounts, UGMA/UTMA accounts, personal trusts, Coverdell Education Savings Accounts and IRAs (including traditional, Roth, Rollover, SEP-, SARSEP- and SIMPLE-IRAs), and certain other retirement accounts. If you have only business, business retirement, employer-sponsored or American Century Investments Brokerage accounts, you are currently not subject to this fee. If you are subject to the Account Maintenance Fee, your account value could be reduced by the fee amount.
Hypothetical Example for Comparison Purposes
The table also provides information about hypothetical account values and hypothetical expenses based on the actual expense ratio of each class of your fund and an assumed rate of return of 5% per year before expenses, which is not the actual return of a fund’s share class. The hypothetical account values and expenses may not be used to estimate the actual ending account balance or expenses you paid for the period. You may use this information to compare the ongoing costs of investing in your fund and other funds. To do so, compare this 5% hypothetical example with the 5% hypothetical examples that appear in the shareholder reports of the other funds.
Please note that the expenses shown in the table are meant to highlight your ongoing costs only and do not reflect any transactional costs, such as sales charges (loads) or redemption/exchange fees. Therefore, the table is useful in comparing ongoing costs only, and will not help you determine the relative total costs of owning different funds. In addition, if these transactional costs were included, your costs would have been higher.
| | Beginning Account Value 10/1/12 | Ending Account Value 3/31/13 | Expenses Paid During Period(1) 10/1/12 – 3/31/13 | Annualized Expense Ratio(1) |
| Actual |
| Investor Class | $1,000 | $996.30 | $2.34 | 0.47% |
| Institutional Class | $1,000 | $996.40 | $1.34 | 0.27% |
| A Class | $1,000 | $995.00 | $3.58 | 0.72% |
| C Class | $1,000 | $990.50 | $7.30 | 1.47% |
| R Class | $1,000 | $992.90 | $4.82 | 0.97% |
| Hypothetical | | | | |
| Investor Class | $1,000 | $1,022.59 | $2.37 | 0.47% |
| Institutional Class | $1,000 | $1,023.59 | $1.36 | 0.27% |
| A Class | $1,000 | $1,021.34 | $3.63 | 0.72% |
| C Class | $1,000 | $1,017.60 | $7.39 | 1.47% |
| R Class | $1,000 | $1,020.10 | $4.89 | 0.97% |
| (1) | Expenses are equal to the class’s annualized expense ratio listed in the table above, multiplied by the average account value over the period, multiplied by 182, the number of days in the most recent fiscal half-year, divided by 365, to reflect the one-half year period. |
MARCH 31, 2013
| | | Principal Amount | | | Value | |
| U.S. Treasury Securities — 48.2% | |
| U.S. Treasury Bonds, 10.625%, 8/15/15 | | | $6,250,000 | | | | $7,776,856 | |
| U.S. Treasury Bonds, 8.125%, 8/15/21 | | | 14,247,000 | | | | 21,752,277 | |
| U.S. Treasury Bonds, 7.125%, 2/15/23 | | | 10,700,000 | | | | 15,931,294 | |
| U.S. Treasury Bonds, 6.75%, 8/15/26 | | | 3,000,000 | | | | 4,561,407 | |
| U.S. Treasury Bonds, 6.625%, 2/15/27 | | | 4,500,000 | | | | 6,809,765 | |
| U.S. Treasury Bonds, 6.125%, 11/15/27 | | | 1,100,000 | | | | 1,606,859 | |
| U.S. Treasury Bonds, 5.50%, 8/15/28 | | | 7,500,000 | | | | 10,407,420 | |
| U.S. Treasury Bonds, 5.25%, 2/15/29 | | | 5,000,000 | | | | 6,789,065 | |
| U.S. Treasury Bonds, 5.375%, 2/15/31 | | | 4,200,000 | | | | 5,849,155 | |
| U.S. Treasury Bonds, 3.50%, 2/15/39 | | | 4,000,000 | | | | 4,358,124 | |
| U.S. Treasury Bonds, 4.25%, 5/15/39 | | | 7,000,000 | | | | 8,618,750 | |
| U.S. Treasury Bonds, 4.375%, 11/15/39 | | | 11,200,000 | | | | 14,061,253 | |
| U.S. Treasury Bonds, 4.625%, 2/15/40 | | | 10,500,000 | | | | 13,695,938 | |
| U.S. Treasury Bonds, 4.375%, 5/15/41 | | | 10,000,000 | | | | 12,570,310 | |
| U.S. Treasury Bonds, 3.125%, 11/15/41 | | | 15,000,000 | | | | 15,121,875 | |
| U.S. Treasury Bonds, 2.75%, 11/15/42 | | | 14,800,000 | | | | 13,750,132 | |
| U.S. Treasury Inflation Indexed Notes, 0.125%, 4/15/17 | | | 5,373,511 | | | | 5,800,033 | |
| U.S. Treasury Inflation Indexed Notes, 0.125%, 7/15/22 | | | 12,016,560 | | | | 13,115,883 | |
| U.S. Treasury Inflation Indexed Notes, 0.125%, 1/15/23 | | | 11,173,680 | | | | 12,079,798 | |
| U.S. Treasury Notes, 3.625%, 5/15/13 | | | 15,000,000 | | | | 15,066,210 | |
| U.S. Treasury Notes, 0.375%, 7/31/13 | | | 22,000,000 | | | | 22,023,210 | |
| U.S. Treasury Notes, 0.75%, 8/15/13 | | | 20,000,000 | | | | 20,050,000 | |
| U.S. Treasury Notes, 0.125%, 9/30/13 | | | 15,000,000 | | | | 15,002,340 | |
| U.S. Treasury Notes, 0.50%, 10/15/13 | | | 10,000,000 | | | | 10,022,660 | |
| U.S. Treasury Notes, 0.75%, 12/15/13 | | | 22,500,000 | | | | 22,598,438 | |
| U.S. Treasury Notes, 1.25%, 3/15/14 | | | 8,000,000 | | | | 8,083,440 | |
| U.S. Treasury Notes, 1.25%, 4/15/14 | | | 14,000,000 | | | | 14,157,500 | |
| U.S. Treasury Notes, 0.50%, 10/15/14 | | | 5,000,000 | | | | 5,021,875 | |
| U.S. Treasury Notes, 0.25%, 7/15/15 | | | 15,000,000 | | | | 14,991,795 | |
| U.S. Treasury Notes, 1.75%, 7/31/15 | | | 9,200,000 | | | | 9,514,097 | |
| U.S. Treasury Notes, 0.375%, 11/15/15 | | | 20,000,000 | | | | 20,034,380 | |
| U.S. Treasury Notes, 1.375%, 11/30/15 | | | 10,000,000 | | | | 10,278,910 | |
| U.S. Treasury Notes, 0.25%, 12/15/15 | | | 12,000,000 | | | | 11,976,564 | |
| U.S. Treasury Notes, 2.125%, 12/31/15 | | | 27,053,000 | | | | 28,380,301 | |
| U.S. Treasury Notes, 0.375%, 3/15/16 | | | 5,000,000 | | | | 5,004,300 | |
| U.S. Treasury Notes, 1.50%, 6/30/16 | | | 16,700,000 | | | | 17,289,727 | |
| U.S. Treasury Notes, 1.50%, 7/31/16 | | | 62,000,000 | | | | 64,213,586 | |
| U.S. Treasury Notes, 4.875%, 8/15/16 | | | 14,000,000 | | | | 16,083,592 | |
| U.S. Treasury Notes, 0.875%, 1/31/17 | | | 16,200,000 | | | | 16,418,959 | |
| U.S. Treasury Notes, 0.75%, 6/30/17 | | | 19,000,000 | | | | 19,115,786 | |
| U.S. Treasury Notes, 2.375%, 7/31/17 | | | 20,000,000 | | | | 21,501,560 | |
| U.S. Treasury Notes, 4.75%, 8/15/17 | | | 11,950,000 | | | | 14,084,198 | |
| U.S. Treasury Notes, 0.75%, 10/31/17 | | | 26,000,000 | | | | 26,087,360 | |
| U.S. Treasury Notes, 1.875%, 10/31/17 | | | 30,000,000 | | | | 31,626,570 | |
U.S. Treasury Notes, 0.75%, 12/31/17(1) | | | 11,000,000 | | | | 11,021,483 | |
| U.S. Treasury Notes, 0.875%, 1/31/18 | | | 21,500,000 | | | | 21,651,167 | |
| U.S. Treasury Notes, 0.75%, 2/28/18 | | | 3,500,000 | | | | 3,501,369 | |
| U.S. Treasury Notes, 2.625%, 4/30/18 | | | 2,000,000 | | | | 2,184,688 | |
| U.S. Treasury Notes, 1.50%, 8/31/18 | | | 7,000,000 | | | | 7,241,717 | |
| U.S. Treasury Notes, 1.375%, 9/30/18 | | | 18,000,000 | | | | 18,496,404 | |
| U.S. Treasury Notes, 1.375%, 11/30/18 | | | $34,000,000 | | | | $34,887,196 | |
| U.S. Treasury Notes, 1.00%, 11/30/19 | | | 2,600,000 | | | | 2,575,625 | |
| U.S. Treasury Notes, 2.625%, 8/15/20 | | | 4,000,000 | | | | 4,373,124 | |
| U.S. Treasury Notes, 3.625%, 2/15/21 | | | 8,000,000 | | | | 9,328,752 | |
| U.S. Treasury Notes, 2.125%, 8/15/21 | | | 9,000,000 | | | | 9,412,740 | |
| U.S. Treasury Notes, 2.00%, 2/15/22 | | | 14,000,000 | | | | 14,404,684 | |
| U.S. Treasury Notes, 1.625%, 11/15/22 | | | 7,000,000 | | | | 6,882,967 | |
| U.S. Treasury Notes, 2.00%, 2/15/23 | | | 13,500,000 | | | | 13,683,519 | |
TOTAL U.S. TREASURY SECURITIES (Cost $782,711,353) | | | | 812,928,987 | |
U.S. Government Agency Mortgage-Backed Securities(2) — 46.1% | |
| ADJUSTABLE-RATE U.S. GOVERNMENT AGENCY MORTGAGE-BACKED SECURITIES — 5.4% | |
| FHLMC, VRN, 2.08%, 4/15/13 | | | 4,926,477 | | | | 5,097,911 | |
| FHLMC, VRN, 2.58%, 4/15/13 | | | 2,526,958 | | | | 2,650,660 | |
| FHLMC, VRN, 2.68%, 4/15/13 | | | 6,515,876 | | | | 6,850,452 | |
| FHLMC, VRN, 2.91%, 4/15/13 | | | 11,127,154 | | | | 11,721,290 | |
| FHLMC, VRN, 3.57%, 4/15/13 | | | 3,753,097 | | | | 3,985,880 | |
| FHLMC, VRN, 3.76%, 4/15/13 | | | 4,429,508 | | | | 4,693,863 | |
| FHLMC, VRN, 4.02%, 4/15/13 | | | 1,479,698 | | | | 1,585,366 | |
| FHLMC, VRN, 4.03%, 4/15/13 | | | 1,172,607 | | | | 1,249,423 | |
| FHLMC, VRN, 5.21%, 4/15/13 | | | 3,612,537 | | | | 3,851,471 | |
| FHLMC, VRN, 5.57%, 4/15/13 | | | 4,099,306 | | | | 4,448,789 | |
| FNMA, VRN, 2.77%, 4/25/13 | | | 2,340,399 | | | | 2,456,406 | |
| FNMA, VRN, 2.83%, 4/25/13 | | | 963,950 | | | | 1,039,259 | |
| FNMA, VRN, 3.06%, 4/25/13 | | | 4,476,460 | | | | 4,713,861 | |
| FNMA, VRN, 3.35%, 4/25/13 | | | 5,036,905 | | | | 5,312,088 | |
| FNMA, VRN, 3.35%, 4/25/13 | | | 2,925,590 | | | | 3,106,867 | |
| FNMA, VRN, 3.60%, 4/25/13 | | | 2,801,315 | | | | 2,980,172 | |
| FNMA, VRN, 3.90%, 4/25/13 | | | 3,515,391 | | | | 3,757,406 | |
| FNMA, VRN, 5.43%, 4/25/13 | | | 1,941,055 | | | | 2,097,602 | |
| FNMA, VRN, 5.95%, 4/25/13 | | | 6,953,926 | | | | 7,609,459 | |
| GNMA, VRN, 1.625%, 4/20/13 | | | 2,191,695 | | | | 2,286,306 | |
| GNMA, VRN, 1.625%, 4/20/13 | | | 1,006,696 | | | | 1,055,438 | |
| GNMA, VRN, 1.625%, 4/20/13 | | | 1,122,568 | | | | 1,171,027 | |
| GNMA, VRN, 1.625%, 4/20/13 | | | 755,104 | | | | 791,664 | |
| GNMA, VRN, 1.625%, 4/20/13 | | | 743,551 | | | | 779,552 | |
| GNMA, VRN, 1.625%, 4/20/13 | | | 1,619,941 | | | | 1,698,375 | |
| GNMA, VRN, 1.75%, 4/20/13 | | | 2,117,187 | | | | 2,225,872 | |
| GNMA, VRN, 2.125%, 4/20/13 | | | 1,542,406 | | | | 1,612,009 | |
| | | | | | | | 90,828,468 | |
| FIXED-RATE U.S. GOVERNMENT AGENCY MORTGAGE-BACKED SECURITIES — 40.7% | |
| FHLMC, 4.50%, 1/1/19 | | | 1,032,087 | | | | 1,099,289 | |
| FHLMC, 5.00%, 5/1/23 | | | 5,824,407 | | | | 6,292,125 | |
| FHLMC, 5.50%, 10/1/34 | | | 1,108,790 | | | | 1,209,358 | |
| FHLMC, 5.50%, 4/1/38 | | | 13,717,673 | | | | 14,858,991 | |
| FHLMC, 4.00%, 12/1/40 | | | 2,995,178 | | | | 3,258,535 | |
| FHLMC, 4.00%, 4/1/41 | | | 12,767,086 | | | | 14,033,288 | |
| FHLMC, 6.50%, 7/1/47 | | | 53,175 | | | | 58,980 | |
FNMA, 4.00%, 4/11/13(3) | | | 30,000,000 | | | | 31,992,189 | |
FNMA, 4.50%, 4/11/13(3) | | | 10,000,000 | | | | 10,776,563 | |
FNMA, 5.00%, 4/11/13(3) | | | 27,000,000 | | | | 29,252,818 | |
FNMA, 5.50%, 4/11/13(3) | | | 15,000,000 | | | | 16,361,723 | |
FNMA, 3.00%, 5/13/13(3) | | | 20,000,000 | | | | 20,578,124 | |
FNMA, 3.50%, 5/13/13(3) | | | 30,000,000 | | | | 31,612,500 | |
| FNMA, 4.50%, 6/1/18 | | | 614,988 | | | | 663,391 | |
| FNMA, 4.50%, 5/1/19 | | | 3,258,182 | | | | 3,512,584 | |
| FNMA, 5.00%, 9/1/20 | | | 378,908 | | | | 409,202 | |
| FNMA, 4.50%, 11/1/20 | | | 291,020 | | | | 313,743 | |
| FNMA, 6.50%, 3/1/32 | | | 237,361 | | | | 275,509 | |
| FNMA, 7.00%, 6/1/32 | | | 253,874 | | | | 296,412 | |
| FNMA, 6.50%, 8/1/32 | | | 267,757 | | | | 307,502 | |
| FNMA, 5.50%, 7/1/33 | | | 2,309,616 | | | | 2,547,840 | |
| FNMA, 5.00%, 11/1/33 | | | 12,323,979 | | | | 13,382,926 | |
| FNMA, 6.00%, 12/1/33 | | | 8,266,069 | | | | 9,304,150 | |
| FNMA, 5.50%, 8/1/34 | | | 9,948,931 | | | | 10,977,609 | |
| FNMA, 5.50%, 9/1/34 | | | 788,494 | | | | 870,021 | |
| FNMA, 5.50%, 10/1/34 | | | 5,265,789 | | | | 5,848,098 | |
| FNMA, 5.00%, 8/1/35 | | | 1,747,548 | | | | 1,897,929 | |
| FNMA, 5.50%, 1/1/36 | | | 10,766,974 | | | | 11,791,928 | |
| FNMA, 5.00%, 2/1/36 | | | 1,080,944 | | | | 1,173,901 | |
| FNMA, 5.50%, 4/1/36 | | | 2,968,045 | | | | 3,256,378 | |
| FNMA, 5.00%, 5/1/36 | | | 5,149,626 | | | | 5,592,762 | |
| FNMA, 5.50%, 12/1/36 | | | $2,087,647 | | | | $2,280,015 | |
| FNMA, 5.50%, 2/1/37 | | | 7,458,852 | | | | 8,146,154 | |
| FNMA, 6.50%, 8/1/37 | | | 557,706 | | | | 617,201 | |
| FNMA, 6.00%, 9/1/37 | | | 3,141,992 | | | | 3,446,242 | |
| FNMA, 6.00%, 11/1/37 | | | 17,272,864 | | | | 19,344,888 | |
| FNMA, 6.00%, 9/1/38 | | | 701,097 | | | | 761,209 | |
| FNMA, 6.00%, 11/1/38 | | | 473,547 | | | | 514,149 | |
| FNMA, 4.50%, 2/1/39 | | | 3,713,946 | | | | 4,003,208 | |
| FNMA, 4.50%, 4/1/39 | | | 2,009,133 | | | | 2,245,980 | |
| FNMA, 4.50%, 5/1/39 | | | 5,155,069 | | | | 5,616,269 | |
| FNMA, 6.50%, 5/1/39 | | | 10,039,385 | | | | 11,234,191 | |
| FNMA, 4.50%, 10/1/39 | | | 7,600,508 | | | | 8,496,498 | |
| FNMA, 4.50%, 3/1/40 | | | 12,462,034 | | | | 13,787,034 | |
| FNMA, 4.00%, 10/1/40 | | | 6,937,533 | | | | 7,565,380 | |
| FNMA, 4.50%, 11/1/40 | | | 6,718,360 | | | | 7,432,677 | |
| FNMA, 4.00%, 12/1/40 | | | 7,797,263 | | | | 8,451,746 | |
| FNMA, 4.50%, 4/1/41 | | | 37,956,459 | | | | 41,683,707 | |
| FNMA, 4.00%, 5/1/41 | | | 6,418,832 | | | | 6,848,292 | |
| FNMA, 4.50%, 6/1/41 | | | 9,728,382 | | | | 10,762,733 | |
| FNMA, 4.50%, 7/1/41 | | | 923,285 | | | | 1,013,949 | |
| FNMA, 4.00%, 8/1/41 | | | 6,226,086 | | | | 6,766,199 | |
| FNMA, 4.50%, 9/1/41 | | | 4,574,733 | | | | 5,011,096 | |
| FNMA, 3.50%, 10/1/41 | | | 7,838,942 | | | | 8,285,271 | |
| FNMA, 4.00%, 12/1/41 | | | 17,500,241 | | | | 19,089,482 | |
| FNMA, 4.00%, 1/1/42 | | | 5,531,109 | | | | 5,962,536 | |
| FNMA, 4.00%, 1/1/42 | | | 11,624,523 | | | | 12,405,909 | |
| FNMA, 3.50%, 5/1/42 | | | 4,748,155 | | | | 5,036,308 | |
| FNMA, 3.50%, 6/1/42 | | | 3,872,568 | | | | 4,118,476 | |
| FNMA, 3.50%, 9/1/42 | | | 4,834,174 | | | | 5,127,548 | |
| FNMA, 6.50%, 6/1/47 | | | 76,940 | | | | 84,691 | |
| FNMA, 6.50%, 8/1/47 | | | 194,764 | | | | 214,385 | |
| FNMA, 6.50%, 8/1/47 | | | 102,074 | | | | 112,357 | |
| FNMA, 6.50%, 9/1/47 | | | 472,942 | | | | 520,586 | |
| FNMA, 6.50%, 9/1/47 | | | 159,078 | | | | 175,103 | |
| FNMA, 6.50%, 9/1/47 | | | 156,159 | | | | 171,890 | |
| FNMA, 6.50%, 9/1/47 | | | 77,327 | | | | 85,116 | |
| FNMA, 6.50%, 9/1/47 | | | 16,794 | | | | 18,485 | |
| FNMA, 6.00%, 4/1/48 | | | 2,017,106 | | | | 2,188,791 | |
GNMA, 4.00%, 4/18/13(3) | | | 49,000,000 | | | | 53,419,570 | |
| GNMA, 5.50%, 12/20/38 | | | 7,151,167 | | | | 7,830,751 | |
| GNMA, 6.00%, 1/20/39 | | | 1,685,787 | | | | 1,898,565 | |
| GNMA, 5.00%, 3/20/39 | | | 8,638,472 | | | | 9,424,303 | |
| GNMA, 5.50%, 3/20/39 | | | 2,951,807 | | | | 3,232,320 | |
| GNMA, 5.50%, 4/20/39 | | | 5,105,025 | | | | 5,602,925 | |
| GNMA, 5.00%, 12/15/39 | | | 9,759,172 | | | | 10,811,638 | |
| GNMA, 4.50%, 1/15/40 | | | 5,143,379 | | | | 5,645,019 | |
| GNMA, 4.00%, 11/20/40 | | | 16,584,148 | | | | 18,078,924 | |
| GNMA, 4.00%, 12/15/40 | | | 3,530,654 | | | | 3,872,273 | |
| GNMA, 4.50%, 7/20/41 | | | 17,043,958 | | | | 18,784,124 | |
| GNMA, 3.50%, 6/20/42 | | | 18,679,397 | | | | 20,002,717 | |
| GNMA, 3.50%, 7/20/42 | | | 14,122,137 | | | | 15,122,603 | |
| GNMA, 4.50%, 8/20/42 | | | 17,415,160 | | | | 19,073,409 | |
| | | | | | | | 686,231,260 | |
TOTAL U.S. GOVERNMENT AGENCY MORTGAGE-BACKED SECURITIES (Cost $754,714,438) | | | | 777,059,728 | |
Collateralized Mortgage Obligations(2) — 7.9% | |
| FHLMC, Series 2684, Class FP, VRN, 0.70%, 4/15/13 | | | 5,860,493 | | | | 5,877,447 | |
| FHLMC, Series 2685, Class ND SEQ, 4.00%, 10/15/18 | | | 3,886,070 | | | | 4,108,715 | |
| FHLMC, Series 2706, Class BL SEQ, 3.50%, 11/15/18 | | | 3,857,721 | | | | 4,039,213 | |
| FHLMC, Series 2779, Class FM SEQ, VRN, 0.55%, 4/15/13 | | | 224,967 | | | | 225,426 | |
| FHLMC, Series 2784, Class HJ SEQ, 4.00%, 4/15/19 | | | 7,010,109 | | | | 7,464,686 | |
| FHLMC, Series 2824, Class LB SEQ, 4.50%, 7/15/24 | | | 3,458,825 | | | | 3,792,072 | |
| FHLMC, Series 3076, Class BM SEQ, 4.50%, 11/15/25 | | | 7,931,974 | | | | 8,679,297 | |
| FHLMC, Series 3397, Class GF, VRN, 0.70%, 4/15/13 | | | 3,497,861 | | | | 3,536,250 | |
| FHLMC, Series 3778, Class L SEQ, 3.50%, 12/15/25 | | | 11,104,439 | | | | 12,169,449 | |
| FNMA, Series 2002-5, Class PJ, 6.00%, 10/25/21 | | | 167,739 | | | | 169,631 | |
| FNMA, Series 2003-123, Class AY SEQ, 4.00%, 12/25/18 | | | 4,686,877 | | | | 4,990,013 | |
| FNMA, Series 2003-125, Class AY SEQ, 4.00%, 12/25/18 | | | 7,033,357 | | | | 7,484,666 | |
| FNMA, Series 2003-42, Class FK, VRN, 0.60%, 4/25/13 | | | 361,925 | | | | 362,670 | |
| FNMA, Series 2003-43, Class LF, VRN, 0.55%, 4/25/13 | | | 663,782 | | | | 665,101 | |
| FNMA, Series 2004-17, Class CJ SEQ, 4.00%, 4/25/19 | | | 7,419,179 | | | | 8,076,682 | |
| FNMA, Series 2004-32, Class AY SEQ, 4.00%, 5/25/19 | | | 4,747,434 | | | | 5,011,662 | |
| FNMA, Series 2005-121, Class V SEQ, 4.50%, 6/25/29 | | | 11,098,322 | | | | 11,421,927 | |
| FNMA, Series 2007-36, Class FB, VRN, 0.60%, 4/25/13 | | | 826,063 | | | | 834,799 | |
| FNMA, Series 2010-39, Class VN SEQ, 5.00%, 10/25/39 | | | 2,590,912 | | | | 2,601,623 | |
| | | | Principal Amount | | | | Value | |
| FNMA, Series 2010-83, Class CM SEQ, 4.50%, 3/25/25 | | | $10,335,122 | | | | $10,820,588 | |
| FNMA, Series 2011-3, Class EL, 3.00%, 5/25/20 | | | 2,746,142 | | | | 2,851,848 | |
| GNMA, Series 2004-30, Class PD, 5.00%, 2/20/33 | | | 8,270,181 | | | | 8,639,176 | |
| GNMA, Series 2007-5, Class FA, VRN, 0.34%, 4/20/13 | | | 2,777,040 | | | | 2,790,367 | |
| GNMA, Series 2008-18, Class FH, VRN, 0.80%, 4/20/13 | | | 4,988,517 | | | | 5,064,714 | |
| GNMA, Series 2010-14, Class QF, VRN, 0.65%, 4/16/13 | | | 10,439,728 | | | | 10,597,091 | |
TOTAL COLLATERALIZED MORTGAGE OBLIGATIONS (Cost $128,904,466) | | | | 132,275,113 | |
| U.S. Government Agency Securities — 3.4% | |
| FHLB, 0.14%, 6/17/13 | | | 20,000,000 | | | | 20,001,080 | |
| FHLB, Series 1, 1.00%, 6/21/17 | | | 4,000,000 | | | | 4,044,340 | |
| FHLMC, 5.00%, 2/16/17 | | | 5,000,000 | | | | 5,834,460 | |
| FHLMC, 1.00%, 6/29/17 | | | 4,000,000 | | | | 4,052,492 | |
| FHLMC, Series 1, 0.75%, 1/12/18 | | | 3,750,000 | | | | 3,733,219 | |
| FHLMC, 0.875%, 3/7/18 | | | 5,250,000 | | | | 5,248,467 | |
| FHLMC, 1.25%, 10/2/19 | | | 4,000,000 | | | | 3,981,696 | |
| FHLMC, 2.375%, 1/13/22 | | | 7,300,000 | | | | 7,618,339 | |
| FNMA, 0.875%, 2/8/18 | | | 1,600,000 | | | | 1,597,950 | |
| FNMA, 6.625%, 11/15/30 | | | 1,000,000 | | | | 1,495,249 | |
TOTAL U.S. GOVERNMENT AGENCY SECURITIES (Cost $56,952,216) | | | | 57,607,292 | |
| | | Shares/ Principal Amount | | | Value | |
| Temporary Cash Investments — 7.3% | |
Repurchase Agreement, Bank of America Merrill Lynch, (collateralized by various U.S. Treasury obligations, 0.25%, 2/28/14, valued at $6,186,855), in a joint trading account at 0.11%, dated 3/28/13, due 4/1/13 (Delivery \value $6,064,401) | | | | $6,064,327 | |
Repurchase Agreement, Credit Suisse First Boston, Inc., (collateralized by various U.S. Treasury obligations, 4.375%, 5/15/41, valued at $18,570,607), in a joint trading account at 0.13%, dated 3/28/13, due 4/1/13 (Delivery value $18,193,245) | | | | 18,192,982 | |
Repurchase Agreement, Goldman Sachs & Co., (collateralized by various U.S. Treasury obligations, 4.25%, 11/15/40, valued at $6,187,925), in a joint trading account at 0.10%, dated 3/28/13, due 4/1/13 (Delivery value $6,064,394) | | | | 6,064,327 | |
| SSgA U.S. Government Money Market Fund | | | 39,120,376 | | | | 39,120,376 | |
U.S. Treasury Bills, 0.08%, 4/18/13(4) | | | $23,448,400 | | | | 23,448,001 | |
U.S. Treasury Bills, 0.07%, 5/30/13(4) | | | 15,000,000 | | | | 14,998,470 | |
U.S. Treasury Bills, 0.09%, 6/27/13(4) | | | 15,000,000 | | | | 14,997,375 | |
TOTAL TEMPORARY CASH INVESTMENTS (Cost $122,884,860) | | | | 122,885,858 | |
TOTAL INVESTMENT SECURITIES — 112.9% (Cost $1,846,167,333) | | | | 1,902,756,978 | |
OTHER ASSETS AND LIABILITIES(5) — (12.9)% | | | | (217,397,135 | ) |
| TOTAL NET ASSETS — 100.0% | | | | $1,685,359,843 | |
| Futures Contracts |
| Contracts Purchased | Expiration Date | Underlying Face Amount at Value | Unrealized Gain (Loss) |
| 212 | U.S. Treasury 30-Year Bonds | June 2013 | $30,627,375 | $122,107 |
Notes to Schedule of Investments
FHLB = Federal Home Loan Bank
FHLMC = Federal Home Loan Mortgage Corporation
FNMA = Federal National Mortgage Association
GNMA = Government National Mortgage Association
SEQ = Sequential Payer
VRN = Variable Rate Note. Interest reset date is indicated. Rate shown is effective at the period end.
| (1) | Security, or a portion thereof, has been pledged at the custodian bank or with a broker for margin requirements on futures contracts. At the period end, the aggregate value of securities pledged was $631,230. |
| (2) | Final maturity date indicated, unless otherwise noted. |
| (3) | Forward commitment. Settlement date is indicated. |
| (4) | The rate indicated is the yield to maturity at purchase. |
| (5) | Amount relates primarily to payable for investments purchased, but not settled, at period end. |
See Notes to Financial Statements.
Statement of Assets and Liabilities |
| MARCH 31, 2013 | |
| Assets | |
| Investment securities, at value (cost of $1,846,167,333) | | | $1,902,756,978 | |
| Cash | | | 112,500 | |
| Receivable for investments sold | | | 55,299,754 | |
| Receivable for capital shares sold | | | 1,984,257 | |
| Interest receivable | | | 6,244,088 | |
| | | | 1,966,397,577 | |
| | | | | |
| Liabilities | | | | |
| Payable for investments purchased | | | 276,027,465 | |
| Payable for capital shares redeemed | | | 4,025,914 | |
| Payable for variation margin on futures contracts | | | 19,875 | |
| Accrued management fees | | | 598,158 | |
| Distribution and service fees payable | | | 49,144 | |
| Dividends payable | | | 317,178 | |
| | | | 281,037,734 | |
| | | | | |
| Net Assets | | | $1,685,359,843 | |
| | | | | |
| Net Assets Consist of: | | | | |
| Capital paid in | | | $1,629,141,620 | |
| Undistributed net investment income | | | 17,311 | |
| Accumulated net realized loss | | | (510,840 | ) |
| Net unrealized appreciation | | | 56,711,752 | |
| | | | $1,685,359,843 | |
| | Net assets | Shares outstanding | Net asset value per share |
| Investor Class | $1,074,463,947 | 94,354,608 | $11.39 |
| Institutional Class | $397,187,699 | 34,889,342 | $11.38 |
| A Class | $206,394,429 | 18,124,883 | $11.39* |
| C Class | $4,165,517 | 365,989 | $11.38 |
| R Class | $3,148,251 | 276,612 | $11.38 |
*Maximum offering price $11.93 (net asset value divided by 0.955).
See Notes to Financial Statements.
| YEAR ENDED MARCH 31, 2013 | |
| Investment Income (Loss) | |
| Income: | | | |
| Interest | | | $34,714,471 | |
| | | | | |
| Expenses: | | | | |
| Management fees | | | 7,205,681 | |
| Distribution and service fees: | | | | |
| A Class | | | 560,547 | |
| C Class | | | 36,611 | |
| R Class | | | 8,056 | |
| Trustees’ fees and expenses | | | 91,754 | |
| Other expenses | | | 626 | |
| | | | 7,903,275 | |
| | | | | |
| Net investment income (loss) | | | 26,811,196 | |
| | | | | |
| Realized and Unrealized Gain (Loss) | | | | |
| Net realized gain (loss) on: | | | | |
| Investment transactions | | | 16,603,539 | |
| Futures contract transactions | | | 104,121 | |
| | | | 16,707,660 | |
| | | | | |
| Change in net unrealized appreciation (depreciation) on: | | | | |
| Investments | | | (7,505,640 | ) |
| Futures contracts | | | 122,107 | |
| | | | (7,383,533 | ) |
| | | | | |
| Net realized and unrealized gain (loss) | | | 9,324,127 | |
| | | | | |
| Net Increase (Decrease) in Net Assets Resulting from Operations | | | $36,135,323 | |
See Notes to Financial Statements.
Statement of Changes in Net Assets |
| YEARS ENDED MARCH 31, 2013 AND MARCH 31, 2012 | |
| Increase (Decrease) in Net Assets | March 31, 2013 | | | March 31, 2012 | |
| Operations | |
| Net investment income (loss) | | $26,811,196 | | | | $32,513,524 | |
| Net realized gain (loss) | | 16,707,660 | | | | 20,277,344 | |
| Change in net unrealized appreciation (depreciation) | | (7,383,533 | ) | | | 32,591,387 | |
| Net increase (decrease) in net assets resulting from operations | | 36,135,323 | | | | 85,382,255 | |
| | | | | | | | |
| Distributions to Shareholders | | | | | | | |
| From net investment income: | | | | | | | |
| Investor Class | | (23,294,816 | ) | | | (28,401,563 | ) |
| Institutional Class | | (6,887,306 | ) | | | (920,740 | ) |
| A Class | | (4,028,675 | ) | | | (5,163,291 | ) |
| C Class | | (37,516 | ) | | | (29,563 | ) |
| R Class | | (23,776 | ) | | | (7,903 | ) |
| From net realized gains: | | | | | | | |
| Investor Class | | (7,347,367 | ) | | | (11,553,240 | ) |
| Institutional Class | | (2,603,538 | ) | | | (228,299 | ) |
| A Class | | (1,449,830 | ) | | | (2,349,727 | ) |
| C Class | | (28,257 | ) | | | (21,766 | ) |
| R Class | | (11,856 | ) | | | (4,628 | ) |
| Decrease in net assets from distributions | | (45,712,937 | ) | | | (48,680,720 | ) |
| | | | | | | | |
| Capital Share Transactions | | | | | | | |
| Net increase (decrease) in net assets from capital share transactions | | 270,034,135 | | | | 162,592,422 | |
| | | | | | | | |
| Net increase (decrease) in net assets | | 260,456,521 | | | | 199,293,957 | |
| | | | | | | | |
| Net Assets | | | | | | | |
| Beginning of period | | 1,424,903,322 | | | | 1,225,609,365 | |
| End of period | | $1,685,359,843 | | | | $1,424,903,322 | |
| | | | | | | | |
| Undistributed (disbursements in excess of) net investment income | | $17,311 | | | | $(307,316 | ) |
See Notes to Financial Statements.
Notes to Financial Statements |
MARCH 31, 2013
1. Organization
American Century Government Income Trust (the trust) is registered under the Investment Company Act of 1940, as amended (the 1940 Act), as an open-end management investment company and is organized as a Massachusetts business trust. Government Bond Fund (the fund) is one fund in a series issued by the trust. The fund is diversified as defined under the 1940 Act. The fund’s investment objective is to seek high current income.
The fund offers the Investor Class, the Institutional Class, the A Class, the C Class and the R Class. The A Class may incur an initial sales charge. The A Class and C Class may be subject to a contingent deferred sales charge. The share classes differ principally in their respective sales charges and distribution and shareholder servicing expenses and arrangements. The Institutional Class is made available to institutional shareholders or through financial intermediaries whose clients do not require the same level of shareholder and administrative services as shareholders of other classes. As a result, the Institutional Class is charged a lower unified management fee.
2. Significant Accounting Policies
The following is a summary of significant accounting policies consistently followed by the fund in preparation of its financial statements. The financial statements are prepared in conformity with accounting principles generally accepted in the United States of America, which may require management to make certain estimates and assumptions at the date of the financial statements. Actual results could differ from these estimates.
Investment Valuations — The fund determines the fair value of its investments and computes its net asset value per share as of the close of regular trading (usually 4 p.m. Eastern time) on the New York Stock Exchange (NYSE) on each day the NYSE is open.
Debt securities maturing in greater than 60 days at the time of purchase are valued at the evaluated mean as provided by independent pricing services or at the mean of the most recent bid and asked prices as provided by investment dealers. Debt securities maturing within 60 days at the time of purchase may be valued at cost, plus or minus any amortized discount or premium or at the evaluated mean as provided by an independent pricing service. Evaluated mean prices are commonly derived through utilization of market models, which may consider, among other factors, trade data, quotations from dealers and active market makers, relevant yield curve and spread data, related sector levels, creditworthiness, and other relevant market information on the same or comparable securities.
Investments in open-end management investment companies are valued at the reported net asset value per share. Repurchase agreements are valued at cost. Exchange-traded futures contracts are valued at the settlement price as provided by the appropriate clearing corporation.
If the fund determines that the market price for a portfolio security is not readily available or the valuation methods mentioned above do not reflect a security’s fair value, such security is valued as determined in good faith by the Board of Trustees or its designee, in accordance with procedures adopted by the Board of Trustees. Circumstances that may cause the fund to use these procedures to value a security include, but are not limited to: a security has been declared in default; trading in a security has been halted during the trading day; there is a foreign market holiday and no trading occurred; or an event occurred between the close of a foreign exchange and the NYSE that may affect the value of a security.
Security Transactions — Security transactions are accounted for as of the trade date. Net realized gains and losses are determined on the identified cost basis, which is also used for federal income tax purposes.
Investment Income — Interest income is recorded on the accrual basis and includes paydown gain (loss) and accretion of discounts and amortization of premiums. Inflation adjustments related to inflation-linked debt securities are reflected as interest income.
Forward Commitments — The fund may engage in securities transactions on a forward commitment basis. In these transactions, the securities’ prices and yields are fixed on the date of the commitment. The fund may sell a to-be-announced (TBA) security and at the same time make a commitment to purchase the same security at a future date at a specified price. Conversely, the fund may purchase a TBA security and at the same time make a commitment to sell the same security at a future date at a specified price. These types of transactions are known as “TBA roll” transactions and are accounted for as purchases and sales. The fund will segregate cash, cash equivalents or other appropriate liquid securities on its records in amounts sufficient to meet the purchase price.
Repurchase Agreements — The fund may enter into repurchase agreements with institutions that American Century Investment Management, Inc. (ACIM) (the investment advisor) has determined are creditworthy pursuant to criteria adopted by the Board of Trustees. The fund requires that the collateral, represented by securities, received in a repurchase transaction be transferred to the custodian in a manner sufficient to enable the fund to obtain those securities in the event of a default under the repurchase agreement. ACIM monitors, on a daily basis, the securities transferred to ensure the value, including accrued interest, of the securities under each repurchase agreement is equal to or greater than amounts owed to the fund under each repurchase agreement.
Joint Trading Account — Pursuant to an Exemptive Order issued by the Securities and Exchange Commission, the fund, along with certain other funds in the American Century Investments family of funds, may transfer uninvested cash balances into a joint trading account. These balances are invested in one or more repurchase agreements that are collateralized by U.S. Treasury or Agency obligations.
Segregated Assets — In accordance with the 1940 Act, the fund segregates assets on its books and records to cover certain types of investments, including, but not limited to, futures contracts, forward commitments, when-issued securities, swap agreements and certain forward foreign currency exchange contracts. ACIM monitors, on a daily basis, the securities segregated to ensure the fund designates a sufficient amount of liquid assets, marked-to-market daily. The fund may also receive assets or be required to pledge assets at the custodian bank or with a broker for margin requirements on futures contracts and swap agreements.
Income Tax Status — It is the fund’s policy to distribute substantially all net investment income and net realized gains to shareholders and to otherwise qualify as a regulated investment company under provisions of the Internal Revenue Code. Accordingly, no provision has been made for income taxes. The fund files U.S. federal, state, local and non-U.S. tax returns as applicable. The fund’s tax returns are subject to examination by the relevant taxing authority until expiration of the applicable statute of limitations, which is generally three years from the date of filing but can be longer in certain jurisdictions. At this time, management believes there are no uncertain tax positions which, based on their technical merit, would not be sustained upon examination and for which it is reasonably possible that the total amounts of unrecognized tax benefits will significantly change in the next twelve months.
Multiple Class — All shares of the fund represent an equal pro rata interest in the net assets of the class to which such shares belong, and have identical voting, dividend, liquidation and other rights and the same terms and conditions, except for class specific expenses and exclusive rights to vote on matters affecting only individual classes. Income, non-class specific expenses, and realized and unrealized capital gains and losses of the fund are allocated to each class of shares based on their relative net assets.
Distributions to Shareholders — Distributions from net investment income are declared daily and paid monthly. Distributions from net realized gains, if any, are generally declared and paid annually.
Indemnifications — Under the trust’s organizational documents, its officers and trustees are indemnified against certain liabilities arising out of the performance of their duties to the fund. In addition, in the normal course of business, the fund enters into contracts that provide general indemnifications. The maximum exposure under these arrangements is unknown as this would involve future claims that may be made against a fund. The risk of material loss from such claims is considered by management to be remote.
3. Fees and Transactions with Related Parties
Management Fees — The trust has entered into a management agreement with ACIM, under which ACIM provides the fund with investment advisory and management services in exchange for a single, unified management fee (the fee) per class. The agreement provides that all expenses of managing and operating the fund, except distribution and service fees, brokerage expenses, taxes, interest, fees and expenses of the independent trustees (including legal counsel fees), and extraordinary expenses, will be paid by ACIM. The fee is computed and accrued daily based on each class’s daily net assets and paid monthly in arrears. The fee consists of (1) an Investment Category Fee based on the daily net assets of the fund and certain other accounts managed by the investment advisor that are in the same broad investment category as the fund and (2) a Complex Fee based on the assets of all the funds in the American Century Investments family of funds. The rates for the Investment Category Fee range from 0.1625% to 0.2800%. The rates for the Complex Fee range from 0.2500% to 0.3100% for the Investor Class, A Class, C Class and R Class. The Institutional Class is 0.2000% less at each point within the Complex Fee range. The effective annual management fee for each class for the year ended March 31, 2013 was 0.47% for the Investor Class, A Class, C Class and R Class and 0.27% for the Institutional Class.
Distribution and Service Fees — The Board of Trustees has adopted a separate Master Distribution and Individual Shareholder Services Plan for each of the A Class, C Class and R Class (collectively the plans), pursuant to Rule 12b-1 of the 1940 Act. The plans provide that the A Class will pay American Century Investment Services, Inc. (ACIS) an annual distribution and service fee of 0.25%. The plans provide that the C Class will pay ACIS an annual distribution and service fee of 1.00%, of which 0.25% is paid for individual shareholder services and 0.75% is paid for distribution services. The plans provide that the R Class will pay ACIS an annual distribution and service fee of 0.50%. The fees are computed and accrued daily based on each class’s daily net assets and paid monthly in arrears. The fees are used to pay financial intermediaries for distribution and individual shareholder services. Fees incurred under the plans during the year ended March 31, 2013 are detailed in the Statement of Operations.
Related Parties — Certain officers and trustees of the trust are also officers and/or directors of American Century Companies, Inc. (ACC). The trust’s investment advisor, ACIM, the trust’s distributor, ACIS, and the trust’s transfer agent, American Century Services, LLC are wholly owned, directly or indirectly, by ACC.
4. Investment Transactions
Purchases and sales of investment securities, excluding short-term investments, for the year ended March 31, 2013 were $3,510,342,064 and $3,248,085,710, respectively, all of which are U.S. Treasury and Government Agency obligations.
5. Capital Share Transactions
Transactions in shares of the fund were as follows (unlimited number of shares authorized):
| | Year ended March 31, 2013 | | | Year ended March 31, 2012 | |
| | Shares | | | Amount | | | Shares | | | Amount | |
| Investor Class | | | | | | | | | | | |
| Sold | | 28,134,601 | | | | $324,308,157 | | | | 34,575,711 | | | | $397,218,677 | |
| Issued in reinvestment of distributions | | 2,430,798 | | | | 28,031,432 | | | | 3,156,164 | | | | 36,167,783 | |
| Redeemed | | (35,953,980 | ) | | | (413,972,394 | ) | | | (27,906,298 | ) | | | (319,164,999 | ) |
| | | (5,388,581 | ) | | | (61,632,805 | ) | | | 9,825,577 | | | | 114,221,461 | |
| Institutional Class | | | | | | | | | | | | | | | |
| Sold | | 43,331,857 | | | | 499,262,100 | | | | 4,456,949 | | | | 51,200,138 | |
| Issued in reinvestment of distributions | | 808,019 | | | | 9,303,678 | | | | 100,684 | | | | 1,149,039 | |
| Redeemed | | (14,344,576 | ) | | | (164,294,480 | ) | | | (1,946,247 | ) | | | (22,496,140 | ) |
| | | 29,795,300 | | | | 344,271,298 | | | | 2,611,386 | | | | 29,853,037 | |
| A Class | | | | | | | | | | | | | | | |
| Sold | | 8,700,074 | | | | 100,214,412 | | | | 9,919,753 | | | | 113,811,126 | |
| Issued in reinvestment of distributions | | 242,671 | | | | 2,798,325 | | | | 359,397 | | | | 4,118,476 | |
| Redeemed | | (10,404,539 | ) | | | (119,799,644 | ) | | | (8,844,101 | ) | | | (101,297,351 | ) |
| | | (1,461,794 | ) | | | (16,786,907 | ) | | | 1,435,049 | | | | 16,632,251 | |
| C Class | | | | | | | | | | | | | | | |
| Sold | | 250,666 | | | | 2,890,828 | | | | 171,305 | | | | 1,967,427 | |
| Issued in reinvestment of distributions | | 4,161 | | | | 47,890 | | | | 3,478 | | | | 39,867 | |
| Redeemed | | (115,104 | ) | | | (1,317,117 | ) | | | (51,000 | ) | | | (588,272 | ) |
| | | 139,723 | | | | 1,621,601 | | | | 123,783 | | | | 1,419,022 | |
| R Class | | | | | | | | | | | | | | | |
| Sold | | 261,698 | | | | 3,008,887 | | | | 53,466 | | | | 611,487 | |
| Issued in reinvestment of distributions | | 2,834 | | | | 32,557 | | | | 1,079 | | | | 12,396 | |
| Redeemed | | (41,990 | ) | | | (480,496 | ) | | | (13,643 | ) | | | (157,232 | ) |
| | | 222,542 | | | | 2,560,948 | | | | 40,902 | | | | 466,651 | |
| Net increase (decrease) | | 23,307,190 | | | | $270,034,135 | | | | 14,036,697 | �� | | | $162,592,422 | |
6. Fair Value Measurements
The fund’s securities valuation process is based on several considerations and may use multiple inputs to determine the fair value of the positions held by the fund. In conformity with accounting principles generally accepted in the United States of America, the inputs used to determine a valuation are classified into three broad levels as follows:
| • | Level 1 valuation inputs consist of unadjusted quoted prices in an active market for identical securities; |
| • | Level 2 valuation inputs consist of direct or indirect observable market data (including quoted prices for similar securities, evaluations of subsequent market events, interest rates, prepayment speeds, credit risk, etc.); or |
| • | Level 3 valuation inputs consist of unobservable data (including a fund’s own assumptions). |
The level classification is based on the lowest level input that is significant to the fair valuation measurement. The valuation inputs are not necessarily an indication of the risks associated with investing in these securities or other financial instruments.
The following is a summary of the level classifications as of period end. The Schedule of Investments provides additional information on the fund’s portfolio holdings.
| | Level 1 | | | Level 2 | | | Level 3 | |
| Investment Securities | | | | | | | | |
| U.S. Treasury Securities | | — | | | | $812,928,987 | | | | — | |
| U.S. Government Agency Mortgage-Backed Securities | | — | | | | 777,059,728 | | | | — | |
| Collateralized Mortgage Obligations | | — | | | | 132,275,113 | | | | — | |
| U.S. Government Agency Securities | | — | | | | 57,607,292 | | | | — | |
| Temporary Cash Investments | | $39,120,376 | | | | 83,765,482 | | | | — | |
| Total Value of Investment Securities | | $39,120,376 | | | | $1,863,636,602 | | | | — | |
| | | | | | | | | | | | |
| Other Financial Instruments | | | | | | | | | | | |
| Total Unrealized Gain (Loss) on Futures Contracts | | $122,107 | | | | — | | | | — | |
7. Derivative Instruments
Interest Rate Risk — The fund is subject to interest rate risk in the normal course of pursuing its investment objectives. The value of bonds generally declines as interest rates rise. A fund may enter into futures contracts based on a bond index or a specific underlying security. A fund may purchase futures contracts to gain exposure to increases in market value or sell futures contracts to protect against a decline in market value. Upon entering into a futures contract, a fund will segregate cash, cash equivalents or other appropriate liquid securities on its records in amounts sufficient to meet requirements. Subsequent payments (variation margin) are made or received daily, in cash, by a fund. The variation margin is equal to the daily change in the contract value and is recorded as unrealized gains and losses. A fund recognizes a realized gain or loss when the futures contract is closed or expires. Net realized and unrealized gains or losses occurring during the holding period of futures contracts are a component of net realized gain (loss) on futures contract transactions and change in net unrealized appreciation (depreciation) on futures contracts, respectively. One of the risks of entering into futures contracts is the possibility that the change in value of the contract may not correlate with the changes in value of the underlying securities. The fund purchased interest rate risk derivative instruments during the last three months of the period. The interest rate risk derivative instruments held at period end as disclosed on the Schedule of Investments are indicative of the fund’s typical volume during that time.
The value of interest rate risk derivative instruments as of March 31, 2013, is disclosed on the Statement of Assets and Liabilities as a liability of $19,875 in payable for variation margin on futures contracts.* For the year ended March 31, 2013, the effect of interest rate risk derivative instruments on the Statement of Operations was $104,121 in net realized gain (loss) on futures contract transactions and $122,107 in change in net unrealized appreciation (depreciation) on futures contracts.
*Included in the unrealized gain (loss) on futures contracts as reported in the Schedule of Investments.
8. Risk Factors
The fund’s investment process may result in high portfolio turnover, which could mean high transaction costs, affecting both performance and capital gains tax liabilities to investors.
9. Federal Tax Information
The tax character of distributions paid during the years ended March 31, 2013 and
March 31, 2012 were as follows:
| | | 2013 | | | 2012 | |
| Distributions Paid From | |
| Ordinary income | | | $42,083,110 | | | | $41,804,142 | |
| Long-term capital gains | | | $3,629,827 | | | | $6,876,578 | |
The book-basis character of distributions made during the year from net investment income or net realized gains may differ from their ultimate characterization for federal income tax purposes. These differences reflect the differing character of certain income items and net realized gains and losses for financial statement and tax purposes, and may result in reclassification among certain capital accounts on the financial statements.
As of March 31, 2013, the federal tax cost of investments and the components of distributable earnings on a tax-basis were as follows:
| Federal tax cost of investments | | | $1,846,425,680 | |
| Gross tax appreciation of investments | | | $58,655,812 | |
| Gross tax depreciation of investments | | | (2,324,514 | ) |
| Net tax appreciation (depreciation) of investments | | | $56,331,298 | |
| Other book-to-tax adjustments | | | $(1,095,727 | ) |
| Undistributed ordinary income | | | $73,565 | |
| Accumulated long-term gains | | | $1,921,462 | |
| Post-October capital loss deferral | | | $(1,012,375 | ) |
The difference between book-basis and tax-basis unrealized appreciation (depreciation) is attributable primarily to the tax deferral of losses on wash sales. Other book-to-tax adjustments are attributable primarily to the tax deferral of losses on straddle positions.
Loss deferrals represent certain qualified losses that the fund has elected to treat as having been incurred in the following fiscal year for federal income tax purposes.
| For a Share Outstanding Throughout the Years Ended March 31 (except as noted) |
| Per-Share Data | Ratios and Supplemental Data |
| | | Income From Investment Operations: | Distributions From: | | | Ratio to Average Net Assets of: | | |
| | Net Asset Value, Beginning of Period | Net Investment Income (Loss)(1) | Net Realized and Unrealized Gain (Loss) | Total From Investment Operations | Net Investment Income | Net Realized Gains | Total Distributions | Net Asset Value, End of Period | Total Return(2) | Operating Expenses | Net Investment Income (Loss) | Portfolio Turnover Rate | Net Assets, End of Period (in thousands) |
| Investor Class |
| 2013 | $11.43 | 0.18 | 0.09 | 0.27 | (0.24) | (0.07) | (0.31) | $11.39 | 2.36% | 0.47% | 1.59% | 184% | $1,074,464 |
| 2012 | $11.07 | 0.29 | 0.50 | 0.79 | (0.31) | (0.12) | (0.43) | $11.43 | 7.20% | 0.48% | 2.53% | 127% | $1,139,706 |
| 2011 | $11.02 | 0.32 | 0.13 | 0.45 | (0.34) | (0.06) | (0.40) | $11.07 | 4.04% | 0.48% | 2.83% | 93% | $995,817 |
| 2010 | $11.26 | 0.37 | (0.07) | 0.30 | (0.38) | (0.16) | (0.54) | $11.02 | 2.77% | 0.48% | 3.28% | 124% | $988,435 |
| 2009 | $11.05 | 0.39 | 0.34 | 0.73 | (0.40) | (0.12) | (0.52) | $11.26 | 6.90% | 0.49% | 3.58% | 335% | $895,833 |
| Institutional Class |
| 2013 | $11.42 | 0.20 | 0.09 | 0.29 | (0.26) | (0.07) | (0.33) | $11.38 | 2.56% | 0.27% | 1.79% | 184% | $397,188 |
| 2012 | $11.07 | 0.31 | 0.49 | 0.80 | (0.33) | (0.12) | (0.45) | $11.42 | 7.32% | 0.28% | 2.73% | 127% | $58,198 |
| 2011 | $11.01 | 0.34 | 0.14 | 0.48 | (0.36) | (0.06) | (0.42) | $11.07 | 4.34% | 0.28% | 3.03% | 93% | $27,492 |
2010(3) | $11.07 | 0.03 | (0.06) | (0.03) | (0.03) | — | (0.03) | $11.01 | (0.26)% | 0.28%(4) | 3.33%(4) | 124%(5) | $25 |
A Class(6) |
| 2013 | $11.43 | 0.16 | 0.08 | 0.24 | (0.21) | (0.07) | (0.28) | $11.39 | 2.10% | 0.72% | 1.34% | 184% | $206,394 |
| 2012 | $11.07 | 0.26 | 0.50 | 0.76 | (0.28) | (0.12) | (0.40) | $11.43 | 6.93% | 0.73% | 2.28% | 127% | $223,798 |
| 2011 | $11.02 | 0.29 | 0.13 | 0.42 | (0.31) | (0.06) | (0.37) | $11.07 | 3.78% | 0.73% | 2.58% | 93% | $201,020 |
| 2010 | $11.26 | 0.34 | (0.07) | 0.27 | (0.35) | (0.16) | (0.51) | $11.02 | 2.52% | 0.73% | 3.03% | 124% | $191,437 |
| 2009 | $11.05 | 0.36 | 0.35 | 0.71 | (0.38) | (0.12) | (0.50) | $11.26 | 6.64% | 0.74% | 3.33% | 335% | $189,956 |
| For a Share Outstanding Throughout the Years Ended March 31 (except as noted) |
| Per-Share Data | Ratios and Supplemental Data |
| | | Income From Investment Operations: | Distributions From: | | | Ratio to Average Net Assets of: | | |
| | Net Asset Value, Beginning of Period | Net Investment Income (Loss)(1) | Net Realized and Unrealized Gain (Loss) | Total From Investment Operations | Net Investment Income | Net Realized Gains | Total Distributions | Net Asset Value, End of Period | Total Return(2) | Operating Expenses | Net Investment Income (Loss) | Portfolio Turnover Rate | Net Assets, End of Period (in thousands) |
| C Class |
| 2013 | $11.42 | 0.07 | 0.08 | 0.15 | (0.12) | (0.07) | (0.19) | $11.38 | 1.35% | 1.47% | 0.59% | 184% | $4,166 |
| 2012 | $11.07 | 0.17 | 0.49 | 0.66 | (0.19) | (0.12) | (0.31) | $11.42 | 6.04% | 1.48% | 1.53% | 127% | $2,584 |
| 2011 | $11.01 | 0.20 | 0.14 | 0.34 | (0.22) | (0.06) | (0.28) | $11.07 | 3.10% | 1.48% | 1.83% | 93% | $1,134 |
2010(3) | $11.07 | 0.02 | (0.06) | (0.04) | (0.02) | — | (0.02) | $11.01 | (0.36)% | 1.48%(4) | 2.13%(4) | 124%(5) | $44 |
| R Class |
| 2013 | $11.42 | 0.12 | 0.09 | 0.21 | (0.18) | (0.07) | (0.25) | $11.38 | 1.85% | 0.97% | 1.09% | 184% | $3,148 |
| 2012 | $11.07 | 0.23 | 0.49 | 0.72 | (0.25) | (0.12) | (0.37) | $11.42 | 6.58% | 0.98% | 2.03% | 127% | $617 |
| 2011 | $11.01 | 0.26 | 0.14 | 0.40 | (0.28) | (0.06) | (0.34) | $11.07 | 3.62% | 0.98% | 2.33% | 93% | $146 |
2010(3) | $11.07 | 0.02 | (0.05) | (0.03) | (0.03) | — | (0.03) | $11.01 | (0.32)% | 0.98%(4) | 2.63%(4) | 124%(5) | $25 |
Notes to Financial Highlights
| (1) | Computed using average shares outstanding throughout the period. |
| (2) | Total returns are calculated based on the net asset value of the last business day and do not reflect applicable sales charges, if any. Total returns for periods less than one year are not annualized. |
| (3) | March 1, 2010 (commencement of sale) through March 31, 2010. |
| (5) | Portfolio turnover is calculated at the fund level. Percentage indicated was calculated for the year ended March 31, 2010. |
| (6) | Prior to March 1, 2010, the A Class was referred to as the Advisor Class. |
See Notes to Financial Statements.
Report of Independent Registered Public Accounting Firm |
To the Trustees of the American Century Government Income Trust
and Shareholders of the Government Bond Fund:
In our opinion, the accompanying statement of assets and liabilities, including the schedule of investments, and the related statements of operations and of changes in net assets and the financial highlights present fairly, in all material respects, the financial position of the Government Bond Fund (one of the five funds comprising the American Century Government Income Trust, hereafter referred to as the “Fund”) at March 31, 2013, the results of its operations for the year then ended, the changes in its net assets for each of the two years in the period then ended and the financial highlights for each of the periods presented, in conformity with accounting principles generally accepted in the United States of America. These financial statements and financial highlights (hereafter referred to as “financial statements”) are the responsibility of the Fund’s management; our responsibility is to express an opinion on these financial statements based on our audits. We conducted our audits of these financial statements in accordance with the standards of the Public Company Accounting Oversight Board (United States). Those standards require that we plan and perform the audit to obtain reasonable assurance about whether the financial statements are free of material misstatement. An audit includes examining, on a test basis, evidence supporting the amounts and disclosures in the financial statements, assessing the accounting principles used and significant estimates made by management, and evaluating the overall financial statement presentation. We believe that our audits, which included confirmation of securities at March 31, 2013 by correspondence with the custodian and brokers, provide a reasonable basis for our opinion.
PricewaterhouseCoopers LLP
Kansas City, Missouri
May 21, 2013
Board of Trustees
The individuals listed below serve as trustees of the funds. Each trustee will continue to serve in this capacity until death, retirement, resignation or removal from office. The board has adopted a mandatory retirement age for trustees who are not “interested persons,” as that term is defined in the Investment Company Act (independent trustees). Independent trustees shall retire on December 31 of the year in which they reach their 75th birthday; provided, however, that on or after January 1, 2022, independent trustees shall retire on December 31 of the year in which they reach their 76th birthday.
Mr. Thomas is the only trustee who is an “interested person” because he currently serves as President and Chief Executive Officer of American Century Companies, Inc. (ACC), the parent company of American Century Investment Management, Inc. (ACIM or the advisor).
The other trustees (more than three-fourths of the total number) are independent; that is, they have never been employees, directors or officers of, and have no financial interest in, ACC or any of its wholly owned, direct or indirect, subsidiaries, including ACIM, American Century Investment Services, Inc. (ACIS) and American Century Services, LLC (ACS). The trustees serve in this capacity for eight (in the case of Mr. Thomas, 15) registered investment companies in the American Century Investments family of funds.
The following table presents additional information about the trustees. The mailing address for each trustee other than Mr. Thomas is 1665 Charleston Road, Mountain View, California 94043. The mailing address for Mr. Thomas is 4500 Main Street, Kansas City, Missouri 64111.
Name (Year of Birth) | Position(s) Held with Funds | Length of Time Served | Principal Occupation(s) During Past 5 Years | | Number of American Century Portfolios Overseen by Trustee | Other Directorships Held During Past 5 Years |
| Independent Trustees |
Tanya S. Beder (1955) | Trustee | Since 2011 | Chairman, SBCC Group Inc. (independent advisory services) (2006 to present) | | 42 | CYS Investments, Inc. (specialty finance company) |
Jeremy I. Bulow (1954) | Trustee | Since 2011 | Professor of Economics, Stanford University, Graduate School of Business (1979 to present) | | 42 | None |
Ronald J. Gilson (1946) | Trustee and Chairman of the Board | Since 1995 | Charles J. Meyers Professor of Law and Business, Stanford Law School (1979 to present); Marc and Eva Stern Professor of Law and Business, Columbia University School of Law (1992 to present) | | 42 | None |
Frederick L. A. Grauer (1946) | Trustee | Since 2008 | Senior Advisor, BlackRock, Inc. (investment management firm) (2010 to 2011); Senior Advisor, Barclays Global Investors (investment management firm) (2003 to 2009) | | 42 | None |
Name (Year of Birth) | Position(s) Held with Funds | Length of Time Served | Principal Occupation(s) During Past 5 Years | | Number of American Century Portfolios Overseen by Trustee | Other Directorships Held During Past 5 Years |
| Independent Trustees |
Peter F. Pervere (1947) | Trustee | Since 2007 | Retired | | 42 | Intraware, Inc. (2003 to 2009) |
Myron S. Scholes (1941) | Trustee | Since 1980 | Chairman, Platinum Grove Asset Management, L.P. (asset manager) (1999 to 2009); Frank E. Buck Professor of Finance-Emeritus, Stanford Graduate School of Business (1996 to present) | | 42 | Dimensional Fund Advisors (investment advisor); CME Group, Inc. (futures and options exchange) |
John B. Shoven (1947) | Trustee | Since 2002 | Professor of Economics, Stanford University (1973 to present) | | 42 | Cadence Design Systems; Exponent; Financial Engines |
| |
| Interested Trustee |
Jonathan S. Thomas (1963) | Trustee and President | Since 2007 | President and Chief Executive Officer, ACC (March 2007 to present). Also serves as Chief Executive Officer and Manager, ACS; Executive Vice President, ACIM; Director, ACC, ACIM and other ACC subsidiaries | | 107 | None |
Officers
The following table presents certain information about the executive officers of the funds. Each officer serves as an officer for each of the 15 investment companies in the American Century family of funds, unless otherwise noted. No officer is compensated for his or her service as an officer of the funds. The listed officers are interested persons of the funds and are appointed or re-appointed on an annual basis. The mailing address for each of the officers listed below is 4500 Main Street, Kansas City, Missouri 64111.
Name (Year of Birth) | Offices with the Funds | Principal Occupation(s) During the Past Five Years |
Jonathan S. Thomas (1963) | Trustee and President since 2007 | President and Chief Executive Officer, ACC (March 2007 to present). Also serves as Chief Executive Officer and Manager, ACS; Executive Vice President, ACIM; Director, ACC, ACIM and other ACC subsidiaries |
Maryanne L. Roepke (1956) | Chief Compliance Officer since 2006 and Senior Vice President since 2000 | Chief Compliance Officer, American Century funds, ACIM and ACS (August 2006 to present). Also serves as Senior Vice President, ACS |
Charles A. Etherington (1957) | General Counsel since 2007 and Senior Vice President since 2006 | Attorney, ACC (February 1994 to present); Vice President, ACC (November 2005 to present); General Counsel, ACC (March 2007 to present). Also serves as General Counsel, ACIM, ACS, ACIS and other ACC subsidiaries; and Senior Vice President, ACIM and ACS |
C. Jean Wade (1964) | Vice President, Treasurer and Chief Financial Officer since 2012 | Vice President, ACS (February 2000 to present) |
Robert J. Leach (1966) | Vice President since 2006 and Assistant Treasurer since 2012 | Vice President, ACS (February 2000 to present) |
David H. Reinmiller (1963) | Vice President since 2001 | Attorney, ACC (January 1994 to present); Associate General Counsel, ACC (January 2001 to present). Also serves as Vice President, ACIM and ACS |
Ward D. Stauffer (1960) | Secretary since 2005 | Attorney, ACC (June 2003 to present) |
The Statement of Additional Information has additional information about the fund’s trustees and is available without charge, upon request, by calling 1-800-345-2021.
Retirement Account Information
As required by law, distributions you receive from certain IRAs are subject to federal income tax withholding, unless you elect not to have withholding apply. Tax will be withheld on the total amount withdrawn even though you may be receiving amounts that are not subject to withholding, such as nondeductible contributions. In such case, excess amounts of withholding could occur. You may adjust your withholding election so that a greater or lesser amount will be withheld.
If you don’t want us to withhold on this amount, you must notify us to not withhold the federal income tax. You may notify us in writing or in certain situations by telephone or through other electronic means. For systematic withdrawals, your withholding election will remain in effect until revoked or changed by filing a new election. You have the right to revoke your election at any time.
Remember, even if you elect not to have income tax withheld, you are liable for paying income tax on the taxable portion of your withdrawal. If you elect not to have income tax withheld or you don’t have enough income tax withheld, you may be responsible for payment of estimated tax. You may incur penalties under the estimated tax rules if your withholding and estimated tax payments are not sufficient. You can reduce or defer the income tax on a distribution by directly or indirectly rolling such distribution over to another IRA or eligible plan. You should consult your tax advisor for additional information.
State tax will be withheld if, at the time of your distribution, your address is within one of the mandatory withholding states and you have federal income tax withheld (or as otherwise required by state law). State taxes will be withheld from your distribution in accordance with the respective state rules.
Distributions you receive from 403(b), 457 and qualified plans are subject to special tax and withholding rules. Your plan administrator or plan sponsor is required to provide you with a special tax notice explaining those rules at the time you request a distribution. If applicable, federal and/or state taxes may be withheld from your distribution amount.
Proxy Voting Guidelines
American Century Investment Management, Inc., the fund’s investment advisor, is responsible for exercising the voting rights associated with the securities purchased and/or held by the fund. A description of the policies and procedures the advisor uses in fulfilling this responsibility is available without charge, upon request, by calling 1-800-345-2021. It is also available on American Century Investments’ website at americancentury.com and on the Securities and Exchange Commission’s website at sec.gov. Information regarding how the investment advisor voted proxies relating to portfolio securities during the most recent 12-month period ended June 30 is available on the “About Us” page at americancentury.com. It is also available at sec.gov.
Quarterly Portfolio Disclosure
The fund files its complete schedule of portfolio holdings with the Securities and Exchange Commission (SEC) for the first and third quarters of each fiscal year on Form N-Q. The fund’s Forms N-Q are available on the SEC’s website at sec.gov, and may be reviewed and copied at the SEC’s Public Reference Room in Washington, DC. Information on the operation of the Public Reference Room may be obtained by calling 1-800-SEC-0330. The fund also makes its complete schedule of portfolio holdings for the most recent quarter of its fiscal year available on its website at americancentury.com and, upon request, by calling 1-800-345-2021.
Other Tax Information
The following information is provided pursuant to provisions of the Internal Revenue Code.
The fund hereby designates $3,629,827, or up to the maximum amount allowable, as long-term capital gain distributions for the fiscal year ended March 31, 2013.
The fund hereby designates $7,672,562 as qualified short-term capital gain distributions for purposes of Internal Revenue Code Section 871.
| Contact Us | americancentury.com |
| Automated Information Line | 1-800-345-8765 |
| Investor Services Representative | 1-800-345-2021 or 816-531-5575 |
| Investors Using Advisors | 1-800-378-9878 |
Business, Not-For-Profit, Employer-Sponsored Retirement Plans | 1-800-345-3533 |
Banks and Trust Companies, Broker-Dealers, Financial Professionals, Insurance Companies | 1-800-345-6488 |
| Telecommunications Device for the Deaf | 1-800-634-4113 |
American Century Government Income Trust
Investment Advisor:
American Century Investment Management, Inc.
Kansas City, Missouri
This report and the statements it contains are submitted for the general information of our shareholders. The report is not authorized for distribution to prospective investors unless preceded or accompanied by an effective prospectus.
©2013 American Century Proprietary Holdings, Inc. All rights reserved.
CL-ANN-78340 1305
ANNUAL REPORT MARCH 31, 2013


| President’s Letter | 2 |
| Market Perspective | 3 |
| Performance | 4 |
| Portfolio Commentary | 6 |
| Fund Characteristics | 8 |
| Shareholder Fee Example | 9 |
| Schedule of Investments | 11 |
| Statement of Assets and Liabilities | 14 |
| Statement of Operations | 15 |
| Statement of Changes in Net Assets | 16 |
| Notes to Financial Statements | 17 |
| Financial Highlights | 23 |
| Report of Independent Registered Public Accounting Firm | 26 |
| Management | 27 |
| Additional Information | 30 |
Any opinions expressed in this report reflect those of the author as of the date of the report, and do not necessarily represent the opinions of American Century Investments® or any other person in the American Century Investments organization. Any such opinions are subject to change at any time based upon market or other conditions and American Century Investments disclaims any responsibility to update such opinions. These opinions may not be relied upon as investment advice and, because investment decisions made by American Century Investments funds are based on numerous factors, may not be relied upon as an indication of trading intent on behalf of any American Century Investments fund. Security examples are used for representational purposes only and are not intended as recommendations to purchase or sell securities. Performance information for comparative indices and securities is provided to American Century Investments by third party vendors. To the best of American Century Investments’ knowledge, such information is accurate at the time of printing.
Dear Investor:
Thank you for reviewing this annual report for the 12 months ended March 31, 2013. It offers investment performance, market analysis, and portfolio information, presented with the expert perspective of our portfolio management team.
Annual reports remain important vehicles for conveying information about fund returns, including key factors that affected fund performance. For additional, updated investment and market insights, we encourage you to visit our website, americancentury.com.
Positive Fiscal-Year Returns for U.S. Stock and Bond Benchmarks
Despite a global economic slowdown, continued concerns about European financial system stability, and uncertainty about U.S. political and fiscal conditions, 12-month U.S. stock and bond index returns were generally positive. Aggressive central bank monetary policies helped motivate investors to take more risk and kept short-term interest rates low.
U.S. mid-cap and value stocks and high-yield bonds achieved performance leadership during the period. U.S. mid-cap and value stock indices outpaced the S&P 500 Index’s 13.96% return, and U.S. corporate high-yield and municipal high-yield benchmarks performed in that 13-14% return range as well. U.S. growth and international index returns were generally lower, but still above average—the MSCI EAFE Index, for example, returned 11.25%.
With the exception of high-yield bond sectors, stocks generally outperformed bonds for the period, though bonds benefitted from economic stagnation, reduced inflation pressures, and low interest rates. The 10-year U.S. Treasury yield declined from 2.21% to 1.85% during the period, and the Barclays U.S. Aggregate Bond Index returned 3.78%.
The U.S. economy showed signs of improvement during the fiscal year, particularly the long-depressed housing market. However, the U.S. economic growth outlook for 2013 remains subpar compared with past recession recoveries, still vulnerable to fiscal and financial factors that could trigger further slowdowns and market volatility.
Under these conditions, we continue to believe in a disciplined, diversified, long-term investment approach, using professionally managed stock and bond portfolios—as appropriate—for meeting financial goals. We appreciate your continued trust in us in this challenging environment.
Sincerely,
Jonathan Thomas
President and Chief Executive Officer
American Century Investments
By David MacEwen, Chief Investment Officer, Fixed Income
Central Banks Set Market Tone
Market sentiment wavered between risk taking and risk aversion during the 12-month period ended March 31, 2013, with risk taking generally prevailing. Persistent concerns about weak global economic growth, combined with Europe’s ongoing financial crisis and bouts of political uncertainty in the U.S. (first from the presidential election and then from the year-end “fiscal cliff” of federal tax hikes and spending cuts), triggered risk aversion, while optimism inspired by aggressive central bank monetary policies led to risk taking.
Early in the period, slowing economic growth, still-high unemployment, and ongoing problems in Europe led to a round of risk aversion that favored U.S. Treasuries. In response to the fragile economic backdrop, the Federal Reserve (the Fed) kept its overnight interest rate target near 0% and announced its third and most aggressive quantitative easing program (QE3), which has the Fed purchasing $40 billion of mortgage-backed securities (MBS) each month until economic growth and employment improve. The Fed expanded QE3 in December to include $45 billion in monthly Treasury purchases. Meanwhile, the European Central Bank launched several programs to help the eurozone’s troubled banks, and the Bank of Japan aggressively expanded its balance sheet.
Investors Favored Risk, Feared Long-Term Inflation
Overall, widespread central bank intervention drove down yields among higher-quality bonds and ultimately sparked investments in riskier asset classes. Both high-yield and investment-grade corporate bonds were among the taxable U.S. fixed-income market’s top performers for the period, benefitting from generally favorable corporate fundamentals and investor demand for yield.
At the same time, longer-term Treasury yields tumbled and the yield curve (which shows the relationship between bond maturities and yields across the maturity spectrum) flattened. These factors, combined with strong safe-haven demand that occasionally emerged and overall sluggish economic growth, led to relative outperformance for longer-maturity Treasuries. Treasury outperformance, combined with some long-term inflation concerns triggered by central bank policies, led to relative outperformance for Treasury inflation-protected securities (TIPS).
| U.S. Fixed-Income Total Returns |
| For the 12 months ended March 31, 2013 |
| Barclays U.S. Bond Market Indices | | Barclays U.S. Treasury Bellwethers |
| Corporate High-Yield | 13.13% | | 3-Month Bill | 0.13% |
| Corporate (investment-grade) | 7.47% | | 2-Year Note | 0.48% |
| Treasury Inflation Protected Securities (TIPS) | 5.68% | | 10-Year Note | 6.20% |
| Aggregate (multi-sector) | 3.78% | | 30-Year Bond | 7.48% |
| Treasury | 3.14% | | | |
| MBS (mortgage-backed securities) | 1.97% | | | |
| Total Returns as of March 31, 2013 |
| | | | Average Annual Returns | |
| | Ticker Symbol | 1 year | 5 years | 10 years | Since Inception | Inception Date |
| Investor Class | BGNMX | 2.16% | 5.29% | 4.64% | 6.87% | 9/23/85 |
| Barclays U.S. GNMA Index | — | 1.80% | 5.46% | 5.09% | 7.55%(2) | — |
| Institutional Class | AGMNX | 2.36% | 5.50% | — | 6.00%(1) | 9/28/07 |
A Class(3) No sales charge* With sales charge* | BGNAX | 1.90% -2.70% | 5.03% 4.07% | 4.38% 3.90% | 5.06% 4.75% | 10/9/97 |
| C Class | BGNCX | 1.14% | — | — | 3.60% | 3/1/10 |
| R Class | AGMWX | 1.56% | 4.75% | — | 5.24% | 9/28/07 |
| Sales charges include initial sales charges and contingent deferred sales charges (CDSCs), as applicable. A Class shares have a 4.50% maximum initial sales charge and may be subject to a maximum CDSC of 1.00%. C Class shares redeemed within 12 months of purchase are subject to a maximum CDSC of 1.00%. The SEC requires that mutual funds provide performance information net of maximum sales charges in all cases where charges could be applied. |
| (1) | Returns would have been lower if a portion of the management fee had not been waived. |
| (2) | Since 9/30/85, the date nearest the Investor Class’s inception for which data are available. |
| (3) | Prior to March 1, 2010, the A Class was referred to as the Advisor Class and did not have a front-end sales charge. Performance prior to that date has been adjusted to reflect this charge. |
Data presented reflect past performance. Past performance is no guarantee of future results. Current performance may be higher or lower than the performance shown. Investment return and principal value will fluctuate, and redemption value may be more or less than original cost. To obtain performance data current to the most recent month end, please call 1-800-345-2021 or visit americancentury.com. As interest rates rise, bond values will decline. The fund’s investment process may result in high portfolio turnover, which could mean high transaction costs, affecting both performance and capital gains tax liabilities to investors.
Unless otherwise indicated, performance reflects Investor Class shares; performance for other share classes will vary due to differences in fee structure. For information about other share classes available, please consult the prospectus. Data assumes reinvestment of dividends and capital gains, and none of the charts reflect the deduction of taxes that a shareholder would pay on fund distributions or the redemption of fund shares. Returns for the index are provided for comparison. The fund’s total returns include operating expenses (such as transaction costs and management fees) that reduce returns, while the total returns of the index do not.
| Growth of $10,000 Over 10 Years |
| $10,000 investment made March 31, 2003 |
| Total Annual Fund Operating Expenses |
| Investor Class | Institutional Class | A Class | C Class | R Class |
| 0.56% | 0.36% | 0.81% | 1.56% | 1.06% |
The total annual fund operating expenses shown is as stated in the fund’s prospectus current as of the date of this report. The prospectus may vary from the expense ratio shown elsewhere in this report because it is based on a different time period, includes acquired fund fees and expenses, and, if applicable, does not include fee waivers or expense reimbursements.
Data presented reflect past performance. Past performance is no guarantee of future results. Current performance may be higher or lower than the performance shown. Investment return and principal value will fluctuate, and redemption value may be more or less than original cost. To obtain performance data current to the most recent month end, please call 1-800-345-2021 or visit americancentury.com. As interest rates rise, bond values will decline. The fund’s investment process may result in high portfolio turnover, which could mean high transaction costs, affecting both performance and capital gains tax liabilities to investors.
Unless otherwise indicated, performance reflects Investor Class shares; performance for other share classes will vary due to differences in fee structure. For information about other share classes available, please consult the prospectus. Data assumes reinvestment of dividends and capital gains, and none of the charts reflect the deduction of taxes that a shareholder would pay on fund distributions or the redemption of fund shares. Returns for the index are provided for comparison. The fund’s total returns include operating expenses (such as transaction costs and management fees) that reduce returns, while the total returns of the index do not.
Portfolio Managers: Hando Aguilar, Dan Shiffman, and Bob Gahagan
Performance Summary
Ginnie Mae returned 2.16%* for the 12 months ended March 31, 2013. By comparison, the portfolio’s benchmark, the Barclays U.S. GNMA Index, returned 1.80%. See pages 4 and 5 for additional performance comparisons. Fund returns reflect operating expenses, while index returns do not.
Ginnie Mae’s absolute return reflected the positive performance of government agency mortgage-backed securities (MBS) during the period. Relative to the benchmark, security selection was the main contributor to the fund’s outperformance.
Market Overview
On an absolute basis, MBS posted modest performance for the 12-month period. Mortgage rates declined overall throughout the 12 months, with the average 30-year conventional mortgage rate falling as low as 3.35% at calendar-year-end 2012 before climbing back to 3.57% by March 2013 (compared with 3.95% a year earlier), according to the Federal Home Loan Mortgage Corporation. Meanwhile, the U.S. housing market continued to improve, registering gains in home prices and sales throughout the 12-month period. In this environment, rising mortgage prepayment levels (due to mortgage-holders refinancing to take advantage of historically low mortgage rates) weighed on MBS performance for much of the period.
The Federal Reserve (Fed) triggered a fourth-quarter 2012 rally in the mortgage sector, after it announced in mid-September a third round of quantitative easing (QE3), or the monthly purchase of $40 billion in agency MBS. (The Fed later expanded QE3 to include $45 billion in monthly Treasury purchases.) But, sentiment shifted in early 2013, as economic optimism, sparked primarily by housing and employment gains, led to speculation the Fed would scale back its purchases of Treasuries and MBS sooner than expected. Concerns about mortgage prepayments gave way to the potential for extension risk—that is, the risk that mortgage securities will be prepaid at a slower pace, thus limiting investors’ ability to capitalize on higher interest rates because their investments remain locked in at lower rates for longer periods of time.
Portfolio Positioning
We continued to emphasize single-issuer GNMA securities (Ginnie Mae Is) over those with multiple originators (Ginnie Mae IIs). Much of the new issuance in the GNMA market consists of Ginne Mae IIs, so the supply dynamics favor Ginnie Mae Is. Within the single-issuer allocation, we favored loan balance paper, which represented the largest contributor to the fund’s outperformance. These securities generally provide prepayment protection while delivering incremental income to the fund. Loan balance paper provides exposure to mortgage pools with lower average loan balances and less susceptibility to prepayments. As loan balance paper outperformed during the second half of the period, we took profits in this segment, reducing the fund’s overweight to Ginnie Mae Is compared with Ginnie Mae IIs.
*All fund returns referenced in this commentary are for Investor Class shares.
We reallocated the proceeds from the sales of loan balance paper into more “generic” mortgages designed to provide some protection if the market becomes more volatile. In addition, we increased the fund’s exposure to floating-rate securities. These low-duration (price sensitivity to interest rate changes) securities may provide some protection in a rising-rate environment, because their rates reset monthly according to a stated interest rate benchmark.
We also maintained an overweight position in 30-year GNMA securities and a corresponding underweight to 15-year GNMAs. This positioning also contributed positively to fund performance, as 30-year securities outperformed 15-year GNMAs for the 12-month period.
An overweight position to higher-coupon mortgages detracted slightly from relative performance. These mortgages generally lagged lower-coupon mortgages during much of the period, primarily because they are considered more susceptible to refinancing than lower-coupon securities. This trend reversed in the final three months of the period, though, as refinancing fears subsided.
Outlook
We expect economic growth to remain subpar, with U.S. growth likely remaining between 1% and 3% in 2013. Despite improvements in employment and housing, we believe the odds of a sustained upside breakout in growth in 2013 remain limited, given the headwinds of fiscal consolidation, higher taxes, and increased regulation.
In the near term, we believe mortgage rates should remain low, held down by sluggish economic growth and QE3. In this environment, we expect mortgage prepayments will remain a factor, as mortgage holders seek to refinance their loans at lower rates. Therefore, we will continue to look for undervalued mortgage securities that provide flexibility in terms of prepayment risk.
| MARCH 31, 2013 |
| Portfolio at a Glance | |
| Average Duration (effective) | 4.3 years |
| Weighted Average Life | 4.5 years |
| | |
| Types of Investments in Portfolio | % of net assets |
| U.S. Government Agency Mortgage-Backed Securities (all GNMAs) | 100.0% |
| U.S. Government Agency Collateralized Mortgage Obligations (all GNMAs) | 11.0% |
| U.S. Treasury Securities | 5.2% |
| Temporary Cash Investments | 9.9% |
| Other Assets and Liabilities | (26.1)%* |
*Amount relates primarily to receivable for investments sold and payable for investments purchased, but not settled, at period end.
Fund shareholders may incur two types of costs: (1) transaction costs, including sales charges (loads) on purchase payments and redemption/exchange fees; and (2) ongoing costs, including management fees; distribution and service (12b-1) fees; and other fund expenses. This example is intended to help you understand your ongoing costs (in dollars) of investing in your fund and to compare these costs with the ongoing cost of investing in other mutual funds.
The example is based on an investment of $1,000 made at the beginning of the period and held for the entire period from October 1, 2012 to March 31, 2013.
Actual Expenses
The table provides information about actual account values and actual expenses for each class. You may use the information, together with the amount you invested, to estimate the expenses that you paid over the period. First, identify the share class you own. Then simply divide your account value by $1,000 (for example, an $8,600 account value divided by $1,000 = 8.6), then multiply the result by the number under the heading “Expenses Paid During Period” to estimate the expenses you paid on your account during this period.
If you hold Investor Class shares of any American Century Investments fund, or Institutional Class shares of the American Century Diversified Bond Fund, in an American Century Investments account (i.e., not a financial intermediary or retirement plan account), American Century Investments may charge you a $12.50 semiannual account maintenance fee if the value of those shares is less than $10,000. We will redeem shares automatically in one of your accounts to pay the $12.50 fee. In determining your total eligible investment amount, we will include your investments in all personal accounts (including American Century Investments Brokerage accounts) registered under your Social Security number. Personal accounts include individual accounts, joint accounts, UGMA/UTMA accounts, personal trusts, Coverdell Education Savings Accounts and IRAs (including traditional, Roth, Rollover, SEP-, SARSEP- and SIMPLE-IRAs), and certain other retirement accounts. If you have only business, business retirement, employer-sponsored or American Century Investments Brokerage accounts, you are currently not subject to this fee. If you are subject to the Account Maintenance Fee, your account value could be reduced by the fee amount.
Hypothetical Example for Comparison Purposes
The table also provides information about hypothetical account values and hypothetical expenses based on the actual expense ratio of each class of your fund and an assumed rate of return of 5% per year before expenses, which is not the actual return of a fund’s share class. The hypothetical account values and expenses may not be used to estimate the actual ending account balance or expenses you paid for the period. You may use this information to compare the ongoing costs of investing in your fund and other funds. To do so, compare this 5% hypothetical example with the 5% hypothetical examples that appear in the shareholder reports of the other funds.
Please note that the expenses shown in the table are meant to highlight your ongoing costs only and do not reflect any transactional costs, such as sales charges (loads) or redemption/exchange fees. Therefore, the table is useful in comparing ongoing costs only, and will not help you determine the relative total costs of owning different funds. In addition, if these transactional costs were included, your costs would have been higher.
| | Beginning Account Value 10/1/12 | Ending Account Value 3/31/13 | Expenses Paid During Period(1) 10/1/12 – 3/31/13 | Annualized Expense Ratio(1) |
| Actual | | | | |
| Investor Class | $1,000 | $998.20 | $2.74 | 0.55% |
| Institutional Class | $1,000 | $1,000.10 | $1.75 | 0.35% |
| A Class | $1,000 | $996.90 | $3.98 | 0.80% |
| C Class | $1,000 | $993.20 | $7.70 | 1.55% |
| R Class | $1,000 | $995.70 | $5.22 | 1.05% |
| Hypothetical | | | | |
| Investor Class | $1,000 | $1,022.19 | $2.77 | 0.55% |
| Institutional Class | $1,000 | $1,023.19 | $1.77 | 0.35% |
| A Class | $1,000 | $1,020.94 | $4.03 | 0.80% |
| C Class | $1,000 | $1,017.20 | $7.80 | 1.55% |
| R Class | $1,000 | $1,019.70 | $5.29 | 1.05% |
| (1) | Expenses are equal to the class’s annualized expense ratio listed in the table above, multiplied by the average account value over the period, multiplied by 182, the number of days in the most recent fiscal half-year, divided by 365, to reflect the one-half year period. |
| | | Principal Amount | | | Value | |
U.S. Government Agency Mortgage-Backed Securities(1) — 100.0% | |
| ADJUSTABLE-RATE U.S. GOVERNMENT AGENCY MORTGAGE-BACKED SECURITIES — 1.5% | |
| GNMA, VRN, 1.625%, 4/20/13 | | | $21,906,186 | | | | $22,905,664 | |
| GNMA, VRN, 1.75%, 4/20/13 | | | 6,703,757 | | | | 7,047,890 | |
| | | | | | | | 29,953,554 | |
| FIXED-RATE U.S. GOVERNMENT AGENCY MORTGAGE-BACKED SECURITIES — 98.5% | |
GNMA, 3.00%, 5/21/13(2) | | | 75,000,000 | | | | 78,210,937 | |
GNMA, 3.50%, 5/21/13(2) | | | 300,000,000 | | | | 321,796,875 | |
| GNMA, 3.50%, 6/20/42 to 11/20/42 | | | 118,714,157 | | | | 127,237,295 | |
GNMA, 4.00%, 4/18/13(2) | | | 50,000,000 | | | | 54,509,765 | |
| GNMA, 4.00%, 12/20/39 to 6/20/42 | | | 394,691,208 | | | | 431,548,951 | |
GNMA, 4.50%, 4/18/13(2) | | | 50,000,000 | | | | 54,679,685 | |
| GNMA, 4.50%, 7/15/33 to 3/20/42 | | | 228,302,600 | | | | 251,539,874 | |
| GNMA, 5.00%, 6/15/33 to 5/20/41 | | | 198,609,964 | | | | 218,510,187 | |
GNMA, 5.50%, 4/15/33 to 1/20/40(3) | | | 194,607,103 | | | | 215,004,089 | |
| GNMA, 6.00%, 7/20/16 to 2/20/39 | | | 93,763,206 | | | | 105,844,712 | |
| GNMA, 6.50%, 6/15/23 to 11/15/38 | | | 21,606,595 | | | | 25,076,147 | |
| GNMA, 7.00%, 11/15/22 to 12/20/29 | | | 5,960,978 | | | | 7,066,726 | |
| GNMA, 7.25%, 4/15/23 to 6/15/23 | | | 50,691 | | | | 58,762 | |
| GNMA, 7.50%, 6/15/17 to 11/15/31 | | | 4,762,865 | | | | 5,255,907 | |
| GNMA, 7.65%, 6/15/16 to 12/15/16 | | | 50,667 | | | | 50,930 | |
| GNMA, 7.75%, 11/15/22 to 6/20/23 | | | 43,191 | | | | 44,043 | |
| GNMA, 7.77%, 4/15/20 to 6/15/20 | | | 133,807 | | | | 141,041 | |
| GNMA, 7.89%, 9/20/22 | | | 11,741 | | | | 11,802 | |
| GNMA, 7.98%, 6/15/19 | | | 24,329 | | | | 24,463 | |
| GNMA, 8.00%, 2/20/17 to 7/20/30 | | | 1,361,754 | | | | 1,494,496 | |
| GNMA, 8.15%, 2/15/21 | | | 46,835 | | | | 48,178 | |
| GNMA, 8.25%, 4/15/17 to 2/15/22 | | | 303,076 | | | | 314,261 | |
| GNMA, 8.35%, 11/15/20 | | | 20,881 | | | | 21,000 | |
| GNMA, 8.50%, 4/20/16 to 12/15/30 | | | 1,072,570 | | | | 1,184,340 | |
| GNMA, 8.75%, 3/15/17 to 7/15/27 | | | $108,259 | | | | $111,628 | |
| GNMA, 9.00%, 7/20/15 to 1/15/25 | | | 684,452 | | | | 744,137 | |
| GNMA, 9.25%, 9/15/16 to 3/15/25 | | | 162,926 | | | | 165,807 | |
| GNMA, 9.50%, 5/15/16 to 7/20/25 | | | 308,394 | | | | 318,587 | |
| GNMA, 9.75%, 8/15/17 to 11/20/21 | | | 57,965 | | | | 61,403 | |
| GNMA, 10.00%, 3/15/16 to 11/20/21 | | | 17,967 | | | | 19,085 | |
| GNMA, 10.25%, 2/15/19 | | | 6,227 | | | | 6,272 | |
| GNMA, 10.50%, 3/15/14 to 4/20/19 | | | 32,217 | | | | 33,685 | |
| GNMA, 11.00%, 2/15/16 to 6/15/20 | | | 27,319 | | | | 27,971 | |
| GNMA, 11.25%, 2/20/16 | | | 1,111 | | | | 1,119 | |
| GNMA, 11.50%, 7/15/13 to 5/20/14 | | | 47 | | | | 48 | |
| GNMA, 13.00%, 9/15/13 to 8/15/15 | | | 9,804 | | | | 9,900 | |
| GNMA, 13.50%, 8/15/14 | | | 3,523 | | | | 3,555 | |
| | | | | | | | 1,901,177,663 | |
TOTAL U.S. GOVERNMENT AGENCY MORTGAGE-BACKED SECURITIES (Cost $1,878,755,657) | | | | 1,931,131,217 | |
U.S. Government Agency Collateralized Mortgage Obligations(1) — 11.0% | |
| GNMA, Series 1998-6, Class FA, VRN, 0.71%, 4/16/13 | | | 2,126,503 | | | | 2,156,301 | |
| GNMA, Series 1998-17, Class F, VRN, 0.70%, 4/16/13 | | | 245,634 | | | | 249,095 | |
| GNMA, Series 1999-43, Class FB, VRN, 0.55%, 4/16/13 | | | 7,097,916 | | | | 7,149,781 | |
| GNMA, Series 2000-22, Class FG, VRN, 0.40%, 4/16/13 | | | 70,618 | | | | 70,920 | |
| GNMA, Series 2001-59, Class FD, VRN, 0.70%, 4/16/13 | | | 1,119,929 | | | | 1,136,317 | |
| GNMA, Series 2001-62, Class FB, VRN, 0.70%, 4/16/13 | | | 2,250,732 | | | | 2,283,623 | |
| GNMA, Series 2002-13, Class FA, VRN, 0.70%, 4/16/13 | | | 1,343,811 | | | | 1,361,239 | |
| GNMA, Series 2002-24, Class FA, VRN, 0.70%, 4/16/13 | | | 2,503,912 | | | | 2,537,381 | |
| | | | Principal Amount | | | | Value | |
| GNMA, Series 2002-29, Class FA SEQ, VRN, 0.55%, 4/20/13 | | | $795,324 | | | | $805,717 | |
| GNMA, Series 2002-31, Class FW, VRN, 0.60%, 4/16/13 | | | 789,607 | | | | 799,356 | |
| GNMA, Series 2003-42, Class FW, VRN, 0.55%, 4/20/13 | | | 1,231,244 | | | | 1,242,351 | |
| GNMA, Series 2003-66, Class EH, 5.00%, 5/20/32 | | | 10,383,148 | | | | 10,804,309 | |
| GNMA, Series 2003-66, Class HF, VRN, 0.65%, 4/20/13 | | | 2,222,462 | | | | 2,249,965 | |
| GNMA, Series 2003-110, Class F, VRN, 0.60%, 4/20/13 | | | 3,368,519 | | | | 3,403,639 | |
| GNMA, Series 2004-30, Class PD, 5.00%, 2/20/33 | | | 15,315,840 | | | | 15,999,194 | |
| GNMA, Series 2004-39, Class XF SEQ, VRN, 0.45%, 4/16/13 | | | 1,591,179 | | | | 1,603,050 | |
| GNMA, Series 2004-76, Class F, VRN, 0.60%, 4/20/13 | | | 3,046,235 | | | | 3,077,321 | |
| GNMA, Series 2004-80, Class FM, VRN, 0.50%, 4/20/13 | | | 2,361,125 | | | | 2,364,678 | |
| GNMA, Series 2007-5, Class FA, VRN, 0.34%, 4/20/13 | | | 10,925,422 | | | | 10,977,853 | |
| GNMA, Series 2007-58, Class FC, VRN, 0.70%, 4/20/13 | | | 5,627,403 | | | | 5,692,591 | |
| GNMA, Series 2007-74, Class FL, VRN, 0.66%, 4/16/13 | | | 12,494,745 | | | | 12,619,974 | |
| GNMA, Series 2008-2, Class LF, VRN, 0.66%, 4/20/13 | | | 6,218,311 | | | | 6,287,247 | |
| GNMA, Series 2008-18, Class FH, VRN, 0.80%, 4/20/13 | | | 9,264,389 | | | | 9,405,898 | |
| GNMA, Series 2008-61, Class KF, VRN, 0.87%, 4/20/13 | | | 9,867,364 | | | | 10,033,860 | |
| GNMA, Series 2008-73, Class FK, VRN, 0.96%, 4/20/13 | | | 11,327,940 | | | | 11,596,497 | |
| GNMA, Series 2008-75, Class F, VRN, 0.73%, 4/20/13 | | | 12,834,173 | | | | 13,004,502 | |
| GNMA, Series 2009-45, Class PA, 4.50%, 1/16/31 | | | 15,760,154 | | | | 16,055,168 | |
| GNMA, Series 2009-58, Class MB, 4.50%, 2/16/33 | | | 11,150,000 | | | | 11,493,509 | |
| | | Principal Amount/ Shares | | | Value | |
| GNMA, Series 2009-92, Class FJ, VRN, 0.88%, 4/16/13 | | | $5,427,916 | | | | $5,533,614 | |
| GNMA, Series 2009-109, Class FA, VRN, 0.60%, 4/16/13 | | | 3,142,953 | | | | 3,164,396 | |
| GNMA, Series 2009-127, Class FA, VRN, 0.75%, 4/20/13 | | | 12,109,202 | | | | 12,257,776 | |
| GNMA, Series 2010-14, Class QF, VRN, 0.65%, 4/16/13 | | | 24,103,174 | | | | 24,466,493 | |
TOTAL U.S. GOVERNMENT AGENCY COLLATERALIZED MORTGAGE OBLIGATIONS (Cost $210,256,914) | | | | 211,883,615 | |
| U.S. Treasury Securities — 5.2% | |
| U.S. Treasury Notes, 0.125%, 7/31/14 | | | 40,000,000 | | | | 39,964,080 | |
| U.S. Treasury Notes, 0.25%, 8/31/14 | | | 40,000,000 | | | | 40,026,560 | |
| U.S. Treasury Notes, 0.50%, 10/15/14 | | | 20,000,000 | | | | 20,087,500 | |
TOTAL U.S. TREASURY SECURITIES (Cost $100,060,602) | | | | 100,078,140 | |
| Temporary Cash Investments — 9.9% | |
Federal Home Loan Bank Discount Notes, 0.00%, 4/1/13(4) | | | 55,000,000 | | | | 55,000,000 | |
Repurchase Agreement, Bank of America Merrill Lynch, (collateralized by various U.S. Treasury obligations, 0.25%, 2/28/14, valued at $12,123,231), in a joint trading account at 0.11%, dated 3/28/13, due 4/1/13 (Delivery value $11,883,281) | | | | 11,883,136 | |
Repurchase Agreement, Credit Suisse First Boston, Inc., (collateralized by various U.S. Treasury obligations, 4.375%, 5/15/41, valued at $36,389,371), in a joint trading account at 0.13%, dated 3/28/13, due 4/1/13 (Delivery value $35,649,923) | | | | 35,649,408 | |
Repurchase Agreement, Goldman Sachs & Co., (collateralized by various U.S. Treasury obligations, 4.25%, 11/15/40, valued at $12,125,327), in a joint trading account at 0.10%, dated 3/28/13, due 4/1/13 (Delivery value $11,883,268) | | | | 11,883,136 | |
| SSgA U.S. Government Money Market Fund | | | 76,742,588 | | | | 76,742,588 | |
TOTAL TEMPORARY CASH INVESTMENTS (Cost $191,158,268) | | | | 191,158,268 | |
| | | Value | |
TOTAL INVESTMENT SECURITIES — 126.1% (Cost $2,380,231,441) | | | $2,434,251,240 | |
OTHER ASSETS AND LIABILITIES(5) — (26.1)% | | | (503,714,404 | ) |
| TOTAL NET ASSETS — 100.0% | | | $1,930,536,836 | |
| Futures Contracts | |
| Contracts Purchased | Expiration Date | | Underlying Face Amount at Value | | | Unrealized Gain (Loss) | |
| | 124 | | U.S. Treasury 10-Year Notes | June 2013 | | | $16,366,063 | | | | $47,948 | |
| | 123 | | U.S. Treasury 30-Year Bonds | June 2013 | | | 17,769,656 | | | | 70,845 | |
| | | | | | | | $34,135,719 | | | | $118,793 | |
Notes to Schedule of Investments
GNMA = Government National Mortgage Association
SEQ = Sequential Payer
VRN = Variable Rate Note. Interest reset date is indicated. Rate shown is effective at the period end.
| (1) | Final maturity date indicated, unless otherwise noted. |
| (2) | Forward commitment. Settlement date is indicated. |
| (3) | Security, or a portion thereof, has been pledged at the custodian bank or with a broker for margin requirements on futures contracts. At the period end, the aggregate value of securities pledged was $2,579,858. |
| (4) | The rate indicated is the yield to maturity at purchase. |
| (5) | Amount relates primarily to receivable for investments sold and payable for investments purchased, but not settled, at period end. |
See Notes to Financial Statements.
Statement of Assets and Liabilities |
| MARCH 31, 2013 | |
| Assets | |
| Investment securities, at value (cost of $2,380,231,441) | | | $2,434,251,240 | |
| Receivable for investments sold | | | 422,631,198 | |
| Receivable for capital shares sold | | | 2,719,260 | |
| Interest receivable | | | 6,180,899 | |
| | | | 2,865,782,597 | |
| | | | | |
| Liabilities | | | | |
| Payable for investments purchased | | | 931,526,163 | |
| Payable for capital shares redeemed | | | 2,251,655 | |
| Payable for variation margin on futures contracts | | | 28,969 | |
| Accrued management fees | | | 887,298 | |
| Distribution and service fees payable | | | 96,442 | |
| Dividends payable | | | 455,234 | |
| | | | 935,245,761 | |
| | | | | |
| Net Assets | | | $1,930,536,836 | |
| | | | | |
| Net Assets Consist of: | | | | |
| Capital paid in | | | $1,884,613,709 | |
| Undistributed net investment income | | | 53,084 | |
| Accumulated net realized loss | | | (8,268,549 | ) |
| Net unrealized appreciation | | | 54,138,592 | |
| | | | $1,930,536,836 | |
| | Net assets | Shares outstanding | Net asset value per share |
| Investor Class | $1,519,665,717 | 136,946,149 | $11.10 |
| Institutional Class | $62,075,313 | 5,594,625 | $11.10 |
| A Class | $310,735,533 | 28,003,022 | $11.10* |
| C Class | $33,287,069 | 2,999,315 | $11.10 |
| R Class | $4,773,204 | 430,320 | $11.09 |
*Maximum offering price $11.62 (net asset value divided by 0.955).
See Notes to Financial Statements.
| YEAR ENDED MARCH 31, 2013 | |
| Investment Income (Loss) | |
| Income: | | | |
| Interest | | | $55,858,152 | |
| | | | | |
| Expenses: | | | | |
| Management fees | | | 10,735,137 | |
| Distribution and service fees: | | | | |
| A Class | | | 745,412 | |
| C Class | | | 244,433 | |
| R Class | | | 22,951 | |
| Trustees’ fees and expenses | | | 112,248 | |
| Other expenses | | | 3,043 | |
| | | | 11,863,224 | |
| | | | | |
| Net investment income (loss) | | | 43,994,928 | |
| | | | | |
| Realized and Unrealized Gain (Loss) | | | | |
| Net realized gain (loss) on: | | | | |
| Investment transactions | | | 38,590,436 | |
| Futures contract transactions | | | (782,673 | ) |
| | | | 37,807,763 | |
| | | | | |
| Change in net unrealized appreciation (depreciation) on: | | | | |
| Investments | | | (42,530,052 | ) |
| Futures contracts | | | (53,437 | ) |
| | | | (42,583,489 | ) |
| | | | | |
| Net realized and unrealized gain (loss) | | | (4,775,726 | ) |
| | | | | |
| Net Increase (Decrease) in Net Assets Resulting from Operations | | | $39,219,202 | |
See Notes to Financial Statements.
Statement of Changes in Net Assets |
| YEARS ENDED MARCH 31, 2013 AND MARCH 31, 2012 | |
| Increase (Decrease) in Net Assets | March 31, 2013 | | | March 31, 2012 | |
| Operations | |
| Net investment income (loss) | | $43,994,928 | | | | $53,260,448 | |
| Net realized gain (loss) | | 37,807,763 | | | | 17,916,276 | |
| Change in net unrealized appreciation (depreciation) | | (42,583,489 | ) | | | 42,750,778 | |
| Net increase (decrease) in net assets resulting from operations | | 39,219,202 | | | | 113,927,502 | |
| | | | | | | | |
| Distributions to Shareholders | | | | | | | |
| From net investment income: | | | | | | | |
| Investor Class | | (50,233,315 | ) | | | (52,366,857 | ) |
| Institutional Class | | (1,804,299 | ) | | | (745,895 | ) |
| A Class | | (8,566,324 | ) | | | (7,112,477 | ) |
| C Class | | (514,046 | ) | | | (165,442 | ) |
| R Class | | (120,524 | ) | | | (104,527 | ) |
| Decrease in net assets from distributions | | (61,238,508 | ) | | | (60,495,198 | ) |
| | | | | | | | |
| Capital Share Transactions | | | | | | | |
| Net increase (decrease) in net assets from capital share transactions | | 69,212,619 | | | | 265,675,829 | |
| | | | | | | | |
| Net increase (decrease) in net assets | | 47,193,313 | | | | 319,108,133 | |
| | | | | | | | |
| Net Assets | | | | | | | |
| Beginning of period | | 1,883,343,523 | | | | 1,564,235,390 | |
| End of period | | $1,930,536,836 | | | | $1,883,343,523 | |
| | | | | | | | |
| Undistributed net investment income | | $53,084 | | | | $12,473 | |
See Notes to Financial Statements.
Notes to Financial Statements |
MARCH 31, 2013
1. Organization
American Century Government Income Trust (the trust) is registered under the Investment Company Act of 1940, as amended (the 1940 Act), as an open-end management investment company and is organized as a Massachusetts business trust. Ginnie Mae Fund (the fund) is one fund in a series issued by the trust. The fund is diversified as defined under the 1940 Act. The fund’s investment objective is to seek high current income while maintaining liquidity and safety of principal by investing primarily in Government National Mortgage Association certificates.
The fund offers the Investor Class, the Institutional Class, the A Class, the C Class and the R Class. The A Class may incur an initial sales charge. The A Class and C Class may be subject to a contingent deferred sales charge. The share classes differ principally in their respective sales charges and distribution and shareholder servicing expenses and arrangements. The Institutional Class is made available to institutional shareholders or through financial intermediaries whose clients do not require the same level of shareholder and administrative services as shareholders of other classes. As a result,
the Institutional Class is charged a lower unified management fee.
2. Significant Accounting Policies
The following is a summary of significant accounting policies consistently followed by the fund in preparation of its financial statements. The financial statements are prepared in conformity with accounting principles generally accepted in the United States of America, which may require management to make certain estimates and assumptions at the date of the financial statements. Actual results could differ from these estimates.
Investment Valuations — The fund determines the fair value of its investments and computes its net asset value per share as of the close of regular trading (usually 4 p.m. Eastern time) on the New York Stock Exchange (NYSE) on each day the NYSE is open.
Debt securities maturing in greater than 60 days at the time of purchase are valued at the evaluated mean as provided by independent pricing services or at the mean of the most recent bid and asked prices as provided by investment dealers. Debt securities maturing within 60 days at the time of purchase may be valued at cost, plus or minus any amortized discount or premium or at the evaluated mean as provided by an independent pricing service. Evaluated mean prices are commonly derived through utilization of market models, which may consider, among other factors, trade data, quotations from dealers and active market makers, relevant yield curve and spread data, related sector levels, creditworthiness, and other relevant market information on the same or comparable securities.
Investments in open-end management investment companies are valued at the reported net asset value per share. Repurchase agreements are valued at cost. Exchange-traded futures contracts are valued at the settlement price as provided by the appropriate clearing corporation.
If the fund determines that the market price for a portfolio security is not readily available or the valuation methods mentioned above do not reflect a security’s fair value, such security is valued as determined in good faith by the Board of Trustees or its designee, in accordance with procedures adopted by the Board of Trustees. Circumstances that may cause the fund to use these procedures to value a security include, but are not limited to: a security has been declared in default; trading in a security has been halted during the trading day; there is a foreign market holiday and no trading occurred; or an event occurred between the close of a foreign exchange and the NYSE that may affect the value of a security.
Security Transactions — Security transactions are accounted for as of the trade date. Net realized gains and losses are determined on the identified cost basis, which is also used for federal income tax purposes.
Investment Income — Interest income is recorded on the accrual basis and includes paydown gain (loss) and accretion of discounts and amortization of premiums. Inflation adjustments related to inflation-linked debt securities are reflected as interest income.
Forward Commitments — The fund may engage in securities transactions on a forward commitment basis. In these transactions, the securities’ prices and yields are fixed on the date of the commitment. The fund may sell a to-be-announced (TBA) security and at the same time make a commitment to purchase the same security at a future date at a specified price. Conversely, the fund may purchase a TBA security and at the same time make a commitment to sell the same security at a future date at a specified price. These types of transactions are known as “TBA roll” transactions and are accounted for as purchases and sales. The fund will segregate cash, cash equivalents or other appropriate liquid securities on its records in amounts sufficient to meet the purchase price.
Repurchase Agreements — The fund may enter into repurchase agreements with institutions that American Century Investment Management, Inc. (ACIM) (the investment advisor) has determined are creditworthy pursuant to criteria adopted by the Board of Trustees. The fund requires that the collateral, represented by securities, received in a repurchase transaction be transferred to the custodian in a manner sufficient to enable the fund to obtain those securities in the event of a default under the repurchase agreement. ACIM monitors, on a daily basis, the securities transferred to ensure the value, including accrued interest, of the securities under each repurchase agreement is equal to or greater than amounts owed to the fund under each repurchase agreement.
Joint Trading Account — Pursuant to an Exemptive Order issued by the Securities and Exchange Commission, the fund, along with certain other funds in the American Century Investments family of funds, may transfer uninvested cash balances into a joint trading account. These balances are invested in one or more repurchase agreements that are collateralized by U.S. Treasury or Agency obligations.
Segregated Assets — In accordance with the 1940 Act, the fund segregates assets on its books and records to cover certain types of investments, including, but not limited to, futures contracts, forward commitments, when-issued securities, swap agreements and certain forward foreign currency exchange contracts. ACIM monitors, on a daily basis, the securities segregated to ensure the fund designates a sufficient amount of liquid assets, marked-to-market daily. The fund may also receive assets or be required to pledge assets at the custodian bank or with a broker for margin requirements on futures contracts and swap agreements.
Income Tax Status — It is the fund’s policy to distribute substantially all net investment income and net realized gains to shareholders and to otherwise qualify as a regulated investment company under provisions of the Internal Revenue Code. Accordingly, no provision has been made for income taxes. The fund files U.S. federal, state, local and non-U.S. tax returns as applicable. The fund’s tax returns are subject to examination by the relevant taxing authority until expiration of the applicable statute of limitations, which is generally three years from the date of filing but can be longer in certain jurisdictions. At this time, management believes there are no uncertain tax positions which, based on their technical merit, would not be sustained upon examination and for which it is reasonably possible that the total amounts of unrecognized tax benefits will significantly change in the next twelve months.
Multiple Class — All shares of the fund represent an equal pro rata interest in the net assets of the class to which such shares belong, and have identical voting, dividend, liquidation and other rights and the same terms and conditions, except for class specific expenses and exclusive rights to vote on matters affecting only individual classes. Income, non-class specific expenses, and realized and unrealized capital gains and losses of the fund are allocated to each class of shares based on their relative net assets.
Distributions to Shareholders — Distributions from net investment income are declared daily and paid monthly. Distributions from net realized gains, if any, are generally declared and paid annually.
Indemnifications — Under the trust’s organizational documents, its officers and trustees are indemnified against certain liabilities arising out of the performance of their duties to the fund. In addition, in the normal course of business, the fund enters into contracts that provide general indemnifications. The maximum exposure under these arrangements is unknown as this would involve future claims that may be made against a fund. The risk of material loss from such claims is considered by management to be remote.
3. Fees and Transactions with Related Parties
Management Fees — The trust has entered into a management agreement with ACIM, under which ACIM provides the fund with investment advisory and management services in exchange for a single, unified management fee (the fee) per class. The agreement provides that all expenses of managing and operating the fund, except distribution and service fees, brokerage expenses, taxes, interest, fees and expenses of the independent trustees (including legal counsel fees), and extraordinary expenses, will be paid by ACIM. The fee is computed and accrued daily based on each class’s daily net assets and paid monthly in arrears. The fee consists of (1) an Investment Category Fee based on the daily net assets of the fund and certain other accounts managed by the investment advisor that are in the same broad investment category as the fund and (2) a Complex Fee based on the assets of all the funds in the American Century Investments family of funds. The rates for the Investment Category Fee range from 0.2425% to 0.3600%. The rates for the Complex Fee range from 0.2500% to 0.3100% for the Investor Class, A Class, C Class and R Class. The Institutional Class is 0.2000% less at each point within the Complex Fee range. The effective annual management fee for each class for the year ended March 31, 2013 was 0.54% for the Investor Class, A Class, C Class and R Class and 0.34% for the Institutional Class.
Distribution and Service Fees — The Board of Trustees has adopted a separate Master Distribution and Individual Shareholder Services Plan for each of the A Class, C Class and R Class (collectively the plans), pursuant to Rule 12b-1 of the 1940 Act. The plans provide that the A Class will pay American Century Investment Services, Inc. (ACIS) an annual distribution and service fee of 0.25%. The plans provide that the C Class will pay ACIS an annual distribution and service fee of 1.00%, of which 0.25% is paid for individual shareholder services and 0.75% is paid for distribution services. The plans provide that the R Class will pay ACIS an annual distribution and service fee of 0.50%. The fees are computed and accrued daily based on each class’s daily net assets and paid monthly in arrears. The fees are used to pay financial intermediaries for distribution and individual shareholder services. Fees incurred under the plans during the year ended March 31, 2013 are detailed in the Statement of Operations.
Related Parties — Certain officers and trustees of the trust are also officers and/or directors of American Century Companies, Inc. (ACC). The trust’s investment advisor, ACIM, the trust’s distributor, ACIS, and the trust’s transfer agent, American Century Services, LLC are wholly owned, directly or indirectly, by ACC.
4. Investment Transactions
Purchases and sales of investment securities, excluding short-term investments, for the year ended March 31, 2013 were $5,379,142,229 and $5,129,500,461, respectively, all of which are U.S. Treasury and Government Agency obligations.
5. Capital Share Transactions
Transactions in shares of the fund were as follows (unlimited number of shares authorized):
| | Year ended March 31, 2013 | | | Year ended March 31, 2012 | |
| | Shares | | | Amount | | | Shares | | | Amount | |
| Investor Class | | | | | | | | | | | |
| Sold | | 30,698,604 | | | | $344,172,051 | | | | 36,710,423 | | | | $411,082,724 | |
| Issued in reinvestment of distributions | | 3,968,380 | | | | 44,469,309 | | | | 4,178,200 | | | | 46,627,670 | |
| Redeemed | | (38,153,546 | ) | | | (426,428,355 | ) | | | (28,015,057 | ) | | | (312,254,964 | ) |
| | | (3,486,562 | ) | | | (37,786,995 | ) | | | 12,873,566 | | | | 145,455,430 | |
| Institutional Class | | | | | | | | | | | | | | | |
| Sold | | 3,281,578 | | | | 36,802,821 | | | | 2,966,108 | | | | 33,268,040 | |
| Issued in reinvestment of distributions | | 160,623 | | | | 1,798,543 | | | | 67,053 | | | | 745,895 | |
| Redeemed | | (1,445,336 | ) | | | (16,154,490 | ) | | | (571,843 | ) | | | (6,409,113 | ) |
| | | 1,996,865 | | | | 22,446,874 | | | | 2,461,318 | | | | 27,604,822 | |
| A Class | | | | | | | | | | | | | | | |
| Sold | | 14,185,039 | | | | 159,064,739 | | | | 16,169,635 | | | | 181,093,952 | |
| Issued in reinvestment of distributions | | 691,330 | | | | 7,743,943 | | | | 563,341 | | | | 6,299,798 | |
| Redeemed | | (9,184,049 | ) | | | (102,570,340 | ) | | | (9,594,168 | ) | | | (107,350,460 | ) |
| | | 5,692,320 | | | | 64,238,342 | | | | 7,138,808 | | | | 80,043,290 | |
| C Class | | | | | | | | | | | | | | | |
| Sold | | 2,301,065 | | | | 25,785,632 | | | | 1,049,960 | | | | 11,742,745 | |
| Issued in reinvestment of distributions | | 33,009 | | | | 369,412 | | | | 12,400 | | | | 138,720 | |
| Redeemed | | (566,207 | ) | | | (6,321,424 | ) | | | (69,632 | ) | | | (779,938 | ) |
| | | 1,767,867 | | | | 19,833,620 | | | | 992,728 | | | | 11,101,527 | |
| R Class | | | | | | | | | | | | | | | |
| Sold | | 194,241 | | | | 2,174,176 | | | | 258,680 | | | | 2,889,920 | |
| Issued in reinvestment of distributions | | 10,668 | | | | 119,466 | | | | 9,339 | | | | 104,245 | |
| Redeemed | | (162,047 | ) | | | (1,812,864 | ) | | | (136,724 | ) | | | (1,523,405 | ) |
| | | 42,862 | | | | 480,778 | | | | 131,295 | | | | 1,470,760 | |
| Net increase (decrease) | | 6,013,352 | | | | $69,212,619 | | | | 23,597,715 | | | | $265,675,829 | |
6. Fair Value Measurements
The fund’s securities valuation process is based on several considerations and may use multiple inputs to determine the fair value of the positions held by the fund. In conformity with accounting principles generally accepted in the United States of America, the inputs used to determine a valuation are classified into three broad levels as follows:
| • | Level 1 valuation inputs consist of unadjusted quoted prices in an active market for identical securities; |
| • | Level 2 valuation inputs consist of direct or indirect observable market data (including quoted prices for similar securities, evaluations of subsequent market events, interest rates, prepayment speeds, credit risk, etc.); or |
| • | Level 3 valuation inputs consist of unobservable data (including a fund’s own assumptions). |
The level classification is based on the lowest level input that is significant to the fair valuation measurement. The valuation inputs are not necessarily an indication of the risks associated with investing in these securities or other financial instruments.
The following is a summary of the level classifications as of period end. The Schedule of Investments provides additional information on the fund’s portfolio holdings.
| | Level 1 | | | Level 2 | | | Level 3 | |
| Investment Securities | | | | | | | | |
| U.S. Government Agency Mortgage-Backed Securities | | — | | | | $1,931,131,217 | | | | — | |
| U.S. Government Agency Collateralized Mortgage Obligations | | — | | | | 211,883,615 | | | | — | |
| U.S. Treasury Securities | | — | | | | 100,078,140 | | | | — | |
| Temporary Cash Investments | | $76,742,588 | | | | 114,415,680 | | | | — | |
| Total Value of Investment Securities | | $76,742,588 | | | | $2,357,508,652 | | | | — | |
| | | | | | | | | | | | |
| Other Financial Instruments | | | | | | | | | | | |
| Total Unrealized Gain (Loss) on Futures Contracts | | $118,793 | | | | — | | | | — | |
7. Derivative Instruments
Interest Rate Risk — The fund is subject to interest rate risk in the normal course of pursuing its investment objectives. The value of bonds generally declines as interest rates rise. A fund may enter into futures contracts based on a bond index or a specific underlying security. A fund may purchase futures contracts to gain exposure to increases in market value or sell futures contracts to protect against a decline in market value. Upon entering into a futures contract, a fund will segregate cash, cash equivalents or other appropriate liquid securities on its records in amounts sufficient to meet requirements. Subsequent payments (variation margin) are made or received daily, in cash, by a fund. The variation margin is equal to the daily change in the contract value and is recorded as unrealized gains and losses. A fund recognizes a realized gain or loss when the futures contract is closed or expires. Net realized and unrealized gains or losses occurring during the holding period of futures contracts are a component of net realized gain (loss) on futures contract transactions and change in net unrealized appreciation (depreciation) on futures contracts, respectively. One of the risks of entering into futures contracts is the possibility that the change in value of the contract may not correlate with the changes in value of the underlying securities. The fund regularly purchased and sold interest rate risk derivative instruments throughout the reporting period and the instruments held at period end as disclosed on the Schedule of Investments are indicative of the fund’s typical volume.
The value of interest rate risk derivative instruments as of March 31, 2013, is disclosed on the Statement of Assets and Liabilities as a liability of $28,969 in payable for variation margin on futures contracts.* For the year ended March 31, 2013, the effect of interest rate risk derivative instruments on the Statement of Operations was $(782,673) in net realized gain (loss) on futures contract transactions and $(53,437) in change in net unrealized appreciation (depreciation) on futures contracts.
*Included in the unrealized gain (loss) on futures contracts as reported in the Schedule of Investments.
8. Risk Factors
The fund’s investment process may result in high portfolio turnover, which could mean high transaction costs, affecting both performance and capital gains tax liabilities to investors.
9. Federal Tax Information
The tax character of distributions paid during the years ended March 31, 2013 and
March 31, 2012 were as follows:
| | | 2013 | | | 2012 | |
| Distributions Paid From | | | | | | |
| Ordinary income | | | $61,238,508 | | | | $60,495,198 | |
| Long-term capital gains | | | — | | | | — | |
The book-basis character of distributions made during the year from net investment income or net realized gains may differ from their ultimate characterization for federal income tax purposes. These differences reflect the differing character of certain income items and net realized gains and losses for financial statement and tax purposes, and may result in reclassification among certain capital accounts on the financial statements.
As of March 31, 2013, the federal tax cost of investments and the components of distributable earnings on a tax-basis were as follows:
| Federal tax cost of investments | | | $2,380,511,431 | |
| Gross tax appreciation of investments | | | $57,909,585 | |
| Gross tax depreciation of investments | | | (4,169,776 | ) |
| Net tax appreciation (depreciation) of investments | | | $53,739,809 | |
| Undistributed ordinary income | | | $53,084 | |
| Accumulated short-term capital losses | | | $(908,883 | ) |
| Post-October capital loss deferral | | | $(6,960,883 | ) |
The difference between book-basis and tax-basis unrealized appreciation (depreciation) is attributable primarily to the tax deferral of losses on wash sales.
Accumulated capital losses represent net capital loss carryovers that may be used to offset future realized capital gains for federal income tax purposes. Future capital loss carryover utilization in any given year may be subject to Internal Revenue Code limitations. Capital loss carryovers expire in 2015.
Loss deferrals represent certain qualified losses that the fund has elected to treat as having been incurred in the following fiscal year for federal income tax purposes.
| For a Share Outstanding Throughout the Years Ended March 31 (except as noted) |
| Per-Share Data | Ratios and Supplemental Data |
| | | Income From Investment Operations: | | | | Ratio to Average Net Assets of: | | |
| | Net Asset Value, Beginning of Period | Net Investment Income (Loss)(1) | Net Realized and Unrealized Gain (Loss) | Total From Investment Operations | Distributions From Net Investment Income | Net Asset Value, End of Period | Total Return(2) | Operating Expenses | Operating Expenses (before expense waiver) | Net Investment Income (Loss) | Net Investment Income (Loss) (before expense waiver) | Portfolio Turnover Rate | Net Assets, End of Period (in thousands) |
| Investor Class |
| 2013 | $11.21 | 0.25 | (0.01) | 0.24 | (0.35) | $11.10 | 2.16% | 0.55% | 0.55% | 2.26% | 2.26% | 237% | $1,519,666 |
| 2012 | $10.84 | 0.35 | 0.42 | 0.77 | (0.40) | $11.21 | 7.15% | 0.55% | 0.56% | 3.12% | 3.11% | 130% | $1,574,686 |
| 2011 | $10.76 | 0.39 | 0.13 | 0.52 | (0.44) | $10.84 | 4.90% | 0.53% | 0.56% | 3.57% | 3.54% | 100% | $1,382,165 |
| 2010 | $10.68 | 0.40 | 0.14 | 0.54 | (0.46) | $10.76 | 5.12% | 0.54% | 0.56% | 3.69% | 3.67% | 171% | $1,414,742 |
| 2009 | $10.40 | 0.43 | 0.30 | 0.73 | (0.45) | $10.68 | 7.22% | 0.53% | 0.57% | 4.12% | 4.08% | 330% | $1,336,491 |
| Institutional Class |
| 2013 | $11.21 | 0.27 | (0.01) | 0.26 | (0.37) | $11.10 | 2.36% | 0.35% | 0.35% | 2.46% | 2.46% | 237% | $62,075 |
| 2012 | $10.83 | 0.37 | 0.43 | 0.80 | (0.42) | $11.21 | 7.47% | 0.35% | 0.36% | 3.32% | 3.31% | 130% | $40,336 |
| 2011 | $10.76 | 0.41 | 0.13 | 0.54 | (0.47) | $10.83 | 5.02% | 0.33% | 0.36% | 3.77% | 3.74% | 100% | $12,313 |
| 2010 | $10.68 | 0.42 | 0.14 | 0.56 | (0.48) | $10.76 | 5.33% | 0.34% | 0.36% | 3.89% | 3.87% | 171% | $17,971 |
| 2009 | $10.40 | 0.45 | 0.30 | 0.75 | (0.47) | $10.68 | 7.44% | 0.33% | 0.37% | 4.32% | 4.28% | 330% | $8,016 |
| For a Share Outstanding Throughout the Years Ended March 31 (except as noted) |
| Per-Share Data | Ratios and Supplemental Data |
| | | Income From Investment Operations: | | | | Ratio to Average Net Assets of: | | |
| | Net Asset Value, Beginning of Period | Net Investment Income (Loss)(1) | Net Realized and Unrealized Gain (Loss) | Total From Investment Operations | Distributions From Net Investment Income | Net Asset Value, End of Period | Total Return(2) | Operating Expenses | Operating Expenses (before expense waiver) | Net Investment Income (Loss) | Net Investment Income (Loss) (before expense waiver) | Portfolio Turnover Rate | Net Assets, End of Period (in thousands) |
A Class(3) |
| 2013 | $11.21 | 0.22 | (0.01) | 0.21 | (0.32) | $11.10 | 1.90% | 0.80% | 0.80% | 2.01% | 2.01% | 237% | $310,736 |
| 2012 | $10.84 | 0.32 | 0.42 | 0.74 | (0.37) | $11.21 | 6.89% | 0.80% | 0.81% | 2.87% | 2.86% | 130% | $250,169 |
| 2011 | $10.76 | 0.36 | 0.14 | 0.50 | (0.42) | $10.84 | 4.64% | 0.78% | 0.81% | 3.32% | 3.29% | 100% | $164,395 |
| 2010 | $10.68 | 0.37 | 0.14 | 0.51 | (0.43) | $10.76 | 4.86% | 0.79% | 0.81% | 3.44% | 3.42% | 171% | $158,819 |
| 2009 | $10.40 | 0.40 | 0.30 | 0.70 | (0.42) | $10.68 | 6.96% | 0.78% | 0.82% | 3.87% | 3.83% | 330% | $146,874 |
| C Class |
| 2013 | $11.21 | 0.14 | (0.01) | 0.13 | (0.24) | $11.10 | 1.14% | 1.55% | 1.55% | 1.26% | 1.26% | 237% | $33,287 |
| 2012 | $10.84 | 0.23 | 0.43 | 0.66 | (0.29) | $11.21 | 6.09% | 1.55% | 1.56% | 2.12% | 2.11% | 130% | $13,809 |
| 2011 | $10.76 | 0.28 | 0.13 | 0.41 | (0.33) | $10.84 | 3.87% | 1.53% | 1.56% | 2.57% | 2.54% | 100% | $2,587 |
2010(4) | $10.78 | 0.02 | (0.01) | 0.01 | (0.03) | $10.76 | 0.08% | 1.54%(5) | 1.56%(5) | 2.72%(5) | 2.70%(5) | 171%(6) | $25 |
| R Class |
| 2013 | $11.21 | 0.20 | (0.03) | 0.17 | (0.29) | $11.09 | 1.56% | 1.05% | 1.05% | 1.76% | 1.76% | 237% | $4,773 |
| 2012 | $10.83 | 0.29 | 0.43 | 0.72 | (0.34) | $11.21 | 6.72% | 1.05% | 1.06% | 2.62% | 2.61% | 130% | $4,343 |
| 2011 | $10.76 | 0.34 | 0.12 | 0.46 | (0.39) | $10.83 | 4.29% | 1.03% | 1.06% | 3.07% | 3.04% | 100% | $2,775 |
| 2010 | $10.68 | 0.34 | 0.14 | 0.48 | (0.40) | $10.76 | 4.58% | 1.04% | 1.06% | 3.19% | 3.17% | 171% | $1,820 |
| 2009 | $10.40 | 0.36 | 0.32 | 0.68 | (0.40) | $10.68 | 6.69% | 1.03% | 1.07% | 3.62% | 3.58% | 330% | $556 |
Notes to Financial Highlights
| (1) | Computed using average shares outstanding throughout the period. |
| (2) | Total returns are calculated based on the net asset value of the last business day and do not reflect applicable sales charges, if any. Total returns for periods less than one year are not annualized. |
| (3) | Prior to March 1, 2010, the A Class was referred to as the Advisor Class. |
| (4) | March 1, 2010 (commencement of sale) through March 31, 2010. |
| (6) | Portfolio turnover is calculated at the fund level. Percentage indicated was calculated for the year ended March 31, 2010. |
See Notes to Financial Statements.
Report of Independent Registered Public Accounting Firm |
To the Trustees of the American Century Government Income Trust
and Shareholders of the Ginnie Mae Fund:
In our opinion, the accompanying statement of assets and liabilities, including the schedule of investments, and the related statements of operations and of changes in net assets and the financial highlights present fairly, in all material respects, the financial position of the Ginnie Mae Fund (one of the five funds comprising the American Century Government Income Trust, hereafter referred to as the “Fund”) at March 31, 2013, the results of its operations for the year then ended, the changes in its net assets for each of the two years in the period then ended and the financial highlights for each of the periods presented, in conformity with accounting principles generally accepted in the United States of America. These financial statements and financial highlights (hereafter referred to as “financial statements”) are the responsibility of the Fund’s management; our responsibility is to express an opinion on these financial statements based on our audits. We conducted our audits of these financial statements in accordance with the standards of the Public Company Accounting Oversight Board (United States). Those standards require that we plan and perform the audit to obtain reasonable assurance about whether the financial statements are free of material misstatement. An audit includes examining, on a test basis, evidence supporting the amounts and disclosures in the financial statements, assessing the accounting principles used and significant estimates made by management, and evaluating the overall financial statement presentation. We believe that our audits, which included confirmation of securities at March 31, 2013 by correspondence with the custodian and brokers, provide a reasonable basis for our opinion.
PricewaterhouseCoopers LLP
Kansas City, Missouri
May 21, 2013
Board of Trustees
The individuals listed below serve as trustees of the funds. Each trustee will continue to serve in this capacity until death, retirement, resignation or removal from office. The board has adopted a mandatory retirement age for trustees who are not “interested persons,” as that term is defined in the Investment Company Act (independent trustees). Independent trustees shall retire on December 31 of the year in which they reach their 75th birthday; provided, however, that on or after January 1, 2022, independent trustees shall retire on December 31 of the year in which they reach their 76th birthday.
Mr. Thomas is the only trustee who is an “interested person” because he currently serves as President and Chief Executive Officer of American Century Companies, Inc. (ACC), the parent company of American Century Investment Management, Inc. (ACIM or the advisor).
The other trustees (more than three-fourths of the total number) are independent; that is, they have never been employees, directors or officers of, and have no financial interest in, ACC or any of its wholly owned, direct or indirect, subsidiaries, including ACIM, American Century Investment Services, Inc. (ACIS) and American Century Services, LLC (ACS). The trustees serve in this capacity for eight (in the case of Mr. Thomas, 15) registered investment companies in the American Century Investments family of funds.
The following table presents additional information about the trustees. The mailing address for each trustee other than Mr. Thomas is 1665 Charleston Road, Mountain View, California 94043. The mailing address for Mr. Thomas is 4500 Main Street, Kansas City, Missouri 64111.
Name (Year of Birth) | Position(s) Held with Funds | Length of Time Served | Principal Occupation(s) During Past 5 Years | | Number of American Century Portfolios Overseen by Trustee | Other Directorships Held During Past 5 Years |
| Independent Trustees |
Tanya S. Beder (1955) | Trustee | Since 2011 | Chairman, SBCC Group Inc. (independent advisory services) (2006 to present) | | 42 | CYS Investments, Inc. (specialty finance company) |
Jeremy I. Bulow (1954) | Trustee | Since 2011 | Professor of Economics, Stanford University, Graduate School of Business (1979 to present) | | 42 | None |
Ronald J. Gilson (1946) | Trustee and Chairman of the Board | Since 1995 | Charles J. Meyers Professor of Law and Business, Stanford Law School (1979 to present); Marc and Eva Stern Professor of Law and Business, Columbia University School of Law (1992 to present) | | 42 | None |
Frederick L. A. Grauer (1946) | Trustee | Since 2008 | Senior Advisor, BlackRock, Inc. (investment management firm) (2010 to 2011); Senior Advisor, Barclays Global Investors (investment management firm) (2003 to 2009) | | 42 | None |
Name (Year of Birth) | Position(s) Held with Funds | Length of Time Served | Principal Occupation(s) During Past 5 Years | | Number of American Century Portfolios Overseen by Trustee | Other Directorships Held During Past 5 Years |
| Independent Trustees |
Peter F. Pervere (1947) | Trustee | Since 2007 | Retired | | 42 | Intraware, Inc. (2003 to 2009) |
Myron S. Scholes (1941) | Trustee | Since 1980 | Chairman, Platinum Grove Asset Management, L.P. (asset manager) (1999 to 2009); Frank E. Buck Professor of Finance-Emeritus, Stanford Graduate School of Business (1996 to present) | | 42 | Dimensional Fund Advisors (investment advisor); CME Group, Inc. (futures and options exchange) |
John B. Shoven (1947) | Trustee | Since 2002 | Professor of Economics, Stanford University (1973 to present) | | 42 | Cadence Design Systems; Exponent; Financial Engines |
| |
| Interested Trustee |
Jonathan S. Thomas (1963) | Trustee and President | Since 2007 | President and Chief Executive Officer, ACC (March 2007 to present). Also serves as Chief Executive Officer and Manager, ACS; Executive Vice President, ACIM; Director, ACC, ACIM and other ACC subsidiaries | | 107 | None |
Officers
The following table presents certain information about the executive officers of the funds. Each officer serves as an officer for each of the 15 investment companies in the American Century family of funds, unless otherwise noted. No officer is compensated for his or her service as an officer of the funds. The listed officers are interested persons of the funds and are appointed or re-appointed on an annual basis. The mailing address for each of the officers listed below is 4500 Main Street, Kansas City, Missouri 64111.
Name (Year of Birth) | Offices with the Funds | Principal Occupation(s) During the Past Five Years |
Jonathan S. Thomas (1963) | Trustee and President since 2007 | President and Chief Executive Officer, ACC (March 2007 to present). Also serves as Chief Executive Officer and Manager, ACS; Executive Vice President, ACIM; Director, ACC, ACIM and other ACC subsidiaries |
Maryanne L. Roepke (1956) | Chief Compliance Officer since 2006 and Senior Vice President since 2000 | Chief Compliance Officer, American Century funds, ACIM and ACS (August 2006 to present). Also serves as Senior Vice President, ACS |
Charles A. Etherington (1957) | General Counsel since 2007 and Senior Vice President since 2006 | Attorney, ACC (February 1994 to present); Vice President, ACC (November 2005 to present); General Counsel, ACC (March 2007 to present). Also serves as General Counsel, ACIM, ACS, ACIS and other ACC subsidiaries; and Senior Vice President, ACIM and ACS |
C. Jean Wade (1964) | Vice President, Treasurer and Chief Financial Officer since 2012 | Vice President, ACS (February 2000 to present) |
Robert J. Leach (1966) | Vice President since 2006 and Assistant Treasurer since 2012 | Vice President, ACS (February 2000 to present) |
David H. Reinmiller (1963) | Vice President since 2001 | Attorney, ACC (January 1994 to present); Associate General Counsel, ACC (January 2001 to present). Also serves as Vice President, ACIM and ACS |
Ward D. Stauffer (1960) | Secretary since 2005 | Attorney, ACC (June 2003 to present) |
The Statement of Additional Information has additional information about the fund’s trustees and is available without charge, upon request, by calling 1-800-345-2021.
Retirement Account Information
As required by law, distributions you receive from certain IRAs are subject to federal income tax withholding, unless you elect not to have withholding apply. Tax will be withheld on the total amount withdrawn even though you may be receiving amounts that are not subject to withholding, such as nondeductible contributions. In such case, excess amounts of withholding could occur. You may adjust your withholding election so that a greater or lesser amount will be withheld.
If you don’t want us to withhold on this amount, you must notify us to not withhold the federal income tax. You may notify us in writing or in certain situations by telephone or through other electronic means. For systematic withdrawals, your withholding election will remain in effect until revoked or changed by filing a new election. You have the right to revoke your election at any time.
Remember, even if you elect not to have income tax withheld, you are liable for paying income tax on the taxable portion of your withdrawal. If you elect not to have income tax withheld or you don’t have enough income tax withheld, you may be responsible for payment of estimated tax. You may incur penalties under the estimated tax rules if your withholding and estimated tax payments are not sufficient. You can reduce or defer the income tax on a distribution by directly or indirectly rolling such distribution over to another IRA or eligible plan. You should consult your tax advisor for additional information.
State tax will be withheld if, at the time of your distribution, your address is within one of the mandatory withholding states and you have federal income tax withheld (or as otherwise required by state law). State taxes will be withheld from your distribution in accordance with the respective state rules.
Distributions you receive from 403(b), 457 and qualified plans are subject to special tax and withholding rules. Your plan administrator or plan sponsor is required to provide you with a special tax notice explaining those rules at the time you request a distribution. If applicable, federal and/or state taxes may be withheld from your distribution amount.
Proxy Voting Guidelines
American Century Investment Management, Inc., the fund’s investment advisor, is responsible for exercising the voting rights associated with the securities purchased and/or held by the fund. A description of the policies and procedures the advisor uses in fulfilling this responsibility is available without charge, upon request, by calling 1-800-345-2021. It is also available on American Century Investments’ website at americancentury.com and on the Securities and Exchange Commission’s website at sec.gov. Information regarding how the investment advisor voted proxies relating to portfolio securities during the most recent 12-month period ended June 30 is available on the “About Us” page at americancentury.com. It is also available at sec.gov.
Quarterly Portfolio Disclosure
The fund files its complete schedule of portfolio holdings with the Securities and Exchange Commission (SEC) for the first and third quarters of each fiscal year on Form N-Q. The fund’s Forms N-Q are available on the SEC’s website at sec.gov, and may be reviewed and copied at the SEC’s Public Reference Room in Washington, DC. Information on the operation of the Public Reference Room may be obtained by calling 1-800-SEC-0330. The fund also makes its complete schedule of portfolio holdings for the most recent quarter of its fiscal year available on its website at americancentury.com and, upon request, by calling 1-800-345-2021.
| Contact Us | americancentury.com |
| Automated Information Line | 1-800-345-8765 |
| Investor Services Representative | 1-800-345-2021 or 816-531-5575 |
| Investors Using Advisors | 1-800-378-9878 |
Business, Not-For-Profit, Employer-Sponsored Retirement Plans | 1-800-345-3533 |
Banks and Trust Companies, Broker-Dealers, Financial Professionals, Insurance Companies | 1-800-345-6488 |
| Telecommunications Device for the Deaf | 1-800-634-4113 |
American Century Government Income Trust
Investment Advisor:
American Century Investment Management, Inc.
Kansas City, Missouri
This report and the statements it contains are submitted for the general information of our shareholders. The report is not authorized for distribution to prospective investors unless preceded or accompanied by an effective prospectus.
©2013 American Century Proprietary Holdings, Inc. All rights reserved.
CL-ANN-78339 1305
ITEM 2. CODE OF ETHICS.
| (a) | The registrant has adopted a Code of Ethics for Senior Financial Officers that applies to the registrant’s principal executive officer, principal financial officer, principal accounting officer, and persons performing similar functions. |
| (f) | The registrant’s Code of Ethics for Senior Financial Officers was filed as Exhibit 12 (a)(1) to American Century Asset Allocation Portfolios, Inc.’s Annual Certified Shareholder Report on Form N-CSR, File No. 811-21591, on September 29, 2005, and is incorporated herein by reference. |
ITEM 3. AUDIT COMMITTEE FINANCIAL EXPERT.
| (a)(1) | The registrant's board has determined that the registrant has at least one audit committee financial expert serving on its audit committee. |
| (a)(2) | Tanya S. Beder, Peter F. Pervere and Ronald J. Gilson are the registrant's designated audit committee financial experts. They are "independent" as defined in Item 3 of Form N-CSR. |
ITEM 4. PRINCIPAL ACCOUNTANT FEES AND SERVICES.
The aggregate fees billed for each of the last two fiscal years for professional services rendered by the principal accountant for the audit of the registrant’s annual financial statements or services that are normally provided by the accountant in connection with statutory and regulatory filings or engagements for those fiscal years were as follows:
FY 2012: $119,767
FY 2013: $156,409
The aggregate fees billed in each of the last two fiscal years for assurance and related services by the principal accountant that are reasonably related to the performance of the audit of the registrant’s financial statements and are not reported under paragraph (a) of this Item were as follows:
| | For services rendered to the registrant: |
Fees required to be approved pursuant to paragraph (c)(7)(ii) of Rule 2-01 of Regulation S-X (relating to certain engagements for non-audit services with the registrant’s investment adviser and its affiliates):
The aggregate fees billed in each of the last two fiscal years for professional services rendered by the principal accountant for tax compliance, tax advice, and tax planning were as follows:
| | For services rendered to the registrant: |
FY 2012: $0
FY 2013: $0
Fees required to be approved pursuant to paragraph (c)(7)(ii) of Rule 2-01 of Regulation S-X (relating to certain engagements for non-audit services with the registrant’s investment adviser and its affiliates):
FY 2012: $0
FY 2013: $0
The aggregate fees billed in each of the last two fiscal years for products and services provided by the principal accountant, other than the services reported in paragraphs (a) through (c) of this Item were as follows:
| | For services rendered to the registrant: |
Fees required to be approved pursuant to paragraph (c)(7)(ii) of Rule 2-01 of Regulation S-X (relating to certain engagements for non-audit services with the registrant’s investment adviser and its affiliates):
| (e)(1) | In accordance with paragraph (c)(7)(i)(A) of Rule 2-01 of Regulation S-X, before the accountant is engaged by the registrant to render audit or non-audit services, the engagement is approved by the registrant’s audit committee. Pursuant to paragraph (c)(7)(ii) of Rule 2-01 of Regulation S-X, the registrant’s audit committee also pre-approves its accountant’s engagements for non-audit services with the registrant’s investment adviser, its parent company, and any entity controlled by, or under common control with the investment adviser that provides ongoing services to the registrant, if the engagement relates directly to the operations and financial reporting of the registrant. |
| (e)(2) | All services described in each of paragraphs (b) through (d) of this Item were pre-approved before the engagement by the registrant’s audit committee pursuant to paragraph (c)(7)(i)(A) of Rule 2-01 of Regulation S-X. Consequently, none of such services were required to be approved by the audit committee pursuant to paragraph (c)(7)(i)(C). |
| (f) | The percentage of hours expended on the principal accountant’s engagement to audit the registrant’s financial statements for the most recent fiscal year that were attributed to work performed by persons other than the principal accountant’s full-time, permanent employees was less than 50%. |
| (g) | The aggregate non-audit fees billed by the registrant’s accountant for services rendered to the registrant, and rendered to the registrant’s investment adviser (not including any sub-adviser whose role is primarily portfolio management and is subcontracted with or overseen by another investment adviser), and any entity controlling, controlled by, or under common control with the adviser that provides ongoing services to the registrant for each of the last two fiscal years of the registrant were as follows: |
FY 2012: $214,108
FY 2013: $136,896
| (h) | The registrant’s investment adviser and accountant have notified the registrant’s audit committee of all non-audit services that were rendered by the registrant’s accountant to the registrant’s investment adviser, its parent company, and any entity controlled by, or under common control with the investment adviser that provides services to the registrant, which services were not required to be pre-approved pursuant to paragraph (c)(7)(ii) of Rule 2-01 of Regulation S-X. The notification provided to the registrant’s audit committee included sufficient details regarding such services to allow the registrant’s audit committee to consider the continuing independence of its principal accountant. |
ITEM 5. AUDIT COMMITTEE OF LISTED REGISTRANTS.
Not applicable.
ITEM 6. INVESTMENTS.
| (a) | The schedule of investments is included as part of the report to stockholders filed under Item 1 of this Form. |
ITEM 7. DISCLOSURE OF PROXY VOTING POLICIES AND PROCEDURES FOR CLOSED-END MANAGEMENT INVESTMENT COMPANIES.
Not applicable.
ITEM 8. PORTFOLIO MANAGERS OF CLOSED-END MANAGEMENT INVESTMENT COMPANIES.
Not applicable.
ITEM 9. PURCHASES OF EQUITY SECURITIES BY CLOSED-END MANAGEMENT INVESTMENT COMPANY AND AFFILIATED PURCHASERS.
Not applicable.
ITEM 10. SUBMISSION OF MATTERS TO A VOTE OF SECURITY HOLDERS.
During the reporting period, there were no material changes to the procedures by which shareholders may recommend nominees to the registrant’s board.
ITEM 11. CONTROLS AND PROCEDURES.
| (a) | The registrant's principal executive officer and principal financial officer have concluded that the registrant's disclosure controls and procedures (as defined in Rule 30a-3(c) under the Investment Company Act of 1940) are effective based on their evaluation of these controls and procedures as of a date within 90 days of the filing date of this report. |
| (b) | There were no changes in the registrant's internal control over financial reporting (as defined in Rule 30a-3(d) under the Investment Company Act of 1940) that occurred during the registrant's second fiscal quarter of the period covered by this report that have materially affected, or are reasonably likely to materially affect, the registrant's internal control over financial reporting. |
ITEM 12. EXHIBITS.
| (a)(1) | Registrant’s Code of Ethics for Senior Financial Officers, which is the subject of the disclosure required by Item 2 of Form N-CSR, was filed as Exhibit 12(a)(1) to American Century Asset Allocation Portfolios, Inc.’s Certified Shareholder Report on Form N-CSR, File No. 811-21591, on September 29, 2005. |
| (a)(2) | Separate certifications by the registrant’s principal executive officer and principal financial officer, pursuant to Section 302 of the Sarbanes-Oxley Act of 2002 and Rule 30a-2(a) under the Investment Company Act of 1940, are filed and attached hereto as EX-99.CERT. |
| (b) | A certification by the registrant’s chief executive officer and chief financial officer, pursuant to Section 906 of the Sarbanes-Oxley Act of 2002, is furnished and attached hereto as EX-99.906CERT. |
Pursuant to the requirements of the Securities Exchange Act of 1934 and the Investment Company Act of 1940, the registrant has duly caused this report to be signed on its behalf by the undersigned, thereunto duly authorized.
| Registrant: | American Century Government Income Trust | |
| | | | |
| | | | |
| By: | /s/ Jonathan S. Thomas | |
| | Name: | Jonathan S. Thomas | |
| | Title: | President | |
| | | | |
| Date: | May 30, 2013 | |
| | | |
Pursuant to the requirements of the Securities Exchange Act of 1934 and the Investment Company Act of 1940, this report has been signed below by the following persons on behalf of the registrant and in the capacities and on the dates indicated.
| By: | /s/ Jonathan S. Thomas | |
| | Name: | Jonathan S. Thomas | |
| | Title: | President | |
| | | (principal executive officer) | |
| | | | |
| | | | |
| Date: | May 30, 2013 | |
| By: | /s/ C. Jean Wade | |
| | Name: | C. Jean Wade | |
| | Title: | Vice President, Treasurer, and | |
| | | Chief Financial Officer | |
| | | (principal financial officer) | |
| | | | |
| Date: | May 30, 2013 | |