UNITED STATES
SECURITIES AND EXCHANGE COMMISSION
Washington, D.C. 20549
FORM N-CSR
CERTIFIED SHAREHOLDER REPORT OF REGISTERED
MANAGEMENT INVESTMENT COMPANIES
|
| | | | | | |
| Investment Company Act file number | 811-04363 |
| | |
| AMERICAN CENTURY GOVERNMENT INCOME TRUST |
| (Exact name of registrant as specified in charter) |
| | |
| 4500 MAIN STREET, KANSAS CITY, MISSOURI | 64111 |
| (Address of principal executive offices) | (Zip Code) |
| | |
CHARLES A. ETHERINGTON 4500 MAIN STREET, KANSAS CITY, MISSOURI 64111 |
| (Name and address of agent for service) |
| | |
| Registrant’s telephone number, including area code: | 816-531-5575 |
| | |
| Date of fiscal year end: | 03-31 |
| | |
| Date of reporting period: | 03-31-2016 |
ITEM 1. REPORTS TO STOCKHOLDERS.
|
| |
| | |
| | Annual Report |
| | |
| | March 31, 2016 |
| | |
| | Capital Preservation Fund |
|
| |
| President’s Letter | 2 |
| Performance | 3 |
| Fund Characteristics | |
| Shareholder Fee Example | |
| Schedule of Investments | |
| Statement of Assets and Liabilities | |
| Statement of Operations | |
| Statement of Changes in Net Assets | |
| Notes to Financial Statements | |
| Financial Highlights | |
| Report of Independent Registered Public Accounting Firm | |
| Management | |
| Additional Information | |
Any opinions expressed in this report reflect those of the author as of the date of the report, and do not necessarily represent the opinions of American Century Investments® or any other person in the American Century Investments organization. Any such opinions are subject to change at any time based upon market or other conditions and American Century Investments disclaims any responsibility to update such opinions. These opinions may not be relied upon as investment advice and, because investment decisions made by American Century Investments funds are based on numerous factors, may not be relied upon as an indication of trading intent on behalf of any American Century Investments fund. Security examples are used for representational purposes only and are not intended as recommendations to purchase or sell securities. Performance information for comparative indices and securities is provided to American Century Investments by third party vendors. To the best of American Century Investments’ knowledge, such information is accurate at the time of printing.
|
| |
| Dear Investor:
Thank you for reviewing this annual report for the 12 months ended March 31, 2016. It provides investment performance and portfolio information for the reporting period, plus longer-term historical performance data.
Annual reports help convey information about fund performance, including market and economic factors that affected returns during the reporting period. For additional, updated investment and market insights, we encourage you to visit our website, americancentury.com.
|
| Jonathan Thomas |
Divergence in Economic Growth and Monetary Policies, Combined With China Turmoil, Triggered Market Volatility
Divergence between the U.S. and the rest of the world—along with China’s struggles, plunging commodity prices, capital market volatility, and risk-off trading—were dominant themes during the reporting period. Global divergence described not only the relatively stronger economic growth enjoyed by the U.S. compared with most of the world, but also the related contrast between the U.S. Federal Reserve’s (the Fed’s) unwinding of monetary stimulus versus the continuation and expansion of stimulus by other major central banks.
Two months in particular captured the volatility and risk-off trading of the 12-month period. Last August, China’s economic slowdown (which rippled across the global economy) triggered Chinese stock market volatility, increasingly stimulative Chinese central bank monetary policy, and currency devaluations. Burdened further with oil market volatility, equity and higher-risk bond markets declined globally. Five months later, in January, investor sentiment plunged again as global economic growth decelerated, China devalued its currency again, and oil prices dropped below $30 a barrel. In addition, the Fed, in December, executed its first rate hike since 2006. Central bank policies showed less divergence thereafter, with the Bank of Japan suddenly resorting to negative interest rates, the Fed holding rates steady while reducing its rate hike projections, and the European Central Bank announcing significant additional stimulus.
Bonds (and more bond-like stock sectors, such as utilities and REITs) generally outperformed the broad stock market for the reporting period. In terms of stock style and size, growth generally outperformed value, and large cap generally outperformed small cap. In the bond market, higher quality (investment-grade) generally outperformed lower quality (high-yield). We expect continued economic and monetary policy divergence between the U.S. and non-U.S. economies in 2016, accompanied by further market volatility. This could present both challenges and opportunities for active investment managers. Looking ahead, we continue to believe in a disciplined, diversified, risk-aware investment approach, using professionally managed portfolios to meet financial goals. We appreciate your trust in us.
Sincerely,
Jonathan Thomas
President and Chief Executive Officer
American Century Investments
|
| | | | | |
| Total Returns as of March 31, 2016 | | |
| | | | Average Annual Returns | |
| | Ticker Symbol | 1 year | 5 years | 10 years | Inception Date |
| Investor Class | CPFXX | 0.01% | 0.01% | 0.93% | 10/13/72 |
Returns would have been lower if a portion of the fees had not been waived.
|
| | |
| Total Annual Fund Operating Expenses |
| Investor Class | 0.48% | |
The total annual fund operating expenses shown is as stated in the fund’s prospectus current as of the date of this report. The prospectus may vary from the expense ratio shown elsewhere in this report because it is based on a different time period, includes acquired fund fees and expenses, and, if applicable, does not include fee waivers or expense reimbursements.
Data presented reflect past performance. Past performance is no guarantee of future results. Current performance may be higher or lower than the performance shown.
Total returns for periods less than one year are not annualized. To obtain performance
data current to the most recent month end, please call 1-800-345-2021 or visit americancentury.com. For additional information about the fund, please consult the prospectus.
An investment in the fund is neither insured nor guaranteed by the Federal Deposit Insurance Corporation or any other government agency. Although the fund seeks to preserve the value of your investment at $1.00 per share, it is possible to lose money by investing in the fund. The fund's sponsor has no legal obligation to provide financial support to the fund, and you should not expect that the sponsor will provide financial support to the fund at any time.
The 7-day current yield more closely reflects the current earnings of the fund than the total return.
|
| |
| MARCH 31, 2016 | |
| 7-Day Current Yield | |
After wavier(1) | 0.01% |
| Before waiver | -0.14% |
| 7-Day Effective Yield | |
After waiver(1) | 0.01% |
| (1) Yields would have been lower if a portion of the fees had not been waived. |
| | |
| Portfolio at a Glance | |
| Weighted Average Maturity | 54 days |
| Weighted Average Life | 86 days |
| | |
| Portfolio Composition by Maturity | % of fund investments |
| 1-30 days | 38% |
| 31-90 days | 37% |
| 91-180 days | 25% |
| More than 180 days | 0% |
Fund shareholders may incur two types of costs: (1) transaction costs, including sales charges (loads) on purchase payments and redemption/exchange fees; and (2) ongoing costs, including management fees; distribution and service (12b-1) fees; and other fund expenses. This example is intended to help you understand your ongoing costs (in dollars) of investing in your fund and to compare these costs with the ongoing cost of investing in other mutual funds.
The example is based on an investment of $1,000 made at the beginning of the period and held for the entire period from October 1, 2015 to March 31, 2016.
Actual Expenses
The table provides information about actual account values and actual expenses for each class. You may use the information, together with the amount you invested, to estimate the expenses that you paid over the period. First, identify the share class you own. Then simply divide your account value by $1,000 (for example, an $8,600 account value divided by $1,000 = 8.6), then multiply the result by the number under the heading “Expenses Paid During Period” to estimate the expenses you paid on your account during this period.
If you hold Investor Class shares of any American Century Investments fund, or Institutional Class shares of the American Century Diversified Bond Fund, in an American Century Investments account (i.e., not a financial intermediary or retirement plan account), American Century Investments may charge you a $12.50 semiannual account maintenance fee if the value of those shares is less than $10,000. We will redeem shares automatically in one of your accounts to pay the $12.50 fee. In determining your total eligible investment amount, we will include your investments in all personal accounts (including American Century Investments Brokerage accounts) registered under your Social Security number. Personal accounts include individual accounts, joint accounts, UGMA/UTMA accounts, personal trusts, Coverdell Education Savings Accounts and IRAs (including traditional, Roth, Rollover, SEP-, SARSEP- and SIMPLE-IRAs), and certain other retirement accounts. If you have only business, business retirement, employer-sponsored or American Century Investments Brokerage accounts, you are currently not subject to this fee. If you are subject to the Account Maintenance Fee, your account value could be reduced by the fee amount.
Hypothetical Example for Comparison Purposes
The table also provides information about hypothetical account values and hypothetical expenses based on the actual expense ratio of each class of your fund and an assumed rate of return of 5% per year before expenses, which is not the actual return of a fund’s share class. The hypothetical account values and expenses may not be used to estimate the actual ending account balance or expenses you paid for the period. You may use this information to compare the ongoing costs of investing in your fund and other funds. To do so, compare this 5% hypothetical example with the 5% hypothetical examples that appear in the shareholder reports of the other funds.
Please note that the expenses shown in the table are meant to highlight your ongoing costs only and do not reflect any transactional costs, such as sales charges (loads) or redemption/exchange fees. Therefore, the table is useful in comparing ongoing costs only, and will not help you determine the relative total costs of owning different funds. In addition, if these transactional costs were included, your costs would have been higher.
|
| | | | |
| | Beginning
Account Value
10/1/15 | Ending
Account Value
3/31/16 | Expenses Paid
During Period(1)10/1/15 - 3/31/16 | Annualized
Expense Ratio(1) |
| Actual | | | | |
| Investor Class (after waiver) | $1,000 | $1,000.10 | $0.95 | 0.19% |
| Investor Class (before waiver) | $1,000 | $1,000.10(2) | $2.40 | 0.48% |
| Hypothetical | | | | |
| Investor Class (after waiver) | $1,000 | $1,024.05 | $0.96 | 0.19% |
| Investor Class (before waiver) | $1,000 | $1,022.60 | $2.43 | 0.48% |
| |
| (1) | Expenses are equal to the class's annualized expense ratio listed in the table above, multiplied by the average account value over the period, multiplied by 183, the number of days in the most recent fiscal half-year, divided by 366, to reflect the one-half year period. |
| |
| (2) | Ending account value assumes the return earned after waiver and would have been lower if a portion of the fees had not been waived. |
MARCH 31, 2016
|
| | | | | | |
| | Shares/
Principal Amount | Value |
U.S. TREASURY NOTES(1) — 33.7% | | |
| U.S. Treasury Notes, VRN, 0.35%, 4/4/16 | $ | 104,125,000 |
| $ | 104,122,282 |
|
| U.S. Treasury Notes, VRN, 0.37%, 4/4/16 | 130,000,000 |
| 130,007,336 |
|
| U.S. Treasury Notes, VRN, 0.38%, 4/4/16 | 85,000,000 |
| 84,983,303 |
|
| U.S. Treasury Notes, VRN, 0.47%, 4/4/16 | 10,000,000 |
| 9,995,680 |
|
| U.S. Treasury Notes, VRN, 0.57%, 4/4/16 | 7,026,000 |
| 7,031,081 |
|
| U.S. Treasury Notes, 0.25%, 4/15/16 | 95,000,000 |
| 94,999,339 |
|
| U.S. Treasury Notes, 2.00%, 4/30/16 | 70,000,000 |
| 70,096,477 |
|
| U.S. Treasury Notes, 2.625%, 4/30/16 | 15,000,000 |
| 15,026,997 |
|
| U.S. Treasury Notes, 3.25%, 5/31/16 | 30,000,000 |
| 30,142,830 |
|
| U.S. Treasury Notes, 1.50%, 6/30/16 | 73,000,000 |
| 73,203,136 |
|
| U.S. Treasury Notes, 0.50%, 7/31/16 | 75,000,000 |
| 75,030,513 |
|
| U.S. Treasury Notes, 3.25%, 7/31/16 | 60,000,000 |
| 60,574,104 |
|
| TOTAL U.S. TREASURY NOTES | | 755,213,078 |
|
U.S. TREASURY BILLS(1) — 62.7% | | |
| U.S. Treasury Bills, 0.21%, 4/7/16 | 70,000,000 |
| 69,997,608 |
|
| U.S. Treasury Bills, 0.23%, 4/14/16 | 13,000,000 |
| 12,998,944 |
|
| U.S. Treasury Bills, 0.26%, 4/21/16 | 70,000,000 |
| 69,990,083 |
|
| U.S. Treasury Bills, 0.31%, 4/28/16 | 100,000,000 |
| 99,977,124 |
|
| U.S. Treasury Bills, 0.36%, 5/5/16 | 90,000,000 |
| 89,970,249 |
|
| U.S. Treasury Bills, 0.32%, 5/12/16 | 150,000,000 |
| 149,944,478 |
|
| U.S. Treasury Bills, 0.30%, 5/19/16 | 144,483,000 |
| 144,425,206 |
|
| U.S. Treasury Bills, 0.32%, 5/26/16 | 175,000,000 |
| 174,915,017 |
|
| U.S. Treasury Bills, 0.32%, 6/9/16 | 100,000,000 |
| 99,939,625 |
|
| U.S. Treasury Bills, 0.59%, 6/16/16 | 100,000,000 |
| 99,876,500 |
|
| U.S. Treasury Bills, 0.30%, 6/23/16 | 50,000,000 |
| 49,965,416 |
|
| U.S. Treasury Bills, 0.27%, 6/30/16 | 95,465,000 |
| 95,397,776 |
|
| U.S. Treasury Bills, 0.47%, 7/14/16 | 75,000,000 |
| 74,900,333 |
|
| U.S. Treasury Bills, 0.42%, 7/28/16 | 100,000,000 |
| 99,863,972 |
|
| U.S. Treasury Bills, 0.46%, 8/25/16 | 50,000,000 |
| 49,907,736 |
|
| U.S. Treasury Bills, 0.45%, 9/22/16 | 25,000,000 |
| 24,946,833 |
|
| TOTAL U.S. TREASURY BILLS | | 1,407,016,900 |
|
| TEMPORARY CASH INVESTMENTS — 0.2% | | |
| SSgA U.S. Government Money Market Fund, Class N | 4,973,682 |
| 4,973,682 |
|
| TOTAL INVESTMENT SECURITIES — 96.6% | | 2,167,203,660 |
|
| OTHER ASSETS AND LIABILITIES — 3.4% | | 76,558,880 |
|
| TOTAL NET ASSETS — 100.0% | | $ | 2,243,762,540 |
|
|
| | |
| NOTES TO SCHEDULE OF INVESTMENTS |
| VRN | - | Variable Rate Note. Interest reset date is indicated. Rate shown is effective at the period end. |
| |
| (1) | The rates for U.S. Treasury Bills are the yield to maturity at purchase. The rates for U.S. Treasury Notes are the stated coupon rates. |
See Notes to Financial Statements.
|
|
| Statement of Assets and Liabilities |
|
| | | |
| MARCH 31, 2016 | |
| Assets | |
| Investment securities, at value (amortized cost and cost for federal income tax purposes) | $ | 2,167,203,660 |
|
| Receivable for investments sold | 71,001,026 |
|
| Receivable for capital shares sold | 5,012,927 |
|
| Interest receivable | 2,082,015 |
|
| | 2,245,299,628 |
|
| | |
| Liabilities | |
| Payable for capital shares redeemed | 929,466 |
|
| Accrued management fees | 607,437 |
|
| Dividends payable | 185 |
|
| | 1,537,088 |
|
| | |
| Net Assets | $ | 2,243,762,540 |
|
| | |
| Investor Class Capital Shares | |
| Shares outstanding (unlimited number of shares authorized) | 2,243,725,756 |
|
| | |
| Net Asset Value Per Share | $ | 1.00 |
|
| | |
| Net Assets Consist of: | |
| Capital paid in | $ | 2,243,728,646 |
|
| Undistributed net investment income | 2,717 |
|
| Undistributed net realized gain | 31,177 |
|
| | $ | 2,243,762,540 |
|
See Notes to Financial Statements.
|
| | | |
| YEAR ENDED MARCH 31, 2016 | |
| Investment Income (Loss) | |
| Income: | |
| Interest | $ | 3,221,825 |
|
| | |
| Expenses: | |
| Management fees | 11,119,624 |
|
| Trustees' fees and expenses | 124,085 |
|
| Other expenses | 32,861 |
|
| | 11,276,570 |
|
| Fees waived | (8,289,333 | ) |
| | 2,987,237 |
|
| | |
| Net investment income (loss) | 234,588 |
|
| | |
| Net realized gain (loss) on investment transactions | 33,894 |
|
| | |
| Net Increase (Decrease) in Net Assets Resulting from Operations | $ | 268,482 |
|
See Notes to Financial Statements.
|
|
| Statement of Changes in Net Assets |
|
| | | | | | |
| YEARS ENDED MARCH 31, 2016 AND MARCH 31, 2015 |
| Increase (Decrease) in Net Assets | March 31, 2016 | March 31, 2015 |
| Operations | | |
| Net investment income (loss) | $ | 234,588 |
| $ | 237,959 |
|
| Net realized gain (loss) | 33,894 |
| 1,947 |
|
| Net increase (decrease) in net assets resulting from operations | 268,482 |
| 239,906 |
|
| | | |
| Distributions to Shareholders | | |
| From net investment income | (234,588 | ) | (237,959 | ) |
| From net realized gains | (4,664 | ) | — |
|
| Decrease in net assets from distributions | (239,252 | ) | (237,959 | ) |
| | | |
| Capital Share Transactions | | |
| Proceeds from shares sold | 1,003,344,443 |
| 753,861,658 |
|
| Proceeds from reinvestment of distributions | 233,195 |
| 235,188 |
|
| Payments for shares redeemed | (1,115,418,197 | ) | (935,399,030 | ) |
| Net increase (decrease) in net assets from capital share transactions | (111,840,559 | ) | (181,302,184 | ) |
| | | |
| Net increase (decrease) in net assets | (111,811,329 | ) | (181,300,237 | ) |
| | | |
| Net Assets | | |
| Beginning of period | 2,355,573,869 |
| 2,536,874,106 |
|
| End of period | $ | 2,243,762,540 |
| $ | 2,355,573,869 |
|
| | | |
| Undistributed net investment income | $ | 2,717 |
| $ | 2,717 |
|
| | | |
| Transactions in Shares of the Fund | | |
| Sold | 1,003,344,443 |
| 753,861,658 |
|
| Issued in reinvestment of distributions | 233,195 |
| 235,188 |
|
| Redeemed | (1,115,418,197 | ) | (935,399,030 | ) |
| Net increase (decrease) in shares of the fund | (111,840,559 | ) | (181,302,184 | ) |
See Notes to Financial Statements.
|
|
| Notes to Financial Statements |
MARCH 31, 2016
1. Organization
American Century Government Income Trust (the trust) is registered under the Investment Company Act of 1940, as amended (the 1940 Act), as an open-end management investment company and is organized as a Massachusetts business trust. Capital Preservation Fund (the fund) is one fund in a series issued by the trust. The fund is a money market fund and its investment objective is to seek maximum safety and liquidity. Its secondary objective is to seek to pay shareholders the highest rate of return consistent with safety and liquidity.
2. Significant Accounting Policies
The following is a summary of significant accounting policies consistently followed by the fund in preparation of its financial statements. The fund is an investment company and follows accounting and reporting guidance in accordance with accounting principles generally accepted in the United States of America. This may require management to make certain estimates and assumptions at the date of the financial statements. Actual results could differ from these estimates. Management evaluated the impact of events or transactions occurring through the date the financial statements were issued that would merit recognition or disclosure.
Investment Valuations — The fund determines the fair value of its investments and computes its net asset value (NAV) per share at the close of regular trading (usually 4 p.m. Eastern time) on the New York Stock Exchange (NYSE) on each day the NYSE is open. Investments are generally valued at amortized cost, which approximates fair value. Open-end management investment companies are valued at the reported NAV per share. If the fund determines that the valuation methods do not reflect an investment’s fair value, such investment is valued as determined in good faith by the Board of Trustees or its delegate, in accordance with policies and procedures adopted by the Board of Trustees.
Security Transactions — Security transactions are accounted for as of the trade date. Net realized gains and losses are determined on the identified cost basis, which is also used for federal income tax purposes.
Investment Income — Interest income is recorded on the accrual basis and includes accretion of discounts and amortization of premiums.
Treasury Roll Transactions — The fund purchases a security and at the same time makes a commitment to sell the same security at a future settlement date at a specified price. These types of transactions are known as treasury roll transactions. The difference between the purchase price and the sale price represents interest income reflective of an agreed upon rate between the fund and the counterparty.
Income Tax Status — It is the fund’s policy to distribute substantially all net investment income and net realized gains to shareholders and to otherwise qualify as a regulated investment company under provisions of the Internal Revenue Code. Accordingly, no provision has been made for income taxes. The fund files U.S. federal, state, local and non-U.S. tax returns as applicable. The fund's tax returns are subject to examination by the relevant taxing authority until expiration of the applicable statute of limitations, which is generally three years from the date of filing but can be longer in certain jurisdictions. At this time, management believes there are no uncertain tax positions which, based on their technical merit, would not be sustained upon examination and for which it is reasonably possible that the total amounts of unrecognized tax benefits will significantly change in the next twelve months.
Distributions to Shareholders — Distributions from net investment income, if any, are declared daily and paid monthly. The fund may make short-term capital gains distributions to comply with the distribution requirements of the Internal Revenue Code. The fund does not expect to realize any long-term capital gains, and accordingly, does not expect to pay any long-term capital gains distributions.
Indemnifications — Under the trust’s organizational documents, its officers and trustees are indemnified against certain liabilities arising out of the performance of their duties to the fund. In addition, in the normal course of business, the fund enters into contracts that provide general indemnifications. The maximum exposure under these arrangements is unknown as this would involve future claims that may be made against a fund. The risk of material loss from such claims is considered by management to be remote.
3. Fees and Transactions with Related Parties
Certain officers and trustees of the trust are also officers and/or directors of American Century Companies, Inc. (ACC). The trust's investment advisor, American Century Investment Management, Inc. (ACIM), the trust's distributor, American Century Investment Services, Inc., and the trust's transfer agent, American Century Services, LLC, are wholly owned, directly or indirectly, by ACC.
Management Fees — The trust has entered into a management agreement with ACIM, under which ACIM provides the fund with investment advisory and management services in exchange for a single, unified management fee (the fee). The agreement provides that all expenses of managing and operating the fund, except distribution and service fees, brokerage expenses, taxes, interest, fees and expenses of the independent trustees (including legal counsel fees), and extraordinary expenses, will be paid by ACIM. The fee is computed and accrued daily based on the daily net assets of the fund and paid monthly in arrears. The fee consists of (1) an Investment Category Fee based on the daily net assets of the fund and certain other accounts managed by the investment advisor that are in the same broad investment category as the fund and (2) a Complex Fee based on the assets of all the funds in the American Century Investments family of funds. The rates for the Investment Category Fee range from 0.1370% to 0.2500%. The rates for the Complex Fee range from 0.2500% to 0.3100%. In order to maintain a positive yield, ACIM may voluntarily waive a portion of the management fee on a daily basis. The fee waiver may be revised or terminated at any time by the investment advisor without notice. The effective annual management fee for the year ended March 31, 2016 was 0.47% before waiver and 0.12% after waiver.
Trustees’ Fees and Expenses — The Board of Trustees is responsible for overseeing the investment advisor’s management and operations of the fund. The trustees receive detailed information about the fund and its investment advisor regularly throughout the year, and meet at least quarterly with management of the investment advisor to review reports about fund operations. The fund’s officers do not receive compensation from the fund.
4. Fair Value Measurements
The fund’s investments valuation process is based on several considerations and may use multiple inputs to determine the fair value of the investments held by the fund. In conformity with accounting principles generally accepted in the United States of America, the inputs used to determine a valuation are classified into three broad levels.
| |
| • | Level 1 valuation inputs consist of unadjusted quoted prices in an active market for identical investments. |
| |
| • | Level 2 valuation inputs consist of direct or indirect observable market data (including quoted prices for comparable investments, evaluations of subsequent market events, interest rates, prepayment speeds, credit risk, etc.). These inputs also consist of quoted prices for identical investments initially expressed in local currencies that are adjusted through translation into U.S. dollars. |
| |
| • | Level 3 valuation inputs consist of unobservable data (including a fund’s own assumptions). |
The level classification is based on the lowest level input that is significant to the fair valuation measurement. The valuation inputs are not necessarily an indication of the risks associated with investing in these securities or other financial instruments. There were no significant transfers between levels during the period.
The following is a summary of the level classifications as of period end. The Schedule of Investments provides additional information on the fund’s portfolio holdings.
|
| | | | | | | | |
| | Level 1 | Level 2 | Level 3 |
| Assets | | | |
| Investment Securities | | | |
| U.S. Treasury Notes | — |
| $ | 755,213,078 |
| — |
|
| U.S. Treasury Bills | — |
| 1,407,016,900 |
| — |
|
| Temporary Cash Investments | $ | 4,973,682 |
| — |
| — |
|
| | $ | 4,973,682 |
| $ | 2,162,229,978 |
| — |
|
5. Federal Tax Information
The tax character of distributions paid during the years ended March 31, 2016 and March 31, 2015 were as follows:
|
| | | | | | |
| | 2016 | 2015 |
| Distributions Paid From | | |
| Ordinary income | $ | 239,252 |
| $ | 237,959 |
|
| Long-term capital gains | — |
| — |
|
The book-basis character of distributions made during the year from net investment income or net realized gains may differ from their ultimate characterization for federal income tax purposes. These differences reflect the differing character of certain income items and net realized gains and losses for financial statement and tax purposes, and may result in reclassification among certain capital accounts on the financial statements.
As of March 31, 2016, the fund had undistributed ordinary income for federal income tax purposes of $33,894.
6. Money Market Fund Reform
In July 2014, the Securities and Exchange Commission adopted amendments to the rules that govern money market mutual funds. The amendments consist of structural and operational reforms intended to make money market funds more resilient for investors. In response to the amendments to the rules, beginning in the fall of 2016, the board will have the ability to impose a liquidity fee or suspend redemptions in times of severe market stress and the fund will only be available to shareholders who are retail investors. The fund will continue to seek to maintain a stable NAV. Management anticipates there will be no changes to the financial statement disclosures.
|
| | | | | | | | | | | | | | |
| For a Share Outstanding Throughout the Years Ended March 31 (except as noted) | | | |
| Per-Share Data | | | | Ratios and Supplemental Data |
| | | | Distributions From: | | | Ratio to Average Net Assets of: | |
| | Net Asset
Value,
Beginning
of Period | Income From Investment Operations: Net Investment Income (Loss) | Net
Investment
Income | Net
Realized
Gains | Total
Distributions | Net Asset
Value,
End
of Period | Total
Return(1) | Operating
Expenses | Operating
Expenses
(before
expense
waiver) | Net
Investment
Income
(Loss) | Net Investment Income (Loss) (before expense waiver) | Net
Assets,
End of
Period
(in thousands) |
| Investor Class | | | | | | | | | | | |
| 2016 | $1.00 | —(2) | —(2) | —(2) | —(2) | $1.00 | 0.01% | 0.13% | 0.48% | 0.01% | (0.34)% |
| $2,243,763 |
|
| 2015 | $1.00 | —(2) | —(2) | — | —(2) | $1.00 | 0.01% | 0.04% | 0.48% | 0.01% | (0.43)% |
| $2,355,574 |
|
| 2014 | $1.00 | —(2) | —(2) | —(2) | —(2) | $1.00 | 0.01% | 0.06% | 0.48% | 0.01% | (0.41)% |
| $2,536,874 |
|
| 2013 | $1.00 | —(2) | —(2) | — | —(2) | $1.00 | 0.01% | 0.09% | 0.48% | 0.01% | (0.38)% |
| $2,643,948 |
|
| 2012 | $1.00 | —(2) | —(2) | —(2) | —(2) | $1.00 | 0.01% | 0.06% | 0.48% | 0.01% | (0.41)% |
| $2,801,793 |
|
|
|
| Notes to Financial Highlights |
| |
| (1) | Total returns are calculated based on the net asset value of the last business day. Total returns for periods less than one year are not annualized. |
| |
| (2) | Per-share amount was less than $0.005. |
See Notes to Financial Statements.
|
|
| Report of Independent Registered Public Accounting Firm |
To the Trustees of the American Century Government Income Trust and Shareholders of the Capital Preservation Fund:
In our opinion, the accompanying statement of assets and liabilities, including the schedule of investments, and the related statements of operations and of changes in net assets and the financial highlights present fairly, in all material respects, the financial position of the Capital Preservation Fund (one of the five funds comprising the American Century Government Income Trust, hereafter referred to as the “Fund”) at March 31, 2016, the results of its operations for the year then ended, the changes in its net assets for each of the two years in the period then ended and the financial highlights for each of the five years in the period then ended, in conformity with accounting principles generally accepted in the United States of America. These financial statements and financial highlights (hereafter referred to as "financial statements") are the responsibility of the Fund's management. Our responsibility is to express an opinion on these financial statements based on our audits. We conducted our audits of these financial statements in accordance with the standards of the Public Company Accounting Oversight Board (United States). Those standards require that we plan and perform the audit to obtain reasonable assurance about whether the financial statements are free of material misstatement. An audit includes examining, on a test basis, evidence supporting the amounts and disclosures in the financial statements, assessing the accounting principles used and significant estimates made by management, and evaluating the overall financial statement presentation. We believe that our audits, which included confirmation of securities at March 31, 2016 by correspondence with the custodian and brokers, provide a reasonable basis for our opinion.
PricewaterhouseCoopers LLP
Kansas City, Missouri
May 18, 2016
Board of Trustees
The individuals listed below serve as trustees of the funds. Each trustee will continue to serve in this capacity until death, retirement, resignation or removal from office. The board has adopted a mandatory retirement age for trustees who are not “interested persons,” as that term is defined in the Investment Company Act (independent trustees). Independent trustees shall retire on December 31 of the year in which they reach their 75th birthday; provided, however, that on or after January 1, 2022, independent trustees shall retire on December 31 of the year in which they reach their 76th birthday.
Mr. Thomas is an “interested person” because he currently serves as President and Chief Executive Officer of American Century Companies, Inc. (ACC), the parent company of American Century Investment Management, Inc. (ACIM or the advisor). The other trustees (more than three-fourths of the total number) are independent. They are not employees, directors or officers of, and have no financial interest in, ACC or any of its wholly owned, direct or indirect, subsidiaries, including ACIM, American Century Investment Services, Inc. (ACIS) and American Century Services, LLC (ACS), and they do not have any other affiliations, positions or relationships that would cause them to be considered “interested persons” under the Investment Company Act. The trustees serve in this capacity for eight (in the case of Mr. Thomas, 15) registered investment companies in the American Century Investments family of funds.
The following table presents additional information about the trustees. The mailing address for each trustee other than Mr. Thomas is 1665 Charleston Road, Mountain View, California 94043. The mailing address for Mr. Thomas is 4500 Main Street, Kansas City, Missouri 64111.
|
| | | | | |
Name (Year of Birth) | Position(s) Held with Funds | Length of Time Served | Principal Occupation(s) During Past 5 Years | Number of American Century Portfolios Overseen by Trustee | Other Directorships Held During Past 5 Years |
| Independent Trustees |
Tanya S. Beder (1955) | Trustee | Since 2011 | Chairman and CEO, SBCC Group Inc. (independent advisory services) (2006 to present) | 45 | CYS Investments, Inc. (NYSE mortgage arbitrage REIT) |
Jeremy I. Bulow (1954) | Trustee | Since 2011 | Professor of Economics, Stanford University, Graduate School of Business (1979 to present) | 45 | None |
Anne Casscells (1958) | Advisory Board Member | Since 2016 | Co-Chief Executive Officer and Chief Investment Officer, Aetos Alternatives Management (investment advisory firm) (2001 to present); Lecturer in Accounting, Stanford University, Graduate School of Business (2009 to present) | 45 | None |
Ronald J. Gilson (1946) | Trustee and Chairman of the Board | Since 1995 (Chairman since 2005) | Charles J. Meyers Professor of Law and Business, Stanford Law School (1979 to present); Marc and Eva Stern Professor of Law and Business, Columbia University School of Law (1992 to present) | 45 | None |
|
| | | | | |
Name (Year of Birth) | Position(s) Held with Funds | Length of Time Served | Principal Occupation(s) During Past 5 Years | Number of American Century Portfolios Overseen by Trustee | Other Directorships Held During Past 5 Years |
| Independent Trustees |
Frederick L. A. Grauer (1946) | Trustee | Since 2008 | Senior Advisor, iShares by BlackRock, Inc. (investment management firm) (2010 to 2011, 2013 to present); Senior Advisor, Course Hero (an educational technology company) (2015 to present) | 45 | None |
Jonathan D. Levin (1972) | Advisory Board Member | Since 2016 | Holbrook Working Professor of Price Theory, Standford University, (2000 to present); Chair, Department of Economics, Stanford University (2011 to 2014) | 45 | None |
Peter F. Pervere (1947) | Trustee | Since 2007 | Retired | 45 | None |
John B. Shoven (1947) | Trustee | Since 2002 | Charles R. Schwab Professor of Economics, Stanford University (1973 to present) | 45 | Cadence Design Systems; Exponent; Financial Engines |
| Interested Trustee |
Jonathan S. Thomas (1963) | Trustee and President | Since 2007 | President and Chief Executive Officer, ACC (March 2007 to present). Also serves as Chief Executive Officer, ACS; Executive Vice President, ACIM; Director, ACC, ACIM and other ACC subsidiaries | 128 | BioMed Valley Discoveries, Inc. |
The Statement of Additional Information has additional information about the fund's trustees and is available without charge, upon request, by calling 1-800-345-2021.
Officers
The following table presents certain information about the executive officers of the funds. Each officer serves as an officer for each of the 15 investment companies in the American Century family of funds, unless otherwise noted. No officer is compensated for his or her service as an officer of the funds. The listed officers are interested persons of the funds and are appointed or re-appointed on an annual basis. The mailing address for each of the officers listed below is 4500 Main Street, Kansas City, Missouri 64111.
|
| | |
Name (Year of Birth) | Offices with the Funds | Principal Occupation(s) During the Past Five Years |
Jonathan S. Thomas (1963) | Trustee and President since 2007 | President and Chief Executive Officer, ACC (March 2007 to present). Also serves as Chief Executive Officer, ACS; Executive Vice President, ACIM; Director, ACC, ACIM and other ACC subsidiaries |
Amy D. Shelton (1964) | Chief Compliance Officer and Vice President since 2014 | Chief Compliance Officer, American Century funds, (March 2014 to present); Chief Compliance Officer, ACIM (February 2014 to present); Chief Compliance Officer, ACIS (October 2009 to present); Vice President, Client Interactions and Marketing, ACIS (February 2013 to January 2014); Director, Client Interactions and Marketing, ACIS (June 2007 to January 2013). Also serves as Vice President, ACIS |
Charles A. Etherington (1957) | General Counsel since 2007 and Senior Vice President since 2006 | Attorney, ACC (February 1994 to present); Vice President, ACC (November 2005 to present); General Counsel, ACC (March 2007 to present). Also serves as General Counsel, ACIM, ACS, ACIS and other ACC subsidiaries; and Senior Vice President, ACIM and ACS |
C. Jean Wade (1964) | Vice President, Treasurer and Chief Financial Officer since 2012 | Vice President, ACS (February 2000 to present) |
Robert J. Leach (1966) | Vice President since 2006 and Assistant Treasurer since 2012 | Vice President, ACS (February 2000 to present) |
David H. Reinmiller (1963) | Vice President since 2001 | Attorney, ACC (January 1994 to present); Associate General Counsel, ACC (January 2001 to present). Also serves as Vice President, ACIM and ACS |
Ward D. Stauffer (1960) | Secretary since 2005 | Attorney, ACC (June 2003 to present) |
Retirement Account Information
As required by law, distributions you receive from certain IRAs are subject to federal income tax withholding, unless you elect not to have withholding apply. Tax will be withheld on the total amount withdrawn even though you may be receiving amounts that are not subject to withholding, such as nondeductible contributions. In such case, excess amounts of withholding could occur. You may adjust your withholding election so that a greater or lesser amount will be withheld.
If you don’t want us to withhold on this amount, you must notify us to not withhold the federal income tax. You may notify us in writing or in certain situations by telephone or through other electronic means. For systematic withdrawals, your withholding election will remain in effect until revoked or changed by filing a new election. You have the right to revoke your election at any time.
Remember, even if you elect not to have income tax withheld, you are liable for paying income tax on the taxable portion of your withdrawal. If you elect not to have income tax withheld or you don’t have enough income tax withheld, you may be responsible for payment of estimated tax. You may incur penalties under the estimated tax rules if your withholding and estimated tax payments are not sufficient. You can reduce or defer the income tax on a distribution by directly or indirectly rolling such distribution over to another IRA or eligible plan. You should consult your tax advisor for additional information.
State tax will be withheld if, at the time of your distribution, your address is within one of the mandatory withholding states and you have federal income tax withheld (or as otherwise required by state law). State taxes will be withheld from your distribution in accordance with the respective state rules.
Distributions you receive from 403(b), 457 and qualified plans are subject to special tax and withholding rules. Your plan administrator or plan sponsor is required to provide you with a special tax notice explaining those rules at the time you request a distribution. If applicable, federal and/or state taxes may be withheld from your distribution amount.
Proxy Voting Policies
Descriptions of the principles and policies that the fund's investment advisor uses in exercising the voting rights associated with the securities purchased and/or held by the fund are available without charge, upon request, by calling 1-800-345-2021 or visiting the "About Us" page of American Century Investments’ website at americancentury.com. A description of the policies is also available on the Securities and Exchange Commission’s website at sec.gov. Information regarding how the investment advisor voted proxies relating to portfolio securities during the most recent 12-month period ended June 30 is available on the "About Us" page at americancentury.com. It is also available at sec.gov.
Quarterly Portfolio Disclosure
The fund files its complete schedule of portfolio holdings with the Securities and Exchange Commission (SEC) for the first and third quarters of each fiscal year on Form N-Q. The fund’s Forms N-Q are available on the SEC’s website at sec.gov, and may be reviewed and copied at the SEC’s Public Reference Room in Washington, DC. Information on the operation of the Public Reference Room may be obtained by calling 1-800-SEC-0330. The fund also makes its complete schedule of portfolio holdings for the most recent quarter of its fiscal year available on its
website at americancentury.com and, upon request, by calling 1-800-345-2021.
Other Tax Information
The following information is provided pursuant to provisions of the Internal Revenue Code.
The fund hereby designates $4,664 as qualified short-term capital gain distributions for purposes of Internal Revenue Code Section 871 for the fiscal year ended March 31, 2016.
|
| | |
| |
| | | |
| Contact Us | americancentury.com | |
| Automated Information Line | 1-800-345-8765 | |
| Investor Services Representative | 1-800-345-2021 or 816-531-5575 | |
| Investors Using Advisors | 1-800-378-9878 | |
| Business, Not-For-Profit, Employer-Sponsored Retirement Plans | 1-800-345-3533 | |
| Banks and Trust Companies, Broker-Dealers, Financial Professionals, Insurance Companies | 1-800-345-6488 | |
| Telecommunications Relay Service for the Deaf | 711 | |
| | | |
| American Century Government Income Trust | |
| | | |
Investment Advisor: American Century Investment Management, Inc. Kansas City, Missouri | |
| | | |
| This report and the statements it contains are submitted for the general information of our shareholders. The report is not authorized for distribution to prospective investors unless preceded or accompanied by an effective prospectus. | |
| | | |
©2016 American Century Proprietary Holdings, Inc. All rights reserved.
CL-ANN-88871 1605
| |
|
| |
| | |
| | Annual Report |
| | |
| | March 31, 2016 |
| | |
| | Ginnie Mae Fund |
|
| | |
| President’s Letter | 2 |
|
| Performance | 3 |
|
| Portfolio Commentary | |
|
| Fund Characteristics | |
|
| Shareholder Fee Example | |
|
| Schedule of Investments | |
|
| Statement of Assets and Liabilities | |
|
| Statement of Operations | |
|
| Statement of Changes in Net Assets | |
|
| Notes to Financial Statements | |
|
| Financial Highlights | |
|
| Report of Independent Registered Public Accounting Firm | |
|
| Management | |
|
| Additional Information | |
|
Any opinions expressed in this report reflect those of the author as of the date of the report, and do not necessarily represent the opinions of American Century Investments® or any other person in the American Century Investments organization. Any such opinions are subject to change at any time based upon market or other conditions and American Century Investments disclaims any responsibility to update such opinions. These opinions may not be relied upon as investment advice and, because investment decisions made by American Century Investments funds are based on numerous factors, may not be relied upon as an indication of trading intent on behalf of any American Century Investments fund. Security examples are used for representational purposes only and are not intended as recommendations to purchase or sell securities. Performance information for comparative indices and securities is provided to American Century Investments by third party vendors. To the best of American Century Investments’ knowledge, such information is accurate at the time of printing.
|
| |
| Dear Investor:
Thank you for reviewing this annual report for the 12 months ended March 31, 2016. It provides investment performance and portfolio information for the reporting period, plus longer-term historical performance data.
Annual reports help convey information about fund performance, including market and economic factors that affected returns during the reporting period. For additional, updated investment and market insights, we encourage you to visit our website, americancentury.com.
|
| Jonathan Thomas |
Divergence in Economic Growth and Monetary Policies, Combined With China Turmoil, Triggered Market Volatility
Divergence between the U.S. and the rest of the world—along with China’s struggles, plunging commodity prices, capital market volatility, and risk-off trading—were dominant themes during the reporting period. Global divergence described not only the relatively stronger economic growth enjoyed by the U.S. compared with most of the world, but also the related contrast between the U.S. Federal Reserve’s (the Fed’s) unwinding of monetary stimulus versus the continuation and expansion of stimulus by other major central banks.
Two months in particular captured the volatility and risk-off trading of the 12-month period. Last August, China’s economic slowdown (which rippled across the global economy) triggered Chinese stock market volatility, increasingly stimulative Chinese central bank monetary policy, and currency devaluations. Burdened further with oil market volatility, equity and higher-risk bond markets declined globally. Five months later, in January, investor sentiment plunged again as global economic growth decelerated, China devalued its currency again, and oil prices dropped below $30 a barrel. In addition, the Fed, in December, executed its first rate hike since 2006. Central bank policies showed less divergence thereafter, with the Bank of Japan suddenly resorting to negative interest rates, the Fed holding rates steady while reducing its rate hike projections, and the European Central Bank announcing significant additional stimulus.
Bonds (and more bond-like stock sectors, such as utilities and REITs) generally outperformed the broad stock market for the reporting period. In terms of stock style and size, growth generally outperformed value, and large cap generally outperformed small cap. In the bond market, higher quality (investment-grade) generally outperformed lower quality (high-yield). We expect continued economic and monetary policy divergence between the U.S. and non-U.S. economies in 2016, accompanied by further market volatility. This could present both challenges and opportunities for active investment managers. Looking ahead, we continue to believe in a disciplined, diversified, risk-aware investment approach, using professionally managed portfolios to meet financial goals. We appreciate your trust in us.
Sincerely,
Jonathan Thomas
President and Chief Executive Officer
American Century Investments
|
| | | | | | |
| Total Returns as of March 31, 2016 |
| | | | Average Annual Returns | |
| | Ticker Symbol | 1 year | 5 years | 10 years | Since Inception | Inception Date |
| Investor Class | BGNMX | 1.53% | 2.78% | 4.40% | — | 9/23/85 |
| Barclays U.S. GNMA Index | — | 2.40% | 3.28% | 4.85% | — | — |
| Institutional Class | AGMNX | 1.73% | 3.00% | — | 4.49% | 9/28/07 |
| A Class | BGNAX | | | | | 10/9/97 |
| No sales charge | | 1.28% | 2.52% | 4.15% | — | |
| With sales charge | | -3.25% | 1.59% | 3.66% | — | |
| C Class | BGNCX | 0.52% | 1.76% | — | 2.09% | 3/1/10 |
| R Class | AGMWX | 1.03% | 2.29% | — | 3.76% | 9/28/07 |
Sales charges include initial sales charges and contingent deferred sales charges (CDSCs), as applicable. A Class shares have a 4.50% maximum initial sales charge and may be subject to a maximum CDSC of 1.00%. C Class shares redeemed within 12 months of purchase are subject to a maximum CDSC of 1.00%. The SEC requires that mutual funds provide performance information net of maximum sales charges in all cases where charges could be applied.
Average annual returns since inception are presented when ten years of performance history is not available.
Prior to March 1, 2010, the A Class was referred to as the Advisor Class and did not have a front-end sales charge. Performance prior to that date has been adjusted to reflect this charge. Returns would have been lower if a portion of the fees had not been waived.
Data presented reflect past performance. Past performance is no guarantee of future results. Current performance may be higher or lower than the performance shown. Total returns for periods less than one year are not annualized. Investment return and principal value will fluctuate, and redemption value may be more or less than original cost. Data assumes reinvestment of dividends and capital gains, and none of the charts reflect the deduction of taxes that a shareholder would pay on fund distributions or the redemption of fund shares. To obtain performance data current to the most recent month end, please call 1-800-345-2021 or visit americancentury.com. For additional information about the fund, please consult the prospectus.
|
|
| Growth of $10,000 Over 10 Years |
| $10,000 investment made March 31, 2006 |
Performance for other share classes will vary due to differences in fee structure.
|

|
| |
| Value on March 31, 2016 |
| | Investor Class — $15,394 |
| |
| | Barclays U.S. GNMA Index — $16,065 |
| |
Ending value would have been lower if a portion of the fees had not been waived.
|
| | | | |
| Total Annual Fund Operating Expenses |
| Investor Class | Institutional Class | A Class | C Class | R Class |
| 0.55% | 0.35% | 0.80% | 1.55% | 1.05% |
The total annual fund operating expenses shown is as stated in the fund’s prospectus current as of the date of this report. The prospectus may vary from the expense ratio shown elsewhere in this report because it is based on a different time period, includes acquired fund fees and expenses, and, if applicable, does not include fee waivers or expense reimbursements.
Data presented reflect past performance. Past performance is no guarantee of future results. Current performance may be higher or lower than the performance shown. Total returns for periods less than one year are not annualized. Investment return and principal value will fluctuate, and redemption value may be more or less than original cost. Data assumes reinvestment of dividends and capital gains, and none of the charts reflect the deduction of taxes that a shareholder would pay on fund distributions or the redemption of fund shares. To obtain performance data current to the most recent month end, please call 1-800-345-2021 or visit americancentury.com. For additional information about the fund, please consult the prospectus.
Portfolio Managers: Hando Aguilar, Dan Shiffman, Bob Gahagan, and Jesse Singh
Performance Summary
Ginnie Mae advanced 1.53%* for the 12 months ended March 31, 2016. By comparison, the Barclays U.S. GNMA Index gained 2.40%. The portfolio’s duration (price sensitivity to interest rate changes) positioning in 2015 was a factor that detracted from performance compared with the index. In addition, fund returns reflect operating expenses, while index returns do not.
U.S. Bonds Persevered In Volatile Backdrop
Despite modest economic gains and the Federal Reserve’s (the Fed’s) December 2015 decision to finally start normalizing short-term interest rates—factors that distinguished the U.S. from most other regions of the world, where slowing or stagnant growth and aggressive central bank easing were the norms—U.S. investment-grade bonds generally posted modest gains for the 12-month period ended March 31, 2016. After concluding its massive quantitative easing (QE) program in October 2014, the Fed focused on winding down another component of its unprecedented stimulus program—near-zero short-term interest rates—in 2015. Investor speculation regarding the timing and magnitude of the first Fed rate hike since June 2006 dominated the fixed-income market throughout 2015 and contributed to heightened market volatility.
Meanwhile, other leading central banks pursued aggressive stimulus programs. This global divergence of monetary policies made U.S. Treasury yields relatively more attractive than government bond yields of other nations, where yields declined at a greater pace. Global divergence also initially helped strengthen the U.S. dollar relative to other currencies. But the dollar weakened late in the reporting period as the Fed adopted a more dovish tone toward monetary policy.
Early in the 12-month period, U.S. bond market performance stumbled, largely due to Fed rate-hike speculation, a sharp bond market sell-off in Europe, and fallout from Greece’s inability to repay its government debt. Performance rebounded in the third quarter of 2015 as Greece reached a deal with its creditors. The global economic slowdown sparked a flight to quality, which generally favored high-quality bonds and pushed back the Fed’s rate-hike plans. Investors assumed the Fed would begin to normalize short-term interest rates at its December monetary policy meeting. This expectation drove Treasury yields higher (and returns lower) during the fourth quarter of 2015, particularly among shorter-maturity securities, which are the most sensitive to Fed policy. On December 16, the Fed finally initiated “liftoff” with an increase of 25 basis points (one basis point equals 0.01%) in the federal funds rate target, pushing the overnight lending rate from 0.00%-0.25% to 0.25%-0.50%.
Most investors assumed the Fed would continue rate normalization in the first quarter of 2016. However, mounting concerns about China’s economic slowdown, lackluster global growth, weak oil prices, and equity market volatility kept the Fed on hold. These factors also triggered a rally among U.S. Treasury and other high-quality bonds to start 2016. Midway through the first quarter of 2016, stabilization in the oil markets restored investors’ “risk-on” sentiment, and Treasury returns stalled. But late in the quarter, the Fed reduced its 2016 rate-hike forecast from four to two increases, triggering another Treasury market rally to close out the period.
* All fund returns referenced in this commentary are for Investor Class shares. Performance for other share classes will vary due to differences in fee structure; when Investor Class performance exceeds that of the index, other share classes may not. See page 3 for returns for all share classes.
Against this backdrop, the Treasury yield curve flattened during the 12-month period, as longer-maturity yields declined due to investor demand and weak inflation and shorter-maturity yields increased on Fed rate-hike expectations. The yield on the benchmark 10-year Treasury note declined 15 basis points to 1.77% at the end of March 2016, while the yield on the two-year Treasury note increased 16 basis points to 0.72%, according to Bloomberg.
Mortgage interest rates declined fractionally during the 12-month period, with the average 30-year conventional mortgage rate ending March 2016 at 3.71%, compared with 3.77% in March 2015, according to the Federal Home Loan Mortgage Corporation. Within the mortgage-backed securities (MBS) market, a favorable supply/demand backdrop helped mortgage securities advance and modestly outperform Treasuries for the 12-month period. The Fed continued to support the mortgage market by reinvesting the interest and principal payments from its MBS holdings back into the sector.
Duration Positioning Detracted from Performance
We entered the 12-month period expecting a gradual rise in U.S. interest rates. Accordingly, we maintained a shorter duration than the index. This positioning slightly detracted from relative performance as longer-maturity interest rates generally declined. Given the uncertainty surrounding the timing of interest rate normalization, we shifted from a slightly shorter-than-index duration to a neutral duration in the third calendar quarter of 2015.
In terms of sector positioning, we maintained an overweight position in 30-year GNMA securities and corresponding underweight to 15-year GNMAs. This positioning contributed to relative performance as 30-year securities generally outperformed 15-year GNMAs. We also continued to overweight intermediate- and higher-coupon mortgages versus lower-coupon securities, which aided relative performance.
In terms of security selection, we continued to emphasize single-issuer GNMA securities (Ginnie Mae I MBS) over those with multiple originators (Ginnie Mae II MBS). Ginnie Mae I MBS, which generally provide prepayment protection while delivering incremental income to the fund, underperformed during the reporting period and detracted from fund performance. Elsewhere, our portfolio-only holdings in adjustable-rate mortgages contributed to performance, while our out-of-index agency collateralized mortgage obligations slightly detracted from results.
Outlook
We believe U.S. economic fundamentals eventually will cause the Fed to resume interest-rate normalization. But weaker global economic fundamentals, U.S. dollar strength, weak commodity prices, and geopolitical risks may delay Fed action and keep rates range-bound. Given this uncertainty, we plan to maintain a neutral duration while continuing to focus on intermediate- and higher-coupon securities. We believe relatively stable mortgage rates and the Fed’s continuing reinvestment in the MBS sector should support agency mortgage securities. We will remain selective in our purchases, favoring mortgage securities we believe are undervalued and provide favorable prepayment terms.
|
| |
| MARCH 31, 2016 | |
| Portfolio at a Glance | |
| Average Duration (effective) | 3.1 years |
| Weighted Average Life | 4.9 years |
| | |
| Types of Investments in Portfolio | % of net assets |
| U.S. Government Agency Mortgage-Backed Securities (all GNMAs) | 100.9% |
| U.S. Government Agency Collateralized Mortgage Obligations (all GNMAs) | 8.2% |
| Temporary Cash Investments | 15.6% |
| Other Assets and Liabilities | (24.7)%* |
*Amount relates primarily to payable for investments purchased, but not settled, at period end.
Fund shareholders may incur two types of costs: (1) transaction costs, including sales charges (loads) on purchase payments and redemption/exchange fees; and (2) ongoing costs, including management fees; distribution and service (12b-1) fees; and other fund expenses. This example is intended to help you understand your ongoing costs (in dollars) of investing in your fund and to compare these costs with the ongoing cost of investing in other mutual funds.
The example is based on an investment of $1,000 made at the beginning of the period and held for the entire period from October 1, 2015 to March 31, 2016.
Actual Expenses
The table provides information about actual account values and actual expenses for each class. You may use the information, together with the amount you invested, to estimate the expenses that you paid over the period. First, identify the share class you own. Then simply divide your account value by $1,000 (for example, an $8,600 account value divided by $1,000 = 8.6), then multiply the result by the number under the heading “Expenses Paid During Period” to estimate the expenses you paid on your account during this period.
If you hold Investor Class shares of any American Century Investments fund, or Institutional Class shares of the American Century Diversified Bond Fund, in an American Century Investments account (i.e., not a financial intermediary or retirement plan account), American Century Investments may charge you a $12.50 semiannual account maintenance fee if the value of those shares is less than $10,000. We will redeem shares automatically in one of your accounts to pay the $12.50 fee. In determining your total eligible investment amount, we will include your investments in all personal accounts (including American Century Investments Brokerage accounts) registered under your Social Security number. Personal accounts include individual accounts, joint accounts, UGMA/UTMA accounts, personal trusts, Coverdell Education Savings Accounts and IRAs (including traditional, Roth, Rollover, SEP-, SARSEP- and SIMPLE-IRAs), and certain other retirement accounts. If you have only business, business retirement, employer-sponsored or American Century Investments Brokerage accounts, you are currently not subject to this fee. If you are subject to the Account Maintenance Fee, your account value could be reduced by the fee amount.
Hypothetical Example for Comparison Purposes
The table also provides information about hypothetical account values and hypothetical expenses based on the actual expense ratio of each class of your fund and an assumed rate of return of 5% per year before expenses, which is not the actual return of a fund’s share class. The hypothetical account values and expenses may not be used to estimate the actual ending account balance or expenses you paid for the period. You may use this information to compare the ongoing costs of investing in your fund and other funds. To do so, compare this 5% hypothetical example with the 5% hypothetical examples that appear in the shareholder reports of the other funds.
Please note that the expenses shown in the table are meant to highlight your ongoing costs only and do not reflect any transactional costs, such as sales charges (loads) or redemption/exchange fees. Therefore, the table is useful in comparing ongoing costs only, and will not help you determine the relative total costs of owning different funds. In addition, if these transactional costs were included, your costs would have been higher.
|
| | | | |
| | Beginning
Account Value
10/1/15 | Ending
Account Value
3/31/16 | Expenses Paid
During Period(1)10/1/15 - 3/31/16 | Annualized
Expense Ratio(1) |
| Actual | | | | |
| Investor Class | $1,000 | $1,014.80 | $2.77 | 0.55% |
| Institutional Class | $1,000 | $1,015.90 | $1.76 | 0.35% |
| A Class | $1,000 | $1,013.60 | $4.03 | 0.80% |
| C Class | $1,000 | $1,008.80 | $7.78 | 1.55% |
| R Class | $1,000 | $1,012.30 | $5.28 | 1.05% |
| Hypothetical | | | | |
| Investor Class | $1,000 | $1,022.25 | $2.78 | 0.55% |
| Institutional Class | $1,000 | $1,023.25 | $1.77 | 0.35% |
| A Class | $1,000 | $1,021.00 | $4.04 | 0.80% |
| C Class | $1,000 | $1,017.25 | $7.82 | 1.55% |
| R Class | $1,000 | $1,019.75 | $5.30 | 1.05% |
| |
| (1) | Expenses are equal to the class's annualized expense ratio listed in the table above, multiplied by the average account value over the period, multiplied by 183, the number of days in the most recent fiscal half-year, divided by 366, to reflect the one-half year period. |
MARCH 31, 2016
|
| | | | | | |
| | Principal Amount | Value |
U.S. GOVERNMENT AGENCY MORTGAGE-BACKED SECURITIES(1) — 100.9% |
| Adjustable-Rate U.S. Government Agency Mortgage-Backed Securities — 2.6% |
| GNMA, VRN, 1.75%, 4/20/16 | $ | 18,941,867 |
| $ | 19,748,448 |
|
| GNMA, VRN, 1.875%, 4/20/16 | 4,466,862 |
| 4,650,403 |
|
| GNMA, VRN, 2.00%, 4/20/16 | 6,695,390 |
| 6,980,200 |
|
| | | 31,379,051 |
|
| Fixed-Rate U.S. Government Agency Mortgage-Backed Securities — 98.3% |
GNMA, 3.00%, 4/20/16(2) | 135,000,000 |
| 139,925,385 |
|
| GNMA, 3.00%, 2/20/43 to 7/20/45 | 49,779,621 |
| 51,690,008 |
|
GNMA, 3.50%, 4/20/16(2) | 120,000,000 |
| 126,871,876 |
|
| GNMA, 3.50%, 12/20/41 to 12/20/44 | 280,403,274 |
| 297,222,235 |
|
GNMA, 4.00%, 4/20/16(2) | 30,000,000 |
| 32,080,084 |
|
| GNMA, 4.00%, 12/20/39 to 5/15/42 | 160,054,012 |
| 172,636,961 |
|
| GNMA, 4.50%, 7/15/33 to 3/20/42 | 106,825,381 |
| 116,801,935 |
|
| GNMA, 5.00%, 6/15/33 to 5/20/41 | 87,584,246 |
| 97,375,780 |
|
| GNMA, 5.50%, 4/15/33 to 8/15/39 | 81,987,014 |
| 92,656,627 |
|
| GNMA, 6.00%, 2/20/26 to 2/20/39 | 37,171,005 |
| 42,441,188 |
|
| GNMA, 6.50%, 9/20/23 to 11/15/38 | 5,548,206 |
| 6,504,303 |
|
| GNMA, 7.00%, 12/20/25 to 12/20/29 | 813,659 |
| 993,600 |
|
| GNMA, 7.25%, 4/15/23 to 6/15/23 | 36,894 |
| 37,772 |
|
| GNMA, 7.50%, 12/20/23 to 2/20/31 | 157,687 |
| 198,174 |
|
| GNMA, 7.65%, 9/15/16 to 12/15/16 | 4,900 |
| 4,912 |
|
| GNMA, 7.75%, 11/15/22 | 19,501 |
| 19,574 |
|
| GNMA, 7.77%, 4/15/20 to 6/15/20 | 84,655 |
| 86,801 |
|
| GNMA, 7.89%, 9/20/22 | 8,278 |
| 8,308 |
|
| GNMA, 7.98%, 6/15/19 | 11,084 |
| 11,124 |
|
| GNMA, 8.00%, 3/15/17 to 7/20/30 | 755,817 |
| 799,395 |
|
| GNMA, 8.25%, 4/20/17 to 2/15/22 | 154,019 |
| 157,275 |
|
| GNMA, 8.50%, 6/20/16 to 12/15/30 | 553,098 |
| 608,946 |
|
| GNMA, 8.75%, 3/20/17 to 7/15/27 | 67,904 |
| 69,455 |
|
| GNMA, 9.00%, 6/15/16 to 1/15/25 | 230,116 |
| 243,122 |
|
| GNMA, 9.25%, 10/15/16 to 3/15/25 | 50,196 |
| 51,075 |
|
| GNMA, 9.50%, 8/15/17 to 7/20/25 | 169,012 |
| 172,747 |
|
| GNMA, 9.75%, 12/15/18 to 11/20/21 | 41,537 |
| 42,814 |
|
| GNMA, 10.00%, 12/20/16 to 8/15/21 | 3,268 |
| 3,315 |
|
| GNMA, 10.25%, 2/15/19 | 3,494 |
| 3,512 |
|
| GNMA, 10.50%, 10/15/16 to 4/20/19 | 742 |
| 748 |
|
| GNMA, 11.00%, 9/15/18 to 6/15/20 | 18,168 |
| 18,274 |
|
| | | 1,179,737,325 |
|
TOTAL U.S. GOVERNMENT AGENCY MORTGAGE-BACKED SECURITIES (Cost $1,182,372,741) | 1,211,116,376 |
|
U.S. GOVERNMENT AGENCY COLLATERALIZED MORTGAGE OBLIGATIONS(1) — 8.2% |
| GNMA, Series 1999-43, Class FB, VRN, 0.79%, 4/16/16 | 1,846,006 |
| 1,851,067 |
|
| GNMA, Series 2000-22, Class FG, VRN, 0.64%, 4/16/16 | 15,305 |
| 15,335 |
|
|
| | | | | | |
| | Principal Amount/Shares | Value |
| GNMA, Series 2001-59, Class FD, VRN, 0.94%, 4/16/16 | $ | 598,204 |
| $ | 602,701 |
|
| GNMA, Series 2001-62, Class FB, VRN, 0.94%, 4/16/16 | 1,197,272 |
| 1,206,479 |
|
| GNMA, Series 2002-13, Class FA, VRN, 0.94%, 4/16/16 | 747,878 |
| 753,995 |
|
| GNMA, Series 2002-24, Class FA, VRN, 0.94%, 4/16/16 | 1,518,000 |
| 1,532,601 |
|
| GNMA, Series 2002-29, Class FA SEQ, VRN, 0.78%, 4/20/16 | 535,379 |
| 538,503 |
|
| GNMA, Series 2002-31, Class FW, VRN, 0.84%, 4/16/16 | 457,150 |
| 459,376 |
|
| GNMA, Series 2003-110, Class F, VRN, 0.83%, 4/20/16 | 1,995,457 |
| 2,008,888 |
|
| GNMA, Series 2003-42, Class FW, VRN, 0.78%, 4/20/16 | 773,236 |
| 777,344 |
|
| GNMA, Series 2003-66, Class HF, VRN, 0.88%, 4/20/16 | 1,220,902 |
| 1,230,092 |
|
| GNMA, Series 2004-30, Class PD, 5.00%, 2/20/33 | 146,750 |
| 146,828 |
|
| GNMA, Series 2004-39, Class XF SEQ, VRN, 0.69%, 4/16/16 | 843,582 |
| 844,340 |
|
| GNMA, Series 2004-76, Class F, VRN, 0.83%, 4/20/16 | 1,701,603 |
| 1,713,133 |
|
| GNMA, Series 2005-13, Class FA, VRN, 0.63%, 4/20/16 | 4,683,383 |
| 4,687,474 |
|
| GNMA, Series 2007-5, Class FA, VRN, 0.57%, 4/20/16 | 4,650,338 |
| 4,639,309 |
|
| GNMA, Series 2007-58, Class FC, VRN, 0.93%, 4/20/16 | 2,747,763 |
| 2,765,383 |
|
| GNMA, Series 2007-74, Class FL, VRN, 0.90%, 4/16/16 | 6,353,578 |
| 6,407,462 |
|
| GNMA, Series 2008-18, Class FH, VRN, 1.03%, 4/20/16 | 3,933,517 |
| 3,987,699 |
|
| GNMA, Series 2008-2, Class LF, VRN, 0.89%, 4/20/16 | 2,882,867 |
| 2,907,702 |
|
| GNMA, Series 2008-27, Class FB, VRN, 0.98%, 4/20/16 | 7,158,925 |
| 7,242,923 |
|
| GNMA, Series 2008-61, Class KF, VRN, 1.10%, 4/20/16 | 3,624,400 |
| 3,685,207 |
|
| GNMA, Series 2008-73, Class FK, VRN, 1.19%, 4/20/16 | 4,895,068 |
| 4,999,118 |
|
| GNMA, Series 2008-75, Class F, VRN, 0.96%, 4/20/16 | 5,427,490 |
| 5,470,511 |
|
| GNMA, Series 2008-88, Class UF, VRN, 1.43%, 4/20/16 | 3,385,784 |
| 3,474,781 |
|
| GNMA, Series 2009-109, Class FA, VRN, 0.84%, 4/16/16 | 631,493 |
| 632,035 |
|
| GNMA, Series 2009-127, Class FA, VRN, 0.98%, 4/20/16 | 4,688,025 |
| 4,722,738 |
|
| GNMA, Series 2009-76, Class FB, VRN, 1.04%, 4/16/16 | 3,383,189 |
| 3,413,936 |
|
| GNMA, Series 2009-92, Class FJ, VRN, 1.12%, 4/16/16 | 1,987,687 |
| 2,012,879 |
|
| GNMA, Series 2010-14, Class QF, VRN, 0.89%, 4/16/16 | 13,254,312 |
| 13,357,815 |
|
| GNMA, Series 2010-25, Class FB, VRN, 0.99%, 4/16/16 | 10,406,891 |
| 10,487,041 |
|
TOTAL U.S. GOVERNMENT AGENCY COLLATERALIZED MORTGAGE OBLIGATIONS (Cost $98,328,407) | 98,574,695 |
|
TEMPORARY CASH INVESTMENTS(3) — 15.6% | | |
| Repurchase Agreement, Fixed Income Clearing Corp., (collateralized by various U.S. Treasury obligations, 2.00% - 3.75%, 8/15/25 - 11/15/43, valued at $115,778,763), at 0.10%, dated 3/31/16, due 4/1/16 (Delivery value $113,503,315) | | 113,503,000 |
|
| SSgA U.S. Government Money Market Fund, Class N | 74,463,652 |
| 74,463,652 |
|
TOTAL TEMPORARY CASH INVESTMENTS (Cost $187,966,652) | | 187,966,652 |
|
TOTAL INVESTMENT SECURITIES — 124.7% (Cost $1,468,667,800) | | 1,497,657,723 |
|
OTHER ASSETS AND LIABILITIES(4) — (24.7)% | | (297,029,038) |
|
| TOTAL NET ASSETS — 100.0% | | $ | 1,200,628,685 |
|
|
| | |
| NOTES TO SCHEDULE OF INVESTMENTS |
| GNMA | - | Government National Mortgage Association |
| SEQ | - | Sequential Payer |
| VRN | - | Variable Rate Note. Interest reset date is indicated. Rate shown is effective at the period end. |
| |
| (1) | Final maturity date indicated, unless otherwise noted. |
| |
| (2) | Forward commitment. Settlement date is indicated. |
| |
| (3) | Category includes collateral received at the custodian bank for margin requirements on forward commitments. At the period end, the aggregate value of cash deposits received was $999,727. |
| |
| (4) | Amount relates primarily to payable for investments purchased, but not settled, at period end. |
See Notes to Financial Statements.
|
|
| Statement of Assets and Liabilities |
|
| | | |
| MARCH 31, 2016 | |
| Assets | |
| Investment securities, at value (cost of $1,468,667,800) | $ | 1,497,657,723 |
|
| Receivable for capital shares sold | 479,277 |
|
| Interest receivable | 3,434,716 |
|
| | 1,501,571,716 |
|
| | |
| Liabilities | |
| Payable for collateral received for forward commitments | 999,727 |
|
| Payable for investments purchased | 296,760,469 |
|
| Payable for capital shares redeemed | 2,391,191 |
|
| Accrued management fees | 538,192 |
|
| Distribution and service fees payable | 28,808 |
|
| Dividends payable | 224,644 |
|
| | 300,943,031 |
|
| | |
| Net Assets | $ | 1,200,628,685 |
|
| | |
| Net Assets Consist of: | |
| Capital paid in | $ | 1,208,979,495 |
|
| Undistributed net investment income | 8,847 |
|
| Accumulated net realized loss | (37,349,580) |
|
| Net unrealized appreciation | 28,989,923 |
|
| | $ | 1,200,628,685 |
|
|
| | | | | |
| | Net Assets | Shares Outstanding | Net Asset Value Per Share |
| Investor Class |
| $1,034,732,406 |
| 95,808,232 | $10.80 |
| Institutional Class |
| $71,189,750 |
| 6,592,025 | $10.80 |
| A Class |
| $76,082,928 |
| 7,044,600 | $10.80* |
| C Class |
| $11,753,315 |
| 1,088,036 | $10.80 |
| R Class |
| $6,870,286 |
| 636,413 | $10.80 |
*Maximum offering price $11.31 (net asset value divided by 0.955).
See Notes to Financial Statements.
|
| | | |
| YEAR ENDED MARCH 31, 2016 | |
| Investment Income (Loss) | |
| Income: | |
| Interest | $ | 24,482,337 |
|
| | |
| Expenses: | |
| Management fees | 6,671,229 |
|
| Distribution and service fees: | |
| A Class | 327,536 |
|
| C Class | 118,510 |
|
| R Class | 27,914 |
|
| Trustees' fees and expenses | 65,422 |
|
| Other expenses | 1,557 |
|
| | 7,212,168 |
|
| | |
| Net investment income (loss) | 17,270,169 |
|
| | |
| Realized and Unrealized Gain (Loss) | |
| Net realized gain (loss) on investment transactions | 6,851,686 |
|
| Change in net unrealized appreciation (depreciation) on investments | (7,830,282) |
|
| | |
| Net realized and unrealized gain (loss) | (978,596) |
|
| | |
| Net Increase (Decrease) in Net Assets Resulting from Operations | $ | 16,291,573 |
|
See Notes to Financial Statements.
|
|
| Statement of Changes in Net Assets |
|
| | | | | | |
| YEARS ENDED MARCH 31, 2016 AND MARCH 31, 2015 |
| Increase (Decrease) in Net Assets | March 31, 2016 | March 31, 2015 |
| Operations | | |
| Net investment income (loss) | $ | 17,270,169 |
| $ | 22,325,321 |
|
| Net realized gain (loss) | 6,851,686 |
| 16,149,430 |
|
| Change in net unrealized appreciation (depreciation) | (7,830,282 | ) | 20,881,948 |
|
| Net increase (decrease) in net assets resulting from operations | 16,291,573 |
| 59,356,699 |
|
| | | |
| Distributions to Shareholders | | |
| From net investment income: | | |
| Investor Class | (24,338,279 | ) | (27,108,650 | ) |
| Institutional Class | (1,578,470 | ) | (1,323,477 | ) |
| A Class | (2,687,538 | ) | (5,910,784 | ) |
| C Class | (159,451 | ) | (207,794 | ) |
| R Class | (103,262 | ) | (88,778 | ) |
| Decrease in net assets from distributions | (28,867,000 | ) | (34,639,483 | ) |
| | | |
| Capital Share Transactions | | |
| Net increase (decrease) in net assets from capital share transactions (Note 5) | (199,722,553 | ) | (71,702,322 | ) |
| | | |
| Net increase (decrease) in net assets | (212,297,980 | ) | (46,985,106 | ) |
| | | |
| Net Assets | | |
| Beginning of period | 1,412,926,665 |
| 1,459,911,771 |
|
| End of period | $ | 1,200,628,685 |
| $ | 1,412,926,665 |
|
| | | |
| Undistributed net investment income | $ | 8,847 |
| $ | 15,670 |
|
See Notes to Financial Statements.
|
|
| Notes to Financial Statements |
MARCH 31, 2016
1. Organization
American Century Government Income Trust (the trust) is registered under the Investment Company Act of 1940, as amended (the 1940 Act), as an open-end management investment company and is organized as a Massachusetts business trust. Ginnie Mae Fund (the fund) is one fund in a series issued by the trust. The fund’s investment objective is to seek high current income while maintaining liquidity and safety of principal by investing primarily in Government National Mortgage Association certificates.
The fund offers the Investor Class, the Institutional Class, the A Class, the C Class and the R Class. The A Class may incur an initial sales charge. The A Class and C Class may be subject to a contingent deferred sales charge. The share classes differ principally in their respective sales charges and distribution and shareholder servicing expenses and arrangements. The Institutional Class is made available to institutional shareholders or through financial intermediaries whose clients do not require the same level of shareholder and administrative services as shareholders of other classes. As a result, the Institutional Class is charged a lower unified management fee.
2. Significant Accounting Policies
The following is a summary of significant accounting policies consistently followed by the fund in preparation of its financial statements. The fund is an investment company and follows accounting and reporting guidance in accordance with accounting principles generally accepted in the United States of America. This may require management to make certain estimates and assumptions at the date of the financial statements. Actual results could differ from these estimates. Management evaluated the impact of events or transactions occurring through the date the financial statements were issued that would merit recognition or disclosure.
Investment Valuations — The fund determines the fair value of its investments and computes its net asset value per share at the close of regular trading (usually 4 p.m. Eastern time) on the New York Stock Exchange (NYSE) on each day the NYSE is open. The Board of Trustees has adopted valuation policies and procedures to guide the investment advisor in the fund’s investment valuation process and to provide methodologies for the oversight of the fund’s pricing function.
Fixed income securities are valued at the evaluated mean as provided by independent pricing services or at the mean of the most recent bid and asked prices as provided by investment dealers. U.S. Treasury and Government Agency securities are valued using market models that consider trade data, quotations from dealers and active market makers, relevant yield curve and spread data, creditworthiness, trade data or market information on comparable securities, and other relevant security specific information. Mortgage-related and asset-backed securities are valued based on models that consider trade data, prepayment and default projections, benchmark yield and spread data and estimated cash flows of each tranche of the issuer.
Open-end management investment companies are valued at the reported net asset value per share. Repurchase agreements are valued at cost, which approximates fair value.
If the fund determines that the market price for an investment is not readily available or the valuation methods mentioned above do not reflect an investment’s fair value, such investment is valued as determined in good faith by the Board of Trustees or its delegate, in accordance with policies and procedures adopted by the Board of Trustees. In its determination of fair value, the fund may review several factors including, but not limited to, market information regarding the specific investment or comparable investments and correlation with other investment types, futures indices or general market indicators. Circumstances that may cause the fund to use these procedures to value an investment include, but are not limited to: an investment has been declared in default or is distressed; trading in a security has been suspended during the trading day or a security is not actively trading on its principal exchange; prices received from a regular pricing source are deemed unreliable; or there is a foreign market holiday and no trading occurred.
The fund monitors for significant events occurring after the close of an investment’s primary exchange but before the fund’s net asset value per share is determined. Significant events may include, but are not limited to: corporate announcements and transactions; governmental action and political unrest that could impact a specific investment or an investment sector; or armed conflicts, natural disasters and similar events that could affect investments in a specific country or region.
Security Transactions — Security transactions are accounted for as of the trade date. Net realized gains and losses are determined on the identified cost basis, which is also used for federal income tax purposes.
Investment Income — Interest income is recorded on the accrual basis and includes paydown gain (loss) and accretion of discounts and amortization of premiums.
Forward Commitments — The fund may engage in securities transactions on a forward commitment basis. In these transactions, the securities’ prices and yields are fixed on the date of the commitment. The fund may sell a to-be-announced (TBA) security and at the same time make a commitment to purchase the same security at a future date at a specified price. Conversely, the fund may purchase a TBA security and at the same time make a commitment to sell the same security at a future date at a specified price. These types of transactions are known as “TBA roll” transactions and are accounted for as purchases and sales. The fund will segregate cash, cash equivalents or other appropriate liquid securities on its records in amounts sufficient to meet the purchase price.
Repurchase Agreements — The fund may enter into repurchase agreements with institutions that American Century Investment Management, Inc. (ACIM) (the investment advisor) has determined are creditworthy pursuant to criteria adopted by the Board of Trustees. The fund requires that the collateral, represented by securities, received in a repurchase transaction be transferred to the custodian in a manner sufficient to enable the fund to obtain those securities in the event of a default under the repurchase agreement. ACIM monitors, on a daily basis, the securities transferred to ensure the value, including accrued interest, of the securities under each repurchase agreement is equal to or greater than amounts owed to the fund under each repurchase agreement.
Joint Trading Account — Pursuant to an Exemptive Order issued by the Securities and Exchange Commission, the fund, along with certain other funds in the American Century Investments family of funds, may transfer uninvested cash balances into a joint trading account. These balances are invested in one or more repurchase agreements that are collateralized by U.S. Treasury or Agency obligations.
Segregated Assets — In accordance with the 1940 Act, the fund segregates assets on its books and records to cover certain types of investments, including, but not limited to, futures contracts, forward commitments, when-issued securities, swap agreements and certain forward foreign currency exchange contracts. ACIM monitors, on a daily basis, the securities segregated to ensure the fund designates a sufficient amount of liquid assets, marked-to-market daily. The fund may also receive assets or be required to pledge assets at the custodian bank or with a broker for margin requirements on futures contracts, forward commitments and swap agreements.
Income Tax Status — It is the fund’s policy to distribute substantially all net investment income and net realized gains to shareholders and to otherwise qualify as a regulated investment company under provisions of the Internal Revenue Code. Accordingly, no provision has been made for income taxes. The fund files U.S. federal, state, local and non-U.S. tax returns as applicable. The fund's tax returns are subject to examination by the relevant taxing authority until expiration of the applicable statute of limitations, which is generally three years from the date of filing but can be longer in certain jurisdictions. At this time, management believes there are no uncertain tax positions which, based on their technical merit, would not be sustained upon examination and for which it is reasonably possible that the total amounts of unrecognized tax benefits will significantly change in the next twelve months.
Multiple Class — All shares of the fund represent an equal pro rata interest in the net assets of the class to which such shares belong, and have identical voting, dividend, liquidation and other rights and the same terms and conditions, except for class specific expenses and exclusive rights to vote on matters affecting only individual classes. Income, non-class specific expenses, and realized and unrealized capital gains and losses of the fund are allocated to each class of shares based on their relative net assets.
Distributions to Shareholders — Distributions from net investment income, if any, are declared daily and paid monthly. Distributions from net realized gains, if any, are generally declared and paid annually.
Indemnifications — Under the trust’s organizational documents, its officers and trustees are indemnified against certain liabilities arising out of the performance of their duties to the fund. In addition, in the normal course of business, the fund enters into contracts that provide general indemnifications. The maximum exposure under these arrangements is unknown as this would involve future claims that may be made against a fund. The risk of material loss from such claims is considered by management to be remote.
3. Fees and Transactions with Related Parties
Certain officers and trustees of the trust are also officers and/or directors of American Century Companies, Inc. (ACC). The trust's investment advisor, ACIM, the trust's distributor, American Century Investment Services, Inc. (ACIS), and the trust's transfer agent, American Century Services, LLC, are wholly owned, directly or indirectly, by ACC.
Management Fees — The trust has entered into a management agreement with ACIM, under which ACIM provides the fund with investment advisory and management services in exchange for a single, unified management fee (the fee) per class. The agreement provides that all expenses of managing and operating the fund, except distribution and service fees, brokerage expenses, taxes, interest, fees and expenses of the independent trustees (including legal counsel fees), and extraordinary expenses, will be paid by ACIM. The fee is computed and accrued daily based on each class’s daily net assets and paid monthly in arrears. The fee consists of (1) an Investment Category Fee based on the daily net assets of the fund and certain other accounts managed by the investment advisor that are in the same broad investment category as the fund and (2) a Complex Fee based on the assets of all the funds in the American Century Investments family of funds. The rates for the Investment Category Fee range from 0.2425% to 0.3600%. The rates for the Complex Fee range from 0.2500% to 0.3100% for the Investor Class, A Class, C Class and R Class. The rates for the Complex Fee range from 0.0500% to 0.1100% for the Institutional Class. The effective annual management fee for each class for the year ended March 31, 2016 was 0.55% for the Investor Class, A Class, C Class and R Class and 0.35% for the Institutional Class.
Distribution and Service Fees — The Board of Trustees has adopted a separate Master Distribution and Individual Shareholder Services Plan for each of the A Class, C Class and R Class (collectively the plans), pursuant to Rule 12b-1 of the 1940 Act. The plans provide that the A Class will pay ACIS an annual distribution and service fee of 0.25%. The plans provide that the C Class will pay ACIS an annual distribution and service fee of 1.00%, of which 0.25% is paid for individual shareholder services and 0.75% is paid for distribution services. The plans provide that the R Class will pay ACIS an annual distribution and service fee of 0.50%. The fees are computed and accrued daily based on each class’s daily net assets and paid monthly in arrears. The fees are used to pay financial intermediaries for distribution and individual shareholder services. Fees incurred under the plans during the year ended March 31, 2016 are detailed in the Statement of Operations.
Trustees’ Fees and Expenses — The Board of Trustees is responsible for overseeing the investment advisor’s management and operations of the fund. The trustees receive detailed information about the fund and its investment advisor regularly throughout the year, and meet at least quarterly with management of the investment advisor to review reports about fund operations. The fund’s officers do not receive compensation from the fund.
4. Investment Transactions
Purchases and sales of investment securities, excluding short-term investments, for the year ended March 31, 2016 were $4,248,369,365 and $4,494,557,480, respectively, all of which are U.S. Treasury and Government Agency obligations.
5. Capital Share Transactions
Transactions in shares of the fund were as follows (unlimited number of shares authorized):
|
| | | | | | | | | |
| | Year ended
March 31, 2016 | Year ended
March 31, 2015 |
| | Shares | Amount | Shares | Amount |
| Investor Class | | | | |
| Sold | 13,381,407 |
| $ | 144,175,112 |
| 12,355,517 | $ | 133,706,654 |
|
| Issued in reinvestment of distributions | 2,036,198 |
| 21,943,209 |
| 2,256,540 | 24,427,811 |
|
| Redeemed | (19,651,734) |
| (211,724,798) |
| (21,414,580) | (231,518,944) |
|
| | (4,234,129) |
| (45,606,477) |
| (6,802,523) | (73,384,479) |
|
| Institutional Class | | | | |
| Sold | 3,328,212 |
| 35,792,241 |
| 2,527,094 | 27,349,902 |
|
| Issued in reinvestment of distributions | 134,697 |
| 1,451,335 |
| 110,027 | 1,191,758 |
|
| Redeemed | (2,108,144) |
| (22,683,168) |
| (1,674,871) | (18,115,286) |
|
| | 1,354,765 |
| 14,560,408 |
| 962,250 | 10,426,374 |
|
| A Class | | | | |
| Sold | 2,307,484 |
| 24,859,600 |
| 10,090,070 | 109,202,215 |
|
| Issued in reinvestment of distributions | 207,354 |
| 2,238,452 |
| 511,383 | 5,537,001 |
|
| Redeemed | (18,306,869) |
| (196,927,677) |
| (11,055,910) | (119,634,045) |
|
| | (15,792,031 | ) | (169,829,625 | ) | (454,457) | (4,894,829) |
|
| C Class | | | | |
| Sold | 140,089 |
| 1,509,538 |
| 195,158 | 2,113,082 |
|
| Issued in reinvestment of distributions | 12,295 |
| 132,541 |
| 14,495 | 156,920 |
|
| Redeemed | (217,380) |
| (2,342,925) |
| (617,148) | (6,673,062) |
|
| | (64,996) |
| (700,846) |
| (407,495) | (4,403,060) |
|
| R Class | | | | |
| Sold | 507,053 |
| 5,464,495 |
| 193,569 | 2,097,159 |
|
| Issued in reinvestment of distributions | 8,446 |
| 90,993 |
| 8,062 | 87,261 |
|
| Redeemed | (343,735) |
| (3,701,501) |
| (150,497) | (1,630,748) |
|
| | 171,764 |
| 1,853,987 |
| 51,134 | 553,672 |
|
| Net increase (decrease) | (18,564,627) |
| $ | (199,722,553 | ) | (6,651,091) | $ | (71,702,322 | ) |
6. Fair Value Measurements
The fund’s investments valuation process is based on several considerations and may use multiple inputs to determine the fair value of the investments held by the fund. In conformity with accounting principles generally accepted in the United States of America, the inputs used to determine a valuation are classified into three broad levels.
| |
| • | Level 1 valuation inputs consist of unadjusted quoted prices in an active market for identical investments. |
| |
| • | Level 2 valuation inputs consist of direct or indirect observable market data (including quoted prices for comparable investments, evaluations of subsequent market events, interest rates, prepayment speeds, credit risk, etc.). These inputs also consist of quoted prices for identical investments initially expressed in local currencies that are adjusted through translation into U.S. dollars. |
| |
| • | Level 3 valuation inputs consist of unobservable data (including a fund’s own assumptions). |
The level classification is based on the lowest level input that is significant to the fair valuation measurement. The valuation inputs are not necessarily an indication of the risks associated with investing in these securities or other financial instruments. There were no significant transfers between levels during the period.
The following is a summary of the level classifications as of period end. The Schedule of Investments provides additional information on the fund’s portfolio holdings.
|
| | | | | | | | |
| | Level 1 | Level 2 | Level 3 |
| Assets | | | |
| Investment Securities | | | |
| U.S. Government Agency Mortgage-Backed Securities | — |
| $ | 1,211,116,376 |
| — |
|
| U.S. Government Agency Collateralized Mortgage Obligations | — |
| 98,574,695 |
| — |
|
| Temporary Cash Investments | $ | 74,463,652 |
| 113,503,000 |
| — |
|
| | $ | 74,463,652 |
| $ | 1,423,194,071 |
| — |
|
7. Risk Factors
The fund’s investment process may result in high portfolio turnover, which could mean high transaction costs, affecting both performance and capital gains tax liabilities to investors.
8. Federal Tax Information
The tax character of distributions paid during the years ended March 31, 2016 and March 31, 2015 were as follows:
|
| | | | | | |
| | 2016 | 2015 |
| Distributions Paid From | | |
| Ordinary income | $ | 28,867,000 |
| $ | 34,639,483 |
|
| Long-term capital gains | — |
| — |
|
The book-basis character of distributions made during the year from net investment income or net realized gains may differ from their ultimate characterization for federal income tax purposes. These differences reflect the differing character of certain income items and net realized gains and losses for financial statement and tax purposes, and may result in reclassification among certain capital accounts on the financial statements.
As of March 31, 2016, the federal tax cost of investments and the components of distributable earnings on a tax-basis were as follows:
|
| | | |
| Federal tax cost of investments | $ | 1,468,693,714 |
|
| Gross tax appreciation of investments | $ | 31,795,305 |
|
| Gross tax depreciation of investments | (2,831,296 | ) |
| Net tax appreciation (depreciation) of investments | $ | 28,964,009 |
|
| Undistributed ordinary income | $ | 8,847 |
|
| Accumulated short-term capital losses | $ | (6,952,221 | ) |
| Accumulated long-term capital losses | $ | (30,371,445 | ) |
The difference between book-basis and tax-basis unrealized appreciation (depreciation) is attributable primarily to the tax deferral of losses on wash sales.
Accumulated capital losses represent net capital loss carryovers that may be used to offset future realized capital gains for federal income tax purposes. The capital loss carryovers may be carried forward for an unlimited period. Future capital loss carryover utilization in any given year may be subject to Internal Revenue Code limitations.
|
| | | | | | | | | | | | | | | |
| For a Share Outstanding Throughout the Years Ended March 31 (except as noted) |
| Per-Share Data | | | | | | Ratios and Supplemental Data | |
| | | Income From Investment Operations: | | | | Ratio to Average Net Assets of: | | |
| | Net Asset Value, Beginning of Period | Net Investment Income (Loss)(1) | Net Realized and Unrealized Gain (Loss) | Total From Investment Operations | Distributions From Net Investment Income | Net Asset Value, End of Period | Total Return(2) | Operating Expenses | Operating Expenses(before expense waiver) | Net Investment Income (Loss) | Net Investment Income (Loss)(before expense waiver) | Portfolio Turnover Rate | Net Assets, End of Period (in thousands) |
| Investor Class | | | | | | | | | | | |
| 2016 | $10.89 | 0.15 | 0.01 | 0.16 | (0.25) | $10.80 | 1.53% | 0.55% | 0.55% | 1.42% | 1.42% | 308% |
| $1,034,732 |
|
| 2015 | $10.70 | 0.17 | 0.28 | 0.45 | (0.26) | $10.89 | 4.28% | 0.55% | 0.55% | 1.59% | 1.59% | 306% |
| $1,089,566 |
|
| 2014 | $11.10 | 0.17 | (0.29) | (0.12) | (0.28) | $10.70 | (1.02)% | 0.55% | 0.55% | 1.62% | 1.62% | 264% |
| $1,143,697 |
|
| 2013 | $11.21 | 0.25 | (0.01) | 0.24 | (0.35) | $11.10 | 2.16% | 0.55% | 0.55% | 2.26% | 2.26% | 237% |
| $1,519,666 |
|
| 2012 | $10.84 | 0.35 | 0.42 | 0.77 | (0.40) | $11.21 | 7.15% | 0.55% | 0.56% | 3.12% | 3.11% | 130% |
| $1,574,686 |
|
| Institutional Class | | | | | | | | | | | | |
| 2016 | $10.89 | 0.17 | 0.01 | 0.18 | (0.27) | $10.80 | 1.73% | 0.35% | 0.35% | 1.62% | 1.62% | 308% |
| $71,190 |
|
| 2015 | $10.70 | 0.19 | 0.28 | 0.47 | (0.28) | $10.89 | 4.49% | 0.35% | 0.35% | 1.79% | 1.79% | 306% |
| $57,037 |
|
| 2014 | $11.10 | 0.20 | (0.29) | (0.09) | (0.31) | $10.70 | (0.83)% | 0.35% | 0.35% | 1.82% | 1.82% | 264% |
| $45,757 |
|
| 2013 | $11.21 | 0.27 | (0.01) | 0.26 | (0.37) | $11.10 | 2.36% | 0.35% | 0.35% | 2.46% | 2.46% | 237% |
| $62,075 |
|
| 2012 | $10.83 | 0.37 | 0.43 | 0.80 | (0.42) | $11.21 | 7.47% | 0.35% | 0.36% | 3.32% | 3.31% | 130% |
| $40,336 |
|
|
| | | | | | | | | | | | | | | |
| For a Share Outstanding Throughout the Years Ended March 31 (except as noted) |
| Per-Share Data | | | | | | Ratios and Supplemental Data | |
| | | Income From Investment Operations: | | | | Ratio to Average Net Assets of: | | |
| | Net Asset Value, Beginning of Period | Net Investment Income (Loss)(1) | Net Realized and Unrealized Gain (Loss) | Total From Investment Operations | Distributions From Net Investment Income | Net Asset Value, End of Period | Total Return(2) | Operating Expenses | Operating Expenses(before expense waiver) | Net Investment Income (Loss) | Net Investment Income (Loss)(before expense waiver) | Portfolio Turnover Rate | Net Assets, End of Period (in thousands) |
| A Class | | | | | | | | | | | | | |
| 2016 | $10.89 | 0.12 | 0.02 | 0.14 | (0.23) | $10.80 | 1.28% | 0.80% | 0.80% | 1.17% | 1.17% | 308% |
| $76,083 |
|
| 2015 | $10.70 | 0.14 | 0.29 | 0.43 | (0.24) | $10.89 | 4.02% | 0.80% | 0.80% | 1.34% | 1.34% | 306% |
| $248,705 |
|
| 2014 | $11.10 | 0.15 | (0.29) | (0.14) | (0.26) | $10.70 | (1.27)% | 0.80% | 0.80% | 1.37% | 1.37% | 264% |
| $249,327 |
|
| 2013 | $11.21 | 0.22 | (0.01) | 0.21 | (0.32) | $11.10 | 1.90% | 0.80% | 0.80% | 2.01% | 2.01% | 237% |
| $310,736 |
|
| 2012 | $10.84 | 0.32 | 0.42 | 0.74 | (0.37) | $11.21 | 6.89% | 0.80% | 0.81% | 2.87% | 2.86% | 130% |
| $250,169 |
|
| C Class | | | | | | | | | | | | | |
| 2016 | $10.89 | 0.04 | 0.02 | 0.06 | (0.15) | $10.80 | 0.52% | 1.55% | 1.55% | 0.42% | 0.42% | 308% |
| $11,753 |
|
| 2015 | $10.71 | 0.06 | 0.28 | 0.34 | (0.16) | $10.89 | 3.15% | 1.55% | 1.55% | 0.59% | 0.59% | 306% |
| $12,560 |
|
| 2014 | $11.10 | 0.07 | (0.28) | (0.21) | (0.18) | $10.71 | (1.91)% | 1.55% | 1.55% | 0.62% | 0.62% | 264% |
| $16,706 |
|
| 2013 | $11.21 | 0.14 | (0.01) | 0.13 | (0.24) | $11.10 | 1.14% | 1.55% | 1.55% | 1.26% | 1.26% | 237% |
| $33,287 |
|
| 2012 | $10.84 | 0.23 | 0.43 | 0.66 | (0.29) | $11.21 | 6.09% | 1.55% | 1.56% | 2.12% | 2.11% | 130% |
| $13,809 |
|
| R Class | | | | | | | | | | | | | |
| 2016 | $10.89 | 0.10 | 0.01 | 0.11 | (0.20) | $10.80 | 1.03% | 1.05% | 1.05% | 0.92% | 0.92% | 308% |
| $6,870 |
|
| 2015 | $10.70 | 0.12 | 0.28 | 0.40 | (0.21) | $10.89 | 3.76% | 1.05% | 1.05% | 1.09% | 1.09% | 306% |
| $5,059 |
|
| 2014 | $11.09 | 0.12 | (0.28) | (0.16) | (0.23) | $10.70 | (1.43)% | 1.05% | 1.05% | 1.12% | 1.12% | 264% |
| $4,425 |
|
| 2013 | $11.21 | 0.20 | (0.03) | 0.17 | (0.29) | $11.09 | 1.56% | 1.05% | 1.05% | 1.76% | 1.76% | 237% |
| $4,773 |
|
| 2012 | $10.83 | 0.29 | 0.43 | 0.72 | (0.34) | $11.21 | 6.72% | 1.05% | 1.06% | 2.62% | 2.61% | 130% |
| $4,343 |
|
|
| | | | |
| Notes to Financial Highlights | | |
| |
| (1) | Computed using average shares outstanding throughout the period. |
| |
| (2) | Total returns are calculated based on the net asset value of the last business day and do not reflect applicable sales charges, if any. Total returns for periods less than one year are not annualized. |
See Notes to Financial Statements.
|
|
| Report of Independent Registered Public Accounting Firm |
To the Trustees of the American Century Government Income Trust and Shareholders of the Ginnie Mae Fund:
In our opinion, the accompanying statement of assets and liabilities, including the schedule of investments, and the related statements of operations and of changes in net assets and the financial highlights present fairly, in all material respects, the financial position of the Ginnie Mae Fund (one of the five funds comprising the American Century Government Income Trust, hereafter referred to as the “Fund”) at March 31, 2016, the results of its operations for the year then ended, the changes in its net assets for each of the two years in the period then ended and the financial highlights for each of the five years in the period then ended, in conformity with accounting principles generally accepted in the United States of America. These financial statements and financial highlights (hereafter referred to as "financial statements") are the responsibility of the Fund's management. Our responsibility is to express an opinion on these financial statements based on our audits. We conducted our audits of these financial statements in accordance with the standards of the Public Company Accounting Oversight Board (United States). Those standards require that we plan and perform the audit to obtain reasonable assurance about whether the financial statements are free of material misstatement. An audit includes examining, on a test basis, evidence supporting the amounts and disclosures in the financial statements, assessing the accounting principles used and significant estimates made by management, and evaluating the overall financial statement presentation. We believe that our audits, which included confirmation of securities at March 31, 2016 by correspondence with the custodian and brokers, provide a reasonable basis for our opinion.
PricewaterhouseCoopers LLP
Kansas City, Missouri
May 18, 2016
Board of Trustees
The individuals listed below serve as trustees of the funds. Each trustee will continue to serve in this capacity until death, retirement, resignation or removal from office. The board has adopted a mandatory retirement age for trustees who are not “interested persons,” as that term is defined in the Investment Company Act (independent trustees). Independent trustees shall retire on December 31 of the year in which they reach their 75th birthday; provided, however, that on or after January 1, 2022, independent trustees shall retire on December 31 of the year in which they reach their 76th birthday.
Mr. Thomas is an “interested person” because he currently serves as President and Chief Executive Officer of American Century Companies, Inc. (ACC), the parent company of American Century Investment Management, Inc. (ACIM or the advisor). The other trustees (more than three-fourths of the total number) are independent. They are not employees, directors or officers of, and have no financial interest in, ACC or any of its wholly owned, direct or indirect, subsidiaries, including ACIM, American Century Investment Services, Inc. (ACIS) and American Century Services, LLC (ACS), and they do not have any other affiliations, positions or relationships that would cause them to be considered “interested persons” under the Investment Company Act. The trustees serve in this capacity for eight (in the case of Mr. Thomas, 15) registered investment companies in the American Century Investments family of funds.
The following table presents additional information about the trustees. The mailing address for each trustee other than Mr. Thomas is 1665 Charleston Road, Mountain View, California 94043. The mailing address for Mr. Thomas is 4500 Main Street, Kansas City, Missouri 64111.
|
| | | | | |
Name (Year of Birth) | Position(s) Held with Funds | Length of Time Served | Principal Occupation(s) During Past 5 Years | Number of American Century Portfolios Overseen by Trustee | Other Directorships Held During Past 5 Years |
| Independent Trustees |
Tanya S. Beder (1955) | Trustee | Since 2011 | Chairman and CEO, SBCC Group Inc. (independent advisory services) (2006 to present) | 45 | CYS Investments, Inc. (NYSE mortgage arbitrage REIT) |
Jeremy I. Bulow (1954) | Trustee | Since 2011 | Professor of Economics, Stanford University, Graduate School of Business (1979 to present) | 45 | None |
Anne Casscells (1958) | Advisory Board Member | Since 2016 | Co-Chief Executive Officer and Chief Investment Officer, Aetos Alternatives Management (investment advisory firm) (2001 to present); Lecturer in Accounting, Stanford University, Graduate School of Business (2009 to present) | 45 | None |
Ronald J. Gilson (1946) | Trustee and Chairman of the Board | Since 1995 (Chairman since 2005) | Charles J. Meyers Professor of Law and Business, Stanford Law School (1979 to present); Marc and Eva Stern Professor of Law and Business, Columbia University School of Law (1992 to present) | 45 | None |
|
| | | | | |
Name (Year of Birth) | Position(s) Held with Funds | Length of Time Served | Principal Occupation(s) During Past 5 Years | Number of American Century Portfolios Overseen by Trustee | Other Directorships Held During Past 5 Years |
| Independent Trustees |
Frederick L. A. Grauer (1946) | Trustee | Since 2008 | Senior Advisor, iShares by BlackRock, Inc. (investment management firm) (2010 to 2011, 2013 to present); Senior Advisor, Course Hero (an educational technology company) (2015 to present) | 45 | None |
Jonathan D. Levin (1972) | Advisory Board Member | Since 2016 | Holbrook Working Professor of Price Theory, Standford University, (2000 to present); Chair, Department of Economics, Stanford University (2011 to 2014) | 45 | None |
Peter F. Pervere (1947) | Trustee | Since 2007 | Retired | 45 | None |
John B. Shoven (1947) | Trustee | Since 2002 | Charles R. Schwab Professor of Economics, Stanford University (1973 to present) | 45 | Cadence Design Systems; Exponent; Financial Engines |
| Interested Trustee |
Jonathan S. Thomas (1963) | Trustee and President | Since 2007 | President and Chief Executive Officer, ACC (March 2007 to present). Also serves as Chief Executive Officer, ACS; Executive Vice President, ACIM; Director, ACC, ACIM and other ACC subsidiaries | 128 | BioMed Valley Discoveries, Inc. |
The Statement of Additional Information has additional information about the fund's trustees and is available without charge, upon request, by calling 1-800-345-2021.
Officers
The following table presents certain information about the executive officers of the funds. Each officer serves as an officer for each of the 15 investment companies in the American Century family of funds, unless otherwise noted. No officer is compensated for his or her service as an officer of the funds. The listed officers are interested persons of the funds and are appointed or re-appointed on an annual basis. The mailing address for each of the officers listed below is 4500 Main Street, Kansas City, Missouri 64111.
|
| | |
Name (Year of Birth) | Offices with the Funds | Principal Occupation(s) During the Past Five Years |
Jonathan S. Thomas (1963) | Trustee and President since 2007 | President and Chief Executive Officer, ACC (March 2007 to present). Also serves as Chief Executive Officer, ACS; Executive Vice President, ACIM; Director, ACC, ACIM and other ACC subsidiaries |
Amy D. Shelton (1964) | Chief Compliance Officer and Vice President since 2014 | Chief Compliance Officer, American Century funds, (March 2014 to present); Chief Compliance Officer, ACIM (February 2014 to present); Chief Compliance Officer, ACIS (October 2009 to present); Vice President, Client Interactions and Marketing, ACIS (February 2013 to January 2014); Director, Client Interactions and Marketing, ACIS (June 2007 to January 2013). Also serves as Vice President, ACIS |
Charles A. Etherington (1957) | General Counsel since 2007 and Senior Vice President since 2006 | Attorney, ACC (February 1994 to present); Vice President, ACC (November 2005 to present); General Counsel, ACC (March 2007 to present). Also serves as General Counsel, ACIM, ACS, ACIS and other ACC subsidiaries; and Senior Vice President, ACIM and ACS |
C. Jean Wade (1964) | Vice President, Treasurer and Chief Financial Officer since 2012 | Vice President, ACS (February 2000 to present) |
Robert J. Leach (1966) | Vice President since 2006 and Assistant Treasurer since 2012 | Vice President, ACS (February 2000 to present) |
David H. Reinmiller (1963) | Vice President since 2001 | Attorney, ACC (January 1994 to present); Associate General Counsel, ACC (January 2001 to present). Also serves as Vice President, ACIM and ACS |
Ward D. Stauffer (1960) | Secretary since 2005 | Attorney, ACC (June 2003 to present) |
Retirement Account Information
As required by law, distributions you receive from certain IRAs are subject to federal income tax withholding, unless you elect not to have withholding apply. Tax will be withheld on the total amount withdrawn even though you may be receiving amounts that are not subject to withholding, such as nondeductible contributions. In such case, excess amounts of withholding could occur. You may adjust your withholding election so that a greater or lesser amount will be withheld.
If you don’t want us to withhold on this amount, you must notify us to not withhold the federal income tax. You may notify us in writing or in certain situations by telephone or through other electronic means. For systematic withdrawals, your withholding election will remain in effect until revoked or changed by filing a new election. You have the right to revoke your election at any time.
Remember, even if you elect not to have income tax withheld, you are liable for paying income tax on the taxable portion of your withdrawal. If you elect not to have income tax withheld or you don’t have enough income tax withheld, you may be responsible for payment of estimated tax. You may incur penalties under the estimated tax rules if your withholding and estimated tax payments are not sufficient. You can reduce or defer the income tax on a distribution by directly or indirectly rolling such distribution over to another IRA or eligible plan. You should consult your tax advisor for additional information.
State tax will be withheld if, at the time of your distribution, your address is within one of the mandatory withholding states and you have federal income tax withheld (or as otherwise required by state law). State taxes will be withheld from your distribution in accordance with the respective state rules.
Distributions you receive from 403(b), 457 and qualified plans are subject to special tax and withholding rules. Your plan administrator or plan sponsor is required to provide you with a special tax notice explaining those rules at the time you request a distribution. If applicable, federal and/or state taxes may be withheld from your distribution amount.
Proxy Voting Policies
Descriptions of the principles and policies that the fund's investment advisor uses in exercising the voting rights associated with the securities purchased and/or held by the fund are available without charge, upon request, by calling 1-800-345-2021 or visiting the "About Us" page of American Century Investments’ website at americancentury.com. A description of the policies is also available on the Securities and Exchange Commission’s website at sec.gov. Information regarding how the investment advisor voted proxies relating to portfolio securities during the most recent 12-month period ended June 30 is available on the "About Us" page at americancentury.com. It is also available at sec.gov.
Quarterly Portfolio Disclosure
The fund files its complete schedule of portfolio holdings with the Securities and Exchange Commission (SEC) for the first and third quarters of each fiscal year on Form N-Q. The fund’s Forms N-Q are available on the SEC’s website at sec.gov, and may be reviewed and copied at the SEC’s Public Reference Room in Washington, DC. Information on the operation of the Public Reference Room may be obtained by calling 1-800-SEC-0330. The fund also makes its complete schedule of portfolio holdings for the most recent quarter of its fiscal year available on its
website at americancentury.com and, upon request, by calling 1-800-345-2021.
|
| | |
| |
| | | |
| Contact Us | americancentury.com | |
| Automated Information Line | 1-800-345-8765 | |
| Investor Services Representative | 1-800-345-2021 or 816-531-5575 | |
| Investors Using Advisors | 1-800-378-9878 | |
| Business, Not-For-Profit, Employer-Sponsored Retirement Plans | 1-800-345-3533 | |
| Banks and Trust Companies, Broker-Dealers, Financial Professionals, Insurance Companies | 1-800-345-6488 | |
| Telecommunications Relay Service for the Deaf | 711 | |
| | | |
| American Century Government Income Trust | |
| | | |
Investment Advisor: American Century Investment Management, Inc. Kansas City, Missouri | |
| | | |
| This report and the statements it contains are submitted for the general information of our shareholders. The report is not authorized for distribution to prospective investors unless preceded or accompanied by an effective prospectus. | |
| | | |
©2016 American Century Proprietary Holdings, Inc. All rights reserved.
CL-ANN-88872 1605
| |
|
| |
| | |
| | Annual Report |
| | |
| | March 31, 2016 |
| | |
| | Government Bond Fund |
|
| | |
| President’s Letter | 2 |
|
| Performance | 3 |
|
| Portfolio Commentary | |
|
| Fund Characteristics | |
|
| Shareholder Fee Example | |
|
| Schedule of Investments | |
|
| Statement of Assets and Liabilities | |
|
| Statement of Operations | |
|
| Statement of Changes in Net Assets | |
|
| Notes to Financial Statements | |
|
| Financial Highlights | |
|
| Report of Independent Registered Public Accounting Firm | |
|
| Management | |
|
| Additional Information | |
|
Any opinions expressed in this report reflect those of the author as of the date of the report, and do not necessarily represent the opinions of American Century Investments® or any other person in the American Century Investments organization. Any such opinions are subject to change at any time based upon market or other conditions and American Century Investments disclaims any responsibility to update such opinions. These opinions may not be relied upon as investment advice and, because investment decisions made by American Century Investments funds are based on numerous factors, may not be relied upon as an indication of trading intent on behalf of any American Century Investments fund. Security examples are used for representational purposes only and are not intended as recommendations to purchase or sell securities. Performance information for comparative indices and securities is provided to American Century Investments by third party vendors. To the best of American Century Investments’ knowledge, such information is accurate at the time of printing.
|
| |
| Dear Investor:
Thank you for reviewing this annual report for the 12 months ended March 31, 2016. It provides investment performance and portfolio information for the reporting period, plus longer-term historical performance data.
Annual reports help convey information about fund performance, including market and economic factors that affected returns during the reporting period. For additional, updated investment and market insights, we encourage you to visit our website, americancentury.com.
|
| Jonathan Thomas |
Divergence in Economic Growth and Monetary Policies, Combined With China Turmoil, Triggered Market Volatility
Divergence between the U.S. and the rest of the world—along with China’s struggles, plunging commodity prices, capital market volatility, and risk-off trading—were dominant themes during the reporting period. Global divergence described not only the relatively stronger economic growth enjoyed by the U.S. compared with most of the world, but also the related contrast between the U.S. Federal Reserve’s (the Fed’s) unwinding of monetary stimulus versus the continuation and expansion of stimulus by other major central banks.
Two months in particular captured the volatility and risk-off trading of the 12-month period. Last August, China’s economic slowdown (which rippled across the global economy) triggered Chinese stock market volatility, increasingly stimulative Chinese central bank monetary policy, and currency devaluations. Burdened further with oil market volatility, equity and higher-risk bond markets declined globally. Five months later, in January, investor sentiment plunged again as global economic growth decelerated, China devalued its currency again, and oil prices dropped below $30 a barrel. In addition, the Fed, in December, executed its first rate hike since 2006. Central bank policies showed less divergence thereafter, with the Bank of Japan suddenly resorting to negative interest rates, the Fed holding rates steady while reducing its rate hike projections, and the European Central Bank announcing significant additional stimulus.
Bonds (and more bond-like stock sectors, such as utilities and REITs) generally outperformed the broad stock market for the reporting period. In terms of stock style and size, growth generally outperformed value, and large cap generally outperformed small cap. In the bond market, higher quality (investment-grade) generally outperformed lower quality (high-yield). We expect continued economic and monetary policy divergence between the U.S. and non-U.S. economies in 2016, accompanied by further market volatility. This could present both challenges and opportunities for active investment managers. Looking ahead, we continue to believe in a disciplined, diversified, risk-aware investment approach, using professionally managed portfolios to meet financial goals. We appreciate your trust in us.
Sincerely,
Jonathan Thomas
President and Chief Executive Officer
American Century Investments
|
| | | | | | |
| Total Returns as of March 31, 2016 |
| | | | Average Annual Returns | |
| | Ticker Symbol | 1 year | 5 years | 10 years | Since Inception | Inception Date |
| Investor Class | CPTNX | 1.89% | 2.84% | 4.41% | — | 5/16/80 |
| Barclays U.S. Government/MBS Index | — | 2.39% | 3.32% | 4.67% | — | — |
| Institutional Class | ABTIX | 2.10% | 3.02% | — | 3.15% | 3/1/10 |
| A Class | ABTAX | | | | | 10/9/97 |
| No sales charge | | 1.64% | 2.56% | 4.14% | — | |
| With sales charge | | -2.92% | 1.63% | 3.66% | — | |
| C Class | ABTCX | 0.88% | 1.80% | — | 1.93% | 3/1/10 |
| R Class | ABTRX | 1.39% | 2.31% | — | 2.44% | 3/1/10 |
Sales charges include initial sales charges and contingent deferred sales charges (CDSCs), as applicable. A Class shares have a 4.50% maximum initial sales charge and may be subject to a maximum CDSC of 1.00%. C Class shares redeemed within 12 months of purchase are subject to a maximum CDSC of 1.00%. The SEC requires that mutual funds provide performance information net of maximum sales charges in all cases where charges could be applied.
Average annual returns since inception are presented when ten years of performance history is not available.
Prior to March 1, 2010, the A Class was referred to as the Advisor Class and did not have a front-end sales charge. Performance prior to that date has been adjusted to reflect this charge.
Data presented reflect past performance. Past performance is no guarantee of future results. Current performance may be higher or lower than the performance shown. Total returns for periods less than one year are not annualized. Investment return and principal value will fluctuate, and redemption value may be more or less than original cost. Data assumes reinvestment of dividends and capital gains, and none of the charts reflect the deduction of taxes that a shareholder would pay on fund distributions or the redemption of fund shares. To obtain performance data current to the most recent month end, please call 1-800-345-2021 or visit americancentury.com. For additional information about the fund, please consult the prospectus.
|
|
| Growth of $10,000 Over 10 Years |
| $10,000 investment made March 31, 2006 |
Performance for other share classes will vary due to differences in fee structure.
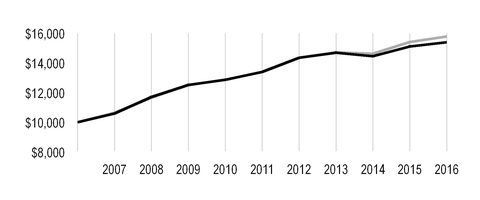
|
| |
| Value on March 31, 2016 |
| | Investor Class — $15,405 |
| |
| | Barclays U.S. Government/MBS Index — $15,784 |
| |
|
| | | | |
| Total Annual Fund Operating Expenses |
| Investor Class | Institutional Class | A Class | C Class | R Class |
| 0.47% | 0.27% | 0.72% | 1.47% | 0.97% |
The total annual fund operating expenses shown is as stated in the fund’s prospectus current as of the date of this report. The prospectus may vary from the expense ratio shown elsewhere in this report because it is based on a different time period, includes acquired fund fees and expenses, and, if applicable, does not include fee waivers or expense reimbursements.
Data presented reflect past performance. Past performance is no guarantee of future results. Current performance may be higher or lower than the performance shown. Total returns for periods less than one year are not annualized. Investment return and principal value will fluctuate, and redemption value may be more or less than original cost. Data assumes reinvestment of dividends and capital gains, and none of the charts reflect the deduction of taxes that a shareholder would pay on fund distributions or the redemption of fund shares. To obtain performance data current to the most recent month end, please call 1-800-345-2021 or visit americancentury.com. For additional information about the fund, please consult the prospectus.
Portfolio Managers: Bob Gahagan, Hando Aguilar, Brian Howell, Dan Shiffman, and Jim Platz
Performance Summary
Government Bond advanced 1.89%* for the 12 months ended March 31, 2016. By comparison, the Barclays U.S. Government/MBS Index advanced 2.39%. The portfolio’s duration positioning (price sensitivity to interest rate changes) in 2015 and Treasury security selection modestly detracted from relative performance. In addition, fund returns reflect operating expenses, while index returns do not.
U.S. Bonds Persevered In Volatile Backdrop
Despite modest economic gains and the Federal Reserve’s (the Fed’s) December 2015 decision to finally start normalizing short-term interest rates—factors that distinguished the U.S. from most other regions of the world, where slowing or stagnant growth and aggressive central bank easing were the norms—U.S. investment-grade bonds generally posted modest gains for the 12-month period ended March 31, 2016. After concluding its massive quantitative easing (QE) program in October 2014, the Fed focused on winding down another component of its unprecedented stimulus program—near-zero short-term interest rates—in 2015. Investor speculation regarding the timing and magnitude of the first Fed rate hike since June 2006 dominated the fixed-income market throughout the first nine months of the period and contributed to heightened market volatility.
Meanwhile, other leading central banks pursued aggressive stimulus programs, including increased QE and negative interest rates, to combat economic weakness. This global divergence of monetary policies made U.S. Treasury yields relatively more attractive than government bond yields of other nations, where yields declined at a greater pace. Global divergence also initially helped strengthen the U.S. dollar relative to other currencies. But the dollar weakened late in the reporting period as the Fed adopted a more dovish tone toward monetary policy.
Early in the 12-month period, U.S. bond market performance stumbled, largely due to Fed rate-hike speculation, a sharp bond market sell-off in Europe, and fallout from Greece’s inability to repay its government debt. Performance rebounded in the third quarter of 2015 as Greece reached a deal with its creditors, and the global economic slowdown sparked a flight to quality, which generally favored high-quality bonds and pushed back the Fed’s rate-hike plans. Investors assumed the Fed would begin to normalize short-term interest rates at its December monetary policy meeting. This expectation drove Treasury yields higher (and returns lower) during the fourth quarter of 2015, particularly among shorter-maturity securities, which are the most sensitive to Fed policy. On December 16, the Fed finally initiated “liftoff” with an increase of 25 basis points (one basis point equals 0.01%) in the federal funds rate target, pushing the overnight lending rate from 0.00%-0.25% to 0.25%-0.50%.
Most investors assumed the Fed would continue rate normalization in the first quarter of 2016. However, mounting concerns about China’s economic slowdown, lackluster global growth, weak oil prices, and equity market volatility kept the Fed on hold. These factors also triggered a rally among U.S. Treasury and other high-quality bonds to start 2016. Midway through the first quarter of 2016, stabilization in the oil markets restored investors’ “risk-on” sentiment, and Treasury returns stalled. But late in the quarter, the Fed reduced its 2016 rate-hike forecast from four to two increases, triggering another Treasury market rally to close out the period.
* All fund returns referenced in this commentary are for Investor Class shares. Performance for other share classes will vary due to differences in fee structure; when Investor Class performance exceeds that of the index, other share classes may not. See page 3 for returns for all share classes.
Against this backdrop, the Treasury yield curve flattened during the 12-month period, as longer-maturity yields declined due to investor demand and weak inflation and shorter-maturity yields increased on Fed rate-hike expectations. The yield on the benchmark 10-year Treasury note declined 15 basis points to 1.77% at the end of March 2016, while the yield on the two-year Treasury note increased 16 basis points to 0.72%, according to Bloomberg.
Duration Positioning Detracted From Performance
We entered the 12-month period expecting a gradual rise in U.S. interest rates. Accordingly, we maintained a shorter duration (less price sensitivity to interest rate changes) than the index. We used U.S. Treasury futures contracts at times as part of this strategy. This positioning slightly detracted from relative performance as longer-maturity interest rates generally declined. Given the uncertainty surrounding the timing of interest rate normalization, we shifted from a slightly shorter-than-index duration to a neutral duration in the third calendar quarter of 2015.
In terms of sector allocations, we maintained underweight positions relative to the index in Treasuries and agencies and an overweight position in the higher-yielding mortgage-backed securities (MBS) sector throughout the 12-month period. This positioning was basically performance neutral relative to the index.
Positive relative performance contributions came instead from security selection within the mortgage allocation. We generally favored structured mortgage products, including collateralized mortgage obligations (CMOs), over traditional government agency pass-through MBS. This positioning helped the portfolio’s performance because CMOs—which generally experience less refinancing-associated price volatility while offering more-predictable cash flows—outperformed traditional MBS.
Conversely, security selection in the Treasury allocation modestly detracted from performance. Specifically, we held a position in Treasury Inflation Protected Securities (TIPS) due to their attractive valuations. TIPS advanced during the 12-month period on rising long-term inflation expectations, but they underperformed nominal Treasuries.
Outlook
We believe U.S. economic fundamentals eventually will cause the Fed to resume interest-rate normalization. But weaker global economic fundamentals, U.S. dollar strength, weak commodity prices, and geopolitical risks may delay Fed action and keep rates range-bound. Accordingly, we plan to tactically manage duration while continuing to overweight MBS relative to Treasuries and agencies, focusing on structured mortgage products offering yield advantages and more predictable payment streams over traditional pass-through mortgage securities.
|
| |
| MARCH 31, 2016 | |
| Portfolio at a Glance | |
| Average Duration (effective) | 4.8 years |
| Weighted Average Life | 6.6 years |
| | |
| Types of Investments in Portfolio | % of net assets |
| U.S. Treasury Securities | 53.4% |
| U.S. Government Agency Mortgage-Backed Securities | 44.4% |
| Collateralized Mortgage Obligations | 16.5% |
| U.S. Government Agency Securities | 2.1% |
| Temporary Cash Investments | 2.8% |
| Other Assets and Liabilities | (19.2)%* |
*Amount relates primarily to payable for investments purchased, but not settled, at period end.
Fund shareholders may incur two types of costs: (1) transaction costs, including sales charges (loads) on purchase payments and redemption/exchange fees; and (2) ongoing costs, including management fees; distribution and service (12b-1) fees; and other fund expenses. This example is intended to help you understand your ongoing costs (in dollars) of investing in your fund and to compare these costs with the ongoing cost of investing in other mutual funds.
The example is based on an investment of $1,000 made at the beginning of the period and held for the entire period from October 1, 2015 to March 31, 2016.
Actual Expenses
The table provides information about actual account values and actual expenses for each class. You may use the information, together with the amount you invested, to estimate the expenses that you paid over the period. First, identify the share class you own. Then simply divide your account value by $1,000 (for example, an $8,600 account value divided by $1,000 = 8.6), then multiply the result by the number under the heading “Expenses Paid During Period” to estimate the expenses you paid on your account during this period.
If you hold Investor Class shares of any American Century Investments fund, or Institutional Class shares of the American Century Diversified Bond Fund, in an American Century Investments account (i.e., not a financial intermediary or retirement plan account), American Century Investments may charge you a $12.50 semiannual account maintenance fee if the value of those shares is less than $10,000. We will redeem shares automatically in one of your accounts to pay the $12.50 fee. In determining your total eligible investment amount, we will include your investments in all personal accounts (including American Century Investments Brokerage accounts) registered under your Social Security number. Personal accounts include individual accounts, joint accounts, UGMA/UTMA accounts, personal trusts, Coverdell Education Savings Accounts and IRAs (including traditional, Roth, Rollover, SEP-, SARSEP- and SIMPLE-IRAs), and certain other retirement accounts. If you have only business, business retirement, employer-sponsored or American Century Investments Brokerage accounts, you are currently not subject to this fee. If you are subject to the Account Maintenance Fee, your account value could be reduced by the fee amount.
Hypothetical Example for Comparison Purposes
The table also provides information about hypothetical account values and hypothetical expenses based on the actual expense ratio of each class of your fund and an assumed rate of return of 5% per year before expenses, which is not the actual return of a fund’s share class. The hypothetical account values and expenses may not be used to estimate the actual ending account balance or expenses you paid for the period. You may use this information to compare the ongoing costs of investing in your fund and other funds. To do so, compare this 5% hypothetical example with the 5% hypothetical examples that appear in the shareholder reports of the other funds.
Please note that the expenses shown in the table are meant to highlight your ongoing costs only and do not reflect any transactional costs, such as sales charges (loads) or redemption/exchange fees. Therefore, the table is useful in comparing ongoing costs only, and will not help you determine the relative total costs of owning different funds. In addition, if these transactional costs were included, your costs would have been higher.
|
| | | | |
| | Beginning
Account Value
10/1/15 | Ending
Account Value
3/31/16 | Expenses Paid
During Period(1)10/1/15 - 3/31/16 | Annualized
Expense Ratio(1) |
| Actual | | | | |
| Investor Class | $1,000 | $1,019.20 | $2.37 | 0.47% |
| Institutional Class | $1,000 | $1,019.40 | $1.36 | 0.27% |
| A Class | $1,000 | $1,017.10 | $3.63 | 0.72% |
| C Class | $1,000 | $1,013.30 | $7.40 | 1.47% |
| R Class | $1,000 | $1,015.80 | $4.89 | 0.97% |
| Hypothetical | | | | |
| Investor Class | $1,000 | $1,022.65 | $2.38 | 0.47% |
| Institutional Class | $1,000 | $1,023.65 | $1.37 | 0.27% |
| A Class | $1,000 | $1,021.40 | $3.64 | 0.72% |
| C Class | $1,000 | $1,017.65 | $7.41 | 1.47% |
| R Class | $1,000 | $1,020.15 | $4.90 | 0.97% |
| |
| (1) | Expenses are equal to the class's annualized expense ratio listed in the table above, multiplied by the average account value over the period, multiplied by 183, the number of days in the most recent fiscal half-year, divided by 366, to reflect the one-half year period. |
MARCH 31, 2016
|
| | | | | | |
| | Principal Amount | Value |
| U.S. TREASURY SECURITIES — 53.4% | | |
U.S. Treasury Bills, 0.56%, 1/5/17(1) | $ | 5,000,000 |
| $ | 4,981,820 |
|
| U.S. Treasury Bonds, 8.125%, 8/15/21 | 14,247,000 |
| 19,277,131 |
|
| U.S. Treasury Bonds, 7.125%, 2/15/23 | 7,000,000 |
| 9,576,735 |
|
| U.S. Treasury Bonds, 3.50%, 2/15/39 | 5,500,000 |
| 6,550,693 |
|
| U.S. Treasury Bonds, 4.375%, 11/15/39 | 5,300,000 |
| 7,137,505 |
|
| U.S. Treasury Bonds, 4.625%, 2/15/40 | 10,000,000 |
| 13,934,770 |
|
| U.S. Treasury Bonds, 4.375%, 5/15/41 | 5,100,000 |
| 6,891,176 |
|
| U.S. Treasury Bonds, 3.125%, 11/15/41 | 2,000,000 |
| 2,226,876 |
|
| U.S. Treasury Bonds, 2.75%, 11/15/42 | 2,840,000 |
| 2,929,582 |
|
| U.S. Treasury Bonds, 2.875%, 5/15/43 | 10,500,000 |
| 11,071,557 |
|
| U.S. Treasury Bonds, 3.625%, 8/15/43 | 700,000 |
| 850,842 |
|
| U.S. Treasury Bonds, 3.75%, 11/15/43 | 6,000,000 |
| 7,457,580 |
|
| U.S. Treasury Bonds, 3.125%, 8/15/44 | 20,000,000 |
| 22,137,500 |
|
| U.S. Treasury Bonds, 3.00%, 11/15/44 | 5,000,000 |
| 5,398,045 |
|
| U.S. Treasury Bonds, 3.00%, 5/15/45 | 4,300,000 |
| 4,639,631 |
|
| U.S. Treasury Inflation Indexed Notes, 0.375%, 7/15/23 | 8,144,320 |
| 8,400,793 |
|
| U.S. Treasury Inflation Indexed Notes, 0.125%, 7/15/24 | 12,272,571 |
| 12,332,179 |
|
| U.S. Treasury Notes, VRN, 0.35%, 4/5/16 | 45,000,000 |
| 45,000,495 |
|
| U.S. Treasury Notes, 4.875%, 8/15/16 | 5,000,000 |
| 5,084,075 |
|
| U.S. Treasury Notes, 0.50%, 4/30/17 | 16,000,000 |
| 15,977,808 |
|
| U.S. Treasury Notes, 2.375%, 7/31/17 | 16,000,000 |
| 16,360,000 |
|
| U.S. Treasury Notes, 4.75%, 8/15/17 | 11,950,000 |
| 12,610,285 |
|
| U.S. Treasury Notes, 0.75%, 10/31/17 | 13,000,000 |
| 13,007,358 |
|
| U.S. Treasury Notes, 1.875%, 10/31/17 | 20,000,000 |
| 20,364,460 |
|
| U.S. Treasury Notes, 0.875%, 1/31/18 | 42,600,000 |
| 42,718,130 |
|
| U.S. Treasury Notes, 1.00%, 3/15/18 | 5,500,000 |
| 5,528,787 |
|
| U.S. Treasury Notes, 2.625%, 4/30/18 | 6,500,000 |
| 6,754,417 |
|
| U.S. Treasury Notes, 1.00%, 5/31/18 | 3,500,000 |
| 3,517,570 |
|
| U.S. Treasury Notes, 1.25%, 11/15/18 | 36,000,000 |
| 36,402,192 |
|
| U.S. Treasury Notes, 1.50%, 2/28/19 | 30,000,000 |
| 30,551,370 |
|
U.S. Treasury Notes, 1.75%, 9/30/19(2) | 20,000,000 |
| 20,525,780 |
|
| U.S. Treasury Notes, 1.50%, 11/30/19 | 300,000 |
| 305,156 |
|
| U.S. Treasury Notes, 1.625%, 12/31/19 | 22,100,000 |
| 22,577,404 |
|
| U.S. Treasury Notes, 1.50%, 5/31/20 | 12,100,000 |
| 12,286,703 |
|
| U.S. Treasury Notes, 1.625%, 11/30/20 | 28,000,000 |
| 28,572,040 |
|
| U.S. Treasury Notes, 3.625%, 2/15/21 | 10,000,000 |
| 11,136,330 |
|
| U.S. Treasury Notes, 1.125%, 2/28/21 | 8,000,000 |
| 7,971,248 |
|
| U.S. Treasury Notes, 2.00%, 10/31/21 | 13,000,000 |
| 13,445,354 |
|
| U.S. Treasury Notes, 1.75%, 5/15/22 | 19,000,000 |
| 19,328,415 |
|
| U.S. Treasury Notes, 1.75%, 9/30/22 | 7,000,000 |
| 7,110,334 |
|
| U.S. Treasury Notes, 2.125%, 12/31/22 | 9,500,000 |
| 9,871,089 |
|
| U.S. Treasury Notes, 1.50%, 2/28/23 | 7,000,000 |
| 6,983,046 |
|
|
| | | | | | |
| | Principal Amount | Value |
| U.S. Treasury Notes, 2.00%, 2/15/25 | $ | 10,300,000 |
| $ | 10,527,125 |
|
| U.S. Treasury Notes, 2.125%, 5/15/25 | 7,000,000 |
| 7,220,801 |
|
| U.S. Treasury Notes, 2.00%, 8/15/25 | 5,900,000 |
| 6,016,389 |
|
| U.S. Treasury Notes, 2.25%, 11/15/25 | 6,000,000 |
| 6,247,032 |
|
TOTAL U.S. TREASURY SECURITIES (Cost $567,083,470) | | 589,795,608 |
|
U.S. GOVERNMENT AGENCY MORTGAGE-BACKED SECURITIES(3) — 44.4% | |
| Adjustable-Rate U.S. Government Agency Mortgage-Backed Securities — 5.9% | |
| FHLMC, VRN, 2.04%, 4/15/16 | 2,258,791 |
| 2,323,489 |
|
| FHLMC, VRN, 2.05%, 4/15/16 | 3,157,474 |
| 3,243,419 |
|
| FHLMC, VRN, 2.32%, 4/15/16 | 2,908,710 |
| 2,977,713 |
|
| FHLMC, VRN, 2.40%, 4/15/16 | 1,941,639 |
| 2,054,630 |
|
| FHLMC, VRN, 2.48%, 4/15/16 | 537,292 |
| 567,458 |
|
| FHLMC, VRN, 2.55%, 4/15/16 | 731,576 |
| 763,342 |
|
| FHLMC, VRN, 2.59%, 4/15/16 | 1,398,358 |
| 1,474,692 |
|
| FHLMC, VRN, 2.60%, 4/15/16 | 554,300 |
| 583,612 |
|
| FHLMC, VRN, 2.61%, 4/15/16 | 874,953 |
| 923,718 |
|
| FHLMC, VRN, 2.63%, 4/15/16 | 1,322,884 |
| 1,395,627 |
|
| FHLMC, VRN, 2.63%, 4/15/16 | 3,268,314 |
| 3,392,828 |
|
| FHLMC, VRN, 2.78%, 4/15/16 | 863,016 |
| 909,771 |
|
| FHLMC, VRN, 3.79%, 4/15/16 | 2,608,297 |
| 2,753,942 |
|
| FHLMC, VRN, 4.06%, 4/15/16 | 401,029 |
| 422,390 |
|
| FHLMC, VRN, 5.61%, 4/15/16 | 1,460,795 |
| 1,546,295 |
|
| FNMA, VRN, 2.05%, 4/25/16 | 4,493,926 |
| 4,613,445 |
|
| FNMA, VRN, 2.06%, 4/25/16 | 1,490,594 |
| 1,557,745 |
|
| FNMA, VRN, 2.07%, 4/25/16 | 2,348,724 |
| 2,441,788 |
|
| FNMA, VRN, 2.07%, 4/25/16 | 1,505,465 |
| 1,567,984 |
|
| FNMA, VRN, 2.07%, 4/25/16 | 1,809,047 |
| 1,886,118 |
|
| FNMA, VRN, 2.07%, 4/25/16 | 1,556,592 |
| 1,621,693 |
|
| FNMA, VRN, 2.33%, 4/25/16 | 2,596,682 |
| 2,693,192 |
|
| FNMA, VRN, 2.52%, 4/25/16 | 966,772 |
| 1,016,671 |
|
| FNMA, VRN, 2.56%, 4/25/16 | 2,035,868 |
| 2,131,925 |
|
| FNMA, VRN, 2.57%, 4/25/16 | 806,874 |
| 846,586 |
|
| FNMA, VRN, 2.60%, 4/25/16 | 1,437,360 |
| 1,516,122 |
|
| FNMA, VRN, 2.74%, 4/25/16 | 1,842,054 |
| 1,933,829 |
|
| FNMA, VRN, 2.76%, 4/25/16 | 1,384,050 |
| 1,468,067 |
|
| FNMA, VRN, 2.78%, 4/25/16 | 664,489 |
| 704,953 |
|
| FNMA, VRN, 3.02%, 4/25/16 | 2,240,614 |
| 2,333,702 |
|
| FNMA, VRN, 3.36%, 4/25/16 | 2,992,270 |
| 3,131,798 |
|
| FNMA, VRN, 4.80%, 4/25/16 | 653,828 |
| 688,624 |
|
| GNMA, VRN, 1.75%, 4/20/16 | 797,556 |
| 830,711 |
|
| GNMA, VRN, 1.75%, 4/20/16 | 1,361,157 |
| 1,418,570 |
|
| GNMA, VRN, 1.875%, 4/20/16 | 1,299,680 |
| 1,352,382 |
|
| GNMA, VRN, 2.00%, 4/20/16 | 566,807 |
| 585,046 |
|
| GNMA, VRN, 2.00%, 4/20/16 | 293,165 |
| 300,552 |
|
| GNMA, VRN, 2.00%, 4/20/16 | 511,630 |
| 527,479 |
|
| GNMA, VRN, 2.00%, 4/20/16 | 1,203,181 |
| 1,256,092 |
|
|
| | | | | | |
| | Principal Amount | Value |
| GNMA, VRN, 2.50%, 4/20/16 | $ | 862,523 |
| $ | 898,164 |
|
| | | 64,656,164 |
|
| Fixed-Rate U.S. Government Agency Mortgage-Backed Securities — 38.5% | |
| FHLMC, 4.50%, 1/1/19 | 250,392 |
| 258,822 |
|
| FHLMC, 5.00%, 5/1/23 | 2,276,091 |
| 2,442,690 |
|
| FHLMC, 5.50%, 10/1/34 | 443,316 |
| 498,896 |
|
| FHLMC, 5.50%, 4/1/38 | 3,860,281 |
| 4,332,123 |
|
| FHLMC, 4.00%, 12/1/40 | 2,102,474 |
| 2,269,587 |
|
| FHLMC, 1.00%, 6/1/44 | 2,378,975 |
| 2,477,758 |
|
| FHLMC, 6.50%, 7/1/47 | 16,728 |
| 18,443 |
|
FNMA, 3.00%, 4/13/16(4) | 20,000,000 |
| 20,524,610 |
|
FNMA, 3.50%, 4/13/16(4) | 30,500,000 |
| 31,988,663 |
|
FNMA, 4.00%, 4/13/16(4) | 44,000,000 |
| 47,028,640 |
|
FNMA, 4.50%, 4/13/16(4) | 45,000,000 |
| 48,970,213 |
|
FNMA, 5.00%, 4/13/16(4) | 27,000,000 |
| 29,879,103 |
|
FNMA, 5.50%, 4/13/16(4) | 15,000,000 |
| 16,826,663 |
|
| FNMA, 4.50%, 6/1/18 | 129,758 |
| 134,211 |
|
| FNMA, 4.50%, 5/1/19 | 868,818 |
| 901,255 |
|
| FNMA, 5.00%, 9/1/20 | 109,332 |
| 114,853 |
|
| FNMA, 4.50%, 11/1/20 | 86,513 |
| 89,937 |
|
| FNMA, 6.50%, 3/1/32 | 112,055 |
| 133,403 |
|
| FNMA, 7.00%, 6/1/32 | 128,640 |
| 156,852 |
|
| FNMA, 6.50%, 8/1/32 | 123,447 |
| 145,627 |
|
| FNMA, 5.50%, 7/1/33 | 921,975 |
| 1,044,145 |
|
| FNMA, 5.00%, 11/1/33 | 5,258,816 |
| 5,848,845 |
|
| FNMA, 6.00%, 12/1/33 | 3,540,423 |
| 4,080,016 |
|
| FNMA, 5.50%, 8/1/34 | 3,701,552 |
| 4,193,359 |
|
| FNMA, 5.50%, 9/1/34 | 262,200 |
| 294,066 |
|
| FNMA, 5.50%, 10/1/34 | 1,825,338 |
| 2,056,586 |
|
| FNMA, 5.00%, 8/1/35 | 662,283 |
| 735,269 |
|
| FNMA, 5.50%, 1/1/36 | 4,070,929 |
| 4,608,170 |
|
| FNMA, 5.00%, 2/1/36 | 397,778 |
| 441,201 |
|
| FNMA, 5.50%, 4/1/36 | 1,021,164 |
| 1,152,188 |
|
| FNMA, 5.00%, 5/1/36 | 1,780,995 |
| 1,974,408 |
|
| FNMA, 5.50%, 12/1/36 | 627,385 |
| 705,586 |
|
| FNMA, 5.50%, 2/1/37 | 2,218,048 |
| 2,493,297 |
|
| FNMA, 6.50%, 8/1/37 | 380,106 |
| 426,843 |
|
| FNMA, 6.00%, 9/1/37 | 782,101 |
| 891,402 |
|
| FNMA, 6.00%, 11/1/37 | 4,601,956 |
| 5,256,778 |
|
| FNMA, 6.00%, 9/1/38 | 130,581 |
| 138,549 |
|
| FNMA, 4.50%, 2/1/39 | 1,644,095 |
| 1,791,888 |
|
| FNMA, 4.50%, 4/1/39 | 1,099,014 |
| 1,212,179 |
|
| FNMA, 4.50%, 5/1/39 | 2,719,090 |
| 3,015,555 |
|
| FNMA, 6.50%, 5/1/39 | 2,716,777 |
| 3,141,176 |
|
| FNMA, 4.50%, 10/1/39 | 4,500,118 |
| 4,965,955 |
|
| FNMA, 4.50%, 3/1/40 | 7,059,918 |
| 7,759,155 |
|
| FNMA, 4.00%, 10/1/40 | 4,546,617 |
| 4,947,660 |
|
|
| | | | | | |
| | Principal Amount | Value |
| FNMA, 4.50%, 11/1/40 | $ | 3,969,235 |
| $ | 4,359,311 |
|
| FNMA, 4.50%, 6/1/41 | 5,500,969 |
| 6,042,142 |
|
| FNMA, 4.00%, 8/1/41 | 4,178,188 |
| 4,520,295 |
|
| FNMA, 4.50%, 9/1/41 | 2,451,194 |
| 2,675,322 |
|
| FNMA, 3.50%, 10/1/41 | 5,146,610 |
| 5,410,176 |
|
| FNMA, 4.00%, 12/1/41 | 10,074,968 |
| 10,804,652 |
|
| FNMA, 3.50%, 5/1/42 | 3,262,746 |
| 3,436,664 |
|
| FNMA, 3.50%, 6/1/42 | 2,945,718 |
| 3,109,093 |
|
| FNMA, 3.50%, 9/1/42 | 3,346,269 |
| 3,525,315 |
|
| FNMA, 3.50%, 12/1/42 | 5,104,201 |
| 5,366,856 |
|
| FNMA, 3.50%, 11/1/45 | 4,934,550 |
| 5,185,444 |
|
| FNMA, 4.00%, 11/1/45 | 7,404,688 |
| 7,941,222 |
|
| FNMA, 6.50%, 8/1/47 | 48,898 |
| 54,410 |
|
| FNMA, 6.50%, 8/1/47 | 21,959 |
| 24,427 |
|
| FNMA, 6.50%, 9/1/47 | 100,703 |
| 112,117 |
|
| FNMA, 6.50%, 9/1/47 | 5,567 |
| 6,195 |
|
| FNMA, 6.50%, 9/1/47 | 37,838 |
| 42,099 |
|
| FNMA, 6.50%, 9/1/47 | 55,021 |
| 61,240 |
|
| FNMA, 6.50%, 9/1/47 | 14,689 |
| 16,338 |
|
| FNMA, 6.00%, 4/1/48 | 613,553 |
| 678,617 |
|
GNMA, 3.50%, 4/20/16(4) | 5,000,000 |
| 5,286,328 |
|
GNMA, 4.00%, 4/20/16(4) | 7,000,000 |
| 7,485,353 |
|
| GNMA, 5.50%, 12/20/38 | 2,360,727 |
| 2,629,989 |
|
| GNMA, 6.00%, 1/20/39 | 659,843 |
| 749,135 |
|
| GNMA, 5.00%, 3/20/39 | 3,347,609 |
| 3,727,364 |
|
| GNMA, 5.50%, 3/20/39 | 1,229,236 |
| 1,375,843 |
|
| GNMA, 5.50%, 4/20/39 | 2,155,131 |
| 2,402,822 |
|
| GNMA, 4.50%, 1/15/40 | 2,134,322 |
| 2,329,170 |
|
| GNMA, 4.00%, 11/20/40 | 8,958,818 |
| 9,661,790 |
|
| GNMA, 4.00%, 12/15/40 | 1,842,232 |
| 1,973,580 |
|
| GNMA, 4.50%, 7/20/41 | 8,120,919 |
| 8,841,877 |
|
| GNMA, 3.50%, 6/20/42 | 11,240,619 |
| 11,919,276 |
|
| GNMA, 3.50%, 7/20/42 | 8,588,735 |
| 9,107,286 |
|
| GNMA, 4.50%, 8/20/42 | 6,639,104 |
| 7,228,507 |
|
| GNMA, 4.00%, 9/20/45 | 14,101,754 |
| 15,101,330 |
|
| | | 425,558,210 |
|
TOTAL U.S. GOVERNMENT AGENCY MORTGAGE-BACKED SECURITIES (Cost $481,212,279) | 490,214,374 |
|
COLLATERALIZED MORTGAGE OBLIGATIONS(3) — 16.5% | | |
| FHLMC, Series 2684, Class FP, VRN, 0.94%, 4/15/16 | 312,179 |
| 312,521 |
|
| FHLMC, Series 2685, Class ND SEQ, 4.00%, 10/15/18 | 893,614 |
| 914,227 |
|
| FHLMC, Series 2706, Class BL SEQ, 3.50%, 11/15/18 | 999,311 |
| 1,029,848 |
|
| FHLMC, Series 2784, Class HJ SEQ, 4.00%, 4/15/19 | 1,953,890 |
| 2,011,271 |
|
| FHLMC, Series 2812, Class MF, VRN, 0.89%, 4/15/16 | 3,789,297 |
| 3,828,485 |
|
| FHLMC, Series 2824, Class LB SEQ, 4.50%, 7/15/24 | 1,417,661 |
| 1,523,162 |
|
| FHLMC, Series 3076, Class BM SEQ, 4.50%, 11/15/25 | 3,254,271 |
| 3,512,922 |
|
| FHLMC, Series 3149, Class LF, VRN, 0.74%, 4/15/16 | 10,637,935 |
| 10,588,194 |
|
| FHLMC, Series 3153, Class FJ, VRN, 0.82%, 4/15/16 | 3,514,655 |
| 3,532,962 |
|
|
| | | | | | |
| | Principal Amount/ Shares | Value |
| FHLMC, Series 3397, Class GF, VRN, 0.94%, 4/15/16 | $ | 1,672,114 |
| $ | 1,677,445 |
|
| FHLMC, Series 3417, Class FA, VRN, 0.94%, 4/15/16 | 2,696,920 |
| 2,720,796 |
|
| FHLMC, Series 3778, Class L SEQ, 3.50%, 12/15/25 | 11,104,439 |
| 12,056,301 |
|
| FHLMC, Series 3810, Class QB SEQ, 3.50%, 2/15/26 | 5,000,000 |
| 5,336,138 |
|
| FHLMC, Series K037, Class A1 SEQ, 2.59%, 4/25/23 | 5,835,437 |
| 6,045,027 |
|
| FHLMC, Series K039, Class A2, 3.30%, 7/25/24 | 12,510,000 |
| 13,532,560 |
|
| FHLMC, Series K041, Class A2, 3.17%, 10/25/24 | 15,000,000 |
| 16,081,395 |
|
| FHLMC, Series K716, Class A2, 3.13%, 6/25/21 | 7,000,000 |
| 7,491,304 |
|
| FNMA, Series 2003-123, Class AY SEQ, 4.00%, 12/25/18 | 1,117,696 |
| 1,142,754 |
|
| FNMA, Series 2003-125, Class AY SEQ, 4.00%, 12/25/18 | 1,644,129 |
| 1,685,532 |
|
| FNMA, Series 2004-17, Class CJ SEQ, 4.00%, 4/25/19 | 1,594,304 |
| 1,634,859 |
|
| FNMA, Series 2004-32, Class AY SEQ, 4.00%, 5/25/19 | 1,219,831 |
| 1,253,896 |
|
| FNMA, Series 2005-103, Class FP, VRN, 0.73%, 4/25/16 | 3,685,019 |
| 3,707,695 |
|
| FNMA, Series 2007-36, Class FB, VRN, 0.83%, 4/25/16 | 398,753 |
| 400,887 |
|
| FNMA, Series 2009-89, Class FD, VRN, 1.03%, 4/25/16 | 2,277,245 |
| 2,309,003 |
|
| FNMA, Series 2010-83, Class CM SEQ, 4.50%, 3/25/25 | 999,993 |
| 1,007,491 |
|
| FNMA, Series 2011-3, Class EL, 3.00%, 5/25/20 | 669,494 |
| 681,276 |
|
| FNMA, Series 2013-M11, Class FA SEQ, VRN, 0.76%, 4/25/16 | 3,975,283 |
| 3,976,665 |
|
| FNMA, Series 2014-M10, Class ASQ1, 1.52%, 9/25/19 | 10,623,828 |
| 10,688,378 |
|
| FNMA, Series 2014-M12, Class ASV2, VRN, 2.61%, 4/1/16 | 13,000,000 |
| 13,544,345 |
|
| FNMA, Series 2014-M4, Class ASQ2 SEQ, 1.27%, 1/25/17 | 5,799,908 |
| 5,799,191 |
|
| FNMA, Series 2014-M5, Class FA, VRN, 0.75%, 4/1/16 | 1,394,046 |
| 1,393,298 |
|
| FNMA, Series 2015-M12, Class FA, VRN, 0.76%, 4/1/16 | 13,717,687 |
| 13,668,199 |
|
| FNMA, Series 2015-M8, Class FA, VRN, 0.58%, 4/1/16 | 8,938,419 |
| 8,868,676 |
|
| FNMA, Series 2016-M2, Class FA, VRN, 1.28%, 4/1/16 | 6,258,082 |
| 6,265,300 |
|
| GNMA, Series 2004-30, Class PD, 5.00%, 2/20/33 | 79,241 |
| 79,284 |
|
| GNMA, Series 2007-5, Class FA, VRN, 0.57%, 4/20/16 | 1,182,030 |
| 1,179,226 |
|
| GNMA, Series 2008-18, Class FH, VRN, 1.03%, 4/20/16 | 2,118,048 |
| 2,147,223 |
|
| GNMA, Series 2010-14, Class QF, VRN, 0.89%, 4/16/16 | 5,740,796 |
| 5,785,626 |
|
| GNMA, Series 2010-163, Class KC SEQ, 4.50%, 6/20/39 | 2,950,810 |
| 3,149,793 |
|
TOTAL COLLATERALIZED MORTGAGE OBLIGATIONS (Cost $179,068,283) | | 182,563,155 |
|
| U.S. GOVERNMENT AGENCY SECURITIES — 2.1% | | |
FNMA, 6.625%, 11/15/30
(Cost $20,901,635) | 15,700,000 |
| 23,382,842 |
|
TEMPORARY CASH INVESTMENTS(5) — 2.8% | | |
| Repurchase Agreement, Fixed Income Clearing Corp., (collateralized by various U.S. Treasury obligations, 3.75%, 8/15/41, valued at $18,770,975), at 0.10%, dated 3/31/16, due 4/1/16 (Delivery value $18,399,051) | | 18,399,000 |
|
| SSgA U.S. Government Money Market Fund, Class N | 12,093,761 |
| 12,093,761 |
|
TOTAL TEMPORARY CASH INVESTMENTS (Cost $30,492,761) | | 30,492,761 |
|
TOTAL INVESTMENT SECURITIES — 119.2% (Cost $1,278,758,428) | | 1,316,448,740 |
|
OTHER ASSETS AND LIABILITIES(6) — (19.2)% | | (211,914,474) |
|
| TOTAL NET ASSETS — 100.0% | | $ | 1,104,534,266 |
|
|
| | | | | | | | |
| FUTURES CONTRACTS |
| Contracts Purchased | Expiration Date | Underlying Face
Amount at Value | Unrealized Appreciation
(Depreciation) |
| 113 | U.S. Treasury 5-Year Notes | June 2016 | $ | 13,691,539 |
| $ | (29,387 | ) |
|
| | | | | | | | | | |
| TOTAL RETURN SWAP AGREEMENTS |
| Counterparty | Notional
Amount | Floating Rate
Referenced Index | Pay/Receive
Total Return of
Referenced Index | Fixed Rate | Termination
Date | Value |
| Bank of America N.A. | $ | 12,000,000 |
| U.S. CPI Urban Consumers NSA Index | Receive | 2.53% | 8/19/24 | $ | (1,269,631 | ) |
|
| | |
| NOTES TO SCHEDULE OF INVESTMENTS |
| CPI | - | Consumer Price Index |
| FHLMC | - | Federal Home Loan Mortgage Corporation |
| FNMA | - | Federal National Mortgage Association |
| GNMA | - | Government National Mortgage Association |
| NSA | - | Not Seasonally Adjusted |
| SEQ | - | Sequential Payer |
| VRN | - | Variable Rate Note. Interest reset date is indicated. Rate shown is effective at the period end. |
| |
| (1) | The rate indicated is the yield to maturity at purchase. |
| |
| (2) | Security, or a portion thereof, has been pledged at the custodian bank or with a broker for margin requirements on futures contracts and/or swap agreements. At the period end, the aggregate value of securities pledged was $1,502,162. |
| |
| (3) | Final maturity date indicated, unless otherwise noted. |
| |
| (4) | Forward commitment. Settlement date is indicated. |
| |
| (5) | Category includes collateral received at the custodian bank for margin requirements on forward commitments. At the period end, the aggregate value of cash deposits received was $350,000. |
| |
| (6) | Amount relates primarily to payable for investments purchased, but not settled, at period end. |
See Notes to Financial Statements.
|
|
| Statement of Assets and Liabilities |
|
| | | |
| MARCH 31, 2016 | |
| Assets | |
| Investment securities, at value (cost of $1,278,758,428) | $ | 1,316,448,740 |
|
| Receivable for investments sold | 255,710 |
|
| Receivable for capital shares sold | 1,807,504 |
|
| Receivable for variation margin on futures contracts | 24,719 |
|
| Interest receivable | 4,396,098 |
|
| | 1,322,932,771 |
|
| | |
| Liabilities | |
| Payable for collateral received for forward commitments | 350,000 |
|
| Payable for investments purchased | 215,207,936 |
|
| Payable for capital shares redeemed | 989,358 |
|
| Swap agreements, at value | 1,269,631 |
|
| Accrued management fees | 385,469 |
|
| Distribution and service fees payable | 28,324 |
|
| Dividends payable | 167,787 |
|
| | 218,398,505 |
|
| | |
| Net Assets | $ | 1,104,534,266 |
|
| | |
| Net Assets Consist of: | |
| Capital paid in | $ | 1,069,571,241 |
|
| Distributions in excess of net investment income | (40,817 | ) |
| Accumulated net realized loss | (1,387,452 | ) |
| Net unrealized appreciation | 36,391,294 |
|
| | $ | 1,104,534,266 |
|
|
| | | | | | |
| | Net Assets | Shares Outstanding | Net Asset Value Per Share |
| Investor Class |
| $669,187,293 |
| 59,141,414 |
| $11.32 |
| Institutional Class |
| $315,880,818 |
| 27,920,322 |
| $11.31 |
| A Class |
| $111,919,943 |
| 9,892,809 |
| $11.31* |
| C Class |
| $4,473,259 |
| 395,563 |
| $11.31 |
| R Class |
| $3,072,953 |
| 271,698 |
| $11.31 |
*Maximum offering price $11.84 (net asset value divided by 0.955).
See Notes to Financial Statements.
|
| | | |
| YEAR ENDED MARCH 31, 2016 | |
| Investment Income (Loss) | |
| Income: | |
| Interest | $ | 20,486,042 |
|
| | |
| Expenses: | |
| Management fees | 4,597,520 |
|
| Distribution and service fees | |
| A Class | 310,662 |
|
| C Class | 36,805 |
|
| R Class | 16,273 |
|
| Trustees' fees and expenses | 57,356 |
|
| Other expenses | 9,553 |
|
| | 5,028,169 |
|
| | |
| Net investment income (loss) | 15,457,873 |
|
| | |
| Realized and Unrealized Gain (Loss) | |
| Net realized gain (loss) on: | |
| Investment transactions | 7,068,585 |
|
| Futures contract transactions | 704,906 |
|
| | 7,773,491 |
|
| | |
| Change in net unrealized appreciation (depreciation) on: | |
| Investments | (2,906,948 | ) |
| Futures contracts | (29,387 | ) |
| Swap agreements | (296,496 | ) |
| | (3,232,831 | ) |
| | |
| Net realized and unrealized gain (loss) | 4,540,660 |
|
| | |
| Net Increase (Decrease) in Net Assets Resulting from Operations | $ | 19,998,533 |
|
See Notes to Financial Statements.
|
|
| Statement of Changes in Net Assets |
|
| | | | | | |
| YEARS ENDED MARCH 31, 2016 AND MARCH 31, 2015 |
| Increase (Decrease) in Net Assets | March 31, 2016 | March 31, 2015 |
| Operations | | |
| Net investment income (loss) | $ | 15,457,873 |
| $ | 16,750,290 |
|
| Net realized gain (loss) | 7,773,491 |
| 13,575,277 |
|
| Change in net unrealized appreciation (depreciation) | (3,232,831 | ) | 22,534,883 |
|
| Net increase (decrease) in net assets resulting from operations | 19,998,533 |
| 52,860,450 |
|
| | | |
| Distributions to Shareholders | | |
| From net investment income: | | |
| Investor Class | (12,316,295 | ) | (13,386,982 | ) |
| Institutional Class | (4,438,684 | ) | (4,329,553 | ) |
| A Class | (1,798,457 | ) | (2,251,001 | ) |
| C Class | (25,760 | ) | (14,968 | ) |
| R Class | (39,017 | ) | (39,183 | ) |
| Decrease in net assets from distributions | (18,618,213 | ) | (20,021,687 | ) |
| | | |
| Capital Share Transactions | | |
| Net increase (decrease) in net assets from capital share transactions (Note 5) | (14,972,416 | ) | (166,027,753 | ) |
| | | |
| Net increase (decrease) in net assets | (13,592,096 | ) | (133,188,990 | ) |
| | | |
| Net Assets | | |
| Beginning of period | 1,118,126,362 |
| 1,251,315,352 |
|
| End of period | $ | 1,104,534,266 |
| $ | 1,118,126,362 |
|
| | | |
| Distributions in excess of net investment income | $ | (40,817 | ) | $ | (43,704 | ) |
See Notes to Financial Statements.
|
|
| Notes to Financial Statements |
MARCH 31, 2016
1. Organization
American Century Government Income Trust (the trust) is registered under the Investment Company Act of 1940, as amended (the 1940 Act), as an open-end management investment company and is organized as a Massachusetts business trust. Government Bond Fund (the fund) is one fund in a series issued by the trust. The fund’s investment objective is to seek high current income.
The fund offers the Investor Class, the Institutional Class, the A Class, the C Class and the R Class. The A Class may incur an initial sales charge. The A Class and C Class may be subject to a contingent deferred sales charge. The share classes differ principally in their respective sales charges and distribution and shareholder servicing expenses and arrangements. The Institutional Class is made available to institutional shareholders or through financial intermediaries whose clients do not require the same level of shareholder and administrative services as shareholders of other classes. As a result, the Institutional Class is charged a lower unified management fee.
2. Significant Accounting Policies
The following is a summary of significant accounting policies consistently followed by the fund in preparation of its financial statements. The fund is an investment company and follows accounting and reporting guidance in accordance with accounting principles generally accepted in the United States of America. This may require management to make certain estimates and assumptions at the date of the financial statements. Actual results could differ from these estimates. Management evaluated the impact of events or transactions occurring through the date the financial statements were issued that would merit recognition or disclosure.
Investment Valuations — The fund determines the fair value of its investments and computes its net asset value per share at the close of regular trading (usually 4 p.m. Eastern time) on the New York Stock Exchange (NYSE) on each day the NYSE is open. The Board of Trustees has adopted valuation policies and procedures to guide the investment advisor in the fund’s investment valuation process and to provide methodologies for the oversight of the fund’s pricing function.
Fixed income securities are valued at the evaluated mean as provided by independent pricing services or at the mean of the most recent bid and asked prices as provided by investment dealers. U.S. Treasury and Government Agency securities are valued using market models that consider trade data, quotations from dealers and active market makers, relevant yield curve and spread data, creditworthiness, trade data or market information on comparable securities, and other relevant security specific information. Mortgage-related and asset-backed securities are valued based on models that consider trade data, prepayment and default projections, benchmark yield and spread data and estimated cash flows of each tranche of the issuer.
Open-end management investment companies are valued at the reported net asset value per share. Repurchase agreements are valued at cost, which approximates fair value. Exchange-traded futures contracts are valued at the settlement price as provided by the appropriate clearing corporation. Swap agreements are valued at an evaluated price as provided by independent pricing services or independent brokers.
If the fund determines that the market price for an investment is not readily available or the valuation methods mentioned above do not reflect an investment’s fair value, such investment is valued as determined in good faith by the Board of Trustees or its delegate, in accordance with policies and procedures adopted by the Board of Trustees. In its determination of fair value, the fund may review several factors including, but not limited to, market information regarding the specific investment or comparable investments and correlation with other investment types, futures indices or general market indicators. Circumstances that may cause the fund to use these procedures to value an investment include, but are not limited to: an investment has been declared in default or is distressed; trading in a security has been suspended during the trading day or a security is not actively trading on its principal exchange; prices received from a regular pricing source are deemed unreliable; or there is a foreign market holiday and no trading occurred.
The fund monitors for significant events occurring after the close of an investment’s primary exchange but before the fund’s net asset value per share is determined. Significant events may include, but are not limited to: corporate announcements and transactions; governmental action and political unrest that could impact a
specific investment or an investment sector; or armed conflicts, natural disasters and similar events that could affect investments in a specific country or region.
Security Transactions — Security transactions are accounted for as of the trade date. Net realized gains and losses are determined on the identified cost basis, which is also used for federal income tax purposes.
Investment Income — Interest income is recorded on the accrual basis and includes paydown gain (loss) and accretion of discounts and amortization of premiums. Inflation adjustments related to inflation-linked debt securities are reflected as interest income.
Forward Commitments — The fund may engage in securities transactions on a forward commitment basis. In these transactions, the securities’ prices and yields are fixed on the date of the commitment. The fund may sell a to-be-announced (TBA) security and at the same time make a commitment to purchase the same security at a future date at a specified price. Conversely, the fund may purchase a TBA security and at the same time make a commitment to sell the same security at a future date at a specified price. These types of transactions are known as “TBA roll” transactions and are accounted for as purchases and sales. The fund will segregate cash, cash equivalents or other appropriate liquid securities on its records in amounts sufficient to meet the purchase price.
Repurchase Agreements — The fund may enter into repurchase agreements with institutions that American Century Investment Management, Inc. (ACIM) (the investment advisor) has determined are creditworthy pursuant to criteria adopted by the Board of Trustees. The fund requires that the collateral, represented by securities, received in a repurchase transaction be transferred to the custodian in a manner sufficient to enable the fund to obtain those securities in the event of a default under the repurchase agreement. ACIM monitors, on a daily basis, the securities transferred to ensure the value, including accrued interest, of the securities under each repurchase agreement is equal to or greater than amounts owed to the fund under each repurchase agreement.
Joint Trading Account — Pursuant to an Exemptive Order issued by the Securities and Exchange Commission, the fund, along with certain other funds in the American Century Investments family of funds, may transfer uninvested cash balances into a joint trading account. These balances are invested in one or more repurchase agreements that are collateralized by U.S. Treasury or Agency obligations.
Segregated Assets — In accordance with the 1940 Act, the fund segregates assets on its books and records to cover certain types of investments, including, but not limited to, futures contracts, forward commitments, when-issued securities, swap agreements and certain forward foreign currency exchange contracts. ACIM monitors, on a daily basis, the securities segregated to ensure the fund designates a sufficient amount of liquid assets, marked-to-market daily. The fund may also receive assets or be required to pledge assets at the custodian bank or with a broker for margin requirements on futures contracts, forward commitments and swap agreements.
Income Tax Status — It is the fund’s policy to distribute substantially all net investment income and net realized gains to shareholders and to otherwise qualify as a regulated investment company under provisions of the Internal Revenue Code. Accordingly, no provision has been made for income taxes. The fund files U.S. federal, state, local and non-U.S. tax returns as applicable. The fund's tax returns are subject to examination by the relevant taxing authority until expiration of the applicable statute of limitations, which is generally three years from the date of filing but can be longer in certain jurisdictions. At this time, management believes there are no uncertain tax positions which, based on their technical merit, would not be sustained upon examination and for which it is reasonably possible that the total amounts of unrecognized tax benefits will significantly change in the next twelve months.
Multiple Class — All shares of the fund represent an equal pro rata interest in the net assets of the class to which such shares belong, and have identical voting, dividend, liquidation and other rights and the same terms and conditions, except for class specific expenses and exclusive rights to vote on matters affecting only individual classes. Income, non-class specific expenses, and realized and unrealized capital gains and losses of the fund are allocated to each class of shares based on their relative net assets.
Distributions to Shareholders — Distributions from net investment income, if any, are declared daily and paid monthly. Distributions from net realized gains, if any, are generally declared and paid annually.
Indemnifications — Under the trust’s organizational documents, its officers and trustees are indemnified against certain liabilities arising out of the performance of their duties to the fund. In addition, in the normal course of business, the fund enters into contracts that provide general indemnifications. The maximum exposure under these arrangements is unknown as this would involve future claims that may be made against a fund. The risk of material loss from such claims is considered by management to be remote.
3. Fees and Transactions with Related Parties
Certain officers and trustees of the trust are also officers and/or directors of American Century Companies, Inc. (ACC). The trust's investment advisor, ACIM, the trust's distributor, American Century Investment Services, Inc. (ACIS), and the trust's transfer agent, American Century Services, LLC, are wholly owned, directly or indirectly, by ACC.
Management Fees — The trust has entered into a management agreement with ACIM, under which ACIM provides the fund with investment advisory and management services in exchange for a single, unified management fee (the fee) per class. The agreement provides that all expenses of managing and operating the fund, except distribution and service fees, brokerage expenses, taxes, interest, fees and expenses of the independent trustees (including legal counsel fees), and extraordinary expenses, will be paid by ACIM. The fee is computed and accrued daily based on each class’s daily net assets and paid monthly in arrears. The fee consists of (1) an Investment Category Fee based on the daily net assets of the fund and certain other accounts managed by the investment advisor that are in the same broad investment category as the fund and (2) a Complex Fee based on the assets of all the funds in the American Century Investments family of funds. The rates for the Investment Category Fee range from 0.1625% to 0.2800%. The rates for the Complex Fee range from 0.2500% to 0.3100% for the Investor Class, A Class, C Class and R Class. The rates for the Complex Fee range from 0.0500% to 0.1100% for the Institutional Class. The effective annual management fee for each class for the year ended March 31, 2016 was 0.46% for the Investor Class, A Class, C Class and R Class and 0.26% for the Institutional Class.
Distribution and Service Fees — The Board of Trustees has adopted a separate Master Distribution and Individual Shareholder Services Plan for each of the A Class, C Class and R Class (collectively the plans), pursuant to Rule 12b-1 of the 1940 Act. The plans provide that the A Class will pay ACIS an annual distribution and service fee of 0.25%. The plans provide that the C Class will pay ACIS an annual distribution and service fee of 1.00%, of which 0.25% is paid for individual shareholder services and 0.75% is paid for distribution services. The plans provide that the R Class will pay ACIS an annual distribution and service fee of 0.50%. The fees are computed and accrued daily based on each class’s daily net assets and paid monthly in arrears. The fees are used to pay financial intermediaries for distribution and individual shareholder services. Fees incurred under the plans during the year ended March 31, 2016 are detailed in the Statement of Operations.
Trustees’ Fees and Expenses — The Board of Trustees is responsible for overseeing the investment advisor’s management and operations of the fund. The trustees receive detailed information about the fund and its investment advisor regularly throughout the year, and meet at least quarterly with management of the investment advisor to review reports about fund operations. The fund’s officers do not receive compensation from the fund.
4. Investment Transactions
Purchases and sales of investment securities, excluding short-term investments, for the year ended March 31, 2016 were $3,525,336,183 and $3,542,463,354, respectively, all of which are U.S. Treasury and Government Agency obligations.
5. Capital Share Transactions
Transactions in shares of the fund were as follows (unlimited number of shares authorized):
|
| | | | | | | | | | |
| | Year ended
March 31, 2016 | Year ended March 31, 2015 |
| | Shares | Amount | Shares | Amount |
| Investor Class | | | | |
| Sold | 21,093,777 |
| $ | 236,058,489 |
| 23,180,893 |
| $ | 258,640,245 |
|
| Issued in reinvestment of distributions | 1,020,304 |
| 11,420,220 |
| 1,083,842 |
| 12,096,490 |
|
| Redeemed | (29,149,322 | ) | (326,203,071 | ) | (35,293,272 | ) | (393,644,345 | ) |
| | (7,035,241 | ) | (78,724,362 | ) | (11,028,537 | ) | (122,907,610 | ) |
| Institutional Class | | | | |
| Sold | 14,673,398 |
| 164,421,999 |
| 8,879,144 |
| 99,060,645 |
|
| Issued in reinvestment of distributions | 365,194 |
| 4,086,274 |
| 371,452 |
| 4,144,829 |
|
| Redeemed | (6,935,815 | ) | (77,486,931 | ) | (11,537,059 | ) | (128,801,087 | ) |
| | 8,102,777 |
| 91,021,342 |
| (2,286,463 | ) | (25,595,613 | ) |
| A Class | | | | |
| Sold | 7,605,233 |
| 84,992,805 |
| 8,416,437 |
| 94,035,129 |
|
| Issued in reinvestment of distributions | 87,500 |
| 978,882 |
| 93,131 |
| 1,039,918 |
|
| Redeemed | (10,175,667 | ) | (113,730,088 | ) | (10,126,153 | ) | (113,755,035 | ) |
| | (2,482,934 | ) | (27,758,401 | ) | (1,616,585 | ) | (18,679,988 | ) |
| C Class | | | | |
| Sold | 134,013 |
| 1,502,951 |
| 201,327 |
| 2,258,602 |
|
| Issued in reinvestment of distributions | 2,142 |
| 23,965 |
| 1,156 |
| 12,914 |
|
| Redeemed | (58,620 | ) | (654,366 | ) | (99,326 | ) | (1,102,416 | ) |
| | 77,535 |
| 872,550 |
| 103,157 |
| 1,169,100 |
|
| R Class | | | | |
| Sold | 86,662 |
| 970,114 |
| 171,504 |
| 1,906,520 |
|
| Issued in reinvestment of distributions | 3,048 |
| 34,089 |
| 3,046 |
| 33,992 |
|
| Redeemed | (124,625 | ) | (1,387,748 | ) | (175,553 | ) | (1,954,154 | ) |
| | (34,915 | ) | (383,545 | ) | (1,003 | ) | (13,642 | ) |
| Net increase (decrease) | (1,372,778 | ) | $ | (14,972,416 | ) | (14,829,431 | ) | $ | (166,027,753 | ) |
6. Fair Value Measurements
The fund’s investments valuation process is based on several considerations and may use multiple inputs to determine the fair value of the investments held by the fund. In conformity with accounting principles generally accepted in the United States of America, the inputs used to determine a valuation are classified into three broad levels.
| |
| • | Level 1 valuation inputs consist of unadjusted quoted prices in an active market for identical investments. |
| |
| • | Level 2 valuation inputs consist of direct or indirect observable market data (including quoted prices for comparable investments, evaluations of subsequent market events, interest rates, prepayment speeds, credit risk, etc.). These inputs also consist of quoted prices for identical investments initially expressed in local currencies that are adjusted through translation into U.S. dollars. |
| |
| • | Level 3 valuation inputs consist of unobservable data (including a fund’s own assumptions). |
The level classification is based on the lowest level input that is significant to the fair valuation measurement. The valuation inputs are not necessarily an indication of the risks associated with investing in these securities or other financial instruments. There were no significant transfers between levels during the period.
The following is a summary of the level classifications as of period end. The Schedule of Investments provides additional information on the fund’s portfolio holdings.
|
| | | | | | | | |
| | Level 1 | Level 2 | Level 3 |
| Assets | | | |
| Investment Securities | | | |
| U.S. Treasury Securities | — |
| $ | 589,795,608 |
| — |
|
| U.S. Government Agency Mortgage-Backed Securities | — |
| 490,214,374 |
| — |
|
| Collateralized Mortgage Obligations | — |
| 182,563,155 |
| — |
|
| U.S. Government Agency Securities | — |
| 23,382,842 |
| — |
|
| Temporary Cash Investments | $ | 12,093,761 |
| 18,399,000 |
| — |
|
| | $ | 12,093,761 |
| $ | 1,304,354,979 |
| — |
|
| | | | |
| Liabilities | | | |
| Other Financial Instruments | | | |
| Futures Contracts | $ | 29,387 |
| — |
| — |
|
| Swap Agreements | — |
| $ | 1,269,631 |
| — |
|
| | $ | 29,387 |
| $ | 1,269,631 |
| — |
|
7. Derivative Instruments
Interest Rate Risk — The fund is subject to interest rate risk in the normal course of pursuing its investment objectives. The value of bonds generally declines as interest rates rise. A fund may enter into futures contracts based on a bond index or a specific underlying security. A fund may purchase futures contracts to gain exposure to increases in market value or sell futures contracts to protect against a decline in market value. Upon entering into a futures contract, a fund will segregate cash, cash equivalents or other appropriate liquid securities on its records in amounts sufficient to meet requirements. Subsequent payments (variation margin) are made or received daily, in cash, by a fund. The variation margin is equal to the daily change in the contract value and is recorded as unrealized gains and losses. A fund recognizes a realized gain or loss when the futures contract is closed or expires. Net realized and unrealized gains or losses occurring during the holding period of futures contracts are a component of net realized gain (loss) on futures contract transactions and change in net unrealized appreciation (depreciation) on futures contracts, respectively. One of the risks of entering into futures contracts is the possibility that the change in value of the contract may not correlate with the changes in value of the underlying securities. The fund's average exposure to interest rate risk derivative instruments held during the period was 138 contracts.
Other Contracts — A fund may enter into total return swap agreements in order to attempt to obtain or preserve a particular return or spread at a lower cost than obtaining a return or spread through purchases and/or sales of instruments in other markets or gain exposure to certain markets in the most economical way possible. A fund will segregate cash, cash equivalents or other appropriate liquid securities on its records in amounts sufficient to meet requirements. Changes in value, including the periodic amounts of interest to be paid or received on swap agreements, are recorded as unrealized appreciation (depreciation) on swap agreements. Realized gain or loss is recorded upon receipt or payment of a periodic settlement or termination of swap agreements. Net realized and unrealized gains or losses occurring during the holding period of swap agreements are a component of net realized gain (loss) on swap agreement transactions and change in net unrealized appreciation (depreciation) on swap agreements, respectively. The risks of entering into swap agreements include the possible lack of liquidity, failure of the counterparty to meet its obligations, and that there may be unfavorable changes in the underlying investments or instruments, including inflationary risk. The fund's average notional amount held during the period was $12,000,000.
Value of Derivative Instruments as of March 31, 2016
|
| | | | | | | | |
| | Asset Derivatives | Liability Derivatives |
| Type of Risk Exposure | Location on Statement of Assets and Liabilities | Value | Location on Statement of Assets and Liabilities | Value |
| Interest Rate Risk | Receivable for variation margin on futures contracts* | $ | 24,719 |
| Payable for variation margin on futures contracts* | — |
|
| Other Contracts | Swap agreements | — |
| Swap agreements | $ | 1,269,631 |
|
| | | $ | 24,719 |
| | $ | 1,269,631 |
|
| |
| * | Included in the unrealized appreciation (depreciation) on futures contracts as reported in the Schedule of Investments. |
Effect of Derivative Instruments on the Statement of Operations for the Year Ended March 31, 2016
|
| | | | | | | | |
| | Net Realized Gain (Loss) | Change in Net Unrealized Appreciation (Depreciation) |
| Type of Risk Exposure | Location on Statement of Operations | Value | Location on Statement of Operations | Value |
| Interest Rate Risk | Net realized gain (loss) on futures contract transactions | $ | 704,906 |
| Change in net unrealized appreciation (depreciation) on futures contracts | $ | (29,387 | ) |
| Other Contracts | Net realized gain (loss) on swap agreement transactions | — |
| Change in net unrealized appreciation (depreciation) on swap agreements | (296,496 | ) |
| | | $ | 704,906 |
| | $ | (325,883 | ) |
8. Risk Factors
The fund’s investment process may result in high portfolio turnover, which could mean high transaction costs, affecting both performance and capital gains tax liabilities to investors.
9. Federal Tax Information
The tax character of distributions paid during the years ended March 31, 2016 and March 31, 2015 were as follows:
|
| | | | | | |
| | 2016 | 2015 |
| Distributions Paid From | | |
| Ordinary income | $ | 18,618,213 |
| $ | 20,021,687 |
|
| Long-term capital gains | — |
| — |
|
The book-basis character of distributions made during the year from net investment income or net realized gains may differ from their ultimate characterization for federal income tax purposes. These differences reflect the differing character of certain income items and net realized gains and losses for financial statement and tax purposes, and may result in reclassification among certain capital accounts on the financial statements.
As of March 31, 2016, the federal tax cost of investments and the components of distributable earnings on a tax-basis were as follows:
|
| | | |
| Federal tax cost of investments | $ | 1,279,181,813 |
|
| Gross tax appreciation of investments | $ | 38,292,102 |
|
| Gross tax depreciation of investments | (1,025,175 | ) |
| Net tax appreciation (depreciation) of investments | 37,266,927 |
|
| Net tax appreciation (depreciation) on derivatives | (1,269,631 | ) |
| Net tax appreciation (depreciation) | $ | 35,997,296 |
|
| Other book-to-tax adjustments | $ | (892,753 | ) |
| Undistributed ordinary income | — |
|
| Accumulated long-term capital losses | $ | (141,518 | ) |
The difference between book-basis and tax-basis unrealized appreciation (depreciation) is attributable primarily to the tax deferral of losses on wash sales. Other book-to-tax adjustments are attributable primarily to the tax deferral of losses on straddle positions.
Accumulated capital losses represent net capital loss carryovers that may be used to offset future realized capital gains for federal income tax purposes. The capital loss carryovers may be carried forward for an unlimited period. Future capital loss carryover utilization in any given year may be subject to Internal Revenue Code limitations.
|
| | | | | | | | | | | | | | | |
| For a Share Outstanding Throughout the Years Ended March 31 (except as noted) |
| Per-Share Data | Ratios and Supplemental Data |
| | | Income From Investment Operations: | Distributions From: | | | Ratio to Average Net Assets of: | | |
| | Net Asset
Value,
Beginning
of Period | Net
Investment
Income
(Loss)(1) | Net
Realized
and
Unrealized
Gain (Loss) | Total From
Investment
Operations | Net
Investment
Income | Net
Realized
Gains | Total
Distributions | Net Asset
Value,
End
of Period | Total
Return(2) | Operating
Expenses | Net
Investment
Income
(Loss) | Portfolio
Turnover
Rate | Net
Assets,
End of
Period
(in thousands) |
| Investor Class |
| 2016 | $11.30 | 0.16 | 0.05 | 0.21 | (0.19) | — | (0.19) | $11.32 | 1.89% | 0.47% | 1.41% | 280% |
| $669,187 |
|
| 2015 | $10.99 | 0.16 | 0.33 | 0.49 | (0.18) | — | (0.18) | $11.30 | 4.54% | 0.47% | 1.39% | 270% |
| $747,496 |
|
| 2014 | $11.39 | 0.15 | (0.33) | (0.18) | (0.20) | (0.02) | (0.22) | $10.99 | (1.58)% | 0.47% | 1.34% | 209% |
| $848,786 |
|
| 2013 | $11.43 | 0.18 | 0.09 | 0.27 | (0.24) | (0.07) | (0.31) | $11.39 | 2.36% | 0.47% | 1.59% | 184% |
| $1,074,464 |
|
| 2012 | $11.07 | 0.29 | 0.50 | 0.79 | (0.31) | (0.12) | (0.43) | $11.43 | 7.20% | 0.48% | 2.53% | 127% |
| $1,139,706 |
|
| Institutional Class |
| 2016 | $11.29 | 0.18 | 0.05 | 0.23 | (0.21) | — | (0.21) | $11.31 | 2.10% | 0.27% | 1.61% | 280% |
| $315,881 |
|
| 2015 | $10.99 | 0.18 | 0.33 | 0.51 | (0.21) | — | (0.21) | $11.29 | 4.65% | 0.27% | 1.59% | 270% |
| $223,807 |
|
| 2014 | $11.38 | 0.17 | (0.31) | (0.14) | (0.23) | (0.02) | (0.25) | $10.99 | (1.29)% | 0.27% | 1.54% | 209% |
| $242,958 |
|
| 2013 | $11.42 | 0.20 | 0.09 | 0.29 | (0.26) | (0.07) | (0.33) | $11.38 | 2.56% | 0.27% | 1.79% | 184% |
| $397,188 |
|
| 2012 | $11.07 | 0.31 | 0.49 | 0.80 | (0.33) | (0.12) | (0.45) | $11.42 | 7.32% | 0.28% | 2.73% | 127% |
| $58,198 |
|
|
| | | | | | | | | | | | | | | |
| For a Share Outstanding Throughout the Years Ended March 31 (except as noted) |
| Per-Share Data | Ratios and Supplemental Data |
| | | Income From Investment Operations: | Distributions From: | | | Ratio to Average Net Assets of: | | |
| | Net Asset
Value,
Beginning
of Period | Net
Investment
Income
(Loss)(1) | Net
Realized
and
Unrealized
Gain (Loss) | Total From
Investment
Operations | Net
Investment
Income | Net
Realized
Gains | Total
Distributions | Net Asset
Value,
End
of Period | Total
Return(2) | Operating
Expenses | Net
Investment
Income
(Loss) | Portfolio
Turnover
Rate | Net
Assets,
End of
Period
(in thousands) |
| A Class |
| 2016 | $11.29 | 0.13 | 0.05 | 0.18 | (0.16) | — | (0.16) | $11.31 | 1.64% | 0.72% | 1.16% | 280% |
| $111,920 |
|
| 2015 | $10.99 | 0.13 | 0.33 | 0.46 | (0.16) | — | (0.16) | $11.29 | 4.18% | 0.72% | 1.14% | 270% |
| $139,772 |
|
| 2014 | $11.39 | 0.12 | (0.32) | (0.20) | (0.18) | (0.02) | (0.20) | $10.99 | (1.82)% | 0.72% | 1.09% | 209% |
| $153,830 |
|
| 2013 | $11.43 | 0.16 | 0.08 | 0.24 | (0.21) | (0.07) | (0.28) | $11.39 | 2.10% | 0.72% | 1.34% | 184% |
| $206,394 |
|
| 2012 | $11.07 | 0.26 | 0.50 | 0.76 | (0.28) | (0.12) | (0.40) | $11.43 | 6.93% | 0.73% | 2.28% | 127% |
| $223,798 |
|
| C Class |
| 2016 | $11.29 | 0.05 | 0.05 | 0.10 | (0.08) | — | (0.08) | $11.31 | 0.88% | 1.47% | 0.41% | 280% |
| $4,473 |
|
| 2015 | $10.99 | 0.04 | 0.33 | 0.37 | (0.07) | — | (0.07) | $11.29 | 3.41% | 1.47% | 0.39% | 270% |
| $3,590 |
|
| 2014 | $11.38 | 0.04 | (0.32) | (0.28) | (0.09) | (0.02) | (0.11) | $10.99 | (2.47)% | 1.47% | 0.34% | 209% |
| $2,361 |
|
| 2013 | $11.42 | 0.07 | 0.08 | 0.15 | (0.12) | (0.07) | (0.19) | $11.38 | 1.35% | 1.47% | 0.59% | 184% |
| $4,166 |
|
| 2012 | $11.07 | 0.17 | 0.49 | 0.66 | (0.19) | (0.12) | (0.31) | $11.42 | 6.04% | 1.48% | 1.53% | 127% |
| $2,584 |
|
| R Class |
| 2016 | $11.29 | 0.10 | 0.05 | 0.15 | (0.13) | — | (0.13) | $11.31 | 1.39% | 0.97% | 0.91% | 280% |
| $3,073 |
|
| 2015 | $10.99 | 0.10 | 0.33 | 0.43 | (0.13) | — | (0.13) | $11.29 | 3.92% | 0.97% | 0.89% | 270% |
| $3,462 |
|
| 2014 | $11.38 | 0.09 | (0.31) | (0.22) | (0.15) | (0.02) | (0.17) | $10.99 | (1.98)% | 0.97% | 0.84% | 209% |
| $3,380 |
|
| 2013 | $11.42 | 0.12 | 0.09 | 0.21 | (0.18) | (0.07) | (0.25) | $11.38 | 1.85% | 0.97% | 1.09% | 184% |
| $3,148 |
|
| 2012 | $11.07 | 0.23 | 0.49 | 0.72 | (0.25) | (0.12) | (0.37) | $11.42 | 6.58% | 0.98% | 2.03% | 127% |
| $617 |
|
|
| |
| Notes to Financial Highlights |
| |
| (1) | Computed using average shares outstanding throughout the period. |
| |
| (2) | Total returns are calculated based on the net asset value of the last business day and do not reflect applicable sales charges, if any. Total returns for periods less than one year are not annualized. |
See Notes to Financial Statements.
|
|
| Report of Independent Registered Public Accounting Firm |
To the Trustees of the American Century Government Income Trust and Shareholders of the Government Bond Fund:
In our opinion, the accompanying statement of assets and liabilities, including the schedule of investments, and the related statements of operations and of changes in net assets and the financial highlights present fairly, in all material respects, the financial position of the Government Bond Fund (one of the five funds comprising the American Century Government Income Trust, hereafter referred to as the “Fund”) at March 31, 2016, the results of its operations for the year then ended, the changes in its net assets for each of the two years in the period then ended and the financial highlights for each of the five years in the period then ended, in conformity with accounting principles generally accepted in the United States of America. These financial statements and financial highlights (hereafter referred to as "financial statements") are the responsibility of the Fund's management. Our responsibility is to express an opinion on these financial statements based on our audits. We conducted our audits of these financial statements in accordance with the standards of the Public Company Accounting Oversight Board (United States). Those standards require that we plan and perform the audit to obtain reasonable assurance about whether the financial statements are free of material misstatement. An audit includes examining, on a test basis, evidence supporting the amounts and disclosures in the financial statements, assessing the accounting principles used and significant estimates made by management, and evaluating the overall financial statement presentation. We believe that our audits, which included confirmation of securities at March 31, 2016 by correspondence with the custodian and brokers, provide a reasonable basis for our opinion.
PricewaterhouseCoopers LLP
Kansas City, Missouri
May 18, 2016
Board of Trustees
The individuals listed below serve as trustees of the funds. Each trustee will continue to serve in this capacity until death, retirement, resignation or removal from office. The board has adopted a mandatory retirement age for trustees who are not “interested persons,” as that term is defined in the Investment Company Act (independent trustees). Independent trustees shall retire on December 31 of the year in which they reach their 75th birthday; provided, however, that on or after January 1, 2022, independent trustees shall retire on December 31 of the year in which they reach their 76th birthday.
Mr. Thomas is an “interested person” because he currently serves as President and Chief Executive Officer of American Century Companies, Inc. (ACC), the parent company of American Century Investment Management, Inc. (ACIM or the advisor). The other trustees (more than three-fourths of the total number) are independent. They are not employees, directors or officers of, and have no financial interest in, ACC or any of its wholly owned, direct or indirect, subsidiaries, including ACIM, American Century Investment Services, Inc. (ACIS) and American Century Services, LLC (ACS), and they do not have any other affiliations, positions or relationships that would cause them to be considered “interested persons” under the Investment Company Act. The trustees serve in this capacity for eight (in the case of Mr. Thomas, 15) registered investment companies in the American Century Investments family of funds.
The following table presents additional information about the trustees. The mailing address for each trustee other than Mr. Thomas is 1665 Charleston Road, Mountain View, California 94043. The mailing address for Mr. Thomas is 4500 Main Street, Kansas City, Missouri 64111.
|
| | | | | |
Name (Year of Birth) | Position(s) Held with Funds | Length of Time Served | Principal Occupation(s) During Past 5 Years | Number of American Century Portfolios Overseen by Trustee | Other Directorships Held During Past 5 Years |
| Independent Trustees |
Tanya S. Beder (1955) | Trustee | Since 2011 | Chairman and CEO, SBCC Group Inc. (independent advisory services) (2006 to present) | 45 | CYS Investments, Inc. (NYSE mortgage arbitrage REIT) |
Jeremy I. Bulow (1954) | Trustee | Since 2011 | Professor of Economics, Stanford University, Graduate School of Business (1979 to present) | 45 | None |
Anne Casscells (1958) | Advisory Board Member | Since 2016 | Co-Chief Executive Officer and Chief Investment Officer, Aetos Alternatives Management (investment advisory firm) (2001 to present); Lecturer in Accounting, Stanford University, Graduate School of Business (2009 to present) | 45 | None |
Ronald J. Gilson (1946) | Trustee and Chairman of the Board | Since 1995 (Chairman since 2005) | Charles J. Meyers Professor of Law and Business, Stanford Law School (1979 to present); Marc and Eva Stern Professor of Law and Business, Columbia University School of Law (1992 to present) | 45 | None |
|
| | | | | |
Name (Year of Birth) | Position(s) Held with Funds | Length of Time Served | Principal Occupation(s) During Past 5 Years | Number of American Century Portfolios Overseen by Trustee | Other Directorships Held During Past 5 Years |
| Independent Trustees |
Frederick L. A. Grauer (1946) | Trustee | Since 2008 | Senior Advisor, iShares by BlackRock, Inc. (investment management firm) (2010 to 2011, 2013 to present); Senior Advisor, Course Hero (an educational technology company) (2015 to present) | 45 | None |
Jonathan D. Levin (1972) | Advisory Board Member | Since 2016 | Holbrook Working Professor of Price Theory, Standford University, (2000 to present); Chair, Department of Economics, Stanford University (2011 to 2014) | 45 | None |
Peter F. Pervere (1947) | Trustee | Since 2007 | Retired | 45 | None |
John B. Shoven (1947) | Trustee | Since 2002 | Charles R. Schwab Professor of Economics, Stanford University (1973 to present) | 45 | Cadence Design Systems; Exponent; Financial Engines |
| Interested Trustee |
Jonathan S. Thomas (1963) | Trustee and President | Since 2007 | President and Chief Executive Officer, ACC (March 2007 to present). Also serves as Chief Executive Officer, ACS; Executive Vice President, ACIM; Director, ACC, ACIM and other ACC subsidiaries | 128 | BioMed Valley Discoveries, Inc. |
The Statement of Additional Information has additional information about the fund's trustees and is available without charge, upon request, by calling 1-800-345-2021.
Officers
The following table presents certain information about the executive officers of the funds. Each officer serves as an officer for each of the 15 investment companies in the American Century family of funds, unless otherwise noted. No officer is compensated for his or her service as an officer of the funds. The listed officers are interested persons of the funds and are appointed or re-appointed on an annual basis. The mailing address for each of the officers listed below is 4500 Main Street, Kansas City, Missouri 64111.
|
| | |
Name (Year of Birth) | Offices with the Funds | Principal Occupation(s) During the Past Five Years |
Jonathan S. Thomas (1963) | Trustee and President since 2007 | President and Chief Executive Officer, ACC (March 2007 to present). Also serves as Chief Executive Officer, ACS; Executive Vice President, ACIM; Director, ACC, ACIM and other ACC subsidiaries |
Amy D. Shelton (1964) | Chief Compliance Officer and Vice President since 2014 | Chief Compliance Officer, American Century funds, (March 2014 to present); Chief Compliance Officer, ACIM (February 2014 to present); Chief Compliance Officer, ACIS (October 2009 to present); Vice President, Client Interactions and Marketing, ACIS (February 2013 to January 2014); Director, Client Interactions and Marketing, ACIS (June 2007 to January 2013). Also serves as Vice President, ACIS |
Charles A. Etherington (1957) | General Counsel since 2007 and Senior Vice President since 2006 | Attorney, ACC (February 1994 to present); Vice President, ACC (November 2005 to present); General Counsel, ACC (March 2007 to present). Also serves as General Counsel, ACIM, ACS, ACIS and other ACC subsidiaries; and Senior Vice President, ACIM and ACS |
C. Jean Wade (1964) | Vice President, Treasurer and Chief Financial Officer since 2012 | Vice President, ACS (February 2000 to present) |
Robert J. Leach (1966) | Vice President since 2006 and Assistant Treasurer since 2012 | Vice President, ACS (February 2000 to present) |
David H. Reinmiller (1963) | Vice President since 2001 | Attorney, ACC (January 1994 to present); Associate General Counsel, ACC (January 2001 to present). Also serves as Vice President, ACIM and ACS |
Ward D. Stauffer (1960) | Secretary since 2005 | Attorney, ACC (June 2003 to present) |
Retirement Account Information
As required by law, distributions you receive from certain IRAs are subject to federal income tax withholding, unless you elect not to have withholding apply. Tax will be withheld on the total amount withdrawn even though you may be receiving amounts that are not subject to withholding, such as nondeductible contributions. In such case, excess amounts of withholding could occur. You may adjust your withholding election so that a greater or lesser amount will be withheld.
If you don’t want us to withhold on this amount, you must notify us to not withhold the federal income tax. You may notify us in writing or in certain situations by telephone or through other electronic means. For systematic withdrawals, your withholding election will remain in effect until revoked or changed by filing a new election. You have the right to revoke your election at any time.
Remember, even if you elect not to have income tax withheld, you are liable for paying income tax on the taxable portion of your withdrawal. If you elect not to have income tax withheld or you don’t have enough income tax withheld, you may be responsible for payment of estimated tax. You may incur penalties under the estimated tax rules if your withholding and estimated tax payments are not sufficient. You can reduce or defer the income tax on a distribution by directly or indirectly rolling such distribution over to another IRA or eligible plan. You should consult your tax advisor for additional information.
State tax will be withheld if, at the time of your distribution, your address is within one of the mandatory withholding states and you have federal income tax withheld (or as otherwise required by state law). State taxes will be withheld from your distribution in accordance with the respective state rules.
Distributions you receive from 403(b), 457 and qualified plans are subject to special tax and withholding rules. Your plan administrator or plan sponsor is required to provide you with a special tax notice explaining those rules at the time you request a distribution. If applicable, federal and/or state taxes may be withheld from your distribution amount.
Proxy Voting Policies
Descriptions of the principles and policies that the fund's investment advisor uses in exercising the voting rights associated with the securities purchased and/or held by the fund are available without charge, upon request, by calling 1-800-345-2021 or visiting the "About Us" page of American Century Investments’ website at americancentury.com. A description of the policies is also available on the Securities and Exchange Commission’s website at sec.gov. Information regarding how the investment advisor voted proxies relating to portfolio securities during the most recent 12-month period ended June 30 is available on the "About Us" page at americancentury.com. It is also available at sec.gov.
Quarterly Portfolio Disclosure
The fund files its complete schedule of portfolio holdings with the Securities and Exchange Commission (SEC) for the first and third quarters of each fiscal year on Form N-Q. The fund’s Forms N-Q are available on the SEC’s website at sec.gov, and may be reviewed and copied at the SEC’s Public Reference Room in Washington, DC. Information on the operation of the Public Reference Room may be obtained by calling 1-800-SEC-0330. The fund also makes its complete schedule of portfolio holdings for the most recent quarter of its fiscal year available on its
website at americancentury.com and, upon request, by calling 1-800-345-2021.
|
| | |
| |
| | | |
| Contact Us | americancentury.com | |
| Automated Information Line | 1-800-345-8765 | |
| Investor Services Representative | 1-800-345-2021 or 816-531-5575 | |
| Investors Using Advisors | 1-800-378-9878 | |
| Business, Not-For-Profit, Employer-Sponsored Retirement Plans | 1-800-345-3533 | |
| Banks and Trust Companies, Broker-Dealers, Financial Professionals, Insurance Companies | 1-800-345-6488 | |
| Telecommunications Relay Service for the Deaf | 711 | |
| | | |
| American Century Government Income Trust | |
| | | |
Investment Advisor: American Century Investment Management, Inc. Kansas City, Missouri | |
| | | |
| This report and the statements it contains are submitted for the general information of our shareholders. The report is not authorized for distribution to prospective investors unless preceded or accompanied by an effective prospectus. | |
| | | |
©2016 American Century Proprietary Holdings, Inc. All rights reserved.
CL-ANN-88873 1605
| |
|
| |
| | |
| | Annual Report |
| | |
| | March 31, 2016 |
| | |
| | Inflation-Adjusted Bond Fund |
|
| | |
| President’s Letter | 2 |
|
| Performance | 3 |
|
| Portfolio Commentary | |
|
| Fund Characteristics | |
|
| Shareholder Fee Example | |
|
| Schedule of Investments | |
|
| Statement of Assets and Liabilities | |
|
| Statement of Operations | |
|
| Statement of Changes in Net Assets | |
|
| Notes to Financial Statements | |
|
| Financial Highlights | |
|
| Report of Independent Registered Public Accounting Firm | |
|
| Management | |
|
| Additional Information | |
|
Any opinions expressed in this report reflect those of the author as of the date of the report, and do not necessarily represent the opinions of American Century Investments® or any other person in the American Century Investments organization. Any such opinions are subject to change at any time based upon market or other conditions and American Century Investments disclaims any responsibility to update such opinions. These opinions may not be relied upon as investment advice and, because investment decisions made by American Century Investments funds are based on numerous factors, may not be relied upon as an indication of trading intent on behalf of any American Century Investments fund. Security examples are used for representational purposes only and are not intended as recommendations to purchase or sell securities. Performance information for comparative indices and securities is provided to American Century Investments by third party vendors. To the best of American Century Investments’ knowledge, such information is accurate at the time of printing.
|
| |
| Dear Investor:
Thank you for reviewing this annual report for the 12 months ended March 31, 2016. It provides investment performance and portfolio information for the reporting period, plus longer-term historical performance data.
Annual reports help convey information about fund performance, including market and economic factors that affected returns during the reporting period. For additional, updated investment and market insights, we encourage you to visit our website, americancentury.com.
|
| Jonathan Thomas |
Divergence in Economic Growth and Monetary Policies, Combined With China Turmoil, Triggered Market Volatility
Divergence between the U.S. and the rest of the world—along with China’s struggles, plunging commodity prices, capital market volatility, and risk-off trading—were dominant themes during the reporting period. Global divergence described not only the relatively stronger economic growth enjoyed by the U.S. compared with most of the world, but also the related contrast between the U.S. Federal Reserve’s (the Fed’s) unwinding of monetary stimulus versus the continuation and expansion of stimulus by other major central banks.
Two months in particular captured the volatility and risk-off trading of the 12-month period. Last August, China’s economic slowdown (which rippled across the global economy) triggered Chinese stock market volatility, increasingly stimulative Chinese central bank monetary policy, and currency devaluations. Burdened further with oil market volatility, equity and higher-risk bond markets declined globally. Five months later, in January, investor sentiment plunged again as global economic growth decelerated, China devalued its currency again, and oil prices dropped below $30 a barrel. In addition, the Fed, in December, executed its first rate hike since 2006. Central bank policies showed less divergence thereafter, with the Bank of Japan suddenly resorting to negative interest rates, the Fed holding rates steady while reducing its rate hike projections, and the European Central Bank announcing significant additional stimulus.
Bonds (and more bond-like stock sectors, such as utilities and REITs) generally outperformed the broad stock market for the reporting period. In terms of stock style and size, growth generally outperformed value, and large cap generally outperformed small cap. In the bond market, higher quality (investment-grade) generally outperformed lower quality (high-yield). We expect continued economic and monetary policy divergence between the U.S. and non-U.S. economies in 2016, accompanied by further market volatility. This could present both challenges and opportunities for active investment managers. Looking ahead, we continue to believe in a disciplined, diversified, risk-aware investment approach, using professionally managed portfolios to meet financial goals. We appreciate your trust in us.
Sincerely,
Jonathan Thomas
President and Chief Executive Officer
American Century Investments
|
| | | | | | |
| Total Returns as of March 31, 2016 | |
| | | | Average Annual Returns | |
| | Ticker Symbol | 1 year | 5 years | 10 years | Since Inception | Inception Date |
| Investor Class | ACITX | 0.98% | 2.46% | 4.18% | — | 2/10/97 |
| Barclays U.S. Treasury Inflation Protected Securities (TIPS) Index | — | 1.51% | 3.02% | 4.62% | — | — |
| Institutional Class | AIANX | 1.19% | 2.68% | 4.39% | — | 10/1/02 |
| A Class | AIAVX | | | | — | 6/15/98 |
| No sales charge | | 0.73% | 2.21% | 3.91% | — | |
| With sales charge | | -3.78% | 1.28% | 3.43% | — | |
| C Class | AINOX | -0.05% | 1.45% | — | 2.18% | 3/1/10 |
| R Class | AIARX | 0.48% | 1.95% | — | 2.69% | 3/1/10 |
Sales charges include initial sales charges and contingent deferred sales charges (CDSCs), as applicable. A Class shares have a 4.50% maximum initial sales charge and may be subject to a maximum CDSC of 1.00%. C Class shares redeemed within 12 months of purchase are subject to a maximum CDSC of 1.00%. The SEC requires that mutual funds provide performance information net of maximum sales charges in all cases where charges could be applied.
Average annual returns since inception are presented when ten years of performance history is not available.
Prior to March 1, 2010, the A Class was referred to as the Advisor Class and did not have a front-end sales charge. Performance prior to that date has been adjusted to reflect this charge.
Data presented reflect past performance. Past performance is no guarantee of future results. Current performance may be higher or lower than the performance shown. Total returns for periods less than one year are not annualized. Investment return and principal value will fluctuate, and redemption value may be more or less than original cost. Data assumes reinvestment of dividends and capital gains, and none of the charts reflect the deduction of taxes that a shareholder would pay on fund distributions or the redemption of fund shares. To obtain performance data current to the most recent month end, please call 1-800-345-2021 or visit americancentury.com. For additional information about the fund, please consult the prospectus.
|
|
| Growth of $10,000 Over 10 Years |
| $10,000 investment made March 31, 2006 |
Performance for other share classes will vary due to differences in fee structure.
|
|
| |
| Value on March 31, 2016 |
| | Investor Class — $15,062 |
| |
| | Barclays U.S. Treasury Inflation Protected Securities (TIPS) Index — $15,712 |
| |
|
| | | | |
| Total Annual Fund Operating Expenses |
| Investor Class | Institutional Class | A Class | C Class | R Class |
| 0.47% | 0.27% | 0.72% | 1.47% | 0.97% |
The total annual fund operating expenses shown is as stated in the fund’s prospectus current as of the date of this report. The prospectus may vary from the expense ratio shown elsewhere in this report because it is based on a different time period, includes acquired fund fees and expenses, and, if applicable, does not include fee waivers or expense reimbursements.
Data presented reflect past performance. Past performance is no guarantee of future results. Current performance may be higher or lower than the performance shown. Total returns for periods less than one year are not annualized. Investment return and principal value will fluctuate, and redemption value may be more or less than original cost. Data assumes reinvestment of dividends and capital gains, and none of the charts reflect the deduction of taxes that a shareholder would pay on fund distributions or the redemption of fund shares. To obtain performance data current to the most recent month end, please call 1-800-345-2021 or visit americancentury.com. For additional information about the fund, please consult the prospectus.
Portfolio Managers: Bob Gahagan, Brian Howell, Jim Platz, and Miguel Castillo
Performance Summary
Inflation-Adjusted Bond advanced 0.98%* for the 12 months ended March 31, 2016. By comparison, the Barclays U.S. Treasury Inflation Protected Securities (TIPS) Index gained 1.51%. Fund and index gains reflected the generally favorable environment for U.S. government bonds. Compared with the index, the portfolio’s out-of-index exposure to corporate bonds and inflation swaps detracted from performance. In addition, fund returns reflect operating expenses, while index returns do not.
Headline Inflation Was Weak as Growth Remained Slow, Oil Prices Plunged
Against a backdrop of weak economic growth and plunging oil prices, U.S. headline inflation remained muted during the 12-month period ended March 31, 2016. According to the year-to-year change in the Consumer Price Index (CPI), headline inflation ended the period up 0.9%, compared with -0.1% a year earlier but still below the Federal Reserve’s (the Fed’s) target rate of 2.0%. Meanwhile, core CPI, which excludes food and energy costs, was up 2.2% for the 12-month period, compared with 1.8% in March 2015. Global commodity prices, which influence the headline inflation rate, declined significantly during the 12-month period, largely due to a sharp sell-off in the global oil markets triggered by supply/demand imbalances. For the 12-month period, Brent crude fell -28.49%, while West Texas Intermediate (WTI) crude dropped -19.76%.
Longer-term inflation expectations also declined. Specifically, the 10-year breakeven rate (the yield difference between 10-year TIPS and nominal 10-year Treasuries) narrowed from 178 basis points (one basis point equals 0.01%) at the end of March 2015 to 163 basis points at the end of March 2016. Theoretically, this rate indicates the market’s expectations for inflation for the next 10 years and also reflects the inflation rate required for TIPS to outperform nominal Treasuries during that period (1.63% or higher).
The low-inflation environment allowed the Fed to maintain accommodative monetary policies that eventually may trigger higher inflation. Specifically, the Fed continued to reinvest the coupon interest from its bond holdings (purchased as part of its quantitative easing program, which ended in October 2014) back into the bond market. And although the Fed started moving toward interest rate “normalization” in December 2015, it only lifted rates 25 basis points-from 0.00%-0.25% to 0.25%-0.50%. Furthermore, the Fed scaled back its forecast for additional rate hikes in 2016, suggesting monetary policy would remain relatively accommodative in 2016.
Mixed Economic Data, Investor Speculation About Fed Policy Triggered Bond Market Volatility
The combination of mixed U.S. economic data, slowing global growth, plunging oil prices, and investor speculation regarding the timing and magnitude of Fed rate hikes led to a volatile 12-month period. Early in the period, U.S. bond market performance stumbled, largely due to Fed rate-hike speculation, a sharp bond market sell-off in Europe, and fallout from Greece’s inability to repay its government debt. Broad bond market performance rebounded in the summer of 2015 as Greece reached a deal with its creditors. In addition, mounting concerns about slowing growth in
China and its influence on the entire global economy triggered a flight to quality, which generally favored nominal U.S. Treasuries and pushed back a widely anticipated September rate hike from
* All fund returns referenced in this commentary are for Investor Class shares. Performance for other share classes will vary due to differences in fee structure; when Investor Class performance exceeds that of the index, other share classes may not. See page 3 for returns for all share classes.
the Fed. But falling commodity prices and lower inflation expectations led to negative returns for TIPS. Investor expectations for the Fed to begin normalizing short-term interest rates at its December monetary policy meeting pushed Treasury yields back up again late in 2015. On December 16, the Fed finally initiated “liftoff” and indicated the path to rate normalization would continue in 2016.
But more volatility preceded any possible normalization. The prospects for a first-quarter 2016 Fed rate hike quickly faded as weaker U.S. and global growth triggered recession fears early in 2016, and nominal Treasury yields tumbled again. Yields headed back upward in late February as stabilization in the oil markets and new stimulus plans from the European Central Bank triggered a return to “risk-on” trading in the second half of the quarter. But in March, the Fed, citing concerns about global growth, reduced its rate-hike forecast for 2016 from four to two, and nominal Treasury yields headed downward once again. TIPS rallied on the longer-term inflation implications of the Fed’s dovish stance.
Against this backdrop, the nominal U.S. Treasury yield curve flattened. Yields on Fed policy-sensitive shorter-maturity securities increased in anticipation of Fed tightening, while yields on longer-maturity securities declined due to weak global growth and low inflation. Overall, longer-duration (greater price sensitivity to interest rate changes) securities and strategies outperformed shorter duration. Despite the slow-growth, weak-inflation backdrop, TIPS performance remained positive for the one-year period, largely due to a modest uptick in breakeven rates late in the period, after the Fed reduced its rate-hike forecast. But TIPS generally underperformed nominal Treasuries and the broad investment-grade bond market.
Sector Allocation (Non-TIPS Exposure) Detracted from Relative Results
Approximately 86% of the portfolio was invested in TIPS at the end of March 2016. The remainder was invested in out-of-index securities, including investment-grade corporate bonds, which generally underperformed TIPS and detracted from the portfolio’s relative performance. Positions in high-quality mortgage-backed securities and non-U.S.-dollar inflation-linked securities outperformed TIPS and aided results relative to the all-TIPS index. In addition, we added a small position in high-yield corporate bonds in January and February, when valuations appeared compelling. These securities rallied in March, providing a boost to relative performance.
To diversify inflation protection, we used inflation “swaps” to create an inflation “overlay” for the non-inflation-linked corporate and mortgage securities. Inflation swaps are fixed-maturity instruments, negotiated through a counterparty (investment bank), that return the rate of inflation (CPI). All swaps bear counterparty credit risk, but American Century Investments applies stringent controls and oversight with regard to this risk. Overall, this strategy positioned the portfolio with greater sensitivity to inflation, which detracted from performance as longer-term inflation expectations declined.
Outlook
We believe the divergence between headline and core inflation may be ending but will remain subject to the future direction of commodity prices. We also believe headline inflation eventually will converge with core inflation, and a stabilization in commodity prices coupled with continued U.S. economic growth ultimately will create higher inflation than is currently priced into the bond market. In the meantime, we expect to maintain the portfolio’s greater sensitivity to inflation due to attractive valuations in the TIPS sector.
|
| |
| MARCH 31, 2016 | |
| Portfolio at a Glance | |
| Average Duration (effective) | 6.2 years |
| Weighted Average Life | 9.1 years |
| | |
| Types of Investments in Portfolio | % of net assets |
| U.S. Treasury Securities | 86.0% |
| Commercial Mortgage-Backed Securities | 4.8% |
| Corporate Bonds | 3.9% |
| Collateralized Mortgage Obligations | 2.5% |
| Asset-Backed Securities | 2.2% |
| Sovereign Governments and Agencies | 0.6% |
| Municipal Securities | 0.1% |
| Temporary Cash Investments | 0.7% |
| Other Assets and Liabilities | (0.8)% |
Fund shareholders may incur two types of costs: (1) transaction costs, including sales charges (loads) on purchase payments and redemption/exchange fees; and (2) ongoing costs, including management fees; distribution and service (12b-1) fees; and other fund expenses. This example is intended to help you understand your ongoing costs (in dollars) of investing in your fund and to compare these costs with the ongoing cost of investing in other mutual funds.
The example is based on an investment of $1,000 made at the beginning of the period and held for the entire period from October 1, 2015 to March 31, 2016.
Actual Expenses
The table provides information about actual account values and actual expenses for each class. You may use the information, together with the amount you invested, to estimate the expenses that you paid over the period. First, identify the share class you own. Then simply divide your account value by $1,000 (for example, an $8,600 account value divided by $1,000 = 8.6), then multiply the result by the number under the heading “Expenses Paid During Period” to estimate the expenses you paid on your account during this period.
If you hold Investor Class shares of any American Century Investments fund, or Institutional Class shares of the American Century Diversified Bond Fund, in an American Century Investments account (i.e., not a financial intermediary or retirement plan account), American Century Investments may charge you a $12.50 semiannual account maintenance fee if the value of those shares is less than $10,000. We will redeem shares automatically in one of your accounts to pay the $12.50 fee. In determining your total eligible investment amount, we will include your investments in all personal accounts (including American Century Investments Brokerage accounts) registered under your Social Security number. Personal accounts include individual accounts, joint accounts, UGMA/UTMA accounts, personal trusts, Coverdell Education Savings Accounts and IRAs (including traditional, Roth, Rollover, SEP-, SARSEP- and SIMPLE-IRAs), and certain other retirement accounts. If you have only business, business retirement, employer-sponsored or American Century Investments Brokerage accounts, you are currently not subject to this fee. If you are subject to the Account Maintenance Fee, your account value could be reduced by the fee amount.
Hypothetical Example for Comparison Purposes
The table also provides information about hypothetical account values and hypothetical expenses based on the actual expense ratio of each class of your fund and an assumed rate of return of 5% per year before expenses, which is not the actual return of a fund’s share class. The hypothetical account values and expenses may not be used to estimate the actual ending account balance or expenses you paid for the period. You may use this information to compare the ongoing costs of investing in your fund and other funds. To do so, compare this 5% hypothetical example with the 5% hypothetical examples that appear in the shareholder reports of the other funds.
Please note that the expenses shown in the table are meant to highlight your ongoing costs only and do not reflect any transactional costs, such as sales charges (loads) or redemption/exchange fees. Therefore, the table is useful in comparing ongoing costs only, and will not help you determine the relative total costs of owning different funds. In addition, if these transactional costs were included, your costs would have been higher.
|
| | | | |
| Beginning
Account Value
10/1/15 | Ending
Account Value
3/31/16 | Expenses Paid
During Period(1)10/1/15 - 3/31/16 | Annualized Expense Ratio(1) |
| Actual | | | | |
| Investor Class | $1,000 | $1,036.80 | $2.39 | 0.47% |
| Institutional Class | $1,000 | $1,038.90 | $1.38 | 0.27% |
| A Class | $1,000 | $1,036.40 | $3.67 | 0.72% |
| C Class | $1,000 | $1,032.90 | $7.47 | 1.47% |
| R Class | $1,000 | $1,034.80 | $4.93 | 0.97% |
| Hypothetical | | | | |
| Investor Class | $1,000 | $1,022.65 | $2.38 | 0.47% |
| Institutional Class | $1,000 | $1,023.65 | $1.37 | 0.27% |
| A Class | $1,000 | $1,021.40 | $3.64 | 0.72% |
| C Class | $1,000 | $1,017.65 | $7.41 | 1.47% |
| R Class | $1,000 | $1,020.15 | $4.90 | 0.97% |
| |
| (1) | Expenses are equal to the class's annualized expense ratio listed in the table above, multiplied by the average account value over the period, multiplied by 183, the number of days in the most recent fiscal half-year, divided by 366, to reflect the one-half year period. |
MARCH 31, 2016
|
| | | | | | | |
| | | Principal Amount | Value |
| U.S. TREASURY SECURITIES — 86.0% | | | |
| U.S. Treasury Inflation Indexed Bonds, 2.00%, 1/15/26 | | $ | 104,684,859 |
| $ | 122,733,471 |
|
| U.S. Treasury Inflation Indexed Bonds, 2.375%, 1/15/27 | | 73,043,190 |
| 89,342,413 |
|
| U.S. Treasury Inflation Indexed Bonds, 1.75%, 1/15/28 | | 61,679,326 |
| 71,619,875 |
|
| U.S. Treasury Inflation Indexed Bonds, 2.50%, 1/15/29 | | 31,699,670 |
| 39,882,147 |
|
| U.S. Treasury Inflation Indexed Bonds, 3.375%, 4/15/32 | | 34,113,285 |
| 49,470,472 |
|
| U.S. Treasury Inflation Indexed Bonds, 0.75%, 2/15/42 | | 73,393,600 |
| 71,440,229 |
|
| U.S. Treasury Inflation Indexed Bonds, 0.625%, 2/15/43 | | 46,587,549 |
| 43,864,180 |
|
| U.S. Treasury Inflation Indexed Bonds, 1.375%, 2/15/44 | | 86,071,289 |
| 96,609,943 |
|
| U.S. Treasury Inflation Indexed Bonds, 0.75%, 2/15/45 | | 25,705,600 |
| 24,942,117 |
|
| U.S. Treasury Inflation Indexed Notes, 0.125%, 4/15/17 | | 64,057,629 |
| 64,813,701 |
|
| U.S. Treasury Inflation Indexed Notes, 2.625%, 7/15/17 | | 27,265,460 |
| 28,722,826 |
|
| U.S. Treasury Inflation Indexed Notes, 1.625%, 1/15/18 | | 46,111,632 |
| 48,237,102 |
|
| U.S. Treasury Inflation Indexed Notes, 0.125%, 4/15/18 | | 99,415,300 |
| 101,220,483 |
|
U.S. Treasury Inflation Indexed Notes, 2.125%, 1/15/19(1) | | 32,883,704 |
| 35,518,675 |
|
| U.S. Treasury Inflation Indexed Notes, 0.125%, 4/15/19 | | 105,405,090 |
| 107,728,007 |
|
| U.S. Treasury Inflation Indexed Notes, 1.875%, 7/15/19 | | 59,140,614 |
| 64,335,466 |
|
| U.S. Treasury Inflation Indexed Notes, 0.125%, 4/15/20 | | 26,000,176 |
| 26,568,254 |
|
| U.S. Treasury Inflation Indexed Notes, 1.25%, 7/15/20 | | 58,934,488 |
| 63,416,750 |
|
| U.S. Treasury Inflation Indexed Notes, 1.125%, 1/15/21 | | 55,607,092 |
| 59,491,248 |
|
| U.S. Treasury Inflation Indexed Notes, 0.625%, 7/15/21 | | 100,144,966 |
| 105,236,336 |
|
| U.S. Treasury Inflation Indexed Notes, 0.125%, 1/15/22 | | 186,583,188 |
| 189,599,305 |
|
| U.S. Treasury Inflation Indexed Notes, 0.125%, 7/15/22 | | 95,606,272 |
| 97,400,132 |
|
| U.S. Treasury Inflation Indexed Notes, 0.125%, 1/15/23 | | 196,863,520 |
| 198,764,237 |
|
| U.S. Treasury Inflation Indexed Notes, 0.375%, 7/15/23 | | 56,195,808 |
| 57,965,470 |
|
| U.S. Treasury Inflation Indexed Notes, 0.625%, 1/15/24 | | 94,937,095 |
| 98,979,327 |
|
| U.S. Treasury Inflation Indexed Notes, 0.125%, 7/15/24 | | 65,653,266 |
| 65,972,144 |
|
| U.S. Treasury Inflation Indexed Notes, 0.25%, 1/15/25 | | 30,007,800 |
| 30,295,755 |
|
U.S. Treasury Inflation Indexed Notes, 2.375%, 1/15/25(1) | | 87,963,304 |
| 104,877,328 |
|
| U.S. Treasury Inflation Indexed Notes, 0.375%, 7/15/25 | | 70,432,320 |
| 72,038,600 |
|
| U.S. Treasury Inflation Indexed Notes, 3.625%, 4/15/28 | | 45,022,093 |
| 62,090,328 |
|
| U.S. Treasury Inflation Indexed Notes, 3.875%, 4/15/29 | | 51,449,055 |
| 73,773,109 |
|
| U.S. Treasury Inflation Indexed Notes, 2.125%, 2/15/40 | | 36,029,793 |
| 46,131,034 |
|
| U.S. Treasury Inflation Indexed Notes, 2.125%, 2/15/41 | | 42,408,520 |
| 54,724,378 |
|
TOTAL U.S. TREASURY SECURITIES (Cost $2,313,784,849) | | | 2,467,804,842 |
|
COMMERCIAL MORTGAGE-BACKED SECURITIES(2) — 4.8% | | |
| Bank of America Merrill Lynch Large Loan, Inc., Series 2015-200P, Class A SEQ, 3.22%, 4/13/33 | | 6,975,000 |
| 7,219,419 |
|
BB-UBS Trust, Series 2012-SHOW, Class A SEQ, 3.43%, 11/5/36(3) | | 8,625,000 |
| 8,824,598 |
|
Commercial Mortgage Pass-Through Certificates, Series 2014-BBG, Class A, VRN, 1.24%, 4/15/16(3) | | 7,600,000 |
| 7,424,317 |
|
| Commercial Mortgage Pass-Through Certificates, Series 2014-CR15, Class AM SEQ, 4.43%, 2/10/47 | | 7,100,000 |
| 7,795,614 |
|
|
| | | | | | | |
| | | Principal Amount | Value |
| Commercial Mortgage Pass-Through Certificates, Series 2014-UBS5, Class AM, 4.19%, 9/10/47 | | $ | 8,000,000 |
| $ | 8,617,334 |
|
| Commercial Mortgage Pass-Through Certificates, Series 2015-CR22, Class AM, VRN, 3.60%, 4/1/16 | | 6,575,000 |
| 6,826,233 |
|
Commercial Mortgage Trust, Series 2015-3BP, Class A, 3.18%, 2/10/35(3) | | 7,425,000 |
| 7,668,153 |
|
| Commercial Mortgage Trust, Series 2015-LC21, Class AM, VRN, 4.04%, 4/1/16 | | 4,500,000 |
| 4,804,339 |
|
Core Industrial Trust, Series 2015-WEST, Class A SEQ, 3.29%, 2/10/37(3) | | 10,000,000 |
| 10,313,940 |
|
| GS Mortgage Securities Corp. II, Series 2015-GC28, Class A5, 3.40%, 2/10/48 | | 10,000,000 |
| 10,411,796 |
|
Irvine Core Office Trust, Series 2013-IRV, Class A1 SEQ, 2.07%, 5/15/48(3) | | 1,601,076 |
| 1,612,503 |
|
Irvine Core Office Trust, Series 2013-IRV, Class A2 SEQ, VRN, 3.17%, 4/10/16(3) | | 8,350,000 |
| 8,715,944 |
|
| JPMBB Commercial Mortgage Securities Trust, Series 2014-C21, Class AS SEQ, 4.00%, 8/15/47 | | 12,520,000 |
| 13,321,497 |
|
| JPMorgan Chase Commercial Mortgage Securities Trust, Series 2013-C16, Class A4, 4.17%, 12/15/46 | | 7,000,000 |
| 7,764,394 |
|
| JPMorgan Chase Commercial Mortgage Securities Trust, Series 2013-C16, Class AS, 4.52%, 12/15/46 | | 5,525,000 |
| 6,119,578 |
|
JPMorgan Chase Commercial Mortgage Securities Trust, Series 2014-CBM, Class B, VRN, 1.84%, 4/15/16(3) | | 9,725,000 |
| 9,470,142 |
|
Morgan Stanley Capital I Trust, Series 2014-CPT, Class A SEQ, 3.35%, 7/13/29(3) | | 10,275,000 |
| 10,806,552 |
|
TOTAL COMMERCIAL MORTGAGE-BACKED SECURITIES (Cost $134,530,651) | | 137,716,353 |
|
| CORPORATE BONDS — 3.9% | | | |
| Banks — 1.4% | | | |
| Barclays Bank plc, MTN, 6.00%, 1/14/21 | EUR | 3,650,000 |
| 4,711,587 |
|
| Branch Banking & Trust Co., 3.80%, 10/30/26 | | $ | 650,000 |
| 691,506 |
|
| Capital One Financial Corp., 2.45%, 4/24/19 | | 700,000 |
| 708,116 |
|
| Citigroup, Inc., 4.40%, 6/10/25 | | 570,000 |
| 582,578 |
|
| Commerzbank AG, MTN, 6.375%, 3/22/19 | EUR | 5,000,000 |
| 6,406,654 |
|
| Cooperatieve Rabobank UA, MTN, 4.125%, 9/14/22 | EUR | 5,000,000 |
| 6,483,221 |
|
| Danske Bank A/S, MTN, VRN, 2.75%, 5/19/21 | EUR | 5,000,000 |
| 5,899,938 |
|
| ING Bank NV, MTN, VRN, 3.625%, 2/25/21 | EUR | 5,000,000 |
| 6,059,435 |
|
| JPMorgan Chase & Co., 3.125%, 1/23/25 | | $ | 990,000 |
| 994,995 |
|
| JPMorgan Chase & Co., 4.95%, 6/1/45 | | 490,000 |
| 519,367 |
|
| Santander Issuances SAU, MTN, 2.50%, 3/18/25 | EUR | 1,300,000 |
| 1,426,553 |
|
| Standard Chartered plc, MTN, VRN, 4.00%, 10/21/20 | EUR | 3,700,000 |
| 4,107,586 |
|
| U.S. Bank N.A., 2.80%, 1/27/25 | | $ | 500,000 |
| 510,959 |
|
| Wells Fargo & Co., MTN, 4.60%, 4/1/21 | | 990,000 |
| 1,099,655 |
|
| Wells Fargo & Co., MTN, 3.55%, 9/29/25 | | 500,000 |
| 525,058 |
|
| Wells Fargo & Co., MTN, 4.65%, 11/4/44 | | 250,000 |
| 257,213 |
|
| | | | 40,984,421 |
|
| Biotechnology — 0.1% | | | |
| Gilead Sciences, Inc., 4.40%, 12/1/21 | | 990,000 |
| 1,107,277 |
|
| Capital Markets — 0.3% | | | |
| ABN AMRO Bank NV, MTN, 7.125%, 7/6/22 | EUR | 5,000,000 |
| 7,177,962 |
|
| Ameriprise Financial, Inc., 4.00%, 10/15/23 | | $ | 200,000 |
| 211,716 |
|
| | | | 7,389,678 |
|
|
| | | | | | | |
| | | Principal Amount | Value |
Communications Equipment† | | | |
| Cisco Systems, Inc., 3.00%, 6/15/22 | | $ | 500,000 |
| $ | 531,784 |
|
| Consumer Finance — 0.1% | | | |
| American Express Credit Corp., 2.125%, 7/27/18 | | 990,000 |
| 997,364 |
|
| Capital One Bank USA N.A., 2.30%, 6/5/19 | | 1,000,000 |
| 997,531 |
|
| Caterpillar Financial Services Corp., MTN, 1.25%, 11/6/17 | | 520,000 |
| 521,622 |
|
| Caterpillar Financial Services Corp., MTN, 2.625%, 3/1/23 | | 1,000,000 |
| 997,452 |
|
| Synchrony Financial, 3.00%, 8/15/19 | | 240,000 |
| 244,045 |
|
| | | | 3,758,014 |
|
Diversified Consumer Services† | | | |
| Board of Trustees of The Leland Stanford Junior University (The), 3.46%, 5/1/47 | | 490,000 |
| 494,053 |
|
| Catholic Health Initiatives, 2.95%, 11/1/22 | | 550,000 |
| 551,922 |
|
| | | | 1,045,975 |
|
| Diversified Financial Services — 0.9% | | | |
| BNP Paribas SA, MTN, VRN, 2.625%, 10/14/22 | EUR | 5,000,000 |
| 5,694,440 |
|
| Credit Agricole SA, 2.625%, 3/17/27 | EUR | 5,000,000 |
| 5,653,256 |
|
| Credit Suisse Group Funding Guernsey Ltd., 4.875%, 5/15/45 | | $ | 500,000 |
| 478,280 |
|
| Deutsche Bank AG, MTN, 2.75%, 2/17/25 | EUR | 4,860,000 |
| 5,053,214 |
|
| Goldman Sachs Group, Inc. (The), MTN, 4.80%, 7/8/44 | | $ | 490,000 |
| 514,483 |
|
| Nationwide Building Society, MTN, 6.75%, 7/22/20 | EUR | 5,000,000 |
| 6,759,465 |
|
| | | | 24,153,138 |
|
Diversified Telecommunication Services† | | | |
| Verizon Communications, Inc., 4.40%, 11/1/34 | | $ | 130,000 |
| 131,862 |
|
Food Products† | | | |
Kraft Heinz Foods Co., 5.20%, 7/15/45(3) | | 490,000 |
| 550,559 |
|
| Unilever Capital Corp., 2.20%, 3/6/19 | | 500,000 |
| 515,413 |
|
| | | | 1,065,972 |
|
Gas Utilities† | | | |
| Enterprise Products Operating LLC, 3.75%, 2/15/25 | | 1,000,000 |
| 1,000,469 |
|
Health Care Equipment and Supplies† | | | |
| Becton Dickinson and Co., 3.73%, 12/15/24 | | 250,000 |
| 266,745 |
|
Hotels, Restaurants and Leisure† | | | |
| McDonald's Corp., MTN, 3.25%, 6/10/24 | | 500,000 |
| 519,100 |
|
| McDonald's Corp., MTN, 4.60%, 5/26/45 | | 490,000 |
| 514,866 |
|
| | | | 1,033,966 |
|
| Insurance — 0.3% | | | |
| Allianz Finance II BV, MTN, VRN, 5.75%, 7/8/21 | EUR | 5,000,000 |
| 6,584,234 |
|
| Chubb INA Holdings, Inc., 3.15%, 3/15/25 | | $ | 1,000,000 |
| 1,030,249 |
|
| | | | 7,614,483 |
|
Machinery† | | | |
| Deere & Co., 2.60%, 6/8/22 | | 520,000 |
| 532,121 |
|
| Media — 0.1% | | | |
| Comcast Corp., 6.40%, 5/15/38 | | 1,500,000 |
| 2,002,296 |
|
| Time Warner, Inc., 3.60%, 7/15/25 | | 740,000 |
| 761,364 |
|
| Walt Disney Co. (The), MTN, 4.125%, 6/1/44 | | 779,000 |
| 837,873 |
|
| | | | 3,601,533 |
|
|
| | | | | | | |
| | | Principal Amount | Value |
Metals and Mining† | | | |
| BHP Billiton Finance USA Ltd., 3.25%, 11/21/21 | | $ | 140,000 |
| $ | 144,181 |
|
| Multi-Utilities — 0.3% | | | |
| Dominion Resources, Inc., 6.40%, 6/15/18 | | 3,250,000 |
| 3,537,254 |
|
| Duke Energy Corp., 3.55%, 9/15/21 | | 1,000,000 |
| 1,049,656 |
|
| Duke Energy Progress, LLC, 4.15%, 12/1/44 | | 500,000 |
| 526,570 |
|
| Georgia Power Co., 4.30%, 3/15/42 | | 1,000,000 |
| 1,021,183 |
|
| MidAmerican Energy Co., 4.40%, 10/15/44 | | 690,000 |
| 755,342 |
|
| Potomac Electric Power Co., 3.60%, 3/15/24 | | 500,000 |
| 533,037 |
|
| Sempra Energy, 6.50%, 6/1/16 | | 1,250,000 |
| 1,259,824 |
|
| | | | 8,682,866 |
|
| Oil, Gas and Consumable Fuels — 0.2% | | | |
| BP Capital Markets plc, 2.50%, 11/6/22 | | 520,000 |
| 509,554 |
|
| BP Capital Markets plc, 2.75%, 5/10/23 | | 280,000 |
| 274,992 |
|
| Chevron Corp., 2.43%, 6/24/20 | | 150,000 |
| 153,295 |
|
| CNOOC Nexen Finance 2014 ULC, 1.625%, 4/30/17 | | 500,000 |
| 499,373 |
|
| ConocoPhillips Co., 3.35%, 5/15/25 | | 990,000 |
| 950,168 |
|
| Occidental Petroleum Corp., 4.625%, 6/15/45 | | 980,000 |
| 1,025,653 |
|
| Statoil ASA, 2.65%, 1/15/24 | | 495,000 |
| 482,937 |
|
| Total Capital International SA, 2.10%, 6/19/19 | | 990,000 |
| 1,007,103 |
|
| | | | 4,903,075 |
|
Paper and Forest Products† | | | |
Georgia-Pacific LLC, 2.54%, 11/15/19(3) | | 250,000 |
| 251,322 |
|
Pharmaceuticals† | | | |
Roche Holdings, Inc., 3.35%, 9/30/24(3) | | 490,000 |
| 520,770 |
|
| Road and Rail — 0.1% | | | |
| Burlington Northern Santa Fe LLC, 3.00%, 4/1/25 | | 1,000,000 |
| 1,031,325 |
|
| Norfolk Southern Corp., 3.85%, 1/15/24 | | 325,000 |
| 346,129 |
|
| Union Pacific Corp., 3.25%, 1/15/25 | | 490,000 |
| 512,594 |
|
| | | | 1,890,048 |
|
| Software — 0.1% | | | |
| Adobe Systems, Inc., 3.25%, 2/1/25 | | 490,000 |
| 507,264 |
|
| Microsoft Corp., 2.125%, 11/15/22 | | 560,000 |
| 567,151 |
|
| Oracle Corp., 2.95%, 5/15/25 | | 370,000 |
| 379,630 |
|
| | | | 1,454,045 |
|
TOTAL CORPORATE BONDS (Cost $109,720,914) | | | 112,063,745 |
|
COLLATERALIZED MORTGAGE OBLIGATIONS(2) — 2.5% | | | |
| Private Sponsor Collateralized Mortgage Obligations — 2.3% | | |
| ABN Amro Mortgage Corp., Series 2003-4, Class A4, 5.50%, 3/25/33 | | 720,188 |
| 748,672 |
|
| ABN Amro Mortgage Corp., Series 2003-6, Class 1A4, 5.50%, 5/25/33 | | 1,348,276 |
| 1,404,122 |
|
| Banc of America Mortgage Securities, Inc., Series 2004-8, Class 5A1, 6.50%, 5/25/32 | | 1,118,687 |
| 1,151,237 |
|
| Cendant Mortgage Corp., Series 2003-6, Class A3, 5.25%, 7/25/33 | | 2,233,618 |
| 2,238,831 |
|
| Citigroup Mortgage Loan Trust, Inc., Series 2005-6, Class A2, VRN, 2.65%, 4/1/16 | | 1,344,333 |
| 1,343,096 |
|
|
| | | | | | | |
| | | Principal Amount | Value |
| Countrywide Home Loan Mortgage Pass-Through Trust, Series 2004-5, Class 2A4, 5.50%, 5/25/34 | | $ | 2,171,172 |
| $ | 2,187,489 |
|
Credit Suisse Mortgage Trust, Series 2015-WIN1, Class A10, VRN, 3.50%, 4/1/16(3) | | 6,285,000 |
| 6,500,092 |
|
JPMorgan Mortgage Trust, Series 2014-5, Class A1, VRN, 3.00%, 4/1/16(3) | | 6,390,679 |
| 6,597,501 |
|
| MASTR Asset Securitization Trust, Series 2003-10, Class 3A1, 5.50%, 11/25/33 | | 1,652,933 |
| 1,651,523 |
|
| PHHMC Mortgage Pass-Through Certificates, Series 2007-6, Class A1, VRN, 5.40%, 4/1/16 | | 725,548 |
| 719,949 |
|
| Sequoia Mortgage Trust, Series 2012-1, Class 1A1, VRN, 2.87%, 4/1/16 | | 1,159,835 |
| 1,157,704 |
|
Sequoia Mortgage Trust, Series 2013-12, Class A1 SEQ, 4.00%, 12/25/43(3) | | 4,296,926 |
| 4,454,874 |
|
Sequoia Mortgage Trust, Series 2014-3, Class A14, VRN, 3.00%, 4/1/16(3) | | 6,293,508 |
| 6,380,448 |
|
| Structured Adjustable Rate Mortgage Loan Trust, Series 2004-6, Class 3A2, VRN, 2.55%, 4/1/16 | | 1,813,869 |
| 1,811,627 |
|
| Thornburg Mortgage Securities Trust, Series 2004-3, Class A, VRN, 1.17%, 4/25/16 | | 2,261,118 |
| 2,087,609 |
|
| WaMu Mortgage Pass-Through Certificates, Series 2003-S11, Class 3A5, 5.95%, 11/25/33 | | 1,982,068 |
| 2,034,977 |
|
| Wells Fargo Mortgage-Backed Securities Trust, Series 2005-AR10, Class 1A1, VRN, 2.79%, 4/1/16 | | 5,183,531 |
| 5,261,664 |
|
| Wells Fargo Mortgage-Backed Securities Trust, Series 2005-AR10, Class 2A15, VRN, 2.79%, 4/1/16 | | 11,177,507 |
| 11,601,922 |
|
| Wells Fargo Mortgage-Backed Securities Trust, Series 2007-3, Class 3A1, 5.50%, 4/25/22 | | 403,386 |
| 409,017 |
|
WinWater Mortgage Loan Trust, Series 2014-1, Class A4 SEQ, VRN, 3.50%, 4/1/16(3) | | 5,769,494 |
| 5,854,272 |
|
| | | | 65,596,626 |
|
| U.S. Government Agency Collateralized Mortgage Obligations — 0.2% | |
| FHLMC, Series 2824, Class LB SEQ, 4.50%, 7/15/24 | | 4,699,285 |
| 5,048,998 |
|
TOTAL COLLATERALIZED MORTGAGE OBLIGATIONS (Cost $70,453,591) | | | 70,645,624 |
|
ASSET-BACKED SECURITIES(2) — 2.2% | | | |
Avis Budget Rental Car Funding AESOP LLC, Series 2012-3A, Class A SEQ, 2.10%, 3/20/19(3) | | 14,100,000 |
| 14,078,046 |
|
Avis Budget Rental Car Funding AESOP LLC, Series 2015-2A, Class A, 2.63%, 12/20/21(3) | | 2,000,000 |
| 1,990,237 |
|
BMW Floorplan Master Owner Trust, Series 2015-1A, Class A, VRN, 0.94%, 4/15/16(3) | | 7,475,000 |
| 7,482,027 |
|
| Chase Issuance Trust, Series 2007-B1, Class B1, VRN, 0.69%, 4/15/16 | | 3,975,000 |
| 3,960,422 |
|
Chesapeake Funding LLC, Series 2014-1A, Class A, VRN, 0.86%, 4/7/16(3) | | 6,671,546 |
| 6,653,693 |
|
Enterprise Fleet Financing LLC, Series 2014-1, Class A2 SEQ, 0.87%, 9/20/19(3) | | 1,868,135 |
| 1,862,706 |
|
Hertz Fleet Lease Funding LP, Series 2013-3, Class B, VRN, 1.49%, 4/11/16(3) | | 4,275,000 |
| 4,277,601 |
|
Hilton Grand Vacations Trust, Series 2013-A, Class A SEQ, 2.28%, 1/25/26(3) | | 1,626,698 |
| 1,619,239 |
|
Hilton Grand Vacations Trust, Series 2014-AA, Class A SEQ, 1.77%, 11/25/26(3) | | 8,522,976 |
| 8,387,961 |
|
MVW Owner Trust, Series 2013-1A, Class A SEQ, 2.15%, 4/22/30(3) | | 5,606,445 |
| 5,565,181 |
|
|
| | | | | | | |
| | | Principal Amount/Shares | Value |
MVW Owner Trust, Series 2014-1A, Class A, 2.25%, 9/22/31(3) | | $ | 4,526,367 |
| $ | 4,452,207 |
|
Sierra Timeshare Receivables Funding LLC, Series 2015-1A, Class A, 2.40%, 3/22/32(3) | | 3,751,333 |
| 3,712,028 |
|
TOTAL ASSET-BACKED SECURITIES (Cost $64,601,435) | | | 64,041,348 |
|
| SOVEREIGN GOVERNMENTS AND AGENCIES — 0.6% | | | |
| Portugal — 0.6% | | | |
Portugal Obrigacoes do Tesouro OT, 2.875%, 10/15/25(3)
(Cost $16,128,525) | EUR | 14,750,000 |
| 16,948,367 |
|
| MUNICIPAL SECURITIES — 0.1% | | | |
| Bay Area Toll Authority Toll Bridge Rev., Series 2010 S-1, (Building Bonds), 6.92%, 4/1/40 | | $ | 535,000 |
| 738,557 |
|
| Los Angeles Community College District GO, (Building Bonds), 6.75%, 8/1/49 | | 250,000 |
| 374,782 |
|
| Los Angeles Department of Water & Power Rev., (Building Bonds), 5.72%, 7/1/39 | | 295,000 |
| 375,957 |
|
| Metropolitan Transportation Authority Rev., Series 2010 E, (Building Bonds), 6.81%, 11/15/40 | | 250,000 |
| 348,587 |
|
| Port Authority of New York & New Jersey Rev., (Consolidated Bonds), 4.93%, 10/1/51 | | 250,000 |
| 287,308 |
|
| Rutgers State University Rev., Series 2010 H, (Building Bonds), 5.67%, 5/1/40 | | 270,000 |
| 333,315 |
|
| San Antonio Electric & Gas Rev., (Building Bonds), 5.99%, 2/1/39 | | 250,000 |
| 334,938 |
|
| San Francisco City & County Public Utilities Water Commission Rev., Series 2010 FG, (Building Bonds), 6.95%, 11/1/50 | | 125,000 |
| 181,711 |
|
| Santa Clara Valley Transportation Authority Sales Tax Rev., Series 2010 A, (Building Bonds), 5.88%, 4/1/32 | | 250,000 |
| 314,163 |
|
TOTAL MUNICIPAL SECURITIES (Cost $3,035,124) | | | 3,289,318 |
|
| TEMPORARY CASH INVESTMENTS — 0.7% | | | |
BNP Paribas SA, 0.25%, 4/1/16(4) | | 1,461,000 |
| 1,460,986 |
|
Credit Agricole Corporate and Investment Bank, 0.27%, 4/1/16 (LOC: Credit Agricole SA)(4) | | 11,900,000 |
| 11,899,867 |
|
| Repurchase Agreement, Fixed Income Clearing Corp., (collateralized by various U.S. Treasury obligations, 3.75%, 11/15/43, valued at $4,786,031), at 0.10%, dated 3/31/16, due 4/1/16 (Delivery value $4,691,013) | | 4,691,000 |
|
| SSgA U.S. Government Money Market Fund, Class N | | 3,017,997 |
| 3,017,997 |
|
TOTAL TEMPORARY CASH INVESTMENTS (Cost $21,069,997) | | | 21,069,850 |
|
TOTAL INVESTMENT SECURITIES — 100.8% (Cost $2,733,325,086) | | | 2,893,579,447 |
|
| OTHER ASSETS AND LIABILITIES — (0.8)% | | | (22,078,612) |
|
| TOTAL NET ASSETS — 100.0% | | | $ | 2,871,500,835 |
|
|
| | | | | | | | | | |
| FORWARD FOREIGN CURRENCY EXCHANGE CONTRACTS |
| Currency Purchased | Currency Sold | Counterparty | Settlement Date | Unrealized Appreciation
(Depreciation) |
| EUR | 131,250 |
| USD | 147,530 |
| Deutsche Bank | 6/15/16 | $ | 2,147 |
|
| EUR | 79,016,862 |
| USD | 89,655,297 |
| HSBC Holdings plc | 6/15/16 | 455,307 |
|
| USD | 148,868 |
| EUR | 131,250 |
| Deutsche Bank | 6/15/16 | (809 | ) |
| USD | 85,641,757 |
| EUR | 77,516,129 |
| HSBC Holdings plc | 6/15/16 | (2,757,415 | ) |
| USD | 1,669,747 |
| EUR | 1,500,733 |
| HSBC Holdings plc | 6/15/16 | (41,685 | ) |
| USD | 88,878,421 |
| EUR | 78,347,706 |
| JPMorgan Chase Bank N.A. | 6/15/16 | (469,080 | ) |
| | | | | | | $ | (2,811,535 | ) |
|
| | | | | | | | |
| FUTURES CONTRACTS | | | |
| Contracts Purchased | Expiration Date | Underlying Face Amount at Value | Unrealized Appreciation (Depreciation) |
| 848 | U.S. Treasury 2-Year Notes | June 2016 | $ | 185,500,000 |
| $ | 45,748 |
|
| 628 | U.S. Treasury 5-Year Notes | June 2016 | 76,091,032 |
| 28,525 |
|
| | | | $ | 261,591,032 |
| $ | 74,273 |
|
| | | | | |
| Contracts Sold | Expiration Date | Underlying Face Amount at Value | Unrealized Appreciation (Depreciation) |
| 60 | U.S. Treasury 10-Year Notes | June 2016 | $ | 7,823,438 |
| $ | 40,177 |
|
| 224 | U.S. Treasury 10-Year Ultra Notes | June 2016 | 31,528,000 |
| 75,152 |
|
| 400 | U.S. Treasury Long Bonds | June 2016 | 65,775,000 |
| 754,663 |
|
| 97 | U.S. Treasury Ultra Long Bonds | June 2016 | 16,735,531 |
| 171,782 |
|
| | | | $ | 121,861,969 |
| $ | 1,041,774 |
|
SWAP AGREEMENTS
CENTRALLY CLEARED CREDIT DEFAULT
|
| | | | | | | | | | | | | |
| Reference Entity | Notional
Amount | Buy/Sell*
Protection | Interest
Rate | Termination
Date | Implied Credit Spread** | Unrealized Appreciation
(Depreciation) | Value |
| CDX North America High Yield 25 Index | $ | 70,050,000 |
| Sell | 5.00% | 12/20/20 | 4.29% | $ | 2,539,816 |
| $ | 2,110,878 |
|
TOTAL RETURN
|
| | | | | | | | | | |
| Counterparty | Notional Amount | Floating Rate Referenced Index | Pay/Receive Total Return of Referenced Index | Fixed Rate | Termination Date | Value |
| Bank of America N.A. | $ | 4,000,000 |
| U.S. CPI Urban Consumers NSA Index | Receive | 2.42% | 4/1/18 | $ | (315,774 | ) |
| Bank of America N.A. | 8,700,000 |
| U.S. CPI Urban Consumers NSA Index | Receive | 2.51% | 3/30/19 | (847,922 | ) |
| Bank of America N.A. | 5,000,000 |
| U.S. CPI Urban Consumers NSA Index | Receive | 2.66% | 12/4/19 | (613,571 | ) |
|
| | | | | | | | | | |
| Counterparty | Notional Amount | Floating Rate Referenced Index | Pay/Receive Total Return of Referenced Index | Fixed Rate | Termination Date | Value |
| Bank of America N.A. | $ | 50,000,000 |
| U.S. CPI Urban Consumers NSA Index | Receive | 2.62% | 3/18/20 | $ | (6,043,969 | ) |
| Bank of America N.A. | 12,800,000 |
| U.S. CPI Urban Consumers NSA Index | Receive | 1.41% | 8/27/20 | 55,457 |
|
| Bank of America N.A. | 4,500,000 |
| U.S. CPI Urban Consumers NSA Index | Receive | 2.67% | 4/1/22 | (666,718 | ) |
| Bank of America N.A. | 11,000,000 |
| U.S. CPI Urban Consumers NSA Index | Receive | 2.53% | 8/19/24 | (1,163,829 | ) |
| Bank of America N.A. | 29,900,000 |
| U.S. CPI Urban Consumers NSA Index | Receive | 2.08% | 3/3/25 | (1,181,041 | ) |
| Bank of America N.A. | 24,500,000 |
| U.S. CPI Urban Consumers NSA Index | Receive | 2.14% | 7/2/25 | (926,134 | ) |
| Bank of America N.A. | 15,000,000 |
| U.S. CPI Urban Consumers NSA Index | Receive | 1.79% | 8/27/25 | (71,200 | ) |
| Barclays Bank plc | 24,000,000 |
| U.S. CPI Urban Consumers NSA Index | Receive | 2.74% | 4/25/17 | (2,914,566 | ) |
| Barclays Bank plc | 39,000,000 |
| U.S. CPI Urban Consumers NSA Index | Receive | 1.71% | 2/5/20 | (634,219 | ) |
| Barclays Bank plc | 16,300,000 |
| U.S. CPI Urban Consumers NSA Index | Receive | 2.59% | 7/23/24 | (1,832,021 | ) |
| Barclays Bank plc | 10,000,000 |
| U.S. CPI Urban Consumers NSA Index | Receive | 2.36% | 9/29/24 | (862,547 | ) |
| Barclays Bank plc | 15,000,000 |
| U.S. CPI Urban Consumers NSA Index | Receive | 2.31% | 9/30/24 | (1,207,820 | ) |
| Barclays Bank plc | 19,200,000 |
| U.S. CPI Urban Consumers NSA Index | Receive | 2.90% | 12/21/27 | (5,312,708 | ) |
| Barclays Bank plc | 15,000,000 |
| U.S. CPI Urban Consumers NSA Index | Receive | 2.78% | 7/2/44 | (4,180,607 | ) |
| | | | | | | $ | (28,719,189 | ) |
*The maximum potential amount the fund could be required to deliver as a seller of credit protection if a credit event occurs as defined under the terms of the agreement is the notional amount. The maximum potential amount may be partially offset by any recovery values of the reference entities and upfront payments received upon entering into the agreement.
**Implied credit spreads for centrally cleared credit default swap agreements are linked to the weighted average spread across the underlying reference entities included in a particular index. Implied credit spreads serve as an indication of the seller's performance risk related to the likelihood of a credit event occurring as defined in the agreement. Implied credit spreads are used to determine the value of swap agreements and reflect the cost of buying/selling protection, which may include upfront payments made/received upon entering the agreement. Therefore, higher spreads would indicate a greater likelihood that a seller will be obligated to perform under the contract terms. Increasing values, in absolute terms and relative to notional amounts, are also indicative of greater performance risk.
|
| | |
| NOTES TO SCHEDULE OF INVESTMENTS |
| CDX | - | Credit Derivatives Indexes |
| CPI | - | Consumer Price Index |
| EUR | - | Euro |
| FHLMC | - | Federal Home Loan Mortgage Corporation |
| GO | - | General Obligation |
| LOC | - | Letter of Credit |
| MTN | - | Medium Term Note |
| NSA | - | Not Seasonally Adjusted |
| SEQ | - | Sequential Payer |
| USD | - | United States Dollar |
| VRN | - | Variable Rate Note. Interest reset date is indicated. Rate shown is effective at the period end. |
† Category is less than 0.05% of total net assets.
| |
| (1) | Security, or a portion thereof, has been pledged at the custodian bank or with a broker for margin requirements on futures contracts and/or swap agreements. At the period end, the aggregate value of securities pledged was $37,498,333. |
| |
| (2) | Final maturity date indicated, unless otherwise noted. |
| |
| (3) | Security was purchased pursuant to Rule 144A under the Securities Act of 1933 and may be sold in transactions exempt from registration, normally to qualified institutional investors. The aggregate value of these securities at the period end was $172,975,280, which represented 6.0% of total net assets. |
| |
| (4) | The rate indicated is the yield to maturity at purchase. |
See Notes to Financial Statements.
|
|
| Statement of Assets and Liabilities |
|
| | | |
| MARCH 31, 2016 | |
| Assets | |
| Investment securities, at value (cost of $2,733,325,086) | $ | 2,893,579,447 |
|
| Cash | 46,559 |
|
| Foreign currency holdings, at value (cost of $395,203) | 399,687 |
|
| Receivable for investments sold | 598,717 |
|
| Receivable for capital shares sold | 4,059,619 |
|
| Receivable for variation margin on swap agreements | 113,354 |
|
| Unrealized appreciation on forward foreign currency exchange contracts | 457,454 |
|
| Swap agreements, at value | 55,457 |
|
| Interest receivable | 8,620,279 |
|
| | 2,907,930,573 |
|
| | |
| Liabilities | |
| Payable for capital shares redeemed | 2,971,042 |
|
| Payable for variation margin on futures contracts | 431,938 |
|
| Unrealized depreciation on forward foreign currency exchange contracts | 3,268,989 |
|
| Swap agreements, at value | 28,774,646 |
|
| Accrued management fees | 921,228 |
|
| Distribution and service fees payable | 61,895 |
|
| | 36,429,738 |
|
| | |
| Net Assets | $ | 2,871,500,835 |
|
| | |
| Net Assets Consist of: | |
| Capital paid in | $ | 2,734,677,563 |
|
| Undistributed net investment income | 24,348,914 |
|
| Accumulated net realized loss | (19,957,034 | ) |
| Net unrealized appreciation | 132,431,392 |
|
| | $ | 2,871,500,835 |
|
|
| | | | | | |
| | Net Assets | Shares Outstanding | Net Asset Value Per Share |
| Investor Class |
| $1,496,428,552 |
| 127,219,153 |
| $11.76 |
| Institutional Class |
| $1,147,154,863 |
| 97,575,793 |
| $11.76 |
| A Class |
| $193,664,369 |
| 16,509,670 |
| $11.73* |
| C Class |
| $16,558,005 |
| 1,410,933 |
| $11.74 |
| R Class |
| $17,695,046 |
| 1,501,991 |
| $11.78 |
*Maximum offering price $12.28 (net asset value divided by 0.955).
See Notes to Financial Statements.
|
| | | |
| YEAR ENDED MARCH 31, 2016 | |
| Investment Income (Loss) | |
| Income: | |
| Interest | $ | 63,658,188 |
|
| | |
| Expenses: | |
| Management fees | 11,504,061 |
|
| Distribution and service fees: | |
| A Class | 533,887 |
|
| C Class | 183,752 |
|
| R Class | 87,427 |
|
| Trustees' fees and expenses | 155,074 |
|
| Other expenses | 35,521 |
|
| | 12,499,722 |
|
| | |
| Net investment income (loss) | 51,158,466 |
|
| | |
| Realized and Unrealized Gain (Loss) | |
| Net realized gain (loss) on: | |
| Investment transactions | 10,939,729 |
|
| Futures contract transactions | (5,283,937 | ) |
| Swap agreement transactions | (2,370,846 | ) |
| Foreign currency transactions | (761,440 | ) |
| | 2,523,506 |
|
| | |
| Change in net unrealized appreciation (depreciation) on: | |
| Investments | (31,787,514 | ) |
| Futures contracts | 3,556,633 |
|
| Swap agreements | 539,968 |
|
| Translation of assets and liabilities in foreign currencies | (2,759,643 | ) |
| | (30,450,556 | ) |
| | |
| Net realized and unrealized gain (loss) | (27,927,050 | ) |
| | |
| Net Increase (Decrease) in Net Assets Resulting from Operations | $ | 23,231,416 |
|
See Notes to Financial Statements.
|
|
| Statement of Changes in Net Assets |
|
| | | | | | |
| YEARS ENDED MARCH 31, 2016 AND MARCH 31, 2015 |
| Increase (Decrease) in Net Assets | March 31, 2016 | March 31, 2015 |
| Operations | | |
| Net investment income (loss) | $ | 51,158,466 |
| $ | 20,164,580 |
|
| Net realized gain (loss) | 2,523,506 |
| (16,363,099 | ) |
| Change in net unrealized appreciation (depreciation) | (30,450,556 | ) | 64,491,094 |
|
| Net increase (decrease) in net assets resulting from operations | 23,231,416 |
| 68,292,575 |
|
| | | |
| Distributions to Shareholders | | |
| From net investment income: | | |
| Investor Class | (15,071,866 | ) | (28,045,630 | ) |
| Institutional Class | (12,922,998 | ) | (17,044,399 | ) |
| A Class | (1,473,944 | ) | (3,499,971 | ) |
| C Class | (20,799 | ) | (39,257 | ) |
| R Class | (82,927 | ) | (132,260 | ) |
| From net realized gains: | | |
| Investor Class | — |
| (6,507,140 | ) |
| Institutional Class | — |
| (3,446,579 | ) |
| A Class | — |
| (956,509 | ) |
| C Class | — |
| (75,131 | ) |
| R Class | — |
| (61,803 | ) |
| Decrease in net assets from distributions | (29,572,534 | ) | (59,808,679 | ) |
| | | |
| Capital Share Transactions | | |
| Net increase (decrease) in net assets from capital share transactions (Note 5) | (282,996,505 | ) | (26,938,136 | ) |
| | | |
| Net increase (decrease) in net assets | (289,337,623 | ) | (18,454,240 | ) |
| | | |
| Net Assets | | |
| Beginning of period | 3,160,838,458 |
| 3,179,292,698 |
|
| End of period | $ | 2,871,500,835 |
| $ | 3,160,838,458 |
|
| | | |
| Undistributed net investment income | $ | 24,348,914 |
| $ | 3,312,099 |
|
See Notes to Financial Statements.
|
|
| Notes to Financial Statements |
MARCH 31, 2016
1. Organization
American Century Government Income Trust (the trust) is registered under the Investment Company Act of 1940, as amended (the 1940 Act), as an open-end management investment company and is organized as a Massachusetts business trust. Inflation-Adjusted Bond Fund (the fund) is one fund in a series issued by the trust. The fund’s investment objectives are to seek to provide total return and inflation protection consistent with investment in inflation-indexed securities.
The fund offers the Investor Class, the Institutional Class, the A Class, the C Class and the R Class. The A Class may incur an initial sales charge. The A Class and C Class may be subject to a contingent deferred sales charge. The share classes differ principally in their respective sales charges and distribution and shareholder servicing expenses and arrangements. The Institutional Class is made available to institutional shareholders or through financial intermediaries whose clients do not require the same level of shareholder and administrative services as shareholders of other classes. As a result, the Institutional Class is charged a lower unified management fee.
2. Significant Accounting Policies
The following is a summary of significant accounting policies consistently followed by the fund in preparation of its financial statements. The fund is an investment company and follows accounting and reporting guidance in accordance with accounting principles generally accepted in the United States of America. This may require management to make certain estimates and assumptions at the date of the financial statements. Actual results could differ from these estimates. Management evaluated the impact of events or transactions occurring through the date the financial statements were issued that would merit recognition or disclosure.
Investment Valuations — The fund determines the fair value of its investments and computes its net asset value per share at the close of regular trading (usually 4 p.m. Eastern time) on the New York Stock Exchange (NYSE) on each day the NYSE is open. The Board of Trustees has adopted valuation policies and procedures to guide the investment advisor in the fund’s investment valuation process and to provide methodologies for the oversight of the fund’s pricing function.
Fixed income securities are valued at the evaluated mean as provided by independent pricing services or at the mean of the most recent bid and asked prices as provided by investment dealers. Corporate bonds, U.S. Treasury and Government Agency securities, convertible bonds, municipal securities, and sovereign governments and agencies are valued using market models that consider trade data, quotations from dealers and active market makers, relevant yield curve and spread data, creditworthiness, trade data or market information on comparable securities, and other relevant security specific information. Mortgage-related and asset-backed securities are valued based on models that consider trade data, prepayment and default projections, benchmark yield and spread data and estimated cash flows of each tranche of the issuer. Fixed income securities initially expressed in local currencies are translated into U.S. dollars at the mean of the appropriate currency exchange rate at the close of the NYSE as provided by an independent pricing service.
Open-end management investment companies are valued at the reported net asset value per share. Repurchase agreements are valued at cost, which approximates fair value. Exchange-traded futures contracts are valued at the settlement price as provided by the appropriate clearing corporation. Swap agreements are valued at an evaluated price as provided by independent pricing services or independent brokers. Forward foreign currency exchange contracts are valued at the mean of the appropriate forward exchange rate at the close of the NYSE as provided by an independent pricing service.
If the fund determines that the market price for an investment is not readily available or the valuation methods mentioned above do not reflect an investment’s fair value, such investment is valued as determined in good faith by the Board of Trustees or its delegate, in accordance with policies and procedures adopted by the Board of Trustees. In its determination of fair value, the fund may review several factors including, but not limited to, market information regarding the specific investment or comparable investments and correlation with other investment types, futures indices or general market indicators. Circumstances that may cause the fund to use these procedures to value an investment include, but are not limited to: an investment has been declared in default or is distressed; trading in a security has been suspended during the trading day or a
security is not actively trading on its principal exchange; prices received from a regular pricing source are deemed unreliable; or there is a foreign market holiday and no trading occurred.
The fund monitors for significant events occurring after the close of an investment’s primary exchange but before the fund’s net asset value per share is determined. Significant events may include, but are not limited to: corporate announcements and transactions; governmental action and political unrest that could impact a specific investment or an investment sector; or armed conflicts, natural disasters and similar events that could affect investments in a specific country or region.
Security Transactions — Security transactions are accounted for as of the trade date. Net realized gains and losses are determined on the identified cost basis, which is also used for federal income tax purposes.
Investment Income — Interest income is recorded on the accrual basis and includes paydown gain (loss) and accretion of discounts and amortization of premiums. Inflation adjustments related to inflation-linked debt securities are reflected as interest income.
Foreign Currency Translations — All assets and liabilities initially expressed in foreign currencies are translated into U.S. dollars at prevailing exchange rates at period end. The fund may enter into spot foreign currency exchange contracts to facilitate transactions denominated in a foreign currency. Purchases and sales of investment securities, dividend and interest income, spot foreign currency exchange contracts, and expenses are translated at the rates of exchange prevailing on the respective dates of such transactions. Net realized and unrealized foreign currency exchange gains or losses related to investment securities are a component of net realized gain (loss) on investment transactions and change in net unrealized appreciation (depreciation) on investments, respectively.
Repurchase Agreements — The fund may enter into repurchase agreements with institutions that American Century Investment Management, Inc. (ACIM) (the investment advisor) has determined are creditworthy pursuant to criteria adopted by the Board of Trustees. The fund requires that the collateral, represented by securities, received in a repurchase transaction be transferred to the custodian in a manner sufficient to enable the fund to obtain those securities in the event of a default under the repurchase agreement. ACIM monitors, on a daily basis, the securities transferred to ensure the value, including accrued interest, of the securities under each repurchase agreement is equal to or greater than amounts owed to the fund under each repurchase agreement.
Joint Trading Account — Pursuant to an Exemptive Order issued by the Securities and Exchange Commission, the fund, along with certain other funds in the American Century Investments family of funds, may transfer uninvested cash balances into a joint trading account. These balances are invested in one or more repurchase agreements that are collateralized by U.S. Treasury or Agency obligations.
Segregated Assets — In accordance with the 1940 Act, the fund segregates assets on its books and records to cover certain types of investments, including, but not limited to, futures contracts, forward commitments, when-issued securities, swap agreements and certain forward foreign currency exchange contracts. ACIM monitors, on a daily basis, the securities segregated to ensure the fund designates a sufficient amount of liquid assets, marked-to-market daily. The fund may also receive assets or be required to pledge assets at the custodian bank or with a broker for margin requirements on futures contracts, forward commitments and swap agreements.
Income Tax Status — It is the fund’s policy to distribute substantially all net investment income and net realized gains to shareholders and to otherwise qualify as a regulated investment company under provisions of the Internal Revenue Code. Accordingly, no provision has been made for income taxes. The fund files U.S. federal, state, local and non-U.S. tax returns as applicable. The fund's tax returns are subject to examination by the relevant taxing authority until expiration of the applicable statute of limitations, which is generally three years from the date of filing but can be longer in certain jurisdictions. At this time, management believes there are no uncertain tax positions which, based on their technical merit, would not be sustained upon examination and for which it is reasonably possible that the total amounts of unrecognized tax benefits will significantly change in the next twelve months.
Multiple Class — All shares of the fund represent an equal pro rata interest in the net assets of the class to which such shares belong, and have identical voting, dividend, liquidation and other rights and the same terms and conditions, except for class specific expenses and exclusive rights to vote on matters affecting only individual classes. Income, non-class specific expenses, and realized and unrealized capital gains and losses of the fund are allocated to each class of shares based on their relative net assets.
Distributions to Shareholders — Distributions from net investment income, if any, are generally declared and paid quarterly, but may be paid less frequently. Distributions from net realized gains, if any, are generally declared and paid annually.
Indemnifications — Under the trust’s organizational documents, its officers and trustees are indemnified against certain liabilities arising out of the performance of their duties to the fund. In addition, in the normal course of business, the fund enters into contracts that provide general indemnifications. The maximum exposure under these arrangements is unknown as this would involve future claims that may be made against a fund. The risk of material loss from such claims is considered by management to be remote.
3. Fees and Transactions with Related Parties
Certain officers and trustees of the trust are also officers and/or directors of American Century Companies, Inc. (ACC). The trust's investment advisor, ACIM, the trust's distributor, American Century Investment Services, Inc. (ACIS), and the trust's transfer agent, American Century Services, LLC, are wholly owned, directly or indirectly, by ACC. Various funds issued by American Century Asset Allocation Portfolios, Inc. own, in aggregate, 29% of the shares of the fund. Related parties do not invest in the fund for the purpose of exercising management or control.
Management Fees — The trust has entered into a management agreement with ACIM, under which ACIM provides the fund with investment advisory and management services in exchange for a single, unified management fee (the fee) per class. The agreement provides that all expenses of managing and operating the fund, except distribution and service fees, brokerage expenses, taxes, interest, fees and expenses of the independent trustees (including legal counsel fees), and extraordinary expenses, will be paid by ACIM. The fee is computed and accrued daily based on each class’s daily net assets and paid monthly in arrears. The fee consists of (1) an Investment Category Fee based on the daily net assets of the fund and certain other accounts managed by the investment advisor that are in the same broad investment category as the fund and (2) a Complex Fee based on the assets of all the funds in the American Century Investments family of funds. The rates for the Investment Category Fee range from 0.1625% to 0.2800%. The rates for the Complex Fee range from 0.2500% to 0.3100% for the Investor Class, A Class, C Class and R Class. The rates for the Complex Fee range from 0.0500% to 0.1100% for the Institutional Class. The effective annual management fee for each class for the year ended March 31, 2016 was 0.46% for the Investor Class, A Class, C Class and R Class and 0.26% for the Institutional Class.
Distribution and Service Fees — The Board of Trustees has adopted a separate Master Distribution and Individual Shareholder Services Plan for each of the A Class, C Class and R Class (collectively the plans), pursuant to Rule 12b-1 of the 1940 Act. The plans provide that the A Class will pay ACIS an annual distribution and service fee of 0.25%. The plans provide that the C Class will pay ACIS an annual distribution and service fee of 1.00%, of which 0.25% is paid for individual shareholder services and 0.75% is paid for distribution services. The plans provide that the R Class will pay ACIS an annual distribution and service fee of 0.50%. The fees are computed and accrued daily based on each class’s daily net assets and paid monthly in arrears. The fees are used to pay financial intermediaries for distribution and individual shareholder services. Fees incurred under the plans during the year ended March 31, 2016 are detailed in the Statement of Operations.
Trustees’ Fees and Expenses — The Board of Trustees is responsible for overseeing the investment advisor’s management and operations of the fund. The trustees receive detailed information about the fund and its investment advisor regularly throughout the year, and meet at least quarterly with management of the investment advisor to review reports about fund operations. The fund’s officers do not receive compensation from the fund.
4. Investment Transactions
Purchases of investment securities, excluding short-term investments, for the year ended March 31, 2016 totaled $404,561,382, of which $192,591,908 represented U.S. Treasury and Government Agency obligations.
Sales of investment securities, excluding short-term investments, for the year ended March 31, 2016 totaled $650,801,475, of which $420,133,962 represented U.S. Treasury and Government Agency obligations.
5. Capital Share Transactions
Transactions in shares of the fund were as follows (unlimited number of shares authorized):
|
| | | | | | | | | | |
| | Year ended
March 31, 2016 | Year ended
March 31, 2015 |
| | Shares | Amount | Shares | Amount |
| Investor Class | | | | |
| Sold | 21,945,595 |
| $ | 253,001,152 |
| 37,748,696 |
| $ | 448,190,712 |
|
| Issued in reinvestment of distributions | 1,253,414 |
| 14,219,153 |
| 2,752,372 |
| 32,404,139 |
|
| Redeemed | (50,118,363 | ) | (578,322,342 | ) | (47,848,015 | ) | (566,561,411 | ) |
| | (26,919,354 | ) | (311,102,037 | ) | (7,346,947 | ) | (85,966,560 | ) |
| Institutional Class | | | | |
| Sold | 27,617,494 |
| 317,986,634 |
| 25,124,568 |
| 296,737,377 |
|
| Issued in reinvestment of distributions | 1,126,407 |
| 12,766,690 |
| 1,712,091 |
| 20,128,253 |
|
| Redeemed | (21,761,803 | ) | (249,774,087 | ) | (13,026,514 | ) | (154,485,404 | ) |
| | 6,982,098 |
| 80,979,237 |
| 13,810,145 |
| 162,380,226 |
|
| A Class | | | | |
| Sold | 6,058,850 |
| 69,555,581 |
| 6,006,907 |
| 71,067,066 |
|
| Issued in reinvestment of distributions | 120,982 |
| 1,369,157 |
| 359,312 |
| 4,223,820 |
|
| Redeemed | (10,401,642 | ) | (119,247,260 | ) | (14,783,020 | ) | (174,964,662 | ) |
| | (4,221,810 | ) | (48,322,522 | ) | (8,416,801 | ) | (99,673,776 | ) |
| C Class | | | | |
| Sold | 345,759 |
| 3,982,128 |
| 317,502 |
| 3,758,447 |
|
| Issued in reinvestment of distributions | 1,332 |
| 15,021 |
| 7,881 |
| 92,744 |
|
| Redeemed | (698,461 | ) | (8,032,501 | ) | (617,846 | ) | (7,318,975 | ) |
| | (351,370 | ) | (4,035,352 | ) | (292,463 | ) | (3,467,784 | ) |
| R Class | | | | |
| Sold | 730,544 |
| 8,407,673 |
| 368,762 |
| 4,359,828 |
|
| Issued in reinvestment of distributions | 6,548 |
| 74,287 |
| 15,497 |
| 183,072 |
|
| Redeemed | (782,117 | ) | (8,997,791 | ) | (400,477 | ) | (4,753,142 | ) |
| | (45,025 | ) | (515,831 | ) | (16,218 | ) | (210,242 | ) |
| Net increase (decrease) | (24,555,461 | ) | $ | (282,996,505 | ) | (2,262,284 | ) | $ | (26,938,136 | ) |
6. Fair Value Measurements
The fund’s investments valuation process is based on several considerations and may use multiple inputs to determine the fair value of the investments held by the fund. In conformity with accounting principles generally accepted in the United States of America, the inputs used to determine a valuation are classified into three broad levels.
| |
| • | Level 1 valuation inputs consist of unadjusted quoted prices in an active market for identical investments. |
| |
| • | Level 2 valuation inputs consist of direct or indirect observable market data (including quoted prices for comparable investments, evaluations of subsequent market events, interest rates, prepayment speeds, credit risk, etc.). These inputs also consist of quoted prices for identical investments initially expressed in local currencies that are adjusted through translation into U.S. dollars. |
| |
| • | Level 3 valuation inputs consist of unobservable data (including a fund’s own assumptions). |
The level classification is based on the lowest level input that is significant to the fair valuation measurement. The valuation inputs are not necessarily an indication of the risks associated with investing in these securities or other financial instruments. There were no significant transfers between levels during the period.
The following is a summary of the level classifications as of period end. The Schedule of Investments provides additional information on the fund’s portfolio holdings.
|
| | | | | | | | |
| | Level 1 | Level 2 | Level 3 |
| Assets | | | |
| Investment Securities | | | |
| U.S. Treasury Securities | — |
| $ | 2,467,804,842 |
| — |
|
| Commercial Mortgage-Backed Securities | — |
| 137,716,353 |
| — |
|
| Corporate Bonds | — |
| 112,063,745 |
| — |
|
| Collateralized Mortgage Obligations | — |
| 70,645,624 |
| — |
|
| Asset-Backed Securities | — |
| 64,041,348 |
| — |
|
| Sovereign Governments and Agencies | — |
| 16,948,367 |
| — |
|
| Municipal Securities | — |
| 3,289,318 |
| — |
|
| Temporary Cash Investments | $ | 3,017,997 |
| 18,051,853 |
| — |
|
| | $ | 3,017,997 |
| $ | 2,890,561,450 |
| — |
|
| Other Financial Instruments | | | |
| Futures Contracts | $ | 1,116,047 |
| — |
| — |
|
| Swap Agreements | — |
| $ | 2,166,335 |
| — |
|
| Forward Foreign Currency Exchange Contracts | — |
| 457,454 |
| — |
|
| | $ | 1,116,047 |
| $ | 2,623,789 |
| — |
|
| | | | |
| Liabilities | | | |
| Other Financial Instruments | | | |
| Swap Agreements | — |
| $ | 28,774,646 |
| — |
|
| Forward Foreign Currency Exchange Contracts | — |
| 3,268,989 |
| — |
|
| | — |
| $ | 32,043,635 |
| — |
|
7. Derivative Instruments
Credit Risk — The fund is subject to credit risk in the normal course of pursuing its investment objectives. The value of a bond generally declines as the credit quality of its issuer declines. Credit default swap agreements enable a fund to buy/sell protection against a credit event of a specific issuer or index. A fund may attempt to enhance returns by selling protection or attempt to mitigate credit risk by buying protection. Upon entering into a centrally cleared swap, a fund is required to deposit cash or securities (initial margin) with a financial intermediary in an amount equal to a certain percentage of the notional amount. Subsequent payments (variation margin) are made or received daily, in cash, by a fund. The variation margin is equal to the daily change in the value and is a component of unrealized gains and losses. Realized gain or loss is recorded upon receipt or payment of a periodic settlement or termination of swap agreements. Net realized and unrealized gains or losses occurring during the holding period of swap agreements are a component of net realized gain (loss) on swap agreement transactions and change in net unrealized appreciation (depreciation) on swap agreements, respectively. The risks of entering into swap agreements include the possible lack of liquidity, failure of the counterparty to meet its obligations, and that there may be unfavorable changes in the underlying investments or instruments. The fund's average notional amount held during the period was $65,383,333.
Foreign Currency Risk — The fund is subject to foreign currency exchange rate risk in the normal course of pursuing its investment objectives. The value of foreign investments held by a fund may be significantly affected by changes in foreign currency exchange rates. The dollar value of a foreign security generally decreases when the value of the dollar rises against the foreign currency in which the security is denominated and tends to increase when the value of the dollar declines against such foreign currency. A fund may enter into forward foreign currency exchange contracts to reduce a fund's exposure to foreign currency exchange rate fluctuations. The net U.S. dollar value of foreign currency underlying all contractual commitments held by a fund and the resulting unrealized appreciation or depreciation are determined daily. Realized gain or loss is recorded upon the termination of the contract. Net realized and unrealized gains or losses occurring during the holding period of forward foreign currency exchange contracts are a component of net realized gain (loss) on foreign currency transactions and change in net unrealized appreciation (depreciation) on translation of assets
and liabilities in foreign currencies, respectively. A fund bears the risk of an unfavorable change in the foreign currency exchange rate underlying the forward contract. Additionally, losses, up to the fair value, may arise if the counterparties do not perform under the contract terms. The fund's average U.S. dollar exposure to foreign currency risk derivative instruments held during the period was $132,656,612.
Interest Rate Risk — The fund is subject to interest rate risk in the normal course of pursuing its investment objectives. The value of bonds generally declines as interest rates rise. A fund may enter into futures contracts based on a bond index or a specific underlying security. A fund may purchase futures contracts to gain exposure to increases in market value or sell futures contracts to protect against a decline in market value. Upon entering into a futures contract, a fund will segregate cash, cash equivalents or other appropriate liquid securities on its records in amounts sufficient to meet requirements. Subsequent payments (variation margin) are made or received daily, in cash, by a fund. The variation margin is equal to the daily change in the contract value and is recorded as unrealized gains and losses. A fund recognizes a realized gain or loss when the futures contract is closed or expires. Net realized and unrealized gains or losses occurring during the holding period of futures contracts are a component of net realized gain (loss) on futures contract transactions and change in net unrealized appreciation (depreciation) on futures contracts, respectively. One of the risks of entering into futures contracts is the possibility that the change in value of the contract may not correlate with the changes in value of the underlying securities. The fund's average exposure to interest rate risk derivative instruments held during the period was 964 contracts.
Other Contracts — A fund may enter into total return swap agreements in order to attempt to obtain or preserve a particular return or spread at a lower cost than obtaining a return or spread through purchases and/or sales of instruments in other markets or gain exposure to certain markets in the most economical way possible. A fund will segregate cash, cash equivalents or other appropriate liquid securities on its records in amounts sufficient to meet requirements. Changes in value, including the periodic amounts of interest to be paid or received on swap agreements, are recorded as unrealized appreciation (depreciation) on swap agreements. Realized gain or loss is recorded upon receipt or payment of a periodic settlement or termination of swap agreements. Net realized and unrealized gains or losses occurring during the holding period of swap agreements are a component of net realized gain (loss) on swap agreement transactions and change in net unrealized appreciation (depreciation) on swap agreements, respectively. The risks of entering into swap agreements include the possible lack of liquidity, failure of the counterparty to meet its obligations, and that there may be unfavorable changes in the underlying investments or instruments, including inflationary risk.
The fund's average notional amount held during the period was $348,381,250.
Value of Derivative Instruments as of March 31, 2016 |
| | | | | | | | |
| | Asset Derivatives | Liability Derivatives |
| Type of Risk Exposure | Location on Statement of Assets and Liabilities | Value | Location on Statement of Assets and Liabilities | Value |
| Credit Risk | Receivable for variation margin on swap agreements* | $ | 113,354 |
| Payable for variation margin on swap agreements* | — |
|
| Foreign Currency Risk | Unrealized appreciation on forward foreign currency exchange contracts | 457,454 |
| Unrealized depreciation on forward foreign currency exchange contracts | $ | 3,268,989 |
|
| Interest Rate Risk | Receivable for variation margin on futures contracts* | — |
| Payable for variation margin on futures contracts* | 431,938 |
|
| Other Contracts | Swap agreements | 55,457 |
| Swap agreements | 28,774,646 |
|
| | | $ | 626,265 |
| | $ | 32,475,573 |
|
| | | | | |
| * Included in the unrealized appreciation (depreciation) on centrally cleared credit default swap agreements or futures contracts, as applicable, as reported in the Schedule of Investments. |
|
| | | | | | | | |
| Effect of Derivative Instruments on the Statement of Operations for the Year Ended March 31, 2016 |
| | Net Realized Gain (Loss) | Change in Net Unrealized Appreciation (Depreciation) |
| Type of Risk Exposure | Location on Statement of Operations | Value | Location on Statement of Operations | Value |
| Credit Risk | Net realized gain (loss) on swap agreement transactions | $ | 526,435 |
| Change in net unrealized appreciation (depreciation) on swap agreements | $ | 2,539,816 |
|
| Foreign Currency Risk | Net realized gain (loss) on foreign currency transactions | (877,882 | ) | Change in net unrealized appreciation (depreciation) on translation of assets and liabilities in foreign currencies | (2,811,535 | ) |
| Interest Rate Risk | Net realized gain (loss) on futures contract transactions | (5,283,937 | ) | Change in net unrealized appreciation (depreciation) on futures contracts | 3,556,633 |
|
| Other Contracts | Net realized gain (loss) on swap agreement transactions | (2,897,281 | ) | Change in net unrealized appreciation (depreciation) on swap agreements | (1,999,848 | ) |
| | | $ | (8,532,665 | ) | | $ | 1,285,066 |
|
Counterparty Risk — The fund is subject to counterparty risk, or the risk that an institution will fail to perform its obligations to the fund. The investment advisor attempts to minimize counterparty risk prior to entering into transactions by performing extensive reviews of the creditworthiness of all potential counterparties. The fund may also enter into agreements that provide provisions for legally enforceable master netting arrangements to manage the credit risk between counterparties related to forward foreign currency exchange contracts and/or swap agreements. A master netting arrangement provides for the net settlement of multiple contracts with a single counterparty through a single payment in the event of default or termination of any one contract. To mitigate counterparty risk, the fund may receive assets or be required to pledge assets at the custodian bank or with a broker as designated under prescribed collateral provisions.
The fund does not offset assets and liabilities subject to master netting arrangements on the Statement of Assets and Liabilities for financial reporting purposes. The fund’s asset derivatives and liability derivatives that are subject to legally enforceable offsetting arrangements as of period end were as follows:
|
| | | | | | | | | | | | |
| Counterparty | Gross Amount on Statement of Assets and Liabilities | Amount Eligible for Offset | Collateral | Net Exposure* |
| Assets | | | | |
| Bank of America N.A. | $ | 55,457 |
| $ | (55,457 | ) | — |
| — |
|
| Deutsche Bank | 2,147 |
| (809 | ) | — |
| $ | 1,338 |
|
| HSBC Holdings plc | 455,307 |
| (455,307 | ) | — |
| — |
|
| | $ | 512,911 |
| $ | (511,573 | ) | — |
| $ | 1,338 |
|
| | | | | |
| Liabilities | | | | |
| Bank of America N.A. | $ | 11,830,158 |
| $ | (55,457 | ) | $ | (11,774,701 | ) | — |
|
| Barclays Bank plc | 16,944,488 |
| — |
| (16,944,488 | ) | — |
|
| Deutsche Bank | 809 |
| (809 | ) | — |
| — |
|
| HSBC Holdings plc | 2,799,100 |
| (455,307 | ) | — |
| $ | 2,343,793 |
|
| JPMorgan Chase Bank N.A. | 469,080 |
| — |
| — |
| 469,080 |
|
| | $ | 32,043,635 |
| $ | (511,573 | ) | $ | (28,719,189 | ) | $ | 2,812,873 |
|
* The net exposure represents the amount receivable from the counterparty or amount payable to the counterparty in the event of default or termination.
8. Federal Tax Information
The tax character of distributions paid during the years ended March 31, 2016 and March 31, 2015 were as follows:
|
| | | | | | |
| | 2016 | 2015 |
| Distributions Paid From | | |
| Ordinary income | $ | 29,572,534 |
| $ | 48,774,369 |
|
| Long-term capital gains | — |
| $ | 11,034,310 |
|
The book-basis character of distributions made during the year from net investment income or net realized gains may differ from their ultimate characterization for federal income tax purposes. These differences reflect the differing character of certain income items and net realized gains and losses for financial statement and tax purposes, and may result in reclassification among certain capital accounts on the financial statements.
As of March 31, 2016, the federal tax cost of investments and the components of distributable earnings on a tax-basis were as follows:
|
| | | |
| Federal tax cost of investments | $ | 2,736,806,667 |
|
| Gross tax appreciation of investments | $ | 175,479,850 |
|
| Gross tax depreciation of investments | (18,707,070 | ) |
| Net tax appreciation (depreciation) of investments | 156,772,780 |
|
| Net tax appreciation (depreciation) on derivatives and translation of assets and liabilities in foreign currencies | (26,234,502 | ) |
| Net tax appreciation (depreciation) | $ | 130,538,278 |
|
| Other book-to-tax adjustments | $ | (9,185,306 | ) |
| Undistributed ordinary income | $ | 23,854,955 |
|
| Accumulated short-term capital losses | $ | (8,384,655 | ) |
The difference between book-basis and tax-basis unrealized appreciation (depreciation) is attributable primarily to the tax deferral of losses on wash sales and the realization for tax purposes of unrealized gains (losses) on certain foreign currency exchange contracts and futures contracts and income adjustments on Treasury inflation-protected securities. Other book-to-tax adjustments are attributable primarily to the tax deferral of losses on straddle positions.
Accumulated capital losses represent net capital loss carryovers that may be used to offset future realized capital gains for federal income tax purposes. The capital loss carryovers may be carried forward for an unlimited period. Future capital loss carryover utilization in any given year may be subject to Internal Revenue Code limitations.
|
| | | | | | | | | | | | | | | |
| For a Share Outstanding Throughout the Years Ended March 31 (except as noted) | | | | | |
| Per-Share Data | | | | | | | | | Ratios and Supplemental Data | |
| | | Income From Investment Operations: | Distributions From: | | | Ratio to Average Net Assets of: | |
| | Net Asset Value, Beginning of Period | Net Investment Income (Loss)(1) | Net Realized and Unrealized Gain (Loss) | Total From Investment Operations | Net Investment Income | Net Realized Gains | Total Distributions | Net Asset Value, End of Period | Total Return(2) | Operating Expenses | Net Investment Income (Loss) | Portfolio Turnover Rate | Net Assets, End of Period (in thousands) |
| Investor Class | | | | | | | | | | | | |
| 2016 | $11.76 | 0.20 | (0.09) | 0.11 | (0.11) | — | (0.11) | $11.76 | 0.98% | 0.47% | 1.69% | 14% |
| $1,496,429 |
|
| 2015 | $11.73 | 0.08 | 0.17 | 0.25 | (0.18) | (0.04) | (0.22) | $11.76 | 2.14% | 0.47% | 0.61% | 18% |
| $1,813,395 |
|
| 2014 | $13.13 | 0.23 | (1.18) | (0.95) | (0.17) | (0.28) | (0.45) | $11.73 | (7.20)% | 0.47% | 1.81% | 17% |
| $1,894,824 |
|
| 2013 | $12.85 | 0.23 | 0.46 | 0.69 | (0.30) | (0.11) | (0.41) | $13.13 | 5.36% | 0.47% | 1.69% | 27% |
| $3,514,082 |
|
| 2012 | $12.01 | 0.40 | 1.01 | 1.41 | (0.45) | (0.12) | (0.57) | $12.85 | 11.99% | 0.48% | 3.15% | 26% |
| $3,393,055 |
|
| Institutional Class | | | | | | | | | | | | |
| 2016 | $11.76 | 0.21 | (0.08) | 0.13 | (0.13) | — | (0.13) | $11.76 | 1.19% | 0.27% | 1.89% | 14% |
| $1,147,155 |
|
| 2015 | $11.74 | 0.07 | 0.21 | 0.28 | (0.22) | (0.04) | (0.26) | $11.76 | 2.37% | 0.27% | 0.81% | 18% |
| $1,065,257 |
|
| 2014 | $13.13 | 0.23 | (1.14) | (0.91) | (0.20) | (0.28) | (0.48) | $11.74 | (6.94)% | 0.27% | 2.01% | 17% |
| $901,517 |
|
| 2013 | $12.85 | 0.24 | 0.47 | 0.71 | (0.32) | (0.11) | (0.43) | $13.13 | 5.57% | 0.27% | 1.89% | 27% |
| $1,067,297 |
|
| 2012 | $12.01 | 0.43 | 1.01 | 1.44 | (0.48) | (0.12) | (0.60) | $12.85 | 12.16% | 0.28% | 3.35% | 26% |
| $802,309 |
|
| A Class | | | | | | | | | | | | |
| 2016 | $11.73 | 0.18 | (0.10) | 0.08 | (0.08) | — | (0.08) | $11.73 | 0.73% | 0.72% | 1.44% | 14% |
| $193,664 |
|
| 2015 | $11.69 | 0.08 | 0.13 | 0.21 | (0.13) | (0.04) | (0.17) | $11.73 | 1.83% | 0.72% | 0.36% | 18% |
| $243,242 |
|
| 2014 | $13.08 | 0.20 | (1.17) | (0.97) | (0.14) | (0.28) | (0.42) | $11.69 | (7.38)% | 0.72% | 1.56% | 17% |
| $340,625 |
|
| 2013 | $12.80 | 0.20 | 0.45 | 0.65 | (0.26) | (0.11) | (0.37) | $13.08 | 5.12% | 0.72% | 1.44% | 27% |
| $708,663 |
|
| 2012 | $11.97 | 0.37 | 1.01 | 1.38 | (0.43) | (0.12) | (0.55) | $12.80 | 11.72% | 0.73% | 2.90% | 26% |
| $830,062 |
|
|
| | | | | | | | | | | | | | | |
| For a Share Outstanding Throughout the Years Ended March 31 (except as noted) | | | | | |
| Per-Share Data | | | | | | | | | Ratios and Supplemental Data | |
| | | Income From Investment Operations: | Distributions From: | | | Ratio to Average Net Assets of: | |
| | Net Asset Value, Beginning of Period | Net Investment Income (Loss)(1) | Net Realized and Unrealized Gain (Loss) | Total From Investment Operations | Net Investment Income | Net Realized Gains | Total Distributions | Net Asset Value, End of Period | Total Return(2) | Operating Expenses | Net Investment Income (Loss) | Portfolio Turnover Rate | Net Assets, End of Period (in thousands) |
| C Class | | | | | | | | | | | | |
| 2016 | $11.76 | 0.08 | (0.09) | (0.01) | (0.01) | — | (0.01) | $11.74 | (0.05)% | 1.47% | 0.69% | 14% |
| $16,558 |
|
| 2015 | $11.68 | (0.03) | 0.17 | 0.14 | (0.02) | (0.04) | (0.06) | $11.76 | 1.21% | 1.47% | (0.39)% | 18% |
| $20,716 |
|
| 2014 | $13.09 | 0.10 | (1.17) | (1.07) | (0.06) | (0.28) | (0.34) | $11.68 | (8.14)% | 1.47% | 0.81% | 17% |
| $24,009 |
|
| 2013 | $12.81 | 0.07 | 0.49 | 0.56 | (0.17) | (0.11) | (0.28) | $13.09 | 4.34% | 1.47% | 0.69% | 27% |
| $46,414 |
|
| 2012 | $12.00 | 0.15 | 1.13 | 1.28 | (0.35) | (0.12) | (0.47) | $12.81 | 10.85% | 1.48% | 2.15% | 26% |
| $31,563 |
|
| R Class | | | | | | | | | | | | |
| 2016 | $11.78 | 0.13 | (0.08) | 0.05 | (0.05) | — | (0.05) | $11.78 | 0.48% | 0.97% | 1.19% | 14% |
| $17,695 |
|
| 2015 | $11.72 | 0.02 | 0.17 | 0.19 | (0.09) | (0.04) | (0.13) | $11.78 | 1.60% | 0.97% | 0.11% | 18% |
| $18,228 |
|
| 2014 | $13.11 | 0.11 | (1.11) | (1.00) | (0.11) | (0.28) | (0.39) | $11.72 | (7.60)% | 0.97% | 1.31% | 17% |
| $18,318 |
|
| 2013 | $12.83 | 0.08 | 0.54 | 0.62 | (0.23) | (0.11) | (0.34) | $13.11 | 4.85% | 0.97% | 1.19% | 27% |
| $13,044 |
|
| 2012 | $12.01 | 0.21 | 1.13 | 1.34 | (0.40) | (0.12) | (0.52) | $12.83 | 11.37% | 0.98% | 2.65% | 26% |
| $3,322 |
|
|
| | | | |
| Notes to Financial Highlights | | |
| |
| (1) | Computed using average shares outstanding throughout the period. |
| |
| (2) | Total returns are calculated based on the net asset value of the last business day and do not reflect applicable sales charges, if any. Total returns for periods less than one year are not annualized. |
See Notes to Financial Statements.
|
|
| Report of Independent Registered Public Accounting Firm |
To the Trustees of the American Century Government Income Trust and Shareholders of the Inflation-Adjusted Bond Fund:
In our opinion, the accompanying statement of assets and liabilities, including the schedule of investments, and the related statements of operations and of changes in net assets and the financial highlights present fairly, in all material respects, the financial position of the Inflation-Adjusted Bond Fund (one of the five funds comprising the American Century Government Income Trust, hereafter referred to as the “Fund”) at March 31, 2016, the results of its operations for the year then ended, the changes in its net assets for each of the two years in the period then ended and the financial highlights for each of the five years in the period then ended, in conformity with accounting principles generally accepted in the United States of America. These financial statements and financial highlights (hereafter referred to as "financial statements") are the responsibility of the Fund's management. Our responsibility is to express an opinion on these financial statements based on our audits. We conducted our audits of these financial statements in accordance with the standards of the Public Company Accounting Oversight Board (United States). Those standards require that we plan and perform the audit to obtain reasonable assurance about whether the financial statements are free of material misstatement. An audit includes examining, on a test basis, evidence supporting the amounts and disclosures in the financial statements, assessing the accounting principles used and significant estimates made by management, and evaluating the overall financial statement presentation. We believe that our audits, which included confirmation of securities at March 31, 2016 by correspondence with the custodian and brokers, provide a reasonable basis for our opinion.
PricewaterhouseCoopers LLP
Kansas City, Missouri
May 18, 2016
Board of Trustees
The individuals listed below serve as trustees of the funds. Each trustee will continue to serve in this capacity until death, retirement, resignation or removal from office. The board has adopted a mandatory retirement age for trustees who are not “interested persons,” as that term is defined in the Investment Company Act (independent trustees). Independent trustees shall retire on December 31 of the year in which they reach their 75th birthday; provided, however, that on or after January 1, 2022, independent trustees shall retire on December 31 of the year in which they reach their 76th birthday.
Mr. Thomas is an “interested person” because he currently serves as President and Chief Executive Officer of American Century Companies, Inc. (ACC), the parent company of American Century Investment Management, Inc. (ACIM or the advisor). The other trustees (more than three-fourths of the total number) are independent. They are not employees, directors or officers of, and have no financial interest in, ACC or any of its wholly owned, direct or indirect, subsidiaries, including ACIM, American Century Investment Services, Inc. (ACIS) and American Century Services, LLC (ACS), and they do not have any other affiliations, positions or relationships that would cause them to be considered “interested persons” under the Investment Company Act. The trustees serve in this capacity for eight (in the case of Mr. Thomas, 15) registered investment companies in the American Century Investments family of funds.
The following table presents additional information about the trustees. The mailing address for each trustee other than Mr. Thomas is 1665 Charleston Road, Mountain View, California 94043. The mailing address for Mr. Thomas is 4500 Main Street, Kansas City, Missouri 64111.
|
| | | | | |
Name (Year of Birth) | Position(s) Held with Funds | Length of Time Served | Principal Occupation(s) During Past 5 Years | Number of American Century Portfolios Overseen by Trustee | Other Directorships Held During Past 5 Years |
| Independent Trustees |
Tanya S. Beder (1955) | Trustee | Since 2011 | Chairman and CEO, SBCC Group Inc. (independent advisory services) (2006 to present) | 45 | CYS Investments, Inc. (NYSE mortgage arbitrage REIT) |
Jeremy I. Bulow (1954) | Trustee | Since 2011 | Professor of Economics, Stanford University, Graduate School of Business (1979 to present) | 45 | None |
Anne Casscells (1958) | Advisory Board Member | Since 2016 | Co-Chief Executive Officer and Chief Investment Officer, Aetos Alternatives Management (investment advisory firm) (2001 to present); Lecturer in Accounting, Stanford University, Graduate School of Business (2009 to present) | 45 | None |
Ronald J. Gilson (1946) | Trustee and Chairman of the Board | Since 1995 (Chairman since 2005) | Charles J. Meyers Professor of Law and Business, Stanford Law School (1979 to present); Marc and Eva Stern Professor of Law and Business, Columbia University School of Law (1992 to present) | 45 | None |
|
| | | | | |
Name (Year of Birth) | Position(s) Held with Funds | Length of Time Served | Principal Occupation(s) During Past 5 Years | Number of American Century Portfolios Overseen by Trustee | Other Directorships Held During Past 5 Years |
| Independent Trustees |
Frederick L. A. Grauer (1946) | Trustee | Since 2008 | Senior Advisor, iShares by BlackRock, Inc. (investment management firm) (2010 to 2011, 2013 to present); Senior Advisor, Course Hero (an educational technology company) (2015 to present) | 45 | None |
Jonathan D. Levin (1972) | Advisory Board Member | Since 2016 | Holbrook Working Professor of Price Theory, Standford University, (2000 to present); Chair, Department of Economics, Stanford University (2011 to 2014) | 45 | None |
Peter F. Pervere (1947) | Trustee | Since 2007 | Retired | 45 | None |
John B. Shoven (1947) | Trustee | Since 2002 | Charles R. Schwab Professor of Economics, Stanford University (1973 to present) | 45 | Cadence Design Systems; Exponent; Financial Engines |
| Interested Trustee |
Jonathan S. Thomas (1963) | Trustee and President | Since 2007 | President and Chief Executive Officer, ACC (March 2007 to present). Also serves as Chief Executive Officer, ACS; Executive Vice President, ACIM; Director, ACC, ACIM and other ACC subsidiaries | 128 | BioMed Valley Discoveries, Inc. |
The Statement of Additional Information has additional information about the fund's trustees and is available without charge, upon request, by calling 1-800-345-2021.
Officers
The following table presents certain information about the executive officers of the funds. Each officer serves as an officer for each of the 15 investment companies in the American Century family of funds, unless otherwise noted. No officer is compensated for his or her service as an officer of the funds. The listed officers are interested persons of the funds and are appointed or re-appointed on an annual basis. The mailing address for each of the officers listed below is 4500 Main Street, Kansas City, Missouri 64111.
|
| | |
| Name (Year of Birth) | Offices with the Funds | Principal Occupation(s) During the Past Five Years |
Jonathan S. Thomas (1963) | Trustee and President since 2007 | President and Chief Executive Officer, ACC (March 2007 to present). Also serves as Chief Executive Officer, ACS; Executive Vice President, ACIM; Director, ACC, ACIM and other ACC subsidiaries |
Amy D. Shelton (1964) | Chief Compliance Officer and Vice President since 2014 | Chief Compliance Officer, American Century funds, (March 2014 to present); Chief Compliance Officer, ACIM (February 2014 to present); Chief Compliance Officer, ACIS (October 2009 to present); Vice President, Client Interactions and Marketing, ACIS (February 2013 to January 2014); Director, Client Interactions and Marketing, ACIS (June 2007 to January 2013). Also serves as Vice President, ACIS |
Charles A. Etherington (1957) | General Counsel since 2007 and Senior Vice President since 2006 | Attorney, ACC (February 1994 to present); Vice President, ACC (November 2005 to present); General Counsel, ACC (March 2007 to present). Also serves as General Counsel, ACIM, ACS, ACIS and other ACC subsidiaries; and Senior Vice President, ACIM and ACS |
C. Jean Wade (1964) | Vice President, Treasurer and Chief Financial Officer since 2012 | Vice President, ACS (February 2000 to present) |
Robert J. Leach (1966) | Vice President since 2006 and Assistant Treasurer since 2012 | Vice President, ACS (February 2000 to present) |
David H. Reinmiller (1963) | Vice President since 2001 | Attorney, ACC (January 1994 to present); Associate General Counsel, ACC (January 2001 to present). Also serves as Vice President, ACIM and ACS |
Ward D. Stauffer (1960) | Secretary since 2005 | Attorney, ACC (June 2003 to present) |
Retirement Account Information
As required by law, distributions you receive from certain IRAs are subject to federal income tax withholding, unless you elect not to have withholding apply. Tax will be withheld on the total amount withdrawn even though you may be receiving amounts that are not subject to withholding, such as nondeductible contributions. In such case, excess amounts of withholding could occur. You may adjust your withholding election so that a greater or lesser amount will be withheld.
If you don’t want us to withhold on this amount, you must notify us to not withhold the federal income tax. You may notify us in writing or in certain situations by telephone or through other electronic means. For systematic withdrawals, your withholding election will remain in effect until revoked or changed by filing a new election. You have the right to revoke your election at any time.
Remember, even if you elect not to have income tax withheld, you are liable for paying income tax on the taxable portion of your withdrawal. If you elect not to have income tax withheld or you don’t have enough income tax withheld, you may be responsible for payment of estimated tax. You may incur penalties under the estimated tax rules if your withholding and estimated tax payments are not sufficient. You can reduce or defer the income tax on a distribution by directly or indirectly rolling such distribution over to another IRA or eligible plan. You should consult your tax advisor for additional information.
State tax will be withheld if, at the time of your distribution, your address is within one of the mandatory withholding states and you have federal income tax withheld (or as otherwise required by state law). State taxes will be withheld from your distribution in accordance with the respective state rules.
Distributions you receive from 403(b), 457 and qualified plans are subject to special tax and withholding rules. Your plan administrator or plan sponsor is required to provide you with a special tax notice explaining those rules at the time you request a distribution. If applicable, federal and/or state taxes may be withheld from your distribution amount.
Proxy Voting Policies
Descriptions of the principles and policies that the fund's investment advisor uses in exercising the voting rights associated with the securities purchased and/or held by the fund are available without charge, upon request, by calling 1-800-345-2021 or visiting the "About Us" page of American Century Investments’ website at americancentury.com. A description of the policies is also available on the Securities and Exchange Commission’s website at sec.gov. Information regarding how the investment advisor voted proxies relating to portfolio securities during the most recent 12-month period ended June 30 is available on the "About Us" page at americancentury.com. It is also available at sec.gov.
Quarterly Portfolio Disclosure
The fund files its complete schedule of portfolio holdings with the Securities and Exchange Commission (SEC) for the first and third quarters of each fiscal year on Form N-Q. The fund’s Forms N-Q are available on the SEC’s website at sec.gov, and may be reviewed and copied at the SEC’s Public Reference Room in Washington, DC. Information on the operation of the Public Reference Room may be obtained by calling 1-800-SEC-0330. The fund also makes its complete schedule of portfolio holdings for the most recent quarter of its fiscal year available on its
website at americancentury.com and, upon request, by calling 1-800-345-2021.
|
| | |
| |
| | | |
| Contact Us | americancentury.com | |
| Automated Information Line | 1-800-345-8765 | |
| Investor Services Representative | 1-800-345-2021 or 816-531-5575 | |
| Investors Using Advisors | 1-800-378-9878 | |
| Business, Not-For-Profit, Employer-Sponsored Retirement Plans | 1-800-345-3533 | |
| Banks and Trust Companies, Broker-Dealers, Financial Professionals, Insurance Companies | 1-800-345-6488 | |
| Telecommunications Relay Service for the Deaf | 711 | |
| | | |
| American Century Government Income Trust | |
| | | |
Investment Advisor: American Century Investment Management, Inc. Kansas City, Missouri | |
| | | |
| This report and the statements it contains are submitted for the general information of our shareholders. The report is not authorized for distribution to prospective investors unless preceded or accompanied by an effective prospectus. | |
| | | |
©2016 American Century Proprietary Holdings, Inc. All rights reserved.
CL-ANN-88874 1605
| |
|
| |
| | |
| | Annual Report |
| | |
| | March 31, 2016 |
| | |
| | Short-Term Government Fund |
|
| | |
| President’s Letter | 2 |
|
| Performance | 3 |
|
| Portfolio Commentary | |
|
| Fund Characteristics | |
|
| Shareholder Fee Example | |
|
| Schedule of Investments | |
|
| Statement of Assets and Liabilities | |
|
| Statement of Operations | |
|
| Statement of Changes in Net Assets | |
|
| Notes to Financial Statements | |
|
| Financial Highlights | |
|
| Report of Independent Registered Public Accounting Firm | |
|
| Management | |
|
| Additional Information | |
|
Any opinions expressed in this report reflect those of the author as of the date of the report, and do not necessarily represent the opinions of American Century Investments® or any other person in the American Century Investments organization. Any such opinions are subject to change at any time based upon market or other conditions and American Century Investments disclaims any responsibility to update such opinions. These opinions may not be relied upon as investment advice and, because investment decisions made by American Century Investments funds are based on numerous factors, may not be relied upon as an indication of trading intent on behalf of any American Century Investments fund. Security examples are used for representational purposes only and are not intended as recommendations to purchase or sell securities. Performance information for comparative indices and securities is provided to American Century Investments by third party vendors. To the best of American Century Investments’ knowledge, such information is accurate at the time of printing.
|
| |
| Dear Investor:
Thank you for reviewing this annual report for the 12 months ended March 31, 2016. It provides investment performance and portfolio information for the reporting period, plus longer-term historical performance data.
Annual reports help convey information about fund performance, including market and economic factors that affected returns during the reporting period. For additional, updated investment and market insights, we encourage you to visit our website, americancentury.com.
|
| Jonathan Thomas |
Divergence in Economic Growth and Monetary Policies, Combined With China Turmoil, Triggered Market Volatility
Divergence between the U.S. and the rest of the world—along with China’s struggles, plunging commodity prices, capital market volatility, and risk-off trading—were dominant themes during the reporting period. Global divergence described not only the relatively stronger economic growth enjoyed by the U.S. compared with most of the world, but also the related contrast between the U.S. Federal Reserve’s (the Fed’s) unwinding of monetary stimulus versus the continuation and expansion of stimulus by other major central banks.
Two months in particular captured the volatility and risk-off trading of the 12-month period. Last August, China’s economic slowdown (which rippled across the global economy) triggered Chinese stock market volatility, increasingly stimulative Chinese central bank monetary policy, and currency devaluations. Burdened further with oil market volatility, equity and higher-risk bond markets declined globally. Five months later, in January, investor sentiment plunged again as global economic growth decelerated, China devalued its currency again, and oil prices dropped below $30 a barrel. In addition, the Fed, in December, executed its first rate hike since 2006. Central bank policies showed less divergence thereafter, with the Bank of Japan suddenly resorting to negative interest rates, the Fed holding rates steady while reducing its rate hike projections, and the European Central Bank announcing significant additional stimulus.
Bonds (and more bond-like stock sectors, such as utilities and REITs) generally outperformed the broad stock market for the reporting period. In terms of stock style and size, growth generally outperformed value, and large cap generally outperformed small cap. In the bond market, higher quality (investment-grade) generally outperformed lower quality (high-yield). We expect continued economic and monetary policy divergence between the U.S. and non-U.S. economies in 2016, accompanied by further market volatility. This could present both challenges and opportunities for active investment managers. Looking ahead, we continue to believe in a disciplined, diversified, risk-aware investment approach, using professionally managed portfolios to meet financial goals. We appreciate your trust in us.
Sincerely,
Jonathan Thomas
President and Chief Executive Officer
American Century Investments
|
| | | | | | |
| Total Returns as of March 31, 2016 |
| | | | Average Annual Returns | |
| | Ticker Symbol | 1 year | 5 years | 10 years | Since Inception | Inception Date |
| Investor Class | TWUSX | 0.44% | 0.54% | 2.20% | — | 12/15/82 |
| Barclays U.S. 1-3 Year Government Bond Index | — | 0.93% | 0.90% | 2.55% | — | — |
| Institutional Class | TWUOX | 0.64% | 0.74% | — | 0.86% | 3/1/10 |
| A Class | TWAVX | | | | | 7/8/98 |
| No sales charge | | 0.19% | 0.29% | 1.94% | — | |
| With sales charge | | -2.04% | -0.16% | 1.72% | — | |
| C Class | TWACX | -0.63% | -0.46% | — | -0.34% | 3/1/10 |
| R Class | TWARX | -0.10% | 0.06% | — | 0.17% | 3/1/10 |
Sales charges include initial sales charges and contingent deferred sales charges (CDSCs), as applicable. A Class shares have a 2.25% maximum initial sales charge and may be subject to a maximum CDSC of 1.00%. C Class shares redeemed within 12 months of purchase are subject to a maximum CDSC of 1.00%. The SEC requires that mutual funds provide performance information net of maximum sales charges in all cases where charges could be applied.
Average annual returns since inception are presented when ten years of performance history is not available.
Prior to March 1, 2010, the A Class was referred to as the Advisor Class and did not have a front-end sales charge. Performance prior to that date has been adjusted to reflect this charge.
Data presented reflect past performance. Past performance is no guarantee of future results. Current performance may be higher or lower than the performance shown. Total returns for periods less than one year are not annualized. Investment return and principal value will fluctuate, and redemption value may be more or less than original cost. Data assumes reinvestment of dividends and capital gains, and none of the charts reflect the deduction of taxes that a shareholder would pay on fund distributions or the redemption of fund shares. To obtain performance data current to the most recent month end, please call 1-800-345-2021 or visit americancentury.com. For additional information about the fund, please consult the prospectus.
|
|
| Growth of $10,000 Over 10 Years |
| $10,000 investment made March 31, 2006 |
Performance for other share classes will vary due to differences in fee structure.
|
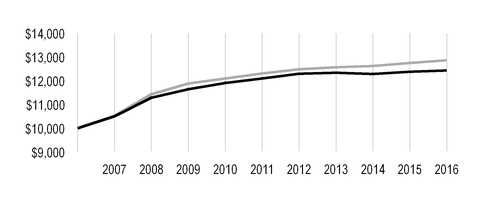
|
| |
| Value on March 31, 2016 |
| | Investor Class — $12,432 |
| |
| | Barclays U.S. 1-3 Year Government Bond Index — $12,871 |
| |
|
| | | | |
| Total Annual Fund Operating Expenses |
| Investor Class | Institutional Class | A Class | C Class | R Class |
| 0.55% | 0.35% | 0.80% | 1.55% | 1.05% |
The total annual fund operating expenses shown is as stated in the fund’s prospectus current as of the date of this report. The prospectus may vary from the expense ratio shown elsewhere in this report because it is based on a different time period, includes acquired fund fees and expenses, and, if applicable, does not include fee waivers or expense reimbursements.
Data presented reflect past performance. Past performance is no guarantee of future results. Current performance may be higher or lower than the performance shown. Total returns for periods less than one year are not annualized. Investment return and principal value will fluctuate, and redemption value may be more or less than original cost. Data assumes reinvestment of dividends and capital gains, and none of the charts reflect the deduction of taxes that a shareholder would pay on fund distributions or the redemption of fund shares. To obtain performance data current to the most recent month end, please call 1-800-345-2021 or visit americancentury.com. For additional information about the fund, please consult the prospectus.
Portfolio Managers: Bob Gahagan, Hando Aguilar, Brian Howell, Dan Shiffman, and Jim Platz
Performance Summary
Short-Term Government advanced 0.44%* for the 12 months ended March 31, 2016. The Barclays U.S. 1-3 Year Government Bond Index advanced 0.93%. Fund returns reflect operating expenses, while index returns do not.
U.S. Bonds Persevered In Volatile Backdrop
Despite modest economic gains and the Federal Reserve’s (the Fed’s) December 2015 decision to finally start normalizing short-term interest rates—factors that distinguished the U.S. from most other regions of the world, where slowing or stagnant growth and aggressive central bank easing were the norms—U.S. investment-grade bonds generally posted modest gains for the 12-month period ended March 31, 2016. After concluding its massive quantitative easing (QE) program in October 2014, the Fed focused on winding down another component of its unprecedented stimulus program—near-zero short-term interest rates—in 2015. Investor speculation regarding the timing and magnitude of the first Fed rate hike since June 2006 dominated the fixed-income market throughout the first nine months of the period and contributed to heightened market volatility.
Meanwhile, other leading central banks pursued aggressive stimulus programs, including increased QE and negative interest rates, to combat economic weakness. This global divergence of monetary policies made U.S. Treasury yields relatively more attractive than government bond yields of other nations, where yields declined at a greater pace. Global divergence also initially helped strengthen the U.S. dollar relative to other currencies. But the dollar weakened late in the reporting period as the Fed adopted a more dovish tone toward monetary policy.
Early in the 12-month period, U.S. bond market performance stumbled, largely due to Fed rate-hike speculation, a sharp bond market sell-off in Europe, and fallout from Greece’s inability to repay its government debt. Performance rebounded in the third quarter of 2015 as Greece reached a deal with its creditors, and the global economic slowdown sparked a flight to quality, which generally favored high-quality bonds and pushed back the Fed’s rate-hike plans. Investors assumed the Fed would begin to normalize short-term interest rates at its December monetary policy meeting. This expectation drove Treasury yields higher (and returns lower) during the fourth quarter of 2015, particularly among shorter-maturity securities, which are the most sensitive to Fed policy. On December 16, the Fed finally initiated “liftoff” with an increase of 25 basis points (one basis point equals 0.01%) in the federal funds rate target, pushing the overnight lending rate from 0.00%-0.25% to 0.25%-0.50%.
Most investors assumed the Fed would continue rate normalization in the first quarter of 2016. However, mounting concerns about China’s economic slowdown, lackluster global growth, weak oil prices, and equity market volatility kept the Fed on hold. These factors also triggered a rally among U.S. Treasury and other high-quality bonds to start 2016. Midway through the first quarter of 2016, stabilization in the oil markets restored investors’ “risk-on” sentiment, and Treasury returns stalled. But late in the quarter, the Fed reduced its 2016 rate-hike forecast from four to two increases, triggering another Treasury market rally to close out the period.
| |
| * | All fund returns referenced in this commentary are for Investor Class shares. Performance for other share classes will vary due to differences in fee structure; when Investor Class performance exceeds that of the index, other share classes may not. See page 3 for returns for all share classes. |
Against this backdrop, the Treasury yield curve flattened during the 12-month period, as longer-maturity yields declined due to investor demand and weak inflation and shorter-maturity yields increased on Fed rate-hike expectations. The yield on the benchmark 10-year Treasury note declined 15 basis points to 1.77% at the end of March 2016, while the yield on the two-year Treasury note increased 16 basis points to 0.72%, according to Bloomberg.
Portfolio Positioning Summary
We maintained underweight positions in Treasuries and agencies and an overweight position in the higher-yielding mortgage-backed securities (MBS) sector throughout the 12-month period. A favorable supply/demand backdrop contributed to the MBS sector’s positive tone. Investors in the short-maturity, high-quality fixed-income market generally favored MBS for their relative yield advantages versus comparable-maturity Treasuries and government agency securities. Also, the Fed continued to reinvest the interest and principal payments from its MBS holdings back into the sector, which helped performance.
Our security selection within the MBS allocation contributed to performance. We favored agency commercial mortgage-backed securities and collateralized mortgage obligations for their yield advantages and more-predictable payment streams.
Outlook
We believe U.S. economic fundamentals eventually will cause the Fed to resume interest-rate normalization. But weaker global economic fundamentals, U.S. dollar strength, weak commodity prices, and geopolitical risks may delay Fed action and keep rates range-bound. We expect to continue to overweight MBS relative to Treasuries and agencies, focusing on structured mortgage products over traditional pass-through mortgage securities. We also expect to continue holding ARMs and other floating-rate securities. Overall, we favor a disciplined, relative-value approach to portfolio management, emphasizing careful security selection and risk management.
|
| |
| MARCH 31, 2016 |
| Portfolio at a Glance | |
| Average Duration (effective) | 1.9 years |
| Weighted Average Life | 2.1 years |
| | |
| Types of Investments in Portfolio | % of net assets |
| U.S. Treasury Securities | 67.4% |
| Collateralized Mortgage Obligations | 21.8% |
| U.S. Government Agency Mortgage-Backed Securities | 8.0% |
| U.S. Government Agency Securities | 3.3% |
| Temporary Cash Investments | 4.2% |
| Other Assets and Liabilities | (4.7)% |
Fund shareholders may incur two types of costs: (1) transaction costs, including sales charges (loads) on purchase payments and redemption/exchange fees; and (2) ongoing costs, including management fees; distribution and service (12b-1) fees; and other fund expenses. This example is intended to help you understand your ongoing costs (in dollars) of investing in your fund and to compare these costs with the ongoing cost of investing in other mutual funds.
The example is based on an investment of $1,000 made at the beginning of the period and held for the entire period from October 1, 2015 to March 31, 2016.
Actual Expenses
The table provides information about actual account values and actual expenses for each class. You may use the information, together with the amount you invested, to estimate the expenses that you paid over the period. First, identify the share class you own. Then simply divide your account value by $1,000 (for example, an $8,600 account value divided by $1,000 = 8.6), then multiply the result by the number under the heading “Expenses Paid During Period” to estimate the expenses you paid on your account during this period.
If you hold Investor Class shares of any American Century Investments fund, or Institutional Class shares of the American Century Diversified Bond Fund, in an American Century Investments account (i.e., not a financial intermediary or retirement plan account), American Century Investments may charge you a $12.50 semiannual account maintenance fee if the value of those shares is less than $10,000. We will redeem shares automatically in one of your accounts to pay the $12.50 fee. In determining your total eligible investment amount, we will include your investments in all personal accounts (including American Century Investments Brokerage accounts) registered under your Social Security number. Personal accounts include individual accounts, joint accounts, UGMA/UTMA accounts, personal trusts, Coverdell Education Savings Accounts and IRAs (including traditional, Roth, Rollover, SEP-, SARSEP- and SIMPLE-IRAs), and certain other retirement accounts. If you have only business, business retirement, employer-sponsored or American Century Investments Brokerage accounts, you are currently not subject to this fee. If you are subject to the Account Maintenance Fee, your account value could be reduced by the fee amount.
Hypothetical Example for Comparison Purposes
The table also provides information about hypothetical account values and hypothetical expenses based on the actual expense ratio of each class of your fund and an assumed rate of return of 5% per year before expenses, which is not the actual return of a fund’s share class. The hypothetical account values and expenses may not be used to estimate the actual ending account balance or expenses you paid for the period. You may use this information to compare the ongoing costs of investing in your fund and other funds. To do so, compare this 5% hypothetical example with the 5% hypothetical examples that appear in the shareholder reports of the other funds.
Please note that the expenses shown in the table are meant to highlight your ongoing costs only and do not reflect any transactional costs, such as sales charges (loads) or redemption/exchange fees. Therefore, the table is useful in comparing ongoing costs only, and will not help you determine the relative total costs of owning different funds. In addition, if these transactional costs were included, your costs would have been higher.
|
| | | | |
| | Beginning
Account Value
10/1/15 | Ending
Account Value
3/31/16 | Expenses Paid
During Period(1)10/1/15 - 3/31/16 | Annualized
Expense Ratio(1) |
| Actual | | | | |
| Investor Class | $1,000 | $1,002.70 | $2.75 | 0.55% |
| Institutional Class | $1,000 | $1,002.70 | $1.75 | 0.35% |
| A Class | $1,000 | $1,000.50 | $4.00 | 0.80% |
| C Class | $1,000 | $996.80 | $7.74 | 1.55% |
| R Class | $1,000 | $1,000.00 | $5.25 | 1.05% |
| Hypothetical | | | | |
| Investor Class | $1,000 | $1,022.25 | $2.78 | 0.55% |
| Institutional Class | $1,000 | $1,023.25 | $1.77 | 0.35% |
| A Class | $1,000 | $1,021.00 | $4.04 | 0.80% |
| C Class | $1,000 | $1,017.25 | $7.82 | 1.55% |
| R Class | $1,000 | $1,019.75 | $5.30 | 1.05% |
| |
| (1) | Expenses are equal to the class's annualized expense ratio listed in the table above, multiplied by the average account value over the period, multiplied by 183, the number of days in the most recent fiscal half-year, divided by 366, to reflect the one-half year period. |
MARCH 31, 2016
|
| | | | | | |
| | Principal Amount | Value |
| U.S. TREASURY SECURITIES — 67.4% | | |
U.S. Treasury Bills, 0.57%, 1/5/17(1) | $ | 6,000,000 |
| $ | 5,978,184 |
|
U.S. Treasury Notes, 0.875%, 2/28/17(2) | 3,000,000 |
| 3,007,206 |
|
| U.S. Treasury Notes, 0.875%, 5/15/17 | 28,100,000 |
| 28,168,592 |
|
| U.S. Treasury Notes, 0.50%, 7/31/17 | 16,800,000 |
| 16,761,612 |
|
| U.S. Treasury Notes, 2.375%, 7/31/17 | 6,500,000 |
| 6,646,250 |
|
| U.S. Treasury Notes, 0.75%, 10/31/17 | 23,800,000 |
| 23,813,471 |
|
| U.S. Treasury Notes, 1.875%, 10/31/17 | 3,500,000 |
| 3,563,780 |
|
| U.S. Treasury Notes, 0.875%, 1/31/18 | 45,000,000 |
| 45,124,785 |
|
| U.S. Treasury Notes, 1.00%, 2/15/18 | 24,800,000 |
| 24,922,066 |
|
| U.S. Treasury Notes, 1.00%, 3/15/18 | 10,800,000 |
| 10,856,527 |
|
| U.S. Treasury Notes, 2.625%, 4/30/18 | 1,800,000 |
| 1,870,454 |
|
| U.S. Treasury Notes, 1.00%, 5/31/18 | 5,000,000 |
| 5,025,100 |
|
| U.S. Treasury Notes, 1.375%, 6/30/18 | 1,600,000 |
| 1,621,813 |
|
| U.S. Treasury Notes, 1.25%, 11/15/18 | 13,700,000 |
| 13,853,056 |
|
| U.S. Treasury Notes, 1.50%, 2/28/19 | 3,000,000 |
| 3,055,137 |
|
TOTAL U.S. TREASURY SECURITIES (Cost $193,576,445) | | 194,268,033 |
|
COLLATERALIZED MORTGAGE OBLIGATIONS(3) — 21.8% | | |
| FHLMC, Series 2650, Class PN, 4.50%, 12/15/32 | 1,262,845 |
| 1,309,313 |
|
| FHLMC, Series 2684, Class FP, VRN, 0.94%, 4/15/16 | 53,142 |
| 53,201 |
|
| FHLMC, Series 3114, Class FT, VRN, 0.79%, 4/15/16 | 1,117,084 |
| 1,116,217 |
|
| FHLMC, Series 3149, Class LF, VRN, 0.74%, 4/15/16 | 2,599,817 |
| 2,587,661 |
|
| FHLMC, Series 3200, Class FP, VRN, 0.64%, 4/15/16 | 1,665,788 |
| 1,658,628 |
|
| FHLMC, Series 3206, Class FE, VRN, 0.84%, 4/15/16 | 1,011,527 |
| 1,016,303 |
|
| FHLMC, Series 3231, Class FA, VRN, 0.84%, 4/15/16 | 930,372 |
| 937,414 |
|
| FHLMC, Series 3301, Class FA, VRN, 0.74%, 4/15/16 | 909,268 |
| 913,835 |
|
| FHLMC, Series 3380, Class FP, VRN, 0.79%, 4/15/16 | 1,215,372 |
| 1,221,532 |
|
| FHLMC, Series 3501, Class AC SEQ, 4.00%, 8/15/23 | 355,786 |
| 360,605 |
|
| FHLMC, Series 3508, Class PF, VRN, 1.29%, 4/15/16 | 1,087,315 |
| 1,102,605 |
|
| FHLMC, Series 3587, Class FB, VRN, 1.21%, 4/15/16 | 1,133,038 |
| 1,147,350 |
|
| FHLMC, Series 3831, Class CG, 3.00%, 10/15/18 | 233,017 |
| 236,888 |
|
| FHLMC, Series 3842, Class JB, 2.00%, 9/15/18 | 730,488 |
| 735,246 |
|
| FHLMC, Series K037, Class A1 SEQ, 2.59%, 4/25/23 | 1,654,826 |
| 1,714,261 |
|
| FHLMC, Series K039, Class A1, 2.68%, 12/25/23 | 2,871,881 |
| 2,996,760 |
|
| FHLMC, Series K043, Class A1 SEQ, 2.53%, 10/25/23 | 1,405,203 |
| 1,460,515 |
|
| FHLMC, Series K716, Class A1, 2.41%, 8/25/47 | 2,100,136 |
| 2,161,194 |
|
| FHLMC, Series K718, Class A1 SEQ, 2.375%, 9/25/21 | 3,190,670 |
| 3,311,383 |
|
| FNMA, Series 2003-108, Class BE SEQ, 4.00%, 11/25/18 | 245,117 |
| 251,522 |
|
| FNMA, Series 2003-123, Class AY SEQ, 4.00%, 12/25/18 | 595,818 |
| 609,176 |
|
| FNMA, Series 2003-125, Class AY SEQ, 4.00%, 12/25/18 | 1,049,055 |
| 1,075,472 |
|
| FNMA, Series 2003-128, Class NG, 4.00%, 1/25/19 | 360,233 |
| 369,398 |
|
| FNMA, Series 2003-17, Class FN, VRN, 0.73%, 4/25/16 | 345,269 |
| 345,175 |
|
| FNMA, Series 2004-17, Class CJ SEQ, 4.00%, 4/25/19 | 827,838 |
| 848,896 |
|
|
| | | | | | |
| | Principal Amount | Value |
| FNMA, Series 2004-28, Class FE, VRN, 0.78%, 4/25/16 | $ | 4,058,471 |
| $ | 4,076,871 |
|
| FNMA, Series 2004-32, Class AY SEQ, 4.00%, 5/25/19 | 611,583 |
| 628,662 |
|
| FNMA, Series 2004-52, Class PF, VRN, 0.88%, 4/25/16 | 425,802 |
| 427,616 |
|
| FNMA, Series 2006-11, Class FA, VRN, 0.73%, 4/25/16 | 790,791 |
| 793,280 |
|
| FNMA, Series 2006-60, Class KF, VRN, 0.73%, 4/25/16 | 1,785,183 |
| 1,793,795 |
|
| FNMA, Series 2006-72, Class TE, VRN, 0.73%, 4/25/16 | 1,125,130 |
| 1,128,540 |
|
| FNMA, Series 2008-77, Class EB SEQ, 4.50%, 9/25/23 | 369,761 |
| 386,704 |
|
| FNMA, Series 2009-33, Class FB, VRN, 1.25%, 4/25/16 | 1,212,551 |
| 1,238,368 |
|
| FNMA, Series 2009-87, Class HF, VRN, 1.28%, 4/25/16 | 483,423 |
| 493,814 |
|
| FNMA, Series 2009-89, Class FD, VRN, 1.03%, 4/25/16 | 627,986 |
| 636,744 |
|
| FNMA, Series 2010-12, Class AC SEQ, 2.50%, 12/25/18 | 443,188 |
| 448,114 |
|
| FNMA, Series 2010-83, Class CM SEQ, 4.50%, 3/25/25 | 345,483 |
| 348,073 |
|
| FNMA, Series 2011-3, Class EL, 3.00%, 5/25/20 | 175,605 |
| 178,695 |
|
| FNMA, Series 2011-71, Class DJ SEQ, 3.00%, 3/25/25 | 377,126 |
| 383,553 |
|
| FNMA, Series 2013-M11, Class FA SEQ, VRN, 0.76%, 4/25/16 | 1,192,585 |
| 1,193,000 |
|
| FNMA, Series 2014-M10, Class ASQ1, 1.52%, 9/25/19 | 2,605,845 |
| 2,621,678 |
|
| FNMA, Series 2014-M12, Class ASV1, 1.93%, 10/25/21 | 2,373,963 |
| 2,411,363 |
|
| FNMA, Series 2014-M4, Class ASQ2 SEQ, 1.27%, 1/25/17 | 1,614,407 |
| 1,614,208 |
|
| FNMA, Series 2014-M5, Class FA, VRN, 0.75%, 4/1/16 | 280,890 |
| 280,739 |
|
| FNMA, Series 2015-M12, Class FA, VRN, 0.76%, 4/1/16 | 3,638,383 |
| 3,625,257 |
|
| FNMA, Series 2015-M13, Class ASQ2, 1.65%, 9/25/19 | 1,700,000 |
| 1,712,498 |
|
| FNMA, Series 2015-M7, Class ASQ2, 1.55%, 4/25/18 | 1,150,000 |
| 1,154,797 |
|
| FNMA, Series 2015-M8, Class FA, VRN, 0.58%, 4/1/16 | 2,462,626 |
| 2,443,411 |
|
| FNMA, Series 2016-M2, Class FA, VRN, 1.28%, 4/1/16 | 1,698,538 |
| 1,700,497 |
|
| GNMA, Series 2010-14, Class QF, VRN, 0.89%, 4/16/16 | 1,472,701 |
| 1,484,202 |
|
TOTAL COLLATERALIZED MORTGAGE OBLIGATIONS (Cost $62,555,376) | | 62,745,029 |
|
U.S. GOVERNMENT AGENCY MORTGAGE-BACKED SECURITIES(3) — 8.0% | |
| Adjustable-Rate U.S. Government Agency Mortgage-Backed Securities — 7.5% | |
| FHLMC, VRN, 2.04%, 4/15/16 | 648,445 |
| 667,019 |
|
| FHLMC, VRN, 2.05%, 4/15/16 | 947,242 |
| 973,026 |
|
| FHLMC, VRN, 2.125%, 4/15/16 | 16,031 |
| 16,071 |
|
| FHLMC, VRN, 2.32%, 4/15/16 | 581,742 |
| 595,543 |
|
| FHLMC, VRN, 2.39%, 4/15/16 | 2,491,083 |
| 2,636,408 |
|
| FHLMC, VRN, 2.40%, 4/15/16 | 190,124 |
| 201,188 |
|
| FHLMC, VRN, 2.41%, 4/15/16 | 556,613 |
| 590,921 |
|
| FHLMC, VRN, 2.48%, 4/15/16 | 13,564 |
| 13,652 |
|
| FHLMC, VRN, 2.48%, 4/15/16 | 190,613 |
| 201,314 |
|
| FHLMC, VRN, 2.55%, 4/15/16 | 229,997 |
| 239,984 |
|
| FHLMC, VRN, 2.59%, 4/15/16 | 419,507 |
| 442,408 |
|
| FHLMC, VRN, 2.63%, 4/15/16 | 596,703 |
| 629,514 |
|
| FHLMC, VRN, 2.63%, 4/15/16 | 1,652,086 |
| 1,715,026 |
|
| FHLMC, VRN, 2.78%, 4/15/16 | 129,452 |
| 136,466 |
|
| FHLMC, VRN, 3.13%, 4/15/16 | 25,595 |
| 25,760 |
|
| FHLMC, VRN, 3.79%, 4/15/16 | 1,119,481 |
| 1,181,992 |
|
| FHLMC, VRN, 4.06%, 4/15/16 | 254,999 |
| 268,582 |
|
| FHLMC, VRN, 4.67%, 4/15/16 | 98,528 |
| 103,388 |
|
| FNMA, VRN, 2.04%, 4/25/16 | 7,770 |
| 7,999 |
|
|
| | | | | | |
| | Principal Amount | Value |
| FNMA, VRN, 2.05%, 4/25/16 | $ | 1,348,178 |
| $ | 1,384,033 |
|
| FNMA, VRN, 2.07%, 4/25/16 | 665,472 |
| 691,840 |
|
| FNMA, VRN, 2.07%, 4/25/16 | 602,186 |
| 627,193 |
|
| FNMA, VRN, 2.07%, 4/25/16 | 135,679 |
| 141,459 |
|
| FNMA, VRN, 2.07%, 4/25/16 | 902,823 |
| 940,582 |
|
| FNMA, VRN, 2.18%, 4/25/16 | 793 |
| 799 |
|
| FNMA, VRN, 2.23%, 4/25/16 | 3,827 |
| 3,849 |
|
| FNMA, VRN, 2.31%, 4/25/16 | 5,444 |
| 5,476 |
|
| FNMA, VRN, 2.33%, 4/25/16 | 18,750 |
| 18,858 |
|
| FNMA, VRN, 2.33%, 4/25/16 | 519,336 |
| 538,638 |
|
| FNMA, VRN, 2.34%, 4/25/16 | 5,094 |
| 5,103 |
|
| FNMA, VRN, 2.37%, 4/25/16 | 2,396 |
| 2,454 |
|
| FNMA, VRN, 2.375%, 4/25/16 | 511,496 |
| 530,674 |
|
| FNMA, VRN, 2.41%, 4/25/16 | 1,456,243 |
| 1,526,401 |
|
| FNMA, VRN, 2.48%, 4/25/16 | 10,504 |
| 11,217 |
|
| FNMA, VRN, 2.56%, 4/25/16 | 81,432 |
| 85,274 |
|
| FNMA, VRN, 2.57%, 4/25/16 | 116,975 |
| 122,732 |
|
| FNMA, VRN, 2.58%, 4/25/16 | 5,235 |
| 5,269 |
|
| FNMA, VRN, 2.60%, 4/25/16 | 626,159 |
| 660,470 |
|
| FNMA, VRN, 2.61%, 4/25/16 | 85,305 |
| 87,518 |
|
| FNMA, VRN, 2.74%, 4/25/16 | 580,176 |
| 609,082 |
|
| FNMA, VRN, 2.83%, 4/25/16 | 1,737 |
| 1,785 |
|
| FNMA, VRN, 2.875%, 4/25/16 | 1,731 |
| 1,740 |
|
| FNMA, VRN, 3.02%, 4/25/16 | 876,454 |
| 912,866 |
|
| FNMA, VRN, 3.36%, 4/25/16 | 1,377,878 |
| 1,442,128 |
|
| FNMA, VRN, 3.61%, 4/25/16 | 255,031 |
| 269,579 |
|
| FNMA, VRN, 3.67%, 4/25/16 | 2,761 |
| 2,808 |
|
| FNMA, VRN, 3.875%, 4/25/16 | 5,218 |
| 5,217 |
|
| FNMA, VRN, 4.10%, 4/25/16 | 454 |
| 454 |
|
| FNMA, VRN, 4.10%, 4/25/16 | 10,370 |
| 10,421 |
|
| FNMA, VRN, 4.80%, 4/25/16 | 163,457 |
| 172,156 |
|
| FNMA, VRN, 6.03%, 4/25/16 | 1,115 |
| 1,118 |
|
| GNMA, VRN, 2.50%, 4/20/16 | 7,275 |
| 7,412 |
|
| GNMA, VRN, 3.00%, 4/20/16 | 22,136 |
| 22,292 |
|
| | | 21,495,158 |
|
| Fixed-Rate U.S. Government Agency Mortgage-Backed Securities — 0.5% | |
| FHLMC, 5.50%, 11/1/17 | 41,915 |
| 42,777 |
|
| FHLMC, 1.00%, 6/1/44 | 991,241 |
| 1,032,401 |
|
| FNMA, 7.00%, 5/1/32 | 156,255 |
| 172,022 |
|
| FNMA, 7.00%, 5/1/32 | 109,000 |
| 123,378 |
|
| FNMA, 7.00%, 6/1/32 | 20,107 |
| 22,691 |
|
| FNMA, 7.00%, 6/1/32 | 107,050 |
| 124,176 |
|
| FNMA, 7.00%, 8/1/32 | 24,591 |
| 24,869 |
|
| GNMA, 9.50%, 11/20/19 | 1,608 |
| 1,616 |
|
| | | 1,543,930 |
|
TOTAL U.S. GOVERNMENT AGENCY MORTGAGE-BACKED SECURITIES (Cost $22,688,987) | 23,039,088 |
|
|
| | | | | | |
| | Principal Amount/Shares | Value |
| U.S. GOVERNMENT AGENCY SECURITIES — 3.3% | | |
| FHLB, 1.00%, 6/21/17 | $ | 84,000 |
| $ | 84,340 |
|
| FHLB, 1.375%, 2/18/21 | 1,000,000 |
| 1,001,410 |
|
| FHLMC, 1.125%, 4/15/19 | 2,000,000 |
| 2,009,150 |
|
| FNMA, 1.125%, 12/14/18 | 1,700,000 |
| 1,711,640 |
|
| FNMA, 1.375%, 1/28/19 | 1,400,000 |
| 1,419,093 |
|
| FNMA, 1.50%, 6/22/20 | 1,300,000 |
| 1,315,509 |
|
| FNMA, 1.875%, 12/28/20 | 700,000 |
| 718,878 |
|
| FNMA, 1.375%, 2/26/21 | 1,400,000 |
| 1,402,380 |
|
TOTAL U.S. GOVERNMENT AGENCY SECURITIES (Cost $9,567,436) | | 9,662,400 |
|
| TEMPORARY CASH INVESTMENTS — 4.2% | | |
| Repurchase Agreement, Fixed Income Clearing Corp., (collateralized by various U.S. Treasury obligations, 3.75%, 11/15/43, valued at $7,494,988), at 0.10%, dated 3/31/16, due 4/1/16 (Delivery value $7,347,020) | | 7,347,000 |
|
| SSgA U.S. Government Money Market Fund, Class N | 4,896,777 |
| 4,896,777 |
|
TOTAL TEMPORARY CASH INVESTMENTS (Cost $12,243,777) | | 12,243,777 |
|
TOTAL INVESTMENT SECURITIES — 104.7% (Cost $300,632,021) | | 301,958,327 |
|
| OTHER ASSETS AND LIABILITIES — (4.7)% | | (13,626,454) |
|
| TOTAL NET ASSETS — 100.0% | | $ | 288,331,873 |
|
|
| | | | | | | | |
| FUTURES CONTRACTS |
| Contracts Purchased | Expiration Date | Underlying Face
Amount at Value | Unrealized Appreciation
(Depreciation) |
| 253 | U.S. Treasury 2-Year Notes | June 2016 | $ | 55,343,750 |
| $ | 6,056 |
|
| | | | | |
| Contracts Sold | Expiration Date | Underlying Face
Amount at Value | Unrealized Appreciation
(Depreciation) |
| 28 | U.S. Treasury 5-Year Notes | June 2016 | $ | 3,392,594 |
| $ | (10,304 | ) |
|
| | | | | | | | | | |
| TOTAL RETURN SWAP AGREEMENTS |
| Counterparty | Notional
Amount | Floating Rate
Referenced Index | Pay/Receive
Total Return of Referenced Index | Fixed Rate | Termination
Date | Value |
| Bank of America N.A. | $ | 5,800,000 |
| U.S. CPI Urban Consumers NSA Index | Receive | 1.41% | 8/27/20 | $ | 25,129 |
|
|
| | |
| NOTES TO SCHEDULE OF INVESTMENTS |
| CPI | - | Consumer Price Index |
| FHLB | - | Federal Home Loan Bank |
| FHLMC | - | Federal Home Loan Mortgage Corporation |
| FNMA | - | Federal National Mortgage Association |
| GNMA | - | Government National Mortgage Association |
| NSA | - | Not Seasonally Adjusted |
| SEQ | - | Sequential Payer |
| VRN | - | Variable Rate Note. Interest reset date is indicated. Rate shown is effective at the period end. |
| |
| (1) | The rate indicated is the yield to maturity at purchase. |
| |
| (2) | Security, or a portion thereof, has been pledged at the custodian bank or with a broker for margin requirements on futures contracts. At the period end, the aggregate value of securities pledged was $159,446. |
| |
| (3) | Final maturity date indicated, unless otherwise noted. |
See Notes to Financial Statements.
|
|
| Statement of Assets and Liabilities |
|
| | | |
| MARCH 31, 2016 | |
| Assets | |
| Investment securities, at value (cost of $300,632,021) | $ | 301,958,327 |
|
| Receivable for investments sold | 79,839 |
|
| Receivable for capital shares sold | 38,713 |
|
| Receivable for variation margin on futures contracts | 13,640 |
|
| Swap agreements, at value | 25,129 |
|
| Interest receivable | 618,315 |
|
| | 302,733,963 |
|
| | |
| Liabilities | |
| Payable for investments purchased | 7,184,195 |
|
| Payable for capital shares redeemed | 7,079,048 |
|
| Accrued management fees | 127,997 |
|
| Distribution and service fees payable | 4,266 |
|
| Dividends payable | 6,584 |
|
| | 14,402,090 |
|
| | |
| Net Assets | $ | 288,331,873 |
|
| | |
| Net Assets Consist of: | |
| Capital paid in | $ | 288,568,724 |
|
| Distributions in excess of net investment income | (6,584 | ) |
| Accumulated net realized loss | (1,577,454 | ) |
| Net unrealized appreciation | 1,347,187 |
|
| | $ | 288,331,873 |
|
|
| | | | | |
| | Net Assets | Shares Outstanding | Net Asset Value Per Share |
| Investor Class |
| $229,689,280 |
| 23,785,511 | $9.66 |
| Institutional Class |
| $42,177,133 |
| 4,366,278 | $9.66 |
| A Class |
| $15,114,411 |
| 1,564,717 | $9.66* |
| C Class |
| $970,885 |
| 103,397 | $9.39 |
| R Class |
| $380,164 |
| 39,533 | $9.62 |
*Maximum offering price $9.88 (net asset value divided by 0.9775).
See Notes to Financial Statements.
|
| | | |
| YEAR ENDED MARCH 31, 2016 | |
| Investment Income (Loss) | |
| Income: | |
| Interest | $ | 2,743,298 |
|
| | |
| Expenses: | |
| Management fees | 1,524,199 |
|
| Distribution and service fees: | |
| A Class | 50,026 |
|
| C Class | 8,737 |
|
| R Class | 2,374 |
|
| Trustees' fees and expenses | 15,408 |
|
| Other expenses | 3,619 |
|
| | 1,604,363 |
|
| | |
| Net investment income (loss) | 1,138,935 |
|
| | |
| Realized and Unrealized Gain (Loss) | |
| Net realized gain (loss) on: | |
| Investment transactions | 350,661 |
|
| Futures contract transactions | 58,847 |
|
| | 409,508 |
|
| | |
| Change in net unrealized appreciation (depreciation) on: | |
| Investments | (388,640 | ) |
| Futures contracts | (15,632 | ) |
| Swap agreements | 25,129 |
|
| | (379,143 | ) |
| | |
| Net realized and unrealized gain (loss) | 30,365 |
|
| | |
| Net Increase (Decrease) in Net Assets Resulting from Operations | $ | 1,169,300 |
|
See Notes to Financial Statements.
|
|
| Statement of Changes in Net Assets |
|
| | | | | | |
| YEARS ENDED MARCH 31, 2016 AND MARCH 31, 2015 |
| Increase (Decrease) in Net Assets | March 31, 2016 | March 31, 2015 |
| Operations | | |
| Net investment income (loss) | $ | 1,138,935 |
| $ | 900,608 |
|
| Net realized gain (loss) | 409,508 |
| 317,499 |
|
| Change in net unrealized appreciation (depreciation) | (379,143 | ) | 1,126,139 |
|
| Net increase (decrease) in net assets resulting from operations | 1,169,300 |
| 2,344,246 |
|
| | | |
| Distributions to Shareholders | | |
| From net investment income: | | |
| Investor Class | (1,269,997 | ) | (1,250,884 | ) |
| Institutional Class | (266,261 | ) | (210,338 | ) |
| A Class | (57,157 | ) | (50,527 | ) |
| Decrease in net assets from distributions | (1,593,415 | ) | (1,511,749 | ) |
| | | |
| Capital Share Transactions | | |
| Net increase (decrease) in net assets from capital share transactions (Note 5) | (16,999,476 | ) | (46,666,397 | ) |
| | | |
| Net increase (decrease) in net assets | (17,423,591 | ) | (45,833,900 | ) |
| | | |
| Net Assets | | |
| Beginning of period | 305,755,464 |
| 351,589,364 |
|
| End of period | $ | 288,331,873 |
| $ | 305,755,464 |
|
| | | |
| Distributions in excess of net investment income | $ | (6,584 | ) | $ | (4,520 | ) |
See Notes to Financial Statements.
|
|
| Notes to Financial Statements |
MARCH 31, 2016
1. Organization
American Century Government Income Trust (the trust) is registered under the Investment Company Act of 1940, as amended (the 1940 Act), as an open-end management investment company and is organized as a Massachusetts business trust. Short-Term Government Fund (the fund) is one fund in a series issued by the trust. The fund’s investment objective is to seek high current income while maintaining safety of principal.
The fund offers the Investor Class, the Institutional Class, the A Class, the C Class and the R Class. The A Class may incur an initial sales charge. The A Class and C Class may be subject to a contingent deferred sales charge. The share classes differ principally in their respective sales charges and distribution and shareholder servicing expenses and arrangements. The Institutional Class is made available to institutional shareholders or through financial intermediaries whose clients do not require the same level of shareholder and administrative services as shareholders of other classes. As a result, the Institutional Class is charged a lower unified management fee.
2. Significant Accounting Policies
The following is a summary of significant accounting policies consistently followed by the fund in preparation of its financial statements. The fund is an investment company and follows accounting and reporting guidance in accordance with accounting principles generally accepted in the United States of America. This may require management to make certain estimates and assumptions at the date of the financial statements. Actual results could differ from these estimates. Management evaluated the impact of events or transactions occurring through the date the financial statements were issued that would merit recognition or disclosure.
Investment Valuations — The fund determines the fair value of its investments and computes its net asset value per share at the close of regular trading (usually 4 p.m. Eastern time) on the New York Stock Exchange (NYSE) on each day the NYSE is open. The Board of Trustees has adopted valuation policies and procedures to guide the investment advisor in the fund’s investment valuation process and to provide methodologies for the oversight of the fund’s pricing function.
Fixed income securities are valued at the evaluated mean as provided by independent pricing services or at the mean of the most recent bid and asked prices as provided by investment dealers. U.S. Treasury and Government Agency securities are valued using market models that consider trade data, quotations from dealers and active market makers, relevant yield curve and spread data, creditworthiness, trade data or market information on comparable securities, and other relevant security specific information. Mortgage-related and asset-backed securities are valued based on models that consider trade data, prepayment and default projections, benchmark yield and spread data and estimated cash flows of each tranche of the issuer.
Open-end management investment companies are valued at the reported net asset value per share. Repurchase agreements are valued at cost, which approximates fair value. Exchange-traded futures contracts are valued at the settlement price as provided by the appropriate clearing corporation. Swap agreements are valued at an evaluated price as provided by independent pricing services or independent brokers.
If the fund determines that the market price for an investment is not readily available or the valuation methods mentioned above do not reflect an investment’s fair value, such investment is valued as determined in good faith by the Board of Trustees or its delegate, in accordance with policies and procedures adopted by the Board of Trustees. In its determination of fair value, the fund may review several factors including, but not limited to, market information regarding the specific investment or comparable investments and correlation with other investment types, futures indices or general market indicators. Circumstances that may cause the fund to use these procedures to value an investment include, but are not limited to: an investment has been declared in default or is distressed; trading in a security has been suspended during the trading day or a security is not actively trading on its principal exchange; prices received from a regular pricing source are deemed unreliable; or there is a foreign market holiday and no trading occurred.
The fund monitors for significant events occurring after the close of an investment’s primary exchange but before the fund’s net asset value per share is determined. Significant events may include, but are not limited to: corporate announcements and transactions; governmental action and political unrest that could impact a
specific investment or an investment sector; or armed conflicts, natural disasters and similar events that could affect investments in a specific country or region.
Security Transactions — Security transactions are accounted for as of the trade date. Net realized gains and losses are determined on the identified cost basis, which is also used for federal income tax purposes.
Investment Income — Interest income is recorded on the accrual basis and includes paydown gain (loss) and accretion of discounts and amortization of premiums. Inflation adjustments related to inflation-linked debt securities are reflected as interest income.
Repurchase Agreements — The fund may enter into repurchase agreements with institutions that American Century Investment Management, Inc. (ACIM) (the investment advisor) has determined are creditworthy pursuant to criteria adopted by the Board of Trustees. The fund requires that the collateral, represented by securities, received in a repurchase transaction be transferred to the custodian in a manner sufficient to enable the fund to obtain those securities in the event of a default under the repurchase agreement. ACIM monitors, on a daily basis, the securities transferred to ensure the value, including accrued interest, of the securities under each repurchase agreement is equal to or greater than amounts owed to the fund under each repurchase agreement.
Joint Trading Account — Pursuant to an Exemptive Order issued by the Securities and Exchange Commission, the fund, along with certain other funds in the American Century Investments family of funds, may transfer uninvested cash balances into a joint trading account. These balances are invested in one or more repurchase agreements that are collateralized by U.S. Treasury or Agency obligations.
Segregated Assets — In accordance with the 1940 Act, the fund segregates assets on its books and records to cover certain types of investments, including, but not limited to, futures contracts, forward commitments, when-issued securities, swap agreements and certain forward foreign currency exchange contracts. ACIM monitors, on a daily basis, the securities segregated to ensure the fund designates a sufficient amount of liquid assets, marked-to-market daily. The fund may also receive assets or be required to pledge assets at the custodian bank or with a broker for margin requirements on futures contracts, forward commitments and swap agreements.
Income Tax Status — It is the fund’s policy to distribute substantially all net investment income and net realized gains to shareholders and to otherwise qualify as a regulated investment company under provisions of the Internal Revenue Code. Accordingly, no provision has been made for income taxes. The fund files U.S. federal, state, local and non-U.S. tax returns as applicable. The fund's tax returns are subject to examination by the relevant taxing authority until expiration of the applicable statute of limitations, which is generally three years from the date of filing but can be longer in certain jurisdictions. At this time, management believes there are no uncertain tax positions which, based on their technical merit, would not be sustained upon examination and for which it is reasonably possible that the total amounts of unrecognized tax benefits will significantly change in the next twelve months.
Multiple Class — All shares of the fund represent an equal pro rata interest in the net assets of the class to which such shares belong, and have identical voting, dividend, liquidation and other rights and the same terms and conditions, except for class specific expenses and exclusive rights to vote on matters affecting only individual classes. Income, non-class specific expenses, and realized and unrealized capital gains and losses of the fund are allocated to each class of shares based on their relative net assets.
Distributions to Shareholders — Distributions from net investment income, if any, are declared daily and paid monthly. Distributions from net realized gains, if any, are generally declared and paid annually.
Indemnifications — Under the trust’s organizational documents, its officers and trustees are indemnified against certain liabilities arising out of the performance of their duties to the fund. In addition, in the normal course of business, the fund enters into contracts that provide general indemnifications. The maximum exposure under these arrangements is unknown as this would involve future claims that may be made against a fund. The risk of material loss from such claims is considered by management to be remote.
3. Fees and Transactions with Related Parties
Certain officers and trustees of the trust are also officers and/or directors of American Century Companies, Inc. (ACC). The trust's investment advisor, ACIM, the trust's distributor, American Century Investment Services, Inc. (ACIS), and the trust's transfer agent, American Century Services, LLC, are wholly owned, directly or indirectly, by ACC.
Management Fees — The trust has entered into a management agreement with ACIM, under which ACIM provides the fund with investment advisory and management services in exchange for a single, unified management fee (the fee) per class. The agreement provides that all expenses of managing and operating the fund, except distribution and service fees, brokerage expenses, taxes, interest, fees and expenses of the independent trustees (including legal counsel fees), and extraordinary expenses, will be paid by ACIM. The fee is computed and accrued daily based on each class’s daily net assets and paid monthly in arrears. The fee consists of (1) an Investment Category Fee based on the daily net assets of the fund and certain other accounts managed by the investment advisor that are in the same broad investment category as the fund and (2) a Complex Fee based on the assets of all the funds in the American Century Investments family of funds. The rates for the Investment Category Fee range from 0.2425% to 0.3600%. The rates for the Complex Fee range from 0.2500% to 0.3100% for the Investor Class, A Class, C Class and R Class. The rates for the Complex Fee range from 0.0500% to 0.1100% for the Institutional Class. The effective annual management fee for each class for the year ended March 31, 2016 was 0.54% for the Investor Class, A Class, C Class and R Class and 0.34% for the Institutional Class.
Distribution and Service Fees — The Board of Trustees has adopted a separate Master Distribution and Individual Shareholder Services Plan for each of the A Class, C Class and R Class (collectively the plans), pursuant to Rule 12b-1 of the 1940 Act. The plans provide that the A Class will pay ACIS an annual distribution and service fee of 0.25%. The plans provide that the C Class will pay ACIS an annual distribution and service fee of 1.00%, of which 0.25% is paid for individual shareholder services and 0.75% is paid for distribution services. The plans provide that the R Class will pay ACIS an annual distribution and service fee of 0.50%. The fees are computed and accrued daily based on each class’s daily net assets and paid monthly in arrears. The fees are used to pay financial intermediaries for distribution and individual shareholder services. Fees incurred under the plans during the year ended March 31, 2016 are detailed in the Statement of Operations.
Trustees’ Fees and Expenses — The Board of Trustees is responsible for overseeing the investment advisor’s management and operations of the fund. The trustees receive detailed information about the fund and its investment advisor regularly throughout the year, and meet at least quarterly with management of the investment advisor to review reports about fund operations. The fund’s officers do not receive compensation from the fund.
4. Investment Transactions
Purchases and sales of investment securities, excluding short-term investments, for the year ended March 31, 2016 were $275,853,032 and $293,831,847, respectively, all of which are U.S. Treasury and Government Agency obligations.
5. Capital Share Transactions
Transactions in shares of the fund were as follows (unlimited number of shares authorized):
|
| | | | | | | | | | |
| | Year ended
March 31, 2016 | Year ended
March 31, 2015 |
| | Shares | Amount | Shares | Amount |
| Investor Class | | | | |
| Sold | 8,201,587 |
| $ | 79,085,593 |
| 3,369,180 |
| $ | 32,533,028 |
|
| Issued in reinvestment of distributions | 125,001 |
| 1,205,877 |
| 124,173 |
| 1,199,051 |
|
| Redeemed | (9,071,946 | ) | (87,490,522 | ) | (6,616,761 | ) | (63,868,545 | ) |
| | (745,358 | ) | (7,199,052 | ) | (3,123,408 | ) | (30,136,466 | ) |
| Institutional Class | | | | |
| Sold | 3,354,641 |
| 32,303,236 |
| 3,397,705 |
| 32,822,603 |
|
| Issued in reinvestment of distributions | 27,584 |
| 266,250 |
| 21,364 |
| 206,394 |
|
| Redeemed | (3,182,583 | ) | (30,700,709 | ) | (4,746,283 | ) | (45,857,107 | ) |
| | 199,642 |
| 1,868,777 |
| (1,327,214 | ) | (12,828,110 | ) |
| A Class | | | | |
| Sold | 839,669 |
| 8,105,818 |
| 859,115 |
| 8,290,230 |
|
| Issued in reinvestment of distributions | 5,331 |
| 51,449 |
| 4,996 |
| 48,251 |
|
| Redeemed | (2,084,176 | ) | (20,090,822 | ) | (1,248,961 | ) | (12,057,909 | ) |
| | (1,239,176 | ) | (11,933,555 | ) | (384,850 | ) | (3,719,428 | ) |
| C Class | | | | |
| Sold | 59,136 |
| 555,103 |
| 98,967 |
| 936,864 |
|
| Redeemed | (42,500 | ) | (398,835 | ) | (113,270 | ) | (1,071,521 | ) |
| | 16,636 |
| 156,268 |
| (14,303 | ) | (134,657 | ) |
| R Class | | | | |
| Sold | 54,610 |
| 524,565 |
| 16,557 |
| 159,043 |
|
| Redeemed | (43,383 | ) | (416,479 | ) | (706 | ) | (6,779 | ) |
| | 11,227 |
| 108,086 |
| 15,851 |
| 152,264 |
|
| Net increase (decrease) | (1,757,029 | ) | $ | (16,999,476 | ) | (4,833,924 | ) | $ | (46,666,397 | ) |
6. Fair Value Measurements
The fund’s investments valuation process is based on several considerations and may use multiple inputs to determine the fair value of the investments held by the fund. In conformity with accounting principles generally accepted in the United States of America, the inputs used to determine a valuation are classified into three broad levels.
| |
| • | Level 1 valuation inputs consist of unadjusted quoted prices in an active market for identical investments. |
| |
| • | Level 2 valuation inputs consist of direct or indirect observable market data (including quoted prices for comparable investments, evaluations of subsequent market events, interest rates, prepayment speeds, credit risk, etc.). These inputs also consist of quoted prices for identical investments initially expressed in local currencies that are adjusted through translation into U.S. dollars. |
| |
| • | Level 3 valuation inputs consist of unobservable data (including a fund’s own assumptions). |
The level classification is based on the lowest level input that is significant to the fair valuation measurement. The valuation inputs are not necessarily an indication of the risks associated with investing in these securities or other financial instruments. There were no significant transfers between levels during the period.
The following is a summary of the level classifications as of period end. The Schedule of Investments provides additional information on the fund’s portfolio holdings.
|
| | | | | | | | |
| | Level 1 | Level 2 | Level 3 |
| Assets | | | |
| Investment Securities | | | |
| U.S. Treasury Securities | — |
| $ | 194,268,033 |
| — |
|
| Collateralized Mortgage Obligations | — |
| 62,745,029 |
| — |
|
| U.S. Government Agency Mortgage-Backed Securities | — |
| 23,039,088 |
| — |
|
| U.S. Government Agency Securities | — |
| 9,662,400 |
| — |
|
| Temporary Cash Investments | $ | 4,896,777 |
| 7,347,000 |
| — |
|
| | $ | 4,896,777 |
| $ | 297,061,550 |
| — |
|
| Other Financial Instruments | | | |
| Futures Contracts | $ | 6,056 |
| — |
| — |
|
| Swap Agreements | — |
| $ | 25,129 |
| — |
|
| | $ | 6,056 |
| $ | 25,129 |
| — |
|
| | | | |
| Liabilities | | | |
| Other Financial Instruments | | | |
| Futures Contracts | $ | 10,304 |
| — |
| — |
|
7. Derivative Instruments
Interest Rate Risk — The fund is subject to interest rate risk in the normal course of pursuing its investment objectives. The value of bonds generally declines as interest rates rise. A fund may enter into futures contracts based on a bond index or a specific underlying security. A fund may purchase futures contracts to gain exposure to increases in market value or sell futures contracts to protect against a decline in market value. Upon entering into a futures contract, a fund will segregate cash, cash equivalents or other appropriate liquid securities on its records in amounts sufficient to meet requirements. Subsequent payments (variation margin) are made or received daily, in cash, by a fund. The variation margin is equal to the daily change in the contract value and is recorded as unrealized gains and losses. A fund recognizes a realized gain or loss when the futures contract is closed or expires. Net realized and unrealized gains or losses occurring during the holding period of futures contracts are a component of net realized gain (loss) on futures contract transactions and change in net unrealized appreciation (depreciation) on futures contracts, respectively. One of the risks of entering into futures contracts is the possibility that the change in value of the contract may not correlate with the changes in value of the underlying securities. The fund's average exposure to interest rate risk derivative instruments held during the period was 230 contracts.
Other Contracts — A fund may enter into total return swap agreements in order to attempt to obtain or preserve a particular return or spread at a lower cost than obtaining a return or spread through purchases and/or sales of instruments in other markets or gain exposure to certain markets in the most economical way possible. A fund will segregate cash, cash equivalents or other appropriate liquid securities on its records in amounts sufficient to meet requirements. Changes in value, including the periodic amounts of interest to be paid or received on swap agreements, are recorded as unrealized appreciation (depreciation) on swap agreements. Realized gain or loss is recorded upon receipt or payment of a periodic settlement or termination of swap agreements. Net realized and unrealized gains or losses occurring during the holding period of swap agreements are a component of net realized gain (loss) on swap agreement transactions and change in net unrealized appreciation (depreciation) on swap agreements, respectively. The risks of entering into swap agreements include the possible lack of liquidity, failure of the counterparty to meet its obligations, and that there may be unfavorable changes in the underlying investments or instruments, including inflationary risk. The fund's average notional amount held during the period was $5,800,000.
Value of Derivative Instruments as of March 31, 2016
|
| | | | | | | | |
| | Asset Derivatives | Liability Derivatives |
| Type of Risk Exposure | Location on Statement of Assets and Liabilities | Value | Location on Statement of Assets and Liabilities | Value |
| Interest Rate Risk | Receivable for variation margin on futures contracts* | $ | 13,640 |
| Payable for variation margin on futures contracts* | — |
|
| Other Contracts | Swap agreements | 25,129 |
| Swap agreements | — |
|
| | | $ | 38,769 |
| | — |
|
| | | | | |
| * Included in the unrealized appreciation (depreciation) on futures contracts as reported in the Schedule of Investments. |
| | | | | |
| Effect of Derivative Instruments on the Statement of Operations for the Year Ended March 31, 2016 |
| | Net Realized Gain (Loss) | Change in Net Unrealized Appreciation (Depreciation) |
| Type of Risk Exposure | Location on Statement of Operations | Value | Location on Statement of Operations | Value |
| Interest Rate Risk | Net realized gain (loss) on futures contract transactions | $ | 58,847 |
| Change in net unrealized appreciation (depreciation) on futures contracts | $ | (15,632 | ) |
| Other Contracts | Net realized gain (loss) on swap agreement transactions | — |
| Change in net unrealized appreciation (depreciation) on swap agreements | 25,129 |
|
| | | $ | 58,847 |
| | $ | 9,497 |
|
8. Federal Tax Information
The tax character of distributions paid during the years ended March 31, 2016 and March 31, 2015 were as follows:
|
| | | | | | |
| | 2016 | 2015 |
| Distributions Paid From | | |
| Ordinary income | $ | 1,593,415 |
| $ | 1,511,749 |
|
| Long-term capital gains | — |
| — |
|
The book-basis character of distributions made during the year from net investment income or net realized gains may differ from their ultimate characterization for federal income tax purposes. These differences reflect the differing character of certain income items and net realized gains and losses for financial statement and tax purposes, and may result in reclassification among certain capital accounts on the financial statements.
As of March 31, 2016, the federal tax cost of investments and the components of distributable earnings on a tax-basis were as follows:
|
| | | |
| Federal tax cost of investments | $ | 300,712,552 |
|
| Gross tax appreciation of investments | $ | 1,467,778 |
|
| Gross tax depreciation of investments | (222,003 | ) |
| Net tax appreciation (depreciation) of investments | 1,245,775 |
|
| Net tax appreciation (depreciation) on derivatives | 25,129 |
|
| Net tax appreciation (depreciation) | $ | 1,270,904 |
|
| Other book-to-tax adjustments | $ | (55,396 | ) |
| Undistributed ordinary income | — |
|
| Accumulated short-term capital losses | $ | (757,000 | ) |
| Accumulated long-term capital losses | $ | (695,359 | ) |
The difference between book-basis and tax-basis unrealized appreciation (depreciation) is attributable primarily to the tax deferral of losses on wash sales. Other book-to-tax adjustments are attributable primarily to the tax deferral of losses on straddle positions.
Accumulated capital losses represent net capital loss carryovers that may be used to offset future realized capital gains for federal income tax purposes. The capital loss carryovers may be carried forward for an unlimited period. Future capital loss carryover utilization in any given year may be subject to Internal Revenue Code limitations.
|
| | | | | | | | | | | | | | | |
| For a Share Outstanding Throughout the Years Ended March 31 (except as noted) | | | | | | | |
| Per-Share Data | | | | | | | | | Ratios and Supplemental Data | |
| | | Income From Investment Operations: | Distributions From: | | | Ratio to Average Net Assets of: | | |
| | Net Asset
Value,
Beginning
of Period | Net
Investment
Income
(Loss)(1) | Net
Realized
and
Unrealized
Gain (Loss) | Total From
Investment
Operations | Net
Investment
Income | Net
Realized
Gains | Total
Distributions | Net Asset
Value, End
of Period | Total
Return(2) | Operating
Expenses | Net
Investment
Income
(Loss) | Portfolio
Turnover
Rate | Net Assets, End of Period
(in thousands) |
| Investor Class | | | | | | | | | | | | |
| 2016 | $9.67 | 0.04 | —(3) | 0.04 | (0.05) | — | (0.05) | $9.66 | 0.44% | 0.55% | 0.39% | 99% |
| $229,689 |
|
| 2015 | $9.65 | 0.03 | 0.04 | 0.07 | (0.05) | — | (0.05) | $9.67 | 0.71% | 0.55% | 0.30% | 76% |
| $237,231 |
|
| 2014 | $9.71 | —(3) | (0.03) | (0.03) | (0.03) | — | (0.03) | $9.65 | (0.35)% | 0.55% | 0.05% | 103% |
| $266,755 |
|
| 2013 | $9.76 | 0.01 | 0.03 | 0.04 | (0.03) | (0.06) | (0.09) | $9.71 | 0.33% | 0.55% | 0.11% | 77% |
| $346,147 |
|
| 2012 | $9.73 | 0.05 | 0.10 | 0.15 | (0.06) | (0.06) | (0.12) | $9.76 | 1.59% | 0.56% | 0.51% | 139% |
| $475,832 |
|
| Institutional Class | | | | | | | | | | | | |
| 2016 | $9.67 | 0.06 | —(3) | 0.06 | (0.07) | — | (0.07) | $9.66 | 0.64% | 0.35% | 0.59% | 99% |
| $42,177 |
|
| 2015 | $9.65 | 0.05 | 0.04 | 0.09 | (0.07) | — | (0.07) | $9.67 | 0.91% | 0.35% | 0.50% | 76% |
| $40,312 |
|
| 2014 | $9.72 | 0.02 | (0.04) | (0.02) | (0.05) | — | (0.05) | $9.65 | (0.25)% | 0.35% | 0.25% | 103% |
| $53,011 |
|
| 2013 | $9.76 | 0.04 | 0.03 | 0.07 | (0.05) | (0.06) | (0.11) | $9.72 | 0.64% | 0.35% | 0.31% | 77% |
| $48,242 |
|
| 2012 | $9.73 | 0.04 | 0.13 | 0.17 | (0.08) | (0.06) | (0.14) | $9.76 | 1.79% | 0.36% | 0.71% | 139% |
| $333,284 |
|
| A Class | | | | | | | | | | | | |
| 2016 | $9.67 | 0.01 | 0.01 | 0.02 | (0.03) | — | (0.03) | $9.66 | 0.19% | 0.80% | 0.14% | 99% |
| $15,114 |
|
| 2015 | $9.64 | —(3) | 0.05 | 0.05 | (0.02) | — | (0.02) | $9.67 | 0.50% | 0.80% | 0.05% | 76% |
| $27,121 |
|
| 2014 | $9.71 | (0.02) | (0.05) | (0.07) | — | — | — | $9.64 | (0.72)% | 0.80% | (0.20)% | 103% |
| $30,747 |
|
| 2013 | $9.76 | (0.02) | 0.04 | 0.02 | (0.01) | (0.06) | (0.07) | $9.71 | 0.14% | 0.80% | (0.14)% | 77% |
| $38,902 |
|
| 2012 | $9.73 | 0.02 | 0.11 | 0.13 | (0.04) | (0.06) | (0.10) | $9.76 | 1.33% | 0.81% | 0.26% | 139% |
| $63,497 |
|
|
| | | | | | | | | | | | | | | |
| For a Share Outstanding Throughout the Years Ended March 31 (except as noted) | | | | | | | |
| Per-Share Data | | | | | | | | | Ratios and Supplemental Data | |
| | | Income From Investment Operations: | Distributions From: | | | Ratio to Average Net Assets of: | | |
| | Net Asset
Value,
Beginning
of Period | Net
Investment
Income
(Loss)(1) | Net
Realized
and
Unrealized
Gain (Loss) | Total From
Investment
Operations | Net
Investment
Income | Net
Realized
Gains | Total
Distributions | Net Asset
Value, End
of Period | Total
Return(2) | Operating
Expenses | Net
Investment
Income
(Loss) | Portfolio
Turnover
Rate | Net Assets, End of Period
(in thousands) |
| C Class | | | | | | | | | | | | |
| 2016 | $9.45 | (0.06) | —(3) | (0.06) | — | — | — | $9.39 | (0.63)% | 1.55% | (0.61)% | 99% |
| $971 |
|
| 2015 | $9.47 | (0.07) | 0.05 | (0.02) | — | — | — | $9.45 | (0.21)% | 1.55% | (0.70)% | 76% |
| $820 |
|
| 2014 | $9.61 | (0.09) | (0.05) | (0.14) | — | — | — | $9.47 | (1.46)% | 1.55% | (0.95)% | 103% |
| $957 |
|
| 2013 | $9.72 | (0.09) | 0.04 | (0.05) | — | (0.06) | (0.06) | $9.61 | (0.55)% | 1.55% | (0.89)% | 77% |
| $3,322 |
|
| 2012 | $9.73 | (0.06) | 0.11 | 0.05 | — | (0.06) | (0.06) | $9.72 | 0.55% | 1.56% | (0.49)% | 139% |
| $3,691 |
|
| R Class | | | | | | | | | | | | |
| 2016 | $9.63 | (0.01) | —(3) | (0.01) | — | — | — | $9.62 | (0.10)% | 1.05% | (0.11)% | 99% |
| $380 |
|
| 2015 | $9.60 | (0.02) | 0.05 | 0.03 | — | — | — | $9.63 | 0.31% | 1.05% | (0.20)% | 76% |
| $272 |
|
| 2014 | $9.69 | (0.04) | (0.05) | (0.09) | — | — | — | $9.60 | (0.93)% | 1.05% | (0.45)% | 103% |
| $120 |
|
| 2013 | $9.76 | (0.03) | 0.02 | (0.01) | —(3) | (0.06) | (0.06) | $9.69 | (0.14)% | 1.05% | (0.39)% | 77% |
| $173 |
|
| 2012 | $9.73 | (0.01) | 0.12 | 0.11 | (0.02) | (0.06) | (0.08) | $9.76 | 1.15% | 1.06% | 0.01% | 139% |
| $345 |
|
|
| |
| Notes to Financial Highlights |
| |
| (1) | Computed using average shares outstanding throughout the period. |
| |
| (2) | Total returns are calculated based on the net asset value of the last business day and do not reflect applicable sales charges, if any. Total returns for periods less than one year are not annualized. |
| |
| (3) | Per-share amount was less than $0.005. |
See Notes to Financial Statements.
|
|
| Report of Independent Registered Public Accounting Firm |
To the Trustees of the American Century Government Income Trust and Shareholders of the
Short-Term Government Fund:
In our opinion, the accompanying statement of assets and liabilities, including the schedule of investments, and the related statements of operations and of changes in net assets and the financial highlights present fairly, in all material respects, the financial position of the Short-Term Government Fund (one of the five funds comprising the American Century Government Income Trust, hereafter referred to as the “Fund”) at March 31, 2016, the results of its operations for the year then ended, the changes in its net assets for each of the two years in the period then ended and the financial highlights for each of the five years in the period then ended, in conformity with accounting principles generally accepted in the United States of America. These financial statements and financial highlights (hereafter referred to as "financial statements") are the responsibility of the Fund's management. Our responsibility is to express an opinion on these financial statements based on our audits. We conducted our audits of these financial statements in accordance with the standards of the Public Company Accounting Oversight Board (United States). Those standards require that we plan and perform the audit to obtain reasonable assurance about whether the financial statements are free of material misstatement. An audit includes examining, on a test basis, evidence supporting the amounts and disclosures in the financial statements, assessing the accounting principles used and significant estimates made by management, and evaluating the overall financial statement presentation. We believe that our audits, which included confirmation of securities at March 31, 2016 by correspondence with the custodian and brokers, provide a reasonable basis for our opinion.
PricewaterhouseCoopers LLP
Kansas City, Missouri
May 18, 2016
Board of Trustees
The individuals listed below serve as trustees of the funds. Each trustee will continue to serve in this capacity until death, retirement, resignation or removal from office. The board has adopted a mandatory retirement age for trustees who are not “interested persons,” as that term is defined in the Investment Company Act (independent trustees). Independent trustees shall retire on December 31 of the year in which they reach their 75th birthday; provided, however, that on or after January 1, 2022, independent trustees shall retire on December 31 of the year in which they reach their 76th birthday.
Mr. Thomas is an “interested person” because he currently serves as President and Chief Executive Officer of American Century Companies, Inc. (ACC), the parent company of American Century Investment Management, Inc. (ACIM or the advisor). The other trustees (more than three-fourths of the total number) are independent. They are not employees, directors or officers of, and have no financial interest in, ACC or any of its wholly owned, direct or indirect, subsidiaries, including ACIM, American Century Investment Services, Inc. (ACIS) and American Century Services, LLC (ACS), and they do not have any other affiliations, positions or relationships that would cause them to be considered “interested persons” under the Investment Company Act. The trustees serve in this capacity for eight (in the case of Mr. Thomas, 15) registered investment companies in the American Century Investments family of funds.
The following table presents additional information about the trustees. The mailing address for each trustee other than Mr. Thomas is 1665 Charleston Road, Mountain View, California 94043. The mailing address for Mr. Thomas is 4500 Main Street, Kansas City, Missouri 64111.
|
| | | | | |
Name (Year of Birth) | Position(s) Held with Funds | Length of Time Served | Principal Occupation(s) During Past 5 Years | Number of American Century Portfolios Overseen by Trustee | Other Directorships Held During Past 5 Years |
| Independent Trustees |
Tanya S. Beder (1955) | Trustee | Since 2011 | Chairman and CEO, SBCC Group Inc. (independent advisory services) (2006 to present) | 45 | CYS Investments, Inc. (NYSE mortgage arbitrage REIT) |
Jeremy I. Bulow (1954) | Trustee | Since 2011 | Professor of Economics, Stanford University, Graduate School of Business (1979 to present) | 45 | None |
Anne Casscells (1958) | Advisory Board Member | Since 2016 | Co-Chief Executive Officer and Chief Investment Officer, Aetos Alternatives Management (investment advisory firm) (2001 to present); Lecturer in Accounting, Stanford University, Graduate School of Business (2009 to present) | 45 | None |
Ronald J. Gilson (1946) | Trustee and Chairman of the Board | Since 1995 (Chairman since 2005) | Charles J. Meyers Professor of Law and Business, Stanford Law School (1979 to present); Marc and Eva Stern Professor of Law and Business, Columbia University School of Law (1992 to present) | 45 | None |
|
| | | | | |
Name (Year of Birth) | Position(s) Held with Funds | Length of Time Served | Principal Occupation(s) During Past 5 Years | Number of American Century Portfolios Overseen by Trustee | Other Directorships Held During Past 5 Years |
| Independent Trustees |
Frederick L. A. Grauer (1946) | Trustee | Since 2008 | Senior Advisor, iShares by BlackRock, Inc. (investment management firm) (2010 to 2011, 2013 to present); Senior Advisor, Course Hero (an educational technology company) (2015 to present) | 45 | None |
Jonathan D. Levin (1972) | Advisory Board Member | Since 2016 | Holbrook Working Professor of Price Theory, Standford University, (2000 to present); Chair, Department of Economics, Stanford University (2011 to 2014) | 45 | None |
Peter F. Pervere (1947) | Trustee | Since 2007 | Retired | 45 | None |
John B. Shoven (1947) | Trustee | Since 2002 | Charles R. Schwab Professor of Economics, Stanford University (1973 to present) | 45 | Cadence Design Systems; Exponent; Financial Engines |
| Interested Trustee |
Jonathan S. Thomas (1963) | Trustee and President | Since 2007 | President and Chief Executive Officer, ACC (March 2007 to present). Also serves as Chief Executive Officer, ACS; Executive Vice President, ACIM; Director, ACC, ACIM and other ACC subsidiaries | 128 | BioMed Valley Discoveries, Inc. |
The Statement of Additional Information has additional information about the fund's trustees and is available without charge, upon request, by calling 1-800-345-2021.
Officers
The following table presents certain information about the executive officers of the funds. Each officer serves as an officer for each of the 15 investment companies in the American Century family of funds, unless otherwise noted. No officer is compensated for his or her service as an officer of the funds. The listed officers are interested persons of the funds and are appointed or re-appointed on an annual basis. The mailing address for each of the officers listed below is 4500 Main Street, Kansas City, Missouri 64111.
|
| | |
| Name (Year of Birth) | Offices with the Funds | Principal Occupation(s) During the Past Five Years |
Jonathan S. Thomas (1963) | Trustee and President since 2007 | President and Chief Executive Officer, ACC (March 2007 to present). Also serves as Chief Executive Officer, ACS; Executive Vice President, ACIM; Director, ACC, ACIM and other ACC subsidiaries |
Amy D. Shelton (1964) | Chief Compliance Officer and Vice President since 2014 | Chief Compliance Officer, American Century funds, (March 2014 to present); Chief Compliance Officer, ACIM (February 2014 to present); Chief Compliance Officer, ACIS (October 2009 to present); Vice President, Client Interactions and Marketing, ACIS (February 2013 to January 2014); Director, Client Interactions and Marketing, ACIS (June 2007 to January 2013). Also serves as Vice President, ACIS |
Charles A. Etherington (1957) | General Counsel since 2007 and Senior Vice President since 2006 | Attorney, ACC (February 1994 to present); Vice President, ACC (November 2005 to present); General Counsel, ACC (March 2007 to present). Also serves as General Counsel, ACIM, ACS, ACIS and other ACC subsidiaries; and Senior Vice President, ACIM and ACS |
C. Jean Wade (1964) | Vice President, Treasurer and Chief Financial Officer since 2012 | Vice President, ACS (February 2000 to present) |
Robert J. Leach (1966) | Vice President since 2006 and Assistant Treasurer since 2012 | Vice President, ACS (February 2000 to present) |
David H. Reinmiller (1963) | Vice President since 2001 | Attorney, ACC (January 1994 to present); Associate General Counsel, ACC (January 2001 to present). Also serves as Vice President, ACIM and ACS |
Ward D. Stauffer (1960) | Secretary since 2005 | Attorney, ACC (June 2003 to present) |
Retirement Account Information
As required by law, distributions you receive from certain IRAs are subject to federal income tax withholding, unless you elect not to have withholding apply. Tax will be withheld on the total amount withdrawn even though you may be receiving amounts that are not subject to withholding, such as nondeductible contributions. In such case, excess amounts of withholding could occur. You may adjust your withholding election so that a greater or lesser amount will be withheld.
If you don’t want us to withhold on this amount, you must notify us to not withhold the federal income tax. You may notify us in writing or in certain situations by telephone or through other electronic means. For systematic withdrawals, your withholding election will remain in effect until revoked or changed by filing a new election. You have the right to revoke your election at any time.
Remember, even if you elect not to have income tax withheld, you are liable for paying income tax on the taxable portion of your withdrawal. If you elect not to have income tax withheld or you don’t have enough income tax withheld, you may be responsible for payment of estimated tax. You may incur penalties under the estimated tax rules if your withholding and estimated tax payments are not sufficient. You can reduce or defer the income tax on a distribution by directly or indirectly rolling such distribution over to another IRA or eligible plan. You should consult your tax advisor for additional information.
State tax will be withheld if, at the time of your distribution, your address is within one of the mandatory withholding states and you have federal income tax withheld (or as otherwise required by state law). State taxes will be withheld from your distribution in accordance with the respective state rules.
Distributions you receive from 403(b), 457 and qualified plans are subject to special tax and withholding rules. Your plan administrator or plan sponsor is required to provide you with a special tax notice explaining those rules at the time you request a distribution. If applicable, federal and/or state taxes may be withheld from your distribution amount.
Proxy Voting Policies
Descriptions of the principles and policies that the fund's investment advisor uses in exercising the voting rights associated with the securities purchased and/or held by the fund are available without charge, upon request, by calling 1-800-345-2021 or visiting the "About Us" page of American Century Investments’ website at americancentury.com. A description of the policies is also available on the Securities and Exchange Commission’s website at sec.gov. Information regarding how the investment advisor voted proxies relating to portfolio securities during the most recent 12-month period ended June 30 is available on the "About Us" page at americancentury.com. It is also available at sec.gov.
Quarterly Portfolio Disclosure
The fund files its complete schedule of portfolio holdings with the Securities and Exchange Commission (SEC) for the first and third quarters of each fiscal year on Form N-Q. The fund’s Forms N-Q are available on the SEC’s website at sec.gov, and may be reviewed and copied at the SEC’s Public Reference Room in Washington, DC. Information on the operation of the Public Reference Room may be obtained by calling 1-800-SEC-0330. The fund also makes its complete schedule of portfolio holdings for the most recent quarter of its fiscal year available on its
website at americancentury.com and, upon request, by calling 1-800-345-2021.
|
| | |
| |
| | | |
| Contact Us | americancentury.com | |
| Automated Information Line | 1-800-345-8765 | |
| Investor Services Representative | 1-800-345-2021 or 816-531-5575 | |
| Investors Using Advisors | 1-800-378-9878 | |
| Business, Not-For-Profit, Employer-Sponsored Retirement Plans | 1-800-345-3533 | |
| Banks and Trust Companies, Broker-Dealers, Financial Professionals, Insurance Companies | 1-800-345-6488 | |
| Telecommunications Relay Service for the Deaf | 711 | |
| | | |
| American Century Government Income Trust | |
| | | |
Investment Advisor: American Century Investment Management, Inc. Kansas City, Missouri | |
| | | |
| This report and the statements it contains are submitted for the general information of our shareholders. The report is not authorized for distribution to prospective investors unless preceded or accompanied by an effective prospectus. | |
| | | |
©2016 American Century Proprietary Holdings, Inc. All rights reserved.
CL-ANN-88875 1605
| |
ITEM 2. CODE OF ETHICS.
| |
| (a) | The registrant has adopted a Code of Ethics for Senior Financial Officers that applies to the registrant’s principal executive officer, principal financial officer, principal accounting officer, and persons performing similar functions. |
| |
| (f) | The registrant’s Code of Ethics for Senior Financial Officers was filed as Exhibit 12 (a)(1) to American Century Asset Allocation Portfolios, Inc.’s Annual Certified Shareholder Report on Form N-CSR, File No. 811-21591, on September 29, 2005, and is incorporated herein by reference. |
ITEM 3. AUDIT COMMITTEE FINANCIAL EXPERT.
| |
| (a)(1) | The registrant's board has determined that the registrant has at least one audit committee financial expert serving on its audit committee. |
| |
| (a)(2) | Tanya S. Beder, Peter F. Pervere and Ronald J. Gilson are the registrant's designated audit committee financial experts. They are "independent" as defined in Item 3 of Form N-CSR. |
ITEM 4. PRINCIPAL ACCOUNTANT FEES AND SERVICES.
The aggregate fees billed for each of the last two fiscal years for professional services rendered by the principal accountant for the audit of the registrant’s annual financial statements or services that are normally provided by the accountant in connection with statutory and regulatory filings or engagements for those fiscal years were as follows:
FY 2015: $144,254
FY 2016: $147,115
The aggregate fees billed in each of the last two fiscal years for assurance and related services by the principal accountant that are reasonably related to the performance of the audit of the registrant’s financial statements and are not reported under paragraph (a) of this Item were as follows:
For services rendered to the registrant:
FY 2015: $0
FY 2016: $0
Fees required to be approved pursuant to paragraph (c)(7)(ii) of Rule 2-01 of Regulation S-X (relating to certain engagements for non-audit services with the registrant’s investment adviser and its affiliates):
FY 2015: $0
FY 2016: $0
(c)Tax Fees.
The aggregate fees billed in each of the last two fiscal years for professional services rendered by the principal accountant for tax compliance, tax advice, and tax planning were as follows:
For services rendered to the registrant:
FY 2015: $0
FY 2016: $0
Fees required to be approved pursuant to paragraph (c)(7)(ii) of Rule 2-01 of Regulation S-X (relating to certain engagements for non-audit services with the registrant’s investment adviser and its affiliates):
FY 2015: $0
FY 2016: $0
(d)All Other Fees.
The aggregate fees billed in each of the last two fiscal years for products and services provided by the principal accountant, other than the services reported in paragraphs (a) through (c) of this Item were as follows:
For services rendered to the registrant:
FY 2015: $0
FY 2016: $0
Fees required to be approved pursuant to paragraph (c)(7)(ii) of Rule 2-01 of Regulation S-X (relating to certain engagements for non-audit services with the registrant’s investment adviser and its affiliates):
FY 2015: $0
FY 2016: $0
(e)(1)In accordance with paragraph (c)(7)(i)(A) of Rule 2-01 of Regulation S-X, before the accountant is engaged by the registrant to render audit or non-audit services, the engagement is approved by the registrant’s audit committee. Pursuant to paragraph (c)(7)(ii) of Rule 2-01 of Regulation S-X, the registrant’s audit committee also pre-approves its accountant’s engagements for non-audit services with the registrant’s investment adviser, its parent company, and any entity controlled by, or under common control with the investment adviser that provides ongoing services to the registrant, if the engagement relates directly to the operations and financial reporting of the registrant.
| |
| (e)(2) | All services described in each of paragraphs (b) through (d) of this Item were pre-approved before the engagement by the registrant’s audit committee pursuant to paragraph (c)(7)(i)(A) of Rule 2-01 of Regulation S-X. Consequently, none of such services were required to be approved by the audit committee pursuant to paragraph (c)(7)(i)(C). |
| |
| (f) | The percentage of hours expended on the principal accountant’s engagement to audit the registrant’s financial statements for the most recent fiscal year that were attributed to work performed by persons other than the principal accountant’s full-time, permanent employees was less than 50%. |
| |
| (g) | The aggregate non-audit fees billed by the registrant’s accountant for services rendered to the registrant, and rendered to the registrant’s investment adviser (not including any sub-adviser whose role is primarily portfolio management and is subcontracted with or overseen by another investment adviser), and any entity controlling, controlled by, or under common control with the adviser that provides ongoing services to the registrant for each of the last two fiscal years of the registrant were as follows: |
FY 2015: $317,494
FY 2016: $167,395
| |
| (h) | The registrant’s investment adviser and accountant have notified the registrant’s audit committee of all non-audit services that were rendered by the registrant’s accountant to the registrant’s investment adviser, its parent company, and any entity controlled by, or under common control with the investment adviser that provides services to the registrant, which services were not required to be pre-approved pursuant to paragraph (c)(7)(ii) of Rule 2-01 of Regulation S-X. The notification provided to the registrant’s audit committee included sufficient details regarding such services to allow the registrant’s audit committee to consider the continuing independence of its principal accountant. |
ITEM 5. AUDIT COMMITTEE OF LISTED REGISTRANTS.
Not applicable.
ITEM 6. INVESTMENTS.
| |
| (a) | The schedule of investments is included as part of the report to stockholders filed under Item 1 of this Form. |
ITEM 7. DISCLOSURE OF PROXY VOTING POLICIES AND PROCEDURES FOR CLOSED-END MANAGEMENT INVESTMENT COMPANIES.
Not applicable.
ITEM 8. PORTFOLIO MANAGERS OF CLOSED-END MANAGEMENT INVESTMENT COMPANIES.
Not applicable.
ITEM 9. PURCHASES OF EQUITY SECURITIES BY CLOSED-END MANAGEMENT INVESTMENT COMPANY AND AFFILIATED PURCHASERS.
Not applicable.
ITEM 10. SUBMISSION OF MATTERS TO A VOTE OF SECURITY HOLDERS.
During the reporting period, there were no material changes to the procedures by which shareholders may recommend nominees to the registrant’s board.
ITEM 11. CONTROLS AND PROCEDURES.
| |
| (a) | The registrant's principal executive officer and principal financial officer have concluded that the registrant's disclosure controls and procedures (as defined in Rule 30a-3(c) under the Investment Company Act of 1940) are effective based on their evaluation of these controls and procedures as of a date within 90 days of the filing date of this report. |
| |
| (b) | There were no changes in the registrant's internal control over financial reporting (as defined in Rule 30a-3(d) under the Investment Company Act of 1940) that occurred during the registrant's second fiscal quarter of the period covered by this report that have materially affected, or are reasonably likely to materially affect, the registrant's internal control over financial reporting. |
ITEM 12. EXHIBITS.
| |
| (a)(1) | Registrant’s Code of Ethics for Senior Financial Officers, which is the subject of the disclosure required by Item 2 of Form N-CSR, was filed as Exhibit 12(a)(1) to American Century Asset Allocation Portfolios, Inc.’s Certified Shareholder Report on Form N-CSR, File No. 811-21591, on September 29, 2005. |
| |
| (a)(2) | Separate certifications by the registrant’s principal executive officer and principal financial officer, pursuant to Section 302 of the Sarbanes-Oxley Act of 2002 and Rule 30a-2(a) under the Investment Company Act of 1940, are filed and attached hereto as EX-99.CERT. |
| |
| (b) | A certification by the registrant’s chief executive officer and chief financial officer, pursuant to Section 906 of the Sarbanes-Oxley Act of 2002, is furnished and attached hereto as EX-99.906CERT. |
SIGNATURES
Pursuant to the requirements of the Securities Exchange Act of 1934 and the Investment Company Act of 1940, the registrant has duly caused this report to be signed on its behalf by the undersigned, thereunto duly authorized.
|
| | | |
| Registrant: | American Century Government Income Trust |
| | | |
| By: | /s/ Jonathan S. Thomas |
| | Name: | Jonathan S. Thomas |
| | Title: | President |
| | | |
| Date: | May 26, 2016 |
Pursuant to the requirements of the Securities Exchange Act of 1934 and the Investment Company Act of 1940, this report has been signed below by the following persons on behalf of the registrant and in the capacities and on the dates indicated.
|
| | |
| By: | /s/ Jonathan S. Thomas |
| | Name: | Jonathan S. Thomas |
| | Title: | President |
| | | (principal executive officer) |
| | | |
| Date: | May 26, 2016 |
|
| | |
| By: | /s/ C. Jean Wade |
| | Name: | C. Jean Wade |
| | Title: | Vice President, Treasurer, and |
| | | Chief Financial Officer |
| | | (principal financial officer) |
| | | |
| Date: | May 26, 2016 |