Washington, D.C. 20549
ITEM 1. REPORTS TO STOCKHOLDERS.
ANNUAL REPORT MARCH 31, 2011
| | Capital Preservation Fund |
| President’s Letter | 2 |
| Market Perspective | 3 |
| Performance | 4 |
| Fund Characteristics | 5 |
| Shareholder Fee Example | 6 |
| Schedule of Investments | 8 |
| Statement of Assets and Liabilities | 9 |
| Statement of Operations | 10 |
| Statement of Changes in Net Assets | 11 |
| Notes to Financial Statements | 12 |
| Financial Highlights | 15 |
| Report of Independent Registered Public Accounting Firm | 16 |
| Proxy Voting Results | 17 |
| Management | 18 |
| Additional Information | 21 |
Any opinions expressed in this report reflect those of the author as of the date of the report, and do not necessarily represent the opinions of American Century Investments® or any other person in the American Century Investments organization. Any such opinions are subject to change at any time based upon market or other conditions and American Century Investments disclaims any responsibility to update such opinions. These opinions may not be relied upon as investment advice and, because investment decisions made by American Century Investments funds are based on numerous factors, may not be relied upon as an indication of trading intent on behalf of any American Century Investments fund. Security examples are used for representational purposes only and are not intended as recommendations to purchase or sell securities. Performance information for comparative indices and securities is provided to American Century Investments by third party vendors. To the best of American Century Investments’ knowledge, such information is accurate at the time of printing.
Dear Investor:
Thank you for reviewing this annual report for the period ended March 31, 2011. Our report offers investment performance and portfolio information, presented with the expert perspective and commentary of our portfolio management team. This report remains one of our most important vehicles for conveying the information you need about your investment performance, and about the market factors and strategies that affect fund returns. For additional, updated information on fund performance, portfolio strategy, and the investment markets, we encourage you to visit our website, americancentury.com. Click on the “Fund Performance” and “Insights & News” headings at the top of our Individual Investors site.
Investment Performance and Macroeconomic Update
Investment performance tables turned dramatically since our semiannual report for the six months ended September 30, 2010. That report chronicled an uneven period for economic growth and financial market performance that produced generally higher returns for U.S. bonds than for U.S. stocks. For the subsequent six months ended March 31, 2011, broad U.S. stock indices significantly outperformed their bond counterparts as monetary and fiscal intervention in 2010 fueled investor optimism about economic and financial market conditions in 2011 and 2012. The S&P 500 Index (representing U.S. stocks) and the Barclays Capital U.S. Aggregate Bond Index returned 17.31% and -0.88%, respectively, during those final six months.
In the second half of 2010, the U.S. Federal Reserve launched its second round of quantitative easing (QE2), a form of monetary intervention involving the purchase of U.S. government securities to increase the money supply and encourage investors to purchase potentially higher-risk/higher-return assets, such as stocks. Small-cap growth stocks benefited most from the resulting rally. But besides boosting stock prices, QE2 also helped fuel inflation fears. The benchmark 10-year U.S. Treasury note suffered a -5.92% total return from September 30, 2010, to March 31, 2011, as its yield jumped from 2.51% to 3.47%.
These developments over the more-recent six months are incorporated in the broader, enclosed 12-month Market Perspective and Portfolio Commentary from the portfolio management team. Our experts will continue to diligently apply their knowledge and skills as they make daily investment decisions for you.
Sincerely,
Jonathan Thomas
President and Chief Executive Officer
American Century Investments
By David MacEwen, Chief Investment Officer, Fixed Income
Economic Uncertainty Gave Way to Economic Optimism
Bonds generated solid returns for the 12 months ended March 31, 2011—a period characterized by mixed economic data and changing investor sentiment. Early in the period, a slowdown in the pace of economic growth, combined with lingering high unemployment, the European sovereign debt crisis, and mounting deflationary signals, stoked fears of a double-dip recession. This backdrop fueled demand for Treasuries and other “safe haven” investments.
Dissatisfied with the slow pace of economic growth and the lingering high jobless rate, the Federal Reserve (the Fed) kept its federal funds rate target near zero and, in late 2010, announced a second round of quantitative easing, dubbed “QE2” (the Fed’s government-securities purchase program designed to expand the money supply). This action, combined with improving economic data and the extension of prevailing federal income tax rates, sparked a fresh round of economic optimism and “risk-taking” by investors. At the same time, inflationary pressures began brewing, primarily due to better economic forecasts combined with soaring prices for oil and other commodities.
Demand for Yield, Inflation Protection Drove Performance
Treasury yields declined across all maturities, yet the slope of the yield curve (between two and 30 years) remained relatively unchanged. The generally low interest rate environment prompted investors to maintain a healthy appetite for yield. This led to strong, broad-benchmark-beating performance from investment-grade and high-yield corporate bonds, which also benefited from solid corporate fundamentals and low default rates. Longer-term nominal Treasuries also outperformed the broad bond market in this rate environment, but they lagged their inflation-indexed counterparts. Concerns about rising inflation pushed TIPS (Treasury inflation-protected securities) to the top of the investment-grade fixed-income performance hierarchy for the 12-month period.
Government agency mortgage-backed securities (MBS) posted positive returns for the period, but they lagged the broader market. Valuations in the sector remained tight relative to Treasuries, giving investors little incentive to take on additional risk. Meanwhile, cash returns were essentially flat throughout the period, reflecting the Fed’s near-zero interest rate policy.
| U.S. Fixed-Income Total Returns |
| For the 12 months ended March 31, 2011 |
| Barclays Capital U.S. Bond Market Indices | | Barclays Capital U.S. Treasury Bellwethers |
| Corporate High-Yield | 14.31% | | 3-Month Bill | 0.19% |
| Treasury Inflation Protected Securities (TIPS) | 7.91% | | 2-Year Note | 1.64% |
| Corporate (investment-grade) | 7.46% | | 10-Year Note | 6.55% |
| Aggregate (multi-sector) | 5.12% | | 30-Year Bond | 6.91% |
| Treasury | 4.53% | | |
| MBS (mortgage-backed securities) | 4.37% | | |
| Total Returns as of March 31, 2011 |
| | | | Average Annual Returns | |
| | Ticker Symbol | 1 year | 5 years | 10 years | Since Inception | Inception Date |
| Investor Class | CPFXX | 0.01%(1) | 1.86%(1) | 1.81%(1) | 4.37% | 10/13/72 |
| (1) | Returns would have been lower if a portion of the management fee had not been waived. |
| Total Annual Fund Operating Expenses |
Investor Class 0.48% |
The total annual fund operating expenses shown is as stated in the fund’s prospectus current as of the date of this report. The prospectus may vary from the expense ratio shown elsewhere in this report because it is based on a different time period, includes acquired fund fees and expenses, and, if applicable, does not include fee waivers or expense reimbursements.
Data presented reflect past performance. Past performance is no guarantee of future results. Current performance may be higher or lower than the performance shown. To obtain performance data current to the most recent month end, please call 1-800-345-2021 or visit americancentury.com.
An investment in the fund is not insured or guaranteed by the Federal Deposit Insurance Corporation or any other government agency. Although the fund seeks to preserve the value of your investment at $1.00 per share, it is possible to lose money by investing in the fund.
The 7-day current yield more closely reflects the current earnings of the fund than the total return.
| MARCH 31, 2011 |
| 7-Day Current Yield | |
After waiver(1) | 0.01% |
| Before waiver | -0.36% |
| 7-Day Effective Yield | |
After waiver(1) | 0.01% |
(1)Yields would have been lower if a portion of the management fee had not been waived. |
| | |
| Portfolio at a Glance | |
| Weighted Average Maturity | 56 days |
| Weighted Average Life | 56 days |
| | |
| Portfolio Composition by Maturity | % of fund investments |
| 1-30 days | 58% |
| 31-90 days | 24% |
| 91-180 days | 7% |
| More than 180 days | 11% |
Shareholder Fee Example (Unaudited) |
Fund shareholders may incur two types of costs: (1) transaction costs, including sales charges (loads) on purchase payments and redemption/exchange fees; and (2) ongoing costs, including management fees; distribution and service (12b-1) fees; and other fund expenses. This example is intended to help you understand your ongoing costs (in dollars) of investing in your fund and to compare these costs with the ongoing cost of investing in other mutual funds.
The example is based on an investment of $1,000 made at the beginning of the period and held for the entire period from October 1, 2010 to March 31, 2011.
Actual Expenses
The table provides information about actual account values and actual expenses for each class. You may use the information, together with the amount you invested, to estimate the expenses that you paid over the period. First, identify the share class you own. Then simply divide your account value by $1,000 (for example, an $8,600 account value divided by $1,000 = 8.6), then multiply the result by the number under the heading “Expenses Paid During Period” to estimate the expenses you paid on your account during this period.
If you hold Investor Class shares of any American Century Investments fund, or Institutional Class shares of the American Century Diversified Bond Fund, in an American Century Investments account (i.e., not a financial intermediary or retirement plan account), American Century Investments may charge you a $12.50 semiannual account maintenance fee if the value of those shares is less than $10,000. We will redeem shares automatically in one of your accounts to pay the $12.50 fee. In determining your total eligible investment amount, we will include your investments in all personal accounts (including American Century Investments Brokerage accounts) registered under your Social Security number. Personal accounts include individual accounts, joint accounts, UGMA/UTMA accounts, personal trusts, Coverdell Education Savings Accounts and IRAs (including traditional, Roth, Rollover, SEP-, SARSEP- and SIMPLE-IRAs), and certain other retirement accounts. If you have only business, business retirement, employer-sponsored or American Century Investments Brokerage accounts, you are currently not subject to this fee. We will not charge the fee as long as you choose to manage your accounts exclusively online. If you are subject to the Account Maintenance Fee, your account value could be reduced by the fee amount.
Hypothetical Example for Comparison Purposes
The table also provides information about hypothetical account values and hypothetical expenses based on the actual expense ratio of each class of your fund and an assumed rate of return of 5% per year before expenses, which is not the actual return of a fund’s share class. The hypothetical account values and expenses may not be used to estimate the actual ending account balance or expenses you paid for the period. You may use this information to compare the ongoing costs of investing in your fund and other funds. To do so, compare this 5% hypothetical example with the 5% hypothetical examples that appear in the shareholder reports of the other funds.
Please note that the expenses shown in the table are meant to highlight your ongoing costs only and do not reflect any transactional costs, such as sales charges (loads) or redemption/exchange fees. Therefore, the table is useful in comparing ongoing costs only, and will not help you determine the relative total costs of owning different funds. In addition, if these transactional costs were included, your costs would have been higher.
| | | | | |
| | Beginning Account Value 10/1/10 | Ending Account Value 3/31/11 | Expenses Paid During Period(1) 10/1/10 – 3/31/11 | Annualized Expense Ratio(1) |
| Actual |
Investor Class (after waiver) | $1,000 | $1,000.10 | $0.75 | 0.15% |
Investor Class (before waiver) | $1,000 | $1,000.10(2) | $2.39 | 0.48% |
| Hypothetical |
Investor Class (after waiver) | $1,000 | $1,024.18 | $0.76 | 0.15% |
Investor Class (before waiver) | $1,000 | $1,022.54 | $2.42 | 0.48% |
| (1) | Expenses are equal to the class’s annualized expense ratio listed in the table above, multiplied by the average account value over the period, multiplied by 182, the number of days in the most recent fiscal half-year, divided by 365, to reflect the one-half year period. |
| (2) | Ending account value assumes the return earned after waiver and would have been lower if a portion of the management fee had not been waived. |
| | | |
| | Principal Amount | Value |
U.S. Treasury Bills(1) — 70.1% |
| U.S. Treasury Bills, 0.08%, 4/7/11 | $380,000,000 | $ 379,995,217 |
| U.S. Treasury Bills, 0.03%, 4/14/11 | 335,000,000 | 334,996,371 |
| U.S. Treasury Bills, 0.10%, 4/15/11 | 80,000,000 | 79,996,827 |
| U.S. Treasury Bills, 0.05%, 4/21/11 | 330,000,000 | 329,990,083 |
| U.S. Treasury Bills, 0.05%, 4/28/11 | 250,000,000 | 249,991,000 |
| U.S. Treasury Bills, 0.04%, 5/5/11 | 325,000,000 | 324,987,415 |
| U.S. Treasury Bills, 0.15%, 5/26/11 | 82,000,000 | 81,981,144 |
| U.S. Treasury Bills, 0.11%, 6/9/11 | 25,000,000 | 24,994,681 |
| U.S. Treasury Bills, 0.09%, 6/16/11 | 100,000,000 | 99,980,789 |
| U.S. Treasury Bills, 0.10%, 6/23/11 | 65,000,000 | 64,985,763 |
| U.S. Treasury Bills, 0.10%, 6/30/11 | 70,000,000 | 69,983,200 |
| TOTAL U.S. TREASURY BILLS | 2,041,882,490 |
U.S. Treasury Notes(1) — 20.1% |
| U.S. Treasury Notes, 0.875%, 4/30/11 | 25,000,000 | 25,013,378 |
| U.S. Treasury Notes, 0.875%, 5/31/11 | 100,000,000 | 100,115,800 |
| U.S. Treasury Notes, 1.125%, 6/30/11 | 50,000,000 | 50,123,765 |
| U.S. Treasury Notes, 5.125%, 6/30/11 | 7,000,000 | 7,087,092 |
| U.S. Treasury Notes, 1.00%, 7/31/11 | 50,000,000 | 50,117,794 |
| U.S. Treasury Notes, 4.625%, 8/31/11 | 33,000,000 | 33,600,315 |
| U.S. Treasury Notes, 4.50%, 9/30/11 | 50,000,000 | 51,064,072 |
| U.S. Treasury Notes, 4.625%, 10/31/11 | 25,000,000 | 25,635,674 |
| U.S. Treasury Notes, 1.75%, 11/15/11 | 15,000,000 | 15,139,715 |
| U.S. Treasury Notes, 4.50%, 11/30/11 | 60,000,000 | 61,680,107 |
| U.S. Treasury Notes, 1.125%, 12/15/11 | 105,000,000 | 105,600,722 |
| U.S. Treasury Notes, 1.125%, 1/15/12 | 50,000,000 | 50,319,948 |
| U.S. Treasury Notes, 1.375%, 2/15/12 | 10,000,000 | 10,087,838 |
| TOTAL U.S. TREASURY NOTES | 585,586,220 |
| TOTAL INVESTMENT SECURITIES — 90.2% | 2,627,468,710 |
OTHER ASSETS AND LIABILITIES — 9.8%(2) | 285,749,871 |
| TOTAL NET ASSETS — 100.0% | $2,913,218,581 |
Notes to Schedule of Investments
| (1) | The rates for U.S. Treasury Bills are the yield to maturity at purchase. The rates for U.S. Treasury Notes are the stated coupon rates. |
| (2) | Category includes amounts related to net securities sold, but not settled as of the period end. |
See Notes to Financial Statements.
Statement of Assets and Liabilities |
| MARCH 31, 2011 | |
| Assets | |
| Investment securities, at value (amortized cost and cost for federal income tax purposes) | | | $2,627,468,710 | |
| Receivable for investments sold | | | 290,064,897 | |
| Receivable for capital shares sold | | | 1,119,860 | |
| Interest receivable | | | 2,793,211 | |
| | | | 2,921,446,678 | |
| | | | | |
| Liabilities | | | | |
| Disbursements in excess of demand deposit cash | | | 3,295,099 | |
| Payable for capital shares redeemed | | | 4,642,155 | |
| Accrued management fees | | | 290,551 | |
| Dividends payable | | | 292 | |
| | | | 8,228,097 | |
| | | | | |
| Net Assets | | | $2,913,218,581 | |
| | | | | |
| Investor Class Capital Shares | | | | |
| Shares outstanding (unlimited number of shares authorized) | | | 2,913,217,533 | |
| | | | | |
| Net Asset Value Per Share | | | $1.00 | |
| | | | | |
| Net Assets Consist of: | | | | |
| Capital paid in | | | $2,913,218,429 | |
| Undistributed net realized gain | | | 152 | |
| | | | $2,913,218,581 | |
See Notes to Financial Statements.
| YEAR ENDED MARCH 31, 2011 | |
| Investment Income (Loss) | |
| Income: | | | |
| Interest | | | $5,305,886 | |
| | | | | |
| Expenses: | | | | |
| Management fees | | | 14,445,020 | |
| Trustees’ fees and expenses | | | 109,846 | |
| Other expenses | | | 53,809 | |
| | | | 14,608,675 | |
| Fees waived | | | (9,602,412 | ) |
| | | | 5,006,263 | |
| | | | | |
| Net investment income (loss) | | | 299,623 | |
| | | | | |
| Net realized gain (loss) on investment transactions | | | 1,730 | |
| | | | | |
| Net Increase (Decrease) in Net Assets Resulting from Operations | | | $301,353 | |
See Notes to Financial Statements.
Statement of Changes in Net Assets |
| YEARS ENDED MARCH 31, 2011 AND MARCH 31, 2010 | |
| Increase (Decrease) in Net Assets | | 2011 | | | 2010 | |
| Operations | |
| Net investment income (loss) | | | $299,623 | | | | $250,287 | |
| Net realized gain (loss) | | | 1,730 | | | | 5,839 | |
| Net increase (decrease) in net assets resulting from operations | | | 301,353 | | | | 256,126 | |
| | | | | | | | | |
| Distributions to Shareholders | | | | | | | | |
| From net investment income | | | (299,623 | ) | | | (331,749 | ) |
| From net realized gains | | | (7,418 | ) | | | (85,586 | ) |
| Decrease in net assets from distributions | | | (307,041 | ) | | | (417,335 | ) |
| | | | | | | | | |
| Capital Share Transactions | | | | | | | | |
| Proceeds from shares sold | | | 1,062,497,413 | | | | 1,086,059,699 | |
| Proceeds from reinvestment of distributions | | | 302,742 | | | | 409,766 | |
| Payments for shares redeemed | | | (1,302,942,463 | ) | | | (1,501,227,094 | ) |
| Net increase (decrease) in net assets from capital share transactions | | | (240,142,308 | ) | | | (414,757,629 | ) |
| | | | | | | | | |
| Net increase (decrease) in net assets | | | (240,147,996 | ) | | | (414,918,838 | ) |
| | | | | | | | | |
| Net Assets | | | | | | | | |
| Beginning of period | | | 3,153,366,577 | | | | 3,568,285,415 | |
| End of period | | | $2,913,218,581 | | | | $3,153,366,577 | |
| | | | | | | | | |
| Transactions in Shares of the Fund | | | | | | | | |
| Sold | | | 1,062,497,413 | | | | 1,086,059,699 | |
| Issued in reinvestment of distributions | | | 302,742 | | | | 409,766 | |
| Redeemed | | | (1,302,942,463 | ) | | | (1,501,227,094 | ) |
| Net increase (decrease) in shares of the fund | | | (240,142,308 | ) | | | (414,757,629 | ) |
See Notes to Financial Statements.
Notes to Financial Statements |
MARCH 31, 2011
1. Organization
American Century Government Income Trust (the trust) is registered under the Investment Company Act of 1940, as amended (the 1940 Act), as an open-end management investment company and is organized as a Massachusetts business trust. Capital Preservation Fund (the fund) is one fund in a series issued by the trust. The fund is diversified as defined under Rule 2a-7 of the 1940 Act. The fund’s investment objective is to seek maximum safety and liquidity. Its secondary objective is to seek to pay shareholders the highest rate of return consistent with safety and liquidity. The fund pursues its objectives by investing in short-term money market securities issued by the U.S. Treasury that are guaranteed by the direct full faith and credit pledge of the U.S. government.
2. Significant Accounting Policies
The following is a summary of significant accounting policies consistently followed by the fund in preparation of its financial statements. The financial statements are prepared in conformity with accounting principles generally accepted in the United States of America, which may require management to make certain estimates and assumptions at the date of the financial statements. Actual results could differ from these estimates.
Investment Valuations — The fund determines the fair value of its investments and computes its net asset value per share as of the close of regular trading (usually 4 p.m. Eastern time) on the New York Stock Exchange (NYSE) on each day the NYSE is open. Securities are generally valued at amortized cost, which approximates current market value. When such valuations do not reflect market value, securities are valued as determined in good faith by the Board of Trustees or its designee, in accordance with procedures adopted by the Board of Trustees.
Security Transactions — Security transactions are accounted for as of the trade date. Net realized gains and losses are determined on the identified cost basis, which is also used
for federal income tax purposes.
Investment Income — Interest income is recorded on the accrual basis and includes accretion of discounts and amortization of premiums.
When-Issued and Forward Commitments — The fund may engage in securities transactions on a when-issued or forward commitment basis. In these transactions, the securities’ prices and yields are fixed on the date of the commitment. In a when-issued transaction, the payment and delivery are scheduled for a future date and during this period, securities are subject to market fluctuations. In a forward commitment transaction, the fund may sell a security and at the same time make a commitment to purchase the same security at a future date at a specified price. Conversely, the fund may purchase a security and at the same time make a commitment to sell the same security at a future date at a specified price. These types of transactions are executed simultaneously in what are known as “roll” transactions. The fund will segregate cash, cash equivalents or other appropriate liquid securities on its records in amounts sufficient to meet the purchase price.
Income Tax Status — It is the fund’s policy to distribute substantially all net investment income and net realized gains to shareholders and to otherwise qualify as a regulated investment company under provisions of the Internal Revenue Code. The fund is no longer subject to examination by tax authorities for years prior to 2008. At this time, management believes there are no uncertain tax positions which, based on their technical merit, would not be sustained upon examination and for which it is reasonably possible that the total amounts of unrecognized tax benefits will significantly change in the next twelve months. Accordingly, no provision has been made for federal or state income taxes.
Distributions to Shareholders — Distributions from net investment income are declared daily and paid monthly. The fund may make short-term capital gains distributions to comply with the distribution requirements of the Internal Revenue Code. The fund does not expect to realize any long-term capital gains, and accordingly, does not expect to pay any long-term capital gains distributions.
Indemnifications — Under the trust’s organizational documents, its officers and trustees are indemnified against certain liabilities arising out of the performance of their duties to the fund. In addition, in the normal course of business, the fund enters into contracts that provide general indemnifications. The maximum exposure under these arrangements is unknown as this would involve future claims that may be made against a fund. The risk of material loss from such claims is considered by management to be remote.
3. Fees and Transactions with Related Parties
Management Fees — The trust has entered into a management agreement with American Century Investment Management, Inc. (ACIM) (the investment advisor), under which ACIM provides the fund with investment advisory and management services in exchange for a single, unified management fee (the fee). The agreement provides that all expenses of managing and operating the fund, except distribution and service fees, brokerage expenses, taxes, interest, fees and expenses of the independent trustees (including legal counsel fees), and extraordinary expenses, will be paid by ACIM. The fee is computed and accrued daily based on the daily net assets of the fund and paid monthly in arrears. The fee consists of (1) an Investment Category Fee based on the daily net assets of the fund and certain other accounts managed by the investment advisor that are in the same broad investment category as the fund and (2) a Complex Fee based on the assets of all the funds in the American Century Investments family of funds. The rates for the Investment Category Fee range from 0.1370% to 0.2500%. The rates for the Complex Fee range from 0.2500% to 0.3100%. During the year ended March 31, 2011, the investment advisor voluntarily agreed to waive 0.021% of its management fee. The investment advisor expects the fee waiver to continue through July 31, 2011, and cannot terminate it without consulting the Board of Trustees. In order to maintain a positive yield, ACIM may voluntarily waive a portion of its management fee on a daily basis. This fee waiver may be revised or terminated at any time without notice. The effective annual management fee before waiver for the year ended March 31, 2011 was 0.47%. The effective annual management fee after waiver for the year ended March 31, 2011 was 0.16%.
Related Parties — Certain officers and trustees of the trust are also officers and/or directors of American Century Companies, Inc. (ACC), the parent of the trust’s investment advisor, ACIM, the distributor of the trust, American Century Investment Services, Inc., and the trust’s transfer agent, American Century Services, LLC.
The fund is eligible to invest in a money market fund for temporary purposes, which is managed by J.P. Morgan Investment Management, Inc. (JPMIM). The fund has a mutual funds services agreement with J.P. Morgan Investor Services Co. (JPMIS). JPMorgan Chase Bank (JPMCB) is a custodian of the fund. JPMIM, JPMIS and JPMCB are wholly owned subsidiaries of JPMorgan Chase & Co. (JPM). JPM is an equity investor in ACC.
4. Fair Value Measurements
The fund’s securities valuation process is based on several considerations and may use multiple inputs to determine the fair value of the positions held by the fund. In conformity with accounting principles generally accepted in the United States of America, the inputs used to determine a valuation are classified into three broad levels as follows:
| • | Level 1 valuation inputs consist of unadjusted quoted prices in an active market for identical securities; |
| • | Level 2 valuation inputs consist of direct or indirect observable market data (including quoted prices for similar securities, evaluations of subsequent market events, interest rates, prepayment speeds, credit risk, etc.); or |
| • | Level 3 valuation inputs consist of unobservable data (including a fund’s own assumptions). |
The level classification is based on the lowest level input that is significant to the fair valuation measurement. The valuation inputs are not necessarily an indication of the risks associated with investing in these securities or other financial instruments.
As of period end, the fund’s investment securities were classified as Level 2. The Schedule of Investments provides additional information on the fund’s portfolio holdings.
5. Federal Tax Information
The tax character of distributions paid during the years ended March 31, 2011 and March 31, 2010 were as follows:
| | | | | | | |
| | | 2011 | | | 2010 | |
| Distributions Paid From | | | | | | |
| Ordinary income | | | $307,041 | | | | $417,335 | |
| Long-term capital gains | | | — | | | | — | |
The book-basis character of distributions made during the year from net investment income or net realized gains may differ from their ultimate characterization for federal income tax purposes. These differences reflect the differing character of certain income items and net realized gains and losses for financial statement and tax purposes, and may result in reclassification among certain capital accounts on the financial statements.
As of March 31, 2011, the fund has undistributed ordinary income for federal income tax purposes of $152.
On December 22, 2010, the Regulated Investment Company Modernization Act of 2010 (the “Act”) was enacted, which changed various technical rules governing the tax treatment of regulated investment companies. The changes are generally effective for taxable years beginning after the date of enactment. Under the Act, the fund will be permitted to carry forward capital losses incurred in taxable years beginning after the date of enactment for an unlimited period.
| Investor Class | |
| For a Share Outstanding Throughout the Years Ended March 31 | |
| | | 2011 | | | 2010 | | | 2009 | | | 2008 | | | 2007 | |
| Per-Share Data | |
| Net Asset Value, Beginning of Period | | | $1.00 | | | | $1.00 | | | | $1.00 | | | | $1.00 | | | | $1.00 | |
| Income From Investment Operations | | | | | | | | | | | | | | | | | | | | |
| Net Investment Income (Loss) | | | — | (1) | | | — | (1) | | | 0.01 | | | | 0.04 | | | | 0.04 | |
| Distributions | | | | | | | | | | | | | | | | | | | | |
| From Net Investment Income | | | — | (1) | | | — | (1) | | | (0.01 | ) | | | (0.04 | ) | | | (0.04 | ) |
| From Net Realized Gains | | | — | (1) | | | — | (1) | | | — | | | | — | | | | — | |
| Total Distributions | | | — | (1) | | | — | (1) | | | (0.01 | ) | | | (0.04 | ) | | | (0.04 | ) |
| Net Asset Value, End of Period | | | $1.00 | | | | $1.00 | | | | $1.00 | | | | $1.00 | | | | $1.00 | |
| | | | | | | | | | | | | | | | | | | | | |
Total Return(2) | | | 0.01 | % | | | 0.01 | % | | | 0.91 | % | | | 3.90 | % | | | 4.59 | % |
| | | | | | | | | | | | | | | | | | | | | |
| Ratios/Supplemental Data | |
Ratio of Operating Expenses to Average Net Assets | | | 0.17 | % | | | 0.28 | % | | | 0.49 | % | | | 0.47 | % | | | 0.48 | % |
Ratio of Operating Expenses to Average Net Assets (Before Expense Waiver) | | | 0.48 | % | | | 0.48 | % | | | 0.49 | % | | | 0.47 | % | | | 0.48 | % |
Ratio of Net Investment Income (Loss) to Average Net Assets | | | 0.01 | % | | | 0.01 | % | | | 0.87 | % | | | 3.78 | % | | | 4.50 | % |
Ratio of Net Investment Income (Loss) to Average Net Assets (Before Expense Waiver) | | | (0.30 | )% | | | (0.19 | )% | | | 0.87 | % | | | 3.78 | % | | | 4.50 | % |
| Net Assets, End of Period (in thousands) | | | $2,913,219 | | | | $3,153,367 | | | | $3,568,285 | | | | $3,270,834 | | | | $2,656,986 | |
| (1) | Per-share amount was less than $0.005. |
| (2) | Total returns are calculated based on the net asset value of the last business day. Total returns for periods less than one year are not annualized. |
See Notes to Financial Statements.
Report of Independent Registered Public Accounting Firm |
To the Trustees of the American Century Government Income Trust
and Shareholders of the Capital Preservation Fund:
In our opinion, the accompanying statement of assets and liabilities, including the schedule of investments, and the related statements of operations and of changes in net assets and the financial highlights present fairly, in all material respects, the financial position of the Capital Preservation Fund (one of the five funds comprising the American Century Government Income Trust, hereafter referred to as the “Fund”) at March 31, 2011, the results of its operations for the year then ended, the changes in its net assets for each of the two years in the period then ended and the financial highlights for each of the five years in the period then ended, in conformity with accounting principles generally accepted in the United States of America. These financial statements and financial highlights (hereafter referred to as “financial statements”) are the responsibility of the Fund’s management; our responsibility is to express an opinion on these financial statements based on our audits. We conducted our audits of these financial statements in accordance with the standards of the Public Company Accounting Oversight Board (United States). Those standards require that we plan and perform the audit to obtain reasonable assurance about whether the financial statements are free of material misstatement. An audit includes examining, on a test basis, evidence supporting the amounts and disclosures in the financial statements, assessing the accounting principles used and significant estimates made by management, and evaluating the overall financial statement presentation. We believe that our audits, which included confirmation of securities at March 31, 2011 by correspondence with the custodian, provide a reasonable basis for our opinion.
PricewaterhouseCoopers LLP
Kansas City, Missouri
May 19, 2011
A special meeting of shareholders was held on June 16, 2010, to vote on the following proposals. Each proposal received the required number of votes and was adopted. A summary of voting results is listed below each proposal.
Proposal 1:
To elect one Trustee to the Board of Trustees of American Century Government Income Trust (the proposal was voted on by all shareholders of funds issued by American Century Government Income Trust):
| | | |
| Frederick L.A. Grauer | For: | 6,878,868,575 |
| | Withhold: | 268,743,465 |
| | Abstain: | 0 |
| | Broker Non-Vote: | 0 |
The other trustees whose term of office continued after the meeting include Jonathan S. Thomas, John Freidenrich, Ronald J. Gilson, Peter F. Pervere, Myron S. Scholes, and John B. Shoven.
Proposal 2:
To approve a management agreement between the fund and American Century Investment Management, Inc.:
| | | |
| Investor Class | For: | 1,685,824,211 |
| | Against: | 38,130,571 |
| | Abstain: | 84,101,901 |
| | Broker Non-Vote: | 119,834,926 |
The individuals listed below serve as trustees of the fund. Each trustee will continue to serve in this capacity until death, retirement, resignation or removal from office. The mandatory retirement age for trustees who are not “interested persons,” as that term is defined in the Investment Company Act (independent trustees), is 73. However, the mandatory retirement age may be extended for a period not to exceed two years with the approval of the remaining independent trustees.
Mr. Thomas is the only trustee who is an “interested person” because he currently serves as President and Chief Executive Officer of American Century Companies, Inc. (ACC), the parent company of American Century Investment Management, Inc. (ACIM or the advisor).
The other trustees (more than three-fourths of the total number) are independent; that is, they have never been employees, directors or officers of, and have no financial interest in, ACC or any of its wholly owned, direct or indirect, subsidiaries, including ACIM, American Century Investment Services, Inc. (ACIS) and American Century Services, LLC (ACS). The trustees serve in this capacity for eight (in the case of Mr. Thomas, 15) registered investment companies in the American Century Investments family of funds.
The following presents additional information about the trustees. The mailing address for each trustee, other than Mr. Thomas, is 1665 Charleston Road, Mountain View, California 94043. The mailing address for Mr. Thomas is 4500 Main Street, Kansas City, Missouri 64111.
| | | | | | |
Name (Year of Birth) | Position(s) Held with Funds | Length of Time Served | Principal Occupation(s) During Past 5 Years | Number of American Century Portfolios Overseen by Trustee | Other Directorships Held During Past 5 Years |
| Independent Trustees |
Tanya S. Beder (1955) | Trustee | Since 2011 | Chairman, SBCC Group Inc. (investment advisory services) (2006 to present); Fellow in Practice, International Center for Finance, Yale University School of Management (1985 to present); Chief Executive Officer, Tribeca Global Management LLC (2004 to 2006) | 40 | None |
John Freidenrich (1937) | Trustee | Since 2005 | Founder, Member and Manager, Regis Management Company, LLC (investment management firm) (April 2004 to present) | 40 | None |
Ronald J. Gilson (1946) | Trustee and Chairman of the Board | Since 1995 | Charles J. Meyers Professor of Law and Business, Stanford Law School (1979 to present); Marc and Eva Stern Professor of Law and Business, Columbia University School of Law (1992 to present) | 40 | None |
| | | | | | |
Name (Year of Birth) | Position(s) Held with Funds | Length of Time Served | Principal Occupation(s) During Past 5 Years | Number of American Century Portfolios Overseen by Trustee | Other Directorships Held During Past 5 Years |
| Independent Trustees |
Frederick L. A. Grauer (1946) | Trustee | Since 2008 | Senior Advisor, BlackRock, Inc. (investment management firm) (2010 to 2011); Senior Advisor, Barclays Global Investors (investment management firm) (2003 to 2009) | 40 | None |
Peter F. Pervere (1947) | Trustee | Since 2007 | Retired | 40 | Intraware, Inc. (2003 to 2009) |
Myron S. Scholes (1941) | Trustee | Since 1980 | Chairman, Platinum Grove Asset Management, L.P. (asset manager) (1999 to 2009); Frank E. Buck Professor of Finance-Emeritus, Stanford Graduate School of Business (1996 to present) | 40 | Dimensional Fund Advisors (investment advisor); CME Group, Inc. (futures and options exchange) |
John B. Shoven (1947) | Trustee | Since 2002 | Professor of Economics, Stanford University (1973 to present) | 40 | Cadence Design Systems; Exponent; Financial Engines; Watson Wyatt Worldwide (2002 to 2006) |
| |
| Interested Trustee |
Jonathan S. Thomas (1963) | Trustee and President | Since 2007 | President and Chief Executive Officer, ACC (March 2007 to present); Chief Administrative Officer, ACC (February 2006 to February 2007); Executive Vice President, ACC (November 2005 to February 2007). Also serves as: Chief Executive Officer and Manager, ACS; Executive Vice President, ACIM; Director, ACC, ACIM and other ACC subsidiaries | 104 | None |
Officers
The following table presents certain information about the executive officers of the fund. Each officer serves as an officer for each of the 15 investment companies in the American Century family of funds, unless otherwise noted. No officer is compensated for his or her service as an officer of the fund. The listed officers are interested persons of the fund and are appointed or re-appointed on an annual basis. The mailing address for each of the officers listed below is 4500 Main Street, Kansas City, Missouri 64111.
Name (Year of Birth) | Offices with the Funds | Principal Occupation(s) During the Past Five Years |
| Officers |
Jonathan S. Thomas (1963) | Trustee and President since 2007 | President and Chief Executive Officer, ACC (March 2007 to present); Chief Administrative Officer, ACC (February 2006 to February 2007); Executive Vice President, ACC (November 2005 to February 2007). Also serves as: Chief Executive Officer and Manager, ACS; Executive Vice President, ACIM; Director, ACC, ACIM and other ACC subsidiaries |
Barry Fink (1955) | Executive Vice President since 2007 | Chief Operating Officer and Executive Vice President, ACC (September 2007 to present); President, ACS (October 2007 to present); Managing Director, Morgan Stanley (2000 to 2007); Global General Counsel, Morgan Stanley (2000 to 2006). Also serves as: Manager, ACS and Director, ACC and certain ACC subsidiaries |
Maryanne L. Roepke (1956) | Chief Compliance Officer since 2006 and Senior Vice President since 2000 | Chief Compliance Officer, American Century funds, ACIM and ACS (August 2006 to present); Assistant Treasurer, ACC (January 1995 to August 2006); and Treasurer and Chief Financial Officer, various American Century funds (July 2000 to August 2006). Also serves as: Senior Vice President, ACS |
Charles A. Etherington (1957) | General Counsel since 2007 and Senior Vice President since 2006 | Attorney, ACC (February 1994 to present); Vice President, ACC (November 2005 to present), General Counsel, ACC (March 2007 to present); Also serves as General Counsel, ACIM, ACS, ACIS and other ACC subsidiaries; and Senior Vice President, ACIM and ACS |
Robert J. Leach (1966) | Vice President, Treasurer and Chief Financial Officer since 2006 | Vice President, ACS (February 2000 to present); and Controller, various American Century funds (1997 to September 2006) |
David H. Reinmiller (1963) | Vice President since 2001 | Attorney, ACC (January 1994 to present); Associate General Counsel, ACC (January 2001 to present); Chief Compliance Officer, American Century funds and ACIM (January 2001 to February 2005). Also serves as Vice President, ACIM and ACS |
Ward D. Stauffer (1960) | Secretary since 2005 | Attorney, ACC (June 2003 to present) |
The Statement of Additional Information has additional information about the fund’s trustees and is available without charge, upon request, by calling 1-800-345-2021.
Retirement Account Information
As required by law, distributions you receive from certain IRAs, or 403(b), 457 and qualified plans are subject to federal income tax withholding, unless you elect not to have withholding apply. Tax will be withheld on the total amount withdrawn even though you may be receiving amounts that are not subject to withholding, such as nondeductible contributions. In such case, excess amounts of withholding could occur. You may adjust your withholding election so that a greater or lesser amount will be withheld.
If you don’t want us to withhold on this amount, you must notify us to not withhold the federal income tax. You may notify us in writing or in certain situations by telephone or through other electronic means. You have the right to revoke your withholding election at any time and any election you make may remain in effect until revoked by filing a new election.
Remember, even if you elect not to have income tax withheld, you are liable for paying income tax on the taxable portion of your withdrawal. If you elect not to have income tax withheld or you don’t have enough income tax withheld, you may be responsible for payment of estimated tax. You may incur penalties under the estimated tax rules if your withholding and estimated tax payments are not sufficient. You can reduce or defer the income tax on a distribution by directly or indirectly rolling such distribution over to another IRA or eligible plan. You should consult your tax advisor for additional information.
State tax will be withheld if, at the time of your distribution, your address is within one of the mandatory withholding states and you have federal income tax withheld. State taxes will be withheld from your distribution in accordance with the respective state rules.
Proxy Voting Guidelines
American Century Investment Management, Inc., the fund’s investment advisor, is responsible for exercising the voting rights associated with the securities purchased and/or held by the fund. A description of the policies and procedures the advisor uses in fulfilling this responsibility is available without charge, upon request, by calling 1-800-345-2021. It is also available on American Century Investments’ website at americancentury.com and on the Securities and Exchange Commission’s website at sec.gov. Information regarding how the investment advisor voted proxies relating to portfolio securities during the most recent 12-month period ended June 30 is available on the “About Us” page at americancentury.com. It is also available at sec.gov.
Quarterly Portfolio Disclosure
The fund files its complete schedule of portfolio holdings with the Securities and Exchange Commission (SEC) for the first and third quarters of each fiscal year on Form N-Q. The fund’s Forms N-Q are available on the SEC’s website at sec.gov, and may be reviewed and copied at the SEC’s Public Reference Room in Washington, DC. Information on the operation of the Public Reference Room may be obtained by calling 1-800-SEC-0330. The fund also makes its complete schedule of portfolio holdings for the most recent quarter of its fiscal year available on its website at americancentury.com and, upon request, by calling 1-800-345-2021.
Other Tax Information
The following information is provided pursuant to provisions of the Internal Revenue Code.
The fund hereby designates $7,418 as qualified short-term capital gain distributions for purposes of Internal Revenue Code Section 871.
| Contact Us | americancentury.com |
| Automated Information Line | 1-800-345-8765 |
| Investor Services Representative | 1-800-345-2021 or 816-531-5575 |
| Investors Using Advisors | 1-800-378-9878 |
Business, Not-For-Profit, Employer-Sponsored Retirement Plans | 1-800-345-3533 |
Banks and Trust Companies, Broker-Dealers, Financial Professionals, Insurance Companies | 1-800-345-6488 |
| Telecommunications Device for the Deaf | 1-800-634-4113 |
American Century Government Income Trust
Investment Advisor:
American Century Investment Management, Inc.
Kansas City, Missouri
This report and the statements it contains are submitted for the general information of our shareholders. The report is not authorized for distribution to prospective investors unless preceded or accompanied by an effective prospectus.
©2011 American Century Proprietary Holdings, Inc. All rights reserved.
CL-ANN-71445 1105
ANNUAL REPORT MARCH 31, 2011


| President’s Letter | 2 |
| Market Perspective | 3 |
| Performance | 4 |
| Portfolio Commentary | 6 |
| Fund Characteristics | 8 |
| Shareholder Fee Example | 9 |
| Schedule of Investments | 11 |
| Statement of Assets and Liabilities | 14 |
| Statement of Operations | 15 |
| Statement of Changes in Net Assets | 16 |
| Notes to Financial Statements | 17 |
| Financial Highlights | 23 |
| Report of Independent Registered Public Accounting Firm | 28 |
| Proxy Voting Results | 29 |
| Management | 30 |
| Additional Information | 33 |
Any opinions expressed in this report reflect those of the author as of the date of the report, and do not necessarily represent the opinions of American Century Investments® or any other person in the American Century Investments organization. Any such opinions are subject to change at any time based upon market or other conditions and American Century Investments disclaims any responsibility to update such opinions. These opinions may not be relied upon as investment advice and, because investment decisions made by American Century Investments funds are based on numerous factors, may not be relied upon as an indication of trading intent on behalf of any American Century Investments fund. Security examples are used for representational purposes only and are not intended as recommendations to purchase or sell securities. Performance information for comparative indices and securities is provided to American Century Investments by third party vendors. To the best of American Century Investments’ knowledge, such information is accurate at the time of printing.
Dear Investor:
Thank you for reviewing this annual report for the period ended March 31, 2011. Our report offers investment performance and portfolio information, presented with the expert perspective and commentary of our portfolio management team. This report remains one of our most important vehicles for conveying the information you need about your investment performance, and about the market factors and strategies that affect fund returns. For additional, updated information on fund performance, portfolio strategy, and the investment markets, we encourage you to visit our website, americancentury.com. Click on the “Fund Performance” and “Insights & News” headings at the top of our Individual Investors site.
Investment Performance and Macroeconomic Update
Investment performance tables turned dramatically since our semiannual report for the six months ended September 30, 2010. That report chronicled an uneven period for economic growth and financial market performance that produced generally higher returns for U.S. bonds than for U.S. stocks. For the subsequent six months ended March 31, 2011, broad U.S. stock indices significantly outperformed their bond counterparts as monetary and fiscal intervention in 2010 fueled investor optimism about economic and financial market conditions in 2011 and 2012. The S&P 500 Index (representing U.S. stocks) and the Barclays Capital U.S. Aggregate Bond Index returned 17.31% and -0.88%, respectively, during those final six months.
In the second half of 2010, the U.S. Federal Reserve launched its second round of quantitative easing (QE2), a form of monetary intervention involving the purchase of U.S. government securities to increase the money supply and encourage investors to purchase potentially higher-risk/higher-return assets, such as stocks. Small-cap growth stocks benefited most from the resulting rally. But besides boosting stock prices, QE2 also helped fuel inflation fears. The benchmark 10-year U.S. Treasury note suffered a -5.92% total return from September 30, 2010, to March 31, 2011, as its yield jumped from 2.51% to 3.47%.
These developments over the more-recent six months are incorporated in the broader, enclosed 12-month Market Perspective and Portfolio Commentary from the portfolio management team. Our experts will continue to diligently apply their knowledge and skills as they make daily investment decisions for you.
Sincerely,
Jonathan Thomas
President and Chief Executive Officer
American Century Investments
By David MacEwen, Chief Investment Officer, Fixed Income
Economic Uncertainty Gave Way to Economic Optimism
Bonds generated solid returns for the 12 months ended March 31, 2011—a period characterized by mixed economic data and changing investor sentiment. Early in the period, a slowdown in the pace of economic growth, combined with lingering high unemployment, the European sovereign debt crisis, and mounting deflationary signals, stoked fears of a double-dip recession. This backdrop fueled demand for Treasuries and other “safe haven” investments.
Dissatisfied with the slow pace of economic growth and the lingering high jobless rate, the Federal Reserve (the Fed) kept its federal funds rate target near zero and, in late 2010, announced a second round of quantitative easing, dubbed “QE2” (the Fed’s government-securities purchase program designed to expand the money supply). This action, combined with improving economic data and the extension of prevailing federal income tax rates, sparked a fresh round of economic optimism and “risk-taking” by investors. At the same time, inflationary pressures began brewing, primarily due to better economic forecasts combined with soaring prices for oil and other commodities.
Demand for Yield, Inflation Protection Drove Performance
Treasury yields declined across all maturities, yet the slope of the yield curve (between two and 30 years) remained relatively unchanged. The generally low interest rate environment prompted investors to maintain a healthy appetite for yield. This led to strong, broad-benchmark-beating performance from investment-grade and high-yield corporate bonds, which also benefited from solid corporate fundamentals and low default rates. Longer-term nominal Treasuries also outperformed the broad bond market in this rate environment, but they lagged their inflation-indexed counterparts. Concerns about rising inflation pushed TIPS (Treasury inflation-protected securities) to the top of the investment-grade fixed-income performance hierarchy for the 12-month period.
Government agency mortgage-backed securities (MBS) posted positive returns for the period, but they lagged the broader market. Valuations in the sector remained tight relative to Treasuries, giving investors little incentive to take on additional risk. Meanwhile, cash returns were essentially flat throughout the period, reflecting the Fed’s near-zero interest rate policy.
| U.S. Fixed-Income Total Returns |
| For the 12 months ended March 31, 2011 |
| Barclays Capital U.S. Bond Market Indices | | Barclays Capital U.S. Treasury Bellwethers |
| Corporate High-Yield | 14.31% | | 3-Month Bill | 0.19% |
| Treasury Inflation Protected Securities (TIPS) | 7.91% | | 2-Year Note | 1.64% |
| Corporate (investment-grade) | 7.46% | | 10-Year Note | 6.55% |
| Aggregate (multi-sector) | 5.12% | | 30-Year Bond | 6.91% |
| Treasury | 4.53% | | | |
| MBS (mortgage-backed securities) | 4.37% | | | |
| Total Returns as of March 31, 2011 |
| | | | Average Annual Returns | |
| | Ticker Symbol | 1 year | 5 years | 10 years | Since Inception | Inception Date |
| Investor Class | BGNMX | 4.90% | 6.06%(1) | 5.06% | 7.05% | 9/23/85 |
Barclays Capital U.S. GNMA Index | — | 5.35% | 6.45% | 5.65% | 7.78%(2) | — |
| Institutional Class | AGMNX | 5.02%(1) | — | — | 6.65%(1) | 9/28/07 |
A Class(3) No sales charge* With sales charge* | BGNAX | 4.64% -0.09% | 5.79%(1) 4.82%(1) | 4.80% 4.32% | 5.17% 4.81% | 10/9/97 |
| C Class | BGNCX | 3.87%(1) | — | — | 3.65%(1) | 3/1/10 |
| R Class | AGMWX | 4.29%(1) | — | — | 5.90%(1) | 9/28/07 |
| * | Returns would have been lower if a portion of the management fee had not been waived. |
Sales charges include initial sales charges and contingent deferred sales charges (CDSCs), as applicable. A Class shares have a 4.50% maximum initial sales charge and may be subject to a maximum CDSC of 1.00%. C Class shares redeemed within 12 months of purchase are subject to a maximum CDSC of 1.00%. The SEC requires that mutual funds provide performance information net of maximum sales charges in all cases where charges could be applied.
| (1) | Returns would have been lower if a portion of the management fee had not been waived. |
| (2) | Since 9/30/85, the date nearest the Investor Class’s inception for which data are available. |
| (3) | Prior to March 1, 2010, the A Class was referred to as the Advisor Class and did not have a front-end sales charge. Performance prior to that date has been adjusted to reflect this charge. |
Data presented reflect past performance. Past performance is no guarantee of future results. Current performance may be higher or lower than the performance shown. Investment return and principal value will fluctuate, and redemption value may be more or less than original cost. To obtain performance data current to the most recent month end, please call 1-800-345-2021 or visit americancentury.com. As interest rates rise, bond values will decline.
Unless otherwise indicated, performance reflects Investor Class shares; performance for other share classes will vary due to differences in fee structure. For information about other share classes available, please consult the prospectus. Data assumes reinvestment of dividends and capital gains, and none of the charts reflect the deduction of taxes that a shareholder would pay on fund distributions or the redemption of fund shares. Returns for the index are provided for comparison. The fund’s total returns include operating expenses (such as transaction costs and management fees) that reduce returns, while the total returns of the index do not.
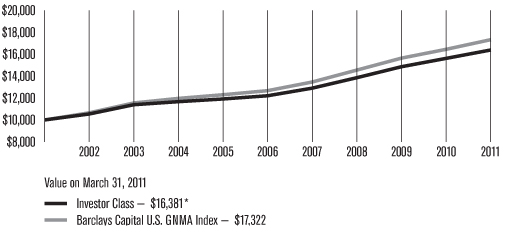
| Growth of $10,000 Over 10 Years |
| $10,000 investment made March 31, 2001 |
* Ending value would have been lower if a portion of the management fee had not been waived.
| Total Annual Fund Operating Expenses |
| Investor Class | Institutional Class | A Class | C Class | R Class |
| 0.57% | 0.37% | 0.82% | 1.57% | 1.07% |
The total annual fund operating expenses shown is as stated in the fund’s prospectus current as of the date of this report. The prospectus may vary from the expense ratio shown elsewhere in this report because it is based on a different time period, includes acquired fund fees and expenses, and, if applicable, does not include fee waivers or expense reimbursements.
Data presented reflect past performance. Past performance is no guarantee of future results. Current performance may be higher or lower than the performance shown. Investment return and principal value will fluctuate, and redemption value may be more or less than original cost. To obtain performance data current to the most recent month end, please call 1-800-345-2021 or visit americancentury.com. As interest rates rise, bond values will decline.
Unless otherwise indicated, performance reflects Investor Class shares; performance for other share classes will vary due to differences in fee structure. For information about other share classes available, please consult the prospectus. Data assumes reinvestment of dividends and capital gains, and none of the charts reflect the deduction of taxes that a shareholder would pay on fund distributions or the redemption of fund shares. Returns for the index are provided for comparison. The fund’s total returns include operating expenses (such as transaction costs and management fees) that reduce returns, while the total returns of the index do not.
Portfolio Managers: Hando Aguilar, Dan Shiffman, and Bob Gahagan
Performance Summary
Ginnie Mae returned 4.90%* for the fiscal year ended March 31, 2011, compared with the 5.35% return of its benchmark, the Barclays Capital U.S. GNMA Index. See page 4 for additional performance comparisons. Fund returns reflect operating expenses, while index returns do not.
Market Review
Mortgage-backed securities (MBS) enjoyed solid gains for the 12-month period. Mortgage rates declined throughout the first half of the period, but after reaching historically low levels in October, they rose sharply through the end of 2010 and finished the period only slightly lower than where they began. Although refinancing activity picked up as mortgage rates fell, tight lending standards and a moribund housing market limited the increase in refinancing volumes. The modest overall decline in interest rates and a benign refinancing environment provided a favorable backdrop for MBS.
Within the mortgage market, GNMA securities were among the better performers, outpacing both the broad fixed-income indices and government agency MBS such as those issued by Freddie Mac and Fannie Mae. Demand for the higher credit quality of GNMA securities, particularly from banks and overseas investors, helped GNMAs outperform during the period.
Portfolio Positioning
Given the interest rate volatility in the mortgage market throughout the period, we made some adjustments to reduce the portfolio’s overall risk profile. Toward this end, we maintained a duration (a measure of interest rate sensitivity) that was in line with that of the benchmark index. In addition, we focused on seasoned MBS that typically have less price volatility and prepayment risk.
From a coupon (i.e., mortgage interest rate) perspective, we held an overweight position in higher-coupon mortgages (5.5%–6%), with a corresponding underweight position in current-coupon securities (4.5%). This positioning added value as higher-coupon mortgages outperformed, in part because refinancing activity among mortgages with 5.5% to 6% coupons was especially muted during the 12 months.
The fund benefited from an emphasis on single-issuer GNMA securities over bonds with multiple originators. Single-issuer securities provide greater opportunities to invest in securities that have the specific characteristics we seek. The exception to this strategy was in the intermediate-to-high coupon segment, where we held an overweight position in multi-issuer securities. This positioning was designed to diversify away some of the prepayment risk of higher-coupon bonds—by investing in multi-issuer bonds, the portfolio is not overexposed to the prepayment practices of any one mortgage servicer.
* All fund returns referenced in this commentary are for Investor Class shares.
Throughout the period, we avoided 15-year mortgage-backed securities, which comprise approximately 3% of the index. In a constrained mortgage environment with prepayments generally in check, we preferred to clip the higher coupon of 30-year mortgages over 15-year mortgages.
We modestly increased the fund’s holdings of collateralized mortgage obligations (CMOs) during the one-year period, boosting the position to about 7% of the portfolio by the end of the period. The fund’s CMO holdings generated mixed results overall. The fund also held a small position in adjustable-rate mortgages (ARMs), which benefited from increased demand over the latter half of the period amid growing expectations for higher interest rates going forward.
Finally, the fund was also positioned to benefit from a flatter yield curve (a narrower gap between short- and long-term Treasury bond yields). This positioning was put in place in late 2009, when the spread between the two-year and 30-year Treasury yields was near its widest level ever. However, during the 12-month period, this positioning had little impact on performance as the slope of the yield curve remained largely the same.
Outlook
The U.S. economy has reached a period of transition. A growing body of economic evidence indicates that a recovery is underway, with employment figures becoming the latest data to turn consistently positive. However, June brings the end of the Federal Reserve’s (the Fed’s) most recent quantitative easing measures, and it is unclear whether the recovery will continue at its current pace in the absence of the Fed’s stimulus efforts.
The MBS market is also in transition as the future of Fannie Mae and Freddie Mac, both of which remain under government conservatorship, is still uncertain. The likely outcome, though, is that Fannie and Freddie’s presence in the mortgage market will be gradually reduced and ultimately phased out entirely. We expect this to contribute to a further tightening in mortgage lending standards, and we also anticipate that MBS will become a smaller component of the overall fixed-income market.
| MARCH 31, 2011 |
| Portfolio at a Glance | |
| Average Duration (effective) | 4.7 years |
| Weighted Average Life | 5.5 years |
| | |
30-Day SEC Yields(1) | |
| Investor Class | 3.52% |
| Institutional Class | 3.73% |
| A Class | 3.12% |
| C Class | 2.52% |
| R Class | 3.02% |
| (1) | Yields would have been lower if a portion of the management fee had not been waived. |
| | |
| Types of Investments in Portfolio | % of fund investments |
| U.S. Government Agency Mortgage-Backed Securities (all GNMAs) | 92.3% |
| U.S. Government Agency Collateralized Mortgage Obligations (all GNMAs) | 6.7% |
| Temporary Cash Investments | 1.0% |
Shareholder Fee Example (Unaudited) |
Fund shareholders may incur two types of costs: (1) transaction costs, including sales charges (loads) on purchase payments and redemption/exchange fees; and (2) ongoing costs, including management fees; distribution and service (12b-1) fees; and other fund expenses. This example is intended to help you understand your ongoing costs (in dollars) of investing in your fund and to compare these costs with the ongoing cost of investing in other mutual funds.
The example is based on an investment of $1,000 made at the beginning of the period and held for the entire period from October 1, 2010 to March 31, 2011.
Actual Expenses
The table provides information about actual account values and actual expenses for each class. You may use the information, together with the amount you invested, to estimate the expenses that you paid over the period. First, identify the share class you own. Then simply divide your account value by $1,000 (for example, an $8,600 account value divided by $1,000 = 8.6), then multiply the result by the number under the heading “Expenses Paid During Period” to estimate the expenses you paid on your account during this period.
If you hold Investor Class shares of any American Century Investments fund, or Institutional Class shares of the American Century Diversified Bond Fund, in an American Century Investments account (i.e., not a financial intermediary or retirement plan account), American Century Investments may charge you a $12.50 semiannual account maintenance fee if the value of those shares is less than $10,000. We will redeem shares automatically in one of your accounts to pay the $12.50 fee. In determining your total eligible investment amount, we will include your investments in all personal accounts (including American Century Investments Brokerage accounts) registered under your Social Security number. Personal accounts include individual accounts, joint accounts, UGMA/UTMA accounts, personal trusts, Coverdell Education Savings Accounts and IRAs (including traditional, Roth, Rollover, SEP-, SARSEP- and SIMPLE-IRAs), and certain other retirement accounts. If you have only business, business retirement, employer-sponsored or American Century Investments Brokerage accounts, you are currently not subject to this fee. We will not charge the fee as long as you choose to manage your accounts exclusively online. If you are subject to the Account Maintenance Fee, your account value could be reduced by the fee amount.
Hypothetical Example for Comparison Purposes
The table also provides information about hypothetical account values and hypothetical expenses based on the actual expense ratio of each class of your fund and an assumed rate of return of 5% per year before expenses, which is not the actual return of a fund’s share class. The hypothetical account values and expenses may not be used to estimate the actual ending account balance or expenses you paid for the period. You may use this information to compare the ongoing costs of investing in your fund and other funds. To do so, compare this 5% hypothetical example with the 5% hypothetical examples that appear in the shareholder reports of the other funds.
Please note that the expenses shown in the table are meant to highlight your ongoing costs only and do not reflect any transactional costs, such as sales charges (loads) or redemption/exchange fees. Therefore, the table is useful in comparing ongoing costs only, and will not help you determine the relative total costs of owning different funds. In addition, if these transactional costs were included, your costs would have been higher.
| | | | | |
| | Beginning Account Value 10/1/10 | Ending Account Value 3/31/11 | Expenses Paid During Period(1) 10/1/10 - 3/31/11 | Annualized Expense Ratio(1) |
| Actual |
| Investor Class (after waiver) | $1,000 | $1,007.40 | $2.65 | 0.53% |
| Investor Class (before waiver) | $1,000 | $1,007.40(2) | $2.80 | 0.56% |
| Institutional Class (after waiver) | $1,000 | $1,007.50 | $1.65 | 0.33% |
| Institutional Class (before waiver) | $1,000 | $1,007.50(2) | $1.80 | 0.36% |
| A Class (after waiver) | $1,000 | $1,006.10 | $3.90 | 0.78% |
| A Class (before waiver) | $1,000 | $1,006.10(2) | $4.05 | 0.81% |
| C Class (after waiver) | $1,000 | $1,002.40 | $7.64 | 1.53% |
| C Class (before waiver) | $1,000 | $1,002.40(2) | $7.79 | 1.56% |
| R Class (after waiver) | $1,000 | $1,004.90 | $5.15 | 1.03% |
| R Class (before waiver) | $1,000 | $1,004.90(2) | $5.30 | 1.06% |
| Hypothetical |
| Investor Class (after waiver) | $1,000 | $1,022.29 | $2.67 | 0.53% |
| Investor Class (before waiver) | $1,000 | $1,022.14 | $2.82 | 0.56% |
| Institutional Class (after waiver) | $1,000 | $1,023.29 | $1.66 | 0.33% |
| Institutional Class (before waiver) | $1,000 | $1,023.14 | $1.82 | 0.36% |
| A Class (after waiver) | $1,000 | $1,021.04 | $3.93 | 0.78% |
| A Class (before waiver) | $1,000 | $1,020.89 | $4.08 | 0.81% |
| C Class (after waiver) | $1,000 | $1,017.30 | $7.70 | 1.53% |
| C Class (before waiver) | $1,000 | $1,017.15 | $7.85 | 1.56% |
| R Class (after waiver) | $1,000 | $1,019.80 | $5.19 | 1.03% |
| R Class (before waiver) | $1,000 | $1,019.65 | $5.34 | 1.06% |
| (1) | Expenses are equal to the class’s annualized expense ratio listed in the table above, multiplied by the average account value over the period, multiplied by 182, the number of days in the most recent fiscal half-year, divided by 365, to reflect the one-half year period. |
| (2) | Ending account value assumes the return earned after waiver and would have been lower if a portion of the management fee had not been waived. |
| | | |
| | Principal Amount | Value |
U.S. Government Agency Mortgage-Backed Securities(1) — 98.0% |
| ADJUSTABLE-RATE U.S. GOVERNMENT AGENCY MORTGAGE-BACKED SECURITIES — 2.0% |
| GNMA, VRN, 1.88%, 4/1/12 | $31,011,079 | $31,914,885 |
| FIXED-RATE U.S. GOVERNMENT AGENCY MORTGAGE-BACKED SECURITIES — 96.0% |
GNMA, 4.00%, settlement date 4/15/11(2) | 85,000,000 | 84,840,625 |
GNMA, 4.50%, settlement date 4/15/11(2) | 13,000,000 | 13,392,028 |
| GNMA, 4.00%, 12/20/39 to 11/20/40 | 73,854,601 | 73,857,011 |
GNMA, 4.50%, 7/15/33 to 9/15/40(3) | 260,854,299 | 269,547,938 |
GNMA, 5.00%, 6/15/33 to 6/20/40(3) | 391,824,739 | 417,276,041 |
GNMA, 5.50%, 4/15/33 to 1/20/40(3) | 341,690,628 | 371,014,051 |
GNMA, 6.00%, 7/20/16 to 2/20/39(3) | 177,947,523 | 195,107,808 |
GNMA, 6.50%, 6/15/23 to 11/15/38(3) | 45,258,091 | 51,218,826 |
GNMA, 7.00%, 5/15/17 to 12/20/29(3) | 8,407,432 | 9,702,732 |
GNMA, 7.25%, 4/15/23 to 6/15/23(3) | 58,071 | 66,731 |
GNMA, 7.50%, 6/15/13 to 11/15/31(3) | 6,634,807 | 7,706,089 |
GNMA, 7.65%, 6/15/16 to 12/15/16(3) | 75,528 | 83,924 |
GNMA, 7.75%, 11/15/22 to 6/20/23(3) | 51,432 | 59,475 |
GNMA, 7.77%, 4/15/20 to 6/15/20(3) | 217,429 | 249,508 |
GNMA, 7.85%, 9/20/22(3) | 30,657 | 35,492 |
GNMA, 7.89%, 9/20/22(3) | 13,524 | 15,674 |
GNMA, 7.98%, 6/15/19(3) | 54,480 | 59,654 |
GNMA, 8.00%, 2/20/17 to 7/20/30(3) | 1,949,745 | 2,274,877 |
GNMA, 8.15%, 2/15/21(3) | 55,266 | 64,623 |
GNMA, 8.25%, 10/20/16 to 2/15/22(3) | 445,907 | 507,654 |
GNMA, 8.35%, 11/15/20(3) | 35,730 | 41,783 |
GNMA, 8.50%, 1/20/13 to 12/15/30(3) | 1,616,633 | 1,898,538 |
GNMA, 8.75%, 1/15/17 to 7/15/27(3) | 147,268 | 168,423 |
GNMA, 9.00%, 7/20/15 to 1/15/25(3) | 995,491 | 1,143,583 |
GNMA, 9.25%, 9/15/16 to 3/15/25(3) | 205,404 | 235,637 |
GNMA, 9.50%, 5/15/16 to 7/20/25(3) | 418,442 | 486,560 |
GNMA, 9.75%, 8/15/17 to 11/20/21(3) | 66,385 | 75,736 |
GNMA, 10.00%, 3/15/16 to 1/15/22(3) | 44,293 | 49,036 |
GNMA, 10.25%, 7/15/12 to 2/15/19(3) | 8,129 | 8,193 |
GNMA, 10.50%, 3/15/14 to 4/20/19(3) | 56,772 | 60,303 |
GNMA, 11.00%, 2/15/16 to 6/15/20(3) | 31,896 | 35,913 |
GNMA, 11.25%, 2/20/16(3) | 1,742 | 1,966 |
GNMA, 11.50%, 5/15/13 to 10/20/18(3) | 3,700 | 3,832 |
GNMA, 12.00%, 12/15/12(3) | 2,063 | 2,081 |
GNMA, 12.25%, 2/15/14(3) | 2,632 | 2,657 |
GNMA, 12.50%, 11/20/13 to 12/15/13(3) | 6,206 | 6,262 |
GNMA, 13.00%, 12/15/12 to 8/15/15(3) | 32,772 | 33,189 |
GNMA, 13.50%, 10/15/12 to 8/15/14(3) | 13,471 | 13,646 |
GNMA, 13.75%, 8/15/14(3) | 3,784 | 3,823 |
GNMA, 14.50%, 10/15/12 to 12/15/12(3) | 6,133 | 6,196 |
GNMA, 15.00%, 7/15/11 to 9/15/12(3) | 3,855 | 3,911 |
| TOTAL FIXED-RATE U.S. GOVERNMENT AGENCY MORTGAGE-BACKED SECURITIES | 1,501,362,029 |
TOTAL U.S. GOVERNMENT AGENCY MORTGAGE-BACKED SECURITIES (Cost $1,482,852,620) | 1,533,276,914 |
U.S. Government Agency Collateralized Mortgage Obligations(1) — 7.1% |
GNMA, Series 1998-6, Class FA, VRN, 0.76%, 4/18/11, resets monthly off the 1-month LIBOR plus 0.51% with a cap of 9.00%(3) | 2,906,357 | 2,911,904 |
GNMA, Series 1998-17, Class F, VRN, 0.75%, 4/18/11, resets monthly off the 1-month LIBOR plus 0.50% with a cap of 9.00%(3) | 357,025 | 357,718 |
GNMA, Series 2000-22, Class FG, VRN, 0.45%, 4/18/11, resets monthly off the 1-month LIBOR plus 0.20% with a cap of 10.00%(3) | $134,317 | $133,920 |
GNMA, Series 2001-59, Class FD, VRN, 0.75%, 4/18/11, resets monthly off the 1-month LIBOR plus 0.50% with a cap of 8.50%(3) | 1,667,733 | 1,674,286 |
GNMA, Series 2001-62, Class FB, VRN, 0.75%, 4/18/11, resets monthly off the 1-month LIBOR plus 0.50% with a cap of 8.50%(3) | 3,381,166 | 3,392,324 |
GNMA, Series 2002-13, Class FA, VRN, 0.75%, 4/18/11, resets monthly off the 1-month LIBOR plus 0.50% with a cap of 8.50%(3) | 1,916,779 | 1,922,707 |
GNMA, Series 2002-24, Class FA, VRN, 0.75%, 4/18/11, resets monthly off the 1-month LIBOR plus 0.50% with a cap of 8.50%(3) | 3,433,208 | 3,441,550 |
GNMA, Series 2002-29, Class FA SEQ, VRN, 0.60%, 4/20/11, resets monthly off the 1-month LIBOR plus 0.35% with a cap of 9.00%(3) | 1,025,608 | 1,022,840 |
GNMA, Series 2002-31, Class FW, VRN, 0.65%, 4/18/11, resets monthly off the 1-month LIBOR plus 0.40% with a cap of 8.50%(3) | 1,060,672 | 1,061,148 |
GNMA, Series 2003-42, Class FW, VRN, 0.60%, 4/20/11, resets monthly off the 1-month LIBOR plus 0.35% with a cap of 7.00%(3) | 1,705,947 | 1,703,331 |
GNMA, Series 2003-66, Class EH, 5.00%, 5/20/32(3) | 17,650,000 | 18,888,658 |
GNMA, Series 2003-66, Class HF, VRN, 0.70%, 4/20/11, resets monthly off the 1-month LIBOR plus 0.45% with a cap of 7.50% | 3,243,749 | 3,259,645 |
| GNMA, Series 2003-85, Class A SEQ, 4.50%, 9/20/27 | 317,776 | 318,305 |
| GNMA, Series 2004-30, Class PB, 5.00%, 5/20/29 | 668,382 | 668,061 |
GNMA, Series 2004-30, Class PD, 5.00%, 2/20/33(3) | 22,223,224 | 23,876,827 |
GNMA, Series 2004-39, Class XF SEQ, VRN, 0.50%, 4/18/11, resets monthly off the 1-month LIBOR plus 0.25% with a cap of 7.50%(3) | 2,285,935 | 2,282,547 |
| GNMA, Series 2007-5, Class FA, VRN, 0.39%, 4/20/11 | 19,670,984 | 19,504,648 |
| GNMA, Series 2009-45, Class AB, 5.00%, 12/20/29 | 3,847,196 | 3,898,833 |
| GNMA, Series 2009-45, Class PA, 4.50%, 1/16/31 | 9,834,527 | 10,324,297 |
| GNMA, Series 2010-60, Class DY SEQ, 4.00%, 5/16/25 | 10,000,000 | 9,987,744 |
TOTAL U.S. GOVERNMENT AGENCY COLLATERALIZED MORTGAGE OBLIGATIONS (Cost $107,066,038) | 110,631,293 |
| Temporary Cash Investments — 1.1% |
JPMorgan U.S. Treasury Plus Money Market Fund Agency Shares(3) | 319,289 | 319,289 |
Repurchase Agreement, Bank of America Securities, LLC, (collateralized by various U.S. Treasury obligations, 0.375%, 10/31/12, valued at $16,583,884), in a joint trading account at 0.06%, dated 3/31/11, due 4/1/11 (Delivery value $16,242,027) | 16,242,000 |
TOTAL TEMPORARY CASH INVESTMENTS(Cost $16,561,289) | 16,561,289 |
TOTAL INVESTMENT SECURITIES — 106.2%(Cost $1,606,479,947) | 1,660,469,496 |
| OTHER ASSETS AND LIABILITIES — (6.2)% | (96,234,106) |
| TOTAL NET ASSETS — 100.0% | $1,564,235,390 |
| Futures Contracts |
| Contracts Purchased | Expiration Date | Underlying Face Amount at Value | Unrealized Gain (Loss) |
| 265 | U.S. Long Bond | June 2011 | $31,849,688 | $49,091 |
| |
| Contracts Sold | Expiration Date | Underlying Face Amount at Value | Unrealized Gain (Loss) |
| 837 | U.S. Treasury 2-Year Notes | June 2011 | $182,570,625 | $(67,337) |
Notes to Schedule of Investments
GNMA = Government National Mortgage Association
LIBOR = London Interbank Offered Rate
resets = The frequency with which a security’s coupon changes, based on current market conditions or an underlying index. The more frequently a security resets, the less risk the investor is taking that the coupon will vary significantly from current market rates.
SEQ = Sequential Payer
VRN = Variable Rate Note. Interest reset date is indicated. Rate shown is effective at the period end.
| (1) | Final maturity date indicated, unless otherwise noted. |
| (3) | Security, or a portion thereof, has been segregated for forward commitments and/or futures contracts. At the period end, the aggregate value of securities pledged was $312,653,000. |
See Notes to Financial Statements.
Statement of Assets and Liabilities |
| MARCH 31, 2011 | |
| Assets | |
| Investment securities, at value (cost of $1,606,479,947) | | | $1,660,469,496 | |
| Cash | | | 34,078 | |
| Receivable for investments sold | | | 5,175,938 | |
| Receivable for capital shares sold | | | 845,352 | |
| Interest receivable | | | 6,220,053 | |
| | | | 1,672,744,917 | |
| | | | | |
| Liabilities | | | | |
| Payable for investments purchased | | | 103,968,132 | |
| Payable for capital shares redeemed | | | 2,953,705 | |
| Payable for variation margin on futures contracts | | | 52,313 | |
| Accrued management fees | | | 697,610 | |
| Distribution and service fees payable | | | 38,604 | |
| Dividends payable | | | 799,163 | |
| | | | 108,509,527 | |
| | | | | |
| Net Assets | | | $1,564,235,390 | |
| | | | | |
| Net Assets Consist of: | |
| Capital paid in | | | $1,549,725,261 | |
| Undistributed net investment income | | | 390 | |
| Accumulated net realized loss | | | (39,461,564 | ) |
| Net unrealized appreciation | | | 53,971,303 | |
| | | | $1,564,235,390 | |
| | | Net assets | | Shares outstanding | | Net asset value per share |
| Investor Class | | $1,382,165,477 | | | 127,559,145 | | | $10.84 | |
| Institutional Class | | $12,313,000 | | | 1,136,442 | | | $10.83 | |
| A Class | | $164,395,354 | | | 15,171,894 | | | $10.84 | * |
| C Class | | $2,586,949 | | | 238,720 | | | $10.84 | |
| R Class | | $2,774,610 | | | 256,163 | | | $10.83 | |
* Maximum offering price $11.35 (net asset value divided by 0.9550)
See Notes to Financial Statements.
| YEAR ENDED MARCH 31, 2011 | |
| Investment Income (Loss) | |
| Income: | | | |
| Interest | | | $66,562,378 | |
| | | | | |
| Expenses: | | | | |
| Management fees | | | 8,942,466 | |
| Distribution and service fees: | | | | |
| A Class | | | 419,115 | |
| C Class | | | 16,626 | |
| R Class | | | 11,693 | |
| Trustees’ fees and expenses | | | 58,053 | |
| Other expenses | | | 46,492 | |
| | | | 9,494,445 | |
| Fees waived | | | (438,480 | ) |
| | | | 9,055,965 | |
| | | | | |
| Net investment income (loss) | | | 57,506,413 | |
| | | | | |
| Realized and Unrealized Gain (Loss) | | | | |
| Net realized gain (loss) on: | | | | |
| Investment transactions | | | 8,529,544 | |
| Futures contract transactions | | | (403,827 | ) |
| | | | 8,125,717 | |
| | | | | |
| Change in net unrealized appreciation (depreciation) on: | | | | |
| Investments | | | 10,431,918 | |
| Futures contracts | | | 13,763 | |
| | | | 10,445,681 | |
| | | | | |
| Net realized and unrealized gain (loss) | | | 18,571,398 | |
| | | | | |
| Net Increase (Decrease) in Net Assets Resulting from Operations | | | $76,077,811 | |
See Notes to Financial Statements.
Statement of Changes in Net Assets |
| YEARS ENDED MARCH 31, 2011 AND MARCH 31, 2010 | |
| Increase (Decrease) in Net Assets | | 2011 | | | 2010 | |
| Operations | |
| Net investment income (loss) | | | $57,506,413 | | | | $57,288,199 | |
| Net realized gain (loss) | | | 8,125,717 | | | | 12,245,635 | |
| Change in net unrealized appreciation (depreciation) | | | 10,445,681 | | | | 8,040,561 | |
| Net increase (decrease) in net assets resulting from operations | | | 76,077,811 | | | | 77,574,395 | |
| | | | | | | | | |
| Distributions to Shareholders | |
| From net investment income: | | | | | | | | |
| Investor Class | | | (58,283,990 | ) | | | (58,932,371 | ) |
| Institutional Class | | | (644,563 | ) | | | (480,395 | ) |
| A Class | | | (6,380,868 | ) | | | (6,770,082 | ) |
| C Class | | | (50,612 | ) | | | (66 | ) |
| R Class | | | (83,161 | ) | | | (45,454 | ) |
| Decrease in net assets from distributions | | | (65,443,194 | ) | | | (66,228,368 | ) |
| | | | | | | | | |
| Capital Share Transactions | |
| Net increase (decrease) in net assets from capital share transactions | | | (39,776,522 | ) | | | 90,094,753 | |
| | | | | | | | | |
| | | | | | | | | |
| Net increase (decrease) in net assets | | | (29,141,905 | ) | | | 101,440,780 | |
| | | | | | | | | |
| Net Assets | |
| Beginning of period | | | 1,593,377,295 | | | | 1,491,936,515 | |
| End of period | | | $1,564,235,390 | | | | $1,593,377,295 | |
| | | | | | | | | |
| Undistributed net investment income | | | $390 | | | | $12,768 | |
See Notes to Financial Statements.
Notes to Financial Statements |
MARCH 31, 2011
1. Organization
American Century Government Income Trust (the trust) is registered under the Investment Company Act of 1940, as amended (the 1940 Act), as an open-end management investment company and is organized as a Massachusetts business trust. Ginnie Mae Fund (the fund) is one fund in a series issued by the trust. The fund is diversified as defined under the 1940 Act. The fund’s investment objective is to seek high current income while maintaining liquidity and safety of principal by investing primarily in Government National Mortgage Association certificates. In addition, the fund may buy other U.S. government securities, including U.S. Treasury securities and other securities issued or guaranteed by the U.S. government and its agencies and instrumentalities.
The fund is authorized to issue the Investor Class, the Institutional Class, the A Class (formerly Advisor Class), the C Class and the R Class. The A Class may incur an initial sales charge. The A Class and C Class may be subject to a contingent deferred sales charge. The share classes differ principally in their respective sales charges and distribution and shareholder servicing expenses and arrangements. The Institutional Class is made available to institutional shareholders or through financial intermediaries whose clients do not require the same level of shareholder and administrative services as shareholders of other classes. As a result, the Institutional Class is charged a lower unified management fee. Sale of the C Class commenced on March 1, 2010.
2. Significant Accounting Policies
The following is a summary of significant accounting policies consistently followed by the fund in preparation of its financial statements. The financial statements are prepared in conformity with accounting principles generally accepted in the United States of America, which may require management to make certain estimates and assumptions at the date of the financial statements. Actual results could differ from these estimates.
Investment Valuations — The fund determines the fair value of its investments and computes its net asset value per share as of the close of regular trading (usually 4 p.m. Eastern time) on the New York Stock Exchange (NYSE) on each day the NYSE is open.
Debt securities maturing in greater than 60 days at the time of purchase are valued at the evaluated mean as provided by independent pricing services or at the mean of the most recent bid and asked prices as provided by investment dealers. Debt securities maturing within 60 days at the time of purchase may be valued at cost, plus or minus any amortized discount or premium or at the evaluated mean as provided by an independent pricing service. Evaluated mean prices are commonly derived through utilization of market models, which may consider, among other factors, trade data, quotations from dealers and active market makers, relevant yield curve and spread data, related sector levels, creditworthiness, and other relevant market information on the same or comparable securities.
Investments in open-end management investment companies are valued at the reported net asset value per share. Repurchase agreements are valued at cost. Exchange-traded futures contracts are valued at the settlement price as provided by the appropriate clearing corporation.
If the fund determines that the market price for a portfolio security is not readily available or the valuation methods mentioned above do not reflect a security’s fair value, such security is valued as determined in good faith by the Board of Trustees or its designee, in accordance with procedures adopted by the Board of Trustees. Circumstances that may cause the fund to use these procedures to value a security include, but are not limited to: a security has been declared in default; trading in a security has been halted during the trading day; there is a foreign market holiday and no trading occurred; or an event occurred between the close of a foreign exchange and the NYSE that may affect the value of a security.
Security Transactions — Security transactions are accounted for as of the trade date. Net realized gains and losses are determined on the identified cost basis, which is also used for federal income tax purposes.
Investment Income — Interest income is recorded on the accrual basis and includes paydown gain (loss) and accretion of discounts and amortization of premiums.
When-Issued and Forward Commitments — The fund may engage in securities transactions on a when-issued or forward commitment basis. In these transactions, the securities’ prices and yields are fixed on the date of the commitment. In a when-issued transaction, the payment and delivery are scheduled for a future date and during this period, securities are subject to market fluctuations. In a forward commitment transaction, the fund may sell a security and at the same time make a commitment to purchase the same security at a future date at a specified price. Conversely, the fund may purchase a security and at the same time make a commitment to sell the same security at a future date at a specified price. These types of transactions are executed simultaneously in what are known as “roll” transactions. The fund will segregate cash, cash equivalents or other appropriate liquid securities on its records in amounts sufficient to meet the purchase price. The fund accounts for “roll” transactions as purchases and sales.
Repurchase Agreements — The fund may enter into repurchase agreements with institutions that American Century Investment Management, Inc. (ACIM) (the investment advisor) has determined are creditworthy pursuant to criteria adopted by the Board of Trustees. The fund requires that the collateral, represented by securities, received in a repurchase transaction be transferred to the custodian in a manner sufficient to enable the fund to obtain those securities in the event of a default under the repurchase agreement. ACIM monitors, on a daily basis, the securities transferred to ensure the value, including accrued interest, of the securities under each repurchase agreement is equal to or greater than amounts owed to the fund under each repurchase agreement.
Joint Trading Account — Pursuant to an Exemptive Order issued by the Securities and Exchange Commission, the fund, along with certain other funds in the American Century Investments family of funds, may transfer uninvested cash balances into a joint trading account. These balances are invested in one or more repurchase agreements that are collateralized by U.S. Treasury or Agency obligations.
Income Tax Status — It is the fund’s policy to distribute substantially all net investment income and net realized gains to shareholders and to otherwise qualify as a regulated investment company under provisions of the Internal Revenue Code. The fund is no longer subject to examination by tax authorities for years prior to 2008. At this time, management believes there are no uncertain tax positions which, based on their technical merit, would not be sustained upon examination and for which it is reasonably possible that the total amounts of unrecognized tax benefits will significantly change in the next twelve months. Accordingly, no provision has been made for federal or state income taxes.
Multiple Class — All shares of the fund represent an equal pro rata interest in the net assets of the class to which such shares belong, and have identical voting, dividend, liquidation and other rights and the same terms and conditions, except for class specific expenses and exclusive rights to vote on matters affecting only individual classes. Income, non-class specific expenses, and realized and unrealized capital gains and losses of the fund are allocated to each class of shares based on their relative net assets.
Distributions to Shareholders — Distributions from net investment income are declared daily and paid monthly. Distributions from net realized gains, if any, are generally declared and paid annually.
Indemnifications — Under the trust’s organizational documents, its officers and trustees are indemnified against certain liabilities arising out of the performance of their duties to the fund. In addition, in the normal course of business, the fund enters into contracts that provide general indemnifications. The maximum exposure under these arrangements is unknown as this would involve future claims that may be made against a fund. The risk of material loss from such claims is considered by management to be remote.
3. Fees and Transactions with Related Parties
Management Fees — The trust has entered into a management agreement with ACIM, under which ACIM provides the fund with investment advisory and management services in exchange for a single, unified management fee (the fee) per class. The agreement provides that all expenses of managing and operating the fund, except distribution and service fees, brokerage expenses, taxes, interest, fees and expenses of the independent trustees (including legal counsel fees), and extraordinary expenses, will be paid by ACIM. The fee is computed and accrued daily based on each class’s daily net assets and paid monthly in arrears. The fee consists of (1) an Investment Category Fee based on the daily net assets of the fund and certain other accounts managed by the investment advisor that are in the same broad investment category as the fund and (2) a Complex Fee based on the assets of all the funds in the American Century Investments family of funds. The rates for the Investment Category Fee range from 0.2425% to 0.3600%. The rates for the Complex Fee range from 0.2500% to 0.3100% for the Investor Class, A Class, C Class and R Class. The Institutional Class is 0.2000% less at each point within the Complex Fee range. From April 1, 2010 through July 31, 2010, the investment advisor voluntarily agreed to waive 0.025% of its management fee. Effective August 1, 2010, the investment advisor voluntarily agreed to waive 0.028% of its management fee. The investment advisor expects the fee waiver to continue through July 31, 2011, and cannot terminate it without consulting the Board of Trustees. The total amount of the waiver for each class for the year ended March 31, 2011 was $388,042, $4,068, $45,277, $460 and $633 for the Investor Class, Institutional Class, A Class, C Class and R Class, respectively. The effective annual management fee before waiver for each class for the year ended March 31, 2011 was 0.55% for the Investor Class, A Class, C Class and R Class and 0.35% for the Institutional Class. The effective annual management fee after waiver for each class for the year ended March 31, 2011 was 0.52% for the Investor Class, A Class, C Class and R Class and 0.32% for the Institutional Class.
Distribution and Service Fees — The Board of Trustees has adopted a separate Master Distribution and Individual Shareholder Services Plan for each of the A Class, C Class and R Class (collectively the plans), pursuant to Rule 12b-1 of the 1940 Act. The plans provide that the A Class will pay American Century Investment Services, Inc. (ACIS) an annual distribution and service fee of 0.25%. The plans provide that the C Class will pay ACIS an annual distribution and service fee of 1.00%, of which 0.25% is paid for individual shareholder services and 0.75% is paid for distribution services. The plans provide that the R Class will pay ACIS an annual distribution and service fee of 0.50%. The fees are computed and accrued daily based on each class’s daily net assets and paid monthly in arrears. The fees are used to pay financial intermediaries for distribution and individual shareholder services. Fees incurred under the plans during the year ended March 31, 2011 are detailed in the Statement of Operations.
Related Parties — Certain officers and trustees of the trust are also officers and/or directors of American Century Companies, Inc. (ACC), the parent of the trust’s investment advisor, ACIM, the distributor of the trust, ACIS, and the trust’s transfer agent, American Century Services, LLC.
The fund is eligible to invest in a money market fund for temporary purposes, which is managed by J.P. Morgan Investment Management, Inc. (JPMIM). The fund has a securities lending agreement with JPMorgan Chase Bank (JPMCB) and a mutual funds services agreement with J.P. Morgan Investor Services Co. (JPMIS). JPMCB is a custodian of the fund. JPMIM, JPMIS and JPMCB are wholly owned subsidiaries of JPMorgan Chase & Co. (JPM). JPM is an equity investor in ACC.
4. Investment Transactions
Purchases and sales of investment securities, excluding short-term investments, for the year ended March 31, 2011, were $1,628,748,446 and $1,685,211,850, respectively, all of which are U.S. Treasury and Government Agency obligations.
5. Capital Share Transactions
Transactions in shares of the fund were as follows (unlimited number of shares authorized):
| | | | | | | |
| | | Year ended March 31, 2011 | | | Year ended March 31, 2010(1) | |
| | | Shares | | | Amount | | | Shares | | | Amount | |
| Investor Class | |
| Sold | | | 24,962,522 | | | | $273,145,608 | | | | 34,274,791 | | | | $367,324,551 | |
| Issued in reinvestment of distributions | | | 4,712,805 | | | | 51,577,224 | | | | 4,870,410 | | | | 52,221,499 | |
| Redeemed | | | (33,630,764 | ) | | | (366,579,418 | ) | | | (32,803,453 | ) | | | (351,326,924 | ) |
| | | | (3,955,437 | ) | | | (41,856,586 | ) | | | 6,341,748 | | | | 68,219,126 | |
| Institutional Class | |
| Sold | | | 907,018 | | | | 9,911,787 | | | | 1,269,346 | | | | 13,671,426 | |
| Issued in reinvestment of distributions | | | 43,589 | | | | 477,102 | | | | 34,088 | | | | 365,520 | |
| Redeemed | | | (1,484,847 | ) | | | (16,225,430 | ) | | | (383,503 | ) | | | (4,110,012 | ) |
| | | | (534,240 | ) | | | (5,836,541 | ) | | | 919,931 | | | | 9,926,934 | |
| A Class | | | | | | | | | | | | | | | | |
| Sold | | | 6,965,105 | | | | 76,042,550 | | | | 9,460,117 | | | | 101,309,034 | |
| Issued in reinvestment of distributions | | | 315,711 | | | | 3,456,305 | | | | 458,194 | | | | 4,912,262 | |
| Redeemed | | | (6,872,367 | ) | | | (75,110,888 | ) | | | (8,910,133 | ) | | | (95,549,375 | ) |
| | | | 408,449 | | | | 4,387,967 | | | | 1,008,178 | | | | 10,671,921 | |
| C Class | | | | | | | | | | | | | | | | |
| Sold | | | 323,060 | | | | 3,529,996 | | | | 2,319 | | | | 25,000 | |
| Issued in reinvestment of distributions | | | 3,188 | | | | 34,887 | | | | 6 | | | | 66 | |
| Redeemed | | | (89,853 | ) | | | (979,452 | ) | | | — | | | | — | |
| | | | 236,395 | | | | 2,585,431 | | | | 2,325 | | | | 25,066 | |
| R Class | | | | | | | | | | | | | | | | |
| Sold | | | 127,154 | | | | 1,384,575 | | | | 154,422 | | | | 1,650,125 | |
| Issued in reinvestment of distributions | | | 7,594 | | | | 83,071 | | | | 4,213 | | | | 45,260 | |
| Redeemed | | | (47,844 | ) | | | (524,439 | ) | | | (41,466 | ) | | | (443,679 | ) |
| | | | 86,904 | | | | 943,207 | | | | 117,169 | | | | 1,251,706 | |
| Net increase (decrease) | | | (3,757,929 | ) | | | $(39,776,522 | ) | | | 8,389,351 | | | | $90,094,753 | |
| (1) | March 1, 2010 (commencement of sale) through March 31, 2010 for the C Class. |
6. Fair Value Measurements
The fund’s securities valuation process is based on several considerations and may use multiple inputs to determine the fair value of the positions held by the fund. In conformity with accounting principles generally accepted in the United States of America, the inputs used to determine a valuation are classified into three broad levels as follows:
| • | Level 1 valuation inputs consist of unadjusted quoted prices in an active market for identical securities; |
| • | Level 2 valuation inputs consist of direct or indirect observable market data (including quoted prices for similar securities, evaluations of subsequent market events, interest rates, prepayment speeds, credit risk, etc.); or |
| • | Level 3 valuation inputs consist of unobservable data (including a fund’s own assumptions). |
The level classification is based on the lowest level input that is significant to the fair valuation measurement. The valuation inputs are not necessarily an indication of the risks associated with investing in these securities or other financial instruments.
The following is a summary of the level classifications as of period end. The Schedule of Investments provides additional information on the fund’s portfolio holdings.
| | | Level 1 | | | Level 2 | | | Level 3 | |
| Investment Securities | |
| U.S. Government Agency Mortgage-Backed Securities | | | — | | | | $1,533,276,914 | | | | — | |
| U.S. Government Agency Collateralized Mortgage Obligations | | | — | | | | 110,631,293 | | | | — | |
| Temporary Cash Investments | | | $319,289 | | | | 16,242,000 | | | | — | |
| Total Value of Investment Securities | | | $319,289 | | | | $1,660,150,207 | | | | — | |
| | | | | | | | | | | | | |
| Other Financial Instruments | |
| Total Unrealized Gain (Loss) on Futures Contracts | | | $(18,246 | ) | | | — | | | | — | |
7. Derivative Instruments
Interest Rate Risk — The fund is subject to interest rate risk in the normal course of pursuing its investment objectives. The value of bonds generally declines as interest rates rise. A fund may enter into futures contracts based on a bond index or a specific underlying security. A fund may purchase futures contracts to gain exposure to increases in market value or sell futures contracts to protect against a decline in market value. Upon entering into a futures contract, a fund will segregate cash, cash equivalents or other appropriate liquid securities on its records in amounts sufficient to meet requirements. Subsequent payments (variation margin) are made or received daily, in cash, by a fund. The variation margin is equal to the daily change in the contract value and is recorded as unrealized gains and losses. A fund recognizes a realized gain or loss when the futures contract is closed or expires. Net realized and unrealized gains or losses occurring during the holding period of futures contracts are a component of net realized gain (loss) on futures contract transactions and change in net unrealized appreciation (depreciation) on futures contracts, respectively. One of the risks of entering into futures contracts is the possibility that the change in value of the contract may not correlate with the changes in value of the underlying securities. The interest rate risk derivative instruments held at period end as disclosed on the Schedule of Investments are indicative of the fund’s typical volume during the period.
The value of interest rate risk derivative instruments as of March 31, 2011, is disclosed on the Statement of Assets and Liabilities as a liability of $52,313 in payable for variation margin on futures contracts. For the year ended March 31, 2011, the effect of interest rate risk derivative instruments on the Statement of Operations was $(403,827) in net realized gain (loss) on futures contract transactions and $13,763 in change in net unrealized appreciation (depreciation) on futures contracts.
8. Risk Factors
The fund’s investment process may result in high portfolio turnover, which could mean high transaction costs, affecting both performance and capital gains tax liabilities to investors.
9. Federal Tax Information
The tax character of distributions paid during the years ended March 31, 2011 and
March 31, 2010 were as follows:
| | | | | | | |
| | | 2011 | | | 2010 | |
| Distributions Paid From | | | | | | |
| Ordinary income | | | $65,443,194 | | | | $66,228,368 | |
| Long-term capital gains | | | — | | | | — | |
The book-basis character of distributions made during the year from net investment income or net realized gains may differ from their ultimate characterization for federal income tax purposes. These differences reflect the differing character of certain income items and net realized gains and losses for financial statement and tax purposes, and may result in reclassification among certain capital accounts on the financial statements.
As of March 31, 2011, the federal tax cost of investments and the components of distributable earnings on a tax-basis were as follows:
| | | | | |
| Federal tax cost of investments | | | $1,606,762,671 | |
| Gross tax appreciation of investments | | | $59,560,399 | |
| Gross tax depreciation of investments | | | (5,853,574 | ) |
| Net tax appreciation (depreciation) of investments | | | $53,706,825 | |
| Undistributed ordinary income | | | $390 | |
| Accumulated capital losses | | | $(34,324,737 | ) |
| Capital loss deferrals | | | $(4,872,349 | ) |
The difference between book-basis and tax-basis cost and unrealized appreciation (depreciation) is attributable primarily to the tax deferral of losses on wash sales and the realization for tax purposes of unrealized gains (losses) on futures contracts.
The accumulated capital losses represent net capital loss carryovers that may be used to offset future realized capital gains for federal income tax purposes. Future capital loss carryover utilization in any given year may be subject to Internal Revenue Code limitations. Capital loss carryovers expire as follows:
| | | | |
| 2012 | 2013 | 2014 | 2015 |
| $(4,170,582) | $(11,922,927) | $(10,878,793) | $(7,352,435) |
The capital loss deferral represents net capital losses incurred in the five-month period ended March 31, 2011. The fund has elected to treat such losses as having been incurred in the following fiscal year for federal income tax purposes.
On December 22, 2010, the Regulated Investment Company Modernization Act of 2010 (the “Act”) was enacted, which changed various technical rules governing the tax treatment of regulated investment companies. The changes are generally effective for taxable years beginning after the date of enactment. Under the Act, the fund will be permitted to carry forward capital losses incurred in taxable years beginning after the date of enactment for an unlimited period. However, any losses incurred during those future taxable years will be required to be utilized prior to the losses incurred in pre-enactment taxable years, which carry an expiration date. As a result of this ordering rule, pre-enactment capital loss carryforwards may be more likely to expire unused.
| Investor Class | |
| For a Share Outstanding Throughout the Years Ended March 31 | |
| | | 2011 | | | 2010 | | | 2009 | | | 2008 | | | 2007 | |
| Per-Share Data | |
| Net Asset Value, Beginning of Period | | | $10.76 | | | | $10.68 | | | | $10.40 | | | | $10.17 | | | | $10.11 | |
| Income From Investment Operations | | | | | | | | | | | | | | | | | | | | |
Net Investment Income (Loss)(1) | | | 0.39 | | | | 0.40 | | | | 0.43 | | | | 0.48 | | | | 0.48 | |
| Net Realized and Unrealized Gain (Loss) | | | 0.13 | | | | 0.14 | | | | 0.30 | | | | 0.25 | | | | 0.08 | |
| Total From Investment Operations | | | 0.52 | | | | 0.54 | | | | 0.73 | | | | 0.73 | | | | 0.56 | |
| Distributions | | | | | | | | | | | | | | | | | | | | |
| From Net Investment Income | | | (0.44 | ) | | | (0.46 | ) | | | (0.45 | ) | | | (0.50 | ) | | | (0.50 | ) |
| Net Asset Value, End of Period | | | $10.84 | | | | $10.76 | | | | $10.68 | | | | $10.40 | | | | $10.17 | |
| | | | | | | | | | | | | | | | | | | | | |
Total Return(2) | | | 4.90 | % | | | 5.12 | % | | | 7.22 | % | | | 7.39 | % | | | 5.69 | % |
| | | | | | | | | | | | | | | | | | | | | |
| Ratios/Supplemental Data | |
Ratio of Operating Expenses to Average Net Assets | | | 0.53 | % | | | 0.54 | % | | | 0.53 | % | | | 0.52 | % | | | 0.57 | % |
Ratio of Operating Expenses to Average Net Assets (Before Expense Waiver) | | | 0.56 | % | | | 0.56 | % | | | 0.57 | % | | | 0.57 | % | | | 0.57 | % |
Ratio of Net Investment Income (Loss) to Average Net Assets | | | 3.57 | % | | | 3.69 | % | | | 4.12 | % | | | 4.73 | % | | | 4.71 | % |
Ratio of Net Investment Income (Loss) to Average Net Assets (Before Expense Waiver) | | | 3.54 | % | | | 3.67 | % | | | 4.08 | % | | | 4.68 | % | | | 4.71 | % |
| Portfolio Turnover Rate | | | 100 | % | | | 171 | % | | | 330 | % | | | 338 | % | | | 410 | % |
| Net Assets, End of Period (in thousands) | | | $1,382,165 | | | | $1,414,742 | | | | $1,336,491 | | | | $1,179,206 | | | | $1,219,743 | |
| (1) | Computed using average shares outstanding throughout the period. |
| (2) | Total returns are calculated based on the net asset value of the last business day. Total returns for periods less than one year are not annualized. |
See Notes to Financial Statements.
| Institutional Class | |
| For a Share Outstanding Throughout the Years Ended March 31 (except as noted) | |
| | | 2011 | | | 2010 | | | 2009 | | | 2008(1) | |
| Per-Share Data | |
| Net Asset Value, Beginning of Period | | | $10.76 | | | | $10.68 | | | | $10.40 | | | | $10.11 | |
| Income From Investment Operations | | | | | | | | | | | | | | | | |
Net Investment Income (Loss)(2) | | | 0.41 | | | | 0.42 | | | | 0.45 | | | | 0.25 | |
| Net Realized and Unrealized Gain (Loss) | | | 0.13 | | | | 0.14 | | | | 0.30 | | | | 0.30 | |
| Total From Investment Operations | | | 0.54 | | | | 0.56 | | | | 0.75 | | | | 0.55 | |
| Distributions | | | | | | | | | | | | | | | | |
| From Net Investment Income | | | (0.47 | ) | | | (0.48 | ) | | | (0.47 | ) | | | (0.26 | ) |
| Net Asset Value, End of Period | | | $10.83 | | | | $10.76 | | | | $10.68 | | | | $10.40 | |
| | | | | | | | | | | | | | | | | |
Total Return(3) | | | 5.02 | % | | | 5.33 | % | | | 7.44 | % | | | 5.45 | % |
| | | | | | | | | | | | | | | | | |
| Ratios/Supplemental Data | |
Ratio of Operating Expenses to Average Net Assets | | | 0.33 | % | | | 0.34 | % | | | 0.33 | % | | | 0.29 | %(4) |
Ratio of Operating Expenses to Average Net Assets (Before Expense Waiver) | | | 0.36 | % | | | 0.36 | % | | | 0.37 | % | | | 0.37 | %(4) |
Ratio of Net Investment Income (Loss) to Average Net Assets | | | 3.77 | % | | | 3.89 | % | | | 4.32 | % | | | 4.86 | %(4) |
Ratio of Net Investment Income (Loss) to Average Net Assets (Before Expense Waiver) | | | 3.74 | % | | | 3.87 | % | | | 4.28 | % | | | 4.78 | %(4) |
| Portfolio Turnover Rate | | | 100 | % | | | 171 | % | | | 330 | % | | | 338 | %(5) |
| Net Assets, End of Period (in thousands) | | | $12,313 | | | | $17,971 | | | | $8,016 | | | | $6,143 | |
| (1) | September 28, 2007 (commencement of sale) through March 31, 2008. |
| (2) | Computed using average shares outstanding throughout the period. |
| (3) | Total returns are calculated based on the net asset value of the last business day. Total returns for periods less than one year are not annualized. |
| (5) | Portfolio turnover is calculated at the fund level. Percentage indicated was calculated for the year ended March 31, 2008. |
See Notes to Financial Statements.
A Class(1) | |
| For a Share Outstanding Throughout the Years Ended March 31 | |
| | | 2011 | | | 2010 | | | 2009 | | | 2008 | | | 2007 | |
| Per-Share Data | |
| Net Asset Value, Beginning of Period | | | $10.76 | | | | $10.68 | | | | $10.40 | | | | $10.17 | | | | $10.11 | |
| Income From Investment Operations | | | | | | | | | | | | | | | | | | | | |
Net Investment Income (Loss)(2) | | | 0.36 | | | | 0.37 | | | | 0.40 | | | | 0.46 | | | | 0.45 | |
| Net Realized and Unrealized Gain (Loss) | | | 0.14 | | | | 0.14 | | | | 0.30 | | | | 0.24 | | | | 0.08 | |
| Total From Investment Operations | | | 0.50 | | | | 0.51 | | | | 0.70 | | | | 0.70 | | | | 0.53 | |
| Distributions | | | | | | | | | | | | | | | | | | | | |
| From Net Investment Income | | | (0.42 | ) | | | (0.43 | ) | | | (0.42 | ) | | | (0.47 | ) | | | (0.47 | ) |
| Net Asset Value, End of Period | | | $10.84 | | | | $10.76 | | | | $10.68 | | | | $10.40 | | | | $10.17 | |
| | | | | | | | | | | | | | | | | | | | | |
Total Return(3) | | | 4.64 | % | | | 4.86 | % | | | 6.96 | % | | | 7.12 | % | | | 5.42 | % |
| | | | | | | | | | | | | | | | | | | | | |
| Ratios/Supplemental Data | |
Ratio of Operating Expenses to Average Net Assets | | | 0.78 | % | | | 0.79 | % | | | 0.78 | % | | | 0.77 | % | | | 0.82 | % |
Ratio of Operating Expenses to Average Net Assets (Before Expense Waiver) | | | 0.81 | % | | | 0.81 | % | | | 0.82 | % | | | 0.82 | % | | | 0.82 | % |
Ratio of Net Investment Income (Loss) to Average Net Assets | | | 3.32 | % | | | 3.44 | % | | | 3.87 | % | | | 4.48 | % | | | 4.46 | % |
Ratio of Net Investment Income (Loss) to Average Net Assets (Before Expense Waiver) | | | 3.29 | % | | | 3.42 | % | | | 3.83 | % | | | 4.43 | % | | | 4.46 | % |
| Portfolio Turnover Rate | | | 100 | % | | | 171 | % | | | 330 | % | | | 338 | % | | | 410 | % |
| Net Assets, End of Period (in thousands) | | | $164,395 | | | | $158,819 | | | | $146,874 | | | | $95,323 | | | | $85,984 | |
| (1) | Prior to March 1, 2010, the A Class was referred to as the Advisor Class. |
| (2) | Computed using average shares outstanding throughout the period. |
| (3) | Total returns are calculated based on the net asset value of the last business day and do not reflect applicable sales charges. Total returns for periods less than one year are not annualized. |
See Notes to Financial Statements.
| C Class | |
| For a Share Outstanding Throughout the Years Ended March 31 (except as noted) | |
| | | 2011 | | | 2010(1) | |
| Per-Share Data | |
| Net Asset Value, Beginning of Period | | | $10.76 | | | | $10.78 | |
| Income From Investment Operations | | | | | | | | |
Net Investment Income (Loss)(2) | | | 0.28 | | | | 0.02 | |
| Net Realized and Unrealized Gain (Loss) | | | 0.13 | | | | (0.01 | ) |
| Total From Investment Operations | | | 0.41 | | | | 0.01 | |
| Distributions | | | | | | | | |
| From Net Investment Income | | | (0.33 | ) | | | (0.03 | ) |
| Net Asset Value, End of Period | | | $10.84 | | | | $10.76 | |
| | | | | | | | | |
Total Return(3) | | | 3.87 | % | | | 0.08 | % |
| | | | | | | | | |
| Ratios/Supplemental Data | |
| Ratio of Operating Expenses to Average Net Assets | | | 1.53 | % | | | 1.54 | %(4) |
Ratio of Operating Expenses to Average Net Assets (Before Expense Waiver) | | | 1.56 | % | | | 1.56 | %(4) |
| Ratio of Net Investment Income (Loss) to Average Net Assets | | | 2.57 | % | | | 2.72 | %(4) |
Ratio of Net Investment Income (Loss) to Average Net Assets (Before Expense Waiver) | | | 2.54 | % | | | 2.70 | %(4) |
| Portfolio Turnover Rate | | | 100 | % | | | 171 | %(5) |
| Net Assets, End of Period (in thousands) | | | $2,587 | | | | $25 | |
| (1) | March 1, 2010 (commencement of sale) through March 31, 2010. |
| (2) | Computed using average shares outstanding throughout the period. |
| (3) | Total returns are calculated based on the net asset value of the last business day and do not reflect applicable sales charges. Total returns for periods less than one year are not annualized. |
| (5) | Portfolio turnover is calculated at the fund level. Percentage indicated was calculated for the year ended March 31, 2010. |
See Notes to Financial Statements.
| R Class | |
| For a Share Outstanding Throughout the Years Ended March 31 (except as noted) | |
| | | 2011 | | | 2010 | | | 2009 | | | 2008(1) | |
| Per-Share Data | |
| Net Asset Value, Beginning of Period | | | $10.76 | | | | $10.68 | | | | $10.40 | | | | $10.11 | |
| Income From Investment Operations | | | | | | | | | | | | | | | | |
Net Investment Income (Loss)(2) | | | 0.34 | | | | 0.34 | | | | 0.36 | | | | 0.22 | |
| Net Realized and Unrealized Gain (Loss) | | | 0.12 | | | | 0.14 | | | | 0.32 | | | | 0.29 | |
| Total From Investment Operations | | | 0.46 | | | | 0.48 | | | | 0.68 | | | | 0.51 | |
| Distributions | | | | | | | | | | | | | | | | |
| From Net Investment Income | | | (0.39 | ) | | | (0.40 | ) | | | (0.40 | ) | | | (0.22 | ) |
| Net Asset Value, End of Period | | | $10.83 | | | | $10.76 | | | | $10.68 | | | | $10.40 | |
| | | | | | | | | | | | | | | | | |
Total Return(3) | | | 4.29 | % | | | 4.58 | % | | | 6.69 | % | | | 5.09 | % |
| | | | | | | | | | | | | | | | | |
| Ratios/Supplemental Data | |
| Ratio of Operating Expenses to Average Net Assets | | | 1.03 | % | | | 1.04 | % | | | 1.03 | % | | | 0.99 | %(4) |
Ratio of Operating Expenses to Average Net Assets (Before Expense Waiver) | | | 1.06 | % | | | 1.06 | % | | | 1.07 | % | | | 1.07 | %(4) |
| Ratio of Net Investment Income (Loss) to Average Net Assets | | | 3.07 | % | | | 3.19 | % | | | 3.62 | % | | | 4.19 | %(4) |
Ratio of Net Investment Income (Loss) to Average Net Assets (Before Expense Waiver) | | | 3.04 | % | | | 3.17 | % | | | 3.58 | % | | | 4.11 | %(4) |
| Portfolio Turnover Rate | | | 100 | % | | | 171 | % | | | 330 | % | | | 338 | %(5) |
| Net Assets, End of Period (in thousands) | | | $2,775 | | | | $1,820 | | | | $556 | | | | $26 | |
| (1) | September 28, 2007 (commencement of sale) through March 31, 2008. |
| (2) | Computed using average shares outstanding throughout the period. |
| (3) | Total returns are calculated based on the net asset value of the last business day. Total returns for periods less than one year are not annualized. |
| (5) | Portfolio turnover is calculated at the fund level. Percentage indicated was calculated for the year ended March 31, 2008. |
See Notes to Financial Statements.
Report of Independent Registered Public Accounting Firm |
To the Trustees of the American Century Government Income Trust and Shareholders of the Ginnie Mae Fund:
In our opinion, the accompanying statement of assets and liabilities, including the schedule of investments, and the related statements of operations and of changes in net assets and the financial highlights present fairly, in all material respects, the financial position of the Ginnie Mae Fund (one of the five funds comprising the American Century Government Income Trust, hereafter referred to as the “Fund”) at March 31, 2011, the results of its operations for the year then ended, the changes in its net assets for each of the two years in the period then ended and the financial highlights for each of the periods presented, in conformity with accounting principles generally accepted in the United States of America. These financial statements and financial highlights (hereafter referred to as “financial statements”) are the responsibility of the Fund’s management; our responsibility is to express an opinion on these financial statements based on our audits. We conducted our audits of these financial statements in accordance with the standards of the Public Company Accounting Oversight Board (United States). Those standards require that we plan and perform the audit to obtain reasonable assurance about whether the financial statements are free of material misstatement. An audit includes examining, on a test basis, evidence supporting the amounts and disclosures in the financial statements, assessing the accounting principles used and significant estimates made by management, and evaluating the overall financial statement presentation. We believe that our audits, which included confirmation of securities at March 31, 2011 by correspondence with the custodian and brokers, provide a reasonable basis for our opinion.
PricewaterhouseCoopers LLP
Kansas City, Missouri
May 19, 2011
A special meeting of shareholders was held on June 16, 2010 and June 30, 2010, to vote on the following proposals. Each proposal received the required number of votes and was adopted. A summary of voting results is listed below each proposal.
Proposal 1:
To elect one Trustee to the Board of Trustees of American Century Government Income Trust (the proposal was voted on by all shareholders of funds issued by American Century Government Income Trust):
| | | |
| Frederick L.A. Grauer | For: | 6,878,868,575 |
| | Withhold: | 268,743,465 |
| | Abstain: | 0 |
| | Broker Non-Vote: | 0 |
The other trustees whose term of office continued after the meeting include Jonathan S. Thomas, John Freidenrich, Ronald J. Gilson, Peter F. Pervere, Myron S. Scholes, and John B. Shoven.
Proposal 2:
To approve a management agreement between the fund and American Century Investment Management, Inc.:
| | | |
| Investor, A and R Classes | For: | 980,969,041 |
| | Against: | 15,247,724 |
| | Abstain: | 34,170,596 |
| | Broker Non-Vote: | 133,533,129 |
| |
| Institutional Class | For: | 10,203,849 |
| | Against: | 0 |
| | Abstain: | 0 |
| | Broker Non-Vote: | 0 |
The individuals listed below serve as trustees of the fund. Each trustee will continue to serve in this capacity until death, retirement, resignation or removal from office. The mandatory retirement age for trustees who are not “interested persons,” as that term is defined in the Investment Company Act (independent trustees), is 73. However, the mandatory retirement age may be extended for a period not to exceed two years with the approval of the remaining independent trustees.
Mr. Thomas is the only trustee who is an “interested person” because he currently serves as President and Chief Executive Officer of American Century Companies, Inc. (ACC), the parent company of American Century Investment Management, Inc. (ACIM or the advisor).
The other trustees (more than three-fourths of the total number) are independent; that is, they have never been employees, directors or officers of, and have no financial interest in, ACC or any of its wholly owned, direct or indirect, subsidiaries, including ACIM, American Century Investment Services, Inc. (ACIS) and American Century Services, LLC (ACS). The trustees serve in this capacity for eight (in the case of Mr. Thomas, 15) registered investment companies in the American Century Investments family of funds.
The following presents additional information about the trustees. The mailing address for each trustee, other than Mr. Thomas, is 1665 Charleston Road, Mountain View, California 94043. The mailing address for Mr. Thomas is 4500 Main Street, Kansas City, Missouri 64111.
| | | | | | |
Name (Year of Birth) | Position(s) Held with Funds | Length of Time Served | Principal Occupation(s) During Past 5 Years | Number of American Century Portfolios Overseen by Trustee | Other Directorships Held During Past 5 Years |
| Independent Trustees |
Tanya S. Beder (1955) | Trustee | Since 2011 | Chairman, SBCC Group Inc. (investment advisory services) (2006 to present); Fellow in Practice, International Center for Finance, Yale University School of Management (1985 to present); Chief Executive Officer, Tribeca Global Management LLC (2004 to 2006) | 40 | None |
John Freidenrich (1937) | Trustee | Since 2005 | Founder, Member and Manager, Regis Management Company, LLC (investment management firm) (April 2004 to present) | 40 | None |
Ronald J.Gilson (1946) | Trustee and Chairman of the Board | Since 1995 | Charles J. Meyers Professor of Law and Business, Stanford Law School (1979 to present); Marc and Eva Stern Professor f Law and Business, Columbia University School of Law (1992 to present) | 40 | None |
| | | | | | |
Name (Year of Birth) | Position(s) Held with Funds | Length of Time Served | Principal Occupation(s) During Past 5 Years | Number of American Century Portfolios Overseen by Trustee | Other Directorships Held During Past 5 Years |
| Independent Trustees |
Frederick L. A. Grauer (1946) | Trustee | Since 2008 | Senior Advisor, BlackRock, Inc. (investment management firm) (2010 to 2011); Senior Advisor, Barclays Global Investors (investment management firm) (2003 to 2009) | 40 | None |
Peter F. Pervere (1947) | Trustee | Since 2007 | Retired | 40 | Intraware, Inc. (2003 to 2009) |
Myron S. Scholes (1941) | Trustee | Since 1980 | Chairman, Platinum Grove Asset Management, L.P. (asset manager) (1999 to 2009); Frank E. Buck Professor of Finance-Emeritus, Stanford Graduate School of Business (1996 to present) | 40 | Dimensional Fund Advisors (investment advisor); CME Group, Inc. (futures and options exchange) |
John B. Shoven (1947) | Trustee | Since 2002 | Professor of Economics, Stanford University (1973 to present) | 40 | Cadence Design Systems; Exponent; Financial Engines; Watson Wyatt Worldwide (2002 to 2006) |
| |
| Interested Trustee |
Jonathan S. Thomas (1963) | Trustee and President | Since 2007 | President and Chief Executive Officer, ACC (March 2007 to present); Chief Administrative Officer, ACC (February 2006 to February 2007); Executive Vice President, ACC (November 2005 to February 2007). Also serves as: Chief Executive Officer and Manager, ACS; Executive Vice President, ACIM; Director, ACC, ACIM and other ACC subsidiaries | 104 | None |
Officers
The following table presents certain information about the executive officers of the fund. Each officer serves as an officer for each of the 15 investment companies in the American Century family of funds, unless otherwise noted. No officer is compensated for his or her service as an officer of the fund. The listed officers are interested persons of the fund and are appointed or re-appointed on an annual basis. The mailing address for each of the officers listed below is 4500 Main Street, Kansas City, Missouri 64111.
| | | |
Name (Year of Birth) | Offices with the Funds | Principal Occupation(s) During the Past Five Years |
| Officers |
Jonathan S. Thomas (1963) | Trustee and President since 2007 | President and Chief Executive Officer, ACC (March 2007 to present); Chief Administrative Officer, ACC (February 2006 to February 2007); Executive Vice President, ACC (November 2005 to February 2007). Also serves as: Chief Executive Officer and Manager, ACS; Executive Vice President, ACIM; Director, ACC, ACIM and other ACC subsidiaries |
Barry Fink (1955) | Executive Vice President since 2007 | Chief Operating Officer and Executive Vice President, ACC (September 2007 to present); President, ACS (October 2007 to present); Managing Director, Morgan Stanley (2000 to 2007); Global General Counsel, Morgan Stanley (2000 to 2006). Also serves as: Manager, ACS and Director, ACC and certain ACC subsidiaries |
Maryanne L. Roepke (1956) | Chief Compliance Officer since 2006 and Senior Vice President since 2000 | Chief Compliance Officer, American Century funds, ACIM and ACS (August 2006 to present); Assistant Treasurer, ACC (January 1995 to August 2006); and Treasurer and Chief Financial Officer, various American Century funds (July 2000 to August 2006). Also serves as: Senior Vice President, ACS |
Charles A. Etherington (1957) | General Counsel since 2007 and Senior Vice President since 2006 | Attorney, ACC (February 1994 to present); Vice President, ACC (November 2005 to present), General Counsel, ACC (March 2007 to present); Also serves as General Counsel, ACIM, ACS, ACIS and other ACC subsidiaries; and Senior Vice President, ACIM and ACS |
Robert J. Leach (1966) | Vice President, Treasurer and Chief Financial Officer since 2006 | Vice President, ACS (February 2000 to present); and Controller, various American Century funds (1997 to September 2006) |
David H. Reinmiller (1963) | Vice President since 2001 | Attorney, ACC (January 1994 to present); Associate General Counsel, ACC (January 2001 to present); Chief Compliance Officer, American Century funds and ACIM (January 2001 to February 2005). Also serves as Vice President, ACIM and ACS |
Ward D. Stauffer (1960) | Secretary since 2005 | Attorney, ACC (June 2003 to present) |
The Statement of Additional Information has additional information about the fund’s trustees and is available without charge, upon request, by calling 1-800-345-2021.
Retirement Account Information
As required by law, distributions you receive from certain IRAs, or 403(b), 457 and qualified plans are subject to federal income tax withholding, unless you elect not to have withholding apply. Tax will be withheld on the total amount withdrawn even though you may be receiving amounts that are not subject to withholding, such as nondeductible contributions. In such case, excess amounts of withholding could occur. You may adjust your withholding election so that a greater or lesser amount will be withheld.
If you don’t want us to withhold on this amount, you must notify us to not withhold the federal income tax. You may notify us in writing or in certain situations by telephone or through other electronic means. You have the right to revoke your withholding election at any time and any election you make may remain in effect until revoked by filing a new election.
Remember, even if you elect not to have income tax withheld, you are liable for paying income tax on the taxable portion of your withdrawal. If you elect not to have income tax withheld or you don’t have enough income tax withheld, you may be responsible for payment of estimated tax. You may incur penalties under the estimated tax rules if your withholding and estimated tax payments are not sufficient. You can reduce or defer the income tax on a distribution by directly or indirectly rolling such distribution over to another IRA or eligible plan. You should consult your tax advisor for additional information.
State tax will be withheld if, at the time of your distribution, your address is within one of the mandatory withholding states and you have federal income tax withheld. State taxes will be withheld from your distribution in accordance with the respective state rules.
Proxy Voting Guidelines
American Century Investment Management, Inc., the fund’s investment advisor, is responsible for exercising the voting rights associated with the securities purchased and/or held by the fund. A description of the policies and procedures the advisor uses in fulfilling this responsibility is available without charge, upon request, by calling 1-800-345-2021. It is also available on American Century Investments’ website at americancentury.com and on the Securities and Exchange Commission’s website at sec.gov. Information regarding how the investment advisor voted proxies relating to portfolio securities during the most recent 12-month period ended June 30 is available on the “About Us” page at americancentury.com. It is also available at sec.gov.
Quarterly Portfolio Disclosure
The fund files its complete schedule of portfolio holdings with the Securities and Exchange Commission (SEC) for the first and third quarters of each fiscal year on Form N-Q. The fund’s Forms N-Q are available on the SEC’s website at sec.gov, and may be reviewed and copied at the SEC’s Public Reference Room in Washington, DC. Information on the operation of the Public Reference Room may be obtained by calling 1-800-SEC-0330. The fund also makes its complete schedule of portfolio holdings for the most recent quarter of its fiscal year available on its website at americancentury.com and, upon request, by calling 1-800-345-2021.
| Contact Us | americancentury.com |
| Automated Information Line | 1-800-345-8765 |
| Investor Services Representative | 1-800-345-2021 or 816-531-5575 |
| Investors Using Advisors | 1-800-378-9878 |
Business, Not-For-Profit, Employer-Sponsored Retirement Plans | 1-800-345-3533 |
Banks and Trust Companies, Broker-Dealers, Financial Professionals, Insurance Companies | 1-800-345-6488 |
| Telecommunications Device for the Deaf | 1-800-634-4113 |
American Century Government Income Trust
Investment Advisor:
American Century Investment Management, Inc.
Kansas City, Missouri
This report and the statements it contains are submitted for the general information of our shareholders. The report is not authorized for distribution to prospective investors unless preceded or accompanied by an effective prospectus.
©2011 American Century Proprietary Holdings, Inc. All rights reserved.
CL-ANN-71446 1105
ANNUAL REPORT MARCH 31, 2011
| President’s Letter | 2 |
| Market Perspective | 3 |
| Performance | 4 |
| Portfolio Commentary | 6 |
| Fund Characteristics | 8 |
| Shareholder Fee Example | 9 |
| Schedule of Investments | 11 |
| Statement of Assets and Liabilities | 15 |
| Statement of Operations | 16 |
| Statement of Changes in Net Assets | 17 |
| Notes to Financial Statements | 18 |
| Financial Highlights | 24 |
| Report of Independent Registered Public Accounting Firm | 29 |
| Proxy Voting Results | 30 |
| Management | 31 |
| Additional Information | 34 |
Any opinions expressed in this report reflect those of the author as of the date of the report, and do not necessarily represent the opinions of American Century Investments® or any other person in the American Century Investments organization. Any such opinions are subject to change at any time based upon market or other conditions and American Century Investments disclaims any responsibility to update such opinions. These opinions may not be relied upon as investment advice and, because investment decisions made by American Century Investments funds are based on numerous factors, may not be relied upon as an indication of trading intent on behalf of any American Century Investments fund. Security examples are used for representational purposes only and are not intended as recommendations to purchase or sell securities. Performance information for comparative indices and securities is provided to American Century Investments by third party vendors. To the best of American Century Investments’ knowledge, such information is accurate at the time of printing.
Dear Investor:
Thank you for reviewing this annual report for the period ended March 31, 2011. Our report offers investment performance and portfolio information, presented with the expert perspective and commentary of our portfolio management team. This report remains one of our most important vehicles for conveying the information you need about your investment performance, and about the market factors and strategies that affect fund returns. For additional, updated information on fund performance, portfolio strategy, and the investment markets, we encourage you to visit our website, americancentury.com. Click on the “Fund Performance” and “Insights & News” headings at the top of our Individual Investors site.
Investment Performance and Macroeconomic Update
Investment performance tables turned dramatically since our semiannual report for the six months ended September 30, 2010. That report chronicled an uneven period for economic growth and financial market performance that produced generally higher returns for U.S. bonds than for U.S. stocks. For the subsequent six months ended March 31, 2011, broad U.S. stock indices significantly outperformed their bond counterparts as monetary and fiscal intervention in 2010 fueled investor optimism about economic and financial market conditions in
2011 and 2012. The S&P 500 Index (representing U.S. stocks) and the Barclays Capital U.S. Aggregate Bond Index returned 17.31% and -0.88%, respectively, during those final six months.
In the second half of 2010, the U.S. Federal Reserve launched its second round of quantitative easing (QE2), a form of monetary intervention involving the purchase of U.S. government securities to increase the money supply and encourage investors to purchase potentially higher-risk/higher-return assets, such as stocks. Small-cap growth stocks benefited most from the resulting rally. But besides boosting stock prices, QE2 also helped fuel inflation fears. The benchmark 10-year U.S. Treasury note suffered a -5.92% total return from September 30, 2010, to March 31, 2011, as its yield jumped from 2.51% to 3.47%.
These developments over the more-recent six months are incorporated in the broader, enclosed 12-month Market Perspective and Portfolio Commentary from the portfolio management team. Our experts will continue to diligently apply their knowledge and skills as they make daily investment decisions for you.
Sincerely,
Jonathan Thomas
President and Chief Executive Officer
American Century Investments
By David MacEwen, Chief Investment Officer, Fixed Income
Economic Uncertainty Gave Way to Economic Optimism
Bonds generated solid returns for the 12 months ended March 31, 2011—a period characterized by mixed economic data and changing investor sentiment. Early in the period, a slowdown in the pace of economic growth, combined with lingering high unemployment, the European sovereign debt crisis, and mounting deflationary signals, stoked fears of a double-dip recession. This backdrop fueled demand for Treasuries and other “safe haven” investments.
Dissatisfied with the slow pace of economic growth and the lingering high jobless rate, the Federal Reserve (the Fed) kept its federal funds rate target near zero and, in late 2010, announced a second round of quantitative easing, dubbed “QE2” (the Fed’s government-securities purchase program designed to expand the money supply). This action, combined with improving economic data and the extension of prevailing federal income tax rates, sparked a fresh round of economic optimism and “risk-taking” by investors. At the same time, inflationary pressures began brewing, primarily due to better economic forecasts combined with soaring prices for oil and other commodities.
Demand for Yield, Inflation Protection Drove Performance
Treasury yields declined across all maturities, yet the slope of the yield curve (between two and 30 years) remained relatively unchanged. The generally low interest rate environment prompted investors to maintain a healthy appetite for yield. This led to strong, broad-benchmark-beating performance from investment-grade and high-yield corporate bonds, which also benefited from solid corporate fundamentals and low default rates. Longer-term nominal Treasuries also outperformed the broad bond market in this rate environment, but they lagged their inflation-indexed counterparts. Concerns about rising inflation pushed TIPS (Treasury inflation-protected securities) to the top of the investment-grade fixed-income performance hierarchy for the 12-month period.
Government agency mortgage-backed securities (MBS) posted positive returns for the period, but they lagged the broader market. Valuations in the sector remained tight relative to Treasuries, giving investors little incentive to take on additional risk. Meanwhile, cash returns were essentially flat throughout the period, reflecting the Fed’s near-zero interest rate policy.
| U.S. Fixed-Income Total Returns |
| For the 12 months ended March 31, 2011 |
| Barclays Capital U.S. Bond Market Indices | | Barclays Capital U.S. Treasury Bellwethers |
| Corporate High-Yield | 14.31% | | 3-Month Bill | 0.19% |
| Treasury Inflation Protected Securities (TIPS) | 7.91% | | 2-Year Note | 1.64% |
| Corporate (investment-grade) | 7.46% | | 10-Year Note | 6.55% |
| Aggregate (multi-sector) | 5.12% | | 30-Year Bond | 6.91% |
| Treasury | 4.53% | | | |
| MBS (mortgage-backed securities) | 4.37% | | | |
| Total Returns as of March 31, 2011 |
| | | | Average Annual Returns | |
| | Ticker Symbol | 1 year | 5 years | 10 years | Since Inception | Inception Date |
| Investor Class | CPTNX | 4.04% | 6.01% | 5.08% | 7.39% | 5/16/80 |
Barclays Capital U.S. Government/MBS Index | — | 4.26% | 6.03% | 5.39% | 8.44%(1) | — |
| Institutional Class | ABTIX | 4.34% | — | — | 3.76% | 3/1/10 |
A Class(2) No sales charge* With sales charge* | ABTAX | 3.78% -0.89% | 5.75% 4.77% | 4.82% 4.33% | 5.32% 4.97% | 10/9/97 |
| C Class | ABTCX | 3.10% | — | — | 2.52% | 3/1/10 |
| R Class | ABTRX | 3.62% | — | — | 3.04% | 3/1/10 |
| * | Sales charges include initial sales charges and contingent deferred sales charges (CDSCs), as applicable. A Class shares have a 4.50% maximum initial sales charge and may be subject to a maximum CDSC of 1.00%. C Class shares redeemed within 12 months of purchase are subject to a maximum CDSC of 1.00%. The SEC requires that mutual funds provide performance information net of maximum sales charges in all cases where charges could be applied. |
Performance information prior to September 3, 2002, is that of the American Century Treasury Fund, all of the net assets of which were acquired by Government Bond pursuant to a plan of reorganization approved by Treasury Fund shareholders on August 2, 2002.
| (1) | Since 5/31/80, the date nearest the Investor Class’s inception for which data are available. |
| (2) | Prior to March 1, 2010, the A Class was referred to as the Advisor Class and did not have a front-end sales charge. Performance prior to that date has been adjusted to reflect this charge. |
Data presented reflect past performance. Past performance is no guarantee of future results. Current performance may be higher or lower than the performance shown. Investment return and principal value will fluctuate, and redemption value may be more or less than original cost. To obtain performance data current to the most recent month end, please call 1-800-345-2021 or visit americancentury.com. As interest rates rise, bond values will decline.
Unless otherwise indicated, performance reflects Investor Class shares; performance for other share classes will vary due to differences in fee structure. For information about other share classes available, please consult the prospectus. Data assumes reinvestment of dividends and capital gains, and none of the charts reflect the deduction of taxes that a shareholder would pay on fund distributions or the redemption of fund shares. Returns for the index are provided for comparison. The fund’s total returns include operating expenses (such as transaction costs and management fees) that reduce returns, while the total returns of the index do not.
| Growth of $10,000 Over 10 Years |
| $10,000 investment made March 31, 2001 |
| Total Annual Fund Operating Expenses |
| Investor Class | Institutional Class | A Class | C Class | R Class |
| 0.48% | 0.28% | 0.73% | 1.48% | 0.98% |
The total annual fund operating expenses shown is as stated in the fund’s prospectus current as of the date of this report. The prospectus may vary from the expense ratio shown elsewhere in this report because it is based on a different time period, includes acquired fund fees and expenses, and, if applicable, does not include fee waivers or expense reimbursements.
Data presented reflect past performance. Past performance is no guarantee of future results. Current performance may be higher or lower than the performance shown. Investment return and principal value will fluctuate, and redemption value may be more or less than original cost. To obtain performance data current to the most recent month end, please call 1-800-345-2021 or visit americancentury.com. As interest rates rise, bond values will decline.
Unless otherwise indicated, performance reflects Investor Class shares; performance for other share classes will vary due to differences in fee structure. For information about other share classes available, please consult the prospectus. Data assumes reinvestment of dividends and capital gains, and none of the charts reflect the deduction of taxes that a shareholder would pay on fund distributions or the redemption of fund shares. Returns for the index are provided for comparison. The fund’s total returns include operating expenses (such as transaction costs and management fees) that reduce returns, while the total returns of the index do not.
Portfolio Managers: Bob Gahagan, Hando Aguilar, Brian Howell, Dan Shiffman, and Jim Platz
Performance Summary
Government Bond returned 4.04%* for the 12 months ended March 31, 2011. By comparison, the portfolio’s benchmark, the Barclays Capital U.S. Government/MBS Index, returned 4.26%. See page 4 for additional performance comparisons. Fund returns reflect operating expenses, while index returns do not.
Government Bond’s absolute return reflected the positive performance of intermediate- and long-term government-backed securities during the period. Relative to the benchmark, the main differentiating factors included operating expenses, yield curve positioning, and security selection.
Mortgage Security Selection Was Positive
With Treasury yields at relatively low levels, we maintained a portfolio overweight position in the MBS sector throughout the 12-month period. MBS outperformed Treasuries of similar maturities during the period, but typically longer-maturity, more interest-rate sensitive broad Treasury indices outperformed their MBS counterparts. Treasury yields declined across all maturities.
Security selection within the portfolio’s mortgage component contributed positively to the 12-month return. In particular, we favored higher-yielding collateralized mortgage obligations (CMOs), and earlier in the period, Federal Deposit Insurance Corporation (FDIC)-guaranteed securities, over traditional government agency MBS. We avoided traditional MBS because their yields on an absolute basis and relative to Treasuries remained at historically low levels. This positioning helped the portfolio’s performance, because FDIC paper and CMOs outperformed traditional MBS. Investors favored “structured mortgage products,” such as CMOs, which are less likely to experience sharp price volatility as a result of refinancing and the risk of rapidly changing interest rates.
Security selection also was effective within the portfolio’s agency component. As with Treasuries, we believed valuations among government agency securities appeared rich during the reporting period, due to the impact on the market from the Federal Reserve’s (the Fed’s) bond-buying activities. As such, we gradually pared back our exposure. With the Fed’s quantitative easing program set to expire in the second quarter of 2011, we are looking for opportunities to take advantage of improving valuations among agency debentures.
Yield Curve Positioning Favored Flattening
We continued to position the portfolio for a longer-term flattening of the yield curve (the graphic representation of Treasury yields), with the expectation that the yield difference between two- and 30-year Treasuries would narrow going forward. This strategy had a minimal impact on performance during the 12-month period, as the slope of the yield curve remained relatively unchanged. From a longer term perspective—potentially after the Fed’s quantitative easing concludes in June—we believe the curve may flatten more significantly, due to short-term rates rising at a faster pace than long-term rates.
* All fund returns referenced in this commentary are for Investor Class shares.
Outlook
“Economic conditions appear to have improved,” said Portfolio Manager Bob Gahagan. “ISM (Institute for Supply Management) manufacturing data, retail sales, and consumer confidence are better, but it remains to be seen if current momentum is enough to offset the winding down of stimulus programs from the Fed and the federal government, soft employment, a weak housing market, and historically high debt levels. In addition, elevated sovereign debt risk and the need for fiscal austerity in many industrialized nations may act as an additional friction to growth over the next few years. Also, the implications of the Japan earthquake and the unrest in the Middle East and Northern Africa are adding to the aura of uncertainty.
“These factors, combined with increasing inflationary pressures stemming from monetary expansion and rising commodity prices, have important implications for fixed-income investors. In this environment, we are sticking to our disciplined, relative-value approach to portfolio management, emphasizing careful security selection and risk management. As such, we are likely to maintain a duration (price sensitivity to interest rate changes) close to that of the benchmark. In terms of sector allocation, we continue to favor a modest overweight to MBS, focusing on structured mortgage products over traditional mortgage securities.”
| MARCH 31, 2011 |
| Portfolio at a Glance |
| Average Duration (effective) | 4.7 years |
| Weighted Average Life | 5.6 years |
| |
| 30-Day SEC Yields |
| Investor Class | 2.50% |
| Institutional Class | 2.70% |
| A Class | 2.15% |
| C Class | 1.50% |
| R Class | 2.00% |
| |
| Types of Investments in Portfolio | % of net assets |
| U.S. Government Agency Mortgage-Backed Securities | 40.9% |
| U.S. Treasury Securities | 33.9% |
| U.S. Government Agency Securities and Equivalents | 15.4% |
| Collateralized Mortgage Obligations | 10.7% |
| Temporary Cash Investments | 2.6% |
| Other Assets and Liabilities | (3.5)% |
Shareholder Fee Example (Unaudited) |
Fund shareholders may incur two types of costs: (1) transaction costs, including sales charges (loads) on purchase payments and redemption/exchange fees; and (2) ongoing costs, including management fees; distribution and service (12b-1) fees; and other fund expenses. This example is intended to help you understand your ongoing costs (in dollars) of investing in your fund and to compare these costs with the ongoing cost of investing in other mutual funds.
The example is based on an investment of $1,000 made at the beginning of the period and held for the entire period from October 1, 2010 to March 31, 2011.
Actual Expenses
The table provides information about actual account values and actual expenses for each class. You may use the information, together with the amount you invested, to estimate the expenses that you paid over the period. First, identify the share class you own. Then simply divide your account value by $1,000 (for example, an $8,600 account value divided by $1,000 = 8.6), then multiply the result by the number under the heading “Expenses Paid During Period” to estimate the expenses you paid on your account during this period.
If you hold Investor Class shares of any American Century Investments fund, or Institutional Class shares of the American Century Diversified Bond Fund, in an American Century Investments account (i.e., not a financial intermediary or retirement plan account), American Century Investments may charge you a $12.50 semiannual account maintenance fee if the value of those shares is less than $10,000. We will redeem shares automatically in one of your accounts to pay the $12.50 fee. In determining your total eligible investment amount, we will include your investments in all personal accounts (including American Century Investments Brokerage accounts) registered under your Social Security number. Personal accounts include individual accounts, joint accounts, UGMA/UTMA accounts, personal trusts, Coverdell Education Savings Accounts and IRAs (including traditional, Roth, Rollover, SEP-, SARSEP- and SIMPLE-IRAs), and certain other retirement accounts. If you have only business, business retirement, employer-sponsored or American Century Investments Brokerage accounts, you are currently not subject to this fee. We will not charge the fee as long as you choose to manage your accounts exclusively online. If you are subject to the Account Maintenance Fee, your account value could be reduced by the fee amount.
Hypothetical Example for Comparison Purposes
The table also provides information about hypothetical account values and hypothetical expenses based on the actual expense ratio of each class of your fund and an assumed rate of return of 5% per year before expenses, which is not the actual return of a fund’s share class. The hypothetical account values and expenses may not be used to estimate the actual ending account balance or expenses you paid for the period. You may use this information to compare the ongoing costs of investing in your fund and other funds. To do so, compare this 5% hypothetical example with the 5% hypothetical examples that appear in the shareholder reports of the other funds.
Please note that the expenses shown in the table are meant to highlight your ongoing costs only and do not reflect any transactional costs, such as sales charges (loads) or redemption/exchange fees. Therefore, the table is useful in comparing ongoing costs only, and will not help you determine the relative total costs of owning different funds. In addition, if these transactional costs were included, your costs would have been higher.
| | | | | |
| | Beginning Account Value 10/1/10 | Ending Account Value 3/31/11 | Expenses Paid During Period* 10/1/10 – 3/31/11 | Annualized Expense Ratio* |
| Actual |
| Investor Class | $1,000 | $985.30 | $2.38 | 0.48% |
| Institutional Class | $1,000 | $986.30 | $1.39 | 0.28% |
| A Class | $1,000 | $984.10 | $3.61 | 0.73% |
| C Class | $1,000 | $981.20 | $7.31 | 1.48% |
| R Class | $1,000 | $982.80 | $4.84 | 0.98% |
| Hypothetical |
| Investor Class | $1,000 | $1,022.54 | $2.42 | 0.48% |
| Institutional Class | $1,000 | $1,023.54 | $1.41 | 0.28% |
| A Class | $1,000 | $1,021.29 | $3.68 | 0.73% |
| C Class | $1,000 | $1,017.55 | $7.44 | 1.48% |
| R Class | $1,000 | $1,020.04 | $4.94 | 0.98% |
| * | Expenses are equal to the class’s annualized expense ratio listed in the table above, multiplied by the average account value over the period, multiplied by 182, the number of days in the most recent fiscal half-year, divided by 365, to reflect the one-half year period. |
| | | |
| | Principal Amount | Value |
U.S. Government Agency Mortgage-Backed Securities(1) — 40.9% |
| ADJUSTABLE-RATE U.S. GOVERNMENT AGENCY MORTGAGE-BACKED SECURITIES — 0.2% |
FNMA, VRN, 5.76%, 12/1/12(2) | $ 2,187,082 | $ 2,333,524 |
| FIXED-RATE U.S. GOVERNMENT AGENCY MORTGAGE-BACKED SECURITIES — 40.7% |
FHLMC, 4.50%, 1/1/19(2) | 2,266,438 | 2,396,340 |
FHLMC, 5.00%, 5/1/23(2) | 12,951,978 | 13,849,013 |
FHLMC, 5.50%, 10/1/34(2) | 3,195,470 | 3,426,584 |
FHLMC, 5.50%, 4/1/38(2) | 33,538,601 | 35,833,281 |
| FHLMC, 4.00%, 12/1/40 | 3,567,362 | 3,503,917 |
FHLMC, 6.50%, 7/1/47(2) | 156,494 | 174,512 |
FNMA, 4.50%, settlement date 4/15/11(3) | 10,000,000 | 10,162,500 |
FNMA, 6.00%, settlement date 4/15/11(3) | 18,200,000 | 19,781,125 |
FNMA, 6.50%, settlement date 4/15/11(3) | 15,170,000 | 17,004,629 |
| FNMA, 4.50%, 6/1/18 | 1,321,708 | 1,398,701 |
FNMA, 4.50%, 5/1/19(2) | 6,744,254 | 7,124,480 |
FNMA, 5.00%, 9/1/20(2) | 658,617 | 704,150 |
| FNMA, 4.50%, 11/1/20 | 599,537 | 633,338 |
FNMA, 6.50%, 3/1/32(2) | 384,622 | 435,157 |
FNMA, 7.00%, 6/1/32(2) | 388,740 | 448,331 |
FNMA, 6.50%, 8/1/32(2) | 497,608 | 562,988 |
FNMA, 5.50%, 7/1/33(2) | 5,244,906 | 5,644,541 |
FNMA, 5.00%, 11/1/33(2) | 27,075,849 | 28,511,766 |
| FNMA, 5.50%, 8/1/34 | 20,709,941 | 22,262,046 |
FNMA, 5.50%, 9/1/34(2) | 1,130,453 | 1,215,174 |
FNMA, 5.50%, 10/1/34(2) | 9,168,966 | 9,866,543 |
FNMA, 5.00%, 8/1/35(2) | 5,023,618 | 5,281,402 |
FNMA, 5.50%, 1/1/36(2) | 21,294,436 | 22,870,382 |
FNMA, 5.00%, 2/1/36(2) | 2,426,622 | 2,551,143 |
FNMA, 5.50%, 4/1/36(2) | 6,688,605 | 7,183,612 |
FNMA, 5.00%, 5/1/36(2) | 11,818,181 | 12,424,624 |
FNMA, 5.50%, 12/1/36(2) | 5,507,653 | 5,903,212 |
FNMA, 5.50%, 2/1/37(2) | 19,400,735 | 20,794,094 |
FNMA, 6.50%, 8/1/37(2) | 1,725,861 | 1,920,527 |
| FNMA, 6.00%, 9/1/37 | 7,583,289 | 8,257,352 |
| FNMA, 6.00%, 11/1/37 | 29,977,257 | 32,782,391 |
| FNMA, 6.00%, 9/1/38 | 2,324,620 | 2,512,000 |
| FNMA, 6.00%, 11/1/38 | 2,440,869 | 2,637,619 |
| FNMA, 4.50%, 2/1/39 | 10,253,246 | 10,444,175 |
| FNMA, 4.50%, 4/1/39 | 3,546,173 | 3,621,072 |
| FNMA, 4.50%, 5/1/39 | 8,178,111 | 8,350,843 |
| FNMA, 4.50%, 10/1/39 | 9,966,063 | 10,176,559 |
| FNMA, 4.50%, 3/1/40 | 9,553,806 | 9,740,667 |
| FNMA, 4.00%, 10/1/40 | 8,916,451 | 8,781,885 |
| FNMA, 4.50%, 11/1/40 | 8,080,743 | 8,238,792 |
| FNMA, 4.00%, 12/1/40 | 9,886,049 | 9,727,582 |
FNMA, 6.50%, 6/1/47(2) | 134,561 | 149,445 |
FNMA, 6.50%, 8/1/47(2) | 393,208 | 436,699 |
FNMA, 6.50%, 8/1/47(2) | 544,640 | 604,881 |
FNMA, 6.50%, 9/1/47(2) | 45,837 | 50,907 |
FNMA, 6.50%, 9/1/47(2) | 372,517 | 413,720 |
FNMA, 6.50%, 9/1/47(2) | 407,107 | 452,135 |
FNMA, 6.50%, 9/1/47(2) | 760,766 | 844,912 |
FNMA, 6.00%, 4/1/48(2) | 3,373,336 | 3,634,707 |
| GNMA, 5.50%, 12/20/38 | 15,503,983 | 16,764,488 |
| GNMA, 6.00%, 1/20/39 | 3,182,254 | 3,475,121 |
| GNMA, 5.00%, 3/20/39 | 17,663,385 | 18,753,548 |
| GNMA, 5.50%, 3/20/39 | 5,363,662 | 5,799,739 |
| GNMA, 5.50%, 4/20/39 | 9,145,951 | 9,889,535 |
| GNMA, 5.00%, 12/15/39 | 12,858,147 | 13,685,891 |
| GNMA, 5.00%, 8/20/40 | 18,189,250 | 19,311,869 |
| GNMA, 4.00%, 11/20/40 | 22,140,129 | 22,134,365 |
| GNMA, 4.00%, 12/15/40 | 3,973,674 | 3,974,502 |
| | | 499,515,513 |
TOTAL U.S. GOVERNMENT AGENCY MORTGAGE-BACKED SECURITIES (Cost $484,362,289) | 501,849,037 |
| U.S. Treasury Securities — 33.9% |
U.S. Treasury Bonds, 11.25%, 2/15/15(2) | 5,500,000 | 7,470,546 |
U.S. Treasury Bonds, 10.625%, 8/15/15(2) | 6,250,000 | 8,538,575 |
U.S. Treasury Bonds, 8.125%, 8/15/21(2) | 14,247,000 | 19,997,004 |
U.S. Treasury Bonds, 7.125%, 2/15/23(2) | 10,700,000 | 14,174,162 |
U.S. Treasury Bonds, 6.625%, 2/15/27(2) | 4,500,000 | 5,820,471 |
U.S. Treasury Bonds, 5.50%, 8/15/28(2) | 5,000,000 | 5,785,940 |
U.S. Treasury Bonds, 5.25%, 2/15/29(2) | 10,000,000 | 11,253,130 |
U.S. Treasury Bonds, 3.50%, 2/15/39(2) | 4,000,000 | 3,351,252 |
U.S. Treasury Bonds, 4.25%, 5/15/39(2) | 8,500,000 | 8,148,049 |
U.S. Treasury Bonds, 4.375%, 11/15/39(2) | 9,700,000 | 9,483,263 |
U.S. Treasury Bonds, 4.625%, 2/15/40(2) | $14,000,000 | $ 14,266,882 |
U.S. Treasury Bonds, 4.25%, 11/15/40(2) | 3,800,000 | 3,631,375 |
| U.S. Treasury Bonds, 4.75%, 2/15/41 | 3,000,000 | 3,116,718 |
U.S. Treasury Notes, 0.75%, 11/30/11(2) | 1,300,000 | 1,304,672 |
U.S. Treasury Notes, 4.125%, 8/31/12(2) | 5,650,000 | 5,935,370 |
U.S. Treasury Notes, 1.375%, 9/15/12(2) | 5,000,000 | 5,059,180 |
U.S. Treasury Notes, 1.375%, 10/15/12(2) | 13,900,000 | 14,065,063 |
U.S. Treasury Notes, 1.375%, 11/15/12(2) | 2,300,000 | 2,327,223 |
U.S. Treasury Notes, 0.50%, 11/30/12(2) | 5,550,000 | 5,535,909 |
U.S. Treasury Notes, 1.125%, 6/15/13(2) | 15,000,000 | 15,064,455 |
U.S. Treasury Notes, 1.25%, 2/15/14(2) | 21,700,000 | 21,698,307 |
U.S. Treasury Notes, 1.25%, 3/15/14(2) | 29,450,000 | 29,417,782 |
U.S. Treasury Notes, 1.875%, 4/30/14(2) | 25,000,000 | 25,412,125 |
U.S. Treasury Notes, 2.375%, 8/31/14(2) | 13,000,000 | 13,370,708 |
U.S. Treasury Notes, 2.125%, 11/30/14(2) | 10,000,000 | 10,171,880 |
U.S. Treasury Notes, 2.625%, 12/31/14(2) | 17,000,000 | 17,583,049 |
U.S. Treasury Notes, 2.125%, 12/31/15(2) | 27,000,000 | 26,970,462 |
U.S. Treasury Notes, 2.00%, 1/31/16(2) | 14,000,000 | 13,879,684 |
U.S. Treasury Notes, 4.875%, 8/15/16(2) | 14,000,000 | 15,781,724 |
U.S. Treasury Notes, 3.25%, 12/31/16(2) | 5,000,000 | 5,189,845 |
U.S. Treasury Notes, 4.75%, 8/15/17(2) | 28,950,000 | 32,412,709 |
U.S. Treasury Notes, 4.00%, 8/15/18(2) | 12,085,000 | 12,913,958 |
U.S. Treasury Notes, 3.625%, 2/15/20(2) | 15,000,000 | 15,387,900 |
U.S. Treasury Notes, 3.625%, 2/15/21(2) | 11,000,000 | 11,142,659 |
TOTAL U.S. TREASURY SECURITIES (Cost $408,292,138) | 415,662,031 |
| U.S. Government Agency Securities and Equivalents — 15.4% |
| FIXED-RATE U.S. GOVERNMENT AGENCY SECURITIES — 5.3% |
FHLMC, 2.875%, 2/9/15(2) | 13,000,000 | 13,459,888 |
FHLMC, 5.00%, 2/16/17(2) | 5,000,000 | 5,590,700 |
FHLMC, 4.875%, 6/13/18(2) | 5,000,000 | 5,561,195 |
| FNMA, 0.50%, 10/30/12 | 10,000,000 | 9,971,350 |
FNMA, 0.75%, 2/26/13(2) | 4,070,000 | 4,064,180 |
| FNMA, 1.625%, 10/26/15 | 2,120,000 | 2,062,402 |
FNMA, 2.375%, 4/11/16(2) | 4,040,000 | 4,026,284 |
FNMA, 5.00%, 2/13/17(2) | 7,000,000 | 7,824,530 |
FNMA, 5.375%, 6/12/17(2) | 3,500,000 | 3,990,234 |
FNMA, 6.625%, 11/15/30(2) | 6,000,000 | 7,591,524 |
| | | 64,142,287 |
GOVERNMENT-BACKED CORPORATE BONDS(4) — 10.1% |
Ally Financial, Inc., 1.75%, 10/30/12(2) | 14,000,000 | 14,231,378 |
Ally Financial, Inc., 2.20%, 12/19/12(2) | 5,150,000 | 5,275,150 |
Bank of America Corp., 2.10%, 4/30/12(2) | 3,500,000 | 3,564,830 |
Bank of America Corp., 3.125%, 6/15/12(2) | 18,800,000 | 19,386,898 |
Citigroup Funding, Inc., 2.125%, 7/12/12(2) | 4,000,000 | 4,083,524 |
| Citigroup Funding, Inc., 1.875%, 10/22/12 | 2,000,000 | 2,037,406 |
Citigroup Funding, Inc., 1.875%, 11/15/12(2) | 8,000,000 | 8,150,040 |
General Electric Capital Corp., 2.625%, 12/28/12(2) | 7,415,000 | 7,651,828 |
Goldman Sachs Group, Inc. (The), 3.25%, 6/15/12(2) | 5,000,000 | 5,165,960 |
John Deere Capital Corp., 2.875%, 6/19/12(2) | 3,950,000 | 4,064,803 |
JPMorgan Chase & Co., 2.20%, 6/15/12(2) | 17,500,000 | 17,894,013 |
JPMorgan Chase & Co., 2.125%, 12/26/12(2) | 5,000,000 | 5,121,890 |
Morgan Stanley, 1.95%, 6/20/12(2) | 10,000,000 | 10,183,810 |
State Street Corp., 2.15%, 4/30/12(2) | 7,500,000 | 7,634,010 |
| U.S. Bancorp., 1.80%, 5/15/12 | 10,000,000 | 10,150,290 |
| | | 124,595,830 |
TOTAL U.S. GOVERNMENT AGENCY SECURITIES AND EQUIVALENTS (Cost $185,684,171) | 188,738,117 |
Collateralized Mortgage Obligations(1) — 10.7% |
FHLMC, Series 2625, Class FJ SEQ, VRN, 0.56%, 4/15/11, resets monthly off the 1-month LIBOR plus 0.30% with a cap of 7.50%(2) | $ 929,639 | $ 930,885 |
| FHLMC, Series 2685, Class ND SEQ, 4.00%, 10/15/18 | 5,260,000 | 5,542,638 |
FHLMC, Series 2706, Class BL SEQ, 3.50%, 11/15/18 | 5,000,000 | 5,147,810 |
FHLMC, Series 2706, Class EB, 5.00%, 9/15/20(2) | 2,065,449 | 2,107,996 |
FHLMC, Series 2779, Class FM SEQ, VRN, 0.61%, 4/15/11, resets monthly off the 1-month LIBOR plus 0.35% with a cap of 7.50%(2) | 1,334,545 | 1,338,441 |
| FHLMC, Series 2784, Class HJ SEQ, 4.00%, 4/15/19 | 8,813,000 | 9,254,692 |
| FHLMC, Series 3076, Class BM SEQ, 4.50%, 11/15/25 | 13,500,000 | 14,076,485 |
FHLMC, Series 3203, Class VN SEQ, 5.00%, 6/15/22(2) | 10,000,000 | 10,665,767 |
| FHLMC, Series 3601, Class AB SEQ, 1.25%, 11/15/12 | 4,412,808 | 4,435,433 |
FNMA, Series 2002-5, Class PJ, 6.00%, 10/25/21(2) | 1,108,897 | 1,160,540 |
FNMA, Series 2003-10, Class HW SEQ, 5.00%, 11/25/16(2) | 112,757 | 112,795 |
FNMA, Series 2003-42, Class FK, VRN, 0.65%, 4/25/11, resets monthly off the 1-month LIBOR plus 0.40% with a cap of 7.50%(2) | 1,348,495 | 1,353,341 |
FNMA, Series 2003-43, Class LF, VRN, 0.60%, 4/25/11, resets monthly off the 1-month LIBOR plus 0.35% with a cap of 8.00%(2) | 2,679,739 | 2,688,402 |
FNMA, Series 2003-52, Class KF SEQ, VRN, 0.65%, 4/25/11, resets monthly off the 1-month LIBOR plus 0.40% with a cap of 7.50%(2) | 1,704,335 | 1,708,837 |
| FNMA, Series 2003-123, Class AY SEQ, 4.00%, 12/25/18 | 7,800,000 | 8,209,477 |
| FNMA, Series 2004-17, Class CJ SEQ, 4.00%, 4/25/19 | 9,300,000 | 9,899,768 |
| FNMA, Series 2004-32, Class AY SEQ, 4.00%, 5/25/19 | 5,485,000 | 5,838,337 |
FNMA, Series 2005-47, Class AN SEQ, 5.00%, 12/25/16(2) | 105,021 | 105,374 |
| FNMA, Series 2005-121, Class V SEQ, 4.50%, 6/25/29 | 11,995,287 | 12,491,247 |
| FNMA, Series 2010-39, Class VN SEQ, 5.00%, 10/25/39 | 8,900,000 | 9,515,236 |
GNMA, Series 2004-30, Class PD, 5.00%, 2/20/33(2) | 12,000,000 | 12,892,906 |
| GNMA, Series 2007-5, Class FA, VRN, 0.39%, 4/20/11 | 5,000,000 | 4,957,721 |
| GNMA, Series 2010-60, Class DY SEQ, 4.00%, 5/16/25 | 5,000,000 | 4,993,872 |
| NCUA Guaranteed Notes, Series 2010 C1, Class A2 SEQ, 2.90%, 10/29/20 | 2,075,000 | 2,020,219 |
TOTAL COLLATERALIZED MORTGAGE OBLIGATIONS (Cost $127,828,210) | 131,448,219 |
| | Shares/ Principal Amount | Value |
| Temporary Cash Investments — 2.6% |
| JPMorgan U.S. Treasury Plus Money Market Fund Agency Shares | 5,036,365 | $ 5,036,365 |
Repurchase Agreement, Bank of America Securities, LLC, (collateralized by various U.S. Treasury obligations, 0.375%, 10/31/12, valued at $26,898,525), in a joint trading account at 0.06%, dated 3/31/11, due 4/1/11 (Delivery value $26,344,044) | 26,344,000 |
TOTAL TEMPORARY CASH INVESTMENTS (Cost $31,380,365) | 31,380,365 |
TOTAL INVESTMENT SECURITIES — 103.5% (Cost $1,237,547,173) | 1,269,077,769 |
| OTHER ASSETS AND LIABILITIES — (3.5)% | (43,468,404) |
| TOTAL NET ASSETS — 100.0% | $1,225,609,365 |
| Futures Contracts |
| Contracts Purchased | Expiration Date | Underlying Face Amount at Value | Unrealized Gain (Loss) |
| 387 | U.S. Long Bond | June 2011 | $46,512,563 | $71,692 |
| |
| Contracts Sold | Expiration Date | Underlying Face Amount at Value | Unrealized Gain (Loss) |
| 1,223 | U.S. Treasury 2-Year Notes | June 2011 | $266,766,875 | $(98,390) |
Notes to Schedule of Investments
Equivalent = Security whose principal payments are backed by the full faith and credit of the United States
FHLMC = Federal Home Loan Mortgage Corporation
FNMA = Federal National Mortgage Association
GNMA = Government National Mortgage Association
LIBOR = London Interbank Offered Rate
NCUA = National Credit Union Administration
resets = The frequency with which a security’s coupon changes, based on current market conditions or an underlying index. The more frequently a security resets, the less risk the investor is taking that the coupon will vary significantly from current market rates.
SEQ = Sequential Payer
VRN = Variable Rate Note. Interest reset date is indicated. Rate shown is effective at the period end.
| (1) | Final maturity date indicated, unless otherwise noted. |
| (2) | Security, or a portion thereof, has been segregated for forward commitments and/or futures contracts. At the period end, the aggregate value of securities pledged was $360,228,000. |
| (4) | The debt is guaranteed under the Federal Deposit Insurance Corporation’s (FDIC) Temporary Liquidity Guarantee Program and is backed by the full faith and credit of the United States. The expiration date of the FDIC’s guarantee is the earlier of the maturity date of the debt or December 31, 2012. |
See Notes to Financial Statements.
Statement of Assets and Liabilities |
| MARCH 31, 2011 | |
| Assets | |
| Investment securities, at value (cost of $1,237,547,173) | | | $1,269,077,769 | |
| Cash | | | 31,035 | |
| Receivable for capital shares sold | | | 1,092,230 | |
| Interest receivable | | | 5,992,606 | |
| | | | 1,276,193,640 | |
| | | | | |
| Liabilities | |
| Payable for investments purchased | | | 46,953,084 | |
| Payable for capital shares redeemed | | | 2,547,936 | |
| Payable for variation margin on futures contracts | | | 76,437 | |
| Accrued management fees | | | 487,141 | |
| Distribution and service fees payable | | | 43,848 | |
| Dividends payable | | | 475,829 | |
| | | | 50,584,275 | |
| | | | | |
| Net Assets | | | $1,225,609,365 | |
| | | | | |
| Net Assets Consist of: | |
| Capital paid in | | | $1,196,528,031 | |
| Accumulated net investment loss | | | (408,166 | ) |
| Accumulated net realized loss | | | (2,014,398 | ) |
| Net unrealized appreciation | | | 31,503,898 | |
| | | | $1,225,609,365 | |
| | | Net assets | | Shares outstanding | | Net asset value per share |
| Investor Class | | $995,817,387 | | | 89,917,612 | | | $11.07 | |
| Institutional Class | | $27,492,025 | | | 2,482,656 | | | $11.07 | |
| A Class | | $201,019,919 | | | 18,151,628 | | | $11.07 | * |
| C Class | | $1,134,280 | | | 102,483 | | | $11.07 | |
| R Class | | $145,754 | | | 13,168 | | | $11.07 | |
* Maximum offering price $11.59 (net asset value divided by 0.955)
See Notes to Financial Statements.
| YEAR ENDED MARCH 31, 2011 | |
| Investment Income (Loss) | |
| Income: | | | |
| Interest | | | $41,898,300 | |
| | | | | |
| Expenses: | | | | |
| Management fees | | | 5,968,142 | |
| Distribution and service fees: | | | | |
| A Class | | | 524,799 | |
| C Class | | | 6,475 | |
| R Class | | | 322 | |
| Trustees’ fees and expenses | | | 44,025 | |
| Other expenses | | | 42,772 | |
| | | | 6,586,535 | |
| | | | | |
| Net investment income (loss) | | | 35,311,765 | |
| | | | | |
| Realized and Unrealized Gain (Loss) | |
| Net realized gain (loss) on: | | | | |
| Investment transactions | | | 7,467,017 | |
| Futures contract transactions | | | 335,535 | |
| | | | 7,802,552 | |
| | | | | |
| Change in net unrealized appreciation (depreciation) on: | | | | |
| Investments | | | 5,394,626 | |
| Futures contracts | | | 72,801 | |
| | | | 5,467,427 | |
| | | | | |
| Net realized and unrealized gain (loss) | | | 13,269,979 | |
| | | | | |
| Net Increase (Decrease) in Net Assets Resulting from Operations | | | $48,581,744 | |
See Notes to Financial Statements.
Statement of Changes in Net Assets |
| YEARS ENDED MARCH 31, 2011 AND MARCH 31, 2010 | |
| Increase (Decrease) in Net Assets | | 2011 | | | 2010 | |
| Operations | |
| Net investment income (loss) | | | $35,311,765 | | | | $36,623,233 | |
| Net realized gain (loss) | | | 7,802,552 | | | | 5,765,184 | |
| Change in net unrealized appreciation (depreciation) | | | 5,467,427 | | | | (13,778,588 | ) |
| Net increase (decrease) in net assets resulting from operations | | | 48,581,744 | | | | 28,609,829 | |
| | | | | | | | | |
| Distributions to Shareholders | |
| From net investment income: | | | | | | | | |
| Investor Class | | | (31,367,912 | ) | | | (32,407,531 | ) |
| Institutional Class | | | (186,970 | ) | | | (71 | ) |
| A Class | | | (5,754,540 | ) | | | (5,915,261 | ) |
| C Class | | | (12,478 | ) | | | (67 | ) |
| R Class | | | (1,609 | ) | | | (57 | ) |
| From net realized gains: | | | | | | | | |
| Investor Class | | | (5,572,674 | ) | | | (14,534,572 | ) |
| Institutional Class | | | (14,937 | ) | | | — | |
| A Class | | | (1,126,370 | ) | | | (2,722,724 | ) |
| C Class | | | (5,476 | ) | | | — | |
| R Class | | | (363 | ) | | | — | |
| Decrease in net assets from distributions | | | (44,043,329 | ) | | | (55,580,283 | ) |
| | | | | | | | | |
| Capital Share Transactions | |
| Net increase (decrease) in net assets from capital share transactions | | | 41,104,552 | | | | 121,147,895 | |
| | | | | | | | | |
| Net increase (decrease) in net assets | | | 45,642,967 | | | | 94,177,441 | |
| | | | | | | | | |
| Net Assets | |
| Beginning of period | | | 1,179,966,398 | | | | 1,085,788,957 | |
| End of period | | | $1,225,609,365 | | | | $1,179,966,398 | |
| | | | | | | | | |
| Accumulated net investment loss | | | $(408,166 | ) | | | $(410,820 | ) |
See Notes to Financial Statements.
Notes to Financial Statements |
MARCH 31, 2011
1. Organization
American Century Government Income Trust (the trust) is registered under the Investment Company Act of 1940, as amended (the 1940 Act), as an open-end management investment company and is organized as a Massachusetts business trust. Government Bond Fund (the fund) is one fund in a series issued by the trust. The fund is diversified as defined under the 1940 Act. The fund’s investment objective is to seek high current income. The fund pursues its objective by investing primarily in U.S. government debt securities, including U.S. Treasury securities and other securities issued or guaranteed by the U.S. government and its agencies and instrumentalities.
The fund is authorized to issue the Investor Class, the Institutional Class, the A Class (formerly Advisor Class), the C Class and the R Class. The A Class may incur an initial sales charge. The A Class and C Class may be subject to a contingent deferred sales charge. The share classes differ principally in their respective sales charges and distribution and shareholder servicing expenses and arrangements. The Institutional Class is made available to institutional shareholders or through financial intermediaries whose clients do not require the same level of shareholder and administrative services as shareholders of other classes. As a result, the Institutional Class is charged a lower unified management fee. Sale of the Institutional Class, C Class and R Class commenced on March 1, 2010.
2. Significant Accounting Policies
The following is a summary of significant accounting policies consistently followed by the fund in preparation of its financial statements. The financial statements are prepared in conformity with accounting principles generally accepted in the United States of America, which may require management to make certain estimates and assumptions at the date of the financial statements. Actual results could differ from these estimates.
Investment Valuations — The fund determines the fair value of its investments and computes its net asset value per share as of the close of regular trading (usually 4 p.m. Eastern time) on the New York Stock Exchange (NYSE) on each day the NYSE is open.
Debt securities maturing in greater than 60 days at the time of purchase are valued at the evaluated mean as provided by independent pricing services or at the mean of the most recent bid and asked prices as provided by investment dealers. Debt securities maturing within 60 days at the time of purchase may be valued at cost, plus or minus any amortized discount or premium or at the evaluated mean as provided by an independent pricing service. Evaluated mean prices are commonly derived through utilization of market models, which may consider, among other factors, trade data, quotations from dealers and active market makers, relevant yield curve and spread data, related sector levels, creditworthiness, and other relevant market information on the same or comparable securities.
Investments in open-end management investment companies are valued at the reported net asset value per share. Repurchase agreements are valued at cost. Exchange-traded futures contracts are valued at the settlement price as provided by the appropriate clearing corporation.
If the fund determines that the market price for a portfolio security is not readily available or the valuation methods mentioned above do not reflect a security’s fair value, such security is valued as determined in good faith by the Board of Trustees or its designee, in accordance with procedures adopted by the Board of Trustees. Circumstances that may cause the fund to use these procedures to value a security include, but are not limited to: a security has been declared in default; trading in a security has been halted during the trading day; there is a foreign market holiday and no trading occurred; or an event occurred between the close of a foreign exchange and the NYSE that may affect the value of a security.
Security Transactions — Security transactions are accounted for as of the trade date. Net realized gains and losses are determined on the identified cost basis, which is also used
for federal income tax purposes.
Investment Income — Interest income is recorded on the accrual basis and includes paydown gain (loss) and accretion of discounts and amortization of premiums.
When-Issued and Forward Commitments — The fund may engage in securities transactions on a when-issued or forward commitment basis. In these transactions, the securities’ prices and yields are fixed on the date of the commitment. In a when-issued transaction, the payment and delivery are scheduled for a future date and during this period, securities are subject to market fluctuations. In a forward commitment transaction, the fund may sell a security and at the same time make a commitment to purchase the same security at a future date at a specified price. Conversely, the fund may purchase a security and at the same time make a commitment to sell the same security at a future date at a specified price. These types of transactions are executed simultaneously in what are known as “roll” transactions. The fund will segregate cash, cash equivalents or other appropriate liquid securities on its records in amounts sufficient to meet the purchase price. The fund accounts for “roll” transactions as purchases and sales.
Repurchase Agreements — The fund may enter into repurchase agreements with institutions that American Century Investment Management, Inc. (ACIM) (the investment advisor) has determined are creditworthy pursuant to criteria adopted by the Board of Trustees. The fund requires that the collateral, represented by securities, received in a repurchase transaction be transferred to the custodian in a manner sufficient to enable the fund to obtain those securities in the event of a default under the repurchase agreement. ACIM monitors, on a daily basis, the securities transferred to ensure the value, including accrued interest, of the securities under each repurchase agreement is equal to or greater than amounts owed to the fund under each repurchase agreement.
Joint Trading Account — Pursuant to an Exemptive Order issued by the Securities and Exchange Commission, the fund, along with certain other funds in the American Century Investments family of funds, may transfer uninvested cash balances into a joint trading account. These balances are invested in one or more repurchase agreements that are collateralized by U.S. Treasury or Agency obligations.
Income Tax Status — It is the fund’s policy to distribute substantially all net investment income and net realized gains to shareholders and to otherwise qualify as a regulated investment company under provisions of the Internal Revenue Code. The fund is no longer subject to examination by tax authorities for years prior to 2008. At this time, management believes there are no uncertain tax positions which, based on their technical merit, would not be sustained upon examination and for which it is reasonably possible that the total amounts of unrecognized tax benefits will significantly change in the next twelve months. Accordingly, no provision has been made for federal or state income taxes.
Multiple Class — All shares of the fund represent an equal pro rata interest in the net assets of the class to which such shares belong, and have identical voting, dividend, liquidation and other rights and the same terms and conditions, except for class specific expenses and exclusive rights to vote on matters affecting only individual classes. Income, non-class specific expenses, and realized and unrealized capital gains and losses of the fund are allocated to each class of shares based on their relative net assets.
Distributions to Shareholders — Distributions from net investment income, if any, are generally declared daily and paid monthly. Distributions from net realized gains, if any, are generally declared and paid annually.
Indemnifications — Under the trust’s organizational documents, its officers and trustees are indemnified against certain liabilities arising out of the performance of their duties to the fund. In addition, in the normal course of business, the fund enters into contracts that provide general indemnifications. The maximum exposure under these arrangements is unknown as this would involve future claims that may be made against a fund. The risk of material loss from such claims is considered by management to be remote.
3. Fees and Transactions with Related Parties
Management Fees — The trust has entered into a management agreement with ACIM, under which ACIM provides the fund with investment advisory and management services in exchange for a single, unified management fee (the fee) per class. The agreement provides that all expenses of managing and operating the fund, except distribution and service fees, brokerage expenses, taxes, interest, fees and expenses of the independent trustees (including legal counsel fees), and extraordinary expenses, will be paid by ACIM. The fee is computed and accrued daily based on each class’s daily net assets and paid monthly in arrears. The fee consists of (1) an Investment Category Fee based on the daily net assets of the fund and certain other accounts managed by the investment advisor that are in the same broad investment category as the fund and (2) a Complex Fee based on the assets of all the funds in the American Century Investments family of funds. The rates for the Investment Category Fee range from 0.1625% to 0.2800%. The rates for the Complex Fee range from 0.2500% to 0.3100% for the Investor Class, A Class, C Class and R Class. The Institutional Class is 0.2000% less at each point within the Complex Fee range. The effective annual management fee for each class for the year ended March 31, 2011, was 0.47% for the Investor Class, A Class, C Class and R Class and 0.27% for the Institutional Class.
Distribution and Service Fees — The Board of Trustees has adopted a separate Master Distribution and Individual Shareholder Services Plan for each of the A Class, C Class and R Class (collectively the plans), pursuant to Rule 12b-1 of the 1940 Act. The plans provide that the A Class will pay American Century Investment Services, Inc. (ACIS) an annual distribution and service fee of 0.25%. The plans provide that the C Class will pay ACIS an annual distribution and service fee of 1.00%, of which 0.25% is paid for individual shareholder services and 0.75% is paid for distribution services. The plans provide that the R Class will pay ACIS an annual distribution and service fee of 0.50%. The fees are computed and accrued daily based on each class’s daily net assets and paid monthly in arrears. The fees are used to pay financial intermediaries for distribution and individual shareholder services. Fees incurred under the plans during the year ended March 31, 2011 are detailed in the Statement of Operations.
Related Parties — Certain officers and trustees of the trust are also officers and/or directors of American Century Companies, Inc. (ACC), the parent of the trust’s investment advisor, ACIM, the distributor of the trust, ACIS, and the trust’s transfer agent, American Century Services, LLC.
The fund is eligible to invest in a money market fund for temporary purposes, which is managed by J.P. Morgan Investment Management, Inc. (JPMIM). The fund has a securities lending agreement with JPMorgan Chase Bank (JPMCB) and a mutual funds services agreement with J.P. Morgan Investor Services Co. (JPMIS). JPMCB is a custodian of the fund. JPMIM, JPMIS and JPMCB are wholly owned subsidiaries of JPMorgan Chase & Co. (JPM). JPM is an equity investor in ACC.
4. Investment Transactions
Purchases of investment securities, excluding short-term investments, for the year ended March 31, 2011, were $1,201,486,618, of which $1,199,416,909 represented U.S. Treasury and Government Agency obligations.
Sales of investment securities, excluding short-term investments, for the year ended March 31, 2011, totaled $1,155,616,935, of which $1,151,012,616 represented U.S. Treasury and Government Agency obligations.
5. Capital Share Transactions
Transactions in shares of the fund were as follows (unlimited number of shares authorized):
| | | | | | | |
| | | Year ended March 31, 2011 | | | Year ended March 31, 2010(1) | |
| | | Shares | | | Amount | | | Shares | | | Amount | |
| Investor Class | |
| Sold | | | 33,453,787 | | | | $376,088,849 | | | | 40,351,769 | | | | $450,358,038 | |
| Issued in reinvestment of distributions | | | 2,995,597 | | | | 33,685,472 | | | | 3,719,388 | | | | 41,457,457 | |
| Redeemed | | | (36,265,286 | ) | | | (406,283,815 | ) | | | (33,866,174 | ) | | | (376,482,770 | ) |
| | | | 184,098 | | | | 3,490,506 | | | | 10,204,983 | | | | 115,332,725 | |
| Institutional Class | |
| Sold | | | 2,556,660 | | | | 28,470,104 | | | | 2,259 | | | | 25,000 | |
| Issued in reinvestment of distributions | | | 18,131 | | | | 201,907 | | | | 6 | | | | 71 | |
| Redeemed | | | (94,400 | ) | | | (1,046,281 | ) | | | — | | | | — | |
| | | | 2,480,391 | | | | 27,625,730 | | | | 2,265 | | | | 25,071 | |
| A Class | |
| Sold | | | 9,844,783 | | | | 110,283,503 | | | | 12,266,398 | | | | 136,599,245 | |
| Issued in reinvestment of distributions | | | 341,125 | | | | 3,835,209 | | | | 468,859 | | | | 5,226,821 | |
| Redeemed | | | (9,413,607 | ) | | | (105,369,007 | ) | | | (12,219,222 | ) | | | (136,105,071 | ) |
| | | | 772,301 | | | | 8,749,705 | | | | 516,035 | | | | 5,720,995 | |
| C Class | |
| Sold | | | 121,030 | | | | 1,369,662 | | | | 3,978 | | | | 44,000 | |
| Issued in reinvestment of distributions | | | 1,522 | | | | 17,038 | | | | 4 | | | | 47 | |
| Redeemed | | | (24,051 | ) | | | (270,430 | ) | | | — | | | | — | |
| | | | 98,501 | | | | 1,116,270 | | | | 3,982 | | | | 44,047 | |
| R Class | |
| Sold | | | 13,067 | | | | 146,275 | | | | 2,259 | | | | 25,000 | |
| Issued in reinvestment of distributions | | | 177 | | | | 1,972 | | | | 5 | | | | 57 | |
| Redeemed | | | (2,340 | ) | | | (25,906 | ) | | | — | | | | — | |
| | | | 10,904 | | | | 122,341 | | | | 2,264 | | | | 25,057 | |
| Net increase (decrease) | | | 3,546,195 | | | | $41,104,552 | | | | 10,729,529 | | | | $121,147,895 | |
| (1) | March 1, 2010 (commencement of sale) through March 31, 2010 for the Institutional Class, C Class and R Class. |
6. Fair Value Measurements
The fund’s securities valuation process is based on several considerations and may use multiple inputs to determine the fair value of the positions held by the fund. In conformity with accounting principles generally accepted in the United States of America, the inputs used to determine a valuation are classified into three broad levels as follows:
| • | Level 1 valuation inputs consist of unadjusted quoted prices in an active market for identical securities; |
| • | Level 2 valuation inputs consist of direct or indirect observable market data (including quoted prices for similar securities, evaluations of subsequent market events, interest rates, prepayment speeds, credit risk, etc.); or |
| • | Level 3 valuation inputs consist of unobservable data (including a fund’s own assumptions). |
The level classification is based on the lowest level input that is significant to the fair valuation measurement. The valuation inputs are not necessarily an indication of the risks associated with investing in these securities or other financial instruments.
The following is a summary of the level classifications as of period end. The Schedule of Investments provides additional information on the fund’s portfolio holdings.
| | | | | | | | | | |
| | | Level 1 | | | Level 2 | | | Level 3 | |
| Investment Securities | |
| U.S. Government Agency Mortgage-Backed Securities | | | — | | | | $501,849,037 | | | | — | |
| U.S. Treasury Securities | | | — | | | | 415,662,031 | | | | — | |
| U.S. Government Agency Securities and Equivalents | | | — | | | | 188,738,117 | | | | — | |
| Collateralized Mortgage Obligations | | | — | | | | 131,448,219 | | | | — | |
| Temporary Cash Investments | | | $5,036,365 | | | | 26,344,000 | | | | — | |
| Total Value of Investment Securities | | | $5,036,365 | | | | $1,264,041,404 | | | | — | |
| | |
| Other Financial Instruments | |
| Total Unrealized Gain (Loss) on Futures Contracts | | | $(26,698 | ) | | | — | | | | — | |
7. Derivative Instruments
Interest Rate Risk — The fund is subject to interest rate risk in the normal course of pursuing its investment objectives. The value of bonds generally declines as interest rates rise. A fund may enter into futures contracts based on a bond index or a specific underlying security. A fund may purchase futures contracts to gain exposure to increases in market value or sell futures contracts to protect against a decline in market value. Upon entering into a futures contract, a fund will segregate cash, cash equivalents or other appropriate liquid securities on its records in amounts sufficient to meet requirements. Subsequent payments (variation margin) are made or received daily, in cash, by a fund. The variation margin is equal to the daily change in the contract value and is recorded as unrealized gains and losses. A fund recognizes a realized gain or loss when the futures contract is closed or expires. Net realized and unrealized gains or losses occurring during the holding period of futures contracts are a component of net realized gain (loss) on futures contract transactions and change in net unrealized appreciation (depreciation) on futures contracts, respectively. One of the risks of entering into futures contracts is the possibility that the change in value of the contract may not correlate with the changes in value of the underlying securities. The interest rate risk derivative instruments held at period end as disclosed on the Schedule of Investments are indicative of the fund’s typical volume during the period.
The value of interest rate risk derivative instruments as of March 31, 2011, is disclosed on the Statement of Assets and Liabilities as a liability of $76,437 in payable for variation margin on futures contracts. For the year ended March 31, 2011, the effect of interest rate risk derivative instruments on the Statement of Operations was $335,535 in net realized gain (loss) on futures contract transactions and $72,801 in change in net unrealized appreciation (depreciation) on futures contracts.
8. Federal Tax Information
The tax character of distributions paid during the years ended March 31, 2011 and March 31, 2010 were as follows:
| | | | | | | |
| | | 2011 | | | 2010 | |
| Distributions Paid From | |
| Ordinary income | | | $44,043,329 | | | | $51,349,586 | |
| Long-term capital gains | | | — | | | | $4,230,697 | |
The book-basis character of distributions made during the year from net investment income or net realized gains may differ from their ultimate characterization for federal income tax purposes. These differences reflect the differing character of certain income items and net realized gains and losses for financial statement and tax purposes, and may result in reclassification among certain capital accounts on the financial statements.
As of March 31, 2011, the federal tax cost of investments and the components of distributable earnings on a tax-basis were as follows:
| | | | |
| Federal tax cost of investments | | | $1,237,798,224 | |
| Gross tax appreciation of investments | | | $36,538,338 | |
| Gross tax depreciation of investments | | | (5,258,793 | ) |
| Net tax appreciation (depreciation) of investments | | | $31,279,545 | |
| Net tax appreciation (depreciation) on derivatives | | | $(475,829 | ) |
| Other book-to-tax adjustments | | | $(924,765 | ) |
| Net tax appreciation (depreciation) | | | $29,878,951 | |
| Undistributed ordinary income | | | $67,663 | |
| Capital loss deferral | | | $(865,280 | ) |
The difference between book-basis and tax-basis cost and unrealized appreciation (depreciation) is attributable primarily to the tax deferral of losses on wash sales and the realization for tax purposes of unrealized gains (losses) for futures contracts. Other book-to-tax adjustments are attributable primarily to the tax deferral of losses on straddle positions.
The capital loss deferral represents net capital losses incurred in the five-month period ended March 31, 2011. The fund has elected to treat such losses as having been incurred in the following fiscal year for federal income tax purposes.
On December 22, 2010, the Regulated Investment Company Modernization Act of 2010 (the “Act”) was enacted, which changed various technical rules governing the tax treatment of regulated investment companies. The changes are generally effective for taxable years beginning after the date of enactment. Under the Act, the fund will be permitted to carry forward capital losses incurred in taxable years beginning after the
date of enactment for an unlimited period.
| Investor Class | |
| For a Share Outstanding Throughout the Years Ended March 31 | |
| | | 2011 | | | 2010 | | | 2009 | | | 2008 | | | 2007 | |
| Per-Share Data | |
| Net Asset Value, Beginning of Period | | | $11.02 | | | | $11.26 | | | | $11.05 | | | | $10.45 | | | | $10.33 | |
| Income From Investment Operations | | | | | | | | | | | | | | | | | | | | |
Net Investment Income (Loss)(1) | | | 0.32 | | | | 0.37 | | | | 0.39 | | | | 0.47 | | | | 0.48 | |
| Net Realized and Unrealized Gain (Loss) | | | 0.13 | | | | (0.07 | ) | | | 0.34 | | | | 0.60 | | | | 0.12 | |
| Total From Investment Operations | | | 0.45 | | | | 0.30 | | | | 0.73 | | | | 1.07 | | | | 0.60 | |
| Distributions | | | | | | | | | | | | | | | | | | | | |
| From Net Investment Income | | | (0.34 | ) | | | (0.38 | ) | | | (0.40 | ) | | | (0.47 | ) | | | (0.48 | ) |
| From Net Realized Gains | | | (0.06 | ) | | | (0.16 | ) | | | (0.12 | ) | | | — | | | | — | |
| Total Distributions | | | (0.40 | ) | | | (0.54 | ) | | | (0.52 | ) | | | (0.47 | ) | | | (0.48 | ) |
| Net Asset Value, End of Period | | | $11.07 | | | | $11.02 | | | | $11.26 | | | | $11.05 | | | | $10.45 | |
| | | | | | | | | | | | | | | | | | | | | |
Total Return(2) | | | 4.04 | % | | | 2.77 | % | | | 6.90 | % | | | 10.58 | % | | | 5.95 | % |
| | | | | | | | | | | | | | | | | | | | | |
| Ratios/Supplemental Data | |
Ratio of Operating Expenses to Average Net Assets | | | 0.48 | % | | | 0.48 | % | | | 0.49 | % | | | 0.49 | % | | | 0.49 | % |
Ratio of Net Investment Income (Loss) to Average Net Assets | | | 2.83 | % | | | 3.28 | % | | | 3.58 | % | | | 4.45 | % | | | 4.60 | % |
| Portfolio Turnover Rate | | | 93 | % | | | 124 | % | | | 335 | % | | | 239 | % | | | 319 | % |
| Net Assets, End of Period (in thousands) | | | $995,817 | | | | $988,435 | | | | $895,833 | | | | $662,104 | | | | $500,331 | |
| (1) | Computed using average shares outstanding throughout the period. |
| (2) | Total returns are calculated based on the net asset value of the last business day. Total returns for periods less than one year are not annualized. |
See Notes to Financial Statements.
| Institutional Class | |
| For a Share Outstanding Throughout the Years Ended March 31 (except as noted) | |
| | | 2011 | | | 2010(1) | |
| Per-Share Data | |
| Net Asset Value, Beginning of Period | | | $11.01 | | | | $11.07 | |
| Income From Investment Operations | | | | | | | | |
Net Investment Income (Loss)(2) | | | 0.34 | | | | 0.03 | |
| Net Realized and Unrealized Gain (Loss) | | | 0.14 | | | | (0.06 | ) |
| Total From Investment Operations | | | 0.48 | | | | (0.03 | ) |
| Distributions | | | | | | | | |
| From Net Investment Income | | | (0.36 | ) | | | (0.03 | ) |
| From Net Realized Gains | | | (0.06 | ) | | | — | |
| Total Distributions | | | (0.42 | ) | | | (0.03 | ) |
| Net Asset Value, End of Period | | | $11.07 | | | | $11.01 | |
| | | | | | | | | |
Total Return(3) | | | 4.34 | % | | | (0.26 | )% |
| | | | | | | | | |
| Ratios/Supplemental Data | |
| Ratio of Operating Expenses to Average Net Assets | | | 0.28 | % | | | 0.28 | %(4) |
| Ratio of Net Investment Income (Loss) to Average Net Assets | | | 3.03 | % | | | 3.33 | %(4) |
| Portfolio Turnover Rate | | | 93 | % | | | 124 | %(5) |
| Net Assets, End of Period (in thousands) | | | $27,492 | | | | $25 | |
| (1) | March 1, 2010 (commencement of sale) through March 31, 2010. |
| (2) | Computed using average shares outstanding throughout the period. |
| (3) | Total returns are calculated based on the net asset value of the last business day. Total returns for periods less than one year are not annualized. |
| (5) | Portfolio turnover is calculated at the fund level. Percentage indicated was calculated for the year ended March 31, 2010. |
See Notes to Financial Statements.
A Class(1) | |
| For a Share Outstanding Throughout the Years Ended March 31 | |
| | | 2011 | | | 2010 | | | 2009 | | | 2008 | | | 2007 | |
| Per-Share Data | |
| Net Asset Value, Beginning of Period | | | $11.02 | | | | $11.26 | | | | $11.05 | | | | $10.45 | | | | $10.33 | |
| Income From Investment Operations | | | | | | | | | | | | | | | | | | | | |
Net Investment Income (Loss)(2) | | | 0.29 | | | | 0.34 | | | | 0.36 | | | | 0.44 | | | | 0.45 | |
| Net Realized and Unrealized Gain (Loss) | | | 0.13 | | | | (0.07 | ) | | | 0.35 | | | | 0.61 | | | | 0.12 | |
| Total From Investment Operations | | | 0.42 | | | | 0.27 | | | | 0.71 | | | | 1.05 | | | | 0.57 | |
| Distributions | | | | | | | | | | | | | | | | | | | | |
| From Net Investment Income | | | (0.31 | ) | | | (0.35 | ) | | | (0.38 | ) | | | (0.45 | ) | | | (0.45 | ) |
| From Net Realized Gains | | | (0.06 | ) | | | (0.16 | ) | | | (0.12 | ) | | | — | | | | — | |
| Total Distributions | | | (0.37 | ) | | | (0.51 | ) | | | (0.50 | ) | | | (0.45 | ) | | | (0.45 | ) |
| Net Asset Value, End of Period | | | $11.07 | | | | $11.02 | | | | $11.26 | | | | $11.05 | | | | $10.45 | |
| | | | | | | | | | | | | | | | | | | | | |
Total Return(3) | | | 3.78 | % | | | 2.52 | % | | | 6.64 | % | | | 10.31 | % | | | 5.69 | % |
| | | | | | | | | | | | | | | | | | | | | |
| Ratios/Supplemental Data | |
Ratio of Operating Expenses to Average Net Assets | | | 0.73 | % | | | 0.73 | % | | | 0.74 | % | | | 0.74 | % | | | 0.74 | % |
Ratio of Net Investment Income (Loss) to Average Net Assets | | | 2.58 | % | | | 3.03 | % | | | 3.33 | % | | | 4.20 | % | | | 4.35 | % |
| Portfolio Turnover Rate | | | 93 | % | | | 124 | % | | | 335 | % | | | 239 | % | | | 319 | % |
| Net Assets, End of Period (in thousands) | | | $201,020 | | | | $191,437 | | | | $189,956 | | | | $105,512 | | | | $40,671 | |
| (1) | Prior to March 1, 2010, the A Class was referred to as the Advisor Class. |
| (2) | Computed using average shares outstanding throughout the period. |
| (3) | Total returns are calculated based on the net asset value of the last business day and do not reflect applicable sales charges. Total returns for periods less than one year are not annualized. |
See Notes to Financial Statements.
| C Class | |
| For a Share Outstanding Throughout the Years Ended March 31 (except as noted) | |
| | | 2011 | | | 2010(1) | |
| Per-Share Data | |
| Net Asset Value, Beginning of Period | | | $11.01 | | | | $11.07 | |
| Income From Investment Operations | | | | | | | | |
Net Investment Income (Loss)(2) | | | 0.20 | | | | 0.02 | |
| Net Realized and Unrealized Gain (Loss) | | | 0.14 | | | | (0.06 | ) |
| Total From Investment Operations | | | 0.34 | | | | (0.04 | ) |
| Distributions | | | | | | | | |
| From Net Investment Income | | | (0.22 | ) | | | (0.02 | ) |
| From Net Realized Gains | | | (0.06 | ) | | | — | |
| Total Distributions | | | (0.28 | ) | | | (0.02 | ) |
| Net Asset Value, End of Period | | | $11.07 | | | | $11.01 | |
| | | | | | | | | |
Total Return(3) | | | 3.10 | % | | | (0.36 | )% |
| | | | | | | | | |
| Ratios/Supplemental Data | |
| Ratio of Operating Expenses to Average Net Assets | | | 1.48 | % | | | 1.48 | %(4) |
| Ratio of Net Investment Income (Loss) to Average Net Assets | | | 1.83 | % | | | 2.13 | %(4) |
| Portfolio Turnover Rate | | | 93 | % | | | 124 | %(5) |
| Net Assets, End of Period (in thousands) | | | $1,134 | | | | $44 | |
| (1) | March 1, 2010 (commencement of sale) through March 31, 2010. |
| (2) | Computed using average shares outstanding throughout the period. |
| (3) | Total returns are calculated based on the net asset value of the last business day and do not reflect applicable sales charges. Total returns for periods less than one year are not annualized. |
| (5) | Portfolio turnover is calculated at the fund level. Percentage indicated was calculated for the year ended March 31, 2010. |
See Notes to Financial Statements.
| R Class | |
| For a Share Outstanding Throughout the Years Ended March 31 (except as noted) | |
| | | 2011 | | | 2010(1) | |
| Per-Share Data | |
| Net Asset Value, Beginning of Period | | | $11.01 | | | | $11.07 | |
| Income From Investment Operations | | | | | | | | |
Net Investment Income (Loss)(2) | | | 0.26 | | | | 0.02 | |
| Net Realized and Unrealized Gain (Loss) | | | 0.14 | | | | (0.05 | ) |
| Total From Investment Operations | | | 0.40 | | | | (0.03 | ) |
| Distributions | | | | | | | | |
| From Net Investment Income | | | (0.28 | ) | | | (0.03 | ) |
| From Net Realized Gains | | | (0.06 | ) | | | — | |
| Total Distributions | | | (0.34 | ) | | | (0.03 | ) |
| Net Asset Value, End of Period | | | $11.07 | | | | $11.01 | |
| | | | | | | | | |
Total Return(3) | | | 3.62 | % | | | (0.32 | )% |
| | | | | | | | | |
| Ratios/Supplemental Data | |
| Ratio of Operating Expenses to Average Net Assets | | | 0.98 | % | | | 0.98 | %(4) |
| Ratio of Net Investment Income (Loss) to Average Net Assets | | | 2.33 | % | | | 2.63 | %(4) |
| Portfolio Turnover Rate | | | 93 | % | | | 124 | %(5) |
| Net Assets, End of Period (in thousands) | | | $146 | | | | $25 | |
| (1) | March 1, 2010 (commencement of sale) through March 31, 2010. |
| (2) | Computed using average shares outstanding throughout the period. |
| (3) | Total returns are calculated based on the net asset value of the last business day. Total returns for periods less than one year are not annualized. |
| (5) | Portfolio turnover is calculated at the fund level. Percentage indicated was calculated for the year ended March 31, 2010. |
See Notes to Financial Statements.
Report of Independent Registered Public Accounting Firm |
To the Trustees of the American Century Government Income Trust and Shareholders of the Government Bond Fund:
In our opinion, the accompanying statement of assets and liabilities, including the schedule of investments, and the related statements of operations and of changes in net assets and the financial highlights present fairly, in all material respects, the financial position of the Government Bond Fund (one of the five funds comprising the American Century Government Income Trust, hereafter referred to as the “Fund”) at March 31, 2011, the results of its operations for the year then ended, the changes in its net assets for each of the two years in the period then ended and the financial highlights for each of the periods presented, in conformity with accounting principles generally accepted in the United States of America. These financial statements and financial highlights (hereafter referred to as “financial statements”) are the responsibility of the Fund’s management; our responsibility is to express an opinion on these financial statements based on our audits. We conducted our audits of these financial statements in accordance with the standards of the Public Company Accounting Oversight Board (United States). Those standards require that we plan and perform the audit to obtain reasonable assurance about whether the financial statements are free of material misstatement. An audit includes examining, on a test basis, evidence supporting the amounts and disclosures in the financial statements, assessing the accounting principles used and significant estimates made by management, and evaluating the overall financial statement presentation. We believe that our audits, which included confirmation of securities at March 31, 2011 by correspondence with the custodian and brokers, provide a reasonable basis for our opinion.
PricewaterhouseCoopers LLP
Kansas City, Missouri
May 19, 2011
A special meeting of shareholders was held on June 16, 2010, to vote on the following proposals. Each proposal received the required number of votes and was adopted. A summary of voting results is listed below each proposal.
Proposal 1:
To elect one Trustee to the Board of Trustees of American Century Government Income Trust (the proposal was voted on by all shareholders of funds issued by American Century Government Income Trust):
| | | |
| Frederick L.A. Grauer | For: | 6,878,868,575 |
| | Withhold: | 268,743,465 |
| | Abstain: | 0 |
| | Broker Non-Vote: | 0 |
The other trustees whose term of office continued after the meeting include Jonathan S. Thomas, John Freidenrich, Ronald J. Gilson, Peter F. Pervere, Myron S. Scholes, and John B. Shoven.
Proposal 2:
To approve a management agreement between the fund and American Century Investment Management, Inc.:
| | | |
| Investor and A Classes | For: | 635,725,578 |
| | Against: | 9,605,771 |
| | Abstain: | 18,289,520 |
| | Broker Non-Vote: | 131,599,462 |
The individuals listed below serve as trustees of the fund. Each trustee will continue to serve in this capacity until death, retirement, resignation or removal from office. The mandatory retirement age for trustees who are not “interested persons,” as that term is defined in the Investment Company Act (independent trustees), is 73. However, the mandatory retirement age may be extended for a period not to exceed two years with the approval of the remaining independent trustees.
Mr. Thomas is the only trustee who is an “interested person” because he currently serves as President and Chief Executive Officer of American Century Companies, Inc. (ACC), the parent company of American Century Investment Management, Inc. (ACIM or the advisor).
The other trustees (more than three-fourths of the total number) are independent; that is, they have never been employees, directors or officers of, and have no financial interest in, ACC or any of its wholly owned, direct or indirect, subsidiaries, including ACIM, American Century Investment Services, Inc. (ACIS) and American Century Services, LLC (ACS). The trustees serve in this capacity for eight (in the case of Mr. Thomas, 15) registered investment companies in the American Century Investments family of funds.
The following presents additional information about the trustees. The mailing address for each trustee, other than Mr. Thomas, is 1665 Charleston Road, Mountain View, California 94043. The mailing address for Mr. Thomas is 4500 Main Street, Kansas City, Missouri 64111.
| | | | | | |
Name (Year of Birth) | Position(s) Held with Funds | Length of Time Served | Principal Occupation(s) During Past 5 Years | Number of American Century Portfolios Overseen by Trustee | Other Directorships Held During Past 5 Years |
| Independent Trustees |
Tanya S. Beder (1955) | Trustee | Since 2011 | Chairman, SBCC Group Inc. (investment advisory services) (2006 to present); Fellow in Practice, International Center for Finance, Yale University School of Management (1985 to present); Chief Executive Officer, Tribeca Global Management LLC (2004 to 2006) | 40 | None |
John Freidenrich (1937) | Trustee | Since 2005 | Founder, Member and Manager, Regis Management Company, LLC (investment management firm) (April 2004 to present) | 40 | None |
Ronald J. Gilson (1946) | Trustee and Chairman of the Board | Since 1995 | Charles J. Meyers Professor of Law and Business, Stanford Law School (1979 to present); Marc and Eva Stern Professor of Law and Business, Columbia University School of Law (1992 to present) | 40 | None |
| | | | | | |
Name (Year of Birth) | Position(s) Held with Funds | Length of Time Served | Principal Occupation(s) During Past 5 Years | Number of American Century Portfolios Overseen by Trustee | Other Directorships Held During Past 5 Years |
| Independent Trustees |
Frederick L. A. Grauer (1946) | Trustee | Since 2008 | Senior Advisor, BlackRock, Inc. (investment management firm) (2010 to 2011); Senior Advisor, Barclays Global Investors (investment management firm) (2003 to 2009) | 40 | None |
Peter F. Pervere (1947) | Trustee | Since 2007 | Retired | 40 | Intraware, Inc. (2003 to 2009) |
Myron S. Scholes (1941) | Trustee | Since 1980 | Chairman, Platinum Grove Asset Management, L.P. (asset manager) (1999 to 2009); Frank E. Buck Professor of Finance-Emeritus, Stanford Graduate School of Business (1996 to present) | 40 | Dimensional Fund Advisors (investment advisor); CME Group, Inc. (futures and options exchange) |
John B. Shoven (1947) | Trustee | Since 2002 | Professor of Economics, Stanford University (1973 to present) | 40 | Cadence Design Systems; Exponent; Financial Engines; Watson Wyatt Worldwide (2002 to 2006) |
| |
| Interested Trustee |
Jonathan S. Thomas (1963) | Trustee and President | Since 2007 | President and Chief Executive Officer, ACC (March 2007 to present); Chief Administrative Officer, ACC (February 2006 to February 2007); Executive Vice President, ACC (November 2005 to February 2007). Also serves as: Chief Executive Officer and Manager, ACS; Executive Vice President, ACIM; Director, ACC, ACIM and other ACC subsidiaries | 104 | None |
Officers
The following table presents certain information about the executive officers of the fund. Each officer serves as an officer for each of the 15 investment companies in the American Century family of funds, unless otherwise noted. No officer is compensated for his or her service as an officer of the fund. The listed officers are interested persons of the fund and are appointed or re-appointed on an annual basis. The mailing address for each of the officers listed below is 4500 Main Street, Kansas City, Missouri 64111.
| | | |
Name (Year of Birth) | Offices with the Funds | Principal Occupation(s) During the Past Five Years |
| Officers |
Jonathan S. Thomas (1963) | Trustee and President since 2007 | President and Chief Executive Officer, ACC (March 2007 to present); Chief Administrative Officer, ACC (February 2006 to February 2007); Executive Vice President, ACC (November 2005 to February 2007). Also serves as: Chief Executive Officer and Manager, ACS; Executive Vice President, ACIM; Director, ACC, ACIM and other ACC subsidiaries |
Barry Fink (1955) | Executive Vice President since 2007 | Chief Operating Officer and Executive Vice President, ACC (September 2007 to present); President, ACS (October 2007 to present); Managing Director, Morgan Stanley (2000 to 2007); Global General Counsel, Morgan Stanley (2000 to 2006). Also serves as: Manager, ACS and Director, ACC and certain ACC subsidiaries |
Maryanne L. Roepke (1956) | Chief Compliance Officer since 2006 and Senior Vice President since 2000 | Chief Compliance Officer, American Century funds, ACIM and ACS (August 2006 to present); Assistant Treasurer, ACC (January 1995 to August 2006); and Treasurer and Chief Financial Officer, various American Century funds (July 2000 to August 2006). Also serves as: Senior Vice President, ACS |
Charles A. Etherington (1957) | General Counsel since 2007 and Senior Vice President since 2006 | Attorney, ACC (February 1994 to present); Vice President, ACC (November 2005 to present), General Counsel, ACC (March 2007 to present); Also serves as General Counsel, ACIM, ACS, ACIS and other ACC subsidiaries; and Senior Vice President, ACIM and ACS |
Robert J. Leach (1966) | Vice President, Treasurer and Chief Financial Officer since 2006 | Vice President, ACS (February 2000 to present); and Controller, various American Century funds (1997 to September 2006) |
David H. Reinmiller (1963) | Vice President since 2001 | Attorney, ACC (January 1994 to present); Associate General Counsel, ACC (January 2001 to present); Chief Compliance Officer, American Century funds and ACIM (January 2001 to February 2005). Also serves as Vice President, ACIM and ACS |
Ward D. Stauffer (1960) | Secretary since 2005 | Attorney, ACC (June 2003 to present) |
The Statement of Additional Information has additional information about the fund’s trustees and is available without charge, upon request, by calling 1-800-345-2021.
Retirement Account Information
As required by law, distributions you receive from certain IRAs, or 403(b), 457 and qualified plans are subject to federal income tax withholding, unless you elect not to have withholding apply. Tax will be withheld on the total amount withdrawn even though you may be receiving amounts that are not subject to withholding, such as nondeductible contributions. In such case, excess amounts of withholding could occur. You may adjust your withholding election so that a greater or lesser amount will be withheld.
If you don’t want us to withhold on this amount, you must notify us to not withhold the federal income tax. You may notify us in writing or in certain situations by telephone or through other electronic means. You have the right to revoke your withholding election at any time and any election you make may remain in effect until revoked by filing a new election.
Remember, even if you elect not to have income tax withheld, you are liable for paying income tax on the taxable portion of your withdrawal. If you elect not to have income tax withheld or you don’t have enough income tax withheld, you may be responsible for payment of estimated tax. You may incur penalties under the estimated tax rules if your withholding and estimated tax payments are not sufficient. You can reduce or defer the income tax on a distribution by directly or indirectly rolling such distribution over to another IRA or eligible plan. You should consult your tax advisor for additional information.
State tax will be withheld if, at the time of your distribution, your address is within one of the mandatory withholding states and you have federal income tax withheld. State taxes will be withheld from your distribution in accordance with the respective state rules.
Proxy Voting Guidelines
American Century Investment Management, Inc., the fund’s investment advisor, is responsible for exercising the voting rights associated with the securities purchased and/or held by the fund. A description of the policies and procedures the advisor uses in fulfilling this responsibility is available without charge, upon request, by calling 1-800-345-2021. It is also available on American Century Investments’ website at americancentury.com and on the Securities and Exchange Commission’s website at sec.gov. Information regarding how the investment advisor voted proxies relating to portfolio securities during the most recent 12-month period ended June 30 is available on the “About Us” page at americancentury.com. It is also available at sec.gov.
Quarterly Portfolio Disclosure
The fund files its complete schedule of portfolio holdings with the Securities and Exchange Commission (SEC) for the first and third quarters of each fiscal year on Form N-Q. The fund’s Forms N-Q are available on the SEC’s website at sec.gov, and may be reviewed and copied at the SEC’s Public Reference Room in Washington, DC. Information on the operation of the Public Reference Room may be obtained by calling 1-800-SEC-0330. The fund also makes its complete schedule of portfolio holdings for the most recent quarter of its fiscal year available on its website at americancentury.com and, upon request, by calling 1-800-345-2021.
Other Tax Information
The following information is provided pursuant to provisions of the Internal Revenue Code.
The fund hereby designates $6,719,062 as qualified short-term capital gain distributions for purposes of Internal Revenue Code Section 871.
| Contact Us | americancentury.com |
| Automated Information Line | 1-800-345-8765 |
| Investor Services Representative | 1-800-345-2021 or 816-531-5575 |
| Investors Using Advisors | 1-800-378-9878 |
Business, Not-For-Profit, Employer-Sponsored Retirement Plans | 1-800-345-3533 |
Banks and Trust Companies, Broker-Dealers, Financial Professionals, Insurance Companies | 1-800-345-6488 |
| Telecommunications Device for the Deaf | 1-800-634-4113 |
American Century Government Income Trust
Investment Advisor:
American Century Investment Management, Inc.
Kansas City, Missouri
This report and the statements it contains are submitted for the general information of our shareholders. The report is not authorized for distribution to prospective investors unless preceded or accompanied by an effective prospectus.
©2011 American Century Proprietary Holdings, Inc. All rights reserved.
CL-ANN-71447 1105
ANNUAL REPORT MARCH 31, 2011
| | Inflation-Adjusted Bond Fund |
| President’s Letter | 2 |
| Market Perspective | 3 |
| Performance | 4 |
| Portfolio Commentary | 6 |
| Fund Characteristics | 8 |
| Shareholder Fee Example | 9 |
| Schedule of Investments | 11 |
| Statement of Assets and Liabilities | 18 |
| Statement of Operations | 19 |
| Statement of Changes in Net Assets | 20 |
| Notes to Financial Statements | 21 |
| Financial Highlights | 28 |
| Report of Independent Registered Public Accounting Firm | 33 |
| Proxy Voting Results | 34 |
| Management | 35 |
| Additional Information | 38 |
Any opinions expressed in this report reflect those of the author as of the date of the report, and do not necessarily represent the opinions of American Century Investments® or any other person in the American Century Investments organization. Any such opinions are subject to change at any time based upon market or other conditions and American Century Investments disclaims any responsibility to update such opinions. These opinions may not be relied upon as investment advice and, because investment decisions made by American Century Investments funds are based on numerous factors, may not be relied upon as an indication of trading intent on behalf of any American Century Investments fund. Security examples are used for representational purposes only and are not intended as recommendations to purchase or sell securities. Performance information for comparative indices and securities is provided to American Century Investments by third party vendors. To the best of American Century Investments’ knowledge, such information is accurate at the time of printing.
Dear Investor:
Thank you for reviewing this annual report for the period ended March 31, 2011. Our report offers investment performance and portfolio information, presented with the expert perspective and commentary of our portfolio management team. This report remains one of our most important vehicles for conveying the information you need about your investment performance, and about the market factors and strategies that affect fund returns. For additional, updated information on fund performance, portfolio strategy, and the investment markets, we encourage you to visit our website, americancentury.com. Click on the “Fund Performance” and “Insights & News” headings at the top of our Individual Investors site.
Investment Performance and Macroeconomic Update
Investment performance tables turned dramatically since our semiannual report for the six months ended September 30, 2010. That report chronicled an uneven period for economic growth and financial market performance that produced generally higher returns for U.S. bonds than for U.S. stocks. For the subsequent six months ended March 31, 2011, broad U.S. stock indices significantly outperformed their bond counterparts as monetary and fiscal intervention in 2010 fueled investor optimism about economic and financial market conditions in 2011 and 2012. The S&P 500 Index (representing U.S. stocks) and the Barclays Capital U.S. Aggregate Bond Index returned 17.31% and -0.88%, respectively, during those final six months.
In the second half of 2010, the U.S. Federal Reserve launched its second round of quantitative easing (QE2), a form of monetary intervention involving the purchase of U.S. government securities to increase the money supply and encourage investors to purchase potentially higher-risk/higher-return assets, such as stocks. Small-cap growth stocks benefited most from the resulting rally. But besides boosting stock prices, QE2 also helped fuel inflation fears. The benchmark 10-year U.S. Treasury note suffered a -5.92% total return from September 30, 2010, to March 31, 2011, as its yield jumped from 2.51% to 3.47%.
These developments over the more-recent six months are incorporated in the broader, enclosed 12-month Market Perspective and Portfolio Commentary from the portfolio management team. Our experts will continue to diligently apply their knowledge and skills as they make daily investment decisions for you.
Sincerely,
Jonathan Thomas
President and Chief Executive Officer
American Century Investments
By David MacEwen, Chief Investment Officer, Fixed Income
Economic Uncertainty Gave Way to Economic Optimism
Bonds generated solid returns for the 12 months ended March 31, 2011—a period characterized by mixed economic data and changing investor sentiment. Early in the period, a slowdown in the pace of economic growth, combined with lingering high unemployment, the European sovereign debt crisis, and mounting deflationary signals, stoked fears of a double-dip recession. This backdrop fueled demand for Treasuries and other “safe haven” investments.
Dissatisfied with the slow pace of economic growth and the lingering high jobless rate, the Federal Reserve (the Fed) kept its federal funds rate target near zero and, in late 2010, announced a second round of quantitative easing, dubbed “QE2” (the Fed’s government-securities purchase program designed to expand the money supply). This action, combined with improving economic data and the extension of prevailing federal income tax rates, sparked a fresh round of economic optimism and “risk-taking” by investors. At the same time, inflationary pressures began brewing, primarily due to better economic forecasts combined with soaring prices for oil and other commodities.
Demand for Yield, Inflation Protection Drove Performance
Treasury yields declined across all maturities, yet the slope of the yield curve (between two and 30 years) remained relatively unchanged. The generally low interest rate environment prompted investors to maintain a healthy appetite for yield. This led to strong, broad-benchmark-beating performance from investment-grade and high-yield corporate bonds, which also benefited from solid corporate fundamentals and low default rates. Longer-term nominal Treasuries also outperformed the broad bond market in this rate environment, but they lagged their inflation-indexed counterparts. Concerns about rising inflation pushed TIPS (Treasury inflation-protected securities) to the top of the investment-grade fixed-income performance hierarchy for the 12-month period.
Government agency mortgage-backed securities (MBS) posted positive returns for the period, but they lagged the broader market. Valuations in the sector remained tight relative to Treasuries, giving investors little incentive to take on additional risk. Meanwhile, cash returns were essentially flat throughout the period, reflecting the Fed’s near-zero interest rate policy.
| U.S. Fixed-Income Total Returns |
| For the 12 months ended March 31, 2011 |
| Barclays Capital U.S. Bond Market Indices | | Barclays Capital U.S. Treasury Bellwethers |
| Corporate High-Yield | 14.31% | | 3-Month Bill | 0.19% |
Treasury Inflation Protected Securities (TIPS) | 7.91% | | 2-Year Note | 1.64% |
| 10-Year Note | 6.55% |
| Corporate (investment-grade) | 7.46% | | 30-Year Bond | 6.91% |
| Aggregate (multi-sector) | 5.12% | | | |
| Treasury | 4.53% | | | |
| MBS (mortgage-backed securities) | 4.37% | | |
| Total Returns as of March 31, 2011 |
| | | | Average Annual Returns | |
| | Ticker Symbol | 1 year | 5 years | 10 years | Since Inception | Inception Date |
| Investor Class | ACITX | 7.18% | 5.92% | 6.26% | 6.02% | 2/10/97 |
Barclays Capital U.S. Treasury Inflation Protected Securities (TIPS) Index | — | 7.91% | 6.25% | 6.74% | 6.65%(1) | — |
| Institutional Class | AIANX | 7.39% | 6.13% | — | 5.62% | 10/1/02 |
A Class(2) No sales charge* With sales charge* | AIAVX | 6.84% 2.04% | 5.64% 4.67% | 5.99% 5.50% | 6.19% 5.82% | 6/15/98 |
| C Class | AINOX | 6.11% | — | — | 5.63% | 3/1/10 |
| R Class | AIARX | 6.64% | — | — | 6.21% | 3/1/10 |
| * | Sales charges include initial sales charges and contingent deferred sales charges (CDSCs), as applicable. A Class shares have a 4.50% maximum initial sales charge and may be subject to a maximum CDSC of 1.00%. C Class shares redeemed within 12 months of purchase are subject to a maximum CDSC of 1.00%. The SEC requires that mutual funds provide performance information net of maximum sales charges in all cases where charges could be applied. |
| (1) | Since 2/28/97, the date nearest the Investor Class’s inception for which data are available. |
| (2) | Prior to March 1, 2010, the A Class was referred to as the Advisor Class and did not have a front-end sales charge. Performance prior to that date has been adjusted to reflect this charge. |
Prior to March 1, 2010, the A Class was referred to as the Advisor Class and did not have a front-end sales charge. Performance prior to that date has been adjusted to reflect this charge.
Data presented reflect past performance. Past performance is no guarantee of future results. Current performance may be higher or lower than the performance shown. Investment return and principal value will fluctuate, and redemption value may be more or less than original cost. To obtain performance data current to the most recent month end, please call 1-800-345-2021 or visit americancentury.com. As interest rates rise, bond values will decline.
Unless otherwise indicated, performance reflects Investor Class shares; performance for other share classes will vary due to differences in fee structure. For information about other share classes available, please consult the prospectus. Data assumes reinvestment of dividends and capital gains, and none of the charts reflect the deduction of taxes that a shareholder would pay on fund distributions or the redemption of fund shares. Returns for the index are provided for comparison. The fund’s total returns include operating expenses (such as transaction costs and management fees) that reduce returns, while the total returns of the index do not.
| Growth of $10,000 Over 10 Years |
| $10,000 investment made March 31, 2001 |
| Total Annual Fund Operating Expenses |
| Investor Class | Institutional Class | A Class | C Class | R Class |
| 0.48% | 0.28% | 0.73% | 1.48% | 0.98% |
The total annual fund operating expenses shown is as stated in the fund’s prospectus current as of the date of this report. The prospectus may vary from the expense ratio shown elsewhere in this report because it is based on a different time period, includes acquired fund fees and expenses, and, if applicable, does not include fee waivers or expense reimbursements.
Data presented reflect past performance. Past performance is no guarantee of future results. Current performance may be higher or lower than the performance shown. Investment return and principal value will fluctuate, and redemption value may be more or less than original cost. To obtain performance data current to the most recent month end, please call 1-800-345-2021 or visit americancentury.com. As interest rates rise, bond values will decline.
Unless otherwise indicated, performance reflects Investor Class shares; performance for other share classes will vary due to differences in fee structure. For information about other share classes available, please consult the prospectus. Data assumes reinvestment of dividends and capital gains, and none of the charts reflect the deduction of taxes that a shareholder would pay on fund distributions or the redemption of fund shares. Returns for the index are provided for comparison. The fund’s total returns include operating expenses (such as transaction costs and management fees) that reduce returns, while the total returns of the index do not.
Portfolio Managers: Bob Gahagan, Brian Howell, and Jim Platz
Performance Summary
Inflation-Adjusted Bond returned 7.18%* for the 12 months ended March 31, 2011. By comparison, the fund’s benchmark, the Barclays Capital U.S. Treasury Inflation Protected Securities (TIPS) Index, returned 7.91%. See page 4 for additional performance comparisons. Fund returns reflect operating expenses, while index returns do not.
TIPS (Treasury inflation-protected securities) posted solid returns for the 12-month period, outperforming their nominal Treasury counterparts and all other U.S. investment-grade fixed-income sectors. In the first half of the period, the growing likelihood of the Federal Reserve (the Fed) launching a second round of quantitative easing (which it ultimately did in December 2010), combined with relatively slow growth and an overall aura of economic uncertainty, helped keep Treasuries, including TIPS, in favor. In the final months of the period, soaring commodity prices helped usher in mounting inflation fears, which boosted TIPS performance. The portfolio’s lagging results relative to the benchmark were due primarily to portfolio-only weightings in investment-grade spread (non-Treasury) sectors, which lagged TIPS during the period.
Commodity Price Hikes Pushed Inflation Upward
Political unrest in several oil-producing nations sent oil prices soaring during the period, with Brent crude jumping more than 29%. Similarly, WTI crude futures increased from $84 a barrel at the end of March 2010 to $107 a barrel a year later. Prices for gold and other commodities also skyrocketed, pushing the return on the S&P Goldman Sachs Commodities Index, a measure of price movements in the global commodities markets, up 22.73%.
Accordingly, headline inflation, based on the year-to-year change in the Consumer Price Index (CPI), increased 2.7% as of March 31, 2011, marking the largest gain since December 2009. The year-to-year change in core inflation, which excludes food and energy prices, was only 1.2% for the 12-month period.
At the same time, expectations for higher long-term inflation were mounting. The yield difference (or breakeven rate) between 10-year TIPS and nominal 10-year Treasuries rose from 2.26 percentage points at the end of March 2010 to 2.49 percentage points at the end of March 2011. The 10-year breakeven rate equals the market’s expectations for inflation for the next 10 years and reflects the inflation rate required for TIPS to outperform nominal Treasuries during that period.
Portfolio Strategy
We continued to invest the majority of the portfolio in TIPS (86% as of March 31, 2011), while investing most of the remainder in spread sectors—primarily corporate, mortgage-backed, and municipal bonds. These spread-sector investments underperformed TIPS for the 12-month period, thereby detracting from performance relative to the all-TIPS benchmark.
* All fund returns referenced in this commentary are for Investor Class shares.
In an effort to maintain maximum inflation protection without investing further in TIPS, we used inflation “swaps” to synthetically create an inflation-linked “overlay” for the non-inflation-linked spread securities. Inflation swaps are fixed-maturity instruments, negotiated through a counterparty (investment bank), that return the rate of inflation (CPI). All swaps bear counterparty credit risk, but we apply stringent controls and oversight with regard to this risk. The portfolio’s swaps underperformed during the period, primarily because we used investment-grade corporate securities as the counterparts to the swap agreements.
We also positioned the portfolio for a flattening of the nominal Treasury yield curve (the graphic representation of Treasury yields). The slope of the curve remained relatively unchanged for the year, so this strategy had a neutral impact on performance. Longer term—potentially after the Fed ends its quantitative easing program in June—we believe the curve will likely flatten, due to short-term rates rising at a greater pace than long-term rates.
Outlook
We believe core inflation has bottomed and headline inflation likely will be higher during the next three to five years than it’s been during the past five years. Contained overall inflation (CPI) of 2%-4% is our most probable scenario, but there’s an almost equally high likelihood, in our view, that monetary expansion and global wage and commodity-price pressures could push CPI beyond that level. This outlook strongly supports maintaining an allocation to inflation-hedging strategies, including TIPS, in investment portfolios.
| MARCH 31, 2011 | |
| Portfolio at a Glance | |
| Average Duration (effective) | 6.2 years |
| Weighted Average Life | 9.4 years |
| | |
| 30-Day SEC Yields | |
| Investor Class | 4.99% |
| Institutional Class | 5.20% |
| A Class | 4.53% |
| C Class | 4.02% |
| R Class | 4.49% |
| | |
| Types of Investments in Portfolio | % of net assets |
| U.S. Treasury Securities | 86.8% |
| Corporate Bonds | 5.4% |
| Commercial Mortgage-Backed Securities | 3.6% |
| Collateralized Mortgage Obligations | 2.7% |
| Municipal Securities | 1.0% |
| Sovereign Governments & Agencies | 0.1% |
| Temporary Cash Investments | 0.3% |
| Other Assets and Liabilities | 0.1% |
Shareholder Fee Example (Unaudited) |
Fund shareholders may incur two types of costs: (1) transaction costs, including sales charges (loads) on purchase payments and redemption/exchange fees; and (2) ongoing costs, including management fees; distribution and service (12b-1) fees; and other fund expenses. This example is intended to help you understand your ongoing costs (in dollars) of investing in your fund and to compare these costs with the ongoing cost of investing in other mutual funds.
The example is based on an investment of $1,000 made at the beginning of the period and held for the entire period from October 1, 2010 to March 31, 2011.
Actual Expenses
The table provides information about actual account values and actual expenses for each class. You may use the information, together with the amount you invested, to estimate the expenses that you paid over the period. First, identify the share class you own. Then simply divide your account value by $1,000 (for example, an $8,600 account value divided by $1,000 = 8.6), then multiply the result by the number under the heading “Expenses Paid During Period” to estimate the expenses you paid on your account during this period.
If you hold Investor Class shares of any American Century Investments fund, or Institutional Class shares of the American Century Diversified Bond Fund, in an American Century Investments account (i.e., not a financial intermediary or retirement plan account), American Century Investments may charge you a $12.50 semiannual account maintenance fee if the value of those shares is less than $10,000. We will redeem shares automatically in one of your accounts to pay the $12.50 fee. In determining your total eligible investment amount, we will include your investments in all personal accounts (including American Century Investments Brokerage accounts) registered under your Social Security number. Personal accounts include individual accounts, joint accounts, UGMA/UTMA accounts, personal trusts, Coverdell Education Savings Accounts and IRAs (including traditional, Roth, Rollover, SEP-, SARSEP- and SIMPLE-IRAs), and certain other retirement accounts. If you have only business, business retirement, employer-sponsored or American Century Investments Brokerage accounts, you are currently not subject to this fee. We will not charge the fee as long as you choose to manage your accounts exclusively online. If you are subject to the Account Maintenance Fee, your account value could be reduced by the fee amount.
Hypothetical Example for Comparison Purposes
The table also provides information about hypothetical account values and hypothetical expenses based on the actual expense ratio of each class of your fund and an assumed rate of return of 5% per year before expenses, which is not the actual return of a fund’s share class. The hypothetical account values and expenses may not be used to estimate the actual ending account balance or expenses you paid for the period. You may use this information to compare the ongoing costs of investing in your fund and other funds. To do so, compare this 5% hypothetical example with the 5% hypothetical examples that appear in the shareholder reports of the other funds.
Please note that the expenses shown in the table are meant to highlight your ongoing costs only and do not reflect any transactional costs, such as sales charges (loads) or redemption/exchange fees. Therefore, the table is useful in comparing ongoing costs only, and will not help you determine the relative total costs of owning different funds. In addition, if these transactional costs were included, your costs would have been higher.
| | | | | |
| | Beginning Account Value 10/1/10 | Ending Account Value 3/31/11 | Expenses Paid During Period* 10/1/10 – 3/31/11 | Annualized Expense Ratio* |
| Actual | | | | |
| Investor Class | $1,000 | $1,006.90 | $2.40 | 0.48% |
| Institutional Class | $1,000 | $1,007.60 | $1.40 | 0.28% |
| A Class | $1,000 | $1,005.00 | $3.65 | 0.73% |
| C Class | $1,000 | $1,001.70 | $7.39 | 1.48% |
| R Class | $1,000 | $1,004.70 | $4.90 | 0.98% |
| Hypothetical | | | | |
| Investor Class | $1,000 | $1,022.54 | $2.42 | 0.48% |
| Institutional Class | $1,000 | $1,023.54 | $1.41 | 0.28% |
| A Class | $1,000 | $1,021.29 | $3.68 | 0.73% |
| C Class | $1,000 | $1,017.55 | $7.44 | 1.48% |
| R Class | $1,000 | $1,020.04 | $4.94 | 0.98% |
| * | Expenses are equal to the class’s annualized expense ratio listed in the table above, multiplied by the average account value over the period, multiplied by 182, the number of days in the most recent fiscal half-year, divided by 365, to reflect the one-half year period. |
| | | |
| | Principal Amount | Value |
| U.S. Treasury Securities — 86.8% |
U.S. Treasury Inflation Indexed Bonds, 2.375%, 1/15/25(1) | $204,729,971 | $ 230,065,305 |
U.S. Treasury Inflation Indexed Bonds, 2.00%, 1/15/26(1) | 173,979,008 | 185,844,898 |
U.S. Treasury Inflation Indexed Bonds, 2.375%, 1/15/27(1) | 111,578,165 | 124,278,885 |
U.S. Treasury Inflation Indexed Bonds, 1.75%, 1/15/28(1) | 40,514,299 | 41,330,905 |
U.S. Treasury Inflation Indexed Bonds, 3.625%, 4/15/28(1) | 125,587,615 | 162,135,621 |
U.S. Treasury Inflation Indexed Bonds, 2.50%, 1/15/29(1) | 71,521,076 | 81,103,755 |
U.S. Treasury Inflation Indexed Bonds, 3.875%, 4/15/29(1) | 150,639,145 | 201,774,054 |
U.S. Treasury Inflation Indexed Bonds, 3.375%, 4/15/32(1) | 22,745,570 | 29,316,901 |
U.S. Treasury Inflation Indexed Bonds, 2.125%, 2/15/40(1) | 86,870,561 | 92,096,347 |
U.S. Treasury Inflation Indexed Bonds, 2.125%, 2/15/41(1) | 47,264,610 | 50,122,654 |
U.S. Treasury Inflation Indexed Notes, 3.00%, 7/15/12(1) | 128,146,793 | 137,327,357 |
U.S. Treasury Inflation Indexed Notes, 0.625%, 4/15/13(1) | 49,594,440 | 51,923,048 |
U.S. Treasury Inflation Indexed Notes, 1.875%, 7/15/13(1) | 58,183,901 | 62,943,170 |
U.S. Treasury Inflation Indexed Notes, 2.00%, 1/15/14(1) | 169,206,945 | 184,409,173 |
U.S. Treasury Inflation Indexed Notes, 1.25%, 4/15/14(1) | 43,184,485 | 46,160,155 |
U.S. Treasury Inflation Indexed Notes, 2.00%, 7/15/14(1) | 148,258,539 | 162,725,311 |
U.S. Treasury Inflation Indexed Notes, 1.625%, 1/15/15(1) | 176,269,191 | 191,100,656 |
U.S. Treasury Inflation Indexed Notes, 0.50%, 4/15/15(1) | 123,773,160 | 128,492,012 |
U.S. Treasury Inflation Indexed Notes, 1.875%, 7/15/15(1) | 146,534,985 | 161,222,773 |
U.S. Treasury Inflation Indexed Notes, 2.00%, 1/15/16(1) | 102,745,256 | 113,469,292 |
U.S. Treasury Inflation Indexed Notes, 2.50%, 7/15/16(1) | 109,074,262 | 123,841,935 |
U.S. Treasury Inflation Indexed Notes, 2.375%, 1/15/17(1) | 99,473,013 | 112,148,063 |
U.S. Treasury Inflation Indexed Notes, 2.625%, 7/15/17(1) | 59,609,616 | 68,457,948 |
U.S. Treasury Inflation Indexed Notes, 1.625%, 1/15/18(1) | 87,013,080 | 94,069,319 |
U.S. Treasury Inflation Indexed Notes, 1.375%, 7/15/18(1) | 15,268,709 | 16,256,411 |
U.S. Treasury Inflation Indexed Notes, 2.125%, 1/15/19(1) | 89,033,364 | 99,334,791 |
U.S. Treasury Inflation Indexed Notes, 1.875%, 7/15/19(1) | 50,641,740 | 55,551,609 |
U.S. Treasury Inflation Indexed Notes, 1.375%, 1/15/20(1) | 105,097,848 | 110,204,973 |
U.S. Treasury Inflation Indexed Notes, 1.25%, 7/15/20(1) | 115,420,140 | 119,171,294 |
U.S. Treasury Inflation Indexed Notes, 1.125%, 1/15/21(1) | 81,040,960 | 82,212,245 |
U.S. Treasury Notes, 3.625%, 2/15/21(1) | 38,650,000 | 39,151,252 |
TOTAL U.S. TREASURY SECURITIES (Cost $3,133,015,865) | 3,358,242,112 |
| Corporate Bonds — 5.4% |
| AEROSPACE & DEFENSE — 0.1% |
L-3 Communications Corp., 5.20%, 10/15/19(1) | 900,000 | 939,338 |
Lockheed Martin Corp., 4.25%, 11/15/19(1) | 3,000,000 | 3,026,544 |
| | | 3,965,882 |
| BEVERAGES — 0.3% |
| Anheuser-Busch InBev Worldwide, Inc., 6.875%, 11/15/19 | $ 3,120,000 | $ 3,686,751 |
Anheuser-Busch InBev Worldwide, Inc., 5.375%, 1/15/20(1) | 4,030,000 | 4,326,926 |
Coca-Cola Co. (The), 3.625%, 3/15/14(1) | 2,440,000 | 2,584,187 |
| Coca-Cola Co. (The), 3.15%, 11/15/20 | 2,650,000 | 2,466,623 |
| | | 13,064,487 |
| CAPITAL MARKETS — 0.6% |
Credit Suisse (New York), 5.50%, 5/1/14(1) | 3,710,000 | 4,065,978 |
Credit Suisse (New York), 5.30%, 8/13/19(1) | 3,240,000 | 3,406,947 |
Credit Suisse AG, 5.40%, 1/14/20(1) | 980,000 | 990,120 |
Goldman Sachs Group, Inc. (The), 7.50%, 2/15/19(1) | 3,980,000 | 4,624,171 |
Goldman Sachs Group, Inc. (The), 5.375%, 3/15/20(1) | 2,000,000 | 2,031,386 |
Morgan Stanley, 4.20%, 11/20/14(1) | 3,230,000 | 3,333,786 |
Morgan Stanley, 7.30%, 5/13/19(1) | 3,190,000 | 3,589,095 |
| | | 22,041,483 |
| CHEMICALS — 0.1% |
Dow Chemical Co. (The), 2.50%, 2/15/16(1) | 3,480,000 | 3,351,278 |
| COMMERCIAL BANKS — 0.1% |
PNC Bank N.A., 6.00%, 12/7/17(1) | 1,200,000 | 1,328,299 |
PNC Funding Corp., 3.625%, 2/8/15(1) | 980,000 | 1,012,727 |
| | | 2,341,026 |
| COMMUNICATIONS EQUIPMENT — 0.1% |
Cisco Systems, Inc., 5.90%, 2/15/39(1) | 2,675,000 | 2,785,392 |
CONSUMER FINANCE(2) |
John Deere Capital Corp., 4.90%, 9/9/13(1) | 1,500,000 | 1,628,306 |
| DIVERSIFIED FINANCIAL SERVICES — 0.2% |
Bank of America Corp., 6.50%, 8/1/16(1) | 4,570,000 | 5,055,384 |
Citigroup, Inc., 6.01%, 1/15/15(1) | 4,340,000 | 4,742,171 |
| | | 9,797,555 |
| DIVERSIFIED TELECOMMUNICATION SERVICES — 0.5% |
AT&T, Inc., 6.70%, 11/15/13(1) | 1,820,000 | 2,048,071 |
AT&T, Inc., 6.55%, 2/15/39(1) | 3,250,000 | 3,395,675 |
Cellco Partnership/Verizon Wireless Capital LLC, 5.55%, 2/1/14(1) | 2,320,000 | 2,546,982 |
Cellco Partnership/Verizon Wireless Capital LLC, 8.50%, 11/15/18(1) | 1,560,000 | 2,005,371 |
Deutsche Telekom International Finance BV, 6.75%, 8/20/18(1) | 3,900,000 | 4,604,843 |
Verizon Communications, Inc., 6.10%, 4/15/18(1) | 3,970,000 | 4,451,795 |
| | | 19,052,737 |
| ELECTRIC UTILITIES — 0.1% |
Duke Energy Ohio, Inc., 2.10%, 6/15/13(1) | 1,950,000 | 1,987,159 |
FirstEnergy Solutions Corp., 6.05%, 8/15/21(1) | 2,600,000 | 2,695,997 |
| | | 4,683,156 |
| FOOD & STAPLES RETAILING — 0.1% |
Wal-Mart Stores, Inc., 3.25%, 10/25/20(1) | 5,280,000 | 4,933,996 |
| FOOD PRODUCTS — 0.3% |
Kraft Foods, Inc., 5.375%, 2/10/20(1) | 6,970,000 | 7,361,142 |
Kraft Foods, Inc., 6.50%, 2/9/40(1) | 2,450,000 | 2,625,623 |
Mead Johnson Nutrition Co., 5.90%, 11/1/39(1) | 1,300,000 | 1,346,690 |
| | | 11,333,455 |
| HEALTH CARE EQUIPMENT & SUPPLIES — 0.2% |
Medtronic, Inc., 3.00%, 3/15/15(1) | 5,770,000 | 5,934,007 |
Stryker Corp., 3.00%, 1/15/15(1) | 1,450,000 | 1,485,255 |
| | | 7,419,262 |
| INDUSTRIAL CONGLOMERATES — 0.3% |
General Electric Capital Corp., 3.75%, 11/14/14(1) | 4,640,000 | 4,833,154 |
General Electric Capital Corp., 5.625%, 9/15/17(1) | 200,000 | 217,029 |
General Electric Capital Corp., 6.00%, 8/7/19(1) | 1,350,000 | 1,474,372 |
General Electric Capital Corp., 4.375%, 9/16/20(1) | 1,200,000 | 1,166,605 |
General Electric Co., 5.25%, 12/6/17(1) | 2,970,000 | 3,233,988 |
| | | 10,925,148 |
INSURANCE(2) |
Prudential Financial, Inc., 2.75%, 1/14/13(1) | 1,300,000 | 1,325,228 |
| INTERNET SOFTWARE & SERVICES — 0.1% |
eBay, Inc., 3.25%, 10/15/20(1) | $ 4,390,000 | $ 4,017,688 |
| MEDIA — 0.6% |
Comcast Corp., 5.90%, 3/15/16(1) | 1,880,000 | 2,090,851 |
Comcast Corp., 5.15%, 3/1/20(1) | 3,970,000 | 4,135,267 |
DirecTV Holdings LLC/DirecTV Financing Co., Inc., 3.55%, 3/15/15(1) | 3,300,000 | 3,371,323 |
NBCUniversal Media, LLC, 5.15%, 4/30/20(1)(3) | 2,000,000 | 2,062,042 |
NBCUniversal Media, LLC, 4.375%, 4/1/21(3) | 3,600,000 | 3,447,976 |
News America, Inc., 6.90%, 8/15/39(1) | 3,630,000 | 3,954,043 |
Time Warner Cable, Inc., 8.25%, 2/14/14(1) | 1,210,000 | 1,406,620 |
Time Warner, Inc., 4.875%, 3/15/20(1) | 3,270,000 | 3,336,450 |
| | | 23,804,572 |
| METALS & MINING — 0.1% |
Anglo American Capital plc, 4.45%, 9/27/20(1)(3) | 630,000 | 630,718 |
Newmont Mining Corp., 6.25%, 10/1/39(1) | 1,980,000 | 2,106,312 |
| | | 2,737,030 |
| MULTI-UTILITIES — 0.3% |
Dominion Resources, Inc., 6.40%, 6/15/18(1) | 4,250,000 | 4,854,818 |
Pacific Gas & Electric Co., 6.25%, 12/1/13(1) | 1,820,000 | 2,010,698 |
Pacific Gas & Electric Co., 5.80%, 3/1/37(1) | 1,367,000 | 1,385,491 |
PG&E Corp., 5.75%, 4/1/14(1) | 1,380,000 | 1,507,639 |
Sempra Energy, 6.50%, 6/1/16(1) | 1,250,000 | 1,426,370 |
| | | 11,185,016 |
| OIL, GAS & CONSUMABLE FUELS — 0.7% |
| Chevron Corp., 3.95%, 3/3/14 | 2,440,000 | 2,608,955 |
ConocoPhillips, 4.75%, 2/1/14(1) | 5,990,000 | 6,500,558 |
Enterprise Products Operating LLC, 3.70%, 6/1/15(1) | 2,500,000 | 2,574,235 |
Enterprise Products Operating LLC, 5.20%, 9/1/20(1) | 2,000,000 | 2,063,710 |
Kinder Morgan Energy Partners LP, 5.30%, 9/15/20(1) | 3,930,000 | 4,079,206 |
Shell International Finance BV, 4.30%, 9/22/19(1) | 3,240,000 | 3,338,515 |
Talisman Energy, Inc., 7.75%, 6/1/19(1) | 1,700,000 | 2,075,488 |
Williams Partners LP, 5.25%, 3/15/20(1) | 1,330,000 | 1,388,309 |
Williams Partners LP, 4.125%, 11/15/20(1) | 1,690,000 | 1,609,808 |
| | | 26,238,784 |
PAPER & FOREST PRODUCTS(2) |
International Paper Co., 9.375%, 5/15/19(1) | 840,000 | 1,081,536 |
| PHARMACEUTICALS — 0.1% |
Abbott Laboratories, 5.30%, 5/27/40(1) | 940,000 | 926,887 |
Roche Holdings, Inc., 6.00%, 3/1/19(1)(3) | 2,130,000 | 2,414,939 |
| | | 3,341,826 |
| ROAD & RAIL — 0.1% |
Union Pacific Corp., 7.875%, 1/15/19(1) | 3,310,000 | 4,132,595 |
| SOFTWARE — 0.3% |
Adobe Systems, Inc., 3.25%, 2/1/15(1) | 4,800,000 | 4,902,250 |
Oracle Corp., 5.75%, 4/15/18(1) | 5,000,000 | 5,597,420 |
| | | 10,499,670 |
| SPECIALTY RETAIL — 0.1% |
Lowe’s Cos., Inc., 2.125%, 4/15/16(1) | 3,310,000 | 3,228,286 |
WIRELESS TELECOMMUNICATION SERVICES(2) |
America Movil SAB de CV, 5.00%, 3/30/20(1) | 1,350,000 | 1,397,123 |
TOTAL CORPORATE BONDS(Cost $204,464,758) | 210,312,517 |
Commercial Mortgage-Backed Securities(4) — 3.6% |
Banc of America Commercial Mortgage, Inc., Series 2004-1, Class A4 SEQ, 4.76%, 11/10/39(1) | 7,200,000 | 7,594,651 |
Credit Suisse Mortgage Capital Certificates, Series 2007 TF2A, Class A1, VRN, 0.44%, 4/15/11, resets monthly off the 1-month LIBOR plus 0.18% with no caps(1)(3) | 8,344,902 | 8,157,598 |
GE Capital Commercial Mortgage Corp., Series 2005 C3, Class A5, VRN, 4.98%, 4/1/11(1) | $ 3,900,000 | $ 4,003,319 |
Greenwich Capital Commercial Funding Corp., Series 2005 GG3, Class A4, VRN, 4.80%, 4/1/11(1) | 4,450,000 | 4,693,930 |
Greenwich Capital Commercial Funding Corp., Series 2005-GG3, Class A3 SEQ, 4.57%, 8/10/42(1) | 5,760,000 | 5,813,180 |
GS Mortgage Securities Corp. II, Series 2004 GG2, Class A4 SEQ, 4.96%, 8/10/38(1) | 11,384,000 | 11,508,330 |
GS Mortgage Securities Corp. II, Series 2004 GG2, Class A6 SEQ, VRN, 5.40%, 4/1/11(1) | 11,875,000 | 12,718,409 |
GS Mortgage Securities Corp. II, Series 2005 GG4, Class A4 SEQ, 4.76%, 7/10/39(1) | 8,750,000 | 9,125,630 |
GS Mortgage Securities Corp. II, Series 2005 GG4, Class A4A SEQ, 4.75%, 7/10/39(1) | 13,475,000 | 14,175,831 |
LB-UBS Commercial Mortgage Trust, Series 2004 C1, Class A4 SEQ, 4.57%, 1/15/31(1) | 4,500,000 | 4,722,254 |
LB-UBS Commercial Mortgage Trust, Series 2004 C4, Class A4, VRN, 5.39%, 4/11/11(1) | 8,650,000 | 9,266,681 |
LB-UBS Commercial Mortgage Trust, Series 2005 C5, Class A4 SEQ, 4.95%, 9/15/30(1) | 3,000,000 | 3,202,083 |
LB-UBS Commercial Mortgage Trust, Series 2005 C5, Class AM, VRN, 5.02%, 4/11/11(1) | 7,500,000 | 7,708,204 |
LB-UBS Commercial Mortgage Trust, Series 2005 C7, Class A4 SEQ, VRN, 5.20%, 4/11/11(1) | 10,000,000 | 10,727,404 |
Lehman Brothers Floating Rate Commercial Mortgage Trust, Series 2007 LLFA, Class A1, VRN, 0.56%, 4/15/11, resets monthly off the 1-month LIBOR plus 0.30% with no caps(1)(3) | 8,892,721 | 8,621,665 |
Wachovia Bank Commercial Mortgage Trust, Series 2003 C3, Class A2 SEQ, 4.87%, 2/15/35(1) | 6,600,000 | 6,894,007 |
Wachovia Bank Commercial Mortgage Trust, Series 2005 C20, Class A6A, VRN, 5.11%, 4/1/11(1) | 11,675,000 | 12,094,981 |
TOTAL COMMERCIAL MORTGAGE-BACKED SECURITIES (Cost $141,209,528) | 141,028,157 |
Collateralized Mortgage Obligations(4) — 2.7% |
| PRIVATE SPONSOR COLLATERALIZED MORTGAGE OBLIGATIONS — 2.5% |
| ABN Amro Mortgage Corp., Series 2003-4, Class A4, 5.50%, 3/25/33 | 7,866,071 | 8,165,556 |
| ABN Amro Mortgage Corp., Series 2003-6, Class 1A4, 5.50%, 5/25/33 | 7,644,764 | 7,935,132 |
Banc of America Mortgage Securities, Inc., Series 2004-7, Class 7A1, 5.00%, 8/25/19(1) | 5,256,351 | 5,301,566 |
Banc of America Mortgage Securities, Inc., Series 2004-8, Class 5A1, 6.50%, 5/25/32(1) | 5,574,114 | 5,726,558 |
Cendant Mortgage Corp., Series 2003-6, Class A3, 5.25%, 7/25/33(1) | 7,500,000 | 7,755,836 |
| Countrywide Home Loan Mortgage Pass-Through Trust, Series 2004-5, Class 2A4, 5.50%, 5/25/34 | 7,218,215 | 7,618,295 |
MASTR Asset Securitization Trust, Series 2003-10, Class 3A1, 5.50%, 11/25/33(1) | 9,329,838 | 9,860,160 |
| Sequoia Mortgage Trust, Series 2011-1, Class A1, VRN, 4.125%, 4/1/11 | 5,749,324 | 5,767,840 |
WaMu Mortgage Pass-Through Certificates, Series 2003 S11, Class 3A5, 5.95%, 11/25/33(1) | 7,165,143 | 7,630,634 |
Wells Fargo Mortgage-Backed Securities Trust, Series 2003-11, Class 1A10 SEQ, 4.75%, 10/25/18(1) | 9,750,000 | 10,002,657 |
Wells Fargo Mortgage-Backed Securities Trust, Series 2003-17, Class 1A14, 5.25%, 1/25/34(1) | 7,487,142 | 7,774,027 |
Wells Fargo Mortgage-Backed Securities Trust, Series 2004-1, Class A10, 5.50%, 2/25/34(1) | $ 7,553,360 | $ 7,981,111 |
| Wells Fargo Mortgage-Backed Securities Trust, Series 2007-3, Class 3A1, 5.50%, 4/25/22 | 6,596,498 | 6,880,035 |
| | | 98,399,407 |
| U.S. GOVERNMENT AGENCY COLLATERALIZED MORTGAGE OBLIGATIONS — 0.2% |
| FHLMC, Series 3794, Class LB SEQ, 3.50%, 1/15/26 | 7,665,877 | 7,140,120 |
TOTAL COLLATERALIZED MORTGAGE OBLIGATIONS (Cost $105,812,115) | 105,539,527 |
| Municipal Securities — 1.0% |
Bay Area Toll Auth. Toll Bridge Rev., Series 2010 S1, (Building Bonds), 6.92%, 4/1/40(1) | 1,710,000 | 1,746,355 |
California Educational Facilities Auth. Rev., Series 2009 A, (University of Southern California), 5.00%, 10/1/39(1) | 5,265,000 | 5,151,487 |
California Educational Facilities Auth. Rev., Series 2009 B, (University of Southern California), 5.00%, 10/1/38(1) | 2,660,000 | 2,607,412 |
Los Angeles Department of Water & Power Rev., (Building Bonds), 5.72%, 7/1/39(1) | 295,000 | 275,300 |
Metropolitan Atlanta Rapid Transit Auth. Sales Tax Rev., Series 2009 A, 5.00%, 7/1/39(1) | 6,705,000 | 6,511,896 |
New York Municipal Water Finance Auth. Water & Sewer Rev., Series 2011 GG, 5.00%, 6/15/43(1) | 7,540,000 | 7,253,706 |
Port Seattle Rev., Series 2010 B, (Intermediate Lien), 5.00%, 6/1/40(1) | 3,865,000 | 3,590,817 |
Salt River Agricultural Improvement & Power District Rev., Series 2008 A, (Electric System Distribution), 5.00%, 1/1/38(1) | 3,540,000 | 3,480,740 |
Salt River Agricultural Improvement & Power District Rev., Series 2009 A, (Electric System Distribution), 5.00%, 1/1/39(1) | 1,595,000 | 1,565,524 |
Texas GO, (Building Bonds), 5.52%, 4/1/39(1) | 1,750,000 | 1,789,602 |
Triborough Bridge & Tunnel Auth. Rev., Series 2008 C, 5.00%, 11/15/38(1) | 3,990,000 | 3,876,325 |
TOTAL MUNICIPAL SECURITIES (Cost $37,577,890) | 37,849,164 |
| Sovereign Governments & Agencies — 0.1% |
| ITALY — 0.1% |
Republic of Italy, 3.125%, 1/26/15(1) (Cost $3,352,053) | 3,280,000 | 3,292,448 |
| Temporary Cash Investments — 0.3% |
Repurchase Agreement, Bank of America Securities, LLC, (collateralized by various U.S. Treasury obligations, 0.375%, 10/31/12, valued at $10,327,914), in a joint trading account at 0.06%, dated 3/31/11, due 4/1/11 (Delivery value $10,115,017) (Cost $10,115,000) | 10,115,000 |
TOTAL INVESTMENT SECURITIES — 99.9% (Cost $3,635,547,209) | 3,866,378,925 |
| OTHER ASSETS AND LIABILITIES — 0.1% | 4,201,208 |
| TOTAL NET ASSETS — 100.0% | $3,870,580,133 |
| Futures Contracts |
| Contracts Purchased | Expiration Date | Underlying Face Amount at Value | Unrealized Gain (Loss) |
| 1,067 | U.S. Long Bond | June 2011 | $128,240,063 | $197,662 |
| Contracts Sold | Expiration Date | Underlying Face Amount at Value | Unrealized Gain (Loss) |
| 3,371 | U.S. Treasury 2-Year Notes | June 2011 | $735,299,375 | $(271,197) |
| Swap Agreements | |
| Notional Amount | | Description of Agreement | Premiums Paid (Received) | Value | |
| TOTAL RETURN | | | | | |
| $44,200,000 | | Pay a fixed rate equal to 1.13 multiplied by the notional amount and receive the return of the U.S. CPI Urban Consumers NSA Index upon the termination date with Barclays Bank plc. Expires January 2012. | — | $ (448,097) | |
| 32,000,000 | | Pay a fixed rate equal to 0.12 multiplied by the notional amount and receive the return of the U.S. CPI Urban Consumers NSA Index upon the termination date with Bank of America N.A. Expires January 2015. | — | (67,600) | |
| 1,075,000 | | Pay a fixed rate equal to 0.12 multiplied by the notional amount and receive the return of the U.S. CPI Urban Consumers NSA Index upon the termination date with Bank of America N.A. Expires January 2016. | — | 15,089 | |
| 38,900,000 | | Pay a fixed rate equal to 0.12 multiplied by the notional amount and receive the return of the U.S. CPI Urban Consumers NSA Index upon the termination date with Barclays Bank plc. Expires January 2016. | — | 506,267 | |
| 24,000,000 | | Pay a fixed rate equal to 1.31 multiplied by the notional amount and receive the return of the U.S. CPI Urban Consumers NSA Index upon the termination date with Barclays Bank plc. Expires April 2017. | — | (970,463) | |
| 4,000,000 | | Pay a fixed rate equal to 0.21 multiplied by the notional amount and receive the return of the U.S. CPI Urban Consumers NSA Index upon the termination date with Bank of America N.A. Expires April 2018. | — | 15,953 | |
| 8,700,000 | | Pay a fixed rate equal to 0.25 multiplied by the notional amount and receive the return of the U.S. CPI Urban Consumers NSA Index upon the termination date with Bank of America N.A. Expires March 2019. | — | 18,846 | |
| 32,000,000 | | Pay a fixed rate equal to 0.30 multiplied by the notional amount and receive the return of the U.S. CPI Urban Consumers NSA Index upon the termination date with Bank of America N.A. Expires December 2019. | — | (276,864) | |
| 50,000,000 | | Pay a fixed rate equal to 0.30 multiplied by the notional amount and receive the return of the U.S. CPI Urban Consumers NSA Index upon the termination date with Bank of America N.A. Expires March 2020. | — | (155,500) | |
| 24,000,000 | | Pay a fixed rate equal to 0.30 multiplied by the notional amount and receive the return of the U.S. CPI Urban Consumers NSA Index upon the termination date with Bank of America N.A. Expires March 2020. | — | (107,869) | |
| 4,500,000 | | Pay a fixed rate equal to 0.37 multiplied by the notional amount and receive the return of the U.S. CPI Urban Consumers NSA Index upon the termination date with Bank of America N.A. Expires April 2022. | — | 5,754 | |
| 58,300,000 | | Pay a fixed rate equal to 1.77 multiplied by the notional amount and receive the return of the U.S. CPI Urban Consumers NSA Index upon the termination date with Barclays Bank plc. Expires December 2027. | — | (1,839,260) | |
| 7,600,000 | | Pay a fixed rate equal to 0.81 multiplied by the notional amount and receive the return of the U.S. CPI Urban Consumers NSA Index upon the termination date with Bank of America N.A. Expires February 2030. | — | (198,636) | |
| 12,520,000 | | Pay a fixed rate equal to 1.44 multiplied by the notional amount and receive the return of the U.S. CPI Urban Consumers NSA Index upon the termination date with Barclays Bank plc. Expires January 2041. | — | (144,319) | |
| | | | — | $(3,646,699) | |
Notes to Schedule of Investments
CPI = Consumer Price Index
FHLMC = Federal Home Loan Mortgage Corporation
GO = General Obligation
LB-UBS = Lehman Brothers, Inc. — UBS AG
LIBOR = London Interbank Offered Rate
MASTR = Mortgage Asset Securitization Transactions, Inc.
NSA = Not Seasonally Adjusted
resets = The frequency with which a security’s coupon changes, based on current market conditions or an underlying index. The more frequently a security resets, the less risk the investor is taking that the coupon will vary significantly from current market rates.
SEQ = Sequential Payer
VRN = Variable Rate Note. Interest reset date is indicated. Rate shown is effective at the period end.
| (1) | Security, or a portion thereof, has been segregated for futures contracts and/or swap agreements. At the period end, the aggregate value of securities pledged was $867,187,000. |
| (2) | Category is less than 0.05% of total net assets. |
| (3) | Security was purchased under Rule 144A of the Securities Act of 1933 or is a private placement and, unless registered under the Act or exempted from registration, may only be sold to qualified institutional investors. The aggregate value of these securities at the period end was $25,334,938, which represented 0.7% of total net assets. |
| (4) | Final maturity date indicated, unless otherwise noted. |
See Notes to Financial Statements.
Statement of Assets and Liabilities |
| MARCH 31, 2011 | |
| Assets | |
| Investment securities, at value (cost of $3,635,547,209) | | | $3,866,378,925 | |
| Receivable for investments sold | | | 4,084,689 | |
| Receivable for capital shares sold | | | 6,638,034 | |
| Swap agreements, at value | | | 561,909 | |
| Interest receivable | | | 20,191,666 | |
| | | | 3,897,855,223 | |
| | | | | |
| Liabilities | | | | |
| Payable for investments purchased | | | 11,384,900 | |
| Payable for capital shares redeemed | | | 9,866,247 | |
| Payable for variation margin on futures contracts | | | 210,687 | |
| Accrued management fees | | | 1,452,846 | |
| Distribution and service fees payable | | | 151,802 | |
| Swap agreements, at value | | | 4,208,608 | |
| | | | 27,275,090 | |
| | | | | |
| Net Assets | | | $3,870,580,133 | |
| | | | | |
| Net Assets Consist of: | | | | |
| Capital paid in | | | $3,595,414,402 | |
| Undistributed net investment income | | | 63,432,280 | |
| Accumulated net realized loss | | | (15,378,031 | ) |
| Net unrealized appreciation | | | 227,111,482 | |
| | | | $3,870,580,133 | |
| | | | | | | |
| | | Net assets | | Shares outstanding | | Net asset value per share |
| Investor Class | | $2,614,427,263 | | | 217,656,821 | | | $12.01 | |
| Institutional Class | | $559,589,070 | | | 46,583,621 | | | $12.01 | |
| A Class | | $691,361,539 | | | 57,739,683 | | | $11.97 | * |
| C Class | | $5,159,262 | | | 429,906 | | | $12.00 | |
| R Class | | $42,999 | | | 3,581 | | | $12.01 | |
* Maximum offering price $12.53 (net asset value divided by 0.955)
See Notes to Financial Statements.
| YEAR ENDED MARCH 31, 2011 | |
| Investment Income (Loss) | |
| Income: | | | |
| Interest | | | $114,736,000 | |
| | | | | |
| Expenses: | | | | |
| Management fees | | | 16,825,997 | |
| Distribution and service fees: | | | | |
| A Class | | | 1,819,450 | |
| C Class | | | 24,994 | |
| R Class | | | 147 | |
| Trustees’ fees and expenses | | | 135,200 | |
| Other expenses | | | 171,668 | |
| | | | 18,977,456 | |
| | | | | |
| Net investment income (loss) | | | 95,758,544 | |
| | | | | |
| Realized and Unrealized Gain (Loss) | | | | |
| Net realized gain (loss) on: | | | | |
| Investment transactions | | | 29,728,403 | |
| Futures contract transactions | | | (6,599,327 | ) |
| Swap agreement transactions | | | (350,667 | ) |
| | | | 22,778,409 | |
| | | | | |
| Change in net unrealized appreciation (depreciation) on: | | | | |
| Investments | | | 127,146,020 | |
| Futures contracts | | | 15,139 | |
| Swap agreements | | | 1,832,864 | |
| | | | 128,994,023 | |
| | | | | |
| Net realized and unrealized gain (loss) | | | 151,772,432 | |
| | | | | |
| Net Increase (Decrease) in Net Assets Resulting from Operations | | | $247,530,976 | |
See Notes to Financial Statements.
Statement of Changes in Net Assets |
| YEARS ENDED MARCH 31, 2011 AND MARCH 31, 2010 | |
| Increase (Decrease) in Net Assets | | 2011 | | | 2010 | |
| Operations | |
| Net investment income (loss) | | | $95,758,544 | | | | $94,340,141 | |
| Net realized gain (loss) | | | 22,778,409 | | | | 13,083,241 | |
| Change in net unrealized appreciation (depreciation) | | | 128,994,023 | | | | 47,296,676 | |
| Net increase (decrease) in net assets resulting from operations | | | 247,530,976 | | | | 154,720,058 | |
| | | | | | | | | |
| Distributions to Shareholders | | | | | | | | |
| From net investment income: | | | | | | | | |
| Investor Class | | | (55,336,814 | ) | | | (31,576,120 | ) |
| Institutional Class | | | (10,906,755 | ) | | | (5,848,258 | ) |
| A Class | | | (14,120,189 | ) | | | (8,674,827 | ) |
| C Class | | | (19,340 | ) | | | — | |
| R Class | | | (464 | ) | | | — | |
| From net realized gains: | | | | | | | | |
| Investor Class | | | (14,802,400 | ) | | | — | |
| Institutional Class | | | (2,381,569 | ) | | | — | |
| A Class | | | (4,046,425 | ) | | | — | |
| C Class | | | (18,766 | ) | | | — | |
| R Class | | | (178 | ) | | | — | |
| Decrease in net assets from distributions | | | (101,632,900 | ) | | | (46,099,205 | ) |
| | | | | | | | | |
| Capital Share Transactions | | | | | | | | |
| Net increase (decrease) in net assets from capital share transactions | | | 340,127,434 | | | | 1,377,673,215 | |
| | | | | | | | | |
| Net increase (decrease) in net assets | | | 486,025,510 | | | | 1,486,294,068 | |
| | | | | | | | | |
| Net Assets | | | | | | | | |
| Beginning of period | | | 3,384,554,623 | | | | 1,898,260,555 | |
| End of period | | | $3,870,580,133 | | | | $3,384,554,623 | |
| | | | | | | | | |
| Undistributed net investment income | | | $63,432,280 | | | | $47,642,976 | |
See Notes to Financial Statements.
Notes to Financial Statements |
MARCH 31, 2011
1. Organization
American Century Government Income Trust (the trust) is registered under the Investment Company Act of 1940, as amended (the 1940 Act), as an open-end management investment company and is organized as a Massachusetts business trust. Inflation-Adjusted Bond Fund (the fund) is one fund in a series issued by the trust. The fund is diversified as defined under the 1940 Act. The fund’s investment objectives are to seek total return and inflation protection consistent with investment in inflation-indexed securities primarily issued by the U.S. Treasury, by other U.S. government agencies and instrumentalities, and by other, non-U.S. government entities such as corporations.
The fund is authorized to issue the Investor Class, the Institutional Class, the A Class (formerly Advisor Class), the C Class and the R Class. The A Class may incur an initial sales charge. The A Class and C Class may be subject to a contingent deferred sales charge. The share classes differ principally in their respective sales charges and distribution and shareholder servicing expenses and arrangements. The Institutional Class is made available to institutional shareholders or through financial intermediaries whose clients do not require the same level of shareholder and administrative services as shareholders of other classes. As a result, the Institutional Class is charged a lower unified management fee. Sale of the C Class and R Class commenced on March 1, 2010.
2. Significant Accounting Policies
The following is a summary of significant accounting policies consistently followed by the fund in preparation of its financial statements. The financial statements are prepared in conformity with accounting principles generally accepted in the United States of America, which may require management to make certain estimates and assumptions at the date of the financial statements. Actual results could differ from these estimates.
Investment Valuations — The fund determines the fair value of its investments and computes its net asset value per share as of the close of regular trading (usually 4 p.m. Eastern time) on the New York Stock Exchange (NYSE) on each day the NYSE is open.
Debt securities maturing in greater than 60 days at the time of purchase are valued at the evaluated mean as provided by independent pricing services or at the mean of the most recent bid and asked prices as provided by investment dealers. Debt securities maturing within 60 days at the time of purchase may be valued at cost, plus or minus any amortized discount or premium or at the evaluated mean as provided by an independent pricing service. Evaluated mean prices are commonly derived through utilization of market models, which may consider, among other factors, trade data, quotations from dealers and active market makers, relevant yield curve and spread data, related sector levels, creditworthiness, and other relevant market information on the same or comparable securities.
Investments in open-end management investment companies are valued at the reported net asset value per share. Repurchase agreements are valued at cost. Exchange-traded futures contracts are valued at the settlement price as provided by the appropriate clearing corporation. Swap agreements are valued at an evaluated price as provided by independent pricing services or investment dealers.
If the fund determines that the market price for a portfolio security is not readily available or the valuation methods mentioned above do not reflect a security’s fair value, such security is valued as determined in good faith by the Board of Trustees or its designee, in accordance with procedures adopted by the Board of Trustees. Circumstances that may cause the fund to use these procedures to value a security include, but are not limited to: a security has been declared in default; trading in a security has been halted during the trading day; there is a foreign market holiday and no trading occurred; or an event occurred between the close of a foreign exchange and the NYSE that may affect the value of a security.
Security Transactions — Security transactions are accounted for as of the trade date. Net realized gains and losses are determined on the identified cost basis, which is also used for federal income tax purposes.
Investment Income — Interest income is recorded on the accrual basis and includes paydown gain (loss) and accretion of discounts and amortization of premiums. Inflation adjustments related to inflation-linked debt securities are reflected as interest income.
When-Issued and Forward Commitments — The fund may engage in securities transactions on a when-issued or forward commitment basis. In these transactions, the securities’ prices and yields are fixed on the date of the commitment. In a when-issued transaction, the payment and delivery are scheduled for a future date and during this period, securities are subject to market fluctuations. In a forward commitment transaction, the fund may sell a security and at the same time make a commitment to purchase the same security at a future date at a specified price. Conversely, the fund may purchase a security and at the same time make a commitment to sell the same security at a future date at a specified price. These types of transactions are executed simultaneously in what are known as “roll” transactions. The fund will segregate cash, cash equivalents or other appropriate liquid securities on its records in amounts sufficient to meet the purchase price. The fund accounts for “roll” transactions as purchases and sales.
Repurchase Agreements — The fund may enter into repurchase agreements with institutions that American Century Investment Management, Inc. (ACIM) (the investment advisor) has determined are creditworthy pursuant to criteria adopted by the Board of Trustees. The fund requires that the collateral, represented by securities, received in a repurchase transaction be transferred to the custodian in a manner sufficient to enable the fund to obtain those securities in the event of a default under the repurchase agreement. ACIM monitors, on a daily basis, the securities transferred to ensure the value, including accrued interest, of the securities under each repurchase agreement is equal to or greater than amounts owed to the fund under each repurchase agreement.
Joint Trading Account — Pursuant to an Exemptive Order issued by the Securities and Exchange Commission, the fund, along with certain other funds in the American Century Investments family of funds, may transfer uninvested cash balances into a joint trading account. These balances are invested in one or more repurchase agreements that are collateralized by U.S. Treasury or Agency obligations.
Income Tax Status — It is the fund’s policy to distribute substantially all net investment income and net realized gains to shareholders and to otherwise qualify as a regulated investment company under provisions of the Internal Revenue Code. The fund is no longer subject to examination by tax authorities for years prior to 2008. At this time, management believes there are no uncertain tax positions which, based on their technical merit, would not be sustained upon examination and for which it is reasonably possible that the total amounts of unrecognized tax benefits will significantly change in the next twelve months. Accordingly, no provision has been made for federal or state income taxes.
Multiple Class — All shares of the fund represent an equal pro rata interest in the net assets of the class to which such shares belong, and have identical voting, dividend, liquidation and other rights and the same terms and conditions, except for class specific expenses and exclusive rights to vote on matters affecting only individual classes. Income, non-class specific expenses, and realized and unrealized capital gains and losses of the fund are allocated to each class of shares based on their relative net assets.
Distributions to Shareholders — Distributions from net investment income, if any, are generally declared and paid quarterly. Distributions from net realized gains, if any, are generally declared and paid annually.
Indemnifications — Under the trust’s organizational documents, its officers and trustees are indemnified against certain liabilities arising out of the performance of their duties to the fund. In addition, in the normal course of business, the fund enters into contracts that provide general indemnifications. The maximum exposure under these arrangements is unknown as this would involve future claims that may be made against a fund. The risk of material loss from such claims is considered by management to be remote.
3. Fees and Transactions with Related Parties
Management Fees — The trust has entered into a management agreement with ACIM, under which ACIM provides the fund with investment advisory and management services in exchange for a single, unified management fee (the fee) per class. The agreement provides that all expenses of managing and operating the fund, except distribution and service fees, brokerage expenses, taxes, interest, fees and expenses of the independent trustees (including legal counsel fees), and extraordinary expenses, will be paid by ACIM. The fee is computed and accrued daily based on each class’s daily net assets and paid monthly in arrears. The fee consists of (1) an Investment Category Fee based on the daily net assets of the fund and certain other accounts managed by the investment advisor that are in the same broad investment category as the fund and (2) a Complex Fee based on the assets of all the funds in the American Century Investments family of funds. The rates for the Investment Category Fee range from 0.1625% to 0.2800%. The rates for the Complex Fee range from 0.2500% to 0.3100% for the Investor Class, A Class, C Class and R Class. The Institutional Class is 0.2000% less at each point within the Complex Fee range. The effective annual management fee for each class for the year ended March 31, 2011 was 0.47% for the Investor Class, A Class, C Class and R Class and 0.27% for the Institutional Class.
Distribution and Service Fees — The Board of Trustees has adopted a separate Master Distribution and Individual Shareholder Services Plan for each of the A Class, C Class and R Class (collectively the plans), pursuant to Rule 12b-1 of the 1940 Act. The plans provide that the A Class will pay American Century Investment Services, Inc. (ACIS) an annual distribution and service fee of 0.25%. The plans provide that the C Class will pay ACIS an annual distribution and service fee of 1.00%, of which 0.25% is paid for individual shareholder services and 0.75% is paid for distribution services. The plans provide that the R Class will pay ACIS an annual distribution and service fee of 0.50%. The fees are computed and accrued daily based on each class’s daily net assets and paid monthly in arrears. The fees are used to pay financial intermediaries for distribution and individual shareholder services. Fees incurred under the plans during the year ended March 31, 2011 are detailed in the Statement of Operations.
Related Parties — Certain officers and trustees of the trust are also officers and/or directors of American Century Companies, Inc. (ACC), the parent of the trust’s investment advisor, ACIM, the distributor of the trust, ACIS, and the trust’s transfer agent, American Century Services, LLC. Various funds in a series issued by American Century Asset Allocation Portfolios, Inc. (ACAAP) own, in aggregate, 9% of the shares of the fund. ACAAP does not invest in the fund for the purpose of exercising management or control.
The fund is eligible to invest in a money market fund for temporary purposes, which is managed by J.P. Morgan Investment Management, Inc. (JPMIM). The fund has a securities lending agreement with JPMorgan Chase Bank (JPMCB) and a mutual funds services agreement with J.P. Morgan Investor Services Co. (JPMIS). JPMCB is a custodian of the fund. JPMIM, JPMIS and JPMCB are wholly owned subsidiaries of JPMorgan Chase & Co. (JPM). JPM is an equity investor in ACC.
4. Investment Transactions
Purchases of investment securities, excluding short-term investments, for the year ended March 31, 2011, totaled $1,537,742,308, of which $1,241,622,820 represented U.S. Treasury and Government Agency obligations.
Sales of investment securities, excluding short-term investments, for the year ended March 31, 2011, totaled $1,224,650,256, of which $1,096,019,596 represented U.S. Treasury and Government Agency obligations.
5. Capital Share Transactions
Transactions in shares of the fund were as follows (unlimited number of shares authorized):
| | | | | | | |
| | | Year ended March 31, 2011 | | | Year ended March 31, 2010(1) | |
| | | Shares | | | Amount | | | Shares | | | Amount | |
| Investor Class | | | | | | | | | | | | |
| Sold | | | 102,552,177 | | | | $1,220,514,290 | | | | 135,001,472 | | | | $1,523,997,066 | |
| Issued in reinvestment of distributions | | | 4,754,110 | | | | 55,508,337 | | | | 2,137,805 | | | | 24,563,421 | |
| Redeemed | | | (86,351,187 | ) | | | (1,025,847,233 | ) | | | (47,757,972 | ) | | | (541,816,610 | ) |
| | | | 20,955,100 | | | | 250,175,394 | | | | 89,381,305 | | | | 1,006,743,877 | |
| Institutional Class | | | | | | | | | | | | | | | | |
| Sold | | | 26,056,470 | | | | 309,436,624 | | | | 20,972,581 | | | | 238,882,151 | |
| Issued in reinvestment of distributions | | | 1,118,020 | | | | 13,053,050 | | | | 312,289 | | | | 3,588,206 | |
| Redeemed | | | (15,977,552 | ) | | | (188,928,489 | ) | | | (4,897,162 | ) | | | (55,638,455 | ) |
| | | | 11,196,938 | | | | 133,561,185 | | | | 16,387,708 | | | | 186,831,902 | |
| A Class | | | | | | | | | | | | | | | | |
| Sold | | | 18,518,380 | | | | 219,297,851 | | | | 33,094,921 | | | | 372,937,288 | |
| Issued in reinvestment of distributions | | | 1,457,180 | | | | 16,957,986 | | | | 718,837 | | | | 8,237,868 | |
| Redeemed | | | (24,035,597 | ) | | | (284,856,814 | ) | | | (17,433,264 | ) | | | (197,241,935 | ) |
| | | | (4,060,037 | ) | | | (48,600,977 | ) | | | 16,380,494 | | | | 183,933,221 | |
| C Class | | | | | | | | | | | | | | | | |
| Sold | | | 454,284 | | | | 5,408,287 | | | | 12,087 | | | | 139,215 | |
| Issued in reinvestment of distributions | | | 2,702 | | | | 31,537 | | | | — | | | | — | |
| Redeemed | | | (39,167 | ) | | | (464,882 | ) | | | — | | | | — | |
| | | | 417,819 | | | | 4,974,942 | | | | 12,087 | | | | 139,215 | |
| R Class | | | | | | | | | | | | | | | | |
| Sold | | | 1,354 | | | | 16,248 | | | | 2,172 | | | | 25,000 | |
| Issued in reinvestment of distributions | | | 55 | | | | 642 | | | | — | | | | — | |
| | | | 1,409 | | | | 16,890 | | | | 2,172 | | | | 25,000 | |
| Net increase (decrease) | | | 28,511,229 | | | | $340,127,434 | | | | 122,163,766 | | | | $1,377,673,215 | |
| (1) | March 1, 2010 (commencement of sale) through March 31, 2010 for the C Class and R Class. |
6. Fair Value Measurements
The fund’s securities valuation process is based on several considerations and may use multiple inputs to determine the fair value of the positions held by the fund. In conformity with accounting principles generally accepted in the United States of America, the inputs used to determine a valuation are classified into three broad levels as follows:
| • | Level 1 valuation inputs consist of unadjusted quoted prices in an active market for identical securities; |
| • | Level 2 valuation inputs consist of direct or indirect observable market data (including quoted prices for similar securities, evaluations of subsequent market events, interest rates, prepayment speeds, credit risk, etc.); or |
| • | Level 3 valuation inputs consist of unobservable data (including a fund’s own assumptions). |
The level classification is based on the lowest level input that is significant to the fair valuation measurement. The valuation inputs are not necessarily an indication of the risks associated with investing in these securities or other financial instruments.
The following is a summary of the level classifications as of period end. The Schedule of Investments provides additional information on the fund’s portfolio holdings.
| | | | | | | | | | |
| | | Level 1 | | | Level 2 | | | Level 3 | |
| Investment Securities | | | | | | | | | |
| U.S. Treasury Securities | | | — | | | | $3,358,242,112 | | | | — | |
| Corporate Bonds | | | — | | | | 210,312,517 | | | | — | |
| Commercial Mortgage-Backed Securities | | | — | | | | 141,028,157 | | | | — | |
| Collateralized Mortgage Obligations | | | — | | | | 105,539,527 | | | | — | |
| Municipal Securities | | | — | | | | 37,849,164 | | | | — | |
| Sovereign Governments & Agencies | | | — | | | | 3,292,448 | | | | — | |
| Temporary Cash Investments | | | — | | | | 10,115,000 | | | | — | |
| Total Value of Investment Securities | | | — | | | | $3,866,378,925 | | | | — | |
| | | | | | | | | | | | | |
| Other Financial Instruments | | | | | | | | | | | | |
| Futures Contracts | | | $(73,535 | ) | | | — | | | | — | |
| Swap Agreements | | | — | | | | $(3,646,699 | ) | | | — | |
| Total Unrealized Gain (Loss) on Other Financial Instruments | | | $(73,535 | ) | | | $(3,646,699 | ) | | | — | |
7. Derivative Instruments
Interest Rate Risk — The fund is subject to interest rate risk in the normal course of pursuing its investment objectives. The value of bonds generally declines as interest rates rise. A fund may enter into futures contracts based on a bond index or a specific underlying security. A fund may purchase futures contracts to gain exposure to increases in market value or sell futures contracts to protect against a decline in market value. Upon entering into a futures contract, a fund will segregate cash, cash equivalents or other appropriate liquid securities on its records in amounts sufficient to meet requirements. Subsequent payments (variation margin) are made or received daily, in cash, by a fund. The variation margin is equal to the daily change in the contract value and is recorded as unrealized gains and losses. A fund recognizes a realized gain or loss when the futures contract is closed or expires. Net realized and unrealized gains or losses occurring during the holding period of futures contracts are a component of net realized gain (loss) on futures contract transactions and change in net unrealized appreciation (depreciation) on futures contracts, respectively. One of the risks of entering into futures contracts is the possibility that the change in value of the contract may not correlate with the changes in value of the underlying securities. The interest rate risk derivative instruments held at period end as disclosed on the Schedule of Investments are indicative of the fund’s typical volume during the period.
Other Contracts — The fund may enter into total return swap agreements in order to attempt to obtain or preserve a particular return or spread at a lower cost than obtaining a return or spread through purchases and/or sales of instruments in other markets or gain exposure to certain markets in the most economical way possible. A fund will segregate cash, cash equivalents or other appropriate liquid securities on its records in amounts sufficient to meet requirements. Changes in value, including the periodic amounts of interest to be paid or received on swap agreements, are recorded as unrealized appreciation (depreciation) on swap agreements. Realized gain or loss is recorded upon receipt or payment of a periodic settlement or termination of swap agreements. Net realized and unrealized gains or losses occurring during the holding period of swap agreements are a component of net realized gain (loss) on swap agreement transactions and change in net unrealized appreciation (depreciation) on swap agreements, respectively. The risks of entering into swap agreements include the possible lack of liquidity, failure of the counterparty to meet its obligations, and that there may be unfavorable changes in the underlying investments or instruments. The other contract derivative instruments held at period end as disclosed on the Schedule of Investments are indicative of the fund’s typical volume during the period.
| Value of Derivative Instruments as of March 31, 2011 | |
| | Asset Derivatives | | | Liability Derivatives | |
| Type of Risk Exposure | Location on Statement of Assets and Liabilities | | Value | | Location on Statement of Assets and Liabilities | | Value |
| Interest Rate Risk | Receivable for variation margin on futures contracts | | | — | | | Payable for variation margin on futures contracts | | | $210,687 | |
| Other Contracts | Swap agreements | | | $561,909 | | | Swap agreements | | | 4,208,608 | |
| | | | | $561,909 | | | | | | $4,419,295 | |
| Effect of Derivative Instruments on the Statement of Operations for the Year Ended March 31, 2011 | |
| | Net Realized Gain (Loss) | | | Change in Net Unrealized Appreciation (Depreciation) | |
| Type of Risk Exposure | Location on Statement of Operations | | Value | | Location on Statement of Operations | | Value |
| Interest Rate Risk | Net realized gain (loss) on futures contract transactions | | | $(6,599,327 | ) | | Change in net unrealized appreciation (depreciation) on futures contracts | | | $15,139 | |
| Other Contracts | Net realized gain (loss) on wap agreement transactions | | | (350,667 | ) | | Change in net unrealized appreciation (depreciation) on swap agreements | | | 1,832,864 | |
| | | | | $(6,949,994 | ) | | | | | $1,848,003 | |
8. Federal Tax Information
The tax character of distributions paid during the years ended March 31, 2011 and March 31, 2010 were as follows:
| | | | | | | |
| | | 2011 | | 2010 |
| Distributions Paid From | | | | | | |
| Ordinary income | | $86,822,755 | | | $46,099,205 | |
| Long-term capital gains | | $14,810,145 | | | — | |
The book-basis character of distributions made during the year from net investment income or net realized gains may differ from their ultimate characterization for federal income tax purposes. These differences reflect the differing character of certain income items and net realized gains and losses for financial statement and tax purposes, and may result in reclassification among certain capital accounts on the financial statements.
As of March 31, 2011, the federal tax cost of investments and the components of distributable earnings on a tax-basis were as follows:
| | | | |
| Federal tax cost of investments | | | $3,641,354,766 | |
| Gross tax appreciation of investments | | | $230,341,812 | |
| Gross tax depreciation of investments | | | (5,317,653 | ) |
| Net tax appreciation (depreciation) of investments | | | $225,024,159 | |
| Net tax appreciation (depreciation) on derivatives | | | $(3,646,699 | ) |
| Other book-to-tax adjustments | | | $(13,257,533 | ) |
| Net tax appreciation (depreciation) | | | $208,119,927 | |
| Undistributed ordinary income | | | $70,654,544 | |
| Accumulated long-term gains | | | $146,827 | |
| Capital loss deferral | | | $(3,755,567 | ) |
The difference between book-basis and tax-basis cost and unrealized appreciation (depreciation) is attributable primarily to the tax deferral of losses on wash sales and the realization for tax purposes of unrealized gains (losses) on futures contracts. Other book-to-tax adjustments are attributable primarily to the tax deferral of losses on straddle positions.
The capital loss deferral represents net capital losses incurred in the five-month period ended March 31, 2011. The fund has elected to treat such losses as having been incurred in the following fiscal year for federal income tax purposes.
On December 22, 2010, the Regulated Investment Company Modernization Act of 2010 (the “Act”) was enacted, which changed various technical rules governing the tax treatment of regulated investment companies. The changes are generally effective for taxable years beginning after the date of enactment. Under the Act, the fund will be permitted to carry forward capital losses incurred in taxable years beginning after the date of enactment for an unlimited period.
| Investor Class | |
| For a Share Outstanding Throughout the Years Ended March 31 | |
| | | 2011 | | | 2010 | | | 2009 | | | 2008 | | | 2007 | |
| Per-Share Data | |
| Net Asset Value, Beginning of Period | | | $11.52 | | | | $11.06 | | | | $11.72 | | | | $10.83 | | | | $10.73 | |
| Income From Investment Operations | | | | | | | | | | | | | | | | | | | | |
| Net Investment Income (Loss) | | | 0.31 | (1) | | | 0.40 | (1) | | | 0.17 | (1) | | | 0.62 | (1) | | | 0.38 | |
| Net Realized and Unrealized Gain (Loss) | | | 0.51 | | | | 0.24 | | | | (0.35 | ) | | | 0.85 | | | | 0.11 | |
| Total From Investment Operations | | | 0.82 | | | | 0.64 | | | | (0.18 | ) | | | 1.47 | | | | 0.49 | |
| Distributions | | | | | | | | | | | | | | | | | | | | |
| From Net Investment Income | | | (0.26 | ) | | | (0.18 | ) | | | (0.40 | ) | | | (0.58 | ) | | | (0.38 | ) |
| From Net Realized Gains | | | (0.07 | ) | | | — | | | | — | | | | — | | | | — | |
| From Tax Return of Capital | | | — | | | | — | | | | (0.08 | ) | | | — | | | | (0.01 | ) |
| Total Distributions | | | (0.33 | ) | | | (0.18 | ) | | | (0.48 | ) | | | (0.58 | ) | | | (0.39 | ) |
| Net Asset Value, End of Period | | | $12.01 | | | | $11.52 | | | | $11.06 | | | | $11.72 | | | | $10.83 | |
| | | | | | | | | | | | | | | | | | | | | |
Total Return(2) | | | 7.18 | % | | | 5.76 | % | | | (1.51 | )% | | | 14.08 | % | | | 4.71 | % |
| | | | | | | | | | | | | | | | | | | | | |
| Ratios/Supplemental Data | |
Ratio of Operating Expenses to Average Net Assets | | | 0.48 | % | | | 0.48 | % | | | 0.49 | % | | | 0.49 | % | | | 0.49 | % |
Ratio of Net Investment Income (Loss) to Average Net Assets | | | 2.58 | % | | | 3.49 | % | | | 1.61 | % | | | 5.66 | % | | | 3.79 | % |
| Portfolio Turnover Rate | | | 33 | % | | | 27 | % | | | 18 | % | | | 33 | % | | | 32 | % |
| Net Assets, End of Period (in thousands) | | | $2,614,427 | | | | $2,266,660 | | | | $1,187,202 | | | | $892,596 | | | | $590,530 | |
| (1) | Computed using average shares outstanding throughout the period. |
| (2) | Total returns are calculated based on the net asset value of the last business day. Total returns for periods less than one year are not annualized. |
See Notes to Financial Statements.
| Institutional Class | |
| For a Share Outstanding Throughout the Years Ended March 31 | |
| | | 2011 | | | 2010 | | | 2009 | | | 2008 | | | 2007 | |
| Per-Share Data | |
| Net Asset Value, Beginning of Period | | | $11.52 | | | | $11.06 | | | | $11.71 | | | | $10.82 | | | | $10.73 | |
| Income From Investment Operations | | | | | | | | | | | | | | | | | | | | |
| Net Investment Income (Loss) | | | 0.34 | (1) | | | 0.41 | (1) | | | 0.16 | (1) | | | 0.64 | (1) | | | 0.42 | |
| Net Realized and Unrealized Gain (Loss) | | | 0.50 | | | | 0.25 | | | | (0.32 | ) | | | 0.85 | | | | 0.09 | |
| Total From Investment Operations | | | 0.84 | | | | 0.66 | | | | (0.16 | ) | | | 1.49 | | | | 0.51 | |
| Distributions | | | | | | | | | | | | | | | | | | | | |
| From Net Investment Income | | | (0.28 | ) | | | (0.20 | ) | | | (0.41 | ) | | | (0.60 | ) | | | (0.42 | ) |
| From Net Realized Gains | | | (0.07 | ) | | | — | | | | — | | | | — | | | | — | |
| From Tax Return of Capital | | | — | | | | — | | | | (0.08 | ) | | | — | | | | — | |
| Total Distributions | | | (0.35 | ) | | | (0.20 | ) | | | (0.49 | ) | | | (0.60 | ) | | | (0.42 | ) |
| Net Asset Value, End of Period | | | $12.01 | | | | $11.52 | | | | $11.06 | | | | $11.71 | | | | $10.82 | |
| | | | | | | | | | | | | | | | | | | | | |
Total Return(2) | | | 7.39 | % | | | 5.98 | % | | | (1.32 | )% | | | 14.31 | % | | | 4.92 | % |
| | | | | | | | | | | | | | | | | | | | | |
| Ratios/Supplemental Data | |
Ratio of Operating Expenses to Average Net Assets | | | 0.28 | % | | | 0.28 | % | | | 0.29 | % | | | 0.29 | % | | | 0.29 | % |
Ratio of Net Investment Income (Loss) to Average Net Assets | | | 2.78 | % | | | 3.69 | % | | | 1.81 | % | | | 5.86 | % | | | 3.99 | % |
| Portfolio Turnover Rate | | | 33 | % | | | 27 | % | | | 18 | % | | | 33 | % | | | 32 | % |
| Net Assets, End of Period (in thousands) | | | $559,589 | | | | $407,799 | | | | $210,177 | | | | $165,872 | | | | $118,250 | |
| (1) | Computed using average shares outstanding throughout the period. |
| (2) | Total returns are calculated based on the net asset value of the last business day. Total returns for periods less than one year are not annualized. |
See Notes to Financial Statements.
A Class(1) | |
| For a Share Outstanding Throughout the Years Ended March 31 | |
| | | 2011 | | | 2010 | | | 2009 | | | 2008 | | | 2007 | |
| Per-Share Data | |
| Net Asset Value, Beginning of Period | | | $11.49 | | | | $11.03 | | | | $11.70 | | | | $10.81 | | | | $10.73 | |
| Income From Investment Operations | | | | | | | | | | | | | | | | | | | | |
| Net Investment Income (Loss) | | | 0.27 | (2) | | | 0.37 | (2) | | | 0.18 | (2) | | | 0.60 | (2) | | | 0.36 | |
| Net Realized and Unrealized Gain (Loss) | | | 0.51 | | | | 0.24 | | | | (0.38 | ) | | | 0.84 | | | | 0.10 | |
| Total From Investment Operations | | | 0.78 | | | | 0.61 | | | | (0.20 | ) | | | 1.44 | | | | 0.46 | |
| Distributions | | | | | | | | | | | | | | | | | | | | |
| From Net Investment Income | | | (0.23 | ) | | | (0.15 | ) | | | (0.39 | ) | | | (0.55 | ) | | | (0.36 | ) |
| From Net Realized Gains | | | (0.07 | ) | | | — | | | | — | | | | — | | | | — | |
| From Tax Return of Capital | | | — | | | | — | | | | (0.08 | ) | | | — | | | | (0.02 | ) |
| Total Distributions | | | (0.30 | ) | | | (0.15 | ) | | | (0.47 | ) | | | (0.55 | ) | | | (0.38 | ) |
| Net Asset Value, End of Period | | | $11.97 | | | | $11.49 | | | | $11.03 | | | | $11.70 | | | | $10.81 | |
| | | | | | | | | | | | | | | | | | | | | |
Total Return(3) | | | 6.84 | % | | | 5.52 | % | | | (1.73 | )% | | | 13.83 | % | | | 4.37 | % |
| | | | | | | | | | | | | | | | | | | | | |
| Ratios/Supplemental Data | |
Ratio of Operating Expenses to Average Net Assets | | | 0.73 | % | | | 0.73 | % | | | 0.74 | % | | | 0.74 | % | | | 0.74 | % |
Ratio of Net Investment Income (Loss) to Average Net Assets | | | 2.33 | % | | | 3.24 | % | | | 1.36 | % | | | 5.41 | % | | | 3.54 | % |
| Portfolio Turnover Rate | | | 33 | % | | | 27 | % | | | 18 | % | | | 33 | % | | | 32 | % |
| Net Assets, End of Period (in thousands) | | | $691,362 | | | | $709,931 | | | | $500,882 | | | | $488,645 | | | | $419,477 | |
| (1) | Prior to March 1, 2010, the A Class was referred to as the Advisor Class. |
| (2) | Computed using average shares outstanding throughout the period. |
| (3) | Total returns are calculated based on the net asset value of the last business day and do not reflect applicable sales charges. Total returns for periods less than one year are not annualized. |
See Notes to Financial Statements.
| C Class | |
| For a Share Outstanding Throughout the Years Ended March 31 (except as noted) | |
| | | 2011 | | | 2010(1) | |
| Per-Share Data | |
| Net Asset Value, Beginning of Period | | | $11.51 | | | | $11.51 | |
| Income From Investment Operations | | | | | | | | |
Net Investment Income (Loss)(2) | | | 0.21 | | | | 0.03 | |
| Net Realized and Unrealized Gain (Loss) | | | 0.49 | | | | (0.03 | ) |
| Total From Investment Operations | | | 0.70 | | | | — | |
| Distributions | | | | | | | | |
| From Net Investment Income | | | (0.14 | ) | | | — | |
| From Net Realized Gains | | | (0.07 | ) | | | — | |
| Total Distributions | | | (0.21 | ) | | | — | |
| Net Asset Value, End of Period | | | $12.00 | | | | $11.51 | |
| | | | | | | | | |
Total Return(3) | | | 6.11 | % | | | 0.00 | % |
| | | | | | | | | |
| Ratios/Supplemental Data | |
| Ratio of Operating Expenses to Average Net Assets | | | 1.48 | % | | | 1.48 | %(4) |
| Ratio of Net Investment Income (Loss) to Average Net Assets | | | 1.58 | % | | | 3.67 | %(4) |
| Portfolio Turnover Rate | | | 33 | % | | | 27 | %(5) |
| Net Assets, End of Period (in thousands) | | | $5,159 | | | | $139 | |
| (1) | March 1, 2010 (commencement of sale) through March 31, 2010. |
| (2) | Computed using average shares outstanding throughout the period. |
| (3) | Total returns are calculated based on the net asset value of the last business day and do not reflect applicable sales charges. Total returns for periods less than one year are not annualized. |
| (5) | Portfolio turnover is calculated at the fund level. Percentage indicated was calculated for the year ended March 31, 2010. |
See Notes to Financial Statements.
| R Class | |
| For a Share Outstanding Throughout the Years Ended March 31 (except as noted) | |
| | | 2011 | | | 2010(1) | |
| Per-Share Data | |
| Net Asset Value, Beginning of Period | | | $11.52 | | | | $11.51 | |
| Income From Investment Operations | | | | | | | | |
Net Investment Income (Loss)(2) | | | 0.26 | | | | 0.04 | |
| Net Realized and Unrealized Gain (Loss) | | | 0.50 | | | | (0.03 | ) |
| Total From Investment Operations | | | 0.76 | | | | 0.01 | |
| Distributions | | | | | | | | |
| From Net Investment Income | | | (0.20 | ) | | | — | |
| From Net Realized Gains | | | (0.07 | ) | | | — | |
| Total Distributions | | | (0.27 | ) | | | — | |
| Net Asset Value, End of Period | | | $12.01 | | | | $11.52 | |
| | | | | | | | | |
Total Return(3) | | | 6.64 | % | | | 0.09 | % |
| | | | | | | | | |
| Ratios/Supplemental Data | |
| Ratio of Operating Expenses to Average Net Assets | | | 0.98 | % | | | 0.98 | %(4) |
| Ratio of Net Investment Income (Loss) to Average Net Assets | | | 2.08 | % | | | 4.17 | %(4) |
| Portfolio Turnover Rate | | | 33 | % | | | 27 | %(5) |
| Net Assets, End of Period (in thousands) | | | $43 | | | | $25 | |
| (1) | March 1, 2010 (commencement of sale) through March 31, 2010. |
| (2) | Computed using average shares outstanding throughout the period. |
| (3) | Total returns are calculated based on the net asset value of the last business day. Total returns for periods less than one year are not annualized. |
| (5) | Portfolio turnover is calculated at the fund level. Percentage indicated was calculated for the year ended March 31, 2010. |
See Notes to Financial Statements.
Report of Independent Registered Public Accounting Firm |
To the Trustees of the American Century Government Income Trust and Shareholders of the Inflation-Adjusted Bond Fund:
In our opinion, the accompanying statement of assets and liabilities, including the schedule of investments, and the related statements of operations and of changes in net assets and the financial highlights present fairly, in all material respects, the financial position of the Inflation-Adjusted Bond Fund (one of the five funds comprising the American Century Government Income Trust, hereafter referred to as the “Fund”) at March 31, 2011, the results of its operations for the year then ended, the changes in its net assets for each of the two years in the period then ended and the financial highlights for each of the periods presented, in conformity with accounting principles generally accepted in the United States of America. These financial statements and financial highlights (hereafter referred to as “financial statements”) are the responsibility of the Fund’s management; our responsibility is to express an opinion on these financial statements based on our audits. We conducted our audits of these financial statements in accordance with the standards of the Public Company Accounting Oversight Board (United States). Those standards require that we plan and perform the audit to obtain reasonable assurance about whether the financial statements are free of material misstatement. An audit includes examining, on a test basis, evidence supporting the amounts and disclosures in the financial statements, assessing the accounting principles used and significant estimates made by management, and evaluating the overall financial statement presentation. We believe that our audits, which included confirmation of securities at March 31, 2011 by correspondence with the custodian and brokers, provide a reasonable basis for our opinion.
PricewaterhouseCoopers LLP
Kansas City, Missouri
May 19, 2011
A special meeting of shareholders was held on June 16, 2010, to vote on the following proposals. Each proposal received the required number of votes and was adopted. A summary of voting results is listed below each proposal.
Proposal 1:
To elect one Trustee to the Board of Trustees of American Century Government Income Trust (the proposal was voted on by all shareholders of funds issued by American Century Government Income Trust):
| | | |
| Frederick L.A. Grauer | For: | 6,878,868,575 |
| | Withhold: | 268,743,465 |
| | Abstain: | 0 |
| | Broker Non-Vote: | 0 |
The other trustees whose term of office continued after the meeting include Jonathan S. Thomas, John Freidenrich, Ronald J. Gilson, Peter F. Pervere, Myron S. Scholes, and John B. Shoven.
Proposal 2:
To approve a management agreement between the fund and American Century Investment Management, Inc.:
| | | |
| Investor and A Classes | For: | 1,461,796,392 |
| | Against: | 33,663,915 |
| | Abstain: | 51,400,779 |
| | Broker Non-Vote: | 503,313,385 |
| | | |
| Institutional Class | For: | 292,953,382 |
| | Against: | 5,209,440 |
| | Abstain: | 3,086,948 |
| | Broker Non-Vote: | 5,336 ,894 |
The individuals listed below serve as trustees of the fund. Each trustee will continue to serve in this capacity until death, retirement, resignation or removal from office. The mandatory retirement age for trustees who are not “interested persons,” as that term is defined in the Investment Company Act (independent trustees), is 73. However, the mandatory retirement age may be extended for a period not to exceed two years with the approval of the remaining independent trustees.
Mr. Thomas is the only trustee who is an “interested person” because he currently serves as President and Chief Executive Officer of American Century Companies, Inc. (ACC), the parent company of American Century Investment Management, Inc. (ACIM or the advisor).
The other trustees (more than three-fourths of the total number) are independent; that is, they have never been employees, directors or officers of, and have no financial interest in, ACC or any of its wholly owned, direct or indirect, subsidiaries, including ACIM, American Century Investment Services, Inc. (ACIS) and American Century Services, LLC (ACS). The trustees serve in this capacity for eight (in the case of Mr. Thomas, 15) registered investment companies in the American Century Investments family of funds.
The following presents additional information about the trustees. The mailing address for each trustee, other than Mr. Thomas, is 1665 Charleston Road, Mountain View, California 94043. The mailing address for Mr. Thomas is 4500 Main Street, Kansas City, Missouri 64111.
| | | | | | |
Name (Year of Birth) | Position(s) Held with Funds | Length of Time Served | Principal Occupation(s) During Past 5 Years | Number of American Century Portfolios Overseen by Trustee | Other Directorships Held During Past 5 Years |
| Independent Trustees |
Tanya S. Beder (1955) | Trustee | Since 2011 | Chairman, SBCC Group Inc. (investment advisory services) (2006 to present); Fellow in Practice, International Center for Finance, Yale University School of Management (1985 to present); Chief Executive Officer, Tribeca Global Management LLC (2004 to 2006) | 40 | None |
John Freidenrich (1937) | Trustee | Since 2005 | Founder, Member and Manager, Regis Management Company, LLC (investment management firm) (April 2004 to present) | 40 | None |
Ronald J. Gilson (1946) | Trustee and Chairman of the Board | Since 1995 | Charles J. Meyers Professor of Law and Business, Stanford Law School (1979 to present); Marc and Eva Stern Professor of Law and Business, Columbia University School of Law (1992 to present) | 40 | None |
| | | | | | |
Name (Year of Birth) | Position(s) Held with Funds | Length of Time Served | Principal Occupation(s) During Past 5 Years | Number of American Century Portfolios Overseen by Trustee | Other Directorships Held During Past 5 Years |
| Independent Trustees |
Frederick L. A. Grauer (1946) | Trustee | Since 2008 | Senior Advisor, BlackRock, Inc. (investment management firm) (2010 to 2011); Senior Advisor, Barclays Global Investors (investment management firm) (2003 to 2009) | 40 | None |
Peter F. Pervere (1947) | Trustee | Since 2007 | Retired | 40 | Intraware, Inc. (2003 to 2009) |
Myron S. Scholes (1941) | Trustee | Since 1980 | Chairman, Platinum Grove Asset Management, L.P. (asset manager) (1999 to 2009); Frank E. Buck Professor of Finance-Emeritus, Stanford Graduate School of Business (1996 to present) | 40 | Dimensional Fund Advisors (investment advisor); CME Group, Inc. (futures and options exchange) |
John B. Shoven (1947) | Trustee | Since 2002 | Professor of Economics, Stanford University (1973 to present) | 40 | Cadence Design Systems; Exponent; Financial Engines; Watson Wyatt Worldwide (2002 to 2006) |
| |
| Interested Trustee |
Jonathan S. Thomas (1963) | Trustee and President | Since 2007 | President and Chief Executive Officer, ACC (March 2007 to present); Chief Administrative Officer, ACC (February 2006 to February 2007); Executive Vice President, ACC (November 2005 to February 2007). Also serves as: Chief Executive Officer and Manager, ACS; Executive Vice President, ACIM; Director, ACC, ACIM and other ACC subsidiaries | 104 | None |
Officers
The following table presents certain information about the executive officers of the fund. Each officer serves as an officer for each of the 15 investment companies in the American Century family of funds, unless otherwise noted. No officer is compensated for his or her service as an officer of the fund. The listed officers are interested persons of the fund and are appointed or re-appointed on an annual basis. The mailing address for each of the officers listed below is 4500 Main Street, Kansas City, Missouri 64111.
| | | |
Name (Year of Birth) | Offices with the Funds | Principal Occupation(s) During the Past Five Years |
| Officers |
Jonathan S. Thomas (1963) | Trustee and President since 2007 | President and Chief Executive Officer, ACC (March 2007 to present); Chief Administrative Officer, ACC (February 2006 to February 2007); Executive Vice President, ACC (November 2005 to February 2007). Also serves as: Chief Executive Officer and Manager, ACS; Executive Vice President, ACIM; Director, ACC, ACIM and other ACC subsidiaries |
Barry Fink (1955) | Executive Vice President since 2007 | Chief Operating Officer and Executive Vice President, ACC (September 2007 to present); President, ACS (October 2007 to present); Managing Director, Morgan Stanley (2000 to 2007); Global General Counsel, Morgan Stanley (2000 to 2006). Also serves as: Manager, ACS and Director, ACC and certain ACC subsidiaries |
Maryanne L. Roepke (1956) | Chief Compliance Officer since 2006 and Senior Vice President since 2000 | Chief Compliance Officer, American Century funds, ACIM and ACS (August 2006 to present); Assistant Treasurer, ACC (January 1995 to August 2006); and Treasurer and Chief Financial Officer, various American Century funds (July 2000 to August 2006). Also serves as: Senior Vice President, ACS |
Charles A. Etherington (1957) | General Counsel since 2007 and Senior Vice President since 2006 | Attorney, ACC (February 1994 to present); Vice President, ACC (November 2005 to present), General Counsel, ACC (March 2007 to present); Also serves as General Counsel, ACIM, ACS, ACIS and other ACC subsidiaries; and Senior Vice President, ACIM and ACS |
Robert J. Leach (1966) | Vice President, Treasurer and Chief Financial Officer since 2006 | Vice President, ACS (February 2000 to present); and Controller, various American Century funds (1997 to September 2006) |
David H. Reinmiller (1963) | Vice President since 2001 | Attorney, ACC (January 1994 to present); Associate General Counsel, ACC (January 2001 to present); Chief Compliance Officer, American Century funds and ACIM (January 2001 to February 2005). Also serves as Vice President, ACIM and ACS |
Ward D. Stauffer (1960) | Secretary since 2005 | Attorney, ACC (June 2003 to Present) |
The Statement of Additional Information has additional information about the fund’s trustees and is available without charge, upon request, by calling 1-800-345-2021.
Retirement Account Information
As required by law, distributions you receive from certain IRAs, or 403(b), 457 and qualified plans are subject to federal income tax withholding, unless you elect not to have withholding apply. Tax will be withheld on the total amount withdrawn even though you may be receiving amounts that are not subject to withholding, such as nondeductible contributions. In such case, excess amounts of withholding could occur. You may adjust your withholding election so that a greater or lesser amount will be withheld.
If you don’t want us to withhold on this amount, you must notify us to not withhold the federal income tax. You may notify us in writing or in certain situations by telephone or through other electronic means. You have the right to revoke your withholding election at any time and any election you make may remain in effect until revoked by filing a new election.
Remember, even if you elect not to have income tax withheld, you are liable for paying income tax on the taxable portion of your withdrawal. If you elect not to have income tax withheld or you don’t have enough income tax withheld, you may be responsible for payment of estimated tax. You may incur penalties under the estimated tax rules if your withholding and estimated tax payments are not sufficient. You can reduce or defer the income tax on a distribution by directly or indirectly rolling such distribution over to another IRA or eligible plan. You should consult your tax advisor for additional information.
State tax will be withheld if, at the time of your distribution, your address is within one of the mandatory withholding states and you have federal income tax withheld. State taxes will be withheld from your distribution in accordance with the respective state rules.
Proxy Voting Guidelines
American Century Investment Management, Inc., the fund’s investment advisor, is responsible for exercising the voting rights associated with the securities purchased and/or held by the fund. A description of the policies and procedures the advisor uses in fulfilling this responsibility is available without charge, upon request, by calling 1-800-345-2021. It is also available on American Century Investments’ website at americancentury.com and on the Securities and Exchange Commission’s website at sec.gov. Information regarding how the investment advisor voted proxies relating to portfolio securities during the most recent 12-month period ended June 30 is available on the “About Us” page at americancentury.com. It is also available at sec.gov.
Quarterly Portfolio Disclosure
The fund files its complete schedule of portfolio holdings with the Securities and Exchange Commission (SEC) for the first and third quarters of each fiscal year on Form N-Q. The fund’s Forms N-Q are available on the SEC’s website at sec.gov, and may be reviewed and copied at the SEC’s Public Reference Room in Washington, DC. Information on the operation of the Public Reference Room may be obtained by calling 1-800-SEC-0330. The fund also makes its complete schedule of portfolio holdings for the most recent quarter of its fiscal year available on its website at americancentury.com and, upon request, by calling 1-800-345-2021.
Other Tax Information
The following information is provided pursuant to provisions of the Internal Revenue Code.
The fund hereby designates $14,810,145, or up to the maximum amount allowable, as long-term capital gain distributions for the fiscal year ended March 31, 2011.
The fund hereby designates $6,439,193 as qualified short-term capital gain distributions for purposes of Internal Revenue Code Section 871.
| Contact Us | americancentury.com |
| Automated Information Line | 1-800-345-8765 |
| Investor Services Representative | 1-800-345-2021 or 816-531-5575 |
| Investors Using Advisors | 1-800-378-9878 |
Business, Not-For-Profit, Employer-Sponsored Retirement Plans | 1-800-345-3533 |
Banks and Trust Companies, Broker-Dealers, Financial Professionals, Insurance Companies | 1-800-345-6488 |
| Telecommunications Device for the Deaf | 1-800-634-4113 |
American Century Government Income Trust
Investment Advisor:
American Century Investment Management, Inc.
Kansas City, Missouri
This report and the statements it contains are submitted for the general information of our shareholders. The report is not authorized for distribution to prospective investors unless preceded or accompanied by an effective prospectus.
©2011 American Century Proprietary Holdings, Inc. All rights reserved.
CL-ANN-71448 1105
ANNUAL REPORT MARCH 31, 2011
| | Short-Term Government Fund |
| President’s Letter | 2 |
| Market Perspective | 3 |
| Performance | 4 |
| Portfolio Commentary | 6 |
| Fund Characteristics | 8 |
| Shareholder Fee Example | 9 |
| Schedule of Investments | 11 |
| Statement of Assets and Liabilities | 15 |
| Statement of Operations | 16 |
| Statement of Changes in Net Assets | 17 |
| Notes to Financial Statements | 18 |
| Financial Highlights | 24 |
| Report of Independent Registered Public Accounting Firm | 29 |
| Proxy Voting Results | 30 |
| Management | 31 |
| Additional Information | 34 |
Any opinions expressed in this report reflect those of the author as of the date of the report, and do not necessarily represent the opinions of American Century Investments® or any other person in the American Century Investments organization. Any such opinions are subject to change at any time based upon market or other conditions and American Century Investments disclaims any responsibility to update such opinions. These opinions may not be relied upon as investment advice and, because investment decisions made by American Century Investments funds are based on numerous factors, may not be relied upon as an indication of trading intent on behalf of any American Century Investments fund. Security examples are used for representational purposes only and are not intended as recommendations to purchase or sell securities. Performance information for comparative indices and securities is provided to American Century Investments by third party vendors. To the best of American Century Investments’ knowledge, such information is accurate at the time of printing.
Dear Investor:
Thank you for reviewing this annual report for the period ended March 31, 2011. Our report offers investment performance and portfolio information, presented with the expert perspective and commentary of our portfolio management team. This report remains one of our most important vehicles for conveying the information you need about your investment performance, and about the market factors and strategies that affect fund returns. For additional, updated information on fund performance, portfolio strategy, and the investment markets, we encourage you to visit our website, americancentury.com. Click on the “Fund Performance” and “Insights & News” headings at the top of our Individual Investors site.
Investment Performance and Macroeconomic Update
Investment performance tables turned dramatically since our semiannual report for the six months ended September 30, 2010. That report chronicled an uneven period for economic growth and financial market performance that produced generally higher returns for U.S. bonds than for U.S. stocks. For the subsequent six months ended March 31, 2011, broad U.S. stock indices significantly outperformed their bond counterparts as monetary and fiscal intervention in 2010 fueled investor optimism about economic and financial market conditions in 2011 and 2012. The S&P 500 Index (representing U.S. stocks) and the Barclays Capital U.S. Aggregate Bond Index returned 17.31% and -0.88%, respectively, during those final six months.
In the second half of 2010, the U.S. Federal Reserve launched its second round of quantitative easing (QE2), a form of monetary intervention involving the purchase of U.S. government securities to increase the money supply and encourage investors to purchase potentially higher-risk/higher-return assets, such as stocks. Small-cap growth stocks benefited most from the resulting rally. But besides boosting stock prices, QE2 also helped fuel inflation fears. The benchmark 10-year U.S. Treasury note suffered a -5.92% total return from September 30, 2010, to March 31, 2011, as its yield jumped from 2.51% to 3.47%.
These developments over the more-recent six months are incorporated in the broader, enclosed 12-month Market Perspective and Portfolio Commentary from the portfolio management team. Our experts will continue to diligently apply their knowledge and skills as they make daily investment decisions for you.
Sincerely,
Jonathan Thomas
President and Chief Executive Officer
American Century Investments
By David MacEwen, Chief Investment Officer, Fixed Income
Economic Uncertainty Gave Way to Economic Optimism
Bonds generated solid returns for the 12 months ended March 31, 2011—a period characterized by mixed economic data and changing investor sentiment. Early in the period, a slowdown in the pace of economic growth, combined with lingering high unemployment, the European sovereign debt crisis, and mounting deflationary signals, stoked fears of a double-dip recession. This backdrop fueled demand for Treasuries and other “safe haven” investments.
Dissatisfied with the slow pace of economic growth and the lingering high jobless rate, the Federal Reserve (the Fed) kept its federal funds rate target near zero and, in late 2010, announced a second round of quantitative easing, dubbed “QE2” (the Fed’s government-securities purchase program designed to expand the money supply). This action, combined with improving economic data and the extension of prevailing federal income tax rates, sparked a fresh round of economic optimism and “risk-taking” by investors. At the same time, inflationary pressures began brewing, primarily due to better economic forecasts combined with soaring prices for oil and other commodities.
Demand for Yield, Inflation Protection Drove Performance
Treasury yields declined across all maturities, yet the slope of the yield curve (between two and 30 years) remained relatively unchanged. The generally low interest rate environment prompted investors to maintain a healthy appetite for yield. This led to strong, broad-benchmark-beating performance from investment-grade and high-yield corporate bonds, which also benefited from solid corporate fundamentals and low default rates. Longer-term nominal Treasuries also outperformed the broad bond market in this rate environment, but they lagged their inflation-indexed counterparts. Concerns about rising inflation pushed TIPS (Treasury inflation-protected securities) to the top of the investment-grade fixed-income performance hierarchy for the 12-month period.
Government agency mortgage-backed securities (MBS) posted positive returns for the period, but they lagged the broader market. Valuations in the sector remained tight relative to Treasuries, giving investors little incentive to take on additional risk. Meanwhile, cash returns were essentially flat throughout the period, reflecting the Fed’s near-zero interest rate policy.
| U.S. Fixed-Income Total Returns |
| For the 12 months ended March 31, 2011 |
| Barclays Capital U.S. Bond Market Indices | | Barclays Capital U.S. Treasury Bellwethers |
| Corporate High-Yield | 14.31% | | 3-Month Bill | 0.19% |
| Treasury Inflation Protected Securities (TIPS) | 7.91% | | 2-Year Note | 1.64% |
| Corporate (investment-grade) | 7.46% | | 10-Year Note | 6.55% |
| Aggregate (multi-sector) | 5.12% | | 30-Year Bond | 6.91% |
| Treasury | 4.53% | | |
| MBS (mortgage-backed securities) | 4.37% | | |
| Total Returns as of March 31, 2011 |
| | | | Average Annual Returns | |
| | Ticker Symbol | 1 year | 5 years | 10 years | Since Inception | Inception Date |
| Investor Class | TWUSX | 1.60% | 3.89% | 3.30% | 5.63% | 12/15/82 |
Barclays Capital U.S. 1–3 Year Government Bond Index | — | 1.73% | 4.24% | 3.79% | 6.50%(1) | — |
| Institutional Class | TWUOX | 1.70% | — | — | 1.38% | 3/1/10 |
A Class(2) No sales charge* With sales charge* | TWAVX | 1.35% -0.89% | 3.63% 3.17% | 3.04% 2.80% | 3.52% 3.34% | 7/8/98 |
| C Class | TWACX | 0.53% | — | — | 0.21% | 3/1/10 |
| R Class | TWARX | 0.99% | — | — | 0.68% | 3/1/10 |
| * | Sales charges include initial sales charges and contingent deferred sales charges (CDSCs), as applicable. A Class shares have a 2.25% maximum initial sales charge and may be subject to a maximum CDSC of 1.00%. C Class shares redeemed within 12 months of purchase are subject to a maximum CDSC of 1.00%. The SEC requires that mutual funds provide performance information net of maximum sales charges in all cases where charges could be applied. |
| (1) | Since 12/31/82, the date nearest the Investor Class’s inception for which data are available. |
| (2) | Prior to March 1, 2010, the A Class was referred to as the Advisor Class and did not have a front-end sales charge. Performance prior to that date has been adjusted to reflect this charge. |
Data presented reflect past performance. Past performance is no guarantee of future results. Current performance may be higher or lower than the performance shown. Investment return and principal value will fluctuate, and redemption value may be more or less than original cost. To obtain performance data current to the most recent month end, please call 1-800-345-2021 or visit americancentury.com. As interest rates rise, bond values will decline.
Unless otherwise indicated, performance reflects Investor Class shares; performance for other share classes will vary due to differences in fee structure. For information about other share classes available, please consult the prospectus. Data assumes reinvestment of dividends and capital gains, and none of the charts reflect the deduction of taxes that a shareholder would pay on fund distributions or the redemption of fund shares. Returns for the index are provided for comparison. The fund’s total returns include operating expenses (such as transaction costs and management fees) that reduce returns, while the total returns of the index do not.
| Growth of $10,000 Over 10 Years |
| $10,000 investment made March 31, 2001 |
| Total Annual Fund Operating Expenses |
| Investor Class | Institutional Class | A Class | C Class | R Class |
| 0.56% | 0.36% | 0.81% | 1.56% | 1.06% |
The total annual fund operating expenses shown is as stated in the fund’s prospectus current as of the date of this report. The prospectus may vary from the expense ratio shown elsewhere in this report because it is based on a different time period, includes acquired fund fees and expenses, and, if applicable, does not include fee waivers or expense reimbursements.
Data presented reflect past performance. Past performance is no guarantee of future results. Current performance may be higher or lower than the performance shown. Investment return and principal value will fluctuate, and redemption value may be more or less than original cost. To obtain performance data current to the most recent month end, please call 1-800-345-2021 or visit americancentury.com. As interest rates rise, bond values will decline.
Unless otherwise indicated, performance reflects Investor Class shares; performance for other share classes will vary due to differences in fee structure. For information about other share classes available, please consult the prospectus. Data assumes reinvestment of dividends and capital gains, and none of the charts reflect the deduction of taxes that a shareholder would pay on fund distributions or the redemption of fund shares. Returns for the index are provided for comparison. The fund’s total returns include operating expenses (such as transaction costs and management fees) that reduce returns, while the total returns of the index do not.
Portfolio Managers: Bob Gahagan, Hando Aguilar, Brian Howell, Dan Shiffman, and Jim Platz
Performance Summary
Short-Term Government returned 1.60%* for the 12 months ended March 31, 2011. By comparison, the portfolio’s benchmark, the Barclays Capital U.S. 1-3 Year Government Bond Index, returned 1.73%. See page 4 for additional performance comparisons. Fund returns reflect operating expenses, while index returns do not.
Short-Term Government’s absolute return reflected the modest, positive performance of short-term government bonds during the period. Relative to the benchmark, the main differentiating factors included operating expenses, yield curve positioning, and security selection.
Mortgage Security Selection Was Positive
With Treasury yields at relatively low levels, we maintained a portfolio overweight position in the mortgage-backed securities (MBS) sector throughout the 12-month period. MBS outperformed Treasuries of similar maturities during the period, but typically longer-maturity, more interest-rate-sensitive broad Treasury indices outperformed their MBS counterparts. Treasury yields declined across all maturities.
Security selection within the portfolio’s mortgage component contributed positively to the 12-month return. In particular, we favored higher-yielding collateralized mortgage obligations (CMOs), and earlier in the period, Federal Deposit Insurance Corporation (FDIC)-guaranteed securities, over traditional government agency MBS. We avoided traditional MBS because their yields on an absolute basis and relative to Treasuries remained at historically low levels. This positioning helped the portfolio’s performance, because FDIC paper and CMOs outperformed traditional MBS. Investors favored “structured mortgage products,” such as CMOs, which are less likely to experience sharp price volatility as a result of refinancing and the risk of rapidly changing interest rates.
Security selection also was effective within the portfolio’s agency component. As with Treasuries, we believed valuations among government agency securities appeared rich during the reporting period, due to the impact on the market from the Federal Reserve’s (the Fed’s) bond-buying activities. As such, we gradually pared back our exposure. With the Fed’s quantitative easing program set to expire in the second quarter of 2011, we are looking for opportunities to take advantage of improving valuations among agency debentures.
Yield Curve Positioning Favored Flattening
We continued to position the portfolio for a longer-term flattening of the yield curve (the graphic representation of Treasury yields), with the expectation that the yield difference between one- and five-year Treasuries would narrow going forward. This strategy had a minimal impact on performance during the 12-month period, as the slope of the short-term yield curve flattened only slightly. From a longer term perspective—potentially after the Fed’s quantitative easing concludes in June—we believe the curve may flatten more significantly, due to short-term rates rising at a faster pace than long-term rates.
*All fund returns referenced in this commentary are for Investor Class shares.
Outlook
“Economic conditions appear to have improved,” said Portfolio Manager Bob Gahagan. “ISM (Institute for Supply Management) manufacturing data, retail sales, and consumer confidence are better, but it remains to be seen if current momentum is enough to offset the winding down of stimulus programs from the Fed and the federal government, soft employment, a weak housing market, and historically high debt levels. In addition, elevated sovereign debt risk and the need for fiscal austerity in many industrialized nations may act as an additional friction to growth over the next few years. Also, the implications of the Japan earthquake and the unrest in the Middle East and Northern Africa are adding to the aura of uncertainty.
“These factors, combined with increasing inflationary pressures stemming from monetary expansion and rising commodity prices, have important implications for fixed-income investors. In this environment, we are sticking to our disciplined, relative-value approach to portfolio management, emphasizing careful security selection and risk management. As such, we are likely to maintain a duration (price sensitivity to interest rate changes) close to that of the benchmark. In terms of sector allocation, we continue to favor a modest overweight to MBS, focusing on structured mortgage products over traditional mortgage securities.”
| MARCH 31, 2011 |
| Portfolio at a Glance | |
| Average Duration (effective) | 1.8 years |
| Weighted Average Life | 2.0 years |
| | |
| 30-Day SEC Yields | |
| Investor Class | 0.39% |
| Institutional Class | 0.59% |
| A Class | 0.14% |
| C Class | -0.60% |
| R Class | -0.11% |
| | |
| Types of Investments in Portfolio | % of net assets |
| U.S. Treasury Securities | 54.6% |
| U.S. Government Agency Securities and Equivalents | 28.0% |
| Collateralized Mortgage Obligations | 11.1% |
| U.S. Government Agency Mortgage-Backed Securities | 2.2% |
| Temporary Cash Investments | 3.8% |
| Other Assets and Liabilities | 0.3% |
Shareholder Fee Example (Unaudited) |
Fund shareholders may incur two types of costs: (1) transaction costs, including sales charges (loads) on purchase payments and redemption/exchange fees; and (2) ongoing costs, including management fees; distribution and service (12b-1) fees; and other fund expenses. This example is intended to help you understand your ongoing costs (in dollars) of investing in your fund and to compare these costs with the ongoing cost of investing in other mutual funds.
The example is based on an investment of $1,000 made at the beginning of the period and held for the entire period from October 1, 2010 to March 31, 2011.
Actual Expenses
The table provides information about actual account values and actual expenses for each class. You may use the information, together with the amount you invested, to estimate the expenses that you paid over the period. First, identify the share class you own. Then simply divide your account value by $1,000 (for example, an $8,600 account value divided by $1,000 = 8.6), then multiply the result by the number under the heading “Expenses Paid During Period” to estimate the expenses you paid on your account during this period.
If you hold Investor Class shares of any American Century Investments fund, or Institutional Class shares of the American Century Diversified Bond Fund, in an American Century Investments account (i.e., not a financial intermediary or retirement plan account), American Century Investments may charge you a $12.50 semiannual account maintenance fee if the value of those shares is less than $10,000. We will redeem shares automatically in one of your accounts to pay the $12.50 fee. In determining your total eligible investment amount, we will include your investments in all personal accounts (including American Century Investments Brokerage accounts) registered under your Social Security number. Personal accounts include individual accounts, joint accounts, UGMA/UTMA accounts, personal trusts, Coverdell Education Savings Accounts and IRAs (including traditional, Roth, Rollover, SEP-, SARSEP- and SIMPLE-IRAs), and certain other retirement accounts. If you have only business, business retirement, employer-sponsored or American Century Investments Brokerage accounts, you are currently not subject to this fee. We will not charge the fee as long as you choose to manage your accounts exclusively online. If you are subject to the Account Maintenance Fee, your account value could be reduced by the fee amount.
Hypothetical Example for Comparison Purposes
The table also provides information about hypothetical account values and hypothetical expenses based on the actual expense ratio of each class of your fund and an assumed rate of return of 5% per year before expenses, which is not the actual return of a fund’s share class. The hypothetical account values and expenses may not be used to estimate the actual ending account balance or expenses you paid for the period. You may use this information to compare the ongoing costs of investing in your fund and other funds. To do so, compare this 5% hypothetical example with the 5% hypothetical examples that appear in the shareholder reports of the other funds.
Please note that the expenses shown in the table are meant to highlight your ongoing costs only and do not reflect any transactional costs, such as sales charges (loads) or redemption/exchange fees. Therefore, the table is useful in comparing ongoing costs only, and will not help you determine the relative total costs of owning different funds. In addition, if these transactional costs were included, your costs would have been higher.
| | | | | |
| | Beginning Account Value 10/1/10 | Ending Account Value 3/31/11 | Expenses Paid During Period* 10/1/10 – 3/31/11 | Annualized Expense Ratio* |
| Actual |
| Investor Class | $1,000 | $995.60 | $2.79 | 0.56% |
| Institutional Class | $1,000 | $996.50 | $1.79 | 0.36% |
| A Class | $1,000 | $994.30 | $4.03 | 0.81% |
| C Class | $1,000 | $990.80 | $7.74 | 1.56% |
| R Class | $1,000 | $993.10 | $5.27 | 1.06% |
| Hypothetical |
| Investor Class | $1,000 | $1,022.14 | $2.82 | 0.56% |
| Institutional Class | $1,000 | $1,023.14 | $1.82 | 0.36% |
| A Class | $1,000 | $1,020.89 | $4.08 | 0.81% |
| C Class | $1,000 | $1,017.15 | $7.85 | 1.56% |
| R Class | $1,000 | $1,019.65 | $5.34 | 1.06% |
| * | Expenses are equal to the class’s annualized expense ratio listed in the table above, multiplied by the average account value over the period, multiplied by 182, the number of days in the most recent fiscal half-year, divided by 365, to reflect the one-half year period. |
MARCH 31, 2011
| | | |
| | Principal Amount | Value |
| U.S. Treasury Securities — 54.6% |
U.S. Treasury Notes, 0.75%, 11/30/11(1) | $ 18,000,000 | $ 18,064,692 |
U.S. Treasury Notes, 0.75%, 5/31/12(1) | 30,000,000 | 30,124,080 |
U.S. Treasury Notes, 1.875%, 6/15/12(1) | 90,000,000 | 91,567,980 |
U.S. Treasury Notes, 0.375%, 8/31/12(1) | 20,000,000 | 19,960,160 |
U.S. Treasury Notes, 1.375%, 9/15/12(1) | 25,000,000 | 25,295,900 |
U.S. Treasury Notes, 1.375%, 10/15/12(1) | 14,600,000 | 14,773,375 |
U.S. Treasury Notes, 1.375%, 11/15/12(1) | 107,400,000 | 108,671,186 |
U.S. Treasury Notes, 0.50%, 11/30/12(1) | 10,150,000 | 10,124,229 |
U.S. Treasury Notes, 1.375%, 3/15/13(1) | 45,000,000 | 45,497,565 |
U.S. Treasury Notes, 1.375%, 5/15/13(1) | 15,000,000 | 15,155,790 |
U.S. Treasury Notes, 0.75%, 9/15/13(1) | 13,000,000 | 12,909,611 |
U.S. Treasury Notes, 1.00%, 1/15/14(1) | 5,000,000 | 4,971,485 |
U.S. Treasury Notes, 1.25%, 2/15/14(1) | 18,100,000 | 18,098,588 |
U.S. Treasury Notes, 1.25%, 3/15/14(1) | 52,000,000 | 51,943,112 |
U.S. Treasury Notes, 1.875%, 4/30/14(1) | 10,000,000 | 10,164,850 |
U.S. Treasury Notes, 2.375%, 8/31/14(1) | 5,000,000 | 5,142,580 |
U.S. Treasury Notes, 2.625%, 12/31/14(1) | 2,500,000 | 2,585,743 |
U.S. Treasury Notes, 1.25%, 9/30/15(1) | 7,000,000 | 6,761,566 |
TOTAL U.S. TREASURY SECURITIES (Cost $489,942,858) | 491,812,492 |
| U.S. Government Agency Securities and Equivalents — 28.0% |
| FIXED-RATE U.S. GOVERNMENT AGENCY SECURITIES — 11.2% |
FDIC Structured Sale Guaranteed Notes, Series A1, 1.06%, 10/25/11(2)(3) | 3,000,000 | 2,991,294 |
FHLMC, 2.125%, 9/21/12(1) | 17,000,000 | 17,373,626 |
| FHLMC, 0.625%, 12/28/12 | 10,000,000 | 9,980,350 |
FHLMC, 1.625%, 4/15/13(1) | 15,000,000 | 15,227,700 |
FHLMC, 2.875%, 2/9/15(1) | 23,000,000 | 23,813,648 |
| FHLMC, 1.75%, 9/10/15 | 12,100,000 | 11,873,924 |
| FNMA, 0.50%, 10/30/12 | 10,000,000 | 9,971,350 |
| FNMA, 1.00%, 9/23/13 | 10,000,000 | 9,955,050 |
FNMA, 2.375%, 4/11/16(1) | 1,150,000 | 1,146,096 |
| | | 102,333,038 |
GOVERNMENT-BACKED CORPORATE BONDS(4) — 16.8% |
Ally Financial, Inc., 1.75%, 10/30/12(1) | 13,000,000 | 13,214,851 |
Ally Financial, Inc., 2.20%, 12/19/12(1) | 9,500,000 | 9,730,859 |
Bank of America Corp., 2.10%, 4/30/12(1) | 5,000,000 | 5,092,615 |
Bank of America Corp., 3.125%, 6/15/12(1) | 17,000,000 | 17,530,706 |
Citibank N.A., 1.75%, 12/28/12(1) | 10,000,000 | 10,174,470 |
| Citigroup Funding, Inc., 1.875%, 10/22/12 | 5,000,000 | 5,093,515 |
General Electric Capital Corp., 2.625%, 12/28/12(1) | 14,780,000 | 15,252,058 |
Goldman Sachs Group, Inc. (The), 2.15%, 3/15/12(1) | 10,000,000 | 10,175,300 |
Goldman Sachs Group, Inc. (The), 3.25%, 6/15/12(1) | 6,500,000 | 6,715,748 |
John Deere Capital Corp., 2.875%, 6/19/12(1) | 5,000,000 | 5,145,320 |
JPMorgan Chase & Co., 2.125%, 12/26/12(1) | 16,000,000 | 16,390,048 |
JPMorgan Chase & Co., 2.125%, 6/22/12(1) | 10,000,000 | 10,198,790 |
Morgan Stanley, 1.95%, 6/20/12(1) | 5,000,000 | 5,091,905 |
State Street Corp., 2.15%, 4/30/12(1) | 5,000,000 | 5,089,340 |
| U.S. Bancorp., 1.80%, 5/15/12 | 15,000,000 | 15,225,435 |
| | | 150,120,960 |
TOTAL U.S. GOVERNMENT AGENCY SECURITIES AND EQUIVALENTS (Cost $249,771,718) | 252,453,998 |
Collateralized Mortgage Obligations(5) — 11.1% |
FHLMC, Series 2430, Class QC, 5.50%, 2/15/17(1) | 7,138,777 | 7,614,260 |
FHLMC, Series 2624, Class FE SEQ, VRN, 0.56%, 4/15/11, resets monthly off the 1-month LIBOR plus 0.30% with a cap of 8.00%(1) | 2,671,856 | 2,677,629 |
FHLMC, Series 2625, Class FJ SEQ, VRN, 0.56%, 4/15/11, resets monthly off the 1-month LIBOR plus 0.30% with a cap of 7.50%(1) | $ 1,580,385 | $ 1,582,504 |
| FHLMC, Series 2642, Class AR SEQ, 4.50%, 7/15/23 | 3,069,538 | 3,246,057 |
| FHLMC, Series 2650, Class PN, 4.50%, 12/15/32 | 11,222,747 | 11,899,835 |
FHLMC, Series 2688, Class DE SEQ, 4.50%, 2/15/20(1) | 305,862 | 306,647 |
FHLMC, Series 2699, Class TG SEQ, 4.00%, 5/15/17(1) | 909,066 | 937,555 |
FHLMC, Series 2718, Class FW, VRN, 0.61%, 4/15/11, resets monthly off the 1-month LIBOR plus 0.35% with a cap of 8.00%(1) | 4,051,525 | 4,057,079 |
FHLMC, Series 2779, Class FM SEQ, VRN, 0.61%, 4/15/11, resets monthly off the 1-month LIBOR plus 0.35% with a cap of 7.50%(1) | 1,334,545 | 1,338,441 |
FHLMC, Series 2827, Class F, VRN, 0.61%, 4/15/11, resets monthly off the 1-month LIBOR plus 0.35% with a cap of 7.50%(1) | 1,758,418 | 1,759,148 |
| FHLMC, Series 3501, Class AC SEQ, 4.00%, 8/15/23 | 7,380,832 | 7,741,123 |
FHLMC, Series 3562, Class KB SEQ, 4.00%, 11/15/22(1) | 6,856,217 | 7,155,679 |
| FHLMC, Series 3601, Class AB SEQ, 1.25%, 11/15/12 | 3,649,053 | 3,667,762 |
FNMA, Series 2002-5, Class PJ, 6.00%, 10/25/21(1) | 1,108,897 | 1,160,540 |
FNMA, Series 2003-17, Class FN, VRN, 0.55%, 4/25/11, resets monthly off the 1-month LIBOR plus 0.30% with a cap of 8.50%(1) | 5,530,023 | 5,552,560 |
FNMA, Series 2003-24, Class BF SEQ, VRN, 0.60%, 4/25/11, resets monthly off the 1-month LIBOR plus 0.35% with a cap of 8.00%(1) | 812,737 | 813,472 |
FNMA, Series 2003-29, Class L SEQ, 5.00%, 9/25/30(1) | 640,129 | 653,729 |
FNMA, Series 2003-35, Class KC SEQ, 4.50%, 4/25/17(1) | 541,015 | 550,250 |
FNMA, Series 2003-42, Class FK, VRN, 0.65%, 4/25/11, resets monthly off the 1-month LIBOR plus 0.40% with a cap of 7.50%(1) | 2,022,743 | 2,030,012 |
FNMA, Series 2003-43, Class LF, VRN, 0.60%, 4/25/11, resets monthly off the 1-month LIBOR plus 0.35% with a cap of 8.00%(1) | 2,679,739 | 2,688,401 |
| FNMA, Series 2003-108, Class BE SEQ, 4.00%, 11/25/18 | 2,717,000 | 2,859,555 |
| FNMA, Series 2003-123, Class AY SEQ, 4.00%, 12/25/18 | 6,200,000 | 6,525,482 |
| FNMA, Series 2003-125, Class AY SEQ, 4.00%, 12/25/18 | 5,000,000 | 5,262,763 |
| FNMA, Series 2003-128, Class NG, 4.00%, 1/25/19 | 3,000,000 | 3,167,336 |
| FNMA, Series 2004-17, Class CJ SEQ, 4.00%, 4/25/19 | 7,200,000 | 7,664,337 |
| FNMA, Series 2004-32, Class AY SEQ, 4.00%, 5/25/19 | 4,100,000 | 4,364,117 |
FNMA, Series 2005-53, Class WC SEQ, 5.00%, 8/25/18(1) | 1,095,131 | 1,119,944 |
FNMA, Series 2006-4, Class A SEQ, 6.00%, 11/25/22(1) | 472,950 | 478,580 |
FNMA, Series 2006-77, Class PD, 6.50%, 10/25/30(1) | 504,262 | 510,447 |
| GNMA, Series 2009-61, Class PA, 5.00%, 2/16/32 | 1,149,844 | 1,194,098 |
TOTAL COLLATERALIZEDMORTGAGE OBLIGATIONS(Cost $100,324,101) | 100,579,342 |
U.S. Government Agency Mortgage-Backed Securities(5) — 2.2% |
| ADJUSTABLE-RATE U.S. GOVERNMENT AGENCY MORTGAGE-BACKED SECURITIES — 1.7% |
FHLMC, VRN, 3.125%, 4/1/11(1) | 44,787 | 45,009 |
FHLMC, VRN, 2.32%, 7/1/11(1) | 138,774 | 140,005 |
FHLMC, VRN, 2.76%, 9/1/11(1) | 59,785 | 60,067 |
FHLMC, VRN, 6.34%, 9/1/11(1) | 6,107,257 | 6,427,049 |
FHLMC, VRN, 3.28%, 10/1/11(1) | $ 1,439,224 | $ 1,517,812 |
FNMA, VRN, 2.45%, 4/1/11(1) | 55,277 | 55,369 |
FNMA, VRN, 2.75%, 4/1/11(1) | 31,047 | 32,751 |
FNMA, VRN, 3.13%, 4/1/11(1) | 35,561 | 35,998 |
FNMA, VRN, 3.375%, 4/1/11(1) | 11,500 | 11,843 |
FNMA, VRN, 7.49%, 4/1/11(1) | 8,758 | 9,053 |
FNMA, VRN, 2.33%, 5/1/11(1) | 50,168 | 51,845 |
FNMA, VRN, 3.81%, 5/1/11(1) | 13,655 | 13,680 |
FNMA, VRN, 4.40%, 5/1/11(1) | 145,596 | 146,514 |
FNMA, VRN, 2.32%, 6/1/11(1) | 19,681 | 20,177 |
FNMA, VRN, 1.96%, 7/1/11(1) | 61,726 | 63,761 |
FNMA, VRN, 4.76%, 7/1/11(1) | 29,821 | 30,039 |
FNMA, VRN, 2.07%, 8/1/11(1) | 1,829,579 | 1,900,593 |
FNMA, VRN, 2.38%, 8/1/11(1) | 47,456 | 49,205 |
FNMA, VRN, 2.50%, 8/1/11(1) | 8,977 | 9,057 |
FNMA, VRN, 2.78%, 8/1/11(1) | 13,406 | 13,587 |
FNMA, VRN, 3.68%, 8/1/11(1) | 3,394,324 | 3,551,217 |
FNMA, VRN, 4.14%, 8/1/11(1) | 66,005 | 69,049 |
FNMA, VRN, 2.07%, 9/1/11(1) | 31,368 | 32,242 |
FNMA, VRN, 2.27%, 9/1/11(1) | 163,990 | 169,854 |
FNMA, VRN, 2.48%, 9/1/11(1) | 41,650 | 43,731 |
FNMA, VRN, 2.49%, 9/1/11(1) | 20,251 | 21,422 |
FNMA, VRN, 6.175%, 9/1/11(1) | 5,876 | 5,891 |
FNMA, VRN, 3.65%, 10/1/11(1) | 559,274 | 587,227 |
FNMA, VRN, 3.875%, 1/1/12(1) | 10,836 | 11,153 |
| | Principal Amount/ Shares | Value |
GNMA, VRN, 3.375%, 7/1/11(1) | $ 14,400 | $ 14,980 |
GNMA, VRN, 2.625%, 1/2/12(1) | 19,294 | 19,970 |
GNMA, VRN, 3.375%, 4/2/12(1) | 521 | 544 |
GNMA, VRN, 3.875%, 4/2/12(1) | 72,601 | 75,949 |
| | | 15,236,643 |
| FIXED-RATE U.S. GOVERNMENT AGENCY MORTGAGE-BACKED SECURITIES — 0.5% |
FHLMC, 6.50%, 5/1/11(1) | 2,157 | 2,177 |
FHLMC, 6.50%, 12/1/12(1) | 47,465 | 49,313 |
FHLMC, 6.00%, 2/1/13(1) | 134,454 | 145,374 |
FHLMC, 7.00%, 11/1/13(1) | 10,788 | 11,406 |
FHLMC, 7.00%, 12/1/14(1) | 16,577 | 17,791 |
FHLMC, 6.00%, 1/1/15(1) | 481,043 | 522,157 |
FHLMC, 7.50%, 5/1/16(1) | 190,520 | 208,540 |
FHLMC, 5.50%, 11/1/17(1) | 643,948 | 697,540 |
FNMA, 8.00%, 5/1/12(1) | 6,683 | 7,032 |
FNMA, 6.50%, 1/1/13(1) | 197,836 | 205,667 |
FNMA, 6.50%, 3/1/13(1) | 2,343 | 2,565 |
FNMA, 6.00%, 6/1/13(1) | 23,971 | 26,109 |
FNMA, 6.50%, 6/1/13(1) | 1,117 | 1,223 |
FNMA, 6.00%, 1/1/14(1) | 9,812 | 10,687 |
FNMA, 6.00%, 7/1/14(1) | 82,190 | 89,523 |
FNMA, 5.50%, 4/1/16(1) | 200,102 | 217,068 |
FNMA, 7.00%, 5/1/32(1) | 777,962 | 896,774 |
FNMA, 7.00%, 6/1/32(1) | 77,893 | 89,759 |
FNMA, 7.00%, 6/1/32(1) | 565,140 | 651,450 |
FNMA, 7.00%, 8/1/32(1) | 411,177 | 473,974 |
GNMA, 9.50%, 11/20/19(1) | 8,235 | 9,680 |
| | | 4,335,809 |
TOTAL U.S. GOVERNMENT AGENCY MORTGAGE-BACKED SECURITIES (Cost $18,789,125) | 19,572,452 |
| Temporary Cash Investments — 3.8% |
JPMorgan U.S. Treasury Plus Money Market Fund Agency Shares(1) (Cost $34,203,253) | 34,203,253 | 34,203,253 |
TOTAL INVESTMENT SECURITIES — 99.7% (Cost $893,031,055) | 898,621,537 |
| OTHER ASSETS AND LIABILITIES — 0.3% | 2,750,027 |
| TOTAL NET ASSETS — 100.0% | $901,371,564 |
| Futures Contracts |
| Contracts Purchased | Expiration Date | Underlying Face Amount at Value | Unrealized Gain (Loss) |
| 499 | U.S. Treasury 5-Year Notes | June 2011 | $58,277,742 | $26,154 |
| | | | | |
| Contracts Sold | Expiration Date | Underlying Face Amount at Value | Unrealized Gain (Loss) |
| 574 | U.S. Treasury 2-Year Notes | June 2011 | $125,203,750 | $(46,178) |
Notes to Schedule of Investments
Equivalent = Security whose principal payments are backed by the full faith and credit of the United States
FDIC = Federal Deposit Insurance Corporation
FHLMC = Federal Home Loan Mortgage Corporation
FNMA = Federal National Mortgage Association
GNMA = Government National Mortgage Association
LIBOR = London Interbank Offered Rate
resets = The frequency with which a security’s coupon changes, based on current market conditions or an underlying index. The more frequently a security resets, the less risk the investor is taking that the coupon will vary significantly from current market rates.
SEQ = Sequential Payer
VRN = Variable Rate Note. Interest reset date is indicated. Rate shown is effective at the period end.
| (1) | Security, or a portion thereof, has been segregated for futures contracts. At the period end, the aggregate value of securities pledged was $183,482,000. |
| (2) | Security was purchased under Rule 144A of the Securities Act of 1933 or is a private placement and, unless registered under the Act or exempted from registration, may only be sold to qualified institutional investors. The aggregate value of these securities at the period end was $2,991,294, which represented 0.3% of total net assets. |
| (3) | The rate indicated is the yield to maturity at purchase. |
| (4) | The debt is guaranteed under the Federal Deposit Insurance Corporation’s (FDIC) Temporary Liquidity Guarantee Program and is backed by the full faith and credit of the United States. The expiration date of the FDIC’s guarantee is the earlier of the maturity date of the debt or December 31, 2012. |
| (5) | Final maturity date indicated, unless otherwise noted. |
See Notes to Financial Statements.
Statement of Assets and Liabilities |
| MARCH 31, 2011 | |
| Assets | |
| Investment securities, at value (cost of $893,031,055) | | | $898,621,537 | |
| Cash | | | 19,820 | |
| Receivable for investments sold | | | 187,940 | |
| Receivable for capital shares sold | | | 384,544 | |
| Interest receivable | | | 3,219,316 | |
| | | | 902,433,157 | |
| | | | | |
| Liabilities | | | | |
| Payable for capital shares redeemed | | | 547,363 | |
| Payable for variation margin on futures contracts | | | 59,266 | |
| Accrued management fees | | | 426,028 | |
| Distribution and service fees payable | | | 11,274 | |
| Dividends payable | | | 17,662 | |
| | | | 1,061,593 | |
| | | | | |
| Net Assets | | | $901,371,564 | |
| | | | | |
| Net Assets Consist of: | | | | |
| Capital paid in | | | $898,757,076 | |
| Accumulated net investment loss | | | (17,662 | ) |
| Accumulated net realized loss | | | (2,938,308 | ) |
| Net unrealized appreciation | | | 5,570,458 | |
| | | | $901,371,564 | |
| | | | | | | | | | |
| | | Net assets | | Shares outstanding | | Net asset value per share |
| Investor Class | | | $852,801,685 | | | | 87,654,092 | | | | $9.73 | |
| Institutional Class | | | $131,293 | | | | 13,489 | | | | $9.73 | |
| A Class | | | $47,691,515 | | | | 4,901,278 | | | | $9.73 | * |
| C Class | | | $721,880 | | | | 74,187 | | | | $9.73 | |
| R Class | | | $25,191 | | | | 2,588 | | | | $9.73 | |
*Maximum offering price $9.95 (net asset value divided by 0.9775)
See Notes to Financial Statements.
| YEAR ENDED MARCH 31, 2011 | |
| Investment Income (Loss) | |
| Income: | | | |
| Interest | | | $15,020,988 | |
| | | | | |
| Expenses: | | | | |
| Management fees | | | 5,537,988 | |
| Distribution and service fees: | | | | |
| A Class | | | 186,076 | |
| C Class | | | 4,171 | |
| R Class | | | 127 | |
| Trustees’ fees and expenses | | | 36,030 | |
| Other expenses | | | 36,446 | |
| | | | 5,800,838 | |
| | | | | |
| Net investment income (loss) | | | 9,220,150 | |
| | | | | |
| Realized and Unrealized Gain (Loss) | | | | |
| Net realized gain (loss) on: | | | | |
| Investment transactions | | | 8,099,208 | |
| Futures contract transactions | | | 637,078 | |
| | | | 8,736,286 | |
| | | | | |
| Change in net unrealized appreciation (depreciation) on: | | | | |
| Investments | | | (1,920,693 | ) |
| Futures contracts | | | 155,625 | |
| | | | (1,765,068 | ) |
| | | | | |
| Net realized and unrealized gain (loss) | | | 6,971,218 | |
| | | | | |
| Net Increase (Decrease) in Net Assets Resulting from Operations | | | $16,191,368 | |
See Notes to Financial Statements.
Statement of Changes in Net Assets |
| YEARS ENDED MARCH 31, 2011 AND MARCH 31, 2010 | |
| Increase (Decrease) in Net Assets | | 2011 | | | 2010 | |
| Operations | |
| Net investment income (loss) | | | $9,220,150 | | | | $16,934,408 | |
| Net realized gain (loss) | | | 8,736,286 | | | | 10,919,442 | |
| Change in net unrealized appreciation (depreciation) | | | (1,765,068 | ) | | | (3,412,140 | ) |
| Net increase (decrease) in net assets resulting from operations | | | 16,191,368 | | | | 24,441,710 | |
| | | | | | | | | |
| Distributions to Shareholders | | | | | | | | |
| From net investment income: | | | | | | | | |
| Investor Class | | | (9,118,600 | ) | | | (16,319,090 | ) |
| Institutional Class | | | (728 | ) | | | (27 | ) |
| A Class | | | (548,160 | ) | | | (907,603 | ) |
| C Class | | | (12 | ) | | | (3 | ) |
| R Class | | | (121 | ) | | | (13 | ) |
| From net realized gains: | | | | | | | | |
| Investor Class | | | (4,574,789 | ) | | | — | |
| Institutional Class | | | (680 | ) | | | — | |
| A Class | | | (392,947 | ) | | | — | |
| C Class | | | (3,451 | ) | | | — | |
| R Class | | | (127 | ) | | | — | |
| Decrease in net assets from distributions | | | (14,639,615 | ) | | | (17,226,736 | ) |
| | | | | | | | | |
| Capital Share Transactions | | | | | | | | |
| Net increase (decrease) in net assets from capital share transactions | | | (166,373,061 | ) | | | 22,577,685 | |
| | | | | | | | | |
| Net increase (decrease) in net assets | | | (164,821,308 | ) | | | 29,792,659 | |
| | | | | | | | | |
| Net Assets | | | | | | | | |
| Beginning of period | | | 1,066,192,872 | | | | 1,036,400,213 | |
| End of period | | | $901,371,564 | | | | $1,066,192,872 | |
| | | | | | | | | |
| Accumulated undistributed net investment income (loss) | | | $(17,662 | ) | | | $9,685 | |
See Notes to Financial Statements.
Notes to Financial Statements |
MARCH 31, 2011
1. Organization
American Century Government Income Trust (the trust) is registered under the Investment Company Act of 1940, as amended (the 1940 Act), as an open-end management investment company and is organized as a Massachusetts business trust. Short-Term Government Fund (the fund) is one fund in a series issued by the trust. The fund is diversified as defined under the 1940 Act. The fund’s investment objective is to seek high current income while maintaining safety of principal. The fund pursues its objectives by investing primarily in U.S. government securities, including U.S. Treasury securities and other securities issued or guaranteed by the U.S. government and its agencies and instrumentalities. The fund may also invest in investment-grade debt securities, including debt securities of U.S. companies, and non-U.S. government mortgage-backed, asset-backed and other fixed-income securities.
The fund is authorized to issue the Investor Class, the Institutional Class, the A Class (formerly Advisor Class), the C Class and the R Class. The A Class may incur an initial sales charge. The A Class and C Class may be subject to a contingent deferred sales charge. The share classes differ principally in their respective sales charges and distribution and shareholder servicing expenses and arrangements. The Institutional Class is made available to institutional shareholders or through financial intermediaries whose clients do not require the same level of shareholder and administrative services as shareholders of other classes. As a result, the Institutional Class is charged a lower unified management fee. Sale of the Institutional Class, C Class and R Class commenced on March 1, 2010.
2. Significant Accounting Policies
The following is a summary of significant accounting policies consistently followed by the fund in preparation of its financial statements. The financial statements are prepared in conformity with accounting principles generally accepted in the United States of America, which may require management to make certain estimates and assumptions at the date of the financial statements. Actual results could differ from these estimates.
Investment Valuations — The fund determines the fair value of its investments and computes its net asset value per share as of the close of regular trading (usually 4 p.m. Eastern time) on the New York Stock Exchange (NYSE) on each day the NYSE is open.
Debt securities maturing in greater than 60 days at the time of purchase are valued at the evaluated mean as provided by independent pricing services or at the mean of the most recent bid and asked prices as provided by investment dealers. Debt securities maturing within 60 days at the time of purchase may be valued at cost, plus or minus any amortized discount or premium or at the evaluated mean as provided by an independent pricing service. Evaluated mean prices are commonly derived through utilization of market models, which may consider, among other factors, trade data, quotations from dealers and active market makers, relevant yield curve and spread data, related sector levels, creditworthiness, and other relevant market information on the same or comparable securities.
Investments in open-end management investment companies are valued at the reported net asset value per share. Repurchase agreements are valued at cost. Exchange-traded futures contracts are valued at the settlement price as provided by the appropriate clearing corporation.
If the fund determines that the market price for a portfolio security is not readily available or the valuation methods mentioned above do not reflect a security’s fair value, such security is valued as determined in good faith by the Board of Trustees or its designee, in accordance with procedures adopted by the Board of Trustees. Circumstances that may cause the fund to use these procedures to value a security include, but are not limited to: a security has been declared in default; trading in a security has been halted during the trading day; there is a foreign market holiday and no trading occurred; or an event occurred between the close of a foreign exchange and the NYSE that may affect the value of a security.
Security Transactions — Security transactions are accounted for as of the trade date. Net realized gains and losses are determined on the identified cost basis, which is also used for federal income tax purposes.
Investment Income — Interest income is recorded on the accrual basis and includes paydown gain (loss) and accretion of discounts and amortization of premiums.
Repurchase Agreements — The fund may enter into repurchase agreements with institutions that American Century Investment Management, Inc. (ACIM) (the investment advisor) has determined are creditworthy pursuant to criteria adopted by the Board of Trustees. The fund requires that the collateral, represented by securities, received in a repurchase transaction be transferred to the custodian in a manner sufficient to enable the fund to obtain those securities in the event of a default under the repurchase agreement. ACIM monitors, on a daily basis, the securities transferred to ensure the value, including accrued interest, of the securities under each repurchase agreement is equal to or greater than amounts owed to the fund under each repurchase agreement.
Joint Trading Account — Pursuant to an Exemptive Order issued by the Securities and Exchange Commission, the fund, along with certain other funds in the American Century Investments family of funds, may transfer uninvested cash balances into a joint trading account. These balances are invested in one or more repurchase agreements that are collateralized by U.S. Treasury or Agency obligations.
Income Tax Status — It is the fund’s policy to distribute substantially all net investment income and net realized gains to shareholders and to otherwise qualify as a regulated investment company under provisions of the Internal Revenue Code. The fund is no longer subject to examination by tax authorities for years prior to 2008. At this time, management believes there are no uncertain tax positions which, based on their technical merit, would not be sustained upon examination and for which it is reasonably possible that the total amounts of unrecognized tax benefits will significantly change in the next twelve months. Accordingly, no provision has been made for federal or state income taxes.
Multiple Class — All shares of the fund represent an equal pro rata interest in the net assets of the class to which such shares belong, and have identical voting, dividend, liquidation and other rights and the same terms and conditions, except for class specific expenses and exclusive rights to vote on matters affecting only individual classes. Income, non-class specific expenses, and realized and unrealized capital gains and losses of the fund are allocated to each class of shares based on their relative net assets.
Distributions to Shareholders — Distributions from net investment income are declared daily and paid monthly. Distributions from net realized gains, if any, are generally declared and paid annually.
Indemnifications — Under the trust’s organizational documents, its officers and trustees are indemnified against certain liabilities arising out of the performance of their duties to the fund. In addition, in the normal course of business, the fund enters into contracts that provide general indemnifications. The maximum exposure under these arrangements is unknown as this would involve future claims that may be made against a fund. The risk of material loss from such claims is considered by management to be remote.
3. Fees and Transactions with Related Parties
Management Fees — The trust has entered into a management agreement with ACIM, under which ACIM provides the fund with investment advisory and management services in exchange for a single, unified management fee (the fee) per class. The agreement provides that all expenses of managing and operating the fund, except distribution and service fees, brokerage expenses, taxes, interest, fees and expenses of the independent trustees (including legal counsel fees), and extraordinary expenses, will be paid by ACIM. The fee is computed and accrued daily based on each class’s daily net assets and paid monthly in arrears. The fee consists of (1) an Investment Category Fee based on the daily net assets of the fund and certain other accounts managed by the investment advisor that are in the same broad investment category as the fund and (2) a Complex Fee based on the assets of all the funds in the American Century Investments family of funds. The rates for the Investment Category Fee range from 0.2425% to 0.3600%. The rates for the Complex Fee range from 0.2500% to 0.3100% for the Investor Class, A Class, C Class and R Class. The Institutional Class is 0.2000% less at each point within the Complex Fee range. The effective annual management fee for each class for the year ended March 31, 2011, was 0.55% for the Investor Class, A Class, C Class and R Class and 0.35% for the Institutional Class.
Distribution and Service Fees — The Board of Trustees has adopted a separate Master Distribution and Individual Shareholder Services Plan for each of the A Class, C Class and R Class (collectively the plans), pursuant to Rule 12b-1 of the 1940 Act. The plans provide that the A Class will pay American Century Investment Services, Inc. (ACIS) an annual distribution and service fee of 0.25%. The plans provide that the C Class will pay ACIS an annual distribution and service fee of 1.00%, of which 0.25% is paid for individual shareholder services and 0.75% is paid for distribution services. The plans provide that the R Class will pay ACIS an annual distribution and service fee of 0.50%. The fees are computed and accrued daily based on each class’s daily net assets and paid monthly in arrears. The fees are used to pay financial intermediaries for distribution and individual shareholder services. Fees incurred under the plans during the year ended March 31, 2011 are detailed in the Statement of Operations.
Related Parties — Certain officers and trustees of the trust are also officers and/or directors of American Century Companies, Inc. (ACC), the parent of the trust’s investment advisor, ACIM, the distributor of the trust, ACIS, and the trust’s transfer agent, American Century Services, LLC. Directors of these entities are officers and directors of other entities and those other entities own 21% of the outstanding shares of the fund.
The fund is eligible to invest in a money market fund for temporary purposes, which is managed by J.P. Morgan Investment Management, Inc. (JPMIM). The fund has a securities lending agreement with JPMorgan Chase Bank (JPMCB) and a mutual funds services agreement with J.P. Morgan Investor Services Co. (JPMIS). JPMCB is a custodian of the fund. JPMIM, JPMIS and JPMCB are wholly owned subsidiaries of JPMorgan Chase & Co. (JPM). JPM is an equity investor in ACC.
4. Investment Transactions
Purchases of investment securities, excluding short-term investments, for the year ended March 31, 2011, were $709,668,941, all of which are U.S. Treasury and Government Agency obligations.
Sales of investment securities, excluding short-term investments, for the year ended March 31, 2011, totaled $881,836,649, of which $876,706,018 represented U.S. Treasury and Government Agency obligations.
5. Capital Share Transactions
Transactions in shares of the fund were as follows (unlimited number of shares authorized):
| | | | | | | |
| | | Year ended March 31, 2011 | | | Year ended March 31, 2010(1) | |
| | | Shares | | | Amount | | | Shares | | | Amount | |
| Investor Class | | | | | | | | | | | | |
| Sold | | | 26,161,229 | | | | $256,238,820 | | | | 48,506,544 | | | | $470,491,702 | |
| Issued in reinvestment of distributions | | | 1,366,427 | | | | 13,369,692 | | | | 1,643,435 | | | | 15,953,799 | |
| Redeemed | | | (41,847,190 | ) | | | (409,632,637 | ) | | | (48,709,652 | ) | | | (472,955,017 | ) |
| | | | (14,319,534 | ) | | | (140,024,125 | ) | | | 1,440,327 | | | | 13,490,484 | |
| Institutional Class | | | | | | | | | | | | | | | | |
| Sold | | | 12,838 | | | | 126,250 | | | | 2,561 | | | | 25,000 | |
| Issued in reinvestment of distributions | | | 144 | | | | 1,408 | | | | 3 | | | | 27 | |
| Redeemed | | | (2,057 | ) | | | (20,061 | ) | | | — | | | | — | |
| | | | 10,925 | | | | 107,597 | | | | 2,564 | | | | 25,027 | |
| A Class | | | | | | | | | | | | | | | | |
| Sold | | | 4,135,632 | | | | 40,464,826 | | | | 9,047,645 | | | | 87,928,437 | |
| Issued in reinvestment of distributions | | | 94,416 | | | | 923,788 | | | | 91,030 | | | | 883,746 | |
| Redeemed | | | (7,006,181 | ) | | | (68,549,978 | ) | | | (8,206,772 | ) | | | (79,800,025 | ) |
| | | | (2,776,133 | ) | | | (27,161,364 | ) | | | 931,903 | | | | 9,012,158 | |
| C Class | | | | | | | | | | | | | | | | |
| Sold | | | 98,412 | | | | 966,414 | | | | 2,562 | | | | 25,000 | |
| Issued in reinvestment of distributions | | | 342 | | | | 3,335 | | | | — | (2) | | | 3 | |
| Redeemed | | | (27,129 | ) | | | (265,166 | ) | | | — | | | | — | |
| | | | 71,625 | | | | 704,583 | | | | 2,562 | | | | 25,003 | |
| R Class | | | | | | | | | | | | | | | | |
| Sold | | | — | | | | — | | | | 2,562 | | | | 25,000 | |
| Issued in reinvestment of distributions | | | 25 | | | | 248 | | | | 1 | | | | 13 | |
| | | | 25 | | | | 248 | | | | 2,563 | | | | 25,013 | |
| Net increase (decrease) | | | (17,013,092 | ) | | | $(166,373,061 | ) | | | 2,379,919 | | | | $22,577,685 | |
| (1) | March 1, 2010 (commencement of sale) through March 31, 2010 for the Institutional Class, C Class and R Class. |
| (2) | Share amount was less than 0.5. |
6. Fair Value Measurements
The fund’s securities valuation process is based on several considerations and may use multiple inputs to determine the fair value of the positions held by the fund. In conformity with accounting principles generally accepted in the United States of America, the inputs used to determine a valuation are classified into three broad levels as follows:
| • | Level 1 valuation inputs consist of unadjusted quoted prices in an active market for identical securities; |
| • | Level 2 valuation inputs consist of direct or indirect observable market data (including quoted prices for similar securities, evaluations of subsequent market events, interest rates, prepayment speeds, credit risk, etc.); or |
| • | Level 3 valuation inputs consist of unobservable data (including a fund’s own assumptions). |
The level classification is based on the lowest level input that is significant to the fair valuation measurement. The valuation inputs are not necessarily an indication of the risks associated with investing in these securities or other financial instruments.
The following is a summary of the level classifications as of period end. The Schedule of Investments provides additional information on the fund’s portfolio holdings.
| | | | | | | | | | |
| | | Level 1 | | Level 2 | | Level 3 |
| Investment Securities | | | | | | | | | |
| U.S. Treasury Securities | | | — | | | | $491,812,492 | | | | — | |
| U.S. Government Agency Securities and Equivalents | | | — | | | | 252,453,998 | | | | — | |
| Collateralized Mortgage Obligations | | | — | | | | 100,579,342 | | | | — | |
| U.S. Government Agency Mortgage-Backed Securities | | | — | | | | 19,572,452 | | | | — | |
| Temporary Cash Investments | | | $34,203,253 | | | | — | | | | — | |
| Total Value of Investment Securities | | | $34,203,253 | | | | $864,418,284 | | | | — | |
| | | | | | | | | | | | | |
| Other Financial Instruments | | | | | | | | | | | | |
| Total Unrealized Gain (Loss) on Futures Contracts | | | $(20,024 | ) | | | — | | | | — | |
7. Derivative Instruments
Interest Rate Risk — The fund is subject to interest rate risk in the normal course of pursuing its investment objectives. The value of bonds generally declines as interest rates rise. A fund may enter into futures contracts based on a bond index or a specific underlying security. A fund may purchase futures contracts to gain exposure to increases in market value or sell futures contracts to protect against a decline in market value. Upon entering into a futures contract, a fund will segregate cash, cash equivalents or other appropriate liquid securities on its records in amounts sufficient to meet requirements. Subsequent payments (variation margin) are made or received daily, in cash, by a fund. The variation margin is equal to the daily change in the contract value and is recorded as unrealized gains and losses. A fund recognizes a realized gain or loss when the futures contract is closed or expires. Net realized and unrealized gains or losses occurring during the holding period of futures contracts are a component of net realized gain (loss) on futures contract transactions and change in net unrealized appreciation (depreciation) on futures contracts, respectively. One of the risks of entering into futures contracts is the possibility that the change in value of the contract may not correlate with the changes in value of the underlying securities. The interest rate risk derivative instruments held at period end as disclosed on the Schedule of Investments are indicative of the fund’s typical volume during the period.
The value of interest rate risk derivative instruments as of March 31, 2011, is disclosed on the Statement of Assets and Liabilities as a liability of $59,266 in payable for variation margin on futures contracts. For the year ended March 31, 2011, the effect of interest rate risk derivative instruments on the Statement of Operations was $637,078 in net realized gain (loss) on futures contract transactions and $155,625 in change in net unrealized appreciation (depreciation) on futures contracts.
8. Federal Tax Information
The tax character of distributions paid during the years ended March 31, 2011 and March 31, 2010 were as follows:
| | | | | | | |
| | | 2011 | | 2010 |
| Distributions Paid From | | | | | | |
| Ordinary income | | | $14,639,615 | | | | $17,226,736 | |
| Long-term capital gains | | | — | | | | — | |
The book-basis character of distributions made during the year from net investment income or net realized gains may differ from their ultimate characterization for federal income tax purposes. These differences reflect the differing character of certain income items and net realized gains and losses for financial statement and tax purposes, and may result in reclassification among certain capital accounts on the financial statements.
As of March 31, 2011, the federal tax cost of investments and the components of distributable earnings on a tax-basis were as follows:
| | | | |
| Federal tax cost of investments | | | $893,052,576 | |
| Gross tax appreciation of investments | | | $7,219,907 | |
| Gross tax depreciation of investments | | | (1,650,946 | ) |
| Net tax appreciation (depreciation) of investments | | | $5,568,961 | |
| Other book-to-tax adjustments | | | $(2,017,529 | ) |
| Net tax appreciation (depreciation) | | | $3,551,432 | |
| Undistributed ordinary income | | | — | |
| Accumulated capital losses | | | $(188,638 | ) |
| Capital loss deferral | | | $(748,306 | ) |
The difference between book-basis and tax-basis cost and unrealized appreciation (depreciation) is attributable primarily to the tax deferral of losses on wash sales and the realization for tax purposes of unrealized gains (losses) on futures contracts. Other book-to-tax adjustments are attributable primarily to the tax deferral of losses on straddle positions.
The accumulated capital losses represent net capital loss carryovers that may be used to offset future realized capital gains for federal income tax purposes. Future capital loss carryover utilization in any given year may be subject to Internal Revenue Code limitations. Capital loss carryovers expire in 2015.
The capital loss deferral represents net capital losses incurred in the five-month period ended March 31, 2011. The fund has elected to treat such losses as having been incurred in the following fiscal year for federal income tax purposes.
On December 22, 2010, the Regulated Investment Company Modernization Act of 2010 (the “Act”) was enacted, which changed various technical rules governing the tax treatment of regulated investment companies. The changes are generally effective for taxable years beginning after the date of enactment. Under the Act, the fund will be permitted to carry forward capital losses incurred in taxable years beginning after the date of enactment for an unlimited period. However, any losses incurred during those future taxable years will be required to be utilized prior to the losses incurred in pre-enactment taxable years, which carry an expiration date. As a result of this ordering rule, pre-enactment capital loss carryforwards may be more likely to expire unused.
| Investor Class | |
| For a Share Outstanding Throughout the Years Ended March 31 | |
| | | 2011 | | | 2010 | | | 2009 | | | 2008 | | | 2007 | |
| Per-Share Data | |
| Net Asset Value, Beginning of Period | | | $9.72 | | | | $9.66 | | | | $9.65 | | | | $9.37 | | | | $9.32 | |
| Income From Investment Operations | | | | | | | | | | | | | | | | | | | | |
Net Investment Income (Loss)(1) | | | 0.09 | | | | 0.15 | | | | 0.29 | | | | 0.40 | | | | 0.40 | |
| Net Realized and Unrealized Gain (Loss) | | | 0.07 | | | | 0.07 | | | | 0.01 | | | | 0.29 | | | | 0.06 | |
| Total From Investment Operations | | | 0.16 | | | | 0.22 | | | | 0.30 | | | | 0.69 | | | | 0.46 | |
| Distributions | | | | | | | | | | | | | | | | | | | | |
| From Net Investment Income | | | (0.10 | ) | | | (0.16 | ) | | | (0.29 | ) | | | (0.41 | ) | | | (0.41 | ) |
| From Net Realized Gains | | | (0.05 | ) | | | — | | | | — | | | | — | | | | — | |
| Total Distributions | | | (0.15 | ) | | | (0.16 | ) | | | (0.29 | ) | | | (0.41 | ) | | | (0.41 | ) |
| Net Asset Value, End of Period | | | $9.73 | | | | $9.72 | | | | $9.66 | | | | $9.65 | | | | $9.37 | |
| | | | | | | | | | | | | | | | | | | | | |
Total Return(2) | | | 1.60 | % | | | 2.25 | % | | | 3.17 | % | | | 7.50 | % | | | 5.02 | % |
| | | | | | | | | | | | | | | | | | | | | |
| Ratios/Supplemental Data | |
Ratio of Operating Expenses to Average Net Assets | | | 0.56 | % | | | 0.56 | % | | | 0.57 | % | | | 0.57 | % | | | 0.57 | % |
Ratio of Net Investment Income (Loss) to Average Net Assets | | | 0.94 | % | | | 1.57 | % | | | 2.99 | % | | | 4.23 | % | | | 4.34 | % |
| Portfolio Turnover Rate | | | 75 | % | | | 158 | % | | | 142 | % | | | 148 | % | | | 210 | % |
| Net Assets, End of Period (in thousands) | | | $852,802 | | | | $991,464 | | | | $971,230 | | | | $1,105,947 | | | | $937,029 | |
| (1) | Computed using average shares outstanding throughout the period. |
| (2) | Total returns are calculated based on the net asset value of the last business day. Total returns for periods less than one year are not annualized. |
See Notes to Financial Statements.
| Institutional Class | |
| For a Share Outstanding Throughout the Years Ended March 31 (except as noted) | |
| | | 2011 | | | 2010(1) | |
| Per-Share Data | |
| Net Asset Value, Beginning of Period | | | $9.73 | | | | $9.76 | |
| Income From Investment Operations | | | | | | | | |
Net Investment Income (Loss)(2) | | | 0.11 | | | | 0.01 | |
| Net Realized and Unrealized Gain (Loss) | | | 0.06 | | | | (0.03 | ) |
| Total From Investment Operations | | | 0.17 | | | | (0.02 | ) |
| Distributions | | | | | | | | |
| From Net Investment Income | | | (0.12 | ) | | | (0.01 | ) |
| From Net Realized Gains | | | (0.05 | ) | | | — | |
| Total Distributions | | | (0.17 | ) | | | (0.01 | ) |
| Net Asset Value, End of Period | | | $9.73 | | | | $9.73 | |
| | | | | | | | | |
Total Return(3) | | | 1.70 | % | | | (0.20 | )% |
| | | | | | | | | |
| Ratios/Supplemental Data | |
| Ratio of Operating Expenses to Average Net Assets | | | 0.36 | % | | | 0.36 | %(4) |
| Ratio of Net Investment Income (Loss) to Average Net Assets | | | 1.14 | % | | | 1.33 | %(4) |
| Portfolio Turnover Rate | | | 75 | % | | | 158 | %(5) |
| Net Assets, End of Period (in thousands) | | | $131 | | | | $25 | |
| (1) | March 1, 2010 (commencement of sale) through March 31, 2010. |
| (2) | Computed using average shares outstanding throughout the period. |
| (3) | Total returns are calculated based on the net asset value of the last business day. Total returns for periods less than one year are not annualized. |
| (5) | Portfolio turnover is calculated at the fund level. Percentage indicated was calculated for the year ended March 31, 2010. |
See Notes to Financial Statements.
A Class(1) | |
| For a Share Outstanding Throughout the Years Ended March 31 | |
| | | 2011 | | | 2010 | | | 2009 | | | 2008 | | | 2007 | |
| Per-Share Data | |
| Net Asset Value, Beginning of Period | | | $9.72 | | | | $9.66 | | | | $9.65 | | | | $9.37 | | | | $9.32 | |
| Income From Investment Operations | | | | | | | | | | | | | | | | | | | | |
Net Investment Income (Loss)(2) | | | 0.07 | | | | 0.13 | | | | 0.24 | | | | 0.38 | | | | 0.38 | |
| Net Realized and Unrealized Gain (Loss) | | | 0.06 | | | | 0.06 | | | | 0.03 | | | | 0.28 | | | | 0.05 | |
| Total From Investment Operations | | | 0.13 | | | | 0.19 | | | | 0.27 | | | | 0.66 | | | | 0.43 | |
| Distributions | | | | | | | | | | | | | | | | | | | | |
| From Net Investment Income | | | (0.07 | ) | | | (0.13 | ) | | | (0.26 | ) | | | (0.38 | ) | | | (0.38 | ) |
| From Net Realized Gains | | | (0.05 | ) | | | — | | | | — | | | | — | | | | — | |
| Total Distributions | | | (0.12 | ) | | | (0.13 | ) | | | (0.26 | ) | | | (0.38 | ) | | | (0.38 | ) |
| Net Asset Value, End of Period | | | $9.73 | | | | $9.72 | | | | $9.66 | | | | $9.65 | | | | $9.37 | |
| | | | | | | | | | | | | | | | | | | | | |
Total Return(3) | | | 1.35 | % | | | 2.00 | % | | | 2.91 | % | | | 7.23 | % | | | 4.76 | % |
| | | | | | | | | | | | | | | | | | | | | |
| Ratios/Supplemental Data | |
Ratio of Operating Expenses to Average Net Assets | | | 0.81 | % | | | 0.81 | % | | | 0.82 | % | | | 0.82 | % | | | 0.82 | % |
Ratio of Net Investment Income (Loss) to Average Net Assets | | | 0.69 | % | | | 1.32 | % | | | 2.74 | % | | | 3.98 | % | | | 4.09 | % |
| Portfolio Turnover Rate | | | 75 | % | | | 158 | % | | | 142 | % | | | 148 | % | | | 210 | % |
| Net Assets, End of Period (in thousands) | | | $47,692 | | | | $74,654 | | | | $65,170 | | | | $32,379 | | | | $27,541 | |
| (1) | Prior to March 1, 2010, the A Class was referred to as the Advisor Class. |
| (2) | Computed using average shares outstanding throughout the period. |
| (3) | Total returns are calculated based on the net asset value of the last business day and do not reflect applicable sales charges. Total returns for periods less than one year are not annualized. |
See Notes to Financial Statements.
| C Class | |
| For a Share Outstanding Throughout the Years Ended March 31 (except as noted) | |
| | | 2011 | | | 2010(1) | |
| Per-Share Data | |
| Net Asset Value, Beginning of Period | | | $9.73 | | | | $9.76 | |
| Income From Investment Operations | | | | | | | | |
Net Investment Income (Loss)(2) | | | (0.01 | ) | | | — | (3) |
| Net Realized and Unrealized Gain (Loss) | | | 0.06 | | | | (0.03 | ) |
| Total From Investment Operations | | | 0.05 | | | | (0.03 | ) |
| Distributions | | | | | | | | |
| From Net Investment Income | | | — | (3) | | | — | (3) |
| From Net Realized Gains | | | (0.05 | ) | | | — | |
| Total Distributions | | | (0.05 | ) | | | — | |
| Net Asset Value, End of Period | | | $9.73 | | | | $9.73 | |
| | | | | | | | | |
Total Return(4) | | | 0.53 | % | | | (0.30 | )% |
| | | | | | | | | |
| Ratios/Supplemental Data | |
| Ratio of Operating Expenses to Average Net Assets | | | 1.56 | % | | | 1.56 | %(5) |
| Ratio of Net Investment Income (Loss) to Average Net Assets | | | (0.06 | )% | | | 0.13 | %(5) |
| Portfolio Turnover Rate | | | 75 | % | | | 158 | %(6) |
| Net Assets, End of Period (in thousands) | | | $722 | | | | $25 | |
| (1) | March 1, 2010 (commencement of sale) through March 31, 2010. |
| (2) | Computed using average shares outstanding throughout the period. |
| (3) | Per-share amount was less than $0.005. |
| (4) | Total returns are calculated based on the net asset value of the last business day and do not reflect applicable sales charges. Total returns for periods less than one year are not annualized. |
| (6) | Portfolio turnover is calculated at the fund level. Percentage indicated was calculated for the year ended March 31, 2010. |
See Notes to Financial Statements.
| R Class | |
| For a Share Outstanding Throughout the Years Ended March 31 (except as noted) | |
| | | 2011 | | | 2010(1) | |
| Per-Share Data | |
| Net Asset Value, Beginning of Period | | | $9.73 | | | | $9.76 | |
| Income From Investment Operations | | | | | | | | |
Net Investment Income (Loss)(2) | | | 0.04 | | | | 0.01 | |
| Net Realized and Unrealized Gain (Loss) | | | 0.06 | | | | (0.03 | ) |
| Total From Investment Operations | | | 0.10 | | | | (0.02 | ) |
| Distributions | | | | | | | | |
| From Net Investment Income | | | (0.05 | ) | | | (0.01 | ) |
| From Net Realized Gains | | | (0.05 | ) | | | — | |
| Total Distributions | | | (0.10 | ) | | | (0.01 | ) |
| Net Asset Value, End of Period | | | $9.73 | | | | $9.73 | |
| | | | | | | | | |
Total Return(3) | | | 0.99 | % | | | (0.26 | )% |
| | | | | | | | | |
| Ratios/Supplemental Data | |
| Ratio of Operating Expenses to Average Net Assets | | | 1.06 | % | | | 1.06 | %(4) |
| Ratio of Net Investment Income (Loss) to Average Net Assets | | | 0.44 | % | | | 0.63 | %(4) |
| Portfolio Turnover Rate | | | 75 | % | | | 158 | %(5) |
| Net Assets, End of Period (in thousands) | | | $25 | | | | $25 | |
| (1) | March 1, 2010 (commencement of sale) through March 31, 2010. |
| (2) | Computed using average shares outstanding throughout the period. |
| (3) | Total returns are calculated based on the net asset value of the last business day. Total returns for periods less than one year are not annualized. |
| (5) | Portfolio turnover is calculated at the fund level. Percentage indicated was calculated for the year ended March 31, 2010. |
See Notes to Financial Statements.
Report of Independent Registered Public Accounting Firm |
To the Trustees of the American Century Government Income Trust and Shareholders of the Short-Term Government Fund:
In our opinion, the accompanying statement of assets and liabilities, including the schedule of investments, and the related statements of operations and of changes in net assets and the financial highlights present fairly, in all material respects, the financial position of the Short-Term Government Fund (one of the five funds comprising the American Century Government Income Trust, hereafter referred to as the “Fund”) at March 31, 2011, the results of its operations for the year then ended, the changes in its net assets for each of the two years in the period then ended and the financial highlights for each of the periods presented, in conformity with accounting principles generally accepted in the United States of America. These financial statements and financial highlights (hereafter referred to as “financial statements”) are the responsibility of the Fund’s management; our responsibility is to express an opinion on these financial statements based on our audits. We conducted our audits of these financial statements in accordance with the standards of the Public Company Accounting Oversight Board (United States). Those standards require that we plan and perform the audit to obtain reasonable assurance about whether the financial statements are free of material misstatement. An audit includes examining, on a test basis, evidence supporting the amounts and disclosures in the financial statements, assessing the accounting principles used and significant estimates made by management, and evaluating the overall financial statement presentation. We believe that our audits, which included confirmation of securities at March 31, 2011 by correspondence with the custodian and brokers, provide a reasonable basis for our opinion.
PricewaterhouseCoopers LLP
Kansas City, Missouri
May 19, 2011
A special meeting of shareholders was held on June 16, 2010, to vote on the following proposals. Each proposal received the required number of votes and was adopted. A summary of voting results is listed below each proposal.
Proposal 1:
To elect one Trustee to the Board of Trustees of American Century Government Income Trust (the proposal was voted on by all shareholders of funds issued by American Century Government Income Trust):
| | | |
| Frederick L.A. Grauer | For: | 6,878,868,575 |
| | Withhold: | 268,743,465 |
| | Abstain: | 0 |
| | Broker Non-Vote: | 0 |
The other trustees whose term of office continued after the meeting include Jonathan S. Thomas, John Freidenrich, Ronald J. Gilson, Peter F. Pervere, Myron S. Scholes, and John B. Shoven.
Proposal 2:
To approve a management agreement between the fund and American Century Investment Management, Inc.:
| | | |
| Investor and A Classes | For: | 708,791,650 |
| | Against: | 5,985,588 |
| | Abstain: | 13,761,543 |
| | Broker Non-Vote: | 166,755,267 |
The individuals listed below serve as trustees of the fund. Each trustee will continue to serve in this capacity until death, retirement, resignation or removal from office. The mandatory retirement age for trustees who are not “interested persons,” as that term is defined in the Investment Company Act (independent trustees), is 73. However, the mandatory retirement age may be extended for a period not to exceed two years with the approval of the remaining independent trustees.
Mr. Thomas is the only trustee who is an “interested person” because he currently serves as President and Chief Executive Officer of American Century Companies, Inc. (ACC), the parent company of American Century Investment Management, Inc. (ACIM or the advisor).
The other trustees (more than three-fourths of the total number) are independent; that is, they have never been employees, directors or officers of, and have no financial interest in, ACC or any of its wholly owned, direct or indirect, subsidiaries, including ACIM, American Century Investment Services, Inc. (ACIS) and American Century Services, LLC (ACS). The trustees serve in this capacity for eight (in the case of Mr. Thomas, 15) registered investment companies in the American Century Investments family of funds.
The following presents additional information about the trustees. The mailing address for each trustee, other than Mr. Thomas, is 1665 Charleston Road, Mountain View, California 94043. The mailing address for Mr. Thomas is 4500 Main Street, Kansas City, Missouri 64111.
| | | | | | |
Name (Year of Birth) | Position(s) Held with Funds | Length of Time Served | Principal Occupation(s) During Past 5 Years | Number of American Century Portfolios Overseen by Trustee | Other Directorships Held During Past 5 Years |
| Independent Trustees |
Tanya S. Beder (1955) | Trustee | Since 2011 | Chairman, SBCC Group Inc. (investment advisory services) (2006 to present); Fellow in Practice, International Center for Finance, Yale University School of Management (1985 to present); Chief Executive Officer, Tribeca Global Management LLC (2004 to 2006) | 40 | None |
John Freidenrich (1937) | Trustee | Since 2005 | Founder, Member and Manager, Regis Management Company, LLC (investment management firm) (April 2004 to present) | 40 | None |
Ronald J. Gilson (1946) | Trustee and Chairman of the Board | Since 1995 | Charles J. Meyers Professor of Law and Business, Stanford Law School (1979 to present); Marc and Eva Stern Professor of Law and Business, Columbia University School of Law (1992 to present) | 40 | None |
| | | | | | |
Name (Year of Birth) | Position(s) Held with Funds | Length of Time Served | Principal Occupation(s) During Past 5 Years | Number of American Century Portfolios Overseen by Trustee | Other Directorships Held During Past 5 Years |
| Independent Trustees |
Frederick L. A. Grauer (1946) | Trustee | Since 2008 | Senior Advisor, BlackRock, Inc. (investment management firm) (2010 to 2011); Senior Advisor, Barclays Global Investors (investment management firm) (2003 to 2009) | 40 | None |
Peter F. Pervere (1947) | Trustee | Since 2007 | Retired | 40 | Intraware, Inc. (2003 to 2009) |
Myron S. Scholes (1941) | Trustee | Since 1980 | Chairman, Platinum Grove Asset Management, L.P. (asset manager) (1999 to 2009); Frank E. Buck Professor of Finance-Emeritus, Stanford Graduate School of Business (1996 to present) | 40 | Dimensional Fund Advisors (investment advisor); CME Group, Inc. (futures and options exchange) |
John B. Shoven (1947) | Trustee | Since 2002 | Professor of Economics, Stanford University (1973 to present) | 40 | Cadence Design Systems; Exponent; Financial Engines; Watson Wyatt Worldwide (2002 to 2006) |
| |
| Interested Trustee |
Jonathan S. Thomas (1963) | Trustee and President | Since 2007 | President and Chief Executive Officer, ACC (March 2007 to present); Chief Administrative Officer, ACC (February 2006 to February 2007); Executive Vice President, ACC (November 2005 to February 2007). Also serves as: Chief Executive Officer and Manager, ACS; Executive Vice President, ACIM; Director, ACC, ACIM and other ACC subsidiaries | 104 | None |
Officers
The following table presents certain information about the executive officers of the fund. Each officer serves as an officer for each of the 15 investment companies in the American Century family of funds, unless otherwise noted. No officer is compensated for his or her service as an officer of the fund. The listed officers are interested persons of the fund and are appointed or re-appointed on an annual basis. The mailing address for each of the officers listed below is 4500 Main Street, Kansas City, Missouri 64111.
| | | |
Name (Year of Birth) | Offices with the Funds | Principal Occupation(s) During the Past Five Years |
| Officers |
Jonathan S. Thomas (1963) | Trustee and President since 2007 | President and Chief Executive Officer, ACC (March 2007 to present); Chief Administrative Officer, ACC (February 2006 to February 2007); Executive Vice President, ACC (November 2005 to February 2007). Also serves as: Chief Executive Officer and Manager, ACS; Executive Vice President, ACIM; Director, ACC, ACIM and other ACC subsidiaries |
Barry Fink (1955) | Executive Vice President since 2007 | Chief Operating Officer and Executive Vice President, ACC (September 2007 to present); President, ACS (October 2007 to present); Managing Director, Morgan Stanley (2000 to 2007); Global General Counsel, Morgan Stanley (2000 to 2006). Also serves as: Manager, ACS and Director, ACC and certain ACC subsidiaries |
Maryanne L. Roepke (1956) | Chief Compliance Officer since 2006 and Senior Vice President since 2000 | Chief Compliance Officer, American Century funds, ACIM and ACS (August 2006 to present); Assistant Treasurer, ACC (January 1995 to August 2006); and Treasurer and Chief Financial Officer, various American Century funds (July 2000 to August 2006). Also serves as: Senior Vice President, ACS |
Charles A. Etherington (1957) | General Counsel since 2007 and Senior Vice President since 2006 | Attorney, ACC (February 1994 to present); Vice President, ACC (November 2005 to present), General Counsel, ACC (March 2007 to present); Also serves as General Counsel, ACIM, ACS, ACIS and other ACC subsidiaries; and Senior Vice President, ACIM and ACS |
Robert J. Leach (1966) | Vice President, Treasurer and Chief Financial Officer since 2006 | Vice President, ACS (February 2000 to present); and Controller, various American Century funds (1997 to September 2006) |
David H. Reinmiller (1963) | Vice President since 2001 | Attorney, ACC (January 1994 to present); Associate General Counsel, ACC (January 2001 to present); Chief Compliance Officer, American Century funds and ACIM (January 2001 to February 2005). Also serves as Vice President, ACIM and ACS |
Ward D. Stauffer (1960) | Secretary since 2005 | Attorney, ACC (June 2003 to present) |
The Statement of Additional Information has additional information about the fund’s trustees and is available without charge, upon request, by calling 1-800-345-2021.
Retirement Account Information
As required by law, distributions you receive from certain IRAs, or 403(b), 457 and qualified plans are subject to federal income tax withholding, unless you elect not to have withholding apply. Tax will be withheld on the total amount withdrawn even though you may be receiving amounts that are not subject to withholding, such as nondeductible contributions. In such case, excess amounts of withholding could occur. You may adjust your withholding election so that a greater or lesser amount will be withheld.
If you don’t want us to withhold on this amount, you must notify us to not withhold the federal income tax. You may notify us in writing or in certain situations by telephone or through other electronic means. You have the right to revoke your withholding election at any time and any election you make may remain in effect until revoked by filing a new election.
Remember, even if you elect not to have income tax withheld, you are liable for paying income tax on the taxable portion of your withdrawal. If you elect not to have income tax withheld or you don’t have enough income tax withheld, you may be responsible for payment of estimated tax. You may incur penalties under the estimated tax rules if your withholding and estimated tax payments are not sufficient. You can reduce or defer the income tax on a distribution by directly or indirectly rolling such distribution over to another IRA or eligible plan. You should consult your tax advisor for additional information.
State tax will be withheld if, at the time of your distribution, your address is within one of the mandatory withholding states and you have federal income tax withheld. State taxes will be withheld from your distribution in accordance with the respective state rules.
Proxy Voting Guidelines
American Century Investment Management, Inc., the fund’s investment advisor, is responsible for exercising the voting rights associated with the securities purchased and/or held by the fund. A description of the policies and procedures the advisor uses in fulfilling this responsibility is available without charge, upon request, by calling 1-800-345-2021. It is also available on American Century Investments’ website at americancentury.com and on the Securities and Exchange Commission’s website at sec.gov. Information regarding how the investment advisor voted proxies relating to portfolio securities during the most recent 12-month period ended June 30 is available on the “About Us” page at americancentury.com. It is also available at sec.gov.
Quarterly Portfolio Disclosure
The fund files its complete schedule of portfolio holdings with the Securities and Exchange Commission (SEC) for the first and third quarters of each fiscal year on Form N-Q. The fund’s Forms N-Q are available on the SEC’s website at sec.gov, and may be reviewed and copied at the SEC’s Public Reference Room in Washington, DC. Information on the operation of the Public Reference Room may be obtained by calling 1-800-SEC-0330. The fund also makes its complete schedule of portfolio holdings for the most recent quarter of its fiscal year available on its website at americancentury.com and, upon request, by calling 1-800-345-2021.
| Contact Us | americancentury.com |
| Automated Information Line | 1-800-345-8765 |
| Investor Services Representative | 1-800-345-2021 or 816-531-5575 |
| Investors Using Advisors | 1-800-378-9878 |
Business, Not-For-Profit, Employer-Sponsored Retirement Plans | 1-800-345-3533 |
Banks and Trust Companies, Broker-Dealers, Financial Professionals, Insurance Companies | 1-800-345-6488 |
| Telecommunications Device for the Deaf | 1-800-634-4113 |
American Century Government Income Trust
Investment Advisor:
American Century Investment Management, Inc.
Kansas City, Missouri
This report and the statements it contains are submitted for the general information of our shareholders. The report is not authorized for distribution to prospective investors unless preceded or accompanied by an effective prospectus.
©2011 American Century Proprietary Holdings, Inc. All rights reserved.
CL-ANN-71449 1105
ITEM 2. CODE OF ETHICS.
ITEM 3. AUDIT COMMITTEE FINANCIAL EXPERT.
ITEM 4. PRINCIPAL ACCOUNTANT FEES AND SERVICES.
The aggregate fees billed for each of the last two fiscal years for professional services rendered by the principal accountant for the audit of the registrant’s annual financial statements or services that are normally provided by the accountant in connection with statutory and regulatory filings or engagements for those fiscal years were as follows:
The aggregate fees billed in each of the last two fiscal years for assurance and related services by the principal accountant that are reasonably related to the performance of the audit of the registrant’s financial statements and are not reported under paragraph (a) of this Item were as follows:
Fees required to be approved pursuant to paragraph (c)(7)(ii) of Rule 2-01 of Regulation S-X (relating to certain engagements for non-audit services with the registrant’s investment adviser and its affiliates):
The aggregate fees billed in each of the last two fiscal years for professional services rendered by the principal accountant for tax compliance, tax advice, and tax planning were as follows:
Fees required to be approved pursuant to paragraph (c)(7)(ii) of Rule 2-01 of Regulation S-X (relating to certain engagements for non-audit services with the registrant’s investment adviser and its affiliates):
The aggregate fees billed in each of the last two fiscal years for products and services provided by the principal accountant, other than the services reported in paragraphs (a) through (c) of this Item were as follows:
Fees required to be approved pursuant to paragraph (c)(7)(ii) of Rule 2-01 of Regulation S-X (relating to certain engagements for non-audit services with the registrant’s investment adviser and its affiliates):
ITEM 5. AUDIT COMMITTEE OF LISTED REGISTRANTS.
Not applicable.
ITEM 6. INVESTMENTS.
ITEM 7. DISCLOSURE OF PROXY VOTING POLICIES AND PROCEDURES FOR CLOSED-END MANAGEMENT INVESTMENT COMPANIES.
ITEM 8. PORTFOLIO MANAGERS OF CLOSED-END MANAGEMENT INVESTMENT COMPANIES.
ITEM 9. PURCHASES OF EQUITY SECURITIES BY CLOSED-END MANAGEMENT INVESTMENT COMPANY AND AFFILIATED PURCHASERS.
ITEM 10. SUBMISSION OF MATTERS TO A VOTE OF SECURITY HOLDERS.
ITEM 11. CONTROLS AND PROCEDURES.
ITEM 12. EXHIBITS.
Pursuant to the requirements of the Securities Exchange Act of 1934 and the Investment Company Act of 1940, the registrant has duly caused this report to be signed on its behalf by the undersigned, thereunto duly authorized.
Pursuant to the requirements of the Securities Exchange Act of 1934 and the Investment Company Act of 1940, this report has been signed below by the following persons on behalf of the registrant and in the capacities and on the dates indicated.