UNITED STATES
SECURITIES AND EXCHANGE COMMISSION
Washington, D.C. 20549
FORM N-CSR
CERTIFIED SHAREHOLDER REPORT OF REGISTERED
MANAGEMENT INVESTMENT COMPANIES
Investment Company Act file number | 811-4367 |
|
Columbia Funds Series Trust I |
(Exact name of registrant as specified in charter) |
|
One Financial Center, Boston, Massachusetts | | 02111 |
(Address of principal executive offices) | | (Zip code) |
|
James R. Bordewick, Jr., Esq. Columbia Management Advisors, LLC One Financial Center Boston, MA 02111 |
(Name and address of agent for service) |
|
Registrant’s telephone number, including area code: | 1-617-426-3750 | |
|
Date of fiscal year end: | November 30, 2006 | |
|
Date of reporting period: | November 30, 2006 | |
| | | | | | | | |
Form N-CSR is to be used by management investment companies to file reports with the Commission not later than 10 days after the transmission to stockholders of any report that is required to be transmitted to stockholders under Rule 30e-1 under the Investment Company Act of 1940 (17 CFR 270.30e-1). The Commission may use the information provided on Form N-CSR in its regulatory, disclosure review, inspection, and policymaking roles.
A registrant is required to disclose the information specified by Form N-CSR, and the Commission will make this information public. A registrant is not required to respond to the collection of information contained in Form N-CSR unless the Form displays a currently valid Office of Management and Budget (“OMB”) control number. Please direct comments concerning the accuracy of the information collection burden estimate and any suggestions for reducing the burden to Secretary, Securities and Exchange Commission, 450 Fifth Street, NW, Washington, DC 20549-0609. The OMB has reviewed this collection of information under the clearance requirements of 44 U.S.C. § 3507.
Item 1. Reports to Stockholders.
Columbia Management®
Columbia Tax-Exempt Fund
Annual Report – November 30, 2006
NOT FDIC INSURED
May Lose Value
No Bank Guarantee
Table of contents
| Economic Update | | | 1 | | |
|
| Performance Information | | | 2 | | |
|
| Understanding Your Expenses | | | 3 | | |
|
| Portfolio Manager's Report | | | 4 | | |
|
| Fund Profile | | | 6 | | |
|
| Financial Statements | | | 7 | | |
|
| Investment Portfolio | | | 8 | | |
|
Statement of Assets and
Liabilities | | | 56 | | |
|
| Statement of Operations | | | 57 | | |
|
Statement of Changes in
Net Assets | | | 58 | | |
|
| Financial Highlights | | | 60 | | |
|
| Notes to Financial Statements | | | 64 | | |
|
Report of Independent
Registered Public Accounting
Firm | | | 73 | | |
|
| Unaudited Information | | | 74 | | |
|
| Fund Governance | | | 75 | | |
|
Board Consideration and
Approval of Investment Advisory Agreements | | | 79 | | |
|
Summary of Management Fee
Evaluation by Independent
Fee Consultant | | | 82 | | |
|
| Columbia Funds | | | 87 | | |
|
Important Information About
This Report | | | 89 | | |
|
The views expressed in the President's Message and Portfolio Manager's report reflect the current views of the respective parties. These views are not guarantees of future performance and involve certain risks, uncertainties and assumptions that are difficult to predict so actual outcomes and results may differ significantly from the views expressed. These views are subject to change at any time based upon economic, market or other conditions and the respective parties disclaim any responsibility to update such views. These views may not be relied on as investment advice and, because investment decisions for a Columbia Fund are based on numerous factors, may not be relied on as an indication of trading intent on behalf of any particular Columbia Fund. References to specific securities should not be construed as a recommendation or investment advice.
President's Message
November 30, 2006

Dear Shareholder,
Over the past few years, you've heard a lot about change here at Columbia Funds as we've streamlined our fund offerings, reduced our expenses and enhanced the different ways that you can do business with us. Our goal in all these matters has been to make investing easier and more convenient—and to ensure that you find the range of financial choices and services that you expect from one of the nation's leading financial companies.
As 78 million baby boomers move closer to retirement, we are also mindful that retirement is the single most important financial goal for many Americans. To that end we have committed considerable resources to ensure that you can find a wide range of choices at Columbia Funds, whether you are just beginning to invest for retirement or preparing to turn your retirement savings into income. If you haven't done so already, we suggest that you work closely with your financial adviser to draw up a personal investment plan that is based on what you'll require for your future. We continue to look for new ways to help meet the unique needs of all our investors—especially those who are approaching retirement.
Change is a constant in our lives, but one thing that does not change is our commitment to continue to improve your investment and service experiences. At Columbia Funds, we understand that you have a choice of financial providers and we want you to remain satisfied with your decision to invest with us—now and in the years to come.
As you read the following message from the manager of your Columbia fund, keep in mind that investing is often a long-term undertaking. While it's important to review the performance and market environment of the most recent period, it's essential to evaluate this information with your goal, time horizon and risk tolerance in mind.
Sincerely,

Christopher L. Wilson
President, Columbia Funds
Economic Update – Columbia Tax-Exempt Fund
The US economy grew at a solid but uneven pace during the 12-month period that began December 1, 2005 and ended November 30, 2006. Gross domestic product (GDP) growth was robust in the first quarter of 2006, as businesses created jobs at a brisk pace, industrial production rose and both personal spending and personal income moved higher. However, a weak housing market began to weigh on the economy, and the manufacturing sector contracted late in the period—registering its first downturn since the spring of 2003. Against this backdrop, economic growth averaged 3.0% for the 12-month period.
Between December and June, the Federal Reserve Board (the Fed) raised a key short-term interest rate, the federal funds rate, five times—to 5.25%. But as economic growth slowed, the Fed turned cautious and passed on any further increases after its June meeting. Inflation also retreated during the period, which lent further support to the Fed's decision. Investors reacted favorably to the prospect of stable or possibly even lower interest rates and both the stock and bond markets rallied.
Bonds bounced back
Although bond yields moved higher early in the period, the US bond market delivered a respectable return, as prices rose and yields declined in reaction to the Fed's mid-year decision to put further short-term rate increases on hold. The yield on the 10-year US Treasury note, a bellwether for the bond market, ended the period at 4.4%—slightly lower than where it started. In this environment, the Lehman Brothers U.S. Aggregate Bond Index returned 5.94%. High-yield bonds led the fixed-income markets, reflecting investor confidence about the overall resilience of the economy despite its slower pace of growth. The Merrill Lynch U.S. High Yield, Cash Pay Index returned 11.46%.
Stocks moved solidly higher
After a lackluster start, stock prices moved solidly higher during the 12-month period covered by this report. The S&P 500 Index, a broad measure of common stock performance, rose 14.23%. Small- and mid-cap stocks outpaced large-cap stocks, although the margin of leadership narrowed as the period wore on. Value stocks outperformed growth stocks, as measured by their respective Russell indices.1 Foreign stock markets generally outperformed the US market. The MSCI EAFE Index,2 which tracks stock market performance in industrialized countries outside the United States and Canada, returned 28.20%. A declining US dollar also bolstered foreign returns for US investors.
1The Russell 1000 Value Index measures the performance of those Russell 1000 Index companies with lower price-to-book ratios and lower forecasted growth values. The Russell 3000 Value Index measures the performance of those Russell 3000 Index companies with lower price-to-book ratios and lower forecasted growth values. The Russell Midcap Value Index measures the performance of those Russell Midcap Index companies with lower price-to-book ratios and lower forecasted growth values. Indices are not investments, do not incur fees or expenses and are not professionally managed. It is not possible to invest directly in an index.
2The MSCI EAFE (Europe, Australasia, Far East) Index is a free-float adjusted market capitalization index that is designed to measure developed market equity performance, excluding the US and Canada. Indices are not investments, do not incur fees or expenses and are not professionally managed. It is not possible to invest directly in an index.
Summary
For the 12-month period ended November 30, 2006
g Investment-grade bonds rebounded as yields declined, lifting the Lehman Brothers U.S. Aggregate Bond Index to a respectable return. High-yield bonds, as measured by the Merrill Lynch U.S. High Yield, Cash Pay Index, led the fixed-income markets.
Lehman Index | | Merrill Lynch
Index | |
|
 | |  | |
|
g The broad stock market, as measured by the S&P 500 Index, returned 14.23%. Small cap value stocks led the market, as measured by the Russell 2000 Value Index.
| S&P Index | | Russell Index | |
|
 | |  | |
|
The Lehman Brothers U.S. Aggregate Bond Index is a market value-weighted index that tracks the daily price, coupon, pay-downs, and total return performance of fixed-rate, publicly placed, dollar-denominated, and non-convertible investment grade debt issues with at least $250 million par amount outstanding and with at least one year to final maturity.
The Merrill Lynch U.S. High Yield, Cash Pay Index tracks the performance of non-investment-grade corporate bonds.
The S&P 500 Index tracks the performance of 500 widely held, large-capitalization US stocks.
The Russell 2000 Value Index measures the performance of those Russell 2000 companies with lower price-to-book ratios and lower forecasted growth values.
Indices are not investments, do not incur fees or expenses and are not professionally managed. It is not possible to invest directly in an index.
1
Performance Information – Columbia Tax-Exempt Fund
Performance data quoted represents past performance and current performance may be lower or higher. Past performance is no guarantee of future results. The investment return and principal value will fluctuate so that shares, when redeemed, may be worth more or less than the original cost. Please visit www.columbiafunds.com for daily and most recent month-end performance updates.
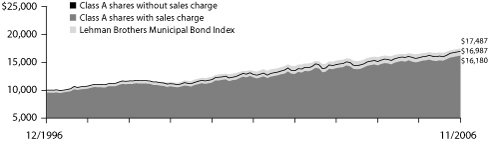
Performance of a $10,000 investment
12/01/96 – 11/30/06 ($)
| Sales charge | | without | | with | |
| Class A | | | 16,987 | | | | 16,180 | | |
| Class B | | | 15,765 | | | | 15,765 | | |
| Class C | | | 15,982 | | | | 15,982 | | |
| Class Z | | | 17,028 | | | | n/a | | |
Growth of a $10,000 investment 12/01/96 – 11/30/06 ($)
The chart above shows the growth in value of a hypothetical $10,000 investment in Class A shares of Columbia Tax-Exempt Fund during the stated time period, and does not reflect the deduction of taxes that a shareholder would pay on fund distributions or the redemption of fund shares. The Lehman Brothers Municipal Bond Index is considered representative of the broad market for investment-grade, tax exempt bonds with a maturity of at least one year. Indices are not investments, they do not incur fees or expenses and are not professionally managed. It is not possible to invest directly in an index. Securities in the fund may not match those in an index.
Average annual total return as of 11/30/06 (%)
| Share class | | A | | B | | C | | Z | |
| Inception | | 11/21/78 | | 05/05/92 | | 08/01/97 | | 09/19/05 | |
| Sales charge | | without | | with | | without | | with | | without | | with | | without | |
| 1-year | | | 7.53 | | | | 2.42 | | | | 6.73 | | | | 1.73 | | | | 6.89 | | | | 5.89 | | | | 7.75 | | |
| 5-year | | | 5.79 | | | | 4.77 | | | | 5.01 | | | | 4.67 | | | | 5.16 | | | | 5.16 | | | | 5.84 | | |
| 10-year | | | 5.44 | | | | 4.93 | | | | 4.66 | | | | 4.66 | | | | 4.80 | | | | 4.80 | | | | 5.47 | | |
Average annual total return as of 12/31/06 (%)
| Share class | | A | | B | | C | | Z | |
| Sales charge | | without | | with | | without | | with | | without | | with | | without | |
| 1-year | | | 5.56 | | | | 0.55 | | | | 4.78 | | | | -0.22 | | | | 4.94 | | | | 3.94 | | | | 5.78 | | |
| 5-year | | | 5.97 | | | | 4.94 | | | | 5.18 | | | | 4.85 | | | | 5.34 | | | | 5.34 | | | | 6.03 | | |
| 10-year | | | 5.44 | | | | 4.93 | | | | 4.66 | | | | 4.66 | | | | 4.81 | | | | 4.81 | | | | 5.47 | | |
The "with sales charge" returns include the maximum initial sales charge of 4.75% for Class A shares, maximum contingent deferred sales charge of 5.00% in the first year, declining to 1.00% in the sixth year and eliminated thereafter for Class B shares and 1.00% for Class C shares for the first year only. The "without sales charge" returns do not include the effect of sales charges. If they had, returns would be lower.
All results shown assume reinvestment of distributions. Class Z shares are sold at net asset value with no 12b-1 fees. Class Z shares have limited eligibility and the investment minimum requirement may vary. Please see the fund's prospectus for details.
Performance results reflect any voluntary waivers or reimbursement of fund expenses by the investment advisor and/or its affiliates. Absent these waivers or reimbursement arrangements, performance results would have been lower.
The table does not reflect the deduction of taxes that a shareholder would pay on fund distributions or the redemption of fund shares.
Class Z is a newer class of shares. Its performance information includes returns of the fund's Class A shares (the oldest existing fund class). These returns have not been restated to reflect any differences in expenses (such as Rule 12b-1 fees) between Class A shares and the newer class of shares. The Class A share returns have been adjusted to take into account the fact that Class Z shares are sold without sales charges. If differences in expenses had been reflected, the returns shown for the period prior to the inception of the newer class of shares would have been higher, since Class Z shares are not subject to any Rule 12b-1 fees.
Class C is a newer class of shares. Its performance information includes returns of the fund's Class B shares for periods prior to the inception of Class C shares. Class B shares would have substantially similar annual returns because Class B and Class C shares generally have similar expense structures. Class A shares were initially offered on November 21, 1978, Class B shares were initially offered on May 5, 1992, Class C shares were initially offered on August 1, 1997, and Class Z shares were initially offered on September 19, 2005.
2
Understanding Your Expenses – Columbia Tax-Exempt Fund
As a fund shareholder, you incur two types of costs. There are transaction costs, which generally include sales charges on purchases and may include redemption or exchange fees. There are also ongoing costs, which generally include investment advisory fees, Rule 12b-1 fees and other fund expenses. The information on this page is intended to help you understand your ongoing costs of investing in the fund and to compare these costs with the ongoing costs of investing in other mutual funds.
Analyzing your fund's expenses by share class
To illustrate these ongoing costs, we have provided an example and calculated the expenses paid by investors in each share class during the period. The information in the following table is based on an initial investment of $1,000, which is invested at the beginning of the reporting period and held for the entire period. Expense information is calculated two ways and each method provides you with different information. The amount listed in the "actual" column is calculated using the fund's actual operating expenses and total return for the period. The amount listed in the "hypothetical" column for each share class assumes that the return each year is 5% before expenses and is calculated based on the fund's actual operating expenses. You should not use the hypothetical account values and expenses to estimate either your actual account balance at the end of the period or the expenses you paid during this reporting period.
Compare with other funds
Since all mutual funds are required to include the same hypothetical calculations about expenses in shareholder reports, you can use this information to compare the ongoing cost of investing in the fund with other funds. To do so, compare the 5% hypothetical example with the 5% hypothetical examples that appear in the shareholder reports of other funds. As you compare hypothetical examples of other fund companies, it is important to note that hypothetical examples are meant to highlight the ongoing costs of investing in a fund and do not reflect any transaction costs, such as sales charges or redemption or exchange fees.
Estimating your actual expenses
To estimate the expenses that you paid over the period, first you will need your account balance at the end of the period:
g For shareholders who receive their account statements from Columbia Management Services, Inc., your account balance is available online at www.columbiafunds.com or by calling Shareholder Services at 800.345.6611.
g For shareholders who receive their account statements from their brokerage firm, contact your brokerage firm to obtain your account balance.
1. Divide your ending account balance by $1,000. For example, if an account balance was $8,600 at the end of the period, the result would be 8.6.
2. In the section of the table below titled "Expenses paid during the period," locate the amount for your share class. You will find this number in the column labeled "actual." Multiply this number by the result from step 1. Your answer is an estimate of the expenses you paid on your account during the period.
06/01/06 – 11/30/06
| | | Account value at the
beginning of the period ($) | | Account value at the
end of the period ($) | | Expenses paid
during the period ($) | | Fund's annualized
expense ratio (%) | |
| | | Actual | | Hypothetical | | Actual | | Hypothetical | | Actual | | Hypothetical | | Actual | |
| Class A | | | 1,000.00 | | | | 1,000.00 | | | | 1,055.50 | | | | 1,020.96 | | | | 4.23 | | | | 4.15 | | | | 0.82 | | |
| Class B | | | 1,000.00 | | | | 1,000.00 | | | | 1,051.49 | | | | 1,017.20 | | | | 8.07 | | | | 7.94 | | | | 1.57 | | |
| Class C | | | 1,000.00 | | | | 1,000.00 | | | | 1,052.29 | | | | 1,017.95 | | | | 7.31 | | | | 7.18 | | | | 1.42 | | |
| Class Z | | | 1,000.00 | | | | 1,000.00 | | | | 1,056.50 | | | | 1,021.96 | | | | 3.20 | | | | 3.14 | | | | 0.62 | | |
Expenses paid during the period are equal to the annualized expense ratio for the share class, multiplied by the average account value over the period, then multiplied by the number of days in the fund's most recent fiscal half-year and divided by 365.
Had the investment advisor and/or any of its affiliates not waived or reimbursed a portion of expenses, total return would have been reduced.
It is important to note that the expense amounts shown in the table are meant to highlight only ongoing costs of investing in the fund and do not reflect any transaction costs, such as sales charges, redemption or exchange fees. Therefore, the hypothetical examples provided may not help you determine the relative total costs of owning shares of different funds. If these transaction costs were included, your costs would have been higher.
3
Portfolio Manager's Report – Columbia Tax-Exempt Fund
Performance data quoted represents past performance and current performance may be lower or higher. Past performance is no guarantee of future results. The investment return and principal value will fluctuate so that shares, when redeemed, may be worth more or less than the original cost. Please visit www.columbiafunds.com for daily and most recent month-end performance updates.
Net asset value per share
as of 11/30/06 ($)
| Class A | | | 13.88 | | |
| Class B | | | 13.88 | | |
| Class C | | | 13.88 | | |
| Class Z | | | 13.88 | | |
Distributions declared per share
12/01/05 – 11/30/06 ($)
| Class A | | | 0.60 | | |
| Class B | | | 0.50 | | |
| Class C | | | 0.52 | | |
| Class Z | | | 0.63 | | |
A portion of the fund's income may be subject to the alternative minimum tax. The fund may at times purchase tax-exempt securities at a discount. Some, or all, of this discount may be included in the fund's ordinary income, and is taxable when distributed.
SEC yields
as of 11/30/06 (%)
| Class A | | | 3.47 | | |
| Class B | | | 2.90 | | |
| Class C | | | 3.05 | | |
| Class Z | | | 3.84 | | |
The 30-day SEC yields reflect the portfolio's earning power, net of expenses, expressed as an annualized percentage of the public offering price per share at the end of the period.
Taxable-equivalent SEC yields
as of 11/30/06 (%)
| Class A | | | 5.34 | | |
| Class B | | | 4.46 | | |
| Class C | | | 4.69 | | |
| Class Z | | | 5.91 | | |
Taxable-equivalent SEC yields are based on the maximum effective 35.0% federal income tax rate. This tax rate does not reflect the phase out of exemptions or the reduction of the otherwise allowable deductions that occur when adjusted gross income exceeds certain levels.
For the 12-month period ended November 30, 2006, Columbia Tax-Exempt Fund Class A shares returned 7.53% without sales charge. The fund outperformed its benchmark, the Lehman Brothers Municipal Bond Index, which returned 6.12%.1 It also outpaced the average return of its peer group, the Lipper General Municipal Debt Funds Classification which was 5.77%.2 The fund's substantial holdings in securities that mature in 15 years or longer were a major factor in its performance. Declining long-term yields helped boost performance from the fund's zero coupon and non-callable holdings. Security selection in the high yield sector also contributed to returns. The reorganization of the Columbia Tax-Exempt Insured Fund and the Columbia Municipal Income Fund into Columbia Tax-Exempt Fund resulted in a small decline in the fund's holdings in non-rated bonds due to the composition of the other funds, which were otherwise si milarly structured.
Longer intermediate maturity bonds, zero coupon and non-callable issues boosted returns
As the pace of economic growth slowed, the Federal Reserve Board (the Fed) curtailed its streak of 17 consecutive increases in the federal funds rate—a key short-term interest rate. The Fed's last hike brought the federal funds rate to 5.25% in June, and that's where it remained throughout the period. While inflationary pressures remain, the Fed has said that it expects a slowing economy to keep inflation in check. The fixed income market also broadcasted muted inflationary expectations, sending prices higher and yields lower on bonds at the longer end of the maturity spectrum. As a result, our focus on bonds in the longer intermediate maturity range (15 years and longer) was rewarded during the period. We believed these issues had the potential to outperform short-term bonds.
Non-callable bonds and zero-coupon bonds maturing in longer than 10 years also performed well as longer-term yields declined. Non-callable bonds tend to perform true to their maturity dates as opposed to callable bonds, which give the issuer the option to redeem the bonds prior to their maturity date—an option that became more attractive as yields on all but the shortest-maturity bonds declined. Zero-coupon bonds, which are very sensitive to interest rate changes, do not pay income but are redeemed for full face value at maturity, also benefited because their value increased as yields declined.
High-yield holdings added to performance
During the period, the difference in yield between high quality bonds and lower quality issues narrowed, as investors were attracted to bonds that offered higher yields. This trend benefited the fund's high-yield holdings. Because many of the fund's high yield bonds were purchased several years ago at more attractive yields than are available today, these securities also helped boost the fund's income.
1The Lehman Brothers Municipal Bond Index is considered representative of the broad market for investment-grade, tax-exempt bonds with maturity of at least one year. Indices are not investments, do not incur fees or expenses and are not professionally managed. It is not possible to invest directly in an index.
2Lipper Inc., a widely respected data provider in the industry, calculates an average total return (assuming reinvestment of distributions) for mutual funds with investment objectives similar to those of the fund. Lipper makes no adjustment for the effect of sales loads.
4
Portfolio Manager's Report (continued) – Columbia Tax-Exempt Fund
Looking ahead
The Fed has indicated that it is likely to base any further actions with respect to short-term interest rates on evidence presented in the economic data. As a result, we plan to continue to monitor the economy—especially inflation, employment and wage statistics and housing market movements—to gauge our expectations for the direction of the market. Given the current environment of relatively slow growth and the Fed on hold, we plan to continue to focus on bonds with good call protection in the longer intermediate range of the maturity spectrum. However, we could alter our approach if our expectations for economic growth and inflation are not met.
Top 5 sectors
as of 11/30/06 (%)
| Refunded/Escrowed | | | 18.0 | | |
| Local General Obligations | | | 13.2 | | |
| Special Non-Property Tax | | | 7.7 | | |
| State Appropriated | | | 6.8 | | |
| Hospitals | | | 6.7 | | |
Quality breakdown
as of 11/30/06 (%)
| AAA | | | 68.1 | | |
| AA | | | 8.4 | | |
| A | | | 6.0 | | |
| BBB | | | 7.4 | | |
| BB | | | 0.2 | | |
| B | | | 0.3 | | |
| CCC | | | 0.2 | | |
| Non-Rated | | | 8.6 | | |
| Cash and Equivalents | | | 0.8 | | |
Maturity breakdown
as of 11/30/06 (%)
| 0-1 years | | | 0.3 | | |
| 1-3 years | | | 3.2 | | |
| 3-5 years | | | 7.1 | | |
| 5-7 years | | | 9.9 | | |
| 7-10 years | | | 13.5 | | |
| 10-15 years | | | 32.1 | | |
| 15-20 years | | | 18.1 | | |
| 20-25 years | | | 9.8 | | |
| 25 years and over | | | 5.2 | | |
| Cash and Equivalents | | | 0.8 | | |
Sector weightings are calculated as a percentage of net assets.
Quality and maturity breakdowns are calculated as a percentage of total investments. Ratings shown in the quality breakdown represent the rating assigned to a particular bond by one of the following nationally recognized rating agencies: Standard & Poor's, a division of The McGraw-Hill Companies, Inc., Moody's Investors Service, Inc. or Fitch Ratings Ltd. Ratings are relative and subjective and are not absolute standards of quality. The fund's credit quality does not remove market risk.
Because the fund is actively managed, there is no guarantee that the fund will continue to invest in these sectors or maintain these quality and maturity breakdowns in the future.
5
Fund Profile – Columbia Tax-Exempt Fund
Performance data quoted represents past performance and current performance may be lower or higher. Past performance is no guarantee of future results. The investment return and principal value will fluctuate so that shares, when redeemed, may be more or less than the original cost. Please visit www.columbiafunds.com for daily and most recent month-end performance updates.
Summary
1-year return as of 11/30/06
| | +7.53 | % | |
|
 Class A shares Class A shares
(without sales charge) | |
|
| | +6.12 | % | |
|
 Lehman Brothers Lehman Brothers
Municipal Bond Index | |
|
Management Style
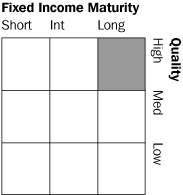
Management style is determined by Columbia Management and is based on the investment strategy and process as outlined in the fund's prospectus.
Summary
g For the 12-month period ended November 30, 2006, the fund's Class A shares returned 7.53%, without sales charge.
g The fund outperformed both its benchmark and the average return of its peer group, the Lipper General Municipal Debt Funds Classification average.
g The fund's substantial allocation to bonds maturing in 15 or more years drove its performance; zero-coupon, non-callable and high-yield bond holdings also contributed to returns.
Portfolio Management
Kimberly Campbell has managed the Columbia Tax-Exempt Fund since December 2001. Ms. Campbell has been with the advisor or its predecessors or affiliate organizations since June 1995.
Portfolio holdings and characteristics are subject to change and may not be representative of current holdings and characteristics. The outlook for this fund may differ from that presented for other Columbia Funds mutual funds and portfolios. Performance for different classes of shares will vary based on differences in sales charges and fees associated with each class. For standardized performance, please refer to the Performance Information page.
Tax-exempt investing offers current tax-exempt income, but it also involves special risks. The value of the fund will be affected by interest rate changes and the creditworthiness of issues held in the fund. When interest rates go up, bond prices generally drop and vice versa. Interest income from certain tax-exempt bonds may be subject to certain state and local taxes and, if applicable, the alternative minimum tax. Capital gains are not exempt from income taxes.
Investing in high-yield or "junk" bonds offers the potential for higher income than investments in investment-grade bonds but also has a higher degree of risk. Changes in economic conditions or other circumstances may adversely affect a high-yield bond issuer's ability to make timely principal and interest payments.
6
Financial Statements – Columbia Tax Exempt Fund
November 30, 2006
A guide to understanding your fund's financial statements
| Investment Portfolio | | The investment portfolio details all of the fund's holdings and their values as of the last day of the reporting period. Portfolio holdings are organized by type of asset, industry, country or geographic region (if applicable) to demonstrate areas of concentration and diversification. | |
|
| Statement of Assets and Liabilities | | This statement details the fund's assets, liabilities, net assets and share price for each share class as of the last day of the reporting period. Net assets are calculated by subtracting all the fund's liabilities (including any unpaid expenses) from the total of the fund's investment and non-investment assets. The share price for each class is calculated by dividing net assets for that class by the number of shares outstanding in that class as of the last day of the reporting period. | |
|
| Statement of Operations | | This statement details income earned by the fund and the expenses accrued by the fund during the reporting period. The Statement of Operations also shows any net gain or loss the fund realized on the sales of its holdings during the period, as well as any unrealized gains or losses recognized over the period. The total of these results represents the fund's net increase or decrease in net assets from operations. | |
|
| Statement of Changes in Net Assets | | This statement demonstrates how the fund's net assets were affected by its operating results, distributions to shareholders and shareholder transactions (e.g., subscriptions, redemptions and dividend reinvestments) during the reporting period. The Statement of Changes in Net Assets also details changes in the number of shares outstanding. | |
|
| Financial Highlights | | The financial highlights demonstrate how the fund's net asset value per share was affected by the fund's operating results. The financial highlights table also discloses performance for each class of shares and certain key ratios (e.g., class expenses and net investment income as a percentage of average net assets). | |
|
| Notes to Financial Statements | | These notes disclose the organizational background of the fund, its significant accounting policies (including those surrounding security valuation, income recognition and distributions to shareholders), federal tax information, fees and compensation paid to affiliates and significant risks and contingencies. | |
|
7
Investment Portfolio – Columbia Tax-Exempt Fund
November 30, 2006
| | | | | Par ($) | | Value ($) | |
| Education – 3.3% | |
| Education – 2.8% | |
| CA Educational Facilities Authority | |
| | | Loyola Marymount University,
Series 2001,
Insured: MBIA:
(a) 10/01/17
(a) 10/01/20 | | |
2,525,000
2,000,000 | | | |
1,629,989
1,123,780 | | |
| CA Municipal Finance Authority | |
| | | Escondido Charter,
Series 2006 A,
5.250% 06/01/36 | | | 1,750,000 | | | | 1,831,287 | | |
| IN Ivy Technical State College | |
| | | Series 1997 E,
Insured: AMBAC
5.125% 07/01/12 | | | 2,000,000 | | | | 2,050,520 | | |
| MA College Building Authority | |
| | | Series 1994 A,
7.500% 05/01/14 | | | 3,500,000 | | | | 4,270,805 | | |
| MA Health & Educational Facilities Authority | |
| | | Harvard University,
Series 1991 N,
6.250% 04/01/20 | | | 2,000,000 | | | | 2,520,820 | | |
| | Massachusetts Institute of Technology:
Series 2002 K,
5.500% 07/01/22 | | | 8,000,000 | | | | 9,577,760 | | |
| | Series 2003 L,
5.000% 07/01/18 | | | 5,000,000 | | | | 5,607,800 | | |
| NC University North Carolina at Chapel Hill | |
| | | Series 1997,
(a) 08/01/13 | | |
2,000,000 | | | |
1,562,080 | | |
| NY Dormitory Authority | |
| | | Educational Housing Services,
Series 2005,
Insured: AMBAC
5.250% 07/01/30 | | | 3,000,000 | | | | 3,553,680 | | |
| | New York University,
Series 2001 1,
Insured: AMBAC
5.500% 07/01/40 | | | 4,000,000 | | | | 4,973,560 | | |
| | Upstate Community Colleges,
Series 2005 B,
Insured: FGIC
5.500% 07/01/23 | | | 2,000,000 | | | | 2,388,060 | | |
| TX University of Texas Permanent University | |
| | | Series 2004 B,
5.000% 07/01/26 | | | 2,500,000 | | | | 2,667,175 | | |
| UT Weber State University Revenue | |
| | | Series 2005,
Insured: MBIA
4.250% 04/01/29 | | | 5,100,000 | | | | 5,024,469 | | |
See Accompanying Notes to Financial Statements.
8
Columbia Tax-Exempt Fund
November 30, 2006
| Municipal Bonds – (continued) | |
| | | | | Par ($) | | Value ($) | |
| Education – (continued) | |
| Education – (continued) | |
| VA College Building Authority | |
| | | Virginia Educational Facilities,
Washington & Lee University,
Series 2001,
5.375% 01/01/21 | | | 10,000,000 | | | | 11,622,100 | | |
| WV University of West Virginia | |
| | | Series 1998 A,
Insured: MBIA
5.250% 04/01/28 | | | 5,000,000 | | | | 5,931,000 | | |
| | Series 2000 A,
Insured: AMBAC:
(a) 04/01/16
(a) 04/01/17
(a) 04/01/18 | | | 3,300,000
2,480,000
3,800,000 | | | | 2,275,383
1,631,939
2,388,034 | | |
| | Education Total | | | | | | | 72,630,241 | | |
| Student Loan – 0.5% | |
| IA Student Loan Liquidity Corp. | |
| | | Series 1998 J, AMT,
Insured: AMBAC
4.800% 06/01/09 | | | 2,750,000 | | | | 2,817,705 | | |
| WY Student Loan Corp. | |
| | | Series 1999 A,
6.250% 06/01/29 | | | 10,000,000 | | | | 10,655,100 | | |
| | Student Loan Total | | | | | | | 13,472,805 | | |
| Education Total | | | | | | | | | 86,103,046 | | |
| Health Care – 9.5% | |
| Continuing Care Retirement – 0.4% | |
| FL Capital Projects Finance Authority | |
| | | Glenridge on Palmer Ranch,
Series 2002 A,
8.000% 06/01/32 | | | 4,500,000 | | | | 5,057,235 | | |
| FL Lee County Industrial Development Authority | |
| | | Shell Point Village Project,
Series 1999 A,
5.750% 11/15/15 | | | 250,000 | | | | 260,843 | | |
| NC Medical Care Commission | |
| | | Glenaire, Inc.,
Series 2006,
5.500% 10/01/31 | | | 2,500,000 | | | | 2,619,350 | | |
| OH Hamilton County Health Care Facilities Revenue | |
| | | Twin Towers,
Series 1998 A,
5.125% 10/01/18 | | | 500,000 | | | | 517,910 | | |
| PA Montgomery County Industrial Development Authority | |
| | | Whitemarsh Continuing Care Retirement Community,
Series 2005,
6.125% 02/01/28 | | | 2,000,000 | | | | 2,137,120 | | |
| | Continuing Care Retirement Total | | | | | | | 10,592,458 | | |
See Accompanying Notes to Financial Statements.
9
Columbia Tax-Exempt Fund
November 30, 2006
| Municipal Bonds – (continued) | |
| | | | | Par ($) | | Value ($) | |
| Health Care – (continued) | |
| Health Services – 0.5% | |
| MA Development Finance Agency | |
| | | Boston Biomedical Research Institute,
Series 1999,
5.650% 02/01/19 | | | 1,310,000 | | | | 1,365,387 | | |
| MN Minneapolis & St. Paul Housing & Redevelopment Authority | |
| | | Group Health Plan, Inc.,
Series 2003:
5.250% 12/01/16
6.000% 12/01/17 | | | 1,250,000
1,650,000 | | | | 1,327,512
1,826,682 | | |
| WI Health & Educational Facilities Authority | |
| | | Marshfield Clinic,
Series 1999,
Insured: RAD
6.250% 02/15/29 | | | 7,200,000 | | | | 7,766,496 | | |
| | Health Services Total | | | | | | | 12,286,077 | | |
| Hospitals – 6.7% | |
| AL Huntsville Health Care Authority | |
| | | Series 2001 A,
5.750% 06/01/31 | | | 5,000,000 | | | | 5,377,700 | | |
| AZ Health Facilities Authority | |
| | | Catholic Heallthcare West,
Series 1999 A,
6.625% 07/01/20 | | | 3,700,000 | | | | 4,086,058 | | |
| AZ University Medical Center Corp. | |
| | | Series 2004,
5.250% 07/01/13 | | | 1,000,000 | | | | 1,068,430 | | |
| CA ABAG Finance Authority for Nonprofit Corps. | |
| | | San Diego Hospital Association,
Series 2003 C,
5.375% 03/01/20 | | | 1,320,000 | | | | 1,422,868 | | |
| CA Health Facilities Financing Authority | |
| | | Catholic Healthcare West,
Series 2004 G,
5.250% 07/01/23 | | | 500,000 | | | | 534,790 | | |
| CT Health & Educational Facility Authority | |
| | | Series 2000 A,
Insured: RAD
6.000% 07/01/25 | | | 1,740,000 | | | | 1,878,086 | | |
| FL Coral Gables Health Facilities Authority | |
| | | Mariners Hospital,
Series 2004,
Insured: FSA
5.000% 08/15/34 | | | 5,000,000 | | | | 5,376,650 | | |
| FL Hillsborough County Industrial Development Authority | |
| | | Tampa General Hospital,
Series 2003 A:
5.000% 10/01/18
5.250% 10/01/24 | | | 825,000
4,000,000 | | | | 867,471
4,274,040 | | |
| FL Orange County Health Facilities Authority | |
| | | Orlando Regional Healthcare System,
Series 1999 E,
6.000% 10/01/26 | | | 6,905,000 | | | | 7,346,506 | | |
See Accompanying Notes to Financial Statements.
10
Columbia Tax-Exempt Fund
November 30, 2006
| Municipal Bonds – (continued) | |
| | | | | Par ($) | | Value ($) | |
| Health Care – (continued) | |
| Hospitals – (continued) | |
| | Series 1996 A,
Insured: MBIA
6.250% 10/01/16 | | |
825,000 | | | |
976,058 | | |
| FL West Orange Healthcare District | |
| | | Series 2001 A,
5.650% 02/01/22 | | | 3,650,000 | | | | 3,871,190 | | |
| GA Chatham County Hospital Authority | |
| | | Memorial Health University Medical Center,
Series 2004 A,
5.500% 01/01/34 | | | 2,500,000 | | | | 2,692,550 | | |
| | | Memorial Medical Center,
Series 2001 A,
6.125% 01/01/24 | | | 3,000,000 | | | | 3,296,880 | | |
| GA Gainesville & Hall County Hospital Authority | |
| | | Northeast Georgia Health Systems,
Series 2001:
5.000% 05/15/12
5.000% 05/15/13 | | | 1,610,000
1,560,000 | | | | 1,679,536
1,624,132 | | |
| LA Public Facilities Authority | |
| | | Touro Infirmary,
Series 1999 A,
5.625% 08/15/29 | | | 10,940,000 | | | | 11,134,623 | | |
| MA Health & Educational Facilities Authority | |
| | | South Shore Hospital,
Series 1999 F,
5.750% 07/01/29 | | | 13,000,000 | | | | 13,716,430 | | |
| MI Dickinson County | |
| | | Series 1999,
5.700% 11/01/18 | | | 1,800,000 | | | | 1,866,402 | | |
| MI University of Michigan | |
| | | Series 2002 D,
5.250% 12/01/20 | | | 6,310,000 | | | | 6,748,040 | | |
| MN St. Paul Housing & Redevelopment Authority | |
| | | HealthEast, Inc.,
Series 1997 A,
5.500% 11/01/09 | | | 250,000 | | | | 257,708 | | |
| MN Waconia | |
| | | Ridgeview Medical Center,
Series 1999 A,
Insured: RAD
6.125% 01/01/29 | | | 1,000,000 | | | | 1,067,060 | | |
| MO Health & Educational Facilities Authority | |
| | | Lake Regional Health Systems,
Series 2003,
5.600% 02/15/25 | | | 625,000 | | | | 672,294 | | |
| | | SSM Health Care Corp.,
Series 2002 A:
5.000% 06/01/11
5.250% 06/01/12 | | | 2,000,000
2,500,000 | | | | 2,104,380
2,684,900 | | |
See Accompanying Notes to Financial Statements.
11
Columbia Tax-Exempt Fund
November 30, 2006
| Municipal Bonds – (continued) | |
| | | | | Par ($) | | Value ($) | |
| Health Care – (continued) | |
| Hospitals – (continued) | |
| MS Medical Center Building Corp. | |
| | | University of Mississippi Medical Center,
Series 1998,
Insured: AMBAC
5.500% 12/01/23 | | | 10,550,000 | | | | 12,474,214 | | |
| NC Medical Care Community Health Care Facility | |
| | | Wilson Memorial Hospital,
Series 1997,
Insured: AMBAC
(a) 11/01/14 | | | 1,380,000 | | | | 1,020,524 | | |
| ND Ward County Health Care Facility | |
| | | Trinity Health,
Series 2006,
5.125% 07/01/29 | | | 1,250,000 | | | | 1,320,212 | | |
| NH Higher Educational & Health | |
| | | Series 1998,
5.800% 05/01/18 | | | 1,470,000 | | | | 1,513,747 | | |
| NM Farmington | |
| | | San Juan Medical Center,
Series 2004 A,
5.000% 06/01/23 | | | 500,000 | | | | 522,570 | | |
| NV Henderson | |
| | | Catholic Healthcare West,
Series 1999 A,
6.750% 07/01/20 | | | 520,000 | | | | 570,908 | | |
| OH Highland County Joint Township | |
| | | Series 1999,
6.750% 12/01/29 | | | 1,850,000 | | | | 1,944,905 | | |
| SC Greenville Hospital System Board | |
| | | Series 2001,
Insured: AMBAC
5.500% 05/01/26 | | | 5,000,000 | | | | 5,387,100 | | |
| TN Johnson City Health & Educational Facilities Board | |
| | | Mountain States Health Alliance,
Series 2006 A,
5.500% 07/01/36 | | | 1,250,000 | | | | 1,355,525 | | |
| TN Knox County Health, Educational & Housing Facilities Authority | |
| | | East Tennessee Hospital,
Series 2003 B,
5.750% 07/01/33 | | | 650,000 | | | | 703,144 | | |
| | Fort Sanders Alliance,
Series 1993,
Insured: MBIA
5.250% 01/01/15 | | | 5,000,000 | | | | 5,496,850 | | |
| TN Sullivan County Health Educational & Housing Facilities Board | |
| | | Wellmont Health System,
Series 2006 C,
5.250% 09/01/36 | | | 7,000,000 | | | | 7,444,360 | | |
| TX Harris County Health Facilities Development Corp. | |
| | | Memorial Hermann Hospital Systems,
Series 1998,
Insured: FSA
5.500% 06/01/11 | | | 3,335,000 | | | | 3,580,456 | | |
See Accompanying Notes to Financial Statements.
12
Columbia Tax-Exempt Fund
November 30, 2006
| Municipal Bonds – (continued) | |
| | | | | Par ($) | | Value ($) | |
| Health Care – (continued) | |
| Hospitals – (continued) | |
| UT Murray | |
| | | IHC Health Services, Inc.,
Series 1996,
Insured: MBIA
5.000% 05/15/22 | | | 4,000,000 | | | | 4,019,120 | | |
| VA Augusta County Industrial Development Authority | |
| | | Augusta Health Care, Inc.,
Series 2003,
5.250% 09/01/20 | | | 1,325,000 | | | | 1,469,133 | | |
| VA Fairfax County Industrial Development Authority | |
| | | Inova Health System,
Series 1993 A,
5.000% 08/15/23 | | | 10,000,000 | | | | 10,991,000 | | |
| VA Henrico County Industrial Development Authority | |
| | | Bon Secours Health,
Series 1996,
Insured: MBIA
6.000% 08/15/16 | | | 5,000,000 | | | | 5,732,850 | | |
| WI Health & Educational Facilities Authority | |
| | | Aurora Health Care, Inc.:
Series 1999 B:
5.500% 02/15/15
5.625% 02/15/20 | | | 3,500,000
5,500,000 | | | | 3,652,180
5,745,465 | | |
| | Series 1999 A,
5.600% 02/15/29 | | | 4,000,000 | | | | 4,164,160 | | |
| | Series 2003,
6.400% 04/15/33 | | | 4,250,000 | | | | 4,789,197 | | |
| | | Waukesha Memorial Hospital,
Series 1990 B,
Insured: AMBAC
7.250% 08/15/19 | | | 10,000 | | | | 10,027 | | |
| | | Wheaton Franciscan Services,
Series 2002,
5.750% 08/15/30 | | | 4,900,000 | | | | 5,281,563 | | |
| | Hospitals Total | | | | | | | 175,813,992 | | |
| Intermediate Care Facilities – 0.6% | |
| IL Development Finance Authority | |
| | | Hoosier Care, Inc.,
Series 1999 A,
7.125% 06/01/34 | | | 2,320,000 | | | | 2,403,567 | | |
| IN Health Facilities Financing Authority | |
| | | Hoosier Care, Inc.,
Series 1999 A,
7.125% 06/01/34 | | | 11,965,000 | | | | 12,395,979 | | |
| | Intermediate Care Facilities Total | | | | | | | 14,799,546 | | |
See Accompanying Notes to Financial Statements.
13
Columbia Tax-Exempt Fund
November 30, 2006
| Municipal Bonds – (continued) | |
| | | | | Par ($) | | Value ($) | |
| Health Care – (continued) | |
| Nursing Homes – 1.3% | |
| CO Health Facilities Authority | |
| | | American Housing Foundation I, Inc.,
Series 2003 A,
8.500% 12/01/31 | | | 895,000 | | | | 956,612 | | |
| IA Finance Authority | |
| | | Care Initiatives,
Series 1998 B:
5.500% 07/01/08
5.750% 07/01/28 | | | 510,000
4,500,000 | | | | 519,971
4,552,515 | | |
| IA Marion | |
| | | Health Care Facilities Revenue,
Series 2003,
6.500% 01/01/29 | | | 200,000 | | | | 208,716 | | |
| MA Development Finance Agency | |
| | | AHF/Woodlawn Manor, Inc.:
Series 2000 A,
7.750% 12/01/27(b) | | | 2,397,000 | | | | 958,800 | | |
| | | Series 2000 B,
10.250% 06/01/27(b)(c) | | | 742,783 | | | | 22,283 | | |
| MA Industrial Finance Agency | |
| | | First Mortgage GF/Massachusetts, Inc.,
Series 1994,
8.300% 07/01/23 | | | 10,800,000 | | | | 10,714,248 | | |
| PA Chester County Industrial Development Authority | |
| | | Pennsylvania Nursing Home,
Series 2002,
8.500% 05/01/32 | | | 6,330,000 | | | | 6,624,978 | | |
| PA Delaware County Industrial Development Authority | |
| | | Care Institute-Main Line LLC,
Series 2005,
9.000% 08/01/31 | | | 8,395,000 | | | | 6,796,508 | | |
| PA Washington County Industrial Development Authority | |
| | | AHF Project,
Series 2003,
7.750% 01/01/29 | | | 2,218,000 | | | | 2,337,461 | | |
| TN Metropolitan Government Nashville & Davidson County Health & Education Board | |
| | | AHF Project,
Series 2003,
7.750% 01/01/29 | | | 508,000 | | | | 535,361 | | |
| | Nursing Homes Total | | | | | | | 34,227,453 | | |
| Health Care Total | | | | | | | | | 247,719,526 | | |
| Housing – 3.1% | |
| Assisted Living/Senior – 0.3% | |
| DE Kent County | |
| | | Heritage at Dover,
Series 1999, AMT,
7.625% 01/01/30 | | | 1,640,000 | | | | 1,530,743 | | |
| MN Roseville | |
| | | Care Institute, Inc.,
Series 1993,
7.750% 11/01/23 | | | 3,275,000 | | | | 2,878,234 | | |
See Accompanying Notes to Financial Statements.
14
Columbia Tax-Exempt Fund
November 30, 2006
| Municipal Bonds – (continued) | |
| | | | | Par ($) | | Value ($) | |
| Housing – (continued) | |
| Assisted Living/Senior – (continued) | |
| NC Medical Care Commission | |
| | | DePaul Community Facilities, Inc.,
Series 1999,
7.625% 11/01/29 | | | 2,060,000 | | | | 2,170,951 | | |
| NY Suffolk County Industrial Development Agency | |
| | | Gurwin-Jewish Phase II,
Series 2004,
6.700% 05/01/39 | | | 900,000 | | | | 983,358 | | |
| | Assisted Living/Senior Total | | | | | | | 7,563,286 | | |
| Multi-Family – 2.2% | |
| CA ABAG Finance Authority for Nonprofit Corps. | |
| | | Northbay Properties II LP,
Series 2000 A, AMT,
6.400% 08/15/30(d) | | | 5,000,000 | | | | 5,165,850 | | |
| | | Winterland San Francisco,
Series 2000 B,
6.250% 08/15/30(d) | | | 2,000,000 | | | | 2,066,260 | | |
| FL Broward County Housing Finance Authority | |
| | | Chaves Lake Apartments Ltd.,
Series 2000 A, AMT,
7.500% 07/01/40 | | | 7,925,000 | | | | 8,456,292 | | |
| | | Cross Keys Apartments,
Series 1998 A, AMT,
5.750% 10/01/28 | | | 985,000 | | | | 1,010,768 | | |
| FL Capital Trust Agency | |
| | | Atlantic Housing Foundation, Inc.,
Series 2005 C,
5.875% 01/01/28 | | | 2,000,000 | | | | 2,051,460 | | |
| FL Clay County Housing Finance Authority | |
| | | Breckenridge Commons Ltd.,
Series 2000 A, AMT,
7.450% 07/01/40 | | | 3,900,000 | | | | 4,137,120 | | |
| MA Housing Finance Agency | |
| | | Series 2004 A, AMT,
Insured: FSA
5.250% 07/01/25 | | | 10,000,000 | | | | 10,359,600 | | |
| MD Economic Development Corp. | |
| | | Collegiate Housing Foundation,
Series 1999 A,
6.000% 06/01/30 | | | 3,000,000 | | | | 3,125,670 | | |
| MN Minneapolis | |
| | | Riverplace Project,
Series 1987 A,
7.100% 01/01/20 | | | 20,000 | | | | 20,267 | | |
| MN Washington County Housing & Redevelopment Authority | |
| | | Cottages of Aspen,
Series 1992, AMT,
9.250% 06/01/22 | | | 1,830,000 | | | | 1,868,759 | | |
| MN White Bear Lake | |
| | | Birch Lake Townhomes:
Series 1989 A,
9.750% 07/15/19 | | | 2,385,000 | | | | 2,262,173 | | |
| | | Series 1989 B,
(a) 07/15/19 | | | 265,000 | | | | 74,200 | | |
See Accompanying Notes to Financial Statements.
15
Columbia Tax-Exempt Fund
November 30, 2006
| Municipal Bonds – (continued) | |
| | | | | Par ($) | | Value ($) | |
| Housing – (continued) | |
| Multi-Family – (continued) | |
| MO St. Louis Area Housing Finance Corp. | |
| | | Wellington Arms III,
Series 1979,
7.375% 01/01/21(e) | | | 1,598,790 | | | | 1,614,170 | | |
| NC Housing Finance Agency | |
| | | Series 1994 F,
Insured: FHA
6.600% 07/01/17 | | | 355,000 | | | | 355,586 | | |
| NC Medical Care Commission | |
| | | ARC Project,
Series 2004 A,
5.800% 10/01/34 | | | 1,400,000 | | | | 1,528,856 | | |
| NY New York City Housing Development Corp. | |
| | | Series 2005 F-1,
4.650% 11/01/25 | | | 5,000,000 | | | | 5,154,500 | | |
| Resolution Trust Corp. | |
| | | Pass-Through Certificates,
Series 1993 A,
8.500% 12/01/16(f) | | | 6,615,223 | | | | 6,604,241 | | |
| | Multi-Family Total | | | | | | | 55,855,772 | | |
| Single-Family – 0.6% | |
| CA Housing Finance Authority | |
| | | Series 1984 B,
(a) 08/01/16 | | | 275,000 | | | | 95,945 | | |
| CO El Paso County School District No. 11 | |
| | | Series 1988 A, AMT,
Insured: GNMA
8.375% 03/25/19 | | | 119,209 | | | | 121,544 | | |
| CO Housing Finance Authority | |
| | | Series 1996 B-1, AMT,
7.650% 11/01/26 | | | 60,000 | | | | 60,971 | | |
| FL Brevard County | |
| | | Series 1985,
Insured: FGIC
(a) 04/01/17 | | | 430,000 | | | | 153,519 | | |
| FL Lee County Housing Finance Authority | |
| | | Series 1998 A-2, AMT,
Insured: GNMA
6.300% 03/01/29 | | | 135,000 | | | | 136,382 | | |
| IL Chicago | |
| | | Series 1997 A, AMT,
Insured: GNMA
7.250% 09/01/28 | | | 30,000 | | | | 30,872 | | |
| LA Jefferson Parish Home Mortgage Authority | |
| | | Series 1999 B-1, AMT,
Insured: GNMA
6.750% 06/01/30 | | | 420,000 | | | | 420,025 | | |
| MA Housing Finance Agency | |
| | | Series 1992 21, AMT,
7.125% 06/01/25 | | | 665,000 | | | | 665,818 | | |
| | Series 1992, AMT,
Insured: AMBAC
7.125% 06/01/25 | | | 220,000 | | | | 220,279 | | |
See Accompanying Notes to Financial Statements.
16
Columbia Tax-Exempt Fund
November 30, 2006
| Municipal Bonds – (continued) | |
| | | | | Par ($) | | Value ($) | |
| Housing – (continued) | |
| Single-Family – (continued) | |
| MD Community Development Administration Department of Housing & Community Development | |
| | | Series 2006 B, AMT,
4.900% 09/01/37 | | | 5,000,000 | | | | 5,123,400 | | |
| ME Housing Authority | |
| | | Series 2006 D, AMT,
4.950% 11/15/31 | | | 2,075,000 | | | | 2,139,782 | | |
| MO Housing Development Commission | |
| | | Series 2006, AMT,
Insured: GNMA
4.750% 09/01/21 | | | 1,000,000 | | | | 1,023,670 | | |
| NC Housing Finance Agency | |
| | | Series 1998, AMT,
5.250% 03/01/17 | | | 295,000 | | | | 303,859 | | |
| NM Mortgage Finance Authority | |
| | | Series 1997 C-2, AMT,
Insured: GNMA
6.050% 07/01/28 | | | 405,000 | | | | 412,687 | | |
| | Series 1999 D-2, AMT,
Insured: GNMA
6.750% 09/01/29 | | | 1,135,000 | | | | 1,157,814 | | |
| | | Series 2000 A-2, AMT,
Insured: FHA
7.100% 09/01/30 | | | 265,000 | | | | 272,910 | | |
| OH Housing Finance Agency | |
| | | Series 1997 A-1, AMT,
Insured: GNMA
6.050% 09/01/17 | | | 290,000 | | | | 298,500 | | |
| OK Housing Finance Agency | |
| | | Series 1999 B-1,
Insured: GNMA
6.800% 09/01/16 | | | 165,000 | | | | 169,582 | | |
| OR Department of Housing & Community Services | |
| | | Series 1998 A,
5.150% 07/01/15 | | | 35,000 | | | | 35,929 | | |
| WA Housing Finance Commission | |
| | | Series 2006 3A, AMT,
Insured: GNMA
5.000% 12/01/37 | | | 3,000,000 | | | | 3,080,970 | | |
| | Single-Family Total | | | | | | | 15,924,458 | | |
| Housing Total | | | | | | | | | 79,343,516 | | |
| Industrials – 2.4% | |
| Food Products – 0.5% | |
| FL Hendry County Industrial Development Authority | |
| | | Savannah Foods & Industries,
Series 1992, AMT,
6.400% 03/01/17 | | | 1,500,000 | | | | 1,518,690 | | |
| MI Strategic Fund | |
| | | Imperial Holly Corp.:
Series 1998 A,
6.250% 11/01/15 | | | 2,250,000 | | | | 2,324,385 | | |
See Accompanying Notes to Financial Statements.
17
Columbia Tax-Exempt Fund
November 30, 2006
| Municipal Bonds – (continued) | |
| | | | | Par ($) | | Value ($) | |
| Industrials – (continued) | |
| Food Products – (continued) | |
| | Series 1998 B,
6.450% 11/01/25 | | | 3,500,000 | | | | 3,588,060 | | |
| | | Series 1998 C, AMT,
6.550% 11/01/25 | | | 4,250,000 | | | | 4,349,280 | | |
| | Food Products Total | | | | | | | 11,780,415 | | |
| Forest Products & Paper – 0.5% | |
| FL Escambia County Environmental Improvement Revenue | |
| | | International Paper Co.,
Series 2003 A, AMT,
5.750% 11/01/27 | | | 2,750,000 | | | | 2,933,810 | | |
| IA Cedar Rapids | |
| | | Weyerhaeuser Co.,
Series 1984,
9.000% 08/01/14 | | | 1,000,000 | | | | 1,258,290 | | |
| MS Lowndes County | |
| | | Weyerhaeuser Co.,
Series 1992,
6.800% 04/01/22 | | | 2,470,000 | | | | 3,023,576 | | |
| SC Georgetown County | |
| | | International Paper Co.,
Series 2000 A,
5.950% 03/15/14 | | | 4,000,000 | | | | 4,411,680 | | |
| SC Richland County | |
| | | International Paper Co.,
Series 2003, AMT,
6.100% 04/01/23 | | | 1,000,000 | | | | 1,093,440 | | |
| | Forest Products & Paper Total | | | | | | | 12,720,796 | | |
| Manufacturing – 0.6% | |
| AL McIntosh Industrial Development Board | |
| | | CIBA Specialty Chemicals,
Series 1998,
5.375% 06/01/28 | | | 1,000,000 | | | | 1,022,950 | | |
| IL Will-Kankakee Regional Development Authority | |
| | | Flanders Corp.,
Series 1997, AMT,
6.500% 12/15/17 | | | 2,220,000 | | | | 2,263,912 | | |
| KS Wichita Airport Authority | |
| | | Cessna Citation Service Center,
Series 2002 A, AMT,
GTY AGMT: Textron, Inc.
6.250% 06/15/32 | | | 5,000,000 | | | | 5,368,000 | | |
| MN Alexandria Industrial Development | |
| | | Seluemed LLP,
Series 1998, AMT,
5.850% 03/01/18 | | | 830,000 | | | | 832,772 | | |
| MO Development Finance Board | |
| | | Procter & Gamble Co.,
Series 1999, AMT,
5.200% 03/15/29 | | | 4,385,000 | | | | 5,022,316 | | |
See Accompanying Notes to Financial Statements.
18
Columbia Tax-Exempt Fund
November 30, 2006
| Municipal Bonds – (continued) | |
| | | | | Par ($) | | Value ($) | |
| Industrials – (continued) | |
| Manufacturing – (continued) | |
| MO St. Louis Industrial Development Authority | |
| | | Anheuser-Busch Companies, Inc.,
Series 1991,
6.650% 05/01/16 | | | 1,400,000 | | | | 1,698,914 | | |
| | Manufacturing Total | | | | | | | 16,208,864 | | |
| Metals & Mining – 0.0% | |
| NV Department of Business & Industry | |
| | | Wheeling-Pittsburgh Steel Corp.,
Series 1999 A, AMT,
8.000% 09/01/14(f) | | | 1,030,000 | | | | 1,076,607 | | |
| | Metals & Mining Total | | | | | | | 1,076,607 | | |
| Oil & Gas – 0.5% | |
| NJ Middlesex County Pollution Control Authority | |
| | | Amerada Hess Corp.,
Series 2004,
6.050% 09/15/34 | | | 1,140,000 | | | | 1,256,189 | | |
| TN Maury County Industrial Development Board | |
| | | Occidental Petroleum Corp.,
Series 2001 A, AMT,
6.250% 08/01/18 | | | 4,000,000 | | | | 4,354,040 | | |
| TX Texas City Industrial Development Corp. | |
| | | BP Pipelines N.A., Inc.,
Series 1990,
7.375% 10/01/20 | | | 2,000,000 | | | | 2,632,460 | | |
| VI Virgin Islands Public Finance Authority | |
| | | Hovensa LLC,
Series 2003, AMT,
6.125% 07/01/22 | | | 2,975,000 | | | | 3,309,241 | | |
| | Oil & Gas Total | | | | | | | 11,551,930 | | |
| Other Industrial Development Bonds – 0.3% | |
| MI Strategic Fund Obligation Ltd. | |
| | | NSF International,
Series 2004,
5.250% 08/01/26 | | | 600,000 | | | | 630,228 | | |
| NJ Economic Development Authority | |
| | | GMT Realty LLC,
Series 2006 B, AMT,
6.875% 01/01/37 | | | 7,000,000 | | | | 7,138,180 | | |
| | Other Industrial Development Bonds Total | | | | | | | 7,768,408 | | |
| Industrials Total | | | | | | | | | 61,107,020 | | |
| Other – 19.8% | |
| Other – 0.0% | |
| PR Commonwealth of Puerto Rico Government Development Bank | |
| | | Series 2006 B,
5.000% 12/01/15 | | | 1,100,000 | | | | 1,192,169 | | |
| | Other Total | | | | | | | 1,192,169 | | |
See Accompanying Notes to Financial Statements.
19
Columbia Tax-Exempt Fund
November 30, 2006
| Municipal Bonds – (continued) | |
| | | | | Par ($) | | Value ($) | |
| Other – (continued) | |
| Pool/Bond Bank – 1.0% | |
| FL Municipal Loan Council | |
| | | Series 2000 A,
Insured: MBIA
(a) 04/01/21 | | | 1,000,000 | | | | 549,530 | | |
| MA Water Pollution Abatement Trust | |
| | | Series 1999 A,
6.000% 08/01/17 | | | 10,000,000 | | | | 12,000,000 | | |
| | | Series 2006,
5.250% 08/01/24(e) | | | 4,000,000 | | | | 4,656,680 | | |
| MI Municipal Bond Authority | |
| | | Series 1991 C,
Insured: FSA
(a) 06/15/15 | | | 3,380,000 | | | | 2,428,327 | | |
| | | Series 2001,
5.250% 10/01/19 | | | 1,000,000 | | | | 1,068,920 | | |
| OH Water Development Authority | |
| | | Water Pollution Control,
Series 2005 B,
4.750% 06/01/25 | | | 5,000,000 | | | | 5,260,650 | | |
| | Pool/Bond Bank Total | | | | | | | 25,964,107 | | |
| Refunded/Escrowed(g) – 18.0% | |
| AK Anchorage | |
| | | Ice Rink Revenue,
Series 1998,
Pre-refunded 07/01/10,
6.250% 01/01/12 | | | 1,430,000 | | | | 1,500,542 | | |
| AL Phoenix County Industrial Development Board | |
| | | Mead Coated Board, Inc.,
Series 1998 B,
Pre-refunded 04/01/08,
5.250% 04/01/28 | | | 6,750,000 | | | | 7,016,085 | | |
| AZ Maricopa County Industrial Development Authority | |
| | | Single Family,
Series 1984,
Escrowed to Maturity,
(a) 02/01/16 | | | 4,500,000 | | | | 3,157,650 | | |
| | | Windsor Housing,
Series 1996 A,
Escrowed to Maturity,
6.625% 07/01/26 | | | 2,750,000 | | | | 2,811,957 | | |
| AZ Pima County Industrial Development Authority | |
| | | Series 1989, AMT,
Escrowed to Maturity,
8.200% 09/01/21 | | | 12,370,000 | | | | 16,925,129 | | |
| AZ Tucson & Pima Counties Industrial Development Authority | |
| | | Series 1983 A,
Escrowed to Maturity,
(a) 12/01/14 | | | 5,000,000 | | | | 3,700,050 | | |
See Accompanying Notes to Financial Statements.
20
Columbia Tax-Exempt Fund
November 30, 2006
| Municipal Bonds – (continued) | |
| | | | | Par ($) | | Value ($) | |
| Other – (continued) | |
| Refunded/Escrowed(g) – (continued) | |
| CA Department of Water Resources | |
| | | Series 2002 A,
Pre-refunded 05/01/12:
5.125% 05/01/18 | | | 2,500,000 | | | | 2,727,375 | | |
| | Insured: AMBAC
5.375% 05/01/18 | | | 1,000,000 | | | | 1,103,210 | | |
| CA Foothill Eastern Transportation Corridor Agency | |
| | | Series 1995 A,
Escrowed to Maturity,
(a) 01/01/18 | | | 10,000,000 | | | | 6,418,400 | | |
| CA Morgan Hill Unified School District | |
| | | Series 2002,
Insured: FGIC
(a) 08/01/22 | | | 3,345,000 | | | | 1,743,983 | | |
| CA Palmdale Community Redevelopment Agency | |
| | | Series 1986 A, AMT,
Escrowed to Maturity,
Insured: FHA
8.000% 03/01/16 | | | 3,000,000 | | | | 4,008,300 | | |
| | | Series 1986 D, AMT,
Escrowed to Maturity,
Insured: MBIA
8.000% 04/01/16 | | | 7,000,000 | | | | 9,370,550 | | |
| CA Perris Community Facilities District | |
| | | Series 1991 2-90,
Escrowed to Maturity,
8.750% 10/01/21 | | | 6,165,000 | | | | 9,514,999 | | |
| CA Pomona | |
| | | Series 1990 A,
Escrowed to Maturity,
Insured: GNMA
7.600% 05/01/23 | | | 9,710,000 | | | | 12,753,891 | | |
| CA Riverside County | |
| | | Series 1998, AMT,
Escrowed to Maturity,
Insured: GNMA
8.300% 11/01/12 | | | 10,000,000 | | | | 12,389,400 | | |
| CA San Francisco Bay Area Rapid Transit District | |
| | | Series 1999,
Pre-refunded 07/01/09,
5.500% 07/01/26(h) | | | 10,000,000 | | | | 10,609,600 | | |
| CO El Paso County School District No. 11 | |
| | | Series 1996:
7.100% 12/01/18
7.125% 12/01/20 | | | 2,000,000
7,350,000 | | | | 2,552,000
9,380,437 | | |
| CO Health Facilities Authority | |
| | | Catholic Health Initiatives,
Series 2002 A,
Escrowed to Maturity,
5.000% 03/01/11 | | | 1,350,000 | | | | 1,423,292 | | |
| CO Highlands Ranch Metropolitan District No. 2 | |
| | | Series 1996,
Escrowed to Maturity,
Insured: FSA
6.500% 06/15/12 | | | 530,000 | | | | 607,444 | | |
See Accompanying Notes to Financial Statements.
21
Columbia Tax-Exempt Fund
November 30, 2006
| Municipal Bonds – (continued) | |
| | | | | Par ($) | | Value ($) | |
| Other – (continued) | |
| Refunded/Escrowed(g) – (continued) | |
| CO Mesa County | |
| | | Series 1992,
Escrowed to Maturity,
(a) 12/01/11 | | | 5,905,000 | | | | 4,903,394 | | |
| CT Health & Educational Facility Authority | |
| | | Series 2000 A,
Pre-refunded 07/01/10,
6.000% 07/01/25 | | | 3,260,000 | | | | 3,553,041 | | |
| DC Hospital Revenue | |
| | | Medlantic Healthcare,
Series 1997 A,
Escrowed to Maturity,
Insured: MBIA
5.375% 08/15/15 | | | 9,000,000 | | | | 9,284,400 | | |
| FL Highlands County Health Facilities Authority | |
| | | Adventist Health Systems,
Series 2003 D,
Pre-refunded 11/15/13,
5.375% 11/15/35 | | | 3,450,000 | | | | 3,817,218 | | |
| FL Jacksonville Transportation Authority | |
| | | Series 1985,
Escrowed to Maturity,
9.200% 01/01/15 | | | 2,000,000 | | | | 2,591,360 | | |
| FL Melbourne | |
| | | Series 2000 A,
Escrowed to Maturity,
Insured: FGIC
(a) 10/01/19 | | | 600,000 | | | | 362,706 | | |
| FL Mid-Bay Bridge Authority | |
| | | Series 1991 A,
Escrowed to Maturity,
6.875% 10/01/22 | | | 2,000,000 | | | | 2,655,400 | | |
| FL Orange County Health Facilities Authority | |
| | | Orlando Regional Healthcare System:
Series 1996 A,
Escrowed to Maturity,
Insured: MBIA
6.250% 10/01/16 | | | 2,120,000 | | | | 2,531,110 | | |
| | | Series 1999 E,
Pre-refunded 10/01/09,
6.000% 10/01/26 | | | 145,000 | | | | 155,565 | | |
| Series 1996 A, | | Escrowed to Maturity,
Insured: MBIA
6.250% 10/01/16 | | | 55,000 | | | | 65,071 | | |
| FL Orlando Utilities Commission Water & Electric Revenue | |
| | | Series 1989 D,
Escrowed to Maturity,
6.750% 10/01/17 | | | 3,750,000 | | | | 4,520,475 | | |
See Accompanying Notes to Financial Statements.
22
Columbia Tax-Exempt Fund
November 30, 2006
| Municipal Bonds – (continued) | |
| | | | | Par ($) | | Value ($) | |
| Other – (continued) | |
| Refunded/Escrowed(g) – (continued) | |
| FL Seminole County | |
| | | Series 1992,
Escrowed to Maturity,
Insured: MBIA
6.000% 10/01/19 | | | 1,030,000 | | | | 1,218,099 | | |
| FL Tampa Bay Water Utility Systems | |
| | | Series 1999,
Pre-refunded 10/01/11,
5.750% 10/01/29(h) | | | 3,000,000 | | | | 3,290,760 | | |
| GA Forsyth County Hospital Authority | |
| | | Baptist Health Care System,
Series 1998,
Escrowed to Maturity,
6.000% 10/01/08 | | | 325,000 | | | | 334,217 | | |
| GA Fulton County Water & Sewer | |
| | | Series 1992,
Insured: FGIC
6.375% 01/01/14 | | | 19,080,000 | | | | Escrowed to Maturity,
21,592,264 | | |
| GA Municipal Electric Authority | |
| | | Series 1991,
Escrowed to Maturity,
Insured: MBIA:
6.600% 01/01/18
6.600% 01/01/18 | | | 420,000
3,600,000 | | | | 498,422
4,342,752 | | |
| | Series 1998 Y:
Escrowed to Maturity,
Insured: AMBAC
6.400% 01/01/13 | | | 55,000 | | | | 61,843 | | |
| | | Pre-refunded 01/01/11,
Insured: AMBAC
6.400% 01/01/13 | | | 10,000 | | | | 11,076 | | |
| ID Health Facilities Authority | |
| | | IHC Hospitals, Inc.,
Series 1992,
Escrowed to Maturity,
6.650% 02/15/21 | | | 6,000,000 | | | | 7,795,620 | | |
| IL Chicago Metropolitan Water Reclamation District-Greater Chicago | |
| | | Series 1993,
Escrowed to Maturity,
5.500% 12/01/12 | | | 3,000,000 | | | | 3,271,860 | | |
| IL Educational Facilities Authority | |
| | | Educational Advancement Fund, Inc.,
Series 2002,
Pre-refunded 05/01/12,
6.625% 05/01/17 | | | 4,500,000 | | | | 5,207,760 | | |
| IL Glendale Heights | |
| | | Series 1985 B,
Escrowed to Maturity,
7.100% 12/01/15 | | | 1,440,000 | | | | 1,668,845 | | |
See Accompanying Notes to Financial Statements.
23
Columbia Tax-Exempt Fund
November 30, 2006
| Municipal Bonds – (continued) | |
| | | | | Par ($) | | Value ($) | |
| Other – (continued) | |
| Refunded/Escrowed(g) – (continued) | |
| IL Metropolitan Pier & Exposition Authority | |
| | | Series 1993 A,
Escrowed to Maturity,
Insured: FGIC
(a) 06/15/13 | | | 8,750,000 | | | | 6,853,262 | | |
| | Series 1996,
Escrowed to Maturity,
Insured: MBIA
(a) 06/15/12 | | | 2,655,000 | | | | 2,160,958 | | |
| IN Health Facility Financing Authority | |
| | | Daughters of Charity Health,
Series 1997 D,
Pre-refunded 11/01/07,
5.000% 11/01/26(d) | | | 3,195,000 | | | | 3,235,001 | | |
| MA College Building Authority | |
| | | Series 1999 A,
Escrowed to Maturity,
Insured: MBIA:
(a) 05/01/19
(a) 05/01/20 | | | 7,710,000
7,750,000 | | | | 4,708,728
4,531,037 | | |
| MA Port Authority | |
| | | Series 1999 C,
Pre-refunded 01/01/10,
5.750% 07/01/29(h) | | | 5,000,000 | | | | 5,366,600 | | |
| MA Turnpike Authority | |
| | | Series 1993 A,
Escrowed to Maturity:
5.000% 01/01/20 | | | 3,610,000 | | | | 3,972,408 | | |
| | Insured: FGIC:
5.000% 01/01/20
5.125% 01/01/23 | | | 12,665,000
3,600,000 | | | | 13,936,439
4,131,180 | | |
| MI Cornell Township Economic Development Corp. | |
| | | Mead Corp.,
Series 2002,
Pre-refunded 05/01/12,
5.875% 05/01/18 | | | 1,000,000 | | | | 1,113,150 | | |
| MI State | |
| | | 525 Redevco, Inc.,
Series 2000,
Escrowed to Maturity,
Insured: AMBAC
(a) 06/01/21 | | | 6,000,000 | | | | 3,297,660 | | |
| MN Dakota & Washington Counties Housing & Redevelopment Authority | |
| | | Series 1988, AMT,
Escrowed to Maturity,
Insured: GNMA
8.150% 09/01/16 | | | 235,000 | | | | 317,090 | | |
| MN Higher Education Facilities Authority | |
| | | College Art & Design,
Series 2000 5-D,
Pre-refunded 05/01/10,
6.750% 05/01/26 | | | 500,000 | | | | 537,230 | | |
| MN Moorhead | |
| | | Series 1979,
Escrowed to Maturity,
Insured: FHA
7.100% 08/01/11 | | | 20,000 | | | | 21,748 | | |
See Accompanying Notes to Financial Statements.
24
Columbia Tax-Exempt Fund
November 30, 2006
| Municipal Bonds – (continued) | |
| | | | | Par ($) | | Value ($) | |
| Other – (continued) | |
| Refunded/Escrowed(g) – (continued) | |
| MN Robbinsdale Economic Development Authority | |
| | | Series 1999 A,
Pre-refunded 01/01/10,
6.875% 01/01/26 | | | 250,000 | | | | 273,528 | | |
| MN University of Minnesota | |
| | | Series 1996 A,
Escrowed to Maturity,
5.500% 07/01/21 | | | 1,000,000 | | | | 1,172,800 | | |
| MN Western Minnesota Municipal Power Agency | |
| | | Series 1983 A,
Escrowed to Maturity,
Insured: MBIA
9.750% 01/01/16 | | | 1,000,000 | | | | 1,439,960 | | |
| NC Eastern Municipal Power Agency | |
| | | Series 1987 A,
Pre-refunded 01/01/22,
4.500% 01/01/24 | | | 1,750,000 | | | | 1,870,417 | | |
| | Series 1991 A,
Escrowed to Maturity:
5.000% 01/01/21
6.500% 01/01/18 | | | 8,735,000
5,815,000 | | | | 9,759,790
7,272,413 | | |
| NC Lincoln County | |
| | | Lincoln County Hospital,
Series 1991,
Escrowed to Maturity,
9.000% 05/01/07 | | | 105,000 | | | | 107,219 | | |
| NE Omaha Public Power District | |
| | | Series 1992 B,
Escrowed to Maturity,
6.200% 02/01/17 | | | 1,600,000 | | | | 1,870,960 | | |
| NJ Highway Authority | |
| | | Series 1971,
Escrowed to Maturity,
6.500% 01/01/11 | | | 571,000 | | | | 600,789 | | |
| NJ Transportation Trust Fund Authority | |
| | | Series 1995 B,
Escrowed to Maturity,
Insured: MBIA
7.000% 06/15/12 | | | 10,135,000 | | | | 11,863,119 | | |
| NJ Turnpike Authority | |
| | | Series 1991 C,
Escrowed to Maturity,
Insured: MBIA
6.500% 01/01/16 | | | 11,000,000 | | | | 12,943,700 | | |
| | | Series 2005 C,
Escrowed to Maturity,
Insured: MBIA
6.500% 01/01/16 | | | 965,000 | | | | 1,135,516 | | |
| NV Henderson | |
| | | Catholic Healthcare West,
Series 1999 A,
Pre-refunded 07/01/10,
6.750% 07/01/20 | | | 3,680,000 | | | | 4,095,030 | | |
See Accompanying Notes to Financial Statements.
25
Columbia Tax-Exempt Fund
November 30, 2006
| Municipal Bonds – (continued) | |
| | | | | Par ($) | | Value ($) | |
| Other – (continued) | |
| Refunded/Escrowed(g) – (continued) | |
| NY New York City Municipal Water Finance Authority | |
| | | Series 1999 A,
Pre-refunded 06/15/09,
5.500% 06/15/32(h) | | | 10,000,000 | | | | 10,581,300 | | |
| NY Triborough Bridge & Tunnel Authority | |
| | | Series 1992 Y,
Escrowed to Maturity,
6.125% 01/01/21 | | | 14,000,000 | | | | 17,313,380 | | |
| | Series 1992,
Escrowed to Maturity,
Insured: CAP
6.125% 01/01/21 | | | 7,000,000 | | | | 8,656,690 | | |
| OH Cleveland-Cuyahoga County Port Authority | |
| | | Oglebay Norton Co.,
Series 1997, AMT,
Escrowed to Maturity,
6.000% 03/01/07 | | | 115,000 | | | | 115,555 | | |
| OH Hilliard School District | |
| | | Series 1995 A,
Escrowed to Maturity,
Insured: FGIC
(a) 12/01/12 | | | 2,505,000 | | | | 2,008,985 | | |
| PA Cambria County Industrial Development Authority | |
| | | Beverly Enterprises,
Series 1987,
Escrowed to Maturity,
10.000% 06/18/12 | | | 900,000 | | | | 1,070,145 | | |
| PA Convention Center Authority | |
| | | Series 1989 A,
Escrowed to Maturity,
Insured: FGIC
6.000% 09/01/19 | | | 14,010,000 | | | | 16,931,365 | | |
| PA Pottstown Boro Authority | |
| | | Sewer Revenue,
Series 1991,
Escrowed to Maturity,
Insured: FGIC
(a) 11/01/16 | | | 1,000,000 | | | | 681,850 | | |
| PA Westmoreland County Municipal Authority | |
| | | Series 2000 A,
Escrowed to Maturity,
Insured: FGIC
(a) 08/15/23 | | | 5,000,000 | | | | 2,315,800 | | |
| PR Commonwealth of Puerto Rico Public Finance Corp. | |
| | | Series 2002 E,
Escrowed to Maturity,
6.000% 08/01/26 | | | 230,000 | | | | 295,125 | | |
| SC Piedmont Municipal Power Agency | |
| | | Series 1991 A,
Escrowed to Maturity,
Insured: FGIC
6.125% 01/01/07 | | | 75,000 | | | | 75,162 | | |
| | | Series 1993,
Escrowed to Maturity:
Insured: AMBAC
(a) 01/01/13 | | | 9,800,000 | | | | 7,440,258 | | |
See Accompanying Notes to Financial Statements.
26
Columbia Tax-Exempt Fund
November 30, 2006
| Municipal Bonds – (continued) | |
| | | | | Par ($) | | Value ($) | |
| Other – (continued) | |
| Refunded/Escrowed(g) – (continued) | |
| | Insured: MBIA
5.375% 01/01/25 | | | 3,960,000 | | | | 4,712,044 | | |
| | | Series 1998,
Escrowed to Maturity:
Insured: AMBAC
(a) 01/01/13 | | | 18,585,000 | | | | 12,973,817 | | |
| | | Insured: MBIA
5.375% 01/01/25 | | | 435,000 | | | | 515,162 | | |
| TX Harris County Health Facilities Development Corp. | |
| | | Christus Health,
Series 1999 A,
Pre-refunded 07/01/09,
Insured: MBIA
5.375% 07/01/19(h) | | | 18,000,000 | | | | 18,932,040 | | |
| TX Houston Water & Sewer System | |
| | | Series 1998 A,
Escrowed to Maturity,
Insured: FSA:
(a) 12/01/19
(a) 12/01/23 | | | 26,955,000
2,515,000 | | | | 15,902,102
1,238,487 | | |
| TX Municipal Power Agency | |
| | | Series 1989,
Escrowed to Maturity,
Insured: AMBAC:
(a) 09/01/10
(a) 09/01/11
(a) 09/01/12 | | | 350,000
560,000
205,000 | | | | 305,235
470,014
165,458 | | |
| | | Series 1993,
Escrowed to Maturity,
Insured: MBIA
(a) 09/01/15 | | | 185,000 | | | | 132,238 | | |
| TX North Central Health Facility Development Corp. | |
| | | Series 1991 A,
Escrowed to Maturity,
6.625% 06/01/11 | | | 2,000,000 | | | | 2,141,620 | | |
| TX Research Laboratory Commission Finance Authority | |
| | | Superconducting Super Collider,
Series 1991,
Escrowed to Maturity,
6.950% 12/01/12 | | | 10,000,000 | | | | 11,008,900 | | |
| UT Provo | |
| | | Series 1980,
Escrowed to Maturity,
10.125% 04/01/15 | | | 1,485,000 | | | | 1,885,757 | | |
| UT Utah County Hospital Revenue | |
| | | IHC Health Services, Inc.,
Series 1997,
Escrowed to Maturity,
Insured: MBIA
5.250% 08/15/26 | | | 2,500,000 | | | | 2,553,000 | | |
See Accompanying Notes to Financial Statements.
27
Columbia Tax-Exempt Fund
November 30, 2006
| Municipal Bonds – (continued) | |
| | | | | Par ($) | | Value ($) | |
| Other – (continued) | |
| Refunded/Escrowed(g) – (continued) | |
| WA Public Power Supply System | |
| | | Series 1992 A,
Escrowed to Maturity,
Insured: MBIA
(a) 07/01/11 | | | 2,315,000 | | | | 1,954,971 | | |
| | | Series 1990 B,
Escrowed to Maturity, | | | | | | | | | |
| | | 7.250% 07/01/09 | | | 855,000 | | | | 900,546 | | |
| WV Hospital Finance Authority | |
| | | Charleston Area Medical Center,
Series 2000,
Pre-refunded 09/01/10,
6.750% 09/01/30 | | | 10,410,000 | | | | 11,637,859 | | |
| | | Refunded/Escrowed Total | | | | | | | 466,950,149 | | |
| Tobacco – 0.8% | |
NJ Tobacco Settlement
Financing Corp. | |
| | | Series 2003,
6.750% 06/01/39 | | | 6,165,000 | | | | 7,089,319 | | |
| NY TSASC, Inc. | |
| | | Series 2006 1,
5.000% 06/01/26 | | | 2,000,000 | | | | 2,054,820 | | |
| SC Tobacco Settlement Management Authority | |
| | | Series 2001 B,
6.375% 05/15/28 | | | 4,500,000 | | | | 4,892,040 | | |
| VA Tobacco Settlement Financing Corp. | |
| | | Series 2005,
5.500% 06/01/26 | | | 5,000,000 | | | | 5,332,200 | | |
| WI Badger TOB Asset Securitization Corp. | |
| | | Series 2002,
5.750% 06/01/12 | | | 2,450,000 | | | | 2,638,601 | | |
| | | Tobacco Total | | | | | | | 22,006,980 | | |
| Other Total | | | | | | | | | 516,113,405 | | |
| Other Revenue – 1.0% | |
| Hotels – 0.3% | |
| MA Boston Industrial Development Financing Authority | |
| | | Crosstown Center Hotel LLC,
Series 2002, AMT,
6.500% 09/01/35 | | | 2,965,000 | | | | 3,098,365 | | |
| NJ Middlesex County Improvement Authority | |
| | | Heldrich Associates LLC,
Series 2005 B,
6.250% 01/01/37 | | | 4,000,000 | | | | 4,164,720 | | |
| | | Hotels Total | | | | | | | 7,263,085 | | |
| Recreation – 0.7% | |
| CA Agua Caliente Band Cahuilla Indians | |
| | | Series 2003,
6.000% 07/01/18 | | | 1,750,000 | | | | 1,908,725 | | |
| CA Cabazon Band Mission Indians | |
| | | Series 2004:
8.375% 10/01/15(f)
8.750% 10/01/19(f) | | | 2,085,000
7,680,000 | | | | 2,158,892
8,033,741 | | |
| CO Metropolitan Football Stadium District | |
| | | Series 1999 A,
Insured: MBIA
(a) 01/01/11 | | | 3,650,000 | | | | 3,133,379 | | |
See Accompanying Notes to Financial Statements.
28
Columbia Tax-Exempt Fund
November 30, 2006
| Municipal Bonds – (continued) | |
| | | | | Par ($) | | Value ($) | |
| Other Revenue – (continued) | |
| Recreation – (continued) | |
| OR Cow Creek Band Umpqua Tribe of Indians | |
| | | Series 2006 C,
5.625% 10/01/26(f) | | | 3,500,000 | | | | 3,588,200 | | |
| | | Recreation Total | | | | | | | 18,822,937 | | |
| Retail – 0.0% | |
| OH Lake County | |
| | | North Madison Properties,
Series 1993,
8.819% 09/01/11 | | | 145,000 | | | | 146,633 | | |
| | | Retail Total | | | | | | | 146,633 | | |
| Other Revenue Total | | | | | | | | | 26,232,655 | | |
| Resource Recovery – 0.4% | |
| Disposal – 0.2% | |
| NC Haywood County Industrial Facilities & Pollution Control Financing Authority | |
| | | Champion International Corp.,
Series 1999, AMT,
6.400% 11/01/24 | | | 2,425,000 | | | | 2,570,233 | | |
| NV Department of Business & Industry | |
| | | Republic Services, Inc.,
Series 2003, AMT,
5.625% 12/01/26 | | | 2,000,000 | | | | 2,222,200 | | |
| | | Disposal Total | | | | | | | 4,792,433 | | |
| Resource Recovery – 0.2% | |
| FL Palm Beach County Solid Waste Authority | |
| | | Series 1998 A,
Insured: AMBAC
(a) 10/01/12 | | | 1,855,000 | | | | 1,489,992 | | |
| MA Industrial Finance Agency | |
| | | Ogden Haverhill Associates,
Series 1998 A, AMT,
5.400% 12/01/11 | | | 3,300,000 | | | | 3,436,356 | | |
| | | Resource Recovery Total | | | | | | | 4,926,348 | | |
| Resource Recovery Total | | | | | | | | | 9,718,781 | | |
| Tax-Backed – 36.2% | |
| Local Appropriated – 2.3% | |
| CA Los Angeles County Schools | |
| | | Series 1999 A,
Insured: AMBAC
(a) 08/01/22 | | | 2,180,000 | | | | 1,109,031 | | |
| IL Chicago Board of Education | |
| | | Series 1992 A,
Insured: MBIA:
6.000% 01/01/16
6.000% 01/01/20
6.250% 01/01/15 | | | 5,000,000
8,000,000
12,900,000 | | | | 5,880,350
9,602,960
14,776,434 | | |
| IN Crown Point School Building Corp. | |
| | | Series 2000,
Insured: MBIA
(a) 01/15/19 | | | 8,165,000 | | | | 4,932,640 | | |
See Accompanying Notes to Financial Statements.
29
Columbia Tax-Exempt Fund
November 30, 2006
| Municipal Bonds – (continued) | |
| | | | | Par ($) | | Value ($) | |
| Tax-Backed – (continued) | |
| Local Appropriated – (continued) | |
| IN Noblesville Redevelopment Authority | |
| | | Series 2006 A,
5.250% 08/01/25 | | | 2,000,000 | | | | 2,157,100 | | |
| MN Hibbing Economic Development Authority | |
| | | Series 1997,
6.400% 02/01/12 | | | 500,000 | | | | 500,950 | | |
| MO St. Louis Industrial Development Authority | |
| | | St. Louis Convention Center,
Series 2000,
Insured: AMBAC
(a) 07/15/18 | | | 2,000,000 | | | | 1,244,920 | | |
| NC Rowan County | |
| | | Justice Center Project,
Series 1992,
6.250% 12/01/07 | | | 190,000 | | | | 192,143 | | |
| SC Scago Educational Facilities Corp. for Spartanburg School District No. 5 | |
| | | Series 2005,
Insured: FSA
4.600% 04/01/22 | | | 8,885,000 | | | | 9,167,188 | | |
| TX Houston Independent School District | |
| | | Series 1998 A,
Insured: AMBAC:
(a) 09/15/14
(a) 09/15/18
(a) 09/15/20 | | | 3,885,000
3,885,000
3,885,000 | | | | 2,872,258
2,388,032
2,178,125 | | |
| | Series 1998 B,
Insured: AMBAC
(a) 09/15/15 | | | 2,000,000 | | | | 1,413,860 | | |
| | | Local Appropriated Total | | | | | | | 58,415,991 | | |
| Local General Obligations – 13.2% | |
| AK North Slope Borough | |
| | | Series 1999 B,
Insured: MBIA
(a) 06/30/10 | | | 12,515,000 | | | | 10,955,005 | | |
| | | Series 2000 B,
Insured: MBIA:
(a) 06/30/10
(a) 06/30/11 | | | 20,000,000
15,000,000 | | | | 17,519,400
12,634,350 | | |
| | | Series 2001 A,
Insured: MBIA
(a) 06/30/12 | | | 23,000,000 | | | | 18,630,000 | | |
| AL Birmingham | |
| | | Series 2003 A,
Insured: AMBAC
5.250% 06/01/17 | | | 2,130,000 | | | | 2,344,086 | | |
| AL Jefferson County | |
| | | Series 2004 A,
5.250% 01/01/19 | | | 2,790,000 | | | | 3,024,723 | | |
| AZ Tucson | |
| | | Series 1994 G,
Insured: FGIC
7.625% 07/01/14 | | | 3,140,000 | | | | 3,969,965 | | |
See Accompanying Notes to Financial Statements.
30
Columbia Tax-Exempt Fund
November 30, 2006
| Municipal Bonds – (continued) | |
| | | | | Par ($) | | Value ($) | |
| Tax-Backed – (continued) | |
| Local General Obligations – (continued) | |
| CA Alvord Unified School District | |
| | Series 2002 A,
Insured: MBIA
5.900% 02/01/19 | | | 1,975,000 | | | | 2,367,452 | | |
| CA Benicia Unified School District | |
| | | Series 1997 A,
Insured: FGIC
(a) 08/01/21 | | | 5,955,000 | | | | 3,217,963 | | |
| CA Clovis Unified School District | |
| | | Series 2004 A:
Insured: FGIC
(a) 08/01/19
(a) 08/01/20 | | | 8,350,000
7,000,000 | | | | 4,943,784
3,960,600 | | |
| CA Corona-Norco Unified School District | |
| | | Series 2001 C,
Insured: FGIC
(a) 09/01/18 | | | 1,390,000 | | | | 859,729 | | |
| CA Fresno Unified School District | |
| | | Series 2002 A,
Insured: MBIA
6.000% 02/01/19 | | | 1,000,000 | | | | 1,217,080 | | |
| CA Golden West School Authority | |
| | | Series 1999 A,
Insured: MBIA:
(a) 08/01/14
(a) 08/01/15 | | | 3,980,000
1,500,000 | | | | 2,972,543
1,071,165 | | |
| CA Modesto High School District | |
| | | Series 2002 A,
Insured: FGIC
(a) 08/01/17 | | | 2,500,000 | | | | 1,624,750 | | |
| CA San Juan Unified School District | |
| | | Series 2001,
Insured: FSA:
(a) 08/01/17
(a) 08/01/18 | | | 1,525,000
1,785,000 | | | | 991,098
1,107,807 | | |
| CA San Ysidro School District | |
| | | Series 2005 D,
Insured: FGIC
(a) 08/01/23 | | | 2,330,000 | | | | 1,148,340 | | |
| CA Vallejo City Unified School District | |
| | | Series 2002 A,
Insured: MBIA
5.900% 02/01/20 | | | 1,000,000 | | | | 1,217,110 | | |
| CA West Contra Costa Unified School District | |
| | | Series 2001 B,
Insured: MBIA
6.000% 08/01/24 | | | 2,320,000 | | | | 2,896,938 | | |
| CA Yuba City Unified School District | |
| | | Series 2000,
Insured: FGIC
(a) 09/01/18 | | | 1,160,000 | | | | 717,472 | | |
See Accompanying Notes to Financial Statements.
31
Columbia Tax-Exempt Fund
November 30, 2006
| Municipal Bonds – (continued) | |
| | | | | Par ($) | | Value ($) | |
| Tax-Backed – (continued) | |
| Local General Obligations – (continued) | |
| CO Boulder Larimer & Weld Counties State Vrain Valley School District | |
| | | Series 2006,
Insured: FGIC
5.250% 12/15/20 | | | 2,000,000 | | | | 2,308,560 | | |
| CO El Paso County School District No. 11 | |
| | | Series 1996,
7.100% 12/01/16 | | | 2,105,000 | | | | 2,666,109 | | |
| CO Highlands Ranch Metropolitan District No. 2 | |
| | | Series 1996,
Insured: FSA
6.500% 06/15/12 | | | 470,000 | | | | 538,169 | | |
| HI Honolulu | |
| | | Series 1993 B,
8.000% 10/01/10 | | | 1,180,000 | | | | 1,359,820 | | |
| IL Champaign County | |
| | | Series 1999,
Insured: FGIC:
8.250% 01/01/20
8.250% 01/01/23 | | | 1,015,000
1,420,000 | | | | 1,444,030
2,099,328 | | |
| IL Chicago Board of Education | |
| | | Series 1998 B-1,
Insured: FGIC:
(a) 12/01/10
(a) 12/01/13
(a) 12/01/21
(a) 12/01/22 | | | 3,905,000
13,400,000
8,000,000
25,200,000 | | | | 3,372,007
10,266,544
4,256,720
12,796,308 | | |
| | Series 1999 A,
Insured: FGIC
(a) 12/01/09 | | | 5,000,000 | | | | 4,481,400 | | |
| | | Series 2005 A,
Insured: AMBAC
5.500% 12/01/22 | | | 4,750,000 | | | | 5,635,875 | | |
| IL Chicago | |
| | | Series 1999,
Insured: FGIC:
(a) 01/01/14
5.500% 01/01/23 | | | 2,000,000
9,750,000 | | | | 1,524,300
11,562,037 | | |
| IL Coles & Cumberland Counties Unified School District | |
| | | Series 2000,
Insured: FSA
(a) 12/01/12 | | | 3,030,000 | | | | 2,412,910 | | |
| IL Cook County Forest Preservation District | |
| | | Series 2004,
Insured: AMBAC
5.250% 11/15/21 | | | 2,000,000 | | | | 2,194,640 | | |
| IL Cook County High School District No. 209-Provisional Township | |
| | | Series 2004,
Insured: FSA
12/01/15
(5.000% 12/01/07) | | | 1,750,000 | | | | 1,818,250 | | |
| IL Cook County School District No. 102 | |
| | | Series 2001,
Insured: FGIC
(a) 12/01/20 | | | 3,065,000 | | | | 1,703,251 | | |
See Accompanying Notes to Financial Statements.
32
Columbia Tax-Exempt Fund
November 30, 2006
| Municipal Bonds – (continued) | |
| | | | | Par ($) | | Value ($) | |
| Tax-Backed – (continued) | |
| Local General Obligations – (continued) | |
| IL Cook County | |
| | Series 1997 A,
Insured: MBIA
5.625% 11/15/22 | | | 5,000,000 | | | | 5,137,500 | | |
| IL De Kalb County Community Unified School District No. 424 | |
| | | Series 2001,
Insured: AMBAC:
(a) 01/01/20
(a) 01/01/21 | | | 2,575,000
2,675,000 | | | | 1,490,873
1,479,302 | | |
| IL Development Finance Authority Elgin School District No. U46 | |
| | | Series 2001,
Insured: FSA
(a) 01/01/16 | | | 2,660,000 | | | | 1,851,121 | | |
| IL Du Page County Community High School District No. 99 | |
| | | Series 1998,
Insured: FSA:
(a) 12/01/10
(a) 12/01/11 | | | 2,245,000
1,280,000 | | | | 1,934,786
1,060,800 | | |
| IL Du Page County | |
| | | Series 1993,
5.600% 01/01/21 | | | 2,565,000 | | | | 2,940,824 | | |
| IL Kane & De Kalb Counties Community Unit School District No. 302 | |
| | | Series 2004,
Insured: FGIC
(a) 02/01/21 | | | 3,165,000 | | | | 1,739,294 | | |
| IL Lake & McHenry Counties Community Unified School District | |
| | | Series 1998,
Insured: FGIC:
(a) 02/01/09
(a) 02/01/10 | | | 2,355,000
2,060,000 | | | | 2,177,739
1,835,151 | | |
| IL Lake County School District No. 56 | |
| | | Series 1997,
Insured: FGIC
9.000% 01/01/17 | | | 10,440,000 | | | | 14,833,570 | | |
| IL Will County Forest Preservation District | |
| | | Series 1999 B,
Insured: FGIC
(a) 12/01/16 | | | 1,000,000 | | | | 670,330 | | |
| IL Will County School District No. 114 | |
| | | Series 2005 C,
Insured: FGIC
(a) 12/01/23 | | | 2,130,000 | | | | 1,033,284 | | |
| IL Will County United School District No. 365-UVY | |
| | | Series 1999 B,
Insured: FSA
(a) 11/01/18 | | | 3,370,000 | | | | 2,065,372 | | |
| IN Indianapolis-Marion County Public Library | |
| | | Series 2002 A,
4.700% 07/01/19 | | | 2,260,000 | | | | 2,335,190 | | |
| KS Wyandotte County School District No. 500 | |
| | | Series 2005,
Insured: FSA
5.250% 09/01/20 | | | 1,000,000 | | | | 1,152,980 | | |
See Accompanying Notes to Financial Statements.
33
Columbia Tax-Exempt Fund
November 30, 2006
| Municipal Bonds – (continued) | |
| | | | | Par ($) | | Value ($) | |
| Tax-Backed – (continued) | |
| Local General Obligations – (continued) | |
| KS Wyandotte County | |
| | Series 1998,
Insured: MBIA
4.500% 09/01/28 | | | 2,900,000 | | | | 2,914,007 | | |
| LA New Orleans | |
| | | Series 1991,
Insured: AMBAC
(a) 09/01/12 | | | 6,250,000 | | | | 4,962,562 | | |
| MI Detroit City School District | |
| | | Series 2005 A,
Insured: FSA
5.250% 05/01/30 | | | 10,000,000 | | | | 11,922,700 | | |
| MI Holland School District | |
| | | Series 1992,
Insured: AMBAC
(a) 05/01/17 | | | 1,190,000 | | | | 783,627 | | |
| MI Paw Paw Public School District | |
| | | Series 1998,
Insured: FGIC
5.000% 05/01/25 | | | 1,020,000 | | | | 1,156,313 | | |
| MI Redford Unified School District | |
| | | Series 1997,
Insured: AMBAC
5.000% 05/01/22 | | | 650,000 | | | | 729,840 | | |
| MI St. John's Public School | |
| | | Series 1998,
Insured: FGIC
5.100% 05/01/25 | | | 1,790,000 | | | | 2,054,992 | | |
| MN Elk River Independent School District No. 728 | |
| | | Series 2004 A,
Insured: FGIC
5.000% 02/01/19 | | | 1,950,000 | | | | 2,108,223 | | |
| MN Rosemount Independent School District No. 196 | |
| | | Series 1994 B,
Insured: CGIC
(a) 06/01/10 | | | 775,000 | | | | 682,070 | | |
| MO Independence School District | |
| | | Series 1991,
6.250% 03/01/11 | | | 855,000 | | | | 897,981 | | |
| MO Jefferson City School District | |
| | | Series 1991 A,
6.700% 03/01/11 | | | 1,450,000 | | | | 1,566,464 | | |
| MO Springfield School District No. R-12 | |
| | | Series 1991 B,
Insured: FGIC
9.500% 03/01/07 | | | 600,000 | | | | 608,724 | | |
| NC New Hanover County | |
| | | Series 2001,
5.000% 06/01/20 | | | 2,500,000 | | | | 2,684,700 | | |
| NE Omaha Convention Center/Arena | |
| | | Series 2004,
5.250% 04/01/23 | | | 5,000,000 | | | | 5,829,450 | | |
| NH Manchester School Facilities Revenue | |
| | | Series 2004,
Insured: MBIA
5.500% 06/01/22 | | | 2,000,000 | | | | 2,379,980 | | |
See Accompanying Notes to Financial Statements.
34
Columbia Tax-Exempt Fund
November 30, 2006
| Municipal Bonds – (continued) | |
| | | | | Par ($) | | Value ($) | |
| Tax-Backed – (continued) | |
| Local General Obligations – (continued) | |
| NJ Washington Township Board of Education Mercer County | |
| | Series 2005,
Insured: FSA
5.250% 01/01/27 | | | 1,410,000 | | | | 1,662,475 | | |
| OH Adams County Ohio Valley Local School District | |
| | | Series 1995,
Insured: MBIA
7.000% 12/01/15 | | | 3,000,000 | | | | 3,597,930 | | |
| OH Crooksville Exempt Village School District | |
| | | Series 1986,
7.375% 12/01/07 | | | 25,000 | | | | 25,744 | | |
| OH Cuyahoga County | |
| | | Series 1993 A,
Insured: MBIA
(a) 10/01/12 | | | 1,000,000 | | | | 803,230 | | |
| OH Dublin City School District | |
| | | Series 1997,
Insured: MBIA
(a) 12/01/11 | | | 900,000 | | | | 746,613 | | |
| OH Gahanna-Jefferson City School District | |
| | | Series 1993,
Insured: AMBAC
(a) 12/01/11 | | | 795,000 | | | | 659,508 | | |
| OH Kings Local School District | |
| | | Series 1995,
Insured: FGIC
7.500% 12/01/16 | | | 2,110,000 | | | | 2,623,257 | | |
| OH Massillon City School District | |
| | | Series 1994,
Insured: AMBAC:
(a) 12/01/09
(a) 12/01/11 | | | 900,000
1,000,000 | | | | 806,652
829,570 | | |
| OH Pickerington Local School District | |
| | | Series 2001,
Insured: FGIC:
(a) 12/01/14
(a) 12/01/15
(a) 12/01/16 | | | 2,000,000
1,500,000
1,340,000 | | | | 1,468,440
1,054,950
901,766 | | |
| OH River Valley Local School District | |
| | | School Facilities Construction & Improvement,
Series 2001,
Insured: FSA
5.250% 11/01/23 | | | 500,000 | | | | 583,020 | | |
| OH Tri-County North Local School District | |
| | | Series 1986,
8.125% 12/01/06 | | | 75,000 | | | | 75,000 | | |
| OH West Chester Township | |
| | | Series 2002,
Insured: AMBAC
5.750% 12/01/20 | | | 1,000,000 | | | | 1,209,020 | | |
| OR Clackamas County School District No. 108 | |
| | | Series 2005,
Insured: FSA
5.500% 06/15/24 | | | 1,130,000 | | | | 1,354,915 | | |
See Accompanying Notes to Financial Statements.
35
Columbia Tax-Exempt Fund
November 30, 2006
| Municipal Bonds – (continued) | |
| | | | | Par ($) | | Value ($) | |
| Tax-Backed – (continued) | |
| Local General Obligations – (continued) | |
| OR Linn County Community School District No. 9 | |
| | Series 2005,
Insured: FGIC
5.500% 06/15/30 | | | 1,435,000 | | | | 1,778,912 | | |
| PA Cornwall-Lebanon School District | |
| | | Series 2001,
Insured: FSA
(a) 03/15/18 | | | 3,020,000 | | | | 1,901,332 | | |
| PA Westmoreland County Municipal Authority | |
| | | Series 2000 A,
Insured: MBIA
(a) 06/01/13 | | | 3,000,000 | | | | 2,342,640 | | |
| SC Darlington County School District | |
| | | Series 2005,
Insured: FSA
5.000% 03/01/24 | | | 2,100,000 | | | | 2,259,999 | | |
| TN Metropolitan Government Nashville & Davidson County | |
| | | Series 1996,
Insured: MBIA
(a) 05/15/09 | | | 5,250,000 | | | | 4,801,020 | | |
| TX Brazosport Independent School District | |
| | | Series 2003 C,
Insured: PSFG
5.000% 02/15/16 | | | 1,150,000 | | | | 1,236,813 | | |
| TX Dallas County Flood Control District | |
| | | Series 2002,
7.250% 04/01/32 | | | 7,500,000 | | | | 8,053,275 | | |
| TX Galveston County | |
| | | Series 2001,
Insured: FGIC
(a) 02/01/20 | | | 1,510,000 | | | | 868,975 | | |
| TX Grande Prairie Independent School District | |
| | | Series 2002,
Insured: PSFG
5.000% 02/15/22 | | | 2,220,000 | | | | 2,338,259 | | |
| TX Harris County | |
| | | Series 2002,
Insured: MBIA
(a) 08/15/19 | | | 8,000,000 | | | | 4,723,120 | | |
| TX Hurst Euless Bedford Independent School District | |
| | | Series 1998,
Insured: PSFG
4.500% 08/15/25 | | | 16,000,000 | | | | 16,056,480 | | |
| TX Leander Independent School District | |
| | | Series 2002,
Insured: PSFG
5.375% 08/15/17 | | | 1,900,000 | | | | 2,063,324 | | |
| TX McKinney Independent School District | |
| | | Series 2001,
Insured: PSFG
5.125% 02/15/17 | | | 4,155,000 | | | | 4,406,627 | | |
See Accompanying Notes to Financial Statements.
36
Columbia Tax-Exempt Fund
November 30, 2006
| Municipal Bonds – (continued) | |
| | | | | Par ($) | | Value ($) | |
| Tax-Backed – (continued) | |
| Local General Obligations – (continued) | |
| TX North East Independent School District | |
| | | Series 1999,
Insured: PSFG
4.500% 10/01/28 | | | 6,000,000 | | | | 6,029,820 | | |
| WA Clark County School District No. 37 | |
| | | Series 2001 C,
Insured: FGIC:
(a) 12/01/16
(a) 12/01/20 | | | 3,000,000
6,150,000 | | | | 2,012,970
3,431,700 | | |
| WA King & Snohomish Counties School District No. 417 | |
| | | Series 1998 B,
Insured: FGIC:
(a) 06/15/14
(a) 06/15/16 | | | 1,800,000
3,315,000 | | | | 1,345,338
2,266,465 | | |
| | Local General Obligations Total | | | | | | | 343,170,526 | | |
| Special Non-Property Tax – 7.7% | |
| CA San Francisco Bay Area Transit Financing Authority | |
| | | Series 1990,
Insured: AMBAC
6.750% 07/01/11 | | | 2,500,000 | | | | 2,842,525 | | |
| FL Leon County | |
| | | Series 2005,
Insured: AMBAC
5.000% 10/01/15 | | | 5,000,000 | | | | 5,503,700 | | |
| FL Orange County | |
| | | Series 1998 A,
Insured: AMBAC
4.750% 10/01/24 | | | 2,000,000 | | | | 2,044,040 | | |
| FL Tallahassee Blueprint 2000 Intergovernmental Agency | |
| | | Series 2003,
Insured: FSA
5.000% 10/01/13 | | | 1,000,000 | | | | 1,073,870 | | |
| FL Tampa Sports Authority | |
| | | Series 1995,
Insured: MBIA
5.750% 10/01/25 | | | 2,500,000 | | | | 3,074,075 | | |
| FL Tampa | |
| | | Series 1996,
Insured: AMBAC
(a) 04/01/21 | | | 900,000 | | | | 495,972 | | |
| GA Metropolitan Atlanta Rapid Transit Authority | |
| | | Series 1992 P,
Insured: AMBAC
6.250% 07/01/20 | | | 6,000,000 | | | | 7,137,000 | | |
| IL Metropolitan Pier & Exposition Authority | |
| | | Series 1993 A,
Insured: FGIC:
(a) 06/15/13
(a) 06/15/16 | | | 11,640,000
3,750,000 | | | | 9,075,941
2,568,675 | | |
| | | Series 1996 A,
Insured: MBIA:
(a) 06/15/12
(a) 12/15/12 | | | 2,345,000
8,850,000 | | | | 1,903,460
7,049,733 | | |
See Accompanying Notes to Financial Statements.
37
Columbia Tax-Exempt Fund
November 30, 2006
| Municipal Bonds – (continued) | |
| | | | | Par ($) | | Value ($) | |
| Tax-Backed – (continued) | |
| Special Non-Property Tax – (continued) | |
| | Series 2002 B,
Insured: MBIA
5.000% 06/15/21 | | | 3,000,000 | | | | 3,187,200 | | |
| IL Sales Tax Revenue | |
| | | Series 2002,
Insured: FGIC
6.000% 06/15/23 | | | 4,000,000 | | | | 4,983,320 | | |
| MA Bay Transportation Authority | |
| | | Series 2003 A,
5.250% 07/01/19 | | | 6,000,000 | | | | 6,857,280 | | |
| | | Series 2005 A,
5.000% 07/01/25 | | | 3,000,000 | | | | 3,420,450 | | |
| | | Series 2005 B,
Insured: MBIA:
5.500% 07/01/26
5.500% 07/01/29 | | | 1,500,000
2,000,000 | | | | 1,817,265
2,460,340 | | |
| | | Series 2006 A,
5.250% 07/01/29 | | | 3,185,000 | | | | 3,799,832 | | |
| NJ Economic Development Authority | |
| | | Series 2004,
5.500% 06/15/31 | | | 775,000 | | | | 829,351 | | |
| NY Dormitory Authority | |
| | | Series 2005 B,
Insured: AMBAC
5.500% 03/15/29 | | | 2,030,000 | | | | 2,500,250 | | |
| | | Series B,
Insured: AMBAC:
5.500% 03/15/27
5.500% 03/15/30 | | | 5,860,000
6,040,000 | | | | 7,156,466
7,467,252 | | |
| NY Local Government Assistance Corp. | |
| | | Series 1993 E:
Insured: AMBAC
5.250% 04/01/16 | | | 10,000,000 | | | | 11,168,200 | | |
| | | Insured: MBIA
5.000% 04/01/21 | | | 3,655,000 | | | | 4,088,848 | | |
| NY New York City Transitional Finance Authority | |
| | | Series 2002 A,
5.500% 11/01/26(d) | | | 5,000,000 | | | | 5,411,350 | | |
| NY Sales Tax Asset Receivables Corp. | |
| | | Series 2004 A,
Insured: AMBAC
5.000% 10/15/32 | | | 3,950,000 | | | | 4,233,689 | | |
| OH Hamilton County Sales Tax Revenue | |
| | | Series 2000 B,
Insured: AMBAC
(a) 12/01/20 | | | 2,000,000 | | | | 1,120,600 | | |
| PR Commonwealth of Puerto Rico Convention Center Authority | |
| | | Series 2006,
Insured: AMBAC
5.000% 07/01/20 | | | 3,000,000 | | | | 3,299,520 | | |
See Accompanying Notes to Financial Statements.
38
Columbia Tax-Exempt Fund
November 30, 2006
| Municipal Bonds – (continued) | |
| | | | | Par ($) | | Value ($) | |
| Tax-Backed – (continued) | |
| Special Non-Property Tax – (continued) | |
| PR Commonwealth of Puerto Rico Highway & Transportation Authority | |
| | | Series 1996 Y,
Insured: MBIA
6.250% 07/01/12 | | | 3,000,000 | | | | 3,416,820 | | |
| | Series 1996 Z,
Insured: FSA
6.000% 07/01/18 | | | 10,000,000 | | | | 12,087,800 | | |
| | | Series 2002 E,
Insured: FSA:
5.500% 07/01/14
5.500% 07/01/17 | | | 10,000,000
5,400,000 | | | | 11,293,700
6,239,700 | | |
| | | Series 2003 AA,
Insured: MBIA:
5.500% 07/01/19
5.500% 07/01/20 | | | 4,000,000
4,000,000 | | | | 4,679,520
4,711,640 | | |
| | | Series 2005 L,
Insured: MBIA
5.250% 07/01/35 | | | 5,000,000 | | | | 6,048,950 | | |
| PR Commonwealth of Puerto Rico Infrastructure Financing Authority | |
| | | Series 2005 A,
Insured: FGIC
5.500% 07/01/24 | | | 4,000,000 | | | | 4,797,520 | | |
| | | Series 2005 C,
Insured: AMBAC:
5.500% 07/01/25
5.500% 07/01/26 | | | 1,955,000
2,000,000 | | | | 2,359,939
2,426,100 | | |
| TX Harris County Houston Sports Authority | |
| | | Series 2001 A,
Insured: MBIA:
(a) 11/15/14
(a) 11/15/15
(a) 11/15/16 | | | 3,905,000
3,975,000
4,040,000 | | | | 2,867,793
2,790,927
2,710,315 | | |
| TX Houston Hotel Occupancy | |
| | | Series 2001 B,
Insured: AMBAC
(a) 09/01/17 | | | 2,000,000 | | | | 1,292,720 | | |
| UT Transit Authority Sales Tax Revenue | |
| | | Series 2006 C,
Insured: FSA
5.250% 06/15/29 | | | 10,000,000 | | | | 11,861,600 | | |
| WA Central Puget Sound Regional Transportation Authority | |
| | | Series 1998,
Insured: FGIC
5.250% 02/01/21 | | | 4,500,000 | | | | 5,135,175 | | |
| | | Special Non-Property Tax Total | | | | | | | 201,290,423 | | |
| Special Property Tax – 0.4% | |
| CA Huntington Beach Community Facilities District | |
| | | Series 2001-1,
6.450% 09/01/31 | | | 1,850,000 | | | | 2,001,793 | | |
| FL Double Branch Community Development District | |
| | | Series 2002 A,
6.700% 05/01/34 | | | 1,370,000 | | | | 1,514,699 | | |
See Accompanying Notes to Financial Statements.
39
Columbia Tax-Exempt Fund
November 30, 2006
| Municipal Bonds – (continued) | |
| | | | | Par ($) | | Value ($) | |
| Tax-Backed – (continued) | |
| Special Property Tax – (continued) | |
| FL Heritage Palms Community Development District | |
| | | Series 1999 A,
6.750% 05/01/21 | | | 100,000 | | | | 101,757 | | |
| FL Lexington Oaks Community Development District | |
| | | Series 1998 A,
6.125% 05/01/19 | | | 515,000 | | | | 517,307 | | |
| FL Maple Ridge Community Development District | |
| | | Series 2000 A,
7.150% 05/01/31 | | | 185,000 | | | | 198,925 | | |
| FL Orlando | |
| | | Series 1998 A,
5.800% 05/01/26 | | | 300,000 | | | | 307,980 | | |
| FL Stoneybrook Community Development District | |
| | | Series 1998 A,
6.100% 05/01/19 | | | 210,000 | | | | 210,953 | | |
| FL Village Center Community Development District | |
| | | Series 1998 A,
Insured: MBIA
5.500% 11/01/12 | | | 750,000 | | | | 827,438 | | |
| FL Westchester Community Development District No. 1 | |
| | | Series 2003,
6.000% 05/01/23 | | | 2,480,000 | | | | 2,651,591 | | |
| IL Sports Facilities Authority | |
| | | Series 2001,
Insured: AMBAC
(a) 06/15/18 | | | 4,000,000 | | | | 2,498,280 | | |
| IN Portage | |
| | | Series 2006,
5.000% 01/15/27 | | | 410,000 | | | | 421,652 | | |
| | Special Property Tax Total | | | | | | | 11,252,375 | | |
| State Appropriated – 6.8% | |
| IN Office Building Commission | |
| | | Series 1995 B,
Insured: AMBAC
6.250% 07/01/16 | | | 8,000,000 | | | | 9,437,600 | | |
| KS Development Finance Authority | |
| | | Series 2006 A,
Insured: FGIC
5.000% 11/01/20 | | | 3,000,000 | | | | 3,287,310 | | |
| KY Turnpike Authority | |
| | | Series 1992,
Insured: FGIC
(a) 01/01/10 | | | 7,500,000 | | | | 6,699,675 | | |
| MI State | |
| | | Series 1992,
6.250% 11/01/12 | | | 5,435,000 | | | | 5,993,338 | | |
| NJ Economic Development Authority | |
| | | Series 2005 K,
Insured: FGIC
5.250% 12/15/21 | | | 2,000,000 | | | | 2,307,500 | | |
| | | Series 2005 N-1:
Insured: FGIC
5.500% 09/01/27 | | | 5,000,000 | | | | 6,090,400 | | |
| | | Insured: FSA
5.500% 09/01/25 | | | 12,765,000 | | | | 15,386,676 | | |
See Accompanying Notes to Financial Statements.
40
Columbia Tax-Exempt Fund
November 30, 2006
| Municipal Bonds – (continued) | |
| | | | | Par ($) | | Value ($) | |
| Tax-Backed – (continued) | |
| State Appropriated – (continued) | |
| NJ Transportation Trust Fund Authority | |
| | | Series 1995 B,
Insured: MBIA
7.000% 06/15/12 | | | 16,865,000 | | | | 19,694,441 | | |
| | Series 1999 A:
5.750% 06/15/18
5.750% 06/15/20 | | | 5,000,000
4,150,000 | | | | 5,842,850
4,927,544 | | |
| | | Series 2001 C,
Insured: FSA
5.500% 12/15/15 | | | 1,685,000 | | | | 1,919,164 | | |
| | | Series 2006 A,
5.500% 12/15/23 | | | 3,000,000 | | | | 3,539,820 | | |
| NY Dormitory Authority | |
| | | Series 1990 A,
7.500% 05/15/13 | | | 8,000,000 | | | | 9,708,960 | | |
| | | Series 1993 A:
Insured: CGIC
6.000% 07/01/20 | | | 6,140,000 | | | | 7,431,426 | | |
| | | Insured: FGIC
5.875% 05/15/17 | | | 28,240,000 | | | | 33,265,873 | | |
| | | Insured: FSA
5.500% 05/15/19 | | | 2,350,000 | | | | 2,725,765 | | |
| | | Series 1993,
6.000% 07/01/20 | | | 13,350,000 | | | | 16,036,153 | | |
| PR Commonwealth of Puerto Rico Public Finance Corp. | |
| | | Series 1998 A,
Insured: AMBAC
5.375% 06/01/17 | | | 5,000,000 | | | | 5,719,650 | | |
| | | Series 2002 E,
6.000% 08/01/26 | | | 2,470,000 | | | | 3,030,641 | | |
| | | Series 2004 A,
5.750% 08/01/27(d) | | | 1,000,000 | | | | 1,086,560 | | |
| UT Building Ownership Authority | |
| | | Series 1998 C,
Insured: FSA
5.500% 05/15/19 | | | 3,450,000 | | | | 4,001,655 | | |
| VA Port Authority | |
| | | Series 2003, AMT,
Insured: MBIA
5.250% 07/01/16 | | | 1,505,000 | | | | 1,634,084 | | |
| WA State | |
| | | Series 2000 S-5,
Insured: FGIC
(a) 01/01/19 | | | 5,000,000 | | | | 3,032,700 | | |
| WV Building Commission | |
| | | Series 1998 A,
Insured: AMBAC
5.375% 07/01/21 | | | 3,215,000 | | | | 3,707,538 | | |
| | | State Appropriated Total | | | | | | | 176,507,323 | | |
See Accompanying Notes to Financial Statements.
41
Columbia Tax-Exempt Fund
November 30, 2006
| Municipal Bonds – (continued) | |
| | | | | Par ($) | | Value ($) | |
| Tax-Backed – (continued) | |
| State General Obligations – 5.8% | |
| CA State | |
| | | Series 2002,
Insured: AMBAC:
6.000% 04/01/16
6.000% 04/01/17
6.000% 04/01/18 | | | 3,000,000
2,500,000
3,000,000 | | | | 3,560,670
2,993,575
3,624,690 | | |
| | Series 2003,
5.250% 02/01/23 | | | 5,000,000 | | | | 5,719,300 | | |
| | | Series 2004,
5.000% 02/01/22 | | | 2,000,000 | | | | 2,122,200 | | |
| FL Board of Education | |
| | | Series 1985,
9.125% 06/01/14 | | | 1,735,000 | | | | 2,114,896 | | |
| FL State | |
| | | Series 2002,
5.000% 07/01/23 | | | 4,425,000 | | | | 4,710,457 | | |
| IL State | |
| | | Series 2001,
Insured: FGIC
6.000% 11/01/26 | | | 3,000,000 | | | | 3,816,750 | | |
| | | Series 2004 A,
5.000% 03/01/34 | | | 3,000,000 | | | | 3,181,260 | | |
| MA Bay Transportation Authority | |
| | | Series 1992 B,
Insured: MBIA
6.200% 03/01/16 | | | 3,825,000 | | | | 4,449,699 | | |
| | | Series 1994 A:
7.000% 03/01/14 | | | 3,150,000 | | | | 3,737,884 | | |
| | | Insured: FSA
7.000% 03/01/19 | | | 2,500,000 | | | | 3,148,250 | | |
| MA State | |
| | | Series 2004 A:
5.250% 08/01/20 | | | 3,650,000 | | | | 4,180,600 | | |
| | | Insured: AMBAC
5.250% 08/01/21 | | | 9,675,000 | | | | 11,170,078 | | |
| | | Series 2006 B,
Insured: FSA:
5.250% 09/01/24
5.250% 09/01/25 | | | 10,000,000
5,000,000 | | | | 11,675,000
5,869,650 | | |
| NV State | |
| | | Series 1992 A,
6.800% 07/01/12 | | | 60,000 | | | | 60,155 | | |
| OR State | |
| | | Series 1980:
7.250% 01/01/07
8.250% 01/01/07 | | | 100,000
200,000 | | | | 100,305
200,776 | | |
| | | Series 1997 76A,
5.550% 04/01/09 | | | 30,000 | | | | 30,201 | | |
| PR Commonwealth of Puerto Rico Public Buildings Authority | |
| | | Series 2002 F,
5.250% 07/01/20 | | | 2,000,000 | | | | 2,253,280 | | |
See Accompanying Notes to Financial Statements.
42
Columbia Tax-Exempt Fund
November 30, 2006
| Municipal Bonds – (continued) | |
| | | | | Par ($) | | Value ($) | |
| Tax-Backed – (continued) | |
| State General Obligations – (continued) | |
| PR Commonwealth of Puerto Rico Public Finance Corp. | |
| | | Series 1998 A,
Insured: AMBAC
5.125% 06/01/24 | | | 3,000,000 | | | | 3,417,810 | | |
| PR Commonwealth of Puerto Rico | |
| | | Aqueduct & Sewer Authority,
Series 2001,
Insured: FSA
5.500% 07/01/17 | | | 13,130,000 | | | | 15,171,715 | | |
| | | Public Import,
Series 2001 A,
Insured: MBIA
5.500% 07/01/21 | | | 4,500,000 | | | | 5,322,645 | | |
| | | Public Improvement,
Series 2002 A,
Insured: FGIC
5.500% 07/01/19 | | | 7,000,000 | | | | 8,189,160 | | |
| | | Series 1996 B,
Insured: AMBAC
6.500% 07/01/15 | | | 2,650,000 | | | | 3,213,178 | | |
| | | Series 2004 A,
5.250% 07/01/21 | | | 3,000,000 | | | | 3,259,530 | | |
| | | Series 2006 A,
5.250% 07/01/30 | | | 2,000,000 | | | | 2,185,700 | | |
| TX Public Finance Authority | |
| | | Series 1997,
(a) 10/01/13 | | | 4,000,000 | | | | 3,090,360 | | |
| WA State | |
| | | Series 1990 A,
6.750% 02/01/15 | | | 12,700,000 | | | | 14,758,289 | | |
| | | Series 1992-93 A,
5.750% 10/01/12 | | | 2,955,000 | | | | 3,155,763 | | |
| | | Series 2000 A,
5.625% 07/01/21 | | | 10,000,000 | | | | 10,699,600 | | |
| | | State General Obligations Total | | | | | | | 151,183,426 | | |
| Tax-Backed Total | | | | | | | | | 941,820,064 | | |
| Transportation – 8.0% | |
| Air Transportation – 1.3% | |
| AK State | |
| | | Series 2002 B,
Insured: AMBAC
5.500% 10/01/11 | | | 1,250,000 | | | | 1,355,063 | | |
| IN Indianapolis Airport Authority | |
| | | Fed Ex Corp.,
Series 2004, AMT,
5.100% 01/15/17 | | | 4,000,000 | | | | 4,262,960 | | |
See Accompanying Notes to Financial Statements.
43
Columbia Tax-Exempt Fund
November 30, 2006
| Municipal Bonds – (continued) | |
| | | | | Par ($) | | Value ($) | |
| Transportation – (continued) | |
| Air Transportation – (continued) | |
| NC Charlotte/Douglas International Airport | |
| | | US Airways, Inc.:
Series 1998, AMT,
5.600% 07/01/27 | | | 4,300,000 | | | | 4,346,870 | | |
| | Series 2000, AMT,
7.750% 02/01/28 | | | 6,750,000 | | | | 7,297,627 | | |
| NJ Economic Development Authority | |
| | | Continental Airlines, Inc.,
Series 1999, AMT:
6.250% 09/15/19
6.250% 09/15/29
6.400% 09/15/23 | | | 1,300,000
2,000,000
4,000,000 | | | | 1,348,074
2,076,600
4,163,280 | | |
| OH Dayton Special Facilities | |
| | | Emery Air Freight Corp.,
Series 1996 D, AMT,
6.200% 10/01/09 | | | 5,250,000 | | | | 5,588,888 | | |
| TX Dallas-Fort Worth International Airport | |
| | | Series 2000, AMT,
8.500% 05/01/29 | | | 4,000,000 | | | | 4,194,120 | | |
| | | Air Transportation Total | | | | | | | 34,633,482 | | |
| Airports – 1.5% | |
| FL Miami-Dade County | |
| | | Series 2002, AMT,
Insured: FGIC
5.750% 10/01/20 | | | 2,095,000 | | | | 2,300,017 | | |
| IL Chicago O'Hare International Airport | |
| | | Series 1993 A,
5.000% 01/01/16 | | | 300,000 | | | | 300,156 | | |
| | | Series 1999, AMT,
Insured: AMBAC
5.500% 01/01/10 | | | 7,000,000 | | | | 7,349,440 | | |
| MA Port Authority | |
| | | Series 1999 600R, AMT,
Insured: FGIC
8.301% 01/01/21(d)(f) | | | 1,000,000 | | | | 1,120,410 | | |
| | | Series 1999 D, AMT,
6.000% 07/01/29(h) | | | 3,000,000 | | | | 3,205,320 | | |
| MO St. Louis Airport Revenue | |
| | | Series 2005,
Insured: MBIA
5.500% 07/01/27 | | | 4,000,000 | | | | 4,836,080 | | |
| NC Charlotte | |
| | | Series 1999, AMT,
Insured: MBIA
8.370% 06/15/22(d)(f) | | | 1,000,000 | | | | 1,130,250 | | |
| | | Series 1999 B, AMT,
6.000% 07/01/28(h) | | | 2,000,000 | | | | 2,123,940 | | |
| NV Clark County | |
| | | Series 2002, AMT,
Insured: MBIA
5.250% 07/01/11 | | | 1,960,000 | | | | 2,081,912 | | |
| OK Tulsa Airports Improvement Trust | |
| | | Series 2004 A, AMT,
Insured: FGIC
5.000% 06/01/10 | | | 1,220,000 | | | | 1,270,032 | | |
See Accompanying Notes to Financial Statements.
44
Columbia Tax-Exempt Fund
November 30, 2006
| Municipal Bonds – (continued) | |
| | | | | Par ($) | | Value ($) | |
| Transportation – (continued) | |
| Airports – (continued) | |
| TX Dallas-Fort Worth International Airport Facilities Improvement Corp. | |
| | | Series 2003 A, AMT,
Insured: AMBAC
5.500% 11/01/15 | | | 3,210,000 | | | | 3,535,076 | | |
| TX Houston | |
| | | Series 1998 B, AMT,
Insured: FGIC
5.000% 07/01/16 | | | 5,000,000 | | | | 5,122,150 | | |
| WA Seattle Port | |
| | | Series 1999 B, AMT,
Insured: FGIC
5.500% 09/01/13 | | | 3,885,000 | | | | 4,220,431 | | |
| | Airports Total | | | | | | | 38,595,214 | | |
| Toll Facilities – 4.5% | |
| CA San Joaquin Hills Transportation Corridor Agency | |
| | | Series 1997 A,
Insured: MBIA
(a) 01/15/14 | | | 14,450,000 | | | | 11,042,834 | | |
| CO E-470 Public Highway Authority | |
| | | Series 1997 B,
Insured: MBIA:
(a) 09/01/11
(a) 09/01/22 | | | 17,685,000
6,515,000 | | | | 14,801,637
3,343,433 | | |
| | | Series 2000 B,
Insured: MBIA
(a) 09/01/18 | | | 18,600,000 | | | | 11,477,688 | | |
| MA Turnpike Authority | |
| | | Series 1997 A,
Insured: MBIA
(a) 01/01/24 | | | 7,000,000 | | | | 3,389,470 | | |
| | | Series 1997 C,
Insured: MBIA:
(a) 01/01/18
(a) 01/01/20 | | | 4,700,000
17,000,000 | | | | 2,987,320
9,867,990 | | |
| NJ Turnpike Authority | |
| | | Series 1991 C:
Insured: FSA
6.500% 01/01/16 | | | 8,500,000 | | | | 10,001,950 | | |
| | | Insured: MBIA
6.500% 01/01/16 | | | 2,840,000 | | | | 3,337,824 | | |
| | | Series 2004 C-2,
Insured: AMBAC
5.500% 01/01/25 | | | 2,500,000 | | | | 3,011,850 | | |
| | | Series 2005,
Insured: FSA
5.250% 01/01/30 | | | 2,000,000 | | | | 2,394,740 | | |
| NY Triborough Bridge & Tunnel Authority | |
| | | Series 2002,
Insured: MBIA
5.500% 11/15/20 | | | 6,800,000 | | | | 8,059,428 | | |
| OH Turnpike Commission | |
| | | Series 1998 A,
Insured: FGIC
5.500% 02/15/24 | | | 7,000,000 | | | | 8,393,980 | | |
See Accompanying Notes to Financial Statements.
45
Columbia Tax-Exempt Fund
November 30, 2006
| Municipal Bonds – (continued) | |
| | | | | Par ($) | | Value ($) | |
| Transportation – (continued) | |
| Toll Facilities – (continued) | |
| TX Turnpike Authority | |
| | | Series 2002 A,
Insured: AMBAC:
(a) 08/15/16
(a) 08/15/18
(a) 08/15/19 | | | 7,000,000
10,000,000
10,330,000 | | | | 4,749,220
6,182,100
6,098,729 | | |
| VA Richmond Metropolitan Authority | |
| | | Series 1998,
Insured: FGIC
5.250% 07/15/22 | | | 7,800,000 | | | | 9,032,946 | | |
| | | Toll Facilities Total | | | | | | | 118,173,139 | | |
| Transportation – 0.7% | |
| IL Regional Transportation Authority | |
| | | Series 1994 C,
Insured: FGIC
7.750% 06/01/20 | | | 5,000,000 | | | | 6,973,650 | | |
| NV Department of Business & Industry | |
| | | Las Vegas Monorail Co.,
Series 2000:
7.375% 01/01/30
7.375% 01/01/40 | | | 1,650,000
3,500,000 | | | | 1,692,983
3,583,650 | | |
| OH Toledo-Lucas County Port Authority | |
| | | Series 1992,
6.450% 12/15/21 | | | 3,950,000 | | | | 4,853,681 | | |
| | | Transportation Total | | | | | | | 17,103,964 | | |
| Transportation Total | | | | | | | | | 208,505,799 | | |
| Utilities – 14.2% | |
| Independent Power Producers – 0.6% | |
| NY Port Authority of New York & New Jersey | |
| | | KIAC Partners,
Series 1996 IV, AMT,
6.750% 10/01/19 | | | 7,000,000 | | | | 7,110,250 | | |
| NY Suffolk County Industrial Development Authority | |
| | | Nissequogue Cogeneration Partners Facilities,
Series 1998, AMT,
5.500% 01/01/23 | | | 7,800,000 | | | | 7,805,460 | | |
| PA Carbon City Industrial Development Authority | |
| | | Panther Creek Partners,
Series 2000, AMT,
6.650% 05/01/10 | | | 650,000 | | | | 682,910 | | |
| | | Independent Power Producers Total | | | | | | | 15,598,620 | | |
| Investor Owned – 2.4% | |
| AZ Pima County Industrial Development Authority | |
| | | Tucson Electric Power Co.,
Series 1997 A, AMT,
6.100% 09/01/25 | | | 2,000,000 | | | | 2,007,940 | | |
| GA Monroe County Development Authority | |
| | | Oglethorpe Power Corp.,
Series 1992,
6.800% 01/01/11 | | | 2,000,000 | | | | 2,222,460 | | |
See Accompanying Notes to Financial Statements.
46
Columbia Tax-Exempt Fund
November 30, 2006
| Municipal Bonds – (continued) | |
| | | | | Par ($) | | Value ($) | |
| Utilities – (continued) | |
| Investor Owned – (continued) | |
| IN Development Finance Authority | |
| | | Series 1999, AMT,
5.950% 08/01/30 | | | 5,000,000 | | | | 5,148,650 | | |
| IN Petersburg | |
| | | Indiana Power & Light Co.,
Series 1993 B,
Insured: AMBAC
5.400% 08/01/17 | | | 5,000,000 | | | | 5,634,300 | | |
| | Series 1995 C, AMT,
5.950% 12/01/29 | | | 5,000,000 | | | | 5,352,500 | | |
| MA Development Finance Agency | |
| | | Dominion Energy Brayton,
Series 2006, AMT,
5.000% 02/01/36 | | | 3,000,000 | | | | 3,130,740 | | |
| MI Strategic Fund | |
| | | Detroit Edison Co.,
Series 1991 BB,
Insured: AMBAC
7.000% 05/01/21 | | | 2,505,000 | | | | 3,315,768 | | |
| NY Energy & Research Development Authority | |
| | | Brooklyn Union Gas Co.,
Series 1993,
8.750% 04/01/20(d) | | | 13,000,000 | | | | 14,396,720 | | |
| OH Air Quality Development Authority | |
| | | Cleveland Electric Illuminating Co.,
Series 2002 A,
6.000% 12/01/13 | | | 500,000 | | | | 513,885 | | |
| TX Brazos River Authority Pollution Control Revenue | |
| | | TXU Energy Co. LLC:
Series 1999 B, AMT,
6.750% 09/01/34 | | | 12,455,000 | | | | 13,866,525 | | |
| | | Series 2003 A, AMT,
6.750% 04/01/38 | | | 1,900,000 | | | | 2,122,509 | | |
| TX Sabine River Authority Pollution Control Revenue | |
| | | Series 2001 C,
5.200% 05/01/28 | | | 3,000,000 | | | | 3,124,800 | | |
| WY Lincoln County Environmental Improvement | |
| | | Pacificorp,
Series 1995, AMT,
4.125% 11/01/25 | | | 2,500,000 | | | | 2,506,375 | | |
| | | Investor Owned Total | | | | | | | 63,343,172 | | |
| Joint Power Authority – 3.2% | |
| GA Municipal Electric Authority | |
| | | Series 2002 A,
Insured: FSA
5.000% 01/01/18 | | | 3,750,000 | | | | 4,000,725 | | |
| MN Anoka County Solid Waste Disposal | |
| | | National Power Association,
Series 1987 A, AMT,
6.950% 12/01/08 | | | 170,000 | | | | 175,071 | | |
| NC Eastern Municipal Power Agency | |
| | | Series 1991 A,
6.500% 01/01/18 | | | 2,185,000 | | | | 2,615,948 | | |
See Accompanying Notes to Financial Statements.
47
Columbia Tax-Exempt Fund
November 30, 2006
| Municipal Bonds – (continued) | |
| | | | | Par ($) | | Value ($) | |
| Utilities – (continued) | |
| Joint Power Authority – (continued) | |
| | Series 1992,
Insured: MBIA
(a) 01/01/09 | | | 2,260,000 | | | | 2,096,173 | | |
| | | Series 1993 B,
Insured: RAD
6.000% 01/01/22 | | | 500,000 | | | | 606,705 | | |
| | | Series 1993,
Insured: AMBAC
6.000% 01/01/18 | | | 20,470,000 | | | | 24,430,740 | | |
| SC Piedmont Municipal Power Agency | |
| | | Series 1988,
Insured: AMBAC
(a) 01/01/13 | | | 16,070,000 | | | | 12,115,655 | | |
| | | Series 1993,
Insured: MBIA
5.375% 01/01/25 | | | 11,370,000 | | | | 13,192,384 | | |
| | | Series 2004 A,
Insured: FGIC
(a) 01/01/24 | | | 5,000,000 | | | | 2,408,900 | | |
| SC Public Service Authority | |
| | | Series 2002 D,
Insured: FSA
5.000% 01/01/18 | | | 3,095,000 | | | | 3,305,429 | | |
| TX Municipal Power Agency | |
| | | Series 1989,
Insured: AMBAC:
(a) 09/01/11
(a) 09/01/12 | | | 5,000,000
2,795,000 | | | | 4,188,700
2,252,043 | | |
| | | Series 1993,
Insured: MBIA
(a) 09/01/15 | | | 8,790,000 | | | | 6,229,385 | | |
| WA Public Power Supply System | |
| | | Nuclear Project No. 3,
Series 1989 B,
(a) 07/01/08 | | | 7,000,000 | | | | 6,601,490 | | |
| | | Joint Power Authority Total | | | | | | | 84,219,348 | | |
| Municipal Electric – 3.5% | |
| AK Anchorage | |
| | | Series 1993,
Insured: MBIA
8.000% 12/01/09 | | | 2,000,000 | | | | 2,245,920 | | |
| AZ Salt River Project Agricultural Improvement & Power District | |
| | | Series 2006 A,
5.000% 01/01/37 | | | 5,000,000 | | | | 5,385,500 | | |
| GA Municipal Electric Authority | |
| | | Series 1991,
Insured: MBIA
6.600% 01/01/18 | | | 17,280,000 | | | | 20,601,043 | | |
| | | Series 1998 Y,
Insured: AMBAC
6.400% 01/01/13 | | | 935,000 | | | | 1,046,377 | | |
See Accompanying Notes to Financial Statements.
48
Columbia Tax-Exempt Fund
November 30, 2006
| Municipal Bonds – (continued) | |
| | | | | Par ($) | | Value ($) | |
| Utilities – (continued) | |
| Municipal Electric – (continued) | |
| MN Southern Minnesota Municipal Power Agency | |
| | | Series 2002 A,
Insured: AMBAC
5.250% 01/01/17 | | | 11,000,000 | | | | 12,424,060 | | |
| OH Cleveland Public Power Systems | |
| | | Series 1994 A,
Insured: MBIA
(a) 11/15/13 | | | 2,000,000 | | | | 1,537,020 | | |
| PA Westmoreland County Municipal Authority | |
| | | Series 1995 A,
Insured: FGIC
(a) 08/15/23 | | | 5,540,000 | | | | 2,725,846 | | |
| | Series 1999 A,
Insured: MBIA
(a) 08/15/22 | | | 2,000,000 | | | | 1,029,900 | | |
| PR Commonwealth of Puerto Rico Electric Power Authority | |
| | | Series 2002 KK,
Insured: MBIA
5.500% 07/01/16 | | | 12,000,000 | | | | 13,802,640 | | |
| SD Heartland Consumers Power District | |
| | | Series 1992,
Insured: FSA:
6.000% 01/01/09
6.000% 01/01/17 | | | 235,000
13,600,000 | | | | 240,316
16,086,896 | | |
| TX Sam Rayburn Municipal Power Agency | |
| | | Series 2002,
6.000% 10/01/16 | | | 5,000,000 | | | | 5,335,900 | | |
| TX San Marcos | |
| | | Series 2002,
Insured: FSA
5.250% 11/01/16 | | | 1,000,000 | | | | 1,082,240 | | |
| WA Chelan County Public Utilities District No. 1 | |
| | | Columbia River Rock Hydroelectric,
Series 1997 A,
Insured: MBIA
(a) 06/01/09 | | | 5,000,000 | | | | 4,556,050 | | |
| | | Series 1997 A, AMT,
5.600% 07/01/32(d) | | | 2,310,000 | | | | 2,371,931 | | |
| | | Municipal Electric Total | | | | | | | 90,471,639 | | |
| Water & Sewer – 4.5% | |
| AL Jefferson County | |
| | | Series 1997 A,
Insured: FGIC
5.625% 02/01/22 | | | 570,000 | | | | 577,484 | | |
| AZ Water Infrastructure Finance Authority | |
| | | Series 2006 A,
5.000% 10/01/20 | | | 1,500,000 | | | | 1,645,215 | | |
| CA Castaic Lake Water Agency | |
| | | Series 1999,
Insured: AMBAC
(a) 08/01/24 | | | 9,445,000 | | | | 4,453,790 | | |
| FL Seminole County | |
| | | Series 1992,
Insured: MBIA
6.000% 10/01/19 | | | 470,000 | | | | 552,814 | | |
See Accompanying Notes to Financial Statements.
49
Columbia Tax-Exempt Fund
November 30, 2006
| Municipal Bonds – (continued) | |
| | | | | Par ($) | | Value ($) | |
| Utilities – (continued) | |
| Water & Sewer – (continued) | |
| FL St. John's County Water & Sewer Authority | |
| | | Series 1991 A,
Insured: MBIA:
(a) 06/01/13
(a) 06/01/14 | | | 2,600,000
1,500,000 | | | | 2,038,062
1,128,675 | | |
| GA Atlanta Water & Wastewater Revenue | |
| | | Series 1999 A,
Insured: FGIC
5.500% 11/01/22 | | | 5,475,000 | | | | 6,392,555 | | |
| | Series 2001 A,
Insured: MBIA
5.500% 11/01/27 | | | 1,500,000 | | | | 1,811,040 | | |
| GA Fulton County Water & Sewer | |
| | | Series 1992,
Insured: FGIC
6.375% 01/01/14 | | | 620,000 | | | | 699,124 | | |
| GA Henry County Water & Sewer Authority | |
| | | Series 1997,
Insured: AMBAC
6.150% 02/01/20 | | | 5,390,000 | | | | 6,660,908 | | |
| GA Milledgeville Water & Sewer Revenue | |
| | | Series 1996,
Insured: FSA
6.000% 12/01/21 | | | 1,000,000 | | | | 1,209,410 | | |
| IL Chicago | |
| | | Series 1998,
Insured: MBIA
(a) 01/01/20 | | | 7,275,000 | | | | 4,212,080 | | |
| | | Series 2000,
Insured: AMBAC
5.750% 11/01/10 | | | 4,800,000 | | | | 5,179,440 | | |
| MA Water Resources Authority | |
| | | Series 1992 A,
Insured: FGIC
6.500% 07/15/19 | | | 5,000,000 | | | | 6,066,450 | | |
| | | Series 1993 C,
Insured: AMBAC
5.250% 12/01/15 | | | 3,000,000 | | | | 3,310,620 | | |
| | | Series 2002 J,
Insured: FSA
5.500% 08/01/21 | | | 5,000,000 | | | | 5,924,000 | | |
| | | Series 2006 A,
Insured: AMBAC
5.000% 08/01/24 | | | 2,170,000 | | | | 2,381,271 | | |
| MS V Lakes Utility District | |
| | | Series 1994,
8.250% 07/15/24(b) | | | 750,000 | | | | 583,478 | | |
| NY New York City Municipal Water Finance Authority | |
| | | Series 1999, IFRN,
Insured: FGIC
7.380% 06/15/32(d)(f) | | | 2,000,000 | | | | 2,222,160 | | |
| | | Series 2001 D,
5.250% 06/15/25 | | | 3,520,000 | | | | 3,766,752 | | |
See Accompanying Notes to Financial Statements.
50
Columbia Tax-Exempt Fund
November 30, 2006
| Municipal Bonds – (continued) | |
| | | | | Par ($) | | Value ($) | |
| Utilities – (continued) | |
| Water & Sewer – (continued) | |
| OH Cleveland Waterworks Revenue | |
| | | Series 1993 G,
Insured: MBIA
5.500% 01/01/21 | | | 4,015,000 | | | | 4,701,284 | | |
| OH Lakewood Water Systems Revenue | |
| | | Series 1995,
Insured: AMBAC
5.850% 07/01/20 | | | 2,300,000 | | | | 2,793,948 | | |
| PA Allegheny County Sanitation Authority | |
| | | Series 1991 A,
Insured: FGIC
(a) 06/01/07 | | | 2,370,000 | | | | 2,328,312 | | |
| PA Dauphin County Industrial Development Authority | |
| | | General Waterworks Corp.,
Series 1992 A, AMT,
6.900% 06/01/24 | | | 3,400,000 | | | | 4,394,772 | | |
| SC Western Carolina Regional Sewer Authority | |
| | | Series 2005,
Insured: FSA:
5.250% 03/01/18
5.250% 03/01/21 | | | 7,810,000
4,400,000 | | | | 8,861,616
5,049,704 | | |
| TN Metropolitan Government Nashville & Davidson County | |
| | | Series 1993,
Insured: FGIC
5.200% 01/01/13 | | | 2,500,000 | | | | 2,725,350 | | |
| TX Houston Water & Sewer Systems | |
| | | Series 1991 C,
Insured: AMBAC:
(a) 12/01/09
(a) 12/01/10 | | | 4,000,000
3,750,000 | | | | 3,580,920
3,231,825 | | |
| | | Series 1998 A,
Insured: FSA:
(a) 12/01/19
(a) 12/01/23 | | | 10,545,000
985,000 | | | | 6,134,448
477,045 | | |
| TX Houston | |
| | | Series 1991 C,
Insured: AMBAC
(a) 12/01/08 | | | 4,000,000 | | | | 3,716,320 | | |
| VA Fairfax County Water Authority | |
| | | Series 2005 B,
5.250% 04/01/24 | | | 6,175,000 | | | | 7,243,646 | | |
| | | Water & Sewer Total | | | | | | | 116,054,518 | | |
| Utilities Total | | | | | | | | | 369,687,297 | | |
| | | Total Municipal Bonds
(cost of $2,312,205,613) | | | | | | | 2,546,351,109 | | |
See Accompanying Notes to Financial Statements.
51
Columbia Tax-Exempt Fund
November 30, 2006
| Municipal Preferred Stocks – 0.9% | |
| | | | | Shares | | Value ($) | |
| Housing – 0.9% | |
| Multi-Family – 0.9% | |
| Charter Mac Equity Issuer Trust | |
| | | Series 1999, AMT,
6.625% 06/30/09(f) | | | 6,000,000 | | | | 6,316,380 | | |
| | | Series 2000, AMT,
7.600% 11/30/10(f) | | | 5,000,000 | | | | 5,554,650 | | |
| Munimae TE Bond Subsidiary LLC | |
| | | Series 2000 B, AMT,
7.750% 06/30/50(f) | | | 10,000,000 | | | | 11,177,200 | | |
| | | Series 2005 C-3, AMT,
5.500% 11/29/49(f) | | | 1,000,000 | | | | 1,057,910 | | |
| | | Multi-Family Total | | | | | | | 24,106,140 | | |
| Housing Total | | | | | | | | | 24,106,140 | | |
| | | Total Municipal Preferred Stocks
(cost of $22,000,000) | | | | | | | 24,106,140 | | |
Other – 0.0% Par ($)
| Transportation – 0.0% | |
| Air Transportation – 0.0% | |
| IL Chicago O'Hare International Airport | |
| | | United Airlines, Inc.,
Series 1999 A(i)(j) | | | 4,100,000 | | | | 127,100 | | |
| IN Indianapolis Airport Authority | |
| | | United Airlines, Inc.,
Series 1995 A, AMT(i)(j) | | | 1,360,000 | | | | 88,400 | | |
| | | Air Transportation Total | | | | | | | 215,500 | | |
| Transportation Total | | | | | | | | | 215,500 | | |
| | | Total Other
(cost $1,045,950) | | | | | | | 215,500 | | |
| | | | | Shares | | | |
| Investment Company – 0.0% | |
| | | Dreyfus Tax-Exempt Cash Management Fund | | | 173,303 | | | | 173,303 | | |
| | | Total Investment Company
(cost of $173,303) | | | | | | | 173,303 | | |
Common Stock – 0.0%
| Industrials – 0.0% | |
| Airlines – 0.0% | |
| | | UAL Corp. (k) | | | 3,423 | | | | 138,906 | | |
| | | Airlines Total | | | | | 138,906 | | |
| Industrials Total | | | | | | | 138,906 | | |
| | | Total Common Stock
(cost of $105,810) | | | | | 138,906 | | |
See Accompanying Notes to Financial Statements.
52
Columbia Tax-Exempt Fund
November 30, 2006
| | | | | Shares | | Value ($) | |
| Securities Lending Collateral – 0.0% | |
| | | State Street Navigator Securities Lending Prime Portfolio(l) | | | 140,868 | | | | 140,868 | | |
| | | Total Securities Lending Collateral
(cost of $140,868) | | | | | | | 140,868 | | |
| Short-Term Obligations – 0.8% | | Par ($) | |
| Variable Rate Demand Notes (m) – 0.8% | | | | | | | | | | | |
| FL Orange County School Board | |
| | | Series 2000 B,
Insured: AMBAC,
SPA: Sun Trust Bank N.A.
3.570% 08/01/25 | | | 900,000 | | | | 900,000 | | |
| FL Pinellas County Health Facility Authority | |
| | | All Childrens Hospital,
Series 1985,
Insured: AMBAC,
SPA: Wachovia Bank N.A.
3.550% 12/01/15 | | | 2,500,000 | | | | 2,500,000 | | |
| IL Chicago Board of Education | |
| | | Series 2005 D-2,
Insured: CIFG,
SPA: DEPFA Bank PLC
3.570% 03/01/36 | | | 1,800,000 | | | | 1,800,000 | | |
| IL Health Facilities Authority | |
| | | University of Chicago Hospital,
Series 1994,
Insured: MBIA,
SPA: JPMorgan Chase Bank
3.570% 08/15/26 | | | 900,000 | | | | 900,000 | | |
| MN Brooklyn Center | |
| | | BCC Associates LLC,
Series 2001,
LOC: U.S. Bank N.A.
3.620% 12/01/14 | | | 200,000 | | | | 200,000 | | |
| | | Chevron Corp.:
Series 1992,
3.570% 12/01/16 | | | 2,200,000 | | | | 2,200,000 | | |
| | | Series 1993,
3.570% 06/01/23 | | | 1,000,000 | | | | 1,000,000 | | |
| TN Blount County Public Building Authority | |
| | | Local Government Public Improvement,
Series 2006 D-7-B,
SPA: DEPFA Bank PLC
3.570% 06/01/31 | | | 1,500,000 | | | | 1,500,000 | | |
| | | Series 2005 D1,
Insured: AMBAC,
SPA: DEPFA Bank PLC
3.570% 06/01/30 | | | 300,000 | | | | 300,000 | | |
See Accompanying Notes to Financial Statements.
53
Columbia Tax-Exempt Fund
November 30, 2006
| Short-Term Obligations – (continued) | |
| | | | | Par ($) | | Value ($) | |
| Variable Rate Demand Notes (m) – (continued) | | | | | | | | | | | |
| TX Harris County Health Facilities Development Corp. | |
| | | Texas Medical Center,
Series 2006,
Insured: MBIA,
SPA: JPMorgan Chase Bank
3.570% 05/01/35 | | | 2,100,000 | | | | 2,100,000 | | |
| | | YMCA-Greater Houston Area,
Series 2002,
LOC: JPMorgan Chase Bank
3.570% 07/01/37 | | | 200,000 | | | | 200,000 | | |
| WI Health & Educational Facilities Authority | |
| | | Gundersen Clinic Ltd.,
Series 2000 A,
Insured: FSA,
SPA: Dexia Credit Local
3.570% 12/01/15 | | | 500,000 | | | | 500,000 | | |
| | | ProHealth Care, Inc.,
Series 2001 B,
Insured: AMBAC,
SPA: JPMorgan Chase Bank
3.570% 08/15/30 | | | 1,100,000 | | | | 1,100,000 | | |
| WY Uinta County Pollution Control Revenue | |
| | | Chevron Corp.:
Series 1992,
3.570% 12/01/22 | | | 1,500,000 | | | | 1,500,000 | | |
| | | Series 1993,
3.570% 08/15/20 | | | 2,600,000 | | | | 2,600,000 | | |
| Variable Rate Demand Notes Total | | | | | | | | | 19,300,000 | | |
| | | Total Short-Term Obligations
(cost of $19,300,000) | | | | | | | 19,300,000 | | |
| | | Total Investments – 99.6%
(cost of $2,354,971,544)(n) | | | | | | | 2,590,425,826 | | |
| | | Other Assets & Liabilities, Net – 0.4% | | | | | | | 9,978,196 | | |
| | | Net Assets – 100.0% | | | | | | $ | 2,600,404,022 | | |
Notes to Investment Portfolio:
(a) Zero coupon bond.
(b) The issuer is in default of certain debt covenants. Income is not being accrued. At November 30, 2006, the value of these securities amounted to $1,564,561, which represents 0.1% of net assets.
(c) Represents fair value as determined in good faith under procedures approved by the Board of Trustees.
(d) The interest rate shown on floating rate or variable rate securities reflects the rate at November 30, 2006.
(e) Security purchased on a delayed delivery basis.
(f) Security exempt from registration pursuant to Rule 144A under the Securities Act of 1933. These securities may be resold in transactions exempt from registration, normally to qualified institutional buyers. At November 30, 2006, these securities, which did not include any illiquid securities except the following, amounted to $50,040,641, which represents 1.9% of net assets.
| Security | | Acquisition
Date | | Par | | Cost | | Value | |
Resolution Trust Corp.
Pass-Through Certificates,
Series 1993 A,
8.500% 12/01/16 | | | 08/27/93 | | | $ | 6,615,223 | | | $ | 6,751,636 | | | $ | 6,604,241 | | |
(g) The Fund has been informed that each issuer has placed direct obligations of the U.S. Government in an irrevocable trust, solely for the payment of principal and interest.
See Accompanying Notes to Financial Statements.
54
Columbia Tax-Exempt Fund
November 30, 2006
(h) Security represents the underlying bond transferred to a special purpose entity established in a floating rate note transaction in which the Fund acquired the residual interest. These securities amount to $54,109,560 and serve as collateral in the transactions.
(i) Non-income producing.
(j) Position reflects anticipated residual bankruptcy claims.
(k) All or a portion of this security was on loan at November 30, 2006. The total market value of securities on loan at November 30, 2006 is $136,105.
(l) Investment made with cash collateral received from securities lending activity.
(m) Variable rate demand note. This security is payable upon not more than one, seven or thirty business days' notice. Put bonds and notes have a demand feature that matures within one year. The interest rate changes periodically. The interest rate shown reflects the rate as of November 30, 2006.
(n) Cost for federal income tax purposes is $2,350,344,104.
At November 30, 2006, the Fund held investments in the following states/territories:
| State/Territory | | % of Total
Investments | |
| Illinois | | | 8.8 | % | |
| Massachusetts | | | 8.6 | | |
| New York | | | 8.0 | | |
| Texas | | | 8.0 | | |
| California | | | 6.3 | | |
| New Jersey | | | 5.3 | | |
| Puerto Rico | | | 5.0 | | |
| Other* | | | 50.0 | | |
| | | | 100.0 | % | |
* Includes all states/territories that are less than 5.0% of total investments.
At November 30, 2006, the composition of the Fund by revenue source is as follows:
Holding by
Revenue Source
(Unaudited) | | % of
Net Assets | |
| Tax-Backed | | | 36.2 | % | |
| Other | | | 19.8 | | |
| Utilities | | | 14.2 | | |
| Health Care | | | 9.5 | | |
| Transportation | | | 8.0 | | |
| Education | | | 3.3 | | |
| Housing | | | 4.0 | | |
| Industrials | | | 2.4 | | |
| Other Revenue | | | 1.0 | | |
| Resource Recovery | | | 0.4 | | |
| | | | 98.8 | | |
| Investment Company | | | 0.0 | * | |
| Securities Lending Collateral | | | 0.0 | * | |
| Short-Term Obligations | | | 0.8 | | |
| Other Assets & Liabilities, Net | | | 0.4 | | |
| | | | 100.0 | % | |
* Represents less than 0.01%.
| Acronym | | Name | |
| AMBAC | | Ambac Assurance Corp. | |
|
| AMT | | Alternative Minimum Tax | |
|
| CAP | | Capital Markets Assurance Corp. | |
|
| CGIC | | Capital Guaranty Insurance Corp. | |
|
| CIFG | | CIFG Assurance North America, Inc. | |
|
| FGIC | | Financial Guaranty Insurance Co. | |
|
| FHA | | Federal Housing Administration | |
|
| FSA | | Financial Security Assurance, Inc. | |
|
| GNMA | | Government National Mortgage Association | |
|
| GTY AGMT | | Guaranty Agreement | |
|
| IFRN | | Inverse Floating Rate Note | |
|
| LOC | | Letter of Credit | |
|
| MBIA | | MBIA Insurance Corp. | |
|
| PSFG | | Permanent School Fund Guarantee | |
|
| RAD | | Radian Asset Assurance | |
|
| SPA | | Stand-by Purchase Agreement | |
|
See Accompanying Notes to Financial Statements.
55
Statement of Assets and Liabilities – Columbia Tax-Exempt Fund, November 30, 2006
| | | | | ($) | |
| Assets | | Investments, at cost | | | 2,354,971,544 | | |
| | | Investments, at value (including securities on loan of $136,105) | | | 2,590,425,826 | | |
| | | Cash | | | 111,011 | | |
| | | Receivable for: | | | | | |
| | | Investments sold | | | 14,001,843 | | |
| | | Fund shares sold | | | 1,215,907 | | |
| | | Interest | | | 35,250,779 | | |
| | | Deferred Trustees' compensation plan | | | 187,927 | | |
| | | Other assets | | | 10 | | |
| | | Total Assets | | | 2,641,193,303 | | |
| | | Collateral on securities loaned | | | 140,868 | | |
| Liabilities | | Payable for: | | | | | |
| | | Investments purchased on a delayed delivery basis | | | 4,616,960 | | |
| | | Fund shares repurchased | | | 2,367,875 | | |
| | | Futures variation margin | | | 195,803 | | |
| | | Distributions | | | 4,848,523 | | |
| | | Interest expense and fees | | | 449,126 | | |
| | | Floating rate notes | | | 25,604,210 | | |
| | | Investment advisory fee | | | 1,023,813 | | |
| | | Transfer agent fee | | | 336,830 | | |
| | | Pricing and bookkeeping fees | | | 21,339 | | |
| | | Trustees' fees | | | 74,131 | | |
| | | Distribution and service fees | | | 312,041 | | |
| | | Custody fee | | | 6,774 | | |
| | | Chief compliance officer expenses | | | 2,500 | | |
| | | Deferred Trustees' fees | | | 187,927 | | |
| | | Other liabilities | | | 600,561 | | |
| | | Total Liabilities | | | 40,789,281 | | |
| | | Net Assets | | | 2,600,404,022 | | |
| Net Assets Consist of | | Paid-in capital | | | 2,397,363,026 | | |
| | | Undistributed net investment income | | | 5,811,617 | | |
| | | Accumulated net realized loss | | | (38,224,903 | ) | |
| | | Net unrealized appreciation on investments | | | 235,454,282 | | |
| | | Net Assets | | | 2,600,404,022 | | |
| Class A | | Net assets | | | 1,646,200,595 | | |
| | | Shares outstanding | | | 118,635,452 | | |
| | | Net asset value per share | | | 13.88 | (a) | |
| | | Maximum offering price per share ($13.88/0.9525) | | | 14.57 | (b) | |
| Class B | | Net assets | | | 43,770,826 | | |
| | | Shares outstanding | | | 3,154,362 | | |
| | | Net asset value and offering price per share | | | 13.88 | (a) | |
| Class C | | Net assets | | | 20,788,733 | | |
| | | Shares outstanding | | | 1,498,156 | | |
| | | Net asset value and offering price per share | | | 13.88 | (a) | |
| Class Z | | Net assets | | | 889,643,868 | | |
| | | Shares outstanding | | | 64,113,301 | | |
| | | Net asset value, offering and redemption price per share | | | 13.88 | | |
(a) Redemption price per share is equal to net asset value less any applicable contingent deferred sales charge.
(b) On sales of $50,000 or more the offering price is reduced.
See Accompanying Notes to Financial Statements.
56
Statement of Operations – Columbia Tax-Exempt Fund
For the Year Ended November 30, 2006
| | | | | ($) | |
| Investment Income | | Interest | | | 107,445,840 | | |
| | | Dividends | | | 26,784 | | |
| | | Securities lending | | | 15 | | |
| | | Total Investment Income | | | 107,472,639 | | |
| Expenses | | Investment advisory fee | | | 9,876,510 | | |
| | | Distribution fee: | | | | | |
| | | Class B | | | 274,800 | | |
| | | Class C | | | 90,831 | | |
| | | Service fee: | | | | | |
| | | Class A | | | 3,109,577 | | |
| | | Class B | | | 73,280 | | |
| | | Class C | | | 24,215 | | |
| | | Transfer agent fee | | | 1,194,685 | | |
| | | Pricing and bookkeeping fees | | | 175,608 | | |
| | | Trustees' fees | | | 122,061 | | |
| | | Custody fee | | | 71,639 | | |
| | | Chief compliance officer expenses | | | 14,975 | | |
| | | Non-recurring costs (See Note 8) | | | 11,302 | | |
| | | Other expenses | | | 780,614 | | |
| | | Total Operating Expenses | | | 15,820,097 | | |
| | | Interest expenses and fees | | | 970,428 | | |
| | | Total Expenses | | | 16,790,525 | | |
| | | Fees waived by Distributor - Class C | | | (18,185 | ) | |
| | | Non-recurring costs assumed by Investment Advisor (See Note 8) | | | (11,302 | ) | |
| | | Custody earnings credit | | | (9,585 | ) | |
| | | Net Expenses | | | 16,751,453 | | |
| | | Net Investment Income | | | 90,721,186 | | |
| Net Realized and Unrealized Gain on Investments and Futures Contracts | | Net realized gain on: | | | | | |
| | | Investments | | | 3,536,899 | | |
| | | Futures contracts | | | 748,503 | | |
| | | Net realized gain | | | 4,285,402 | | |
| | | Net change in unrealized appreciation on investments | | | 52,641,928 | | |
| | | Net Gain | | | 56,927,330 | | |
| | | Net Increase Resulting from Operations | | | 147,648,516 | | |
See Accompanying Notes to Financial Statements.
57
Statement of Changes in Net Assets – Columbia Tax-Exempt Fund
| Increase (Decrease) in Net Assets | | Year Ended November 30, | | 2006($) | | 2005 (a)($) | |
| Operations | | Net investment income | | | 90,721,186 | | | | 77,655,783 | | |
| | | Net realized gain on investments and futures contracts | | | 4,285,402 | | | | 5,783,783 | | |
| | | Net change in unrealized appreciation (depreciation)
on investments | | | 52,641,928 | | | | (13,925,362 | ) | |
| | | Net Increase Resulting from Operations | | | 147,648,516 | | | | 69,514,204 | | |
| Distributions Declared to Shareholders | | From net investment income: | | | | | | | | | |
| | | Class A | | | (68,860,501 | ) | | | (72,124,909 | ) | |
| | | Class B | | | (1,345,455 | ) | | | (1,512,797 | ) | |
| | | Class C | | | (459,942 | ) | | | (351,255 | ) | |
| | | Class Z | | | (19,394,532 | ) | | | (3,138,574 | ) | |
| | | Total Distributions Declared to Shareholders | | | (90,060,430 | ) | | | (77,127,535 | ) | |
| Share Transactions | | Class A: | | | | | | | | | |
| | | Subscriptions | | | 35,579,691 | | | | 27,309,844 | | |
| | | Proceeds received in connection with merger | | | 131,564,548 | | | | 43,521,408 | | |
| | | Distributions reinvested | | | 40,581,170 | | | | 41,669,366 | | |
| | | Redemptions | | | (182,290,425 | ) | | | (171,953,653 | ) | |
| | | Net Increase (Decrease) | | | 25,434,984 | | | | (59,453,035 | ) | |
| | | Class B: | | | | | | | | | |
| | | Subscriptions | | | 1,604,683 | | | | 1,418,388 | | |
| | | Proceeds received in connection with merger | | | 16,432,045 | | | | 5,372,640 | | |
| | | Distributions reinvested | | | 758,551 | | | | 820,293 | | |
| | | Redemptions | | | (14,174,638 | ) | | | (14,610,318 | ) | |
| | | Net Increase (Decrease) | | | 4,620,641 | | | | (6,998,997 | ) | |
| | | Class C: | | | | | | | | | |
| | | Subscriptions | | | 2,925,038 | | | | 1,208,536 | | |
| | | Proceeds received in connection with merger | | | 9,489,654 | | | | 2,147,093 | | |
| | | Distributions reinvested | | | 232,529 | | | | 189,102 | | |
| | | Redemptions | | | (2,619,977 | ) | | | (1,807,877 | ) | |
| | | Net Increase | | | 10,027,244 | | | | 1,736,854 | | |
| | | Class Z: | | | | | | | | | |
| | | Subscriptions | | | 16,547,900 | | | | 947,964 | | |
| | | Proceeds received in connection with merger | | | 577,965,524 | | | | 342,179,750 | | |
| | | Distributions reinvested | | | 9,457,111 | | | | 2,006,726 | | |
| | | Redemptions | | | (56,565,227 | ) | | | (9,872,279 | ) | |
| | | Net Increase | | | 547,405,308 | | | | 335,262,161 | | |
| | | Net Increase from Share Transactions | | | 587,488,177 | | | | 270,546,983 | | |
| | | Total Increase in Net Assets | | | 645,076,263 | | | | 262,933,652 | | |
| Net Assets | | Beginning of period | | | 1,955,327,759 | | | | 1,692,394,107 | | |
| | | End of period | | | 2,600,404,022 | | | | 1,955,327,759 | | |
| | | Undistributed net investment income at end of period | | | 5,811,617 | | | | 4,173,938 | | |
See Accompanying Notes to Financial Statements.
58
Statement of Changes in Net Assets – Columbia Tax-Exempt Fund (continued)
| | | Year Ended November 30, | | 2006 | | 2005 (a) | |
| Changes in Shares | | Class A: | | | | | | | | | |
| | | Subscriptions | | | 2,608,553 | | | | 1,995,021 | | |
| | | Issued in connection with merger | | | 9,550,879 | | | | 3,172,828 | | |
| | | Isssued for distributions reinvested | | | 2,984,692 | | | | 3,044,944 | | |
| | | Redemptions | | | (13,439,568 | ) | | | (12,576,092 | ) | |
| | | Net Increase (Decrease) | | | 1,704,556 | | | | (4,363,299 | ) | |
| | | Class B: | | | | | | | | | |
| | | Subscriptions | | | 117,985 | | | | 103,509 | | |
| | | Issued in connection with merger | | | 1,192,816 | | | | 391,688 | | |
| | | Isssued for distributions reinvested | | | 55,754 | | | | 59,947 | | |
| | | Redemptions | | | (1,043,899 | ) | | | (1,067,037 | ) | |
| | | Net Increase (Decrease) | | | 322,656 | | | | (511,893 | ) | |
| | | Class C: | | | | | | | | | |
| | | Subscriptions | | | 214,322 | | | | 88,278 | | |
| | | Issued in connection with merger | | | 688,923 | | | | 156,533 | | |
| | | Isssued for distributions reinvested | | | 17,067 | | | | 13,827 | | |
| | | Redemptions | | | (192,923 | ) | | | (131,827 | ) | |
| | | Net Increase | | | 727,389 | | | | 126,811 | | |
| | | Class Z: | | | | | | | | | |
| | | Subscriptions | | | 1,205,243 | | | | 69,747 | | |
| | | Issued in connection with merger | | | 41,929,939 | | | | 24,945,971 | | |
| | | Isssued for distributions reinvested | | | 695,573 | | | | 148,665 | | |
| | | Redemptions | | | (4,157,693 | ) | | | (724,144 | ) | |
| | | Net Increase | | | 39,673,062 | | | | 24,440,239 | | |
(a) On September 16, 2005, Columbia Tax-Exempt Fund Class Z shares commenced operations.
See Accompanying Notes to Financial Statements.
59
Financial Highlights – Columbia Tax-Exempt Fund
Selected data for a share outstanding throughout each period is as follows:
| | | Year Ended November 30, | |
| Class A Shares | | 2006 | | 2005 | | 2004 | | 2003 | | 2002 | |
| Net Asset Value, Beginning of Period | | $ | 13.49 | | | $ | 13.51 | | | $ | 13.60 | | | $ | 13.16 | | | $ | 13.13 | | |
| Income from Investment Operations: | |
| Net investment income (a) | | | 0.61 | | | | 0.62 | | | | 0.61 | | | | 0.60 | | | | 0.66 | | |
Net realized and unrealized gain (loss)
on investments and futures contracts | | | 0.38 | | | | (0.03 | ) | | | (0.11 | ) | | | 0.44 | | | | 0.02 | | |
| Total from Investment Operations | | | 0.99 | | | | 0.59 | | | | 0.50 | | | | 1.04 | | | | 0.68 | | |
| Less Distributions Declared to Shareholders: | |
| From net investment income | | | (0.60 | ) | | | (0.61 | ) | | | (0.59 | ) | | | (0.60 | ) | | | (0.65 | ) | |
| Net Asset Value, End of Period | | $ | 13.88 | | | $ | 13.49 | | | $ | 13.51 | | | $ | 13.60 | | | $ | 13.16 | | |
| Total return (b)(c) | | | 7.53 | % | | | 4.41 | % | | | 3.78 | % | | | 8.05 | % | | | 5.26 | % | |
| Ratios to Average Net Assets/Supplemental Data: | |
| Operating expenses (d) | | | 0.80 | % | | | 0.82 | % | | | 0.86 | % | | | 0.94 | % | | | 0.94 | % | |
| Interest and fee expense | | | 0.05 | %(e) | | | — | | | | — | | | | — | | | | — | | |
| Total expenses (d) | | | 0.85 | % | | | 0.82 | % | | | 0.86 | % | | | 0.94 | % | | | 0.94 | % | |
| Waiver/reimbursement | | | — | | | | — | %(f) | | | 0.03 | % | | | 0.03 | % | | | 0.03 | % | |
| Net investment income (d) | | | 4.46 | % | | | 4.50 | % | | | 4.49 | % | | | 4.50 | % | | | 5.01 | % | |
| Portfolio turnover rate | | | 5 | % | | | 4 | % | | | 5 | % | | | 11 | % | | | 19 | % | |
| Net assets end of period (000's) | | $ | 1,646,201 | | | $ | 1,577,102 | | | $ | 1,638,527 | | | $ | 1,837,693 | | | $ | 1,900,366 | | |
(a) Per share data was calculated using the average shares outstanding during the period.
(b) Total return at net asset value assuming all distributions reinvested and no initial sales charge or contingent deferred sales charge.
(c) Had the investment advisor and/or any of its affiliates not waived or reimbursed a portion of expenses, total return would have been reduced.
(d) The benefits derived from custody credits had an impact of less than 0.01%.
(e) Interest and fee expense relates to the liability for floating-rate notes issued in conjunction with inverse floater securities transactions.
(f) Rounds to less than 0.01%.
See Accompanying Notes to Financial Statements.
60
Financial Highlights – Columbia Tax-Exempt Fund
Selected data for a share outstanding throughout each period is as follows:
| | | Year Ended November 30, | |
| Class B Shares | | 2006 | | 2005 | | 2004 | | 2003 | | 2002 | |
| Net Asset Value, Beginning of Period | | $ | 13.49 | | | $ | 13.51 | | | $ | 13.60 | | | $ | 13.16 | | | $ | 13.13 | | |
| Income from Investment Operations: | |
| Net investment income (a) | | | 0.50 | | | | 0.51 | | | | 0.50 | | | | 0.50 | | | | 0.56 | | |
Net realized and unrealized gain (loss)
on investments and futures contracts | | | 0.39 | | | | (0.02 | ) | | | (0.10 | ) | | | 0.44 | | | | 0.02 | | |
| Total from Investment Operations | | | 0.89 | | | | 0.49 | | | | 0.40 | | | | 0.94 | | | | 0.58 | | |
| Less Distributions Declared to Shareholders: | |
| From net investment income | | | (0.50 | ) | | | (0.51 | ) | | | (0.49 | ) | | | (0.50 | ) | | | (0.55 | ) | |
| Net Asset Value, End of Period | | $ | 13.88 | | | $ | 13.49 | | | $ | 13.51 | | | $ | 13.60 | | | $ | 13.16 | | |
| Total return (b)(c) | | | 6.73 | % | | | 3.63 | % | | | 3.01 | % | | | 7.25 | % | | | 4.47 | % | |
| Ratios to Average Net Assets/Supplemental Data: | |
| Operating expenses (d) | | | 1.55 | % | | | 1.57 | % | | | 1.61 | % | | | 1.69 | % | | | 1.69 | % | |
| Interest and fee expense | | | 0.05 | %(e) | | | — | | | | — | | | | — | | | | — | | |
| Total expenses (d) | | | 1.60 | % | | | 1.57 | % | | | 1.61 | % | | | 1.69 | % | | | 1.69 | % | |
| Waiver/reimbursement | | | — | | | | — | %(f) | | | 0.03 | % | | | 0.03 | % | | | 0.03 | % | |
| Net investment income (d) | | | 3.71 | % | | | 3.75 | % | | | 3.74 | % | | | 3.75 | % | | | 4.26 | % | |
| Portfolio turnover rate | | | 5 | % | | | 4 | % | | | 5 | % | | | 11 | % | | | 19 | % | |
| Net assets end of period (000's) | | $ | 43,771 | | | $ | 38,193 | | | $ | 45,168 | | | $ | 64,990 | | | $ | 81,766 | | |
(a) Per share data was calculated using the average shares outstanding during the period.
(b) Total return at net asset value assuming all distributions reinvested and no contingent deferred sales charge.
(c) Had the investment advisor and/or any of its affiliates not waived or reimbursed a portion of expenses, total return would have been reduced.
(d) The benefits derived from custody credits had an impact of less than 0.01%.
(e) Interest and fee expense relates to the liability for floating-rate notes issued in conjunction with inverse floater securities transactions.
(f) Rounds to less than 0.01%.
See Accompanying Notes to Financial Statements.
61
Financial Highlights – Columbia Tax-Exempt Fund
Selected data for a share outstanding throughout each period is as follows:
| | | Year Ended November 30, | |
| Class C Shares | | 2006 | | 2005 | | 2004 | | 2003 | | 2002 | |
| Net Asset Value, Beginning of Period | | $ | 13.49 | | | $ | 13.51 | | | $ | 13.60 | | | $ | 13.16 | | | $ | 13.13 | | |
| Income from Investment Operations: | |
| Net investment income (a) | | | 0.52 | | | | 0.53 | | | | 0.53 | | | | 0.51 | | | | 0.58 | | |
Net realized and unrealized gain (loss)
on investments and futures contracts | | | 0.39 | | | | (0.02 | ) | | | (0.11 | ) | | | 0.45 | | | | 0.02 | | |
| Total from Investment Operations | | | 0.91 | | | | 0.51 | | | | 0.42 | | | | 0.96 | | | | 0.60 | | |
| Less Distributions Declared to Shareholders: | |
| From net investment income | | | (0.52 | ) | | | (0.53 | ) | | | (0.51 | ) | | | (0.52 | ) | | | (0.57 | ) | |
| Net Asset Value, End of Period | | $ | 13.88 | | | $ | 13.49 | | | $ | 13.51 | | | $ | 13.60 | | | $ | 13.16 | | |
| Total return (b)(c) | | | 6.89 | % | | | 3.78 | % | | | 3.17 | % | | | 7.41 | % | | | 4.63 | % | |
| Ratios to Average Net Assets/Supplemental Data: | |
| Operating expenses (d) | | | 1.40 | % | | | 1.42 | % | | | 1.46 | % | | | 1.54 | % | | | 1.54 | % | |
| Interest and fee expense | | | 0.05 | %(e) | | | — | | | | — | | | | — | | | | — | | |
| Total expenses (d) | | | 1.45 | % | | | 1.42 | % | | | 1.46 | % | | | 1.54 | % | | | 1.54 | % | |
| Waiver/reimbursement | | | 0.15 | % | | | 0.15 | % | | | 0.18 | % | | | 0.18 | % | | | 0.18 | % | |
| Net investment income (d) | | | 3.83 | % | | | 3.90 | % | | | 3.89 | % | | | 3.90 | % | | | 4.41 | % | |
| Portfolio turnover rate | | | 5 | % | | | 4 | % | | | 5 | % | | | 11 | % | | | 19 | % | |
| Net assets end of period (000's) | | $ | 20,789 | | | $ | 10,396 | | | $ | 8,699 | | | $ | 12,450 | | | $ | 13,165 | | |
(a) Per share data was calculated using the average shares outstanding during the period.
(b) Total return at net asset value assuming all distributions reinvested and no contingent deferred sales charge.
(c) Had the investment advisor and/or any of its affiliates not waived or reimbursed a portion of expenses, total return would have been reduced.
(d) The benefits derived from custody credits had an impact of less than 0.01%.
(e) Interest and fee expense relates to the liability for floating-rate notes issued in conjunction with inverse floater securities transactions.
See Accompanying Notes to Financial Statements.
62
Financial Highlights – Columbia Tax-Exempt Fund
Selected data for a share outstanding throughout each period is as follows:
| Class Z Shares | | Year Ended
November 30,
2006 | | Period Ended
November 30,
2005 (a) | |
| Net Asset Value, Beginning of Period | | $ | 13.49 | | | $ | 13.71 | | |
| Income from Investment Operations: | |
| Net investment income (b) | | | 0.62 | | | | 0.13 | | |
| Net realized and unrealized gain (loss) on investments and futures contracts | | | 0.40 | | | | (0.22 | ) | |
| Total from Investment Operations | | | 1.02 | | | | (0.09 | ) | |
| Less Distributions Declared to Shareholders: | |
| From net investment income | | | (0.63 | ) | | | (0.13 | ) | |
| Net Asset Value, End of Period | | $ | 13.88 | | | $ | 13.49 | | |
| Total return (c)(d) | | | 7.75 | % | | | (0.63 | )%(e) | |
| Ratios to Average Net Assets/Supplemental Data: | |
| Operating expenses (f) | | | 0.60 | % | | | 0.57 | %(g) | |
| Interest and fee expense | | | 0.05 | %(h) | | | — | | |
| Total expenses (f) | | | 0.65 | % | | | 0.57 | %(g) | |
| Waiver/reimbursement | | | — | | | | — | %(g)(i) | |
| Net investment income (f) | | | 4.62 | % | | | 4.91 | %(g) | |
| Portfolio turnover rate | | | 5 | % | | | 4 | %(e) | |
| Net assets end of period (000's) | | $ | 889,644 | | | $ | 329,637 | | |
(a) On September 16, 2005, Columbia Tax-Exempt Fund Class Z shares commenced operations.
(b) Per share data was calculated using the average shares outstanding during the period.
(c) Total return at net asset value assuming all distributions reinvested.
(d) Had the investment advisor and/or any of its affiliates not waived or reimbursed a portion of expenses, total return would have been reduced.
(e) Not annualized.
(f) The benefits derived from custody credits had an impact of less than 0.01%.
(g) Annualized.
(h) Interest and fee expense relates to the liability for floating-rate notes issued in conjunction with inverse floater securities transactions.
(i) Rounds to less than 0.01%.
See Accompanying Notes to Financial Statements.
63
Notes to Financial Statements – Columbia Tax-Exempt Fund
November 30, 2006
Note 1. Organization
Columbia Tax-Exempt Fund (the "Fund"), a series of Columbia Funds Series Trust I (the "Trust"), is a diversified portfolio. The Trust is a Massachusetts business trust registered under the Investment Company Act of 1940, as amended, as an open-end management investment company.
After the close of business on September 22, 2006, Columbia Tax-Exempt Insured Fund, a series of Columbia Funds Series Trust I, and Columbia Municipal Income Fund, a series of Columbia Funds Series Trust, merged into Columbia Tax-Exempt Fund.
Investment Goal
The Fund seeks as high a level of after-tax total return as is consistent with prudent risk by pursuing current income exempt from federal income tax and opportunities for long-term appreciation.
Fund Shares
The Fund may issue an unlimited number of shares and offers four classes of shares: Class A, Class B, Class C and Class Z. Each share class has its own sales charge and expense structure.
Class A shares are subject to a maximum front-end sales charge of 4.75% based on the amount of initial investment. Class A shares purchased without an initial sales charge in accounts aggregating up to $50 million at the time of purchase are subject to a 1.00% contingent deferred sales charge ("CDSC") if the shares are sold within twelve months of the time of the purchase. Class B shares are subject to a maximum CDSC of 5.00% based upon the holding period after purchase. Class B shares will convert to Class A shares eight years after purchase. Class C shares are subject to a 1.00% CDSC on shares sold within one year after purchase. Class Z shares are offered continuously at net asset value. There are certain restrictions on the purchase of Class Z shares, as described in the Fund's prospectus.
Note 2. Significant Accounting Policies
The preparation of financial statements in conformity with accounting principles generally accepted in the United States of America ("GAAP") requires management to make estimates and assumptions that affect the reported amounts of assets and liabilities, the disclosure of contingent assets and liabilities at the date of the financial statements and the reported amounts of revenue and expenses during the reporting period. Actual results could differ from those estimates. The following is a summary of significant accounting policies consistently followed by the Fund in the preparation of its financial statements.
Security Valuation
Debt securities generally are valued by pricing services approved by the Fund's Board of Trustees, based upon market transactions for normal, institutional-size trading units of similar securities. The services may use various pricing techniques which take into account appropriate factors such as yield, quality, coupon rate, maturity, type of issue, trading characteristics and other data, as well as broker quotes. Debt securities for which quotations are readily available are valued at an over-the-counter or exchange bid quotation. Certain debt securities, which tend to be more thinly traded and of lesser quality, are priced based on fundamental analysis of the financial condition of the issuer and the estimated value of any collateral. Valuations developed through pricing techniques may vary from the actual amounts realized upon sale of the securities, and the potential variation may be greater for those securities valued using fundamental analysis.
Short-term debt obligations maturing within 60 days are valued at amortized cost, which approximates market value.
Equity securities and securities of certain investment companies are valued at the last sale price on the principal exchange on which they trade, except for securities traded on the NASDAQ, which are valued at the NASDAQ official close price. Unlisted securities or listed securities for which there were no sales during the day are valued at the closing bid price on such exchanges or over-the-counter markets.
Investments in other open-end investment companies are valued at net asset value.
Futures contracts are valued at the settlement price established each day by the board of trade or exchange on which they are traded.
Investments for which market quotations are not readily available, or that have quotations which management believes are not reliable, are valued at fair value as determined in good faith under consistently applied procedures established by and
64
Columbia Tax-Exempt Fund, November 30, 2006
under the general supervision of the Board of Trustees. If a security is valued at a "fair value", such value is likely to be different from the last quoted market price for the security.
In September 2006, Statement of Financial Accounting Standards No. 157, Fair Value Measurements ("SFAS 157"), was issued. SFAS 157 is effective for fiscal years beginning after November 15, 2007. SFAS 157 defines fair value, establishes a framework for measuring fair value and expands disclosures about fair value measurements. Management has recently begun to evaluate the impact the application of SFAS 157 will have on the Fund's financial statement disclosures.
Security Transactions
Security transactions are accounted for on the trade date. Cost is determined and gains (losses) are based upon the specific identification method for both financial statement and federal income tax purposes.
Floating Rate Notes Issued in Conjunction with Securities Held
The Fund may sell a fixed-rate bond ("Fixed-Rate Bond") to a broker, who deposits the Fixed-Rate Bond into a special-purpose entity, from which are issued floating-rate notes ("Floating-Rate Notes") that are sold to third parties. The Floating-Rate Notes have interest rates that reset weekly and Floating-Rate Note holders have the option to tender their notes to the broker at par at each reset date. A residual certificate (an "Inverse Floater"), which pays interest equal to the difference between the Fixed-Rate Bond and the Floating-Rate Notes, is also issued by the special-purpose entity. The Inverse Floater also gives the holder the right to cause the Floating-Rate Notes to be called at par and to require transfer of the Fixed-Rate Bond to the holder of the Inverse Floater, thereby liquidating the special-purpose entity. In certain transactions, the Fund ultimately receives the Inverse Floater plus cash equivalent to the proce eds raised from the issuance of the Floating Rate Notes in exchange for the Fixed-Rate Bonds.
Although the Fund physically holds the Inverse Floater, because of its right to cause the liquidation of the special-purpose entity and recover the Fixed-Rate Bond it originally sold to the broker, the Fund accounts for this transaction as a secured borrowing pursuant to Statement of Financial Accounting Standards No. 140, Accounting for Transfers and Servicing of Financial Assets and Extinguishments of Liabilities, by including the Fixed-Rate Bond in its Portfolio of Investments, and recognizing the Floating-Rate Notes as a liability on its Statement of Assets and Liabilities.
Futures Contracts
The Fund may invest in futures contracts to hedge against the effects of changes in the value of portfolio securities due to anticipated changes in interest rates and/or market conditions, for duration management, or when the transactions are economically appropriate to the reduction of risk inherent in the management of the Fund and not for trading purposes. The use of futures contracts involves certain risks, which include: (1) imperfect correlation between the price movement of the instruments and the underlying securities, (2) inability to close out positions due to differing trading hours, or the temporary absence of a liquid market, for either the instrument or the underlying securities, or (3) an inaccurate prediction by Columbia Management Advisors, LLC of the future direction of interest rates. Any of these risks may involve amounts exceeding the variation margin recorded in the Fund's Statement of Assets and Liabilitie s at any given time.
Upon entering into a futures contract, the Fund deposits cash or securities with the broker in an amount sufficient to meet the initial margin requirement. Subsequent payments are made or received by the Fund equal to the daily change in the contract value and are recorded as variation margin receivable or payable and offset in unrealized gains or losses. The Fund recognizes a realized gain or loss when the contract is closed or expired.
Restricted Securities
Restricted securities are securities that may only be resold upon registration under federal securities laws or in transactions exempt from registration. In some cases, the issuer of restricted securities has agreed to register such securities for resale at the issuer's expense either upon demand by the Fund or in connection with another registered offering of the securities. Many restricted securities may be resold in the secondary market in transactions exempt from registration. Such restricted securities may be determined to be liquid under criteria established by the Board of Trustees. The Fund will not incur any registration costs upon such resale.
Income Recognition
Interest income is recorded on the accrual basis. Original issue discount is accreted to interest income over the life of
65
Columbia Tax-Exempt Fund, November 30, 2006
the security with a corresponding increase in cost basis. Premium and discount are amortized and accreted, respectively, on all debt securities. Dividend income is recorded on the ex-date.
Determination of Class Net Asset Values
All income, expenses (other than class-specific expenses, as shown on the Statement of Operations) and realized and unrealized gains (losses) are allocated to each class of the Fund on a daily basis for purposes of determining the net asset value of each class. Income and expenses are allocated to each class based on the settled shares method, while realized and unrealized gains (losses) are allocated based on the relative net assets of each class.
Federal Income Tax Status
The Fund intends to qualify each year as a "regulated investment company" under Subchapter M of the Internal Revenue Code, as amended, and will distribute substantially all of its tax-exempt or taxable income, if any, for its tax year, and as such will not be subject to federal income taxes. In addition, the Fund intends to distribute in each calendar year substantially all of its net investment income, capital gains and certain other amounts, if any, such that the Fund should not be subject to federal excise tax. Therefore, no federal income or excise tax provision is recorded.
Distributions to Shareholders
Dividends from net investment income are declared daily and paid monthly. Net realized capital gains, if any, are distributed at least annually.
Indemnification
In the normal course of business, the Fund enters into contracts that contain a variety of representations and warranties and which provide general indemnities. The Fund's maximum exposure under these arrangements is unknown, as this would involve future claims against the Fund. Also, under the Fund's organizational documents and by contract, the Trustees and Officers of the Trust are indemnified against certain liabilities that may arise out of their duties to the Trust. However, based on experience, the Fund expects the risk of loss due to these representations, warranties and indemnities to be minimal.
Note 3. Federal Tax Information
The timing and character of income and capital gain distributions are determined in accordance with income tax regulations, which may differ from GAAP. Reclassifications are made to the Fund's capital accounts for permanent tax differences to reflect income and gains available for distribution (or available capital loss carryforwards) under income tax regulations.
For the year ended November 30, 2006, permanent book and tax basis differences resulting primarily from differing treatments for discount accretion/premium amortization on debt securities, market discount reclassifications and non-deductible merger fees were identified and reclassified among the components of the Fund's net assets as follows:
Undistributed
Net Investment
Income | | Accumulated
Net Realized Loss | | Paid-In Capital | |
| $ | 976,923 | | | $ | (5,775,850 | ) | | $ | 4,798,927 | | |
Net investment income and net realized gains (losses), as disclosed on the Statement of Operations, and net assets were not affected by this reclassification.
The tax character of distributions paid during the years ended November 30, 2006 and November 30, 2005 was as follows:
| | | November 30, 2006 | | November 30, 2005 | |
Distributions paid
from: | |
| |
| Tax-Exempt Income | | $ | 89,980,818 | | | $ | 77,123,736 | | |
| Ordinary Income* | | | 79,612 | | | | 3,799 | | |
* For tax purposes short-term capital gains distributions, if any, are considered ordinary income distributions.
As of November 30, 2006, the components of distributable earnings on a tax basis were as follows:
Undistributed
Tax-Exempt
Income | | Net Unrealized
Appreciation* | |
| $ | 6,928,395 | | | $ | 240,081,722 | | |
* The differences between book-basis and tax-basis net unrealized appreciation/depreciation are primarily due to capital loss carryforwards, discount accretion/premium amortization on debt securities, market discount reclassifications and deferred trustee fees.
66
Columbia Tax-Exempt Fund, November 30, 2006
Unrealized appreciation and depreciation at November 30, 2006, based on cost of investments for federal income tax purposes, was:
| Unrealized appreciation | | $ | 247,477,566 | | |
| Unrealized depreciation | | | (7,395,844 | ) | |
| Net unrealized appreciation | | $ | 240,081,722 | | |
The following capital loss carryforwards, determined as of November 30, 2006, may be available to reduce taxable income arising from future net realized gains on investments, if any, to the extent permitted by the Internal Revenue Code:
| Year of Expiration | | Capital Loss Carryforward | |
| | 2008 | | | $ | 13,280,466 | | |
| | 2009 | | | | 179,607 | | |
| | 2010 | | | | 10,177,991 | | |
| | Total | | | $ | 23,638,064 | | |
Capital loss carryforwards of $5,354,526 were utilized during the year ended November 30, 2006. Of the capital loss carryforwards attributable to Columbia Tax Exempt Bond Fund, $179,607 (expiring November 30, 2009) and $1,320,005 (expiring November 30, 2010) were acquired from the current year merger with Columbia Municipal Income Fund none of which were utilized to offset current year gains. The availability of the remaining capital loss carryforward from the Columbia Municipal Income Fund may be limited in a given year. Any capital loss carryforwards acquired as part of a merger that are permanently lost due to provisions under Internal Revenue Code are included as being expired. Expired capital loss carryforwards are recorded as a reduction of paid-in capital.
In June 2006, the Financial Accounting Standards Board ("FASB") issued FASB Interpretation No. 48, Accounting for Uncertainty in Income Taxes, an Interpretation of FASB Statement No. 109 (the "Interpretation"). This Interpretation is effective for fiscal years beginning after December 15, 2006 and is to be applied to open tax positions upon initial adoption. This Interpretation prescribes a minimum recognition threshold and measurement method for the financial statement recognition of tax positions taken or expected to be taken in a tax return and also requires certain expanded disclosures. Management has recently begun to evaluate the application of this Interpretation to the Fund and has not at this time quantified the impact, if any, resulting from the adoption of this Interpretation on the Fund's financial statements.
Note 4. Fees and Compensation Paid to Affiliates
Investment Advisory Fee
Columbia Management Advisors, LLC ("Columbia"), an indirect, wholly-owned subsidiary of Bank of America Corporation ("BOA"), is the investment advisor to the Fund and provides administrative and other services. Columbia receives a monthly investment advisory fee based on the Fund's average daily net assets at the following annual rates:
| Average Daily Net Assets | | Annual Fee Rate | |
| First $500 million | | | 0.55 | % | |
| $500 million to $1 billion | | | 0.50 | % | |
| $1 billion to $1.5 billion | | | 0.47 | % | |
| $1.5 billion to $3 billion | | | 0.44 | % | |
| $3 billion to $6 billion | | | 0.43 | % | |
| Over $6 billion | | | 0.42 | % | |
Prior to the close of business on September 22, 2006, Columbia received a monthly investment advisory fee from the Fund at the fee rates disclosed above based on the Fund's pro-rata portion of the combined average net assets of the Fund and Columbia Tax-Exempt Insured Fund.
For the year ended November 30, 2006, the Fund's effective investment advisory fee rate was 0.49%.
Pricing and Bookkeeping Fees
Columbia is responsible for providing pricing and bookkeeping services to the Fund under a pricing and bookkeeping agreement. Under a separate agreement (the "Outsourcing Agreement"), Columbia has delegated certain functions to State Street Bank & Trust Company ("State Street"). As a result, the total fees payable under the pricing and bookkeeping agreement (other than certain reimbursements paid to Columbia and discussed below) are paid to State Street.
Under its pricing and bookkeeping agreement with the Fund, Columbia receives an annual fee of $38,000 paid monthly plus
67
Columbia Tax-Exempt Fund, November 30, 2006
an additional monthly fee based on the level of average daily net assets for the month; provided that during any 12-month period, the aggregate fee (exclusive of out-of-pocket expenses and charges) shall not exceed $140,000.
The Fund also reimburses Columbia and State Street for out-of-pocket expenses and charges, including fees payable to third parties for pricing the Fund's portfolio securities and direct internal costs incurred by Columbia in connection with providing fund accounting oversight and monitoring and certain other services. For the year ended November 30, 2006, the Fund's effective pricing and bookkeeping fee rate, inclusive of out-of-pocket expenses, was 0.009% of the Fund's average daily net assets.
Transfer Agent Fee
Columbia Management Services, Inc. (the "Transfer Agent"), an affiliate of Columbia and an indirect, wholly-owned subsidiary of BOA, provides shareholder services to the Fund and has contracted with Boston Financial Data Services ("BFDS") to serve as sub-transfer agent. The Transfer Agent is entitled to receive a fee for its services, paid monthly, at the annual rate of $17.00 per open account plus sub-transfer agent fees (exclusive of BFDS fees) calculated based on assets held in omnibus accounts and intended to recover the cost of payments to other parties (including affiliates of BOA) for services to those accounts. Prior to April 1, 2006, the annual rate was $15.23. The Transfer Agent may also retain, as additional compensation for its services, fees for wire, telephone and redemption orders, IRA trustee agent fees and account transcript fees due the Transfer Agent from shareholders of the Fund and credits (net of bank charg es) earned with respect to balances in accounts the Transfer Agent maintains in connection with its services to the Fund. The Transfer Agent also receives reimbursement for certain out-of-pocket expenses.
For the year ended November 30, 2006, the Fund's effective transfer agent fee rate, inclusive of out-of-pocket expenses and sub-transfer agent fees and net of fee waivers, if applicable, was 0.06% of the Fund's average daily net assets.
Underwriting Discounts, Service and Distribution Fees
Columbia Management Distributors, Inc. (the "Distributor"), an affiliate of Columbia and an indirect, wholly-owned subsidiary of BOA, is the principal underwriter of the Fund. For the year ended November 30, 2006, the Distributor retained net underwriting discounts of $53,238 on sales of the Fund's Class A shares and net CDSC fees of $45,282 and $118 on Class B and Class C share redemptions, respectively.
The Fund has adopted a Rule 12b-1 plan (the "Plan") which allows the payment of a monthly service fee to the Distributor equal to 0.20% annually of the average daily net assets attributable to Class A, Class B and Class C shares. The Plan also requires the payment of a monthly distribution fee to the Distributor equal to 0.75% annually of the average daily net assets attributable to Class B and Class C shares only. The Distributor has voluntarily agreed to waive a portion of the Class C share distribution fee so that it will not exceed 0.60% annually.
The CDSC and the distribution fees received from the Plan are used principally as repayment to the Distributor for amounts paid by the Distributor to dealers who sold such shares.
Custody Credits
The Fund has an agreement with its custodian bank under which custody fees may be reduced by balance credits. These credits are recorded as a reduction of total expenses on the Statement of Operations. The Fund could have invested a portion of the assets utilized in connection with the expense offset arrangement in an income-producing asset if it had not entered into such an agreement.
Fees Paid to Officers and Trustees
All officers of the Fund, with the exception of the Fund's Chief Compliance Officer, are employees of Columbia or its affiliates and receive no compensation from the Fund. The Board of Trustees has appointed a Chief Compliance Officer to the Fund in accordance with federal securities regulations. The Fund, along with other affiliated funds, pays its pro-rata share of the expenses associated with the Chief Compliance Officer. The Fund's expenses for the Office of the Chief Compliance Officer will not exceed $15,000 per year.
The Fund's Trustees may participate in a deferred compensation plan which may be terminated at any time. Obligations of the plan will be paid solely out of the Fund's assets.
68
Columbia Tax-Exempt Fund, November 30, 2006
Other
Columbia provides certain services to the Fund related to Sarbanes-Oxley compliance. For the year ended November 30, 2006, the Fund paid $3,116 to Columbia for such services. This amount is included in "Other expenses" on the Statement of Operations.
Note 5. Portfolio Information
For the year ended November 30, 2006, the cost of purchases and proceeds from sales of securities, excluding short-term obligations, were $96,626,016 and $269,728,378, respectively.
At November 30, 2006, the Fund held Inverse Floaters related to the following securities:
| | | Par | |
CA San Francisco Bay Area Rapid Transit,
Series 1999, 5.500%, 07/01/26 | | $ | 10,000,000 | | |
FL Tampa Bay Water Utility Systems,
Series 1999, 5.750% 10/01/29 | | | 3,000,000 | | |
MA Port Authority, Series 1999 C,
5.750%, 07/01/29 | | | 5,000,000 | | |
MA Port Authority, Series 1999D,
6.000%, 07/01/29 | | | 3,000,000 | | |
NC Charlotte, Series 1999B,
6.000%, 07/01/28 | | | 2,000,000 | | |
NY New York City Municipal Water
Finance Authority, Series 1999A,
5.500%, 06/15/32 | | | 10,000,000 | | |
TX Harris County Health Facilities
Development Corp., Series 1999A,
5.375% 07/01/19 | | | 18,000,000 | | |
| | | $ | 51,000,000 | | |
Against these securities have been issued $25,500,000 par of Floating-Rate Notes bearing interest rates at November 30, 2006 ranging from 3.620% to 3.807%, at a weighted average rate of 3.717%. Interest paid on the Floating-Rate Notes during the year ended November 30, 2006 was at an average rate of 3.745%. The Fund's physical holdings at November 30, 2006 were Inverse Floaters totalling $25,500,000 par, market value of $28,505,350, bearing interest at a weighted rate of 7.371%. The Inverse Floaters are exempt from registration pursuant to Rule 144A under the Securities Act of 1933.
Note 6. Line of Credit
The Fund and other affiliated funds participate in a $350,000,000 committed unsecured revolving line of credit and a $150,000,000 uncommitted, unsecured line of credit, both provided by State Street. Borrowings are used for temporary or emergency purposes to facilitate portfolio liquidity.
Interest on the committed line of credit is charged to each participating fund based on the fund's borrowings at a rate per annum equal to the Federal Funds Rate plus 0.50%. In addition, a commitment fee of 0.10% per annum is accrued and apportioned among the participating funds based on their pro-rata portion of the unutilized committed line of credit. Interest on the uncommitted line of credit is charged to each participating fund based on the fund's borrowings at a variable rate per annum equal to the Federal Funds Rate plus a spread, as determined and quoted by State Street at the time of the request for a loan. A one-time structuring fee of $30,000 is also accrued and apportioned to each participating fund based on the average net assets of the participating funds. In addition, if the uncommitted line of credit is extended for an additional period, an annual administration fee of $15,000 will be charged and apportioned amon g the participating funds. The commitment fee and structuring fee are included in "Other expenses" in the Statement of Operations.
For the year ended November 30, 2006, the Fund did not borrow under these arrangements.
Note 7. Securities Lending
The Fund commenced a securities lending program in August 2006 and may lend its securities to certain approved brokers, dealers and other financial institutions. Each loan is collateralized by cash, in an amount at least equal to the market value of the securities loaned. The collateral received is invested and the income generated by the investment of the collateral, net of any fees remitted to State Street as the lending agent, is paid to the Fund. Generally, in the event of borrower default, the Fund has the right to use the collateral to offset any losses incurred. In the event the Fund is delayed or prevented from exercising its right to dispose of the collateral, there may be a potential loss to the Fund. The Fund bears the risk of loss with respect to the investment of collateral.
69
Columbia Tax-Exempt Fund, November 30, 2006
Note 8. Disclosure of Significant Risks and Contingencies
Concentration of Credit Risk
The Fund holds investments that are insured by private insurers who guarantee the payment of principal and interest in the event of default or that are supported by a letter of credit. Each of the Fund's insurers is rated Aaa by Moody's Investor Services, Inc. ("Moody's") or rated AAA by Standard & Poor's except for Radian Asset Assurance, Inc., which is rated Aa3 and AA by Moody's and Standard & Poor's, respectively. At November 30, 2006, investments supported by private insurers that represent greater than 5% of the total investments of the Fund were as follows:
| Insurer | | % of Total
Investments | |
| MBIA Insurance Corp. | | | 19.2 | % | |
| Financial Guaranty Insurance Co. | | | 14.5 | | |
| Ambac Assurance Corp. | | | 13.4 | | |
| Financial Security Assurance, Inc. | | | 9.7 | | |
High-Yield Securities
Investing in high-yield securities may involve greater credit risk and considerations not typically associated with investing in U.S. government bonds and other higher quality fixed income securities. These securities are non-investment grade securities, often referred to as "junk" bonds. Economic downturns may disrupt the high yield market and impair the ability of issuers to repay principal and interest. Also, an increase in interest rates would likely have an adverse impact on the value of such obligations. Moreover, high-yield securities may be less liquid to the extent that there is no established secondary market.
Industry Focus
The Fund may focus its investments in certain industries, subjecting it to greater risk than a fund that is more diversified.
Geographic Concentration
The Fund has greater than 5% of its total investments at November 30, 2006 invested in debt obligations issued by the states of New York, Massachusetts, Illinois, California, New Jersey, Texas and the territory of Puerto Rico and their respective political subdivisions, agencies and public authorities. The Fund is more susceptible to economic and political factors adversely affecting issuers of the state's or territories' municipal securities than are municipal bond funds that are not concentrated to the same extent in these issuers.
Legal Proceedings
On February 9, 2005, Columbia Management Advisors, Inc. (which has since merged into Banc of America Capital Management, LLC (now named Columbia Management Advisors, LLC)) ("Columbia") and Columbia Funds Distributor, Inc. (which has been renamed Columbia Management Distributors, Inc.) (the "Distributor") (collectively, the "Columbia Group") entered into an Assurance of Discontinuance with the New York Attorney General ("NYAG") (the "NYAG Settlement") and consented to the entry of a cease-and-desist order by the Securities and Exchange Commission ("SEC") (the "SEC Order"). The SEC Order and the NYAG Settlement are referred to collectively as the "Settlements". The Settlements contain substantially the same terms and conditions as outlined in the agreements in principle which Columbia Group entered into with the SEC and NYAG in March 2004.
Under the terms of the SEC Order, the Columbia Group agreed, among other things, to: pay $70 million in disgorgement and $70 million in civil money penalties; cease and desist from violations of the antifraud provisions and certain other provisions of the federal securities laws; maintain certain compliance and ethics oversight structures; retain an independent consultant to review the Columbia Group's applicable supervisory, compliance, control and other policies and procedures; and retain an independent distribution consultant (see below). The Columbia Funds have also voluntarily undertaken to implement certain governance measures designed to maintain the independence of their boards of trustees. The NYAG Settlement also, among other things, requires Columbia and its affiliates to reduce management fees for certain Columbia Funds (including the former Nations Funds) and other mutual funds collectively by $32 million per year f or five years, for a projected total of $160 million in management fee reductions.
Pursuant to the procedures set forth in the SEC Order, the $140 million in settlement amounts described above will be distributed in accordance with a distribution plan developed by an independent distribution consultant and approved by
70
Columbia Tax-Exempt Fund, November 30, 2006
the SEC. The independent distribution consultant has been in consultation with the staff of the SEC and has submitted a proposed plan of distribution. The SEC has released the proposed plan of distribution for public notice and comment but has not yet approved a final plan of distribution.
As a result of these matters or any adverse publicity or other developments resulting from them, there may be increased redemptions or reduced sales of fund shares, which could increase transaction costs or operating expenses, or have other adverse consequences for the funds.
A copy of the SEC Order is available on the SEC website at http://www.sec.gov. A copy of the NYAG Settlement is available as part of the Bank of America Corporation Form 8-K filing on February 10, 2005.
In connection with the events described in detail above, various parties have filed suit against certain funds, the Trustees of the Columbia Funds, FleetBoston Financial Corporation and its affiliated entities and/or Bank of America and its affiliated entities.
On February 20, 2004, the Judicial Panel on Multidistrict Litigation transferred these cases and cases against other mutual fund companies based on similar allegations to the United States District Court in Maryland for consolidated or coordinated pretrial proceedings (the "MDL"). Subsequently, additional related cases were transferred to the MDL. On September 29, 2004, the plaintiffs in the MDL filed amended and consolidated complaints. One of these amended complaints is a putative class action that includes claims under the federal securities laws and state common law, and that names Columbia, the Distributor, the Trustees of the Columbia Funds, Bank of America Corporation and others as defendants. Another of the amended complaints is a derivative action purportedly on behalf of the Columbia Funds that asserts claims under federal securities laws and state common law.
On February 25, 2005, Columbia and other defendants filed motions to dismiss the claims in the pending cases. On March 1, 2006, for reasons stated in the court's memoranda dated November 3, 2005, the U.S. District Court for the District of Maryland granted in part and denied in part the defendants' motions to dismiss. The court dismissed all of the class action claims pending against the Columbia Funds Trusts. As to Columbia and the Distributor, the claims under the Securities Act of 1933, the claims under Sections 34(b) and 36(a) of the Investment Company Act of 1940 ("ICA") and the state law claims were dismissed. The claims under Sections 10(b) and 20(a) of the Securities Exchange Act of 1934 and claims under Sect ion 36(b) of the ICA were not dismissed.
On March 21, 2005, a purported class action was filed in Massachusetts state court alleging that the conduct, including market timing, entitles Class B shareholders in certain Columbia funds to an exemption from contingent deferred sales charges upon early redemption ("the CDSC Lawsuit"). The CDSC Lawsuit has been removed to federal court in Massachusetts and the federal Judicial Panel has transferred the CDSC Lawsuit to the MDL.
On April 4, 2006, the plaintiffs and the Columbia defendants named in the MDL, including the Columbia Funds, entered into a term sheet containing the principal terms of a stipulation of settlement that would settle all Columbia-related claims in the MDL described above, including the CDSC Lawsuit. On April 6, 2006, the U.S. District Court for the District of Maryland stayed all actions with respect to these Columbia-related claims.
In 2004, certain Columbia funds, the Trustees of the Columbia Funds, advisers and affiliated entities were named as defendants in certain purported shareholder class and derivative actions making claims, including claims under the Investment Company and the Investment Advisers Acts of 1940 and state law. The suits allege, inter alia, that the fees and expenses paid by the funds are excessive and that the advisers and their affiliates inappropriately used fund assets to distribute the funds and for other improper purposes. On March 2, 2005, the actions were consolidated in the Massachusetts federal court as In re Columbia Entities Litigation. The plaintiffs filed a consolidated amended complaint on June 9, 2005 naming the Columbia Funds as nominal defendants. On November 30, 2005, the judge dismissed all claims by plaintiffs and ordered that the case be closed. The plaintiffs filed a notice of appeal to the United States Court of Appeals for the First Circuit on December 30, 2005; this appeal is currently pending. The parties have advised the appellate court that they are engaged in settlement discussions and the court has, accordingly, deferred the briefing schedule for the appeal. The settlement has not yet been finalized. Any settlement ultimately agreed by the parties will be subject to court approval.
This matter is ongoing. Accordingly, no estimate can be made of the financial impact, if any, of this litigation on any fund.
For the year ended November 30, 2006, Columbia has assumed $11,302 of legal, consulting services and Trustees' fees incurred by the Fund in connection with these matters.
71
Columbia Tax-Exempt Fund, November 30, 2006
Note 9. Business Combinations and Mergers
After the close of business on September 22, 2006, Columbia Tax-Exempt Insured Fund and Columbia Municipal Income Fund (collectively, the "Target Funds") merged into Columbia Tax-Exempt Fund. Columbia Tax-Exempt Fund received a tax-free transfer of assets from the Target Funds as follows:
| | | Shares
Issued | | Net Assets
Received | | Unrealized
Appreciation* | |
| Columbia Tax-Exempt Insured Fund | | | 9,023,311 | | | $ | 124,282,889 | | | $ | 15,636,407 | | |
| Columbia Municipal Income Fund | | | 44,339,246 | | | | 611,168,882 | | | | 35,832,754 | | |
| | | Net Assets of
Columbia Tax-Exempt Fund
Prior to
Combination | | Net Assets of
Target Funds
Immediately
Prior to
Combination | | Net Assets of
Columbia Tax-Exempt
Fund Immediately
After Combination | |
| | | $ | 1,875,715,026 | | | $ | 735,451,771 | | | $ | 2,611,166,797 | | |
On September 18, 2005, Columbia Managed Municipals Fund merged into Columbia Tax-Exempt Fund. Columbia Tax-Exempt Fund received a tax-free transfer of assets from Columbia Managed Municipals Fund as follows:
| | | Shares
Issued | | Net Assets
Received | | Unrealized
Appreciation* | |
| Columbia Managed Municipals Fund | | | 28,667,020 | | | $ | 393,220,891 | | | $ | 37,104,007 | | |
| | | Net Assets of
Columbia Tax-Exempt Fund
Prior to
Combination | | Net Assets of
Columbia Managed
Municipals Fund
Immediately
Prior to
Combination | | Net Assets of
Columbia Tax-Exempt
Fund After
Combination | |
| | | $ | 1,622,123,339 | | | $ | 393,220,891 | | | $ | 2,015,344,230 | | |
* Unrealized appreciation is included in the respective Net Assets Received amount shown above.
72
Report of Independent Registered Public Accounting Firm
Columbia Tax-Exempt Fund
To the Trustees of Columbia Funds Series Trust I and the Shareholders of Columbia Tax-Exempt Fund
In our opinion, the accompanying statement of assets and liabilities, including the investment portfolio, and the related statements of operations and of changes in net assets and the financial highlights present fairly, in all material respects, the financial position of Columbia Tax-Exempt Fund (the "Fund") (a series of Columbia Funds Series Trust I) at November 30, 2006 and the results of its operations, the changes in its net assets and its financial highlights for the periods indicated, in conformity with accounting principles generally accepted in the United States of America. These financial statements and financial highlights (hereafter referred to as "financial statements") are the responsibility of the Fund's management. Our responsibility is to express an opinion on these financial statements based on our audits.We conducted our audits of these financial statements in accordance with the standards of the Public Compan y Accounting Oversight Board (United States). Those standards require that we plan and perform the audit to obtain reasonable assurance about whether the financial statements are free of material misstatement. An audit includes examining, on a test basis, evidence supporting the amounts and disclosures in the financial statements, assessing the accounting principles used and significant estimates made by management, and evaluating the overall financial statement presentation.We believe that our audits, which included confirmation of securities at November 30, 2006 by correspondence with the custodian and brokers, provide a reasonable basis for our opinion.
PricewaterhouseCoopers LLP
Boston, Massachusetts
January 25, 2007
73
Unaudited Information – Columbia Tax-Exempt Fund
Federal Income Tax Information
100.00% of distributions from net investment income will be treated as exempt income for federal income tax purposes.
74
Fund Governance – Columbia Tax-Exempt Fund
The Trustees serve terms of indefinite duration. The names, addresses and ages of the Trustees and officers of the Funds in the Columbia Funds Complex, the year each was first elected or appointed to office, their principal business occupations during at least the last five years, the number of portfolios overseen by each Trustee and other directorships they hold are shown below. Each officer listed below serves as an officer of each Fund in the Columbia Funds Complex.
Independent Trustees
Name, Address and Year of Birth,
Position with Funds, Year First
Elected or Appointed to Office(1) | | Principal Occupation(s) During Past Five Years, Number of Portfolios in Columbia
Funds Complex Overseen by Trustee, Other Directorships Held
| |
| Douglas A. Hacker (Born 1955) | |
|
c/o Columbia Management Advisors, LLC
One Financial Center
Boston, MA 02111
Trustee (since 1996) | | Independent business executive since May, 2006; Executive Vice President-Strategy of United Airlines (airline) from December, 2002 to May, 2006; President of UAL Loyalty Services (airline marketing company) from September, 2001 to December, 2002; Executive Vice President and Chief Financial Officer of United Airlines from July, 1999 to September, 2001. Oversees 81, Nash Finch Company (food distributor); Aircastle Limited (aircraft leasing) | |
|
| Janet Langford Kelly (Born 1957) | |
|
c/o Columbia Management Advisors, LLC
One Financial Center
Boston, MA 02111
Trustee (since 1996) | | Deputy General Counsel-Corporate Legal Services, ConocoPhillips (integrated petroleum company) since August, 2006; Partner, Zelle, Hofmann, Voelbel, Mason & Gette LLP (law firm) from March, 2005 to July, 2006; Adjunct Professor of Law, Northwestern University, from September, 2004 to June, 2006, Director, UAL Corporation (airline) from February, 2006 to July, 2006; Chief Administrative Officer and Senior Vice President, Kmart Holding Corporation (consumer goods), from September, 2003 to March, 2004; Executive Vice President-Corporate Development and Administration, General Counsel and Secretary, Kellogg Company (food manufacturer), from September, 1999 to August, 2003. Oversees 81, None | |
|
| Richard W. Lowry (Born 1936) | |
|
c/o Columbia Management Advisors, LLC
One Financial Center
Boston, MA 02111
Trustee (since 1995) | | Private Investor since August, 1987 (formerly Chairman and Chief Executive Officer, U.S. Plywood Corporation (building products manufacturer) until 1987). Oversees 81, None | |
|
| Charles R. Nelson (Born 1943) | |
|
c/o Columbia Management Advisors, LLC
One Financial Center
Boston, MA 02111
Trustee (since 1981) | | Professor of Economics, University of Washington, since January, 1976; Ford and Louisa Van Voorhis Professor of Political Economy, University of Washington, since September, 1993; Director, Institute for Economic Research, University of Washington from September, 2001 to June, 2003; Adjunct Professor of Statistics, University of Washington, since September, 1980; Associate Editor, Journal of Money Credit and Banking, since September, 1993; Consultant on econometric and statistical matters. Oversees 81, None | |
|
75
Fund Governance (continued) – Columbia Tax-Exempt Fund
Independent Trustees
Name, Address and Year of Birth,
Position with Funds, Year First
Elected or Appointed to Office(1) | | Principal Occupation(s) During Past Five Years, Number of Portfolios in Columbia
Funds Complex Overseen by Trustee, Other Directorships Held
| |
| John J. Neuhauser (Born 1942) | |
|
c/o Columbia Management Advisors, LLC
One Financial Center
Boston, MA 02111
Trustee (since 1985) | | University Professor, Boston College since November, 2005; Academic Vice President and Dean of Faculties, Boston College from August, 1999 to October, 2005. Oversees 81, None | |
|
| Patrick J. Simpson (Born 1944) | |
|
c/o Columbia Management Advisors, LLC
One Financial Center
Boston, MA 02111
Trustee (since 2000) | | Partner, Perkins Coie LLP (law firm). Oversees 81, None | |
|
| Thomas E. Stitzel (Born 1936) | |
|
c/o Columbia Management Advisors, LLC
One Financial Center
Boston, MA 02111
Trustee (since 1998) | | Business Consultant since 1999; Chartered Financial Analyst. Oversees 81, None | |
|
| Thomas C. Theobald (Born 1937) | |
|
c/o Columbia Management Advisors, LLC
One Financial Center
Boston, MA 02111
Trustee and Chairman of the Board(2) (since 1996) | | Partner and Senior Advisor, Chicago Growth Partners (private equity investing) since September, 2004; Managing Director, William Blair Capital Partners (private equity investing) from September, 1994 to September, 2004. Oversees 81, Anixter International (network support equipment distributor); Ventas, Inc. (real estate investment trust); Jones Lang LaSalle (real estate management services); Ambac Financial Group (financial guaranty insurance) | |
|
| Anne-Lee Verville (Born 1945) | |
|
c/o Columbia Management Advisors, LLC
One Financial Center
Boston, MA 02111
Trustee (since 1998) | | Retired since 1997 (formerly General Manager, Global Education Industry, IBM Corporation (computer and technology) from 1994 to 1997). Oversees 81, None | |
|
76
Fund Governance (continued) – Columbia Tax-Exempt Fund
Interested Trustee
Name, Address and Year of Birth,
Position with Funds, Year First
Elected or Appointed to Office(1) | | Principal Occupation(s) During Past Five Years, Number of Portfolios in Columbia
Funds Complex Overseen by Trustee, Other Directorships Held | |
| William E. Mayer (Born 1940) | |
|
c/o Columbia Management Advisors, LLC
One Financial Center
Boston, MA 02111
Trustee(3) (since 1994) | | Partner, Park Avenue Equity Partners (private equity) since February, 1999; Dean and Professor, College of Business, University of Maryland, 1992 to 1997. Oversees 81, Lee Enterprises (print media), WR Hambrecht + Co. (financial service provider); Reader's Digest (publishing) | |
|
1 In December 2000, the boards of each of the former Liberty Funds and former Stein Roe Funds were combined into one board of trustees responsible for the oversight of both fund groups (collectively, the "Liberty Board"). In October 2003, the trustees on the Liberty Board were elected to the boards of the Columbia Funds (the "Columbia Board") and of the CMG Fund Trust (the "CMG Funds Board"); simultaneous with that election, Patrick J. Simpson who had been a director on the Columbia Board and trustee on the CMG Funds Board, was appointed to serve as trustee of the Liberty Board. The date shown is the earliest date on which a trustee/director was elected or appointed to the board of a Fund in the Columbia Funds Complex.
2 Mr. Theobald was appointed as Chairman of the Board effective December 10, 2003.
3 Mr. Mayer is an "interested person" (as defined in the Investment Company Act of 1940 (1940 Act)) by reason of his affiliation with WR Hambrecht + Co.
The Statement of Additional Information includes additional information about the Trustees of the Funds and is available, without charge, upon request by calling 800-426-3750.
Officers
Name, Address and Year of Birth,
Position with Columbia Funds,
Year First Elected or
Appointed to Office | | Principal Occupation(s) During Past Five Years | |
| Christopher L. Wilson (Born 1957) | |
|
One Financial Center
Boston, MA 02111
President (since 2004) | | Head of Mutual Funds since August, 2004 and Managing Director of Columbia Management Advisors, LLC ("the Advisor") since September, 2005; President and Chief Executive Officer, CDC IXIS Asset Management Services, Inc. (investment management) from September, 1998 to August, 2004. | |
|
| James R. Bordewick, Jr. (Born 1959) | |
|
One Financial Center
Boston, MA 02111
Senior Vice President, Secretary and Chief Legal Officer (since 2006) | | Associate General Counsel, Bank of America since April, 2005; Senior Vice President and Associate General Counsel, MFS Investment Management (investment management) prior to April, 2005. | |
|
| J. Kevin Connaughton (Born 1964) | |
|
One Financial Center
Boston, MA 02111
Senior Vice President, Chief Financial Officer and Treasurer (since 2000) | | Managing Director of the Advisor since February, 1998. | |
|
77
Fund Governance (continued) – Columbia Tax-Exempt Fund
Officers
Name, Address and Year of Birth,
Position with Columbia Funds,
Year First Elected or
Appointed to Office | | Principal Occupation(s) During Past Five Years | |
| Linda J. Wondrack (Born 1964) | |
|
One Financial Center
Boston, MA 02111
Senior Vice President, Chief Compliance Officer (since 2007) | | Director (Columbia Management Group LLC and Investment Product Group Compliance), Bank of America since June 2005; Director of Corporate Compliance and Conflicts Officer, MFS Investment Management (investment management), August 2004 to May 2005; Managing Director, Deutsche Asset Management (investment management) prior to August 2004. | |
|
| Michael G. Clarke (Born 1969) | |
|
One Financial Center
Boston, MA 02111
Chief Accounting Officer and Assistant Treasurer (since 2004) | | Director of Fund Administration of the Advisor since January, 2006; Managing Director of the Advisor September, 2004 to December, 2005; Vice President Fund Administration of the Advisor June, 2002 to September, 2004. Vice President Product Strategy and Development of the Advisor from February, 2001 to June, 2002. | |
|
| Jeffrey R. Coleman (Born 1969) | |
|
One Financial Center
Boston, MA 02111
Deputy Treasurer (since 2006) | | Director of Fund Administration of the Advisor since January, 2006; Fund Controller of the Advisor from October 2004 to January 2006; Vice President of CDC IXIS Asset Management Services, Inc. (investment management) from August, 2000 to September, 2004. | |
|
| Joseph F. DiMaria (Born 1968) | |
|
One Financial Center
Boston, MA 02111
Deputy Treasurer (since 2006) | | Director of Fund Administration of the Advisor since January, 2006; Head of Tax/Compliance and Assistant Treasurer of the Advisor from November, 2004 to December, 2005; Director of Trustee Administration (Sarbanes-Oxley) of the Advisor from May, 2003 to October, 2004; Senior Audit Manager, PricewaterhouseCoopers (independent registered public accounting firm) from July, 2000 to April, 2003. | |
|
| Ty S. Edwards (Born 1966) | |
|
One Financial Center
Boston, MA 02111
Deputy Treasurer (since 2006) | | Director of Fund Administration of the Advisor since January, 2006; Vice President of the Advisor from July, 2002 to December, 2005; Assistant Vice president and Director, State Street Corporation (financial services) prior to 2002. | |
|
| Barry S. Vallan (Born 1969) | |
|
One Financial Center
Boston, MA 02111
Controller (since 2006) | | Vice President-Fund Treasury of the Advisor since October, 2004; Vice President-Trustee Reporting of the Advisor from April, 2002 to October, 2004; Management Consultant, PricewaterhouseCoopers (independent registered public accounting firm) prior to October, 2002. | |
|
78
Board Consideration and Approval of Investment Advisory Agreements
The Advisory Fees and Expenses Committee of the Board of Trustees meets one or more times annually to review the advisory agreements (collectively, the "Agreements") of the funds for which the Trustees serve as trustees (each a "fund") and determine whether to recommend that the full Board approve the continuation of the Agreements for an additional one-year period. After the Committee has made its recommendation, the full Board, including the Independent Trustees, determines whether to approve the continuation of the Agreements. In addition, the Board, including the Independent Trustees, considers matters bearing on the Agreements at most of its other meetings throughout the year and meets regularly with the heads of each investment area within Columbia. Through the Board's Investment Oversight Committees, Trustees also meet with selected fund portfolio managers at various times throughout the year.
The Trustees receive and review all materials that they, their legal counsel or Columbia, the funds' investment adviser, believe to be reasonably necessary for the Trustees to evaluate the Agreements and determine whether to approve the continuation of the Agreements. Those materials generally include, among other items, (i) information on the investment performance of each fund relative to the performance of peer groups of mutual funds and the fund's performance benchmarks, (ii) information on each fund's advisory fees and other expenses, including information comparing the fund's expenses to those of peer groups of mutual funds and information about any applicable expense caps and fee "breakpoints," (iii) information about the profitability of the Agreements to Columbia, including potential "fall-out" or ancillary benefits that Columbia and its affiliates may receive as a result of their relationships with the funds and (iv) i nformation obtained through Columbia's response to a questionnaire prepared at the request of the Trustees by counsel to the funds and independent legal counsel to the Independent Trustees. The Trustees also consider other information such as (v) Columbia's financial results and financial condition, (vi) each fund's investment objective and strategies and the size, education and experience of Columbia's investment staffs and their use of technology, external research and trading cost measurement tools, (vii) the allocation of the funds' brokerage, if any, and the use of "soft" commission dollars to pay for research products and services, (viii) Columbia's resources devoted to, and its record of compliance with, the funds' investment policies and restrictions, policies on personal securities transactions and other compliance policies, (ix) Columbia's response to various legal and regulatory proceedings since 2003 and (x) the economic outl ook generally and for the mutual fund industry in particular. In addition, the Advisory Fees and Expenses Committee confers with the funds' independent fee consultant and reviews materials relating to the funds' relationships with Columbia provided by the independent fee consultant. Throughout the process, the Trustees have the opportunity to ask questions of and request additional materials from Columbia and to consult with independent legal counsel to the Independent Trustees and the independent fee consultant.
The Board of Trustees most recently approved the continuation of the Agreements at its October, 2006 meeting, following meetings of the Advisory Fees and Expenses Committee held in August, September and October, 2006. In considering whether to approve the continuation of the Agreements, the Trustees, including the Independent Trustees, did not identify any single factor as determinative, and each weighed various factors as he or she deemed appropriate. The Trustees considered the following matters in connection with their approval of the continuation of the Agreements:
The nature, extent and quality of the services provided to the funds under the Agreements. The Trustees considered the nature, extent and quality of the services provided by Columbia and its affiliates to the funds and the resources dedicated to the funds by Columbia and its affiliates. Among other things, the Trustees considered (i) Columbia's ability (including its personnel and other resources, compensation programs for personnel involved in fund management, reputation and other attributes) to attract and retain highly qualified research, advisory and supervisory investment professionals; (ii) the portfolio management services provided by those investment professionals; and (iii) the trade execution services provided on behalf of the funds. For each fund, the Trustees also considered the benefits to shareholders of investing in a mutual fund that is part of a family of funds offering exposure to a variety of asset classes and investment disciplines and providing a variety of fund and shareholder services. After reviewing those and related factors, the Trustees concluded, within the context of their overall conclusions regarding each of the Agreements, that the
79
nature, extent and quality of services provided supported the continuation of the Agreements.
Investment performance of the funds and Columbia. The Trustees reviewed information about the performance of each fund over various time periods, including information prepared by an independent third party that compared the performance of each fund to the performance of peer groups of mutual funds and performance benchmarks. The Trustees also reviewed a description of the third party's methodology for identifying each fund's peer group for purposes of performance and expense comparisons. The Trustees also considered additional information that the Advisory Fees and Expenses Committee requested from Columbia relating to funds that presented relatively weaker performance and/or relatively higher expenses.
In the case of each fund whose performance lagged that of a relevant peer group for certain (although not necessarily all) periods, the Trustees concluded that other factors relevant to performance were sufficient, in light of other considerations, to warrant continuation of the fund's Agreements. Those factors varied from fund to fund, but included one or more of the following: (i) that the fund's performance, although lagging in certain recent periods, was stronger over the longer term; (ii) that the underperformance was attributable, to a significant extent, to investment decisions that were reasonable and consistent with the fund's investment strategy and policies and that the fund was performing as expected, given these investment decisions, market conditions and the fund's investment strategy; (iii) that the fund's performance was competitive when compared to other relevant performance benchmarks or peer groups; (iv) that Columbia had taken or was taking steps designed to help improve the fund's investment performance, including, but not limited to, replacing portfolio managers or modifying investment strategies; and (v) that the fund was proposed to be reorganized into another fund, and that such reorganization would result in a reduction in fund expenses.
The Trustees also considered Columbia's performance and reputation generally, the funds' performance as a fund family generally, and Columbia's historical responsiveness to Trustee concerns about performance and Columbia's willingness to take steps intended to improve performance.
After reviewing those and related factors, the Trustees concluded, within the context of their overall conclusions regarding each of the Agreements, that the performance of each fund and Columbia was sufficient, in light of other considerations, to warrant the continuation of the Agreement(s) pertaining to that fund.
The costs of the services provided and profits realized by Columbia and its affiliates from their relationships with the funds. The Trustees considered the fees charged to the funds for advisory services as well as the total expense levels of the funds. That information included comparisons (provided by management and by an independent third party) of each fund's advisory fees and total expense levels to those of the fund's peer groups and information about the advisory fees charged by Columbia to comparable institutional accounts. In considering the fees charged to those accounts, the Trustees took into account, among other things, management's representations about the differences between managing mutual funds as compared to other types of accounts, including differences in the services provided, differences in the risk profile of such business for Columbia, and the additional resources required to manage mutual funds effectively. In evaluating each fund's advisory fees, the Trustees also took into account the demands, complexity and quality of the investment management of the fund. The Trustees considered existing advisory fee breakpoints, and Columbia's use of advisory fee waivers and expense caps, which benefited a number of the funds. The Trustees also noted management's stated justification for the fees charged to the funds, which included information about the investment performance of the funds and the services provided to the funds.
The Trustees also considered the compensation directly or indirectly received by Columbia and its affiliates from their relationships with the funds. The Trustees reviewed information provided by management as to the profitability to Columbia and its affiliates of their relationships with each fund, and information about the allocation of expenses used to calculate profitability. When reviewing profitability, the Trustees also considered court cases in which adviser profitability was an issue in whole or in part, the performance of the relevant funds, the expense level of each fund, and whether Columbia had implemented breakpoints and/or expense caps with respect to the fund.
80
After reviewing those and related factors, the Trustees concluded, within the context of their overall conclusions regarding each of the Agreements, that the advisory fees charged to each fund, and the related profitability to Columbia and its affiliates of their relationships with the fund, supported the continuation of the Agreement(s) pertaining to that fund.
Economies of Scale. The Trustees considered the existence of any economies of scale in the provision by Columbia of services to each fund, to groups of related funds, and to Columbia's investment advisory clients as a whole and whether those economies were shared with the funds through breakpoints in the investment advisory fees or other means, such as expense waivers/reductions and additional investments by Columbia in investment, trading and compliance resources. The Trustees noted that many of the funds benefited from breakpoints, expense caps, or both. In considering those issues, the Trustees also took note of the costs of the services provided (both on an absolute and a relative basis) and the profitability to Columbia and its affiliates of their relationships with the funds, as discussed above.
After reviewing those and related factors, the Trustees concluded, within the context of their overall conclusions regarding each of the Agreements, that the extent to which economies of scale were shared with the funds supported the continuation of the Agreements.
Other Factors. The Trustees also considered other factors, which included but were not limited to the following:
• the extent to which each fund had operated in accordance with its investment objective and investment restrictions, the nature and scope of the compliance programs of the funds and Columbia and the compliance-related resources that Columbia and its affiliates were providing to the funds;
• the nature, quality, cost and extent of administrative and shareholder services performed by Columbia and its affiliates, both under the Agreements and under separate agreements for the provision of transfer agency and administrative services;
• so-called "fall-out benefits" to Columbia and its affiliates, such as the engagement of its affiliates to provide distribution, brokerage and transfer agency services to the funds, and the benefits of research made available to Columbia by reason of brokerage commissions generated by the funds' securities transactions, as well as possible conflicts of interest associated with those fall-out and other benefits, and the reporting, disclosure and other processes in place to disclose and monitor those possible conflicts of interest; and
• the draft report provided by the funds' independent fee consultant, which included information about and analysis of the funds' fees, expenses and performance.
Based on their evaluation of all factors that they deemed to be material, including those factors described above, and assisted by the advice of independent counsel and the independent fee consultant, the Trustees, including the Independent Trustees, approved the continuance of each of the Agreements through October 31, 2007.
81
Summary of Management Fee Evaluation by Independent Fee Consultant
Prepared Pursuant to the February 9, 2005
Assurance of Discontinuance
between the Office of
Attorney General of New York State and
Columbia Management Advisors, Inc. and
Columbia Funds Distributor, Inc.
October 11, 2006
I. Overview
Columbia Management Advisors, LLC ("CMA") and Columbia Funds Distributors, Inc.1 ("CFD") agreed on February 9, 2005 to the New York Attorney General's Assurance of Discontinuance ("AOD"). Among other things, the AOD stipulates that CMA may manage or advise a Columbia Fund ("Fund" and together with all such funds or a group of such funds as the "Funds") only if the Independent Members of the Fund's Board of Trustees (such Independent Members of the Fund's Board together with the other members of the Fund's Board, referred to as the "Trustees") appoint a Senior Officer or retain an Independent Fee Consultant ("IFC") who is to manage the process by which proposed management fees are negotiated. The AOD further stipulates that the Senior Officer or IFC is to prepare a written annual evaluation of the fee negotiation process.
On September 14, 2006, the Independent Members of the Funds' Boards retained me as IFC for the Funds. In this capacity, I have prepared the second annual written evaluation of the fee negotiation process. I am successor to the first IFC, Erik Sirri, who prepared the annual evaluation in 2005 and who contributed to the second annual written evaluation until his resignation as IFC in August 2006 to become Director of the Division of Market Regulation at the U.S. Securities and Exchange Commission.2
A. Role of the Independent Fee Consultant
The AOD charges the IFC with "managing the process by which proposed management fees...to be charged the Columbia Fund are negotiated so that they are negotiated in a manner which is at arms' length and reasonable and consistent with this Assurance of Discontinuance." In this role, the IFC does not replace the Trustees in negotiating management fees with CMA, and the IFC does not substitute his or her judgment for that of the Trustees about the reasonableness of proposed fees. As the AOD states, CMA "may manage or advise a Columbia Fund only if the reasonableness of the proposed management fees is determined by the Board of Trustees...using...an annual independent written evaluation prepared by or under the direction of...the Independent Fee Consultant."
B. Elements Involved in Managing the Fee Negotiation Process
Managing the fee negotiation process has three elements. One involves reviewing the information provided by CMG to the Trustees for evaluating the proposed management fees and augmenting that information, as necessary, with additional information from CMG or other sources and with further analyses of the information and data. The second element involves reviewing the information and analysis relative to at least the following six factors set forth in the AOD:
1. The nature and quality of CMA's services, including the Fund's performance;
2. Management fees (including any components thereof) charged by other mutual fund companies for like services;
3. Possible economies of scale as the Fund grows larger;
4. Management fees (including any components thereof) charged to institutional and other clients of CMA for like services;
5. Costs to CMA and its affiliates of supplying services pursuant to the management fee agreements, excluding any intra-corporate profit; and
6. Profit margins of CMA and its affiliates from supplying such services.
1 CMA and CFD are subsidiaries of Columbia Management Group, Inc. ("CMG"), which also is the parent of Columbia Management Services, Inc. ("CFS"), the Funds' transfer agent. Before the date of this report, CMA merged into an affiliated entity, Banc of America Capital Management, LLC, which was renamed Columbia Management Advisors, LLC and which carries on the business of CMA. CFD also has been renamed Columbia Management Distributors, Inc.
2 I am an independent economic consultant. From August 2005 until August 2006, I provided support to Mr. Sirri as an independent consultant. From 1994 to 2004, I was Chief Economist at the Investment Company Institute. Earlier, I was Section Chief and Assistant Director at the Federal Reserve Board and Professor of Economics at Oklahoma State University. I have no material relationship with Bank of America or CMG, aside from serving as IFC, and I am aware of no material relationship with any of their affiliates. To assist me with the report, I engaged NERA Economic Consulting, an independent consulting firm that has had extensive experience in the mutual fund industry. I also have retained Willkie Farr & Gallagher LLP as counsel to advise me in connection with the report.
82
The final element involves providing the Trustees with a written evaluation of the above factors as they relate to the fee negotiation process.
C. Organization of the Annual Evaluation
The 2006 annual evaluation focuses on the six factors and contains a section for each factor except that CMA's costs and profits from managing the Funds have been combined into a single section. In each section, the discussion of the factor considers and analyzes the available data and other information as they bear upon the fee negotiation process. If appropriate, the discussion in the section may point out certain aspects of the proposed fees that may warrant particular attention from the Trustees. The discussion also may suggest other data, information, and approaches that the Trustees might consider incorporating into the fee negotiation process in future years.
In addition to a discussion of the six factors, the report reviews the status of recommendations made in the 2005 IFC evaluation. The 2006 report also summarizes the findings with regard to the six factors and contains a summary of recommendations for possible enhancements to the process.
II. Status of 2005 Recommendations
The 2005 IFC evaluation contains recommendations aimed at enhancing the evaluation of proposed management fees by Trustees. The section summarizes those recommendations and includes my assessment of the response to the recommendations.
1. Recommendation: Trustees should consider requesting more analytical work from CMG in the preparation of future 15(c) materials.
Status: CMG has provided additional analyses to the Trustees on economies of scale, a comparative analysis of institutional and retail management fees, management fee breakpoints, risk-adjusted performance, fee waivers and expense reimbursements, and CMG's costs and profitability.
2. Recommendation: Trustees may wish to consider whether CMG should continue expanding the use of Morningstar or other third party data to supplement CMG's fee and performance analysis that is now based primarily on Lipper reports.
Status: CMG has used data from Morningstar Inc. to compare with data from Lipper Inc. ("Lipper") in performing the Trustees' screening procedures.
3. Recommendation: Trustees should consider whether...the fund-by-fund screen...should place comparable emphasis on both basis point and quintile information in their evaluation of the funds...Also, the Trustees should consider incorporating sequences of one-year performance into a fund-by-fund screen.
Status: CMG has not provided Trustees with results of the screening process using percentiles. CMG has provided Trustees with information on the changes in performance and expenses between 2005 and 2006 and data on one-year returns.
4. Recommendation: Given the volatility of fund performance, the Trustees may want to consider whether a better method exists than th[e] fee waiver process to deal with fund underperformance.
Status: It is my understanding that the Trustees have determined to address fund underperformance not only through fee waivers and expense caps but also through discussions with CMG regarding the sources of underperformance. CMG has provided Trustees with an analysis of the relationship between breakpoints, expense reimbursements, and fee waivers.
5. Recommendation: [Seventy-one] percent of funds [have] yet to reach their first management fee breakpoint... Trustees may wish to consider whether the results of my ongoing economies-of-scale work affects the underlying economic assumptions reflected in the existing breakpoint schedules.
Status: CMG has prepared a memo for the Trustees discussing its views on the nature and sharing of potential economies of scale. The memo discuses CMG's view that economies of scale arise at the complex level rather than the fund level. The memo also describes steps, including the introduction of breakpoints, taken to share economies of scale with shareholders. CMG's analysis, however, does not discuss specific sources of economies of scale and does not link breakpoints to economies of scale that might be realized as the Funds' assets increase.
83
6. Recommendation: Trustees should continue working with management to address issues of funds that demonstrate consistent or significant underperformance even if the fee levels for the funds are low.
Status: Trustees monitor performance on an ongoing basis.
III. Findings
A. General
1. Based upon my examination of the available information and the six factors, I conclude that the Trustees have the relevant information necessary to evaluate the reasonableness of the proposed management fees for the Funds. CMG has provided the Trustees with relevant materials on the six factors through the 15(c) contract renewal process and in materials prepared for review at Board and Committee meetings.
2. In my view, the process by which the proposed management fees of the Funds have been negotiated in 2006 thus far has been, to the extent practicable, at arms' length and reasonable and consistent with the AOD.
B. Nature and Quality of Services, Including Performance
3. The performance of the Funds has been relatively strong, especially that of fixed-income Funds. For each of the 1-, 3-, 5- and 10-year performance periods, over 60 percent of the funds have ranked in the top three performance quintiles.
4. The performance of the equity Funds overall, though less concentrated in the top two quintiles than the fixed-income Funds, improved in 2006 relative to that in 2005. The fixed-income funds maintained the relatively high performance level of 2005 in 2006.
5. The Funds' overall performance adjusted for risk was significantly stronger than performance unadjusted for risk. Domestic and international equity funds, in particular, moved to higher relative performance rankings after adjusting for risk.
6. The procedure used to construct the performance universe in which each Fund's performance is ranked relative to comparable funds may bias a Fund's ranking upward within that universe. The bias occurs because the performance ranking procedure includes all share classes of multi-class funds in the universe and because the procedure ranks either no-load or A share classes of the Funds. No-load and A share classes generally have lower total expenses than B and C shares (owing to B and C shares having higher distribution/service fees) and thus, given all else, would outperform many of B and C share classes included in the universe. A preliminary analysis that adjusts for the bias results in a downward movement in the relative performance for the Funds but does not change the general finding that the Funds' performance has been strong relative to co mparable funds.
C. Management Fees Charged by Other Mutual Fund Companies
7. The Funds' management fees and total expenses are generally low relative to those of their peers. At least 56 percent of the Funds are in the first or second quintiles with the lowest fees and expenses and nearly three-fourths or more in the first three quintiles. Equity Funds are more highly concentrated in the first three quintiles than fixed-income Funds.
8. The fee and expense rankings as whole are similar to those in 2005 in that the majority of funds are ranked in the top quintiles. Nonetheless, a number of individual funds experienced a change in ranking between 2005 and 2006. This fund-level instability may reflect sensitivity of rankings to the composition of the comparison groups, as the membership of the peer groups typically changed substantially between the two years.
9. The Liberty Money Market Fund VS appears to have a higher management fee structure than that of other Columbia money market funds of comparable asset size.
D. Trustees' Fee and Performance Evaluation Process
10. The Trustees' evaluation process identified 21 funds in 2006 for further review based upon their relative performance or expenses. Seventeen of these funds had been subject to review in 2004 or 2005.
84
E. Potential Economies of Scale
11. CMG has prepared a memo for the Trustees containing its views on the sources and sharing of potential economies of scale. CMG views economies of scale as arising at the complex level and would regard estimates of scale economies for individual funds as unreliable. CMG has not, however, identified specific sources of economies of scale nor has it provided any estimates of the magnitude of any economies of scale. In the memo, CMG also describes measures taken by the Trustees and CMG that seek to share any potential economies of scale through breakpoints in management fee schedules, expense reimbursements, fee waivers, enhanced shareholder services, fund mergers, and operational consolidation. These measures, although of significant benefit to shareholders, have not been directly linked in the memo to the existence, sources, and magnitude of economies of scale.
F. Management Fees Charged to Institutional Clients
12. CMG has provided Trustees with comparisons of mutual fund management fees and institutional fees based upon standardized fee schedules and upon actual fees. Based upon the information, institutional fees are generally lower than the Funds' management fees. This pattern is consistent with the economics of the two financial products. Data are not available, however, on actual institutional fees at other money managers. Thus, it is not possible to determine the extent to which differences between the Funds' management fees and institutional fees are consistent with those seen generally in the marketplace.
G. Revenues, Expenses, and Profits
13. The financial statements and the methodology underlying their construction generally form a sufficient basis for Trustees to evaluate the expenses and profitability of the Funds.
IV. Recommendations
A. Performance
1. Trustees may wish to consider incorporating risk-adjusted measures in their evaluation of performance. CMG has begun to prepare reports for the Trustees with risk adjustments, which could form the basis for formally including the measures in the 15(c) materials. To this end, Trustees may wish to have CMG prepare documents explaining risk adjustments and describing their advantages and disadvantages.
2. Trustees may wish to consider having CMG evaluate the sensitivity of performance rankings to the design of the universe. The preliminary analysis contained in the evaluation suggests that the method employed by Lipper, the source of performance rankings used by the Trustees, may bias performance rankings upward.
B. Economies of Scale
3. Trustees may wish to consider having CMG extend its analysis of economies of scale by examining the sources of such economies, if any. Identification of the sources may enable the Trustees and CMG to gauge their magnitude. It also may enable the Trustees and CMG to build upon past work on standardized fee schedules so that the schedules themselves are consistent with any economies of scale and their sources. Finally, an extension of the analysis may enable the Trustees and CMG to develop a framework that coordinates the use of fee waivers and expense caps with the standard fee schedules and with any economies of scale and their sources.
C. Institutional Fees
4. Trustees may wish to consider encouraging CMG to build further upon its expanded analysis of institutional fees by refining the matching of institutional accounts with mutual funds, by dating the establishment of each institutional account, and by incorporating other accounts, such as subadvisory relationships, trusts, offshore funds, and separately managed accounts into the analysis.
D. Profitability
5. Trustees may wish to consider requesting that CMG expand the reporting of revenues and expenses to include more line-item detail for management and administration, transfer agency, fund accounting, and distribution.
6. Trustees may wish to consider requesting that CMG provide a statement of its operations in the 15(c) materials.
7. Trustees may wish to consider the treatment of the revenue sharing with the Private Bank of Bank of America in their review of CMG's profitability.
Respectfully submitted,
John D. Rea
85
Appendix
Sources of Information Used in the Evaluation
The following list generally describes the sources and types of information that were used in preparing this report.
1. Performance, management fees, and expense ratios for the Funds and comparable funds from other fund complexes from Lipper and CMG. The sources of this information were CMG and Lipper;
2. CMG's expenses and profitability obtained directly from CMG;
3. Information on CMG's organizational structure;
4. Profitability of publicly traded asset managers from Lipper;
5. Interviews with CMG staff, including members of senior management, legal staff, heads of affiliates, portfolio managers, and financial personnel;
6. Documents prepared by CMG for Section 15(c) contract renewals in 2005 and 2006;
7. Academic research papers, industry publications, professional materials on mutual fund operations and profitability, and SEC releases and studies of mutual fund expenses
8. Interviews with and documents prepared by Ernst & Young LLP in its review of the Private Bank Revenue Sharing Agreement;
9. Discussions with Trustees and attendance at Board and committee meetings during which matters pertaining to the evaluation were considered.
In addition, I engaged NERA Economic Consulting ("NERA") to assist me in data management and analysis. NERA has extensive experience in the mutual fund industry that provides unique insights and special knowledge pertaining to my independent analysis of fees, performance, and profitability. I have also retained attorneys in the Washington, D.C. office of Willkie Farr & Gallagher LLP as outside counsel to advise me in connection with my evaluation.
Finally, meetings and discussions with CMG staff were informative. My participation in Board and committee meetings in which Trustees and CMG management discussed issues relating to management contracts were of great benefit to the preparation of the evaluation.
86
Columbia Funds – Columbia Tax-Exempt Fund
| Growth Funds | | Columbia Acorn Fund
Columbia Acorn Select
Columbia Acorn USA
Columbia Large Cap Growth Fund
Columbia Marsico 21st Century Fund
Columbia Marsico Focused Equities Fund
Columbia Marsico Growth Fund
Columbia Mid Cap Growth Fund
Columbia Small Cap Growth Fund I
Columbia Small Cap Growth Fund II | |
|
| Core Funds | | Columbia Common Stock Fund
Columbia Large Cap Core Fund
Columbia Small Cap Core Fund | |
|
| Value Funds | | Columbia Disciplined Value Fund
Columbia Dividend Income Fund
Columbia Large Cap Value Fund
Columbia Mid Cap Value Fund
Columbia Small Cap Value Fund I
Columbia Small Cap Value Fund II
Columbia Strategic Investor Fund | |
|
| Asset Allocation/Hybrid Funds | | Columbia Asset Allocation Fund
Columbia Asset Allocation Fund II
Columbia Balanced Fund
Columbia Liberty Fund
Columbia LifeGoal(TM) Balanced Growth Portfolio
Columbia LifeGoal(TM) Growth Portfolio
Columbia LifeGoal(TM) Income Portfolio
Columbia LifeGoal(TM) Income and Growth Portfolio
Columbia Masters Global Equity Portfolio
Columbia Masters Heritage Portfolio
Columbia Masters International Equity Portfolio
Columbia Thermostat Fund | |
|
| Index Funds | | Columbia Large Cap Enhanced Core Fund
Columbia Large Cap Index Fund
Columbia Mid Cap Index Fund
Columbia Small Cap Index Fund | |
|
| Specialty Funds | | Columbia Convertible Securities Fund
Columbia Real Estate Equity Fund
Columbia Technology Fund | |
|
| Global/International Funds | | Columbia Acorn International
Columbia Acorn International Select
Columbia Global Value Fund
Columbia Greater China Fund
Columbia International Stock Fund
Columbia International Value Fund
Columbia Marsico International Opportunities Fund
Columbia Multi-Advisor International Equity Fund
Columbia World Equity Fund | |
|
87
Columbia Funds – Columbia Tax-Exempt Fund
| Taxable Bond Funds | | Columbia Conservative High Yield Fund
Columbia Core Bond Fund
Columbia Federal Securities Fund
Columbia High Income Fund
Columbia High Yield Opportunity Fund
Columbia Income Fund
Columbia Intermediate Bond Fund
Columbia Short Term Bond Fund
Columbia Strategic Income Fund
Columbia To tal Return Bond Fund
Columbia U.S. Treasury Index Fund | |
|
| Tax-Exempt Bond Funds | | Columbia California Tax-Exempt Fund
Columbia California Intermediate Municipal Bond Fund
Columbia Connecticut Tax-Exempt Fund
Columbia Connecticut Intermediate Municipal Bond Fund
Columbia Georgia Intermediate Municipal Bond Fund
Columbia High Yield Municipal Fund
Columbia Intermediate Municipal Bond Fund
Columbia Massachusetts Intermediate Municipal Bond Fund
Columbia Massachusetts Tax-Exempt Fund
Columbia Maryland Intermediate Municipal Bond Fund
Columbia North Carolina Intermediate Municipal Bond Fund
Columbia New York Tax-Exempt Fund
Columbia New Jersey Intermediate Municipal Bond Fund
Columbia New York Intermediate Municipal Bond Fund
Columbia Oregon Intermediate Municipal Bond Fund
Columbia Rhode Island Intermediate Municipal Bond Fund
Columbia South Carolina Inter mediate Municipal Bond Fund
Columbia Short Term Municipal Bond Fund
Columbia Tax-Exempt Fund
Columbia Virginia Intermediate Municipal Bond Fund | |
|
| Money Market Funds | | Columbia California Tax-Exempt Reserves
Columbia Cash Reserves
Columbia Connecticut Municipal Reserves
Columbia Government Plus Reserves
Columbia Government Reserves
Columbia Massachusetts Municipal Reserves
Columbia Money Market Reserves
Columbia Municipal Reserves
Columbia New York Tax-Exempt Reserves
Columbia Prime Reserves
Columbia Tax-Exempt Reserves
Columbia Treasury Reserves | |
|
For complete product information on any Columbia fund, visit our website at www.columbiafunds.com.
Columbia Management Group, LLC ("Columbia Management") is the investment management division of Bank of America Corporation. Columbia Management entities furnish investment management services and products for institutional and individual investors. Columbia Funds are distributed by Columbia Management Distributors, Inc., member of NASD, SIPC, part of Columbia Management and an affiliate of Bank of America Corporation.
88
Important Information About This Report – Columbia Tax-Exempt Fund
The fund mails one shareholder report to each shareholder address. If you would like more than one report, please call shareholder services at 800-345-6611 and additional reports will be sent to you.
This report has been prepared for shareholders of Columbia Tax-Exempt Fund. This report may also be used as sales literature when preceded or accompanied by the current prospectus which provides details of sales charges, investment objectives and operating policies of the fund and with the most recent copy of the Columbia Funds Performance Update.
A description of the policies and procedures that the fund uses to determine how to vote proxies relating to its portfolio securities and a copy of the fund's voting records are available (i) at www.columbiamanagement.com; (ii) on the Securities and Exchange Commission's website at www.sec.gov, and (iii) without charge, upon request, by calling 800-368-0346. Information regarding how the fund voted proxies relating to portfolio securities during the 12-month period ended June 30 is available from the SEC's website. Information regarding how the fund voted proxies relating to portfolio securities is also available from the fund's website.
The fund files a complete schedule of portfolio holdings with the SEC for the first and third quarters of each fiscal year on Form N-Q. The fund's Form N-Q is available on the SEC's website at www.sec.gov and may be reviewed and copied at the SEC's Public Reference Room in Washington, DC. Information on the operation of the Public Reference Room may be obtained by calling 1-800-SEC-0330.
| Transfer Agent | |
|
Columbia Management Services, Inc.
P.O. Box 8081
Boston, MA 02266-8081
800.345.6611 | |
|
| Distributor | |
|
Columbia Management
Distributors, Inc.
One Financial Center
Boston, MA 02111 | |
|
| Investment Advisor | |
|
Columbia Management Advisors, LLC
100 Federal Street
Boston, MA 02110 | |
|
Columbia Management Group, LLC ("Columbia Management") is the investment management division of Bank of America Corporation. Columbia Management entities furnish investment management services and products for institutional and individual investors. Columbia Funds are distributed by Columbia Management Distributors, Inc., member of NASD, SIPC, part of Columbia Management and an affiliate of Bank of America Corporation.
89
Columbia Tax-Exempt Fund
Annual Report – November 30, 2006
Columbia Management®
PRSRT STD
U.S. Postage
PAID
Holliston, MA
Permit NO. 20
©2006 Columbia Management Distributors, Inc.
One Financial Center, Boston, MA 02111-2621
800-345-6611 www.columbiafunds.com
SHC 42/115613-1106 (01/07) 07-33120
Item 2. Code of Ethics.
(a) The registrant has, as of the end of the period covered by this report, adopted a code of ethics that applies to the registrant’s principal executive officer, principal financial officer, principal accounting officer or controller, or persons performing similar functions, regardless of whether these individuals are employed by the registrant or a third party.
(b) The registrant’s Board adopted, effective January 3, 2006, a revised code of ethics described in 2(a) above. This revised code of ethics, which is attached as an exhibit hereto, does not differ materially from the code of ethics in effect for the year ended November 30, 2005.
(c) During the period covered by this report, there were no waivers, including any implicit waivers, from a provision of the code of ethics described in 2(a) above that relates to one or more of the items set forth in paragraph (b) of this item’s instructions.
Item 3. Audit Committee Financial Expert.
The registrant’s Board of Trustees has determined that Douglas A. Hacker, Thomas E. Stitzel and Anne-Lee Verville, each of whom are members of the registrant’s Board of Trustees and Audit Committee, each qualify as an audit committee financial expert. Mr. Hacker, Mr. Stitzel and Ms. Verville are each independent trustees, as defined in paragraph (a)(2) of this item’s instructions and collectively constitute the entire Audit Committee.
Item 4. Principal Accountant Fees and Services.
Fee information below is disclosed for the one series of the registrant whose report to stockholders is included in this annual filing. Fee information for fiscal year ended November 30, 2006 also includes fees for two series that were merged into the registrant during the period. Fee information for fiscal year ended November 30, 2005 also includes fees for one series that was merged into the registrant during the period.
(a) Audit Fees. Aggregate Audit Fees billed by the principal accountant for professional services rendered during the fiscal years ended November 30, 2006 and November 30, 2005 are approximately as follows:
2006 | | 2005 |
$ 50,100 | | $ 44,500 |
Audit Fees include amounts related to the audit of the registrant’s annual financial statements or services that are normally provided by the accountant in connection with statutory and regulatory filings or engagements for those fiscal years.
(b) Audit-Related Fees. Aggregate Audit-Related Fees billed to the registrant by the principal accountant for professional services rendered during the fiscal years ended November 30, 2006 and November 30, 2005 are approximately as follows:
2006 | | 2005 |
$ 15,700 | | $ 16,900 |
Audit-Related Fees include amounts for assurance and related services by the principal accountant that are reasonably related to the performance of the audit of the registrant’s financial statements and are not reported in Audit Fees above. In both fiscal years 2006 and 2005, Audit-Related Fees include agreed-upon procedures performed for semi-annual shareholder reports and fund mergers.
During the fiscal years ended November 30, 2006 and November 30, 2005, there were no Audit-Related Fees billed by the registrant’s principal accountant to the registrant’s investment adviser (not including any sub-adviser whose role is primarily portfolio management and is subcontracted with or overseen by another investment adviser) and any entity controlling, controlled by, or under common control with the adviser that provides ongoing services to the registrant for an engagement that related directly to the operations and financial reporting of the registrant.
(c) Tax Fees. Aggregate Tax Fees billed by the principal accountant to the registrant for professional services rendered during the fiscal years ended November 30, 2006 and November 30, 2005 are approximately as follows:
2006 | | 2005 |
$ 34,900 | | $ 18,300 |
Tax Fees consist primarily of the review of annual tax returns, the review of required shareholder distribution calculations and include amounts for professional services by the principal accountant for tax compliance, tax advice and tax planning. In both fiscal years 2006 and 2005, Tax Fees include agreed-upon procedures related to fund mergers and the review of final tax returns.
During the fiscal years ended November 30, 2006 and November 30, 2005, there were no Tax Fees billed by the registrant’s principal accountant to the registrant’s investment adviser (not including any sub-adviser whose role is primarily portfolio management and is subcontracted with or overseen by another investment adviser) and any entity
controlling, controlled by, or under common control with the adviser that provides ongoing services to the registrant for an engagement that related directly to the operations and financial reporting of the registrant.
(d) All Other Fees. Aggregate All Other Fees billed by the principal accountant to the registrant for professional services rendered during the fiscal years ended November 30, 2006 and November 30, 2005 are approximately as follows:
All Other Fees include amounts for products and services provided by the principal accountant, other than the services reported in paragraphs (a) through (c) above. In both fiscal years 2006 and 2005, all other fees include agreed-upon procedures related to the review of the registrant’s anti-money laundering program.
Aggregate All Other Fees billed by the registrant’s principal accountant to the registrant’s investment adviser (not including any sub-adviser whose role is primarily portfolio management and is subcontracted with or overseen by another investment adviser) and any entity controlling, controlled by, or under common control with the adviser that provides ongoing services to the registrant for an engagement that related directly to the operations and financial reporting of the registrant during the fiscal years ended November 30, 2006 and November 30, 2005 are approximately as follows:
2006 | | 2005 |
$ 609,700 | | $ 350,900 |
In both fiscal years 2006 and 2005, All Other Fees include internal control reviews of the registrant’s transfer agent and investment advisor.
(e)(1) Audit Committee Pre-Approval Policies and Procedures
The registrant’s Audit Committee is required to pre-approve the engagement of the registrant’s independent accountants to provide audit and non-audit services to the registrant and non-audit services to its investment adviser (not including any sub-adviser whose role is primarily portfolio management and is subcontracted with or overseen by another investment adviser) or any entity controlling, controlled by or under common control with such investment adviser that provides ongoing services to the registrant (“Adviser Affiliates”), if the engagement relates directly to the operations and financial reporting of the registrant.
The Audit Committee has adopted a Policy for Engagement of Independent Accountants for Audit and Non-Audit Services (“Policy”). The Po licy sets forth the understanding of the Audit Committee regarding the engagement of the registrant’s independent accountants to provide (i) audit and permissible audit-related, tax and other services to the registrant (collectively “Fund Services”); (ii) non-audit services to the
registrant’s investment adviser (not including any sub-adviser whose role is primarily portfolio management and is subcontracted with or overseen by another investment adviser) and Adviser Affiliates, if the engagement relates directly to the operations or financial reporting of a Fund (collectively “Fund-related Adviser Services”); and (iii) certain other audit and non-audit services to the registrant’s investment adviser (not including any sub-adviser whose role is primarily portfolio management and is subcontracted with or overseen by another investment adviser) and Adviser Affiliates. Unless a type of service receives general pre-approval under the Policy, it requires specific pre-approval by the Audit Committee if it is to be provided by the independent accountants. Pre-approval of non-audit services to the registrant, the registrant’s investment adviser (not including any sub - -adviser whose role is primarily portfolio management and is subcontracted with or overseen by another investment adviser) and Adviser Affiliates may be waived provided that the “de minimis” requirements set forth under paragraph (c)(7)(i)(C) of Rule 2-01 of Regulation S-X are met.
Under the Policy, the Audit Committee may delegate pre-approval authority to any pre-designated member or members who are Independent Trustees/Directors. The member(s) to whom such authority is delegated must report, for informational purposes only, any pre-approval decisions to the Audit Committee at its next regular meeting. The Audit Committee’s responsibilities with respect to the pre-approval of services performed by the independent accountants may not be delegated to management.
The Policy requires the Fund Treasurer and/or Director of Board Administration to submit to the Audit Committee, on an annual basis, a schedule of the types of services that are subject to general pre-approval. The schedule(s) provide a description of each type of service that is subject to general pre-approval and, where possible, will provide estimated fee caps for each instance of providing each service. The Audit Committees will review and approve the types of services and review the projected fees for the next fiscal year and may add to, or subtract from, the list of general pre-approved services from time to time based on subsequent determinations. That approval acknowledges that the Audit Committee is in agreement with the specific types of services that the independent accountants will be permitted to perform.
The Fund Treasurer and/or Director of Board Administration shall report to the Audit Committee at each of its regular meetings regarding all Fund Services or Fund-related Adviser Services initiated since the last such report was rendered, including a general description of the services, actual billed and projected fees, and the means by which such Fund Services or Fund-related Adviser Services were pre-approved by the Audit Committee.
*****
(e)(2) The percentage of services described in paragraphs (b) through (d) of this Item approved pursuant to the “de minimis” exception under paragraph (c)(7)(i)(C) of Rule 2-01
of Regulation S-X during both fiscal years ended November 30, 2006 and November 30, 2005 was zero.
(f) Not applicable.
(g) The aggregate non-audit fees billed by the registrant’s accountant for services rendered to the registrant, and rendered to the registrant’s investment adviser (not including any sub-adviser whose role is primarily portfolio management and is subcontracted with or overseen by another investment adviser), and any entity controlling, controlled by, or under common control with the adviser that provides ongoing services to the registrant for the fiscal years ended November 30, 2006 and November 30, 2005 are approximately as follows:
2006 | | 2005 |
$ 661,100 | | $ 388,000 |
(h) The registrant’s Audit Committee of the Board of Directors has considered whether the provision of non-audit services that were rendered to the registrant’s adviser (not including any sub-adviser whose role is primarily portfolio management and is subcontracted with or overseen by another investment adviser), and any entity controlling, controlled by, or under common control with the investment adviser that provides ongoing services to the registrant that were not pre-approved pursuant to paragraph (c)(7)(ii) of Rule 2-01 of Regulation S-X, is compatible with maintaining the principal accountant’s independence.
Item 5. Audit Committee of Listed Registrants.
Not applicable.
Item 6. Schedule of Investments
The registrant’s “Schedule I – Investments in securities of unaffiliated issuers” (as set forth in 17 CFR 210.12-12) is included in Item 1 of this Form N-CSR.
Item 7. Disclosure of Proxy Voting Policies and Procedures for Closed-End Management Investment Companies.
Not applicable.
Item 8. Portfolio Managers of Closed-End Management Investment Companies.
Not applicable.
Item 9. Purchases of Equity Securities by Closed-End Management Investment Company and Affiliated Purchasers.
Not applicable.
Item 10. Submission of Matters to a Vote of Security Holders.
There have not been any material changes to the procedures by which shareholders may recommend nominees to the registrant’s board of directors, since those procedures were last disclosed in response to requirements of Item 7(d)(2)(ii)(G) of Schedule 14A or this Item.
Item 11. Controls and Procedures.
(a) The registrant’s principal executive officer and principal financial officers, based on their evaluation of the registrant’s disclosure controls and procedures as of a date within 90 days of the filing of this report, have concluded that such controls and procedures are adequately designed to ensure that information required to be disclosed by the registrant in Form N-CSR is accumulated and communicated to the registrant’s management, including the principal executive officer and principal financial officer, or persons performing similar functions, as appropriate to allow timely decisions regarding required disclosure.
(b) There was no change in the registrant’s internal control over financial reporting that occurred during the registrant’s second fiscal quarter of the period covered by this report that has materially affected, or is reasonably likely to materially affect, the registrant’s internal control over financial reporting.
Item 12. Exhibits.
(a)(1) Code of ethics required to be disclosed under Item 2 of Form N-CSR attached hereto as Exhibit 99.CODE ETH.
(a)(2) Certifications pursuant to Rule 30a-2(a) under the Investment Company Act of 1940 (17 CFR 270.30a-2(a)) attached hereto as Exhibit 99.CERT.
(a)(3) Not applicable.
(b) Certification pursuant to Rule 30a-2(b) under the Investment Company Act of 1940 (17 CFR 270.30a-2(b)) attached hereto as Exhibit 99.906CERT.
SIGNATURES
Pursuant to the requirements of the Securities Exchange Act of 1934 and the Investment Company Act of 1940, the registrant has duly caused this report to be signed on its behalf by the undersigned, thereunto duly authorized.
(registrant) | | | Columbia Funds Series Trust I | |
| | |
| | |
By (Signature and Title) | | | /s/ Christopher L. Wilson | |
| | Christopher L. Wilson, President |
| | |
| | |
Date | | | January 25, 2007 | |
| | | | | | |
Pursuant to the requirements of the Securities Exchange Act of 1934 and the Investment Company Act of 1940, this report has been signed below by the following persons on behalf of the registrant and in the capacities and on the dates indicated.
By (Signature and Title) | | | /s/ Christopher L. Wilson | |
| | Christopher L. Wilson, President |
| | |
| | |
Date | | | January 25, 2007 | |
| | |
| | |
By (Signature and Title) | | | /s/ J. Kevin Connaughton | |
| | J. Kevin Connaughton, Treasurer |
| | |
| | |
Date | | | January 25, 2007 | |
| | | | | | | |