UNITED STATES
SECURITIES AND EXCHANGE COMMISSION
Washington, D.C. 20549
FORM N-CSR
CERTIFIED SHAREHOLDER REPORT OF REGISTERED
MANAGEMENT INVESTMENT COMPANIES
Investment Company Act file number | 811-4367 |
|
Columbia Funds Series Trust I |
(Exact name of registrant as specified in charter) |
|
One Financial Center, Boston, Massachusetts | | 02111 |
(Address of principal executive offices) | | (Zip code) |
|
James R. Bordewick, Jr., Esq. Columbia Management Advisors, LLC One Financial Center Boston, MA 02111 |
(Name and address of agent for service) |
|
Registrant’s telephone number, including area code: | 1-617-426-3750 | |
|
Date of fiscal year end: | April 30, 2007 | |
|
Date of reporting period: | April 30, 2007 | |
| | | | | | | | | |
Form N-CSR is to be used by management investment companies to file reports with the Commission not later than 10 days after the transmission to stockholders of any report that is required to be transmitted to stockholders under Rule 30e-1 under the Investment Company Act of 1940 (17 CFR 270.30e-1). The Commission may use the information provided on Form N-CSR in its regulatory, disclosure review, inspection, and policymaking roles.
A registrant is required to disclose the information specified by Form N-CSR, and the Commission will make this information public. A registrant is not required to respond to the collection of information contained in Form N-CSR unless the Form displays a currently valid Office of Management and Budget (“OMB”) control number. Please direct comments concerning the accuracy of the information collection burden estimate and any suggestions for reducing the burden to Secretary, Securities and Exchange Commission, 450 Fifth Street, NW, Washington, DC 20549-0609. The OMB has reviewed this collection of information under the clearance requirements of 44 U.S.C. § 3507.
Item 1. Reports to Stockholders.
Columbia Management®
Columbia Core Bond Fund
Annual Report – April 30, 2007
NOT FDIC INSURED
May Lose Value
No Bank Guarantee
Table of Contents
| Economic Update | | | 1 | | |
|
| Performance Information | | | 2 | | |
|
| Understanding Your Expenses | | | 3 | | |
|
| Portfolio Managers' Report | | | 4 | | |
|
| Fund Profile | | | 6 | | |
|
| Financial Statements | | | 7 | | |
|
| Investment Portfolio | | | 8 | | |
|
Statement of Assets and
Liabilities | | | 25 | | |
|
| Statement of Operations | | | 27 | | |
|
Statement of Changes in
Net Assets | | | 28 | | |
|
| Financial Highlights | | | 30 | | |
|
| Notes to Financial Statements | | | 36 | | |
|
Report of Independent Registered
Public Accounting Firm | | | 45 | | |
|
| Fund Governance | | | 46 | | |
|
| Columbia Funds | | | 51 | | |
|
Important Information About
This Report | | | 53 | | |
|
The views expressed in this report reflect the current views of the respective parties. These views are not guarantees of future performance and involve certain risks, uncertainties and assumptions that are difficult to predict so actual outcomes and results may differ significantly from the views expressed. These views are subject to change at any time based upon economic, market or other conditions and the respective parties disclaim any responsibility to update such views. These views may not be relied on as investment advice and, because investment decisions for a Columbia Fund are based on numerous factors, may not be relied on as an indication of trading intent on behalf of any particular Columbia Fund. References to specific securities should not be construed as a recommendation or investment advice.
President's Message

Dear Shareholder:
Investing is a long-term process and we are pleased that you have chosen to include the Columbia family of funds in your overall financial plan.
Your financial advisor can help you establish an appropriate investment portfolio and periodically review that portfolio. A well balanced portfolio is one of the keys to successful long-term investing. Your portfolio should be diversified across different asset classes and market segments and your chosen asset allocation should be appropriate for your investment goals, risk tolerance and time horizons.
However, creating an investment strategy is not a one-step process. From time to time, you'll need to re-evaluate your strategy to determine whether your investment needs have changed. Most experts recommend giving your portfolio a "check-up" every year.
As you begin your portfolio check-up, consider whether you have experienced any major life events since the last time you assessed your portfolio. You may need to tweak your strategy if you have:
• Gotten married or divorced
• Added a child to your family
• Made a significant change in employment
• Entered or moved significantly closer to retirement
• Experienced a serious illness or death in the family
• Taken on or paid off substantial debt
It's important to remember that over time, performance in different market segments will fluctuate. These shifts can cause your portfolio balance to drift away from your chosen asset allocation. A periodic portfolio check-up can help make sure your portfolio stays on track. Remember that asset allocation does not ensure a profit or guarantee against loss.
You'll also want to analyze the individual investments in your portfolio. Of course, performance should be a key factor in your analysis, but it's not the only factor to consider. Make sure the investments in your portfolio line up with your overall objectives and risk tolerance. Be aware of changes in portfolio management and pay special attention to any funds that have made significant shifts in their investment strategy.
We hope this information will help you, in working with your financial advisor, to stay on track to reach your investment goals. Thank you for your business and for your continued confidence in Columbia Funds.
Sincerely,

Christopher L. Wilson
President, Columbia Funds
Economic Update – Columbia Core Bond Fund
US economic growth advanced at a modest pace during the 12-month period that began May 1, 2006 and ended April 30, 2007. A weak housing market weighed on the economy throughout the period, with few signs that relief was imminent. Energy prices trended downward in the second half of 2006, but rose again in 2007, and core inflation moved slightly higher. Yet, many economic indicators remained positive. Job growth, for example, was relatively strong, as the labor markets added an average of 157,000 new jobs each month over the period and the unemployment rate declined to 4.4%. Personal income rose and consumer spending continued to expand. Against this backdrop, economic growth averaged around 2.1% for the 12-month period.
In May and June 2006, the Federal Reserve Board (the "Fed") raised a key short-term interest rate, the federal funds rate, twice—to 5.25%. But after its June meeting, the Fed turned cautious in the face of slower economic growth and held the federal funds rate steady for the first time in two years. Investors reacted favorably to the prospect of stable or lower interest rates and fueled a rally that moved stock prices higher and gave a boost to the bond market as well.
Bonds bounced back
Against a backdrop of generally favorable conditions, the US bond market delivered respectable returns, as prices rose and yields declined in reaction to the Fed's mid-year decision to put further short-term rate increases on hold. The yield on the 10-year US Treasury note1, a bellwether for the bond market, ended the 12-month period at 4.63%—somewhat lower than where it started. In this environment, the Lehman Brothers U.S. Aggregate Bond Index returned 7.36%. High-yield bonds led the US fixed-income markets, reflecting investor confidence about the overall resilience of the economy despite its slower pace of growth. The Merrill Lynch U.S. High Yield, Cash Pay Index returned 12.25%.
Despite volatility, stocks moved solidly higher
Stock prices rose at an above average pace during the 12-month period covered by this report. The S&P 500 Index, a broad measure of common stock performance, rose 15.24%. Large-cap stocks staged a comeback, beating out small- cap stocks and performing in line with mid-cap stocks, as measured by their respective Russell indices. Foreign stock markets were even stronger than the US market. The MSCI EAFE Index, which tracks stock market performance in industrialized countries outside the United States and Canada, returned 19.81%, despite a volatile stretch late in the period when the US and many foreign stock markets retreated in response to a sharp decline in the Chinese market and other market-specific factors.
110-year Treasury note used solely as a benchmark for long-term interest rates.
Past performance is no guarantee of future results.
Summary
For the 12-month period that ended April 30, 2007
g Investment-grade bonds rebounded as yields declined, lifting the Lehman Brothers U.S. Aggregate Bond Index to a respectable return. High-yield bonds, as measured by the Merrill Lynch U.S. High Yield, Cash Pay Index, led the US fixed-income markets.
Lehman
Index | | Merrill Lynch
Index | |
|
 | |  | |
|
g The broad US stock market, as measured by the S&P 500 Index, returned 15.24%. Stock markets outside the United States were even stronger, as measured by the MSCI EAFE Index.
| S&P Index | | MSCI EAFE Index | |
|
 | |  | |
|
The Lehman Brothers U.S. Aggregate Bond Index is a market value-weighted index that tracks the daily price, coupon, pay-downs, and total return performance of fixed-rate, publicly placed, dollar denominated, and non-convertible investment grade debt issues with at least $250 million par amount outstanding and with at least one year to final maturity.
The Merrill Lynch U.S. High Yield, Cash Pay Index tracks the performance of non-investment-grade corporate bonds.
The S&P 500 Index tracks the performance of 500 widely held, large-capitalization US stocks.
The Morgan Stanley Capital International (MSCI) Europe, Australasia, Far East (EAFE) Index is a free float-adjusted market capitalization index that is designed to measure developed market equity performance, excluding the US and Canada.
Indices are not investments, do not incur fees or expenses and are not professionally managed. It is not possible to invest directly in an index.
1
Performance Information – Columbia Core Bond Fund
Performance data quoted represents past performance and current performance may be lower or higher. Past performance is no guarantee of future results. The investment return and principal value will fluctuate so that shares, when redeemed, may be worth more or less than the original cost. Please visit www.columbiafunds.com for daily and most recent month-end performance updates.
Annual operating expense ratio (%)*
| Class A | | | 0.91 | | |
| Class B | | | 1.66 | | |
| Class C | | | 1.66 | | |
| Class G | | | 1.46 | | |
| Class T | | | 0.81 | | |
| Class Z | | | 0.66 | | |
*The annual operating expense ratio is as stated in the fund's prospectus that is current as of the date of this report. Differences in expense ratios disclosed elsewhere in this report may result from including fee waivers and reimbursements as well as different time periods used in calculating the ratios.
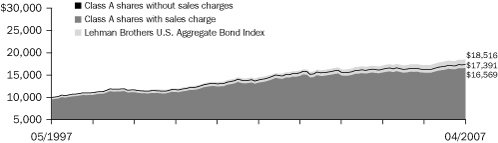
Growth of a $10,000 investment 05/01/97 – 04/30/07 ($)
The chart above shows the growth in value of a hypothetical $10,000 investment in Class A shares of Columbia Core Bond Fund during the stated time period, and does not reflect the deduction of taxes a shareholder may pay on fund distributions or the redemption of fund shares. The Lehman Brothers U.S. Aggregate Bond Index is a market value-weighted index that tracks the daily price, coupon, pay-downs, and total return performance of fixed-rate, publicly placed, dollar denominated, and non-convertible investment grade debt issues with at least $250 million par amount outstanding and with at least one year to final maturity. Indices are not investments, do not incur fees or expenses and are not professionally managed. It is not possible to invest directly in an index. Securities in the fund may not match those in an index.
Performance of a $10,000 investment 05/01/97 – 04/30/07 ($)
| Sales charge | | without | | with | |
| Class A | | | 17,391 | | | | 16,569 | | |
| Class B | | | 16,342 | | | | 16,342 | | |
| Class C | | | 16,449 | | | | 16,449 | | |
| Class G | | | 16,387 | | | | 16,387 | | |
| Class T | | | 17,465 | | | | 16,639 | | |
| Class Z | | | 17,776 | | | | n/a | | |
Average annual total return as of 04/30/07 (%)
| Share class | | A | | B | | C | | G | | T | | Z | |
| Inception | | 11/01/98 | | 11/01/98 | | 11/25/02 | | 03/04/96 | | 12/14/90 | | 12/14/90 | |
| Sales charge | | without | | with | | without | | with | | without | | with | | without | | with | | without | | with | | without | |
| 1-year | | | 6.81 | | | | 1.70 | | | | 6.01 | | | | 1.01 | | | | 6.17 | | | | 5.17 | | | | 6.22 | | | | 1.22 | | | | 6.91 | | | | 1.80 | | | | 7.07 | | |
| 5-year | | | 4.55 | | | | 3.54 | | | | 3.77 | | | | 3.43 | | | | 3.90 | | | | 3.90 | | | | 3.95 | | | | 3.44 | | | | 4.64 | | | | 3.62 | | | | 4.82 | | |
| 10-year | | | 5.69 | | | | 5.18 | | | | 5.03 | | | | 5.03 | | | | 5.10 | | | | 5.10 | | | | 5.06 | | | | 5.06 | | | | 5.73 | | | | 5.22 | | | | 5.92 | | |
Average annual total return as of 03/31/07 (%)
| Share class | | A | | B | | C | | G | | T | | Z | |
| Sales charge | | without | | with | | without | | with | | without | | with | | without | | with | | without | | with | | without | |
| 1-year | | | 5.97 | | | | 0.94 | | | | 5.19 | | | | 0.19 | | | | 5.34 | | | | 4.34 | | | | 5.39 | | | | 0.39 | | | | 6.08 | | | | 1.04 | | | | 6.24 | | |
| 5-year | | | 4.84 | | | | 3.82 | | | | 4.05 | | | | 3.71 | | | | 4.18 | | | | 4.18 | | | | 4.23 | | | | 3.72 | | | | 4.92 | | | | 3.91 | | | | 5.10 | | |
| 10-year | | | 5.79 | | | | 5.27 | | | | 5.14 | | | | 5.14 | | | | 5.20 | | | | 5.20 | | | | 5.16 | | | | 5.16 | | | | 5.83 | | | | 5.31 | | | | 6.02 | | |
The "with sales charge" returns include the maximum initial sales charge of 4.75% for Class A and Class T shares, the applicable contingent deferred sales charge of 5.00% in the first year, declining to 1.00% in the sixth year for Class B and the seventh year for Class G shares and eliminated thereafter and 1.00% for Class C shares for the first year only. The "without sales charge" returns do not include the effect of sales charges. If they had, returns would be lower.
All results shown assume reinvestment of distributions. Class Z shares are sold at net asset value with no Rule 12b-1 fees. Class Z shares have limited eligibility and the investment minimum requirements may vary. Please see the fund's prospectus for details. Performance for different share classes will vary based on differences in sales charges and fees associated with each class.
Performance results reflect any waivers or reimbursements of fund expenses by the investment advisor and/or any of its affiliates. Absent these waivers or reimbursement arrangements, performance results would have been lower.
The tables do not reflect the deduction of taxes that a shareholder may pay on fund distributions or the redemption of fund shares.
The returns for Class A and Class B shares include the returns of Prime A shares (for Class A shares) and Prime B shares (for Class B shares) of the former Galaxy Quality Plus Bond Fund (the "Galaxy Fund") for periods prior to November 25, 2002, the date on which Class A and Class B shares were initially offered by the fund. The returns shown for Class A and Class B shares also include the returns of Retail A shares of the Galaxy Fund (adjusted, as necessary, to reflect the sales charges applicable to Cla ss A and Class B shares, respectively) for periods prior to the inception of Prime A and Prime B shares (November 1, 1998). Class A and Class B shares generally would have had substantially similar returns to Retail A shares because they would have been invested in the same portfolio of securities, although returns would be lower to the extent that expenses for Class A and Class B shares exceed expenses paid by Retail A shares. The returns shown for Class C shares include the returns of Prime B shares of the Galaxy Fund (adjusted to reflect the sales charge applicable to Class C share s) for periods prior to November 25, 2002, the date on which Class C shares were initially offered by the fund. The returns shown for Class C shares also include the returns of Retail A shares of the Galaxy Fund (adjusted to reflect the sales charges applicable to Class C shares) for periods prior to the date of inception of Prime B shares (November 1, 1998). Class C shares generally would have had substantially similar returns to Prime B shares and Retail A shares because they would have been invested in the same portfolio of securities, although the returns would have been lower to the extent that expenses for Class C shares exceed expenses paid by Retail A shares or Prime B shares. The returns for Class G and Class T shares include the returns of Retail A shares (for Class T shares) and Retail B shares (for Class G shares) of the Galaxy Fund for periods prior to November 25, 2002, the date on which Class T and Class G shares were initially offered by the fund. The returns shown for Class G shares also include the returns of Retail A shares of the Galaxy Fund (adjusted to reflect the sales charges applicable to Class G shares) for periods prior to the inception of Retail B shares of the Galaxy Fund (March 4, 1996). Retail A shares of the Galaxy Fund were initially offered on December 14, 1990. Class G shares generally would have had substantially similar returns to Retail A shares and Retail B shares because they would have been invested in the same portfolio of securities, although the returns would be lower to the extent that expenses for Class G shares exceed expenses paid by Retail A shares or Retail B shares. Class T shares generally would have had substantially similar returns to Retail A shares because they would have been invested in the same portfolio of securities, although the returns would be lower to the extent that expenses for Class T shares exceed expe nses paid by Retail A shares. The returns for Class Z shares include returns of Trust shares of the Galaxy Fund for periods prior to November 25, 2002, the date on which Class Z shares were initially offered by the fund. Trust shares of the Galaxy Fund were initially offered on December 14, 1990.
2
Understanding Your Expenses – Columbia Core Bond Fund
As a fund shareholder, you incur two types of costs. There are transaction costs, which generally include sales charges on purchases and may include redemption or exchange fees. There are also ongoing costs, which generally include investment advisory fees, Rule 12b-1 fees and other fund expenses. The information on this page is intended to help you understand the ongoing costs of investing in the fund and to compare these costs with the ongoing costs of investing in other mutual funds.
Analyzing your fund's expenses by share class
To illustrate these ongoing costs, we have provided an example and calculated the expenses paid by investors in each share class during the period. The information in the following table is based on an initial investment of $1,000, which is invested at the beginning of the reporting period and held for the entire period. Expense information is calculated two ways and each method provides you with different information. The amount listed in the "actual" column is calculated using the fund's actual operating expenses and total return for the period. The amount listed in the "hypothetical" column for each share class assumes that the return each year is 5% before expenses and is calculated based on the fund's actual operating expenses. You should not use the hypothetical account values and expenses to estimate either your actual account balance at the end of the period or the expenses you paid during this reporting period.
Compare with other funds
Since all mutual funds are required to include the same hypothetical calculations about expenses in shareholder reports, you can use this information to compare the ongoing cost of investing in the fund with other funds. To do so, compare the 5% hypothetical example with the 5% hypothetical examples that appear in the shareholder reports of other funds. As you compare hypothetical examples of other funds, it is important to note that hypothetical examples are meant to highlight the ongoing costs of investing in a fund and do not reflect any transaction costs, such as sales charges, redemption fees or exchange fees.
Estimating your actual expenses
To estimate the expenses that you paid over the period, first you will need your account balance at the end of the period:
g For shareholders who receive their account statements from Columbia Management Services, Inc., your account balance is available online at www.columbiafunds.com or by calling Shareholder Services at 800.345.6611.
g For shareholders who receive their account statements from their brokerage firm, contact your brokerage firm to obtain your account balance.
1. Divide your ending account balance by $1,000. For example, if an account balance was $8,600 at the end of the period, the result would be 8.6.
2. In the section of the table below titled "Expenses paid during the period," locate the amount for your share class. You will find this number in the column labeled "actual." Multiply this number by the result from step 1. Your answer is an estimate of the expenses you paid on your account during the period.
11/01/06 – 04/30/07
| | | Account value at the
beginning of the period ($) | | Account value at the
end of the period ($) | | Expenses paid
during the period ($) | | Fund's annualized
expense ratio (%) | |
| | | Actual | | Hypothetical | | Actual | | Hypothetical | | Actual | | Hypothetical | | Actual | |
| Class A | | | 1,000.00 | | | | 1,000.00 | | | | 1,024.40 | | | | 1,020.23 | | | | 4.62 | | | | 4.61 | | | | 0.92 | | |
| Class B | | | 1,000.00 | | | | 1,000.00 | | | | 1,020.58 | | | | 1,016.51 | | | | 8.37 | | | | 8.35 | | | | 1.67 | | |
| Class C | | | 1,000.00 | | | | 1,000.00 | | | | 1,021.32 | | | | 1,017.26 | | | | 7.62 | | | | 7.60 | | | | 1.52 | | |
| Class G | | | 1,000.00 | | | | 1,000.00 | | | | 1,021.62 | | | | 1,017.50 | | | | 7.37 | | | | 7.35 | | | | 1.47 | | |
| Class T | | | 1,000.00 | | | | 1,000.00 | | | | 1,024.89 | | | | 1,020.73 | | | | 4.12 | | | | 4.11 | | | | 0.82 | | |
| Class Z | | | 1,000.00 | | | | 1,000.00 | | | | 1,025.59 | | | | 1,021.47 | | | | 3.36 | | | | 3.36 | | | | 0.67 | | |
Expenses paid during the period are equal to the annualized expense ratio for the share class, multiplied by the average account value over the period, then multiplied by the number of days in the fund's most recent fiscal half-year and divided by 365.
Had the investment advisor and/or any of its affiliates not waived or reimbursed a portion of expenses for Class C shares, account value at the end of the period would have been reduced.
It is important to note that the expense amounts shown in the table are meant to highlight only ongoing costs of investing in the fund and do not reflect any transaction costs, such as sales charges, redemption fees or exchange fees. Therefore, the hypothetical examples provided may not help you determine the relative total costs of owning shares of different funds. If these transaction costs were included, your costs would have been higher.
3
Portfolio Managers' Report – Columbia Core Bond Fund
Performance data quoted represents past performance and current performance may be lower or higher. Past performance is no guarantee of future results. The investment return and principal value will fluctuate so that shares, when redeemed, may be worth more or less than the original cost. Please visit www.columbiafunds.com for daily and most recent month-end performance updates.
Net asset value per share
as of 04/30/07 ($)
| Class A | | | 10.57 | | |
| Class B | | | 10.57 | | |
| Class C | | | 10.57 | | |
| Class G | | | 10.57 | | |
| Class T | | | 10.57 | | |
| Class Z | | | 10.57 | | |
Distributions declared per share
05/01/06 – 04/30/07 ($)
| Class A | | | 0.48 | | |
| Class B | | | 0.40 | | |
| Class C | | | 0.42 | | |
| Class G | | | 0.42 | | |
| Class T | | | 0.49 | | |
| Class Z | | | 0.51 | | |
SEC yields
as of 04/30/07 (%)
| Class A | | | 4.42 | | |
| Class B | | | 3.89 | | |
| Class C | | | 4.05 | | |
| Class G | | | 4.09 | | |
| Class T | | | 4.52 | | |
| Class Z | | | 4.90 | | |
The 30-day SEC yields reflect the portfolio's earning power, net of expenses, expressed as an annualized percentage of the public offering price at the end of the period.
For the 12-month period that ended April 30, 2007, the fund's Class A shares returned 6.81% without sales charge. The fund's Class Z shares returned 7.07%. By comparison, the Lehman Brothers U.S. Aggregate Bond Index the fund's benchmark, returned 7.36%.1 The average return of the fund's peer group, the Lipper Corporate Debt Funds A Rated Classification, was 6.96%.2 The fund generally performed in line with its peer group primarily despite its avoidance of high-yield or non-US dollar based market sectors, which fall outside its investment universe. Funds with exposure to these market segments generally did better for the period.
Favorable environment rewarded risk-taking
During the 12-month period covered by this report, Federal Reserve Board (the "Fed") policy and a relatively favorable environment provided support to the fixed income markets. As the Fed moved to the sidelines with its monetary policy, yields on securities with maturities of two years and longer drifted lower than yields on securities with maturities of two years or less. After two years and seventeen quarter-point rate increases, the Fed made no further changes to the bellwether federal funds rate after its June 2006 meeting. Overall, the two-year Treasury yield declined by 0.27 percentage points for the year, while the 30-year Treasury yield declined by 0.35 percentage points.
A vibrant national economy, booming corporate earnings, and a strong stock market encouraged fixed-income investors to take on risk—and rewarded them with higher performance. The fund took advantage of this environment by establishing above-index positions in investment grade corporate bonds and mortgage-backed securities, which proceeded to outperform comparable Treasury securities by 0.81% and 0.65%, respectively. The fund also benefited from its positions in commercial mortgage-backed securities (CMBS), a growing segment of the market. However, well-publicized difficulties among subprime lenders led to overall weakness in the mortgage market in the last three months of the period, the point at which the fund had its highest weight in the mortgage sector, which reduced the earlier advantage the fund had enjoyed from its positioning.
The fund was also held back by its investment-grade orientation: It had no exposure to high-yield bonds or non-US, non-dollar denominated bonds, which were strong performers for the period.
1The Lehman Brothers U.S. Aggregate Bond Index is a market value-weighted index that tracks the daily price, coupon, pay-downs, and total return performance of fixed-rate, publicly placed, dollar denominated, and non-convertible investment grade debt issues with at least $250 million par amount outstanding and with at least one year to final maturity. Indices are not investments, do not incur fees or expenses and are not professionally managed. It is not possible to invest directly in an index.
2Lipper Inc., a widely respected data provider in the industry, calculates an average total return (assuming reinvestment of distributions) for mutual funds with investment objectives similar to those of the fund. Lipper makes no adjustment for the effect of sales loads.
4
Portfolio Managers' Report (continued) – Columbia Core Bond Fund
Looking ahead
We believe interest rates may remain within a manageable trading range until the Fed is motivated to make its next move. So with the Fed on hold, at least for now, we plan to maintain the fund's emphasis on investment-grade corporate bonds, mortgage-backed securities and AAA-rated CMBS, and to make appropriate tactical adjustments to the fund's maturity structure as opportunities present themselves.
Portfolio structure
as of 04/30/07 (%)
| Mortgage-Backed Securities | | | 30.7 | | |
| Corporate Fixed-Income | |
| Bonds & Notes | | | 21.0 | | |
| Asset-Backed Securities | | | 10.8 | | |
| Government & Agency | |
| Obligations | | | 8.7 | | |
| Commercial Mortgage-Backed | |
| Securities | | | 6.4 | | |
| Collateralized Mortgage | |
| Obligations | | | 5.2 | | |
| Other | | | 17.2 | | |
Quality breakdown
as of 04/30/07 (%)
| AAA | | | 69.6 | | |
| AA | | | 11.1 | | |
| A | | | 6.3 | | |
| BBB | | | 12.5 | | |
| BB | | | 0.5 | | |
Maturity breakdown
as of 04/30/07 (%)
| 0-1 year | | | 0.1 | | |
| 1-3 years | | | 17.3 | | |
| 3-5 years | | | 23.1 | | |
| 5-7 years | | | 21.3 | | |
| 7-10 years | | | 23.9 | | |
| 10-15 years | | | 2.0 | | |
| 15-20 years | | | 3.8 | | |
| 20-25 years | | | 2.8 | | |
| 25+ years | | | 5.7 | | |
Your fund is actively managed and the composition of its portfolio will change over time. Portfolio structure, quality and maturity breakdowns are calculated as a percentage of total investments. Ratings shown in the quality breakdown represent the rating assigned to a particular bond by one of the following nationally-recognized rating agencies: Standard & Poor's, a division of The McGraw-Hill Companies, Inc., Moody's Investors Service, Inc. or Fitch Ratings Ltd. Ratings are relative and subjective and are not absolute standards of quality. The fund's credit quality does not remove market risk.
5
Fund Profile – Columbia Core Bond Fund
Performance data quoted represents past performance and current performance may be lower or higher. Past performance is no guarantee of future results. The investment return and principal value will fluctuate so that shares, when redeemed, may be worth more or less than the original cost. Please visit www.columbiafunds.com for daily and most recent month-end performance updates.
Summary
1 Year return as of 04/30/07
| | | +6.81% | |
|
 | | Class A shares
(without sales charge) | |
|
| | | +7.36% | |
|
 | | Lehman Brothers
U.S. Aggregate Bond Index | |
|
Management Style
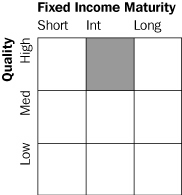
Management style is determined by Columbia Management and is based on the investment strategy and process as outlined in the fund's prospectus.
Summary
g For the 12-month period that ended April 30, 2007, the fund's Class A shares returned 6.81% without sales charge. The fund's Class Z shares returned 7.07%. The fund's returns were in line with its peer group and slightly below its benchmark.
g While the fund was constrained by its high-quality orientation at a time when lesser-quality credits outperformed the market, enough value-adding opportunities were found to make overall performance competitive for the period.
g With the Federal Reserve Board on hold regarding short-term interest rates, the fund has aligned its maturity structure with the Lehman Brothers U.S. Aggregate Bond Index.
Portfolio Management
Leonard A. Aplet has co-managed the fund since November 2006. Mr. Aplet is associated with Columbia Management Advisors, LLC, investment advisor to the fund.
Brian Drainville has co-managed the fund since November 2006. Mr. Drainville is associated with Columbia Management Advisors, LLC.
Driscoll M. DoCanto has co-managed the fund since November 2006. Mr. DoCanto is associated with Columbia Management Advisors, LLC.
The outlook for the fund may differ from that presented for other Columbia Funds.
Investing in fixed-income securities may involve certain risks, including the credit quality of individual issuers, possible prepayments, market or economic developments and yield and share price fluctuations due to changes in interest rates. Investing in foreign fixed-income markets carries additional risks associated with foreign political and economic developments and changes in currency exchange rates. When interest rates go up, bond prices typically drop, and vice versa.
6
Financial Statements – Columbia Core Bond Fund, April 30, 2007
A guide to understanding your fund's financial statements
| Investment Portfolio | | The investment portfolio details all of the fund's holdings and their values as of the last day of the reporting period. Portfolio holdings are organized by type of asset, industry, country or geographic region (if applicable) to demonstrate areas of concentration and diversification. | |
|
| Statement of Assets and Liabilities | | This statement details the fund's assets, liabilities, net assets and share price for each share class as of the last day of the reporting period. Net assets are calculated by subtracting all the fund's liabilities (including any unpaid expenses) from the total of the fund's investment and non-investment assets. The share price for each class is calculated by dividing net assets for that class by the number of shares outstanding in that class as of the last day of the reporting period. | |
|
| Statement of Operations | | This statement details income earned by the fund and the expenses accrued by the fund during the reporting period. This statement also shows any net gain or loss the fund realized on the sales of its holdings during the period, as well as any unrealized gains or losses recognized over the period. The total of these results represents the fund's net increase or decrease in net assets from operations. | |
|
| Statement of Changes in Net Assets | | This statement demonstrates how the fund's net assets were affected by its operating results, distributions to shareholders and shareholder transactions (e.g., subscriptions, redemptions and dividend reinvestments) during the reporting period. This statement also details changes in the number of shares outstanding. | |
|
| Financial Highlights | | The financial highlights demonstrate how the fund's net asset value per share was affected by the fund's operating results. The financial highlights table also discloses performance for each class of shares and certain key ratios (e.g., class expenses and net investment income as a percentage of average net assets). | |
|
| Notes to Financial Statements | | These notes disclose the organizational background of the fund, its significant accounting policies (including those surrounding security valuation, income recognition and distributions to shareholders), federal tax information, fees and compensation paid to affiliates and significant risks and contingencies. | |
|
7
Investment Portfolio – Columbia Core Bond Fund
April 30, 2007
Mortgage-Backed Securities – 38.3%
| | | | | Par ($) | | Value ($) | |
| Federal Home Loan Mortgage Corp. | | 4.500% 08/01/20 | | | 3,807,689 | | | | 3,688,344 | | |
| | | 4.500% 09/01/20 | | | 5,291,046 | | | | 5,125,207 | | |
| | | 4.500% 01/01/21 | | | 29,005,377 | | | | 28,096,254 | | |
| | | 4.500% 06/01/21 | | | 6,061,500 | | | | 5,871,513 | | |
| | | 5.000% 12/01/13 | | | 1,250,930 | | | | 1,238,741 | | |
| | | 5.000% 01/01/19 | | | 371,007 | | | | 366,685 | | |
| | | 5.000% 05/01/21 | | | 31,963,315 | | | | 31,527,811 | | |
| | | 5.000% 02/01/22 | | | 24,832,799 | | | | 24,480,976 | | |
| | | 5.500% 02/01/18 | | | 1,170,250 | | | | 1,174,307 | | |
| | | 5.500% 03/01/18 | | | 319,477 | | | | 320,585 | | |
| | | 5.500% 04/01/21 | | | 9,719,405 | | | | 9,732,900 | | |
| | | 5.500% 10/01/21 | | | 7,277,657 | | | | 7,287,762 | | |
| | | 5.500% 03/01/33 | | | 81,210 | | | | 80,519 | | |
| | | 6.000% 11/01/28 | | | 229,757 | | | | 233,480 | | |
| | | 6.500% 04/01/32 | | | 397,484 | | | | 409,735 | | |
| | | 7.000% 12/01/10 | | | 47,789 | | | | 48,779 | | |
| | | 7.000% 12/01/14 | | | 76,546 | | | | 79,042 | | |
| | | 7.000% 11/01/25 | | | 4,446 | | | | 4,631 | | |
| | | 7.000% 03/01/27 | | | 4,753 | | | | 4,952 | | |
| | | 7.000% 10/01/31 | | | 53,554 | | | | 55,726 | | |
| | | 7.500% 09/01/25 | | | 2,634 | | | | 2,766 | | |
| | | 7.500% 10/01/29 | | | 127,051 | | | | 133,316 | | |
| | | 8.000% 06/01/07 | | | 41 | | | | 41 | | |
| | | 8.000% 06/01/26 | | | 2,922 | | | | 3,087 | | |
| | | 8.750% 09/01/09 | | | 2,809 | | | | 2,859 | | |
| | | 8.750% 07/01/15 | | | 461 | | | | 465 | | |
| | | 9.000% 10/01/15 | | | 257 | | | | 258 | | |
| | | 9.000% 04/01/17 | | | 4,043 | | | | 4,131 | | |
| | | 9.000% 10/01/19 | | | 795 | | | | 798 | | |
| | | 9.250% 05/01/09 | | | 33,818 | | | | 34,943 | | |
| | | 9.250% 08/01/15 | | | 3,771 | | | | 3,850 | | |
| | | 9.500% 09/01/10 | | | 3,118 | | | | 3,229 | | |
| | | 9.500% 03/01/11 | | | 240 | | | | 254 | | |
| | | 9.500% 04/01/11 | | | 2,167 | | | | 2,288 | | |
| | | 9.500% 09/01/16 | | | 1,353 | | | | 1,464 | | |
| | | 9.500% 11/01/16 | | | 853 | | | | 922 | | |
| | | 10.000% 02/01/09 | | | 1,145 | | | | 1,193 | | |
| | | 10.000% 05/01/11 | | | 4,595 | | | | 4,632 | | |
| | | 10.000% 12/01/13 | | | 1,043 | | | | 1,069 | | |
| | | TBA:
5.000% 05/14/37(a) | | | 37,270,000 | | | | 36,012,137 | | |
| Federal National Mortgage Association | | 5.240% 09/01/12 | | | 2,427,076 | | | | 2,436,355 | | |
| | | 5.500% 10/01/21 | | | 4,751,351 | | | | 4,758,023 | | |
| | | 6.000% 05/01/13 | | | 89,814 | | | | 91,372 | | |
| | | 6.000% 04/01/21 | | | 701,792 | | | | 713,273 | | |
| | | 6.000% 05/01/21 | | | 207,630 | | | | 211,027 | | |
| | | 6.000% 07/01/21 | | | 320,009 | | | | 325,244 | | |
| | | 6.000% 12/01/31 | | | 905,769 | | | | 926,680 | | |
See Accompanying Notes to Financial Statements.
8
Columbia Core Bond Fund
April 30, 2007
Mortgage-Backed Securities – (continued)
| | | | | Par ($) | | Value ($) | |
| Federal National Mortgage Association (continued) | | 6.000% 03/01/36 | | | 16,525,480 | | | | 16,654,166 | | |
| | | 6.000% 10/01/36 | | | 44,711,864 | | | | 45,060,040 | | |
| | | 6.000% 01/01/37 | | | 70,032,179 | | | | 70,577,528 | | |
| | | 6.120% 10/01/08 | | | 1,331,274 | | | | 1,343,267 | | |
| | | 6.500% 05/01/11 | | | 228,044 | | | | 233,196 | | |
| | | 6.500% 06/01/13 | | | 78,315 | | | | 80,254 | | |
| | | 6.500% 06/01/28 | | | 135,811 | | | | 140,210 | | |
| | | 6.500% 06/01/31 | | | 177,586 | | | | 183,116 | | |
| | | 6.500% 08/01/31 | | | 680,752 | | | | 701,953 | | |
| | | 6.500% 09/01/31 | | | 284,192 | | | | 293,043 | | |
| | | 6.500% 11/01/36 | | | 48,129,144 | | | | 49,144,166 | | |
| | | 6.565% 12/01/07 | | | 1,564,743 | | | | 1,562,184 | | |
| | | 6.600% 11/01/07 | | | 1,419,620 | | | | 1,416,057 | | |
| | | 7.000% 06/01/32 | | | 103,842 | | | | 108,534 | | |
| | | 7.199% 08/01/36(b) | | | 167,231 | | | | 167,622 | | |
| | | 7.500% 10/01/15 | | | 41,101 | | | | 42,441 | | |
| | | 7.500% 01/01/30 | | | 12,610 | | | | 13,222 | | |
| | | 7.500% 03/01/30 | | | 19,756 | | | | 20,683 | | |
| | | 7.785% 02/01/19 | | | 1,956,581 | | | | 2,074,468 | | |
| | | 8.000% 07/01/07 | | | 435 | | | | 437 | | |
| | | 8.000% 12/01/09 | | | 20 | | | | 20 | | |
| | | 8.000% 12/01/29 | | | 317,779 | | | | 337,649 | | |
| | | 8.000% 02/01/30 | | | 39,832 | | | | 42,252 | | |
| | | 8.000% 03/01/30 | | | 61,847 | | | | 65,422 | | |
| | | 8.000% 04/01/30 | | | 116,554 | | | | 123,292 | | |
| | | 8.000% 05/01/30 | | | 12,979 | | | | 13,730 | | |
| | | 8.500% 08/01/17 | | | 1,790 | | | | 1,883 | | |
| | | 10.000% 10/01/20 | | | 150,941 | | | | 168,406 | | |
| | | 10.000% 12/01/20 | | | 224,343 | | | | 251,042 | | |
| | | TBA:
5.000% 05/14/37(a) | | | 101,575,000 | | | | 98,115,152 | | |
| | | 5.500% 05/14/37(a) | | | 196,559,000 | | | | 194,347,711 | | |
| Government National Mortgage Association | | 5.375% 04/20/22(b) | | | 326,276 | | | | 329,614 | | |
| | | 5.500% 12/15/13 | | | 6,703 | | | | 6,741 | | |
| | | 5.500% 01/15/14 | | | 48,381 | | | | 48,650 | | |
| | | 5.500% 02/15/14 | | | 96,379 | | | | 96,914 | | |
| | | 5.500% 03/15/14 | | | 208,164 | | | | 209,320 | | |
| | | 5.500% 04/15/14 | | | 172,139 | | | | 173,094 | | |
| | | 5.500% 05/15/14 | | | 149,698 | | | | 150,529 | | |
| | | 5.500% 06/15/14 | | | 173,039 | | | | 174,000 | | |
| | | 5.750% 07/20/21(b) | | | 66,432 | | | | 67,194 | | |
| | | 5.750% 07/20/22(b) | | | 78,260 | | | | 79,086 | | |
| | | 6.500% 06/15/11 | | | 27,577 | | | | 28,218 | | |
| | | 6.500% 08/15/12 | | | 12,582 | | | | 12,898 | | |
| | | 6.500% 03/15/13 | | | 24,199 | | | | 24,802 | | |
| | | 6.500% 04/15/13 | | | 37,548 | | | | 38,483 | | |
| | | 6.500% 05/15/13 | | | 41,635 | | | | 42,672 | | |
| | | 6.500% 06/15/13 | | | 877 | | | | 899 | | |
See Accompanying Notes to Financial Statements.
9
Columbia Core Bond Fund
April 30, 2007
Mortgage-Backed Securities – (continued)
| | | | | Par ($) | | Value ($) | |
| Government National Mortgage Association (continued) | | 6.500% 07/15/13 | | | 22,886 | | | | 23,456 | | |
| | | 6.500% 09/15/13 | | | 109,483 | | | | 112,209 | | |
| | | 6.500% 10/15/13 | | | 408,119 | | | | 418,285 | | |
| | | 6.500% 11/15/13 | | | 149,785 | | | | 153,515 | | |
| | | 6.500% 07/15/14 | | | 15,260 | | | | 15,643 | | |
| | | 6.500% 08/15/14 | | | 86,479 | | | | 88,651 | | |
| | | 6.500% 06/15/28 | | | 102,135 | | | | 105,510 | | |
| | | 6.500% 01/15/29 | | | 52,900 | | | | 54,645 | | |
| | | 6.500% 03/15/29 | | | 1,966 | | | | 2,031 | | |
| | | 6.500% 09/15/32 | | | 44,420 | | | | 45,847 | | |
| | | 7.000% 05/15/12 | | | 55,048 | | | | 56,891 | | |
| | | 7.000% 09/15/13 | | | 46,569 | | | | 48,127 | | |
| | | 7.000% 11/15/22 | | | 94,108 | | | | 98,547 | | |
| | | 7.000% 10/15/23 | | | 71,661 | | | | 75,135 | | |
| | | 7.000% 06/15/26 | | | 250,728 | | | | 263,198 | | |
| | | 7.000% 10/15/27 | | | 28,585 | | | | 30,010 | | |
| | | 7.000% 05/15/28 | | | 95,522 | | | | 100,244 | | |
| | | 7.000% 06/15/28 | | | 11,623 | | | | 12,198 | | |
| | | 7.000% 12/15/28 | | | 252,334 | | | | 264,809 | | |
| | | 7.000% 08/15/29 | | | 26,797 | | | | 28,125 | | |
| | | 7.000% 02/15/30 | | | 12,569 | | | | 13,192 | | |
| | | 7.000% 05/15/32 | | | 192,508 | | | | 202,021 | | |
| | | 7.500% 04/15/26 | | | 142,891 | | | | 149,835 | | |
| | | 7.500% 02/15/27 | | | 16,237 | | | | 17,027 | | |
| | | 7.500% 09/15/29 | | | 516,022 | | | | 540,869 | | |
| | | 7.500% 03/15/30 | | | 86,931 | | | | 91,093 | | |
| | | 8.000% 06/15/25 | | | 5,054 | | | | 5,383 | | |
| | | 8.000% 10/15/25 | | | 18,517 | | | | 19,720 | | |
| | | 8.000% 01/15/26 | | | 12,356 | | | | 13,167 | | |
| | | 8.000% 02/15/26 | | | 3,068 | | | | 3,269 | | |
| | | 8.000% 05/15/26 | | | 2,249 | | | | 2,396 | | |
| | | 8.000% 06/15/26 | | | 12,368 | | | | 13,179 | | |
| | | 8.000% 03/15/27 | | | 21,316 | | | | 22,715 | | |
| | | 9.000% 03/15/08 | | | 2,728 | | | | 2,778 | | |
| | | 9.000% 11/15/08 | | | 1,600 | | | | 1,629 | | |
| | | 9.000% 11/15/17 | | | 65,255 | | | | 69,836 | | |
| | | 9.500% 09/15/16 | | | 8,482 | | | | 9,182 | | |
| | | 9.500% 08/15/20 | | | 1,999 | | | | 2,186 | | |
| | | 9.500% 12/15/20 | | | 2,669 | | | | 2,920 | | |
| | | 10.000% 05/15/16 | | | 3,411 | | | | 3,780 | | |
| | | 10.000% 07/15/17 | | | 16,705 | | | | 18,567 | | |
| | | 10.000% 08/15/17 | | | 4,413 | | | | 4,905 | | |
| | | 10.000% 08/15/18 | | | 505 | | | | 561 | | |
| | | 11.500% 06/15/13 | | | 26,489 | | | | 29,405 | | |
| | | Total Mortgage-Backed Securities (cost of $651,666,986) | | | | | | | 653,506,576 | | |
See Accompanying Notes to Financial Statements.
10
Columbia Core Bond Fund
April 30, 2007
Corporate Fixed-Income Bonds & Notes – 26.2%
| | | | | Par ($) | | Value ($) | |
| Basic Materials – 0.6% | |
| Chemicals – 0.0% | |
| Dow Chemical Co. | | 6.000% 10/01/12 | | | 765,000 | | | | 788,414 | | |
| | | Chemicals Total | | | | | | | 788,414 | | |
| Forest Products & Paper – 0.3% | |
| Weyerhaeuser Co. | | 7.375% 03/15/32 | | | 4,590,000 | | | | 4,853,292 | | |
| | | Forest Products & Paper Total | | | | | | | 4,853,292 | | |
| Metals & Mining – 0.3% | |
| Vale Overseas Ltd. | | 6.250% 01/23/17 | | | 4,675,000 | | | | 4,794,231 | | |
| | | Metals & Mining Total | | | | | | | 4,794,231 | | |
| Basic Materials Total | | | | | | | | | 10,435,937 | | |
| Communications – 2.6% | |
| Media – 1.4% | |
| Comcast Corp. | | 5.900% 03/15/16 | | | 3,295,000 | | | | 3,360,778 | | |
| Time Warner Cable, Inc. | | 5.850% 05/01/17(c) | | | 1,650,000 | | | | 1,659,913 | | |
| Time Warner Entertainment Co. LP | | 7.250% 09/01/08 | | | 1,785,000 | | | | 1,828,438 | | |
| Time Warner, Inc. | | 5.875% 11/15/16 | | | 3,085,000 | | | | 3,106,172 | | |
| | | 6.500% 11/15/36 | | | 4,890,000 | | | | 4,893,672 | | |
| | | 9.125% 01/15/13 | | | 927,000 | | | | 1,087,907 | | |
| Viacom, Inc. | | 5.750% 04/30/11 | | | 2,920,000 | | | | 2,959,794 | | |
| | | 6.875% 04/30/36 | | | 4,545,000 | | | | 4,602,899 | | |
| | | Media Total | | | | | | | 23,499,573 | | |
| Telecommunication Services – 1.2% | |
| Nextel Communications, Inc. | | 6.875% 10/31/13 | | | 1,090,000 | | | | 1,120,170 | | |
| Sprint Capital Corp. | | 8.750% 03/15/32 | | | 2,000,000 | | | | 2,360,292 | | |
| Telecom Italia Capital SA | | 5.250% 11/15/13 | | | 1,255,000 | | | | 1,229,201 | | |
| Telefonica Emisiones SAU | | 7.045% 06/20/36 | | | 2,500,000 | | | | 2,682,320 | | |
| TELUS Corp. | | 7.500% 06/01/07 | | | 3,625,000 | | | | 3,630,702 | | |
| Verizon Communications, Inc. | | 6.250% 04/01/37(d) | | | 4,025,000 | | | | 4,033,404 | | |
| Vodafone Group PLC | | 5.750% 03/15/16(d) | | | 6,140,000 | | | | 6,207,479 | | |
| | | Telecommunication Services Total | | | | | | | 21,263,568 | | |
| Communications Total | | | | | | | | | 44,763,141 | | |
See Accompanying Notes to Financial Statements.
11
Columbia Core Bond Fund
April 30, 2007
Corporate Fixed-Income Bonds & Notes – (continued)
| | | | | Par ($) | | Value ($) | |
| Consumer Cyclical – 2.1% | |
| Airlines – 0.1% | |
| Continental Airlines, Inc. | | 7.461% 04/01/15 | | | 751,465 | | | | 784,342 | | |
| | | Airlines Total | | | | | | | 784,342 | | |
| Auto Manufacturers – 0.4% | |
| DaimlerChrysler NA Holding Corp. | | 5.820% 09/10/07(b) | | | 5,180,000 | | | | 5,186,656 | | |
| | | 8.500% 01/18/31(d) | | | 1,635,000 | | | | 2,060,190 | | |
| | | Auto Manufacturers Total | | | | | | | 7,246,846 | | |
| Home Builders – 0.3% | |
| D.R. Horton, Inc. | | 5.625% 09/15/14 | | | 1,855,000 | | | | 1,765,930 | | |
| | | 5.625% 01/15/16(d) | | | 310,000 | | | | 287,683 | | |
| | | 6.500% 04/15/16 | | | 3,885,000 | | | | 3,807,622 | | |
| | | Home Builders Total | | | | | | | 5,861,235 | | |
| Lodging – 0.2% | |
| Harrah's Operating Co., Inc. | | 5.625% 06/01/15 | | | 4,005,000 | | | | 3,444,300 | | |
| | | Lodging Total | | | | | | | 3,444,300 | | |
| Retail – 1.1% | |
| CVS/Caremark Corp. | | 5.298% 01/11/27(c) | | | 879,049 | | | | 839,949 | | |
| | | 6.036% 12/10/28(c) | | | 3,346,743 | | | | 3,356,683 | | |
| Federated Department Stores, Inc. | | 6.900% 04/01/29 | | | 2,590,000 | | | | 2,633,900 | | |
| Federated Retail Holdings, Inc. | | 5.350% 03/15/12 | | | 455,000 | | | | 454,772 | | |
| | | 5.900% 12/01/16 | | | 2,095,000 | | | | 2,105,527 | | |
| JC Penney Corp., Inc. | | 7.400% 04/01/37(d) | | | 2,040,000 | | | | 2,263,152 | | |
| Limited Brands, Inc. | | 6.950% 03/01/33(d) | | | 2,320,000 | | | | 2,314,165 | | |
| Wal-Mart Stores, Inc. | | 4.125% 02/15/11 | | | 4,350,000 | | | | 4,225,586 | | |
| | | 5.250% 09/01/35 | | | 1,405,000 | | | | 1,285,300 | | |
| | | Retail Total | | | | | | | 19,479,034 | | |
| Consumer Cyclical Total | | | | | | | | | 36,815,757 | | |
| Consumer Non-Cyclical – 1.4% | |
| Beverages – 0.2% | |
| SABMiller PLC | | 6.200% 07/01/11(c) | | | 2,755,000 | | | | 2,845,229 | | |
| | | Beverages Total | | | | | | | 2,845,229 | | |
| Food – 0.4% | |
| ConAgra Foods, Inc. | | 7.000% 10/01/28(d) | | | 940,000 | | | | 1,013,219 | | |
| Fred Meyer, Inc. | | 7.450% 03/01/08 | | | 2,444,000 | | | | 2,484,575 | | |
| Kroger Co. | | 7.500% 04/01/31(d) | | | 510,000 | | | | 551,843 | | |
| | | 8.000% 09/15/29(d) | | | 2,930,000 | | | | 3,265,482 | | |
| | | Food Total | | | | | | | 7,315,119 | | |
See Accompanying Notes to Financial Statements.
12
Columbia Core Bond Fund
April 30, 2007
Corporate Fixed-Income Bonds & Notes – (continued)
| | | | | Par ($) | | Value ($) | |
| Consumer Non-Cyclical (continued) | |
| Household Products/Wares – 0.4% | |
| Fortune Brands, Inc. | | 5.125% 01/15/11 | | | 3,815,000 | | | | 3,779,577 | | |
| | | 5.375% 01/15/16 | | | 2,250,000 | | | | 2,136,544 | | |
| | | Household Products/Wares Total | | | | | | | 5,916,121 | | |
| Pharmaceuticals – 0.4% | |
| Merck & Co., Inc. | | 5.750% 11/15/36 | | | 1,555,000 | | | | 1,532,011 | | |
| Wyeth | | 5.500% 02/15/16 | | | 5,680,000 | | | | 5,726,707 | | |
| | | Pharmaceuticals Total | | | | | | | 7,258,718 | | |
| Consumer Non-Cyclical Total | | | | | | | | | 23,335,187 | | |
| Diversified – 0.2% | |
| Holding Companies-Diversified – 0.2% | |
| Hutchison Whampoa International Ltd. | | 6.250% 01/24/14(c) | | | 3,000,000 | | | | 3,135,030 | | |
| | | Holding Companies-Diversified Total | | | | | | | 3,135,030 | | |
| Diversified Total | | | | | | | | | 3,135,030 | | |
| Energy – 2.5% | |
| Oil & Gas – 1.7% | |
| Anadarko Petroleum Corp. | | 5.950% 09/15/16 | | | 2,975,000 | | | | 2,998,107 | | |
| | | 6.450% 09/15/36 | | | 3,030,000 | | | | 3,037,654 | | |
| Canadian Natural Resources Ltd. | | 6.250% 03/15/38 | | | 2,970,000 | | | | 2,948,025 | | |
| Gazprom International SA | | 7.201% 02/01/20 | | | 224,132 | | | | 235,619 | | |
| Hess Corp. | | 7.300% 08/15/31(d) | | | 2,085,000 | | | | 2,331,065 | | |
| Marathon Oil Corp. | | 6.000% 07/01/12 | | | 3,065,000 | | | | 3,171,692 | | |
| Nexen, Inc. | | 5.875% 03/10/35 | | | 3,495,000 | | | | 3,307,794 | | |
| Petrobras International Finance Co. | | 8.375% 12/10/18(d) | | | 435,000 | | | | 524,175 | | |
| Qatar Petroleum | | 5.579% 05/30/11(c) | | | 2,795,000 | | | | 2,810,057 | | |
Ras Laffan Liquified Natural
Gas Co., Ltd. III | | 5.832% 09/30/16(c) | | | 2,130,000 | | | | 2,151,790 | | |
| Valero Energy Corp. | | 6.875% 04/15/12 | | | 5,302,000 | | | | 5,656,105 | | |
| | | Oil & Gas Total | | | | | | | 29,172,083 | | |
| Pipelines – 0.8% | |
| Duke Capital LLC | | 4.370% 03/01/09 | | | 1,415,000 | | | | 1,393,161 | | |
| Energy Transfer Partners LP | | 6.125% 02/15/17 | | | 3,205,000 | | | | 3,284,000 | | |
| Plains All American Pipeline LP | | 6.650% 01/15/37(c) | | | 3,410,000 | | | | 3,526,305 | | |
See Accompanying Notes to Financial Statements.
13
Columbia Core Bond Fund
April 30, 2007
Corporate Fixed-Income Bonds & Notes – (continued)
| | | | | Par ($) | | Value ($) | |
| Energy (continued) | |
| Pipelines (continued) | |
| TEPPCO Partners LP | | 7.625% 02/15/12 | | | 1,311,000 | | | | 1,419,753 | | |
| Transcanada Pipelines Ltd. | | 6.350% 05/15/67(b) | | | 3,785,000 | | | | 3,782,206 | | |
| | | Pipelines Total | | | | | | | 13,405,425 | | |
| Energy Total | | | | | | | | | 42,577,508 | | |
| Financials – 13.4% | |
| Banks – 4.7% | |
| Bank One Corp. | | 7.875% 08/01/10 | | | 1,835,000 | | | | 1,989,298 | | |
| HSBC Bank USA | | 3.875% 09/15/09 | | | 9,145,000 | | | | 8,900,353 | | |
| Lloyds TSB Group PLC | | 6.408% 12/31/49(b)(c) | | | 3,125,000 | | | | 3,108,697 | | |
| M&I Marshall & Ilsley Bank | | 5.300% 09/08/11 | | | 5,130,000 | | | | 5,166,341 | | |
| PNC Funding Corp. | | 5.125% 12/14/10 | | | 3,105,000 | | | | 3,112,688 | | |
| | | 5.625% 02/01/17 | | | 1,745,000 | | | | 1,760,148 | | |
| Scotland International Finance | | 4.250% 05/23/13(c) | | | 1,700,000 | | | | 1,614,429 | | |
| Union Planters Corp. | | 4.375% 12/01/10 | | | 4,155,000 | | | | 4,072,681 | | |
| USB Capital IX | | 6.189% 04/15/42(b) | | | 6,260,000 | | | | 6,427,737 | | |
| Wachovia Capital Trust III | | 5.800% 03/15/42(b) | | | 3,590,000 | | | | 3,643,491 | | |
| Wachovia Corp. | | 4.375% 06/01/10 | | | 2,000,000 | | | | 1,963,396 | | |
| | | 5.300% 10/15/11 | | | 10,015,000 | | | | 10,091,725 | | |
| | | 5.625% 12/15/08 | | | 2,790,000 | | | | 2,813,799 | | |
| Wells Fargo & Co. | | 4.875% 01/12/11 | | | 5,560,000 | | | | 5,534,251 | | |
| | | 5.300% 08/26/11(d) | | | 6,520,000 | | | | 6,581,053 | | |
| | | 5.455% 09/15/09(b) | | | 13,065,000 | | | | 13,087,302 | | |
| | | Banks Total | | | | | | | 79,867,389 | | |
| Commercial Banks – 0.1% | |
| Regions Financing Trust II | | 6.625% 05/15/47(b) | | | 1,075,000 | | | | 1,073,941 | | |
| | | Commercial Banks Total | | | | | | | 1,073,941 | | |
| Diversified Financial Services – 5.6% | |
| American Express Co. | | 6.800% 09/01/66(b) | | | 2,495,000 | | | | 2,665,124 | | |
| Ameriprise Financial, Inc. | | 7.518% 06/01/66(b) | | | 1,735,000 | | | | 1,883,032 | | |
| Capital One Capital IV | | 6.745% 02/17/37 | | | 5,355,000 | | | | 5,224,151 | | |
| CIT Group, Inc. | | 5.850% 09/15/16 | | | 3,885,000 | | | | 3,876,437 | | |
| | | 6.100% 03/15/67(b)(d) | | | 980,000 | | | | 944,097 | | |
See Accompanying Notes to Financial Statements.
14
Columbia Core Bond Fund
April 30, 2007
Corporate Fixed-Income Bonds & Notes – (continued)
| | | | | Par ($) | | Value ($) | |
| Financials (continued) | |
| Diversified Financial Services (continued) | |
| Citigroup, Inc. | | 5.100% 09/29/11 | | | 7,355,000 | | | | 7,360,421 | | |
| Ford Motor Credit Co. | | 7.375% 10/28/09 | | | 5,915,000 | | | | 5,919,578 | | |
| | | 7.375% 02/01/11 | | | 1,630,000 | | | | 1,612,174 | | |
| General Electric Capital Corp. | | 5.475% 12/15/09(b)(d)(e) | | | 10,775,000 | | | | 10,795,882 | | |
| | | 6.750% 03/15/32(d) | | | 4,400,000 | | | | 5,009,761 | | |
| Goldman Sachs Group, Inc. | | 5.300% 02/14/12 | | | 9,590,000 | | | | 9,619,039 | | |
| HSBC Finance Corp. | | 5.640% 11/16/09(b) | | | 7,540,000 | | | | 7,578,288 | | |
| International Lease Finance Corp. | | 4.875% 09/01/10 | | | 3,200,000 | | | | 3,179,309 | | |
| JPMorgan Chase Capital XVIII | | 6.950% 08/17/36 | | | 2,075,000 | | | | 2,220,835 | | |
| Lehman Brothers Holdings, Inc. | | 5.500% 04/04/16(d) | | | 985,000 | | | | 986,256 | | |
| Morgan Stanley | | 5.750% 10/18/16 | | | 9,630,000 | | | | 9,761,257 | | |
| Prudential Funding LLC | | 6.600% 05/15/08(c) | | | 2,860,000 | | | | 2,883,309 | | |
| Residential Capital Corp. | | 6.375% 06/30/10 | | | 3,000,000 | | | | 3,008,022 | | |
| | | 6.500% 04/17/13 | | | 3,810,000 | | | | 3,807,984 | | |
| SLM Corp. | | 5.000% 10/01/13 | | | 150,000 | | | | 135,735 | | |
| | | 5.375% 05/15/14 | | | 2,590,000 | | | | 2,363,517 | | |
| | | 5.565% 07/25/08(b) | | | 4,345,000 | | | | 4,322,445 | | |
| | | Diversified Financial Services Total | | | | | | | 95,156,653 | | |
| Insurance – 1.1% | |
| Hartford Life Global Funding Trusts | | 5.525% 09/15/09(b) | | | 3,530,000 | | | | 3,541,857 | | |
| ING Groep NV | | 5.775% 12/29/49(b)(d) | | | 3,300,000 | | | | 3,287,655 | | |
| Liberty Mutual Group, Inc. | | 7.500% 08/15/36(c)(d) | | | 4,615,000 | | | | 5,003,657 | | |
| Metlife, Inc. | | 6.400% 12/15/36 | | | 3,830,000 | | | | 3,822,581 | | |
| Prudential Financial, Inc. | | 4.750% 04/01/14(d) | | | 2,900,000 | | | | 2,798,634 | | |
| | | Insurance Total | | | | | | | 18,454,384 | | |
| Real Estate Investment Trusts (REITs) – 1.8% | |
| Archstone-Smith Trust | | 5.750% 03/15/16 | | | 7,060,000 | | | | 7,173,864 | | |
| Camden Property Trust | | 5.375% 12/15/13 | | | 1,744,000 | | | | 1,739,903 | | |
| Health Care Property Investors, Inc. | | 6.300% 09/15/16 | | | 3,450,000 | | | | 3,544,123 | | |
| | | 7.072% 06/08/15 | | | 2,380,000 | | | | 2,530,278 | | |
| Highwoods Properties, Inc. | | 5.850% 03/15/17(c) | | | 995,000 | | | | 989,516 | | |
See Accompanying Notes to Financial Statements.
15
Columbia Core Bond Fund
April 30, 2007
Corporate Fixed-Income Bonds & Notes – (continued)
| | | | | Par ($) | | Value ($) | |
| Financials (continued) | |
| Real Estate Investment Trusts (REITs) (continued) | |
| Hospitality Properties Trust | | 5.625% 03/15/17(c) | | | 2,140,000 | | | | 2,105,469 | | |
| iStar Financial, Inc. | | 5.800% 03/15/11 | | | 3,000,000 | | | | 3,027,627 | | |
| Liberty Property LP | | 5.500% 12/15/16 | | | 2,975,000 | | | | 2,959,955 | | |
| Simon Property Group LP | | 5.450% 03/15/13(d) | | | 3,555,000 | | | | 3,579,562 | | |
| | | 5.875% 03/01/17 | | | 4,250,000 | | | | 4,366,131 | | |
| | | Real Estate Investment Trusts (REITs) Total | | | | | | | 32,016,428 | | |
| Savings & Loans – 0.1% | |
Washington Mutual Preferred
Funding Delaware | | 6.534% 03/29/49(b)(c) | | | 2,500,000 | | | | 2,468,300 | | |
| | | Savings & Loans Total | | | | | | | 2,468,300 | | |
| Financials Total | | | | | | | | | 229,037,095 | | |
| Industrials – 0.9% | |
| Aerospace & Defense – 0.2% | |
| Raytheon Co. | | 7.200% 08/15/27 | | | 2,595,000 | | | | 3,014,791 | | |
| | | Aerospace & Defense Total | | | | | | | 3,014,791 | | |
| Machinery-Construction & Mining – 0.1% | |
| Caterpillar, Inc. | | 6.050% 08/15/36 | | | 1,730,000 | | | | 1,778,030 | | |
| | | Machinery-Construction & Mining Total | | | | | | | 1,778,030 | | |
| Transportation – 0.6% | |
| BNSF Funding Trust I | | 6.613% 12/15/55(b) | | | 1,190,000 | | | | 1,137,005 | | |
| Burlington Northern Santa Fe Corp. | | 6.200% 08/15/36 | | | 1,550,000 | | | | 1,551,905 | | |
| | | 7.950% 08/15/30 | | | 1,260,000 | | | | 1,518,988 | | |
| Union Pacific Corp. | | 6.650% 01/15/11 | | | 5,550,000 | | | | 5,804,956 | | |
| | | Transportation Total | | | | | | | 10,012,854 | | |
| Industrials Total | | | | | | | | | 14,805,675 | | |
| Utilities – 2.5% | |
| Electric – 2.1% | |
| American Electric Power Co., Inc. | | 5.250% 06/01/15 | | | 1,465,000 | | | | 1,449,757 | | |
| Carolina Power & Light Co. | | 5.125% 09/15/13 | | | 2,545,000 | | | | 2,522,385 | | |
| Commonwealth Edison Co. | | 4.700% 04/15/15(d) | | | 1,250,000 | | | | 1,157,355 | | |
| | | 5.900% 03/15/36(d) | | | 790,000 | | | | 752,771 | | |
| | | 5.950% 08/15/16 | | | 2,020,000 | | | | 2,012,671 | | |
| | | 6.950% 07/15/18 | | | 1,575,000 | | | | 1,583,291 | | |
See Accompanying Notes to Financial Statements.
16
Columbia Core Bond Fund
April 30, 2007
Corporate Fixed-Income Bonds & Notes – (continued)
| | | | | Par ($) | | Value ($) | |
| Utilities (continued) | |
| Electric (continued) | |
| Dominion Resources, Inc. | | 5.650% 09/28/07(b) | | | 5,965,000 | | | | 5,966,897 | | |
| Duke Energy Corp. | | 5.300% 10/01/15(d) | | | 2,400,000 | | | | 2,398,267 | | |
| FPL Energy National Wind LLC | | 5.608% 03/10/24(c) | | | 894,090 | | | | 888,278 | | |
| Hydro Quebec | | 8.500% 12/01/29 | | | 2,240,000 | | | | 3,115,939 | | |
| MidAmerican Energy Holdings Co. | | 5.875% 10/01/12 | | | 2,855,000 | | | | 2,947,987 | | |
| Pacific Gas & Electric Co. | | 6.050% 03/01/34 | | | 2,230,000 | | | | 2,279,417 | | |
| Progress Energy, Inc. | | 7.750% 03/01/31 | | | 3,755,000 | | | | 4,547,042 | | |
| Southern California Edison Co. | | 5.000% 01/15/16(d) | | | 2,500,000 | | | | 2,441,263 | | |
| Southern Power Co. | | 6.375% 11/15/36 | | | 850,000 | | | | 848,962 | | |
| | | Electric Total | | | | | | | 34,912,282 | | |
| Gas – 0.4% | |
| Atmos Energy Corp. | | 4.950% 10/15/14 | | | 3,475,000 | | | | 3,312,387 | | |
| Nakilat, Inc. | | 6.067% 12/31/33(c) | | | 1,895,000 | | | | 1,856,153 | | |
| Southern California Gas Co. | | 5.530% 12/01/09(b) | | | 2,080,000 | | | | 2,085,057 | | |
| | | Gas Total | | | | | | | 7,253,597 | | |
| Utilities Total | | | | | | | | | 42,165,879 | | |
| | | Total Corporate Fixed-Income Bonds & Notes
(cost of $445,883,744) | | | | | | | 447,071,209 | | |
| Asset-Backed Securities – 13.5% | |
| ACE Securities Corp. | | 5.450% 05/25/36(b) | | | 3,050,000 | | | | 3,049,229 | | |
AmeriCredit Automobile
Receivables Trust | | 3.930% 10/06/11 | | | 3,500,000 | | | | 3,458,985 | | |
| | | 4.730% 07/06/10 | | | 2,500,000 | | | | 2,484,924 | | |
| Bay View Auto Trust | | 5.310% 06/25/14 | | | 2,550,000 | | | | 2,542,665 | | |
Bombardier Capital Mortgage
Securitization Corp. | | 6.230% 04/15/28 | | | 3,539 | | | | 3,549 | | |
| Capital Auto Receivables Asset Trust | | 5.500% 04/20/10(c) | | | 1,850,000 | | | | 1,857,833 | | |
| Carmax Auto Owner Trust | | 5.370% 06/15/12 | | | 2,125,000 | | | | 2,146,162 | | |
| Centex Home Equity | | 5.590% 10/25/35(b) | | | 3,258,271 | | | | 3,258,256 | | |
| Chase Manhattan Auto Owner Trust | | 2.830% 09/15/10 | | | 1,342,065 | | | | 1,323,131 | | |
See Accompanying Notes to Financial Statements.
17
Columbia Core Bond Fund
April 30, 2007
Asset-Backed Securities – (continued)
| | | | | Par ($) | | Value ($) | |
| Citibank Credit Card Master Trust I | | 5.875% 03/10/11 | | | 4,000,000 | | | | 4,060,144 | | |
| CitiFinancial Mortgage Securities, Inc. | | 2.645% 04/25/34 | | | 1,525,094 | | | | 1,477,618 | | |
| Citigroup Mortgage Loan Trust, Inc. | | 5.517% 08/25/35 | | | 2,800,000 | | | | 2,777,088 | | |
| | | 5.598% 03/25/36 | | | 1,900,000 | | | | 1,891,677 | | |
| | | 5.666% 08/25/35 | | | 1,885,000 | | | | 1,855,332 | | |
| Countrywide Asset-Backed Certificates | | 5.430% 06/25/21(b) | | | 7,299,030 | | | | 7,296,767 | | |
| | | 5.440% 01/25/37(b) | | | 5,520,090 | | | | 5,520,352 | | |
| Countrywide Home Equity Loan Trust | | 5.540% 01/15/34(b) | | | 1,391,277 | | | | 1,391,957 | | |
Credit-Based Asset Servicing
and Securitization | | 5.545% 11/25/35 | | | 2,950,000 | | | | 2,866,633 | | |
| Equity One ABS, Inc. | | 5.660% 07/25/34(b) | | | 418,837 | | | | 420,035 | | |
| First Plus Home Loan Trust | | 7.720% 05/10/24 | | | 27,220 | | | | 27,618 | | |
| Ford Credit Auto Owner Trust | | 4.080% 06/15/10 | | | 3,500,000 | | | | 3,453,287 | | |
| | | 5.680% 06/15/12 | | | 2,300,000 | | | | 2,325,348 | | |
| Fremont Home Loan Trust | | 5.420% 05/25/36(b) | | | 4,000,000 | | | | 3,998,855 | | |
| | | 5.430% 02/25/36(b) | | | 6,925,000 | | | | 6,919,542 | | |
| GE Equipment Small Ticket LLC | | 4.620% 12/22/14(c) | | | 1,210,732 | | | | 1,200,114 | | |
| | | 5.120% 06/22/15(c) | | | 3,982,762 | | | | 3,995,619 | | |
| Green Tree Financial Corp. | | 8.250% 07/15/27 | | | 647,705 | | | | 684,546 | | |
| GS Auto Loan Trust | | 4.980% 11/15/13 | | | 2,169,978 | | | | 2,161,125 | | |
| GSAA Trust | | 4.316% 11/25/34(b) | | | 2,000,000 | | | | 1,960,630 | | |
| HSI Asset Loan Obligation | | 5.380% 12/25/36(b) | | | 8,492,891 | | | | 8,492,861 | | |
| Hyundai Auto Receivables Trust | | 4.200% 02/15/12 | | | 2,650,000 | | | | 2,614,576 | | |
| JPMorgan Mortgage Acquisition Corp. | | 5.440% 04/25/36(b) | | | 5,500,000 | | | | 5,500,354 | | |
| | | 5.627% 10/25/35 | | | 3,651,000 | | | | 3,647,107 | | |
| Long Beach Auto Receivables Trust | | 4.522% 06/15/12 | | | 3,000,000 | | | | 2,967,809 | | |
| Long Beach Mortgage Loan Trust | | 5.420% 05/25/36(b) | | | 3,425,000 | | | | 3,423,744 | | |
Memory Lane Advance Receivables
Backed Notes | | 5.027% 10/24/14(c) | | | 5,000,000 | | | | 4,970,600 | | |
| Merrill Lynch Mortgage Investors, Inc. | | 5.470% 05/25/37(b) | | | 5,332,213 | | | | 5,329,849 | | |
| Morgan Stanley Mortgage Loan Trust | | 5.450% 08/25/36(b) | | | 6,370,985 | | | | 6,369,803 | | |
See Accompanying Notes to Financial Statements.
18
Columbia Core Bond Fund
April 30, 2007
Asset-Backed Securities – (continued)
| | | | | Par ($) | | Value ($) | |
| Nomura Home Equity Loan, Inc. | | 5.440% 03/25/36(b) | | | 2,000,000 | | | | 1,997,759 | | |
| Oakwood Mortgage Investors, Inc. | | 7.100% 08/15/27 | | | 618,041 | | | | 620,992 | | |
| Onyx Acceptance Grantor Trust | | 3.890% 02/15/11 | | | 1,650,250 | | | | 1,634,560 | | |
| Origen Manufactured Housing | | 4.490% 05/15/18 | | | 1,100,000 | | | | 1,088,455 | | |
| Renaissance Home Equity Loan Trust | | 5.565% 02/25/36 | | | 11,275,000 | | | | 11,240,588 | | |
Residential Asset Mortgage
Products, Inc. | | 3.981% 04/25/29 | | | 742,981 | | | | 739,113 | | |
| | | 4.480% 09/25/29(b) | | | 1,312,833 | | | | 1,305,407 | | |
| | | 5.390% 05/25/36(b) | | | 5,177,018 | | | | 5,177,294 | | |
| | | 5.670% 10/25/34 | | | 2,250,000 | | | | 2,137,642 | | |
| Residential Asset Securities Corp. | | 5.430% 06/25/36(b) | | | 3,000,000 | | | | 2,999,340 | | |
Residential Funding Mortgage
Securities II, Inc. | | 4.700% 08/25/34 | | | 1,715,000 | | | | 1,697,659 | | |
| | | 5.110% 09/25/35 | | | 2,500,000 | | | | 2,377,802 | | |
| Small Business Administration | | 4.340% 03/01/24 | | | 10,822,527 | | | | 10,316,285 | | |
| | | 4.500% 03/01/23 | | | 5,245,480 | | | | 5,088,436 | | |
| | | 4.890% 09/01/22 | | | 4,424,036 | | | | 4,395,217 | | |
| | | 5.110% 04/01/25 | | | 3,458,424 | | | | 3,463,665 | | |
| | | 5.180% 05/01/24 | | | 7,392,007 | | | | 7,426,106 | | |
| | | 5.240% 08/01/23 | | | 5,180,303 | | | | 5,215,433 | | |
| | | 5.310% 08/01/22 | | | 6,043,433 | | | | 6,097,878 | | |
| | | 5.520% 06/01/24 | | | 3,350,292 | | | | 3,405,550 | | |
| | | 5.570% 03/01/26 | | | 2,608,858 | | | | 2,658,827 | | |
| | | 5.660% 07/01/22 | | | 2,944,885 | | | | 3,001,119 | | |
| | | 6.000% 09/01/18 | | | 2,124,662 | | | | 2,170,842 | | |
| Soundview Home Equity Loan Trust | | 5.410% 07/25/36(b) | | | 8,500,000 | | | | 8,499,240 | | |
| Wells Fargo Financial Auto Owner Trust | | 2.670% 08/16/10 | | | 4,776,037 | | | | 4,722,676 | | |
| WFS Financial Owner Trust | | 2.410% 12/20/10 | | | 1,888,561 | | | | 1,885,636 | | |
| | | 2.810% 08/22/11 | | | 5,021,531 | | | | 4,960,673 | | |
| | | 4.620% 11/19/12 | | | 3,500,000 | | | | 3,473,423 | | |
| | | Total Asset-Backed Securities
(cost of $230,716,415) | | | | | | | 229,523,341 | | |
| Government & Agency Obligations – 10.9% | |
| Foreign Government Obligations – 2.1% | |
| Export Development of Canada | | 4.000% 08/01/07 | | | 2,325,000 | | | | 2,318,283 | | |
| Inter-American Development Bank | | 5.125% 09/13/16 | | | 1,830,000 | | | | 1,853,838 | | |
See Accompanying Notes to Financial Statements.
19
Columbia Core Bond Fund
April 30, 2007
Government & Agency Obligations – (continued)
| | | | | Par ($) | | Value ($) | |
| Foreign Government Obligations (continued) | |
| Province of Manitoba | | 5.000% 02/15/12 | | | 5,500,000 | | | | 5,535,376 | | |
| Province of New Brunswick | | 5.200% 02/21/17 | | | 5,500,000 | | | | 5,558,492 | | |
| Province of Nova Scotia | | 5.125% 01/26/17 | | | 1,055,000 | | | | 1,060,135 | | |
| Province of Ontario | | 5.000% 10/18/11 | | | 1,500,000 | | | | 1,509,129 | | |
| Province of Quebec | | 5.000% 03/01/16(d) | | | 8,545,000 | | | | 8,478,272 | | |
| | | 6.125% 01/22/11(d) | | | 2,000,000 | | | | 2,081,102 | | |
| Republic of South Africa | | 6.500% 06/02/14 | | | 2,134,000 | | | | 2,272,710 | | |
| Swedish Export Credit | | 5.125% 03/01/17 | | | 4,400,000 | | | | 4,418,234 | | |
| Foreign Government Obligations Total | | | | | | | | | 35,085,571 | | |
| U.S. Government Agency Obligations – 5.0% | |
| Federal Home Loan Bank System | | 5.300% 01/16/09 | | | 8,000,000 | | | | 8,000,800 | | |
| | | 5.550% 03/19/09 | | | 10,000,000 | | | | 10,001,980 | | |
| Federal Home Loan Mortgage Corp. | | 5.000% 12/14/18 | | | 8,065,000 | | | | 7,903,668 | | |
| | | 5.200% 03/05/19 | | | 5,000,000 | | | | 4,912,325 | | |
| | | 5.750% 06/27/16 | | | 3,000,000 | | | | 3,117,327 | | |
| | | 6.000% 06/27/11 | | | 14,930,000 | | | | 14,945,856 | | |
| Federal National Mortgage Association | | 5.000% 05/11/17(d) | | | 1,980,000 | | | | 1,976,887 | | |
| | | 5.500% 03/26/14 | | | 8,000,000 | | | | 7,989,584 | | |
| | | 5.800% 02/09/26 | | | 2,000,000 | | | | 2,002,828 | | |
| | | 6.000% 04/18/36 | | | 11,200,000 | | | | 11,536,817 | | |
| | | 6.125% 08/17/26 | | | 12,475,000 | | | | 12,673,365 | | |
| U.S. Government Agency Obligations Total | | | | | | | | | 85,061,437 | | |
| U.S. Government Obligations – 3.8% | |
| U.S. Treasury Bonds | | 4.500% 02/15/36(d) | | | 22,735,000 | | | | 21,559,169 | | |
| | | 6.250% 08/15/23(d) | | | 2,868,000 | | | | 3,306,939 | | |
| U.S. Treasury Inflation Index Notes | | 2.000% 01/15/14(d) | | | 1,926,995 | | | | 1,910,660 | | |
| | | 3.000% 07/15/12(d) | | | 14,767,511 | | | | 15,494,929 | | |
| | | 3.625% 01/15/08(d) | | | 6,108,090 | | | | 6,185,870 | | |
| U.S. Treasury Notes | | 4.625% 02/29/12(d) | | | 1,500,000 | | | | 1,506,796 | | |
| | | 4.625% 02/15/17(d) | | | 6,095,000 | | | | 6,092,141 | | |
| | | 4.875% 08/15/09(d) | | | 8,965,000 | | | | 9,022,779 | | |
| U.S. Government Obligations Total | | | | | | | | | 65,079,283 | | |
| | | Total Government & Agency Obligations (cost of $183,969,629) | | | | | | | 185,226,291 | | |
See Accompanying Notes to Financial Statements.
20
Columbia Core Bond Fund
April 30, 2007
| Commercial Mortgage-Backed Securities – 8.0% | |
| | | | | Par ($) | | Value ($) | |
Bear Stearns Commercial
Mortgage Securities | | 5.934% 09/11/38(b) | | | 7,500,000 | | | | 7,729,247 | | |
| Citigroup Commercial Mortgage Trust | | 4.733% 10/15/41 | | | 3,765,000 | | | | 3,638,220 | | |
Citigroup/Deutsche Bank
Commercial Mortgage Trust | | 5.366% 12/11/49(b) | | | 8,850,000 | | | | 8,788,512 | | |
| | | 5.648% 10/15/48 | | | 11,000,000 | | | | 11,169,155 | | |
CS First Boston Mortgage
Securities Corp. | | 5.416% 02/15/40 | | | 14,478,000 | | | | 14,476,216 | | |
Greenwich Capital Commercial
Funding Corp. | | 6.113% 07/10/38(b) | | | 6,445,000 | | | | 6,709,045 | | |
JPMorgan Chase Commercial
Mortgage Securities Corp. | | 4.780% 07/15/42 | | | 3,000,000 | | | | 2,883,929 | | |
| | | 4.878% 01/15/42 | | | 2,000,000 | | | | 1,946,602 | | |
| | | 5.313% 08/15/42(b)(c) | | | 2,500,000 | | | | 2,344,231 | | |
| | | 5.440% 05/15/45 | | | 11,650,000 | | | | 11,654,335 | | |
| | | 5.460% 06/12/47(b) | | | 17,290,000 | | | | 17,283,746 | | |
| | | 5.565% 04/15/43(b) | | | 5,700,000 | | | | 5,717,575 | | |
| | | 5.855% 06/12/43(b) | | | 11,270,000 | | | | 11,642,247 | | |
| | | 6.066% 04/15/45(b) | | | 4,725,000 | | | | 4,897,882 | | |
| LB-UBS Commercial Mortgage Trust | | 5.124% 11/15/32(b) | | | 6,865,000 | | | | 6,821,054 | | |
| Merrill Lynch Mortgage Investors, Inc. | | I.O.:
0.840% 12/15/30(b) | | | 9,879,407 | | | | 179,865 | | |
| Morgan Stanley Capital I | | 4.970% 12/15/41 | | | 7,949,000 | | | | 7,824,497 | | |
| | | 5.949% 10/15/42(b) | | | 5,595,000 | | | | 5,740,867 | | |
Wachovia Bank Commercial
Mortgage Trust | | 6.164% 06/15/45(b) | | | 4,190,000 | | | | 4,369,876 | | |
| | | Total Commercial Mortgage-Backed Securities
(cost of $135,533,263) | | | | | | | 135,817,101 | | |
| Collateralized Mortgage Obligations – 6.4% | |
| U.S. Government Agency Obligations – 1.1% | |
| Federal Home Loan Mortgage Corp. | | I.O.:
5.500% 01/15/23 | | | 607,686 | | | | 10,214 | | |
| | | 5.500% 05/15/27 | | | 1,246,675 | | | | 85,756 | | |
| Federal National Mortgage Association | | 4.717% 08/25/12 | | | 4,640,093 | | | | 4,568,211 | | |
| | | 5.500% 09/25/35 | | | 6,546,240 | | | | 6,533,843 | | |
See Accompanying Notes to Financial Statements.
21
Columbia Core Bond Fund
April 30, 2007
Collateralized Mortgage Obligations – (continued)
| | | | | Par ($) | | Value ($) | |
| U.S. Government Agency Obligations (continued) | |
Government National
Mortgage Association | | 4.374% 04/16/33 | | | 3,000,000 | | | | 2,936,408 | | |
| | | 4.763% 01/16/25 | | | 4,213,720 | | | | 4,204,329 | | |
| Vendee Mortgage Trust | | I.O.:
0.305% 03/15/29(b) | | | 9,801,066 | | | | 99,386 | | |
| | | 0.441% 09/15/27(b) | | | 7,488,023 | | | | 101,242 | | |
| U.S. Government Agency Obligations Total | | | | | | | | | 18,539,389 | | |
| Non-Agency – 5.3% | |
American Home Mortgage
Investment Trust | | 5.430% 06/25/36(b) | | | 6,151,775 | | | | 6,164,690 | | |
| Chaseflex Trust | | 5.500% 02/25/35 | | | 5,495,789 | | | | 5,436,749 | | |
| | | 5.500% 06/25/35 | | | 4,697,900 | | | | 4,691,176 | | |
| Citigroup Mortgage Loan Trust, Inc. | | 5.837% 11/25/36(b) | | | 17,440,502 | | | | 17,622,641 | | |
| | | 6.452% 07/25/36(b) | | | 2,673,705 | | | | 2,721,960 | | |
| Countrywide Alternative Loan Trust | | 5.000% 07/25/35 | | | 2,660,190 | | | | 2,620,279 | | |
| | | 5.250% 03/25/35 | | | 3,314,136 | | | | 3,276,342 | | |
| | | 5.500% 09/25/35 | | | 4,776,814 | | | | 4,652,754 | | |
First Horizon Alternative
Mortgage Securities | | 6.000% 01/25/35 | | | 5,217,023 | | | | 5,202,909 | | |
| GMAC Mortgage Corp. Loan Trust | | 5.647% 04/19/36(b) | | | 2,707,050 | | | | 2,696,380 | | |
| GSAA Trust | | 3.519% 11/25/33 | | | 237,260 | | | | 234,284 | | |
| | | 5.400% 03/25/37(b) | | | 9,398,444 | | | | 9,399,219 | | |
| JPMorgan Alternative Loan Trust | | 5.750% 12/25/36(b) | | | 7,602,697 | | | | 7,623,924 | | |
| JPMorgan Mortgage Trust | | 4.981% 07/25/34(b) | | | 4,651,358 | | | | 4,567,472 | | |
| | | 4.989% 10/25/35(b) | | | 3,500,000 | | | | 3,466,497 | | |
| Residential Accredit Loans, Inc. | | 5.500% 02/25/35 | | | 7,622,624 | | | | 7,573,911 | | |
| Rural Housing Trust | | 6.330% 04/01/26 | | | 343,419 | | | | 342,702 | | |
| Washington Mutual, Inc. | | 4.672% 04/25/35(b) | | | 2,500,000 | | | | 2,466,489 | | |
| Non-Agency Total | | | | | | | | | 90,760,378 | | |
| | | Total Collateralized Mortgage Obligations
(cost of $109,771,270) | | | | | | | 109,299,767 | | |
See Accompanying Notes to Financial Statements.
22
Columbia Core Bond Fund
April 30, 2007
| Securities Lending Collateral – 5.8% | |
| | | | | Shares | | Value ($) | |
| | | State Street Navigator Securities
Lending Prime Portfolio (f) | | | 98,803,720 | | | | 98,803,720 | | |
| | | Total Securities Lending Collateral
(cost of $98,803,720) | | | | | 98,803,720 | | |
| | | | | Par ($) | | | |
| Short-Term Obligations – 15.7% | |
| Government & Agency Obligations – 8.1% | |
| Federal Home Loan Mortgage Corp. | | 5.120% 05/14/07(g) | | | 138,845,000 | | | | 138,588,291 | | |
| | | Government & Agency Obligations Total | | | | | 138,588,291 | | |
| Repurchase Agreement – 7.6% | |
| | Repurchase agreement with Fixed Income Clearing
Corp., dated 04/30/07, due on 05/01/07, at 5.060%,
collateralized by a U.S. Treasury Obligation
maturing 04/30/12, market value of $131,704,913
(repurchase proceeds $129,136,148) | |
129,118,000 | | |
129,118,000 | | |
| | | Total Short-Term Obligations (cost of $267,706,291) | | | | | 267,706,291 | | |
| | | Total Investments – 124.8% (cost of $2,124,051,318)(h) | | | | | 2,126,954,296 | | |
| | | Other Assets & Liabilities, Net – (24.8)% | | | | | (422,304,882 | ) | |
| | | Net Assets – 100.0% | | | | | 1,704,649,414 | | |
Notes to Investment Portfolio:
(a) Security purchased on a delayed delivery basis.
(b) The interest rate shown on floating rate or variable rate securities reflects the rate at April 30, 2007.
(c) Security exempt from registration pursuant to Rule 144A under the Securities Act of 1933. These securities may be resold in transactions exempt from registration, normally to qualified institutional buyers. At April 30, 2007, these securities, which are not illiquid, amounted to $55,611,161, which represents 3.3% of net assets.
(d) All or a portion of this security was on loan at April 30, 2007. The total market value of securities on loan at April 30, 2007 is $97,304,327.
(e) A portion of this security with a market value of $500,969 is pledged as collateral for open futures contracts.
(f) Investment made with cash collateral received from securities lending activity.
(g) Zero-coupon bond. Rate represents annualized yield at date of purchase.
(h) Cost for federal income tax purposes is $2,124,614,174.
See Accompanying Notes to Financial Statements.
23
Columbia Core Bond Fund
April 30, 2007
At April 30, 2007, the Fund held the following open short futures contract:
| Type | | Number of
Contracts | | Value | | Aggregate
Face Value | | Expiration
Date | | Unrealized
Depreciation | |
| U. S. Treasury Bonds | | | 250 | | | $ | 27,937,500 | | | $ | 27,819,500 | | | Jun-2007 | | $ | (118,000 | ) | |
At April 30, 2007, the asset allocation of the Fund was as follows:
| Asset Allocation (unaudited) | | % of
Net Assets | |
| Mortgage-Backed Securities | | | 38.3 | | |
| Corporate Fixed-Income Bonds & Notes | | | 26.2 | | |
| Asset-Backed Securities | | | 13.5 | | |
| Government & Agency Obligations | | | 10.9 | | |
| Commercial Mortgage-Backed Securities | | | 8.0 | | |
| Collateralized Mortgage Obligations | | | 6.4 | | |
| | | | 103.3 | | |
| Securities Lending Collateral | | | 5.8 | | |
| Short-Term Obligations | | | 15.7 | | |
| Other Assets & Liabilities, Net | | | (24.8 | ) | |
| | | | 100.0 | | |
| Acronym | | Name | |
| I.O. | | Interest Only | |
|
| TBA | | To Be Announced | |
|
See Accompanying Notes to Financial Statements.
24
Statement of Assets and Liabilities – Columbia Core Bond Fund
April 30, 2007
| | | | | ($) | |
| Assets | | Investments, at cost | | | 2,124,051,318 | | |
| | | Investments, at value (including securities on loan of $97,304,327) | | | 2,126,954,296 | | |
| | | Cash | | | 309 | | |
| | | Receivable for: | | | | | |
| | | Investments sold | | | 4,716,973 | | |
| | | Fund shares sold | | | 2,740,595 | | |
| | | Interest | | | 11,447,221 | | |
| | | Securities lending | | | 15,419 | | |
| | | Dollar roll fee income | | | 59,718 | | |
| | | Other | | | 311,444 | | |
| | | Deferred Trustees' compensation plan | | | 100,189 | | |
| | | Other assets | | | 41,803 | | |
| | | Total Assets | | | 2,146,387,967 | | |
| Liabilities | | Collateral on securities loaned | | | 98,803,720 | | |
| | | Payable for: | | | | | |
| | | Investments purchased | | | 4,857,010 | | |
| | | Investments purchased on a delayed delivery basis | | | 329,076,630 | | |
| | | Fund shares repurchased | | | 2,365,723 | | |
| | | Futures variation margin | | | 210,938 | | |
| | | Distributions | | | 4,887,183 | | |
| | | Investment advisory fee | | | 605,177 | | |
| | | Administration fee | | | 94,353 | | |
| | | Transfer agent fee | | | 264,031 | | |
| | | Pricing and bookkeeping fees | | | 19,380 | | |
| | | Merger fee | | | 53,664 | | |
| | | Trustees' fees | | | 62,218 | | |
| | | Custody fee | | | 9,504 | | |
| | | Distribution and service fees | | | 31,890 | | |
| | | Chief compliance officer expenses | | | 1,250 | | |
| | | Deferred dollar roll fee income | | | 17,915 | | |
| | | Deferred Trustees' compensation plan | | | 100,189 | | |
| | | Other liabilities | | | 277,778 | | |
| | | Total Liabilities | | | 441,738,553 | | |
| | | Net Assets | | | 1,704,649,414 | | |
| Net Assets Consist of | | Paid-in capital | | | 1,739,974,429 | | |
| | | Undistributed net investment income | | | 296,856 | | |
| | | Accumulated net realized loss | | | (38,406,849 | ) | |
| | | Net unrealized appreciation (depreciation) on: | | | | | |
| | | Investments | | | 2,902,978 | | |
| | | Futures contracts | | | (118,000 | ) | |
| | | Net Assets | | | 1,704,649,414 | | |
See Accompanying Notes to Financial Statements.
25
Statement of Assets and Liabilities – Columbia Core Bond Fund
April 30, 2007 (continued)
| | | | | ($) | |
| Class A | | Net assets | | | 52,116,166 | | |
| | | Shares outstanding | | | 4,931,813 | | |
| | | Net asset value per share | | | 10.57 | (a) | |
| | | Maximum sales charge | | | 4.75 | % | |
| | | Maximum offering price per share ($10.57/0.9525) | | | 11.10 | (b) | |
| Class B | | Net assets | | | 15,709,609 | | |
| | | Shares outstanding | | | 1,486,626 | | |
| | | Net asset value and offering price per share | | | 10.57 | (a) | |
| Class C | | Net assets | | | 5,694,752 | | |
| | | Shares outstanding | | | 538,902 | | |
| | | Net asset value and offering price per share | | | 10.57 | (a) | |
| Class G | | Net assets | | | 679,713 | | |
| | | Shares outstanding | | | 64,322 | | |
| | | Net asset value and offering price per share | | | 10.57 | (a) | |
| Class T | | Net assets | | | 23,582,406 | | |
| | | Shares outstanding | | | 2,231,640 | | |
| | | Net asset value per share | | | 10.57 | (a) | |
| | | Maximum sales charge | | | 4.75 | % | |
| | | Maximum offering price per share (10.57/0.9525) | | | 11.10 | (b) | |
| Class Z | | Net assets | | | 1,606,866,768 | | |
| | | Shares outstanding | | | 152,060,013 | | |
| | | Net asset value, offering and redemption price per share | | | 10.57 | | |
(a) Redemption price per share is equal to net asset value less any applicable contingent deferred sales charge.
(b) On sales of $50,000 or more the offering price is reduced.
See Accompanying Notes to Financial Statements.
26
Statement of Operations – Columbia Core Bond Fund
For the Year Ended April 30, 2007
| | | | | ($) | |
| Investment Income | | Interest | | | 78,759,871 | | |
| | | Dollar roll fee income | | | 991,943 | | |
| | | Securities lending income | | | 131,967 | | |
| | | Total Investment Income | | | 79,883,781 | | |
| Expenses | | Investment advisory fee | | | 6,346,280 | | |
| | | Administration fee | | | 977,725 | | |
| | | Distribution fee: | | | | | |
| | | Class B | | | 106,343 | | |
| | | Class C | | | 42,484 | | |
| | | Class G | | | 7,072 | | |
| | | Service fee: | | | | | |
| | | Class A | | | 114,760 | | |
| | | Class B | | | 35,448 | | |
| | | Class C | | | 14,161 | | |
| | | Class G | | | 1,632 | | |
| | | Shareholder services fee — Class T | | | 37,184 | | |
| | | Transfer agent fee | | | 1,244,719 | | |
| | | Pricing and bookkeeping fees | | | 191,119 | | |
| | | Trustees' fees | | | 53,583 | | |
| | | Custody fee | | | 98,487 | | |
| | | Merger costs | | | 53,664 | | |
| | | Chief compliance officer expenses | | | 12,589 | | |
| | | Other expenses | | | 478,997 | | |
| | | Total Expenses | | | 9,816,247 | | |
| | | Fees waived by Distributor—Class C | | | (8,497 | ) | |
| | | Custody earnings credit | | | (15,850 | ) | |
| | | Net Expenses | | | 9,791,900 | | |
| | | Net Investment Income | | | 70,091,881 | | |
| Net Realized and Unrealized Gain (Loss) on Investments and Futures Contracts | | Net realized gain on: | | | | | |
| | | Investments | | | 1,050,794 | | |
| | | Futures contracts | | | 1,832,049 | | |
| | | Net realized gain | | | 2,882,843 | | |
| | | Net change in unrealized appreciation (depreciation) on: | | | | | |
| | | Investments | | | 24,250,147 | | |
| | | Futures contracts | | | 790,797 | | |
| | | Net change in unrealized appreciation | | | 25,040,944 | | |
| | | Net Gain | | | 27,923,787 | | |
| | | Net Increase Resulting from Operations | | | 98,015,668 | | |
See Accompanying Notes to Financial Statements.
27
Statement of Changes in Net Assets – Columbia Core Bond Fund
| Increase (Decrease) in Net Assets | | Year Ended April 30, | | 2007 ($) | | 2006 ($) | |
| Operations | | Net investment income | | | 70,091,881 | | | | 42,702,488 | | |
| | | Net realized gain (loss) on investments
and futures contracts | | | 2,882,843 | | | | (13,989,054 | ) | |
| | | Net change in unrealized appreciation
(depreciation) on investments and futures contracts | | | 25,040,944 | | | | (29,282,045 | ) | |
| | | Net Increase (Decrease) Resulting from Operations | | | 98,015,668 | | | | (568,611 | ) | |
| Distributions Declared to Shareholders | | From net investment income: | | | | | | | | | |
| | | Class A | | | (2,118,259 | ) | | | (1,142,477 | ) | |
| | | Class B | | | (547,822 | ) | | | (356,498 | ) | |
| | | Class C | | | (227,347 | ) | | | (162,520 | ) | |
| | | Class G | | | (43,799 | ) | | | (100,370 | ) | |
| | | Class T | | | (1,163,523 | ) | | | (1,187,545 | ) | |
| | | Class Z | | | (66,426,244 | ) | | | (40,562,605 | ) | |
| | | Total Distributions Declared to Shareholders | | | (70,526,994 | ) | | | (43,512,015 | ) | |
| Share Transactions | | Class A: | | | | | | | | | |
| | | Subscriptions | | | 5,343,643 | | | | 5,465,259 | | |
| | | Proceeds received in connection with merger | | | 42,779,230 | | | | — | | |
| | | Distributions reinvested | | | 1,795,314 | | | | 999,344 | | |
| | | Redemptions | | | (23,047,327 | ) | | | (13,504,381 | ) | |
| | | Net Increase (Decrease) | | | 26,870,860 | | | | (7,039,778 | ) | |
| | | Class B: | | | | | | | | | |
| | | Subscriptions | | | 1,810,998 | | | | 867,651 | | |
| | | Proceeds received in connection with merger | | | 8,402,114 | | | | — | | |
| | | Distributions reinvested | | | 448,234 | | | | 282,784 | | |
| | | Redemptions | | | (4,922,977 | ) | | | (3,016,655 | ) | |
| | | Net Increase (Decrease) | | | 5,738,369 | | | | (1,866,220 | ) | |
| | | Class C: | | | | | | | | | |
| | | Subscriptions | | | 1,112,709 | | | | 631,284 | | |
| | | Proceeds received in connection with merger | | | 3,270,310 | | | | — | | |
| | | Distributions reinvested | | | 84,513 | | | | 61,518 | | |
| | | Redemptions | | | (2,961,699 | ) | | | (1,562,501 | ) | |
| | | Net Increase (Decrease) | | | 1,505,833 | | | | (869,699 | ) | |
| | | Class G: | | | | | | | | | |
| | | Subscriptions | | | 3,914 | | | | 9,142 | | |
| | | Distributions reinvested | | | 40,553 | | | | 88,112 | | |
| | | Redemptions | | | (921,423 | ) | | | (2,826,058 | ) | |
| | | Net Decrease | | | (876,956 | ) | | | (2,728,804 | ) | |
| | | Class T: | | | | | | | | | |
| | | Subscriptions | | | 751,736 | | | | 1,734,059 | �� | |
| | | Distributions reinvested | | | 995,115 | | | | 1,015,845 | | |
| | | Redemptions | | | (5,016,255 | ) | | | (6,012,451 | ) | |
| | | Net Decrease | | | (3,269,404 | ) | | | (3,262,547 | ) | |
| | | Class Z: | | | | | | | | | |
| | | Subscriptions | | | 205,763,201 | | | | 232,907,623 | | |
| | | Proceeds received in connection with merger | | | 716,437,185 | | | | — | | |
| | | Distributions reinvested | | | 17,829,231 | | | | 15,071,183 | | |
| | | Redemptions | | | (307,217,767 | ) | | | (185,149,300 | ) | |
| | | Net Increase | | | 632,811,850 | | | | 62,829,506 | | |
| | | Net Increase from Share Transactions | | | 662,780,552 | | | | 47,062,458 | | |
| | | Total Increase in Net Assets | | | 690,269,226 | | | | 2,981,832 | | |
| Net Assets | | Beginning of period | | | 1,014,380,188 | | | | 1,011,398,356 | | |
| | | End of period | | | 1,704,649,414 | | | | 1,014,380,188 | | |
| | | Undistributed net investment income at end of period | | | 296,856 | | | | 285,579 | | |
See Accompanying Notes to Financial Statements.
28
Statement of Changes in Net Assets – Columbia Core Bond Fund (continued)
| Increase (Decrease) in Net Assets | | Year Ended April 30, | | 2007 | | 2006 | |
| Changes in Shares | | Class A: | | | | | | | | | |
| | | Subscriptions | | | 509,322 | | | | 512,625 | | |
| | | Issued in connection with merger | | | 4,091,206 | | | | — | | |
| | | Issued for distributions reinvested | | | 170,422 | | | | 93,672 | | |
| | | Redemptions | | | (2,194,937 | ) | | | (1,265,211 | ) | |
| | | Net Increase (Decrease) | | | 2,576,013 | | | | (658,914 | ) | |
| | | Class B: | | | | | | | | | |
| | | Subscriptions | | | 173,259 | | | | 81,348 | | |
| | | Issued in connection with merger | | | 803,041 | | | | — | | |
| | | Issued for distributions reinvested | | | 42,589 | | | | 26,528 | | |
| | | Redemptions | | | (468,513 | ) | | | (283,076 | ) | |
| | | Net Increase (Decrease) | | | 550,376 | | | | (175,200 | ) | |
| | | Class C: | | | | | | | | | |
| | | Subscriptions | | | 106,572 | | | | 58,699 | | |
| | | Issued in connection with merger | | | 312,786 | | | | — | | |
| | | Issued for distributions reinvested | | | 8,032 | | | | 5,765 | | |
| | | Redemptions | | | (281,427 | ) | | | (146,822 | ) | |
| | | Net Increase (Decrease) | | | 145,963 | | | | (82,358 | ) | |
| | | Class G: | | | | | | | | | |
| | | Subscriptions | | | 373 | | | | 858 | | |
| | | Issued for distributions reinvested | | | 3,869 | | | | 8,249 | | |
| | | Redemptions | | | (88,001 | ) | | | (265,470 | ) | |
| | | Net Decrease | | | (83,759 | ) | | | (256,363 | ) | |
| | | Class T: | | | | | | | | | |
| | | Subscriptions | | | 71,773 | | | | 162,188 | | |
| | | Issued for distributions reinvested | | | 94,793 | | | | 95,298 | | |
| | | Redemptions | | | (479,249 | ) | | | (564,322 | ) | |
| | | Net Decrease | | | (312,683 | ) | | | (306,836 | ) | |
| | | Class Z: | | | | | | | | | |
| | | Subscriptions | | | 19,595,359 | | | | 21,793,944 | | |
| | | Issued in connection with merger | | | 68,514,789 | | | | — | | |
| | | Issued for distributions reinvested | | | 1,697,141 | | | | 1,413,965 | | |
| | | Redemptions | | | (29,236,988 | ) | | | (17,391,006 | ) | |
| | | Net Increase | | | 60,570,301 | | | | 5,816,903 | | |
See Accompanying Notes to Financial Statements.
29
Financial Highlights – Columbia Core Bond Fund
Selected data for a share outstanding throughout each period is as follows:
| | | Year Ended April 30, | | Six Months
Ended
April 30, | | Year
Ended
October 31, | |
| Class A Shares | | 2007 | | 2006 (a) | | 2005 | | 2004 (b) | | 2003 (c)(d) | | 2002 | |
| Net Asset Value, Beginning of Period | | $ | 10.36 | | | $ | 10.81 | | | $ | 10.93 | | | $ | 11.52 | | | $ | 11.29 | | | $ | 11.23 | | |
| Income from Investment Operations: | |
| Net investment income | | | 0.48 | (e) | | | 0.42 | (e) | | | 0.39 | (e) | | | 0.38 | (e) | | | 0.24 | (e) | | | 0.54 | | |
Net realized and unrealized gain (loss)
on investments and futures contracts | | | 0.21 | | | | (0.44 | ) | | | 0.09 | | | | (0.30 | ) | | | 0.24 | | | | 0.07 | | |
| Total from Investment Operations | | | 0.69 | | | | (0.02 | ) | | | 0.48 | | | | 0.08 | | | | 0.48 | | | | 0.61 | | |
| Less Distributions Declared to Shareholders: | |
| From net investment income | | | (0.48 | ) | | | (0.43 | ) | | | (0.41 | ) | | | (0.46 | ) | | | (0.25 | ) | | | (0.55 | ) | |
| From net realized gains | | | — | | | | — | | | | (0.19 | ) | | | (0.21 | ) | | | — | | | | — | | |
| Total Distributions Declared to Shareholders | | | (0.48 | ) | | | (0.43 | ) | | | (0.60 | ) | | | (0.67 | ) | | | (0.25 | ) | | | (0.55 | ) | |
| Net Asset Value, End of Period | | $ | 10.57 | | | $ | 10.36 | | | $ | 10.81 | | | $ | 10.93 | | | $ | 11.52 | | | $ | 11.29 | | |
| Total return (f) | | | 6.81 | % | | | (0.27 | )%(g) | | | 4.52 | %(g) | | | 0.65 | %(g) | | | 4.28 | %(g)(h) | | | 5.64 | %(g) | |
Ratios to Average Net Assets/
Supplemental Data: | |
| Net expenses (i) | | | 0.90 | % | | | 0.91 | % | | | 0.94 | % | | | 1.02 | % | | | 0.92 | %(j) | | | 0.89 | % | |
| Waiver/Reimbursement | | | — | | | | — | %(k) | | | — | %(k) | | | 0.12 | % | | | 0.22 | %(j) | | | 0.39 | % | |
| Net investment income (i) | | | 4.58 | % | | | 3.90 | % | | | 3.75 | % | | | 3.35 | % | | | 4.20 | %(j) | | | 4.79 | % | |
| Portfolio turnover rate | | | 175 | % | | | 105 | % | | | 118 | % | | | 119 | % | | | 42 | %(h) | | | 75 | % | |
| Net assets, end of period (000's) | | $ | 52,116 | | | $ | 24,417 | | | $ | 32,601 | | | $ | 2,105 | | | $ | 522 | | | $ | 59 | | |
(a) On October 7, 2005, the Columbia Quality Plus Bond Fund was renamed the Columbia Core Bond Fund.
(b) On October 13, 2003, the Liberty Quality Plus Bond Fund was renamed the Columbia Quality Plus Bond Fund.
(c) The Fund changed its fiscal year end from October 31 to April 30.
(d) On November 25, 2002, the Galaxy Quality Plus Bond Fund, Prime A shares were renamed Liberty Quality Plus Bond Fund, Class A shares.
(e) Per share data was calculated using the average shares outstanding during the period.
(f) Total return at net asset value assuming all distributions reinvested and no initial sales charge or contingent deferred sales charge.
(g) Had the investment advisor and/or any of its affiliates not waived or reimbursed a portion of expenses, total return would have been reduced.
(h) Not annualized.
(i) The benefits derived from custody credits had an impact of less than 0.01%.
(j) Annualized.
(k) Rounds to less than 0.01%.
See Accompanying Notes to Financial Statements.
30
Financial Highlights – Columbia Core Bond Fund
Selected data for a share outstanding throughout each period is as follows:
| | | Year Ended April 30, | | Six Months
Ended
April 30, | | Year
Ended
October 31, | |
| Class B Shares | | 2007 | | 2006 (a) | | 2005 | | 2004 (b) | | 2003 (c)(d) | | 2002 | |
| Net Asset Value, Beginning of Period | | $ | 10.36 | | | $ | 10.81 | | | $ | 10.93 | | | $ | 11.52 | | | $ | 11.29 | | | $ | 11.23 | | |
| Income from Investment Operations: | |
| Net investment income | | | 0.40 | (e) | | | 0.34 | (e) | | | 0.31 | (e) | | | 0.29 | (e) | | | 0.20 | (e) | | | 0.44 | | |
Net realized and unrealized gain (loss)
on investments and futures contracts | | | 0.21 | | | | (0.44 | ) | | | 0.09 | | | | (0.30 | ) | | | 0.24 | | | | 0.08 | | |
| Total from Investment Operations | | | 0.61 | | | | (0.10 | ) | | | 0.40 | | | | (0.01 | ) | | | 0.44 | | | | 0.52 | | |
| Less Distributions Declared to Shareholders: | |
| From net investment income | | | (0.40 | ) | | | (0.35 | ) | | | (0.33 | ) | | | (0.37 | ) | | | (0.21 | ) | | | (0.46 | ) | |
| From net realized gains | | | — | | | | — | | | | (0.19 | ) | | | (0.21 | ) | | | — | | | | — | | |
| Total Distributions Declared to Shareholders | | | (0.40 | ) | | | (0.35 | ) | | | (0.52 | ) | | | (0.58 | ) | | | (0.21 | ) | | | (0.46 | ) | |
| Net Asset Value, End of Period | | $ | 10.57 | | | $ | 10.36 | | | $ | 10.81 | | | $ | 10.93 | | | $ | 11.52 | | | $ | 11.29 | | |
| Total return (f) | | | 6.01 | % | | | (1.01 | )%(g) | | | 3.74 | %(g) | | | (0.12 | )%(g) | | | 3.89 | %(g)(h) | | | 4.86 | %(g) | |
Ratios to Average Net Assets/
Supplemental Data: | |
| Net expenses (i) | | | 1.65 | % | | | 1.66 | % | | | 1.69 | % | | | 1.81 | % | | | 1.68 | %(j) | | | 1.64 | % | |
| Waiver/Reimbursement | | | — | | | | — | %(k) | | | — | %(k) | | | 0.11 | % | | | 0.22 | %(j) | | | 0.30 | % | |
| Net investment income (i) | | | 3.83 | % | | | 3.15 | % | | | 2.97 | % | | | 2.60 | % | | | 3.45 | %(j) | | | 4.04 | % | |
| Portfolio turnover rate | | | 175 | % | | | 105 | % | | | 118 | % | | | 119 | % | | | 42 | %(h) | | | 75 | % | |
| Net assets, end of period (000's) | | $ | 15,710 | | | $ | 9,704 | | | $ | 12,019 | | | $ | 1,541 | | | $ | 900 | | | $ | 268 | | |
(a) On October 7, 2005, the Columbia Quality Plus Bond Fund was renamed the Columbia Core Bond Fund.
(b) On October 13, 2003, the Liberty Quality Plus Bond Fund was renamed the Columbia Quality Plus Bond Fund.
(c) The Fund changed its fiscal year end from October 31 to April 30.
(d) On November 25, 2002, the Galaxy Quality Plus Bond Fund, Prime B shares were renamed Liberty Quality Plus Bond Fund, Class B shares.
(e) Per share data was calculated using the average shares outstanding during the period.
(f) Total return at net asset value assuming all distributions reinvested and no contingent deferred sales charge.
(g) Had the investment advisor and/or any of its affiliates not waived or reimbursed a portion of expenses, total return would have been reduced.
(h) Not annualized.
(i) The benefits derived from custody credits had an impact of less than 0.01%.
(j) Annualized.
(k) Rounds to less than 0.01%.
See Accompanying Notes to Financial Statements.
31
Financial Highlights – Columbia Core Bond Fund
Selected data for a share outstanding throughout each period is as follows:
| | | Year Ended April 30, | | Period Ended
April 30, | |
| Class C Shares | | 2007 | | 2006 (a) | | 2005 | | 2004 (b) | | 2003 (c) | |
| Net Asset Value, Beginning of Period | | $ | 10.36 | | | $ | 10.81 | | | $ | 10.93 | | | $ | 11.52 | | | $ | 11.21 | | |
| Income from Investment Operations: | |
| Net investment income (d) | | | 0.42 | | | | 0.35 | | | | 0.33 | | | | 0.31 | | | | 0.16 | (e) | |
Net realized and unrealized gain (loss)
on investments and futures contracts | | | 0.21 | | | | (0.44 | ) | | | 0.09 | | | | (0.30 | ) | | | 0.33 | | |
| Total from Investment Operations | | | 0.63 | | | | (0.09 | ) | | | 0.42 | | | | 0.01 | | | | 0.49 | | |
| Less Distributions Declared to Shareholders: | |
| From net investment income | | | (0.42 | ) | | | (0.36 | ) | | | (0.35 | ) | | | (0.39 | ) | | | (0.18 | ) | |
| From net realized gains | | | — | | | | — | | | | (0.19 | ) | | | (0.21 | ) | | | — | | |
| Total Distributions Declared to Shareholders | | | (0.42 | ) | | | (0.36 | ) | | | (0.54 | ) | | | (0.60 | ) | | | (0.18 | ) | |
| Net Asset Value, End of Period | | $ | 10.57 | | | $ | 10.36 | | | $ | 10.81 | | | $ | 10.93 | | | $ | 11.52 | | |
| Total return (f)(g) | | | 6.17 | % | | | (0.86 | )% | | | 3.89 | % | | | 0.10 | % | | | 4.38 | %(h) | |
| Ratios to Average Net Assets/Supplemental Data: | |
| Net expenses (i) | | | 1.50 | % | | | 1.51 | % | | | 1.54 | % | | | 1.59 | % | | | 1.55 | %(e) | |
| Waiver/Reimbursement | | | 0.15 | % | | | 0.15 | % | | | 0.15 | % | | | 0.26 | % | | | 0.37 | %(e) | |
| Net investment income (i) | | | 3.99 | % | | | 3.30 | % | | | 3.12 | % | | | 2.75 | % | | | 3.23 | %(e) | |
| Portfolio turnover rate | | | 175 | % | | | 105 | % | | | 118 | % | | | 119 | % | | | 42 | %(h) | |
| Net assets, end of period (000's) | | $ | 5,695 | | | $ | 4,073 | | | $ | 5,140 | | | $ | 558 | | | $ | 170 | | |
(a) On October 7, 2005, the Columbia Quality Plus Bond Fund was renamed the Columbia Core Bond Fund.
(b) On October 13, 2003, the Liberty Quality Plus Bond Fund was renamed the Columbia Quality Plus Bond Fund.
(c) Class C shares were initially offered on November 25, 2002. Per share data and total return reflect activity from that date.
(d) Per share data was calculated using the average shares outstanding during the period.
(e) Annualized.
(f) Total return at net asset value assuming all distributions reinvested and no contingent deferred sales charge.
(g) Had the investment advisor and/or any of its affiliates not waived or reimbursed a portion of expenses, total return would have been reduced.
(h) Not annualized.
(i) The benefits derived from custody credits had an impact of less than 0.01%.
See Accompanying Notes to Financial Statements.
32
Financial Highlights – Columbia Core Bond Fund
Selected data for a share outstanding throughout each period is as follows:
| | | Year Ended April 30, | | Six Months
Ended
April 30, | | Year
Ended
October 31, | |
| Class G Shares | | 2007 | | 2006 (a) | | 2005 | | 2004 (b) | | 2003 (c)(d) | | 2002 | |
| Net Asset Value, Beginning of Period | | $ | 10.36 | | | $ | 10.81 | | | $ | 10.93 | | | $ | 11.52 | | | $ | 11.29 | | | $ | 11.23 | | |
| Income from Investment Operations: | |
| Net investment income | | | 0.42 | (e) | | | 0.36 | (e) | | | 0.34 | (e) | | | 0.33 | (e) | | | 0.20 | (e) | | | 0.45 | | |
Net realized and unrealized gain (loss)
on investments and futures contracts | | | 0.21 | | | | (0.44 | ) | | | 0.08 | | | | (0.32 | ) | | | 0.24 | | | | 0.08 | | |
| Total from Investment Operations | | | 0.63 | | | | (0.08 | ) | | | 0.42 | | | | 0.01 | | | | 0.44 | | | | 0.53 | | |
| Less Distributions Declared to Shareholders: | |
| From net investment income | | | (0.42 | ) | | | (0.37 | ) | | | (0.35 | ) | | | (0.39 | ) | | | (0.21 | ) | | | (0.47 | ) | |
| From net realized gains | | | — | | | | — | | | | (0.19 | ) | | | (0.21 | ) | | | — | | | | — | | |
| Total Distributions Declared to Shareholders | | | (0.42 | ) | | | (0.37 | ) | | | (0.54 | ) | | | (0.60 | ) | | | (0.21 | ) | | | (0.47 | ) | |
| Net Asset Value, End of Period | | $ | 10.57 | | | $ | 10.36 | | | $ | 10.81 | | | $ | 10.93 | | | $ | 11.52 | | | $ | 11.29 | | |
| Total return (f) | | | 6.22 | % | | | (0.81 | )%(g) | | | 3.94 | %(g) | | | 0.10 | %(g) | | | 3.94 | %(g)(h) | | | 4.90 | %(g) | |
Ratios to Average Net Assets/
Supplemental Data: | |
| Net expenses (i) | | | 1.45 | % | | | 1.46 | % | | | 1.49 | % | | | 1.60 | % | | | 1.60 | %(j) | | | 1.60 | % | |
| Waiver/Reimbursement | | | — | | | | — | %(k) | | | — | %(k) | | | 0.11 | % | | | 0.22 | %(j) | | | 0.23 | % | |
| Net investment income (i) | | | 4.02 | % | | | 3.33 | % | | | 3.07 | % | | | 2.90 | % | | | 3.56 | %(j) | | | 4.08 | % | |
| Portfolio turnover rate | | | 175 | % | | | 105 | % | | | 118 | % | | | 119 | % | | | 42 | %(h) | | | 75 | % | |
| Net assets, end of period (000's) | | $ | 680 | | | $ | 1,535 | | | $ | 4,374 | | | $ | 8,124 | | | $ | 13,345 | | | $ | 13,981 | | |
(a) On October 7, 2005, the Columbia Quality Plus Bond Fund was renamed the Columbia Core Bond Fund.
(b) On October 13, 2003, the Liberty Quality Plus Bond Fund was renamed the Columbia Quality Plus Bond Fund.
(c) The Fund changed its fiscal year end from October 31 to April 30.
(d) On November 25, 2002, the Galaxy Quality Plus Bond Fund, Retail B shares were renamed Liberty Quality Plus Bond Fund, Class G shares.
(e) Per share data was calculated using the average shares outstanding during the period.
(f) Total return at net asset value assuming all distributions reinvested and no contingent deferred sales charge.
(g) Had the investment advisor and/or any of its affiliates not waived or reimbursed a portion of expenses, total return would have been reduced.
(h) Not annualized.
(i) The benefits derived from custody credits had an impact of less than 0.01%.
(j) Annualized.
(k) Rounds to less than 0.01%.
See Accompanying Notes to Financial Statements.
33
Financial Highlights – Columbia Core Bond Fund
Selected data for a share outstanding throughout each period is as follows:
| | | Year Ended April 30, | | Six Months
Ended
April 30, | | Year
Ended
October 31, | |
| Class T Shares | | 2007 | | 2006 (a) | | 2005 | | 2004 (b) | | 2003 (c)(d) | | 2002 | |
| Net Asset Value, Beginning of Period | | $ | 10.36 | | | $ | 10.81 | | | $ | 10.93 | | | $ | 11.52 | | | $ | 11.29 | | | $ | 11.23 | | |
| Income from Investment Operations: | |
| Net investment income | | | 0.49 | (e) | | | 0.42 | (e) | | | 0.41 | (e) | | | 0.40 | (e) | | | 0.24 | (e) | | | 0.52 | | |
Net realized and unrealized gain (loss)
on investments and futures contracts | | | 0.21 | | | | (0.43 | ) | | | 0.09 | | | | (0.31 | ) | | | 0.24 | | | | 0.08 | | |
| Total from Investment Operations | | | 0.70 | | | | (0.01 | ) | | | 0.50 | | | | 0.09 | | | | 0.48 | | | | 0.60 | | |
| Less Distributions Declared to Shareholders: | |
| From net investment income | | | (0.49 | ) | | | (0.44 | ) | | | (0.43 | ) | | | (0.47 | ) | | | (0.25 | ) | | | (0.54 | ) | |
| From net realized gains | | | — | | | | — | | | | (0.19 | ) | | | (0.21 | ) | | | — | | | | — | | |
| Total Distributions Declared to Shareholders | | | (0.49 | ) | | | (0.44 | ) | | | (0.62 | ) | | | (0.68 | ) | | | (0.25 | ) | | | (0.54 | ) | |
| Net Asset Value, End of Period | | $ | 10.57 | | | $ | 10.36 | | | $ | 10.81 | | | $ | 10.93 | | | $ | 11.52 | | | $ | 11.29 | | |
| Total return (f) | | | 6.91 | % | | | (0.17 | )%(g) | | | 4.62 | %(g) | | | 0.75 | %(g) | | | 4.29 | %(g)(h) | | | 5.63 | %(g) | |
Ratios to Average Net Assets/
Supplemental Data: | |
| Net expenses (i) | | | 0.80 | % | | | 0.81 | % | | | 0.84 | % | | | 0.95 | % | | | 0.91 | %(j) | | | 0.91 | % | |
| Waiver/Reimbursement | | | — | | | | — | %(k) | | | — | %(k) | | | 0.11 | % | | | 0.22 | %(j) | | | 0.22 | % | |
| Net investment income (i) | | | 4.68 | % | | | 4.01 | % | | | 3.72 | % | | | 3.54 | % | | | 4.26 | %(j) | | | 4.77 | % | |
| Portfolio turnover rate | | | 175 | % | | | 105 | % | | | 118 | % | | | 119 | % | | | 42 | %(h) | | | 75 | % | |
| Net assets, end of period (000's) | | $ | 23,582 | | | $ | 26,372 | | | $ | 30,832 | | | $ | 35,058 | | | $ | 43,084 | | | $ | 44,409 | | |
(a) On October 7, 2005, the Columbia Quality Plus Bond Fund was renamed the Columbia Core Bond Fund.
(b) On October 13, 2003, the Liberty Quality Plus Bond Fund was renamed the Columbia Quality Plus Bond Fund.
(c) The Fund changed its fiscal year end from October 31 to April 30.
(d) On November 25, 2002, the Galaxy Quality Plus Bond Fund, Retail A shares were renamed Liberty Quality Plus Bond Fund, Class T shares.
(e) Per share data was calculated using the average shares outstanding during the period.
(f) Total return at net asset value assuming all distributions reinvested and no initial sales charge or contingent deferred sales charge.
(g) Had the investment advisor and/or any of its affiliates not waived or reimbursed a portion of expenses, total return would have been reduced.
(h) Not annualized.
(i) The benefits derived from custody credits had an impact of less than 0.01%.
(j) Annualized.
(k) Rounds to less than 0.01%.
See Accompanying Notes to Financial Statements.
34
Financial Highlights – Columbia Core Bond Fund
Selected data for a share outstanding throughout each period is as follows:
| | | Year Ended April 30, | | Six Months
Ended
April 30, | | Year
Ended
October 31, | |
| Class Z Shares | | 2007 | | 2006 (a) | | 2005 | | 2004 (b) | | 2003 (c)(d) | | 2002 | |
| Net Asset Value, Beginning of Period | | $ | 10.36 | | | $ | 10.81 | | | $ | 10.93 | | | $ | 11.52 | | | $ | 11.29 | | | $ | 11.23 | | |
| Income from Investment Operations: | |
| Net investment income | | | 0.51 | (e) | | | 0.44 | (e) | | | 0.42 | (e) | | | 0.42 | (e) | | | 0.25 | (e) | | | 0.55 | | |
Net realized and unrealized gain (loss)
on investments and futures contracts | | | 0.21 | | | | (0.44 | ) | | | 0.09 | | | | (0.31 | ) | | | 0.24 | | | | 0.08 | | |
| Total from Investment Operations | | | 0.72 | | | | — | | | | 0.51 | | | | 0.11 | | | | 0.49 | | | | 0.63 | | |
| Less Distributions Declared to Shareholders: | |
| From net investment income | | | (0.51 | ) | | | (0.45 | ) | | | (0.44 | ) | | | (0.49 | ) | | | (0.26 | ) | | | (0.57 | ) | |
| From net realized gains | | | — | | | | — | | | | (0.19 | ) | | | (0.21 | ) | | | — | | | | — | | |
| Total Distributions Declared to Shareholders | | | (0.51 | ) | | | (0.45 | ) | | | (0.63 | ) | | | (0.70 | ) | | | (0.26 | ) | | | (0.57 | ) | |
| Net Asset Value, End of Period | | $ | 10.57 | | | $ | 10.36 | | | $ | 10.81 | | | $ | 10.93 | | | $ | 11.52 | | | $ | 11.29 | | |
| Total return (f) | | | 7.07 | % | | | (0.02 | )%(g) | | | 4.78 | %(g) | | | 0.94 | %(g) | | | 4.41 | %(g)(h) | | | 5.86 | %(g) | |
Ratios to Average Net Assets/
Supplemental Data: | |
| Net expenses (i) | | | 0.65 | % | | | 0.66 | % | | | 0.69 | % | | | 0.75 | % | | | 0.67 | %(j) | | | 0.69 | % | |
| Waiver/Reimbursement | | | — | | | | — | %(k) | | | — | %(k) | | | 0.11 | % | | | 0.22 | %(j) | | | 0.22 | % | |
| Net investment income (i) | | | 4.83 | % | | | 4.16 | % | | | 3.87 | % | | | 3.71 | % | | | 4.49 | %(j) | | | 4.99 | % | |
| Portfolio turnover rate | | | 175 | % | | | 105 | % | | | 118 | % | | | 119 | % | | | 42 | %(h) | | | 75 | % | |
| Net assets, end of period (000's) | | $ | 1,606,867 | | | $ | 948,279 | | | $ | 926,434 | | | $ | 817,994 | | | $ | 885,920 | | | $ | 888,792 | | |
(a) On October 7, 2005, the Columbia Quality Plus Bond Fund was renamed the Columbia Core Bond Fund.
(b) On October 13, 2003, the Liberty Quality Plus Bond Fund was renamed the Columbia Quality Plus Bond Fund.
(c) The Fund changed its fiscal year end from October 31 to April 30.
(d) On November 25, 2002, the Galaxy Quality Plus Bond Fund, Trust shares were renamed Liberty Quality Plus Bond Fund, Class Z shares.
(e) Per share data was calculated using the average shares outstanding during the period.
(f) Total return at net asset value assuming all distributions reinvested.
(g) Had the investment advisor and/or any of its affiliates not waived or reimbursed a portion of expenses, total return would have been reduced.
(h) Not annualized.
(i) The benefits derived from custody credits had an impact of less than 0.01%.
(j) Annualized.
(k) Rounds to less than 0.01%.
See Accompanying Notes to Financial Statements.
35
Notes to Financial Statements – Columbia Core Bond Fund
April 30, 2007
Note 1. Organization
Columbia Core Bond Fund (the "Fund"), a series of Columbia Funds Series Trust I (the "Trust"), is a diversified portfolio. The Trust is a Massachusetts business trust registered under the Investment Company Act of 1940, as amended, as an open-end management investment company.
Investment Goal
The Fund seeks a high level of current income consistent with prudent risk of capital.
Fund Shares
The Trust may issue an unlimited number of shares, and the Fund offers six classes of shares: Class A, Class B, Class C, Class G, Class T and Class Z. Each share class has its own expense structure and sales charges, as applicable.
Class A and Class T shares are subject to a maximum front-end sales charge of 4.75% based on the amount of initial investment. Class A and Class T shares purchased without an initial sales charge in accounts aggregating up to $50 million at the time of purchase are subject to a 1.00% contingent deferred sales charge ("CDSC") if the shares are sold within twelve months after purchase. Class B and Class G shares are subject to a maximum CDSC of 5.00% based upon the holding period after purchase. Class B shares will convert to Class A shares, and Class G shares will convert to Class T shares, eight years after purchase. Class C shares are subject to a 1.00% CDSC on shares sold within twelve months after purchase. Class Z shares are offered continuously at net asset value. There are certain restrictions on the purchase of Class G, Class T and Class Z shares, as described in the Fund's prospectus.
Note 2. Significant Accounting Policies
The preparation of financial statements in accordance with accounting principles generally accepted in the United States of America ("GAAP") requires management to make certain estimates and assumptions that affect the reported amounts and disclosures in the financial statements. Actual results could differ from those estimates. The following is a summary of significant accounting policies consistently followed by the Fund in the preparation of its financial statements.
Security Valuation
Debt securities generally are valued by pricing services approved by the Trust's Board of Trustees, based upon market transactions for normal, institutional-size trading units of similar securities. The services may use various pricing techniques which take into account appropriate factors such as yield, quality, coupon rate, maturity, type of issue, trading characteristics and other data, as well as broker quotes. Debt securities for which quotations are readily available are valued at an over-the-counter or exchange bid quotation. Certain debt securities, which tend to be more thinly traded and of lesser quality, are priced based on fundamental analysis of the financial condition of the issuer and the estimated value of any collateral. Valuations developed through pricing techniques may vary from the actual amounts realized upon sale of the securities, and the potential variation may be greater for those securities valued usin g fundamental analysis.
Short-term debt obligations maturing within 60 days are valued at amortized cost, which approximates market value.
Futures contracts are valued at the settlement price established each day by the board of trade or exchange on which they are traded.
Investments for which market quotations are not readily available, or that have quotations which management believes are not appropriate, are valued at fair value as determined in good faith under consistently applied procedures established by and under the general supervision of the Board of Trustees. If a security is valued at "fair value," such value is likely to be different from the last quoted market price for the security.
In September 2006, Statement of Financial Accounting Standards No. 157, Fair Value Measurements ("SFAS 157"), was issued. SFAS 157 is effective for fiscal years beginning after November 15, 2007. SFAS 157 defines fair value, establishes a framework for measuring fair value and expands disclosures about fair value measurements. Management is evaluating the impact the application of SFAS 157 will have on the Fund's financial statement disclosures.
Security Transactions
Security transactions are accounted for on the trade date. Cost is determined and gains (losses) are based upon the specific identification method for both financial statement and federal income tax purposes.
36
Columbia Core Bond Fund, April 30, 2007 (continued)
Futures Contracts
The Fund may invest in futures contracts to seek to enhance returns, to hedge some of the risks of its investments in fixed income securities or as a substitute for a position in the underlying assets. The use of futures contracts involves certain risks, which include: (1) imperfect correlation between the price movement of the instruments and the underlying securities, (2) inability to close out positions due to differing trading hours, or the temporary absence of a liquid market, for either the instrument or the underlying securities, or (3) an inaccurate prediction by Columbia Management Advisors, LLC ("Columbia"), the Fund's investment advisor, of the future direction of interest rates. Any of these risks may involve amounts exceeding the variation margin recorded in the Fund's Statement of Assets and Liabilities at any given time.
Upon entering into a futures contract, the Fund deposits cash or securities with the broker in an amount sufficient to meet the initial margin requirement. Subsequent payments are made or received by the Fund equal to the daily change in the contract value and are recorded as variation margin receivable or payable and offset in unrealized gains or losses. The Fund recognizes a realized gain or loss when the contract is closed or expires.
Repurchase Agreements
The Fund may engage in repurchase agreement transactions with institutions that Columbia has determined are creditworthy. The Fund, through its custodian, receives delivery of underlying securities collateralizing a repurchase agreement. Columbia is responsible for determining that collateral is at least equal, at all times, to the value of the repurchase obligation including interest. A repurchase agreement transaction involves certain risks in the event of default or insolvency of the counterparty. These risks include possible delays or restrictions upon the Fund's ability to dispose of the underlying securities and a possible decline in the value of the underlying securities during the period while the Fund seeks to assert its rights.
Mortgage Dollar Roll Transactions
The Fund may enter into mortgage "dollar rolls" in which the Fund sells securities for delivery in the current month and simultaneously contracts with the same counterparty to repurchase similar (same type, coupon and maturity) but not identical securities on a specified future date not exceeding 120 days. During the roll period, the Fund loses the right to receive principal and interest paid on the securities sold. However, the Fund would benefit to the extent of any difference between the price received for the securities sold and the lower forward price for the future purchase (often referred to as the "drop") or fee income plus the interest earned on the cash proceeds of the securities sold until the settlement date of the forward purchase. Unless such benefits exceed the income, capital appreciation and gain or loss due to mortgage prepayments that woul d have been realized on the securities sold as part of the mortgage dollar roll, the use of this technique will diminish the investment performance of the Fund compared with what such performance would have been without the use of mortgage dollar rolls. All cash proceeds will be invested in instruments that are permissible investments for the Fund. The Fund will hold and maintain in a segregated account until the settlement date, cash or liquid securities in an amount equal to the forward purchase price.
The Fund's policy is to record the components of mortgage dollar rolls using "to be announced" mortgage-backed securities ("TBA Dollar Rolls"). For financial reporting and tax purposes, the Fund treats mortgage dollar rolls as two separate transactions, one involving the purchase of a security and a separate transaction involving a sale. The Fund does not currently enter into mortgage dollar rolls that are accounted for as financing.
Mortgage dollar rolls involve certain risks. If the broker-dealer to whom the Fund sells the security becomes insolvent, the Fund's right to purchase or repurchase the mortgage-related securities may be restricted and the instrument which the Fund is required to repurchase may be worth less than an instrument which the Fund originally held. Successful use of mortgage dollar rolls may depend upon the investment advisor's ability to predict correctly interest rates and mortgage prepayments. For these reasons, there is no assurance that mortgage dollar rolls can be successfully employed.
Delayed Delivery Securities
The Fund may trade securities on other than normal settlement terms, including securities purchased or sold on a "when-issued" basis. This may increase the risk if the other party to the transaction fails to deliver and causes the Fund to subsequently invest at less advantageous prices. The Fund holds until
37
Columbia Core Bond Fund, April 30, 2007 (continued)
settlement date, in a segregated account, cash or liquid securities in an amount equal to the delayed delivery commitment.
Income Recognition
Interest income is recorded on the accrual basis and includes accretion of discounts, amortization of premiums and paydown gains and losses, except for certain foreign securities which are recorded as soon after ex date as the Fund becomes aware of such, net of any non-reclaimable tax withholdings of foreign holdings. Fee income attributable to mortgage dollar roll transactions is recorded on the accrual basis over the term of the transaction.
Determination of Class Net Asset Values
All income, expenses (other than class-specific expenses, as shown on the Statement of Operations) and realized and unrealized gains (losses) are allocated to each class of the Fund on a daily basis for purposes of determining the net asset value of each class. Income and expenses are allocated to each class based on the settled shares method, while realized and unrealized gains (losses) are allocated based on the relative net assets of each class.
Stripped Securities
Stripped mortgage-backed securities are derivative multiclass mortgage securities structured so that one class receives most, if not all, of the principal from the underlying mortgage assets, while the other class receives most, if not all, of the interest and the remainder of the principal. If the underlying mortgage assets experience greater than anticipated prepayments of principal, a Fund may fail to fully recoup its initial investment in an interest-only security. The market value of these securities can be extremely volatile in response to changes in interest rates. Credit risk reflects the risk that a Fund may not receive all or part of its principal because the issuer or credit enhancer has defaulted on its obligation.
Treasury Inflation Protected Securities
The Fund may invest in Treasury Inflation Protected Securities ("TIPS"). The principal amount of TIPS is adjusted periodically for inflation based on a monthly published index. Interest payments are based on the inflation-adjusted principal at the time the interest is paid.
Federal Income Tax Status
The Fund intends to qualify each year as a "regulated investment company" under Subchapter M of the Internal Revenue Code, as amended, and will distribute substantially all of its taxable income, if any, for its tax year, and as such will not be subject to federal income taxes. In addition, the Fund intends to distribute in each calendar year substantially all of its net investment income, capital gains and certain other amounts, if any, such that the Fund should not be subject to federal excise tax. Therefore, no federal income or excise tax provision is recorded.
Distributions to Shareholders
Dividends from net investment income are declared daily and paid monthly. Net realized capital gains, if any, are distributed at least annually.
Indemnification
In the normal course of business, the Fund enters into contracts that contain a variety of representations and warranties and which provide general indemnities. The Fund's maximum exposure under these arrangements is unknown because this would involve future claims against the Fund. Also, under the Trust's organizational documents and by contract, the trustees and officers of the Trust are indemnified against certain liabilities that may arise out of actions relating to their duties to the Trust. However, based on experience, the Fund expects the risk of loss due to these representations, warranties and indemnities to be minimal.
Note 3. Federal Tax Information
The timing and character of income and capital gain distributions are determined in accordance with income tax regulations, which may differ from GAAP. Reclassifications are made to the Fund's capital accounts for permanent tax differences to reflect income and gains available for distribution (or available capital loss carryforwards) under income tax regulations.
For the year ended April 30, 2007, permanent book and tax basis differences resulting primarily from differing treatments for expired and acquired capital loss carryforwards, discount accretion/premium amortization on debt securities, paydowns and market discount were identified
38
Columbia Core Bond Fund, April 30, 2007 (continued)
and reclassified among the components of the Fund's net assets as follows:
Undistributed
Net Investment
Income | | Accumulated
Net Realized Loss | | Paid-In
Capital | |
| $ | 446,390 | �� | | $ | (22,437,447 | ) | | $ | 21,991,057 | | |
Net investment income and net realized gains (losses), as disclosed on the Statement of Operations, and net assets were not affected by this reclassification.
The tax character of distributions paid during the years ended April 30, 2007 and April 30, 2006 was as follows:
| | | April 30, | |
| Distributions paid from: | | 2007 | | 2006 | |
| Ordinary Income* | | | 70,526,994 | | | $ | 43,512,015 | | |
| Long-Term Capital Gains | | | — | | | | — | | |
* For tax purposes short-term capital gains distributions, if any, are considered ordinary income distributions.
As of April 30, 2007, the components of distributable earnings on a tax basis were as follows:
Undistributed
Ordinary
Income | | Undistributed
Long-term
Capital Gains | | Net Unrealized
Appreciation* | |
| $ | 5,021,409 | | | $ | — | | | $ | 2,340,122 | | |
* The differences between book-basis and tax-basis net unrealized appreciation are primarily due to deferral of losses from wash sales.
Unrealized appreciation and depreciation at April 30, 2007, based on cost of investments for federal income tax purposes were:
Unrealized
appreciation | | Unrealized
depreciation | | Net unrealized
appreciation | |
| $ | 9,973,771 | | | $ | (7,633,649 | ) | | $ | 2,340,122 | | |
The following capital loss carryforwards, determined as of April 30, 2007, may be available to reduce taxable income arising from future net realized gains on investments, if any, to the extent permitted by the Internal Revenue Code:
| Year of Expiration | | Capital Loss
Carryforward | |
| | 2010 | | | $ | 973,647 | | |
| | 2011 | | | | 1,494,488 | | |
| | 2012 | | | | 2,252,251 | | |
| | 2013 | | | | 5,618,112 | | |
| | 2014 | | | | 19,745,385 | | |
| | 2015 | | | | 5,076,609 | | |
Capital loss carryforwards of $3,074,162 expired during the year ended April 30, 2007.
Under current tax rules, certain capital losses realized after October 31 may be deferred and treated as occurring on the first day of the following fiscal year. As of April 30, 2007, post-October capital losses of $2,902,612 attributed to security transactions were deferred to May 1, 2007.
In June 2006, the Financial Accounting Standards Board ("FASB") issued FASB Interpretation No. 48, Accounting for Uncertainty in Income Taxes, an Interpretation of FASB Statement No. 109 (the "Interpretation"). This Interpretation is effective on the last business day of the semiannual reporting period for fiscal years beginning after December 15, 2006 and is to be applied to open tax positions upon initial adoption. This Interpretation prescribes a minimum recognition threshold and measurement method for the financial statement recognition of tax positions taken or expected to be taken in a tax return and also requires certain expanded disclosures. Management is evaluating the application of this Interpretation to the Fund and has not at this time quantified the impact, if any, r esulting from the adoption of this Interpretation on the Fund's financial statements.
Note 4. Fees and Compensation Paid to Affiliates
Investment Advisory Fee
Columbia, an indirect, wholly-owned subsidiary of Bank of America Corporation ("BOA"), is the investment advisor to the Fund. Columbia receives a monthly investment advisory fee
39
Columbia Core Bond Fund, April 30, 2007 (continued)
based on the Fund's average daily net assets at the following annual rates:
| Average Daily Net Assets | | Annual Fee Rate | |
| First $500 million | | | 0.48 | % | |
| $500 million to $1 billion | | | 0.43 | % | |
| $1 billion to $1.5 billion | | | 0.40 | % | |
| $1.5 billion to $3 billion | | | 0.37 | % | |
| $3 billion to $6 billion | | | 0.36 | % | |
| Over $6 billion | | | 0.35 | % | |
For the year ended April 30, 2007, the Fund's effective investment advisory fee rate was 0.44% of the Fund's average daily net assets.
Administration Fee
Columbia provides administrative and other services to the Fund for a monthly administration fee at the annual rate of 0.067% of the Fund's average daily net assets.
Pricing & Bookkeeping Fees
Effective December 15, 2006, the Fund entered into a Financial Reporting Services Agreement with State Street Bank & Trust Company ("State Street") and Columbia (the "Financial Reporting Services Agreement") pursuant to which State Street provides financial reporting services to the Fund. Also effective December 15, 2006, the Fund entered into an Accounting Services Agreement with State Street and Columbia (collectively with the Financial Reporting Services Agreement, the "State Street Agreements") pursuant to which State Street provides accounting services to the Fund. Under the State Street Agreements, the Fund pays State Street an annual fee of $38,000 paid monthly. In addition, the Fund pays State Street a monthly fee based on an annualized percentage rate of average daily net assets of the Fund for the month. The aggregate fee will not exceed $140,000 per year (exclusive of out-of-pocket expenses and charges). The Fund also reimburses State Street for certain out-of-pocket expenses and charges.
Effective December 15, 2006, the Fund entered into a Pricing and Bookkeeping Oversight and Services Agreement (the "Services Agreement") with Columbia. Under the Services Agreement, Columbia provides services related to Fund expenses and the requirements of the Sarbanes-Oxley Act of 2002, and provides oversight of the accounting and financial reporting services provided by State Street. Under the Services Agreement, the Fund reimburses Columbia for out-of-pocket expenses and direct internal costs relating to accounting oversight and for services relating to Fund expenses and the requirements of the Sarbanes-Oxley Act of 2002.
Prior to December 15, 2006, Columbia was responsible for providing pricing and bookkeeping services to the Fund under a pricing and bookkeeping agreement and was entitled to receive an annual fee at the same fee structure described above under the State Street Agreements. Under separate agreements between Columbia and State Street, Columbia delegated certain functions to State Street. As a result of the delegation, the total fees payable under the pricing and bookkeeping agreement (other than certain reimbursements paid to Columbia and discussed below) were paid to State Street. The Fund also reimbursed Columbia and State Street for out-of-pocket expenses and charges, including fees payable to third parties for pricing the Fund's portfolio securities and direct internal costs incurred by Columbia in connection with providing fund accounting oversight and monitoring and certain other services.
For the year ended April 30, 2007, the total amount paid to affiliates by the Fund under the Services Agreement was $111,757.
For the year ended April 30, 2007, the effective pricing and bookkeeping fee rate for the Fund, inclusive of out-of-pocket expenses, was 0.013% of the Fund's average daily net assets.
Transfer Agent Fee
Columbia Management Services, Inc. (the "Transfer Agent"), an affiliate of Columbia and an indirect, wholly-owned subsidiary of BOA, provides shareholder services to the Fund and has contracted with Boston Financial Data Services ("BFDS") to serve as sub-transfer agent. The Transfer Agent is entitled to receive a fee for its services, paid monthly, at the annual rate of $17.00 per open account plus reimbursement of certain sub-transfer agent fees paid by the Transfer Agent (exclusive of BFDS fees), calculated based on assets held in omnibus accounts and intended to recover the cost of payments to other parties (including affiliates of BOA) for services to those accounts. The Transfer Agent pays the fees of BFDS for services as sub-transfer agent and is not entitled to reimbursement for such fees from the Fund. The Transfer Agent may also retain, as additional compensation for its
40
Columbia Core Bond Fund, April 30, 2007 (continued)
services, fees for wire, telephone and redemption orders, IRA trustee agent fees and account transcript fees due the Transfer Agent from shareholders of the Fund and credits (net of bank charges) earned with respect to balances in accounts the Transfer Agent maintains in connection with its services to the Fund. The Transfer Agent also receives reimbursement for certain out-of-pocket expenses.
For the year ended April 30, 2007, the Fund's effective transfer agent fee rate, inclusive of out-of-pocket expenses and sub-transfer agent fees, was 0.09% of the Fund's average daily net assets.
Underwriting Discounts, Service and Distribution Fees
Columbia Management Distributors, Inc. (the "Distributor"), an affiliate of Columbia and an indirect, wholly-owned subsidiary of BOA, is the principal underwriter of the Fund.
For the year ended April 30, 2007, the Distributor has retained net underwriting discounts of $2,677 and $126 on sales of the Fund's Class A and Class T shares, respectively, and net CDSC fees of $513, $33,681, $390 and $2,631 on Class A, Class B, Class C and Class G share redemptions, respectively.
The Fund has adopted Rule 12b-1 plans (the "Plans"), which require the payment of a monthly distribution and service fee to the Distributor at an annual fee rate as follows:
| Distribution Fee | | Service Fee | |
| Class B | | Class C1 | | Class G2 | | Class A | | Class B | | Class C1 | | Class G2,3 | |
| | 0.75 | % | | | 0.75 | % | | | 0.65 | % | | | 0.25 | % | | | 0.25 | % | | | 0.25 | % | | | 0.50 | % | |
1 The Distributor has voluntarily limited a portion of the Fund's Class C share distribution and service fees so that combined they will not exceed 0.85% annually of average net assets.
2 Under the Plan, the Fund does not intend to pay more than 0.80% annually for Class G shares' combined distribution and service fees.
3 Of the 0.50% service fee for Class G shares, 0.25% relates to shareholder liaison fees and 0.25% relates to administration support fees.
The CDSC and the distribution fees are used principally as repayment to the Distributor for amounts paid by the Distributor to dealers who sold such shares.
Shareholder Services Fee
The Fund has adopted shareholder service plans that permit it to pay for certain services provided to Class T shareholders by their financial advisors. The annual service fee may equal up to 0.50% annually for Class T shares, but will not exceed the Fund's net investment income attributable to Class T shares. The Fund does not intend to pay more than 0.15% annually for Class T shareholder services fees.
Custody Credits
The Fund has an agreement with its custodian bank under which custody fees may be reduced by balance credits. These credits are recorded as a reduction of total expenses in the Statement of Operations. The Fund could have invested a portion of the assets utilized in connection with the expense offset arrangement in an income-producing asset if it had not entered into such an agreement.
Fees Paid to Officers and Trustees
All officers of the Fund are employees of Columbia or its affiliates and, with the exception of the Fund's Chief Compliance Officer, receive no compensation from the Fund. The Board of Trustees has appointed a Chief Compliance Officer to the Fund in accordance with federal securities regulations. The Fund, along with other affiliated funds, pays its pro-rata share of the expenses associated with the Chief Compliance Officer. The Fund's expenses for the Chief Compliance Officer will not exceed $15,000 per year.
The Fund's Trustees may participate in a deferred compensation plan which may be terminated at any time. Obligations of the plan will be paid solely out of the Fund's assets.
As a result of a fund merger, the Fund assumed the assets and liabilities of the deferred compensation plan of an
41
Columbia Core Bond Fund, April 30, 2007 (continued)
acquired fund. The deferred compensation plan of the acquired fund may be terminated at any time. Benefits under this deferred compensation plan are paid solely out of the Fund's assets.
Note 5. Portfolio Information
For the year ended April 30, 2007, the cost of purchases and proceeds from sales of securities, excluding short-term obligations, were $2,228,447,936 and $2,245,363,273, respectively, of which $960,776,886 and $810,174,820, respectively, were U.S. Government Securities.
Note 6. Line of Credit
The Trust and other affiliated funds participate in a $350,000,000 committed unsecured revolving line of credit and a $150,000,000 uncommitted, unsecured line of credit, both provided by State Street. Borrowings are available for temporary or emergency purposes.
Interest on the committed line of credit is charged to each participating fund based on the fund's borrowings at a rate per annum equal to the Federal Funds Rate plus 0.50%. In addition, a commitment fee of 0.10% per annum is accrued and apportioned among the participating funds based on their pro-rata portion of the unutilized committed line of credit. Interest on the uncommitted line of credit is charged to each participating fund based on the fund's borrowings at a variable rate per annum equal to the Federal Funds Rate plus a spread, as determined and quoted by State Street at the time of the request for a loan. A one-time structuring fee of $30,000 is also accrued and apportioned to each fund participating in the uncommitted line of credit based on the average net assets of the participating funds. In addition, if the uncommitted line of credit is extended for an additional period, an annual administration fee of $15,000 wi ll be charged and apportioned among each participating fund. The commitment fee and structuring fee are included in "Other expenses" in the Statement of Operations.
For the year ended April 30, 2007, the Fund did not borrow under these arrangements.
Note 7. Securities Lending
The Fund commenced a securities lending program in August 2006 and may lend its securities to certain approved brokers, dealers and other financial institutions. Each loan is collateralized by cash, in an amount at least equal to the market value of the securities loaned plus accrued income from the investment of collateral. The market value of the loaned securities is determined at the close of business of the Fund and any additional required collateral is delivered to the Fund on the next business day. The collateral received is invested and the income generated by the investment of the collateral, net of any fees remitted to State Street as the lending agent and borrower rebates, is paid to the Fund. Generally, in the event of borrower default, the Fund has the right to use the collateral to offset any losses incurred. In the event the Fund is delayed or prevented from exercising its right to dispose of the collateral, there may be a potential loss to the Fund. The Fund bears the risk of loss with respect to the investment of collateral.
Note 8. Shares of Beneficial Interest
As of April 30, 2007, the Fund had three shareholders that held 90.2% of the Fund's shares outstanding. These shares were beneficially owned by participant accounts over which BOA and/or its affiliates had either sole or joint investment discretion. Subscription and redemption activity in these accounts may have a significant effect on the operations of the Fund.
Note 9. Disclosure of Significant Risks and Contingencies
Foreign Securities
There are certain additional risks involved when investing in foreign securities that are not inherent with investments in domestic securities. These risks may involve foreign currency exchange rate fluctuations, adverse political and economic developments and the possible prevention of currency exchange or other foreign governmental laws or restrictions. In addition, the liquidity of foreign securities may be more limited than that of domestic securities.
Sector Focus
The Fund may focus its investments in certain industries, subjecting it to greater risk than funds that are less concentrated.
Legal Proceedings
On February 9, 2005, Columbia Management Advisors, Inc. (which has since merged into Banc of America Capital Management, LLC (now named Columbia Management
42
Columbia Core Bond Fund, April 30, 2007 (continued)
Advisors, LLC)) ("Columbia") and Columbia Funds Distributor, Inc. (which has been renamed Columbia Management Distributors, Inc.) (the "Distributor") (collectively, the "Columbia Group") entered into an Assurance of Discontinuance with the New York Attorney General ("NYAG") (the "NYAG Settlement") and consented to the entry of a cease-and-desist order by the Securities and Exchange Commission ("SEC") (the "SEC Order") on matters relating to mutual fund trading. The SEC Order and the NYAG Settlement are referred to collectively as the "Settlements".
Under the terms of the SEC Order, the Columbia Group agreed, among other things, to: pay $70 million in disgorgement and $70 million in civil money penalties; cease and desist from violations of the antifraud provisions and certain other provisions of the federal securities laws; maintain certain compliance and ethics oversight structures; retain an independent consultant to review the Columbia Group's applicable supervisory, compliance, control and other policies and procedures; and retain an independent distribution consultant (see below). The Columbia Funds have also voluntarily undertaken to implement certain governance measures designed to maintain the independence of their boards of trustees. The NYAG Settlement also, among other things, requires Columbia and its affiliates to reduce management fees for certain Columbia Funds (including the former Nations Funds) and other mutual funds collectively by $32 million per year f or five years, for a projected total of $160 million in management fee reductions.
Pursuant to the procedures set forth in the SEC Order, the $140 million in settlement amounts described above will be distributed in accordance with a distribution plan that was developed by an independent distribution consultant and approved by the SEC on April 6, 2007.
A copy of the SEC Order is available on the SEC website at http://www.sec.gov. A copy of the NYAG Settlement is available as part of the Bank of America Corporation Form 8-K filing on February 10, 2005.
In connection with the events described above, various parties have filed suit against certain funds, the Trustees of the Columbia Funds, FleetBoston Financial Corporation and its affiliated entities and/or Bank of America and its affiliated entities.
On February 20, 2004, the Judicial Panel on Multidistrict Litigation transferred these cases and cases against other mutual fund companies based on similar allegations to the United States District Court in Maryland for consolidated or coordinated pretrial proceedings (the "MDL"). Subsequently, additional related cases were transferred to the MDL. On September 29, 2004, the plaintiffs in the MDL filed amended and consolidated complaints. One of these amended complaints is a putative class action that includes claims under the federal securities laws and state common law, and that names Columbia, the Distributor, the Trustees of the Columbia Funds, Bank of America Corporation and others as defendants. Another of the amended complaints is a derivative action purportedly on behalf of the Columbia Funds that asserts claims under federal securities laws and state common law.
On February 25, 2005, Columbia and other defendants filed motions to dismiss the claims in the pending cases. On March 1, 2006, for reasons stated in the court's memoranda dated November 3, 2005, the U.S. District Court for the District of Maryland granted in part and denied in part the defendants' motions to dismiss. The court dismissed all of the class action claims pending against the Columbia Funds Trusts. As to Columbia and the Distributor, the claims under the Securities Act of 1933, the claims under Sections 34(b) and 36(a) of the Investment Company Act of 1940 ("ICA") and the state law claims were dismissed. The claims under Sections 10(b) and 20(a) of the Securities Exchange Act of 1934 and claims under Section 36(b) of the ICA were not dismissed.
On March 21, 2005, a purported class action was filed in Massachusetts state court alleging that certain conduct, including market timing, entitled Class B shareholders in certain Columbia funds to an exemption from contingent deferred sales charges upon early redemption ("the CDSC Lawsuit"). The CDSC Lawsuit was removed to federal court in Massachusetts and the federal Judicial Panel transferred the CDSC Lawsuit to the MDL.
On April 4, 2006, the plaintiffs and the Columbia defendants named in the MDL, including the Columbia Funds, entered into a term sheet containing the principal terms of a stipulation of settlement that would settle all Columbia-related claims in the MDL described above, including the CDSC Lawsuit. On April 6, 2006, the U.S. District Court for the District of Maryland stayed
43
Columbia Core Bond Fund, April 30, 2007 (continued)
all actions with respect to these Columbia-related claims. The settlement is subject to court approval.
In 2004, the Columbia Funds' adviser and distributor and certain affiliated entities and individuals were named as defendants in certain purported shareholder class and derivative actions making claims, including claims under the Investment Company and the Investment Advisers Acts of 1940 and state law. Certain Columbia Funds were named as nominal defendants. The suits allege, inter alia, that the fees and expenses paid by the funds are excessive and that the advisers and their affiliates inappropriately used fund assets to distribute the funds and for other improper purposes. On March 2, 2005, the actions were consolidated in the Massachusetts federal court as In re Columbia Entities Litigation. The plaintiffs filed a consolidated amended complaint on June 9, 2005. On November 30, 2005, the judge dismissed all claims by plaintiffs and entered final judgment in favor of the defendants. The plaintiffs appealed to the United States Court of Appeals for the First Circuit on December 30, 2005. A stipulation and settlement agreement dated January 19, 2007 was filed in the First Circuit on February 14, 2007, with a joint stipulation of dismissal and motion for remand to obtain district court approval of the settlement. That joint motion was granted and the appeal was dismissed. On March 6, 2007, the case was remanded to the District Court. On May 11, 2007, the District Court entered a preliminary approval order which granted preliminary approval of the settlement. A final settlement hearing, at which the District Court will determine whether the proposed settlement should be finally approved and the action dismissed on the merits with prejud ice, is scheduled for September 18, 2007. The terms of the settlement, if finally approved, will require payments by the funds' adviser and/or its affiliates, including payment of plaintiffs' attorneys' fees and notice to class members. In the event that the settlement is not finally approved, the plaintiffs may elect to go forward with their appeal and no opinion is expressed regarding the likely outcome or financial impact of such an appeal on any fund.
Note 10. Business Combinations and Mergers
As of the close of business on September 15, 2006, Columbia Intermediate Core Bond Fund merged into Columbia Core Bond Fund. Columbia Core Bond Fund received a tax-free transfer of assets from Columbia Intermediate Core Bond Fund as follows:
Shares
Issued | | Net Assets
Received | | Unrealized
Appreciation* | |
| | 73,721,822 | | | $ | 770,888,839 | | | $ | 5,049,078 | | |
Net Assets of
Columbia Core
Bond Fund
Immediately
Prior to
Combination | | Net Assets of
Columbia Intermediate
Core Bond Fund
Immediately
Prior to Combination | | Net Assets of
Columbia Core
Bond Fund
Immediately
After
Combination | |
| $ | 1,006,189,693 | | | $ | 770,888,839 | | | $ | 1,777,078,532 | | |
* Unrealized appreciation is included in the net assets received.
44
Report of Independent Registered Public Accounting Firm
To the Trustees of Columbia Funds Series Trust I and the Shareholders of Columbia Core Bond Fund
In our opinion, the accompanying statement of assets and liabilities, including the investment portfolio, and the related statements of operations and of changes in net assets and the financial highlights present fairly, in all material respects, the financial position of Columbia Core Bond Fund (the "Fund") (a series of Columbia Funds Series Trust I) at April 30, 2007, and the results of its operations, for the year then ended, the changes in its net assets for the two years in the period then ended and the financial highlights for the four years in the period then ended, in conformity with accounting principles generally accepted in the United States of America. These financial statements and financial highlights (hereafter referred to as "financial statements") are the responsibility of the Fund's management. Our responsibility is to express an opinion on these financial statements based on our audits. We conducted our audits of these financial statements in accordance with the standards of the Public Company Accounting Oversight Board (United States). Those standards require that we plan and perform the audit to obtain reasonable assurance about whether the financial statements are free of material misstatement. An audit includes examining, on a test basis, evidence supporting the amounts and disclosures in the financial statements, assessing the accounting principles used and significant estimates made by management, and evaluating the overall financial statement presentation. We believe that our audits, which included confirmation of securities at April 30, 2007 by correspondence with the custodian and brokers, provide a reasonable basis for our opinion. The financial highlights of the Fund for the periods ending prior to April 30, 2003 were audited by other independent accountants whose report dated June 10, 2003 expressed an unqualified opinion on those highlights.
PricewaterhouseCoopers LLP
Boston, Massachusetts
June 21, 2007
45
Fund Governance
The Trustees serve terms of indefinite duration. The names, addresses and ages of the Trustees and officers of the Funds in Columbia Funds Series Trust I, the year each was first elected or appointed to office, their principal business occupations during at least the last five years, the number of portfolios overseen by each Trustee and other directorships they hold are shown below. Each officer listed below serves as an officer of each Fund in the Columbia Funds Complex.
Independent Trustees
Name, Address and Year of Birth,
Position with Funds, Year First
Elected or Appointed to Office(1) | | Principal Occupation(s) During Past Five Years, Number of Portfolios in Columbia Funds
Complex Overseen by Trustee, Other Directorships Held
| |
| Douglas A. Hacker (Born 1955) | |
|
c/o Columbia Management Advisors, LLC
One Financial Center
Boston, MA 02111
Trustee (since 1996) | | Independent business executive since May, 2006; Executive Vice President-Strategy of United Airlines (airline) from December, 2002 to May, 2006; President of UAL Loyalty Services (airline marketing company) from September, 2001 to December, 2002; Executive Vice President and Chief Financial Officer of United Airlines from July, 1999 to September, 2001. Oversees 75, Nash Finch Company (food distributor); Aircastle Limited (aircraft leasing) | |
|
| Janet Langford Kelly (Born 1957) | |
|
c/o Columbia Management Advisors, LLC
One Financial Center
Boston, MA 02111
Trustee (since 1996) | | Deputy General Counsel-Corporate Legal Services, ConocoPhillips (integrated petroleum company) since August, 2006; Partner, Zelle, Hofmann, Voelbel, Mason & Gette LLP (law firm) from March, 2005 to July, 2006; Adjunct Professor of Law, Northwestern University, from September, 2004 to June, 2006, Director, UAL Corporation (airline) from February, 2006 to July, 2006; Chief Administrative Officer and Senior Vice President, Kmart Holding Corporation (consumer goods), from September, 2003 to March, 2004; Executive Vice President-Corporate Development and Administration, General Counsel and Secretary, Kellogg Company (food manufacturer), from September, 1999 to August, 2003. Oversees 75, None | |
|
| Richard W. Lowry (Born 1936) | |
|
c/o Columbia Management Advisors, LLC
One Financial Center
Boston, MA 02111
Trustee (since 1995) | | Private Investor since August, 1987 (formerly Chairman and Chief Executive Officer, U.S. Plywood Corporation (building products manufacturer) until 1987). Oversees 75, None | |
|
| Charles R. Nelson (Born 1942) | |
|
c/o Columbia Management Advisors, LLC
One Financial Center
Boston, MA 02111
Trustee (since 1981) | | Professor of Economics, University of Washington, since January, 1976; Ford and Louisa, University of Washington, Van Voorhis Professor of Political Economy, University of Washington, since September, 1993; Director, Institute for Economic Research, University of Washington from September, 2001 to June, 2003; Adjunct Professor of Statistics, University of Washington, since September, 1980; Associate Editor, Journal of Money Credit and Banking, since September, 1993; Consultant on econometric and statistical matters. Oversees 81, None | |
|
46
Fund Governance (continued)
Independent Trustees
Name, Address and Year of Birth,
Position with Funds, Year First
Elected or Appointed to Office(1) | | Principal Occupation(s) During Past Five Years, Number of Portfolios in Columbia Funds
Complex Overseen by Trustee, Other Directorships Held
| |
| John J. Neuhauser (Born 1943) | |
|
c/o Columbia Management Advisors, LLC
One Financial Center
Boston, MA 02111
Trustee (since 1985) | | University Professor, Boston College since November, 2005; Academic Vice President and Dean of Faculties, Boston College from August, 1999 to October, 2005. Oversees 75, None | |
|
| Patrick J. Simpson (Born 1944) | |
|
c/o Columbia Management Advisors, LLC
One Financial Center
Boston, MA 02111
Trustee (since 2000) | | Partner, Perkins Coie LLP (law firm). Oversees 75, None | |
|
| Thomas E. Stitzel (Born 1936) | |
|
c/o Columbia Management Advisors, LLC
One Financial Center
Boston, MA 02111
Trustee (since 1998) | | Business Consultant since 1999; Chartered Financial Analyst. Oversees 75, None | |
|
| Thomas C. Theobald (Born 1937) | |
|
c/o Columbia Management Advisors, LLC
One Financial Center
Boston, MA 02111
Trustee and Chairman of the Board(2) (since 1996) | | Partner and Senior Advisor, Chicago Growth Partners (private equity investing) since September, 2004; Managing Director, William Blair Capital Partners (private equity investing) from September, 1994 to September, 2004. Oversees 75, Anixter International (network support equipment distributor); Ventas, Inc. (real estate investment trust); Jones Lang LaSalle (real estate management services); Ambac Financial Group (financial guaranty insurance) | |
|
| Anne-Lee Verville (Born 1945) | |
|
c/o Columbia Management Advisors, LLC
One Financial Center
Boston, MA 02111
Trustee (since 1998) | | Retired since 1997 (formerly General Manager, Global Education Industry, IBM Corporation (computer and technology) from 1994 to 1997). Oversees 75, None | |
|
47
Fund Governance (continued)
Interested Trustee
Name, Address and Year of Birth,
Position with Funds, Year First
Elected or Appointed to Office(1) | | Principal Occupation(s) During Past Five Years, Number of Portfolios in Columbia Funds
Complex Overseen by Trustee, Other Directorships Held
| |
| William E. Mayer (Born 1940) | |
|
c/o Columbia Management Advisors, LLC
One Financial Center
Boston, MA 02111
Trustee(3) (since 1994) | | Partner, Park Avenue Equity Partners (private equity) since February, 1999; Dean and Professor, College of Business, University of Maryland, 1992 to 1997. Oversees 75, Lee Enterprises (print media), WR Hambrecht + Co. (financial service provider); Reader's Digest (publishing) | |
|
1 In December 2000, the boards of each of the former Liberty Funds and former Stein Roe Funds were combined into one board of trustees responsible for the oversight of both fund groups (collectively, the "Liberty Board"). In October 2003, the trustees on the Liberty Board were elected to the boards of the Columbia Funds (the "Columbia Board") and of the CMG Fund Trust (the "CMG Funds Board"); simultaneous with that election, Patrick J. Simpson who had been a director on the Columbia Board and trustee on the CMG Funds Board, was appointed to serve as trustee of the Liberty Board. The date shown is the earliest date on which a trustee/director was elected or appointed to the board of a Fund in the Columbia Funds Complex.
2 Mr. Theobald was appointed as Chairman of the Board effective December 10, 2003.
3 Mr. Mayer is an "interested person" (as defined in the Investment Company Act of 1940) by reason of his affiliation with WR Hambrecht + Co.
The Statement of Additional Information includes additional information about the Trustees of the Funds and is available, without charge, upon request by calling 800-426-3750.
Officers
Name, Address and Year of Birth,
Position with Columbia Funds,
Year First Elected or
Appointed to Office | | Principal Occupation(s) During Past Five Years
| |
| Christopher L. Wilson (Born 1957) | |
|
One Financial Center
Boston, MA 02111
President (since 2004) | | President – Columbia Funds, since October 2004; Managing Director – Columbia Management Advisors, LLC, since September 2005; Senior Vice President – Columbia Management Distributors, Inc., since January 2005; Director – Columbia Management Services, Inc., since January 2005; Director – Bank of America Global Liquidity Funds, plc and Banc of America Capital Management (Ireland), Limited, since May 2005; Director – FIM Funding, Inc., since January 2005; President and Chief Executive Officer – CDC IXIS AM Services, Inc. (investment management), from September 1998 through August 2004; and a senior officer or director of various other Bank of America-affiliated entities, including other registered and unregistered funds. | |
|
| James R. Bordewick, Jr. (Born 1959) | |
|
One Financial Center
Boston, MA 02111
Senior Vice President, Secretary
and Chief Legal Officer (since 2006) | | Associate General Counsel, Bank of America since April, 2005; Senior Vice President and Associate General Counsel, MFS Investment Management (investment management) prior to April, 2005. | |
|
48
Fund Governance (continued)
Officers
Name, Address and Year of Birth,
Position with Columbia Funds,
Year First Elected or
Appointed to Office | | Principal Occupation(s) During Past Five Years
| |
| J. Kevin Connaughton (Born 1964) | |
|
One Financial Center
Boston, MA 02111
Senior Vice President,
Chief Financial Officer
and Treasurer (since 2000) | | Treasurer – Columbia Funds, since October 2003; Treasurer – the Liberty Funds, Stein Roe Funds and Liberty All-Star Funds, December 2000 – December 2006; Vice President – Columbia Management Advisors, Inc., since April 2003; President – Columbia Funds, Liberty Funds and Stein Roe Funds, February 2004 to October 2004; Treasurer – Galaxy Funds, September 2002 to December 2005; Treasurer, December 2002 to December 2004, and President, February 2004 to December 2004 – Columbia Management Multi-Strategy Hedge Fund, LLC; and a senior officer of various other Bank of America-affiliated entities, including other registered and unregistered funds. | |
|
| Linda J. Wondrack (Born 1964) | |
|
One Financial Center
Boston, MA 02111
Senior Vice President,
Chief Compliance Officer
(since 2007) | | Director (Columbia Management Group LLC and Investment Product Group Compliance), Bank of America since June 2005; Director of Corporate Compliance and Conflicts Officer, MFS Investment Management (investment management), August 2004 to May 2005; Managing Director, Deutsche Asset Management (investment management) prior to August 2004. | |
|
| Michael G. Clarke (Born 1969) | |
|
One Financial Center
Boston, MA 02111
Chief Accounting Officer and
Assistant Treasurer (since 2004) | | Director of Fund Administration of the Advisor since January, 2006; Managing Director of the Advisor September, 2004 to December, 2005; Vice President Fund Administration of the Advisor June, 2002 to September, 2004. Vice President Product Strategy and Development of the Advisor from February, 2001 to June, 2002. | |
|
| Jeffrey R. Coleman (Born 1969) | |
|
One Financial Center
Boston, MA 02111
Deputy Treasurer (since 2006) | | Director of Fund Administration of the Advisor since January, 2006; Fund Controller of the Advisor from October 2004 to January 2006; Vice President of CDC IXIS Asset Management Services, Inc. (investment management) from August, 2000 to September, 2004. | |
|
| Joseph F. DiMaria (Born 1968) | |
|
One Financial Center
Boston, MA 02111
Deputy Treasurer (since 2006) | | Director of Fund Administration of the Advisor since January, 2006; Head of Tax/Compliance and Assistant Treasurer of the Advisor from November, 2004 to December, 2005; Director of Trustee Administration (Sarbanes-Oxley) of the Advisor from May, 2003 to October, 2004; Senior Audit Manager, PricewaterhouseCoopers (independent registered public accounting firm) from July, 2000 to April, 2003. | |
|
49
Fund Governance (continued)
Officers
Name, Address and Year of Birth,
Position with Columbia Funds,
Year First Elected or
Appointed to Office | | Principal Occupation(s) During Past Five Years
| |
| Ty S. Edwards (Born 1966) | |
|
One Financial Center
Boston, MA 02111
Deputy Treasurer (since 2006) | | Director of Fund Administration of the Advisor since January, 2006; Vice President of the Advisor from July, 2002 to December, 2005; Assistant Vice President and Director, State Street Corporation (financial services) prior to 2002. | |
|
| Barry S. Vallan (Born 1969) | |
|
One Financial Center
Boston, MA 02111
Controller (since 2006) | | Vice President-Fund Treasury of the Advisor since October, 2004; Vice President-Trustee Reporting of the Advisor from April, 2002 to October, 2004; Management Consultant, PricewaterhouseCoopers (independent registered public accounting firm) prior to October, 2002. | |
|
50
Columbia Funds
| Growth Funds | | Columbia Acorn Fund
Columbia Acorn Select
Columbia Acorn USA
Columbia Large Cap Growth Fund
Columbia Marsico 21st Century Fund
Columbia Marsico Focused Equities Fund
Columbia Marsico Growth Fund
Columbia Mid Cap Growth Fund
Columbia Small Cap Growth Fund I
Columbia Small Cap Growth Fund II | |
|
| Core Funds | | Columbia Common Stock Fund
Columbia Large Cap Core Fund
Columbia Small Cap Core Fund | |
|
| Value Funds | | Columbia Disciplined Value Fund
Columbia Dividend Income Fund
Columbia Large Cap Value Fund
Columbia Mid Cap Value Fund
Columbia Small Cap Value Fund I
Columbia Small Cap Value Fund II
Columbia Strategic Investor Fund | |
|
| Asset Allocation/Hybrid Funds | | Columbia Asset Allocation Fund
Columbia Asset Allocation Fund II
Columbia Balanced Fund
Columbia Liberty Fund
Columbia LifeGoal(TM) Balanced Growth Portfolio
Columbia LifeGoal(TM) Growth Portfolio
Columbia LifeGoal(TM) Income Portfolio
Columbia LifeGoal(TM) Income and Growth Portfolio
Columbia Masters Global Equity Portfolio
Columbia Masters Heritage Portfolio
Columbia Masters International Equity Portfolio
Columbia Thermostat Fund | |
|
| Index Funds | | Columbia Large Cap Enhanced Core Fund
Columbia Large Cap Index Fund
Columbia Mid Cap Index Fund
Columbia Small Cap Index Fund | |
|
| Specialty Funds | | Columbia Convertible Securities Fund
Columbia Real Estate Equity Fund
Columbia Technology Fund | |
|
| Global/International Funds | | Columbia Acorn International
Columbia Acorn International Select
Columbia Global Value Fund
Columbia Greater China Fund
Columbia International Stock Fund
Columbia International Value Fund
Columbia Marsico International Opportunities Fund
Columbia Multi-Advisor International Equity Fund
Columbia World Equity Fund | |
|
51
Columbia Funds (continued)
| Taxable Bond Funds | | Columbia Conservative High Yield Fund
Columbia Core Bond Fund
Columbia Federal Securities Fund
Columbia High Income Fund
Columbia High Yield Opportunity Fund
Columbia Income Fund
Columbia Intermediate Bond Fund
Columbia Short Term Bond Fund
Columbia Strategic Income Fund
Columbia To tal Return Bond Fund
Columbia U.S. Treasury Index Fund | |
|
| Tax-Exempt Bond Funds | | Columbia California Tax-Exempt Fund
Columbia California Intermediate Municipal Bond Fund
Columbia Connecticut Tax-Exempt Fund
Columbia Connecticut Intermediate Municipal Bond Fund
Columbia Georgia Intermediate Municipal Bond Fund
Columbia High Yield Municipal Fund
Columbia Intermediate Municipal Bond Fund
Columbia Massachusetts Intermediate Municipal Bond Fund
Columbia Massachusetts Tax-Exempt Fund
Columbia Maryland Intermediate Municipal Bond Fund
Columbia North Carolina Intermediate Municipal Bond Fund
Columbia New York Tax-Exempt Fund
Columbia New Jersey Intermediate Municipal Bond Fund
Columbia New York Intermediate Municipal Bond Fund
Columbia Oregon Intermediate Municipal Bond Fund
Columbia Rhode Island Intermediate Municipal Bond Fund
Columbia South Carolina Inter mediate Municipal Bond Fund
Columbia Short Term Municipal Bond Fund
Columbia Tax-Exempt Fund
Columbia Virginia Intermediate Municipal Bond Fund | |
|
| Money Market Funds | | Columbia California Tax-Exempt Reserves
Columbia Cash Reserves
Columbia Connecticut Municipal Reserves
Columbia Government Plus Reserves
Columbia Government Reserves
Columbia Massachusetts Municipal Reserves
Columbia Money Market Reserves
Columbia Municipal Reserves
Columbia Prime Reserves
Columbia Tax-Exempt Reserves
Columbia Treasury Reserves | |
|
For complete product information on any Columbia fund, visit our website at www.columbiafunds.com.
52
Important Information About This Report – Columbia Core Bond Fund
The fund mails one shareholder report to each shareholder address. If you would like more than one report, please call shareholder services at 1-800-345-6611 and additional reports will be sent to you. This report has been prepared for shareholders of Columbia Core Bond Fund.
A description of the policies and procedures that the fund uses to determine how to vote proxies and a copy of the fund's voting records are available (i) at www.columbiamanagement.com; (ii) on the Securities and Exchange Commission's website at www.sec.gov, and (iii) without charge, upon request, by calling 1-800-368-0346. Information regarding how the fund voted proxies relating to portfolio securities during the 12-month period ended June 30 is available from the SEC's website. Information regarding how the fund voted proxies relating to portfolio securities is also available from the fund's website.
The fund files a complete schedule of portfolio holdings with the SEC for the first and third quarters of each fiscal year on Form N-Q. The fund's Form N-Q is available on the SEC's website at www.sec.gov and may be reviewed and copied at the SEC's Public Reference Room in Washington, DC. Information on the operation of the Public Reference Room may be obtained by calling 1-800-SEC-0330.
| Transfer Agent | |
|
Columbia Management Services, Inc.
P.O. Box 8081
Boston, MA 02266-8081
1-800-345-6611 | |
|
| Distributor | |
|
Columbia Management
Distributors, Inc.
One Financial Center
Boston, MA 02111 | |
|
| Investment Advisor | |
|
Columbia Management Advisors, LLC
100 Federal Street
Boston, MA 02110 | |
|
Please consider the investment objectives, risks, charges and expenses for the fund carefully before investing. Contact your financial advisor for a prospectus, which contains this and other important information about the fund. You should read it carefully before you invest.
Columbia Management Group, LLC ("Columbia Management") is the investment management division of Bank of America Corporation. Columbia Management entities furnish investment management services and products for institutional and individual investors. Columbia Funds are distributed by Columbia Management Distributors, Inc., member of NASD, SIPC, part of Columbia Management and an affiliate of Bank of America Corporation.
53
Columbia Core Bond Fund
Annual Report – April 30, 2007
Columbia Management®
PRSRT STD
U.S. Postage
PAID
Holliston, MA
Permit NO. 20
©2007 Columbia Management Distributors, Inc.
One Financial Center, Boston, MA 02111-2621
800-345-6611 www.columbiafunds.com
SHC-42/130866-0407 (06/07) 07/39050
Item 2. Code of Ethics.
(a) The registrant has, as of the end of the period covered by this report, adopted a code of ethics that applies to the registrant’s principal executive officer, principal financial officer, principal accounting officer or controller, or persons performing similar functions, regardless of whether these individuals are employed by the registrant or a third party.
(b) During the period covered by this report, there were not any amendments to a provision of the code of ethics adopted in 2(a) above.
(c) During the period covered by this report, there were no waivers, including any implicit waivers, from a provision of the code of ethics described in 2(a) above that relates to one or more of the items set forth in paragraph (b) of this item’s instructions.
Item 3. Audit Committee Financial Expert.
The registrant’s Board of Trustees has determined that Douglas A. Hacker, Thomas E. Stitzel and Anne-Lee Verville, each of whom are members of the registrant’s Board of Trustees and Audit Committee, each qualify as an audit committee financial expert. Mr. Hacker, Mr. Stitzel and Ms. Verville are each independent trustees, as defined in paragraph (a)(2) of this item’s instructions and collectively constitute the entire Audit Committee.
Item 4. Principal Accountant Fees and Services.
Fee information below is disclosed for the one series of the registrant whose report to stockholders is included in this annual filing. Fee information for both fiscal years also includes fees for one series that was merged into the registrant during the periods.
(a) Audit Fees. Aggregate Audit Fees billed by the principal accountant for professional services rendered during the fiscal years ended April 30, 2007 and April 30, 2006 are approximately as follows:
2007 | | 2006 | |
$ | 33,000 | | $ | 30,600 | |
| | | | | |
Audit Fees include amounts related to the audit of the registrant’s annual financial statements or services that are normally provided by the accountant in connection with statutory and regulatory filings or engagements for those fiscal years.
(b) Audit-Related Fees. Aggregate Audit-Related Fees billed to the registrant by the principal accountant for professional services rendered during the fiscal years ended April 30, 2007 and April 30, 2006 are approximately as follows:
2007 | | 2006 | |
$ | 11,600 | | $ | 15,400 | |
| | | | | |
Audit-Related Fees include amounts for assurance and related services by the principal accountant that are reasonably related to the performance of the audit of the registrant’s financial statements and are not reported in Audit Fees above. In both fiscal years 2007 and 2006, Audit-Related Fees include agreed-upon procedures performed for semi-annual shareholder reports and agreed-upon procedures related to fund mergers.
During the fiscal years ended April 30, 2007 and April 30, 2006, there were no Audit-Related Fees billed by the registrant’s principal accountant to the registrant’s investment adviser (not including any sub-adviser whose role is primarily portfolio management and is subcontracted with or overseen by another investment adviser) and any entity controlling, controlled by, or under common control with the adviser that provides ongoing services to the registrant for an engagement that related directly to the operations and financial reporting of the registrant.
(c) Tax Fees. Aggregate Tax Fees billed by the principal accountant to the registrant for professional services rendered during the fiscal years ended April 30, 2007 and April 30, 2006 are approximately as follows:
Tax Fees include amounts for the review of annual tax returns and typically include amounts for professional services by the principal accountant for tax compliance, tax advice and tax planning. In fiscal year 2007, Tax Fees also include agreed-upon procedures related to the review of a final tax return. In fiscal year 2006, Tax Fees include the review of required shareholder distribution calculations.
During the fiscal years ended April 30, 2007 and April 30, 2006, there were no Tax Fees billed by the registrant’s principal accountant to the registrant’s investment adviser (not including any sub-adviser whose role is primarily portfolio management and is subcontracted with or overseen by another investment adviser) and any entity controlling, controlled by, or under common control with the adviser that provides ongoing services to the registrant for an engagement that related directly to the operations and financial reporting of the registrant.
(d) All Other Fees. Aggregate All Other Fees billed by the principal accountant to the registrant for professional services rendered during the fiscal years ended April 30, 2007 and April 30, 2006 are approximately as follows:
All Other Fees include amounts for products and services provided by the principal accountant, other than the services reported in paragraphs (a) through (c) above. In both fiscal years 2007 and 2006, All Other Fees consist of fees billed for agreed-upon procedures related to the review of the registrant’s anti-money laundering program.
Aggregate All Other Fees billed by the registrant’s principal accountant to the registrant’s investment adviser (not including any sub-adviser whose role is primarily portfolio management and is subcontracted with or overseen by another investment adviser) and any entity controlling, controlled by, or under common control with the adviser that provides ongoing services to the registrant for an engagement that related directly to the operations and financial reporting of the registrant during the fiscal years ended April 30, 2007 and April 30, 2006 are approximately as follows:
2007 | | 2006 | |
$ | 849,100 | | $ | 361,600 | |
| | | | | |
In both fiscal years 2007 and 2006, All Other Fees consist of fees billed for internal control examinations of the registrant’s transfer agent and investment advisor.
(e)(1) Audit Committee Pre-Approval Policies and Procedures
The registrant’s Audit Committee is required to pre-approve the engagement of the registrant’s independent accountants to provide audit and non-audit services to the registrant and non-audit services to its investment adviser (not including any sub-adviser whose role is primarily portfolio management and is subcontracted with or overseen by another investment adviser) or any entity controlling, controlled by or under common control with such investment adviser that provides ongoing services to the registrant (“Adviser Affiliates”), if the engagement relates directly to the operations and financial reporting of the registrant.
The Audit Committee has adopted a Policy for Engagement of Independent Accountants for Audit and Non-Audit Services (“Policy”). The Po licy sets forth the understanding of the Audit Committee regarding the engagement of the registrant’s independent accountants to provide (i) audit and permissible audit-related, tax and other services to the registrant (collectively “Fund Services”); (ii) non-audit services to the registrant’s investment adviser (not including any sub-adviser whose role is primarily portfolio management and is subcontracted with or overseen by another investment adviser) and Adviser Affiliates, if the engagement relates directly to the operations or financial reporting of a Fund (collectively “Fund-related Adviser Services”); and (iii)
certain other audit and non-audit services to the registrant’s investment adviser (not including any sub-adviser whose role is primarily portfolio management and is subcontracted with or overseen by another investment adviser) and Adviser Affiliates. Unless a type of service receives general pre-approval under the Policy, it requires specific pre-approval by the Audit Committee if it is to be provided by the independent accountants. Pre-approval of non-audit services to the registrant, the registrant’s investment adviser (not including any sub-adviser whose role is primarily portfolio management and is subcontracted with or overseen by another investment adviser) and Adviser Affiliates may be waived provided that the “de minimis” requirements set forth under paragraph (c)(7)(i)(C) of Rule 2-01 of Regulation S-X are met.
Under the Policy, the Audit Committee may delegate pre-approval authority to any pre-designated member or members who are Independent Trustees/Directors. The member(s) to whom such authority is delegated must report, for informational purposes only, any pre-approval decisions to the Audit Committee at its next regular meeting. The Audit Committee’s responsibilities with respect to the pre-approval of services performed by the independent accountants may not be delegated to management.
The Policy requires the Fund Treasurer and/or Director of Board Administration to submit to the Audit Committee, on an annual basis, a schedule of the types of services that are subject to general pre-approval. The schedule(s) provide a description of each type of service that is subject to general pre-approval and, where possible, will provide estimated fee caps for each instance of providing each service. The Audit Committees will review and approve the types of services and review the projected fees for the next fiscal year and may add to, or subtract from, the list of general pre-approved services from time to time based on subsequent determinations. That approval acknowledges that the Audit Committee is in agreement with the specific types of services that the independent accountants will be permitted to perform.
The Fund Treasurer and/or Director of Board Administration shall report to the Audit Committee at each of its regular meetings regarding all Fund Services or Fund-related Adviser Services initiated since the last such report was rendered, including a general description of the services, actual billed and projected fees, and the means by which such Fund Services or Fund-related Adviser Services were pre-approved by the Audit Committee.
*****
(e)(2) The percentage of services described in paragraphs (b) through (d) of this Item approved pursuant to the “de minimis” exception under paragraph (c)(7)(i)(C) of Rule 2-01 of Regulation S-X during both fiscal years ended April 30, 2007 and April 30, 2006 was zero.
(f) Not applicable.
(g) The aggregate non-audit fees billed by the registrant’s accountant for services rendered to the registrant, and rendered to the registrant’s investment adviser (not including any sub-adviser whose role is primarily portfolio management and is subcontracted with or overseen by another investment adviser), and any entity controlling, controlled by, or under common control with the adviser that provides ongoing services to the registrant for the fiscal years ended April 30, 2007 and April 30, 2006 are approximately as follows:
2007 | | 2006 | |
$ | 873,800 | | $ | 383,900 | |
| | | | | |
(h) The registrant’s Audit Committee of the Board of Directors has considered whether the provision of non-audit services that were rendered to the registrant’s adviser (not including any sub-adviser whose role is primarily portfolio management and is subcontracted with or overseen by another investment adviser), and any entity controlling, controlled by, or under common control with the investment adviser that provides ongoing services to the registrant that were not pre-approved pursuant to paragraph (c)(7)(ii) of Rule 2-01 of Regulation S-X, is compatible with maintaining the principal accountant’s independence.
Item 5. Audit Committee of Listed Registrants.
Not applicable.
Item 6. Schedule of Investments
The registrant’s “Schedule I – Investments in securities of unaffiliated issuers” (as set forth in 17 CFR 210.12-12) is included in Item 1 of this Form N-CSR.
Item 7. Disclosure of Proxy Voting Policies and Procedures for Closed-End Management Investment Companies.
Not applicable.
Item 8. Portfolio Managers of Closed-End Management Investment Companies.
Not applicable.
Item 9. Purchases of Equity Securities by Closed-End Management Investment Company and Affiliated Purchasers.
Not applicable.
Item 10. Submission of Matters to a Vote of Security Holders.
There have not been any material changes to the procedures by which shareholders may recommend nominees to the registrant’s board of directors, since those procedures were last disclosed in response to requirements of Item 7(d)(2)(ii)(G) of Schedule 14A or this Item.
Item 11. Controls and Procedures.
(a) The registrant’s principal executive officer and principal financial officers, based on their evaluation of the registrant’s disclosure controls and procedures as of a date within 90 days of the filing of this report, have concluded that such controls and procedures are adequately designed to ensure that information required to be disclosed by the registrant in Form N-CSR is accumulated and communicated to the registrant’s management, including the principal executive officer and principal financial officer, or persons performing similar functions, as appropriate to allow timely decisions regarding required disclosure.
(b) There was no change in the registrant’s internal control over financial reporting that occurred during the registrant’s second fiscal quarter of the period covered by this report that has materially affected, or is reasonably likely to materially affect, the registrant’s internal control over financial reporting.
Item 12. Exhibits.
(a)(1) Code of ethics required to be disclosed under Item 2 of Form N-CSR attached hereto as Exhibit 99.CODE ETH.
(a)(2) Certifications pursuant to Rule 30a-2(a) under the Investment Company Act of 1940 (17 CFR 270.30a-2(a)) attached hereto as Exhibit 99.CERT.
(a)(3) Not applicable.
(b) Certification pursuant to Rule 30a-2(b) under the Investment Company Act of 1940 (17 CFR 270.30a-2(b)) attached hereto as Exhibit 99.906CERT.
SIGNATURES
Pursuant to the requirements of the Securities Exchange Act of 1934 and the Investment Company Act of 1940, the registrant has duly caused this report to be signed on its behalf by the undersigned, thereunto duly authorized.
(registrant) | | | Columbia Funds Series Trust I | |
| | | |
| | | |
By (Signature and Title) | | /s/ Christopher L. Wilson | |
| | Christopher L. Wilson, President | |
| | | |
| | | |
Date | | June 25, 2007 | |
| | | |
| | | |
Pursuant to the requirements of the Securities Exchange Act of 1934 and the Investment Company Act of 1940, this report has been signed below by the following persons on behalf of the registrant and in the capacities and on the dates indicated. |
| | | |
| | | |
By (Signature and Title) | | /s/ Christopher L. Wilson | |
| | Christopher L. Wilson, President | |
| | | |
| | | |
Date | | | June 25, 2007 | |
| | | |
| | | |
By (Signature and Title) | | /s/ J. Kevin Connaughton | |
| | J. Kevin Connaughton, Treasurer | |
| | | |
| | | |
Date | | | June 25, 2007 | |
| | | | | | | |