UNITED STATES
SECURITIES AND EXCHANGE COMMISSION
Washington, D.C. 20549
FORM N-CSR
CERTIFIED SHAREHOLDER REPORT OF REGISTERED
MANAGEMENT INVESTMENT COMPANIES
Investment Company Act file number | 811-4367 |
|
Columbia Funds Series Trust I |
(Exact name of registrant as specified in charter) |
|
One Financial Center, Boston, Massachusetts | | 02111 |
(Address of principal executive offices) | | (Zip code) |
|
James R. Bordewick, Jr., Esq. Columbia Management Advisors, LLC One Financial Center Boston, MA 02111 |
(Name and address of agent for service) |
|
Registrant’s telephone number, including area code: | 1-617-426-3750 | |
|
Date of fiscal year end: | August 31, 2007 | |
|
Date of reporting period: | August 31, 2007 | |
| | | | | | | | |
Form N-CSR is to be used by management investment companies to file reports with the Commission not later than 10 days after the transmission to stockholders of any report that is required to be transmitted to stockholders under Rule 30e-1 under the Investment Company Act of 1940 (17 CFR 270.30e-1). The Commission may use the information provided on Form N-CSR in its regulatory, disclosure review, inspection, and policymaking roles.
A registrant is required to disclose the information specified by Form N-CSR, and the Commission will make this information public. A registrant is not required to respond to the collection of information contained in Form N-CSR unless the Form displays a currently valid Office of Management and Budget (“OMB”) control number. Please direct comments concerning the accuracy of the information collection burden estimate and any suggestions for reducing the burden to Secretary, Securities and Exchange Commission, 450 Fifth Street, NW, Washington, DC 20549-0609. The OMB has reviewed this collection of information under the clearance requirements of 44 U.S.C. § 3507.
Item 1. Reports to Stockholders.
Columbia Management®
Columbia Funds
Annual Report – August 31, 2007
g Columbia International Stock Fund
g Columbia Mid Cap Growth Fund
g Columbia Small Cap Growth Fund I
g Columbia Real Estate Equity Fund
g Columbia Technology Fund
g Columbia Strategic Investor Fund
g Columbia Balanced Fund
g Columbia Oregon Intermediate Municipal Bond Fund
g Columbia Conservative High Yield Fund
NOT FDIC INSURED
NOT BANK ISSUED
May Lose Value
No Bank Guarantee
Table of Contents
| Economic Update | | | 1 | | |
|
| Columbia International Stock Fund | | | 2 | | |
|
| Columbia Mid Cap Growth Fund | | | 7 | | |
|
| Columbia Small Cap Growth Fund I | | | 12 | | |
|
| Columbia Real Estate Equity Fund | | | 17 | | |
|
| Columbia Technology Fund | | | 22 | | |
|
| Columbia Strategic Investor Fund | | | 27 | | |
|
| Columbia Balanced Fund | | | 32 | | |
|
Columbia Oregon Intermediate
Municipal Bond Fund | | | 37 | | |
|
Columbia Conservative
High Yield Fund | | | 42 | | |
|
| Financial Statements | | | 47 | | |
|
| Investment Portfolios | | | 48 | | |
|
Statements of Assets and
Liabilities | | | 96 | | |
|
| Statements of Operations | | | 100 | | |
|
Statements of Changes in
Net Assets | | | 104 | | |
|
| Financial Highlights | | | 117 | | |
|
| Notes to Financial Statements | | | 155 | | |
|
Report of Independent Registered
Public Accounting Firm | | | 173 | | |
|
| Unaudited Information | | | 174 | | |
|
| Fund Governance | | | 175 | | |
|
Important Information About
This Report | | | 181 | | |
|
The views expressed in this report reflect the current views of the respective parties. These views are not guarantees of future performance and involve certain risks, uncertainties and assumptions that are difficult to predict so actual outcomes and results may differ significantly from the views expressed. These views are subject to change at any time based upon economic, market or other conditions and the respective parties disclaim any responsibility to update such views. These views may not be relied on as investment advice and, because investment decisions for a Columbia Fund are based on numerous factors, may not be relied on as an indication of trading intent on behalf of any particular Columbia Fund. References to specific securities should not be construed as a recommendation or investment advice.
President's Message

Dear Shareholder:
Every six months, you receive a shareholder report for your Columbia Funds investment. We strive to bring you the information you need to make intelligent, informed investment decisions, in an attractive, easy-to-understand format.
We know that for many investors the information contained in shareholder reports can seem very technical, so we would like to take this opportunity to walk you through some of the sections in the beginning of your shareholder report, explain their purpose and point out some of the highlights we think you'll find useful. In future reports, we will discuss how to use the financial statements in your shareholder reports.
Performance Information
One of the first sections in your shareholder report is the Performance Information section, which contains several tables that illustrate how your fund has performed over time. These tables can be very useful for evaluating how your fund has performed versus its benchmark, though it's important to remember that past performance is not an indicator of future results.
Understanding Your Expenses
This section explains the ongoing costs associated with your Columbia Funds investment. It includes both general information about mutual fund expenses and specific information pertinent to your fund.
You can use the information to estimate the expenses you paid over the reporting period. You will need your account balance at the end of the period, which can be found by checking your most recent account statement, logging onto your account at www.columbiafunds.com, calling our service center at 800.345.6611 or contacting your financial advisor. Once you have your balance, the section explains how to calculate your estimated expenses step by step.
Portfolio Manager's Report
The Portfolio Manager's Report is where you will find your portfolio manager's thoughts on what happened during the reporting period. Commentary from your portfolio manager(s) includes a summary of the fund's performance, along with a comparison of the fund's performance versus the relevant peer group and benchmark indices.
The portfolio manager will also discuss market conditions that impacted the fund, as well as the investment strategy during the period. Please note: In semiannual reports, the portfolio manager's comments are included in the Fund Profile section.
Other Information
Every shareholder report includes a page containing "Important Information About This Report," which includes instructions for requesting additional copies of the shareholder report, as well as contact information for the fund's Transfer Agent, Distributor and Investment Advisor.
Annual reports contain additional information, such as an independent registered public accounting firm's report and biographies of the fund's trustees and officers. This information is not included in semiannual reports.
Shareholder reports can be delivered to you electronically through our eDelivery service. Using eDelivery can help your fund save money while at the same time preserve precious natural resources. For even more information about your fund, visit our web site at www.columbiafunds.com. There you will find prospectuses, shareholder reports and fund fact sheets for the funds in the Columbia Funds family.
We hope this guide to your shareholder report will help you get the most out of this important resource. Thank you for your business, and for your continued confidence in Columbia Funds.
Sincerely,

Christopher L. Wilson
President, Columbia Funds
Economic Update – Columbia Funds
Despite an uptick early in 2007, the US economy experienced subpar growth for most of the 12-month period that began September 1, 2006 and ended August 31, 2007. An already fragile housing sector struggled to withstand turmoil in the subprime mortgage market, which issues loans to homebuyers with questionable credit records and/or little money for down payments. Rising delinquencies and foreclosures put additional pressure on home sales and triggered a credit crunch that reverberated through global markets. Rising energy prices pinched household budgets, and higher industrial metals prices drove up manufacturing costs. Job growth sagged during the early summer months. Consumer spending growth tracked lower in the final months of the period, and consumer confidence retreated from a six-year high. Despite the disappointments, gross domestic product is expected to advance approximately 2.3% for the second half of 2007—a respec table pace, even if it is somewhat below average.
In mid-August, the Federal Reserve Board (the Fed) stepped in to quiet the credit markets with a cut to its primary discount rate—the rate at which the Fed loans money to member banks. As the period ended, the Fed was expected to cut another key short-term rate—the federal funds rate—to further loosen the reins on credit and inspire confidence, both at home and abroad.1
Despite volatility, stocks advanced broadly
Against a shifting economic backdrop, corporate profits were better than expected in the first half of 2007 and the US stock market staged a broad rally that took all major stock market averages higher for the 12-month period. However, the volatility that rocked the credit markets midway through the summer spilled over to the stock market and claimed some of its earlier gains. The S&P 500 Index returned 15.13%. Large- and mid-cap stocks outperformed small-cap stocks, as measured by their respective Russell indices. Growth stocks outperformed value stocks by a significant margin.
Stock markets outside the US did even better, as measured by the MSCI EAFE Index, which gained 18.71% for the period. Emerging stock markets, both collectively and individually, were the top performers. The MSCI China Index rose 102.73% as demand for exports as well as domestic infrastructure expansion continued.
Bonds delivered respectable gains
The US bond market seesawed during the 12-month period. Early in the period, as investors anticipated a Fed rate cut, bond prices rose and yields declined across the maturity spectrum. However, a rate cut became less likely when the economy perked up in the second quarter of 2007, sending bond prices lower while yields rose. Then, in the final months of the period, yields fell and higher quality bond prices rose as investors retreated from riskier investments to the safety of the US Treasury market. The benchmark 10-year US Treasury yield ended the period at 4.53%, which was lower than a year ago. In this environment, the Lehman Brothers U.S. Aggregate Bond Index returned a respectable 5.26%. High-yield bonds continued to lead the fixed-income markets. However, their gains were cut short near the end of the period. The Merrill Lynch U.S. High Yield, Cash Pay Index returned 6.45%.
1On September 18, 2007, the Fed lowered the federal funds rate by one half a percent to 4.75%, and further reduced the discount rate to 5.25%.
Summary
For the 12-month period that ended August 31, 2007
g The broad US stock market, as measured by the S&P 500 Index, returned 15.13%. Stock markets outside the United States were even stronger, as measured by the MSCI EAFE Index.
| S&P Index | | MSCI Index | |
|
 | |  | |
|
g Despite volatility, the Lehman Brothers U.S. Aggregate Bond Index delivered a respectable return. High-yield bonds, as measured by the Merrill Lynch U.S. High Yield, Cash Pay Index, led the US fixed-income markets.
Lehman
Index | | Merrill
Lynch Index | |
|
 | |  | |
|
The S&P 500 Index tracks the performance of 500 widely held, large-capitalization US stocks.
The Morgan Stanley Capital International (MSCI) Europe, Australasia, Far East (EAFE) Index is a free float-adjusted market capitalization index that is designed to measure developed market equity performance, excluding the US and Canada.
The Lehman Brothers U.S. Aggregate Bond Index is a market value-weighted index that tracks the daily price, coupon, pay-downs, and total return performance of fixed-rate, publicly placed, dollar denominated, and non-convertible investment grade debt issues with at least $250 million par amount outstanding and with at least one year to final maturity.
The Merrill Lynch U.S. High Yield, Cash Pay Index tracks the performance of non-investment-grade corporate bonds.
Indices are not investments, do not incur fees or expenses and are not professionally managed. It is not possible to invest directly in an index.
1
Fund Profile – Columbia International Stock Fund
Performance data quoted represents past performance and current performance may be lower or higher. Past performance is no guarantee of future results. The investment return and principal value will fluctuate so that shares, when redeemed, may be worth more or less than the original cost. Please visit www.columbiafunds.com for daily and most recent month-end performance updates.
Summary
1 year return as of 08/31/07
| | +18.46% | |
|
 | | Class A shares
(without sales charge) | |
|
| | +18.71% | |
|
 | | MSCI EAFE Index | |
|
| | +23.00% | |
|
 | | MSCI All Country
World ex U.S. Index | |
|
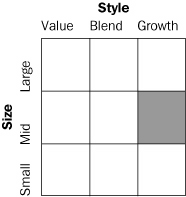
Morningstar Style Box

Summary
g For the 12-month period that ended August 31, 2007, the fund's Class A shares returned 18.46% without sales charge.
g The fund performed in line with its benchmark, the MSCI EAFE Index, but fell short of its other benchmark, the MSCI All Country World ex U.S. Index.1
g Investments in China and Germany had the biggest positive impact on return. An overweight in energy detracted from performance.
Portfolio Management
Fred Copper, lead manager of the fund, has managed or co-managed the fund since October 2005 and has been with the advisor, or its predecessors or affiliate organizations since 2005.
Jasmine (Weili) Huang has co-managed the fund since May 2006 and has been with the advisor, or its predecessors or affiliate organizations since 2003.
Timothy R. Anderson has co-managed the fund since May 2006 and has been with the advisor since 2006.
Paul J. DiGiacomo has co-managed the fund since May 2006 and has been with the advisor since 2006.
Daisuke Nomoto has co-managed the fund since May 2006 and has been with the advisor, or its predecessors or affiliate organizations since 2005.
1The Morgan Stanley Capital International (MSCI) Europe, Australasia, Far East (EAFE) Index is a free float-adjusted market capitalization index that is designed to measure developed market equity performance, excluding the US and Canada. The MSCI All Country (AC) World ex U.S. Index is an index of global stock market performance that includes developed and emerging markets but excludes the US. Indices are not investments, do not incur fees or expenses and are not professionally managed. It is not possible to invest directly in an index. Securities in the fund may not match those in an index.
The Morningstar Style BoxTM reveals a fund's investment strategy. For equity funds the vertical axis shows the market capitalization of the stocks owned and the horizontal axis shows a fund's investment style (value, blend or growth). For fixed-income funds the vertical axis shows the average credit quality of the bonds owned, and the horizontal axis shows interest rate sensitivity as measured by a bond's duration (short, intermediate or long). All of these numbers are drawn from the data most recently provided by the fund and entered into Morningstar's database as of month-end. Although the data is gathered from reliable sources, Morningstar cannot guarantee completeness and accuracy. Information shown is as of 08/31/2007.
2
Performance Information – Columbia International Stock Fund
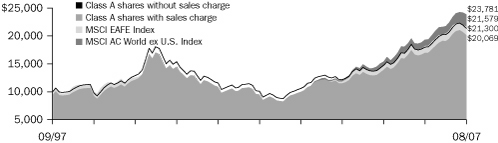
Growth of a $10,000 investment 09/01/97 – 08/31/07
The chart above shows the growth in value of a hypothetical $10,000 investment in Class A shares of Columbia International Stock Fund during the stated time period, and does not reflect the deduction of taxes that a shareholder may pay on fund distributions or the redemption of fund shares. The Morgan Stanley Capital International (MSCI) Europe, Australasia, Far East (EAFE) Index is a free float-adjusted market capitalization index that is designed to measure developed market equity performance, excluding the US and Canada. The MSCI All Country (AC) World ex U.S. Index is an index of global stock market performance that includes developed and emerging markets but excludes the US. Indices are not investments, do not incur fees or expenses and are not professionally managed. It is not possible to invest directly in an index. Securities in the fund may not match those in an index.
Performance of a $10,000 investment 09/01/97 – 08/31/07 ($)
| Sales charge | | without | | with | |
| Class A | | | 21,300 | | | | 20,069 | | |
| Class B | | | 20,492 | | | | 20,492 | | |
| Class C | | | 20,576 | | | | 20,576 | | |
| Class Z | | | 21,723 | | | | n/a | | |
Average annual total return as of 08/31/07 (%)
| Share class | | A | | B | | C | | Z | |
| Inception | | 11/01/02 | | 11/01/02 | | 10/13/03 | | 10/01/92 | |
| Sales charge | | without | | with | | without | | with | | without | | with | | without | |
| 1-year | | | 18.46 | | | | 11.65 | | | | 17.54 | | | | 12.54 | | | | 17.59 | | | | 16.59 | | | | 18.73 | | |
| 5-year | | | 16.11 | | | | 14.75 | | | | 15.22 | | | | 14.99 | | | | 15.31 | | | | 15.31 | | | | 16.57 | | |
| 10-year | | | 7.85 | | | | 7.21 | | | | 7.44 | | | | 7.44 | | | | 7.48 | | | | 7.48 | | | | 8.07 | | |
Average annual total return as of 09/30/07 (%)
| Share class | | A | | B | | C | | Z | |
| Sales charge | | without | | with | | without | | with | | without | | with | | without | |
| 1-year | | | 24.57 | | | | 17.40 | | | | 23.60 | | | | 18.60 | | | | 23.61 | | | | 22.61 | | | | 24.92 | | |
| 5-year | | | 19.87 | | | | 18.47 | | | | 18.93 | | | | 18.73 | | | | 19.03 | | | | 19.03 | | | | 20.36 | | |
| 10-year | | | 7.69 | | | | 7.06 | | | | 7.27 | | | | 7.27 | | | | 7.31 | | | | 7.31 | | | | 7.91 | | |
The "with sales charge" returns include the maximum initial sales charge of 5.75% for Class A shares, the applicable contingent deferred sales charge of 5.00% in the first year, declining to 1.00% in the sixth year, and eliminated thereafter for Class B shares and 1.00% for Class C shares for the first year only. The "without sales charge" returns do not include the effect of sales charges. If they had, returns would have been lower.
Performance results reflect any waivers or reimbursements of fund expenses by the investment advisor and/or any of its affiliates. Absent these waivers or reimbursement arrangements, performance results would have been lower.
All results shown assume reinvestment of distributions. Class Z shares are sold at net asset value with no Rule 12b-1 fees. Class Z shares have limited eligibility and the investment minimum requirements may vary. Please see the fund's prospectus for details. Performance for different share classes will vary based on differences in sales charges and fees associated with each class.
The tables do not reflect the deduction of taxes that a shareholder may pay on fund distributions or the redemption of fund shares.
Classes A and B share performance information includes returns of the fund's Class Z shares (the oldest existing fund class) for periods prior to the inception of the newer class shares. The returns for Class C include the returns of Class B prior to 10/13/03, the date on which Class C was initially offered by the fund. The returns shown for Class C also include the performance of Class Z prior to the inception of Class B (11/01/02). Class Z share returns are not restated to reflect any expense differential (such as Rule 12b-1 fees) between Class Z shares and the newer class shares. Had the expense differential been reflected, the returns for the periods prior to the inception of Classes A, B, and C would have been lower.
Performance data quoted represents past performance and current performance may be lower or higher. Past performance is no guarantee of future results. The investment return and principal value will fluctuate so that shares, when redeemed, may be worth more or less than the original cost. Please visit www.columbiafunds.com for daily and most recent month-end performance updates.
Annual operating expense ratio (%)*
| Class A | | | 1.34 | | |
| Class B | | | 2.09 | | |
| Class C | | | 2.09 | | |
| Class Z | | | 1.09 | | |
*The annual operating expense ratio is as stated in the fund's prospectus that is current as of the date of this report. Differences in expense ratios disclosed elsewhere in this report may result from including fee waivers and reimbursements as well as different time periods used in calculating the ratios.
3
Understanding Your Expenses – Columbia International Stock Fund
Estimating your actual expenses
To estimate the expenses that you paid over the period, first you will need your account balance at the end of the period:
g For shareholders who receive their account statements from Columbia Management Services, Inc., your account balance is available online at www.columbiafunds.com or by calling Shareholder Services at 800.345.6611.
g For shareholders who receive their account statements from their brokerage firm, contact your brokerage firm to obtain your account balance.
1. Divide your ending account balance by $1,000.00. For example, if an account balance was $8,600.00 at the end of the period, the result would be 8.6.
2. In the section of the table below titled "Expenses paid during the period," locate the amount for your share class. You will find this number in the column labeled "actual." Multiply this number by the result from step 1. Your answer is an estimate of the expenses you paid on your account during the period.
A minimum account balance fee of $20 that is charged once per year may be assessed if the value of your account falls below the minimum initial investment applicable to you. This fee is not included in the accompanying table. If you are subject to the fee, keep it in mind when you are estimating the ongoing expenses of investing in the fund and when comparing the expenses of this fund with other funds.
As a fund shareholder, you incur two types of costs. There are transaction costs, which generally include sales charges on purchases and may include redemption or exchange fees. There are also ongoing costs, which generally include investment advisory fees, Rule 12b-1 fees and other fund expenses. The information on this page is intended to help you understand the ongoing costs of investing in the fund and to compare these costs with the ongoing costs of investing in other mutual funds.
Analyzing your fund's expenses by share class
To illustrate these ongoing costs, we have provided an example and calculated the expenses paid by investors in each share class during the period. The information in the following table is based on an initial investment of $1,000.00, which is invested at the beginning of the reporting period and held for the entire period. Expense information is calculated two ways and each method provides you with different information. The amount listed in the "actual" column is calculated using the fund's actual operating expenses and total return for the period. The amount listed in the "hypothetical" column for each share class assumes that the return each year is 5% before expenses and is calculated based on the fund's actual operating expenses. You should not use the hypothetical account values and expenses to estimate either your actual account balance at the end of the period or the expenses you paid during this reporting period.
Compare with other funds
Since all mutual funds are required to include the same hypothetical calculations about expenses in shareholder reports, you can use this information to compare the ongoing costs of investing in the fund with other funds. To do so, compare the 5% hypothetical example with the 5% hypothetical examples that appear in the shareholder reports of other funds. As you compare hypothetical examples of other funds, it is important to note that hypothetical examples are meant to highlight the ongoing costs of investing in a fund and do not reflect any transaction costs, such as sales charges, redemption fees or exchange fees.
03/01/07 – 08/31/07
| | | Account value at the
beginning of the period ($) | | Account value at the
end of the period ($) | | Expenses paid
during the period ($) | | Fund's annualized
expense ratio (%) | |
| | | Actual | | Hypothetical | | Actual | | Hypothetical | | Actual | | Hypothetical | | Actual | |
| Class A | | | 1,000.00 | | | | 1,000.00 | | | | 1,055.10 | | | | 1,018.90 | | | | 6.47 | | | | 6.36 | | | | 1.25 | | |
| Class B | | | 1,000.00 | | | | 1,000.00 | | | | 1,050.92 | | | | 1,015.12 | | | | 10.34 | | | | 10.16 | | | | 2.00 | | |
| Class C | | | 1,000.00 | | | | 1,000.00 | | | | 1,051.22 | | | | 1,015.12 | | | | 10.34 | | | | 10.16 | | | | 2.00 | | |
| Class Z | | | 1,000.00 | | | | 1,000.00 | | | | 1,056.31 | | | | 1,020.16 | | | | 5.18 | | | | 5.09 | | | | 1.00 | | |
Expenses paid during the period are equal to the annualized expense ratio for the share class, multiplied by the average account value over the period, then multiplied by the number of days in the fund's most recent fiscal half-year and divided by 365.
Had the investment advisor and/or any of its affiliates not waived or reimbursed a portion of expenses, account value at the end of the period would have been reduced.
It is important to note that the expense amounts shown in the table are meant to highlight only ongoing costs of investing in the fund and do not reflect any transaction costs, such as sales charges, redemption fees or exchange fees. Therefore, the hypothetical examples provided may not help you determine the relative total costs of owning shares of different funds. If these transaction costs were included, your costs would have been higher.
4
Portfolio Managers' Report – Columbia International Stock Fund
For the 12-month period that ended August 31, 2007, Columbia International Stock Fund Class A shares returned 18.46% without sales charge. The fund's return was in line with the 18.71% return of its benchmark, the MSCI EAFE Index, and less than the 23.00% return of its other benchmark, the MSCI All Country World ex U.S. Index.1 It was less than the 19.29% average return of its peer group, the Morningstar Foreign Large Blend Funds Category.2 The fund's exposure to China and Germany drove the fund's positive performance. An underweight in Australia, a market that rose substantially because of the global demand for raw materials, detracted from results.
Companies tied to global growth were portfolio leaders
Over the period, we favored companies that we believed would benefit from global economic growth and the massive infrastructure development in the emerging markets. In China, two of the biggest contributors to performance were Yanzhou Coal Mining Co., Ltd. and China Mobile Ltd., the country's biggest telecommunications company. The stocks of both companies rose because of robust demand for their products.
An emphasis on Germany, one of the best-performing markets, also contributed substantially to return. After implementing more market friendly policies over the past couple of years, Germany has become a leading global competitor, and many of its engineering and technology companies are at the heart of an infrastructure development and capital spending boom taking place throughout the world. Individual stocks in Europe that aided results included: Volvo AB, a manufacturer of trucks and earth-moving equipment; Salzgitter AG, a German steel company, which benefited from a run-up in steel prices and from the spin off of one of its subsidiaries; and JM AB, a Swedish homebuilder that was buoyed by rising prices in a strong housing market.
The US subprime mortgage problem had a ripple effect in Europe
Early in the period, we used the market volatility that was triggered by problems in the US subprime mortgage market to invest in certain European banks that had declined but that had little exposure to subprime mortgages. In August, market volatility increased when it appeared that the subprime mortgage debacle would lead to a credit crunch in which consumers and businesses would have difficulty obtaining bank loans. Because investors became concerned that tighter credit policies would lead to a slowdown in global economic growth, they sold riskier and more cyclically oriented stocks. As a result, some of the portfolio's European banks lost value. We continue to hold these stocks, because we believe their long-term prospects are attractive.
Despite rising energy prices, the energy sector underperformed the other benchmark sectors during the period and the fund lost ground relative to the indices because of
1The Morgan Stanley Capital International (MSCI) Europe, Australasia, Far East (EAFE) Index is a free float-adjusted market capitalization index that is designed to measure developed market equity performance, excluding the US and Canada. The MSCI All Country (AC) World ex U.S. Index is an index of global stock market performance that includes developed and emerging markets but excludes the US. Indices are not investments, do not incur fees or expenses and are not professionally managed. It is not possible to invest directly in an index. Securities in the fund may not match those in an index.
2©2007 by Morningstar, Inc. All rights reserved. The information contained herein is the proprietary information of Morningstar, Inc., may not be copied or redistributed for any purpose and may only be used for non-commercial, personal purposes. The information contained herein is not represented or warranted to be accurate, correct, complete or timely. Morningstar, Inc. shall not be responsible for investment decisions, damages or other losses resulting from the use of this information. Past performance is no guarantee of future performance. Morningstar, Inc. has not granted consent for it to be considered or deemed an "expert" under the Securities Act of 1933. Morningstar Categories compare the performance of funds with similar investment objectives and strategies.
Performance data quoted represents past performance and current performance may be lower or higher. Past performance is no guarantee of future results. The investment return and principal value will fluctuate so that shares, when redeemed, may be worth more or less than the original cost. Please visit www.columbiafunds.com for daily and most recent month-end performance updates.
Net asset value per share
as of 08/31/07 ($)
| Class A | | | 19.93 | | |
| Class B | | | 19.40 | | |
| Class C | | | 19.49 | | |
| Class Z | | | 20.09 | | |
Distributions declared per share
09/01/06 – 08/31/07 ($)
| Class A | | | 2.26 | | |
| Class B | | | 2.12 | | |
| Class C | | | 2.12 | | |
| Class Z | | | 2.31 | | |
5
Portfolio Managers' Report (continued) – Columbia International Stock Fund
Top 5 countries
as of 08/31/07 (%)
| Japan | | | 21.3 | | |
| United Kingdom | | | 13.3 | | |
| Germany | | | 10.1 | | |
| France | | | 8.7 | | |
| Switzerland | | | 8.6 | | |
Top 10 holdings
as of 08/31/07 (%)
| Total SA | | | 2.1 | | |
| Nokia Oyj | | | 2.0 | | |
| Novartis AG | | | 1.9 | | |
| BASF AG | | | 1.8 | | |
| Banco Santander SA | | | 1.8 | | |
| E. On AG | | | 1.8 | | |
Banco Bilbao Vizcaya
Argentaria SA | | | 1.6 | | |
| BNP Paribas | | | 1.5 | | |
| Credit Suisse Group | | | 1.4 | | |
| Barclays PLC | | | 1.4 | | |
Holdings discussed in this report
as of 08/31/07 (%)
| Yanzhou Coal Mining Co., Ltd. | | | 0.7 | | |
| China Mobile Ltd. | | | 0.7 | | |
| Volvo AB | | | 0.7 | | |
| Salzgitter AG | | | 1.2 | | |
| JM AB | | | 0.3 | | |
| Randstad Holding NV | | | 0.9 | �� | |
Your fund is actively managed and the composition of its portfolio will change over time. Information provided is calculated as a percentage of net assets.
its overweight in energy. However, the portfolio's individual energy stocks delivered solid returns. Individual stocks that detracted from performance included PartyGaming PLC, a UK-based on-line poker company. After the United States passed legislation that prohibits financial institutions from processing on-line gaming transactions, PartyGaming's revenues declined about 70%. We sold the stock. Randstad Holding NV, a temporary employment agency headquartered in the Netherlands, was also disappointing because of a slowdown in business in the United States and in Germany. Randstad Holding NV remains in the portfolio.
The global environment for stocks appears attractive
Looking ahead, we have a favorable opinion regarding the global backdrop for stocks. Interest rates, though rising, are relatively low and inflation appears contained, which bodes well for monetary policies. We believe that global growth has the potential to remain relatively strong. We are carefully monitoring events in France. The new government was elected on a labor reform platform, and we believe that France could be a source of attractive opportunities should the government implement market friendly policies similar to those instituted in Germany. We also believe that the build-out of the infrastructure in the emerging markets is likely to continue to be a theme in the portfolio.
Portfolio holdings and characteristics are subject to change and may not be representative of current holdings and characteristics. The outlook for the fund may differ from that presented for other Columbia Funds.
Equity investments are affected by stock market fluctuations that occur in response to economic and business developments.
International investing may involve certain risks, including foreign taxation, currency fluctuations, risks associated with possible differences in financial standards and other monetary and political risks. Investing in emerging markets may involve greater risks than investing in more developed countries. In addition, concentration of investments in a single region may result in greater volatility.
6
Fund Profile – Columbia Mid Cap Growth Fund
Summary
g For the 12-month period that ended August 31, 2007, the fund's Class A shares returned 21.24% without sales charge.
g The fund outperformed both of its benchmarks, the Russell Midcap Growth Index and the Russell Midcap Index,1 and its return was higher than the average return of its peer group, the Morningstar Mid Cap Growth Category.2
g Strong stock selection in all areas drove the fund's performance. Holdings in the telecommunications and industrials sectors provided an additional boost to returns, as did an emphasis on energy stocks.
Portfolio Management
Wayne M. Collette has co-managed the fund since February 2006 and has been with the advisor, or its predecessors or affiliate organizations since 2001.
George J. Myers has co-managed the fund since February 2006 and has been with the advisor, or its predecessors or affiliate organizations since 2004.
1The Russell Midcap Growth Index measures the performance of those Russell Midcap companies with higher price-to-book ratios and higher forecasted growth values. The Russell Midcap Index measures the performance of the 800 smallest companies in the Russell 1000 Index, as ranked by total market capitalization. Indices are not investments, do not incur fees or expenses and are not professionally managed. It is not possible to invest directly in an index. Securities in the fund may not match those in an index.
2©2007 by Morningstar, Inc. All rights reserved. The information contained herein is the proprietary information of Morningstar, Inc., may not be copied or redistributed for any purpose and may only be used for noncommercial, personal purposes. The information contained herein is not represented or warranted to be accurate, correct, complete or timely. Morningstar, Inc. shall not be responsible for investment decisions, damages or other losses resulting from the use of this information. Past performance is no guarantee of future performance. Morningstar, Inc. has not granted consent for it to be considered or deemed an "expert" under the Securities Act of 1933. Morningstar Categories compare the performance of funds with similar investment objectives and strategies.
The Morningstar Style BoxTM reveals a fund's investment strategy. For equity funds the vertical axis shows the market capitalization of the stocks owned and the horizontal axis shows a fund's investment style (value, blend or growth). For fixed-income funds the vertical axis shows the average credit quality of the bonds owned, and the horizontal axis shows interest rate sensitivity as measured by a bond's duration (short, intermediate or long). All of these numbers are drawn from the data most recently provided by the fund and entered into Morningstar's database as of month-end. Although the data is gathered from reliable sources, Morningstar cannot guarantee completeness and accuracy. Information shown is as of 08/31/2007.
Performance data quoted represents past performance and current performance may be lower or higher. Past performance is no guarantee of future results. The investment return and principal value will fluctuate so that shares, when redeemed, may be worth more or less than the original cost. Please visit www.columbiafunds.com for daily and most recent month-end performance updates.
Summary
1 year return as of 08/31/07
| | +21.24% | |
|
 | | Class A shares
(without sales charge) | |
|
| | +19.31% | |
|
 | | Russell Midcap Growth Index | |
|
| | +16.18% | |
|
 | | Russell Midcap Index | |
|
Morningstar Style Box
7
Performance Information – Columbia Mid Cap Growth Fund
Performance data quoted represents past performance and current performance may be lower or higher. Past performance is no guarantee of future results. The investment return and principal value will fluctuate so that shares, when redeemed, may be worth more or less than the original cost. Please visit www.columbiafunds.com for daily and most recent month-end performance updates.
Annual operating expense ratio (%)*
| Class A | | | 1.26 | | |
| Class B | | | 2.01 | | |
| Class C | | | 2.01 | | |
| Class R | | | 1.51 | | |
| Class T | | | 1.31 | | |
| Class Z | | | 1.01 | | |
* The annual operating expense ratio is as stated in the fund's prospectus that is current as of the date of this report. Differences in expense ratios disclosed elsewhere in this report may result from including fee waivers and reimbursements as well as different time periods used in calculating the ratios.
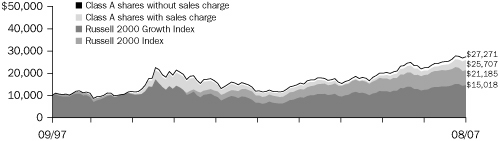
Growth of a $10,000 investment 09/01/97 – 08/31/07
The chart above shows the growth in value of a hypothetical $10,000 investment in Class A shares of Columbia Mid Cap Growth Fund during the stated time period, and does not reflect the deduction of taxes that a shareholder may pay on fund distributions or the redemption of fund shares. The Russell Midcap Growth Index measures the performance of those Russell Midcap Index companies with higher price-to-book ratios and higher forecasted growth values. The Russell Midcap Index measures the performance of the 800 smallest companies in the Russell 1000 Index, as ranked by total market capitalization. Indices are not investments, do not incur fees or expenses and are not professionally managed. It is not possible to invest directly in an index. Securities in the fund may not match those in an index.
Performance of a $10,000 investment 09/01/97 – 08/31/07 ($)
| Sales charge | | without | | with | |
| Class A | | | 21,425 | | | | 20,193 | | |
| Class B | | | 20,659 | | | | 20,659 | | |
| Class C | | | 20,703 | | | | 20,703 | | |
| Class R | | | 21,335 | | | | n/a | | |
| Class T | | | 21,439 | | | | 20,206 | | |
| Class Z | | | 21,770 | | | | n/a | | |
Average annual total return as of 08/31/07 (%)
| Share class | | A | | B | | C | | R | | T | | Z | |
| Inception | | 11/01/02 | | 11/01/02 | | 10/13/03 | | 01/23/06 | | 11/01/02 | | 11/20/85 | |
| Sales charge | | without | | with | | without | | with | | without | | with | | without | | without | | with | | without | |
| 1-year | | | 21.24 | | | | 14.27 | | | | 20.33 | | | | 15.33 | | | | 20.33 | | | | 19.33 | | | | 20.93 | | | | 21.17 | | | | 14.18 | | | | 21.49 | | |
| 5-year | | | 13.85 | | | | 12.51 | | | | 13.02 | | | | 12.77 | | | | 13.07 | | | | 13.07 | | | | 13.75 | | | | 13.86 | | | | 12.52 | | | | 14.21 | | |
| 10-year | | | 7.92 | | | | 7.28 | | | | 7.53 | | | | 7.53 | | | | 7.55 | | | | 7.55 | | | | 7.87 | | | | 7.92 | | | | 7.29 | | | | 8.09 | | |
Average annual total return as of 09/30/07 (%)
| Share class | | A | | B | | C | | R | | T | | Z | |
| Sales charge | | without | | with | | without | | with | | without | | with | | without | | without | | with | | without | |
| 1-year | | | 26.49 | | | | 19.22 | | | | 25.51 | | | | 20.51 | | | | 25.50 | | | | 24.50 | | | | 26.15 | | | | 26.41 | | | | 19.16 | | | | 26.79 | | |
| 5-year | | | 16.29 | | | | 14.92 | | | | 15.43 | | | | 15.20 | | | | 15.48 | | | | 15.48 | | | | 16.19 | | | | 16.31 | | | | 14.94 | | | | 16.67 | | |
| 10-year | | | 8.06 | | | | 7.43 | | | | 7.67 | | | | 7.67 | | | | 7.69 | | | | 7.69 | | | | 8.02 | | | | 8.07 | | | | 7.44 | | | | 8.24 | | |
The "with sales charge" returns include the maximum initial sales charge of 5.75% for Class A and T shares, the applicable contingent deferred sales charge of 5.00% in the first year, declining to 1.00% in the sixth year, and eliminated thereafter for Class B shares and 1.00% for Class C shares for the first year only. The "without sales charge" returns do not include the effect of sales charges. If they had, returns would have been lower.
Performance results reflect any waivers or reimbursements of fund expenses by the investment advisor and/or any of its affiliates. Absent these waivers or reimbursement arrangements, performance results would have been lower.
All results shown assume reinvestment of distributions. Class R shares and Class Z shares are each sold only at net asset value, and have limited eligibility and the investment minimum requirements may vary. Please see the fund's prospectus for details. Performance for different share classes will vary based on differences in sales charges and fees associated with each class.
The tables do not reflect the deduction of taxes that a shareholder may pay on fund distributions or the redemption of fund shares.
Classes A, B, and T (newer class shares) share performance information includes returns of the fund's Class Z shares (the oldest existing fund class) for periods prior to the inception of the newer class shares. The returns for Class C include the returns of Class B prior to 10/13/03, the date on which Class C was initially offered by the fund. The returns shown for Class C also include the performance of Class Z prior to the inception of Class B (11/01/02). The returns for Class R include the returns of Class A prior to 01/23/06, the date on which Class R was initially offered by the fund. The returns shown for Class R also include the performance of Class Z prior to the inception of Class A (11/01/02). If differences in expenses had been reflected, the returns would have been lower, since the Class R shares are subject to a higher Rule 12b-1 fee than Class A shares. Class Z share returns are not restated to reflect any expense differential (such as Rule 12b-1 fees) between Class Z shares and the newer class shares. Had the expense differential been reflected, the returns for the periods prior to the inception of Classes A, B, C, R, and T would have been lower.
8
Understanding Your Expenses – Columbia Mid Cap Growth Fund
As a fund shareholder, you incur two types of costs. There are transaction costs, which generally include sales charges on purchases and may include redemption or exchange fees. There are also ongoing costs, which generally include investment advisory fees, Rule 12b-1 fees and other fund expenses. The information on this page is intended to help you understand the ongoing costs of investing in the fund and to compare these costs with the ongoing costs of investing in other mutual funds.
Analyzing your fund's expenses by share class
To illustrate these ongoing costs, we have provided an example and calculated the expenses paid by investors in each share class during the period. The information in the following table is based on an initial investment of $1,000.00, which is invested at the beginning of the reporting period and held for the entire period. Expense information is calculated two ways and each method provides you with different information. The amount listed in the "actual" column is calculated using the fund's actual operating expenses and total return for the period. The amount listed in the "hypothetical" column for each share class assumes that the return each year is 5% before expenses and is calculated based on the fund's actual operating expenses. You should not use the hypothetical account values and expenses to estimate either your actual account balance at the end of the period or the expenses you paid during this reporting period.
Compare with other funds
Since all mutual funds are required to include the same hypothetical calculations about expenses in shareholder reports, you can use this information to compare the ongoing costs of investing in the fund with other funds. To do so, compare the 5% hypothetical example with the 5% hypothetical examples that appear in the shareholder reports of other funds. As you compare hypothetical examples of other funds, it is important to note that hypothetical examples are meant to highlight the ongoing costs of investing in a fund and do not reflect any transaction costs, such as sales charges, redemption fees or exchange fees.
Estimating your actual expenses
To estimate the expenses that you paid over the period, first you will need your account balance at the end of the period:
g For shareholders who receive their account statements from Columbia Management Services, Inc., your account balance is available online at www.columbiafunds.com or by calling Shareholder Services at 800.345.6611.
g For shareholders who receive their account statements from their brokerage firm, contact your brokerage firm to obtain your account balance.
1. Divide your ending account balance by $1,000.00. For example, if an account balance was $8,600.00 at the end of the period, the result would be 8.6.
2. In the section of the table below titled "Expenses paid during the period," locate the amount for your share class. You will find this number in the column labeled "actual." Multiply this number by the result from step 1. Your answer is an estimate of the expenses you paid on your account during the period.
A minimum account balance fee of $20 that is charged once per year may be assessed if the value of your account falls below the minimum initial investment applicable to you. This fee is not included in the accompanying table. If you are subject to the fee, keep it in mind when you are estimating the ongoing expenses of investing in the fund and when comparing the expenses of this fund with other funds.
03/01/07 – 08/31/07
| | | Account value at the
beginning of the period ($) | | Account value at the
end of the period ($) | | Expenses paid
during the period ($) | | Fund's annualized
expense ratio (%) | |
| | | Actual | | Hypothetical | | Actual | | Hypothetical | | Actual | | Hypothetical | | Actual | |
| Class A | | | 1,000.00 | | | | 1,000.00 | | | | 1,076.32 | | | | 1,019.26 | | | | 6.18 | | | | 6.01 | | | | 1.18 | | |
| Class B | | | 1,000.00 | | | | 1,000.00 | | | | 1,072.49 | | | | 1,015.48 | | | | 10.08 | | | | 9.80 | | | | 1.93 | | |
| Class C | | | 1,000.00 | | | | 1,000.00 | | | | 1,072.39 | | | | 1,015.48 | | | | 10.08 | | | | 9.80 | | | | 1.93 | | |
| Class R | | | 1,000.00 | | | | 1,000.00 | | | | 1,075.41 | | | | 1,018.00 | | | | 7.48 | | | | 7.27 | | | | 1.43 | | |
| Class T | | | 1,000.00 | | | | 1,000.00 | | | | 1,076.22 | | | | 1,019.00 | | | | 6.44 | | | | 6.26 | | | | 1.23 | | |
| Class Z | | | 1,000.00 | | | | 1,000.00 | | | | 1,077.88 | | | | 1,020.52 | | | | 4.87 | | | | 4.74 | | | | 0.93 | | |
Expenses paid during the period are equal to the annualized expense ratio for the share class, multiplied by the average account value over the period, then multiplied by the number of days in the fund's most recent fiscal half-year and divided by 365.
It is important to note that the expense amounts shown in the table are meant to highlight only ongoing costs of investing in the fund and do not reflect any transaction costs, such as sales charges, redemption fees or exchange fees. Therefore, the hypothetical examples provided may not help you determine the relative total costs of owning shares of different funds. If these transaction costs were included, your costs would have been higher.
9
Portfolio Managers' Report – Columbia Mid Cap Growth Fund
Performance data quoted represents past performance and current performance may be lower or higher. Past performance is no guarantee of future results. The investment return and principal value will fluctuate so that shares, when redeemed, may be worth more or less than the original cost. Please visit www.columbiafunds.com for daily and most recent month-end performance updates.
Net asset value per share
as of 08/31/07 ($)
| Class A | | | 27.51 | | |
| Class B | | | 26.47 | | |
| Class C | | | 26.53 | | |
| Class R | | | 27.39 | | |
| Class T | | | 27.53 | | |
| Class Z | | | 27.93 | | |
Distributions declared Per Share
09/01/06 – 08/31/07 ($)
| Class A | | | 1.46 | | |
| Class B | | | 1.46 | | |
| Class C | | | 1.46 | | |
| Class R | | | 1.46 | | |
| Class T | | | 1.46 | | |
| Class Z | | | 1.51 | | |
For the 12-month period that ended August 31, 2007, Columbia Mid Cap Growth Fund Class A shares returned 21.24% without sales charge. The fund's benchmarks, the Russell Midcap Growth Index returned 19.31% and the Russell Midcap Index returned 16.18% for the same period.1 The fund's return was higher than the 20.98% average return of its peer group, the Morningstar Mid-Cap Growth Funds Category.2 The fund benefited from strong stock selection across the board, led by holdings in the telecommunications and industrials sectors. An emphasis on energy stocks also helped returns.
Mass market adoption of wireless technology was an investment theme
Holdings in the telecommunications services sector were top contributors to the fund's return during the period. Leap Wireless International, Inc., a provider of affordable, basic phone and messaging services for the underserved mass market, saw positive results due to continued strong sales of its "Cricket" brand wireless service. Millicom International Cellular SA, a prepaid cellular service provider in the emerging markets, and NII Holdings, Inc., which provides mobile communications to Latin American businesses, were also standout performers. Both reported robust subscriber growth as a result of increasingly widespread use of cell phones and other wireless communication devices in the emerging markets.
Defense industry suppliers helped bolster returns
The fund also benefited from an emphasis on the industrials sector, particularly from exposure to the aerospace and defense industries. Precision Castparts Corp., manufacturer of metal castings and components for industrial and aerospace applications, was a significant contributor to the fund's return. Orders for its jet engine components skyrocketed as demand grew for new aircraft in emerging markets, including China, and among airlines in developed markets which continued to replace older jets. In the information technology sector, one standout performer was polysilicon wafer maker MEMC Electronic Materials, Inc., which benefited from explosive growth in the solar energy market.
Energy and health care companies aided results
Energy and health care stocks provided an additional boost to the fund's performance. A higher-than-benchmark weight in the energy sector helped, as did an emphasis on holdings with oil exposure. Among top performers in the sector were FMC Technologies, Inc., a provider of technology solutions to oil companies, and Denbury Resources, Inc., which specializes in the recovery of depleted oil fields using carbon dioxide. Denbury is a dominant player in the Southeastern US.
1The Russell Midcap Growth Index measures the performance of those Russell Midcap companies with higher price-to-book ratios and higher forecasted growth values. The Russell Midcap Index measures the performance of the 800 smallest companies in the Russell 1000 Index, as ranked by total market capitalization. Indices are not investments, do not incur fees or expenses and are not professionally managed. It is not possible to invest directly in an index. Securities in the fund may not match those in an index.
2©2007 by Morningstar, Inc. All rights reserved. The information contained herein is the proprietary information of Morningstar, Inc., may not be copied or redistributed for any purpose and may only be used for noncommercial, personal purposes. The information contained herein is not represented or warranted to be accurate, correct, complete or timely. Morningstar, Inc. shall not be responsible for investment decisions, damages or other losses resulting from the use of this information. Past performance is no guarantee of future performance. Morningstar, Inc. has not granted consent for it to be considered or deemed an "expert" under the Securities Act of 1933. Morningstar Categories compare the performance of funds with similar investment objectives and strategies.
10
Portfolio Managers' Report (continued) – Columbia Mid Cap Growth Fund
In the health care sector, Kyphon, Inc. was a top contributor to the fund's return. Shares of the medical device manufacturer benefited when Medtronic, Inc. announced it would acquire the firm, which provides products used in surgical spine procedures. Thermo Fisher Scientific, Inc., a test and measurement instrument provider, also experienced continued high demand for its products and services.
A light position in the information technology sector detracted slightly from relative returns, as did a decision not to own several key stocks that outperformed during the period. We have since established a small position in one such company, MasterCard, Inc. While a lighter-than-index weight in the financials sector helped when the sector fell out of favor, the fund also missed out by not owning several financial stocks that were rewarded when they were acquired by other firms during the period.
Seeking exposure to global economic growth
The markets have become volatile as a result of credit concerns sparked by problems in the US subprime mortgage loan sector. By adhering to our core investment process, we hope to turn volatility to the fund's advantage by seeking investment opportunities created by panic selling with the goal of maximizing returns and minimizing risk. As international demand for goods and services continues to drive economic growth, we plan to focus on allocating capital to companies with international footprints that we believe have the potential to capture the power of this growth, particularly in emerging markets. We continue to screen the investment universe for growth companies we believe are attractively valued and that have strong business models, rising profit margins and improving returns on capital.
Portfolio holdings and characteristics are subject to change and may not be representative of current holdings and characteristics. The outlook for the fund may differ from that presented for other Columbia Funds.
Equity investments are affected by stock market fluctuations that occur in response to economic and business developments.
Investing in mid-cap stocks may present special risks, including possible illiquidity and greater price volatility than stocks of larger, more established companies.
Top 5 sectors
as of 08/31/07 (%)
| Information Technology | | | 20.0 | | |
| Health Care | | | 15.7 | | |
| Consumer Discretionary | | | 14.1 | | |
| Industrials | | | 13.2 | | |
| Energy | | | 12.3 | | |
Top 10 holdings
as of 08/31/07 (%)
| Nvidia Corp. | | | 1.6 | | |
| NII Holdings, Inc. | | | 1.4 | | |
| National-Oilwell Varco, Inc. | | | 1.4 | | |
| Nordstrom, Inc. | | | 1.3 | | |
| Kyphon, Inc. | | | 1.3 | | |
| American Tower Corp. | | | 1.3 | | |
| MEMC Electronic Materials, Inc. | | | 1.2 | | |
| Allergan, Inc. | | | 1.1 | | |
| Research In Motion Ltd. | | | 1.1 | | |
Starwood Hotels & Resorts
Worldwide, Inc. | | | 1.0 | | |
Table excludes investment in short-term obligation.
Holdings discussed in this report
as of 08/31/07 (%)
| Leap Wireless International, Inc. | | | 0.7 | | |
| Millicom International Cellular SA | | | 0.6 | | |
| NII Holdings, Inc. | | | 1.4 | | |
| Precision Castparts Corp. | | | 1.0 | | |
| MEMC Electronic Materials, Inc. | | | 1.2 | | |
| FMC Technologies, Inc. | | | 0.7 | | |
| Denbury Resources, Inc. | | | 0.9 | | |
| Kyphon, Inc. | | | 1.3 | | |
| Thermo Fisher Scientific, Inc. | | | 0.6 | | |
| MasterCard, Inc. | | | 0.4 | | |
Your fund is actively managed and the composition of its portfolio will change over time. Information provided is calculated as a percentage of net assets.
11
Fund Profile – Columbia Small Cap Growth Fund I
Performance data quoted represents past performance and current performance may be lower or higher. Past performance is no guarantee of future results. The investment return and principal value will fluctuate so that shares, when redeemed, may be worth more or less than the original cost. Please visit www.columbiafunds.com for daily and most recent month-end performance updates.
Summary
1 year return as of 08/31/07
| | +21.96% | |
|
 | | Class A shares
(without sales charge) | |
|
| | +16.36% | |
|
 | | Russell 2000 Growth Index | |
|
| | +11.36% | |
|
 | | Russell 2000 Index | |
|
Morningstar Style Box

Summary
g For the 12-month period that ended August 31, 2007, the fund's Class A shares returned 21.96% without sales charge.
g The fund's return was higher than the return of both of its benchmarks, the Russell 2000 Growth Index and the Russell 2000 Index,1 and the average return of its peer group, the Morningstar Small Growth Funds Category.2
g Positive stock selection across the board, and strong contributions from the information technology, telecommunications, industrials and energy sectors, drove the fund's return.
Portfolio Management
Wayne M. Collette has co-managed the fund since February 2006 and has been with the advisor, or its predecessors or affiliate organizations since 2001.
George J. Myers has co-managed the fund since February 2006 and has been with the advisor, or its predecessors or affiliate organizations since 2004.
1The Russell 2000 Growth Index measures the performance of those Russell 2000 Index companies with higher price-to-book ratios and higher forecasted growth values. The Russell 2000 Index tracks the performance of the 2,000 smallest of the 3,000 largest US companies based on market capitalization. Indices are not investments, do not incur fees or expenses and are not professionally managed. It is not possible to invest directly in an index. Securities in the fund may not match those in an index.
2©2007 by Morningstar, Inc. All rights reserved. The information contained herein is the proprietary information of Morningstar, Inc., may not be copied or redistributed for any purpose and may only be used for noncommercial, personal purposes. The information contained herein is not represented or warranted to be accurate, correct, complete or timely. Morningstar, Inc. shall not be responsible for investment decisions, damages or other losses resulting from the use of this information. Past performance is no guarantee of future performance. Morningstar, Inc. has not granted consent for it to be considered or deemed an "expert" under the Securities Act of 1933. Morningstar Categories compare the performance of funds with similar investment objectives and strategies.
The Morningstar Style BoxTM reveals a fund's investment strategy. For equity funds the vertical axis shows the market capitalization of the stocks owned and the horizontal axis shows a fund's investment style (value, blend or growth). For fixed-income funds the vertical axis shows the average credit quality of the bonds owned, and the horizontal axis shows interest rate sensitivity as measured by a bond's duration (short, intermediate or long). All of these numbers are drawn from the data most recently provided by the fund and entered into Morningstar's database as of month-end. Although the data is gathered from reliable sources, Morningstar cannot guarantee completeness and accuracy. Information shown is as of 08/31/2007.
12
Performance Information – Columbia Small Cap Growth Fund I
Growth of a $10,000 investment 09/01/97 – 08/31/07
The chart above shows the growth in value of a hypothetical $10,000 investment in Class A shares of Columbia Small Cap Growth Fund I during the stated time period, and does not reflect the deduction of taxes that a shareholder may pay on fund distributions or the redemption of fund shares. The Russell 2000 Growth Index measures the performance of those Russell 2000 Index companies with higher price-to-book ratios and higher forecasted growth values. The Russell 2000 Index tracks the performance of the 2,000 smallest of the 3,000 largest US companies based on market capitalization. Indices are not investments, do not incur fees or expenses and are not professionally managed. It is not possible to invest directly in an index. Securities in the fund may not match those in an index.
Performance of a $10,000 investment 09/01/97 – 08/31/07 ($)
| Sales charge | | without | | with | |
| Class A | | | 27,271 | | | | 25,707 | | |
| Class B | | | 26,934 | | | | 26,934 | | |
| Class C | | | 26,925 | | | | 26,925 | | |
| Class Z | | | 27,394 | | | | n/a | | |
Average annual total return as of 08/31/07 (%)
| Share class | | A | | B | | C | | Z | |
| Inception | | 11/01/05 | | 11/01/05 | | 11/01/05 | | 10/01/96 | |
| Sales charge | | without | | with | | without | | with | | without | | with | | without | |
| 1-year | | | 21.96 | | | | 14.94 | | | | 21.05 | | | | 16.05 | | | | 21.02 | | | | 20.02 | | | | 22.28 | | |
| 5-year | | | 17.90 | | | | 16.52 | | | | 17.61 | | | | 17.40 | | | | 17.60 | | | | 17.60 | | | | 18.01 | | |
| 10-year | | | 10.55 | | | | 9.90 | | | | 10.42 | | | | 10.42 | | | | 10.41 | | | | 10.41 | | | | 10.60 | | |
Average annual total return as of 09/30/07 (%)
| Share class | | A | | B | | C | | Z | |
| Sales charge | | without | | with | | without | | with | | without | | with | | without | |
| 1- year | | | 29.13 | | | | 21.69 | | | | 28.24 | | | | 23.24 | | | | 28.24 | | | | 27.24 | | | | 29.50 | | |
| 5-year | | | 20.30 | | | | 18.87 | | | | 19.99 | | | | 19.79 | | | | 19.99 | | | | 19.99 | | | | 20.41 | | |
| 10-year | | | 10.20 | | | | 9.55 | | | | 10.06 | | | | 10.06 | | | | 10.06 | | | | 10.06 | | | | 10.26 | | |
The "with sales charge" returns include the maximum initial sales charge of 5.75% for Class A shares, the applicable contingent deferred sales charge of 5.00% in the first year, declining to 1.00% in the sixth year, and eliminated thereafter for Class B shares and 1.00% for Class C shares for the first year only. The "without sales charge" returns do not include the effect of sales charges. If they had, returns would be lower.
Performance results reflect any waivers or reimbursements of fund expenses by the investment advisor and/or any of its affiliates. Absent these waivers or reimbursement arrangements, performance results would have been lower.
All results shown assume the reinvestment of distributions. Class Z shares are sold at net asset value with no Rule 12b-1 fees. Class Z shares have limited eligibility and the investment minimum requirements may vary. Please see the fund's prospectus for details. Performance for different share classes will vary based on differences in sales charges and fees associated with each class.
The tables do not reflect the deduction of taxes that a shareholder may pay on fund distributions or the redemption of fund shares.
Classes A, B and C (newer class shares) share performance information includes returns of the fund's Class Z shares (the oldest existing fund class) for periods prior to the inception of the newer class shares. Class Z share returns are not restated to reflect any expense differential (such as Rule 12b-1 fees) between Class Z shares and the newer class shares. Had the expense differential been reflected, the returns for the periods prior to the inception of Classes A, B and C would have been lower.
Performance data quoted represents past performance and current performance may be lower or higher. Past performance is no guarantee of future results. The investment return and principal value will fluctuate so that shares, when redeemed, may be worth more or less than the original cost. Please visit www.columbiafunds.com for daily and most recent month-end performance updates.
Annual operating expense ratio (%)*
| Class A | | | 1.46 | | |
| Class B | | | 2.21 | | |
| Class C | | | 2.21 | | |
| Class Z | | | 1.21 | | |
* The annual operating expense ratio is as stated in the fund's prospectus that is current as of the date of this report. Differences in expense ratios disclosed elsewhere in this report may result from including fee waivers and reimbursements as well as different time periods used in calculating the ratios.
13
Understanding Your Expenses – Columbia Small Cap Growth Fund I
Estimating your actual expenses
To estimate the expenses that you paid over the period, first you will need your account balance at the end of the period:
g For shareholders who receive their account statements from Columbia Management Services, Inc., your account balance is available online at www.columbiafunds.com or by calling Shareholder Services at 800.345.6611.
g For shareholders who receive their account statements from their brokerage firm, contact your brokerage firm to obtain your account balance.
1. Divide your ending account balance by $1,000.00. For example, if an account balance was $8,600.00 at the end of the period, the result would be 8.6.
2. In the section of the table below titled "Expenses paid during the period," locate the amount for your share class. You will find this number in the column labeled "actual." Multiply this number by the result from step 1. Your answer is an estimate of the expenses you paid on your account during the period.
A minimum account balance fee of $20 that is charged once per year may be assessed if the value of your account falls below the minimum initial investment applicable to you. This fee is not included in the accompanying table. If you are subject to the fee, keep it in mind when you are estimating the ongoing expenses of investing in the fund and when comparing the expenses of this fund with other funds.
As a fund shareholder, you incur two types of costs. There are transaction costs, which generally include sales charges on purchases and may include redemption or exchange fees. There are also ongoing costs, which generally include investment advisory fees, Rule 12b-1 fees and other fund expenses. The information on this page is intended to help you understand the ongoing costs of investing in the fund and to compare these costs with the ongoing costs of investing in other mutual funds.
Analyzing your fund's expenses by share class
To illustrate these ongoing costs, we have provided an example and calculated the expenses paid by investors in each share class during the period. The information in the following table is based on an initial investment of $1,000.00, which is invested at the beginning of the reporting period and held for the entire period. Expense information is calculated two ways and each method provides you with different information. The amount listed in the "actual" column is calculated using the fund's actual operating expenses and total return for the period. The amount listed in the "hypothetical" column for each share class assumes that the return each year is 5% before expenses and is calculated based on the fund's actual expenses. You should not use the hypothetical account values and expenses to estimate either your actual account balance at the end of the period or the expenses you paid during this reporting period.
Compare with other funds
Since all mutual funds are required to include the same hypothetical calculations about expenses in shareholder reports, you can use this information to compare the ongoing costs of investing in the fund with other funds. To do so, compare the 5% hypothetical example with the 5% hypothetical examples that appear in the shareholder reports of other funds. As you compare hypothetical examples of other funds, it is important to note that hypothetical examples are meant to highlight the ongoing costs of investing in a fund and do not reflect any transaction costs, such as sales charges, redemption fees or exchange fees.
03/01/07 – 08/31/07
| | | Account value at the
beginning of the period ($) | | Account value at the
end of the period ($) | | Expenses paid
during the period ($) | | Fund's annualized
expense ratio (%) | |
| | | Actual | | Hypothetical | | Actual | | Hypothetical | | Actual | | Hypothetical | | Actual | |
| Class A | | | 1,000.00 | | | | 1,000.00 | | | | 1,087.51 | | | | 1,018.15 | | | | 7.37 | | | | 7.12 | | | | 1.40 | | |
| Class B | | | 1,000.00 | | | | 1,000.00 | | | | 1,083.48 | | | | 1,014.37 | | | | 11.29 | | | | 10.92 | | | | 2.15 | | |
| Class C | | | 1,000.00 | | | | 1,000.00 | | | | 1,083.18 | | | | 1,014.37 | | | | 11.29 | | | | 10.92 | | | | 2.15 | | |
| Class Z | | | 1,000.00 | | | | 1,000.00 | | | | 1,088.92 | | | | 1,019.41 | | | | 6.06 | | | | 5.85 | | | | 1.15 | | |
Expenses paid during the period are equal to the annualized expense ratio for the share class, multiplied by the average account value over the period, then multiplied by the number of days in the fund's most recent fiscal half-year and divided by 365.
It is important to note that the expense amounts shown in the table are meant to highlight only ongoing costs of investing in the fund and do not reflect any transaction costs, such as sales charges, redemption fees or exchange fees. Therefore, the hypothetical examples provided may not help you determine the relative total costs of owning shares of different funds. If these transaction costs were included, your costs would have been higher.
14
Portfolio Managers' Report – Columbia Small Cap Growth Fund I
For the 12-month period that ended August 31, 2007, Columbia Small Cap Growth Fund I Class A shares returned 21.96% without sales charge. The fund outperformed its benchmarks, the Russell 2000 Growth Index, which returned 16.36%, and the Russell 2000 Index, which returned 11.36%, for the same period.1 The fund's return was higher than the 17.30% average return of its peer group, the Morningstar Small Growth Funds Category.2 The fund's strong relative performance was due to positive stock selection across the board and strong performance from the information technology, telecommunications, industrials and energy sectors.
Semiconductor-related companies were standout performers
Holdings in the semiconductor segment of the information technology sector provided the largest boost to returns during the period. Atheros Communications, Inc., which makes chip sets for wireless local area network (LAN) devices, benefited from increased wireless networking in homes and businesses. The stock of semiconductor testing equipment manufacturer Verigy Ltd. rose on strong sales of a new, more efficient testing process developed by the firm.
Wireless technology companies helped boost returns
Telecommunications services holdings also helped the fund's performance, led by Millicom International Cellular SA, a prepaid cellular service provider in the emerging markets, and SBA Communications Corp., a leading US wireless tower owner and operator. Millicom benefited from robust subscriber growth due to growing adoption of cell phone use in the emerging markets. Internet backbone provider Cogent Communications Group, Inc. also saw strong growth during the period as the global use of Internet data continued to increase.
Internet connectivity and clean energy were investment themes
Several trends that drove worldwide demand for the products and services of holdings in the industrials and energy sectors also helped the fund's return. The continued build-out of Internet connectivity and electrical infrastructure worldwide helped General Cable Corp. turn in top-notch performance on heightened demand for its copper and fiber optic wires. Growing demand for clean energy technology, including expanded use of solar power, was another trend that benefited the fund. The trend generated strong performance from SunPower Corp. and JA Solar Holdings Co., Ltd., which manufacture solar cells.
Energy companies turned in universally strong performance
Holdings in the energy sector outperformed across the board, led by offshore driller Atwood Oceanics, Inc. and Core Laboratories NV, which specializes in helping
1The Russell 2000 Growth Index measures the performance of those Russell 2000 Index companies with higher price-to-book ratios and higher forecasted growth values. The Russell 2000 Index tracks the performance of the 2,000 smallest of the 3,000 largest US companies based on market capitalization. Indices are not investments, do not incur fees or expenses and are not professionally managed. It is not possible to invest directly in an index. Securities in the fund may not match those in an index.
2©2007 by Morningstar, Inc. All rights reserved. The information contained herein is the proprietary information of Morningstar, Inc., may not be copied or redistributed for any purpose and may only be used for noncommercial, personal purposes. The information contained herein is not represented or warranted to be accurate, correct, complete or timely. Morningstar, Inc. shall not be responsible for investment decisions, damages or other losses resulting from the use of this information. Past performance is no guarantee of future performance. Morningstar, Inc. has not granted consent for it to be considered or deemed an "expert" under the Securities Act of 1933. Morningstar Categories compare the performance of funds with similar investment objectives and strategies.
Performance data quoted represents past performance and current performance may be lower or higher. Past performance is no guarantee of future results. The investment return and principal value will fluctuate so that shares, when redeemed, may be worth more or less than the original cost. Please visit www.columbiafunds.com for daily and most recent month-end performance updates.
Net asset value per share
as of 08/31/07 ($)
| Class A | | | 31.69 | | |
| Class B | | | 31.26 | | |
| Class C | | | 31.25 | | |
| Class Z | | | 31.86 | | |
Distributions declared per share
09/01/06 – 08/31/07 ($)
| Class A | | | 4.73 | | |
| Class B | | | 4.73 | | |
| Class C | | | 4.73 | | |
| Class Z | | | 4.73 | | |
15
Portfolio Managers' Report (continued) – Columbia Small Cap Growth Fund I
Top 5 sectors
as of 08/31/07 (%)
| Information Technology | | | 22.6 | | |
| Health Care | | | 21.4 | | |
| Consumer Discretionary | | | 17.5 | | |
| Industrials | | | 13.4 | | |
| Energy | | | 7.0 | | |
Top 10 holdings
as of 08/31/07 (%)
| ICON PLC | | | 1.6 | | |
| Kyphon, Inc. | | | 1.6 | | |
| CROCS, Inc. | | | 1.4 | | |
| SBA Communications Corp. | | | 1.2 | | |
| Verigy Ltd. | | | 1.1 | | |
| Atheros Communications, Inc. | | | 1.1 | | |
| Atwood Oceanics, Inc. | | | 1.1 | | |
| Warnaco Group, Inc. | | | 1.0 | | |
| Huron Consulting Group, Inc. | | | 1.0 | | |
| Knology, Inc. | | | 1.0 | | |
Table excludes investment in short term obligation.
Holdings discussed in this report
as of 08/31/07 (%)
| Atheros Communications, Inc. | | | 1.1 | | |
| Verigy Ltd. | | | 1.1 | | |
Millicom International
Cellular SA | | | 0.6 | | |
| SBA Communications Corp. | | | 1.2 | | |
Cogent Communications
Group, Inc. | | | 0.6 | | |
| General Cable Corp. | | | 0.6 | | |
| SunPower Corp. | | | 0.6 | | |
| JA Solar Holdings Co., Ltd. | | | 0.5 | | |
| Atwood Oceanics, Inc. | | | 1.1 | | |
| Core Laboratories NV | | | 0.8 | | |
Your fund is actively managed and the composition of its portfolio will change over time. Information provided is calculated as a percentage of net assets.
exploration and production companies produce more oil and gas through its reservoir description and enhancement services.
The fund's performance suffered slightly due to its lack of exposure to one particular strong performer in the materials sector of the index. Returns were also dampened by poor performance from Bare Escentuals, Inc., a cosmetics company that sells mineral-based make-up products. The firm's business suffered when competition came on more quickly than it had anticipated. We subsequently sold the stock.
Seeking to capture the power of global economic growth
The global markets have experienced a dramatic increase in price volatility due to investors' heightened risk concerns, sparked by problems in the US subprime mortgage loan sector. We intend to navigate this volatile period by adhering to our core investment process while taking advantage of attractive opportunities arising from panic selling with the goal of maximizing returns and minimizing risk. As international demand for goods and services continues to drive economic growth, we plan to expand our position in companies with international footprints that we believe have the potential to capture the power of this growth, particularly in emerging markets. We continue to screen the investment universe for growth companies that we believe are attractively valued and that have strong business models, rising profit margins and improving returns on capital.
Portfolio holdings and characteristics are subject to change and may not be representative of current holdings and characteristics. The outlook for the fund may differ from that presented for other Columbia Funds.
Equity investments are affected by stock market fluctuations that occur in response to economic and business developments.
Investments in small-cap stocks may be subject to greater volatility and price fluctuations because they may be thinly traded and less liquid than investments in larger companies.
16
Fund Profile – Columbia Real Estate Equity Fund
Summary
g For the 12-month period that ended August 31, 2007, the fund's Class A shares returned 1.72% without sales charge.
g The fund underperformed both its benchmark, the NAREIT Index1, and the average return of its peer group, the Morningstar Specialty Real Estate Funds Category.2
g The fund had less exposure than the index to the retail sector, which hampered its return as the sector experienced improved performance, based on attractive valuations, during the period.
Portfolio Management
Arthur Hurley has managed the fund since September 2006 and has been with the advisor since 2006.
1The National Association of Real Estate Investment Trusts (NAREIT) Index tracks the performance of all publicly traded equity real estate investment trusts (REITs). Indices are not investments, do not incur fees or expenses and are not professionally managed. It is not possible to invest directly in an index. Securities in the fund may not match those in an index.
2©2007 by Morningstar, Inc. All rights reserved. The information contained herein is the proprietary information of Morningstar, Inc., may not be copied or redistributed for any purpose and may only be used for noncommercial, personal purposes. The information contained herein is not represented or warranted to be accurate, correct, complete or timely. Morningstar, Inc. shall not be responsible for investment decisions, damages or other losses resulting from the use of this information. Past performance is no guarantee of future performance. Morningstar, Inc. has not granted consent for it to be considered or deemed an "expert" under the Securities Act of 1933. Morningstar Categories compare the performance of funds with similar investment objectives and strategies.
Performance data quoted represents past performance and current performance may be lower or higher. Past performance is no guarantee of future results. The investment return and principal value will fluctuate so that shares, when redeemed, may be worth more or less than the original cost. Please visit www.columbiafunds.com for daily and most recent month-end performance updates.
Summary
1 year return as of 08/31/07
| | +1.72% | |
|
 | | Class A shares
(without sales charge) | |
|
| | +3.09% | |
|
 | | NAREIT Index | |
|
17
Performance Information – Columbia Real Estate Equity Fund
Performance data quoted represents past performance and current performance may be lower or higher. Past performance is no guarantee of future results. The investment return and principal value will fluctuate so that shares, when redeemed, may be worth more or less than the original cost. Please visit www.columbiafunds.com for daily and most recent month-end performance updates.
Annual operating expense ratio (%) *
| Class A | | | 1.22 | | |
| Class B | | | 1.97 | | |
| Class C | | | 1.97 | | |
| Class Z | | | 0.97 | | |
*The annual operating expense ratio is as stated in the fund's prospectus that is current as of the date of this report. Differences in expense ratios disclosed elsewhere in this report may result from including fee waivers and reimbursements as well as different time periods used in calculating the ratios.
Growth of a $10,000 investment 09/01/97 – 08/31/07
The chart above shows the growth in value of a hypothetical $10,000 investment in Class A shares of Columbia Real Estate Equity Fund during the stated time period, and does not reflect the deduction of taxes that a shareholder may pay on fund distributions or the redemption of fund shares. The National Association of Real Estate Investment Trusts (NAREIT) Index tracks the performance of all publicly traded equity real estate investment trusts (REITs). Indices are not investments, do not incur fees or expenses and are not professionally managed. It is not possible to invest directly in an index. Securities in the fund may not match those in an index.
Performance of a $10,000 investment 09/01/97 – 08/31/07 ($)
| Sales charge | | without | | with | |
| Class A | | | 30,335 | | | | 28,594 | | |
| Class B | | | 29,304 | | | | 29,304 | | |
| Class C | | | 29,273 | | | | 29,273 | | |
| Class Z | | | 30,788 | | | | n/a | | |
Average annual total return as of 08/31/07 (%)
| Share class | | A | | B | | C | | Z | |
| Inception | | 11/01/02 | | 11/01/02 | | 10/13/03 | | 04/01/94 | |
| Sales charge | | without | | with | | without | | with | | without | | with | | without | |
| 1-year | | | 1.72 | | | | –4.13 | | | | 0.99 | | | | –2.58 | | | | 0.94 | | | | 0.22 | | | | 1.95 | | |
| 5-year | | | 17.81 | | | | 16.42 | | | | 17.00 | | | | 16.79 | | | | 16.98 | | | | 16.98 | | | | 18.16 | | |
| 10-year | | | 11.74 | | | | 11.08 | | | | 11.35 | | | | 11.35 | | | | 11.34 | | | | 11.34 | | | | 11.90 | | |
Average annual total return as of 09/30/07 (%)
| Share class | | A | | B | | C | | Z | |
| Sales charge | | without | | with | | without | | with | | without | | with | | without | |
| 1-year | | | 3.49 | | | | –2.48 | | | | 2.70 | | | | –0.93 | | | | 2.73 | | | | 2.01 | | | | 3.75 | | |
| 5-year | | | 19.68 | | | | 18.27 | | | | 18.84 | | | | 18.64 | | | | 18.82 | | | | 18.82 | | | | 20.04 | | |
| 10-year | | | 11.21 | | | | 10.55 | | | | 10.82 | | | | 10.82 | | | | 10.81 | | | | 10.81 | | | | 11.38 | | |
The "with sales charge" returns include the maximum initial sales charge of 5.75% for Class A shares, the applicable contingent deferred sales charge of 5.00% in the first year, declining to 1.00% in the sixth year, and eliminated thereafter for Class B shares and 1.00% for Class C shares for the first year only. The "without sales charge" returns do not include the effect of sales charges. If they had, returns would be lower.
Performance results reflect any waivers or reimbursements of fund expenses by the investment advisor and/or any of its affiliates. Absent these waivers or reimbursement arrangements, performance results would have been lower.
All results shown assume reinvestment of distributions. Class Z shares are sold at net asset value with no Rule 12b-1 fees. Class Z shares have limited eligibility and the investment minimum requirements may vary. Please see the fund's prospectus for details. Performance for different share classes will vary based on differences in sales charges and fees associated with each class.
The tables do not reflect the deduction of taxes that a shareholder may pay on fund distributions or the redemption of fund shares.
Classes A and B (newer class shares) share performance information includes returns of the fund's Class Z shares (the oldest existing fund class) for periods prior to the inception of the newer class shares. The returns for Class C include the returns of Class B prior to 10/13/03, the date on which Class C was initially offered by the fund. The returns shown for Class C also include the performance of Class Z prior to the inception of Class B (11/01/02). Class Z share returns are not restated to reflect any expense differential (such as Rule 12b-1 fees) between Class Z shares and the newer class shares. Had the expense differential been reflected, the returns for the periods prior to the inception of Classes A, B and C would have been lower.
18
Understanding Your Expenses – Columbia Real Estate Equity Fund
As a fund shareholder, you incur two types of costs. There are transaction costs, which generally include sales charges on purchases and may include redemption or exchange fees. There are also ongoing costs, which generally include investment advisory fees, Rule 12b-1 fees and other fund expenses. The information on this page is intended to help you understand the ongoing costs of investing in the fund and to compare these costs with the ongoing costs of investing in other mutual funds.
Analyzing your fund's expenses by share class
To illustrate these ongoing costs, we have provided an example and calculated the expenses paid by investors in each share class during the period. The information in the following table is based on an initial investment of $1,000.00, which is invested at the beginning of the reporting period and held for the entire period. Expense information is calculated two ways and each method provides you with different information. The amount listed in the "actual" column is calculated using the fund's actual operating expenses and total return for the period. The amount listed in the "hypothetical" column for each share class assumes that the return each year is 5% before expenses and is calculated based on the fund's actual expenses. You should not use the hypothetical account values and expenses to estimate either your actual account balance at the end of the period or the expenses you paid during this reporting period.
Compare with other funds
Since all mutual funds are required to include the same hypothetical calculations about expenses in shareholder reports, you can use this information to compare the ongoing costs of investing in the fund with other funds. To do so, compare the 5% hypothetical example with the 5% hypothetical examples that appear in the shareholder reports of other funds. As you compare hypothetical examples of other funds, it is important to note that hypothetical examples are meant to highlight the ongoing costs of investing in a fund and do not reflect any transaction costs, such as sales charges, redemption fees or exchange fees.
Estimating your actual expenses
To estimate the expenses that you paid over the period, first you will need your account balance at the end of the period:
g For shareholders who receive their account statements from Columbia Management Services, Inc., your account balance is available online at www.columbiafunds.com or by calling Shareholder Services at 800.345.6611.
g For shareholders who receive their account statements from their brokerage firm, contact your brokerage firm to obtain your account balance.
1. Divide your ending account balance by $1,000.00. For example, if an account balance was $8,600.00 at the end of the period, the result would be 8.6.
2. In the section of the table below titled "Expenses paid during the period," locate the amount for your share class. You will find this number in the column labeled "actual." Multiply this number by the result from step 1. Your answer is an estimate of the expenses you paid on your account during the period.
A minimum account balance fee of $20 that is charged once per year may be assessed if the value of your account falls below the minimum initial investment applicable to you. This fee is not included in the accompanying table. If you are subject to the fee, keep it in mind when you are estimating the ongoing expenses of investing in the fund and when comparing the expenses of this fund with other funds.
03/01/07 – 08/31/07
| | | Account value at the
beginning of the period ($) | | Account value at the
end of the period ($) | | Expenses paid
during the period ($) | | Fund's annualized
expense ratio (%) | |
| | | Actual | | Hypothetical | | Actual | | Hypothetical | | Actual | | Hypothetical | | Actual | |
| Class A | | | 1,000.00 | | | | 1,000.00 | | | | 865.71 | | | | 1,019.11 | | | | 5.69 | | | | 6.16 | | | | 1.21 | | |
| Class B | | | 1,000.00 | | | | 1,000.00 | | | | 862.68 | | | | 1,015.32 | | | | 9.20 | | | | 9.96 | | | | 1.96 | | |
| Class C | | | 1,000.00 | | | | 1,000.00 | | | | 862.38 | | | | 1,015.32 | | | | 9.20 | | | | 9.96 | | | | 1.96 | | |
| Class Z | | | 1,000.00 | | | | 1,000.00 | | | | 867.02 | | | | 1,020.37 | | | | 4.52 | | | | 4.89 | | | | 0.96 | | |
Expenses paid during the period are equal to the annualized expense ratio for the share class, multiplied by the average account value over the period, then multiplied by the number of days in the fund's most recent fiscal half-year and divided by 365.
It is important to note that the expense amounts shown in the table are meant to highlight only ongoing costs of investing in the fund and do not reflect any transaction costs, such as sales charges, redemption fees or exchange fees. Therefore, the hypothetical examples provided may not help you determine the relative total costs of owning shares of different funds. If these transaction costs were included, your costs would have been higher.
19
Portfolio Manager's Report – Columbia Real Estate Equity Fund
Performance data quoted represents past performance and current performance may be lower or higher. Past performance is no guarantee of future results. The investment return and principal value will fluctuate so that shares, when redeemed, may be worth more or less than the original cost. Please visit www.columbiafunds.com for daily and most recent month-end performance updates.
Net asset value per share
as of 08/31/07 ($)
| Class A | | | 20.72 | | |
| Class B | | | 20.76 | | |
| Class C | | | 20.72 | | |
| Class Z | | | 20.74 | | |
Distributions declared per share
09/01/06 – 08/31/07 ($)
| Class A | | | 9.81 | | |
| Class B | | | 9.60 | | |
| Class C | | | 9.60 | | |
| Class Z | | | 9.87 | | |
For the 12-month period that ended August 31, 2007, Columbia Real Estate Equity Fund Class A shares returned 1.72% without sales charge. The fund's benchmark, the NAREIT Index, returned 3.09%.1 The average return of its peer group, the Morningstar Specialty Real Estate Funds Category, was 4.00%.2 The fund's light exposure to the strong-performing retail sector detracted from relative returns during the period. Overall, the performance of real estate investment trusts (REITs) was negatively affected by an uptick in price volatility in the broader equity market and by concerns regarding the direction of commercial real estate values.
The overall REIT market stalled on valuation concerns
Despite general strength in underlying business fundamentals, the REIT market was not immune to a sharp increase in stock market volatility, sparked by recent turmoil in the credit markets. Subprime mortgage concerns created additional uncertainty about where commercial real estate values are headed, even though REITs have little or no connection to the residential housing market or home mortgages. As a result, REIT stock returns were held back over the past six months, including many of the fund's holdings.
Hotel and industrial REITs delivered strong returns
An emphasis on the hotel sector helped the fund's relative returns as hotels outperformed all other property types. Hotels thrived due to strong earnings growth resulting from record-level occupancy and average daily rates. Strong demand from business, convention and leisure travelers continued to drive the sector's growth. The best performing hotel holding in the portfolio was Hilton Hotels Corp., which benefited from its announced acquisition by the Blackstone Group.
Industrial REITs also performed well during the past 12 months. The fund's position in ProLogis, the world's largest industrial REIT, aided performance. ProLogis benefited from solid fundamentals in its core industrial portfolio, including distribution and logistics facilities. The company continued to build out its global distribution platform, which has proven a competitive niche when securing tenants specializing in international trade. This strategy created earnings momentum for the firm in recent quarters. ProLogis also experienced strong demand from institutional investors for its real estate fund management business.
1The National Association of Real Estate Investment Trusts (NAREIT) Index tracks the performance of all publicly traded equity real estate investment trusts (REITs). Indices are not investments, do not incur fees or expenses and are not professionally managed. It is not possible to invest directly in an index. Securities in the fund may not match those in an index.
2©2007 by Morningstar, Inc. All rights reserved. The information contained herein is the proprietary information of Morningstar, Inc., may not be copied or redistributed for any purpose and may only be used for noncommercial, personal purposes. The information contained herein is not represented or warranted to be accurate, correct, complete or timely. Morningstar, Inc. shall not be responsible for investment decisions, damages or other losses resulting from the use of this information. Past performance is no guarantee of future performance. Morningstar, Inc. has not granted consent for it to be considered or deemed an "expert" under the Securities Act of 1933. Morningstar Categories compare the performance of funds with similar investment objectives and strategies.
20
Portfolio Manager's Report (continued) – Columbia Real Estate Equity Fund
An underweight in retail REITs detracted from returns
The fund's underweight position in the retail sector relative to the index detracted from performance during the period. Retail REITs benefited from a general rotation of investor cash out of apartment REITs on concerns that the apartment sector was overpriced. While the fund's return was helped by exposure to some of the strong-performing retail REITs, including Simon Property Group, Inc., its overall positioning in the sector hurt returns.
We continue to hold a relatively light position in the retail sector based on our belief that investors may shift out of retail REITs in favor of the apartment sector. There is already evidence that such a shift may be underway. During August, investors began to re-invest in apartment REITs based on attractive valuations in the sector. We also believe that apartment owners could begin to benefit from increased rental demand as the single family residential housing market continues to suffer and mortgage applicants receive closer scrutiny from prospective lenders.
A focus on business fundamentals
The recent tightening in the credit markets together with uncertainty about real estate valuations has taken the wind out of the REIT market's sails. REIT stock prices have generally returned to earth and the large volume of mergers and acquisitions that preceded this period appears to have halted. As a result, it appears that investors have stopped rewarding companies based on their potential of becoming the next take-over candidate and have refocused on companies' future growth prospects and the quality of their earnings. Despite increased market volatility, we believe the fund is well-positioned to capitalize on this fundamentals-driven market as the portfolio management team continues to favor companies with large development and redevelopment pipelines, opportunities for sustainable growth and defensible business models.
Portfolio holdings and characteristics are subject to change and may not be representative of current holdings and characteristics. The outlook for the fund may differ from that presented for other Columbia Funds.
Equity investments are affected by stock market fluctuations that occur in response to economic and business developments.
The fund may be subject to the same types of risks associated with direct ownership of real estate including the decline of property value due to general, local and regional economic conditions. In addition, the fund's share price will likely be subject to more volatility than the overall stock market because it concentrates in real estate stocks.
Top 10 holdings
as of 08/31/07 (%)
| Simon Property Group, Inc. | | | 10.3 | | |
| ProLogis | | | 9.0 | | |
| Kimco Realty Corp. | | | 6.6 | | |
| Corporate Office Properties Trust | | | 5.3 | | |
Alexandria Real Estate
Equities, Inc. | | | 5.3 | | |
| AvalonBay Communities, Inc. | | | 5.3 | | |
| Public Storage, Inc. | | | 5.0 | | |
| Apartment Investment & | |
| Management Co. | | | 4.6 | | |
Mid-America Apartment
Communities, Inc. | | | 4.5 | | |
| Developers Diversified | |
| Realty Corp. | | | 4.3 | | |
Top sectors
as of 08/31/07 (%)
| Financials | | | 89.4 | | |
| Consumer Discretionary | | | 6.5 | | |
| Health Care | | | 0.5 | | |
Table excludes investment in short-term obligation.
Holdings discussed in this report
as of 08/31/07 (%)
| Hilton Hotels Corp. | | | 1.2 | | |
| ProLogis | | | 9.0 | | |
| Simon Property Group, Inc. | | | 10.3 | | |
Your fund is actively managed and the composition of its portfolio will change over time. Information provided is calculated as a percentage of net assets.
21
Fund Profile – Columbia Technology Fund
Performance data quoted represents past performance and current performance may be lower or higher. Past performance is no guarantee of future results. The investment return and principal value will fluctuate so that shares, when redeemed, may be worth more or less than the original cost. Please visit www.columbiafunds.com for daily and most recent month-end performance updates.
Summary
1 year return as of 08/31/07
| | +24.54% | |
|
 | | Class A shares
(without sales charge) | |
|
| | +20.72% | |
|
 | | Merrill Lynch 100
Technology Index | |
|
Summary
g For the 12-month period that ended August 31, 2007, the fund's Class A shares returned 24.54% without sales charge.
g The fund's return surpassed that of its benchmark, the Merrill Lynch 100 Technology Index1, and it was also higher than the average return of its peer group, the Morningstar Specialty Technology Category.2
g Holdings in the communications equipment and wireless communications areas were the largest contributors to the fund's performance during the period.
Portfolio Management
Wayne M. Collette has managed the fund since June 2002 and has been with the advisor, or its predecessors or affiliate organizations since 2001.
1The Merrill Lynch 100 Technology Index is an equally weighted index of 100 leading technology stocks. Indices are not investments, do not incur fees or expenses and are not professionally managed. It is not possible to invest directly in an index. Securities in the fund may not match those in an index.
2©2007 by Morningstar, Inc. All rights reserved. The information contained herein is the proprietary information of Morningstar, Inc., may not be copied or redistributed for any purpose and may only be used for non-commercial, personal purposes. The information contained herein is not represented or warranted to be accurate, correct, complete or timely. Morningstar, Inc. shall not be responsible for investment decisions, damages or other losses resulting from the use of this information. Past performance is no guarantee of future performance. Morningstar, Inc. has not granted consent for it to be considered or deemed an "expert" under the Securities Act of 1933. Morningstar Categories compare the performance of funds with similar investment objectives and strategies.
22
Performance Information – Columbia Technology Fund
Growth of a $10,000 investment 11/09/00 – 08/31/07
The chart above shows the growth in value of a hypothetical $10,000 investment in Class A shares of Columbia Technology Fund during the stated time period, and does not reflect the deduction of taxes that a shareholder may pay on fund distributions or the redemption of fund shares. The Merrill Lynch 100 Technology Index is an equally weighted index of 100 leading technology stocks. Indices are not investments, do not incur fees or expenses and are not professionally managed. It is not possible to invest directly in an index. Securities in the fund may not match those in an index.
Performance of a $10,000 investment 11/09/00 – 08/31/07 ($)
| Sales charge | | without | | with | |
| Class A | | | 12,306 | | | | 11,600 | | |
| Class B | | | 11,852 | | | | 11,852 | | |
| Class C | | | 11,872 | | | | 11,872 | | |
| Class Z | | | 12,496 | | | | n/a | | |
Average annual total return as of 08/31/07 (%)
| Share class | | A | | B | | C | | Z | |
| Inception | | 11/01/02 | | 11/01/02 | | 10/13/03 | | 11/09/00 | |
| Sales charge | | without | | with | | without | | with | | without | | with | | without | |
| 1-year | | | 24.54 | | | | 17.38 | | | | 23.63 | | | | 18.63 | | | | 23.57 | | | | 22.57 | | | | 24.92 | | |
| 5-year | | | 26.12 | | | | 24.61 | | | | 25.18 | | | | 25.01 | | | | 25.22 | | | | 25.22 | | | | 26.51 | | |
| Life | | | 3.10 | | | | 2.20 | | | | 2.53 | | | | 2.53 | | | | 2.55 | | | | 2.55 | | | | 3.33 | | |
Average annual total return as of 09/30/07 (%)
| Share class | | A | | B | | C | | Z | |
| Sales charge | | without | | with | | without | | with | | without | | with | | without | |
| 1-year | | | 30.17 | | | | 22.68 | | | | 29.12 | | | | 24.12 | | | | 29.17 | | | | 28.17 | | | | 30.44 | | |
| 5-year | | | 30.67 | | | | 29.14 | | | | 29.66 | | | | 29.52 | | | | 29.72 | | | | 29.72 | | | | 31.07 | | |
| Life | | | 4.12 | | | | 3.23 | | | | 3.54 | | | | 3.54 | | | | 3.57 | | | | 3.57 | | | | 4.35 | | |
The "with sales charge" returns include the maximum initial sales charge of 5.75% for Class A shares, the applicable contingent deferred sales charge of 5.00% in the first year, declining to 1.00% in the sixth year, and eliminated thereafter for Class B shares and 1.00% for Class C shares for the first year only. The "without sales charge" returns do not include the effect of sales charges. If they had, returns would be lower.
Performance results reflect any waivers or reimbursements of fund expenses by the investment advisor and/or any of its affiliates. Absent these waivers or reimbursement arrangements, performance results would have been lower.
All results shown assume the reinvestment of distributions. Class Z shares are sold at net asset value with no Rule 12b-1 fees. Class Z shares have limited eligibility and the investment minimum requirements may vary. Please see the fund's prospectus for details. Performance for different share classes will vary based on differences in sales charges and fees associated with each class.
The tables do not reflect the deduction of taxes that a shareholder may pay on fund distributions or the redemption of fund shares.
Classes A and B share performance information includes returns of the fund's Class Z shares (the oldest existing fund class) for periods prior to the inception of the newer class shares. The returns for Class C include the returns of Class B prior to 10/13/03, the date on which Class C was initially offered by the fund. The returns shown for Class C also include the performance of Class Z prior to the inception of Class B (11/01/02). Class Z share returns are not restated to reflect any expense differential (such as Rule 12b-1 fees) between Class Z shares and the newer class shares. Had the expense differential been reflected, the returns for the periods prior to the inception of Classes A, B and C would have been lower.
Performance data quoted represents past performance and current performance may be lower or higher. Past performance is no guarantee of future results. The investment return and principal value will fluctuate so that shares, when redeemed, may be worth more or less than the original cost. Please visit www.columbiafunds.com for daily and most recent month-end performance updates.
Annual operating expense ratio (%)*
| Class A | | | 1.46 | | |
| Class B | | | 2.21 | | |
| Class C | | | 2.21 | | |
| Class Z | | | 1.21 | | |
*The annual operating expense ratio is as stated in the fund's prospectus that is current as of the date of this report. Differences in expense ratios disclosed elsewhere in this report may result from including fee waivers and reimbursements as well as different time periods used in calculating the ratios.
23
Understanding Your Expenses – Columbia Technology Fund
Estimating your actual expenses
To estimate the expenses that you paid over the period, first you will need your account balance at the end of the period:
g For shareholders who receive their account statements from Columbia Management Services, Inc., your account balance is available online at www.columbiafunds.com or by calling Shareholder Services at 800.345.6611.
g For shareholders who receive their account statements from their brokerage firm, contact your brokerage firm to obtain your account balance.
1. Divide your ending account balance by $1,000.00. For example, if an account balance was $8,600.00 at the end of the period, the result would be 8.6.
2. In the section of the table below titled "Expenses paid during the period," locate the amount for your share class. You will find this number in the column labeled "actual." Multiply this number by the result from step 1. Your answer is an estimate of the expenses you paid on your account during the period.
A minimum account balance fee of $20 that is charged once per year may be assessed if the value of your account falls below the minimum initial investment applicable to you. This fee is not included in the accompanying table. If you are subject to the fee, keep it in mind when you are estimating the ongoing expenses of investing in the fund and when comparing the expenses of this fund with other funds.
As a fund shareholder, you incur two types of costs. There are transaction costs, which generally include sales charges on purchases and may include redemption or exchange fees. There are also ongoing costs, which generally include investment advisory fees, Rule 12b-1 fees and other fund expenses. The information on this page is intended to help you understand the ongoing costs of investing in the fund and to compare these costs with the ongoing costs of investing in other mutual funds.
Analyzing your fund's expenses by share class
To illustrate these ongoing costs, we have provided an example and calculated the expenses paid by investors in each share class during the period. The information in the following table is based on an initial investment of $1,000.00, which is invested at the beginning of the reporting period and held for the entire period. Expense information is calculated two ways and each method provides you with different information. The amount listed in the "actual" column is calculated using the fund's actual operating expenses and total return for the period. The amount listed in the "hypothetical" column for each share class assumes that the return each year is 5% before expenses and is calculated based on the fund's actual expenses. You should not use the hypothetical account values and expenses to estimate either your actual account balance at the end of the period or the expenses you paid during this reporting period.
Compare with other funds
Since all mutual funds are required to include the same hypothetical calculations about expenses in shareholder reports, you can use this information to compare the ongoing costs of investing in the fund with other funds. To do so, compare the 5% hypothetical example with the 5% hypothetical examples that appear in the shareholder reports of other funds. As you compare hypothetical examples of other funds, it is important to note that hypothetical examples are meant to highlight the ongoing costs of investing in a fund and do not reflect any transaction costs, such as sales charges, redemption fees or exchange fees.
03/01/07 – 08/31/07
| | | Account value at the
beginning of the period ($) | | Account value at the
end of the period ($) | | Expenses paid
during the period ($) | | Fund's annualized
expense ratio (%) | |
| | | Actual | | Hypothetical | | Actual | | Hypothetical | | Actual | | Hypothetical | | Actual | |
| Class A | | | 1,000.00 | | | | 1,000.00 | | | | 1,125.98 | | | | 1,017.85 | | | | 7.82 | | | | 7.43 | | | | 1.46 | | |
| Class B | | | 1,000.00 | | | | 1,000.00 | | | | 1,122.80 | | | | 1,014.06 | | | | 11.82 | | | | 11.22 | | | | 2.21 | | |
| Class C | | | 1,000.00 | | | | 1,000.00 | | | | 1,121.39 | | | | 1,014.06 | | | | 11.82 | | | | 11.22 | | | | 2.21 | | |
| Class Z | | | 1,000.00 | | | | 1,000.00 | | | | 1,128.40 | | | | 1,019.11 | | | | 6.49 | | | | 6.16 | | | | 1.21 | | |
Expenses paid during the period are equal to the annualized expense ratio for the share class, multiplied by the average account value over the period, then multiplied by the number of days in the fund's most recent fiscal half-year and divided by 365.
It is important to note that the expense amounts shown in the table are meant to highlight only ongoing costs of investing in the fund and do not reflect any transaction costs, such as sales charges, redemption fees or exchange fees. Therefore, the hypothetical examples provided may not help you determine the relative total costs of owning shares of different funds. If these transaction costs were included, your costs would have been higher.
24
Portfolio Manager's Report – Columbia Technology Fund
For the 12-month period that ended August 31, 2007, Columbia Technology Fund Class A shares returned 24.54% without sales charge. The fund outperformed its benchmark, the Merrill Lynch 100 Technology Index, which returned 20.72% for the same period.1 It also beat the average return of its peer group, the Morningstar Specialty Technology Funds Category, which was 22.50%.2 Strong returns from the communications equipment and wireless communications areas, where the fund had more exposure than the index, aided relative performance. Stock selection in the semiconductor and semiconductor capital equipment areas also helped drive the fund's return during the period.
Communications equipment makers and wireless providers boosted returns
An emphasis on makers of equipment that helps optimize Internet traffic was a central investment theme for the fund during the period. Sales growth in communications equipment drove the performance of several of the fund's holdings. An overweight position in cellular handset maker Nokia Oyj proved a boon to returns, as new product launches improved the firm's already competitive handset lineup. Blackberry-manufacturer, Research in Motion Ltd., and Internet connectivity device manufacturer, Riverbed Technology, Inc., were also among the top performers.
Holdings in the telecommunications services sector were also key contributors to the fund's return during the period. Standouts included NII Holdings, Inc., which provides mobile communications to Latin American businesses, and Millicom International Cellular SA, a prepaid cellular service provider in the emerging markets. Both reported robust subscriber growth as a result of increasingly widespread use of cell phones and other wireless communications devices in the emerging markets. Holdings in wireless tower owners and operators SBA Communications Corp. and American Tower Corp. also contributed to the fund's performance.
Semiconductor and semiconductor capital equipment makers helped performance
Semiconductor holdings aided returns during the period. Increased wireless networking in homes and businesses drove strong performance from Atheros Communications, Inc., which makes chip sets for wireless local area network (LAN) devices. NVIDIA Corp., maker of graphics processor chips, benefited by gaining market share from its competition. The fund benefited by avoiding PC chipmaker Advanced Micro Devices, Inc., which underperformed.
1The Merrill Lynch 100 Technology Index is an equally weighted index of 100 leading technology stocks. Indices are not investments, do not incur fees or expenses and are not professionally managed. It is not possible to invest directly in an index. Securities in the fund may not match those in an index.
2©2007 by Morningstar, Inc. All rights reserved. The information contained herein is the proprietary information of Morningstar, Inc., may not be copied or redistributed for any purpose and may only be used for non-commercial, personal purposes. The information contained herein is not represented or warranted to be accurate, correct, complete or timely. Morningstar, Inc. shall not be responsible for investment decisions, damages or other losses resulting from the use of this information. Past performance is no guarantee of future performance. Morningstar, Inc. has not granted consent for it to be considered or deemed an "expert" under the Securities Act of 1933. Morningstar Categories compare the performance of funds with similar investment objectives and strategies.
Performance data quoted represents past performance and current performance may be lower or higher. Past performance is no guarantee of future results. The investment return and principal value will fluctuate so that shares, when redeemed, may be worth more or less than the original cost. Please visit www.columbiafunds.com for daily and most recent month-end performance updates.
Net asset value per share
as of 08/31/07 ($)
| Class A | | | 11.62 | | |
| Class B | | | 11.25 | | |
| Class C | | | 11.27 | | |
| Class Z | | | 11.78 | | |
25
Portfolio Manager's Report (continued) – Columbia Technology Fund
Top 5 sectors
as of 08/31/07 (%)
| Information Technology | | | 76.3 | | |
| Telecommunication Services | | | 10.1 | | |
| Consumer Discretionary | | | 6.3 | | |
| Industrials | | | 2.9 | | |
| Health Care | | | 1.0 | | |
Top 10 holdings
as of 08/31/07 (%)
| Nokia Oyj | | | 5.9 | | |
| Research in Motion Ltd. | | | 3.8 | | |
| Nintendo Co., Ltd. | | | 3.5 | | |
| Apple, Inc. | | | 3.4 | | |
Cognizant Technology
Solutions Corp. | | | 2.3 | | |
| NVIDIA Corp. | | | 2.3 | | |
| Google, Inc. | | | 2.1 | | |
| Garmin Ltd. | | | 1.9 | | |
| EMC Corp. | | | 1.9 | | |
| L-3 Communications | |
| Holdings, Inc. | | | 1.9 | | |
Tables exclude investment in short-term obligation.
Holdings discussed in this report
as of 08/31/07 (%)
| Nokia Oyj | | | 5.9 | | |
| Research in Motion Ltd. | | | 3.8 | | |
| Riverbed Technology, Inc. | | | 0.6 | | |
| NII Holdings, Inc. | | | 1.5 | | |
Millicom International
Cellular SA | | | 1.2 | | |
| SBA Communications Corp. | | | 1.4 | | |
| American Tower Corp. | | | 1.4 | | |
| Atheros Communications, Inc. | | | 1.2 | | |
| NVIDIA Corp. | | | 2.3 | | |
| Amazon.com, Inc. | | | 1.4 | | |
Your fund is actively managed and the composition of its portfolio will change over time. Information provided is calculated as a percentage of net assets.
Low exposure to computers and peripherals detracted from performance
We had less exposure than the index to companies in computers and peripherals. This detracted slightly from returns. In addition, the fund did not fully participate in the exceptionally strong performance of Internet retailer Amazon.com, Inc., which was not in the fund early in the period.
Technology growth projected despite slowing economy
The consensus view on the US economy is that growth is slowing. Nevertheless, the outlook for technology companies remains positive because we believe that companies will feel compelled to upgrade their technology systems and software to take advantage of technological advances and upgrades. In addition, we believe that Internet use should continue to rise, and demand for wireless products and services should continue to grow and expand into new markets. As international demand for goods and services continues to drive economic growth, we plan to focus on companies with international footprints that we believe have the potential to capture the power of this growth. We plan to continue to look for attractively valued technology companies with strong business models, rising profit margins and improving returns on capital.
Portfolio holdings and characteristics are subject to change and may not be representative of current holdings and characteristics. The outlook for the fund may differ from that presented for other Columbia Funds.
Equity investments are affected by stock market fluctuations that occur in response to economic and business developments.
The share price of a fund that invests primarily in one sector will likely be subject to more volatility than a fund that invests across many sectors. Technology stocks may be more volatile than stocks in other sectors. The fund should be considered part of an overall investment program, and not a complete investment program.
International investing may involve certain risks, including foreign taxation, currency fluctuations, risks associated with possible differences in financial standards and other monetary and political risks.
Some of the countries the fund invests in are considered emerging economies, which means there may be greater risks associated with investing there than in more developed countries. In addition, concentration of investments in a single region may result in greater volatility.
26
Fund Profile – Columbia Strategic Investor Fund
Summary
g For the 12-month period that ended August 31, 2007, the fund's Class A shares returned 16.33% without sales charge.
g The fund outperformed its benchmark and peer group.
g Stock selection, especially in energy and health care, benefited performance during the period. Technology and industrial stocks were a source of disappointment during the period.
Portfolio Management
Emil A. Gjester, lead manager of the fund, has managed or co-managed the fund since May 2002 and has been with the advisor, or its predecessors or affiliate organizations since 1996.
Jonas Patrikson has co-managed the fund since February 2006 and has been with the advisor, or its predecessors or affiliate organizations since 2004.
Dara J. White has co-managed the fund since February 2006 and has been with the advisor since 2006.
Michael T. Welter has co-managed the fund since July 2006 and has been with the advisor since 2006.
The Russell 1000 Index tracks the performance of 1,000 of the largest US companies, based on market capitalization. The Russell 3000 Value Index measures the performance of those Russell 3000 Index companies with lower price-to-book ratios and lower forecasted growth values. The stocks in this index are also members of either the Russell 1000 Value or the Russell 2000 Value indexes. The Standard & Poor's (S&P) 500 Index tracks the performance of 500 widely held, large-capitalization US stocks. Indices are not investments, do not incur fees or expenses and are not professionally managed. It is not possible to invest directly in an index.
The Morningstar Style BoxTM reveals a fund's investment strategy. For equity funds the vertical axis shows the market capitalization of the stocks owned, and the horizontal axis shows a fund's investment style (value, blend or growth). For fixed-income funds the vertical axis shows the average credit quality of the bonds owned, and the horizontal axis shows interest rate sensitivity as measured by a bond's duration (short, intermediate or long). All of these numbers are drawn from the data most recently provided by the fund and entered into Morningstar's database as of month-end. Although the data is gathered from reliable sources, Morningstar cannot guarantee completeness and accuracy. Information is as of 08/31/2007.
Performance data quoted represents past performance and current performance may be lower or higher. Past performance is no guarantee of future results. The investment return and principal value will fluctuate so that shares, when redeemed, may be worth more or less than the original cost. Please visit www.columbiafunds.com for daily and most recent month-end performance updates.
Summary
1 year return as of 08/31/07
| | +16.33% | |
|
 | | Class A shares
(without sales charge) | |
|
| | +15.27% | |
|
 | | Russell 1000 Index | |
|
| | +12.31% | |
|
 | | Russell 3000 Value Index | |
|
| | +15.13% | |
|
 | | S&P 500 Index | |
|
Morningstar Style Box

27
Performance Information – Columbia Strategic Investor Fund
Performance data quoted represents past performance and current performance may be lower or higher. Past performance is no guarantee of future results. The investment return and principal value will fluctuate so that shares, when redeemed, may be worth more or less than the original cost. Please visit www.columbiafunds.com for daily and most recent month-end performance updates.
Annual operating expense ratio (%)*
| Class A | | | 1.35 | | |
| Class B | | | 2.10 | | |
| Class C | | | 2.10 | | |
| Class Z | | | 1.10 | | |
Annual operating expense ratio
after contractual waivers (%)*
| Class A | | | 1.23 | | |
| Class B | | | 1.98 | | |
| Class C | | | 1.98 | | |
| Class Z | | | 0.98 | | |
*The annual operating expense ratio and annual operating expense ratio after contractual waivers are as stated in the fund's prospectus that is current as of the date of this report. The contractual waiver expires on 12/31/07. Differences in expense ratios disclosed elsewhere in this report may result from including fee waivers and reimbursements as well as different time periods used in calculating the ratios.
Growth of a $10,000 investment 11/09/00 – 08/31/07
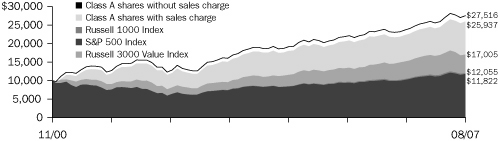 | |
|
The chart above shows the growth in value of a hypothetical $10,000 investment in Class A shares of Columbia Strategic Investor Fund during the stated time period, and does not reflect the deduction of taxes that a shareholder may pay on fund distributions or the redemption of fund shares. The Russell 1000 Index tracks the performance of 1,000 of the largest US companies, based on market capitalization. The Russell 3000 Value Index measures the performance of those Russell 3000 Index companies with lower price-to-book ratios and lower forecasted growth values. The stocks in this index are also members of either the Russell 1000 Value or the Russell 2000 Value indexes. The Standard & Poor's (S&P) 500 Index tracks the performance of 500 widely held, large-capitalization US stocks. Indices are not investments, do not incur fees or expenses and are not professionally managed. It is not possible to invest directly in an index . Securities in the fund may not match those in an index.
Performance of a $10,000 investment 11/09/00 – 08/31/07 ($)
| Sales charge | | without | | with | |
| Class A | | | 27,516 | | | | 25,937 | | |
| Class B | | | 26,508 | | | | 26,508 | | |
| Class C | | | 26,505 | | | | 26,505 | | |
| Class Z | | | 27,848 | | | | n/a | | |
Average annual total return as of 08/31/07 (%)
| Share class | | A | | B | | C | | Z | |
| Inception | | 11/01/02 | | 11/01/02 | | 10/13/03 | | 11/09/00 | |
| Sales charge | | without | | with | | without | | with | | without | | with | | without | |
| 1-year | | | 16.33 | | | | 9.64 | | | | 15.50 | | | | 10.50 | | | | 15.43 | | | | 14.43 | | | | 16.62 | | |
| 5-year | | | 15.01 | | | | 13.66 | | | | 14.16 | | | | 13.92 | | | | 14.15 | | | | 14.15 | | | | 15.29 | | |
| Life | | | 16.03 | | | | 15.03 | | | | 15.39 | | | | 15.39 | | | | 15.39 | | | | 15.39 | | | | 16.23 | | |
Average annual total return as of 09/30/07 (%)
| Share class | | A | | B | | C | | Z | |
| Sales charge | | without | | with | | without | | with | | without | | with | | without | |
| 1-year | | | 21.37 | | | | 14.39 | | | | 20.49 | | | | 15.49 | | | | 20.42 | | | | 19.42 | | | | 21.64 | | |
| 5-year | | | 18.87 | | | | 17.46 | | | | 17.97 | | | | 17.77 | | | | 17.97 | | | | 17.97 | | | | 19.16 | | |
| Life | | | 16.83 | | | | 15.83 | | | | 16.19 | | | | 16.19 | | | | 16.19 | | | | 16.19 | | | | 17.04 | | |
The "with sales charge" returns include the maximum initial sales charge of 5.75% for Class A shares, the applicable contingent deferred sales charge of 5.00% in the first year, declining to 1.00% in the sixth year, and eliminated thereafter for Class B shares and 1.00% for Class C shares for the first year only. The "without sales charge" returns do not include the effect of sales charges. If they had, returns would be lower.
Performance results reflect any waivers or reimbursements of fund expenses by the investment advisor and/or any of its affiliates. Absent these waivers or reimbursement arrangements, performance results would have been lower.
All results shown assume the reinvestment of distributions. Class Z shares are sold at net asset value with no Rule 12b-1 fees. Class Z shares have limited eligibility and the investment minimum requirements may vary. Please see the fund's prospectus for details. Performance for different share classes will vary based on differences in sales charges and fees associated with each class.
The tables do not reflect the deduction of taxes that a shareholder may pay on fund distributions or the redemption of fund shares.
Classes A and B share performance information includes returns of the fund's Class Z shares (the oldest existing fund class) for periods prior to the inception of the newer class shares. The returns for Class C include the returns of Class B prior to 10/13/03, the date on which Class C was initially offered by the fund. The returns shown for Class C also include the performance of Class Z prior to the inception of Class B (11/01/02). Class Z share returns are not restated to reflect any expense differential (such as Rule 12b-1 fees) between Class Z shares and the newer class shares. Had the expense differential been reflected, the returns for the periods prior to the inception of Classes A, B and C would have been lower.
28
Understanding Your Expenses – Columbia Strategic Investor Fund
As a fund shareholder, you incur two types of costs. There are transaction costs, which generally include sales charges on purchases and may include redemption or exchange fees. There are also ongoing costs, which generally include investment advisory fees, Rule 12b-1 fees and other fund expenses. The information on this page is intended to help you understand the ongoing costs of investing in the fund and to compare these costs with the ongoing costs of investing in other mutual funds.
Analyzing your fund's expenses by share class
To illustrate these ongoing costs, we have provided an example and calculated the expenses paid by investors in each share class during the period. The information in the following table is based on an initial investment of $1,000.00, which is invested at the beginning of the reporting period and held for the entire period. Expense information is calculated two ways and each method provides you with different information. The amount listed in the "actual" column is calculated using the fund's actual operating expenses and total return for the period. The amount listed in the "hypothetical" column for each share class assumes that the return each year is 5% before expenses and is calculated based on the fund's actual operating expenses. You should not use the hypothetical account values and expenses to estimate either your actual account balance at the end of the period or the expenses you paid during this reporting period.
Compare with other funds
Since all mutual funds are required to include the same hypothetical calculations about expenses in shareholder reports, you can use this information to compare the ongoing costs of investing in the fund with other funds. To do so, compare the 5% hypothetical example with the 5% hypothetical examples that appear in the shareholder reports of other funds. As you compare hypothetical examples of other funds, it is important to note that hypothetical examples are meant to highlight the ongoing costs of investing in a fund and do not reflect any transaction costs, such as sales charges, redemption fees or exchange fees.
Estimating your actual expenses
To estimate the expenses that you paid over the period, first you will need your account balance at the end of the period:
g For shareholders who receive their account statements from Columbia Management Services, Inc., your account balance is available online at www.columbiafunds.com or by calling Shareholder Services at 800.345.6611.
g For shareholders who receive their account statements from their brokerage firm, contact your brokerage firm to obtain your account balance.
1. Divide your ending account balance by $1,000.00. For example, if an account balance was $8,600.00 at the end of the period, the result would be 8.6.
2. In the section of the table below titled "Expenses paid during the period," locate the amount for your share class. You will find this number in the column labeled "actual." Multiply this number by the result from step 1. Your answer is an estimate of the expenses you paid on your account during the period.
A minimum account balance fee of $20 that is charged once per year may be assessed if the value of your account falls below the minimum initial investment applicable to you. This fee is not included in the accompanying table. If you are subject to the fee, keep it in mind when you are estimating the ongoing expenses of investing in the fund and when comparing the expenses of this fund with other funds.
03/01/07 – 08/31/07
| | | Account value at the
beginning of the period ($) | | Account value at the
end of the period ($) | | Expenses paid
during the period ($) | | Fund's annualized
expense ratio (%) | |
| | | Actual | | Hypothetical | | Actual | | Hypothetical | | Actual | | Hypothetical | | Actual | |
| Class A | | | 1,000.00 | | | | 1,000.00 | | | | 1,076.68 | | | | 1,019.00 | | | | 6.44 | | | | 6.26 | | | | 1.23 | | |
| Class B | | | 1,000.00 | | | | 1,000.00 | | | | 1,072.69 | | | | 1,015.22 | | | | 10.34 | | | | 10.06 | | | | 1.98 | | |
| Class C | | | 1,000.00 | | | | 1,000.00 | | | | 1,072.69 | | | | 1,015.22 | | | | 10.34 | | | | 10.06 | | | | 1.98 | | |
| Class Z | | | 1,000.00 | | | | 1,000.00 | | | | 1,078.09 | | | | 1,020.27 | | | | 5.13 | | | | 4.99 | | | | 0.98 | | |
Expenses paid during the period are equal to the annualized expense ratio for the share class, multiplied by the average account value over the period, then multiplied by the number of days in the fund's most recent fiscal half-year and divided by 365.
Had the investment advisor and/or any of its affiliates not waived or reimbursed a portion of expenses, account value at the end of the period would have been reduced.
It is important to note that the expense amounts shown in the table are meant to highlight only ongoing costs of investing in the fund and do not reflect any transaction costs, such as sales charges, redemption fees or exchange fees. Therefore, the hypothetical examples provided may not help you determine the relative total costs of owning shares of different funds. If these transaction costs were included, your costs would have been higher.
29
Portfolio Managers' Report – Columbia Strategic Investor Fund
Performance data quoted represents past performance and current performance may be lower or higher. Past performance is no guarantee of future results. The investment return and principal value will fluctuate so that shares, when redeemed, may be worth more or less than the original cost. Please visit www.columbiafunds.com for daily and most recent month-end performance updates.
Net asset value per share
as of 08/31/07 ($)
| Class A | | | 21.48 | | |
| Class B | | | 20.96 | | |
| Class C | | | 20.96 | | |
| Class Z | | | 21.53 | | |
Distributions declared per share
09/01/06 – 08/31/07 ($)
| Class A | | | 2.78 | | |
| Class B | | | 2.68 | | |
| Class C | | | 2.68 | | |
| Class Z | | | 2.84 | | |
For the 12-month period that ended August 31, 2007, Columbia Strategic Investor Fund Class A shares returned 16.33% without sales charge. The fund outperformed the 15.27% return of the Russell 1000 Index1, and the 14.86% average return of its peer group, the Lipper Multi-Cap Core Funds Classification.2 The fund also outperformed the 12.31% and 15.13% return of its former benchmarks, the Russell 3000 Value Index1 and the S&P 500 Index1, respectively. Beginning on February 23, 2007, the fund's benchmark was changed to the Russell 1000 Index. The advisor believes that the Russell 1000 Index, because of its broader market representation, more accurately reflects the type of securities in which the fund invests. Stock selection, especially in the energy and health care sectors, benefited performance during the period.
Solid returns from energy, health care and other sectors
Within the energy sector, Transocean, Inc., Cameron International Corp. and Dresser-Rand Group, Inc., which was sold during the period, benefited performance. On the international front, Wellstream Holdings PLC and Petroplus Holdings AG also did well. By contrast, Peabody Energy Corp. and Goodrich Petroleum Corp. (sold from the fund), were disappointments.
The health care sector was another area of relative strength for the fund. US health care companies Onyx Pharmaceuticals, Inc., Medco Health Solutions, Inc. and Illumina, Inc. benefited performance as did international holdings Mindray Medical International Ltd. and Grifols SA. However, Bristol-Myers Squibb Co. and Novartis AG were disappointments and both stocks were sold from the fund.
In addition to energy and health care, the fund's holdings in the consumer discretionary, materials, utilities and consumer staples sectors delivered good relative performance. An underweight in the financial sector, which came under pressure during the period, also benefited relative performance.
Technology and industrials disappointed
Technology and industrial stocks were a source of disappointment for the fund for the period. Within technology, Samsung Electronics Ltd., CSR PLC, Knot, Inc., Dell, Inc., and Red Hat, Inc. were disappointments and were sold from the fund. Within industrials, UTI Worldwide, Inc., Ultrapetrol (Bahamas) Ltd. and GOL Linhas Aereas Inteligentes SA (sold from the fund), were disappointments and detracted from results. Yet, there were several technology and industrial names that benefited performance, including Nokia Oyj, NVIDIA Corp., McDermott International, Inc. and Goodrich Corp.
1The Russell 1000 Index tracks the performance of 1,000 of the largest US companies, based on market capitalization. The Russell 3000 Value Index measures the performance of those Russell 3000 Index companies with lower price-to-book ratios and lower forecasted growth values. The stocks in this index are also members of either the Russell 1000 Value or the Russell 2000 Value indexes. The Standard & Poor's (S&P) 500 Index tracks the performance of 500 widely held, large-capitalization US stocks. Indices are not investments, do not incur fees or expenses and are not professionally managed. It is not possible to invest directly in an index.
2Lipper Inc., a widely respected data provider in the industry, calculates an average total return (assuming reinvestment of distributions) for mutual funds with investment objectives similar to those of the fund. Lipper makes no adjustment for the effect of sales loads.
30
Portfolio Managers' Report (continued) – Columbia Strategic Investor Fund
Looking forward
We are concerned about the maturity of the US economic cycle and credit issues in the system. As a result, we plan to maintain an underweight position in the financials sector. We feel more favorably toward energy. We plan to continue to evaluate investment opportunities overseas, considering areas with potentially compelling growth trends.
Portfolio holdings and characteristics are subject to change and may not be representative of current holdings and characteristics. The outlook for the fund may differ from that presented for other Columbia Funds.
Equity investments are affected by stock market fluctuations that occur in response to economic and business developments.
Investments in small- and mid-cap companies may be subject to greater volatility and price fluctuations because they may be thinly traded and less liquid. Value stocks may also be subject to specific business risks that have caused the stocks to be out of favor.
Top 5 sectors
as of 08/31/07 (%)
| Financials | | | 17.1 | | |
| Information Technology | | | 16.0 | | |
| Health Care | | | 12.7 | | |
| Energy | | | 12.2 | | |
| Industrials | | | 10.7 | | |
Top 10 holdings
as of 08/31/07 (%)
| Exxon Mobil Corp. | | | 2.7 | | |
| Citigroup, Inc. | | | 2.2 | | |
| Procter & Gamble Co. | | | 1.8 | | |
| Cisco Systems, Inc. | | | 1.8 | | |
| Google, Inc. | | | 1.7 | | |
| Hewlett-Packard Co. | | | 1.6 | | |
| JPMorgan Chase & Co. | | | 1.6 | | |
| AT&T, Inc. | | | 1.5 | | |
| General Electric Co. | | | 1.5 | | |
| Freddie Mac | | | 1.3 | | |
Holdings discussed in this report
| as of 08/31/07 (%) | |
| Transocean, Inc. | | | 0.5 | | |
| Cameron International Corp. | | | 0.7 | | |
| Wellstream Holdings PLC | | | 0.4 | | |
| Petroplus Holdings AG | | | 0.2 | | |
| Peabody Energy | | | 0.3 | | |
| Onyx Pharmaceuticals, Inc. | | | 0.3 | | |
| Medco Health Solutions, Inc. | | | 0.7 | | |
| Illumina, Inc. | | | 0.3 | | |
Mindray Medical
International Ltd. | | | 0.4 | | |
| Grifols SA | | | 0.2 | | |
| UTI Worldwide, Inc. | | | 0.3 | | |
| Ultrapetrol (Bahamas) Ltd. | | | 0.2 | | |
| Nokia Oyj | | | 0.9 | | |
| NVIDIA Corp. | | | 0.4 | | |
| McDermott International, Inc. | | | 0.8 | | |
| Goodrich Corp. | | | 0.6 | | |
Your fund is actively managed and the composition of its portfolio will change over time. Information provided is calculated as a percentage of net assets.
31
Fund Profile – Columbia Balanced Fund
Performance data quoted represents past performance and current performance may be lower or higher. Past performance is no guarantee of future results. The investment return and principal value will fluctuate so that shares, when redeemed, may be worth more or less than the original cost. Please visit www.columbiafunds.com for daily and most recent month-end performance updates.
Summary
1 year return as of 08/31/07
| | +12.26% | |
|
 | | Class A shares
(without sales charge) | |
|
| | +15.13% | |
|
 | | S&P 500 Index | |
|
| | +5.26% | |
|
 | | Lehman Brothers U.S. Aggregate
Bond Index | |
|
Summary
g For the 12-month period ended August 31, 2007, the fund's Class A shares returned 12.26% without sales charge. The fund outperformed the average return of similar funds during the period.
g Favorable stock selection, especially within the consumer discretionary and consumer staples sectors, helped the fund achieve its solid performance.
g The fund's fixed-income performance was aided by holdings of intermediate maturity bonds but held back by positions in the corporate and mortgage sectors.
Portfolio Management
Columbia Balanced Fund is managed by a manager from Columbia's large-cap core team:
Guy W. Pope
and by managers from Columbia's bond team:
Leonard A. Aplet Ronald B. Stahl Kevin L. Cronk Thomas A. LaPointe
Guy W. Pope has co-managed the fund since 1997 and has been with the advisor, or its predecessors or affiliate organizations since 1993.
Leonard A. Aplet has co-managed the fund since 1991 and has been with the advisor, or its predecessors or affiliate organizations since 1987.
Ronald B. Stahl has co-managed the fund since 2005 and has been with the advisor, or its predecessors or affiliate organizations since 1998.
Kevin L. Cronk has co-managed the fund since 2006 and has been with the advisor, or its predecessors or affiliate organizations since 1999.
Thomas A. LaPointe has co-managed the fund since 2006 and has been with the advisor, or its predecessors or affiliate organizations since 1999.
The S&P 500 Index tracks the performance of 500 widely held, large capitalization US stocks. The Lehman Brothers U.S. Aggregate Bond Index is a market value-weighted index that tracks the daily price, coupon, pay-downs, and total return performance of fixed-rate, publicly placed, dollar denominated, and non-convertible investment grade debt issues with at least $250 million par amount outstanding and with at least one year to final maturity. Indices are not investments, do not incur fees or expenses and are not professionally managed. It is not possible to invest directly in an index. Securities in the fund may not match those in an index.
32
Performance Information – Columbia Balanced Fund
Growth of a $10,000 investment 09/01/97 – 08/31/07
The chart above shows the growth in value of a hypothetical $10,000 investment in Class A shares of Columbia Balanced Fund during the stated time period, and does not reflect the deduction of taxes that a shareholder may pay on fund distributions or the redemption of fund shares. The Standard & Poor's (S&P) 500 Index tracks the performance of 500 widely held, large-capitalization US stocks. The Lehman Brothers U.S. Aggregate Bond Index is a market value-weighted index that tracks the daily price, coupon, pay-downs, and total return performance of fixed-rate, publicly placed, dollar-denominated, and non-convertible investment grade debt issues with at least $250 million par amount outstanding and with at least one year to final maturity. Indices are not investments, do not incur fees or expenses and are not professionally managed. It is not possible to invest directly in an index. Securities in the fund may not match thos e in an index.
Performance of a $10,000 investment 09/01/97 – 08/31/07 ($)
| Sales charge | | without | | with | |
| Class A | | | 17,612 | | | | 16,600 | | |
| Class B | | | 16,986 | | | | 16,986 | | |
| Class C | | | 16,986 | | | | 16,986 | | |
| Class Z | | | 17,871 | | | | n/a | | |
Average annual total return as of 08/31/07 (%)
| Share class | | A | | B | | C | | Z | |
| Inception | | 11/01/02 | | 11/01/02 | | 10/13/03 | | 10/01/91 | |
| Sales charge | | without | | with | | without | | with | | without | | with | | without | |
| 1-year | | | 12.26 | | | | 5.80 | | | | 11.45 | | | | 6.45 | | | | 11.40 | | | | 10.40 | | | | 12.49 | | |
| 5-year | | | 8.51 | | | | 7.23 | | | | 7.73 | | | | 7.43 | | | | 7.73 | | | | 7.73 | | | | 8.83 | | |
| 10-year | | | 5.82 | | | | 5.20 | | | | 5.44 | | | | 5.44 | | | | 5.44 | | | | 5.44 | | | | 5.98 | | |
Average annual total return as of 09/30/07 (%)
| Share class | | A | | B | | C | | Z | |
| Sales charge | | without | | with | | without | | with | | without | | with | | without | |
| 1-year | | | 13.86 | | | | 7.32 | | | | 12.99 | | | | 7.99 | | | | 13.03 | | | | 12.03 | | | | 14.16 | | |
| 5-year | | | 10.50 | | | | 9.20 | | | | 9.68 | | | | 9.40 | | | | 9.69 | | | | 9.69 | | | | 10.83 | | |
| 10-year | | | 5.88 | | | | 5.25 | | | | 5.49 | | | | 5.49 | | | | 5.49 | | | | 5.49 | | | | 6.04 | | |
The "with sales charge" returns include the maximum initial sales charge of 5.75% for Class A shares, the applicable contingent deferred sales charge of 5.00% in the first year, declining to 1.00% in the sixth year, and eliminated thereafter for Class B shares and 1.00% for Class C shares for the first year only. The "without sales charge" returns do not include the effect of sales charges. If they had, returns would be lower.
Performance results reflect any waivers or reimbursements of fund expenses by the investment advisor and/or any of its affiliates. Absent these waivers or reimbursement arrangements, performance results would have been lower.
All results shown assume reinvestment of distributions. Class Z shares are sold at net asset value with no Rule 12b-1 fees. Class Z shares have limited eligibility and the investment minimum requirements may vary. Please see the fund's prospectus for details. Performance for different share classes will vary based on differences in sales charges and fees associated with each class.
The tables do not reflect the deduction of taxes that a shareholder may pay on fund distributions or the redemption of fund shares.
Classes A and B share performance information includes returns of the fund's Class Z shares (the oldest existing fund class) for periods prior to the inception of the newer class shares. The returns for Class C include the returns of Class B prior to 10/13/03, the date on which Class C was initially offered by the fund. The returns shown for Class C also include the performance of Class Z prior to the inception of Class B (11/01/02). Class Z share returns are not restated to reflect any expense differential (such as Rule 12b-1 fees) between Class Z shares and the newer class shares. Had the expense differential been reflected, the returns for the periods prior to the inception of Classes A, B, and C would have been lower.
Performance data quoted represents past performance and current performance may be lower or higher. Past performance is no guarantee of future results. The investment return and principal value will fluctuate so that shares, when redeemed, may be worth more or less than the original cost. Please visit www.columbiafunds.com for daily and most recent month-end performance updates.
Annual operating expense ratio (%)*
| Class A | | | 0.98 | | |
| Class B | | | 1.73 | | |
| Class C | | | 1.73 | | |
| Class Z | | | 0.73 | | |
*The annual operating expense ratio is as stated in the fund's prospectus that is current as of the date of this report. Differences in expense ratios disclosed elsewhere in this report may result from including fee waivers and reimbursements as well as different time periods used in calculating the ratios.
33
Understanding Your Expenses – Columbia Balanced Fund
Estimating your actual expenses
To estimate the expenses that you paid over the period, first you will need your account balance at the end of the period:
g For shareholders who receive their account statements from Columbia Management Services, Inc., your account balance is available online at www.columbiafunds.com or by calling Shareholder Services at 800.345.6611.
g For shareholders who receive their account statements from their brokerage firm, contact your brokerage firm to obtain your account balance.
1. Divide your ending account balance by $1,000.00, For example, if an account balance was $8,600.00 at the end of the period, the result would be 8.6.
2. In the section of the table below titled "Expenses paid during the period," locate the amount for your share class. You will find this number in the column labeled "actual." Multiply this number by the result from step 1. Your answer is an estimate of the expenses you paid on your account during the period.
A minimum account balance fee of $20 that is charged once per year may be assessed if the value of your account falls below the minimum initial investment applicable to you. This fee is not included in the accompanying table. If you are subject to the fee, keep it in mind when you are estimating the ongoing expenses of investing in the fund and when comparing the expenses of this fund with other funds.
As a fund shareholder, you incur two types of costs. There are transaction costs, which generally include sales charges on purchases and may include redemption or exchange fees. There are also ongoing costs, which generally include investment advisory fees, Rule 12b-1 fees and other fund expenses. The information on this page is intended to help you understand the ongoing costs of investing in the fund and to compare these costs with the ongoing costs of investing in other mutual funds.
Analyzing your fund's expenses by share class
To illustrate these ongoing costs, we have provided an example and calculated the expenses paid by investors in each share class during the period. The information in the following table is based on an initial investment of $1,000.00, which is invested at the beginning of the reporting period and held for the entire period. Expense information is calculated two ways and each method provides you with different information. The amount listed in the "actual" column is calculated using the fund's actual operating expenses and total return for the period. The amount listed in the "hypothetical" column for each share class assumes that the return each year is 5% before expenses and is calculated based on the fund's actual operating expenses. You should not use the hypothetical account values and expenses to estimate either your actual account balance at the end of the period or the expenses you paid during this reporting period.
Compare with other funds
Since all mutual funds are required to include the same hypothetical calculations about expenses in shareholder reports, you can use this information to compare the ongoing costs of investing in the fund with other funds. To do so, compare the 5% hypothetical example with the 5% hypothetical examples that appear in the shareholder reports of other funds. As you compare hypothetical examples of other funds, it is important to note that hypothetical examples are meant to highlight the ongoing costs of investing in a fund and do not reflect any transaction costs, such as sales charges, redemption fees or exchange fees.
03/01/07 – 08/31/07
| | | Account value at the
beginning of the period ($) | | Account value at the
end of the period ($) | | Expenses paid
during the period ($) | | Fund's annualized
expense ratio (%) | |
| | | Actual | | Hypothetical | | Actual | | Hypothetical | | Actual | | Hypothetical | | Actual | |
| Class A | | | 1,000.00 | | | | 1,000.00 | | | | 1,044.41 | | | | 1,020.06 | | | | 5.26 | | | | 5.19 | | | | 1.02 | | |
| Class B | | | 1,000.00 | | | | 1,000.00 | | | | 1,040.58 | | | | 1,016.28 | | | | 9.10 | | | | 9.00 | | | | 1.77 | | |
| Class C | | | 1,000.00 | | | | 1,000.00 | | | | 1,040.58 | | | | 1,016.28 | | | | 9.10 | | | | 9.00 | | | | 1.77 | | |
| Class Z | | | 1,000.00 | | | | 1,000.00 | | | | 1,045.32 | | | | 1,021.32 | | | | 3.97 | | | | 3.92 | | | | 0.77 | | |
Expenses paid during the period are equal to the annualized expense ratio for the share class, multiplied by the average account value over the period, then multiplied by the number of days in the fund's most recent fiscal half-year and divided by 365.
It is important to note that the expense amounts shown in the table are meant to highlight only ongoing costs of investing in the fund and do not reflect any transaction costs, such as sales charges, redemption fees or exchange fees. Therefore, the hypothetical examples provided may not help you determine the relative total costs of owning shares of different funds. If these transaction costs were included, your costs would have been higher.
34
Portfolio Managers' Report – Columbia Balanced Fund
For the 12-month period ended August 31, 2007, Columbia Balanced Fund Class A shares returned 12.26% without sales charge. The S&P 500 Index returned 15.13% and the Lehman Brothers U.S. Aggregate Bond Index returned 5.26%.1 The fund's return was above the 11.23% average return of its peer group, the Morningstar Moderate Allocation Funds Category.2 The fund's sizable allocation to the equity markets helped its performance relative to its peer group.
Positive economic growth, without meaningful inflation set the stage for positive performance from both the equity and fixed-income markets. The equity markets performed especially well. Because stocks outperformed bonds by approximately ten percentage points, the fund benefited from its decision to allocate between 60% and 65% of its total net assets to the equity markets. Pursuant to the fund's principal investment strategies, an allocation of 65% of the fund's total net assets in equities is the largest allowable allocation to such securities.
Favorable stock selection enabled the equity portion of the fund to exceed its internal benchmarks. With domestic operating margins at or near peak levels, we sought incremental growth by moving into large-capitalization growth stocks with exposure to emerging economies. Investments in NIKE, Inc. and Coca-Cola Co. were representative of this strategy, and both stocks handily outperformed the market. Elsewhere within the consumer sector, a contrarian approach led us to purchase Coach, Inc. at attractive levels in 2006, and we were rewarded when the subsequent strength of the high-end consumer segment exceeded investor expectations. We also benefited from the takeovers of fund holdings Hilton Hotels Corp. and MedImmune during the period. One disappointment came from Getty Images, Inc., which continued to face pressure from increased competition. Because we viewed this issue as secular rather than transitory, we eliminated the stoc k from the portfolio.
The fund's fixed-income investments held their own against their competitive benchmarks. The environment was characterized by slightly lower interest rates across all maturities, as the Federal Reserve Board (the Fed) kept the federal funds rate at 5.25% throughout the period. The fund benefited by emphasizing intermediate bonds, which outperformed securities at either end of the maturity spectrum. In general, non-Treasury securities underperformed Treasury securities, so our decision to trim exposure to corporate bonds also proved helpful. Among the corporate positions that we retained, we enjoyed strong relative performance from positions in the natural gas, media, utility and REIT sectors.
Our decision to increase exposure to commercial mortgage-backed securities detracted from the fund's overall fixed-income performance. Although our purchases were restricted to loans with high credit quality, investor concerns about the housing market and defaults on subprime mortgages affected virtually all mortgage-related securities during the spring and summer of 2007. Our decision to overweight 30-year mortgage pass-throughs also detracted from performance.
1The S&P 500 Index tracks the performance of 500 widely held, large capitalization US stocks. The Lehman Brothers U.S. Aggregate Bond Index is a market value-weighted index that tracks the daily price, coupon, pay-downs, and total return performance of fixed-rate, publicly placed, dollar denominated, and non-convertible investment grade debt issues with at least $250 million par amount outstanding and with at least one year to final maturity. Indices are not investments, do not incur fees or expenses and are not professionally managed. It is not possible to invest directly in an index. Securities in the fund may not match those in an index.
2©2007 by Morningstar, Inc. All rights reserved. The information contained herein is the proprietary information of Morningstar, Inc., may not be copied or redistributed for any purpose and may only be used for non-commercial, personal purposes. The information contained herein is not represented or warranted to be accurate, correct, complete or timely. Morningstar, Inc. shall not be responsible for investment decisions, damages or other losses resulting from the use of this information. Past performance is no guarantee of future performance. Morningstar, Inc. has not granted consent for it to be considered or deemed an "expert" under the Securities Act of 1933. Morningstar Categories compare the performance of funds with similar investment objectives and strategies.
Performance data quoted represents past performance and current performance may be lower or higher. Past performance is no guarantee of future results. The investment return and principal value will fluctuate so that shares, when redeemed, may be worth more or less than the original cost. Please visit www.columbiafunds.com for daily and most recent month-end performance updates.
Net asset value per share
as of 08/31/07 ($)
| Class A | | | 24.77 | | |
| Class B | | | 24.73 | | |
| Class C | | | 24.73 | | |
| Class Z | | | 24.75 | | |
Distributions declared per share
09/01/06 – 08/31/07 ($)
| Class A | | | 0.48 | | |
| Class B | | | 0.30 | | |
| Class C | | | 0.30 | | |
| Class Z | | | 0.54 | | |
35
Portfolio Managers' Report (continued) – Columbia Balanced Fund
Portfolio composition
as of 08/31/07 (%)
| Common Stocks | | | 61.7 | | |
| Mortgage-Backed Securities | | | 11.4 | | |
| Corporate Fixed-Income | |
| Bonds & Notes | | | 9.2 | | |
Government & Agency
Obligations | | | 5.5 | | |
| Collateralized Mortgage | |
| Obligations | | | 5.1 | | |
| Commercial Mortgage-Backed | |
| Securities | | | 3.0 | | |
| Asset-Backed Securities | | | 1.0 | | |
| Net Cash & Equivalents | | | 3.1 | | |
Top 10 equity holdings
as of 08/31/07 (%)
| General Electric Co. | | | 2.4 | | |
| Microsoft Corp. | | | 2.3 | | |
| Cisco Systems, Inc. | | | 1.9 | | |
| ConocoPhillips | | | 1.8 | | |
| Coca-Cola Co. | | | 1.7 | | |
| Berkshire Hathaway, Inc. | | | 1.6 | | |
| Abbott Laboratories | | | 1.5 | | |
| JPMorgan Chase & Co. | | | 1.5 | | |
| Google, Inc. | | | 1.5 | | |
| Citigroup, Inc. | | | 1.4 | | |
Tables exclude investment in short-term obligation.
Holdings discussed in this report
as of 08/31/07 (%)
| NIKE, Inc. | | | 1.0 | | |
| Coca-Cola Co. | | | 1.7 | | |
| Coach, Inc. | | | 0.6 | | |
Your fund is actively managed and the composition of its portfolio will change over time. Information provided is calculated as a percentage of net assets.
Looking forward, we expect moderate economic growth and contained core inflation in the months ahead, suggesting that the Fed may be able to reduce the federal funds rate—a key short-term borrowing rate—going forward.3 The fund's fixed-income investments remained centered on intermediate bonds, while our equity strategy of emphasizing traditional growth stocks appears well-suited to a maturing economy.
Portfolio holdings and characteristics are subject to change and may not be representative of current holdings and characteristics. The outlook for the fund may differ from that presented for other Columbia Funds.
Equity investments are affected by stock market fluctuations that occur in response to economic and business developments.
Investing in fixed-income securities may involve certain risks, including the credit quality of individual issuers, possible prepayments, market or economic developments and yield and share price fluctuations due to changes in interest rates. When interest rates go up, bond prices typically drop, and vice versa.
Investing in high-yield securities (commonly known as "junk" bonds) offers the potential for high current income and attractive total returns but involves certain risks. Changes in economic conditions or other circumstances may adversely affect a junk bond issuer's ability to make principal and interest payments. Rising interest rates tend to lower the value of all bonds.
3In September, the Fed lowered the federal funds rate to 4.75%.
36
Fund Profile – Columbia Oregon Intermediate Municipal Bond Fund
Summary
g For the 12-month period that ended August 31, 2007, the fund's Class A shares returned 1.92% without sales charge.
g Pre-refunded bonds, single-family housing bonds and positions in lower-rated credits all benefited the fund's return.
g A decision to lengthen the fund's duration—a measure of interest rate sensitivity—detracted from performance.
Portfolio Management
Brian M. McGreevy has managed the fund since December 2003 and has been with the advisor, or its predecessors or affiliate organizations since 1994.
The Lehman Brothers General Obligation Bond Index represents average market-weighted performance of general obligation securities that have been issued in the last five years with maturities greater than one year. Indices are not investments, do not incur fees or expenses and are not professionally managed. It is not possible to invest directly in an index. Securities in the fund may not match those in an index.
The Morningstar Style BoxTM reveals a fund's investment strategy. For equity funds the vertical axis shows the market capitalization of the stocks owned, and the horizontal axis shows a fund's investment style (value, blend or growth). For fixed-income funds the vertical axis shows the average credit quality of the bonds owned, and the horizontal axis shows interest rate sensitivity as measured by a bond's duration (short, intermediate or long). All of these numbers are drawn from the data most recently provided by the fund and entered into Morningstar's database as of month-end. Although the data is gathered from reliable sources, Morningstar cannot guarantee completeness and accuracy. Information is as of 06/30/2007.
Performance data quoted represents past performance and current performance may be lower or higher. Past performance is no guarantee of future results. The investment return and principal value will fluctuate so that shares, when redeemed, may be worth more or less than the original cost. Please visit www.columbiafunds.com for daily and most recent month-end performance updates.
Summary
1 year return as of 08/31/07
| | +1.92% | |
|
 | | Class A shares
(without sales charge) | |
|
| | +2.65% | |
|
 | | Lehman Brothers General
Obligation Bond Index | |
|
Morningstar Style Box
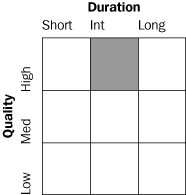
37
Performance Information – Columbia Oregon Intermediate Municipal Bond Fund
Performance data quoted represents past performance and current performance may be lower or higher. Past performance is no guarantee of future results. The investment return and principal value will fluctuate so that shares, when redeemed, may be worth more or less than the original cost. Please visit www.columbiafunds.com for daily and most recent month-end performance updates.
Annual operating expense ratio (%)*
| Class A | | | 0.89 | | |
| Class B | | | 1.64 | | |
| Class C | | | 1.64 | | |
| Class Z | | | 0.64 | | |
*The annual operating expense ratio is as stated in the fund's prospectus that is current as of the date of this report. Differences in expense ratios disclosed elsewhere in this report may result from including fee waivers and reimbursements as well as different time periods used in calculating the ratios.
Growth of a $10,000 investment 09/01/97 – 08/31/07
The chart above shows the growth in value of a hypothetical $10,000 investment in Class A shares of Columbia Oregon Intermediate Municipal Bond Fund during the stated time period, and does not reflect the deduction of taxes that a shareholder may pay on fund distributions or the redemption of fund shares. The growth of $10,000 with sales charge for Class A is calculated with an initial sales charge of 4.75%. The Lehman Brothers General Obligation Bond Index represents average market-weighted performance of general obligation securities that have been issued in the last five years with maturities greater than one year. Indices are not investments, do not incur fees or expenses and are not professionally managed. It is not possible to invest directly in an index. Securities in the fund may not match those in an index.
Performance of a $10,000 investment 09/01/97 – 08/31/07 ($)
| Sales charge | | without | | with | |
| Class A | | | 15,537 | | | | 14,803 | | |
| Class B | | | 14,983 | | | | 14,983 | | |
| Class C | | | 15,192 | | | | 15,192 | | |
| Class Z | | | 15,756 | | | | n/a | | |
Average annual total return as of 08/31/07 (%)
| Share class | | A | | B | | C | | Z | |
| Inception | | 11/01/02 | | 11/01/02 | | 10/13/03 | | 07/02/84 | |
| Sales charge | | without | | with | | without | | with | | without | | with | | without | |
| 1-year | | | 1.92 | | | | –1.39 | | | | 1.16 | | | | –1.78 | | | | 1.52 | | | | 0.54 | | | | 2.18 | | |
| 5-year | | | 3.34 | | | | 2.34 | | | | 2.59 | | | | 2.59 | | | | 2.88 | | | | 2.88 | | | | 3.63 | | |
| 10-year | | | 4.50 | | | | 4.00 | | | | 4.13 | | | | 4.13 | | | | 4.27 | | | | 4.27 | | | | 4.65 | | |
Average annual total return as of 09/30/07(%)
| Share class | | A | | B | | C | | Z | |
| Sales charge | | without | | with | | without | | with | | without | | with | | without | |
| 1- year | | | 2.43 | | | | -0.89 | | | | 1.67 | | | | -1.29 | | | | 2.03 | | | | 1.04 | | | | 2.69 | | |
| 5-year | | | 3.13 | | | | 2.13 | | | | 2.37 | | | | 2.37 | | | | 2.66 | | | | 2.66 | | | | 3.42 | | |
| 10-year | | | 4.52 | | | | 4.01 | | | | 4.13 | | | | 4.13 | | | | 4.28 | | | | 4.28 | | | | 4.66 | | |
The "with sales charge" returns include the maximum initial sales charge of 3.25% for Class A shares, the applicable contingent deferred sales charge of 3.00% in the first year, declining to 1.00% in the fourth year, and eliminated thereafter for Class B shares and 1.00% for Class C shares for the first year only. The "without sales charge" returns do not include the effect of sales charges. If they had, returns would be lower.
The 5 & 10-year Class A average annual returns with sales charge as of 08/31/07 and 09/30/07 include the previous sales charge of 4.75%. The 1-year Class A average annual return with sales charge as of 08/31/07 and 09/30/07 include the new sales charge of 3.25%. This change was effective beginning August 22, 2005.
Performance results reflect any waivers or reimbursements of fund expenses by the investment advisor and/or any of its affiliates. Absent these waivers or reimbursement arrangements, performance results would have been lower.
All results shown assume reinvestment of distributions. Class Z shares are sold at net asset value with no Rule 12b-1 fees. Class Z shares have limited eligibility and the investment minimum requirements may vary. Please see the fund's prospectus for details. Performance for different share classes will vary based on differences in sales charges and fees associated with each class.
The tables do not reflect the deduction of taxes that a shareholder may pay on fund distributions or the redemption of fund shares.
Classes A and B (newer class shares) share performance information includes returns of the fund's Class Z shares (the oldest existing fund class) for periods prior to the inception of the newer class shares. The returns for Class C include the returns of Class B prior to 10/13/03, the date on which Class C was initially offered by the fund. The returns shown for Class C also include the performance of Class Z prior to the inception of Class B (11/01/02). Class Z share returns are not restated to reflect any expense differential (such as Rule 12b-1 fees) between Class Z shares and the newer class shares. Had the expense differential been reflected, the returns for the periods prior to the inception of Classes A, B, and C would have been lower.
38
Understanding Your Expenses – Columbia Oregon Intermediate Municipal Bond Fund
As a fund shareholder, you incur two types of costs. There are transaction costs, which generally include sales charges on purchases and may include redemption or exchange fees. There are also ongoing costs, which generally include investment advisory fees, Rule 12b-1 fees and other fund expenses. The information on this page is intended to help you understand the ongoing costs of investing in the fund and to compare these costs with the ongoing costs of investing in other mutual funds.
Analyzing your fund's expenses by share class
To illustrate these ongoing costs, we have provided an example and calculated the expenses paid by investors in each share class during the period. The information in the following table is based on an initial investment of $1,000.00, which is invested at the beginning of the reporting period and held for the entire period. Expense information is calculated two ways and each method provides you with different information. The amount listed in the "actual" column is calculated using the fund's actual operating expenses and total return for the period. The amount listed in the "hypothetical" column for each share class assumes that the return each year is 5% before expenses and is calculated based on the fund's actual operating expenses. You should not use the hypothetical account values and expenses to estimate either your actual account balance at the end of the period or the expenses you paid during this reporting period.
Compare with other funds
Since all mutual funds are required to include the same hypothetical calculations about expenses in shareholder reports, you can use this information to compare the ongoing costs of investing in the fund with other funds. To do so, compare the 5% hypothetical example with the 5% hypothetical examples that appear in the shareholder reports of other funds. As you compare hypothetical examples of other funds, it is important to note that hypothetical examples are meant to highlight the ongoing costs of investing in a fund and do not reflect any transaction costs, such as sales charges, redemption fees or exchange fees.
Estimating your actual expenses
To estimate the expenses that you paid over the period, first you will need your account balance at the end of the period:
g For shareholders who receive their account statements from Columbia Management Services, Inc., your account balance is available online at www.columbiafunds.com or by calling Shareholder Services at 800.345.6611.
g For shareholders who receive their account statements from their brokerage firm, contact your brokerage firm to obtain your account balance.
1. Divide your ending account balance by $1,000.00. For example, if an account balance was $8,600.00 at the end of the period, the result would be 8.6.
2. In the section of the table below titled "Expenses paid during the period," locate the amount for your share class. You will find this number in the column labeled "actual." Multiply this number by the result from step 1. Your answer is an estimate of the expenses you paid on your account during the period.
A minimum account balance fee of $20 that is charged once per year may be assessed if the value of your account falls below the minimum initial investment applicable to you. This fee is not included in the accompanying table. If you are subject to the fee, keep it in mind when you are estimating the ongoing expenses of investing in the fund and when comparing the expenses of this fund with other funds.
03/01/07 – 08/31/07
| | | Account value at the
beginning of the period ($) | | Account value at the
end of the period ($) | | Expenses paid
during the period ($) | | Fund's annualized
expense ratio (%) | |
| | | Actual | | Hypothetical | | Actual | | Hypothetical | | Actual | | Hypothetical | | Actual | |
| Class A | | | 1,000.00 | | | | 1,000.00 | | | | 997.98 | | | | 1,020.82 | | | | 4.38 | | | | 4.43 | | | | 0.87 | | |
| Class B | | | 1,000.00 | | | | 1,000.00 | | | | 994.20 | | | | 1,017.04 | | | | 8.14 | | | | 8.24 | | | | 1.62 | | |
| Class C | | | 1,000.00 | | | | 1,000.00 | | | | 996.02 | | | | 1,018.80 | | | | 6.39 | | | | 6.46 | | | | 1.27 | | |
| Class Z | | | 1,000.00 | | | | 1,000.00 | | | | 999.29 | | | | 1,022.08 | | | | 3.12 | | | | 3.16 | | | | 0.62 | | |
Expenses paid during the period are equal to the annualized expense ratio for the share class, multiplied by the average account value over the period, then multiplied by the number of days in the fund's most recent fiscal half-year and divided by 365.
Had the investment advisor and/or any of its affiliates not waived or reimbursed a portion of expenses, account value at the end of the period would have been reduced.
It is important to note that the expense amounts shown in the table are meant to highlight only ongoing costs of investing in the fund and do not reflect any transaction costs, such as sales charges, redemption fees or exchange fees. Therefore, the hypothetical examples provided may not help you determine the relative total costs of owning shares of different funds. If these transaction costs were included, your costs would have been higher.
39
Portfolio Manager's Report – Columbia Oregon Intermediate Municipal Bond Fund
Performance data quoted represents past performance and current performance may be lower or higher. Past performance is no guarantee of future results. The investment return and principal value will fluctuate so that shares, when redeemed, may be worth more or less than the original cost. Please visit www.columbiafunds.com for daily and most recent month-end performance updates.
Net asset value per share
as of 08/31/07 ($)
| Class A | | | 12.02 | | |
| Class B | | | 12.02 | | |
| Class C | | | 12.02 | | |
| Class Z | | | 12.02 | | |
Distributions declared per share
09/01/06-08/31/07 ($)
| Class A | | | 0.45 | | |
| Class B | | | 0.36 | | |
| Class C | | | 0.41 | | |
| Class Z | | | 0.48 | | |
A portion of the fund's income may be subject to the alternative minimum tax. The fund may at times purchase tax-exempt securities at a discount. Some or all of this discount may be included in the fund's ordinary income, and is taxable when distributed.
30-day SEC yields
as of 08/31/07 (%)
| Class A | | | 3.26 | | |
| Class B | | | 2.62 | | |
| Class C | | | 3.00 | | |
| Class Z | | | 3.69 | | |
The 30-day SEC yields reflect the portfolio's earning power, net of expenses, expressed as an annualized percentage of the public offering price per share at the end of the period.
Taxable-equivalent SEC yields
as of 08/31/07 (%)
| Class A | | | 5.51 | | |
| Class B | | | 4.44 | | |
| Class C | | | 5.07 | | |
| Class Z | | | 6.23 | | |
Taxable-equivalent SEC yields are based on the combined maximum effective 35.0% federal income tax rate and applicable state income tax rate. This tax rate does not reflect the phase out of exemptions or the reduction of otherwise allowable deductions that occur when adjusted gross income exceeds certain levels.
For the 12-month period that ended August 31, 2007, Columbia Oregon Intermediate Municipal Bond Fund Class A shares returned 1.92% without sales charge. This was less than the fund's benchmark, the Lehman Brothers General Obligation Bond Index, which returned 2.65%.1 The fund's return was greater than the 1.82% average return of its peer group, the Lipper Other States Intermediate Municipal Debt Funds Classification.2 Rising yields resulted in weak performance for the municipal market, with longer maturity bonds suffering more than shorter maturity securities.
Volatile markets tempered results
In general, bond yields rose and bond prices declined from late November 2006 through June 2007, with longer rates rising more than shorter-term rates. In this environment, the best performing areas were short maturity bonds and lower-rated credits. The portfolio's best-performing sectors met these criteria. These include pre-refunded bonds, in which issuers refinance a bond by selling another and investing the proceeds in US government securities—making them attractive from a quality perspective. Pre-refunded bonds typically have shorter maturities and durations, which made them attractive as interest rates rose. Approximately 27% of the fund's assets was invested in pre-refunded issues. Single-family housing bonds also bolstered returns. Usually issued by state agencies, single-family bonds represent large pools of home mortgages that are subject to stringent lending requirements, which raised their appeal as the mortgage market turned volatile. Bonds with lower-tier investment grade ratings also contributed to positive performance. At the end of the period, approximately 11% of the fund was invested in securities rated A or BBB.
Yield swings were relatively narrow for most of the period. But the subprime credit woes that pushed rates higher in the taxable credit markets eventually spread to the municipal markets. Bonds of longer duration, those that are more sensitive to interest rate moves, were most affected. The impact on fund performance was heightened because we had been lengthening the fund's overall duration in anticipation of stable to lower rates. However, rates rose instead. We used the opportunity to take some losses in the portfolio, offsetting some capital gains and helping us position the fund for improved return potential in a more stable environment.
Fed moves will set market direction
We believe that the Federal Reserve Board's response to reduced credit market liquidity is likely to drive fixed-income performance over the next several months. A cut in short-term interest rates could benefit intermediate-maturity bonds, which is the fund's focus. However, we do not expect the yield difference between lower-rated and higher-rated bonds to continue to narrow if the economy continues to slow. Credit quality among municipals remains generally high, but we continue to monitor credit factors for
1The Lehman Brothers General Obligation Bond Index represents average market-weighted performance of general obligation securities that have been issued in the last five years with maturities greater than one year. Indices are not investments, do not incur fees or expenses and are not professionally managed. It is not possible to invest directly in an index. Securities in the fund may not match those in an index.
2Lipper Inc., a widely respected data provider in the industry, calculates an average total return (assuming reinvestment of distributions) for mutual funds with investment objectives similar to those of the fund. Lipper makes no adjustment for the effect of sales loads.
40
Portfolio Manager's Report (continued) – Columbia Oregon Intermediate Municipal Bond Fund
each of the fund's holdings. We plan to continue to avoid added commitments to issues subject to the Alternative Minimum Tax (AMT) because, unless Congress changes the terms and conditions of the AMT, it will continue to affect an increasing number of taxpayers and lower their after-tax returns.
Oregon's outlook remains stable
Overall economic growth in Oregon is about on par with national figures, with state revenues exceeding most forecasts. Oregon's economy recorded its sixteenth consecutive quarter of employment growth at the end of June, when unemployment stood at 5.2%. But with a decline in manufacturing, the state is projecting more subdued growth for the balance of the year. Nevertheless, export-related jobs are up, in response to strong demand from the burgeoning Chinese economy. And although its housing market reflects the national slowdown, Oregon's home prices have risen.
Portfolio holdings and characteristics are subject to change and may not be representative of current holdings and characteristics. The outlook for the fund may differ from that presented for other Columbia Funds.
Tax-exempt investing offers current tax-exempt income, but it also involves certain risks. The value of the fund will be affected by interest rate changes and the creditworthiness of issues held in the fund. When interest rates go up, bond prices generally drop and vice versa.
Interest income from certain tax-exempt bonds may be subject to certain state and local taxes and, if applicable, the AMT. Capital gains are not exempt from income taxes.
Single-state municipal bond funds pose additional risks, due to limited geographical diversification.
Top 5 sectors
as of 08/31/07 (%)
| Tax-Backed | | | 39.4 | | |
| Other | | | 28.4 | | |
| Utilities | | | 9.3 | | |
| Health Care | | | 8.7 | | |
| Education | | | 6.3 | | |
Portfolio quality
as of 08/31/07 (%)
| AAA | | | 49.5 | | |
| AA | | | 27.9 | | |
| A | | | 6.2 | | |
| BBB | | | 5.2 | | |
| BB | | | 0.6 | | |
| Non Rated | | | 10.1 | | |
| Net Cash & Equivalents | | | 0.5 | | |
Ratings shown in the quality breakdown represent the rating assigned to a particular bond by one of the following nationally-recognized rating agencies: Standard and Poor's, Moody's Investors Service, Inc. or Fitch Ratings Ltd. Ratings are relative and subjective and are not absolute standards of quality. The fund's credit quality does not remove market risk.
Maturity breakdown
as of 08/31/07 (%)
| 0-1 year | | | 0.5 | | |
| 1-3 years | | | 9.0 | | |
| 3-5 years | | | 21.6 | | |
| 5-7 years | | | 16.4 | | |
| 7-10 years | | | 13.9 | | |
| 10-15 years | | | 23.3 | | |
| 15-20 years | | | 12.2 | | |
| 20-25 years | | | 1.5 | | |
| 25+ years | | | 1.1 | | |
| Net Cash & Equivalents | | | 0.5 | | |
Your fund is actively managed and the composition of its portfolio will change over time. Information provided is calculated as a percentage of net assets.
41
Fund Profile – Columbia Conservative High Yield Fund
Performance data quoted represents past performance and current performance may be lower or higher. Past performance is no guarantee of future results. The investment return and principal value will fluctuate so that shares, when redeemed, may be worth more or less than the original cost. Please visit www.columbiafunds.com for daily and most recent month-end performance updates.
Summary
1 year return as of 08/31/07
| | +4.75% | |
|
 | | Class A shares
(without sales charge) | |
|
| | +6.00% | |
|
 | | JPMorgan Chase Developed BB High Yield Index | |
|
Morningstar Style Box

Summary
g For the 12-month period that ended August 31, 2007, the fund's Class A shares returned 4.75% without sales charge.
g The fund underperformed both its benchmark and peer group because of its conservative positioning.
g We believe that the fund's conservative stance has the potential to cushion the fund if recent market volatility continues.
Portfolio Management
Thomas A. LaPointe has co-managed the fund since September 2005 and has been with the advisor, or its predecessors or affiliate organizations since 1999.
Kevin L. Cronk has co-managed the fund since September 2005 and has been with the advisor, or its predecessors or affiliate organizations since 1999.
The JPMorgan Chase Developed BB High Yield Index is an index that is designed to mirror the investable universe of the US dollar developed, BB-rated, high yield corporate debt market. Indices are not investments, do not incur fees or expenses and are not professionally managed. It is not possible to invest directly in an index.
The Morningstar Style BoxTM reveals a fund's investment strategy. For equity funds the vertical axis shows the market capitalization of the stocks owned, and the horizontal axis shows a fund's investment style (value, blend or growth). For fixed-income funds the vertical axis shows the average credit quality of the bonds owned, and the horizontal axis shows interest rate sensitivity as measured by a bond's duration (short, intermediate or long). All of these numbers are drawn from the data most recently provided by the fund and entered into Morningstar's database as of month-end. Although the data is gathered from reliable sources, Morningstar cannot guarantee completeness and accuracy. Information is as of 06/30/2007.
42
Performance Information – Columbia Conservative High Yield Fund
Growth of a $10,000 investment 09/01/97 – 08/31/07
The chart above shows the growth in value of a hypothetical $10,000 investment in Class A shares of Columbia Conservative High Yield Fund during the stated time period, and does not reflect the deduction of taxes that a shareholder may pay on fund distributions or the redemption of fund shares. The JPMorgan Chase Developed BB High Yield Index is an index that is designed to mirror the investable universe of the US dollar developed, BB-rated, high yield corporate debt market. Indices are not investments, do not incur fees or expenses and are not professionally managed. It is not possible to invest directly in an index. Securities in the fund may not match those in an index.
Performance of a $10,000 investment 09/01/97 – 08/31/07 ($)
| Sales charge | | without | | with | |
| Class A | | | 16,536 | | | | 15,751 | | |
| Class B | | | 15,930 | | | | 15,930 | | |
| Class C | | | 16,013 | | | | 16,013 | | |
| Class Z | | | 16,744 | | | | n/a | | |
Average annual total return as of 08/31/07 (%)
| Share class | | A | | B | | C | | Z | |
| Inception | | 11/01/02 | | 11/01/02 | | 10/13/03 | | 10/01/93 | |
| Sales charge | | without | | with | | without | | with | | without | | with | | without | |
| 1-year | | | 4.75 | | | | –0.20 | | | | 3.97 | | | | –0.94 | | | | 4.13 | | | | 3.15 | | | | 5.01 | | |
| 5-year | | | 5.98 | | | | 4.96 | | | | 5.19 | | | | 4.87 | | | | 5.30 | | | | 5.30 | | | | 6.25 | | |
| 10-year | | | 5.16 | | | | 4.65 | | | | 4.77 | | | | 4.77 | | | | 4.82 | | | | 4.82 | | | | 5.29 | | |
Average annual total return as of 09/30/07 (%)
| Share class | | A | | B | | C | | Z | |
| Sales charge | | without | | with | | without | | with | | without | | with | | without | |
| 1-year | | | 5.90 | | | | 0.82 | | | | 5.12 | | | | 0.15 | | | | 5.27 | | | | 4.28 | | | | 6.17 | | |
| 5-year | | | 6.56 | | | | 5.53 | | | | 5.76 | | | | 5.44 | | | | 5.87 | | | | 5.87 | | | | 6.84 | | |
| 10-year | | | 5.27 | | | | 4.76 | | | | 4.87 | | | | 4.87 | | | | 4.92 | | | | 4.92 | | | | 5.40 | | |
The "with sales charge" returns include the maximum initial sales charge of 4.75% for Class A shares, the applicable contingent deferred sales charge of 5.00% in the first year, declining to 1.00% in the sixth year, and eliminated thereafter for Class B shares and 1.00% for Class C shares for the first year only. The "without sales charge" returns do not include the effect of sales charges. If they had, returns would have been lower.
Performance results reflect any waivers or reimbursements of fund expenses by the investment advisor and/or any of its affiliates. Absent these waivers or reimbursement arrangements, performance results would have been lower.
All results shown assume reinvestment of distributions. Class Z shares are sold at net asset value with no Rule 12b-1 fees. Class Z shares have limited eligibility and the investment minimum requirements may vary. Please see the fund's prospectus for details. Performance for different share classes will vary based on differences in sales charges and fees associated with each class.
The tables do not reflect the deduction of taxes that a shareholder may pay on fund distributions or the redemption of fund shares.
Classes A and B share performance information includes returns of the fund's Class Z shares (the oldest existing fund class) for periods prior to the inception of the newer class shares. The returns for Class C include the returns of Class B prior to 10/13/03, the date on which Class C was initially offered by the fund. The returns shown for Class C also include the performance of Class Z prior to the inception of Class B (11/01/02). Class Z share returns are not restated to reflect any expense differential (such as Rule 12b-1 fees) between Class Z shares and the newer class shares. Had the expense differential been reflected, the returns for the periods prior to the inception of Classes A, B, and C would have been lower.
Performance data quoted represents past performance and current performance may be lower or higher. Past performance is no guarantee of future results. The investment return and principal value will fluctuate so that shares, when redeemed, may be worth more or less than the original cost. Please visit www.columbiafunds.com for daily and most recent month-end performance updates.
Annual operating expense ratio (%)*
| Class A | | | 1.01 | | |
| Class B | | | 1.76 | | |
| Class C | | | 1.76 | | |
| Class Z | | | 0.76 | | |
*The annual operating expense ratio is as stated in the fund's prospectus that is current as of the date of this report. Differences in expense ratios disclosed elsewhere in this report may result from including fee waivers and reimbursements as well as different time periods used in calculating the ratios.
43
Understanding Your Expenses – Columbia Conservative High Yield Fund
Estimating your actual expenses
To estimate the expenses that you paid over the period, first you will need your account balance at the end of the period:
g For shareholders who receive their account statements from Columbia Management Services, Inc., your account balance is available online at www.columbiafunds.com or by calling Shareholder Services at 800.345.6611.
g For shareholders who receive their account statements from their brokerage firm, contact your brokerage firm to obtain your account balance.
1. Divide your ending account balance by $1,000.00. For example, if an account balance was $8,600.00 at the end of the period, the result would be 8.6.
2. In the section of the table below titled "Expenses paid during the period," locate the amount for your share class. You will find this number in the column labeled "actual." Multiply this number by the result from step 1. Your answer is an estimate of the expenses you paid on your account during the period.
A minimum account balance fee of $20 that is charged once per year may be assessed if the value of your account falls below the minimum initial investment applicable to you. This fee is not included in the accompanying table. If you are subject to the fee, keep it in mind when you are estimating the ongoing expenses of investing in the fund and when comparing the expenses of this fund with other funds.
As a fund shareholder, you incur two types of costs. There are transaction costs, which generally include sales charges on purchases and may include redemption or exchange fees. There are also ongoing costs, which generally include investment advisory fees, Rule 12b-1 fees and other fund expenses. The information on this page is intended to help you understand the ongoing costs of investing in the fund and to compare these costs with the ongoing costs of investing in other mutual funds.
Analyzing your fund's expenses by share class
To illustrate these ongoing costs, we have provided an example and calculated the expenses paid by investors in each share class during the period. The information in the following table is based on an initial investment of $1,000.00, which is invested at the beginning of the reporting period and held for the entire period. Expense information is calculated two ways and each method provides you with different information. The amount listed in the "actual" column is calculated using the fund's actual operating expenses and total return for the period. The amount listed in the "hypothetical" column for each share class assumes that the return each year is 5% before expenses and is calculated based on the fund's actual operating expenses. You should not use the hypothetical account values and expenses to estimate either your actual account balance at the end of the period or the expenses you paid during this reporting period.
Compare with other funds
Since all mutual funds are required to include the same hypothetical calculations about expenses in shareholder reports, you can use this information to compare the ongoing costs of investing in the fund with other funds. To do so, compare the 5% hypothetical example with the 5% hypothetical examples that appear in the shareholder reports of other funds. As you compare hypothetical examples of other funds, it is important to note that hypothetical examples are meant to highlight the ongoing costs of investing in a fund and do not reflect any transaction costs, such as sales charges, redemption fees or exchange fees.
03/01/07 – 08/31/07
| | | Account value at the
beginning of the period ($) | | Account value at the
end of the period ($) | | Expenses paid
during the period ($) | | Fund's annualized
expense ratio (%) | |
| | | Actual | | Hypothetical | | Actual | | Hypothetical | | Actual | | Hypothetical | | Actual | |
| Class A | | | 1,000.00 | | | | 1,000.00 | | | | 986.89 | | | | 1,020.01 | | | | 5.16 | | | | 5.24 | | | | 1.03 | | |
| Class B | | | 1,000.00 | | | | 1,000.00 | | | | 983.21 | | | | 1,016.23 | | | | 8.90 | | | | 9.05 | | | | 1.78 | | |
| Class C | | | 1,000.00 | | | | 1,000.00 | | | | 983.92 | | | | 1,016.99 | | | | 8.15 | | | | 8.29 | | | | 1.63 | | |
| Class Z | | | 1,000.00 | | | | 1,000.00 | | | | 988.10 | | | | 1,021.27 | | | | 3.91 | | | | 3.97 | | | | 0.78 | | |
Expenses paid during the period are equal to the annualized expense ratio for the share class, multiplied by the average account value over the period, then multiplied by the number of days in the fund's most recent fiscal half-year and divided by 365.
Had the investment advisor and/or any of its affiliates not waived or reimbursed a portion of expenses, account value at the end of the period would have been reduced.
It is important to note that the expense amounts shown in the table are meant to highlight only ongoing costs of investing in the fund and do not reflect any transaction costs, such as sales charges, redemption fees or exchange fees. Therefore, the hypothetical examples provided may not help you determine the relative total costs of owning shares of different funds. If these transaction costs were included, your costs would have been higher.
44
Portfolio Managers' Report – Columbia Conservative High Yield Fund
For the 12-month period that ended August 31, 2007, Columbia Conservative High Yield Fund Class A shares returned 4.75% without sales charge. The fund's return was lower than the 6.00% return of its benchmark, the JPMorgan Chase Developed BB High Yield Index1, and the 5.83% average return of its peer group, the Lipper High Current Yield Funds Classification.2 The fund was held back by its conservative positioning at a time when investors favored riskier assets.
A generally favorable environment for high yield
As the economy continued to grow over the past 12 months, corporate profits pushed higher and default rates moved lower—a generally favorable environment for the highyield marketplace. Although high-yield bonds could not match the performance of the equity markets during the period, they were among the best-performing sectors of the fixed-income universe. And, the riskiest segment of the high-yield market did the best over this period. As a result, the fund was held back by its more conservative positioning. However, we believe that the fund's positioning has the potential to cushion it against a more volatile environment going forward.
Lack of exposure to autos hampered performance
In particular, we gave up some performance by underweighting the auto industry relative to the index. We do not believe that these companies, which have had difficulty keeping expenses down and continue to experience significant cash losses, meet our investment requirements. However, the bonds of several leading automakers performed extremely well early in the 12-month period. The fund's positions in Harrah's Operating Co., Inc. and Clear Channel Communications, Inc. also detracted from performance, as both companies are subject to leveraged buyouts whose structure favors stockholders over bondholders.
Individual holdings had a positive impact on return
On the plus side, the fund owned chemical producers Lyondell Chemical Co. and Huntsman International LLC, and both companies were the targets of recent buyouts whose terms suggested that existing bonds might be retired at a premium. The fund's holdings in Rogers Wireless, Inc. also boosted returns, as the company's strong operating performance led to the refinancing of some of its bonds. The fund also benefited from a decision to underweight the housing sector. Housing bonds experienced considerable weakness in 2007 following a wave of foreclosures stemming from defaults in subprime and other risky mortgages.
1The JPMorgan Chase Developed BB High Yield Index is an index that is designed to mirror the investable universe of the US dollar developed, BB-rated, high yield corporate debt market. Indices are not investments, do not incur fees or expenses and are not professionally managed. It is not possible to invest directly in an index.
2Lipper Inc., a widely respected data provider in the industry, calculates an average total return (assuming reinvestment of distributions) for mutual funds with investment objectives similar to those of the fund. Lipper makes no adjustment for the effect of sales loads.
Performance data quoted represents past performance and current performance may be lower or higher. Past performance is no guarantee of future results. The investment return and principal value will fluctuate so that shares, when redeemed, may be worth more or less than the original cost. Please visit www.columbiafunds.com for daily and most recent month-end performance updates.
Net asset value per share
as of 08/31/07 ($)
| Class A | | | 8.12 | | |
| Class B | | | 8.12 | | |
| Class C | | | 8.12 | | |
| Class Z | | | 8.12 | | |
Distributions declared per share
09/01/06 – 08/31/07 ($)
| Class A | | | 0.54 | | |
| Class B | | | 0.48 | | |
| Class C | | | 0.49 | | |
| Class Z | | | 0.56 | | |
45
Portfolio Managers' Report (continued) – Columbia Conservative High Yield Fund
Top 5 sectors
as of 08/31/07 (%)
| Communications | | | 16.2 | | |
| Industrials | | | 15.8 | | |
| Consumer Cyclical | | | 14.4 | | |
| Energy | | | 13.7 | | |
| Consumer Non-Cyclical | | | 12.2 | | |
Portfolio quality
as of 08/31/07 (%)
| AAA | | | 2.4 | | |
| BBB | | | 1.4 | | |
| BB | | | 47.9 | | |
| B | | | 43.7 | | |
| CCC | | | 2.1 | | |
| Not Rated | | | 1.2 | | |
| Other | | | 1.3 | | |
Ratings shown in the quality breakdown represent the rating assigned to a particular bond by one of the following nationally-recognized rating agencies: Standard and Poor's, Moody's Investors Service, Inc. or Fitch Ratings Ltd. Ratings are relative and subjective and are not absolute standards of quality. The fund's credit quality does not remove market risk.
Maturity breakdown
as of 08/31/07 (%)
| 1-3 years | | | 2.2 | | |
| 3-5 years | | | 11.9 | | |
| 5-7 years | | | 30.1 | | |
| 7-10 years | | | 42.9 | | |
| 10-15 years | | | 2.5 | | |
| 15-20 years | | | 2.4 | | |
| 20-30 years | | | 3.9 | | |
| 30 years and over | | | 0.4 | | |
| Net Cash & Equivalents | | | 3.7 | | |
Holdings discussed in this report
as of 08/31/07 (%)
| Harrah's Operating Co., Inc. | | | 0.8 | | |
| Clear Channel | |
| Communications, Inc. | | | 0.5 | | |
| Lyondell Chemical Co. | | | 1.3 | | |
| Huntsman International LLC | | | 0.8 | | |
| Rogers Wireless, Inc. | | | 0.3 | | |
Your fund is actively managed and the composition of its portfolio will change over time. Information provided is calculated as a percentage of net assets.
As a mortgage meltdown continued into the end of the period, the fund's conservative positioning began to prove beneficial. We believe that the recent volatility in the fixed-income markets will persist over the next several months, creating an environment that could potentially reward the higher quality sectors of the high-yield market.
Portfolio holdings and characteristics are subject to change and may not be representative of current holdings and characteristics. The outlook for the fund may differ from that presented for other Columbia Funds.
Investing in fixed-income securities may involves certain risks, including the credit quality of individual issuers, possible prepayments, market or economic developments and yields and share price fluctuations due to changes in interest rates. When interest rates go up, bond prices typically drop, and vice versa.
There are certain additional risks involved when investing in foreign securities that are not inherent with investments in domestic securities. These risks may involve foreign currency exchange rate fluctuations, adverse political and economic developments and the possible prevention of currency exchange or other foreign governmental laws or restrictions. In addition, the liquidity of foreign securities may be more limited than that of domestic securities.
The term "conservative" in the Columbia Conservative High Yield Fund's name, and as used in the discussion above, is intended to describe the fund's credit approach relative to other high yield funds; the fund invests primarily in bonds rated Ba or B by Moody's Investors Service, Inc. or BB or B by Standard & Poor's. These lower rated bonds, commonly referred to as "junk" bonds, are subject to greater credit risk, and are generally less liquid, than higher-rated, lower yielding bonds. Also changes in economic conditions or other circumstances may adversely affect a junk bond issuer's ability to make principal and interest payments. Rising interest rates tend to lower the value of all bonds.
46
Financial Statements – Columbia Funds
August 31, 2007
A guide to understanding your fund's financial statements
| Investment Portfolio | | The investment portfolio details all of the fund's holdings and their values as of the last day of the reporting period. Portfolio holdings are organized by type of asset, industry, country or geographic region (if applicable) to demonstrate areas of concentration and diversification. | |
|
| Statement of Assets and Liabilities | | This statement details the fund's assets, liabilities, net assets and share price for each share class as of the last day of the reporting period. Net assets are calculated by subtracting all the fund's liabilities (including any unpaid expenses) from the total of the fund's investment and non-investment assets. The share price for each class is calculated by dividing net assets for that class by the number of shares outstanding in that class as of the last day of the reporting period. | |
|
| Statement of Operations | | This statement details income earned by the fund and the expenses accrued by the fund during the reporting period. This statement also shows any net gain or loss the fund realized on the sales of its holdings during the period, as well as any unrealized gains or losses recognized over the period. The total of these results represents the fund's net increase or decrease in net assets from operations. | |
|
| Statement of Changes in Net Assets | | This statement demonstrates how the fund's net assets were affected by its operating results, distributions to shareholders and shareholder transactions (e.g., subscriptions, redemptions and dividend reinvestments) during the reporting period. This statement also details changes in the number of shares outstanding. | |
|
| Financial Highlights | | The financial highlights demonstrate how the fund's net asset value per share was affected by the fund's operating results. The financial highlights table also discloses performance for each class of shares and certain key ratios (e.g., class expenses and net investment income as a percentage of average net assets). | |
|
| Notes to Financial Statements | | These notes disclose the organizational background of the fund, its significant accounting policies (including those surrounding security valuation, income recognition and distributions to shareholders), federal tax information, fees and compensation paid to affiliates and significant risks and contingencies. | |
|
47
Investment Portfolio – Columbia International Stock Fund
August 31, 2007
Common Stocks – 98.3%
| | | Shares | | Value ($) | |
| Consumer Discretionary – 9.2% | |
| Auto Components – 2.2% | |
| Continental AG | | | 79,428 | | | | 10,323,433 | | |
| Denso Corp. | | | 314,700 | | | | 11,034,476 | | |
| Stanley Electric Co., Ltd. | | | 407,900 | | | | 8,930,188 | | |
| Auto Components Total | | | 30,288,097 | | |
| Automobiles – 2.0% | |
| Peugeot SA | | | 155,061 | | | | 13,201,984 | | |
| Toyota Motor Corp. | | | 231,100 | | | | 13,491,977 | | |
| Automobiles Total | | | 26,693,961 | | |
| Hotels, Restaurants & Leisure – 1.2% | |
| Genting Berhad | | | 3,117,700 | | | | 6,536,165 | | |
| Paddy Power PLC | | | 340,949 | | | | 10,287,735 | | |
| Hotels, Restaurants & Leisure Total | | | 16,823,900 | | |
| Household Durables – 0.9% | |
| JM AB | | | 174,900 | | | | 4,614,675 | | |
Matsushita Electric
Industrial Co., Ltd. | | | 448,000 | | | | 7,815,528 | | |
| Household Durables Total | | | 12,430,203 | | |
| Leisure Equipment & Products – 0.7% | |
| Nikon Corp. | | | 283,000 | | | | 8,847,569 | | |
| Leisure Equipment & Products Total | | | 8,847,569 | | |
| Media – 1.2% | |
| Vivendi SA | | | 416,727 | | | | 17,036,259 | | |
| Media Total | | | 17,036,259 | | |
| Textiles, Apparel & Luxury Goods – 1.0% | |
| Nisshinbo Industries, Inc. | | | 1,082,000 | | | | 13,278,539 | | |
| Textiles, Apparel & Luxury Goods Total | | | 13,278,539 | | |
| Consumer Discretionary Total | | | 125,398,528 | | |
| Consumer Staples – 7.4% | |
| Beverages – 2.1% | |
Fomento Economico Mexicano
SAB de CV, ADR | | | 324,729 | | | | 11,313,558 | | |
| Heineken NV | | | 267,492 | | | | 16,936,885 | | |
| Beverages Total | | | 28,250,443 | | |
| Food & Staples Retailing – 1.5% | |
| Massmart Holdings Ltd. | | | 923,650 | | | | 11,903,456 | | |
| Metro, Inc., Class A | | | 257,822 | | | | 8,530,588 | | |
| Food & Staples Retailing Total | | | 20,434,044 | | |
| Food Products – 1.8% | |
China Milk Products
Group Ltd. | | | 7,170,000 | | | | 5,503,264 | | |
| | | Shares | | Value ($) | |
| Toyo Suisan Kaisha Ltd. | | | 397,000 | | | | 6,942,957 | | |
| Unilever PLC | | | 391,211 | | | | 12,328,625 | | |
| Food Products Total | | | 24,774,846 | | |
| Tobacco – 2.0% | |
| Imperial Tobacco Group PLC | | | 182,308 | | | | 8,237,438 | | |
| Japan Tobacco, Inc. | | | 3,429 | | | | 19,041,774 | | |
| Tobacco Total | | | 27,279,212 | | |
| Consumer Staples Total | | | 100,738,545 | | |
| Energy – 7.6% | |
| Energy Equipment & Services – 0.8% | |
TGS Nopec Geophysical Co.
ASA (a) | | | 661,700 | | | | 11,378,191 | | |
| Energy Equipment & Services Total | | | 11,378,191 | | |
| Oil, Gas & Consumable Fuels – 6.8% | |
| BP PLC | | | 698,774 | | | | 7,854,639 | | |
| BP PLC, ADR | | | 164,770 | | | | 11,098,907 | | |
| PetroChina Co., Ltd., Class H | | | 9,730,000 | | | | 14,225,055 | | |
| Royal Dutch Shell PLC, Class B | | | 263,251 | | | | 10,265,287 | | |
| Statoil ASA | | | 358,450 | | | | 10,329,174 | | |
| Total SA | | | 387,647 | | | | 29,175,971 | | |
Yanzhou Coal Mining Co., Ltd.,
Class H | | | 5,408,000 | | | | 9,515,400 | | |
| Oil, Gas & Consumable Fuels Total | | | 92,464,433 | | |
| Energy Total | | | 103,842,624 | | |
| Financials – 27.5% | |
| Capital Markets – 3.2% | |
Credit Suisse Group,
Registered Shares | | | 300,510 | | | | 19,625,498 | | |
Deutsche Bank AG,
Registered Shares | | | 151,159 | | | | 18,662,190 | | |
| UBS AG, Registered Shares | | | 99,108 | | | | 5,164,864 | | |
| Capital Markets Total | | | 43,452,552 | | |
| Commercial Banks – 16.4% | |
| ABN AMRO Holding NV | | | 187,818 | | | | 8,732,329 | | |
Australia & New Zealand
Banking Group Ltd. | | | 328,791 | | | | 7,801,178 | | |
Banco Bilbao Vizcaya
Argentaria SA | | | 924,032 | | | | 21,260,490 | | |
| Banco Santander SA | | | 1,340,804 | | | | 24,475,226 | | |
| Bank of Ireland | | | 583,087 | | | | 10,802,614 | | |
| Barclays PLC | | | 1,561,552 | | | | 19,315,930 | | |
| BNP Paribas | | | 193,004 | | | | 20,355,233 | | |
Bumiputra-Commerce
Holdings Berhad | | | 1,655,700 | | | | 5,182,451 | | |
See Accompanying Notes to Financial Statements.
48
Columbia International Stock Fund
August 31, 2007
Common Stocks (continued)
| | | Shares | | Value ($) | |
| DBS Group Holdings Ltd. | | | 623,000 | | | | 8,173,976 | | |
| HBOS PLC | | | 482,381 | | | | 8,549,164 | | |
| HSBC Holdings PLC | | | 974,503 | | | | 17,624,638 | | |
| Kookmin Bank | | | 98,373 | | | | 7,947,004 | | |
| Mizuho Financial Group, Inc. | | | 902 | | | | 5,710,044 | | |
| Societe Generale | | | 111,482 | | | | 17,976,412 | | |
Sumitomo Mitsui Financial
Group, Inc. | | | 484 | | | | 3,824,683 | | |
| Swedbank AB, Class A | | | 248,900 | | | | 8,136,758 | | |
| United Overseas Bank Ltd. | | | 1,146,900 | | | | 15,649,634 | | |
| Westpac Banking Corp. | | | 549,479 | | | | 12,232,411 | | |
| Commercial Banks Total | | | 223,750,175 | | |
| Consumer Finance – 0.5% | |
| ORIX Corp. | | | 29,710 | | | | 6,365,879 | | |
| Consumer Finance Total | | | 6,365,879 | | |
| Diversified Financial Services – 1.9% | |
| Fortis | | | 292,340 | | | | 10,716,638 | | |
| ING Groep NV | | | 392,150 | | | | 15,769,763 | | |
| Diversified Financial Services Total | | | 26,486,401 | | |
| Insurance – 4.8% | |
| Aviva PLC | | | 669,736 | | | | 9,567,271 | | |
| Axis Capital Holdings Ltd. (b) | | | 268,459 | | | | 9,691,370 | | |
Baloise Holding AG,
Registered Shares | | | 114,437 | | | | 10,479,093 | | |
| Brit Insurance Holdings PLC | | | 2,031,806 | | | | 14,471,348 | | |
| Milano Assicurazioni SpA | | | 972,197 | | | | 7,727,727 | | |
Swiss Reinsurance,
Registered Shares | | | 167,429 | | | | 14,085,143 | | |
| Insurance Total | | | 66,021,952 | | |
| Real Estate Management & Development – 0.7% | |
| Swire Pacific Ltd., Class A | | | 851,800 | | | | 9,410,857 | | |
| Yanlord Land Group Ltd. | | | 356,000 | | | | 737,993 | | |
Real Estate Management &
Development Total | | | 10,148,850 | | |
| Financials Total | | | 376,225,809 | | |
| Health Care – 7.6% | |
| Pharmaceuticals – 7.6% | |
| AstraZeneca PLC | | | 374,310 | | | | 18,452,486 | | |
| Biovail Corp. | | | 616,577 | | | | 10,802,429 | | |
| Kyowa Hakko Kogyo Co., Ltd. | | | 610,000 | | | | 5,921,410 | | |
| Novartis AG, Registered Shares | | | 495,086 | | | | 26,107,811 | | |
| Novo-Nordisk A/S, Class B | | | 48,725 | | | | 5,417,651 | | |
| Ono Pharmaceutical Co., Ltd. | | | 152,500 | | | | 7,875,896 | | |
Roche Holding AG,
Genusschein Shares | | | 100,793 | | | | 17,508,917 | | |
| | | Shares | | Value ($) | |
| Takeda Pharmaceutical Co., Ltd. | | | 186,200 | | | | 12,736,022 | | |
| Pharmaceuticals Total | | | 104,822,622 | | |
| Health Care Total | | | 104,822,622 | | |
| Industrials – 10.1% | |
| Aerospace & Defense – 1.0% | |
| MTU Aero Engines Holding AG | | | 139,006 | | | | 8,845,045 | | |
| Rolls-Royce Group PLC (a) | | | 433,237 | | | | 4,463,659 | | |
| Aerospace & Defense Total | | | 13,308,704 | | |
| Airlines – 0.5% | |
| British Airways PLC (a) | | | 762,443 | | | | 6,521,895 | | |
| Airlines Total | | | 6,521,895 | | |
| Building Products – 0.9% | |
| Geberit AG, Registered Shares | | | 87,137 | | | | 12,830,165 | | |
| Building Products Total | | | 12,830,165 | | |
| Commercial Services & Supplies – 1.0% | |
| Randstad Holding NV | | | 231,659 | | | | 12,963,916 | | |
| Commercial Services & Supplies Total | | | 12,963,916 | | |
| Construction & Engineering – 0.6% | |
| Peab AB | | | 285,200 | | | | 8,599,889 | | |
| Construction & Engineering Total | | | 8,599,889 | | |
| Electrical Equipment – 0.6% | |
| Schneider Electric SA | | | 57,934 | | | | 7,694,754 | | |
| Electrical Equipment Total | | | 7,694,754 | | |
| Industrial Conglomerates – 0.7% | |
| Keppel Corp. Ltd. | | | 1,209,000 | | | | 10,151,999 | | |
| Industrial Conglomerates Total | | | 10,151,999 | | |
| Machinery – 3.4% | |
Georg Fischer AG,
Registered Shares (a) | | | 15,266 | | | | 11,529,372 | | |
| Komatsu Ltd. | | | 311,800 | | | | 9,613,317 | | |
| Mori Seiki Co., Ltd. | | | 224,600 | | | | 5,596,088 | | |
| SKF AB, Class B | | | 472,800 | | | | 9,630,166 | | |
| Volvo AB, Class B | | | 584,950 | | | | 10,112,466 | | |
| Machinery Total | | | 46,481,409 | | |
| Trading Companies & Distributors – 1.4% | |
| Hitachi High-Technologies Corp. | | | 233,300 | | | | 5,460,255 | | |
| Itochu Corp. | | | 1,310,000 | | | | 14,209,863 | | |
| Trading Companies & Distributors Total | | | 19,670,118 | | |
| Industrials Total | | | 138,222,849 | | |
See Accompanying Notes to Financial Statements.
49
Columbia International Stock Fund
August 31, 2007
Common Stocks (continued)
| | | Shares | | Value ($) | |
| Information Technology – 9.2% | |
| Communications Equipment – 2.0% | |
| Nokia Oyj | | | 833,470 | | | | 27,442,472 | | |
| Communications Equipment Total | | | 27,442,472 | | |
| Electronic Equipment & Instruments – 1.8% | |
| FUJIFILM Holdings Corp. | | | 360,300 | | | | 15,682,805 | | |
| Kyocera Corp. | | | 94,400 | | | | 8,641,852 | | |
Electronic Equipment &
Instruments Total | | | 24,324,657 | | |
| Internet Software & Services – 1.1% | |
United Internet AG,
Registered Shares | | | 746,908 | | | | 14,326,047 | | |
| Internet Software & Services Total | | | 14,326,047 | | |
| IT Services – 0.6% | |
| CGI Group, Inc., Class A (a) | | | 753,800 | | | | 8,351,761 | | |
| IT Services Total | | | 8,351,761 | | |
| Office Electronics – 2.0% | |
| Brother Industries Ltd. | | | 963,000 | | | | 12,292,202 | | |
| Canon, Inc. | | | 264,800 | | | | 15,139,269 | | |
| Office Electronics Total | | | 27,431,471 | | |
| Semiconductors & Semiconductor Equipment – 1.2% | |
| Infineon Technologies AG (a) | | | 633,990 | | | | 9,862,911 | | |
| Verigy Ltd. (a) | | | 266,200 | | | | 7,033,004 | | |
Semiconductors & Semiconductor
Equipment Total | | | 16,895,915 | | |
| Software – 0.5% | |
| Nintendo Co., Ltd. | | | 15,700 | | | | 7,281,199 | | |
| Software Total | | | 7,281,199 | | |
| Information Technology Total | | | 126,053,522 | | |
| Materials – 10.2% | |
| Chemicals – 3.7% | |
| BASF AG | | | 186,236 | | | | 24,641,869 | | |
| Linde AG | | | 90,176 | | | | 10,582,855 | | |
| Shin-Etsu Chemical Co., Ltd. | | | 209,700 | | | | 15,176,492 | | |
| Chemicals Total | | | 50,401,216 | | |
| Construction Materials – 1.0% | |
| Ciments Francais SA | | | 66,652 | | | | 13,875,543 | | |
| Construction Materials Total | | | 13,875,543 | | |
| Metals & Mining – 5.5% | |
| BHP Billiton PLC | | | 368,241 | | | | 10,832,583 | | |
| JFE Holdings, Inc. | | | 191,300 | | | | 12,490,094 | | |
| Rio Tinto PLC | | | 121,457 | | | | 8,399,651 | | |
| Salzgitter AG | | | 80,059 | | | | 15,813,747 | | |
| | | Shares | | Value ($) | |
SSAB Svenskt Stal AB,
Series A | | | 411,000 | | | | 13,942,403 | | |
| Yamato Kogyo Co., Ltd. | | | 312,700 | | | | 13,367,864 | | |
| Metals & Mining Total | | | 74,846,342 | | |
| Materials Total | | | 139,123,101 | | |
| Telecommunication Services – 5.2% | |
| Diversified Telecommunication Services – 3.4% | |
Bezeq Israeli
Telecommunication Corp., Ltd. | | | 6,205,048 | | | | 9,855,874 | | |
Chunghwa Telecom Co., Ltd.,
ADR | | | 461,346 | | | | 8,082,773 | | |
Nippon Telegraph &
Telephone Corp. | | | 1,521 | | | | 7,067,087 | | |
Telefonica O2 Czech
Republic AS | | | 477,299 | | | | 14,251,691 | | |
| Telekomunikacja Polska SA | | | 958,607 | | | | 7,413,319 | | |
Diversified Telecommunication
Services Total | | | 46,670,744 | | |
| Wireless Telecommunication Services – 1.8% | |
| China Mobile Ltd. | | | 696,800 | | | | 9,490,059 | | |
| KDDI Corp. | | | 1,131 | | | | 8,742,076 | | |
Philippine Long Distance
Telephone Co., ADR | | | 105,993 | | | | 6,224,969 | | |
Wireless Telecommunication
Services Total | | | 24,457,104 | | |
| Telecommunication Services Total | | | 71,127,848 | | |
| Utilities – 4.3% | |
| Electric Utilities – 3.7% | |
| British Energy Group PLC | | | 1,519,251 | | | | 14,197,892 | | |
| E.ON AG | | | 144,857 | | | | 24,301,356 | | |
| Tenaga Nasional Berhad | | | 4,225,900 | | | | 12,214,260 | | |
| Electric Utilities Total | | | 50,713,508 | | |
| Gas Utilities – 0.6% | |
| Tokyo Gas Co., Ltd. | | | 1,614,000 | | | | 8,014,944 | | |
| Gas Utilities Total | | | 8,014,944 | | |
| Utilities Total | | | 58,728,452 | | |
Total Common Stocks
(Cost of $1,079,248,400) | | | 1,344,283,900 | | |
| Investment Company – 0.7% | |
| iShares MSCI EAFE Index Fund | | | 119,435 | | | | 9,375,647 | | |
Total Investment Company
(Cost of $9,843,343) | | | 9,375,647 | | |
See Accompanying Notes to Financial Statements.
50
Columbia International Stock Fund
August 31, 2007
Short-Term Obligation – 0.9%
| | | Par ($) | | Value ($) | |
Repurchase agreement with
Fixed Income Clearing Corp.,
dated 08/31/07, due 09/04/07
at 5.030%, collateralized by
U.S. Government Agency Obligations
with various maturities to
05/15/08, market value
$12,015,855 (repurchase
proceeds $11,784,582) | | | 11,778,000 | | | | 11,778,000 | | |
Total Short-Term Obligation
(Cost of $11,778,000) | | | 11,778,000 | | |
Total Investments – 99.9%
(Cost of $1,100,869,743)(c) | | | 1,365,437,547 | | |
| Other Assets & Liabilities, Net – 0.1% | | | 1,993,021 | | |
| Net Assets – 100.0% | | | 1,367,430,568 | | |
Notes to Investment Portfolio:
(a) Non-income producing security.
(b) Security pledged as collateral for written option contracts.
(c) Cost for federal income tax purposes is $1,108,316,013.
For the year ended August 31, 2007, transactions in written option contracts were as follows:
| | | Number of
contracts | | Premium
received | |
| Options outstanding at August 31, 2006 | | | – | | | | – | | |
| Options written | | | 1,340 | | | $ | 63,381 | | |
| Options terminated in closing | |
| purchase transactions | | | – | | | | – | | |
| Options exercised | | | – | | | | – | | |
| Options expired | | | – | | | | – | | |
| Options outstanding at August 31, 2007 | | | 1,340 | | | $ | 63,381 | | |
At August 31, 2007, the Fund held the following written call option contracts:
| Name of Issuer | | Strike
Price | | Number of
Contracts | | Expiration
Date | | Premium | | Value | |
Axis Capital
Holdings LTD. | | $ | 40 | | | | 1,340 | | | | 09/22/07 | | | $ | 63,381 | | | $ | 26,800 | | |
| Total written call options (proceeds $63,381) | | | | | | | | | | | | | | | | $ | 26,800 | | |
The Fund was invested in the following countries at August 31, 2007:
| Country (Unaudited) | | Value ($) | | % of Total
Investments | |
| Japan | | | 290,592,345 | | | | 21.3 | | |
| United Kingdom | | | 182,181,414 | | | | 13.3 | | |
| Germany | | | 137,359,451 | | | | 10.1 | | |
| France | | | 119,316,157 | | | | 8.7 | | |
| Switzerland | | | 117,330,863 | | | | 8.6 | | |
| Sweden | | | 55,036,357 | | | | 4.0 | | |
| Netherlands | | | 54,402,894 | | | | 4.0 | | |
| Spain | | | 45,735,716 | | | | 3.3 | | |
| Singapore | | | 41,746,606 | | | | 3.1 | | |
| United States* | | | 30,845,020 | | | | 2.3 | | |
| China | | | 29,243,719 | | | | 2.1 | | |
| Canada | | | 27,684,778 | | | | 2.0 | | |
| Finland | | | 27,442,472 | | | | 2.0 | | |
| Malaysia | | | 23,932,877 | | | | 1.8 | | |
| Norway | | | 21,707,365 | | | | 1.6 | | |
| Ireland | | | 21,090,349 | | | | 1.5 | | |
| Australia | | | 20,033,589 | | | | 1.5 | | |
| Hong Kong | | | 18,900,916 | | | | 1.4 | | |
| Czech Republic | | | 14,251,691 | | | | 1.0 | | |
| South Africa | | | 11,903,456 | | | | 0.9 | | |
| Mexico | | | 11,313,558 | | | | 0.8 | | |
| Belgium | | | 10,716,638 | | | | 0.8 | | |
| Israel | | | 9,855,874 | | | | 0.7 | | |
| Taiwan | | | 8,082,773 | | | | 0.6 | | |
| South Korea | | | 7,947,003 | | | | 0.6 | | |
| Italy | | | 7,727,727 | | | | 0.6 | | |
| Poland | | | 7,413,319 | | | | 0.5 | | |
| Philippines | | | 6,224,969 | | | | 0.5 | | |
| Denmark | | | 5,417,651 | | | | 0.4 | | |
| | | $ | 1,365,437,547 | | | | 100.0 | | |
* Includes investment company and short-term obligation.
Certain securities are listed by country of underlying exposure but may trade predominantly on other exchange.
At August 31, 2007, the Fund had entered into the following forward currency exchange contracts:
Forward
Currency
Contracts
to Buy | |
Value | |
Aggregate
Face Value | |
Settlement
Date | |
Unrealized
Appreciation
(Depreciation) | |
| AUD | | | | $ | 66,529,823 | | | $ | 68,647,624 | | | 09/20/07 | | $ | (2,117,801 | ) | |
| CAD | | | | | 2,168,586 | | | | 2,201,448 | | | 09/20/07 | | | (32,862 | ) | |
| CAD | | | | | 2,809,024 | | | | 2,803,809 | | | 09/20/07 | | | 5,215 | | |
| CAD | | | | | 5,190,774 | | | | 5,159,134 | | | 09/20/07 | | | 31,640 | | |
| CHF | | | | | 3,634,867 | | | | 3,670,600 | | | 09/20/07 | | | (35,733 | ) | |
| CHF | | | | | 4,006,144 | | | | 3,979,846 | | | 09/20/07 | | | 26,298 | | |
| CHF | | | | | 1,930,971 | | | | 1,936,213 | | | 09/20/07 | | | (5,242 | ) | |
| DKK | | | | | 5,905,455 | | | | 5,827,056 | | | 09/20/07 | | | 78,399 | | |
| EUR | | | | | 62,052,678 | | | | 61,128,122 | | | 09/20/07 | | | 924,556 | | |
| EUR | | | | | 5,194,918 | | | | 5,165,217 | | | 09/20/07 | | | 29,701 | | |
| EUR | | | | | 6,589,773 | | | | 6,611,350 | | | 09/20/07 | | | (21,577 | ) | |
| GBP | | | | | 131,291,836 | | | | 129,691,749 | | | 09/20/07 | | | 1,600,087 | | |
| GBP | | | | | 5,917,696 | | | | 5,902,094 | | | 09/20/07 | | | 15,602 | | |
| JPY | | | | | 6,162,424 | | | | 5,813,913 | | | 09/20/07 | | | 348,511 | | |
| JPY | | | | | 4,658,215 | | | | 4,418,131 | | | 09/20/07 | | | 240,084 | | |
| JPY | | | | | 4,295,856 | | | | 4,211,013 | | | 09/20/07 | | | 84,843 | | |
| KRW | | | | | 1,381,157 | | | | 1,402,916 | | | 09/20/07 | | | (21,759 | ) | |
| NZD | | | | | 1,277,709 | | | | 1,457,306 | | | 09/20/07 | | | (179,597 | ) | |
| SEK | | | | | 1,335,510 | | | | 1,323,077 | | | 09/20/07 | | | 12,433 | | |
| SGD | | | | | 1,448,831 | | | | 1,467,652 | | | 09/20/07 | | | (18,821 | ) | |
| TWD | | | | | 3,507,891 | | | | 3,560,844 | | | 09/20/07 | | | (52,953 | ) | |
| TWD | | | | | 2,906,586 | | | | 2,951,372 | | | 09/20/07 | | | (44,786 | ) | |
| | | | | $ | 866,238 | | |
See Accompanying Notes to Financial Statements.
51
Columbia International Stock Fund
August 31, 2007
Forward
Currency
Contracts
to Sell | |
Value | |
Aggregate
Face Value | |
Settlement
Date | |
Unrealized
Appreciation
(Depreciation) | |
| AUD | | | | $ | 2,627,426 | | | $ | 2,584,600 | | | 09/20/07 | | $ | (42,826 | ) | |
| CAD | | | | | 36,737,110 | | | | 36,220,553 | | | 09/20/07 | | | (516,557 | ) | |
| CHF | | | | | 37,085,421 | | | | 36,268,367 | | | 09/20/07 | | | (817,054 | ) | |
| CZK | | | | | 13,693,476 | | | | 13,069,400 | | | 09/20/07 | | | (624,076 | ) | |
| EUR | | | | | 10,328,478 | | | | 10,325,104 | | | 09/20/07 | | | (3,374 | ) | |
| EUR | | | | | 4,190,021 | | | | 4,202,020 | | | 09/20/07 | | | 11,999 | | |
| EUR | | | | | 3,620,080 | | | | 3,669,741 | | | 09/20/07 | | | 49,661 | | |
| GBP | | | | | 7,937,292 | | | | 8,074,121 | | | 09/20/07 | | | 136,829 | | |
| GBP | | | | | 2,614,186 | | | | 2,581,808 | | | 09/20/07 | | | (32,378 | ) | |
| GBP | | | | | 2,644,420 | | | | 2,645,923 | | | 09/20/07 | | | 1,503 | | |
| KRW | | | | | 8,623,018 | | | | 8,720,111 | | | 09/20/07 | | | 97,093 | | |
| ILS | | | | | 10,366,214 | | | | 10,104,105 | | | 09/20/07 | | | (262,109 | ) | |
| JPY | | | | | 3,727,966 | | | | 3,550,468 | | | 09/20/07 | | | (177,498 | ) | |
| JPY | | | | | 5,361,230 | | | | 5,319,018 | | | 09/20/07 | | | (42,212 | ) | |
| JPY | | | | | 3,840,955 | | | | 3,859,227 | | | 09/20/07 | | | 18,272 | | |
| JPY | | | | | 2,186,343 | | | | 2,181,462 | | | 09/20/07 | | | (4,881 | ) | |
| JPY | | | | | 2,957,995 | | | | 2,951,392 | | | 09/20/07 | | | (6,603 | ) | |
| MXN | | | | | 6,469,068 | | | | 6,563,671 | | | 09/20/07 | | | 94,603 | | |
| MYR | | | | | 27,006,978 | | | | 27,294,220 | | | 09/20/07 | | | 287,242 | | |
| NOK | | | | | 8,972,036 | | | | 8,770,237 | | | 09/20/07 | | | (201,799 | ) | |
| PHP | | | | | 2,872,319 | | | | 2,906,605 | | | 09/20/07 | | | 34,286 | | |
| PLN | | | | | 7,335,937 | | | | 7,276,039 | | | 09/20/07 | | | (59,898 | ) | |
| SEK | | | | | 20,353,108 | | | | 20,397,216 | | | 09/20/07 | | | 44,108 | | |
| SGD | | | | | 15,338,553 | | | | 15,272,489 | | | 09/20/07 | | | (66,064 | ) | |
| SGD | | | | | 4,189,454 | | | | 4,206,498 | | | 09/20/07 | | | 17,044 | | |
| SGD | | | | | 3,228,823 | | | | 3,225,256 | | | 09/20/07 | | | (3,567 | ) | |
| TWD | | | | | 15,214,841 | | | | 15,323,196 | | | 09/20/07 | | | 108,355 | | |
| ZAR | | | | | 5,875,307 | | | | 5,802,014 | | | 09/20/07 | | | (73,293 | ) | |
| | | | | $ | (2,033,194 | ) | |
| Acronym | | Name | |
| ADR | | American Depositary Receipt | |
|
| AUD | | Australian Dollar | |
|
| CAD | | Canadian Dollar | |
|
| CHF | | Swiss Franc | |
|
| CZK | | Czech Koruna | |
|
| DKK | | Danish Krone | |
|
| EUR | | Euro | |
|
| GBP | | Pound Sterling | |
|
| ILS | | Israeli Shekel | |
|
| JPY | | Japanese Yen | |
|
| KRW | | South Korean Won | |
|
| MXN | | Mexican Peso | |
|
| MYR | | Malaysian Ringgit | |
|
| NOK | | Norwegian Krone | |
|
| NZD | | New Zealand Dollar | |
|
| PHP | | Philippine Peso | |
|
| PLN | | Polish Zloty | |
|
| SEK | | Swedish Krona | |
|
| SGD | | Singapore Dollar | |
|
| TWD | | Taiwan Dollar | |
|
| ZAR | | South African Rand | |
|
See Accompanying Notes to Financial Statements.
52
Investment Portfolio – Columbia Mid Cap Growth Fund
August 31, 2007
Common Stocks – 99.8%
| | | Shares | | Value ($) | |
| Consumer Discretionary – 14.1% | |
| Diversified Consumer Services – 0.7% | |
Apollo Group, Inc.,
Class A (a) | | | 130,240 | | | | 7,641,181 | | |
ITT Educational
Services, Inc. (a) | | | 27,370 | | | | 3,005,226 | | |
| Diversified Consumer Services Total | | | 10,646,407 | | |
| Hotels, Restaurants & Leisure – 3.5% | |
Ctrip.com International Ltd.,
ADR | | | 106,063 | | | | 4,506,617 | | |
International Game
Technology, Inc. | | | 184,940 | | | | 7,059,160 | | |
Orient-Express Hotels Ltd.,
Class A | | | 35,258 | | | | 1,764,663 | | |
Scientific Games Corp.,
Class A (a) | | | 222,470 | | | | 7,761,978 | | |
Starwood Hotels & Resorts
Worldwide, Inc. | | | 265,090 | | | | 16,202,301 | | |
| Wynn Resorts Ltd. | | | 46,110 | | | | 5,705,190 | | |
| Yum! Brands, Inc. | | | 385,600 | | | | 12,616,832 | | |
| Hotels, Restaurants & Leisure Total | | | 55,616,741 | | |
| Household Durables – 0.6% | |
| Garmin Ltd. | | | 96,380 | | | | 9,814,375 | | |
| Household Durables Total | | | 9,814,375 | | |
| Internet & Catalog Retail – 0.7% | |
| Priceline.com, Inc. (a) | | | 125,920 | | | | 10,448,842 | | |
| Internet & Catalog Retail Total | | | 10,448,842 | | |
| Media – 1.7% | |
EchoStar Communications Corp.,
Class A (a) | | | 159,460 | | | | 6,748,347 | | |
Lamar Advertising Co.,
Class A | | | 133,610 | | | | 7,070,641 | | |
Liberty Global, Inc.,
Class A (a) | | | 154,530 | | | | 6,332,640 | | |
Regal Entertainment Group,
Class A | | | 268,450 | | | | 6,050,863 | | |
| Media Total | | | 26,202,491 | | |
| Multiline Retail – 1.8% | |
| J.C. Penney Co., Inc. | | | 118,140 | | | | 8,123,306 | | |
| Nordstrom, Inc. | | | 422,182 | | | | 20,306,954 | | |
| Multiline Retail Total | | | 28,430,260 | | |
| Specialty Retail – 2.2% | |
| GameStop Corp., Class A (a) | | | 286,170 | | | | 14,348,564 | | |
| J Crew Group, Inc. (a) | | | 95,370 | | | | 4,750,380 | | |
| Tiffany & Co. | | | 124,260 | | | | 6,378,266 | | |
| TJX Companies, Inc. | | | 282,930 | | | | 8,626,535 | | |
| Specialty Retail Total | | | 34,103,745 | | |
| | | Shares | | Value ($) | |
| Textiles, Apparel & Luxury Goods – 2.9% | |
| Coach, Inc. (a) | | | 362,886 | | | | 16,159,314 | | |
| CROCS, Inc. (a) | | | 246,980 | | | | 14,581,699 | | |
| Phillips-Van Heusen Corp. | | | 118,340 | | | | 6,890,938 | | |
| Polo Ralph Lauren Corp. | | | 94,431 | | | | 7,133,318 | | |
| Textiles, Apparel & Luxury Goods Total | | | 44,765,269 | | |
| Consumer Discretionary Total | | | 220,028,130 | | |
| Consumer Staples – 3.7% | |
| Beverages – 0.4% | |
| Pepsi Bottling Group, Inc. | | | 189,720 | | | | 6,562,415 | | |
| Beverages Total | | | 6,562,415 | | |
| Food & Staples Retailing – 0.4% | |
| Kroger Co. | | | 257,230 | | | | 6,837,173 | | |
| Food & Staples Retailing Total | | | 6,837,173 | | |
| Food Products – 1.9% | |
| Bunge Ltd. | | | 71,680 | | | | 6,554,419 | | |
| H.J. Heinz Co. | | | 143,080 | | | | 6,451,477 | | |
| McCormick & Co., Inc. | | | 208,060 | | | | 7,456,871 | | |
| Wm. Wrigley Jr. Co. | | | 144,580 | | | | 8,421,785 | | |
| Food Products Total | | | 28,884,552 | | |
| Personal Products – 1.0% | |
| Avon Products, Inc. | | | 328,170 | | | | 11,272,640 | | |
Estee Lauder Companies, Inc.,
Class A | | | 103,070 | | | | 4,286,681 | | |
| Personal Products Total | | | 15,559,321 | | |
| Consumer Staples Total | | | 57,843,461 | | |
| Energy – 12.3% | |
| Energy Equipment & Services – 7.2% | |
| Cameron International Corp. (a) | | | 157,230 | | | | 12,856,697 | | |
| Diamond Offshore Drilling, Inc. | | | 121,570 | | | | 12,784,301 | | |
| FMC Technologies, Inc. (a) | | | 107,260 | | | | 10,157,522 | | |
| GlobalSantaFe Corp. | | | 84,030 | | | | 5,931,678 | | |
| Grant Prideco, Inc. (a) | | | 175,021 | | | | 9,678,661 | | |
| National-Oilwell Varco, Inc. (a) | | | 172,680 | | | | 22,103,040 | | |
| Noble Corp. | | | 270,810 | | | | 13,285,939 | | |
Superior Energy
Services, Inc. (a) | | | 97,930 | | | | 3,801,643 | | |
| Tetra Technologies, Inc. (a) | | | 396,470 | | | | 7,925,435 | | |
Weatherford
International Ltd. (a) | | | 236,100 | | | | 13,783,518 | | |
| Energy Equipment & Services Total | | | 112,308,434 | | |
See Accompanying Notes to Financial Statements.
53
Columbia Mid Cap Growth Fund
August 31, 2007
Common Stocks (continued)
| | | Shares | | Value ($) | |
| Oil, Gas & Consumable Fuels – 5.1% | |
| Chesapeake Energy Corp. | | | 236,040 | | | | 7,614,650 | | |
| Continental Resources, Inc. (a) | | | 624,537 | | | | 9,274,374 | | |
| Denbury Resources, Inc. (a) | | | 372,170 | | | | 14,804,923 | | |
| Frontier Oil Corp. | | | 260,020 | | | | 10,668,621 | | |
| Peabody Energy Corp. | | | 148,320 | | | | 6,305,083 | | |
| Range Resources Corp. | | | 168,650 | | | | 6,123,682 | | |
| Southwestern Energy Co. (a) | | | 295,544 | | | | 10,991,281 | | |
| Sunoco, Inc. | | | 69,290 | | | | 5,067,871 | | |
| Williams Companies, Inc. | | | 252,170 | | | | 7,817,270 | | |
| Oil, Gas & Consumable Fuels Total | | | 78,667,755 | | |
| Energy Total | | | 190,976,189 | | |
| Financials – 5.9% | |
| Capital Markets – 3.3% | |
Affiliated Managers
Group, Inc. (a) | | | 138,060 | | | | 15,635,295 | | |
| E*TRADE Financial Corp. (a) | | | 316,330 | | | | 4,928,421 | | |
| Janus Capital Group, Inc. | | | 110,061 | | | | 2,926,522 | | |
| Lazard Ltd., Class A | | | 199,920 | | | | 8,014,793 | | |
| T. Rowe Price Group, Inc. | | | 221,640 | | | | 11,374,565 | | |
Waddell & Reed Financial, Inc.,
Class A | | | 322,439 | | | | 8,009,385 | | |
| Capital Markets Total | | | 50,888,981 | | |
| Commercial Banks – 0.4% | |
| Zions Bancorporation | | | 84,160 | | | | 5,941,696 | | |
| Commercial Banks Total | | | 5,941,696 | | |
| Diversified Financial Services – 1.7% | |
| CME Group, Inc. | | | 19,606 | | | | 10,877,409 | | |
Intercontinental
Exchange, Inc. (a) | | | 56,450 | | | | 8,234,361 | | |
| Nymex Holdings, Inc. | | | 64,206 | | | | 8,283,858 | | |
| Diversified Financial Services Total | | | 27,395,628 | | |
| Real Estate Investment Trusts (REITs) – 0.5% | |
| Plum Creek Timber Co., Inc. | | | 194,730 | | | | 8,165,029 | | |
Real Estate Investment Trusts
(REITs) Total | | | 8,165,029 | | |
| Financials Total | | | 92,391,334 | | |
| Health Care – 15.7% | |
| Biotechnology – 1.8% | |
| Alexion Pharmaceuticals, Inc. (a) | | | 68,510 | | | | 4,142,800 | | |
| Amylin Pharmaceuticals, Inc. (a) | | | 155,780 | | | | 7,637,893 | | |
| Celgene Corp. (a) | | | 128,220 | | | | 8,233,006 | | |
| Cephalon, Inc. (a) | | | 102,390 | | | | 7,684,370 | | |
| Biotechnology Total | | | 27,698,069 | | |
| | | Shares | | Value ($) | |
| Health Care Equipment & Supplies – 4.6% | |
| Beckman Coulter, Inc. | | | 91,151 | | | | 6,558,314 | | |
| Cytyc Corp. (a) | | | 298,970 | | | | 12,777,978 | | |
| Gen-Probe, Inc. (a) | | | 103,840 | | | | 6,647,837 | | |
| Intuitive Surgical, Inc. (a) | | | 18,961 | | | | 4,195,690 | | |
| Kyphon, Inc. (a) | | | 300,460 | | | | 20,091,760 | | |
Mindray Medical
International Ltd., ADR | | | 206,710 | | | | 7,336,138 | | |
| Sirona Dental Systems, Inc. (a) | | | 165,490 | | | | 4,824,034 | | |
| St. Jude Medical, Inc. (a) | | | 204,440 | | | | 8,907,451 | | |
| Health Care Equipment & Supplies Total | | | 71,339,202 | | |
| Health Care Providers & Services – 5.0% | |
| Brookdale Senior Living, Inc. | | | 195,600 | | | | 7,162,872 | | |
| Coventry Health Care, Inc. (a) | | | 109,800 | | | | 6,299,226 | | |
| Express Scripts, Inc. (a) | | | 240,880 | | | | 13,188,180 | | |
Laboratory Corp. of
America Holdings (a) | | | 121,220 | | | | 9,413,945 | | |
| McKesson Corp. | | | 126,710 | | | | 7,249,079 | | |
| Medco Health Solutions, Inc. (a) | | | 94,000 | | | | 8,032,300 | | |
| Quest Diagnostics, Inc. | | | 209,420 | | | | 11,465,745 | | |
| Sunrise Senior Living, Inc. (a) | | | 213,760 | | | | 7,654,746 | | |
| VCA Antech, Inc. (a) | | | 173,413 | | | | 7,090,857 | | |
| Health Care Providers & Services Total | | | 77,556,950 | | |
| Health Care Technology – 0.9% | |
Allscripts Healthcare
Solutions, Inc. (a) | | | 273,070 | | | | 6,174,113 | | |
| IMS Health, Inc. | | | 235,990 | | | | 7,065,540 | | |
| Health Care Technology Total | | | 13,239,653 | | |
| Life Sciences Tools & Services – 1.8% | |
| Covance, Inc. (a) | | | 93,130 | | | | 6,828,292 | | |
Pharmaceutical Product
Development, Inc. | | | 170,300 | | | | 5,965,609 | | |
Thermo Fisher
Scientific, Inc. (a) | | | 180,840 | | | | 9,806,953 | | |
| Waters Corp. (a) | | | 99,360 | | | | 6,117,595 | | |
| Life Sciences Tools & Services Total | | | 28,718,449 | | |
| Pharmaceuticals – 1.6% | |
| Allergan, Inc. | | | 280,850 | | | | 16,853,808 | | |
| Shire PLC, ADR | | | 110,670 | | | | 8,714,156 | | |
| Pharmaceuticals Total | | | 25,567,964 | | |
| Health Care Total | | | 244,120,287 | | |
| Industrials – 13.2% | |
| Aerospace & Defense – 3.3% | |
| BE Aerospace, Inc. (a) | | | 148,400 | | | | 5,783,148 | | |
| Goodrich Corp. | | | 139,270 | | | | 8,796,293 | | |
See Accompanying Notes to Financial Statements.
54
Columbia Mid Cap Growth Fund
August 31, 2007
Common Stocks (continued)
| | | Shares | | Value ($) | |
L-3 Communications
Holdings, Inc. | | | 76,490 | | | | 7,535,030 | | |
| Precision Castparts Corp. | | | 118,443 | | | | 15,434,307 | | |
| Rockwell Collins, Inc. | | | 212,270 | | | | 14,619,035 | | |
| Aerospace & Defense Total | | | 52,167,813 | | |
| Air Freight & Logistics – 1.0% | |
| C.H. Robinson Worldwide, Inc. | | | 195,070 | | | | 9,566,233 | | |
Expeditors International
Washington, Inc. | | | 140,509 | | | | 6,206,282 | | |
| Air Freight & Logistics Total | | | 15,772,515 | | |
| Commercial Services & Supplies – 1.8% | |
| Dun & Bradstreet Corp. | | | 68,880 | | | | 6,719,244 | | |
| Resources Connection, Inc. | | | 205,130 | | | | 6,153,900 | | |
| Robert Half International, Inc. | | | 195,330 | | | | 6,238,840 | | |
| Stericycle, Inc. (a) | | | 190,200 | | | | 9,490,980 | | |
| Commercial Services & Supplies Total | | | 28,602,964 | | |
| Construction & Engineering – 0.6% | |
Jacobs Engineering
Group, Inc. (a) | | | 72,070 | | | | 4,763,106 | | |
| Quanta Services, Inc. (a) | | | 181,010 | | | | 5,117,153 | | |
| Construction & Engineering Total | | | 9,880,259 | | |
| Electrical Equipment – 2.6% | |
| AMETEK, Inc. | | | 118,900 | | | | 4,754,811 | | |
| General Cable Corp. (a) | | | 156,890 | | | | 9,127,860 | | |
| Roper Industries, Inc. | | | 174,680 | | | | 11,055,497 | | |
| SunPower Corp., Class A (a) | | | 96,050 | | | | 6,563,097 | | |
Suntech Power
Holdings Co., Ltd., ADR (a) | | | 237,440 | | | | 8,488,480 | | |
| Electrical Equipment Total | | | 39,989,745 | | |
| Industrial Conglomerates – 0.6% | |
| McDermott International, Inc. (a) | | | 92,860 | | | | 8,913,632 | | |
| Industrial Conglomerates Total | | | 8,913,632 | | |
| Machinery – 2.9% | |
| Cummins, Inc. | | | 123,930 | | | | 14,675,791 | | |
| ITT Corp. | | | 92,150 | | | | 6,265,278 | | |
| Joy Global, Inc. | | | 195,738 | | | | 8,493,072 | | |
| Oshkosh Truck Corp. | | | 104,960 | | | | 6,076,134 | | |
| Terex Corp. (a) | | | 122,600 | | | | 9,793,288 | | |
| Machinery Total | | | 45,303,563 | | |
| Road & Rail – 0.4% | |
| Landstar System, Inc. | | | 136,040 | | | | 5,851,081 | | |
| Road & Rail Total | | | 5,851,081 | | |
| Industrials Total | | | 206,481,572 | | |
| | | Shares | | Value ($) | |
| Information Technology – 20.0% | |
| Communications Equipment – 3.0% | |
| F5 Networks, Inc. (a) | | | 110,000 | | | | 3,846,700 | | |
| Harris Corp. | | | 137,180 | | | | 8,344,659 | | |
| Juniper Networks, Inc. (a) | | | 261,560 | | | | 8,610,555 | | |
| Research in Motion Ltd. (a) | | | 192,400 | | | | 16,432,884 | | |
| Riverbed Technology, Inc. (a) | | | 211,422 | | | | 9,387,137 | | |
| Communications Equipment Total | | | 46,621,935 | | |
| Computers & Peripherals – 0.7% | |
| Network Appliance, Inc. (a) | | | 229,720 | | | | 6,399,999 | | |
| SanDisk Corp. (a) | | | 86,760 | | | | 4,863,766 | | |
| Computers & Peripherals Total | | | 11,263,765 | | |
| Electronic Equipment & Instruments – 1.2% | |
| Agilent Technologies, Inc. (a) | | | 109,260 | | | | 3,977,064 | | |
| Amphenol Corp., Class A | | | 147,860 | | | | 5,339,225 | | |
| Trimble Navigation Ltd. (a) | | | 126,050 | | | | 4,450,825 | | |
| Tyco Electronics Ltd. (a) | | | 157,510 | | | | 5,492,374 | | |
| Electronic Equipment & Instruments Total | | | 19,259,488 | | |
| Internet Software & Services – 0.7% | |
| Equinix, Inc. (a) | | | 94,000 | | | | 8,319,940 | | |
| VeriSign, Inc. (a) | | | 97,970 | | | | 3,154,634 | | |
| Internet Software & Services Total | | | 11,474,574 | | |
| IT Services – 2.9% | |
Cognizant Technology
Solutions Corp., Class A (a) | | | 154,160 | | | | 11,332,302 | | |
| DST Systems, Inc. (a) | | | 78,720 | | | | 6,018,931 | | |
| Fiserv, Inc. (a) | | | 88,420 | | | | 4,113,298 | | |
| Global Payments, Inc. | | | 172,930 | | | | 6,827,277 | | |
| Mastercard, Inc., Class A | | | 48,870 | | | | 6,694,701 | | |
| Paychex, Inc. | | | 213,100 | | | | 9,468,033 | | |
| IT Services Total | | | 44,454,542 | | |
| Semiconductors & Semiconductor Equipment – 6.4% | |
Atheros
Communications, Inc. (a) | | | 206,490 | | | | 6,176,116 | | |
| KLA-Tencor Corp. | | | 143,360 | | | | 8,238,899 | | |
| Lam Research Corp. (a) | | | 294,290 | | | | 15,782,773 | | |
Marvell Technology
Group Ltd. (a) | | | 524,940 | | | | 8,698,256 | | |
Maxim Integrated
Products, Inc. | | | 192,770 | | | | 5,785,028 | | |
MEMC Electronic
Materials, Inc. (a) | | | 309,534 | | | | 19,011,578 | | |
| National Semiconductor Corp. | | | 199,580 | | | | 5,252,946 | | |
| NVIDIA Corp. (a) | | | 498,610 | | | | 25,508,887 | | |
| Tessera Technologies, Inc. (a) | | | 131,870 | | | | 4,830,398 | | |
Semiconductors & Semiconductor
Equipment Total | | | 99,284,881 | | |
See Accompanying Notes to Financial Statements.
55
Columbia Mid Cap Growth Fund
August 31, 2007
Common Stocks (continued)
| | | Shares | | Value ($) | |
| Software – 5.1% | |
| Activision, Inc. (a) | | | 347,340 | | | | 6,769,657 | | |
| Amdocs Ltd. (a) | | | 48,629 | | | | 1,716,604 | | |
| Autodesk, Inc. (a) | | | 119,059 | | | | 5,514,813 | | |
| BEA Systems, Inc. (a) | | | 439,657 | | | | 5,363,815 | | |
| BMC Software, Inc. (a) | | | 186,040 | | | | 5,696,545 | | |
| Citrix Systems, Inc. (a) | | | 108,427 | | | | 3,941,321 | | |
| Double-Take Software, Inc. (a) | | | 100,532 | | | | 1,737,193 | | |
| Electronic Arts, Inc. (a) | | | 117,190 | | | | 6,204,039 | | |
| FactSet Research Systems, Inc. | | | 198,470 | | | | 11,894,307 | | |
| McAfee, Inc. (a) | | | 365,970 | | | | 13,083,427 | | |
Nuance
Communications, Inc. (a) | | | 54,020 | | | | 1,015,576 | | |
| Salesforce.com, Inc. (a) | | | 83,550 | | | | 3,377,927 | | |
| THQ, Inc. (a) | | | 298,181 | | | | 8,584,631 | | |
| VMware, Inc., Class A (a) | | | 78,360 | | | | 5,398,220 | | |
| Software Total | | | 80,298,075 | | |
| Information Technology Total | | | 312,657,260 | | |
| Materials – 6.0% | |
| Chemicals – 2.3% | |
| Agrium, Inc. | | | 171,730 | | | | 7,820,584 | | |
| Monsanto Co. | | | 167,450 | | | | 11,677,963 | | |
Potash Corp. of
Saskatchewan, Inc. | | | 177,670 | | | | 15,734,456 | | |
| Chemicals Total | | | 35,233,003 | | |
| Construction Materials – 0.6% | |
| Vulcan Materials Co. | | | 100,940 | | | | 9,085,609 | | |
| Construction Materials Total | | | 9,085,609 | | |
| Containers & Packaging – 0.7% | |
| Ball Corp. | | | 93,180 | | | | 4,880,768 | | |
| Crown Holdings, Inc. (a) | | | 286,625 | | | | 6,884,733 | | |
| Containers & Packaging Total | | | 11,765,501 | | |
| Metals & Mining – 2.4% | |
| Allegheny Technologies, Inc. | | | 125,180 | | | | 12,441,640 | | |
| Carpenter Technology Corp. | | | 83,615 | | | | 9,769,577 | | |
Freeport-McMoRan Copper &
Gold, Inc. | | | 107,259 | | | | 9,376,582 | | |
| Lundin Mining Corp. (a) | | | 214,744 | | | | 2,465,261 | | |
| Steel Dynamics, Inc. | | | 65,330 | | | | 2,834,015 | | |
| Metals & Mining Total | | | 36,887,075 | | |
| Materials Total | | | 92,971,188 | | |
| | | Shares | | Value ($) | |
| Telecommunication Services – 6.3% | |
| Diversified Telecommunication Services – 0.4% | |
Cogent Communications
Group, Inc. (a) | | | 229,740 | | | | 5,736,608 | | |
Diversified Telecommunication
Services Total | | | 5,736,608 | | |
| Wireless Telecommunication Services – 5.9% | |
American Tower Corp.,
Class A (a) | | | 493,127 | | | | 19,537,692 | | |
Crown Castle
International Corp. (a) | | | 350,910 | | | | 12,899,451 | | |
Leap Wireless
International, Inc. (a) | | | 145,410 | | | | 10,542,225 | | |
MetroPCS
Communications, Inc. (a) | | | 365,920 | | | | 9,985,957 | | |
Millicom International
Cellular SA (a) | | | 118,330 | | | | 9,978,769 | | |
| NII Holdings, Inc. (a) | | | 279,170 | | | | 22,104,680 | | |
Rogers Communications, Inc.,
Class B | | | 175,350 | | | | 7,939,848 | | |
Wireless Telecommunication
Services Total | | | 92,988,622 | | |
| Telecommunication Services Total | | | 98,725,230 | | |
| Utilities – 2.6% | |
| Electric Utilities – 1.2% | |
| Allegheny Energy, Inc. (a) | | | 95,020 | | | | 4,903,982 | | |
| PPL Corp. | | | 293,520 | | | | 14,165,275 | | |
| Electric Utilities Total | | | 19,069,257 | | |
| Gas Utilities – 0.6% | |
| Questar Corp. | | | 180,530 | | | | 9,021,084 | | |
| Gas Utilities Total | | | 9,021,084 | | |
| Independent Power Producers & Energy Traders – 0.8% | |
Constellation Energy
Group, Inc. | | | 73,630 | | | | 6,106,872 | | |
| Mirant Corp. (a) | | | 161,010 | | | | 6,274,560 | | |
Independent Power Producers &
Energy Traders Total | | | 12,381,432 | | |
| Utilities Total | | | 40,471,773 | | |
Total Common Stocks
(Cost of $1,294,929,116) | | | 1,556,666,424 | | |
See Accompanying Notes to Financial Statements.
56
Columbia Mid Cap Growth Fund
August 31, 2007
Short-Term Obligation – 1.5%
| | | Par ($) | | Value ($) | |
Repurchase agreement with
Fixed Income Clearing Corp.,
dated 8/31/07, due 9/04/07
at 5.030%, collateralized by a
U.S. Treasury Obligation maturing
09/17/07, market value of
$24,366,170 (repurchase
proceeds $23,898,349) | | | 23,885,000 | | | | 23,885,000 | | |
Total Short-Term Obligation
(Cost of $23,885,000) | | | 23,885,000 | | |
Total Investments – 101.3%
(Cost of $1,318,814,116) (b) | | | 1,580,551,424 | | |
| Other Assets & Liabilities, Net – (1.3)% | | | (20,332,045 | ) | |
| Net Assets – 100.0% | | | 1,560,219,379 | | |
Notes to Investment Portfolio:
(a) Non-income producing security.
(b) Cost for federal income tax purposes is $1,324,325,476.
For the year ended August 31, 2007, transactions in written option contracts were as follows:
| | | Number of
contracts | | Premium
received | |
| Options outstanding at August 31, 2006 | | | – | | | | – | | |
| Options written | | | 1,854 | | | $ | 308,780 | | |
| Options terminated in closing | | | | | | | | | |
| purchase transactions | | | – | | | | – | | |
| Options exercised | | | (525 | ) | | | (105,602 | ) | |
| Options expired | | | (1,329 | ) | | | (203,178 | ) | |
| Options outstanding at August 31, 2007 | | | – | | | $ | – | | |
At August 31, 2007, the Fund held investments in the following sectors:
| Sector (Unaudited) | | % of
Net Assets | |
| Information Technology | | | 20.0 | | |
| Health Care | | | 15.7 | | |
| Consumer Discretionary | | | 14.1 | | |
| Industrials | | | 13.2 | | |
| Energy | | | 12.3 | | |
| Telecommunication Services | | | 6.3 | | |
| Materials | | | 6.0 | | |
| Financials | | | 5.9 | | |
| Consumer Staples | | | 3.7 | | |
| Utilities | | | 2.6 | | |
| | | | 99.8 | | |
| Short-Term Obligation | | | 1.5 | | |
| Other Assets & Liabilities, Net | | | (1.3 | ) | |
| | | | 100.0 | | |
| Acronym | | Name | |
| ADR | | American Depositary Receipt | |
|
See Accompanying Notes to Financial Statements.
57
Investment Portfolio – Columbia Small Cap Growth Fund I
August 31, 2007
Common Stocks – 95.6%
| | | Shares | | Value ($) | |
| Consumer Discretionary – 17.5% | |
| Auto Components – 0.6% | |
| Spartan Motors, Inc. | | | 106,500 | | | | 1,576,200 | | |
| Auto Components Total | | | 1,576,200 | | |
| Diversified Consumer Services – 1.7% | |
| Capella Education Co. (a) | | | 16,000 | | | | 806,560 | | |
New Oriental Education &
Technology Group, ADR (a) | | | 25,500 | | | | 1,350,225 | | |
| Sotheby's | | | 11,200 | | | | 484,736 | | |
| Strayer Education, Inc. | | | 9,900 | | | | 1,579,842 | | |
| Diversified Consumer Services Total | | | 4,221,363 | | |
| Hotels, Restaurants & Leisure – 3.9% | |
| Bally Technologies, Inc. (a) | | | 31,300 | | | | 1,038,221 | | |
| Buffalo Wild Wings, Inc. (a) | | | 27,100 | | | | 942,267 | | |
Chipotle Mexican Grill, Inc.,
Class A (a) | | | 7,600 | | | | 790,324 | | |
| Ctrip.com International Ltd., ADR | | | 16,440 | | | | 698,536 | | |
| Life Time Fitness, Inc. (a) | | | 23,300 | | | | 1,294,781 | | |
| Orient-Express Hotels Ltd., Class A | | | 14,800 | | | | 740,740 | | |
| Pinnacle Entertainment, Inc. (a) | | | 34,028 | | | | 946,659 | | |
| Ruby Tuesday, Inc. | | | 25,700 | | | | 569,255 | | |
| Scientific Games Corp., Class A (a) | | | 33,440 | | | | 1,166,721 | | |
| Texas Roadhouse, Inc., Class A (a) | | | 92,400 | | | | 1,183,644 | | |
| Hotels, Restaurants & Leisure Total | | | 9,371,148 | | |
| Household Durables – 0.2% | |
| Gafisa SA, ADR (a) | | | 24,400 | | | | 570,228 | | |
| Household Durables Total | | | 570,228 | | |
| Internet & Catalog Retail – 1.0% | |
| Priceline.com, Inc. (a) | | | 15,000 | | | | 1,244,700 | | |
| Shutterfly, Inc. (a) | | | 42,100 | | | | 1,177,116 | | |
| Internet & Catalog Retail Total | | | 2,421,816 | | |
| Leisure Equipment & Products – 0.6% | |
| Smith & Wesson Holding Corp. (a) | | | 64,100 | | | | 1,346,100 | | |
| Leisure Equipment & Products Total | | | 1,346,100 | | |
| Media – 2.2% | |
| Dolan Media Co. (a) | | | 87,556 | | | | 1,739,738 | | |
| Knology, Inc. (a) | | | 151,500 | | | | 2,393,700 | | |
| National CineMedia, Inc. | | | 51,185 | | | | 1,260,686 | | |
| Media Total | | | 5,394,124 | | |
| Specialty Retail – 3.9% | |
| DSW, Inc., Class A (a) | | | 47,200 | | | | 1,437,240 | | |
| GameStop Corp., Class A (a) | | | 47,700 | | | | 2,391,678 | | |
| Hibbett Sports, Inc. (a) | | | 44,900 | | | | 1,119,806 | | |
| J Crew Group, Inc. (a) | | | 31,000 | | | | 1,544,110 | | |
| Men's Wearhouse, Inc. | | | 18,800 | | | | 952,784 | | |
| | | Shares | | Value ($) | |
| Monro Muffler Brake, Inc. | | | 33,000 | | | | 1,241,790 | | |
| Zumiez, Inc. (a) | | | 15,000 | | | | 727,950 | | |
| Specialty Retail Total | | | 9,415,358 | | |
| Textiles, Apparel & Luxury Goods – 3.4% | |
| CROCS, Inc. (a) | | | 59,000 | | | | 3,483,360 | | |
| Lululemon Athletica, Inc. (a) | | | 28,500 | | | | 970,995 | | |
| Volcom, Inc. (a) | | | 31,483 | | | | 1,228,782 | | |
| Warnaco Group, Inc. (a) | | | 71,800 | | | | 2,505,820 | | |
| Textiles, Apparel & Luxury Goods Total | | | 8,188,957 | | |
| Consumer Discretionary Total | | | 42,505,294 | | |
| Energy – 7.0% | |
| Energy Equipment & Services – 3.3% | |
| Atwood Oceanics, Inc. (a) | | | 34,000 | | | | 2,583,660 | | |
| Core Laboratories NV (a) | | | 16,900 | | | | 1,894,490 | | |
| Hornbeck Offshore Services, Inc. (a) | | | 21,900 | | | | 835,485 | | |
| Oil States International, Inc. (a) | | | 34,500 | | | | 1,455,900 | | |
| Tetra Technologies, Inc. (a) | | | 61,100 | | | | 1,221,389 | | |
| Energy Equipment & Services Total | | | 7,990,924 | | |
| Oil, Gas & Consumable Fuels – 3.7% | |
| Arena Resources, Inc. (a) | | | 22,400 | | | | 1,374,464 | | |
| Berry Petroleum Co., Class A | | | 56,500 | | | | 1,925,520 | | |
| Carrizo Oil & Gas, Inc. (a) | | | 24,491 | | | | 961,761 | | |
| Foundation Coal Holdings, Inc. | | | 30,800 | | | | 1,044,736 | | |
| Parallel Petroleum Corp. (a) | | | 102,069 | | | | 1,805,601 | | |
| PetroHawk Energy Corp. (a) | | | 82,500 | | | | 1,249,050 | | |
| Ship Finance International Ltd. | | | 24,500 | | | | 704,865 | | |
| Oil, Gas & Consumable Fuels Total | | | 9,065,997 | | |
| Energy Total | | | 17,056,921 | | |
| Financials – 6.3% | |
| Capital Markets – 2.0% | |
| Affiliated Managers Group, Inc. (a) | | | 20,001 | | | | 2,265,113 | | |
| GFI Group, Inc. (a) | | | 13,000 | | | | 962,000 | | |
Waddell & Reed Financial, Inc.,
Class A | | | 69,544 | | | | 1,727,473 | | |
| Capital Markets Total | | | 4,954,586 | | |
| Commercial Banks – 1.6% | |
| East West Bancorp, Inc. | | | 38,600 | | | | 1,381,880 | | |
| Signature Bank (a) | | | 27,840 | | | | 962,150 | | |
| Sterling Financial Corp. | | | 27,038 | | | | 688,658 | | |
| UCBH Holdings, Inc. | | | 56,000 | | | | 930,720 | | |
| Commercial Banks Total | | | 3,963,408 | | |
| Consumer Finance – 0.5% | |
| First Cash Financial Services, Inc. (a) | | | 53,100 | | | | 1,137,402 | | |
| Consumer Finance Total | | | 1,137,402 | | |
See Accompanying Notes to Financial Statements.
58
Columbia Small Cap Growth Fund I
August 31, 2007
Common Stocks (continued)
| | | Shares | | Value ($) | |
| Insurance – 0.6% | |
| ProAssurance Corp. (a) | | | 26,977 | | | | 1,418,451 | | |
| Insurance Total | | | 1,418,451 | | |
| Real Estate Investment Trusts (REITs) – 1.6% | |
Alexandria Real Estate
Equities, Inc. | | | 14,000 | | | | 1,306,620 | | |
| FelCor Lodging Trust, Inc. | | | 44,500 | | | | 976,330 | | |
| Redwood Trust, Inc. | | | 21,500 | | | | 802,595 | | |
| Supertel Hospitality, Inc. | | | 95,800 | | | | 757,778 | | |
| Real Estate Investment Trusts (REITs) Total | | | 3,843,323 | | |
| Financials Total | | | 15,317,170 | | |
| Health Care – 21.4% | |
| Biotechnology – 6.2% | |
| Alexion Pharmaceuticals, Inc. (a) | | | 20,700 | | | | 1,251,729 | | |
| Alkermes, Inc. (a) | | | 73,400 | | | | 1,236,790 | | |
| Allos Therapeutics, Inc. (a) | | | 214,900 | | | | 1,014,328 | | |
| Applera Corp. - Celera Group (a) | | | 44,400 | | | | 584,748 | | |
| Ariad Pharmaceuticals, Inc. (a) | | | 146,800 | | | | 729,596 | | |
| ArQule, Inc. (a) | | | 68,000 | | | | 557,600 | | |
| Array Biopharma, Inc. (a) | | | 107,900 | | | | 1,224,665 | | |
| BioMarin Pharmaceuticals, Inc. (a) | | | 77,900 | | | | 1,673,292 | | |
| Cubist Pharmaceuticals, Inc. (a) | | | 29,200 | | | | 668,096 | | |
| Onyx Pharmaceuticals, Inc. (a) | | | 59,200 | | | | 2,345,504 | | |
| OSI Pharmaceuticals, Inc. (a) | | | 30,900 | | | | 1,053,999 | | |
| Savient Pharmaceuticals, Inc. (a) | | | 61,200 | | | | 806,616 | | |
| Seattle Genetics, Inc. (a) | | | 59,400 | | | | 609,444 | | |
| United Therapeutics Corp. (a) | | | 18,000 | | | | 1,232,820 | | |
| Biotechnology Total | | | 14,989,227 | | |
| Health Care Equipment & Supplies – 7.0% | |
| Abiomed, Inc. (a) | | | 52,900 | | | | 651,199 | | |
| Align Technology, Inc. (a) | | | 58,600 | | | | 1,331,978 | | |
| Gen-Probe, Inc. (a) | | | 12,200 | | | | 781,044 | | |
| Hologic, Inc. (a) | | | 38,037 | | | | 2,021,667 | | |
| Immucor, Inc. (a) | | | 38,900 | | | | 1,297,315 | | |
| Kyphon, Inc. (a) | | | 57,230 | | | | 3,826,970 | | |
| Masimo Corp. (a) | | | 35,670 | | | | 749,070 | | |
| Micrus Endovascular Corp. (a) | | | 42,800 | | | | 1,019,496 | | |
Mindray Medical International
Ltd., ADR | | | 29,300 | | | | 1,039,857 | | |
| Northstar Neuroscience, Inc. (a) | | | 60,900 | | �� | | 691,824 | | |
| NuVasive, Inc. (a) | | | 63,500 | | | | 2,025,650 | | |
| Sirona Dental Systems, Inc. (a) | | | 25,600 | | | | 746,240 | | |
| Spectranetics Corp. (a) | | | 51,100 | | | | 752,703 | | |
| Health Care Equipment & Supplies Total | | | 16,935,013 | | |
| Health Care Providers & Services – 2.7% | |
| HealthExtras, Inc. (a) | | | 60,036 | | | | 1,687,612 | | |
| Healthways, Inc. (a) | | | 11,700 | | | | 582,660 | | |
| | | Shares | | Value ($) | |
| Psychiatric Solutions, Inc. (a) | | | 43,300 | | | | 1,596,038 | | |
| Sunrise Senior Living, Inc. (a) | | | 45,200 | | | | 1,618,612 | | |
| VCA Antech, Inc. (a) | | | 25,448 | | | | 1,040,569 | | |
| Health Care Providers & Services Total | | | 6,525,491 | | |
| Health Care Technology – 0.8% | |
Allscripts Healthcare
Solutions, Inc. (a) | | | 84,994 | | | | 1,921,714 | | |
| Health Care Technology Total | | | 1,921,714 | | |
| Life Sciences Tools & Services – 2.4% | |
| ICON PLC, ADR (a) | | | 86,528 | | | | 3,952,599 | | |
| Illumina, Inc. (a) | | | 42,200 | | | | 2,037,838 | | |
| Life Sciences Tools & Services Total | | | 5,990,437 | | |
| Pharmaceuticals – 2.3% | |
| Cypress Bioscience, Inc. (a) | | | 52,100 | | | | 690,846 | | |
Medicis Pharmaceutical Corp.,
Class A | | | 63,600 | | | | 1,942,344 | | |
| MGI Pharma, Inc. (a) | | | 49,000 | | | | 1,154,930 | | |
| Penwest Pharmaceuticals Co. (a) | | | 46,200 | | | | 570,570 | | |
| XenoPort, Inc. (a) | | | 28,300 | | | | 1,175,299 | | |
| Pharmaceuticals Total | | | 5,533,989 | | |
| Health Care Total | | | 51,895,871 | | |
| Industrials – 13.4% | |
| Aerospace & Defense – 2.1% | |
American Science &
Engineering, Inc. | | | 15,161 | | | | 1,095,382 | | |
| BE Aerospace, Inc. (a) | | | 57,027 | | | | 2,222,342 | | |
| Ladish Co., Inc. (a) | | | 35,000 | | | | 1,836,800 | | |
| Aerospace & Defense Total | | | 5,154,524 | | |
| Air Freight & Logistics – 0.5% | |
| HUB Group, Inc., Class A (a) | | | 32,500 | | | | 1,084,525 | | |
| Air Freight & Logistics Total | | | 1,084,525 | | |
| Commercial Services & Supplies – 3.9% | |
| ACCO Brands Corp. (a) | | | 35,200 | | | | 797,984 | | |
| Advisory Board Co. (a) | | | 30,300 | | | | 1,743,159 | | |
| Huron Consulting Group, Inc. (a) | | | 36,298 | | | | 2,397,483 | | |
| Knoll, Inc. | | | 79,500 | | | | 1,511,295 | | |
| Resources Connection, Inc. | | | 49,466 | | | | 1,483,980 | | |
| Waste Connections, Inc. (a) | | | 46,350 | | | | 1,409,967 | | |
| Commercial Services & Supplies Total | | | 9,343,868 | | |
| Construction & Engineering – 0.6% | |
| Granite Construction, Inc. | | | 8,300 | | | | 451,852 | | |
| Quanta Services, Inc. (a) | | | 34,800 | | | | 983,796 | | |
| Construction & Engineering Total | | | 1,435,648 | | |
See Accompanying Notes to Financial Statements.
59
Columbia Small Cap Growth Fund I
August 31, 2007
Common Stocks (continued)
| | | Shares | | Value ($) | |
| Electrical Equipment – 2.0% | |
| Acuity Brands, Inc. | | | 14,700 | | | | 772,338 | | |
| General Cable Corp. (a) | | | 26,300 | | | | 1,530,134 | | |
JA Solar Holdings Co.,
Ltd., ADR (a) | | | 33,505 | | | | 1,228,628 | | |
| SunPower Corp., Class A (a) | | | 20,500 | | | | 1,400,765 | | |
| Electrical Equipment Total | | | 4,931,865 | | |
| Machinery – 2.1% | |
| Actuant Corp., Class A | | | 15,200 | | | | 927,048 | | |
Bucyrus International, Inc.,
Class A | | | 31,800 | | | | 1,987,182 | | |
| Kaydon Corp. | | | 23,200 | | | | 1,224,960 | | |
| RBC Bearings, Inc. (a) | | | 27,475 | | | | 975,363 | | |
| Machinery Total | | | 5,114,553 | | |
| Marine – 1.4% | |
| Diana Shipping, Inc. | | | 39,028 | | | | 1,036,193 | | |
| Genco Shipping & Trading Ltd. | | | 19,400 | | | | 1,088,340 | | |
| Ultrapetrol Bahamas Ltd. (a) | | | 71,700 | | | | 1,292,034 | | |
| Marine Total | | | 3,416,567 | | |
| Road & Rail – 0.8% | |
Genesee & Wyoming, Inc.,
Class A (a) | | | 37,100 | | | | 1,015,798 | | |
| Landstar System, Inc. | | | 21,400 | | | | 920,414 | | |
| Road & Rail Total | | | 1,936,212 | | |
| Industrials Total | | | 32,417,762 | | |
| Information Technology – 22.6% | |
| Communications Equipment – 2.3% | |
| CommScope, Inc. (a) | | | 12,400 | | | | 701,840 | | |
| F5 Networks, Inc. (a) | | | 23,870 | | | | 834,734 | | |
| NETGEAR, Inc. (a) | | | 72,800 | | | | 2,042,768 | | |
| Riverbed Technology, Inc. (a) | | | 31,800 | | | | 1,411,920 | | |
| ShoreTel, Inc. (a) | | | 51,885 | | | | 693,183 | | |
| Communications Equipment Total | | | 5,684,445 | | |
| Computers & Peripherals – 0.6% | |
| Synaptics, Inc. (a) | | | 31,300 | | | | 1,355,290 | | |
| Computers & Peripherals Total | | | 1,355,290 | | |
| Electronic Equipment & Instruments – 1.9% | |
| Anixter International, Inc. (a) | | | 14,600 | | | | 1,120,842 | | |
| Cogent, Inc. (a) | | | 66,300 | | | | 951,405 | | |
| FLIR Systems, Inc. (a) | | | 28,300 | | | | 1,393,492 | | |
| Novatel, Inc. (a) | | | 31,200 | | | | 1,124,760 | | |
| Electronic Equipment & Instruments Total | | | 4,590,499 | | |
| Internet Software & Services – 4.4% | |
| Bankrate, Inc. (a) | | | 12,800 | | | | 500,864 | | |
| DealerTrack Holdings, Inc. (a) | | | 46,400 | | | | 1,772,480 | | |
| | | Shares | | Value ($) | |
| Digital River, Inc. (a) | | | 40,900 | | | | 1,896,124 | | |
| Equinix, Inc. (a) | | | 23,440 | | | | 2,074,675 | | |
| Greenfield Online, Inc. (a) | | | 27,734 | | | | 400,479 | | |
| Keynote Systems, Inc. (a) | | | 66,800 | | | | 921,840 | | |
| Omniture, Inc. (a) | | | 43,219 | | | | 1,072,263 | | |
| Vocus, Inc. (a) | | | 82,682 | | | | 2,067,050 | | |
| Internet Software & Services Total | | | 10,705,775 | | |
| IT Services – 1.5% | |
| Acxiom Corp. | | | 49,400 | | | | 1,210,300 | | |
| Gartner, Inc. (a) | | | 70,200 | | | | 1,552,122 | | |
| RightNow Technologies, Inc. (a) | | | 61,200 | | | | 896,580 | | |
| IT Services Total | | | 3,659,002 | | |
| Semiconductors & Semiconductor Equipment – 5.5% | |
| Atheros Communications, Inc. (a) | | | 90,259 | | | | 2,699,647 | | |
| ATMI, Inc. (a) | | | 56,700 | | | | 1,710,072 | | |
| Hittite Microwave Corp. (a) | | | 23,201 | | | | 983,026 | | |
| MIPS Technologies, Inc. (a) | | | 64,200 | | | | 502,044 | | |
| Monolithic Power Systems, Inc. (a) | | | 43,800 | | | | 897,024 | | |
| Netlogic Microsystems, Inc. (a) | | | 41,800 | | | | 1,225,994 | | |
| PLX Technology, Inc. (a) | | | 43,900 | | | | 474,998 | | |
| Tessera Technologies, Inc. (a) | | | 59,706 | | | | 2,187,031 | | |
| Verigy Ltd. (a) | | | 103,200 | | | | 2,726,544 | | |
Semiconductors & Semiconductor
Equipment Total | | | 13,406,380 | | |
| Software – 6.4% | |
| Activision, Inc. (a) | | | 51,400 | | | | 1,001,786 | | |
| Ansoft Corp. (a) | | | 44,400 | | | | 1,327,116 | | |
| ANSYS, Inc. (a) | | | 41,000 | | | | 1,358,330 | | |
| Concur Technologies, Inc. (a) | | | 78,300 | | | | 2,096,874 | | |
| FactSet Research Systems, Inc. | | | 16,500 | | | | 988,845 | | |
| Informatica Corp. (a) | | | 50,700 | | | | 707,772 | | |
Magma Design
Automation, Inc. (a) | | | 85,685 | | | | 1,177,312 | | |
| Micros Systems, Inc. (a) | | | 12,472 | | | | 752,561 | | |
| Nuance Communications, Inc. (a) | | | 69,278 | | | | 1,302,426 | | |
| Perfect World Co., Ltd., ADR (a) | | | 17,117 | | | | 388,042 | | |
| Taleo Corp., Class A (a) | | | 77,355 | | | | 1,783,033 | | |
| THQ, Inc. (a) | | | 44,358 | | | | 1,277,067 | | |
| Ultimate Software Group, Inc. (a) | | | 41,100 | | | | 1,279,443 | | |
| Software Total | | | 15,440,607 | | |
| Information Technology Total | | | 54,841,998 | | |
| Materials – 4.7% | |
| Chemicals – 0.6% | |
| Terra Industries, Inc. (a) | | | 38,700 | | | | 1,005,039 | | |
| Zoltek Companies, Inc. (a) | | | 14,700 | | | | 606,963 | | |
| Chemicals Total | | | 1,612,002 | | |
See Accompanying Notes to Financial Statements.
60
Columbia Small Cap Growth Fund I
August 31, 2007
Common Stocks (continued)
| | | Shares | | Value ($) | |
| Containers & Packaging – 0.4% | |
| Silgan Holdings, Inc. | | | 18,400 | | | | 940,056 | | |
| Containers & Packaging Total | | | 940,056 | | |
| Metals & Mining – 3.7% | |
Brush Engineered
Materials, Inc. (a) | | | 21,486 | | | | 1,037,774 | | |
| Carpenter Technology Corp. | | | 15,500 | | | | 1,811,020 | | |
| Century Aluminum Co. (a) | | | 17,727 | | | | 871,814 | | |
| Claymont Steel Holdings, Inc. (a) | | | 52,554 | | | | 1,101,006 | | |
| FNX Mining Co., Inc. (a) | | | 27,500 | | | | 750,000 | | |
| Lundin Mining Corp. (a) | | | 118,800 | | | | 1,363,824 | | |
| RTI International Metals, Inc. (a) | | | 13,400 | | | | 934,248 | | |
| Universal Stainless & Alloy (a) | | | 32,800 | | | | 1,063,376 | | |
| Metals & Mining Total | | | 8,933,062 | | |
| Materials Total | | | 11,485,120 | | |
| Telecommunication Services – 2.7% | |
| Diversified Telecommunication Services – 0.6% | |
Cogent Communications
Group, Inc. (a) | | | 57,900 | | | | 1,445,763 | | |
| Diversified Telecommunication Services Total | | | 1,445,763 | | |
| Wireless Telecommunication Services – 2.1% | |
Centennial Communications
Corp. (a) | | | 73,900 | | | | 694,660 | | |
Millicom International
Cellular SA (a) | | | 17,784 | | | | 1,499,725 | | |
SBA Communications Corp.,
Class A (a) | | | 91,907 | | | | 2,993,411 | | |
| Wireless Telecommunication Services Total | | | 5,187,796 | | |
| Telecommunication Services Total | | | 6,633,559 | | |
Total Common Stocks
(Cost of $191,116,614) | | | 232,153,695 | | |
| Short-Term Obligation – 5.9% | |
| | | Par ($) | | | |
Repurchase agreement with
Fixed Income Clearing Corp.,
dated 08/31/07, due 09/04/07 at
5.030%, collateralized by a
U.S. Treasury Obligation maturing
09/17/07, market value of
$14,660,620 (repurchase proceeds
$14,381,033) | | | 14,373,000 | | | | 14,373,000 | | |
Total Short-Term Obligation
(Cost of $14,373,000) | | | 14,373,000 | | |
Total Investments – 101.5%
(Cost of $205,489,614) (b) | | | 246,526,695 | | |
| Other Assets & Liabilities, Net – (1.5)% | | | (3,652,246 | ) | |
| Net Assets – 100.0% | | | 242,874,449 | | |
Notes to Investment Portfolio:
(a) Non-income producing security.
(b) Cost for federal income tax purposes is $206,080,365.
For the year ended August 31, 2007, transactions in written option contracts were as follows:
| | | Number of
contracts | | Premium
received | |
| Options outstanding at August 31, 2006 | | | – | | | | – | | |
| Options written | | | 94 | | | $ | 10,246 | | |
Options terminated in closing
purchase transactions | | | – | | | | – | | |
| Options exercised | | | – | | | | – | | |
| Options expired | | | (94 | ) | | | (10,246 | ) | |
| Options outstanding at August 31, 2007 | | | – | | | $ | – | | |
At August 31, 2007, the Fund held investments in the following sectors:
| Sector (Unaudited) | | % of
Net Assets | |
| Information Technology | | | 22.6 | | |
| Health Care | | | 21.4 | | |
| Consumer Discretionary | | | 17.5 | | |
| Industrials | | | 13.4 | | |
| Energy | | | 7.0 | | |
| Financials | | | 6.3 | | |
| Materials | | | 4.7 | | |
| Telecommunication Services | | | 2.7 | | |
| | | | 95.6 | | |
| Short-Term Obligation | | | 5.9 | | |
| Other Assets & Liabilities, Net | | | (1.5 | ) | |
| | | | 100.0 | | |
| Acronym | | Name | |
| ADR | | American Depositary Receipt | |
|
See Accompanying Notes to Financial Statements.
61
Investment Portfolio – Columbia Real Estate Equity Fund
August 31, 2007
Common Stocks – 96.4%
| | | Shares | | Value ($) | |
| Consumer Discretionary – 6.5% | |
| Hotels, Restaurants & Leisure – 6.5% | |
| Gaylord Entertainment Co. (a) | | | 162,800 | | | | 8,359,780 | | |
| Hilton Hotels Corp. | | | 110,825 | | | | 5,092,409 | | |
Starwood Hotels & Resorts
Worldwide, Inc. | | | 233,462 | | | | 14,269,197 | | |
| Hotels, Restaurants & Leisure Total | | | 27,721,386 | | |
| Consumer Discretionary Total | | | 27,721,386 | | |
| Financials – 89.4% | |
| Real Estate Investment Trusts (REITs) – 89.4% | |
Alexandria Real Estate
Equities, Inc. | | | 242,272 | | | | 22,611,246 | | |
American Campus
Communities, Inc. | �� | | 242,882 | | | | 6,883,276 | | |
Apartment Investment &
Management Co., Class A | | | 441,252 | | | | 19,723,964 | | |
| AvalonBay Communities, Inc. | | | 195,921 | | | | 22,409,444 | | |
| Corporate Office Properties Trust | | | 529,268 | | | | 22,795,573 | | |
| Developers Diversified Realty Corp. | | | 345,263 | | | | 18,464,665 | | |
| Essex Property Trust, Inc. | | | 131,044 | | | | 15,435,673 | | |
| Extra Space Storage, Inc. | | | 703,400 | | | | 10,811,258 | | |
| Health Care REIT, Inc. | | | 368,057 | | | | 14,685,474 | | |
| iStar Financial, Inc. | | | 287,779 | | | | 10,532,711 | | |
| Kimco Realty Corp. | | | 661,078 | | | | 28,307,360 | | |
| LaSalle Hotel Properties | | | 224,000 | | | | 9,327,360 | | |
| Lexington Realty Trust | | | 230,600 | | | | 4,768,808 | | |
| Macerich Co. | | | 132,400 | | | | 10,753,528 | | |
Mid-America Apartment
Communities, Inc. | | | 382,912 | | | | 18,988,606 | | |
| Plum Creek Timber Co., Inc. | | | 356,280 | | | | 14,938,820 | | |
| Potlatch Corp. | | | 102,400 | | | | 4,612,096 | | |
| ProLogis | | | 639,373 | | | | 38,464,680 | | |
| Public Storage, Inc. | | | 283,905 | | | | 21,514,321 | | |
| Simon Property Group, Inc. | | | 464,643 | | | | 44,103,914 | | |
| SL Green Realty Corp. | | | 92,487 | | | | 10,313,225 | | |
| Sun Communities, Inc. | | | 381,978 | | | | 10,890,193 | | |
| Real Estate Investment Trusts (REITs) Total | | | 381,336,195 | | |
| Financials Total | | | 381,336,195 | | |
| | | Shares | | Value ($) | |
| Health Care – 0.5% | |
| Health Care Providers & Services – 0.5% | |
| Brookdale Senior Living, Inc. | | | 53,100 | | | | 1,944,522 | | |
| Health Care Providers & Services Total | | | 1,944,522 | | |
| Health Care Total | | | 1,944,522 | | |
Total Common Stocks
(Cost of $275,232,913) | | | 411,002,103 | | |
| Short-Term Obligation – 3.2% | |
| | | Par ($) | | | |
Repurchase agreement with
Fixed Income Clearing Corp.,
dated 08/31/07, due 09/04/07 at
5.030%, collateralized by a
U.S. Government Agency Obligation maturing
on 09/17/07, market value of
$13,757,430 (repurchase proceeds
$13,491,536) | | | 13,484,000 | | | | 13,484,000 | | |
Total Short-Term Obligation
(Cost of $13,484,000) | | | 13,484,000 | | |
Total Investments – 99.6%
(Cost of $288,716,913) (b) | | | 424,486,103 | | |
| Other Assets & Liabilities, Net – 0.4% | | | 1,896,419 | | |
| Net Assets – 100.0% | | | 426,382,522 | | |
Notes to Investment Portfolio:
(a) Non-income producing security.
(b) Cost for federal income tax purposes is $289,276,453.
At August 31, 2007, the Fund held investments in the following sectors:
| Sector (Unaudited) | | % of
Net Assets | |
| Financials | | | 89.4 | | |
| Consumer Discretionary | | | 6.5 | | |
| Health Care | | | 0.5 | | |
| | | | 96.4 | | |
| Short-Term Obligation | | | 3.2 | | |
| Other Assets & Liabilities, Net | | | 0.4 | | |
| | | | 100.0 | | |
See Accompanying Notes to Financial Statements.
62
Investment Portfolio – Columbia Technology Fund
August 31, 2007
Common Stocks – 96.6%
| | | Shares | | Value ($) | |
| Consumer Discretionary – 6.3% | |
| Hotels, Restaurants & Leisure – 0.3% | |
| Ctrip.com International Ltd., ADR | | | 22,772 | | | | 967,582 | | |
| Hotels, Restaurants & Leisure Total | | | 967,582 | | |
| Household Durables – 2.6% | |
| Garmin Ltd. | | | 55,330 | | | | 5,634,254 | | |
| Sony Corp., ADR | | | 42,620 | | | | 2,036,383 | | |
| Household Durables Total | | | 7,670,637 | | |
| Internet & Catalog Retail – 2.3% | |
| Amazon.com, Inc. (a) | | | 51,350 | | | | 4,103,379 | | |
| Priceline.com, Inc. (a) | | | 16,840 | | | | 1,397,383 | | |
| Shutterfly, Inc. (a) | | | 47,730 | | | | 1,334,531 | | |
| Internet & Catalog Retail Total | | | 6,835,293 | | |
| Media – 1.1% | |
| Knology, Inc. (a) | | | 125,121 | | | | 1,976,912 | | |
| National CineMedia, Inc. | | | 45,515 | | | | 1,121,034 | | |
| Media Total | | | 3,097,946 | | |
| Consumer Discretionary Total | | | 18,571,458 | | |
| Health Care – 1.0% | |
| Health Care Equipment & Supplies – 0.8% | |
| Masimo Corp. (a) | | | 42,056 | | | | 883,176 | | |
Mindray Medical
International Ltd., ADR | | | 37,910 | | | | 1,345,426 | | |
| Health Care Equipment & Supplies Total | | | 2,228,602 | | |
| Health Care Providers & Services – 0.2% | |
| Quest Diagnostics, Inc. | | | 12,540 | | | | 686,565 | | |
| Health Care Providers & Services Total | | | 686,565 | | |
| Health Care Total | | | 2,915,167 | | |
| Industrials – 2.9% | |
| Aerospace & Defense – 2.4% | |
American Science &
Engineering, Inc. | | | 21,250 | | | | 1,535,312 | | |
| L-3 Communications Holdings, Inc. | | | 55,860 | | | | 5,502,769 | | |
| Aerospace & Defense Total | | | 7,038,081 | | |
| Electrical Equipment – 0.3% | |
| General Cable Corp. (a) | | | 16,630 | | | | 967,533 | | |
| Electrical Equipment Total | | | 967,533 | | |
| Machinery – 0.2% | |
| Kaydon Corp. | | | 13,600 | | | | 718,080 | | |
| Machinery Total | | | 718,080 | | |
| Industrials Total | | | 8,723,694 | | |
| | | Shares | | Value ($) | |
| Information Technology – 76.3% | |
| Communications Equipment – 16.8% | |
| Cisco Systems, Inc. (a) | | | 72,930 | | | | 2,327,926 | | |
| Comverse Technology, Inc. (a) | | | 49,240 | | | | 824,770 | | |
| Corning, Inc. | | | 128,030 | | | | 2,992,061 | | |
| Harris Corp. | | | 67,360 | | | | 4,097,509 | | |
| Juniper Networks, Inc. (a) | | | 132,950 | | | | 4,376,714 | | |
| NETGEAR, Inc. (a) | | | 97,280 | | | | 2,729,677 | | |
| Nokia Oyj, ADR | | | 527,860 | | | | 17,356,037 | | |
| Research In Motion Ltd. (a) | | | 131,260 | | | | 11,210,916 | | |
| Riverbed Technology, Inc. (a) | | | 42,400 | | | | 1,882,560 | | |
| ShoreTel, Inc. (a) | | | 123,750 | | | | 1,653,300 | | |
| Communications Equipment Total | | | 49,451,470 | | |
| Computers & Peripherals – 9.4% | |
| Apple, Inc. (a) | | | 73,210 | | | | 10,138,121 | | |
| EMC Corp. (a) | | | 282,660 | | | | 5,557,095 | | |
| Hewlett-Packard Co. | | | 67,600 | | | | 3,336,060 | | |
International Business
Machines Corp. | | | 12,440 | | | | 1,451,624 | | |
| NCR Corp. (a) | | | 33,000 | | | | 1,642,410 | | |
| Network Appliance, Inc. (a) | | | 32,260 | | | | 898,764 | | |
| SanDisk Corp. (a) | | | 26,110 | | | | 1,463,727 | | |
| Seagate Technology | | | 38,120 | | | | 984,258 | | |
| Synaptics, Inc. (a) | | | 52,260 | | | | 2,262,858 | | |
| Computers & Peripherals Total | | | 27,734,917 | | |
| Electronic Equipment & Instruments – 2.9% | |
| Agilent Technologies, Inc. (a) | | | 27,760 | | | | 1,010,464 | | |
| AU Optronics Corp., ADR | | | 161,115 | | | | 2,366,777 | | |
| Cogent, Inc. (a) | | | 51,850 | | | | 744,048 | | |
| LG.Philips LCD Co., Ltd., ADR (a) | | | 132,940 | | | | 2,839,598 | | |
| Novatel, Inc. (a) | | | 27,100 | | | | 976,955 | | |
| Tyco Electronics Ltd. (a) | | | 19,970 | | | | 696,354 | | |
| Electronic Equipment & Instruments Total | | | 8,634,196 | | |
| Internet Software & Services – 5.8% | |
| Bankrate, Inc. (a) | | | 15,240 | | | | 596,341 | | |
| eBay, Inc. (a) | | | 71,600 | | | | 2,441,560 | | |
| Equinix, Inc. (a) | | | 14,800 | | | | 1,309,948 | | |
| Google, Inc., Class A (a) | | | 11,830 | | | | 6,095,408 | | |
| Omniture, Inc. (a) | | | 47,391 | | | | 1,175,771 | | |
| VeriSign, Inc. (a) | | | 84,740 | | | | 2,728,628 | | |
| Vocus, Inc. (a) | | | 103,311 | | | | 2,582,775 | | |
| Internet Software & Services Total | | | 16,930,431 | | |
| IT Services – 6.3% | |
| Accenture Ltd., Class A | | | 62,290 | | | | 2,566,971 | | |
Cognizant Technology Solutions
Corp., Class A (a) | | | 91,260 | | | | 6,708,523 | | |
| DST Systems, Inc. (a) | | | 37,170 | | | | 2,842,018 | | |
| Fiserv, Inc. (a) | | | 54,980 | | | | 2,557,670 | | |
See Accompanying Notes to Financial Statements.
63
Columbia Technology Fund
August 31, 2007
Common Stocks (continued)
| | | Shares | | Value ($) | |
| RightNow Technologies, Inc. (a) | | | 66,850 | | | | 979,352 | | |
Satyam Computer
Services Ltd., ADR | | | 114,280 | | | | 2,911,854 | | |
| IT Services Total | | | 18,566,388 | | |
| Semiconductors & Semiconductor Equipment – 17.5% | |
ASML Holding N.V., N.Y.
Registered Shares (a) | | | 138,060 | | | | 4,096,240 | | |
| Atheros Communications, Inc. (a) | | | 117,788 | | | | 3,523,039 | | |
| ATMI, Inc. (a) | | | 103,530 | | | | 3,122,465 | | |
| Hittite Microwave Corp. (a) | | | 19,300 | | | | 817,741 | | |
| KLA-Tencor Corp. | | | 46,970 | | | | 2,699,366 | | |
| Lam Research Corp. (a) | | | 77,300 | | | | 4,145,599 | | |
| Marvell Technology Group Ltd. (a) | | | 157,080 | | | | 2,602,816 | | |
| Maxim Integrated Products, Inc. | | | 44,080 | | | | 1,322,841 | | |
MEMC Electronic
Materials, Inc. (a) | | | 88,302 | | | | 5,423,509 | | |
| MIPS Technologies, Inc. (a) | | | 111,540 | | | | 872,243 | | |
| National Semiconductor Corp. | | | 55,040 | | | | 1,448,653 | | |
| Netlogic Microsystems, Inc. (a) | | | 27,070 | | | | 793,963 | | |
| NVIDIA Corp. (a) | | | 129,970 | | | | 6,649,265 | | |
| PLX Technology, Inc. (a) | | | 68,800 | | | | 744,416 | | |
Siliconware Precision
Industries Co., ADR | | | 250,690 | | | | 2,704,944 | | |
| Tessera Technologies, Inc. (a) | | | 72,160 | | | | 2,643,221 | | |
| Texas Instruments, Inc. | | | 113,510 | | | | 3,886,582 | | |
| Verigy Ltd. (a) | | | 143,130 | | | | 3,781,494 | | |
Semiconductors & Semiconductor
Equipment Total | | | 51,278,397 | | |
| Software – 17.6% | |
| Activision, Inc. (a) | | | 56,400 | | | | 1,099,236 | | |
| Adobe Systems, Inc. (a) | | | 71,290 | | | | 3,047,648 | | |
| Amdocs Ltd. (a) | | | 21,082 | | | | 744,195 | | |
| ANSYS, Inc. (a) | | | 44,940 | | | | 1,488,862 | | |
| Autodesk, Inc. (a) | | | 41,920 | | | | 1,941,734 | | |
| BEA Systems, Inc. (a) | | | 259,986 | | | | 3,171,829 | | |
| BMC Software, Inc. (a) | | | 35,830 | | | | 1,097,115 | | |
| Business Objects SA, ADR (a) | | | 61,000 | | | | 2,678,510 | | |
| Cadence Design Systems, Inc. (a) | | | 131,047 | | | | 2,846,341 | | |
| Citrix Systems, Inc. (a) | | | 68,287 | | | | 2,482,232 | | |
| Concur Technologies, Inc. (a) | | | 57,340 | | | | 1,535,565 | | |
| Electronic Arts, Inc. (a) | | | 23,480 | | | | 1,243,031 | | |
| Magma Design Automation, Inc. (a) | | | 109,720 | | | | 1,507,553 | | |
| McAfee, Inc. (a) | | | 111,780 | | | | 3,996,135 | | |
| Micros Systems, Inc. (a) | | | 12,206 | | | | 736,510 | | |
| NAVTEQ Corp. (a) | | | 9,524 | | | | 600,012 | | |
| Nintendo Co., Ltd. | | | 22,090 | | | | 10,244,693 | | |
| Nuance Communications, Inc. (a) | | | 45,164 | | | | 849,083 | | |
| Oracle Corp. (a) | | | 131,280 | | | | 2,662,358 | | |
| Perfect World Co., Ltd., ADR (a) | | | 19,093 | | | | 432,838 | | |
| Salesforce.com, Inc. (a) | | | 59,560 | | | | 2,408,011 | | |
| | | Shares | | Value ($) | |
| Taleo Corp., Class A (a) | | | 49,613 | | | | 1,143,580 | | |
| THQ, Inc. (a) | | | 48,358 | | | | 1,392,227 | | |
| VMware, Inc., Class A (a) | | | 32,036 | | | | 2,206,960 | | |
| Software Total | | | 51,556,258 | | |
| Information Technology Total | | | 224,152,057 | | |
| Telecommunication Services – 10.1% | |
| Diversified Telecommunication Services – 0.7% | |
Cogent Communications
Group, Inc. (a) | | | 82,530 | | | | 2,060,774 | | |
Diversified Telecommunication
Services Total | | | 2,060,774 | | |
| Wireless Telecommunication Services – 9.4% | |
America Movil SAB de CV,
ADR, Series L | | | 22,500 | | | | 1,360,350 | | |
| American Tower Corp., Class A (a) | | | 101,773 | | | | 4,032,246 | | |
| Centennial Communications Corp. (a) | | | 81,290 | | | | 764,126 | | |
| Crown Castle International Corp. (a) | | | 74,530 | | | | 2,739,723 | | |
| Leap Wireless International, Inc. (a) | | | 27,880 | | | | 2,021,300 | | |
| MetroPCS Communications, Inc. (a) | | | 104,460 | | | | 2,850,713 | | |
Millicom International
Cellular SA (a) | | | 42,200 | | | | 3,558,726 | | |
| NII Holdings, Inc. (a) | | | 55,200 | | | | 4,370,736 | | |
Rogers Communications,
Inc., Class B | | | 41,170 | | | | 1,864,178 | | |
SBA Communications Corp.,
Class A (a) | | | 125,720 | | | | 4,094,701 | | |
Wireless Telecommunication
Services Total | | | 27,656,799 | | |
| Telecommunication Services Total | | | 29,717,573 | | |
Total Common Stocks
(Cost of $236,273,872) | | | 284,079,949 | | |
See Accompanying Notes to Financial Statements.
64
Columbia Technology Fund
August 31, 2007
| Short-Term Obligation – 3.8% | |
| | | Par ($) | | Value ($) | |
Repurchase agreement with
Fixed Income Clearing Corp.,
dated 08/31/07, due on 09/04/07, at
5.030%, collateralized by a
U.S. Government Agency Obligation
maturing on 09/17/07, market value of
$11,322,310 (repurchase proceeds
$11,102,201) | | | 11,096,000 | | | | 11,096,000 | | |
Total Short-Term Obligation
(Cost of $11,096,000) | | | 11,096,000 | | |
Total Investments – 100.4%
(Cost of $247,369,872) (b) | | | 295,175,949 | | |
| Other Assets & Liabilities, Net – (0.4)% | | | (1,310,776 | ) | |
| Net Assets – 100.0% | | | 293,865,173 | | |
Notes to Investment Portfolio:
(a) Non-income producing security.
(b) Cost for federal income tax purposes is $248,309,450.
At August 31, 2007, the Fund held investments in the following sectors:
| Sector (Unaudited) | | % of
Net Assets | |
| Information Technology | | | 76.3 | | |
| Telecommunication Services | | | 10.1 | | |
| Consumer Discretionary | | | 6.3 | | |
| Industrials | | | 2.9 | | |
| Health Care | | | 1.0 | | |
| | | | 96.6 | | |
| Short-Term Obligation | | | 3.8 | | |
| Other Assets & Liabilities, Net | | | (0.4 | ) | |
| | | | 100.0 | | |
| Acronym | | Name | |
| ADR | | American Depositary Receipt | |
|
See Accompanying Notes to Financial Statements.
65
Investment Portfolio – Columbia Strategic Investor Fund
August 31, 2007
Common Stocks – 99.1%
| | | Shares | | Value ($) | |
| Consumer Discretionary – 9.6% | |
| Auto Components – 0.3% | |
| Nokian Renkaat Oyj | | | 114,700 | | | | 4,031,250 | | |
| Auto Components Total | | | 4,031,250 | | |
| Hotels, Restaurants & Leisure – 1.4% | |
| Carnival Corp. | | | 61,100 | | | | 2,785,549 | | |
| Las Vegas Sands Corp. (a) | | | 39,200 | | | | 3,908,240 | | |
| Marriott International, Inc., Class A | | | 71,200 | | | | 3,162,704 | | |
Starwood Hotels & Resorts
Worldwide, Inc. | | | 65,500 | | | | 4,003,360 | | |
| Yum! Brands, Inc. | | | 118,300 | | | | 3,870,776 | | |
| Hotels, Restaurants & Leisure Total | | | 17,730,629 | | |
| Household Durables – 0.7% | |
| Cyrela Brazil Realty SA | | | 310,700 | | | | 2,937,556 | | |
Desarrolladora Homex SA de CV,
ADR (a) | | | 39,800 | | | | 2,192,980 | | |
| Gafisa SA, ADR (a) | | | 132,700 | | | | 3,101,199 | | |
| Household Durables Total | | | 8,231,735 | | |
| Media – 3.3% | |
| Comcast Corp., Class A (a) | | | 502,900 | | | | 13,004,994 | | |
| Grupo Televisa SA, ADR | | | 124,800 | | | | 3,252,288 | | |
NET Servicos de Comunicacao SA,
ADR (a) | | | 533,400 | | | | 8,049,006 | | |
Time Warner Cable, Inc.,
Class A (a) | | | 135,600 | | | | 4,976,520 | | |
| Time Warner, Inc. | | | 561,088 | | | | 10,649,450 | | |
| Media Total | | | 39,932,258 | | |
| Multiline Retail – 1.7% | |
| J.C. Penney Co., Inc. | | | 55,600 | | | | 3,823,056 | | |
| Nordstrom, Inc. | | | 99,100 | | | | 4,766,710 | | |
| Stockmann Oyj Abp, Class B | | | 52,500 | | | | 2,329,344 | | |
| Target Corp. | | | 146,800 | | | | 9,678,524 | | |
| Multiline Retail Total | | | 20,597,634 | | |
| Specialty Retail – 0.8% | |
| GameStop Corp., Class A (a) | | | 184,700 | | | | 9,260,858 | | |
| Specialty Retail Total | | | 9,260,858 | | |
| Textiles, Apparel & Luxury Goods – 1.4% | |
| Hanesbrands, Inc. (a) | | | 41,300 | | | | 1,237,348 | | |
LVMH Moet Hennessy Louis
Vuitton SA | | | 38,200 | | | | 4,266,590 | | |
| NIKE, Inc., Class B | | | 197,300 | | | | 11,115,882 | | |
| Textiles, Apparel & Luxury Goods Total | | | 16,619,820 | | |
| Consumer Discretionary Total | | | 116,404,184 | | |
| | | Shares | | Value ($) | |
| Consumer Staples – 9.3% | |
| Beverages – 2.1% | |
| Coca-Cola Co. | | | 256,600 | | | | 13,799,948 | | |
| Diageo PLC, ADR | | | 59,000 | | | | 5,039,780 | | |
Fomento Economico Mexicano
SAB de CV, ADR | | | 174,600 | | | | 6,083,064 | | |
| Beverages Total | | | 24,922,792 | | |
| Food & Staples Retailing – 1.2% | |
| CVS Caremark Corp. | | | 111,300 | | | | 4,209,366 | | |
| Kroger Co. | | | 200,000 | | | | 5,316,000 | | |
| Wal-Mart Stores, Inc. | | | 107,700 | | | | 4,698,951 | | |
| Food & Staples Retailing Total | | | 14,224,317 | | |
| Food Products – 1.2% | |
| Archer-Daniels-Midland Co. | | | 109,400 | | | | 3,686,780 | | |
| Nestle SA, Registered Shares | | | 17,500 | | | | 7,607,122 | | |
| Unilever NV, N.Y. Registered Shares | | | 120,100 | | | | 3,669,055 | | |
| Food Products Total | | | 14,962,957 | | |
| Household Products – 3.2% | |
| Colgate-Palmolive Co. | | | 124,900 | | | | 8,283,368 | | |
| Kimberly-Clark Corp. | | | 122,700 | | | | 8,428,263 | | |
| Procter & Gamble Co. | | | 337,600 | | | | 22,048,656 | | |
| Household Products Total | | | 38,760,287 | | |
| Personal Products – 0.6% | |
| Avon Products, Inc. | | | 207,600 | | | | 7,131,060 | | |
| Personal Products Total | | | 7,131,060 | | |
| Tobacco – 1.0% | |
| Altria Group, Inc. | | | 96,800 | | | | 6,718,888 | | |
| UST, Inc. | | | 122,300 | | | | 6,026,944 | | |
| Tobacco Total | | | 12,745,832 | | |
| Consumer Staples Total | | | 112,747,245 | | |
| Energy – 12.2% | |
| Energy Equipment & Services – 4.6% | |
| Cameron International Corp. (a) | | | 104,600 | | | | 8,553,142 | | |
| Core Laboratories NV (a) | | | 47,600 | | | | 5,335,960 | | |
| GlobalSantaFe Corp. | | | 62,900 | | | | 4,440,111 | | |
| Hornbeck Offshore Services, Inc. (a) | | | 69,600 | | | | 2,655,240 | | |
| Noble Corp. | | | 90,600 | | | | 4,444,836 | | |
| Schlumberger Ltd. | | | 112,300 | | | | 10,836,950 | | |
| Tetra Technologies, Inc. (a) | | | 127,300 | | | | 2,544,727 | | |
| Transocean, Inc. (a) | | | 55,000 | | | | 5,779,950 | | |
| Weatherford International Ltd. (a) | | | 109,500 | | | | 6,392,610 | | |
| Wellstream Holdings PLC (a) | | | 441,500 | | | | 5,456,772 | | |
| Energy Equipment & Services Total | | | 56,440,298 | | |
See Accompanying Notes to Financial Statements.
66
Columbia Strategic Investor Fund
August 31, 2007
Common Stocks (continued)
| | | Shares | | Value ($) | |
| Oil, Gas & Consumable Fuels – 7.6% | |
| Chevron Corp. | | | 40,900 | | | | 3,589,384 | | |
| ConocoPhillips | | | 165,800 | | | | 13,577,362 | | |
| Continental Resources, Inc. (a) | | | 318,234 | | | | 4,725,775 | | |
| Devon Energy Corp. | | | 79,000 | | | | 5,949,490 | | |
| Exxon Mobil Corp. | | | 379,100 | | | | 32,500,243 | | |
| Frontier Oil Corp. | | | 80,200 | | | | 3,290,606 | | |
| Hess Corp. | | | 66,900 | | | | 4,105,653 | | |
| Occidental Petroleum Corp. | | | 65,200 | | | | 3,696,188 | | |
| Peabody Energy Corp. | | | 90,800 | | | | 3,859,908 | | |
| Petroleo Brasileiro SA, ADR | | | 40,300 | | | | 2,492,152 | | |
| Petroplus Holdings AG (a) | | | 25,301 | | | | 2,197,539 | | |
| Southwestern Energy Co. (a) | | | 159,300 | | | | 5,924,367 | | |
| Valero Energy Corp. | | | 50,000 | | | | 3,425,500 | | |
| XTO Energy, Inc. | | | 48,800 | | | | 2,652,768 | | |
| Oil, Gas & Consumable Fuels Total | | | 91,986,935 | | |
| Energy Total | | | 148,427,233 | | |
| Financials – 17.1% | |
| Capital Markets – 3.6% | |
| Aberdeen Asset Management PLC | | | 1,628,200 | | | | 5,843,491 | | |
| Goldman Sachs Group, Inc. | | | 68,200 | | | | 12,003,882 | | |
| Lazard Ltd., Class A | | | 163,100 | | | | 6,538,679 | | |
| Lehman Brothers Holdings, Inc. | | | 142,500 | | | | 7,813,275 | | |
| Northern Trust Corp. | | | 69,700 | | | | 4,283,762 | | |
| State Street Corp. | | | 124,600 | | | | 7,645,456 | | |
| Capital Markets Total | | | 44,128,545 | | |
| Commercial Banks – 1.7% | |
| Allied Irish Banks PLC, ADR | | | 52,100 | | | | 2,676,377 | | |
Raiffeisen International Bank
Holding AG | | | 25,500 | | | | 3,682,160 | | |
| Wachovia Corp. | | | 297,800 | | | | 14,586,244 | | |
| Commercial Banks Total | | | 20,944,781 | | |
| Diversified Financial Services – 4.4% | |
| Citigroup, Inc. | | | 556,600 | | | | 26,093,408 | | |
| CME Group, Inc. | | | 13,900 | | | | 7,711,720 | | |
| JPMorgan Chase & Co. | | | 435,600 | | | | 19,392,912 | | |
| Diversified Financial Services Total | | | 53,198,040 | | |
| Insurance – 4.7% | |
| ACE Ltd. | | | 150,700 | | | | 8,704,432 | | |
| Ambac Financial Group, Inc. | | | 93,900 | | | | 5,898,798 | | |
| American International Group, Inc. | | | 45,991 | | | | 3,035,406 | | |
| Aon Corp. | | | 167,400 | | | | 7,251,768 | | |
| Aspen Insurance Holdings Ltd. | | | 179,800 | | | | 4,511,182 | | |
| Castlepoint Holdings Ltd. | | | 255,891 | | | | 2,896,686 | | |
Hartford Financial Services
Group, Inc. | | | 41,100 | | | | 3,654,201 | | |
| | | Shares | | Value ($) | |
| National Financial Partners Corp. | | | 176,100 | | | | 8,609,529 | | |
| Prudential Financial, Inc. | | | 139,500 | | | | 12,524,310 | | |
| Insurance Total | | | 57,086,312 | | |
| Real Estate Investment Trusts (REITs) – 1.3% | |
Alexandria Real Estate
Equities, Inc. | | | 32,200 | | | | 3,005,226 | | |
| CapitalSource, Inc. | | | 201,900 | | | | 3,599,877 | | |
| Digital Realty Trust, Inc. | | | 222,300 | | | | 8,669,700 | | |
| Real Estate Investment Trusts (REITs) Total | | | 15,274,803 | | |
| Real Estate Management & Development – 0.0% | |
Cyrela Commercial Properties SA
Empreendimentos e
Participacoes (a) | | | 385,100 | | | | 471,070 | | |
| Real Estate Management & Development Total | | | 471,070 | | |
| Thrifts & Mortgage Finance – 1.4% | |
| Freddie Mac | | | 264,800 | | | | 16,314,328 | | |
| Thrifts & Mortgage Finance Total | | | 16,314,328 | | |
| Financials Total | | | 207,417,879 | | |
| Health Care – 12.7% | |
| Biotechnology – 2.1% | |
| Applera Corp. - Celera Group (a) | | | 151,400 | | | | 1,993,938 | | |
| BioMarin Pharmaceuticals, Inc. (a) | | | 66,700 | | | | 1,432,716 | | |
| Celgene Corp. (a) | | | 86,607 | | | | 5,561,036 | | |
| Genentech, Inc. (a) | | | 53,200 | | | | 3,979,892 | | |
| Gilead Sciences, Inc. (a) | | | 150,800 | | | | 5,484,596 | | |
| Grifols SA (a) | | | 111,200 | | | | 2,328,280 | | |
| Onyx Pharmaceuticals, Inc. (a) | | | 97,900 | | | | 3,878,798 | | |
| Biotechnology Total | | | 24,659,256 | | |
| Health Care Equipment & Supplies – 2.9% | |
| Align Technology, Inc. (a) | | | 109,300 | | | | 2,484,389 | | |
| Baxter International, Inc. | | | 149,700 | | | | 8,197,572 | | |
| BioLase Technology, Inc. (a) | | | 158,500 | | | | 1,096,820 | | |
| Hologic, Inc. (a) | | | 45,600 | | | | 2,423,640 | | |
| Immucor, Inc. (a) | | | 59,400 | | | | 1,980,990 | | |
| Masimo Corp. (a) | | | 189,030 | | | | 3,969,630 | | |
Mindray Medical International
Ltd., ADR | | | 143,615 | | | | 5,096,896 | | |
| Northstar Neuroscience, Inc. (a) | | | 65,168 | | | | 740,309 | | |
| Sirona Dental Systems, Inc. (a) | | | 103,300 | | | | 3,011,195 | | |
| Zimmer Holdings, Inc. (a) | | | 83,000 | | | | 6,501,390 | | |
| Health Care Equipment & Supplies Total | | | 35,502,831 | | |
| Health Care Providers & Services – 2.1% | |
| Express Scripts, Inc. (a) | | | 106,700 | | | | 5,841,825 | | |
| McKesson Corp. | | | 72,100 | | | | 4,124,841 | | |
| Medco Health Solutions, Inc. (a) | | | 105,500 | | | | 9,014,975 | | |
See Accompanying Notes to Financial Statements.
67
Columbia Strategic Investor Fund
August 31, 2007
Common Stocks (continued)
| | | Shares | | Value ($) | |
| PSS World Medical, Inc. (a) | | | 129,995 | | | | 2,480,304 | | |
| VCA Antech, Inc. (a) | | | 95,800 | | | | 3,917,262 | | |
| Health Care Providers & Services Total | | | 25,379,207 | | |
| Life Sciences Tools & Services – 1.8% | |
| Covance, Inc. (a) | | | 58,600 | | | | 4,296,552 | | |
| Illumina, Inc. (a) | | | 79,000 | | | | 3,814,910 | | |
Pharmaceutical Product
Development, Inc. | | | 73,600 | | | | 2,578,208 | | |
| Thermo Fisher Scientific, Inc. (a) | | | 116,400 | | | | 6,312,372 | | |
| Waters Corp. (a) | | | 84,600 | | | | 5,208,822 | | |
| Life Sciences Tools & Services Total | | | 22,210,864 | | |
| Pharmaceuticals – 3.8% | |
| Abbott Laboratories | | | 177,900 | | | | 9,234,789 | | |
| Johnson & Johnson | | | 109,970 | | | | 6,795,046 | | |
Medicis Pharmaceutical Corp.,
Class A | | | 118,600 | | | | 3,622,044 | | |
| Merck & Co., Inc. | | | 251,400 | | | | 12,612,738 | | |
| Schering-Plough Corp. | | | 157,900 | | | | 4,740,158 | | |
| Shire PLC, ADR | | | 62,600 | | | | 4,929,124 | | |
| Wyeth | | | 87,200 | | | | 4,037,360 | | |
| Pharmaceuticals Total | | | 45,971,259 | | |
| Health Care Total | | | 153,723,417 | | |
| Industrials – 10.7% | |
| Aerospace & Defense – 2.3% | |
| Boeing Co. | | | 48,900 | | | | 4,728,630 | | |
| Goodrich Corp. | | | 121,900 | | | | 7,699,204 | | |
| Rockwell Collins, Inc. | | | 52,200 | | | | 3,595,014 | | |
Spirit Aerosystems Holdings, Inc.,
Class A (a) | | | 109,300 | | | | 3,907,475 | | |
| United Technologies Corp. | | | 105,300 | | | | 7,858,539 | | |
| Aerospace & Defense Total | | | 27,788,862 | | |
| Air Freight & Logistics – 1.0% | |
| FedEx Corp. | | | 33,400 | | | | 3,663,312 | | |
| United Parcel Service, Inc., Class B | | | 73,600 | | | | 5,583,296 | | |
| UTI Worldwide, Inc. | | | 140,700 | | | | 3,130,575 | | |
| Air Freight & Logistics Total | | | 12,377,183 | | |
| Commercial Services & Supplies – 2.1% | |
| Dun & Bradstreet Corp. | | | 37,600 | | | | 3,667,880 | | |
| Equifax, Inc. | | | 175,100 | | | | 6,744,852 | | |
| Republic Services, Inc. | | | 149,700 | | | | 4,654,173 | | |
| Waste Management, Inc. | | | 285,300 | | | | 10,747,251 | | |
| Commercial Services & Supplies Total | | | 25,814,156 | | |
| Electrical Equipment – 0.3% | |
Suntech Power Holdings Co.,
Ltd., ADR (a) | | | 98,200 | | | | 3,510,650 | | |
| Electrical Equipment Total | | | 3,510,650 | | |
| | | Shares | | Value ($) | |
| Industrial Conglomerates – 3.1% | |
| 3M Co. | | | 123,400 | | | | 11,228,166 | | |
| General Electric Co. | | | 456,000 | | | | 17,724,720 | | |
| McDermott International, Inc. (a) | | | 96,700 | | | | 9,282,233 | | |
| Industrial Conglomerates Total | | | 38,235,119 | | |
| Machinery – 1.7% | |
| Dover Corp. | | | 34,800 | | | | 1,719,120 | | |
| Illinois Tool Works, Inc. | | | 87,400 | | | | 5,084,058 | | |
| Joy Global, Inc. | | | 174,500 | | | | 7,571,555 | | |
| Paccar, Inc. | | | 67,700 | | | | 5,791,735 | | |
| Machinery Total | | | 20,166,468 | | |
| Marine – 0.2% | |
| Ultrapetrol (Bahamas) Ltd. (a) | | | 129,800 | | | | 2,338,996 | | |
| Marine Total | | | 2,338,996 | | |
| Industrials Total | | | 130,231,434 | | |
| Information Technology – 16.0% | |
| Communications Equipment – 3.4% | |
| Cisco Systems, Inc. (a) | | | 668,900 | | | | 21,351,288 | | |
| Corning, Inc. | | | 273,800 | | | | 6,398,706 | | |
| Nokia Oyj, ADR | | | 341,200 | | | | 11,218,656 | | |
| QUALCOMM, Inc. | | | 57,700 | | | | 2,301,653 | | |
| Communications Equipment Total | | | 41,270,303 | | |
| Computers & Peripherals – 4.2% | |
| Apple, Inc. (a) | | | 72,100 | | | | 9,984,408 | | |
Brocade Communications
Systems, Inc. (a) | | | 255,900 | | | | 1,791,300 | | |
| EMC Corp. (a) | | | 187,700 | | | | 3,690,182 | | |
| Hewlett-Packard Co. | | | 393,600 | | | | 19,424,160 | | |
International Business
Machines Corp. | | | 132,262 | | | | 15,433,653 | | |
| Computers & Peripherals Total | | | 50,323,703 | | |
| Electronic Equipment & Instruments – 0.1% | |
| Novatel, Inc. (a) | | | 49,100 | | | | 1,770,055 | | |
| Electronic Equipment & Instruments Total | | | 1,770,055 | | |
| Internet Software & Services – 2.2% | |
| eBay, Inc. (a) | | | 157,500 | | | | 5,370,750 | | |
| Google, Inc., Class A (a) | | | 41,000 | | | | 21,125,250 | | |
| Internet Software & Services Total | | | 26,496,000 | | |
| IT Services – 0.8% | |
Cognizant Technology Solutions
Corp., Class A (a) | | | 38,600 | | | | 2,837,486 | | |
| Global Payments, Inc. | | | 64,500 | | | | 2,546,460 | | |
| Redecard SA (a) | | | 287,600 | | | | 4,397,554 | | |
| IT Services Total | | | 9,781,500 | | |
See Accompanying Notes to Financial Statements.
68
Columbia Strategic Investor Fund
August 31, 2007
Common Stocks (continued)
| | | Shares | | Value ($) | |
| Semiconductors & Semiconductor Equipment – 2.5% | |
ASML Holding N.V., N.Y.
Registered Shares (a) | | | 69,100 | | | | 2,050,197 | | |
| Intel Corp. | | | 146,200 | | | | 3,764,650 | | |
| Intersil Corp., Class A | | | 75,400 | | | | 2,512,328 | | |
| Marvell Technology Group Ltd. (a) | | | 118,500 | | | | 1,963,545 | | |
| MEMC Electronic Materials, Inc. (a) | | | 59,729 | | | | 3,668,555 | | |
| NVIDIA Corp. (a) | | | 101,400 | | | | 5,187,624 | | |
| Texas Instruments, Inc. | | | 241,100 | | | | 8,255,264 | | |
| Verigy Ltd. (a) | | | 111,700 | | | | 2,951,114 | | |
Semiconductors & Semiconductor
Equipment Total | | | 30,353,277 | | |
| Software – 2.8% | |
| ANSYS, Inc. (a) | | | 88,400 | | | | 2,928,692 | | |
| Electronic Arts, Inc. (a) | | | 47,400 | | | | 2,509,356 | | |
| Microsoft Corp. | | | 477,600 | | | | 13,721,448 | | |
| Nintendo Co., Ltd. | | | 7,800 | | | | 3,617,411 | | |
| Oracle Corp. (a) | | | 325,800 | | | | 6,607,224 | | |
| UBISOFT Entertainment (a) | | | 55,700 | | | | 3,457,728 | | |
| VMware, Inc. (a) | | | 17,950 | | | | 1,236,575 | | |
| Software Total | | | 34,078,434 | | |
| Information Technology Total | | | 194,073,272 | | |
| Materials – 3.4% | |
| Chemicals – 1.3% | |
| Celanese Corp., Series A | | | 70,600 | | | | 2,535,952 | | |
| E.I. Du Pont de Nemours & Co. | | | 60,600 | | | | 2,954,250 | | |
| Monsanto Co. | | | 146,500 | | | | 10,216,910 | | |
| Chemicals Total | | | 15,707,112 | | |
| Metals & Mining – 1.7% | |
| Alcoa, Inc. | | | 136,100 | | | | 4,971,733 | | |
| Arcelor Mittal, Class A | | | 104,800 | | | | 6,937,760 | | |
| Companhia Vale do Rio Doce, ADR | | | 69,700 | | | | 3,438,301 | | |
Freeport-McMoRan Copper &
Gold, Inc., Class B | | | 56,700 | | | | 4,956,714 | | |
| Metals & Mining Total | | | 20,304,508 | | |
| Paper & Forest Products – 0.4% | |
| Weyerhaeuser Co. | | | 81,200 | | | | 5,535,404 | | |
| Paper & Forest Products Total | | | 5,535,404 | | |
| Materials Total | | | 41,547,024 | | |
| Telecommunication Services – 3.6% | |
| Diversified Telecommunication Services – 2.3% | |
| AT&T, Inc. | | | 465,118 | | | | 18,544,255 | | |
| Tele2 AB, Class B | | | 134,900 | | | | 2,464,123 | | |
| Telekomunikasi Indonesia, ADR | | | 135,900 | | | | 6,409,044 | | |
Diversified Telecommunication
Services Total | | | 27,417,422 | | |
| | | Shares | | Value ($) | |
| Wireless Telecommunication Services – 1.3% | |
| American Tower Corp., Class A (a) | | | 68,500 | | | | 2,713,970 | | |
| China Mobile Ltd., ADR | | | 26,700 | | | | 1,809,993 | | |
Millicom International
Cellular SA (a) | | | 37,100 | | | | 3,128,643 | | |
| NII Holdings, Inc. (a) | | | 64,400 | | | | 5,099,192 | | |
Philippine Long Distance
Telephone Co., ADR | | | 54,400 | | | | 3,194,912 | | |
| Wireless Telecommunication Services Total | | | 15,946,710 | | |
| Telecommunication Services Total | | | 43,364,132 | | |
| Utilities – 4.5% | |
| Electric Utilities – 3.0% | |
| Entergy Corp. | | | 92,700 | | | | 9,605,574 | | |
| Exelon Corp. | | | 127,200 | | | | 8,989,224 | | |
| FPL Group, Inc. | | | 151,400 | | | | 8,908,376 | | |
| PPL Corp. | | | 194,700 | | | | 9,396,222 | | |
| Electric Utilities Total | | | 36,899,396 | | |
| Independent Power Producers & Energy Traders – 0.7% | |
| Mirant Corp. (a) | | | 227,300 | | | | 8,857,881 | | |
Independent Power Producers &
Energy Traders Total | | | 8,857,881 | | |
| Multi-Utilities – 0.8% | |
Public Service Enterprise
Group, Inc. | | | 113,000 | | | | 9,603,870 | | |
| Multi-Utilities Total | | | 9,603,870 | | |
| Utilities Total | | | 55,361,147 | | |
Total Common Stocks
(Cost of $1,006,784,487) | | | 1,203,296,967 | | |
| Short-Term Obligation – 0.8% | |
| | | Par ($) | | | |
Repurchase agreement with
Fixed Income Clearing Corp.,
dated 08/31/07, due on 09/04/07,
at 5.030%, collateralized by
U.S. Government Obligations with
various maturities to 11/15/15,
market value of $9,782,313
(repurchase proceeds $9,593,359) | | | 9,588,000 | | | | 9,588,000 | | |
Total Short-Term Obligation
(Cost of $9,588,000) | | | 9,588,000 | | |
Total Investments – 99.9%
(Cost of $1,016,372,487) (b) | | | 1,212,884,967 | | |
| Other Assets & Liabilities, Net – 0.1% | | | 647,889 | | |
| Net Assets – 100.0% | | | 1,213,532,856 | | |
See Accompanying Notes to Financial Statements.
69
Columbia Strategic Investor Fund
August 31, 2007
Notes to Investment Portfolio:
(a) Non-income producing security.
(b) Cost for federal income tax purposes is $1,017,038,766.
At August 31, 2007 the Fund held investments in the following sectors:
| Sector (Unaudited) | | % of
Net Assets | |
| Financials | | | 17.1 | | |
| Information Technology | | | 16.0 | | |
| Health Care | | | 12.7 | | |
| Energy | | | 12.2 | | |
| Industrials | | | 10.7 | | |
| Consumer Discretionary | | | 9.6 | | |
| Consumer Staples | | | 9.3 | | |
| Utilities | | | 4.5 | | |
| Telecommunication Services | | | 3.6 | | |
| Materials | | | 3.4 | | |
| | | | 99.1 | | |
| Short-Term Obligation | | | 0.8 | | |
| Other Assets & Liabilities, Net | | | 0.1 | | |
| | | | 100.0 | | |
The Fund was invested in the following countries at
August 31, 2007:
Summary of Securities
by Country (Unaudited) | | Value ($) | | % of Total
Investments | |
| United States* | | | 1,059,000,423 | | | | 87.3 | | |
| Brazil | | | 24,886,838 | | | | 2.1 | | |
| United Kingdom | | | 21,269,166 | | | | 1.8 | | |
| Netherlands | | | 17,992,972 | | | | 1.5 | | |
| Finland | | | 17,579,250 | | | | 1.4 | | |
| Mexico | | | 11,528,332 | | | | 1.0 | | |
| Netherlands Antilles | | | 10,836,950 | | | | 0.9 | | |
| Switzerland | | | 9,804,661 | | | | 0.8 | | |
| France | | | 7,724,318 | | | | 0.6 | | |
| Indonesia | | | 6,409,044 | | | | 0.5 | | |
| Austria | | | 3,682,160 | | | | 0.3 | | |
| Japan | | | 3,617,411 | | | | 0.3 | | |
| Philippines | | | 3,194,912 | | | | 0.3 | | |
| Luxembourg | | | 3,128,643 | | | | 0.3 | | |
| Singapore | | | 2,951,114 | | | | 0.2 | | |
| Ireland | | | 2,676,377 | | | | 0.2 | | |
| Sweden | | | 2,464,123 | | | | 0.2 | | |
| Spain | | | 2,328,280 | | | | 0.2 | | |
| Hong Kong | | | 1,809,993 | | | | 0.1 | | |
| | | | 1,212,884,967 | | | | 100.0 | | |
* Includes short-term obligation.
Certain securities are listed by country of underlying exposure but may trade predominately on other exchanges.
| Acronym | | Name | |
| ADR | | American Depositary Receipt | |
|
See Accompanying Notes to Financial Statements.
70
Investment Portfolio – Columbia Balanced Fund
August 31, 2007
Common Stocks – 61.7%
| | | Shares | | Value ($) | |
| Consumer Discretionary – 6.2% | |
| Media – 2.4% | |
| News Corp., Class A | | | 88,600 | | | | 1,792,378 | | |
| Omnicom Group, Inc. | | | 40,000 | | | | 2,037,200 | | |
| Time Warner, Inc. | | | 70,200 | | | | 1,332,396 | | |
| Media Total | | | 5,161,974 | | |
| Multiline Retail – 1.2% | |
| Target Corp. | | | 37,800 | | | | 2,492,154 | | |
| Multiline Retail Total | | | 2,492,154 | | |
| Specialty Retail – 1.0% | |
| American Eagle Outfitters, Inc. | | | 34,000 | | | | 878,220 | | |
| Urban Outfitters, Inc. (a) | | | 53,500 | | | | 1,225,150 | | |
| Specialty Retail Total | | | 2,103,370 | | |
| Textiles, Apparel & Luxury Goods – 1.6% | |
| Coach, Inc. (a) | | | 27,700 | | | | 1,233,481 | | |
| NIKE, Inc., Class B | | | 39,000 | | | | 2,197,260 | | |
| Textiles, Apparel & Luxury Goods Total | | | 3,430,741 | | |
| Consumer Discretionary Total | | | 13,188,239 | | |
| Consumer Staples – 4.8% | |
| Beverages – 1.7% | |
| Coca-Cola Co. | | | 68,640 | | | | 3,691,459 | | |
| Beverages Total | | | 3,691,459 | | |
| Household Products – 1.1% | |
| Colgate-Palmolive Co. | | | 33,830 | | | | 2,243,606 | | |
| Household Products Total | | | 2,243,606 | | |
| Personal Products – 1.2% | |
| Avon Products, Inc. | | | 29,100 | | | | 999,585 | | |
| Herbalife Ltd. | | | 38,100 | | | | 1,617,345 | | |
| Personal Products Total | | | 2,616,930 | | |
| Tobacco – 0.8% | |
| Altria Group, Inc. | | | 23,700 | | | | 1,645,017 | | |
| Tobacco Total | | | 1,645,017 | | |
| Consumer Staples Total | | | 10,197,012 | | |
| Energy – 6.8% | |
| Energy Equipment & Services – 2.3% | |
| Halliburton Co. | | | 57,600 | | | | 1,992,384 | | |
| Transocean, Inc. (a) | | | 17,610 | | | | 1,850,635 | | |
| Weatherford International Ltd. (a) | | | 19,300 | | | | 1,126,734 | | |
| Energy Equipment & Services Total | | | 4,969,753 | | |
| | | Shares | | Value ($) | |
| Oil, Gas & Consumable Fuels – 4.5% | |
| Anadarko Petroleum Corp. | | | 35,600 | | | | 1,743,688 | | |
| Apache Corp. | | | 24,500 | | | | 1,895,810 | | |
| ConocoPhillips | | | 46,900 | | | | 3,840,641 | | |
| Devon Energy Corp. | | | 26,670 | | | | 2,008,518 | | |
| Oil, Gas & Consumable Fuels Total | | | 9,488,657 | | |
| Energy Total | | | 14,458,410 | | |
| Financials – 11.7% | |
| Capital Markets – 2.7% | |
| Charles Schwab Corp. | | | 101,947 | | | | 2,018,550 | | |
| Goldman Sachs Group, Inc. | | | 7,100 | | | | 1,249,671 | | |
| MF Global Ltd. (a) | | | 27,200 | | | | 732,768 | | |
| State Street Corp. | | | 11,400 | | | | 699,504 | | |
| TD Ameritrade Holding Corp. (a) | | | 53,200 | | | | 965,580 | | |
| Capital Markets Total | | | 5,666,073 | | |
| Commercial Banks – 0.8% | |
| Wachovia Corp. | | | 33,300 | | | | 1,631,034 | | |
| Commercial Banks Total | | | 1,631,034 | | |
| Consumer Finance – 1.1% | |
| American Express Co. | | | 38,905 | | | | 2,280,611 | | |
| Consumer Finance Total | | | 2,280,611 | | |
| Diversified Financial Services – 2.9% | |
| Citigroup, Inc. | | | 64,033 | | | | 3,001,867 | | |
| JPMorgan Chase & Co. | | | 70,980 | | | | 3,160,030 | | |
| Diversified Financial Services Total | | | 6,161,897 | | |
| Insurance – 3.5% | |
| American International Group, Inc. | | | 16,350 | | | | 1,079,100 | | |
Berkshire Hathaway, Inc.,
Class B (a) | | | 876 | | | | 3,407,640 | | |
| Principal Financial Group, Inc. | | | 28,600 | | | | 1,587,014 | | |
| Unum Group | | | 57,400 | | | | 1,404,578 | | |
| Insurance Total | | | 7,478,332 | | |
| Thrifts & Mortgage Finance – 0.7% | |
| Fannie Mae | | | 17,700 | | | | 1,161,297 | | |
| Washington Mutual, Inc. | | | 9,100 | | | | 334,152 | | |
| Thrifts & Mortgage Finance Total | | | 1,495,449 | | |
| Financials Total | | | 24,713,396 | | |
| Health Care – 8.6% | |
| Health Care Equipment & Supplies – 3.1% | |
| Baxter International, Inc. | | | 29,500 | | | | 1,615,420 | | |
| Covidien Ltd. (a) | | | 46,225 | | | | 1,841,142 | | |
See Accompanying Notes to Financial Statements.
71
Columbia Balanced Fund
August 31, 2007
Common Stocks (continued)
| | | Shares | | Value ($) | |
| Hologic, Inc. (a) | | | 17,200 | | | | 914,180 | | |
| Medtronic, Inc. | | | 39,700 | | | | 2,097,748 | | |
| Health Care Equipment & Supplies Total | | | 6,468,490 | | |
| Health Care Providers & Services – 1.3% | |
| McKesson Corp. | | | 29,730 | | | | 1,700,853 | | |
| Patterson Companies, Inc. (a) | | | 29,600 | | | | 1,088,688 | | |
| Health Care Providers & Services Total | | | 2,789,541 | | |
| Life Sciences Tools & Services – 1.0% | |
| Thermo Fisher Scientific, Inc. (a) | | | 38,630 | | | | 2,094,905 | | |
| Life Sciences Tools & Services Total | | | 2,094,905 | | |
| Pharmaceuticals – 3.2% | |
| Abbott Laboratories | | | 61,599 | | | | 3,197,604 | | |
| Johnson & Johnson | | | 29,000 | | | | 1,791,910 | | |
| Wyeth | | | 40,900 | | | | 1,893,670 | | |
| Pharmaceuticals Total | | | 6,883,184 | | |
| Health Care Total | | | 18,236,120 | | |
| Industrials – 6.7% | |
| Aerospace & Defense – 1.3% | |
| Honeywell International, Inc. | | | 49,690 | | | | 2,790,094 | | |
| Aerospace & Defense Total | | | 2,790,094 | | |
| Airlines – 0.3% | |
Continental Airlines, Inc.,
Class B (a) | | | 21,000 | | | | 698,460 | | |
| Airlines Total | | | 698,460 | | |
| Commercial Services & Supplies – 0.9% | |
| Waste Management, Inc. | | | 49,900 | | | | 1,879,733 | | |
| Commercial Services & Supplies Total | | | 1,879,733 | | |
| Industrial Conglomerates – 3.2% | |
| General Electric Co. | | | 129,400 | | | | 5,029,778 | | |
| Tyco International Ltd. | | | 39,025 | | | | 1,723,344 | | |
| Industrial Conglomerates Total | | | 6,753,122 | | |
| Road & Rail – 1.0% | |
| Union Pacific Corp. | | | 18,460 | | | | 2,059,582 | | |
| Road & Rail Total | | | 2,059,582 | | |
| Industrials Total | | | 14,180,991 | | |
| Information Technology – 14.4% | |
| Communications Equipment – 3.1% | |
| Cisco Systems, Inc. (a) | | | 123,950 | | | | 3,956,484 | | |
| Nokia Oyj, ADR | | | 80,700 | | | | 2,653,416 | | |
| Communications Equipment Total | | | 6,609,900 | | |
| Computers & Peripherals – 1.2% | |
| Hewlett-Packard Co. | | | 52,500 | | | | 2,590,875 | | |
| Computers & Peripherals Total | | | 2,590,875 | | |
| | | Shares | | Value ($) | |
| Electronic Equipment & Instruments – 0.8% | |
| Tyco Electronics Ltd. (a) | | | 49,625 | | | | 1,730,424 | | |
| Electronic Equipment & Instruments Total | | | 1,730,424 | | |
| Internet Software & Services – 4.6% | |
| Akamai Technologies, Inc. (a) | | | 8,900 | | | | 286,758 | | |
| Digital River, Inc. (a) | | | 14,800 | | | | 686,128 | | |
| eBay, Inc. (a) | | | 87,700 | | | | 2,990,570 | | |
| Google, Inc., Class A (a) | | | 6,100 | | | | 3,143,025 | | |
| VeriSign, Inc. (a) | | | 83,400 | | | | 2,685,480 | | |
| Internet Software & Services Total | | | 9,791,961 | | |
| Semiconductors & Semiconductor Equipment – 0.9% | |
| Texas Instruments, Inc. | | | 52,000 | | | | 1,780,480 | | |
Semiconductors & Semiconductor
Equipment Total | | | 1,780,480 | | |
| Software – 3.8% | |
| Microsoft Corp. | | | 170,490 | | | | 4,898,177 | | |
| Oracle Corp. (a) | | | 113,075 | | | | 2,293,161 | | |
| THQ, Inc. (a) | | | 32,700 | | | | 941,433 | | |
| Software Total | | | 8,132,771 | | |
| Information Technology Total | | | 30,636,411 | | |
| Materials – 0.9% | |
| Metals & Mining – 0.9% | |
| Alcoa, Inc. | | | 49,300 | | | | 1,800,929 | | |
| Metals & Mining Total | | | 1,800,929 | | |
| Materials Total | | | 1,800,929 | | |
| Telecommunication Services – 0.9% | |
| Diversified Telecommunication Services – 0.9% | |
| Verizon Communications, Inc. | | | 44,600 | | | | 1,867,848 | | |
| Diversified Telecommunication Services Total | | | 1,867,848 | | |
| Telecommunication Services Total | | | 1,867,848 | | |
| Utilities – 0.7% | |
| Electric Utilities – 0.7% | |
| Duke Energy Corp. | | | 78,000 | | | | 1,430,520 | | |
| Electric Utilities Total | | | 1,430,520 | | |
| Utilities Total | | | 1,430,520 | | |
Total Common Stocks
(Cost of $110,432,198) | | | 130,709,876 | | |
See Accompanying Notes to Financial Statements.
72
Columbia Balanced Fund
August 31, 2007
| Mortgage-Backed Securities – 11.4% | |
| | | Par ($) | | Value ($) | |
| Federal Home Loan Mortgage Corp. | |
| 5.500% 12/01/18 | | | 1,098,648 | | | | 1,094,659 | | |
| 5.500% 07/01/19 | | | 287,835 | | | | 286,518 | | |
| 5.500% 07/01/21 | | | 418,618 | | | | 416,185 | | |
| 5.500% 08/01/21 | | | 74,585 | | | | 74,151 | | |
| 5.500% 08/01/35 | | | 1,451,865 | | | | 1,419,270 | | |
| 6.000% 03/01/17 | | | 83,951 | | | | 84,950 | | |
| 6.000% 04/01/17 | | | 521,115 | | | | 527,320 | | |
| 6.000% 05/01/17 | | | 277,824 | | | | 281,133 | | |
| 6.000% 08/01/17 | | | 165,017 | | | | 166,982 | | |
| 6.500% 08/01/32 | | | 162,463 | | | | 165,960 | | |
| TBA, | |
| 6.500% 09/01/37 (b) | | | 295,000 | | | | 299,425 | | |
| Federal National Mortgage Association | |
| 5.000% 05/01/37 | | | 934,273 | | | | 888,042 | | |
| 5.000% 06/01/37 | | | 2,948,747 | | | | 2,802,538 | | |
| 5.000% 07/01/37 | | | 1,376,441 | | | | 1,308,193 | | |
| 5.500% 04/01/36 | | | 2,200,899 | | | | 2,150,240 | | |
| 5.500% 05/01/36 | | | 82,050 | | | | 80,162 | | |
| 5.500% 11/01/36 | | | 2,918,784 | | | | 2,851,600 | | |
| 5.741% 07/01/32 (c) | | | 458,043 | | | | 458,150 | | |
| 6.000% 09/01/36 | | | 688,516 | | | | 687,931 | | |
| 6.000% 10/01/36 | | | 3,042,603 | | | | 3,040,020 | | |
| 6.000% 07/01/37 | | | 207,086 | | | | 206,870 | | |
| 6.000% 08/01/37 | | | 758,313 | | | | 757,523 | | |
| 6.000% 09/01/37 | | | 751,000 | | | | 750,218 | | |
| 6.500% 03/01/37 | | | 464,140 | | | | 471,150 | | |
| 6.500% 05/01/37 | | | 833,778 | | | | 846,371 | | |
| 6.500% 06/01/37 | | | 1,275,954 | | | | 1,295,226 | | |
| 6.500% 08/01/37 | | | 603,175 | | | | 612,285 | | |
| Government National Mortgage Association | |
| 7.000% 10/15/31 | | | 69,337 | | | | 72,281 | | |
| 7.000% 04/15/32 | | | 61,826 | | | | 64,458 | | |
| 7.000% 05/15/32 | | | 74,434 | | | | 77,604 | | |
Total Mortgage-Backed Securities
(Cost of $24,308,162) | | | 24,237,415 | | |
| Corporate Fixed-Income Bonds & Notes – 9.2% | |
| Basic Materials – 0.3% | |
| Chemicals – 0.1% | |
| Lyondell Chemical Co. | |
| 8.000% 09/15/14 | | | 15,000 | | | | 16,313 | | |
| 8.250% 09/15/16 | | | 85,000 | | | | 95,200 | | |
| Chemicals Total | | | 111,513 | | |
| Forest Products & Paper – 0.1% | |
| Georgia-Pacific Corp. | |
| 8.000% 01/15/24 | | | 100,000 | | | | 94,000 | | |
| Weyerhaeuser Co. | |
| 7.375% 03/15/32 | | | 225,000 | | | | 225,236 | | |
| Forest Products & Paper Total | | | 319,236 | | |
| | | Par ($) | | Value ($) | |
| Metals & Mining – 0.1% | |
| Vale Overseas Ltd. | |
| 6.875% 11/21/36 | | | 200,000 | | | | 203,020 | | |
| Metals & Mining Total | | | 203,020 | | |
| Basic Materials Total | | | 633,769 | | |
| Communications – 1.4% | |
| Media – 0.6% | |
Charter Communications
Holdings II LLC/ Charter
Communications Holdings II/
Capital Corp. | |
| 10.250% 09/15/10 | | | 100,000 | | | | 101,000 | | |
| Comcast Corp. | |
| 7.050% 03/15/33 | | | 375,000 | | | | 389,108 | | |
| Lamar Media Corp. | |
| 7.250% 01/01/13 | | | 95,000 | | | | 94,525 | | |
| News America, Inc. | |
| 6.550% 03/15/33 | | | 275,000 | | | | 270,819 | | |
| Quebecor Media, Inc. | |
| 7.750% 03/15/16 | | | 100,000 | | | | 95,125 | | |
| Time Warner Cable, Inc. | |
| 6.550% 05/01/37 (d) | | | 250,000 | | | | 243,007 | | |
| Media Total | | | 1,193,584 | | |
| Telecommunication Services – 0.8% | |
| AT&T, Inc. | |
| 5.100% 09/15/14 | | | 225,000 | | | | 216,729 | | |
| Citizens Communications Co. | |
| 7.875% 01/15/27 | | | 120,000 | | | | 112,500 | | |
| Intelsat Bermuda Ltd. | |
| 9.250% 06/15/16 | | | 100,000 | | | | 103,000 | | |
| New Cingular Wireless Services, Inc. | |
| 8.750% 03/01/31 | | | 200,000 | | | | 249,314 | | |
| Sprint Capital Corp. | |
| 6.875% 11/15/28 | | | 200,000 | | | | 194,673 | | |
| Telecom Italia Capital SA | |
| 7.200% 07/18/36 | | | 200,000 | | | | 207,985 | | |
| Telefonica Emisones SAU | |
| 5.984% 06/20/11 | | | 300,000 | | | | 303,966 | | |
| Vodafone Group PLC | |
| 5.000% 12/16/13 | | | 300,000 | | | | 288,058 | | |
| Windstream Corp. | |
| 8.625% 08/01/16 | | | 100,000 | | | | 104,500 | | |
| Telecommunication Services Total | | | 1,780,725 | | |
| Communications Total | | | 2,974,309 | | |
See Accompanying Notes to Financial Statements.
73
Columbia Balanced Fund
August 31, 2007
| Corporate Fixed-Income Bonds & Notes (continued) | |
| | | Par ($) | | Value ($) | |
| Consumer Cyclical – 0.7% | |
| Apparel – 0.0% | |
| Levi Strauss & Co. | |
| 9.750% 01/15/15 | | | 90,000 | | | | 93,150 | | |
| Apparel Total | | | 93,150 | | |
| Home Builders – 0.2% | |
| D.R. Horton, Inc. | |
| 5.625% 09/15/14 | | | 275,000 | | | | 235,414 | | |
| K. Hovnanian Enterprises, Inc. | |
| 6.000% 01/15/10 | | | 25,000 | | | | 21,375 | | |
| 6.375% 12/15/14 | | | 25,000 | | | | 19,188 | | |
| KB Home | |
| 5.875% 01/15/15 | | | 60,000 | | | | 50,700 | | |
| Home Builders Total | | | 326,677 | | |
| Lodging – 0.2% | |
| Harrah's Operating Co., Inc. | |
| 5.625% 06/01/15 | | | 225,000 | | | | 172,688 | | |
| MGM Mirage | |
| 7.500% 06/01/16 | | | 100,000 | | | | 98,750 | | |
| Station Casinos, Inc. | |
| 6.875% 03/01/16 | | | 110,000 | | | | 92,125 | | |
| Lodging Total | | | 363,563 | | |
| Retail – 0.3% | |
| Home Depot, Inc. | |
| 5.875% 12/16/36 | | | 175,000 | | | | 150,797 | | |
| Macy's Retail Holdings, Inc. | |
| 5.900% 12/01/16 | | | 230,000 | | | | 221,582 | | |
| Wal-Mart Stores, Inc. | |
| 4.125% 07/01/10 | | | 300,000 | | | | 292,723 | | |
| Retail Total | | | 665,102 | | |
| Consumer Cyclical Total | | | 1,448,492 | | |
| Consumer Non-Cyclical – 0.6% | |
| Beverages – 0.0% | |
| Cott Beverages, Inc. | |
| 8.000% 12/15/11 | | | 95,000 | | | | 94,050 | | |
| Beverages Total | | | 94,050 | | |
| Commercial Services – 0.0% | |
| Ashtead Capital, Inc. | |
| 9.000% 08/15/16 (d) | | | 25,000 | | | | 24,750 | | |
| Commercial Services Total | | | 24,750 | | |
| Food – 0.4% | |
| ConAgra Foods, Inc. | |
| 6.750% 09/15/11 | | | 160,000 | | | | 167,072 | | |
| | | Par ($) | | Value ($) | |
| Kraft Foods, Inc. | |
| 6.500% 08/11/17 | | | 245,000 | | | | 250,742 | | |
| Kroger Co. | |
| 6.200% 06/15/12 | | | 400,000 | | | | 413,101 | | |
| Food Total | | | 830,915 | | |
| Healthcare Services – 0.1% | |
| HCA, Inc. | |
| 9.250% 11/15/16 (d) | | | 25,000 | | | | 25,688 | | |
| PIK, | |
| 9.625% 11/15/16 (d) | | | 75,000 | | | | 77,531 | | |
| Tenet Healthcare Corp. | |
| 9.875% 07/01/14 | | | 100,000 | | | | 88,500 | | |
| Healthcare Services Total | | | 191,719 | | |
| Household Products/Wares – 0.1% | |
| Fortune Brands, Inc. | |
| 5.375% 01/15/16 | | | 175,000 | | | | 166,994 | | |
| Household Products/Wares Total | | | 166,994 | | |
| Consumer Non-Cyclical Total | | | 1,308,428 | | |
| Energy – 0.8% | |
| Oil & Gas – 0.5% | |
| Canadian Natural Resources Ltd. | |
| 5.700% 05/15/17 | | | 250,000 | | | | 244,290 | | |
| Chesapeake Energy Corp. | |
| 6.375% 06/15/15 | | | 100,000 | | | | 95,625 | | |
| Nexen, Inc. | |
| 5.875% 03/10/35 | | | 225,000 | | | | 203,923 | | |
| Talisman Energy, Inc. | |
| 6.250% 02/01/38 | | | 235,000 | | | | 220,777 | | |
| Valero Energy Corp. | |
| 6.875% 04/15/12 | | | 275,000 | | | | 290,245 | | |
| Oil & Gas Total | | | 1,054,860 | | |
| Pipelines – 0.3% | |
| Energy Transfer Partners LP | |
| 6.625% 10/15/36 | | | 200,000 | | | | 191,668 | | |
| MarkWest Energy Partners LP | |
| 8.500% 07/15/16 | | | 100,000 | | | | 99,500 | | |
| TransCanada Pipelines Ltd. | |
| 6.350% 05/15/67 (c) | | | 245,000 | | | | 234,843 | | |
| Williams Companies, Inc. | |
| 6.375% 10/01/10 (d) | | | 45,000 | | | | 45,112 | | |
| Pipelines Total | | | 571,123 | | |
| Energy Total | | | 1,625,983 | | |
See Accompanying Notes to Financial Statements.
74
Columbia Balanced Fund
August 31, 2007
| Corporate Fixed-Income Bonds & Notes (continued) | |
| | | Par ($) | | Value ($) | |
| Financials – 3.9% | |
| Banks – 1.3% | |
| Capital One Financial Corp. | |
| 5.500% 06/01/15 | | | 325,000 | | | | 306,576 | | |
| Marshall & Ilsley Corp. | |
| 4.375% 08/01/09 | | | 700,000 | | | | 691,499 | | |
| PNC Funding Corp. | |
| 5.625% 02/01/17 | | | 240,000 | | | | 234,695 | | |
| SunTrust Preferred Capital I | |
| 5.853% 12/31/49 (c) | | | 200,000 | | | | 194,793 | | |
| USB Capital IX | |
| 6.189% 04/15/49 (c) | | | 375,000 | | | | 376,552 | | |
| Wachovia Corp. | |
| 4.875% 02/15/14 | | | 300,000 | | | | 288,254 | | |
| Wells Fargo & Co. | |
| 5.125% 09/01/12 | | | 600,000 | | | | 599,043 | | |
| Banks Total | | | 2,691,412 | | |
| Diversified Financial Services – 2.1% | |
| AGFC Capital Trust I | |
| 6.000% 01/15/67 (c)(d) | | | 280,000 | | | | 267,573 | | |
| American General Finance Corp. | |
| 5.375% 09/01/09 | | | 375,000 | | | | 376,364 | | |
| CIT Group, Inc. | |
| 6.100% 03/15/67 (c) | | | 100,000 | | | | 73,644 | | |
| Citigroup, Inc. | |
| 5.000% 09/15/14 | | | 700,000 | | | | 670,238 | | |
| Ford Motor Credit Co. | |
| 7.375% 02/01/11 | | | 100,000 | | | | 92,355 | | |
| General Electric Capital Corp. | |
| 5.000% 01/08/16 | | | 650,000 | | | | 624,709 | | |
| GMAC LLC | |
| 8.000% 11/01/31 | | | 85,000 | | | | 76,361 | | |
| Goldman Sachs Group, Inc. | |
| 6.345% 02/15/34 | | | 370,000 | | | | 332,011 | | |
| HSBC Finance Corp. | |
| 5.000% 06/30/15 | | | 650,000 | | | | 610,943 | | |
| JPMorgan Chase Capital XVIII | |
| 6.950% 08/17/36 | | | 425,000 | | | | 402,816 | | |
| Merrill Lynch & Co., Inc. | |
| 6.050% 08/15/12 | | | 250,000 | | | | 254,272 | | |
| Morgan Stanley | |
| 4.750% 04/01/14 | | | 400,000 | | | | 373,928 | | |
| Residential Capital LLC | |
| 7.500% 04/17/13 | | | 200,000 | | | | 150,500 | | |
| SLM Corp. | |
| 5.375% 05/15/14 | | | 225,000 | | | | 192,802 | | |
| Diversified Financial Services Total | | | 4,498,516 | | |
| Insurance – 0.1% | |
| Metlife, Inc. | |
| 6.400% 12/15/36 | | | 205,000 | | | | 186,473 | | |
| Insurance Total | | | 186,473 | | |
| | | Par ($) | | Value ($) | |
| Real Estate Investment Trusts (REITs) – 0.2% | |
| Health Care Property Investors, Inc. | |
| 6.450% 06/25/12 | | | 250,000 | | | | 256,777 | | |
| Simon Property Group LP | |
| 5.750% 12/01/15 | | | 250,000 | | | | 245,958 | | |
| Real Estate Investment Trusts (REITs) Total | | | 502,735 | | |
| Savings & Loans – 0.2% | |
| Washington Mutual, Inc. | |
| 4.200% 01/15/10 | | | 430,000 | | | | 412,480 | | |
| Savings & Loans Total | | | 412,480 | | |
| Financials Total | | | 8,291,616 | | |
| Industrials – 0.5% | |
| Environmental Control – 0.0% | |
| Allied Waste North America, Inc. | |
| 7.125% 05/15/16 | | | 100,000 | | | | 99,500 | | |
| Environmental Control Total | | | 99,500 | | |
| Machinery – 0.1% | |
| Caterpillar Financial Services Corp. | |
| 4.300% 06/01/10 | | | 225,000 | | | | 220,693 | | |
| Machinery Total | | | 220,693 | | |
| Miscellaneous Manufacturing – 0.1% | |
| Bombardier, Inc. | |
| 6.300% 05/01/14 (d) | | | 105,000 | | | | 100,275 | | |
| Miscellaneous Manufacturing Total | | | 100,275 | | |
| Transportation – 0.3% | |
| Burlington Northern Santa Fe Corp. | |
| 6.200% 08/15/36 | | | 185,000 | | | | 178,727 | | |
| Union Pacific Corp. | |
| 3.875% 02/15/09 | | | 500,000 | | | | 492,672 | | |
| Transportation Total | | | 671,399 | | |
| Industrials Total | | | 1,091,867 | | |
| Technology – 0.1% | |
| Semiconductors – 0.1% | |
| Freescale Semiconductor, Inc. | |
| PIK, | |
| 9.125% 12/15/14 | | | 100,000 | | | | 89,500 | | |
| Semiconductors Total | | | 89,500 | | |
| Technology Total | | | 89,500 | | |
| Utilities – 0.9% | |
| Electric – 0.6% | |
| CMS Energy Corp. | |
| 6.875% 12/15/15 | | | 20,000 | | | | 19,873 | | |
| 8.500% 04/15/11 | | | 10,000 | | | | 10,646 | | |
See Accompanying Notes to Financial Statements.
75
Columbia Balanced Fund
August 31, 2007
| Corporate Fixed-Income Bonds & Notes (continued) | |
| | | Par ($) | | Value ($) | |
| Commonwealth Edison Co. | |
| 5.950% 08/15/16 | | | 325,000 | | | | 325,141 | | |
| Indiana Michigan Power Co. | |
| 5.650% 12/01/15 | | | 275,000 | | | | 271,541 | | |
| NRG Energy, Inc. | |
| 7.250% 02/01/14 | | | 15,000 | | | | 14,850 | | |
| Pacific Gas & Electric Co. | |
| 5.800% 03/01/37 | | | 170,000 | | | | 160,427 | | |
| Progress Energy, Inc. | |
| 7.750% 03/01/31 | | | 250,000 | | | | 290,754 | | |
| Southern California Edison Co. | |
| 5.000% 01/15/14 | | | 275,000 | | | | 268,219 | | |
| Electric Total | | | 1,361,451 | | |
| Gas – 0.3% | |
| Atmos Energy Corp. | |
| 6.350% 06/15/17 | | | 210,000 | | | | 213,907 | | |
| Sempra Energy | |
| 4.750% 05/15/09 | | | 375,000 | | | | 371,849 | | |
| Gas Total | | | 585,756 | | |
| Utilities Total | | | 1,947,207 | | |
Total Corporate Fixed-Income Bonds & Notes
(Cost of $19,916,823) | | | 19,411,171 | | |
| Government & Agency Obligations – 5.5% | |
| Foreign Government Obligations – 0.6% | |
| Province of Ontario | |
| 3.500% 09/17/07 | | | 1,000,000 | | | | 999,710 | | |
| United Mexican States | |
| 7.500% 04/08/33 | | | 250,000 | | | | 295,000 | | |
| Foreign Government Obligations Total | | | 1,294,710 | | |
| U.S. Government Agencies – 2.3% | |
| Federal Home Loan Bank | |
| 5.500% 08/13/14 | | | 870,000 | | | | 897,918 | | |
| Federal Home Loan Mortgage Corp. | |
| 6.625% 09/15/09 | | | 1,410,000 | | | | 1,461,103 | | |
| Federal National Mortgage Association | |
| 5.250% 08/01/12 | | | 2,400,000 | | | | 2,435,179 | | |
| U.S. Government Agencies Total | | | 4,794,200 | | |
| U.S. Government Obligations – 2.6% | |
| U.S. Treasury Bonds | |
| 5.375% 02/15/31 | | | 1,337,000 | | | | 1,432,993 | | |
| U.S. Treasury Notes | |
| 3.375% 10/15/09 | | | 550,000 | | | | 540,848 | | |
| 3.875% 02/15/13 | | | 3,735,000 | | | | 3,662,634 | | |
| U.S. Government Obligations Total | | | 5,636,475 | | |
Total Government & Agency Obligations
(Cost of $11,464,794) | | | 11,725,385 | | |
| Collateralized Mortgage Obligations – 5.1% | |
| | | Par ($) | | Value ($) | |
| Agency – 2.6% | |
| Federal Home Loan Mortgage Corp. | |
| 4.000% 09/15/15 | | | 1,820,000 | | | | 1,786,717 | | |
| 4.000% 10/15/18 | | | 1,900,000 | | | | 1,739,811 | | |
| 4.500% 10/15/18 | | | 1,317,085 | | | | 1,303,391 | | |
| 4.500% 08/15/28 | | | 720,000 | | | | 700,497 | | |
| Agency Total | | | 5,530,416 | | |
| Non-Agency – 2.5% | |
| Bear Stearns Adjustable Rate Mortgage Trust | |
| 5.493% 02/25/47 (c) | | | 1,441,581 | | | | 1,438,249 | | |
| Bear Stearns Asset Backed Securities, Inc. | |
| 5.000% 01/25/34 | | | 999,167 | | | | 985,771 | | |
| SACO I, Inc. | |
| (e) 09/25/24 | | | 9,176 | | | | 8,442 | | |
| Structured Asset Securities Corp. | |
| 5.500% 05/25/33 | | | 648,481 | | | | 642,317 | | |
| 5.500% 07/25/33 | | | 913,842 | | | | 875,734 | | |
| WaMu Mortgage Pass-Through Certificates | |
| 5.720% 02/25/37 (c) | | | 1,409,557 | | | | 1,399,485 | | |
| Non-Agency Total | | | 5,349,998 | | |
Total Collateralized Mortgage Obligations
(Cost of $11,085,728) | | | 10,880,414 | | |
| Commercial Mortgage-Backed Securities – 3.0% | |
| Bear Stearns Commercial Mortgage Securities | |
| 5.449% 12/11/40 | | | 500,000 | | | | 492,678 | | |
| 5.624% 03/11/39 (c) | | | 760,000 | | | | 754,452 | | |
| JPMorgan Chase Commercial Mortgage Securities Corp. | |
| 5.447% 06/12/47 | | | 791,000 | | | | 780,445 | | |
| 4.780% 07/15/42 | | | 1,350,000 | | | | 1,276,025 | | |
| Merrill Lynch/Countrywide Commercial Mortgage Trust | |
| 5.902% 06/12/50 (c) | | | 1,128,000 | | | | 1,112,936 | | |
| Morgan Stanley Capital I | |
| 5.370% 12/15/43 | | | 1,053,000 | | | | 1,022,916 | | |
| Nationslink Funding Corp. | |
| 6.888% 11/10/30 | | | 958,272 | | | | 957,159 | | |
Total Commercial Mortgage-Backed Securities
(Cost of $6,599,172) | | | 6,396,611 | | |
| Asset-Backed Securities – 1.0% | |
| Cityscape Home Equity Loan Trust | |
| 7.410% 05/25/28 | | | 358,300 | | | | 356,715 | | |
| First Alliance Mortgage Loan Trust | |
| 7.340% 06/20/27 | | | 71,373 | | | | 71,130 | | |
| IMC Home Equity Loan Trust | |
| 7.310% 11/20/28 | | | 1,046,970 | | | | 1,043,122 | | |
| 7.520% 08/20/28 | | | 664,676 | | | | 662,411 | | |
Total Asset-Backed Securities
(Cost of $2,128,587) | | | 2,133,378 | | |
See Accompanying Notes to Financial Statements.
76
Columbia Balanced Fund
August 31, 2007
| Short-Term Obligation – 3.3% | |
| | | Par ($) | | Value ($) | |
Repurchase agreement with
Fixed Income Clearing Corp.,
dated 08/31/07, due on 09/04/07,
at 5.110%, collateralized by a
U.S. Government Agency
Obligation maturing 06/12/13,
market value $7,184,425
(repurchase proceeds $7,044,998) | | | 7,041,000 | | | | 7,041,000 | | |
Total Short-Term Obligation
(Cost of $7,041,000) | | | 7,041,000 | | |
Total Investments – 100.2%
(Cost of $192,976,464)(f) | | | 212,535,250 | | |
| Other Assets & Liabilities, Net – (0.2)% | | | (497,423 | ) | |
| Net Assets – 100.0% | | | 212,037,827 | | |
Notes to Investment Portfolio:
(a) Non-income producing security.
(b) Security, or a portion thereof, purchased on a delayed delivery basis.
(c) The interest rate shown on floating rate or variable rate securities reflects the rate at August 31, 2007.
(d) Security exempt from registration pursuant to Rule 144A under the Securities Act of 1933. These securities may be resold in transactions exempt from registration, normally to qualified institutional buyers. At August 31, 2007, these securities, which are not illiquid, amounted to $783,936, which represents 0.4% of net assets.
(e) Zero coupon bond.
(f) Cost for federal income tax purposes is $193,264,155.
At August 31, 2007, the asset allocation of the Fund is as follows:
| Asset Allocation (Unaudited) | | % of
Net Assets | |
| Common Stocks | | | 61.7 | | |
| Mortgage-Backed Securities | | | 11.4 | | |
| Corporate Fixed-Income Bonds & Notes | | | 9.2 | | |
| Government & Agency Obligations | | | 5.5 | | |
| Collateralized Mortgage Obligations | | | 5.1 | | |
| Commercial Mortgage-Backed Securities | | | 3.0 | | |
| Asset-Backed Securities | | | 1.0 | | |
| | | | 96.9 | | |
| Short-Term Obligation | | | 3.3 | | |
| Other Assets & Liabilities, Net | | | (0.2 | ) | |
| | | | 100.0 | | |
| Acronym | | Name | |
| ADR | | American Depositary Receipt | |
|
| PIK | | Payment-In-Kind | |
|
| TBA | | To Be Announced | |
|
See Accompanying Notes to Financial Statements.
77
Investment Portfolio – Columbia Oregon Intermediate Municipal Bond Fund
August 31, 2007
Municipal Bonds – 98.5%
| | | Par ($) | | Value ($) | |
| Education – 6.3% | |
| Education – 6.3% | |
| OR Facilities Authority | |
Linfield College Project,
Series 2005 A,
5.000% 10/01/20 | | | 1,825,000 | | | | 1,841,845 | | |
| OR Forest Grove Student Housing | |
Oak Tree Foundation,
Series 2007,
5.500% 03/01/37 | | | 3,000,000 | | | | 2,774,280 | | |
| OR Health Sciences University | |
Series 1996 A,
Insured: MBIA:
(a) 07/01/09 | | | 1,530,000 | | | | 1,426,694 | | |
| (a) 07/01/12 | | | 1,315,000 | | | | 1,090,543 | | |
| (a) 07/01/14 | | | 2,550,000 | | | | 1,934,991 | | |
| (a) 07/01/15 | | | 4,325,000 | | | | 3,137,485 | | |
| (a) 07/01/21 | | | 12,515,000 | | | | 6,590,524 | | |
OR Health, Housing, Educational &
Cultural Facilities Authority | |
Linfield College Project,
Series 1998 A:
4.650% 10/01/09 | | | 555,000 | | | | 560,023 | | |
| 5.500% 10/01/18 | | | 1,000,000 | | | | 1,017,290 | | |
Reed College Project,
Series 1995 A,
Insured: MBIA
5.100% 07/01/10 | | | 690,000 | | | | 705,359 | | |
OR Multnomah County
Educational Facilities Authority | |
University of Portland Project,
Series 2000:
5.700% 04/01/15 | | | 1,000,000 | | | | 1,031,380 | | |
| 6.000% 04/01/20 | | | 1,000,000 | | | | 1,032,460 | | |
| 6.000% 04/01/25 | | | 500,000 | | | | 513,290 | | |
| Education Total | | | 23,656,164 | | |
| Education Total | | | 23,656,164 | | |
| Health Care – 8.7% | |
| Continuing Care Retirement – 0.7% | |
| OR Albany Hospital Facility Authority | |
Mennonite Home Albany,
Series 2004 PJ-A:
4.750% 10/01/11 | | | 660,000 | | | | 657,802 | | |
| 5.000% 10/01/12 | | | 680,000 | | | | 682,999 | | |
| | | Par ($) | | Value ($) | |
OR Multnomah County Hospital
Facilities Authority | |
Terwilliger Plaza, Inc.,
Series 2006 A,
5.250% 12/01/26 | | | 1,400,000 | | | | 1,378,230 | | |
| Continuing Care Retirement Total | | | 2,719,031 | | |
| Hospitals – 8.0% | |
OR Benton County Hospital
Facilities Authority | |
Samaritan Health Services Project,
Series 1998:
4.400% 10/01/07 | | | 220,000 | | | | 220,072 | | |
| 4.800% 10/01/11 | | | 245,000 | | | | 249,006 | | |
| 5.200% 10/01/17 | | | 2,255,000 | | | | 2,289,682 | | |
OR Clackamas County Hospital
Facility Authority | |
Legacy Health System, IBC,
Series 1999,
Insured: MBIA
5.500% 02/15/13 | | | 495,000 | | | | 513,498 | | |
Legacy Health System:
Series 1999:
5.000% 02/15/16 | | | 1,010,000 | | | | 1,033,311 | | |
| 5.500% 02/15/13 | | | 5,450,000 | | | | 5,647,399 | | |
| 5.500% 02/15/14 | | | 2,385,000 | | | | 2,471,385 | | |
| Series 2001: | |
| 4.600% 05/01/10 | | | 885,000 | | | | 900,726 | | |
| 5.250% 05/01/21 | | | 4,890,000 | | | | 5,019,732 | | |
| 5.750% 05/01/12 | | | 2,000,000 | | | | 2,141,320 | | |
| 5.750% 05/01/16 | | | 1,500,000 | | | | 1,589,085 | | |
OR Medford Hospital Facilities
Authority | |
Asante Health System,
Series 1998 A,
Insured: MBIA:
5.250% 08/15/10 | | | 485,000 | | | | 495,811 | | |
| 5.250% 08/15/11 | | | 260,000 | | | | 265,600 | | |
OR Multnomah County Hospital
Facilities Authority | |
Providence Health System,
Series 2004,
5.250% 10/01/16 | | | 2,970,000 | | | | 3,121,173 | | |
| OR Salem Hospital Facility Authority | |
Series 2006 A,
5.000% 08/15/27 | | | 3,500,000 | | | | 3,525,025 | | |
See Accompanying Notes to Financial Statements.
78
Columbia Oregon Intermediate Municipal Bond Fund
August 31, 2007
Municipal Bonds (continued)
| | | Par ($) | | Value ($) | |
| OR Umatilla County Hospital Facility Authority | |
Catholic Health Initiatives,
Series 2000 A,
5.750% 12/01/20 | | | 285,000 | | | | 299,110 | | |
| Hospitals Total | | | 29,781,935 | | |
| Health Care Total | | | 32,500,966 | | |
| Housing – 3.1% | |
| Assisted Living/Senior – 0.5% | |
OR Clackamas County Hospital
Facility Authority | |
Robison Jewish Home Project,
Series 2005:
5.000% 10/01/19 | | | 1,000,000 | | | | 951,190 | | |
| 5.125% 10/01/24 | | | 1,000,000 | | | | 929,470 | | |
| Assisted Living/Senior Total | | | 1,880,660 | | |
| Multi-Family – 0.6% | |
OR Clackamas County Housing
Authority | |
Multi-Family Housing,
Easton Ridge,
Series 1996 A,
5.800% 12/01/16 | | | 2,255,000 | | | | 2,238,877 | | |
| Multi-Family Total | | | 2,238,877 | | |
| Single-Family – 2.0% | |
| OR Housing & Community Services | |
Department Mortgage Single
Family Program:
Series 1991 D,
6.700% 07/01/13 | | | 200,000 | | | | 206,754 | | |
Series 1998 A,
4.850% 07/01/10 | | | 120,000 | | | | 122,086 | | |
Series 1999 E,
5.375% 07/01/21 | | | 2,590,000 | | | | 2,647,861 | | |
Series 1999 M, AMT,
5.800% 07/01/12 | | | 130,000 | | | | 132,800 | | |
Series 2000 E,
Insured: FHA:
5.700% 07/01/12 | | | 395,000 | | | | 400,415 | | |
| 5.800% 07/01/14 | | | 350,000 | | | | 355,148 | | |
| 6.000% 07/01/20 | | | 965,000 | | | | 984,445 | | |
Series 2001 J,
5.150% 07/01/24 | | | 1,520,000 | | | | 1,538,255 | | |
Series 2001 Q:
4.700% 07/01/15 | | | 510,000 | | | | 520,144 | | |
| 4.900% 07/01/17 | | | 495,000 | | | | 505,400 | | |
| Single-Family Total | | | 7,413,308 | | |
| Housing Total | | | 11,532,845 | | |
| | | Par ($) | | Value ($) | |
| Other – 28.4% | |
| Other – 1.3% | |
OR Health, Housing, Educational &
Cultural Facilities Authority | |
Goodwill Industries Lane County,
Series 1998 A,
6.650% 11/15/22 (b) | | | 3,515,000 | | | | 3,484,736 | | |
PR Commonwealth of Puerto Rico
Government Development Bank | |
Series 2006 B,
5.000% 12/01/14 | | | 1,200,000 | | | | 1,261,080 | | |
| Other Total | | | 4,745,816 | | |
| Refunded/Escrowed (c) – 27.1% | |
| OR Benton & Linn Counties | |
School District No. 509J, Corvallis,
Series 2003,
Pre-refunded 06/01/13,
Insured: FSA
5.000% 06/01/17 | | | 2,665,000 | | | | 2,828,631 | | |
| OR Board of Higher Education | |
Lottery Education Project,
Series 1999 A:
Pre-refunded 04/01/09,
Insured: FSA
5.250% 04/01/13 | | | 1,600,000 | | | | 1,653,344 | | |
Pre-refunded 04/01/11,
Insured: FSA
5.000% 04/01/14 | | | 2,705,000 | | | | 2,823,777 | | |
Series 2001 A,
Pre-refunded 08/01/11,
5.250% 08/01/14 | | | 1,225,000 | | | | 1,292,828 | | |
OR Clackamas County Hospital
Facility Authority | |
Kaiser Permanente,
Series 1998 A,
Escrowed to Maturity,
5.375% 04/01/14 | | | 7,135,000 | | | | 7,371,953 | | |
Willamette View, Inc. Project,
Series 1999 A,
Pre-refunded 11/01/09,
6.850% 11/01/15 | | | 1,480,000 | | | | 1,576,585 | | |
| OR Clackamas County | |
School District No. 086,
Series 2000,
Pre-refunded 06/15/10,
6.000% 06/15/16 | | | 2,350,000 | | | | 2,495,418 | | |
See Accompanying Notes to Financial Statements.
79
Columbia Oregon Intermediate Municipal Bond Fund
August 31, 2007
Municipal Bonds (continued)
| | | Par ($) | | Value ($) | |
School District No. 108,
Series 2001,
Pre-refunded 06/15/11,
Insured: FSA
5.375% 06/15/15 | | | 1,055,000 | | | | 1,117,340 | | |
School District No. 12,
North Clackamas,
Series 1998,
Pre-refunded 06/01/09,
Insured: FGIC
5.250% 06/01/11 | | | 1,000,000 | | | | 1,026,200 | | |
School District No. 7J,
Lake Oswega,
Series 2001,
Pre-refunded 06/01/11:
5.375% 06/01/16 | | | 1,295,000 | | | | 1,370,835 | | |
| 5.375% 06/01/17 | | | 2,535,000 | | | | 2,683,450 | | |
| OR Coos County | |
School District No. 13, North Bend,
Series 2002,
Pre-refunded 06/15/12,
Insured: FSA
5.500% 06/15/15 | | | 1,765,000 | | | | 1,903,958 | | |
| OR Department of Transportation | |
Highway User Tax,
Series 2002 A,
Pre-refunded 11/15/12,
5.500% 11/15/16 | | | 2,500,000 | | | | 2,712,375 | | |
OR Deschutes County Hospital
Facilities Authority | |
Cascade Health Services, Inc.,
Series 2002,
Pre-refunded 01/01/12:
5.500% 01/01/22 | | | 2,000,000 | | | | 2,137,860 | | |
| 5.600% 01/01/27 | | | 5,550,000 | | | | 5,954,539 | | |
| 5.600% 01/01/32 | | | 2,000,000 | | | | 2,145,780 | | |
| OR Deschutes County | |
Certificates of Participation,
Series 1998 A,
Pre-refunded 06/01/09,
5.050% 06/01/17 | | | 420,000 | | | | 429,307 | | |
School District No. 1,
Series 2001 A,
Pre-refunded 06/15/11,
Insured: FSA
5.500% 06/15/18 | | | 1,000,000 | | | | 1,063,470 | | |
| OR Jackson County | |
School District No. 4,
Phoenix-Talent,
Series 2001,
Pre-refunded 06/15/11,
Insured: FSA
5.500% 06/15/16 | | | 1,000,000 | | | | 1,063,470 | | |
| | | Par ($) | | Value ($) | |
School District No. 9, Eagle Point,
Series 2000,
Pre-refunded 06/15/11,
5.625% 06/15/15 | | | 1,920,000 | | | | 2,050,272 | | |
| OR Lebanon Urban Renewal Agency | |
Series 1999,
Pre-refunded 06/01/09,
5.625% 06/01/19 | | | 1,000,000 | | | | 1,031,390 | | |
| OR Linn County Community | |
School District No. 9, Lebanon,
Series 2001,
Pre-refunded 06/15/13,
Insured: FGIC
5.550% 06/15/21 | | | 2,000,000 | | | | 2,182,400 | | |
School District No. 9,
Series 2001,
Pre-refunded 06/15/13,
Insured: FGIC
5.250% 06/15/15 | | | 405,000 | | | | 435,237 | | |
| OR Medford Hospital Facilities Authority | |
Asante Health System,
Series 1998 A,
Pre-refunded 08/15/08,
Insured: MBIA
5.250% 08/15/11 | | | 540,000 | | | | 552,938 | | |
| OR Multnomah County | |
School District No. 40,
Series 2001,
Pre-refunded 12/01/10,
Insured: FSA
5.000% 12/01/14 | | | 1,790,000 | | | | 1,863,157 | | |
School District No. 7, Reynolds,
Series 2000,
Pre-refunded 06/15/11:
5.625% 06/15/14 | | | 2,670,000 | | | | 2,851,160 | | |
| 5.625% 06/15/17 | | | 1,000,000 | | | | 1,067,850 | | |
| OR Multnomah-Clackamas Counties | |
Centennial School
District No. 28-302,
Series 2001,
Pre-refunded 06/15/11,
Insured: FGIC:
5.375% 06/15/16 | | | 2,055,000 | | | | 2,176,430 | | |
| 5.375% 06/15/17 | | | 2,280,000 | | | | 2,414,725 | | |
| 5.375% 06/15/18 | | | 2,490,000 | | | | 2,637,134 | | |
OR North Clackamas Parks &
Recreation District Facilities | |
Series 1993,
Escrowed to Maturity,
5.700% 04/01/13 | | | 2,310,000 | | | | 2,435,410 | | |
See Accompanying Notes to Financial Statements.
80
Columbia Oregon Intermediate Municipal Bond Fund
August 31, 2007
Municipal Bonds (continued)
| | | Par ($) | | Value ($) | |
| OR Northern Oregon Corrections | |
Series 1997,
Pre-refunded 09/15/07,
Insured: AMBAC
5.300% 09/15/13 | | | 1,000,000 | | | | 1,000,550 | | |
| OR Portland Community College District | |
Series 2001 A,
Pre-refunded 06/01/11:
5.375% 06/01/14 | | | 1,925,000 | | | | 2,037,728 | | |
| 5.375% 06/01/16 | | | 2,705,000 | | | | 2,863,405 | | |
| 5.375% 06/01/17 | | | 2,540,000 | | | | 2,688,742 | | |
| OR Powell Valley Water District | |
Series 2000,
Pre-refunded 08/01/09,
6.000% 02/01/15 | | | 620,000 | | | | 645,513 | | |
| OR Salem Water & Sewer | |
Series 2000,
Pre-refunded 06/01/10,
Insured: FSA
5.300% 06/01/15 | | | 1,500,000 | | | | 1,564,230 | | |
OR Tri-County Metropolitan
Transportation District | |
Series 1999 1,
Pre-refunded 06/01/09,
5.400% 06/01/19 | | | 4,200,000 | | | | 4,362,666 | | |
OR Umatilla County Hospital
Facility Authority | |
Catholic Health Initiatives,
Series 2000 A,
Escrowed to Maturity:
5.750% 12/01/20 | | | 245,000 | | | | 260,151 | | |
| 6.000% 12/01/30 | | | 4,825,000 | | | | 5,115,562 | | |
OR Washington & Clackamas
Counties | |
School District No. 23J, Tigard,
Series 2002,
Pre-refunded 06/15/12,
Insured: MBIA
5.375% 06/15/17 | | | 1,500,000 | | | | 1,609,935 | | |
| OR Washington County | |
School District No. 48J, Beaverton:
Series 1999,
Pre-refunded 06/01/09,
Insured: FGIC
5.100% 06/01/12 | | | 500,000 | | | | 511,840 | | |
Series 2001,
Pre-refunded 01/01/11:
5.125% 01/01/14 | | | 2,000,000 | | | | 2,089,780 | | |
| 5.125% 01/01/17 | | | 1,820,000 | | | | 1,901,700 | | |
| 5.125% 01/01/18 | | | 2,260,000 | | | | 2,361,451 | | |
| | | Par ($) | | Value ($) | |
Series 2001,
Pre-refunded 06/01/11,
5.500% 06/01/16 | | | 2,785,000 | | | | 2,960,149 | | |
OR Washington, Multnomah &
Yamhill Counties | |
School District No. 1J,
Series 1999,
Pre-refunded 06/01/09,
5.250% 06/01/14 | | | 500,000 | | | | 513,100 | | |
| OR Yamhill County | |
School District No. 029J,
Series 2002,
Pre-refunded 06/15/12,
Insured: MBIA
5.250% 06/15/16 | | | 2,535,000 | | | | 2,707,000 | | |
VI Virgin Islands Public Finance
Authority | |
Series 1989 A,
Escrowed to Maturity,
7.300% 10/01/18 | | | 1,185,000 | | | | 1,432,073 | | |
| Refunded/Escrowed Total | | | 101,974,798 | | |
| Other Total | | | 106,720,614 | | |
| Other Revenue – 2.0% | |
| Recreation – 2.0% | |
| OR Board of Higher Education | |
Lottery Education Project:
Series 1999 B,
Insured: FSA
5.250% 04/01/15 | | | 1,315,000 | | | | 1,356,173 | | |
Series 2003 A,
Insured: FSA:
5.000% 04/01/14 | | | 1,830,000 | | | | 1,944,649 | | |
| 5.250% 04/01/11 | | | 4,000,000 | | | | 4,128,240 | | |
| Recreation Total | | | 7,429,062 | | |
| Other Revenue Total | | | 7,429,062 | | |
| Tax-Backed – 39.4% | |
| Local Appropriated – 0.3% | |
| OR Deschutes & Jefferson County | |
School District No. 02J,
Series 2004 B,
Insured: FGIC
(a) 06/15/22 | | | 2,335,000 | | | | 1,179,759 | | |
| Local Appropriated Total | | | 1,179,759 | | |
| Local General Obligations – 22.7% | |
| OR Aurora | |
Series 1999,
5.600% 06/01/24 | | | 1,205,000 | | | | 1,229,269 | | |
See Accompanying Notes to Financial Statements.
81
Columbia Oregon Intermediate Municipal Bond Fund
August 31, 2007
Municipal Bonds (continued)
| | | Par ($) | | Value ($) | |
| OR Bend Municipal Airport Project | |
Series 1999 B, AMT,
5.375% 06/01/13 | | | 150,000 | | | | 153,443 | | |
OR Canyonville South Umpqua
Rural Fire District | |
Series 2001,
5.400% 07/01/31 | | | 610,000 | | | | 590,114 | | |
| OR Clackamas & Washington Counties | |
School District No. 003JT,
Series 2003,
Insured: FGIC
(a) 06/15/17 | | | 4,000,000 | | | | 2,610,120 | | |
| OR Clackamas Community College | |
Series 2001,
Insured: FGIC
5.250% 06/15/15 | | | 1,500,000 | | | | 1,575,180 | | |
| OR Clackamas County | |
School District No. 007J, Lake Oswego,
Series 2005,
Insured: FSA
5.250% 06/01/21 | | | 2,000,000 | | | | 2,180,340 | | |
School District No. 108, Estacada,
Series 2005,
Insured: FSA
5.500% 06/15/25 | | | 2,485,000 | | | | 2,790,083 | | |
School District No. 115,
Series 2006 A,
Insured: MBIA:
(a) 06/15/25 | | | 2,250,000 | | | | 896,535 | | |
| (a) 06/15/26 | | | 2,610,000 | | | | 985,406 | | |
School District No. 12,
North Clackamas,
Series 2007 B,
Insured: FSA
(a) 06/15/22 | | | 4,000,000 | | | | 3,467,360 | | |
Series 2007,
Insured: MBIA
4.125% 06/01/27 | | | 2,000,000 | | | | 1,824,080 | | |
| OR Columbia County | |
School District No. 502,
Deferred Interest,
Series 1999,
Insured: FGIC:
(a) 06/01/13 | | | 1,685,000 | | | | 1,342,743 | | |
| (a) 06/01/14 | | | 1,025,000 | | | | 780,671 | | |
| OR Coos Bay | |
Series 2000,
4.900% 09/01/07 | | | 525,000 | | | | 525,000 | | |
| | | Par ($) | | Value ($) | |
| OR Deschutes County | |
Administrative School District No. 1,
Series 2007,
Insured: FGIC
4.500% 06/15/20 | | | 5,000,000 | | | | 5,047,050 | | |
| OR Jackson County | |
School District No. 009,
Series 2005,
Insured: MBIA:
5.500% 06/15/20 | | | 1,000,000 | | | | 1,115,990 | | |
| 5.500% 06/15/21 | | | 1,410,000 | | | | 1,576,718 | | |
School District No. 6, Central Point,
Series 2000,
6.000% 06/15/09 | | | 1,090,000 | | | | 1,133,894 | | |
| OR Jefferson County | |
School District No. 509J,
Madras School District,
Series 2002,
Insured: FGIC
5.250% 06/15/18 | | | 1,075,000 | | | | 1,131,050 | | |
| OR Josephine County | |
Unit School District,
Three Rivers,
Series 2005,
Insured: FGIC:
5.000% 12/15/15 | | | 1,000,000 | | | | 1,074,350 | | |
| 5.000% 12/15/16 | | | 1,000,000 | | | | 1,074,560 | | |
| OR Lane County | |
School District No. 19, Springfield:
Series 1997,
Insured: FGIC:
6.000% 10/15/12 | | | 1,740,000 | | | | 1,923,727 | | |
| 6.000% 10/15/14 | | | 1,310,000 | | | | 1,482,527 | | |
Series 2006,
Insured: FSA
(a) 06/15/25 | | | 5,160,000 | | | | 2,068,592 | | |
School District No. 4J, Eugene,
Series 2002:
5.000% 07/01/12 | | | 1,000,000 | | | | 1,057,460 | | |
| 5.250% 07/01/13 | | | 1,000,000 | | | | 1,077,890 | | |
| OR Linn Benton Community College | |
Series 2001,
Insured: FGIC
(a) 06/15/13 | | | 1,000,000 | | | | 796,020 | | |
Series 2002,
Insured: FGIC
(a) 06/15/14 | | | 1,000,000 | | | | 761,700 | | |
See Accompanying Notes to Financial Statements.
82
Columbia Oregon Intermediate Municipal Bond Fund
August 31, 2007
Municipal Bonds (continued)
| | | Par ($) | | Value ($) | |
| OR Linn County | |
Community School District No. 9,
Lebanon,
Series 2001,
Insured: FGIC
5.250% 06/15/15 | | | 305,000 | | | | 325,889 | | |
| OR Madras Aquatic Center District | |
Series 2005,
5.000% 06/01/22 | | | 1,695,000 | | | | 1,715,476 | | |
| OR Multnomah-Clackamas Counties | |
Centennial School District No. 28JT,
Series 2006,
Insured: AMBAC
(a) 06/01/16 | | | 2,260,000 | | | | 1,550,880 | | |
| OR Portland Limited Tax | |
Series 2001 B:
(a) 06/01/12 | | | 1,750,000 | | | | 1,455,300 | | |
| (a) 06/01/13 | | | 1,500,000 | | | | 1,194,645 | | |
| (a) 06/01/16 | | | 3,500,000 | | | | 2,423,715 | | |
| (a) 06/01/18 | | | 4,000,000 | | | | 2,501,640 | | |
| (a) 06/01/19 | | | 4,000,000 | | | | 2,371,240 | | |
| (a) 06/01/20 | | | 4,000,000 | | | | 2,251,120 | | |
Series 2003 A,
3.400% 06/01/13 | | | 380,000 | | | | 374,840 | | |
| OR Portland | |
Series 2005,
5.000% 06/01/16 | | | 3,075,000 | | | | 3,278,411 | | |
OR Tualatin Hills Park &
Recreation District | |
Series 1998,
Insured: FGIC
5.750% 03/01/14 | | | 990,000 | | | | 1,098,286 | | |
OR Washington & Clackamas
Counties | |
Deferred Interest,
Series 1999 A,
(a) 06/01/10 | | | 1,520,000 | | | | 1,355,141 | | |
School District No. 23J, Tigard:
Series 2000,
(a) 06/15/18 | | | 2,700,000 | | | | 1,673,163 | | |
Series 2005,
Insured: MBIA
5.000% 06/15/21 | | | 6,575,000 | | | | 7,014,276 | | |
OR Washington, Clackamas &
Yamhill Counties | |
School District No. 88J,
Series 2007 B,
Insured: MBIA
4.500% 06/15/23 | | | 8,125,000 | | | | 8,088,112 | | |
| | | Par ($) | | Value ($) | |
OR Washington, Multnomah &
Yamhill Counties | |
School District No. 1J:
Series 1998,
5.000% 11/01/13 | | | 1,100,000 | | | | 1,174,580 | | |
Series 2006,
Insured: MBIA
(a) 06/15/25 | | | 4,065,000 | | | | 1,623,114 | | |
| OR Yamhill County | |
School District No. 029J,
Series 2005,
Insured: FGIC
5.500% 06/15/21 | | | 1,000,000 | | | | 1,118,240 | | |
School District No. 40,
Series 1997,
Insured: FGIC
6.000% 06/01/09 | | | 500,000 | | | | 519,800 | | |
| Local General Obligations Total | | | 85,379,740 | | |
| Special Property Tax – 6.6% | |
| OR Hood River Urban Renewal Agency | |
Series 1996,
6.250% 12/15/11 | | | 840,000 | | | | 842,461 | | |
| OR Lebanon Urban Renewal Agency | |
Series 2000:
5.750% 06/01/15 | | | 1,120,000 | | | | 1,139,432 | | |
| 6.000% 06/01/20 | | | 1,580,000 | | | | 1,614,965 | | |
| OR Medford Urban Renewal | |
Series 1996,
5.875% 09/01/10 | | | 500,000 | | | | 500,755 | | |
OR Portland Airport Way Urban
Renewal & Redevelopment | |
Convention Center,
Series 2000 A,
Insured: AMBAC:
5.750% 06/15/17 | | | 1,500,000 | | | | 1,590,330 | | |
| 5.750% 06/15/18 | | | 2,050,000 | | | | 2,173,164 | | |
OR Portland River District Urban
Renewal & Redevelopment | |
Series 2003 A,
Insured: AMBAC:
5.000% 06/15/17 | | | 1,500,000 | | | | 1,583,490 | | |
| 5.000% 06/15/18 | | | 3,070,000 | | | | 3,204,497 | | |
| 5.000% 06/15/20 | | | 2,000,000 | | | | 2,072,640 | | |
See Accompanying Notes to Financial Statements.
83
Columbia Oregon Intermediate Municipal Bond Fund
August 31, 2007
Municipal Bonds (continued)
| | | Par ($) | | Value ($) | |
OR Portland Urban Renewal &
Redevelopment | |
South Park Blocks,
Series 2000 A,
Insured: AMBAC:
5.750% 06/15/17 | | | 2,065,000 | | | | 2,189,354 | | |
| 5.750% 06/15/19 | | | 2,580,000 | | | | 2,735,006 | | |
| OR Redmond Urban Renewal Agency | |
Downtown Area B,
Series 1999:
5.650% 06/01/13 | | | 720,000 | | | | 729,792 | | |
| 5.850% 06/01/19 | | | 785,000 | | | | 795,653 | | |
South Airport Industrial Area A,
Series 1999,
5.700% 06/01/19 | | | 650,000 | | | | 655,278 | | |
| OR Seaside Urban Renewal Agency | |
Greater Seaside Urban Renewal,
Series 2001,
5.250% 06/01/15 | | | 1,000,000 | | | | 1,016,220 | | |
| OR Veneta Urban Renewal Agency | |
Series 2001:
5.375% 02/15/16 | | | 700,000 | | | | 721,574 | | |
| 5.625% 02/15/21 | | | 1,100,000 | | | | 1,128,457 | | |
| OR Wilsonville Limited Tax Improvement | |
Series 1998,
5.000% 12/01/10 | | | 110,000 | | | | 110,331 | | |
| Special Property Tax Total | | | 24,803,399 | | |
| State Appropriated – 6.2% | |
| OR Department of Administrative Services | |
Certificates of Participation:
Series 1999 A,
Insured: AMBAC:
5.000% 05/01/13 | | | 4,240,000 | | | | 4,360,331 | | |
| 5.000% 05/01/14 | | | 1,000,000 | | | | 1,028,380 | | |
Series 2002 B,
Insured: MBIA
5.250% 05/01/10 | | | 840,000 | | | | 871,861 | | |
Series 2002 C,
Insured: MBIA:
5.250% 11/01/15 | | | 1,000,000 | | | | 1,059,530 | | |
| 5.250% 11/01/17 | | | 5,000,000 | | | | 5,273,600 | | |
Series 2002 E,
Insured: FSA
5.000% 11/01/13 | | | 1,470,000 | | | | 1,545,838 | | |
Series 2007 A,
Insured FGIC:
5.000% 05/01/24 | | | 2,630,000 | | | | 2,725,732 | | |
| 5.000% 05/01/25 | | | 2,780,000 | | | | 2,872,407 | | |
| 5.000% 05/01/26 | | | 2,800,000 | | | | 2,884,224 | | |
| | | Par ($) | | Value ($) | |
PR Commonwealth of Puerto Rico
Public Finance Corp. | |
Series 2004 A,
5.750% 08/01/27 | | | 750,000 | | | | 793,500 | | |
| State Appropriated Total | | | 23,415,403 | | |
| State General Obligations – 3.6% | |
| OR Board of Higher Education | |
Deferred Interest,
Series 2001 A,
(a) 08/01/17 | | | 1,050,000 | | | | 686,186 | | |
Series 1996 A,
(a) 08/01/14 | | | 490,000 | | | | 370,322 | | |
Series 2001 A:
5.250% 08/01/14 | | | 255,000 | | | | 268,178 | | |
| 5.250% 08/01/16 | | | 780,000 | | | | 818,571 | | |
Series 2004 D,
5.000% 08/01/24 | | | 3,620,000 | | | | 3,728,600 | | |
| OR Elderly & Disabled Housing | |
Series 2001 B,
4.950% 08/01/20 | | | 985,000 | | | | 998,170 | | |
| OR State | |
Series 1980,
9.200% 10/01/08 | | | 385,000 | | | | 407,203 | | |
Series 2002 A,
5.250% 10/15/15 | | | 1,735,000 | | | | 1,847,029 | | |
| OR Veterans Welfare | |
Series 1980,
8.000% 07/01/08 | | | 580,000 | | | | 600,236 | | |
Series 2000 80A,
5.700% 10/01/32 | | | 1,535,000 | | | | 1,544,993 | | |
PR Commonwealth of Puerto Rico
Aqueduct & Sewer Authority | |
Series 2004 A,
5.000% 07/01/30 | | | 1,000,000 | | | | 1,034,170 | | |
| PR Commonwealth of Puerto Rico | |
Series 2006 A,
5.250% 07/01/23 | | | 1,000,000 | | | | 1,033,480 | | |
| State General Obligations Total | | | 13,337,138 | | |
| Tax-Backed Total | | | 148,115,439 | | |
| Transportation – 1.3% | |
| Airports – 0.4% | |
| OR Eugene Airport | |
Series 2000, AMT,
5.700% 05/01/08 | | | 515,000 | | | | 520,129 | | |
See Accompanying Notes to Financial Statements.
84
Columbia Oregon Intermediate Municipal Bond Fund
August 31, 2007
Municipal Bonds (continued)
| | | Par ($) | | Value ($) | |
| OR Port of Portland International Airport | |
Series 1998 12B,
Insured: FGIC
5.250% 07/01/12 | | | 1,000,000 | | | | 1,025,630 | | |
| Airports Total | | | 1,545,759 | | |
| Ports – 0.6% | |
| OR Port of Morrow | |
Series 2007:
4.875% 06/01/20 | | | 750,000 | | | | 734,963 | | |
| 5.000% 06/01/25 | | | 1,000,000 | | | | 970,170 | | |
| OR Port of St. Helens | |
Series 1999:
5.600% 08/01/14 | | | 315,000 | | | | 316,559 | | |
| 5.750% 08/01/19 | | | 425,000 | | | | 426,339 | | |
| Ports Total | | | 2,448,031 | | |
| Transportation – 0.3% | |
OR Tri-County Metropolitan
Transportation District | |
Series 2003 A,
5.000% 09/01/15 | | | 1,000,000 | | | | 1,053,370 | | |
| Transportation Total | | | 1,053,370 | | |
| Transportation Total | | | 5,047,160 | | |
| Utilities – 9.3% | |
| Independent Power Producers – 1.0% | |
| OR Western Generation Agency | |
Series 2006 A,
5.000% 01/01/21 | | | 3,000,000 | | | | 2,753,040 | | |
Wauna Cogeneration Project,
Series 2006 A,
5.000% 01/01/20 | | | 1,000,000 | | | | 926,020 | | |
| Independent Power Producers Total | | | 3,679,060 | | |
| Investor Owned – 2.3% | |
| OR Port of St. Helens Pollution Control | |
Portland General Electric Co.:
Series 1985 A,
4.800% 04/01/10 | | | 5,195,000 | | | | 5,175,622 | | |
Series 1985 B,
4.800% 06/01/10 | | | 3,500,000 | | | | 3,486,035 | | |
| Investor Owned Total | | | 8,661,657 | | |
| Municipal Electric – 3.3% | |
| OR Emerald Peoples Utility District | |
Series 1996,
Insured: FGIC:
7.350% 11/01/10 | | | 2,160,000 | | | | 2,389,111 | | |
| 7.350% 11/01/11 | | | 2,000,000 | | | | 2,274,960 | | |
| | | Par ($) | | Value ($) | |
| 7.350% 11/01/12 | | | 2,490,000 | | | | 2,902,593 | | |
| 7.350% 11/01/13 | | | 2,675,000 | | | | 3,191,356 | | |
Series 2003 A,
Insured: FSA
5.250% 11/01/20 | | | 605,000 | | | | 642,534 | | |
| OR Eugene Electric Utilities System | |
Series 2001 B,
Insured: FSA
5.250% 08/01/13 | | | 1,040,000 | | | | 1,093,747 | | |
| Municipal Electric Total | | | 12,494,301 | | |
| Water & Sewer – 2.7% | |
| OR Myrtle Point Water | |
Series 2000,
6.000% 12/01/20 | | | 510,000 | | | | 527,804 | | |
| OR Portland Water Systems Revenue | |
Series 2006 B,
5.000% 10/01/16 | | | 5,330,000 | | | | 5,713,547 | | |
| OR Sheridan Water | |
Series 1998,
5.350% 04/01/18 | | | 300,000 | | | | 300,825 | | |
Series 2000:
6.200% 05/01/15 | | | 625,000 | | | | 647,469 | | |
| 6.450% 05/01/20 | | | 520,000 | | | | 539,011 | | |
OR Washington County Housing
Authority | |
Clean Water Services Sewer,
Series 2004 Lien,
Insured: MBIA
5.000% 10/01/13 | | | 2,310,000 | | | | 2,465,047 | | |
| Water & Sewer Total | | | 10,193,703 | | |
| Utilities Total | | | 35,028,721 | | |
Total Municipal Bonds
(Cost of $362,232,189) | | | | | | | 370,030,971 | | |
Investment Company – 0.1%
| | | Shares | | | |
Dreyfus Tax-Exempt Cash
Management Fund
(7 day yield of 3.740%) | | | 306,966 | | | | 306,966 | | |
Total Investment Company
(Cost of $306,966) | | | | | | | 306,966 | | |
See Accompanying Notes to Financial Statements.
85
Columbia Oregon Intermediate Municipal Bond Fund
August 31, 2007
Short-Term Obligations – 0.3%
| | | Par ($) | | Value ($) | |
| Variable Rate Demand Notes (d) – 0.3% | |
FL Pinellas County Health Facility
Authority | |
All Childrens Hospital,
Series 1985,
Insured: AMBAC,
SPA: Wachovia Bank N.A.
3.980% 12/01/15 | | | 300,000 | | | | 300,000 | | |
| SD Lawrence County | |
Homestake Mining Co.,
Series 1997 B,
LOC: Chase Manhattan Bank
3.940% 07/01/32 | | | 200,000 | | | | 200,000 | | |
| WA Housing Finance Commission | |
Local 82-Jatc Educational Development Trust,
Series 2000,
LOC: U.S. Bank N.A.
3.900% 11/01/25 | | | 900,000 | | | | 900,000 | | |
| Variable Rate Demand Notes Total | | | 1,400,000 | | |
Total Short-Term Obligations
(Cost of $1,400,000) | | | 1,400,000 | | |
Total Investments – 98.9%
(Cost of $363,939,155)(e) | | | 371,737,937 | | |
| Other Assets & Liabilities, Net – 1.1% | | | 4,011,654 | | |
| Net Assets – 100.0% | | | 375,749,591 | | |
Notes to Investment Portfolio:
(a) Zero coupon bond.
(b) Denotes a restricted security, which is subject to restrictions on resale under federal securities laws or in transactions exempt from registration. At August 31, 2007, the value of this security amounted to $3,484,736, which represents 0.9% of net assets.
| Security | | Acquisition
Date | | Acquisition
Cost | |
OR Health, Housing, Educational &
Cultural Facilities Authority, Goodwill
Industries Lane County, Series 1998 A,
6.650% 11/15/22 | | | 06/17/98 | | | $ | 3,635,000 | | |
(c) The Fund has been informed that each issuer has placed direct obligations of the U.S. Government in an irrevocable trust, solely for the payment of principal and interest.
(d) Variable rate demand notes. These securities are payable upon demand and are secured by letters of credit or other credit support agreements from banks. The interest rates change periodically and the interest rates shown reflect the rates at August 31, 2007.
(e) Cost for federal income tax purposes is $363,769,466.
At August 31, 2007, the composition of the Fund by revenue source is as follows:
| Holdings By Revenue Source (Unaudited) | | % of
Net Assets | |
| Tax-Backed | | | 39.4 | | |
| Other | | | 28.4 | | |
| Utilities | | | 9.3 | | |
| Health Care | | | 8.7 | | |
| Education | | | 6.3 | | |
| Housing | | | 3.1 | | |
| Other Revenue | | | 2.0 | | |
| Transportation | | | 1.3 | | |
| | | | 98.5 | | |
| Investment Company | | | 0.1 | | |
| Short-Term Obligations | | | 0.3 | | |
| Other Assets & Liabilities, Net | | | 1.1 | | |
| | | | 100.0 | | |
| Acronym | | Name | |
| AMBAC | | Ambac Assurance Corp. | |
|
| AMT | | Alternative Minimum Tax | |
|
| FGIC | | Financial Guaranty Insurance Co. | |
|
| FHA | | Federal Housing Administration | |
|
| FSA | | Financial Security Assurance, Inc. | |
|
| IBC | | Insured Bond Certificates | |
|
| LOC | | Letter of Credit | |
|
| MBIA | | MBIA Insurance Corp. | |
|
| SPA | | Stand-by Purchase Agreement | |
|
See Accompanying Notes to Financial Statements.
86
Investment Portfolio – Columbia Conservative High Yield Fund
August 31, 2007
Corporate Fixed-Income Bonds & Notes – 95.8%
| | | Par ($) | | Value ($) | |
| Basic Materials – 7.4% | |
| Chemicals – 3.6% | |
| Agricultural Chemicals – 0.6% | |
| Mosaic Co. | |
| 7.625% 12/01/16 (a) | | | 4,440,000 | | | | 4,551,000 | | |
| | | | 4,551,000 | | |
| Chemicals-Diversified – 2.5% | |
| Huntsman International LLC | |
| 6.875% 11/15/13 (a) | | | 1,975,000 | | | | 2,690,442 | | |
| 7.875% 11/15/14 | | | 3,530,000 | | | | 3,688,850 | | |
| Lyondell Chemical Co. | |
| 6.875% 06/15/17 | | | 2,910,000 | | | | 3,150,075 | | |
| 8.000% 09/15/14 | | | 2,615,000 | | | | 2,843,813 | | |
| 8.250% 09/15/16 | | | 3,740,000 | | | | 4,188,800 | | |
| NOVA Chemicals Corp. | |
| 6.500% 01/15/12 | | | 3,610,000 | | | | 3,357,300 | | |
| | | | 19,919,280 | | |
| Chemicals-Specialty – 0.5% | |
| Chemtura Corp. | |
| 6.875% 06/01/16 | | | 4,600,000 | | | | 4,197,500 | | |
| | | | 4,197,500 | | |
| Chemicals Total | | | 28,667,780 | | |
| Forest Products & Paper – 1.4% | |
| Paper & Related Products – 1.4% | |
| Boise Cascade LLC | |
| 7.125% 10/15/14 | | | 2,465,000 | | | | 2,267,800 | | |
| Cascades, Inc. | |
| 7.250% 02/15/13 | | | 2,635,000 | | | | 2,516,425 | | |
| Domtar, Inc. | |
| 7.125% 08/15/15 | | | 3,495,000 | | | | 3,250,350 | | |
| Georgia-Pacific Corp. | |
| 8.000% 01/15/24 | | | 3,815,000 | | | | 3,586,100 | | |
| | | | 11,620,675 | | |
| Forest Products & Paper Total | | | 11,620,675 | | |
| Iron/Steel – 0.7% | |
| Steel-Producers – 0.7% | |
| Russel Metals, Inc. | |
| 6.375% 03/01/14 | | | 6,410,000 | | | | 6,065,462 | | |
| | | | 6,065,462 | | |
| Iron/Steel Total | | | 6,065,462 | | |
| Metals & Mining – 1.7% | |
| Diversified Minerals – 0.9% | |
| FMG Finance Ltd. | |
| 10.625% 09/01/16 (a) | | | 5,810,000 | | | | 6,652,450 | | |
| | | | 6,652,450 | | |
| | | Par ($) | | Value ($) | |
| Metal-Diversified – 0.8% | |
Freeport-McMoRan
Copper & Gold, Inc. | |
| 8.375% 04/01/17 | | | 6,245,000 | | | | 6,650,925 | | |
| | | | 6,650,925 | | |
| Metals & Mining Total | | | 13,303,375 | | |
| Basic Materials Total | | | 59,657,292 | | |
| Communications – 16.2% | |
| Media – 7.7% | |
| Broadcast Services/Programs – 1.1% | |
Clear Channel
Communications, Inc. | |
| 4.900% 05/15/15 | | | 5,630,000 | | | | 4,166,200 | | |
| Liberty Media LLC | |
| 8.250% 02/01/30 | | | 4,495,000 | | | | 4,360,150 | | |
| | | | 8,526,350 | | |
| Cable TV – 3.8% | |
Charter Communications
Holdings II LLC | |
| 10.250% 09/15/10 | | | 4,570,000 | | | | 4,615,700 | | |
| CSC Holdings, Inc. | |
| 7.625% 04/01/11 | | | 4,485,000 | | | | 4,417,725 | | |
| 7.625% 07/15/18 | | | 1,725,000 | | | | 1,582,688 | | |
| DirecTV Holdings LLC | |
| 6.375% 06/15/15 | | | 5,835,000 | | | | 5,455,725 | | |
| 8.375% 03/15/13 | | | 3,619,000 | | | | 3,736,617 | | |
| EchoStar DBS Corp. | |
| 6.625% 10/01/14 | | | 8,080,000 | | | | 7,817,400 | | |
| 7.000% 10/01/13 | | | 3,000,000 | | | | 2,962,500 | | |
| | | | 30,588,355 | | |
| Multimedia – 1.3% | |
| Lamar Media Corp. | |
| 7.250% 01/01/13 | | | 6,163,000 | | | | 6,132,185 | | |
| Quebecor Media, Inc. | |
| 7.750% 03/15/16 | | | 4,765,000 | | | | 4,532,706 | | |
| | | | 10,664,891 | | |
| Publishing-Periodicals – 1.4% | |
| Dex Media West LLC | |
| 9.875% 08/15/13 | | | 1,460,000 | | | | 1,540,300 | | |
| Idearc, Inc. | |
| 8.000% 11/15/16 | | | 2,880,000 | | | | 2,844,000 | | |
| R.H. Donnelley, Inc. | |
| 10.875% 12/15/12 | | | 6,635,000 | | | | 7,033,100 | | |
| | | | 11,417,400 | | |
| Television – 0.1% | |
| Sinclair Broadcast Group, Inc. | |
| 8.000% 03/15/12 | | | 1,012,000 | | | | 1,022,120 | | |
| | | | 1,022,120 | | |
| Media Total | | | 62,219,116 | | |
See Accompanying Notes to Financial Statements.
87
Columbia Conservative High Yield Fund
August 31, 2007
Corporate Fixed-Income Bonds & Notes (continued)
| | | Par ($) | | Value ($) | |
| Telecommunication Services – 8.5% | |
| Cellular Telecommunications – 1.5% | |
| Nextel Communications, Inc. | |
| 7.375% 08/01/15 | | | 9,295,000 | | | | 9,356,998 | | |
| Rogers Wireless, Inc. | |
| 8.000% 12/15/12 | | | 2,275,000 | | | | 2,398,168 | | |
| | | | 11,755,166 | | |
| Satellite Telecommunications – 0.5% | |
| Intelsat Bermuda Ltd. | |
| 9.250% 06/15/16 | | | 3,760,000 | | | | 3,872,800 | | |
| | | | 3,872,800 | | |
| Telecommunication Equipment – 0.8% | |
| Lucent Technologies, Inc. | |
| 6.450% 03/15/29 | | | 7,325,000 | | | | 6,153,000 | | |
| | | | 6,153,000 | | |
| Telecommunication Services – 0.6% | |
| Embarq Corp. | |
| 7.082% 06/01/16 | | | 1,790,000 | | | | 1,845,979 | | |
| Time Warner Telecom Holdings, Inc. | |
| 9.250% 02/15/14 | | | 3,090,000 | | | | 3,198,150 | | |
| | | | 5,044,129 | | |
| Telephone-Integrated – 5.1% | |
| Cincinnati Bell, Inc. | |
| 7.000% 02/15/15 | | | 3,550,000 | | | | 3,408,000 | | |
| Citizens Communications Co. | |
| 7.875% 01/15/27 | | | 6,675,000 | | | | 6,257,813 | | |
| Qwest Corp. | |
| 7.500% 10/01/14 | | | 1,775,000 | | | | 1,819,375 | | |
| 7.500% 06/15/23 | | | 4,890,000 | | | | 4,804,425 | | |
| 8.875% 03/15/12 | | | 13,495,000 | | | | 14,608,337 | | |
| Windstream Corp. | |
| 7.000% 03/15/19 | | | 5,205,000 | | | | 4,905,713 | | |
| 8.625% 08/01/16 | | | 5,165,000 | | | | 5,397,425 | | |
| | | | 41,201,088 | | |
| Telecommunication Services Total | | | 68,026,183 | | |
| Communications Total | | | 130,245,299 | | |
| Consumer Cyclical – 14.4% | |
| Apparel – 1.0% | |
| Apparel Manufacturers – 1.0% | |
| Levi Strauss & Co. | |
| 9.750% 01/15/15 | | | 3,570,000 | | | | 3,694,950 | | |
| Phillips-Van Heusen Corp. | |
| 7.250% 02/15/11 | | | 3,955,000 | | | | 3,979,719 | | |
| | | | 7,674,669 | | |
| Apparel Total | | | 7,674,669 | | |
| | | Par ($) | | Value ($) | |
| Auto Parts & Equipment – 2.0% | |
| Auto/Truck Parts & Equipment-Original – 1.2% | |
| Accuride Corp. | |
| 8.500% 02/01/15 | | | 3,555,000 | | | | 3,288,375 | | |
| ArvinMeritor, Inc. | |
| 8.125% 09/15/15 | | | 2,585,000 | | | | 2,416,975 | | |
| TRW Automotive, Inc. | |
| 7.000% 03/15/14 (a) | | | 4,090,000 | | | | 3,803,700 | | |
| | | | 9,509,050 | | |
| Auto/Truck Parts & Equipment-Replacement – 0.4% | |
| Commercial Vehicle Group, Inc. | |
| 8.000% 07/01/13 | | | 3,065,000 | | | | 2,858,112 | | |
| | | | 2,858,112 | | |
| Rubber-Tires – 0.4% | |
| Goodyear Tire & Rubber Co. | |
| 8.625% 12/01/11 (a) | | | 1,055,000 | | | | 1,071,458 | | |
| 9.000% 07/01/15 | | | 2,333,000 | | | | 2,414,655 | | |
| | | | 3,486,113 | | |
| Auto Parts & Equipment Total | | | 15,853,275 | | |
| Entertainment – 2.0% | |
| Music – 1.2% | |
| Steinway Musical Instruments, Inc. | |
| 7.000% 03/01/14 (a) | | | 4,115,000 | | | | 3,909,250 | | |
| WMG Acquisition Corp. | |
| 7.375% 04/15/14 | | | 6,010,000 | | | | 5,288,800 | | |
| | | | 9,198,050 | | |
| Racetracks – 0.8% | |
| Speedway Motorsports, Inc. | |
| 6.750% 06/01/13 | | | 6,866,000 | | | | 6,763,010 | | |
| | | | 6,763,010 | | |
| Entertainment Total | | | 15,961,060 | | |
| Home Builders – 1.6% | |
| Building-Residential/Commercial – 1.6% | |
| K. Hovnanian Enterprises, Inc. | |
| 6.000% 01/15/10 | | | 2,100,000 | | | | 1,795,500 | | |
| 6.375% 12/15/14 | | | 2,315,000 | | | | 1,776,763 | | |
| 6.500% 01/15/14 | | | 3,025,000 | | | | 2,351,937 | | |
| KB Home | |
| 5.875% 01/15/15 | | | 8,425,000 | | | | 7,119,125 | | |
| | | | 13,043,325 | | |
| Home Builders Total | | | 13,043,325 | | |
| Home Furnishings – 0.5% | |
| Home Furnishings – 0.5% | |
| Sealy Mattress Co. | |
| 8.250% 06/15/14 | | | 4,315,000 | | | | 4,217,913 | | |
| | | | 4,217,913 | | |
| Home Furnishings Total | | | 4,217,913 | | |
See Accompanying Notes to Financial Statements.
88
Columbia Conservative High Yield Fund
August 31, 2007
Corporate Fixed-Income Bonds & Notes (continued)
| | | Par ($) | | Value ($) | |
| Leisure Time – 0.7% | |
| Cruise Lines – 0.7% | |
| Royal Caribbean Cruises Ltd. | |
| 6.875% 12/01/13 | | | 5,660,000 | | | | 5,524,069 | | |
| | | | 5,524,069 | | |
| Leisure Time Total | | | 5,524,069 | | |
| Lodging – 4.4% | |
| Casino Hotels – 4.4% | |
| Galaxy Entertainment Finance Co., Ltd. | |
| 9.875% 12/15/12 (a) | | | 5,590,000 | | | | 5,673,850 | | |
| Harrah's Operating Co., Inc. | |
| 5.625% 06/01/15 | | | 7,940,000 | | | | 6,093,950 | | |
| Las Vegas Sands Corp. | |
| 6.375% 02/15/15 | | | 5,955,000 | | | | 5,657,250 | | |
| MGM Mirage | |
| 7.500% 06/01/16 | | | 4,470,000 | | | | 4,414,125 | | |
| Mohegan Tribal Gaming Authority | |
| 6.875% 02/15/15 | | | 2,000,000 | | | | 1,920,000 | | |
| Pinnacle Entertainment, Inc. | |
| 7.500% 06/15/15 (a) | | | 3,715,000 | | | | 3,417,800 | | |
| Station Casinos, Inc. | |
| 6.875% 03/01/16 | | | 8,600,000 | | | | 7,202,500 | | |
| Wynn Las Vegas LLC | |
| 6.625% 12/01/14 | | | 1,135,000 | | | | 1,098,112 | | |
| | | | 35,477,587 | | |
| Lodging Total | | | 35,477,587 | | |
| Retail – 1.7% | |
| Retail-Automobiles – 0.6% | |
| AutoNation, Inc. | |
| 7.000% 04/15/14 | | | 1,635,000 | | | | 1,538,944 | | |
| 7.360% 04/15/13 (b) | | | 980,000 | | | | 921,200 | | |
| Group 1 Automotive, Inc. | |
| 8.250% 08/15/13 | | | 2,965,000 | | | | 2,965,000 | | |
| | | | 5,425,144 | | |
| Retail-Convenience Store – 0.5% | |
| Couche-Tard US LP | |
| 7.500% 12/15/13 | | | 4,065,000 | | | | 3,983,700 | | |
| | | | 3,983,700 | | |
| Retail-Propane Distributors – 0.6% | |
| AmeriGas Partners LP | |
| 7.125% 05/20/16 | | | 4,840,000 | | | | 4,646,400 | | |
| | | | 4,646,400 | | |
| Retail Total | | | 14,055,244 | | |
| | | Par ($) | | Value ($) | |
| Textiles – 0.5% | |
| Textile-Products – 0.5% | |
| INVISTA | |
| 9.250% 05/01/12 (a) | | | 3,745,000 | | | | 3,894,800 | | |
| | | | 3,894,800 | | |
| Textiles Total | | | 3,894,800 | | |
| Consumer Cyclical Total | | | 115,701,942 | | |
| Consumer Non-Cyclical – 12.2% | |
| Agriculture – 0.5% | |
| Tobacco – 0.5% | |
| Reynolds American, Inc. | |
| 7.625% 06/01/16 | | | 3,940,000 | | | | 4,126,311 | | |
| | | | 4,126,311 | | |
| Agriculture Total | | | 4,126,311 | | |
| Beverages – 1.4% | |
| Beverages-Non-Alcoholic – 0.8% | |
| Cott Beverages, Inc. | |
| 8.000% 12/15/11 | | | 6,570,000 | | | | 6,504,300 | | |
| | | | 6,504,300 | | |
| Beverages-Wine/Spirits – 0.6% | |
| Constellation Brands, Inc. | |
| 8.125% 01/15/12 | | | 4,985,000 | | | | 4,997,463 | | |
| | | | 4,997,463 | | |
| Beverages Total | | | 11,501,763 | | |
| Biotechnology – 0.5% | |
| Medical-Biomedical/Gene – 0.5% | |
| Bio-Rad Laboratories, Inc. | |
| 7.500% 08/15/13 | | | 3,790,000 | | | | 3,808,950 | | |
| | | | 3,808,950 | | |
| Biotechnology Total | | | 3,808,950 | | |
| Commercial Services – 4.0% | |
| Commercial Services – 0.6% | |
| Iron Mountain, Inc. | |
| 7.750% 01/15/15 | | | 5,045,000 | | | | 4,906,262 | | |
| | | | 4,906,262 | | |
| Funeral Services & Related Items – 0.4% | |
| Service Corp. International | |
| 6.750% 04/01/16 | | | 600,000 | | | | 565,500 | | |
| 7.375% 10/01/14 | | | 2,750,000 | | | | 2,763,750 | | |
| | | | 3,329,250 | | |
| Printing-Commercial – 0.6% | |
| Quebecor World Capital Corp. | |
| 8.750% 03/15/16 (a) | | | 4,820,000 | | | | 4,338,000 | | |
| | | | 4,338,000 | | |
See Accompanying Notes to Financial Statements.
89
Columbia Conservative High Yield Fund
August 31, 2007
Corporate Fixed-Income Bonds & Notes (continued)
| | | Par ($) | | Value ($) | |
| Private Corrections – 0.9% | |
| Corrections Corp. of America | |
| 7.500% 05/01/11 | | | 7,300,000 | | | | 7,336,500 | | |
| | | | 7,336,500 | | |
| Rental Auto/Equipment – 1.5% | |
| Ashtead Capital, Inc. | |
| 9.000% 08/15/16 (a) | | | 4,250,000 | | | | 4,207,500 | | |
| United Rentals North America, Inc. | |
| 7.000% 02/15/14 | | | 7,100,000 | | | | 7,242,000 | | |
| 7.750% 11/15/13 | | | 745,000 | | | | 767,350 | | |
| | | | 12,216,850 | | |
| Commercial Services Total | | | 32,126,862 | | |
| Food – 1.5% | |
| Food-Dairy Products – 0.7% | |
| Dean Foods Co. | |
| 7.000% 06/01/16 | | | 5,930,000 | | | | 5,455,600 | | |
| | | | 5,455,600 | | |
| Food-Meat Products – 0.3% | |
| Smithfield Foods, Inc. | |
| 7.750% 07/01/17 | | | 2,800,000 | | | | 2,814,000 | | |
| | | | 2,814,000 | | |
| Food-Miscellaneous/Diversified – 0.5% | |
| Del Monte Corp. | |
| 6.750% 02/15/15 | | | 3,935,000 | | | | 3,738,250 | | |
| | | | 3,738,250 | | |
| Food Total | | | 12,007,850 | | |
| Healthcare Products – 0.2% | |
| Optical Supplies – 0.2% | |
| Advanced Medical Optics, Inc. | |
| 7.500% 05/01/17 | | | 1,440,000 | | | | 1,314,000 | | |
| | | | 1,314,000 | | |
| Healthcare Products Total | | | 1,314,000 | | |
| Healthcare Services – 1.7% | |
| Medical-Hospitals – 1.7% | |
| HCA, Inc. | |
| 9.250% 11/15/16 (a) | | | 3,850,000 | | | | 3,955,875 | | |
| PIK, | |
| 9.625% 11/15/16 (a) | | | 9,500,000 | | | | 9,820,625 | | |
| | | | 13,776,500 | | |
| Healthcare Services Total | | | 13,776,500 | | |
| | | Par ($) | | Value ($) | |
| Household Products/Wares – 1.0% | |
| Consumer Products-Miscellaneous – 1.0% | |
| American Greetings Corp. | |
| 7.375% 06/01/16 | | | 4,275,000 | | | | 4,039,875 | | |
| Jarden Corp. | |
| 7.500% 05/01/17 | | | 3,875,000 | | | | 3,623,125 | | |
| | | | 7,663,000 | | |
| Household Products/Wares Total | | | 7,663,000 | | |
| Pharmaceuticals – 1.4% | |
| Medical-Drugs – 0.5% | |
| Elan Finance PLC | |
| 8.875% 12/01/13 | | | 4,350,000 | | | | 4,263,000 | | |
| | | | 4,263,000 | | |
| Medical-Generic Drugs – 0.4% | |
| Mylan Laboratories, Inc. | |
| 6.375% 08/15/15 | | | 3,215,000 | | | | 3,215,000 | | |
| | | | 3,215,000 | | |
| Pharmacy Services – 0.5% | |
| Omnicare, Inc. | |
| 6.750% 12/15/13 | | | 4,060,000 | | | | 3,775,800 | | |
| | | | 3,775,800 | | |
| Pharmaceuticals Total | | | 11,253,800 | | |
| Consumer Non-Cyclical Total | | | 97,579,036 | | |
| Energy – 13.7% | |
| Coal – 2.3% | |
| Coal – 2.3% | |
| Arch Western Finance LLC | |
| 6.750% 07/01/13 | | | 7,610,000 | | | | 7,200,962 | | |
| Massey Energy Co. | |
| 6.875% 12/15/13 | | | 4,360,000 | | | | 3,934,900 | | |
| Peabody Energy Corp. | |
| 6.875% 03/15/13 | | | 6,885,000 | | | | 6,867,788 | | |
| | | | 18,003,650 | | |
| Coal Total | | | 18,003,650 | | |
| Oil & Gas – 5.5% | |
| Oil & Gas Drilling – 0.7% | |
| Pride International, Inc. | |
| 7.375% 07/15/14 | | | 5,635,000 | | | | 5,691,350 | | |
| | | | 5,691,350 | | |
| Oil Companies-Exploration & Production – 4.2% | |
| Chesapeake Energy Corp. | |
| 6.375% 06/15/15 | | | 10,780,000 | | | | 10,308,375 | | |
| 6.875% 11/15/20 | | | 4,450,000 | | | | 4,272,000 | | |
| Compton Petroleum Corp. | |
| 7.625% 12/01/13 | | | 3,850,000 | | | | 3,657,500 | | |
See Accompanying Notes to Financial Statements.
90
Columbia Conservative High Yield Fund
August 31, 2007
Corporate Fixed-Income Bonds & Notes (continued)
| | | Par ($) | | Value ($) | |
| Newfield Exploration Co. | |
| 6.625% 09/01/14 | | | 8,095,000 | | | | 7,781,319 | | |
| OPTI Canada, Inc. | |
| 8.250% 12/15/14 (a) | | | 3,295,000 | | | | 3,336,187 | | |
| Quicksilver Resources, Inc. | |
| 7.125% 04/01/16 | | | 4,480,000 | | | | 4,278,400 | | |
| | | | 33,633,781 | | |
| Oil Refining & Marketing – 0.6% | |
| Petroplus Finance Ltd. | |
| 6.750% 05/01/14 (a) | | | 570,000 | | | | 530,100 | | |
| 7.000% 05/01/17 (a) | | | 570,000 | | | | 524,400 | | |
| Tesoro Corp. | |
| 6.625% 11/01/15 | | | 4,080,000 | | | | 4,023,900 | | |
| | | | 5,078,400 | | |
| Oil & Gas Total | | | 44,403,531 | | |
| Oil & Gas Services – 0.8% | |
| Oil Field Machinery & Equipment – 0.8% | |
| Grant Prideco, Inc. | |
| 6.125% 08/15/15 | | | 6,485,000 | | | | 6,193,175 | | |
| | | | 6,193,175 | | |
| Oil & Gas Services Total | | | 6,193,175 | | |
| Pipelines – 5.1% | |
| Pipelines – 5.1% | |
| Atlas Pipeline Partners LP | |
| 8.125% 12/15/15 | | | 3,700,000 | | | | 3,672,250 | | |
| Colorado Interstate Gas Co. | |
| 6.800% 11/15/15 | | | 6,285,000 | | | | 6,485,762 | | |
| El Paso Corp. | |
| 6.875% 06/15/14 | | | 1,750,000 | | | | 1,765,743 | | |
| El Paso Performance-Linked Trust | |
| 7.750% 07/15/11 (a) | | | 6,535,000 | | | | 6,695,375 | | |
| MarkWest Energy Partners LP | |
| 6.875% 11/01/14 | | | 8,600,000 | | | | 8,041,000 | | |
| Williams Companies, Inc. | |
| 6.375% 10/01/10 (a) | | | 3,270,000 | | | | 3,278,175 | | |
| 7.750% 06/15/31 | | | 1,755,000 | | | | 1,820,813 | | |
| 8.125% 03/15/12 | | | 8,615,000 | | | | 9,239,587 | | |
| | | | 40,998,705 | | |
| Pipelines Total | | | 40,998,705 | | |
| Energy Total | | | 109,599,061 | | |
| Financials – 6.1% | |
| Diversified Financial Services – 3.7% | |
| Finance-Auto Loans – 2.6% | |
| AmeriCredit Corp. | |
| 8.500% 07/01/15 (a) | | | 1,900,000 | | | | 1,624,500 | | |
| | | Par ($) | | Value ($) | |
| General Motors Acceptance Corp. | |
| 8.000% 11/01/31 | | | 21,045,000 | | | | 18,906,070 | | |
| | | | 20,530,570 | | |
| Finance-Investment Banker/Broker – 1.1% | |
| E*Trade Financial Corp. | |
| 7.375% 09/15/13 | | | 6,875,000 | | | | 6,118,750 | | |
| LaBranche & Co., Inc. | |
| 11.000% 05/15/12 | | | 3,050,000 | | | | 3,019,500 | | |
| | | | 9,138,250 | | |
| Diversified Financial Services Total | | | 29,668,820 | | |
| Insurance – 0.5% | |
| Property/Casualty Insurance – 0.5% | |
| Crum & Forster Holdings Corp. | |
| 7.750% 05/01/17 | | | 4,145,000 | | | | 3,917,025 | | |
| | | | 3,917,025 | | |
| Insurance Total | | | 3,917,025 | | |
| Real Estate Investment Trusts (REITs) – 1.9% | |
| REITS-Hotels – 1.0% | |
| Host Marriott LP | |
| 6.375% 03/15/15 | | | 8,775,000 | | | | 8,511,750 | | |
| | | | 8,511,750 | | |
| REITS-Regional Malls – 0.9% | |
| Rouse Co. LP/TRC Co-Issuer, Inc., | |
| 6.750% 05/01/13 (a) | | | 7,155,000 | | | | 7,083,450 | | |
| | | | 7,083,450 | | |
Real Estate Investment
Trusts (REITs) Total | | | 15,595,200 | | |
| Financials Total | | | 49,181,045 | | |
| Industrials – 15.8% | |
| Aerospace & Defense – 2.2% | |
| Aerospace/Defense-Equipment – 1.4% | |
| DRS Technologies, Inc. | |
| 6.625% 02/01/16 | | | 4,590,000 | | | | 4,475,250 | | |
| Sequa Corp. | |
| 9.000% 08/01/09 | | | 6,227,000 | | | | 6,444,945 | | |
| | | | 10,920,195 | | |
| Electronics-Military – 0.8% | |
| L-3 Communications Corp. | |
| 6.375% 10/15/15 | | | 2,780,000 | | | | 2,689,650 | | |
| 7.625% 06/15/12 | | | 3,995,000 | | | | 4,064,913 | | |
| | | | 6,754,563 | | |
| Aerospace & Defense Total | | | 17,674,758 | | |
See Accompanying Notes to Financial Statements.
91
Columbia Conservative High Yield Fund
August 31, 2007
Corporate Fixed-Income Bonds & Notes (continued)
| | | Par ($) | | Value ($) | |
| Electrical Components & Equipment – 0.8% | |
| Wire & Cable Products – 0.8% | |
| Belden CDT, Inc. | |
| 7.000% 03/15/17 (a) | | | 3,855,000 | | | | 3,739,350 | | |
| General Cable Corp. | |
| 7.125% 04/01/17 | | | 1,535,000 | | | | 1,488,950 | | |
| 7.735% 04/01/15 (b) | | | 1,535,000 | | | | 1,488,950 | | |
| | | | 6,717,250 | | |
| Electrical Components & Equipment Total | | | 6,717,250 | | |
| Electronics – 0.6% | |
| Electronic Components-Miscellaneous – 0.6% | |
| Flextronics International Ltd. | |
| 6.250% 11/15/14 | | | 5,005,000 | | | | 4,604,600 | | |
| | | | 4,604,600 | | |
| Electronics Total | | | 4,604,600 | | |
| Environmental Control – 1.7% | |
| Non-Hazardous Waste Disposal – 1.7% | |
| Allied Waste North America, Inc. | |
| 7.125% 05/15/16 | | | 13,385,000 | | | | 13,318,075 | | |
| | | | 13,318,075 | | |
| Environmental Control Total | | | 13,318,075 | | |
| Machinery-Construction & Mining – 0.4% | |
| Machinery-Construction & Mining – 0.4% | |
| Terex Corp. | |
| 7.375% 01/15/14 | | | 2,975,000 | | | | 2,975,000 | | |
| | | | 2,975,000 | | |
| Machinery-Construction & Mining Total | | | 2,975,000 | | |
| Machinery-Diversified – 1.5% | |
| Machinery-General Industry – 1.5% | |
| Manitowoc Co., Inc. | |
| 7.125% 11/01/13 | | | 7,215,000 | | | | 7,016,588 | | |
| Westinghouse Air Brake Technologies Corp. | |
| 6.875% 07/31/13 | | | 5,565,000 | | | | 5,425,875 | | |
| | | | 12,442,463 | | |
| Machinery-Diversified Total | | | 12,442,463 | | |
| Miscellaneous Manufacturing – 1.9% | |
| Diversified Manufacturing Operators – 1.5% | |
| Bombardier, Inc. | |
| 6.300% 05/01/14 (a) | | | 6,825,000 | | | | 6,517,875 | | |
| Trinity Industries, Inc. | |
| 6.500% 03/15/14 | | | 6,170,000 | | | | 5,830,650 | | |
| | | | 12,348,525 | | |
| | | Par ($) | | Value ($) | |
| Miscellaneous Manufacturing – 0.4% | |
| American Railcar Industries, Inc. | |
| 7.500% 03/01/14 | | | 2,905,000 | | | | 2,817,850 | | |
| | | | 2,817,850 | | |
| Miscellaneous Manufacturing Total | | | 15,166,375 | | |
| Packaging & Containers – 3.4% | |
| Containers-Metal/Glass – 3.4% | |
| Ball Corp. | |
| 6.875% 12/15/12 | | | 3,742,000 | | | | 3,732,645 | | |
| Crown Americas LLC & Crown Americas Capital Corp. | |
| 7.750% 11/15/15 | | | 4,715,000 | | | | 4,762,150 | | |
| Owens-Brockway Glass Container, Inc. | |
| 6.750% 12/01/14 | | | 4,550,000 | | | | 4,390,750 | | |
| Owens-Illinois, Inc. | |
| 7.500% 05/15/10 | | | 9,405,000 | | | | 9,357,975 | | |
| Silgan Holdings, Inc. | |
| 6.750% 11/15/13 | | | 5,050,000 | | | | 4,923,750 | | |
| | | | 27,167,270 | | |
| Packaging & Containers Total | | | 27,167,270 | | |
| Transportation – 3.3% | |
| Transportation-Marine – 2.6% | |
| Overseas Shipholding Group | |
| 8.250% 03/15/13 | | | 8,320,000 | | | | 8,538,400 | | |
| Stena AB | |
| 7.500% 11/01/13 | | | 5,930,000 | | | | 5,870,700 | | |
| Teekay Corp. | |
| 8.875% 07/15/11 | | | 6,296,000 | | | | 6,484,880 | | |
| | | | 20,893,980 | | |
| Transportation-Services – 0.7% | |
| Bristow Group, Inc. | |
| 6.125% 06/15/13 | | | 2,305,000 | | | | 2,195,512 | | |
| 7.500% 09/15/17 (a) | | | 3,500,000 | | | | 3,482,500 | | |
| | | | 5,678,012 | | |
| Transportation Total | | | 26,571,992 | | |
| Industrials Total | | | 126,637,783 | | |
| Private Placement – 0.2% | |
| Private Placement – 0.2% | |
| Penton Media | |
| 7.605% 02/01/13 | | | 1,935,484 | | | | 1,829,032 | | |
| 7.610% 02/01/14 | | | 59,516 | | | | 56,243 | | |
| Private Placement Total | | | 1,885,275 | | |
| Private Placement Total | | | 1,885,275 | | |
See Accompanying Notes to Financial Statements.
92
Columbia Conservative High Yield Fund
August 31, 2007
Corporate Fixed-Income Bonds & Notes (continued)
| | | Par ($) | | Value ($) | |
| Technology – 1.7% | |
| Semiconductors – 1.7% | |
| Electronic Components-Miscellaneous – 0.6% | |
| NXP BV/NXP Funding LLC | |
| 7.875% 10/15/14 | | | 4,835,000 | | | | 4,363,588 | | |
| | | | 4,363,588 | | |
| Electronic Components-Semiconductors – 1.1% | |
| Advanced Micro Devices, Inc. | |
| 7.750% 11/01/12 | | | 1,410,000 | | | | 1,233,750 | | |
| Freescale Semiconductor, Inc. | |
| 10.125% 12/15/16 | | | 4,345,000 | | | | 3,780,150 | | |
| PIK, | |
| 9.125% 12/15/14 | | | 4,620,000 | | | | 4,134,900 | | |
| | | | 9,148,800 | | |
| Semiconductors Total | | | 13,512,388 | | |
| Technology Total | | | 13,512,388 | | |
| Utilities – 8.1% | |
| Electric – 8.1% | |
| Electric-Generation – 3.9% | |
| AES Corp. | |
| 7.750% 03/01/14 | | | 14,750,000 | | | | 14,602,500 | | |
| Edison Mission Energy | |
| 7.000% 05/15/17 (a) | | | 12,040,000 | | | | 11,377,800 | | |
| Intergen NV | |
| 9.000% 06/30/17 (a) | | | 5,400,000 | | | | 5,481,000 | | |
| | | | 31,461,300 | | |
| Electric-Integrated – 1.1% | |
| CMS Energy Corp. | |
| 6.875% 12/15/15 | | | 1,890,000 | | | | 1,877,993 | | |
| 8.500% 04/15/11 | | | 1,645,000 | | | | 1,751,195 | | |
| Mirant Mid Atlantic LLC | |
| 8.625% 06/30/12 | | | 810,670 | | | | 845,123 | | |
| Nevada Power Co. | |
| 6.500% 04/15/12 | | | 3,655,000 | | | | 3,777,888 | | |
| | | | 8,252,199 | | |
| Independent Power Producer – 3.1% | |
| Dynegy Holdings, Inc. | |
| 7.125% 05/15/18 | | | 4,175,000 | | | | 3,715,750 | | |
| 7.750% 06/01/19 (a) | | | 1,805,000 | | | | 1,669,625 | | |
| Mirant North America LLC | |
| 7.375% 12/31/13 | | | 6,510,000 | | | | 6,477,450 | | |
| NRG Energy, Inc. | |
| 7.250% 02/01/14 | | | 2,545,000 | | | | 2,519,550 | | |
| 7.375% 02/01/16 | | | 2,750,000 | | | | 2,715,625 | | |
| 7.375% 01/15/17 | | | 1,735,000 | | | | 1,704,638 | | |
| | | Par ($) | | Value ($) | |
| NSG Holdings LLC/NSG Holdings, Inc. | |
| 7.750% 12/15/25 (a) | | | 4,495,000 | | | | 4,365,769 | | |
| Reliant Energy, Inc. | |
| 7.875% 06/15/17 | | | 1,745,000 | | | | 1,705,737 | | |
| | | | 24,874,144 | | |
| Electric Total | | | 64,587,643 | | |
| Utilities Total | | | 64,587,643 | | |
Total Corporate Fixed-Income
Bonds & Notes
(Cost of $795,581,588) | | | 768,586,764 | | |
Municipal Bond – 0.4%
| Virginia – 0.4% | |
| VA Tobacco Settlement Financing Corp. | |
Series 2007 A1,
6.706% 06/01/46 | | | 3,660,000 | | | | 3,313,618 | | |
| Virginia Total | | | 3,313,618 | | |
Total Municipal Bond
(Cost of $3,659,635) | | | 3,313,618 | | |
Short-Term Obligation – 2.4%
Repurchase agreement with
Fixed Income Clearing Corp.,
dated 08/31/07, due 09/04/07
at 5.110%, collateralized by a
U.S. Government Agency Bond
maturing 06/27/17, market value
of $19,256,188 (repurchase
proceeds $18,885,717) | | | 18,875,000 | | | | 18,875,000 | | |
Total Short-Term Obligation
(Cost of $18,875,000) | | | 18,875,000 | | |
Total Investments – 98.6%
(Cost of $818,116,223)(c) | | | 790,775,382 | | |
| Other Assets & Liabilities, Net – 1.4% | | | 11,412,592 | | |
| Net Assets – 100.0% | | | 802,187,974 | | |
See Accompanying Notes to Financial Statements.
93
Columbia Conservative High Yield Fund
August 31, 2007
Notes to Investment Portfolio:
(a) Security exempt from registration pursuant to Rule 144A under the Securities Act of 1933. These securities may be resold in transactions exempt from registration, normally to qualified institutional buyers. At August 31, 2007, these securities, which are not illiquid, amounted to $117,692,856, which represents 14.7% of net assets.
(b) The interest rate shown on floating rate or variable rate securities reflects the rate at August 31, 2007.
(c) Cost for federal income tax purposes is $820,902,680.
At August 31, 2007, the asset allocation of the Fund is as follows:
| Asset Allocation (Unaudited) | | % of
Net Assets | |
| Communications | | | 16.2 | | |
| Industrials | | | 15.8 | | |
| Consumer Cyclical | | | 14.4 | | |
| Energy | | | 13.7 | | |
| Consumer Non-Cyclical | | | 12.2 | | |
| Utilities | | | 8.1 | | |
| Basic Materials | | | 7.4 | | |
| Financials | | | 6.1 | | |
| Technology | | | 1.7 | | |
| Municipal Bond | | | 0.4 | | |
| Private Placement | | | 0.2 | | |
| | | | 96.2 | | |
| Short-Term Obligation | | | 2.4 | | |
| Other Assets & Liabilities, Net | | | 1.4 | | |
| | | | 100.0 | | |
At August 31, 2007, the Fund had entered into the following forward currency exchange contracts:
Forward
Currency
Contracts to
Sell | | Value | | Aggregate
Face Value | | Settlement
Date | | Unrealized
Depreciation | |
| EUR | | | | $ | 2,649,166 | | | $ | 2,692,903 | | | | 09/20/07 | | | $ | (43,737 | ) | |
| Acronym | | Name | |
| EUR | | Euro | |
|
| PIK | | Payment-In-Kind | |
|
See Accompanying Notes to Financial Statements.
94
This page intentionally left blank.
Statements of Assets and Liabilities – Columbia Funds
August 31, 2007
| | | ($) | | ($) | | ($) | | ($) | | ($) | |
| | | International
Stock Fund | | Mid Cap
Growth Fund | | Small Cap
Growth Fund I | | Real Estate
Equity Fund | | Technology Fund | |
| Assets | |
| Investments, at identified cost | | | 1,100,869,743 | | | | 1,318,814,116 | | | | 205,489,614 | | | | 288,716,913 | | | | 247,369,872 | | |
| Investments, at value | | | 1,365,437,547 | | | | 1,580,551,424 | | | | 246,526,695 | | | | 424,486,103 | | | | 295,175,949 | | |
| Cash | | | 4,507 | | | | 937 | | | | 256 | | | | 727 | | | | 15,796 | | |
Foreign currency (cost of $1,545,012, $8,352, $—, $—, $—, $—,
$—, $— and $—, respectively) | | | 1,543,091 | | | | 8,449 | | | | — | | | | — | | | | — | | |
| Unrealized appreciation on foreign forward currency contracts | | | 4,298,364 | | | | — | | | | — | | | | — | | | | — | | |
| Receivable for: | |
| Investments sold | | | 3,967,312 | | | | 50,666,120 | | | | 3,763,004 | | | | 4,155,720 | | | | 10,990,686 | | |
| Capital stock sold | | | 691,104 | | | | 5,263,009 | | | | 223,845 | | | | 138,045 | | | | 3,712,828 | | |
| Interest | | | 1,645 | | | | 3,337 | | | | 2,010 | | | | 1,884 | | | | 1,551 | | |
| Dividends | | | 2,343,109 | | | | 648,733 | | | | 38,896 | | | | 264,233 | | | | 196,574 | | |
| Foreign tax reclaim | | | 940,818 | | | | — | | | | — | | | | — | | | | — | | |
| Expense reimbursement due from Investment Advisor | | | — | | | | — | | | | — | | | | — | | | | — | | |
| Deferred Trustees' compensation plan | | | 116,663 | | | | 55,741 | | | | 17,412 | | | | 33,381 | | | | 11,979 | | |
| Other assets | | | — | | | | 400 | | | | — | | | | ��� | | | | — | | |
| Total Assets | | | 1,379,344,160 | | | | 1,637,198,150 | | | | 250,572,118 | | | | 429,080,093 | | | | 310,105,363 | | |
| Liabilities | |
| Unrealized depreciation on foreign forward currency contracts | | | 5,465,320 | | | | — | | | | — | | | | — | | | | — | | |
Written options at value (premium of $63,381, $—, $—, $—, $—,
$—, $—, $— and $—, respectively) | | | 26,800 | | | | — | | | | — | | | | — | | | | — | | |
| Payable for: | |
| Investments purchased | | | 3,983,535 | | | | 50,072,991 | | | | 7,228,530 | | | | — | | | | 15,610,979 | | |
| Investments purchased on a delayed delivery basis | | | — | | | | — | | | | — | | | | — | | | | — | | |
| Capital stock redeemed | | | 745,231 | | | | 25,189,879 | | | | 116,769 | | | | 2,107,006 | | | | 203,410 | | |
| Distributions | | | — | | | | — | | | | — | | | | — | | | | — | | |
| Investment advisory fee | | | 945,333 | | | | 1,001,248 | | | | 174,739 | | | | 269,179 | | | | 199,150 | | |
| Administration fee | | | — | | | | — | | | | — | | | | — | | | | — | | |
| Transfer agent fee | | | 186,783 | | | | 239,719 | | | | 68,098 | | | | 152,465 | | | | 66,770 | | |
| Pricing and bookkeeping fees | | | 16,542 | | | | 14,755 | | | | 9,550 | | | | 11,808 | | | | 9,039 | | |
| Merger costs | | | — | | | | 52,424 | | | | — | | | | — | | | | — | | |
| Trustees' fees | | | 205 | | | | 76,504 | | | | 207 | | | | 257 | | | | 1,045 | | |
| Audit fee | | | 36,700 | | | | 36,500 | | | | 34,600 | | | | 28,200 | | | | 32,950 | | |
| Service and distribution fees | | | 113,194 | | | | 40,943 | | | | 6,346 | | | | 21,544 | | | | 56,749 | | |
| Custody fee | | | 138,636 | | | | 9,299 | | | | 3,300 | | | | 5,851 | | | | 5,219 | | |
| Chief compliance officer expenses | | | 183 | | | | 189 | | | | 105 | | | | 131 | | | | — | | |
| Deferred Trustees' compensation plan | | | 116,663 | | | | 55,741 | | | | 17,412 | | | | 33,381 | | | | 11,979 | | |
| Other liabilities | | | 138,467 | | | | 188,579 | | | | 38,013 | | | | 67,749 | | | | 42,900 | | |
| Total Liabilities | | | 11,913,592 | | | | 76,978,771 | | | | 7,697,669 | | | | 2,697,571 | | | | 16,240,190 | | |
| Net Assets | | | 1,367,430,568 | | | | 1,560,219,379 | | | | 242,874,449 | | | | 426,382,522 | | | | 293,865,173 | | |
| Net Assets Consist of | | | | | | | | | | | | | | | | | | | | | |
| Paid-in capital | | | 1,006,825,242 | | | | 1,135,787,449 | | | | 176,786,443 | | | | 195,290,778 | | | | 234,787,878 | | |
| Undistributed (Overdistributed) net investment income | | | 26,558,663 | | | | (42,985 | ) | | | — | | | | (24,881 | ) | | | — | | |
| Accumulated net investment loss | | | — | | | | — | | | | (17,916 | ) | | | — | | | | (11,776 | ) | |
| Accumulated net realized gain (loss) | | | 70,565,730 | | | | 162,737,510 | | | | 25,068,510 | | | | 95,347,435 | | | | 11,282,994 | | |
| Unrealized appreciation (depreciation) on: | |
| Investments | | | 264,567,804 | | | | 261,737,308 | | | | 41,037,081 | | | | 135,769,190 | | | | 47,806,077 | | |
| Foreign currency translations | | | (1,123,452 | ) | | | 97 | | | | 331 | | | | — | | | | — | | |
| Written options | | | 36,581 | | | | — | | | | — | | | | — | | | | — | | |
| Net Assets | | | 1,367,430,568 | | | | 1,560,219,379 | | | | 242,874,449 | | | | 426,382,522 | | | | 293,865,173 | | |
See Accompanying Notes to Financial Statements.
96
| | | ($) | | ($) | | ($) | | ($) | |
| | | Strategic
Investor Fund | | Balanced Fund | | Oregon
Intermediate
Municipal
Bond Fund | | Conservative
High Yield Fund | |
| Assets | |
| Investments, at identified cost | | | 1,016,372,487 | | | | 192,976,464 | | | | 363,939,155 | | | | 818,116,223 | | |
| Investments, at value | | | 1,212,884,967 | | | | 212,535,250 | | | | 371,737,937 | | | | 790,775,382 | | |
| Cash | | | 189 | | | | 167 | | | | 29,226 | | | | 968 | | |
Foreign currency (cost of $1,545,012, $8,352, $—, $—, $—, $—,
$—, $— and $—, respectively) | | | — | | | | — | | | | — | | | | — | | |
| Unrealized appreciation on foreign forward currency contracts | | | — | | | | — | | | | — | | | | — | | |
| Receivable for: | |
| Investments sold | | | 19,076,672 | | | | 2,396,834 | | | | — | | | | — | | |
| Capital stock sold | | | 282,249 | | | | 23,402 | | | | 195,445 | | | | 372,624 | | |
| Interest | | | 1,340 | | | | 612,668 | | | | 4,489,413 | | | | 16,458,240 | | |
| Dividends | | | 1,518,635 | | | | 142,922 | | | | — | | | | — | | |
| Foreign tax reclaim | | | 37,429 | | | | — | | | | — | | | | — | | |
| Expense reimbursement due from Investment Advisor | | | 105,393 | | | | — | | | | — | | | | — | | |
| Deferred Trustees' compensation plan | | | 77,839 | | | | 19,051 | | | | 22,398 | | | | 54,861 | | |
| Other assets | | | 35,681 | | | | — | | | | — | | | | — | | |
| Total Assets | | | 1,234,020,394 | | | | 215,730,294 | | | | 376,474,419 | | | | 807,662,075 | | |
| Liabilities | |
| Unrealized depreciation on foreign forward currency contracts | | | — | | | | — | | | | — | | | | 43,737 | | |
Written options at value (premium of $63,381, $—, $—, $—, $—,
$—, $—, $— and $—, respectively) | | | — | | | | — | | | | — | | | | — | | |
| Payable for: | |
| Investments purchased | | | 17,770,655 | | | | 3,057,681 | | | | — | | | | — | | |
| Investments purchased on a delayed delivery basis | | | — | | | | 300,756 | | | | — | | | | — | | |
| Capital stock redeemed | | | 487,586 | | | | 84,067 | | | | 85,758 | | | | 1,809,968 | | |
| Distributions | | | — | | | | — | | | | 335,158 | | | | 2,687,219 | | |
| Investment advisory fee | | | 570,084 | | | | 90,026 | | | | 159,547 | | | | 408,538 | | |
| Administration fee | | | 147,820 | | | | — | | | | — | | | | — | | |
| Transfer agent fee | | | 315,238 | | | | 38,012 | | | | 34,374 | | | | 207,359 | | |
| Pricing and bookkeeping fees | | | 14,955 | | | | 11,040 | | | | 16,451 | | | | 16,462 | | |
| Merger costs | | | — | | | | — | | | | — | | | | — | | |
| Trustees' fees | | | 210 | | | | — | | | | 207 | | | | 3,066 | | |
| Audit fee | | | 33,900 | | | | 48,850 | | | | 38,700 | | | | 50,100 | | |
| Service and distribution fees | | | 135,455 | | | | 9,440 | | | | 2,505 | | | | 96,627 | | |
| Custody fee | | | 13,801 | | | | 3,593 | | | | 2,790 | | | | 3,589 | | |
| Chief compliance officer expenses | | | 176 | | | | — | | | | 114 | | | | 27 | | |
| Deferred Trustees' compensation plan | | | 77,839 | | | | 19,051 | | | | 22,398 | | | | 54,861 | | |
| Other liabilities | | | 919,819 | | | | 29,951 | | | | 26,826 | | | | 92,548 | | |
| Total Liabilities | | | 20,487,538 | | | | 3,692,467 | | | | 724,828 | | | | 5,474,101 | | |
| Net Assets | | | 1,213,532,856 | | | | 212,037,827 | | | | 375,749,591 | | | | 802,187,974 | | |
| Net Assets Consist of | | | | | | | | | | | | | | | | | |
| Paid-in capital | | | 919,338,632 | | | | 191,102,475 | | | | 367,884,692 | | | | 868,823,509 | | |
| Undistributed (Overdistributed) net investment income | | | 3,307,872 | | | | 1,003,266 | | | | 138,316 | | | | (2,644,269 | ) | |
| Accumulated net investment loss | | | — | | | | — | | | | — | | | | — | | |
| Accumulated net realized gain (loss) | | | 94,370,987 | | | | 373,300 | | | | (72,199 | ) | | | (36,606,930 | ) | |
| Unrealized appreciation (depreciation) on: | |
| Investments | | | 196,512,480 | | | | 19,558,786 | | | | 7,798,782 | | | | (27,340,841 | ) | |
| Foreign currency translations | | | 2,885 | | | | — | | | | — | | | | (43,495 | ) | |
| Written options | | | — | | | | — | | | | — | | | | — | | |
| Net Assets | | | 1,213,532,856 | | | | 212,037,827 | | | | 375,749,591 | | | | 802,187,974 | | |
See Accompanying Notes to Financial Statements.
97
Statements of Assets and Liabilities – Columbia Funds, August 31, 2007 (continued)
| | | International
Stock Fund | | Mid Cap
Growth Fund | | Small Cap
Growth Fund I | | Real Estate
Equity Fund | | Technology Fund | |
| Class A | |
| Net assets | | $ | 297,149,173 | | | $ | 49,614,199 | | | $ | 18,430,402 | | | $ | 31,069,156 | | | $ | 109,540,709 | | |
| Shares outstanding | | | 14,912,386 | | | | 1,803,475 | | | | 581,657 | | | | 1,499,196 | | | | 9,426,386 | | |
| Net asset value per share (a)(b) | | $ | 19.93 | | | $ | 27.51 | | | $ | 31.69 | | | $ | 20.72 | | | $ | 11.62 | | |
| Maximum sales charge | | | 5.75 | % | | | 5.75 | % | | | 5.75 | % | | | 5.75 | % | | | 5.75 | % | |
| Maximum offering price per share (c) | | $ | 21.15 | | | $ | 29.19 | | | $ | 33.62 | | | $ | 21.98 | | | $ | 12.33 | | |
| Class B | |
| Net assets | | $ | 29,924,932 | | | $ | 19,471,620 | | | $ | 1,253,812 | | | $ | 9,663,030 | | | $ | 10,579,584 | | |
| Shares outstanding | | | 1,542,446 | | | | 735,482 | | | | 40,115 | | | | 465,571 | | | | 940,817 | | |
| Net asset value and offering price per share (a)(b) | | $ | 19.40 | | | $ | 26.47 | | | $ | 31.26 | | | $ | 20.76 | | | $ | 11.25 | | |
| Class C | |
| Net assets | | $ | 29,144,374 | | | $ | 8,236,565 | | | $ | 2,303,106 | | | $ | 8,262,575 | | | $ | 36,324,727 | | |
| Shares outstanding | | | 1,495,663 | | | | 310,454 | | | | 73,698 | | | | 398,682 | | | | 3,222,828 | | |
| Net asset value and offering price per share (a)(b) | | $ | 19.49 | | | $ | 26.53 | | | $ | 31.25 | | | $ | 20.72 | | | $ | 11.27 | | |
| Class R | |
| Net assets | | | — | | | $ | 908,386 | | | | — | | | | — | | | | — | | |
| Shares outstanding | | | — | | | | 33,159 | | | | — | | | | — | | | | — | | |
| Net asset value and offering price per share | | | — | | | $ | 27.39 | | | | — | | | | — | | | | — | | |
| Class T | |
| Net assets | | | — | | | $ | 29,281,797 | | | | — | | | | — | | | | — | | |
| Shares outstanding | | | — | | | | 1,063,555 | | | | — | | | | — | | | | — | | |
| Net asset value per share (a) | | | — | | | $ | 27.53 | | | | — | | | | — | | | | — | | |
| Maximum sales charge | | | — | | | | 5.75 | % | | | — | | | | — | | | | — | | |
| Maximum offering price per share (c) | | | — | | | $ | 29.21 | | | | — | | | | — | | | | — | | |
| Class Z | |
| Net assets | | $ | 1,011,212,089 | | | $ | 1,452,706,812 | | | $ | 220,887,129 | | | $ | 377,387,761 | | | $ | 137,420,153 | | |
| Shares outstanding | | | 50,332,750 | | | | 52,006,224 | | | | 6,933,981 | | | | 18,193,920 | | | | 11,670,445 | | |
| Net asset value and offering price per share (b) | | $ | 20.09 | | | $ | 27.93 | | | $ | 31.86 | | | $ | 20.74 | | | $ | 11.78 | | |
(a) Redemption price per share is equal to net asset value less any applicable contingent deferred sales charge.
(b) Redemption price per share is equal to net asset value less any applicable redemption fees.
(c) On sales of $50,000 or more the offering price is reduced.
(d) Net asset value rounds to $20.97 per share due to fractional shares outstanding.
See Accompanying Notes to Financial Statements.
98
| | | Strategic
Investor Fund | | Balanced Fund | | Oregon
Intermediate
Municipal
Bond Fund | | Conservative
High Yield Fund | |
| Class A | |
| Net assets | | $ | 255,743,231 | | | $ | 6,582,146 | | | $ | 5,519,378 | | | $ | 103,769,376 | | |
| Shares outstanding | | | 11,907,006 | | | | 265,727 | | | | 459,244 | | | | 12,772,653 | | |
| Net asset value per share (a)(b) | | $ | 21.48 | | | $ | 24.77 | | | $ | 12.02 | | | $ | 8.12 | | |
| Maximum sales charge | | | 5.75 | % | | | 5.75 | % | | | 3.25 | % | | | 4.75 | % | |
| Maximum offering price per share (c) | | $ | 22.79 | | | $ | 26.28 | | | $ | 12.42 | | | $ | 8.52 | | |
| Class B | |
| Net assets | | $ | 53,965,472 | | | $ | 6,954,537 | | | $ | 841,776 | | | $ | 50,577,328 | | |
| Shares outstanding | | | 2,574,986 | | | | 281,274 | | | | 70,040 | | | | 6,225,441 | | |
| Net asset value and offering price per share (a)(b) | | $ | 20.96 | | | $ | 24.73 | | | $ | 12.02 | | | $ | 8.12 | | |
| Class C | |
| Net assets | | $ | 44,682,039 | | | $ | 1,886,615 | | | $ | 1,096,714 | | | $ | 33,673,131 | | |
| Shares outstanding | | | 2,131,204 | | | | 76,291 | | | | 91,251 | | | | 4,144,740 | | |
| Net asset value and offering price per share (a)(b) | | $ | 20.96 | (d) | | $ | 24.73 | | | $ | 12.02 | | | $ | 8.12 | | |
| Class R | |
| Net assets | | | — | | | | — | | | | — | | | | — | | |
| Shares outstanding | | | — | | | | — | | | | — | | | | — | | |
| Net asset value and offering price per share | | | — | | | | — | | | | — | | | | — | | |
| Class T | |
| Net assets | | | — | | | | — | | | | — | | | | — | | |
| Shares outstanding | | | — | | | | — | | | | — | | | | — | | |
| Net asset value per share (a) | | | — | | | | — | | | | — | | | | — | | |
| Maximum sales charge | | | — | | | | — | | | | — | | | | — | | |
| Maximum offering price per share (c) | | | — | | | | — | | | | — | | | | — | | |
| Class Z | |
| Net assets | | $ | 859,142,114 | | | $ | 196,614,529 | | | $ | 368,291,723 | | | $ | 614,168,139 | | |
| Shares outstanding | | | 39,904,009 | | | | 7,942,591 | | | | 30,643,935 | | | | 75,598,182 | | |
| Net asset value and offering price per share (b) | | $ | 21.53 | | | $ | 24.75 | | | $ | 12.02 | | | $ | 8.12 | | |
See Accompanying Notes to Financial Statements.
99
Statements of Operations – Columbia Funds
For the Year Ended August 31, 2007
| | | ($) | | ($) | | ($) | | ($) | | ($) | |
| | | International
Stock Fund(a)(b) | | Mid Cap
Growth Fund(a)(b) | | Small Cap
Growth Fund I | | Real Estate
Equity Fund(a) | | Technology Fund(a) | |
| Net Investment Income | |
| Income | |
| Dividends | | | 38,523,985 | | | | 15,244,498 | | | | 860,575 | | | | 12,180,985 | | | | 1,016,157 | | |
| Interest | | | 691,380 | | | | 1,853,033 | | | | 392,203 | | | | 422,857 | | | | 246,707 | | |
| Foreign taxes withheld | | | (3,630,866 | ) | | | (31,476 | ) | | | — | | | | (12,506 | ) | | | (81,310 | ) | |
| Total Income | | | 35,584,499 | | | | 17,066,055 | | | | 1,252,778 | | | | 12,591,336 | | | | 1,181,554 | | |
| Expenses | |
| Investment advisory fee | | | 11,484,577 | | | | 11,581,614 | | | | 1,929,963 | | | | 4,576,982 | | | | 2,027,004 | | |
| Administration fee | | | — | | | | — | | | | — | | | | — | | | | — | | |
| Distribution fee: | |
| Class B | | | 279,071 | | | | 152,108 | | | | 6,163 | | | | 97,617 | | | | 69,345 | | |
| Class C | | | 218,688 | | | | 46,545 | | | | 9,311 | | | | 50,618 | | | | 214,476 | | |
| Class D | | | 5,746 | | | | 2,947 | | | | — | | | | 22,733 | | | | 193 | | |
| Class G | | | 4,869 | | | | 3,097 | | | | — | | | | — | | | | — | | |
| Class R | | | — | | | | 1,430 | | | | — | | | | — | | | | — | | |
| Service fee: | |
| Class A | | | 742,932 | | | | 116,527 | | | | 26,552 | | | | 113,409 | | | | 223,445 | | |
| Class B | | | 93,024 | | | | 50,703 | | | | 2,054 | | | | 32,539 | | | | 23,115 | | |
| Class C | | | 72,896 | | | | 15,515 | | | | 3,102 | | | | 16,873 | | | | 71,492 | | |
| Class D | | | 1,915 | | | | 982 | | | | — | | | | 7,577 | | | | 64 | | |
| Class G | | | 2,247 | | | | 1,430 | | | | — | | | | — | | | | — | | |
| Shareholder services fee - Class T | | | — | | | | 86,475 | | | | — | | | | — | | | | — | | |
| Transfer agent fee | | | 2,240,867 | | | | 1,468,496 | | | | 251,138 | | | | 732,915 | | | | 372,793 | | |
| Pricing and bookkeeping fees | | | 169,813 | | | | 162,640 | | | | 94,014 | | | | 147,932 | | | | 93,965 | | |
| Trustees' fees | | | 71,551 | | | | 78,050 | | | | 21,906 | | | | 43,902 | | | | 20,357 | | |
| Custody fee | | | 538,662 | | | | 48,137 | | | | 17,062 | | | | 27,650 | | | | 20,908 | | |
| Chief compliance officer expenses | | | 5,399 | | | | 5,292 | | | | 2,700 | | | | 4,617 | | | | 2,589 | | |
| Other expenses | | | 778,664 | | | | 642,321 | | | | 245,293 | | | | 334,675 | | | | 287,274 | | |
| Expenses before interest expense | | | 16,710,921 | | | | 14,464,309 | | | | 2,609,258 | | | | 6,210,039 | | | | 3,427,020 | | |
| Interest expense | | | 39,226 | | | | 8,220 | | | | 161 | | | | 7,578 | | | | 4,167 | | |
| Total Expenses | | | 16,750,147 | | | | 14,472,529 | | | | 2,609,419 | | | | 6,217,617 | | | | 3,431,187 | | |
| Expenses waived/reimbursed by Investment Advisor | | | — | | | | — | | | | — | | | | — | | | | — | | |
| Fees waived by Distributor: | |
| Class C | | | — | | | | — | | | | — | | | | — | | | | — | | |
| Class D | | | — | | | | — | | | | — | | | | — | | | | — | | |
| Fees waived by Transfer Agent | | | (1,393,904 | ) | | | — | | | | — | | | | — | | | | — | | |
| Expense reductions | | | (39,455 | ) | | | (35,751 | ) | | | (7,838 | ) | | | (11,308 | ) | | | (6,554 | ) | |
| Net Expenses | | | 15,316,788 | | | | 14,436,778 | | | | 2,601,581 | | | | 6,206,309 | | | | 3,424,633 | | |
| Net Investment Income (Loss) | | | 20,267,711 | | | | 2,629,277 | | | | (1,348,803 | ) | | | 6,385,027 | | | | (2,243,079 | ) | |
(a) Class D shares reflects activity for the period September 1, 2006 through August 8, 2007.
(b) Class G shares reflects activity for the period September 1, 2006 through August 8, 2007.
See Accompanying Notes to Financial Statements.
100
| | | ($) | | ($) | | ($) | | ($) | |
| | | Strategic
Investor Fund(a) | | Balanced Fund(a) | | Oregon
Intermediate
Municipal
Bond Fund(a) | | Conservative
High Yield
Fund(a) | |
| Net Investment Income | |
| Income | |
| Dividends | | | 17,960,862 | | | | 1,858,248 | | | | 6,246 | | | | — | | |
| Interest | | | 1,017,180 | | | | 4,815,129 | | | | 17,811,188 | | | | 70,004,335 | | |
| Foreign taxes withheld | | | (241,733 | ) | | | (2,624 | ) | | | — | | | | — | | |
| Total Income | | | 18,736,309 | | | | 6,670,753 | | | | 17,817,434 | | | | 70,004,335 | | |
| Expenses | |
| Investment advisory fee | | | 6,600,954 | | | | 1,126,573 | | | | 1,933,585 | | | | 5,545,438 | | |
| Administration fee | | | 1,653,765 | | | | — | | | | — | | | | — | | |
| Distribution fee: | |
| Class B | | | 418,274 | | | | 53,810 | | | | 6,533 | | | | 450,157 | | |
| Class C | | | 336,628 | | | | 11,846 | | | | 5,435 | | | | 90,679 | | |
| Class D | | | 3,179 | | | | 1,614 | | | | 3,773 | | | | 217,794 | | |
| Class G | | | — | | | | — | | | | — | | | | — | | |
| Class R | | | — | | | | — | | | | — | | | | — | | |
| Service fee: | |
| Class A | | | 628,979 | | | | 13,383 | | | | 15,361 | | | | 340,608 | | |
| Class B | | | 139,425 | | | | 17,937 | | | | 2,178 | | | | 150,052 | | |
| Class C | | | 112,209 | | | | 3,948 | | | | 1,811 | | | | 30,226 | | |
| Class D | | | 1,060 | | | | 538 | | | | 1,258 | | | | 72,598 | | |
| Class G | | | — | | | | — | | | | — | | | | — | | |
| Shareholder services fee - Class T | | | — | | | | — | | | | — | | | | — | | |
| Transfer agent fee | | | 2,899,925 | | | | 235,069 | | | | 122,029 | | | | 1,228,487 | | |
| Pricing and bookkeeping fees | | | 164,511 | | | | 104,571 | | | | 139,547 | | | | 171,331 | | |
| Trustees' fees | | | 47,149 | | | | 19,525 | | | | 28,176 | | | | 59,006 | | |
| Custody fee | | | 57,097 | | | | 16,912 | | | | 12,227 | | | | 28,885 | | |
| Chief compliance officer expenses | | | 5,036 | | | | 2,675 | | | | 3,436 | | | | 5,026 | | |
| Other expenses | | | 880,247 | | | | 237,251 | | | | 190,288 | | | | 522,106 | | |
| Expenses before interest expense | | | 13,948,438 | | | | 1,845,652 | | | | 2,465,637 | | | | 8,912,393 | | |
| Interest expense | | | — | | | | — | | | | — | | | | 967 | | |
| Total Expenses | | | 13,948,438 | | | | 1,845,652 | | | | 2,465,637 | | | | 8,913,360 | | |
| Expenses waived/reimbursed by Investment Advisor | | | (204,253 | ) | | | — | | | | — | | | | — | | |
| Fees waived by Distributor: | |
| Class C | | | — | | | | — | | | | (2,536 | ) | | | (18,136 | ) | |
| Class D | | | — | | | | — | | | | (1,760 | ) | | | (43,559 | ) | |
| Fees waived by Transfer Agent | | | — | | | | — | | | | — | | | | — | | |
| Expense reductions | | | (658,769 | ) | | | (11,976 | ) | | | (5,979 | ) | | | (24,576 | ) | |
| Net Expenses | | | 13,085,416 | | | | 1,833,676 | | | | 2,455,362 | | | | 8,827,089 | | |
| Net Investment Income (Loss) | | | 5,650,893 | | | | 4,837,077 | | | | 15,362,072 | | | | 61,177,246 | | |
See Accompanying Notes to Financial Statements.
101
Statements of Operations – Columbia Funds
For the Year Ended August 31, 2007 (continued)
| | | ($) | | ($) | | ($) | | ($) | | ($) | |
| | | International
Stock Fund(a)(b) | | Mid Cap
Growth Fund(a)(b) | | Small Cap
Growth Fund I | | Real Estate
Equity Fund(a) | | Technology Fund(a) | |
Net Realized and Unrealized Gain (Loss) on Investments,
Foreign Currency and Written Options | |
| Net realized gain (loss) on: | |
| Investments | | | 177,283,300 | | | | 227,554,366 | | | | 31,853,737 | | | | 239,570,282 | | | | 19,771,116 | | |
| Foreign currency transactions | | | 8,652,533 | | | | (250,163 | ) | | | (6,554 | ) | | | — | | | | (58,502 | ) | |
| Written options | | | — | | | | 203,178 | | | | 10,246 | | | | — | | | | — | | |
| Net realized loss due to a trading error (See Note 9) | | | — | | | | — | | | | — | | | | — | | | | — | | |
| Net realized gain (loss) | | | 185,935,833 | | | | 227,507,381 | | | | 31,857,429 | | | | 239,570,282 | | | | 19,712,614 | | |
| Net change in unrealized appreciation (depreciation) on: | |
| Investments | | | 33,225,716 | | | | 60,530,475 | | | | 12,843,868 | | | | (216,587,464 | ) | | | 32,379,550 | | |
| Foreign currency translations | | | (1,163,942 | ) | | | 97 | | | | 331 | | | | — | | | | 2,287 | | |
| Written options | | | 36,581 | | | | — | | | | — | | | | — | | | | — | | |
| Net change in unrealized appreciation (depreciation) | | | 32,098,355 | | | | 60,530,572 | | | | 12,844,199 | | | | (216,587,464 | ) | | | 32,381,837 | | |
| Net Gain (Loss) | | | 218,034,188 | | | | 288,037,953 | | | | 44,701,628 | | | | 22,982,818 | | | | 52,094,451 | | |
| Net Increase Resulting from Operations | | | 238,301,899 | | | | 290,667,230 | | | | 43,352,825 | | | | 29,367,845 | | | | 49,851,372 | | |
(a) Class D shares reflects activity for the period September 1, 2006 through August 8, 2007.
(b) Class G shares reflects activity for the period September 1, 2006 through August 8, 2007.
See Accompanying Notes to Financial Statements.
102
| | | ($) | | ($) | | ($) | | ($) | |
| | | Strategic
Investor Fund(a) | | Balanced Fund(a) | | Oregon
Intermediate
Municipal
Bond Fund(a) | | Conservative
High Yield
Fund(a) | |
Net Realized and Unrealized Gain (Loss) on Investments,
Foreign Currency and Written Options | |
| Net realized gain (loss) on: | |
| Investments | | | 144,597,404 | | | | 18,226,159 | | | | 785,591 | | | | (1,421,718 | ) | |
| Foreign currency transactions | | | (373,861 | ) | | | — | | | | — | | | | (48,474 | ) | |
| Written options | | | — | | | | — | | | | — | | | | — | | |
| Net realized loss due to a trading error (See Note 9) | | | — | | | | — | | | | — | | | | — | | |
| Net realized gain (loss) | | | 144,223,543 | | | | 18,226,159 | | | | 785,591 | | | | (1,470,192 | ) | |
| Net change in unrealized appreciation (depreciation) on: | |
| Investments | | | 34,084,665 | | | | 3,989,036 | | | | (7,940,175 | ) | | | (7,661,979 | ) | |
| Foreign currency translations | | | 1,896 | | | | — | | | | — | | | | (43,495 | ) | |
| Written options | | | — | | | | — | | | | — | | | | — | | |
| Net change in unrealized appreciation (depreciation) | | | 34,086,561 | | | | 3,989,036 | | | | (7,940,175 | ) | | | (7,705,474 | ) | |
| Net Gain (Loss) | | | 178,310,104 | | | | 22,215,195 | | | | (7,154,584 | ) | | | (9,175,666 | ) | |
| Net Increase Resulting from Operations | | | 183,960,997 | | | | 27,052,272 | | | | 8,207,488 | | | | 52,001,580 | | |
See Accompanying Notes to Financial Statements.
103
Statements of Changes in Net Assets – Columbia Funds
| Increase (Decrease) in Net Assets | | International Stock Fund | | Mid Cap Growth Fund | |
| | | Year Ended August 31, | | Year Ended August 31, | |
| | | 2007 ($)(a)(b) | | 2006 ($) | | 2007 ($)(a)(b) | | 2006 ($)(c) | |
| Operations | | | | | |
| Net investment income (loss) | | | 20,267,711 | | | | 20,716,145 | | | | 2,629,277 | | | | (1,961,518 | ) | |
Net realized gain on investments, foreign currency transactions
and written options | | | 185,935,833 | | | | 196,665,422 | | | | 227,507,381 | | | | 95,341,663 | | |
Net change in unrealized appreciation (depreciation)
on investments, foreign currency translations and written options | | | 32,098,355 | | | | 52,474,683 | | | | 60,530,572 | | | | (11,512,689 | ) | |
| Net increase resulting from operations | | | 238,301,899 | | | | 269,856,250 | | | | 290,667,230 | | | | 81,867,456 | | |
| Distributions to Shareholders | | | | | |
| From net investment income: | | | |
| Class A | | | (4,133,168 | ) | | | (1,897,375 | ) | | | — | | | | — | | |
| Class B | | | (281,059 | ) | | | (28,325 | ) | | | — | | | | — | | |
| Class C | | | (205,677 | ) | | | (13,323 | ) | | | — | | | | — | | |
| Class D | | | (5,637 | ) | | | (382 | ) | | | — | | | | — | | |
| Class G | | | (6,342 | ) | | | (3,482 | ) | | | — | | | | — | | |
| Class Z | | | (17,299,002 | ) | | | (9,672,982 | ) | | | (2,454,592 | ) | | | — | | |
| From net realized gains: | | | |
| Class A | | | (28,240,926 | ) | | | (2,668,118 | ) | | | (2,635,416 | ) | | | (109,235 | ) | |
| Class B | | | (3,899,155 | ) | | | (613,184 | ) | | | (1,228,935 | ) | | | (92,893 | ) | |
| Class C | | | (2,862,620 | ) | | | (289,740 | ) | | | (347,303 | ) | | | (12,559 | ) | |
| Class D | | | (78,464 | ) | | | (8,320 | ) | | | (24,153 | ) | | | (5,866 | ) | |
| Class G | | | (82,635 | ) | | | (38,588 | ) | | | (29,379 | ) | | | (10,097 | ) | |
| Class R | | | — | | | | — | | | | (4,303 | ) | | | — | | |
| Class T | | | — | | | | — | | | | (1,593,876 | ) | | | (375,814 | ) | |
| Class Z | | | (101,049,927 | ) | | | (10,376,677 | ) | | | (78,975,335 | ) | | | (10,607,269 | ) | |
| Total distributions to shareholders | | | (158,144,612 | ) | | | (25,610,496 | ) | | | (87,293,292 | ) | | | (11,213,733 | ) | |
| Net Capital Share Transactions | | | (68,281,430 | ) | | | 57,819,222 | | | | 499,062,394 | | | | (54,634,676 | ) | |
| Redemption Fees | | | 9,577 | | | | 31,135 | | | | — | | | | — | | |
| Net increase (decrease) in net assets | | | 11,885,434 | | | | 302,096,111 | | | | 702,436,332 | | | | 16,019,047 | | |
| Net Assets | | | | | |
| Beginning of period | | | 1,355,545,134 | | | | 1,053,449,023 | | | | 857,783,047 | | | | 841,764,000 | | |
| End of period | | | 1,367,430,568 | | | | 1,355,545,134 | | | | 1,560,219,379 | | | | 857,783,047 | | |
| Undistributed (Overdistributed) net investment income, at end of period | | | 26,558,663 | | | | 17,058,253 | | | | (42,985 | ) | | | — | | |
| Accumulated net investment loss, at end of period | | | — | | | | — | | | | — | | | | (24,462 | ) | |
(a) Class D shares reflects activity for the period September 1, 2006 through August 8, 2007.
(b) Class G shares reflects activity for the period September 1, 2006 through August 8, 2007.
(c) Class R shares were initially offered on January 23, 2006.
(d) Classes A, B and C shares were initially offered on November 1, 2005.
See Accompanying Notes to Financial Statements.
104
| Increase (Decrease) in Net Assets | | Small Cap Growth Fund I | | Real Estate Equity Fund | |
| | | Year Ended August 31, | | Year Ended August 31, | |
| | | 2007 ($) | | 2006 ($)(d) | | 2007 ($)(a) | | 2006 ($) | |
| Operations | |
| Net investment income (loss) | | | (1,348,803 | ) | | | (2,006,082 | ) | | | 6,385,027 | | | | 12,000,668 | | |
Net realized gain on investments, foreign currency transactions
and written options | | | 31,857,429 | | | | 33,720,413 | | | | 239,570,282 | | | | 121,739,563 | | |
Net change in unrealized appreciation (depreciation)
on investments, foreign currency translations and written options | | | 12,844,199 | | | | (9,292,815 | ) | | | (216,587,464 | ) | | | 345,333 | | |
| Net increase resulting from operations | | | 43,352,825 | | | | 22,421,516 | | | | 29,367,845 | | | | 134,085,564 | | |
| Distributions to Shareholders | |
| From net investment income: | |
| Class A | | | — | | | | — | | | | (547,791 | ) | | | (1,221,099 | ) | |
| Class B | | | — | | | | — | | | | (55,195 | ) | | | (281,742 | ) | |
| Class C | | | — | | | | — | | | | (25,792 | ) | | | (101,320 | ) | |
| Class D | | | — | | | | — | | | | (13,665 | ) | | | (83,173 | ) | |
| Class G | | | — | | | | — | | | | — | | | | — | | |
| Class Z | | | (9,836 | ) | | | — | | | | (7,967,611 | ) | | | (20,429,149 | ) | |
| From net realized gains: | |
| Class A | | | (1,159,610 | ) | | | (955 | ) | | | (15,301,339 | ) | | | (5,027,442 | ) | |
| Class B | | | (95,854 | ) | | | (1,290 | ) | | | (4,443,972 | ) | | | (1,591,961 | ) | |
| Class C | | | (120,634 | ) | | | (452 | ) | | | (2,158,908 | ) | | | (555,755 | ) | |
| Class D | | | — | | | | — | | | | (1,106,924 | ) | | | (462,275 | ) | |
| Class G | | | — | | | | — | | | | — | | | | — | | |
| Class R | | | — | | | | — | | | | — | | | | — | | |
| Class T | | | — | | | | — | | | | — | | | | — | | |
| Class Z | | | (29,494,728 | ) | | | (6,483,989 | ) | | | (189,312,650 | ) | | | (82,518,380 | ) | |
| Total distributions to shareholders | | | (30,880,662 | ) | | | (6,486,686 | ) | | | (220,933,847 | ) | | | (112,272,296 | ) | |
| Net Capital Share Transactions | | | 33,125,648 | | | | (33,316,966 | ) | | | (28,060,250 | ) | | | (203,184,914 | ) | |
| Redemption Fees | | | — | | | | — | | | | — | | | | — | | |
| Net increase (decrease) in net assets | | | 45,597,811 | | | | (17,382,136 | ) | | | (219,626,252 | ) | | | (181,371,646 | ) | |
| Net Assets | |
| Beginning of period | | | 197,276,638 | | | | 214,658,774 | | | | 646,008,774 | | | | 827,380,420 | | |
| End of period | | | 242,874,449 | | | | 197,276,638 | | | | 426,382,522 | | | | 646,008,774 | | |
| Undistributed (Overdistributed) net investment income, at end of period | | | — | | | | — | | | | (24,881 | ) | | | — | | |
| Accumulated net investment loss, at end of period | | | (17,916 | ) | | | (11,793 | ) | | | — | | | | (12,518 | ) | |
See Accompanying Notes to Financial Statements.
105
Statements of Changes in Net Assets – Columbia Funds
| Increase (Decrease) in Net Assets | | Technology Fund | | Strategic Investor Fund | | Balanced Fund | |
| | | Year Ended August 31, | | Year Ended August 31, | | Year Ended August 31, | |
| | | 2007 ($)(a) | | 2006 ($) | | 2007 ($)(a) | | 2006 ($) | | 2007 ($)(a) | | 2006 ($) | |
| Operations | |
| Net investment income (loss) | | | (2,243,079 | ) | | | (1,274,821 | ) | | | 5,650,893 | | | | 2,830,460 | | | | 4,837,077 | | | | 5,215,730 | | |
Net realized gain (loss) on investments,
foreign currency transactions, futures
contracts and written options | | | 19,712,614 | | | | (3,380,219 | ) | | | 144,223,543 | | | | 66,204,240 | | | | 18,226,159 | | | | 13,540,329 | | |
Net change in unrealized appreciation
(depreciation) on investments, foreign
currency translations, futures contracts and
written options | | | 32,381,837 | | | | 5,045,878 | | | | 34,086,561 | | | | (30,969,554 | ) | | | 3,989,036 | | | | (3,993,678 | ) | |
| Net increase resulting from operations | | | 49,851,372 | | | | 390,838 | | | | 183,960,997 | | | | 38,065,146 | | | | 27,052,272 | | | | 14,762,381 | | |
| Distributions to Shareholders | |
| From net investment income: | |
| Class A | | | — | | | | — | | | | (877,469 | ) | | | (1,141,064 | ) | | | (102,893 | ) | | | (68,779 | ) | |
| Class B | | | — | | | | — | | | | — | | | | — | | | | (90,688 | ) | | | (84,129 | ) | |
| Class C | | | — | | | | — | | | | — | | | | — | | | | (19,483 | ) | | | (11,910 | ) | |
| Class D | | | — | | | | — | | | | — | | | | — | | | | (2,889 | ) | | | (2,534 | ) | |
| Class Z | | | — | | | | — | | | | (2,645,242 | ) | | | (2,001,896 | ) | | | (4,784,102 | ) | | | (5,530,580 | ) | |
| From net realized gains: | |
| Class A | | | — | | | | (1,565,194 | ) | | | (21,385,015 | ) | | | (12,351,692 | ) | | | — | | | | — | | |
| Class B | | | — | | | | (208,798 | ) | | | (6,587,216 | ) | | | (3,757,672 | ) | | | — | | | | — | | |
| Class C | | | — | | | | (235,437 | ) | | | (5,582,554 | ) | | | (3,083,532 | ) | | | — | | | | — | | |
| Class D | | | — | | | | (1,273 | ) | | | (55,652 | ) | | | (35,524 | ) | | | — | | | | — | | |
| Class Z | | | — | | | | (3,469,746 | ) | | | (23,718,387 | ) | | | (15,890,662 | ) | | | — | | | | — | | |
| Total distributions to shareholders | | | — | | | | (5,480,448 | ) | | | (60,851,535 | ) | | | (38,262,042 | ) | | | (5,000,055 | ) | | | (5,697,932 | ) | |
| Net Capital Share Transactions | | | 68,384,627 | | | | 119,898,198 | | | | 645,437,908 | | | | (80,634,677 | ) | | | (49,788,148 | ) | | | (83,198,814 | ) | |
| Net increase (decrease) in net assets | | | 118,235,999 | | | | 114,808,588 | | | | 768,547,370 | | | | (80,831,573 | ) | | | (27,735,931 | ) | | | (74,134,365 | ) | |
| Net Assets | |
| Beginning of period | | | 175,629,174 | | | | 60,820,586 | | | | 444,985,486 | | | | 525,817,059 | | | | 239,773,758 | | | | 313,908,123 | | |
| End of period | | | 293,865,173 | | | | 175,629,174 | | | | 1,213,532,856 | | | | 444,985,486 | | | | 212,037,827 | | | | 239,773,758 | | |
Undistributed (Overdistributed) net investment
income, at end of period | | | — | | | | — | | | | 3,307,872 | | | | 1,591,220 | | | | 1,003,266 | | | | 784,712 | | |
| Accumulated net investment loss, at end of period | | | (11,776 | ) | | | (65,942 | ) | | | — | | | | — | | | | — | | | | — | | |
(a) Class D shares reflects activity for the period September 1, 2006 through August 8, 2007.
See Accompanying Notes to Financial Statements.
106
| Increase (Decrease) in Net Assets | | Oregon Intermediate Municipal
Bond Fund | | Conservative
High Yield Fund | |
| | | Year Ended August 31, | | Year Ended August 31, | |
| | | 2007 ($)(a) | | 2006 ($) | | 2007 ($)(a) | | 2006 ($) | |
| Operations | |
| Net investment income (loss) | | | 15,362,072 | | | | 15,863,946 | | | | 61,177,246 | | | | 77,546,952 | | |
Net realized gain (loss) on investments,
foreign currency transactions, futures
contracts and written options | | | 785,591 | | | | (76,383 | ) | | | (1,470,192 | ) | | | (13,956,133 | ) | |
Net change in unrealized appreciation
(depreciation) on investments, foreign
currency translations, futures contracts and
written options | | | (7,940,175 | ) | | | (6,994,177 | ) | | | (7,705,474 | ) | | | (35,834,574 | ) | |
| Net increase resulting from operations | | | 8,207,488 | | | | 8,793,386 | | | | 52,001,580 | | | | 27,756,245 | | |
| Distributions to Shareholders | |
| From net investment income: | |
| Class A | | | (228,907 | ) | | | (196,135 | ) | | | (8,822,616 | ) | | | (13,897,417 | ) | |
| Class B | | | (25,930 | ) | | | (33,893 | ) | | | (3,440,134 | ) | | | (4,329,122 | ) | |
| Class C | | | (24,106 | ) | | | (18,048 | ) | | | (719,020 | ) | | | (828,000 | ) | |
| Class D | | | (16,764 | ) | | | (23,391 | ) | | | (1,702,096 | ) | | | (2,601,189 | ) | |
| Class Z | | | (15,039,476 | ) | | | (15,572,245 | ) | | | (48,825,293 | ) | | | (60,226,094 | ) | |
| From net realized gains: | |
| Class A | | | — | | | | — | | | | — | | | | — | | |
| Class B | | | — | | | | — | | | | — | | | | — | | |
| Class C | | | — | | | | — | | | | — | | | | — | | |
| Class D | | | — | | | | — | | | | — | | | | — | | |
| Class Z | | | — | | | | — | | | | — | | | | — | | |
| Total distributions to shareholders | | | (15,335,183 | ) | | | (15,843,712 | ) | | | (63,509,159 | ) | | | (81,881,822 | ) | |
| Net Capital Share Transactions | | | (6,444,965 | ) | | | (21,224,759 | ) | | | (273,578,305 | ) | | | (419,739,763 | ) | |
| Net increase (decrease) in net assets | | | (13,572,660 | ) | | | (28,275,085 | ) | | | (285,085,884 | ) | | | (473,865,340 | ) | |
| Net Assets | |
| Beginning of period | | | 389,322,251 | | | | 417,597,336 | | | | 1,087,273,858 | | | | 1,561,139,198 | | |
| End of period | | | 375,749,591 | | | | 389,322,251 | | | | 802,187,974 | | | | 1,087,273,858 | | |
Undistributed (Overdistributed) net investment
income, at end of period | | | 138,316 | | | | 108,173 | | | | (2,644,269 | ) | | | — | | |
| Accumulated net investment loss, at end of period | | | — | | | | — | | | | — | | | | (4,875,422 | ) | |
See Accompanying Notes to Financial Statements.
107
Statements of Changes in Net Assets – Capital Stock Activity
| | | International Stock Fund | |
| | | Year Ended
August 31, 2007(a)(b) | | Year Ended
August 31, 2006 | |
| | | Shares | | Dollars ($) | | Shares | | Dollars ($) | |
| Class A | |
| Subscriptions | | | 1,204,071 | | | | 23,667,863 | | | | 1,820,941 | | | | 31,858,348 | | |
| Proceeds received in connection with merger | | | — | | | | — | | | | 11,502,364 | | | | 184,602,426 | | |
| Distributions reinvested | | | 1,559,040 | | | | 28,733,119 | | | | 241,749 | | | | 4,066,222 | | |
| Redemptions | | | (2,532,806 | ) | | | (49,784,100 | ) | | | (3,406,213 | ) | | | (59,334,868 | ) | |
| Net increase | | | 230,305 | | | | 2,616,882 | | | | 10,158,841 | | | | 161,192,128 | | |
| Class B | |
| Subscriptions | | | 132,548 | | | | 2,536,426 | | | | 150,720 | | | | 2,585,185 | | |
| Proceeds received in connection with merger | | | — | | | | — | | | | 3,265,239 | | | | 51,112,688 | | |
| Distributions reinvested | | | 196,840 | | | | 3,550,989 | | | | 33,515 | | | | 553,002 | | |
| Redemptions | | | (1,096,694 | ) | | | (21,048,203 | ) | | | (1,922,237 | ) | | | (32,857,952 | ) | |
| Net increase (decrease) | | | (767,306 | ) | | | (14,960,788 | ) | | | 1,527,237 | | | | 21,392,923 | | |
| Class C | |
| Subscriptions | | | 148,773 | | | | 2,873,726 | | | | 82,654 | | | | 1,438,606 | | |
| Proceeds received in connection with merger | | | — | | | | — | | | | 1,684,650 | | | | 26,472,752 | | |
| Distributions reinvested | | | 131,938 | | | | 2,390,724 | | | | 14,227 | | | | 235,742 | | |
| Redemptions | | | (287,397 | ) | | | (5,509,015 | ) | | | (337,758 | ) | | | (5,821,095 | ) | |
| Net increase (decrease) | | | (6,686 | ) | | | (244,565 | ) | | | 1,443,773 | | | | 22,326,005 | | |
| Class D | |
| Subscriptions | | | 877 | | | | 16,884 | | | | 2,566 | | | | 43,597 | | |
| Distributions reinvested | | | 4,585 | | | | 83,352 | | | | 504 | | | | 8,373 | | |
| Redemptions | | | (46,660 | ) | | | (934,418 | ) | | | (9,681 | ) | | | (171,234 | ) | |
| Net decrease | | | (41,198 | ) | | | (834,182 | ) | | | (6,611 | ) | | | (119,264 | ) | |
| Class G | |
| Subscriptions | | | 1,934 | | | | 37,101 | | | | 2,248 | | | | 38,693 | | |
| Distributions reinvested | | | 4,932 | | | | 88,927 | | | | 2,530 | | | | 41,730 | | |
| Redemptions | | | (72,798 | ) | | | (1,407,621 | ) | | | (200,046 | ) | | | (3,470,298 | ) | |
| Net decrease | | | (65,932 | ) | | | (1,281,593 | ) | | | (195,268 | ) | | | (3,389,875 | ) | |
| Class R | |
| Subscriptions | | | — | | | | — | | | | — | | | | — | | |
| Distributions reinvested | | | — | | | | — | | | | — | | | | — | | |
| Redemptions | | | — | | | | — | | | | — | | | | — | | |
| Net increase | | | — | | | | — | | | | — | | | | — | | |
| Class T | |
| Subscriptions | | | — | | | | — | | | | — | | | | — | | |
| Distributions reinvested | | | — | | | | — | | | | — | | | | — | | |
| Redemptions | | | — | | | | — | | | | — | | | | — | | |
| Net decrease | | | — | | | | — | | | | — | | | | — | | |
| Class Z | |
| Subscriptions | | | 3,018,443 | | | | 59,462,899 | | | | 3,053,495 | | | | 53,473,236 | | |
| Proceeds received in connection with merger | | | — | | | | — | | | | 1,164,515 | | | | 18,806,658 | | |
| Distributions reinvested | | | 2,297,138 | | | | 42,611,910 | | | | 345,288 | | | | 5,838,832 | | |
| Redemptions | | | (7,851,117 | ) | | | (155,651,993 | ) | | | (12,561,823 | ) | | | (221,701,421 | ) | |
| Net increase (decrease) | | | (2,535,536 | ) | | | (53,577,184 | ) | | | (7,998,525 | ) | | | (143,582,695 | ) | |
(a) Class D shares reflects activity for the period September 1, 2006 through August 8, 2007.
(b) Class G shares reflects activity for the period September 1, 2006 through August 8, 2007.
(c) Class R shares were initially offered on January 23, 2006.
See Accompanying Notes to Financial Statements.
108
| | | Mid Cap Growth Fund | |
| | | Year Ended
August 31, 2007(a)(b) | | Year Ended
August 31, 2006(c) | |
| | | Shares | | Dollars ($) | | Shares | | Dollars ($) | |
| Class A | |
| Subscriptions | | | 322,756 | | | | 8,472,714 | | | | 346,804 | | | | 8,445,955 | | |
| Proceeds received in connection with merger | | | 1,305,055 | | | | 31,735,751 | | | | — | | | | — | | |
| Distributions reinvested | | | 97,217 | | | | 2,445,994 | | | | 4,318 | | | | 102,597 | | |
| Redemptions | | | (448,578 | ) | | | (11,756,287 | ) | | | (98,323 | ) | | | (2,357,032 | ) | |
| Net increase | | | 1,276,450 | | | | 30,898,172 | | | | 252,799 | | | | 6,191,520 | | |
| Class B | |
| Subscriptions | | | 38,357 | | | | 974,624 | | | | 100,073 | | | | 2,388,130 | | |
| Proceeds received in connection with merger | | | 583,144 | | | | 13,770,140 | | | | — | | | | — | | |
| Distributions reinvested | | | 46,417 | | | | 1,130,266 | | | | 3,617 | | | | 83,940 | | |
| Redemptions | | | (251,908 | ) | | | (6,384,625 | ) | | | (78,229 | ) | | | (1,836,358 | ) | |
| Net increase (decrease) | | | 416,010 | | | | 9,490,405 | | | | 25,461 | | | | 635,712 | | |
| Class C | |
| Subscriptions | | | 155,749 | | | | 3,992,578 | | | | 99,459 | | | | 2,379,553 | | |
| Proceeds received in connection with merger | | | 106,084 | | | | 2,510,529 | | | | — | | | | — | | |
| Distributions reinvested | | | 10,692 | | | | 260,879 | | | | 380 | | | | 8,826 | | |
| Redemptions | | | (67,108 | ) | | | (1,687,202 | ) | | | (25,796 | ) | | | (611,480 | ) | |
| Net increase (decrease) | | | 205,417 | | | | 5,076,784 | | | | 74,043 | | | | 1,776,899 | | |
| Class D | |
| Subscriptions | | | 1,061 | | | | 27,869 | | | | 390 | | | | 8,872 | | |
| Distributions reinvested | | | 935 | | | | 22,786 | | | | 226 | | | | 5,256 | | |
| Redemptions | | | (18,393 | ) | | | (492,651 | ) | | | (4,369 | ) | | | (102,165 | ) | |
| Net decrease | | | (16,397 | ) | | | (441,996 | ) | | | (3,753 | ) | | | (88,037 | ) | |
| Class G | |
| Subscriptions | | | 327 | | | | 8,222 | | | | 1,190 | | | | 27,930 | | |
| Distributions reinvested | | | 1,210 | | | | 29,379 | | | | 436 | | | | 10,076 | | |
| Redemptions | | | (27,029 | ) | | | (706,119 | ) | | | (9,585 | ) | | | (227,002 | ) | |
| Net decrease | | | (25,492 | ) | | | (668,518 | ) | | | (7,959 | ) | | | (188,996 | ) | |
| Class R | |
| Subscriptions | | | 34,368 | | | | 934,032 | | | | 2,386 | | | | 57,229 | | |
| Distributions reinvested | | | 172 | | | | 4,306 | | | | — | | | | — | | |
| Redemptions | | | (3,767 | ) | | | (100,826 | ) | | | — | | | | — | | |
| Net increase | | | 30,773 | | | | 837,512 | | | | 2,386 | | | | 57,229 | | |
| Class T | |
| Subscriptions | | | 33,118 | | | | 892,561 | | | | 19,658 | | | | 477,650 | | |
| Distributions reinvested | | | 62,131 | | | | 1,565,081 | | | | 15,447 | | | | 367,640 | | |
| Redemptions | | | (158,964 | ) | | | (4,125,345 | ) | | | (167,717 | ) | | | (4,062,042 | ) | |
| Net decrease | | | (63,715 | ) | | | (1,667,703 | ) | | | (132,612 | ) | | | (3,216,752 | ) | |
| Class Z | |
| Subscriptions | | | 4,928,984 | | | | 131,062,300 | | | | 3,481,879 | | | | 86,368,809 | | |
| Proceeds received in connection with merger | | | 21,863,586 | | | | 538,983,176 | | | | — | | | | — | | |
| Distributions reinvested | | | 2,072,444 | | | | 52,847,304 | | | | 356,875 | | | | 8,582,853 | | |
| Redemptions | | | (10,009,473 | ) | | | (267,355,042 | ) | | | (6,362,479 | ) | | | (154,753,913 | ) | |
| Net increase (decrease) | | | 18,855,541 | | | | 455,537,738 | | | | (2,523,725 | ) | | | (59,802,251 | ) | |
See Accompanying Notes to Financial Statements.
109
Statements of Changes in Net Assets – Capital Stock Activity
| | | Small Cap Growth Fund I | |
| | | Year Ended
August 31, 2007 | | Year Ended
August 31, 2006(a) | |
| | | Shares | | Dollars ($) | | Shares | | Dollars ($) | |
| Class A | |
| Subscriptions | | | 533,293 | | | | 16,437,732 | | | | 103,123 | | | | 3,162,498 | | |
| Distributions reinvested | | | 37,391 | | | | 1,067,138 | | | | 34 | | | | 955 | | |
| Redemptions | | | (82,643 | ) | | | (2,526,761 | ) | | | (9,541 | ) | | | (285,650 | ) | |
| Net increase (decrease) | | | 488,041 | | | | 14,978,109 | | | | 93,616 | | | | 2,877,803 | | |
| Class B | |
| Subscriptions | | | 24,551 | | | | 751,318 | | | | 21,439 | | | | 665,238 | | |
| Distributions reinvested | | | 3,326 | | | | 94,120 | | | | 46 | | | | 1,289 | | |
| Redemptions | | | (5,057 | ) | | | (153,661 | ) | | | (4,190 | ) | | | (123,321 | ) | |
| Net increase (decrease) | | | 22,820 | | | | 691,777 | | | | 17,295 | | | | 543,206 | | |
| Class C | |
| Subscriptions | | | 65,016 | | | | 1,972,580 | | | | 14,855 | | | | 459,002 | | |
| Distributions reinvested | | | 4,165 | | | | 117,868 | | | | 11 | | | | 328 | | |
| Redemptions | | | (9,636 | ) | | | (283,702 | ) | | | (713 | ) | | | (22,820 | ) | |
| Net increase | | | 59,545 | | | | 1,806,746 | | | | 14,153 | | | | 436,510 | | |
| Class D | |
| Subscriptions | | | — | | | | — | | | | — | | | | — | | |
| Distributions reinvested | | | — | | | | — | | | | — | | | | — | | |
| Redemptions | | | — | | | | — | | | | — | | | | — | | |
| Net decrease | | | — | | | | — | | | | — | | | | — | | |
| Class Z | |
| Subscriptions | | | 1,962,106 | | | | 60,044,663 | | | | 2,578,762 | | | | 80,594,892 | | |
| Distributions reinvested | | | 889,648 | | | | 25,479,466 | | | | 223,903 | | | | 6,340,943 | | |
| Redemptions | | | (2,290,415 | ) | | | (69,875,113 | ) | | | (4,150,647 | ) | | | (124,110,320 | ) | |
| Net increase (decrease) | | | 561,339 | | | | 15,649,016 | | | | (1,347,982 | ) | | | (37,174,485 | ) | |
(a) Classes A, B and C shares were initially offered on November 1, 2005.
(b) Class D shares reflects activity for the period September 1, 2006 through August 8, 2007.
See Accompanying Notes to Financial Statements.
110
| | | Real Estate Equity Fund | |
| | | Year Ended
August 31, 2007(b) | | Year Ended
August 31, 2006 | |
| | | Shares | | Dollars ($) | | Shares | | Dollars ($) | |
| Class A | |
| Subscriptions | | | 463,576 | | | | 12,338,183 | | | | 406,170 | | | | 10,961,528 | | |
| Distributions reinvested | | | 599,605 | | | | 15,050,716 | | | | 230,523 | | | | 5,795,348 | | |
| Redemptions | | | (1,101,008 | ) | | | (26,256,248 | ) | | | (743,305 | ) | | | (19,758,652 | ) | |
| Net increase (decrease) | | | (37,827 | ) | | | 1,132,651 | | | | (106,612 | ) | | | (3,001,776 | ) | |
| Class B | |
| Subscriptions | | | 106,638 | | | | 2,792,149 | | | | 55,494 | | | | 1,508,674 | | |
| Distributions reinvested | | | 154,449 | | | | 3,890,251 | | | | 59,456 | | | | 1,492,970 | | |
| Redemptions | | | (253,009 | ) | | | (6,178,329 | ) | | | (174,292 | ) | | | (4,653,145 | ) | |
| Net increase (decrease) | | | 8,078 | | | | 504,071 | | | | (59,342 | ) | | | (1,651,501 | ) | |
| Class C | |
| Subscriptions | | | 249,185 | | | | 5,802,528 | | | | 47,984 | | | | 1,281,844 | | |
| Distributions reinvested | | | 80,271 | | | | 2,003,135 | | | | 23,120 | | | | 580,099 | | |
| Redemptions | | | (119,556 | ) | | | (2,761,528 | ) | | | (55,562 | ) | | | (1,487,279 | ) | |
| Net increase | | | 209,900 | | | | 5,044,135 | | | | 15,542 | | | | 374,664 | | |
| Class D | |
| Subscriptions | | | 2,762 | | | | 67,636 | | | | 1,317 | | | | 34,220 | | |
| Distributions reinvested | | | 37,396 | | | | 949,522 | | | | 18,101 | | | | 454,583 | | |
| Redemptions | | | (164,986 | ) | | | (3,731,933 | ) | | | (47,702 | ) | | | (1,296,509 | ) | |
| Net decrease | | | (124,828 | ) | | | (2,714,775 | ) | | | (28,284 | ) | | | (807,706 | ) | |
| Class Z | |
| Subscriptions | | | 2,743,632 | | | | 73,846,632 | | | | 2,228,792 | | | | 59,982,890 | | |
| Distributions reinvested | | | 5,814,667 | | | | 146,616,512 | | | | 3,067,505 | | | | 77,048,903 | | |
| Redemptions | | | (10,259,942 | ) | | | (252,489,476 | ) | | | (12,617,257 | ) | | | (335,130,388 | ) | |
| Net increase (decrease) | | | (1,701,643 | ) | | | (32,026,332 | ) | | | (7,320,960 | ) | | | (198,098,595 | ) | |
See Accompanying Notes to Financial Statements.
111
Statements of Changes in Net Assets – Capital Stock Activity
| | | Technology Fund | |
| | | Year Ended
August 31, 2007(a) | | Year Ended
August 31, 2006 | |
| | | Shares | | Dollars ($) | | Shares | | Dollars ($) | |
| Class A | |
| Subscriptions | | | 7,069,432 | | | | 75,031,287 | | | | 9,284,782 | | | | 91,997,295 | | |
| Proceeds received in connection with merger | | | — | | | | — | | | | — | | | | — | | |
| Distributions reinvested | | | — | | | | — | | | | 99,164 | | | | 928,177 | | |
| Redemptions | | | (5,786,054 | ) | | | (60,799,434 | ) | | | (2,917,101 | ) | | | (28,495,811 | ) | |
| Net increase | | | 1,283,378 | | | | 14,231,853 | | | | 6,466,845 | | | | 64,429,661 | | |
| Class B | |
| Subscriptions | | | 361,118 | | | | 3,694,119 | | | | 679,001 | | | | 6,674,511 | | |
| Proceeds received in connection with merger | | | — | | | | — | | | | — | | | | — | | |
| Distributions reinvested | | | — | | | | — | | | | 19,481 | | | | 178,643 | | |
| Redemptions | | | (280,078 | ) | | | (2,854,306 | ) | | | (210,315 | ) | | | (1,964,176 | ) | |
| Net increase | | | 81,040 | | | | 839,813 | | | | 488,167 | | | | 4,888,978 | | |
| Class C | |
| Subscriptions | | | 1,963,704 | | | | 20,169,153 | | | | 2,417,270 | | | | 23,956,078 | | |
| Proceeds received in connection with merger | | | — | | | | — | | | | — | | | | — | | |
| Distributions reinvested | | | — | | | | — | | | | 15,776 | | | | 144,978 | | |
| Redemptions | | | (1,045,622 | ) | | | (10,773,554 | ) | | | (357,977 | ) | | | (3,348,585 | ) | |
| Net increase (decrease) | | | 918,082 | | | | 9,395,599 | | | | 2,075,069 | | | | 20,752,471 | | |
| Class D | |
| Subscriptions | | | 21 | | | | 217 | | | | 162 | | | | 1,578 | | |
| Distributions reinvested | | | — | | | | — | | | | 138 | | | | 1,272 | | |
| Redemptions | | | (2,809 | ) | | | (31,424 | ) | | | (92 | ) | | | (887 | ) | |
| Net increase (decrease) | | | (2,788 | ) | | | (31,207 | ) | | | 208 | | | | 1,963 | | |
| Class Z | |
| Subscriptions | | | 8,108,585 | | | | 85,781,059 | | | | 7,178,048 | | | | 72,235,184 | | |
| Proceeds received in connection with merger | | | — | | | | — | | | | — | | | | — | | |
| Distributions reinvested | | | — | | | | — | | | | 349,850 | | | | 3,302,585 | | |
| Redemptions | | | (3,941,346 | ) | | | (41,832,490 | ) | | | (4,648,824 | ) | | | (45,712,644 | ) | |
| Net increase (decrease) | | | 4,167,239 | | | | 43,948,569 | | | | 2,879,074 | | | | 29,825,125 | | |
(a) Class D shares reflects activity for the period September 1, 2006 through August 8, 2007.
See Accompanying Notes to Financial Statements.
112
| | | Strategic Investor Fund | |
| | | Year Ended
August 31, 2007(a) | | Year Ended
August 31, 2006 | |
| | | Shares | | Dollars ($) | | Shares | | Dollars ($) | |
| Class A | |
| Subscriptions | | | 1,375,556 | | | | 28,280,490 | | | | 1,927,245 | | | | 40,285,610 | | |
| Proceeds received in connection with merger | | | 4,450,342 | | | | 82,357,510 | | | | — | | | | — | | |
| Distributions reinvested | | | 1,124,512 | | | | 21,007,498 | | | | 629,370 | | | | 12,719,557 | | |
| Redemptions | | | (3,064,581 | ) | | | (62,574,912 | ) | | | (2,520,791 | ) | | | (52,743,966 | ) | |
| Net increase | | | 3,885,829 | | | | 69,070,586 | | | | 35,824 | | | | 261,201 | | |
| Class B | |
| Subscriptions | | | 176,240 | | | | 3,505,965 | | | | 453,077 | | | | 9,349,459 | | |
| Proceeds received in connection with merger | | | 250,517 | | | | 4,551,995 | | | | — | | | | — | | |
| Distributions reinvested | | | 329,685 | | | | 6,035,882 | | | | 169,557 | | | | 3,377,578 | | |
| Redemptions | | | (653,349 | ) | | | (13,069,497 | ) | | | (516,974 | ) | | | (10,584,904 | ) | |
| Net increase | | | 103,093 | | | | 1,024,345 | | | | 105,660 | | | | 2,142,133 | | |
| Class C | |
| Subscriptions | | | 299,146 | | | | 5,979,580 | | | | 576,305 | | | | 11,877,513 | | |
| Proceeds received in connection with merger | | | 50,148 | | | | 911,399 | | | | — | | | | — | | |
| Distributions reinvested | | | 268,370 | | | | 4,915,740 | | | | 136,921 | | | | 2,728,824 | | |
| Redemptions | | | (594,217 | ) | | | (11,879,800 | ) | | | (488,203 | ) | | | (10,023,576 | ) | |
| Net increase (decrease) | | | 23,447 | | | | (73,081 | ) | | | 225,023 | | | | 4,582,761 | | |
| Class D | |
| Subscriptions | | | 325 | | | | 6,302 | | | | 1,201 | | | | 24,602 | | |
| Distributions reinvested | | | 2,697 | | | | 49,352 | | | | 1,587 | | | | 31,620 | | |
| Redemptions | | | (23,738 | ) | | | (501,988 | ) | | | (7,281 | ) | | | (149,554 | ) | |
| Net increase (decrease) | | | (20,716 | ) | | | (446,334 | ) | | | (4,493 | ) | | | (93,332 | ) | |
| Class Z | |
| Subscriptions | | | 2,573,463 | | | | 52,576,443 | | | | 2,016,913 | | | | 42,353,109 | | |
| Proceeds received in connection with merger | | | 34,148,204 | | | | 632,523,647 | | | | — | | | | — | | |
| Distributions reinvested | | | 1,364,380 | | | | 25,644,886 | | | | 858,956 | | | | 17,376,682 | | |
| Redemptions | | | (6,593,538 | ) | | | (134,882,584 | ) | | | (7,037,088 | ) | | | (147,257,231 | ) | |
| Net increase (decrease) | | | 31,492,509 | | | | 575,862,392 | | | | (4,161,219 | ) | | | (87,527,440 | ) | |
See Accompanying Notes to Financial Statements.
113
Statements of Changes in Net Assets – Capital Stock Activity
| | | Balanced Fund | |
| | | Year Ended
August 31, 2007(a) | | Year Ended
August 31, 2006 | |
| | | Shares | | Dollars ($) | | Shares | | Dollars ($) | |
| Class A | |
| Subscriptions | | | 110,270 | | | | 2,681,094 | | | | 83,879 | | | | 1,850,552 | | |
| Distributions reinvested | | | 3,676 | | | | 88,051 | | | | 2,728 | | | | 59,984 | | |
| Redemptions | | | (32,003 | ) | | | (776,233 | ) | | | (58,116 | ) | | | (1,274,763 | ) | |
| Net increase (decrease) | | | 81,943 | | | | 1,992,912 | | | | 28,491 | | | | 635,773 | | |
| Class B | |
| Subscriptions | | | 52,608 | | | | 1,272,939 | | | | 61,070 | | | | 1,340,143 | | |
| Distributions reinvested | | | 3,353 | | | | 79,857 | | | | 3,339 | | | | 73,387 | | |
| Redemptions | | | (95,621 | ) | | | (2,302,938 | ) | | | (118,655 | ) | | | (2,606,802 | ) | |
| Net decrease | | | (39,660 | ) | | | (950,142 | ) | | | (54,246 | ) | | | (1,193,272 | ) | |
| Class C | |
| Subscriptions | | | 32,183 | | | | 779,452 | | | | 31,610 | | | | 695,179 | | |
| Distributions reinvested | | | 652 | | | | 15,544 | | | | 449 | | | | 9,866 | | |
| Redemptions | | | (22,864 | ) | | | (550,355 | ) | | | (9,567 | ) | | | (211,279 | ) | |
| Net increase | | | 9,971 | | | | 244,641 | | | | 22,492 | | | | 493,766 | | |
| Class D | |
| Subscriptions | | | 3 | | | | 70 | | | | 238 | | | | 5,124 | | |
| Distributions reinvested | | | 107 | | | | 2,548 | | | | 100 | | | | 2,200 | | |
| Redemptions | | | (10,740 | ) | | | (265,417 | ) | | | (4,434 | ) | | | (96,931 | ) | |
| Net decrease | | | (10,630 | ) | | | (262,799 | ) | | | (4,096 | ) | | | (89,607 | ) | |
| Class Z | |
| Subscriptions | | | 444,096 | | | | 10,710,536 | | | | 747,580 | | | | 16,482,201 | | |
| Distributions reinvested | | | 196,343 | | | | 4,672,323 | | | | 247,182 | | | | 5,424,504 | | |
| Redemptions | | | (2,775,314 | ) | | | (66,195,619 | ) | | | (4,769,871 | ) | | | (104,952,179 | ) | |
| Net decrease | | | (2,134,875 | ) | | | (50,812,760 | ) | | | (3,775,109 | ) | | | (83,045,474 | ) | |
(a) Class D shares reflects activity for the period September 1, 2006 through August 8, 2007.
See Accompanying Notes to Financial Statements.
114
| | | Oregon Intermediate Municipal Bond Fund | |
| | | Year Ended
August 31, 2007(a) | | Year Ended
August 31, 2006 | |
| | | Shares | | Dollars ($) | | Shares | | Dollars ($) | |
| Class A | |
| Subscriptions | | | 43,446 | | | | 525,544 | | | | 267,352 | | | | 3,253,116 | | |
| Distributions reinvested | | | 7,435 | | | | 90,639 | | | | 7,222 | | | | 88,108 | | |
| Redemptions | | | (123,096 | ) | | | (1,495,102 | ) | | | (88,497 | ) | | | (1,075,854 | ) | |
| Net increase (decrease) | | | (72,215 | ) | | | (878,919 | ) | | | 186,077 | | | | 2,265,370 | | |
| Class B | |
| Subscriptions | | | 1,921 | | | | 23,528 | | | | 5,444 | | | | 66,548 | | |
| Distributions reinvested | | | 1,382 | | | | 16,844 | | | | 1,433 | | | | 17,497 | | |
| Redemptions | | | (7,814 | ) | | | (95,751 | ) | | | (30,825 | ) | | | (376,823 | ) | |
| Net decrease | | | (4,511 | ) | | | (55,379 | ) | | | (23,948 | ) | | | (292,778 | ) | |
| Class C | |
| Subscriptions | | | 48,928 | | | | 590,399 | | | | 14,183 | | | | 173,313 | | |
| Distributions reinvested | | | 1,504 | | | | 18,314 | | | | 1,205 | | | | 14,707 | | |
| Redemptions | | | (9,491 | ) | | | (114,092 | ) | | | (13,321 | ) | | | (162,835 | ) | |
| Net increase | | | 40,941 | | | | 494,621 | | | | 2,067 | | | | 25,185 | | |
| Class D | |
| Subscriptions | | | — | | | | — | | | | — | | | | — | | |
| Distributions reinvested | | | 758 | | | | 9,260 | | | | 1,279 | | | | 15,623 | | |
| Redemptions | | | (52,569 | ) | | | (634,043 | ) | | | (10,821 | ) | | | (131,939 | ) | |
| Net decrease | | | (51,811 | ) | | | (624,783 | ) | | | (9,542 | ) | | | (116,316 | ) | |
| Class Z | |
| Subscriptions | | | 2,417,758 | | | | 29,487,660 | | | | 1,692,884 | | | | 20,710,082 | | |
| Distributions reinvested | | | 913,001 | | | | 11,128,157 | | | | 952,126 | | | | 11,624,480 | | |
| Redemptions | | | (3,778,908 | ) | | | (45,996,322 | ) | | | (4,538,678 | ) | | | (55,440,782 | ) | |
| Net decrease | | | (448,149 | ) | | | (5,380,505 | ) | | | (1,893,668 | ) | | | (23,106,220 | ) | |
See Accompanying Notes to Financial Statements.
115
Statements of Changes in Net Assets – Capital Stock Activity
| | | Conservative High Yield Fund | |
| | | Year Ended
August 31, 2007(a) | | Year Ended
August 31, 2006 | |
| | | Shares | | Dollars ($) | | Shares | | Dollars ($) | |
| Class A | |
| Subscriptions | | | 1,220,391 | | | | 10,240,281 | | | | 3,633,136 | | | | 30,706,601 | | |
| Distributions reinvested | | | 927,200 | | | | 7,765,153 | | | | 1,475,174 | | | | 12,410,179 | | |
| Redemptions | | | (9,989,565 | ) | | | (83,827,891 | ) | | | (21,793,217 | ) | | | (184,016,358 | ) | |
| Net decrease | | | (7,841,974 | ) | | | (65,822,457 | ) | | | (16,684,907 | ) | | | (140,899,578 | ) | |
| Class B | |
| Subscriptions | | | 168,514 | | | | 1,415,018 | | | | 233,945 | | | | 1,977,598 | | |
| Distributions reinvested | | | 286,174 | | | | 2,395,502 | | | | 350,287 | | | | 2,944,311 | | |
| Redemptions | | | (2,312,398 | ) | | | (19,381,646 | ) | | | (2,841,526 | ) | | | (23,901,260 | ) | |
| Net decrease | | | (1,857,710 | ) | | | (15,571,126 | ) | | | (2,257,294 | ) | | | (18,979,351 | ) | |
| Class C | |
| Subscriptions | | | 3,187,235 | | | | 25,874,771 | | | | 149,813 | | | | 1,264,512 | | |
| Distributions reinvested | | | 54,238 | | | | 452,036 | | | | 57,564 | | | | 483,809 | | |
| Redemptions | | | (505,039 | ) | | | (4,215,649 | ) | | | (888,267 | ) | | | (7,484,301 | ) | |
| Net increase (decrease) | | | 2,736,434 | | | | 22,111,158 | | | | (680,890 | ) | | | (5,735,980 | ) | |
| Class D | |
| Subscriptions | | | 20,719 | | | | 174,982 | | | | 31,924 | | | | 269,498 | | |
| Distributions reinvested | | | 124,498 | | | | 1,044,851 | | | | 193,235 | | | | 1,625,051 | | |
| Redemptions | | | (4,537,960 | ) | | | (37,216,842 | ) | | | (2,649,214 | ) | | | (22,354,841 | ) | |
| Net decrease | | | (4,392,743 | ) | | | (35,997,009 | ) | | | (2,424,055 | ) | | | (20,460,292 | ) | |
| Class Z | |
| Subscriptions | | | 10,706,285 | | | | 89,841,124 | | | | 15,822,759 | | | | 133,488,837 | | |
| Distributions reinvested | | | 1,881,496 | | | | 15,747,576 | | | | 2,520,423 | | | | 21,202,881 | | |
| Redemptions | | | (33,893,132 | ) | | | (283,887,571 | ) | | | (46,067,304 | ) | | | (388,356,280 | ) | |
| Net decrease | | | (21,305,351 | ) | | | (178,298,871 | ) | | | (27,724,122 | ) | | | (233,664,562 | ) | |
(a) Class D shares reflects activity for the period September 1, 2006 through August 8, 2007.
See Accompanying Notes to Financial Statements.
116
Financial Highlights – Columbia International Stock Fund
Selected data for a fund share outstanding throughout each period is as follows:
| | | | | Period Ended | | Period Ended | |
| | | Year Ended August 31, | | August 31, | | December 31, | |
| Class A Shares | | 2007 | | 2006 | | 2005 | | 2004 | | 2003 (a) | | 2002 (b) | |
| Net Asset Value, Beginning of Period | | $ | 18.89 | | | $ | 15.76 | | | $ | 13.04 | | | $ | 11.34 | | | $ | 10.05 | | | $ | 10.04 | | |
| Income from Investment Operations: | |
| Net investment income (loss) (c) | | | 0.26 | | | | 0.26 | | | | 0.25 | | | | 0.01 | | | | 0.04 | | | | (0.02 | ) | |
Net realized and unrealized gain
on investments, foreign currency,
foreign capital gains tax and
written options | | | 3.04 | | | | 3.17 | | | | 2.47 | | | | 1.69 | | | | 1.25 | | | | 0.03 | | |
| Total from investment operations | | | 3.30 | | | | 3.43 | | | | 2.72 | | | | 1.70 | | | | 1.29 | | | | 0.01 | | |
| Less Distributions to Shareholders: | |
| From net investment income | | | (0.29 | ) | | | (0.13 | ) | | | — | (d) | | | — | | | | — | | | | — | | |
| From net realized gains | | | (1.97 | ) | | | (0.17 | ) | | | — | | | | — | | | | — | | | | — | | |
| Total distributions to shareholders | | | (2.26 | ) | | | (0.30 | ) | | | — | (d) | | | — | | | | — | | | | — | | |
| Redemption Fees: | |
| Redemption fees added to paid-in-capital | | | — | (c)(d) | | | — | (c)(d) | | | — | (c)(d) | | | — | (c)(d) | | | — | | | | — | | |
| Net Asset Value, End of Period | | $ | 19.93 | | | $ | 18.89 | | | $ | 15.76 | | | $ | 13.04 | | | $ | 11.34 | | | $ | 10.05 | | |
| Total return (e) | | | 18.46 | %(f)(g) | | | 21.98 | %(f) | | | 20.89 | %(f) | | | 14.99 | %(f) | | | 12.84 | %(h) | | | 0.10 | %(h) | |
| Ratios to Average Net Assets/Supplemental Data: | |
| Net expenses before interest expense (i) | | | 1.24 | % | | | 1.19 | % | | | 1.25 | % | | | 1.72 | % | | | 1.90 | %(j) | | | 1.86 | %(j) | |
| Interest expense | | | — | %(k) | | | — | %(k) | | | — | | | | — | | | | — | | | | — | | |
| Net expenses (i) | | | 1.24 | % | | | 1.19 | % | | | 1.25 | % | | | 1.72 | % | | | 1.90 | %(j) | | | 1.86 | %(j) | |
| Waiver/Reimbursement | | | 0.10 | % | | | 0.08 | % | | | 0.09 | % | | | 0.09 | % | | | — | | | | — | | |
| Net investment income (loss) (i) | | | 1.33 | % | | | 1.49 | % | | | 1.71 | % | | | 0.10 | % | | | 0.61 | %(j) | | | (0.39 | )%(j) | |
| Portfolio turnover rate | | | 65 | % | | | 95 | % | | | 66 | % | | | 90 | % | | | 43 | %(h) | | | 96 | % | |
| Net assets, end of period (000's) | | $ | 297,149 | | | $ | 277,295 | | | $ | 71,270 | | | $ | 24,119 | | | $ | 21,664 | | | $ | 20,178 | | |
(a) The Fund changed its fiscal year end from December 31 to August 31.
(b) Class A shares were initially offered on November 1, 2002. Per share data and total return reflect activity from that date.
(c) Per share data was calculated using the average shares outstanding during the period.
(d) Rounds to less than $0.01 per share.
(e) Total return at net asset value assuming assuming all distributions reinvested and no initial sales charge or contingent deferred sales charge.
(f) Had the investment advisor and/or any of its affiliates not waived or reimbursed a portion of expenses, total return would have been reduced.
(g) Total return includes a voluntary reimbursement by the investment advisor for a realized investment loss due to a trading error. This reimbursement increased total return and net asset value per share by less than 0.01% and less than $0.01, respectively.
(h) Not annualized.
(i) The benefits derived from expense reductions had an impact of less than 0.01%.
(j) Annualized.
(k) Rounds to less than 0.01%.
See Accompanying Notes to Financial Statements.
117
Financial Highlights – Columbia International Stock Fund
Selected data for a fund share outstanding throughout each period is as follows:
| | | Year Ended August 31, | | Period Ended
August 31, | | Period Ended
December 31, | |
| Class B Shares | | 2007 | | 2006 | | 2005 | | 2004 | | 2003 (a) | | 2002 (b) | |
| Net Asset Value, Beginning of Period | | $ | 18.44 | | | $ | 15.37 | | | $ | 12.81 | | | $ | 11.23 | | | $ | 10.02 | | | $ | 10.04 | | |
| Income from Investment Operations: | |
| Net investment income (loss) (c) | | | 0.09 | | | | 0.11 | | | | 0.07 | | | | (0.09 | ) | | | (0.03 | ) | | | (0.05 | ) | |
Net realized and unrealized gain
on investments, foreign currency,
foreign capital gains tax and
written options | | | 2.99 | | | | 3.14 | | | | 2.49 | | | | 1.67 | | | | 1.24 | | | | 0.03 | | |
| Total from investment operations | | | 3.08 | | | | 3.25 | | | | 2.56 | | | | 1.58 | | | | 1.21 | | | | (0.02 | ) | |
| Less Distributions to Shareholders: | |
| From net investment income | | | (0.15 | ) | | | (0.01 | ) | | | — | | | | — | | | | — | | | | — | | |
| From net realized gains | | | (1.97 | ) | | | (0.17 | ) | | | — | | | | — | | | | — | | | | — | | |
| Total distributions to shareholders | | | (2.12 | ) | | | (0.18 | ) | | | — | | | | — | | | | — | | | | — | | |
| Redemption Fees: | |
| Redemption fees added to paid-in-capital | | | — | (c)(d) | | | — | (c)(d) | | | — | (c)(d) | | | — | (c)(d) | | | — | | | | — | | |
| Net Asset Value, End of Period | | $ | 19.40 | | | $ | 18.44 | | | $ | 15.37 | | | $ | 12.81 | | | $ | 11.23 | | | $ | 10.02 | | |
| Total return (e)(f) | | | 17.54 | %(g) | | | 21.30 | % | | | 19.98 | % | | | 14.07 | % | | | 12.08 | %(h) | | | (0.20 | )%(h) | |
| Ratios to Average Net Assets/Supplemental Data: | |
| Net expenses before interest expense (i) | | | 1.99 | % | | | 1.94 | % | | | 2.01 | % | | | 2.50 | % | | | 2.98 | %(j) | | | 3.64 | %(j) | |
| Interest expense | | | — | %(k) | | | — | %(k) | | | — | | | | — | | | | — | | | | — | | |
| Net expenses (i) | | | 1.99 | % | | | 1.94 | % | | | 2.01 | % | | | 2.50 | % | | | 2.98 | %(j) | | | 3.64 | %(j) | |
| Waiver/Reimbursement | | | 0.10 | % | | | 0.08 | % | | | 0.10 | % | | | 0.18 | % | | | 0.11 | %(j) | | | 0.11 | %(j) | |
| Net investment income (loss) (i) | | | 0.49 | % | | | 0.62 | % | | | 0.47 | % | | | (0.69 | )% | | | (0.47 | )%(j) | | | (2.17 | )%(j) | |
| Portfolio turnover rate | | | 65 | % | | | 95 | % | | | 66 | % | | | 90 | % | | | 43 | %(h) | | | 96 | % | |
| Net assets, end of period (000's) | | $ | 29,925 | | | $ | 42,585 | | | $ | 12,026 | | | $ | 10,221 | | | $ | 10,316 | | | $ | 10,920 | | |
(a) The Fund changed its fiscal year end from December 31 to August 31.
(b) Class B shares were initially offered on November 1, 2002. Per share data and total return reflect activity from that date.
(c) Per share data was calculated using the average shares outstanding during the period.
(d) Rounds to less than $0.01 per share.
(e) Total return at net asset value assuming all distributions reinvested and no contingent deferred sales charge.
(f) Had the investment advisor and/or any of its affiliates not waived or reimbursed a portion of expenses, total return would have been reduced.
(g) Total return includes a voluntary reimbursement by the investment advisor for a realized investment loss due to a trading error. This reimbursement increased total return and net asset value per share by less than 0.01% and less than $0.01, respectively.
(h) Not annualized.
(i) The benefits derived from expense reductions had an impact of less than 0.01%.
(j) Annualized.
(k) Rounds to less than 0.01%.
See Accompanying Notes to Financial Statements.
118
Financial Highlights – Columbia International Stock Fund
Selected data for a fund share outstanding throughout each period is as follows:
| | | Year Ended August 31, | | Period Ended
August 31, | |
| Class C Shares | | 2007 | | 2006 | | 2005 | | 2004 (a) | |
| Net Asset Value, Beginning of Period | | $ | 18.51 | | | $ | 15.43 | | | $ | 12.86 | | | $ | 12.27 | | |
| Income from Investment Operations: | |
| Net investment income (loss) (b) | | | 0.11 | | | | 0.13 | | | | 0.07 | | | | (0.01 | ) | |
Net realized and unrealized gain on investments,
foreign currency, foreign capital gains tax and written options | | | 2.99 | | | | 3.13 | | | | 2.50 | | | | 0.60 | | |
| Total from investment operations | | | 3.10 | | | | 3.26 | | | | 2.57 | | | | 0.59 | | |
| Less Distributions to Shareholders: | |
| From net investment income | | | (0.15 | ) | | | (0.01 | ) | | | — | | | | — | | |
| From net realized gains | | | (1.97 | ) | | | (0.17 | ) | | | — | | | | — | | |
| Total distributions to shareholders | | | (2.12 | ) | | | (0.18 | ) | | | — | | | | — | | |
| Redemption Fees: | |
| Redemption fees added to paid-in-capital (b)(c) | | | — | | | | — | | | | — | | | | — | | |
| Net Asset Value, End of Period | | $ | 19.49 | | | $ | 18.51 | | | $ | 15.43 | | | $ | 12.86 | | |
| Total return (d)(e) | | | 17.59 | %(f) | | | 21.28 | % | | | 19.98 | % | | | 4.81 | %(g) | |
| Ratios to Average Net Assets/Supplemental Data: | |
| Net expenses before interest expense (h) | | | 1.99 | % | | | 1.94 | % | | | 2.01 | % | | | 2.11 | %(i) | |
| Interest expense | | | — | %(j) | | | — | %(j) | | | — | | | | — | | |
| Net expenses (h) | | | 1.99 | % | | | 1.94 | % | | | 2.01 | % | | | 2.11 | %(i) | |
| Waiver/Reimbursement | | | 0.10 | % | | | 0.08 | % | | | 0.10 | % | | | 0.35 | %(i) | |
| Net investment income (loss) (h) | | | 0.57 | % | | | 0.75 | % | | | 0.46 | % | | | (0.05 | )%(i) | |
| Portfolio turnover rate | | | 65 | % | | | 95 | % | | | 66 | % | | | 90 | % | |
| Net assets, end of period (000's) | | $ | 29,144 | | | $ | 27,806 | | | $ | 904 | | | $ | 632 | | |
(a) Class C shares were initially offered on October 13, 2003. Per share data and total return reflect activity from that date.
(b) Per share data was calculated using the average shares outstanding during the period.
(c) Rounds to less than $0.01 per share.
(d) Total return at net asset value assuming all distributions reinvested and no contingent deferred sales charge.
(e) Had the investment advisor and/or any of its affiliates not waived or reimbursed a portion of expenses, total return would have been reduced.
(f) Total return includes a voluntary reimbursement by the investment advisor for a realized investment loss due to a trading error. This reimbursement increased total return and net asset value per share by less than 0.01% and less than $0.01, respectively.
(g) Not annualized.
(h) The benefits derived from expense reductions had an impact of less than 0.01%.
(i) Annualized.
(j) Rounds to less than 0.01%.
See Accompanying Notes to Financial Statements.
119
Financial Highlights – Columbia International Stock Fund
Selected data for a fund share outstanding throughout each period is as follows:
| | | Year Ended August 31, | | Period Ended
August 31, | | Year Ended
December 31, | |
| Class Z Shares | | 2007 | | 2006 | | 2005 | | 2004 | | 2003 (a) | | 2002 (b) | |
| Net Asset Value, Beginning of Period | | $ | 19.03 | | | $ | 15.85 | | | $ | 13.14 | | | $ | 11.40 | | | $ | 10.05 | | | $ | 12.03 | | |
| Income from Investment Operations: | |
| Net investment income (loss) (c) | | | 0.31 | | | | 0.29 | | | | 0.25 | | | | 0.11 | | | | 0.07 | | | | — | (d) | |
Net realized and unrealized gain (loss)
on investments, foreign currency,
foreign capital gains tax and written options | | | 3.06 | | | | 3.23 | | | | 2.53 | | | | 1.67 | | | | 1.27 | | | | (1.94 | ) | |
| Total from investment operations | | | 3.37 | | | | 3.52 | | | | 2.78 | | | | 1.78 | | | | 1.34 | | | | (1.94 | ) | |
| Less Distributions to Shareholders: | |
| From net investment income | | | (0.34 | ) | | | (0.17 | ) | | | (0.07 | ) | | | (0.04 | ) | | | — | | | | (0.01 | ) | |
| From net realized gains | | | (1.97 | ) | | | (0.17 | ) | | | — | | | | — | | | | — | | | | — | | |
| Return of capital | | | — | | | | — | | | | — | | | | — | | | | — | | | | (0.03 | ) | |
| Total distributions to shareholders | | | (2.31 | ) | | | (0.34 | ) | | | (0.07 | ) | | | (0.04 | ) | | | — | | | | (0.04 | ) | |
| Redemption Fees: | |
| Redemption fees added to paid-in-capital | | | — | (c)(d) | | | — | (c)(d) | | | — | (c)(d) | | | — | (c)(d) | | | 0.01 | (c) | | | — | | |
| Net Asset Value, End of Period | | $ | 20.09 | | | $ | 19.03 | | | $ | 15.85 | | | $ | 13.14 | | | $ | 11.40 | | | $ | 10.05 | | |
| Total return (e)(f) | | | 18.73 | %(g) | | | 22.45 | % | | | 21.20 | % | | | 15.65 | % | | | 13.43 | %(h) | | | (16.10 | )% | |
| Ratios to Average Net Assets/Supplemental Data: | |
| Net expenses before interest expense (i) | | | 0.99 | % | | | 0.94 | % | | | 1.00 | % | | | 1.10 | % | | | 1.47 | %(j) | | | 1.49 | % | |
| Interest expense | | | — | %(k) | | | — | %(k) | | | — | | | | — | | | | — | | | | — | | |
| Net expenses (i) | | | 0.99 | % | | | 0.94 | % | | | 1.00 | % | | | 1.10 | % | | | 1.47 | %(j) | | | 1.49 | % | |
| Waiver/Reimbursement | | | 0.10 | % | | | 0.08 | % | | | 0.10 | % | | | 0.18 | % | | | 0.12 | %(j) | | | 0.12 | % | |
| Net investment income (loss) (i) | | | 1.55 | % | | | 1.63 | % | | | 1.71 | % | | | 0.81 | % | | | 1.03 | %(j) | | | (0.02 | )% | |
| Portfolio turnover rate | | | 65 | % | | | 95 | % | | | 66 | % | | | 90 | % | | | 43 | %(h) | | | 96 | % | |
| Net assets, end of period (000's) | | $ | 1,011,212 | | | $ | 1,005,878 | | | $ | 964,495 | | | $ | 558,082 | | | $ | 248,718 | | | $ | 143,332 | | |
(a) The Fund changed its fiscal year end from December 31 to August 31.
(b) On November 1, 2002, the existing Fund shares were renamed Class Z shares.
(c) Per share data was calculated using the average shares outstanding during the period.
(d) Rounds to less than $0.01 per share.
(e) Total return at net asset value assuming all distributions reinvested.
(f) Had the investment advisor and/or any of its affiliates not waived or reimbursed a portion of expenses, total return would have been reduced.
(g) Total return includes a voluntary reimbursement by the investment advisor for a realized investment loss due to a trading error. This reimbursement increased total return and net asset value per share by less than 0.01% and less than $0.01, respectively.
(h) Not annualized.
(i) The benefits derived from expense reductions had an impact of less than 0.01%.
(j) Annualized.
(k) Rounds to less than 0.01%.
See Accompanying Notes to Financial Statements.
120
Financial Highlights – Columbia Mid Cap Growth Fund
Selected data for a fund share outstanding throughout each period is as follows:
| | | Year Ended August 31, | | Period Ended
August 31, | | Period Ended
December 31, | |
| Class A Shares | | 2007 | | 2006 | | 2005 | | 2004 | | 2003 (a) | | 2002 (b) | |
| Net Asset Value, Beginning of Period | | $ | 24.01 | | | $ | 22.16 | | | $ | 16.99 | | | $ | 18.09 | | | $ | 14.77 | | | $ | 15.15 | | |
| Income from Investment Operations: | |
| Net investment income (loss) (c) | | | (0.01 | )(d) | | | (0.10 | ) | | | (0.15 | ) | | | (0.23 | ) | | | (0.14 | ) | | | (0.02 | ) | |
Net realized and unrealized gain (loss)
on investments, foreign currency
and written options | | | 4.97 | | | | 2.26 | | | | 5.32 | | | | (0.87 | ) | | | 3.46 | | | | (0.36 | ) | |
| Total from investment operations | | | 4.96 | | | | 2.16 | | | | 5.17 | | | | (1.10 | ) | | | 3.32 | | | | (0.38 | ) | |
| Less Distributions to Shareholders: | |
| From net realized gains | | | (1.46 | ) | | | (0.31 | ) | | | — | | | | — | | | | — | | | | — | | |
| Net Asset Value, End of Period | | $ | 27.51 | | | $ | 24.01 | | | $ | 22.16 | | | $ | 16.99 | | | $ | 18.09 | | | $ | 14.77 | | |
| Total return (e) | | | 21.24 | % | | | 9.76 | %(f) | | | 30.43 | %(f) | | | (6.08 | )%(f) | | | 22.48 | %(f)(g) | | | (2.51 | )%(f)(g) | |
| Ratios to Average Net Assets/Supplemental Data: | |
| Net expenses before interest expense (h) | | | 1.17 | % | | | 1.21 | % | | | 1.23 | % | | | 1.53 | % | | | 1.60 | %(i) | | | 1.49 | %(i) | |
| Interest expense | | | — | %(j) | | | — | | | | — | %(j) | | | — | | | | — | | | | — | | |
| Net expenses (h) | | | 1.17 | % | | | 1.21 | % | | | 1.23 | % | | | 1.53 | % | | | 1.60 | %(i) | | | 1.49 | %(i) | |
| Waiver/Reimbursement | | | — | | | | 0.01 | % | | | 0.05 | % | | | 0.02 | % | | | 0.01 | %(i) | | | 0.01 | %(i) | |
| Net investment loss (h) | | | (0.05 | )% | | | (0.43 | )% | | | (0.76 | )% | | | (1.21 | )% | | | (1.31 | )%(i) | | | (1.22 | )%(i) | |
| Portfolio turnover rate | | | 171 | % | | | 67 | % | | | 104 | % | | | 139 | % | | | 78 | %(g) | | | 88 | % | |
| Net assets, end of period (000's) | | $ | 49,614 | | | $ | 12,654 | | | $ | 6,078 | | | $ | 4,432 | | | $ | 4,525 | | | $ | 1,180 | | |
(a) The Fund changed its fiscal year end from December 31 to August 31.
(b) Class A shares were initially offered on November 1, 2002. Per share data and total return reflect activity from that date.
(c) Per share data was calculated using the average shares outstanding during the period.
(d) Net investment income per share reflects special dividends. The effect of these dividends amounted to $0.07 per share.
(e) Total return at net asset value assuming all distributions reinvested and no initial sales charge or contingent deferred sales charge.
(f) Had the investment advisor and/or any of its affiliates not waived or reimbursed a portion of expenses, total return would have been reduced.
(g) Not annualized.
(h) The benefits derived from expense reductions had an impact of less than 0.01%.
(i) Annualized.
(j) Rounds to less than 0.01%.
See Accompanying Notes to Financial Statements.
121
Financial Highlights – Columbia Mid Cap Growth Fund
Selected data for a fund share outstanding throughout each period is as follows:
| | | Year Ended August 31, | | Period Ended
August 31, | | Period Ended
December 31, | |
| Class B Shares | | 2007 | | 2006 | | 2005 | | 2004 | | 2003 (a) | | 2002 (b) | |
| Net Asset Value, Beginning of Period | | $ | 23.32 | | | $ | 21.69 | | | $ | 16.75 | | | $ | 17.98 | | | $ | 14.76 | | | $ | 15.15 | | |
| Income from Investment Operations: | |
| Net investment loss (c) | | | (0.20 | )(d) | | | (0.28 | ) | | | (0.30 | ) | | | (0.36 | ) | | | (0.22 | ) | | | (0.04 | ) | |
Net realized and unrealized gain (loss)
on investments, foreign currency
and written options | | | 4.81 | | | | 2.22 | | | | 5.24 | | | | (0.87 | ) | | | 3.44 | | | | (0.35 | ) | |
| Total from investment operations | | | 4.61 | | | | 1.94 | | | | 4.94 | | | | (1.23 | ) | | | 3.22 | | | | (0.39 | ) | |
| Less Distributions to Shareholders: | |
| From net realized gains | | | (1.46 | ) | | | (0.31 | ) | | | — | | | | — | | | | — | | | | — | | |
| Net Asset Value, End of Period | | $ | 26.47 | | | $ | 23.32 | | | $ | 21.69 | | | $ | 16.75 | | | $ | 17.98 | | | $ | 14.76 | | |
| Total return (e) | | | 20.33 | % | | | 8.95 | %(f) | | | 29.49 | %(f) | | | (6.84 | )%(f) | | | 21.82 | %(f)(g) | | | (2.57 | )%(f)(g) | |
| Ratios to Average Net Assets/Supplemental Data: | |
| Net expenses before interest expense (h) | | | 1.92 | % | | | 1.96 | % | | | 1.98 | % | | | 2.29 | % | | | 2.36 | %(i) | | | 2.32 | %(i) | |
| Interest expense | | | — | %(j) | | | — | | | | — | %(j) | | | — | | | | — | | | | — | | |
| Net expenses (h) | | | 1.92 | % | | | 1.96 | % | | | 1.98 | % | | | 2.29 | % | | | 2.36 | %(i) | | | 2.32 | %(i) | |
| Waiver/Reimbursement | | | — | | | | 0.01 | % | | | 0.05 | % | | | 0.10 | % | | | 0.12 | %(i) | | | 0.12 | %(i) | |
| Net investment loss (h) | | | (0.79 | )% | | | (1.19 | )% | | | (1.51 | )% | | | (1.97 | )% | | | (2.06 | )%(i) | | | (2.05 | )%(i) | |
| Portfolio turnover rate | | | 171 | % | | | 67 | % | | | 104 | % | | | 139 | % | | | 78 | %(g) | | | 88 | % | |
| Net assets, end of period (000's) | | $ | 19,472 | | | $ | 7,452 | | | $ | 6,377 | | | $ | 5,079 | | | $ | 4,242 | | | $ | 3,383 | | |
(a) The Fund changed its fiscal year end from December 31 to August 31.
(b) Class B shares were initially offered on November 1, 2002. Per share data and total return reflect activity from that date.
(c) Per share data was calculated using the average shares outstanding during the period.
(d) Net investment income per share reflects special dividends. The effect of these dividends amounted to $0.07 per share.
(e) Total return at net asset value assuming all distributions reinvested and no contingent deferred sales charge.
(f) Had the investment advisor and/or any of its affiliates not waived or reimbursed a portion of expenses, total return would have been reduced.
(g) Not annualized.
(h) The benefits derived from expense reductions had an impact of less than 0.01%.
(i) Annualized.
(j) Rounds to less than 0.01%.
See Accompanying Notes to Financial Statements.
122
Financial Highlights – Columbia Mid Cap Growth Fund
Selected data for a fund share outstanding throughout each period is as follows:
| | | Year Ended August 31, | | Period Ended
August 31, | |
| Class C Shares | | 2007 | | 2006 | | 2005 | | 2004 (a) | |
| Net Asset Value, Beginning of Period | | $ | 23.37 | | | $ | 21.74 | | | $ | 16.79 | | | $ | 17.88 | | |
| Income from Investment Operations: | |
| Net investment loss (b) | | | (0.21 | )(c) | | | (0.28 | ) | | | (0.30 | ) | | | (0.30 | ) | |
Net realized and unrealized gain (loss) on investments,
foreign currency and written options | | | 4.83 | | | | 2.22 | | | | 5.25 | | | | (0.79 | ) | |
| Total from investment operations | | | 4.62 | | | | 1.94 | | | | 4.95 | | | | (1.09 | ) | |
| Less Distributions to Shareholders: | |
| From net realized gains | | | (1.46 | ) | | | (0.31 | ) | | | — | | | | — | | |
| Net Asset Value, End of Period | | $ | 26.53 | | | $ | 23.37 | | | $ | 21.74 | | | $ | 16.79 | | |
| Total return (d) | | | 20.33 | % | | | 8.93 | %(e) | | | 29.48 | %(e) | | | (6.10 | )%(e)(f) | |
| Ratios to Average Net Assets/Supplemental Data: | |
| Net expenses before interest expense (g) | | | 1.92 | % | | | 1.96 | % | | | 1.98 | % | | | 2.18 | %(h) | |
| Interest expense | | | — | %(i) | | | — | | | | — | %(i) | | | — | | |
| Net expenses (g) | | | 1.92 | % | | | 1.96 | % | | | 1.98 | % | | | 2.18 | %(h) | |
| Waiver/Reimbursement | | | — | | | | 0.01 | % | | | 0.05 | % | | | 0.08 | %(h) | |
| Net investment loss (g) | | | (0.81 | )% | | | (1.16 | )% | | | (1.52 | )% | | | (1.83 | )%(h) | |
| Portfolio turnover rate | | | 171 | % | | | 67 | % | | | 104 | % | | | 139 | % | |
| Net assets, end of period (000's) | | $ | 8,237 | | | $ | 2,454 | | | $ | 674 | | | $ | 501 | | |
(a) Class C shares were initially offered on October 13, 2003. Per share data and total return reflect activity from that date.
(b) Per share data was calculated using the average shares outstanding during the period.
(c) Net investment income per share reflects special dividends. The effect of these dividends amounted to $0.07 per share.
(d) Total return at net asset value assuming all distributions reinvested and no contingent deferred sales charge.
(e) Had the investment advisor and/or any of its affiliates not waived or reimbursed a portion of expenses, total return would have been reduced.
(f) Not annualized.
(g) The benefits derived from expense reductions had an impact of less than 0.01%.
(h) Annualized.
(i) Rounds to less than 0.01%.
See Accompanying Notes to Financial Statements.
123
Financial Highlights – Columbia Mid Cap Growth Fund
Selected data for a fund share outstanding throughout each period is as follows:
| Class R Shares | | Year Ended
August 31,
2007 | | Period Ended
August 31,
2006 (a) | |
| Net Asset Value, Beginning of Period | | $ | 23.97 | | | $ | 24.44 | | |
| Income from Investment Operations: | |
| Net investment loss (b) | | | (0.15 | )(c) | | | (0.10 | ) | |
Net realized and unrealized gain (loss) on investments,
foreign currency and written options | | | 5.03 | | | | (0.37 | ) | |
| Total from investment operations | | | 4.88 | | | | (0.47 | ) | |
| Less Distributions to Shareholders: | |
| From net realized gains | | | (1.46 | ) | | | — | | |
| Net Asset Value, End of Period | | $ | 27.39 | | | $ | 23.97 | | |
| Total return (d) | | | 20.93 | % | | | (1.92 | )%(e) | |
| Ratios to Average Net Assets/Supplemental Data: | |
| Net expenses before interest expense (f) | | | 1.42 | % | | | 1.47 | %(g) | |
| Interest expense | | | — | %(h) | | | — | | |
| Net expenses (f) | | | 1.42 | % | | | 1.47 | %(g) | |
| Net investment loss (f) | | | (0.57 | )% | | | (0.66 | )%(g) | |
| Portfolio turnover rate | | | 171 | % | | | 67 | % | |
| Net assets, end of period (000's) | | $ | 908 | | | $ | 57 | | |
(a) Class R shares were initially offered on January 23, 2006. Total return reflects activity from that date.
(b) Per share data was calculated using the average shares outstanding during the period.
(c) Net investment income per share reflects special dividends. The effect of these dividends amounted to $0.07 per share.
(d) Total return at net asset value assuming all distributions reinvested.
(e) Not annualized.
(f) The benefits derived from expense reductions had an impact of less than 0.01%.
(g) Annualized.
(h) Rounds to less than 0.01%.
See Accompanying Notes to Financial Statements.
124
Financial Highlights – Columbia Mid Cap Growth Fund
Selected data for a fund share outstanding throughout each period is as follows:
| | | Year Ended August 31, | | Period
Ended
August 31, | | Period
Ended
December 31, | |
| Class T Shares | | 2007 | | 2006 | �� | 2005 | | 2004 | | 2003 (a) | | 2002 (b) | |
| Net Asset Value, Beginning of Period | | $ | 24.04 | | | $ | 22.20 | | | $ | 17.03 | | | $ | 18.12 | | | $ | 14.79 | | | $ | 15.15 | | |
| Income from Investment Operations: | |
| Net investment loss (c) | | | (0.03 | )(d) | | | (0.12 | ) | | | (0.16 | ) | | | (0.22 | ) | | | (0.12 | ) | | | (0.02 | ) | |
Net realized and unrealized gain (loss)
on investments, foreign currency and written options | | | 4.98 | | | | 2.27 | | | | 5.33 | | | | (0.87 | ) | | | 3.45 | | | | (0.34 | ) | |
| Total from investment operations | | | 4.95 | | | | 2.15 | | | | 5.17 | | | | (1.09 | ) | | | 3.33 | | | | (0.36 | ) | |
| Less Distributions to Shareholders: | |
| From net realized gains | | | (1.46 | ) | | | (0.31 | ) | | | — | | | | — | | | | — | | | | — | | |
| Net Asset Value, End of Period | | $ | 27.53 | | | $ | 24.04 | | | $ | 22.20 | | | $ | 17.03 | | | $ | 18.12 | | | $ | 14.79 | | |
| Total return (e) | | | 21.17 | % | | | 9.70 | %(f) | | | 30.36 | %(f) | | | (6.02 | )%(f) | | | 22.52 | %(g) | | | (2.38 | )%(g) | |
| Ratios to Average Net Assets/Supplemental Data: | |
| Net expenses before interest expense (h) | | | 1.22 | % | | | 1.26 | % | | | 1.28 | % | | | 1.50 | % | | | 1.46 | %(i) | | | 1.45 | %(i) | |
| Interest expense | | | — | %(j) | | | — | | | | — | %(j) | | | — | | | | — | | | | — | | |
| Net expenses (h) | | | 1.22 | % | | | 1.26 | % | | | 1.28 | % | | | 1.50 | % | | | 1.46 | %(i) | | | 1.45 | %(i) | |
| Waiver/Reimbursement | | | — | | | | 0.01 | % | | | 0.05 | % | | | 0.01 | % | | | — | | | | — | | |
| Net investment loss (h) | | | (0.10 | )% | | | (0.50 | )% | | | (0.82 | )% | | | (1.19 | )% | | | (1.16 | )%(i) | | | (1.18 | )%(i) | |
| Portfolio turnover rate | | | 171 | % | | | 67 | % | | | 104 | % | | | 139 | % | | | 78 | %(g) | | | 88 | % | |
| Net assets, end of period (000's) | | $ | 29,282 | | | $ | 27,101 | | | $ | 27,969 | | | $ | 25,236 | | | $ | 29,920 | | | $ | 25,966 | | |
(a) The Fund changed its fiscal year end from December 31 to August 31.
(b) Class T shares were initially offered on November 1, 2002. Per share data and total return reflect activity from that date.
(c) Per share data was calculated using the average shares outstanding during the period.
(d) Net investment income per share reflects special dividends. The effect of these dividends amounted to $0.07 per share.
(e) Total return at net asset value assuming all distributions reinvested and no initial sales charge or contingent deferred sales charge.
(f) Had the investment advisor and/or any of its affiliates not waived or reimbursed a portion of expenses, total return would have been reduced.
(g) Not annualized.
(h) The benefits derived from expense reductions had an impact of less than 0.01%.
(i) Annualized.
(j) Rounds to less than 0.01%.
See Accompanying Notes to Financial Statements.
125
Financial Highlights – Columbia Mid Cap Growth Fund
Selected data for a fund share outstanding throughout each period is as follows:
| | | Year Ended August 31, | | Period
Ended
August 31, | | Year
Ended
December 31, | |
| Class Z Shares | | 2007 | | 2006 | | 2005 | | 2004 | | 2003 (a) | | 2002 (b) | |
| Net Asset Value, Beginning of Period | | $ | 24.35 | | | $ | 22.41 | | | $ | 17.14 | | | $ | 18.17 | | | $ | 14.79 | | | $ | 19.60 | | |
| Income from Investment Operations: | |
| Net investment income (loss) (c) | | | 0.05 | (d) | | | (0.05 | ) | | | (0.10 | ) | | | (0.14 | ) | | | (0.08 | ) | | | (0.13 | ) | |
Net realized and unrealized gain (loss)
on investments, foreign currency
and written options | | | 5.04 | | | | 2.30 | | | | 5.37 | | | | (0.89 | ) | | | 3.46 | | | | (4.68 | ) | |
| Total from investment operations | | | 5.09 | | | | 2.25 | | | | 5.27 | | | | (1.03 | ) | | | 3.38 | | | | (4.81 | ) | |
| Less Distributions to Shareholders: | |
| From net investment income | | | (0.05 | ) | | | — | | | | — | | | | — | | | | — | | | | — | | |
| From net realized gains | | | (1.46 | ) | | | (0.31 | ) | | | — | | | | — | | | | — | | | | — | | |
| Total distributions to shareholders | | | (1.51 | ) | | | (0.31 | ) | | | — | | | | — | | | | — | | | | — | | |
| Net Asset Value, End of Period | | $ | 27.93 | | | $ | 24.35 | | | $ | 22.41 | | | $ | 17.14 | | | $ | 18.17 | | | $ | 14.79 | | |
| Total return (e) | | | 21.49 | % | | | 10.06 | %(f) | | | 30.75 | %(f) | | | (5.67 | )%(f) | | | 22.85 | %(f)(g) | | | (24.54 | )%(f) | |
| Ratios to Average Net Assets/Supplemental Data: | |
| Net expenses before interest expense (h) | | | 0.92 | % | | | 0.96 | % | | | 0.98 | % | | | 1.07 | % | | | 1.09 | %(i) | | | 1.12 | % | |
| Interest expense | | | — | %(j) | | | — | | | | — | %(j) | | | — | | | | — | | | | — | | |
| Net expenses (h) | | | 0.92 | % | | | 0.96 | % | | | 0.98 | % | | | 1.07 | % | | | 1.09 | %(i) | | | 1.12 | % | |
| Waiver/Reimbursement | | | — | | | | 0.01 | % | | | 0.05 | % | | | 0.05 | % | | | 0.05 | %(i) | | | 0.05 | % | |
| Net investment income (loss) (h) | | | 0.20 | % | | | (0.20 | )% | | | (0.52 | )% | | | (0.75 | )% | | | (0.80 | )%(i) | | | (0.85 | )% | |
| Portfolio turnover rate | | | 171 | % | | | 67 | % | | | 104 | % | | | 139 | % | | | 78 | %(g) | | | 88 | % | |
| Net assets, end of period (000's) | | $ | 1,452,707 | | | $ | 807,089 | | | $ | 799,505 | | | $ | 825,988 | | | $ | 998,943 | | | $ | 807,342 | | |
(a) The Fund changed its fiscal year end from December 31 to August 31.
(b) On November 1, 2002, the existing Fund shares were renamed Class Z shares.
(c) Per share data was calculated using the average shares outstanding during the period.
(d) Net investment income per share reflects special dividends. The effect of these dividends amounted to $0.07 per share.
(e) Total return at net asset value assuming all distributions reinvested.
(f) Had the investment advisor and/or any of its affiliates not waived or reimbursed a portion of expenses, total return would have been reduced.
(g) Not annualized.
(h) The benefits derived from expense reductions had an impact of less than 0.01%.
(i) Annualized.
(j) Rounds to less than 0.01%.
See Accompanying Notes to Financial Statements.
126
Financial Highlights – Columbia Small Cap Growth Fund I
Selected data for a fund share outstanding throughout each period is as follows:
| Class A Shares | | Year
Ended
August 31,
2007 | | Period Ended
August 31,
2006 (a) | |
| Net Asset Value, Beginning of Period | | $ | 30.29 | | | $ | 27.47 | | |
| Income from Investment Operations: | |
| Net investment loss (b) | | | (0.25 | ) | | | (0.30 | ) | |
Net realized and unrealized gain on investments,
foreign currency and written options | | | 6.38 | | | | 4.01 | | |
| Total from investment operations | | | 6.13 | | | | 3.71 | | |
| Less Distributions to Shareholders: | |
| From net realized gains | | | (4.73 | ) | | | (0.89 | ) | |
| Net Asset Value, End of Period | | $ | 31.69 | | | $ | 30.29 | | |
| Total return (c) | | | 21.96 | % | | | 13.73 | %(d) | |
| Ratios to Average Net Assets/Supplemental Data: | |
| Net expenses before interest expense (e) | | | 1.40 | % | | | 1.46 | %(f) | |
| Interest expense (g) | | | — | % | | | — | %(f) | |
| Net expenses (e) | | | 1.40 | % | | | 1.46 | %(f) | |
| Net investment loss (e) | | | (0.82 | )% | | | (1.15 | )%(f) | |
| Portfolio turnover rate | | | 151 | % | | | 109 | % | |
| Net assets, end of period (000's) | | $ | 18,430 | | | $ | 2,836 | | |
(a) Class A shares were initially offered November 1, 2005.
(b) Per share data was calculated using the average shares outstanding during the period.
(c) Total return at net asset value assuming all distributions reinvested and no initial sales charge or contingent defered sales charge.
(d) Not annualized.
(e) The benefits derived from expense reductions had an impact of less than 0.01%.
(f) Annualized.
(g) Rounds to less than 0.01%.
See Accompanying Notes to Financial Statements.
127
Financial Highlights – Columbia Small Cap Growth Fund I
Selected data for a fund share outstanding throughout each period is as follows:
| Class B Shares | | Year
Ended
August 31,
2007 | | Period Ended
August 31,
2006 (a) | |
| Net Asset Value, Beginning of Period | | $ | 30.14 | | | $ | 27.47 | | |
| Income from Investment Operations: | |
| Net investment loss (b) | | | (0.48 | ) | | | (0.50 | ) | |
Net realized and unrealized gain on investments,
foreign currency and written options | | | 6.33 | | | | 4.06 | | |
| Total from investment operations | | | 5.85 | | | | 3.56 | | |
| Less Distributions to Shareholders: | |
| From net realized gains | | | (4.73 | ) | | | (0.89 | ) | |
| Net Asset Value, End of Period | | $ | 31.26 | | | $ | 30.14 | | |
| Total return (c) | | | 21.05 | % | | | 13.17 | %(d) | |
| Ratios to Average Net Assets/Supplemental Data: | |
| Net expenses before interest expense (e) | | | 2.15 | % | | | 2.21 | %(f) | |
| Interest expense (g) | | | — | % | | | — | %(f) | |
| Net expenses (e) | | | 2.15 | % | | | 2.21 | %(f) | |
| Net investment loss (e) | | | (1.57 | )% | | | (1.92 | )%(f) | |
| Portfolio turnover rate | | | 151 | % | | | 109 | % | |
| Net assets, end of period (000's) | | $ | 1,254 | | | $ | 521 | | |
(a) Class B shares were initially offered November 1, 2005.
(b) Per share data was calculated using the average shares outstanding during the period.
(c) Total return at net asset value assuming all distributions reinvested and no contingent deferred sales charge.
(d) Not annualized.
(e) The benefits derived from expense reductions had an impact of less than 0.01%.
(f) Annualized.
(g) Rounds to less than 0.01%.
See Accompanying Notes to Financial Statements.
128
Financial Highlights – Columbia Small Cap Growth Fund I
Selected data for a fund share outstanding throughout each period is as follows:
| Class C Shares | | Year
Ended
August 31,
2007 | | Period Ended
August 31,
2006 (a) | |
| Net Asset Value, Beginning of Period | | $ | 30.14 | | | $ | 27.47 | | |
| Income from Investment Operations: | |
| Net investment loss (b) | | | (0.48 | ) | | | (0.49 | ) | |
Net realized and unrealized gain on investments,
foreign currency and written options | | | 6.32 | | | | 4.05 | | |
| Total from investment operations | | | 5.84 | | | | 3.56 | | |
| Less Distributions to Shareholders: | |
| From net realized gains | | | (4.73 | ) | | | (0.89 | ) | |
| Net Asset Value, End of Period | | $ | 31.25 | | | $ | 30.14 | | |
| Total return (c) | | | 21.02 | % | | | 13.17 | %(d) | |
| Ratios to Average Net Assets/Supplemental Data: | |
| Net expenses before interest expense (e) | | | 2.15 | % | | | 2.21 | %(f) | |
| Interest expense (g) | | | — | % | | | — | %(f) | |
| Net expenses (e) | | | 2.15 | % | | | 2.21 | %(f) | |
| Net investment loss (e) | | | (1.56 | )% | | | (1.92 | )%(f) | |
| Portfolio turnover rate | | | 151 | % | | | 109 | % | |
| Net assets, end of period (000's) | | $ | 2,303 | | | $ | 427 | | |
(a) Class C shares were initially offered November 1, 2005.
(b) Per share data was calculated using average shares outstanding during the period.
(c) Total return at net asset value assuming all distributions reinvested and no contingent deferred sales charge.
(d) Not annualized.
(e) The benefits derived from expense reductions had an impact of less than 0.01%.
(f) Annualized.
(g) Rounds to less than 0.01%.
See Accompanying Notes to Financial Statements.
129
Financial Highlights – Columbia Small Cap Growth Fund I
Selected data for a fund share outstanding throughout each period is as follows:
| | | Year Ended August 31, | | Period
Ended
August 31, | | Year
Ended
December 31, | |
| Class Z Shares | | 2007 | | 2006 | | 2005 | | 2004 | | 2003 (a) | | 2002 (b) | |
| Net Asset Value, Beginning of Period | | $ | 30.36 | | | $ | 27.80 | | | $ | 21.32 | | | $ | 21.62 | | | $ | 16.30 | | | $ | 22.20 | | |
| Income from Investment Operations: | |
| Net investment loss (c) | | | (0.18 | ) | | | (0.29 | ) | | | (0.24 | ) | | | (0.24 | ) | | | (0.13 | ) | | | (0.17 | ) | |
Net realized and unrealized gain (loss)
on investments, foreign currency and
written options | | | 6.41 | | | | 3.74 | | | | 6.72 | | | | (0.06 | ) | | | 5.45 | | | | (5.73 | ) | |
| Total from investment operations | | | 6.23 | | | | 3.45 | | | | 6.48 | | | | (0.30 | ) | | | 5.32 | | | | (5.90 | ) | |
| Less Distributions to Shareholders: | |
| From net investment income | | | — | (d) | | | — | | | | — | | | | — | | | | — | | | | — | | |
| From net realized gains | | | (4.73 | ) | | | (0.89 | ) | | | — | | | | — | | | | — | | | | — | | |
| Total distributions to shareholders | | | (4.73 | ) | | | (0.89 | ) | | | — | | | | — | | | | — | | | | — | | |
| Net Asset Value, End of Period | | $ | 31.86 | | | $ | 30.36 | | | $ | 27.80 | | | $ | 21.32 | | | $ | 21.62 | | | $ | 16.30 | | |
| Total return (e) | | | 22.28 | % | | | 12.64 | %(f) | | | 30.39 | %(g) | | | (1.39 | )% | | | 32.64 | %(h) | | | (26.58 | )% | |
| Ratios to Average Net Assets/Supplemental Data: | |
| Net expenses before interest expense (i) | | | 1.15 | % | | | 1.20 | % | | | 1.16 | % | | | 1.18 | % | | | 1.28 | %(j) | | | 1.24 | % | |
| Interest expense | | | — | %(k) | | | — | %(k) | | | — | %(k) | | | — | | | | — | | | | — | | |
| Net expenses (i) | | | 1.15 | % | | | 1.20 | % | | | 1.16 | % | | | 1.18 | % | | | 1.28 | %(j) | | | 1.24 | % | |
| Waiver/Reimbursement | | | — | | | | — | %(k) | | | — | | | | — | | | | — | | | | — | | |
| Net investment loss (i) | | | (0.59 | )% | | | (0.96 | )% | | | (0.99 | )% | | | (1.01 | )% | | | (1.09 | )%(j) | | | (0.90 | )% | |
| Portfolio turnover rate | | | 151 | % | | | 109 | % | | | 114 | % | | | 118 | % | | | 79 | %(h) | | | 109 | % | |
| Net assets, end of period (000's) | | $ | 220,887 | | | $ | 193,493 | | | $ | 214,659 | | | $ | 543,016 | | | $ | 637,616 | | | $ | 493,031 | | |
(a) The Fund changed its fiscal year end from December 31 to August 31.
(b) On November 1, 2002, the existing Fund shares were renamed Class Z shares.
(c) Per share data was calculated using the average shares outstanding during the period.
(d) Rounds to less than $0.01 per share
(e) Total return at net asset value assuming all distributions reinvested.
(f) Had the investment advisor and/or any of its affiliates not waived or reimbursed a portion of its expenses, total return would have been reduced.
(g) Total return includes a reimbursement of loss experienced by the Fund due to a compliance violation. This reimbursement had an impact of less than 0.01% on the Fund's total return.
(h) Not annualized.
(i) The benefits derived from expense reductions had an impact of less than 0.01%.
(j) Annualized.
(k) Rounds to less than 0.01%.
See Accompanying Notes to Financial Statements.
130
Financial Highlights – Columbia Real Estate Equity Fund
Selected data for a fund share outstanding throughout each period is as follows:
| | | Year Ended August 31, | | Period
Ended
August 31, | | Period
Ended
December 31, | |
| Class A Shares | | 2007 | | 2006 | | 2005 | | 2004 | | 2003 (a) | | 2002 (b) | |
| Net Asset Value, Beginning of Period | | $ | 29.07 | | | $ | 27.84 | | | $ | 25.59 | | | $ | 21.04 | | | $ | 17.80 | | | $ | 17.01 | | |
| Income from Investment Operations: | |
| Net investment income (c) | | | 0.22 | | | | 0.39 | | | | 0.79 | (d) | | | 0.77 | | | | 0.36 | (e) | | | 0.26 | | |
Net realized and unrealized gain
on investments | | | 1.24 | | | | 4.90 | | | | 4.73 | | | | 4.67 | | | | 3.11 | (e) | | | 0.78 | | |
| Total from investment operations | | | 1.46 | | | | 5.29 | | | | 5.52 | | | | 5.44 | | | | 3.47 | | | | 1.04 | | |
| Less Distributions to Shareholders: | |
| From net investment income | | | (0.33 | ) | | | (0.78 | ) | | | (0.75 | ) | | | (0.70 | ) | | | (0.23 | ) | | | (0.25 | ) | |
| From net realized gains | | | (9.48 | ) | | | (3.28 | ) | | | (2.52 | ) | | | (0.19 | ) | | | — | | | | — | | |
| Total distributions to shareholders | | | (9.81 | ) | | | (4.06 | ) | | | (3.27 | ) | | | (0.89 | ) | | | (0.23 | ) | | | (0.25 | ) | |
| Net Asset Value, End of Period | | $ | 20.72 | | | $ | 29.07 | | | $ | 27.84 | | | $ | 25.59 | | | $ | 21.04 | | | $ | 17.80 | | |
| Total return (f) | | | 1.72 | % | | | 21.66 | % | | | 22.65 | % | | | 26.42 | % | | | 19.62 | %(g) | | | 6.10 | %(g) | |
| Ratios to Average Net Assets/Supplemental Data: | |
| Net expenses before interest expense (h) | | | 1.21 | % | | | 1.19 | % | | | 1.18 | % | | | 1.20 | % | | | 1.55 | %(i) | | | 1.43 | %(i) | |
| Interest expense | | | — | %(j) | | | — | %(j) | | | — | | | | — | | | | — | | | | — | | |
| Net expenses (h) | | | 1.21 | % | | | 1.19 | % | | | 1.18 | % | | | 1.20 | % | | | 1.55 | %(i) | | | 1.43 | %(i) | |
| Net investment income (h) | | | 0.84 | % | | | 1.45 | % | | | 2.98 | % | | | 3.27 | % | | | 2.70 | %(e)(i) | | | 4.81 | %(i) | |
| Portfolio turnover rate | | | 67 | % | | | 10 | % | | | 10 | % | | | 28 | % | | | 33 | %(g) | | | 53 | % | |
| Net assets, end of period (000's) | | $ | 31,069 | | | $ | 44,685 | | | $ | 45,756 | | | $ | 32,703 | | | $ | 12,364 | | | $ | 905 | | |
(a) The Fund changed its fiscal year end from December 31 to August 31.
(b) Class A shares were initially offered on November 1, 2002. Per share data and total return reflect activity from that date.
(c) Per share data was calculated using the average shares outstanding during the period.
(d) Net investment income per share reflects a special dividend. The effect of this dividend amounted to $0.24 per share.
(e) Effective January 1, 2003, the Fund adopted the policy to reduce cost of investments for financial statement purposes by the distributions received in excess of income from Real Estate Investment Trusts. The effect of this change for the eight months ended August 31, 2003 was to decrease the net investment income per share by $0.05, increase net realized and unrealized gain on investments per share by $0.05 and decrease the ratio of net investment income to average net assets from 3.12% to 2.70%. Per share data and ratios for the period prior to August 31, 2003 have not been restated to reflect this change in policy.
(f) Total return at net asset value assuming all distributions reinvested and no initial sales charge or contingent deferred sales charge.
(g) Not annualized.
(h) The benefits derived from expense reductions had an impact of less than 0.01%.
(i) Annualized.
(j) Rounds to less than 0.01%.
See Accompanying Notes to Financial Statements.
131
Financial Highlights – Columbia Real Estate Equity Fund
Selected data for a fund share outstanding throughout each period is as follows:
| | | Year Ended August 31, | | Period
Ended
August 31, | | Period
Ended
December 31, | |
| Class B Shares | | 2007 | | 2006 | | 2005 | | 2004 | | 2003 (a) | | 2002 (b) | |
| Net Asset Value, Beginning of Period | | $ | 29.09 | | | $ | 27.85 | | | $ | 25.60 | | | $ | 21.03 | | | $ | 17.82 | | | $ | 17.01 | | |
| Income from Investment Operations: | |
| Net investment income (c) | | | 0.03 | | | | 0.19 | | | | 0.60 | (d) | | | 0.58 | | | | 0.24 | (e) | | | 0.22 | | |
Net realized and unrealized gain
on investments | | | 1.24 | | | | 4.90 | | | | 4.73 | | | | 4.70 | | | | 3.12 | (e) | | | 0.81 | | |
| Total from investment operations | | | 1.27 | | | | 5.09 | | | | 5.33 | | | | 5.28 | | | | 3.36 | | | | 1.03 | | |
| Less Distributions to Shareholders: | |
| From net investment income | | | (0.12 | ) | | | (0.57 | ) | | | (0.56 | ) | | | (0.52 | ) | | | (0.15 | ) | | | (0.22 | ) | |
| From net realized gains | | | (9.48 | ) | | | (3.28 | ) | | | (2.52 | ) | | | (0.19 | ) | | | — | | | | — | | |
| Total distributions to shareholders | | | (9.60 | ) | | | (3.85 | ) | | | (3.08 | ) | | | (0.71 | ) | | | (0.15 | ) | | | (0.22 | ) | |
| Net Asset Value, End of Period | | $ | 20.76 | | | $ | 29.09 | | | $ | 27.85 | | | $ | 25.60 | | | $ | 21.03 | | | $ | 17.82 | | |
| Total return (f) | | | 0.99 | % | | | 20.78 | % | | | 21.74 | % | | | 25.53 | % | | | 18.97 | %(g) | | | 6.09 | %(g) | |
| Ratios to Average Net Assets/Supplemental Data: | |
| Net expenses before interest expense (h) | | | 1.96 | % | | | 1.94 | % | | | 1.93 | % | | | 1.98 | % | | | 2.37 | %(i) | | | 2.18 | %(i) | |
| Interest expense | | | — | %(j) | | | — | %(j) | | | — | | | | — | | | | — | | | | — | | |
| Net expenses (h) | | | 1.96 | % | | | 1.94 | % | | | 1.93 | % | | | 1.98 | % | | | 2.37 | %(i) | | | 2.18 | %(i) | |
| Net investment income (h) | | | 0.10 | % | | | 0.72 | % | | | 2.26 | % | | | 2.47 | % | | | 1.86 | %(e)(i) | | | 4.06 | %(i) | |
| Portfolio turnover rate | | | 67 | % | | | 10 | % | | | 10 | % | | | 28 | % | | | 33 | %(g) | | | 53 | % | |
| Net assets, end of period (000's) | | $ | 9,663 | | | $ | 13,309 | | | $ | 14,393 | | | $ | 11,234 | | | $ | 4,776 | | | $ | 1,074 | | |
(a) The Fund changed its fiscal year end from December 31 to August 31.
(b) Class B shares were initially offered on November 1, 2002. Per share data and total return reflect activity from that date.
(c) Per share data was calculated using the average shares outstanding during the period.
(d) Net investment income per share reflects a special dividend. The effect of this dividend amounted to $0.24 per share.
(e) Effective January 1, 2003, the Fund adopted the policy to reduce cost of investments for financial statement purposes by the distributions received in excess of income from Real Estate Investment Trusts. The effect of this change for the eight months ended August 31, 2003 was to decrease the net investment income per share by $0.05, increase net realized and unrealized gain on investments per share by $0.05 and decrease the ratio of net investment income to average net assets from 2.28% to 1.86%. Per share data and ratios for the period prior to August 31, 2003 have not been restated to reflect this change in policy.
(f) Total return at net asset value assuming all distributions reinvested and no contingent deferred sales charge.
(g) Not annualized.
(h) The benefits derived from expense reductions had an impact of less than 0.01%.
(i) Annualized.
(j) Rounds to less than 0.01%.
See Accompanying Notes to Financial Statements.
132
Financial Highlights – Columbia Real Estate Equity Fund
Selected data for a fund share outstanding throughout each period is as follows:
| | | Year Ended August 31, | | Period
Ended
August 31, | |
| Class C Shares | | 2007 | | 2006 | | 2005 | | 2004 (a) | |
| Net Asset Value, Beginning of Period | | $ | 29.06 | | | $ | 27.83 | | | $ | 25.58 | | | $ | 21.99 | | |
| Income from Investment Operations: | |
| Net investment income (b) | | | 0.03 | | | | 0.18 | | | | 0.55 | (c) | | | 0.41 | | |
| Net realized and unrealized gain on investments | | | 1.23 | | | | 4.90 | | | | 4.78 | | | | 3.72 | | |
| Total from investment operations | | | 1.26 | | | | 5.08 | | | | 5.33 | | | | 4.13 | | |
| Less Distributions to Shareholders: | |
| From net investment income | | | (0.12 | ) | | | (0.57 | ) | | | (0.56 | ) | | | (0.35 | ) | |
| From net realized gains | | | (9.48 | ) | | | (3.28 | ) | | | (2.52 | ) | | | (0.19 | ) | |
| Total distributions to shareholders | | | (9.60 | ) | | | (3.85 | ) | | | (3.08 | ) | | | (0.54 | ) | |
| Net Asset Value, End of Period | | $ | 20.72 | | | $ | 29.06 | | | $ | 27.83 | | | $ | 25.58 | | |
| Total return (d) | | | 0.94 | % | | | 20.75 | % | | | 21.75 | % | | | 18.99 | %(e) | |
| Ratios to Average Net Assets/Supplemental Data: | |
| Net expenses before interest expense (f) | | | 1.96 | % | | | 1.94 | % | | | 1.93 | % | | | 1.95 | %(g) | |
| Interest expense | | | — | %(h) | | | — | %(h) | | | — | | | | — | | |
| Net expenses (f) | | | 1.96 | % | | | 1.94 | % | | | 1.93 | % | | | 1.95 | %(g) | |
| Net investment income (f) | | | 0.11 | % | | | 0.66 | % | | | 2.08 | % | | | 1.93 | %(g) | |
| Portfolio turnover rate | | | 67 | % | | | 10 | % | | | 10 | % | | | 28 | % | |
| Net assets, end of period (000's) | | $ | 8,263 | | | $ | 5,486 | | | $ | 4,821 | | | $ | 2,404 | | |
(a) Class C shares were initially offered on October 13, 2003. Per share data and total return reflect activity from that date.
(b) Per share data was calculated using the average shares outstanding during the period.
(c) Net investment income per share reflects a special dividend. The effect of this dividend amounted to $0.24 per share.
(d) Total return at net asset value assuming all distributions reinvested and no contingent deferred sales charge.
(e) Not annualized.
(f) The benefits derived from expense reductions had an impact of less than 0.01%.
(g) Annualized.
(h) Rounds to less than 0.01%.
See Accompanying Notes to Financial Statements.
133
Financial Highlights – Columbia Real Estate Equity Fund
Selected data for a fund share outstanding throughout each period is as follows:
| | | Year Ended August 31, | | Period
Ended
August 31, | | Year
Ended
December 31, | |
| Class Z Shares | | 2007 | | 2006 | | 2005 | | 2004 | | 2003 (a) | | 2002 (b) | |
| Net Asset Value, Beginning of Period | | $ | 29.10 | | | $ | 27.86 | | | $ | 25.60 | | | $ | 21.06 | | | $ | 17.81 | | | $ | 18.04 | | |
| Income from Investment Operations: | |
| Net investment income (c) | | | 0.29 | | | | 0.48 | | | | 0.90 | (d) | | | 0.88 | | | | 0.39 | (e) | | | 0.82 | | |
Net realized and unrealized gain (loss)
on investments | | | 1.22 | | | | 4.88 | | | | 4.70 | | | | 4.62 | | | | 3.14 | (e) | | | (0.25 | ) | |
| Total from investment operations | | | 1.51 | | | | 5.36 | | | | 5.60 | | | | 5.50 | | | | 3.53 | | | | 0.57 | | |
| Less Distributions to Shareholders: | |
| From net investment income | | | (0.39 | ) | | | (0.84 | ) | | | (0.82 | ) | | | (0.77 | ) | | | (0.28 | ) | | | (0.71 | ) | |
| From net realized gains | | | (9.48 | ) | | | (3.28 | ) | | | (2.52 | ) | | | (0.19 | ) | | | — | | | | (0.09 | ) | |
| Total distributions to shareholders | | | (9.87 | ) | | | (4.12 | ) | | | (3.34 | ) | | | (0.96 | ) | | | (0.28 | ) | | | (0.80 | ) | |
| Net Asset Value, End of Period | | $ | 20.74 | | | $ | 29.10 | | | $ | 27.86 | | | $ | 25.60 | | | $ | 21.06 | | | $ | 17.81 | | |
| Total return (f) | | | 1.95 | % | | | 21.99 | % | | | 22.99 | % | | | 26.72 | % | | | 20.01 | %(g) | | | 3.12 | % | |
| Ratios to Average Net Assets/Supplemental Data: | |
| Net expenses before interest expense (h) | | | 0.96 | % | | | 0.94 | % | | | 0.93 | % | | | 0.97 | % | | | 1.08 | %(i) | | | 0.94 | % | |
| Interest expense | | | — | %(j) | | | — | %(j) | | | — | | | | — | | | | — | | | | — | | |
| Net expenses (h) | | | 0.96 | % | | | 0.94 | % | | | 0.93 | % | | | 0.97 | % | | | 1.08 | %(i) | | | 0.94 | % | |
| Net investment income (h) | | | 1.10 | % | | | 1.78 | % | | | 3.40 | % | | | 3.78 | % | | | 3.09 | %(e)(i) | | | 5.30 | % | |
| Portfolio turnover rate | | | 67 | % | | | 10 | % | | | 10 | % | | | 28 | % | | | 33 | %(g) | | | 53 | % | |
| Net assets, end of period (000's) | | $ | 377,388 | | | $ | 578,899 | | | $ | 758,147 | | | $ | 872,924 | | | $ | 884,747 | | | $ | 774,646 | | |
(a) The Fund changed its fiscal year end from December 31 to August 31.
(b) On November 1, 2002, the existing Fund shares were renamed Class Z shares.
(c) Per share data was calculated using the average shares outstanding during the period.
(d) Net investment income per share reflects a special dividend. The effect of this dividend amounted to $0.24 per share.
(e) Effective January 1, 2003, the Fund adopted the policy to reduce cost of investments for financial statement purposes by the distributions received in excess of income from Real Estate Investment Trusts. The effect of this change for the eight months ended August 31, 2003 was to decrease the net investment income per share by $0.05, increase net realized and unrealized gain on investments per share by $0.05 and decrease the ratio of net investment income to average net assets from 3.51% to 3.09%. Per share data and ratios for the period prior to August 31, 2003 have not been restated to reflect this change in policy.
(f) Total return at net asset value assuming all distributions reinvested.
(g) Not annualized.
(h) The benefits derived from expense reductions had an impact of less than 0.01%.
(i) Annualized.
(j) Rounds to less than 0.01%.
See Accompanying Notes to Financial Statements.
134
Financial Highlights – Columbia Technology Fund
Selected data for a fund share outstanding throughout each period is as follows:
| | | Year Ended August 31, | | Period
Ended
August 31, | | Period
Ended
December 31, | |
| Class A Shares | | 2007 | | 2006 | | 2005 | | 2004 | | 2003 (a) | | 2002 (b) | |
| Net Asset Value, Beginning of Period | | $ | 9.33 | | | $ | 8.77 | | | $ | 6.50 | | | $ | 5.91 | | | $ | 3.79 | | | $ | 3.82 | | |
| Income from Investment Operations: | |
| Net investment loss (c) | | | (0.10 | ) | | | (0.09 | ) | | | (0.04 | ) | | | (0.11 | ) | | | (0.04 | ) | | | (0.01 | ) | |
Net realized and unrealized gain (loss)
on investments, futures contracts,
foreign currency and written options | | | 2.39 | | | | 1.21 | | | | 2.31 | | | | 0.70 | | | | 2.16 | | | | (0.02 | ) | |
| Total from investment operations | | | 2.29 | | | | 1.12 | | | | 2.27 | | | | 0.59 | | | | 2.12 | | | | (0.03 | ) | |
| Less Distributions to Shareholders: | |
| From net realized gains | | | — | | | | (0.56 | ) | | | — | | | | — | | | | — | | | | — | | |
| Net Asset Value, End of Period | | $ | 11.62 | | | $ | 9.33 | | | $ | 8.77 | | | $ | 6.50 | | | $ | 5.91 | | | $ | 3.79 | | |
| Total return (d) | | | 24.54 | % | | | 12.78 | %(e) | | | 34.92 | %(e) | | | 9.98 | %(e) | | | 55.94 | %(e)(f) | | | (0.79 | )%(e)(f) | |
| Ratios to Average Net Assets/Supplemental Data: | |
| Net expenses before interest expense (g) | | | 1.46 | % | | | 1.45 | % | | | 1.85 | % | | | 1.90 | % | | | 1.90 | %(h) | | | 1.76 | %(h) | |
| Interest expense | | | — | %(i) | | | — | %(i) | | | — | | | | — | | | | — | | | | — | | |
| Net expenses (g) | | | 1.46 | % | | | 1.45 | % | | | 1.85 | % | | | 1.90 | % | | | 1.90 | %(h) | | | 1.76 | %(h) | |
| Waiver/Reimbursement | | | — | | | | — | %(i) | | | 0.06 | % | | | 0.53 | % | | | 3.06 | %(h) | | | 1.24 | %(h) | |
| Net investment loss (g) | | | (0.96 | )% | | | (0.95 | )% | | | (1.47 | )% | | | (1.51 | )% | | | (1.35 | )%(h) | | | (1.35 | )%(h) | |
| Portfolio turnover rate | | | 210 | % | | | 350 | % | | | 328 | % | | | 488 | % | | | 523 | %(f) | | | 512 | % | |
| Net assets, end of period (000's) | | $ | 109,541 | | | $ | 75,996 | | | $ | 14,696 | | | $ | 2,818 | | | $ | 376 | | | $ | 1 | | |
(a) The Fund changed its fiscal year end from December 31 to August 31.
(b) Class A shares were initially offered on November 1, 2002. Per share data and total return reflect activity from that date.
(c) Per share data was calculated using the average shares outstanding during the period.
(d) Total return at net asset value assuming all distributions reinvested and no initial sales charge or contingent deferred sales charge.
(e) Had the investment advisor and/or any of its affiliates not waived or reimbursed a portion of expenses, total return would have been reduced.
(f) Not annualized.
(g) The benefits derived from expense reductions had an impact of less than 0.01%.
(h) Annualized.
(i) Rounds to less than 0.01%.
See Accompanying Notes to Financial Statements.
135
Financial Highlights – Columbia Technology Fund
Selected data for a fund share outstanding throughout each period is as follows:
| | | Year Ended August 31, | | Period
Ended
August 31, | | Period
Ended
December 31, | |
| Class B Shares | | 2007 | | 2006 | | 2005 | | 2004 | | 2003 (a) | | 2002 (b) | |
| Net Asset Value, Beginning of Period | | $ | 9.10 | | | $ | 8.57 | | | $ | 6.40 | | | $ | 5.86 | | | $ | 3.78 | | | $ | 3.82 | | |
| Income from Investment Operations: | |
| Net investment loss (c) | | | (0.17 | ) | | | (0.16 | ) | | | (0.17 | ) | | | (0.16 | ) | | | (0.07 | ) | | | (0.01 | ) | |
Net realized and unrealized gain (loss)
on investments, futures contracts,
foreign currency and written options | | | 2.32 | | | | 1.19 | | | | 2.34 | | | | 0.70 | | | | 2.15 | | | | (0.03 | ) | |
| Total from investment operations | | | 2.15 | | | | 1.03 | | | | 2.17 | | | | 0.54 | | | | 2.08 | | | | (0.04 | ) | |
| Less Distributions to Shareholders: | |
| From net realized gains | | | — | | | | (0.50 | ) | | | — | | | | — | | | | — | | | | — | | |
| Net Asset Value, End of Period | | $ | 11.25 | | | $ | 9.10 | | | $ | 8.57 | | | $ | 6.40 | | | $ | 5.86 | | | $ | 3.78 | | |
| Total return (d) | | | 23.63 | % | | | 11.98 | %(e) | | | 33.91 | %(e) | | | 9.22 | %(e) | | | 55.03 | %(e)(f) | | | (1.05 | )%(e)(f) | |
| Ratios to Average Net Assets/Supplemental Data: | |
| Net expenses before interest expense (g) | | | 2.21 | % | | | 2.20 | % | | | 2.60 | % | | | 2.65 | % | | | 2.65 | %(h) | | | 2.51 | %(h) | |
| Interest expense | | | — | %(i) | | | — | %(i) | | | — | | | | — | | | | — | | | | — | | |
| Net expenses (g) | | | 2.21 | % | | | 2.20 | % | | | 2.60 | % | | | 2.65 | % | | | 2.65 | %(h) | | | 2.51 | %(h) | |
| Waiver/Reimbursement | | | — | | | | — | %(i) | | | 0.06 | % | | | 0.48 | % | | | 2.40 | %(h) | | | 1.24 | %(h) | |
| Net investment loss (g) | | | (1.70 | )% | | | (1.70 | )% | | | (2.29 | )% | | | (2.30 | )% | | | (2.11 | )%(h) | | | (2.10 | )%(h) | |
| Portfolio turnover rate | | | 210 | % | | | 350 | % | | | 328 | % | | | 488 | % | | | 523 | %(f) | | | 512 | % | |
| Net assets, end of period (000's) | | $ | 10,580 | | | $ | 7,823 | | | $ | 3,183 | | | $ | 2,200 | | | $ | 1,246 | | | $ | 7 | | |
(a) The Fund changed its fiscal year end from December 31 to August 31.
(b) Class B shares were initially offered on November 1, 2002. Per share data and total return reflect activity from that date.
(c) Per share data was calculated using the average shares outstanding during the period.
(d) Total return at net asset value assuming all distributions reinvested and no contingent deferred sales charge.
(e) Had the investment advisor and/or any of its affiliates not waived or reimbursed a portion of expenses, total return would have been reduced.
(f) Not annualized.
(g) The benefits derived from expense reductions had an impact of less than 0.01%.
(h) Annualized.
(i) Rounds to less than 0.01%.
See Accompanying Notes to Financial Statements.
136
Financial Highlights – Columbia Technology Fund
Selected data for a fund share outstanding throughout each period is as follows:
| | | Year Ended August 31, | | Period
Ended
August 31, | |
| Class C Shares | | 2007 | | 2006 | | 2005 | | 2004 (a) | |
| Net Asset Value, Beginning of Period | | $ | 9.12 | | | $ | 8.59 | | | $ | 6.41 | | | $ | 6.48 | | |
| Income from Investment Operations: | |
| Net investment loss (b) | | | (0.17 | ) | | | (0.16 | ) | | | (0.17 | ) | | | (0.14 | ) | |
Net realized and unrealized gain on investments, futures contracts,
foreign currency and written options | | | 2.32 | | | | 1.19 | | | | 2.35 | | | | 0.07 | | |
| Total from investment operations | | | 2.15 | | | | 1.03 | | | | 2.18 | | | | (0.07 | ) | |
| Less Distributions to Shareholders: | |
| From net realized gains | | | — | | | | (0.50 | ) | | | — | | | | — | | |
| Net Asset Value, End of Period | | $ | 11.27 | | | $ | 9.12 | | | $ | 8.59 | | | $ | 6.41 | | |
| Total return (c) | | | 23.57 | % | | | 11.95 | %(d) | | | 34.01 | %(d) | | | (1.08 | )%(d)(e) | |
| Ratios to Average Net Assets/Supplemental Data: | |
| Net expenses before interest expense (f) | | | 2.21 | % | | | 2.20 | % | | | 2.60 | % | | | 2.65 | %(g) | |
| Interest expense | | | — | %(h) | | | — | %(h) | | | — | | | | — | | |
| Net expenses (f) | | | 2.21 | % | | | 2.20 | % | | | 2.60 | % | | | 2.65 | %(g) | |
| Waiver/Reimbursement | | | — | | | | — | %(h) | | | 0.06 | % | | | 0.68 | %(g) | |
| Net investment loss (f) | | | (1.70 | )% | | | (1.70 | )% | | | (2.23 | )% | | | (2.18 | )%(g) | |
| Portfolio turnover rate | | | 210 | % | | | 350 | % | | | 328 | % | | | 488 | % | |
| Net assets, end of period (000's) | | $ | 36,325 | | | $ | 21,018 | | | $ | 1,972 | | | $ | 488 | | |
(a) Class C shares were initially offered on October 13, 2003. Per share data and total return reflect activity from that date.
(b) Per share data was calculated using the average shares outstanding during the period.
(c) Total return at net asset value assuming all distributions reinvested and no contingent deferred sales charge.
(d) Had the investment advisor and/or any of its affiliates not waived or reimbursed a portion of expenses, total return would have been reduced.
(e) Not annualized.
(f) The benefits derived from expense reductions had an impact of less than 0.01%.
(g) Annualized.
(h) Rounds to less than 0.01%.
See Accompanying Notes to Financial Statements.
137
Financial Highlights – Columbia Technology Fund
Selected data for a fund share outstanding throughout each period is as follows:
| | | Year Ended August 31, | | Period
Ended
August 31, | | Year
Ended
December 31, | |
| Class Z Shares | | 2007 | | 2006 | | 2005 | | 2004 | | 2003 (a) | | 2002 (b) | |
| Net Asset Value, Beginning of Period | | $ | 9.43 | | | $ | 8.86 | | | $ | 6.55 | | | $ | 5.93 | | | $ | 3.79 | | | $ | 6.13 | | |
| Income from Investment Operations: | |
| Net investment loss (c) | | | (0.08 | ) | | | (0.07 | ) | | | (0.10 | ) | | | (0.09 | ) | | | (0.04 | ) | | | (0.06 | ) | |
Net realized and unrealized gain (loss)
on investments, futures contracts,
foreign currency and written options | | | 2.43 | | | | 1.22 | | | | 2.41 | | | | 0.71 | | | | 2.18 | | | | (2.28 | ) | |
| Total from investment operations | | | 2.35 | | | | 1.15 | | | | 2.31 | | | | 0.62 | | | | 2.14 | | | | (2.34 | ) | |
| Less Distributions to Shareholders: | |
| From net realized gains | | | — | | | | (0.58 | ) | | | — | | | | — | | | | — | | | | — | | |
| Net Asset Value, End of Period | | $ | 11.78 | | | $ | 9.43 | | | $ | 8.86 | | | $ | 6.55 | | | $ | 5.93 | | | $ | 3.79 | | |
| Total return (d) | | | 24.92 | % | | | 13.01 | %(e) | | | 35.27 | %(e) | | | 10.46 | %(e) | | | 56.46 | %(e)(f) | | | (38.17 | )%(e)(f) | |
| Ratios to Average Net Assets/Supplemental Data: | |
| Net expenses before interest expense (g) | | | 1.21 | % | | | 1.20 | % | | | 1.60 | % | | | 1.65 | % | | | 1.65 | %(h) | | | 1.65 | % | |
| Interest expense | | | — | %(i) | | | — | %(i) | | | — | | | | — | | | | — | | | | — | | |
| Net expenses (g) | | | 1.21 | % | | | 1.20 | % | | | 1.60 | % | | | 1.65 | % | | | 1.65 | %(h) | | | 1.65 | % | |
| Waiver/Reimbursement | | | — | | | | — | %(i) | | | 0.06 | % | | | 0.53 | % | | | 2.73 | %(h) | | | 1.33 | % | |
| Net investment income (loss) (g) | | | (0.70 | )% | | | (0.71 | )% | | | (1.29 | )% | | | (1.30 | )% | | | (1.19 | )%(h) | | | (1.24 | )% | |
| Portfolio turnover rate | | | 210 | % | | | 350 | % | | | 328 | % | | | 488 | % | | | 523 | %(f) | | | 512 | % | |
| Net assets, end of period (000's) | | $ | 137,420 | | | $ | 70,767 | | | $ | 40,947 | | | $ | 30,268 | | | $ | 19,663 | | | $ | 8,055 | | |
(a) The Fund changed its fiscal year end from December 31 to August 31.
(b) On November 1, 2002, the existing Fund shares were renamed Class Z shares.
(c) Per share data was calculated using the average shares outstanding during the period.
(d) Total return at net asset value assuming all distributions reinvested.
(e) Had the investment advisor and/or any of its affiliates not waived or reimbursed a portion of expenses, total return would have been reduced.
(f) Not annualized.
(g) The benefits derived from expense reductions had an impact of less than 0.01%.
(h) Annualized.
(i) Rounds to less than 0.01%.
See Accompanying Notes to Financial Statements.
138
Financial Highlights – Columbia Strategic Investor Fund
Selected data for a fund share outstanding throughout each period is as follows:
| | | Year Ended August 31, | | Period
Ended
August 31, | | Period
Ended
December 31, | |
| Class A Shares | | 2007 | | 2006 | | 2005 | | 2004 | | 2003 (a) | | 2002 (b) | |
| Net Asset Value, Beginning of Period | | $ | 21.22 | | | $ | 21.21 | | | $ | 18.37 | | | $ | 15.95 | | | $ | 13.13 | | | $ | 12.72 | | |
| Income from Investment Operations: | |
| Net investment income (c) | | | 0.07 | | | | 0.13 | | | | 0.01 | | | | 0.03 | | | | 0.06 | | | | 0.01 | | |
Net realized and unrealized gain on
investments and foreign currency | | | 2.97 | | | | 1.54 | | | | 3.08 | | | | 2.46 | | | | 2.76 | | | | 0.40 | | |
| Total from investment operations | | | 3.04 | | | | 1.67 | | | | 3.09 | | | | 2.49 | | | | 2.82 | | | | 0.41 | | |
| Less Distributions to Shareholders: | |
| From net investment income | | | (0.10 | ) | | | (0.14 | ) | | | (0.03 | ) | | | (0.07 | ) | | | — | | | | — | | |
| From net realized gains | | | (2.68 | ) | | | (1.52 | ) | | | (0.22 | ) | | | — | | | | — | | | | — | | |
| Total distributions to shareholders | | | (2.78 | ) | | | (1.66 | ) | | | (0.25 | ) | | | (0.07 | ) | | | — | | | | — | | |
| Net Asset Value, End of Period | | $ | 21.48 | | | $ | 21.22 | | | $ | 21.21 | | | $ | 18.37 | | | $ | 15.95 | | | $ | 13.13 | | |
| Total return (d) | | | 16.33 | %(e) | | | 8.26 | %(e) | | | 16.88 | %(e) | | | 15.64 | %(e) | | | 21.48 | %(f) | | | 3.22 | %(f) | |
| Ratios to Average Net Assets/Supplemental Data: | |
| Net expenses | | | 1.23 | %(g) | | | 1.24 | %(h) | | | 1.24 | %(h) | | | 1.27 | %(h) | | | 1.30 | %(h)(i) | | | 1.21 | %(h)(i) | |
| Waiver/Reimbursement | | | 0.02 | % | | | 0.01 | % | | | 0.03 | % | | | 0.01 | % | | | — | | | | — | | |
| Net investment income | | | 0.36 | %(g) | | | 0.65 | %(h) | | | 0.64 | %(h) | | | 0.19 | %(h) | | | 0.60 | %(h)(i) | | | 0.64 | %(h)(i) | |
| Portfolio turnover rate | | | 139 | % | | | 82 | % | | | 80 | % | | | 106 | % | | | 68 | %(f) | | | 188 | % | |
| Net assets, end of period (000's) | | $ | 255,743 | | | $ | 170,201 | | | $ | 169,340 | | | $ | 99,608 | | | $ | 60,112 | | | $ | 53,526 | | |
(a) The Fund changed its fiscal year end from December 31 to August 31.
(b) Class A shares were initially offered on November 1, 2002. Per share data and total return reflect activity from that date.
(c) Per share data was calculated using the average shares outstanding during the period.
(d) Total return at net asset value assuming all distributions reinvested and no initial sales charge or contingent deferred sales charge.
(e) Had the investment advisor and/or any of its affiliates not waived or reimbursed a portion of expenses, total return would have been reduced.
(f) Not annualized.
(g) The benefit derived from expense reductions had an impact of 0.06%.
(h) The benefits derived from expense reductions had an impact of less than 0.01%.
(i) Annualized.
See Accompanying Notes to Financial Statements.
139
Financial Highlights – Columbia Strategic Investor Fund
Selected data for a fund share outstanding throughout each period is as follows:
| | | Year Ended August 31, | | Period
Ended
August 31, | | Period
Ended
December 31, | |
| Class B Shares | | 2007 | | 2006 | | 2005 | | 2004 | | 2003 (a) | | 2002 (b) | |
| Net Asset Value, Beginning of Period | | $ | 20.81 | | | $ | 20.84 | | | $ | 18.17 | | | $ | 15.82 | | | $ | 13.10 | | | $ | 12.72 | | |
| Income from Investment Operations: | |
| Net investment loss (c) | | | (0.08 | ) | | | (0.02 | ) | | | — | (d) | | | (0.10 | ) | | | (0.03 | ) | | | (0.01 | ) | |
| Net realized and unrealized gain on | |
| investments and foreign currency | | | 2.91 | | | | 1.51 | | | | 2.89 | | | | 2.45 | | | | 2.75 | | | | 0.39 | | |
| Total from investment operations | | | 2.83 | | | | 1.49 | | | | 2.89 | | | | 2.35 | | | | 2.72 | | | | 0.38 | | |
| Less Distributions to Shareholders: | |
| From net realized gains | | | (2.68 | ) | | | (1.52 | ) | | | (0.22 | ) | | | — | | | | — | | | | — | | |
| Net Asset Value, End of Period | | $ | 20.96 | | | $ | 20.81 | | | $ | 20.84 | | | $ | 18.17 | | | $ | 15.82 | | | $ | 13.10 | | |
| Total return (e)(f) | | | 15.50 | % | | | 7.47 | % | | | 15.97 | % | | | 14.85 | % | | | 20.76 | %(g) | | | 2.99 | %(g) | |
| Ratios to Average Net Assets/Supplemental Data: | |
| Net expenses | | | 1.98 | %(h) | | | 1.99 | %(i) | | | 1.99 | %(i) | | | 2.02 | %(i) | | | 2.22 | %(i)(j) | | | 2.36 | %(i)(j) | |
| Waiver/Reimbursement | | | 0.02 | % | | | 0.01 | % | | | 0.03 | % | | | 0.14 | % | | | 0.23 | %(j) | | | 0.23 | %(j) | |
| Net investment loss | | | (0.39 | )%(h) | | | (0.10 | )%(i) | | | (0.09 | )%(i) | | | (0.57 | )%(i) | | | (0.33 | )%(i)(j) | | | (0.51 | )%(i)(j) | |
| Portfolio turnover rate | | | 139 | % | | | 82 | % | | | 80 | % | | | 106 | % | | | 68 | %(g) | | | 188 | % | |
| Net assets, end of period (000's) | | $ | 53,965 | | | $ | 51,446 | | | $ | 49,318 | | | $ | 22,071 | | | $ | 3,398 | | | $ | 2,350 | | |
(a) The Fund changed its fiscal year end from December 31 to August 31.
(b) Class B shares were initially offered on November 1, 2002. Per share data and total return reflect activity from that date.
(c) Per share data was calculated using the average shares outstanding during the period.
(d) Rounds to less than $0.01 per share.
(e) Total return at net asset value assuming all distributions reinvested and no contingent deferred sales charge.
(f) Had the investment advisor and/or any of its affiliates not waived or reimbursed a portion of expenses, total return would have been reduced.
(g) Not annualized.
(h) The benefits derived from expense reductions had an impact of 0.06%.
(i) The benefits derived from expense reductions had an impact of less than 0.01%.
(j) Annualized.
See Accompanying Notes to Financial Statements.
140
Financial Highlights – Columbia Strategic Investor Fund
Selected data for a fund share outstanding throughout each period is as follows:
| | | Year Ended August 31, | | Period
Ended
August 31, | |
| Class C Shares | | 2007 | | 2006 | | 2005 | | 2004 (a) | |
| Net Asset Value, Beginning of Period | | $ | 20.82 | | | $ | 20.85 | | | $ | 18.18 | | | $ | 16.42 | | |
| Income from Investment Operations: | |
| Net investment loss (b) | | | (0.08 | ) | | | (0.02 | ) | | | — | (c) | | | (0.09 | ) | |
Net realized and unrealized gain on investments and
foreign currency | | | 2.90 | | | | 1.51 | | | | 2.89 | | | | 1.85 | | |
| Total from investment operations | | | 2.82 | | | | 1.49 | | | | 2.89 | | | | 1.76 | | |
| Less Distributions to Shareholders: | |
| From net realized gains | | | (2.68 | ) | | | (1.52 | ) | | | (0.22 | ) | | | — | | |
| Net Asset Value, End of Period | | $ | 20.96 | | | $ | 20.82 | | | $ | 20.85 | | | $ | 18.18 | | |
| Total return (d)(e) | | | 15.43 | % | | | 7.46 | % | | | 15.96 | % | | | 10.72 | %(f) | |
| Ratios to Average Net Assets/Supplemental Data: | |
| Net expenses | | | 1.98 | %(g) | | | 1.99 | %(h) | | | 1.99 | %(h) | | | 2.05 | %(h)(i) | |
| Waiver/Reimbursement | | | 0.02 | % | | | 0.01 | % | | | 0.03 | % | | | 0.07 | %(h) | |
| Net investment income | | | (0.40 | )%(g) | | | (0.10 | )%(h) | | | (0.09 | )%(h) | | | (0.57 | )%(h)(i) | |
| Portfolio turnover rate | | | 139 | % | | | 82 | % | | | 80 | % | | | 106 | % | |
| Net assets, end of period (000's) | | $ | 44,682 | | | $ | 43,881 | | | $ | 39,253 | | | $ | 14,821 | | |
(a) Class C shares were initially offered on October 13, 2003. Per share data and total return reflect activity from that date.
(b) Per share data was calculated using the average shares outstanding during the period.
(c) Rounds to less than $0.01 per share.
(d) Total return at net asset value assuming all distributions reinvested and no contingent deferred sales charge.
(e) Had the investment advisor and/or any of its affiliates not waived or reimbursed a portion of expenses, total return would have been reduced.
(f) Not annualized.
(g) The benefits derived from expense reductions had an impact of 0.06%.
(h) The benefits derived from expense reductions had an impact of less than 0.01%.
(i) Annualized.
See Accompanying Notes to Financial Statements.
141
Financial Highlights – Columbia Strategic Investor Fund
Selected data for a fund share outstanding throughout each period is as follows:
| | | Year Ended August 31, | | Period
Ended
August 31, | | Year
Ended
December 31, | |
| Class Z Shares | | 2007 | | 2006 | | 2005 | | 2004 | | 2003 (a) | | 2002 (b) | |
| Net Asset Value, Beginning of Period | | $ | 21.28 | | | $ | 21.27 | | | $ | 18.42 | | | $ | 15.98 | | | $ | 13.14 | | | $ | 14.52 | | |
| Income from Investment Operations: | |
| Net investment income | | | 0.13 | (c) | | | 0.18 | (c) | | | 0.01 | (c) | | | 0.08 | (c) | | | 0.08 | (c) | | | 0.10 | (c) | |
Net realized and unrealized gain
(loss) on investments and
foreign currency | | | 2.96 | | | | 1.54 | | | | 3.13 | | | | 2.47 | | | | 2.76 | | | | (1.35 | ) | |
| Total from investment operations | | | 3.09 | | | | 1.72 | | | | 3.14 | | | | 2.55 | | | | 2.84 | | | | (1.25 | ) | |
| Less Distributions to Shareholders: | |
| From net investment income | | | (0.16 | ) | | | (0.19 | ) | | | (0.07 | ) | | | (0.11 | ) | | | — | | | | (0.11 | ) | |
| From net realized gains | | | (2.68 | ) | | | (1.52 | ) | | | (0.22 | ) | | | — | | | | — | | | | (0.02 | ) | |
| Total distributions to shareholders | | | (2.84 | ) | | | (1.71 | ) | | | (0.29 | ) | | | (0.11 | ) | | | — | | | | (0.13 | ) | |
| Net Asset Value, End of Period | | $ | 21.53 | | | $ | 21.28 | | | $ | 21.27 | | | $ | 18.42 | | | $ | 15.98 | | | $ | 13.14 | | |
| Total return (d) | | | 16.62 | %(e) | | | 8.50 | %(e) | | | 17.16 | %(e) | | | 15.98 | %(e) | | | 21.61 | %(e)(f) | | | (8.56 | )%(e) | |
| Ratios to Average Net Assets/Supplemental Data: | |
| Net expenses | | | 0.98 | %(g) | | | 0.99 | %(h) | | | 0.99 | %(h) | | | 1.02 | %(h) | | | 1.08 | %(h)(i) | | | 1.23 | %(h) | |
| Waiver/Reimbursement | | | 0.02 | % | | | 0.01 | % | | | 0.03 | % | | | 0.03 | % | | | 0.03 | %(i) | | | 0.03 | % | |
| Net investment income | | | 0.63 | %(g) | | | 0.89 | %(h) | | | 0.86 | %(h) | | | 0.44 | %(h) | | | 0.82 | %(h)(i) | | | 0.62 | %(h) | |
| Portfolio turnover rate | | | 139 | % | | | 82 | % | | | 80 | % | | | 106 | % | | | 68 | %(f) | | | 188 | % | |
| Net assets, end of period (000's) | | $ | 859,142 | | | $ | 179,027 | | | $ | 267,380 | | | $ | 272,178 | | | $ | 227,454 | | | $ | 209,610 | | |
(a) The Fund changed its fiscal year end from December 31 to August 31.
(b) On November 1, 2002, the existing Fund shares were renamed Class Z shares.
(c) Per share data was calculated using the average shares outstanding during the period.
(d) Total return at net asset value assuming all distributions reinvested.
(e) Had the investment advisor and/or any of its affiliates not waived or reimbursed a portion of expenses, total return would have been reduced.
(f) Not annualized.
(g) The benefits derived from expense reductions had an impact of 0.06%.
(h) The benefits derived from expense reductions had an impact of less than 0.01%.
(i) Annualized.
See Accompanying Notes to Financial Statements.
142
Financial Highlights – Columbia Balanced Fund
Selected data for a fund share outstanding throughout each period is as follows:
| | | Year Ended August 31, | | Period
Ended
August 31, | | Period
Ended
December 31, | |
| Class A Shares | | 2007 | | 2006 | | 2005 | | 2004 | | 2003 (a) | | 2002 (b) | |
| Net Asset Value, Beginning of Period | | $ | 22.51 | | | $ | 21.75 | | | $ | 19.86 | | | $ | 19.18 | | | $ | 17.52 | | | $ | 17.58 | | |
| Income from Investment Operations: | |
| Net investment income (c) | | | 0.48 | | | | 0.38 | | | | 0.02 | (d) | | | 0.29 | | | | 0.16 | | | | 0.03 | | |
Net realized and unrealized gain on
investments and futures contracts | | | 2.26 | | | | 0.78 | | | | 2.28 | | | | 0.67 | | | | 1.64 | | | | — | (e) | |
| Total from investment operations | | | 2.74 | | | | 1.16 | | | | 2.30 | | | | 0.96 | | | | 1.80 | | | | 0.03 | | |
| Less Distributions to Shareholders: | |
| From net investment income | | | (0.48 | ) | | | (0.40 | ) | | | (0.41 | ) | | | (0.28 | ) | | | (0.14 | ) | | | (0.09 | ) | |
| Net Asset Value, End of Period | | $ | 24.77 | | | $ | 22.51 | | | $ | 21.75 | | | $ | 19.86 | | | $ | 19.18 | | | $ | 17.52 | | |
| Total return (f) | | | 12.26 | % | | | 5.40 | %(g) | | | 11.72 | % | | | 4.99 | % | | | 10.35 | %(h) | | | 0.19 | %(h) | |
| Ratios to Average Net Assets/Supplemental Data: | |
| Net expenses before interest expense (i) | | | 1.02 | % | | | 0.98 | % | | | 1.02 | % | | | 1.02 | % | | | 1.42 | %(j) | | | 1.17 | %(j) | |
| Interest expense | | | — | | | | — | %(k) | | | — | | | | — | | | | — | | | | — | | |
| Net expenses (i) | | | 1.02 | % | | | 0.98 | % | | | 1.02 | % | | | 1.02 | % | | | 1.42 | %(j) | | | 1.17 | %(j) | |
| Waiver/Reimbursement | | | — | | | | 0.01 | % | | | — | | | | — | | | | — | | | | — | | |
| Net investment income (i) | | | 1.98 | % | | | 1.71 | % | | | 1.80 | % | | | 1.45 | % | | | 1.32 | %(j) | | | 2.03 | %(j) | |
| Portfolio turnover rate | | | 78 | % | | | 59 | % | | | 63 | % | | | 158 | % | | | 110 | %(h) | | | 98 | % | |
| Net assets, end of period (000's) | | $ | 6,582 | | | $ | 4,137 | | | $ | 3,378 | | | $ | 2,577 | | | $ | 670 | | | $ | 146 | | |
(a) The Fund changed its fiscal year end from December 31 to August 31.
(b) Class A shares were initially offered on November 1, 2002. Per share data and total return reflect activity from that date.
(c) Per share data was calculated using the average shares outstanding during the period.
(d) Net investment income per share reflects a special dividend. The effect of this dividend amounted to $0.06 per share.
(e) Rounds to less than $0.01 per share.
(f) Total return at net asset value assuming all distributions reinvested and no initial sales charge or contingent deferred sales charge.
(g) Had the investment advisor and/or any of its affiliates not waived or reimbursed a portion of expenses, total return would have been reduced.
(h) Not annualized.
(i) The benefits derived from expense reductions had an impact of less than 0.01%.
(j) Annualized.
(k) Rounds to less than 0.01%.
See Accompanying Notes to Financial Statements.
143
Financial Highlights – Columbia Balanced Fund
Selected data for a fund share outstanding throughout each period is as follows:
| | | Year Ended August 31, | | Period
Ended
August 31, | | Period
Ended
December 31, | |
| Class B Shares | | 2007 | | 2006 | | 2005 | | 2004 | | 2003 (a) | | 2002 (b) | |
| Net Asset Value, Beginning of Period | | $ | 22.47 | | | $ | 21.72 | | | $ | 19.83 | | | $ | 19.16 | | | $ | 17.52 | | | $ | 17.58 | | |
| Income from Investment Operations: | |
| Net investment income (c) | | | 0.29 | | | | 0.21 | | | | 0.01 | (d) | | | 0.14 | | | | 0.07 | | | | 0.02 | | |
Net realized and unrealized gain (loss)
on investments and futures contracts | | | 2.27 | | | | 0.78 | | | | 2.14 | | | | 0.66 | | | | 1.65 | | | | (0.01 | ) | |
| Total from investment operations | | | 2.56 | | | | 0.99 | | | | 2.15 | | | | 0.80 | | | | 1.72 | | | | 0.01 | | |
| Less Distributions to Shareholders: | |
| From net investment income | | | (0.30 | ) | | | (0.24 | ) | | | (0.26 | ) | | | (0.13 | ) | | | (0.08 | ) | | | (0.07 | ) | |
| Net Asset Value, End of Period | | $ | 24.73 | | | $ | 22.47 | | | $ | 21.72 | | | $ | 19.83 | | | $ | 19.16 | | | $ | 17.52 | | |
| Total return (e) | | | 11.45 | % | | | 4.57 | %(f) | | | 10.91 | % | | | 4.17 | % | | | 9.83 | %(g) | | | 0.06 | %(g) | |
| Ratios to Average Net Assets/Supplemental Data: | |
| Net expenses before interest expense (h) | | | 1.77 | % | | | 1.73 | % | | | 1.77 | % | | | 1.77 | % | | | 2.17 | %(i) | | | 1.92 | %(i) | |
| Interest expense | | | — | | | | — | %(j) | | | — | | | | — | | | | — | | | | — | | |
| Net expenses (h) | | | 1.77 | % | | | 1.73 | % | | | 1.77 | % | | | 1.77 | % | | | 2.17 | %(i) | | | 1.92 | %(i) | |
| Waiver/Reimbursement | | | — | | | | 0.01 | % | | | — | | | | — | | | | — | | | | — | | |
| Net investment income (h) | | | 1.20 | % | | | 0.95 | % | | | 1.07 | % | | | 0.71 | % | | | 0.59 | %(i) | | | 1.28 | %(i) | |
| Portfolio turnover rate | | | 78 | % | | | 59 | % | | | 63 | % | | | 158 | % | | | 110 | %(g) | | | 98 | % | |
| Net assets, end of period (000's) | | $ | 6,955 | | | $ | 7,213 | | | $ | 8,149 | | | $ | 7,286 | | | $ | 3,349 | | | $ | 608 | | |
(a) The Fund changed its fiscal year end from December 31 to August 31.
(b) Class B shares were initially offered on November 1, 2002. Per share data and total return reflect activity from that date.
(c) Per share data was calculated using the average shares outstanding during the period.
(d) Net investment income per share reflects a special dividend. The effect of this dividend amounted to $0.06 per share.
(e) Total return at net asset value assuming all distributions reinvested and no contingent deferred sales charge.
(f) Had the investment advisor and/or any of its affiliates not waived or reimbursed a portion of expenses, total return would have been reduced.
(g) Not annualized.
(h) The benefits derived from expense reductions had an impact of less than 0.01%.
(i) Annualized.
(j) Rounds to less than 0.01%.
See Accompanying Notes to Financial Statements.
144
Financial Highlights – Columbia Balanced Fund
Selected data for a fund share outstanding throughout each period is as follows:
| | | Year Ended August 31, | | Period
Ended
August 31, | |
| Class C Shares | | 2007 | | 2006 | | 2005 | | 2004 (a) | |
| Net Asset Value, Beginning of Period | | $ | 22.48 | | | $ | 21.72 | | | $ | 19.83 | | | $ | 19.59 | | |
| Income from Investment Operations: | |
| Net investment income (b) | | | 0.29 | | | | 0.21 | | | | 0.01 | (c) | | | 0.13 | | |
Net realized and unrealized gain on investments and
futures contracts | | | 2.26 | | | | 0.79 | | | | 2.14 | | | | 0.23 | | |
| Total from investment operations | | | 2.55 | | | | 1.00 | | | | 2.15 | | | | 0.36 | | |
| Less Distributions to Shareholders: | |
| From net investment income | | | (0.30 | ) | | | (0.24 | ) | | | (0.26 | ) | | | (0.12 | ) | |
| Net Asset Value, End of Period | | $ | 24.73 | | | $ | 22.48 | | | $ | 21.72 | | | $ | 19.83 | | |
| Total return (d) | | | 11.40 | % | | | 4.62 | %(e) | | | 10.91 | % | | | 1.82 | %(f) | |
| Ratios to Average Net Assets/Supplemental Data: | |
| Net expenses before interest expense (g) | | | 1.77 | % | | | 1.73 | % | | | 1.77 | % | | | 1.80 | %(h) | |
| Interest expense | | | — | | | | — | %(i) | | | — | | | | — | | |
| Net expenses (g) | | | 1.77 | % | | | 1.73 | % | | | 1.77 | % | | | 1.80 | %(h) | |
| Waiver/Reimbursement | | | — | | | | 0.01 | % | | | — | | | | — | | |
| Net investment income (g) | | | 1.20 | % | | | 0.98 | % | | | 1.06 | % | | | 0.72 | %(h) | |
| Portfolio turnover rate | | | 78 | % | | | 59 | % | | | 63 | % | | | 158 | % | |
| Net assets, end of period (000's) | | $ | 1,887 | | | $ | 1,491 | | | $ | 952 | | | $ | 730 | | |
(a) Class C shares were initially offered on October 13, 2003. Per share data and total return reflect activity from that date.
(b) Per share data was calculated using the average shares outstanding during the period.
(c) Net investment income per share reflects a special dividend. The effect of this dividend amounted to $0.06 per share.
(d) Total return at net asset value assuming all distributions reinvested and no contingent deferred sales charge.
(e) Had the investment advisor and/or any of its affiliates not waived or reimbursed a portion of expenses, total return would have been reduced.
(f) Not annualized.
(g) The benefits derived from expense reductions had an impact of less than 0.01%.
(h) Annualized.
(i) Rounds to less than 0.01%.
See Accompanying Notes to Financial Statements.
145
Financial Highlights – Columbia Balanced Fund
Selected data for a fund share outstanding throughout each period is as follows:
| | | Year Ended August 31, | | Period
Ended
August 31, | | Year
Ended
December 31, | |
| Class Z Shares | | 2007 | | 2006 | | 2005 | | 2004 | | 2003 (a) | | 2002 (b) | |
| Net Asset Value, Beginning of Period | | $ | 22.50 | | | $ | 21.74 | | | $ | 19.84 | | | $ | 19.19 | | | $ | 17.51 | | | $ | 20.67 | | |
| Income from Investment Operations: | |
| Net investment income (c) | | | 0.53 | | | | 0.43 | | | | 0.01 | (d) | | | 0.35 | | | | 0.24 | | | | 0.47 | | |
Net realized and unrealized gain (loss) on
investments and futures contracts | | | 2.26 | | | | 0.79 | | | | 2.36 | | | | 0.66 | | | | 1.64 | | | | (3.13 | ) | |
| Total from investment operations | | | 2.79 | | | | 1.22 | | | | 2.37 | | | | 1.01 | | | | 1.88 | | | | (2.66 | ) | |
| Less Distributions to Shareholders: | |
| From net investment income | | | (0.54 | ) | | | (0.46 | ) | | | (0.47 | ) | | | (0.36 | ) | | | (0.20 | ) | | | (0.50 | ) | |
| Net Asset Value, End of Period | | $ | 24.75 | | | $ | 22.50 | | | $ | 21.74 | | | $ | 19.84 | | | $ | 19.19 | | | $ | 17.51 | | |
| Total return (e) | | | 12.49 | % | | | 5.66 | %(f) | | | 12.06 | % | | | 5.27 | % | | | 10.81 | %(g) | | | (12.97 | )% | |
| Ratios to Average Net Assets/Supplemental Data: | |
| Net expenses before interest expense (h) | | | 0.77 | % | | | 0.73 | % | | | 0.77 | % | | | 0.77 | % | | | 0.77 | %(i) | | | 0.70 | % | |
| Interest expense | | | — | | | | — | %(j) | | | — | | | | — | | | | — | | | | — | | |
| Net expenses (h) | | | 0.77 | % | | | 0.73 | % | | | 0.77 | % | | | 0.77 | % | | | 0.77 | %(i) | | | 0.70 | % | |
| Waiver/Reimbursement | | | — | | | | 0.01 | % | | | — | | | | — | | | | — | | | | — | | |
| Net investment income (h) | | | 2.19 | % | | | 1.94 | % | | | 2.11 | % | | | 1.73 | % | | | 2.03 | %(i) | | | 2.50 | % | |
| Portfolio turnover rate | | | 78 | % | | | 59 | % | | | 63 | % | | | 158 | % | | | 110 | %(g) | | | 98 | % | |
| Net assets, end of period (000's) | | $ | 196,615 | | | $ | 226,694 | | | $ | 301,109 | | | $ | 483,746 | | | $ | 640,402 | | | $ | 668,290 | | |
(a) The Fund changed its fiscal year end from December 31 to August 31.
(b) On November 1, 2002, the existing Fund shares were renamed Class Z shares.
(c) Per share data was calculated using the average shares outstanding during the period.
(d) Net investment income per share reflects a special dividend. The effect of this dividend amounted to $0.06 per share.
(e) Total return at net asset value assuming all distributions reinvested.
(f) Had the investment advisor and/or any of its affiliates not waived or reimbursed a portion of expenses, total return would have been reduced.
(g) Not annualized.
(h) The benefits derived from expense reductions had an impact of less than 0.01%.
(i) Annualized.
(j) Rounds to less than 0.01%.
See Accompanying Notes to Financial Statements.
146
Financial Highlights – Columbia Oregon Intermediate Municipal Bond Fund
Selected data for a fund share outstanding throughout each period is as follows:
| | | Year Ended August 31, | | Period
Ended
August 31, | | Period
Ended
December 31, | |
| Class A Shares | | 2007 | | 2006 | | 2005 | | 2004 | | 2003 (a) | | 2002 (b) | |
| Net Asset Value, Beginning of Period | | $ | 12.24 | | | $ | 12.45 | | | $ | 12.45 | | | $ | 12.25 | | | $ | 12.50 | | | $ | 12.52 | | |
| Income from Investment Operations: | |
| Net investment income (c) | | | 0.46 | | | | 0.45 | | | | 0.46 | | | | 0.46 | | | | 0.29 | | | | 0.08 | | |
Net realized and unrealized gain (loss)
on investments | | | (0.23 | ) | | | (0.20 | ) | | | 0.03 | | | | 0.34 | | | | (0.22 | ) | | | 0.07 | | |
| Total from investment operations | | | 0.23 | | | | 0.25 | | | | 0.49 | | | | 0.80 | | | | 0.07 | | | | 0.15 | | |
| Less Distributions to Shareholders: | |
| From net investment income | | | (0.45 | ) | | | (0.46 | ) | | | (0.45 | ) | | | (0.46 | ) | | | (0.31 | ) | | | (0.08 | ) | |
| From net realized gains | | | — | | | | — | | | | (0.04 | ) | | | (0.14 | ) | | | (0.01 | ) | | | (0.09 | ) | |
| Total distributions to shareholders | | | (0.45 | ) | | | (0.46 | ) | | | (0.49 | ) | | | (0.60 | ) | | | (0.32 | ) | | | (0.17 | ) | |
| Net Asset Value, End of Period | | $ | 12.02 | | | $ | 12.24 | | | $ | 12.45 | | | $ | 12.45 | | | $ | 12.25 | | | $ | 12.50 | | |
| Total return (d) | | | 1.92 | % | | | 2.05 | %(e) | | | 4.05 | % | | | 6.68 | % | | | 0.56 | %(f) | | | 1.19 | %(f) | |
| Ratios to Average Net Assets/Supplemental Data: | |
| Net expenses (g) | | | 0.88 | % | | | 0.89 | % | | | 0.89 | % | | | 0.92 | % | | | 1.16 | %(h) | | | 0.92 | %(h) | |
| Waiver/Reimbursement | | | — | | | | — | %(i) | | | — | | | | — | | | | — | | | | — | | |
| Net investment income (g) | | | 3.73 | % | | | 3.72 | % | | | 3.71 | % | | | 3.73 | % | | | 3.52 | %(h) | | | 4.11 | %(h) | |
| Portfolio turnover rate | | | 16 | % | | | 2 | % | | | 9 | % | | | 11 | % | | | 10 | %(f) | | | 21 | % | |
| Net assets, end of period (000's) | | $ | 5,519 | | | $ | 6,507 | | | $ | 4,300 | | | $ | 3,680 | | | $ | 2,138 | | | $ | 477 | | |
(a) The Fund changed its fiscal year end from December 31 to August 31.
(b) Class A shares were initially offered on November 1, 2002. Per share data and total return reflect activity from that date.
(c) Per share data was calculated using the average shares outstanding during the period.
(d) Total return at net asset value assuming all distributions reinvested and no initial sales charge or contingent deferred sales charge.
(e) Had the investment advisor and/or any of its affiliates not waived or reimbursed a portion of expenses, total return would have been reduced.
(f) Not annualized.
(g) The benefits derived from expense reductions had an impact of less than 0.01%.
(h) Annualized.
(i) Rounds to less than 0.01%.
See Accompanying Notes to Financial Statements.
147
Financial Highlights – Columbia Oregon Intermediate Municipal Bond Fund
Selected data for a fund share outstanding throughout each period is as follows:
| | | Year Ended August 31, | | Period
Ended
August 31, | | Period
Ended
December 31, | |
| Class B Shares | | 2007 | | 2006 | | 2005 | | 2004 | | 2003 (a) | | 2002 (b) | |
| Net Asset Value, Beginning of Period | | $ | 12.24 | | | $ | 12.45 | | | $ | 12.45 | | | $ | 12.25 | | | $ | 12.50 | | | $ | 12.52 | | |
| Income from Investment Operations: | |
| Net investment income (c) | | | 0.36 | | | | 0.37 | | | | 0.37 | | | | 0.37 | | | | 0.24 | | | | 0.06 | | |
Net realized and unrealized gain (loss)
on investments | | | (0.22 | ) | | | (0.22 | ) | | | 0.03 | | | | 0.34 | | | | (0.23 | ) | | | 0.08 | | |
| Total from investment operations | | | 0.14 | | | | 0.15 | | | | 0.40 | | | | 0.71 | | | | 0.01 | | | | 0.14 | | |
| Less Distributions to Shareholders: | |
| From net investment income | | | (0.36 | ) | | | (0.36 | ) | | | (0.36 | ) | | | (0.37 | ) | | | (0.25 | ) | | | (0.07 | ) | |
| From net realized gains | | | — | | | | — | | | | (0.04 | ) | | | (0.14 | ) | | | (0.01 | ) | | | (0.09 | ) | |
| Total distributions to shareholders | | | (0.36 | ) | | | (0.36 | ) | | | (0.40 | ) | | | (0.51 | ) | | | (0.26 | ) | | | (0.16 | ) | |
| Net Asset Value, End of Period | | $ | 12.02 | | | $ | 12.24 | | | $ | 12.45 | | | $ | 12.45 | | | $ | 12.25 | | | $ | 12.50 | | |
| Total return (d) | | | 1.16 | % | | | 1.29 | %(e) | | | 3.26 | % | | | 5.87 | % | | | 0.05 | %(f) | | | 1.10 | %(f) | |
| Ratios to Average Net Assets/Supplemental Data: | |
| Net expenses (g) | | | 1.63 | % | | | 1.64 | % | | | 1.64 | % | | | 1.68 | % | | | 1.86 | %(h) | | | 1.67 | %(h) | |
| Waiver/Reimbursement | | | — | | | | — | %(i) | | | — | | | | — | | | | — | | | | — | | |
| Net investment income (g) | | | 2.98 | % | | | 3.00 | % | | | 2.96 | % | | | 2.97 | % | | | 2.83 | %(h) | | | 3.36 | %(h) | |
| Portfolio turnover rate | | | 16 | % | | | 2 | % | | | 9 | % | | | 11 | % | | | 10 | %(f) | | | 21 | % | |
| Net assets, end of period (000's) | | $ | 842 | | | $ | 913 | | | $ | 1,226 | | | $ | 1,190 | | | $ | 999 | | | $ | 373 | | |
(a) The Fund changed its fiscal year end from December 31 to August 31.
(b) Class B shares were initially offered on November 1, 2002. Per share data and total return reflect activity from that date.
(c) Per share data was calculated using the average shares outstanding during the period.
(d) Total return at net asset value assuming all distributions reinvested and no contingent deferred sales charge.
(e) Had the investment advisor and/or any of its affiliates not waived or reimbursed a portion of expenses, total return would have been reduced.
(f) Not annualized.
(g) The benefits derived from expense reductions had an impact of less than 0.01%.
(h) Annualized.
(i) Rounds to less than 0.01%.
See Accompanying Notes to Financial Statements.
148
Financial Highlights – Columbia Oregon Intermediate Municipal Bond Fund
Selected data for a fund share outstanding throughout each period is as follows:
| | | Year Ended August 31, | | Period
Ended
August 31, | |
| Class C Shares | | 2007 | | 2006 | | 2005 | | 2004 (a) | |
| Net Asset Value, Beginning of Period | | $ | 12.24 | | | $ | 12.45 | | | $ | 12.45 | | | $ | 12.42 | | |
| Income from Investment Operations: | |
| Net investment income (b) | | | 0.40 | | | | 0.41 | | | | 0.41 | | | | 0.36 | | |
| Net realized and unrealized gain (loss) on investments | | | (0.21 | ) | | | (0.21 | ) | | | 0.03 | | | | 0.18 | | |
| Total from investment operations | | | 0.19 | | | | 0.20 | | | | 0.44 | | | | 0.54 | | |
| Less Distributions to Shareholders: | |
| From net investment income | | | (0.41 | ) | | | (0.41 | ) | | | (0.40 | ) | | | (0.37 | ) | |
| From net realized gains | | | — | | | | — | | | | (0.04 | ) | | | (0.14 | ) | |
| Total distributions to shareholders | | | (0.41 | ) | | | (0.41 | ) | | | (0.44 | ) | | | (0.51 | ) | |
| Net Asset Value, End of Period | | $ | 12.02 | | | $ | 12.24 | | | $ | 12.45 | | | $ | 12.45 | | |
| Total return (c)(d) | | | 1.52 | % | | | 1.64 | % | | | 3.64 | % | | | 4.41 | %(e) | |
| Ratios to Average Net Assets/Supplemental Data: | |
| Net expenses (f) | | | 1.28 | % | | | 1.29 | % | | | 1.29 | % | | | 1.30 | %(g) | |
| Waiver/Reimbursement | | | 0.35 | % | | | 0.35 | % | | | 0.35 | % | | | 0.35 | %(g) | |
| Net investment income (f) | | | 3.33 | % | | | 3.33 | % | | | 3.31 | % | | | 3.28 | %(g) | |
| Portfolio turnover rate | | | 16 | % | | | 2 | % | | | 9 | % | | | 11 | % | |
| Net assets, end of period (000's) | | $ | 1,097 | | | $ | 616 | | | $ | 601 | | | $ | 278 | | |
(a) Class C shares were initially offered on October 13, 2003. Per share data and total return reflect activity from that date.
(b) Per share data was calculated using the average shares outstanding during the period.
(c) Total return at net asset value assuming all distributions reinvested and no contingent deferred sales charge.
(d) Had the investment advisor and/or any of its affiliates not waived or reimbursed a portion of expenses, total return would have been reduced.
(e) Not annualized.
(f) The benefits derived from expense reductions had an impact of less than 0.01%.
(g) Annualized.
See Accompanying Notes to Financial Statements.
149
Financial Highlights – Columbia Oregon Intermediate Municipal Bond Fund
Selected data for a fund share outstanding throughout each period is as follows:
| | | Year Ended August 31, | | Period
Ended
August 31, | | Year
Ended
December 31, | |
| Class Z Shares | | 2007 | | 2006 | | 2005 | | 2004 | | 2003 (a) | | 2002 (b) | |
| Net Asset Value, Beginning of Period | | $ | 12.24 | | | $ | 12.45 | | | $ | 12.45 | | | $ | 12.25 | | | $ | 12.50 | | | $ | 12.08 | | |
| Income from Investment Operations: | |
| Net investment income (c) | | | 0.49 | | | | 0.49 | | | | 0.49 | | | | 0.50 | | | | 0.34 | | | | 0.55 | | |
Net realized and unrealized gain (loss)
on investments | | | (0.23 | ) | | | (0.21 | ) | | | 0.03 | | | | 0.34 | | | | (0.23 | ) | | | 0.54 | | |
| Total from investment operations | | | 0.26 | | | | 0.28 | | | | 0.52 | | | | 0.84 | | | | 0.11 | | | | 1.09 | | |
| Less Distributions to Shareholders: | |
| From net investment income | | | (0.48 | ) | | | (0.49 | ) | | | (0.48 | ) | | | (0.50 | ) | | | (0.35 | ) | | | (0.55 | ) | |
| From net realized gains | | | — | | | | — | | | | (0.04 | ) | | | (0.14 | ) | | | (0.01 | ) | | | (0.12 | ) | |
| Total distributions to shareholders | | | (0.48 | ) | | | (0.49 | ) | | | (0.52 | ) | | | (0.64 | ) | | | (0.36 | ) | | | (0.67 | ) | |
| Net Asset Value, End of Period | | $ | 12.02 | | | $ | 12.24 | | | $ | 12.45 | | | $ | 12.45 | | | $ | 12.25 | | | $ | 12.50 | | |
| Total return (d) | | | 2.18 | % | | | 2.31 | %(e) | | | 4.31 | % | | | 6.97 | % | | | 0.83 | %(f) | | | 9.24 | % | |
| Ratios to Average Net Assets/Supplemental Data: | |
| Net expenses (g) | | | 0.63 | % | | | 0.64 | % | | | 0.64 | % | | | 0.65 | % | | | 0.68 | %(h) | | | 0.58 | % | |
| Waiver/Reimbursement | | | — | | | | — | %(i) | | | — | | | | — | | | | — | | | | — | | |
| Net investment income (g) | | | 3.98 | % | | | 3.99 | % | | | 3.96 | % | | | 4.03 | % | | | 4.13 | %(h) | | | 4.45 | % | |
| Portfolio turnover rate | | | 16 | % | | | 2 | % | | | 9 | % | | | 11 | % | | | 10 | %(f) | | | 21 | % | |
| Net assets, end of period (000's) | | $ | 368,292 | | | $ | 380,653 | | | $ | 410,706 | | | $ | 434,509 | | | $ | 485,427 | | | $ | 508,865 | | |
(a) The Fund changed its fiscal year end from December 31 to August 31.
(b) On November 1, 2002, the existing Fund shares were renamed Class Z shares.
(c) Per share data was calculated using the average shares outstanding during the period.
(d) Total return at net asset value assuming all distributions reinvested.
(e) Had the investment advisor and/or any of its affiliates not waived or reimbursed a portion of expenses, total return would have been reduced.
(f) Not annualized.
(g) The benefits derived from expense reductions had an impact of less than 0.01%.
(h) Annualized.
(i) Rounds to less than 0.01%.
See Accompanying Notes to Financial Statements.
150
Financial Highlights – Columbia Conservative High Yield Fund
Selected data for a fund share outstanding throughout each period is as follows:
| | | Year Ended August 31, | | Period
Ended
August 31, | | Period
Ended
December 31, | |
| Class A Shares | | 2007 | | 2006 | | 2005 | | 2004 | | 2003 (a) | | 2002 (b) | |
| Net Asset Value, Beginning of Period | | $ | 8.27 | | | $ | 8.62 | | | $ | 8.69 | | | $ | 8.49 | | | $ | 8.37 | | | $ | 8.17 | | |
| Income from Investment Operations: | |
| Net investment income (c) | | | 0.52 | | | | 0.50 | | | | 0.48 | | | | 0.50 | | | | 0.33 | | | | 0.09 | | |
Net realized and unrealized gain (loss)
on investments and foreign currency | | | (0.13 | ) | | | (0.32 | ) | | | (0.03 | ) | | | 0.24 | | | | 0.15 | | | | 0.20 | | |
| Total from investment operations | | | 0.39 | | | | 0.18 | | | | 0.45 | | | | 0.74 | | | | 0.48 | | | | 0.29 | | |
| Less Distributions to Shareholders: | |
| From net investment income | | | (0.54 | ) | | | (0.53 | ) | | | (0.52 | ) | | | (0.54 | ) | | | (0.36 | ) | | | (0.09 | ) | |
| Net Asset Value, End of Period | | $ | 8.12 | | | $ | 8.27 | | | $ | 8.62 | | | $ | 8.69 | | | $ | 8.49 | | | $ | 8.37 | | |
| Total return (d) | | | 4.75 | % | | | 2.16 | %(e) | | | 5.31 | % | | | 8.90 | % | | | 5.81 | %(f) | | | 3.50 | %(f) | |
| Ratios to Average Net Assets/Supplemental Data: | |
| Net expenses before interest expense (g) | | | 1.03 | % | | | 0.97 | % | | | 0.95 | % | | | 1.01 | % | | | 1.07 | %(h) | | | 1.15 | %(h) | |
| Interest expense | | | — | %(i) | | | — | | | | — | | | | — | | | | — | | | | — | | |
| Net expenses (g) | | | 1.03 | % | | | 0.97 | % | | | 0.95 | % | | | 1.01 | % | | | 1.07 | %(h) | | | 1.15 | %(h) | |
| Waiver/Reimbursement | | | — | | | | — | %(i) | | | — | | | | — | | | | — | | | | — | | |
| Net investment income (g) | | | 6.25 | % | | | 5.97 | % | | | 5.55 | % | | | 5.74 | % | | | 5.82 | %(h) | | | 6.46 | %(h) | |
| Portfolio turnover rate | | | 42 | % | | | 31 | % | | | 40 | % | | | 41 | % | | | 38 | %(f) | | | 42 | % | |
| Net assets, end of period (000's) | | $ | 103,769 | | | $ | 170,575 | | | $ | 321,402 | | | $ | 335,841 | | | $ | 193,267 | | | $ | 33,992 | | |
(a) The Fund changed its fiscal year end from December 31 to August 31.
(b) Class A shares were initially offered on November 1, 2002. Per share data and total return reflect activity from that date.
(c) Per share data was calculated using the average shares outstanding during the period.
(d) Total return at net asset value assuming all distributions reinvested and no initial sales charge or contingent deferred sales charge.
(e) Had the investment advisor and/or any of its affiliates not waived or reimbursed a portion of expenses, total return would have been reduced.
(f) Not annualized.
(g) The benefits derived from expense reductions had an impact of less than 0.01%.
(h) Annualized.
(i) Rounds to less than 0.01%.
See Accompanying Notes to Financial Statements.
151
Financial Highlights – Columbia Conservative High Yield Fund
Selected data for a fund share outstanding throughout each period is as follows:
| | | Year Ended August 31, | | Period
Ended
August 31, | | Period
Ended
December 31, | |
| Class B Shares | | 2007 | | 2006 | | 2005 | | 2004 | | 2003 (a) | | 2002 (b) | |
| Net Asset Value, Beginning of Period | | $ | 8.27 | | | $ | 8.62 | | | $ | 8.69 | | | $ | 8.49 | | | $ | 8.37 | | | $ | 8.17 | | |
| Income from Investment Operations: | |
| Net investment income (c) | | | 0.46 | | | | 0.44 | | | | 0.42 | | | | 0.43 | | | | 0.28 | | | | 0.07 | | |
Net realized and unrealized gain (loss)
on investments and foreign currency | | | (0.13 | ) | | | (0.32 | ) | | | (0.03 | ) | | | 0.24 | | | | 0.15 | | | | 0.20 | | |
| Total from investment operations | | | 0.33 | | | | 0.12 | | | | 0.39 | | | | 0.67 | | | | 0.43 | | | | 0.27 | | |
| Less Distributions to Shareholders: | |
| From net investment income | | | (0.48 | ) | | | (0.47 | ) | | | (0.46 | ) | | | (0.47 | ) | | | (0.31 | ) | | | (0.07 | ) | |
| Net Asset Value, End of Period | | $ | 8.12 | | | $ | 8.27 | | | $ | 8.62 | | | $ | 8.69 | | | $ | 8.49 | | | $ | 8.37 | | |
| Total return (d) | | | 3.97 | % | | | 1.40 | %(e) | | | 4.53 | % | | | 8.07 | % | | | 5.20 | %(f) | | | 3.33 | %(f) | |
| Ratios to Average Net Assets/Supplemental Data: | |
| Net expenses before interest expense (g) | | | 1.78 | % | | | 1.72 | % | | | 1.70 | % | | | 1.77 | % | | | 1.94 | %(h) | | | 1.90 | %(h) | |
| Interest expense | | | — | %(i) | | | — | | | | — | | | | — | | | | — | | | | — | | |
| Net expenses (g) | | | 1.78 | % | | | 1.72 | % | | | 1.70 | % | | | 1.77 | % | | | 1.94 | %(h) | | | 1.90 | %(h) | |
| Waiver/Reimbursement | | | — | | | | — | %(i) | | | — | | | | — | | | | — | | | | — | | |
| Net investment income (g) | | | 5.50 | % | | | 5.21 | % | | | 4.80 | % | | | 4.97 | % | | | 4.93 | %(h) | | | 5.71 | %(h) | |
| Portfolio turnover rate | | | 42 | % | | | 31 | % | | | 40 | % | | | 41 | % | | | 38 | %(f) | | | 42 | % | |
| Net assets, end of period (000's) | | $ | 50,577 | | | $ | 66,886 | | | $ | 89,101 | | | $ | 102,038 | | | $ | 89,950 | | | $ | 16,701 | | |
(a) The Fund changed its fiscal year end from December 31 to August 31.
(b) Class B shares were initially offered on November 1, 2002. Per share data and total return reflect activity from that date.
(c) Per share data was calculated using the average shares outstanding during the period.
(d) Total return at net asset value assuming all distributions reinvested and no contingent deferred sales charge.
(e) Had the investment advisor and/or any of its affiliates not waived or reimbursed a portion of expenses, total return would have been reduced.
(f) Not annualized.
(g) The benefits derived from expense reductions had an impact of less than 0.01%.
(h) Annualized.
(i) Rounds to less than 0.01%.
See Accompanying Notes to Financial Statements.
152
Financial Highlights – Columbia Conservative High Yield Fund
Selected data for a fund share outstanding throughout each period is as follows:
| | | Year Ended August 31, | | Period
Ended
August 31, | |
| Class C Shares | | 2007 | | 2006 | | 2005 | | 2004 (a) | |
| Net Asset Value, Beginning of Period | | $ | 8.27 | | | $ | 8.62 | | | $ | 8.69 | | | $ | 8.64 | | |
| Income from Investment Operations: | |
| Net investment income (b) | | | 0.47 | | | | 0.45 | | | | 0.43 | | | | 0.39 | | |
Net realized and unrealized gain (loss)
on investments and foreign currency | | | (0.13 | ) | | | (0.32 | ) | | | (0.03 | ) | | | 0.09 | | |
| Total from investment operations | | | 0.34 | | | | 0.13 | | | | 0.40 | | | | 0.48 | | |
| Less Distributions to Shareholders: | |
| From net investment income | | | (0.49 | ) | | | (0.48 | ) | | | (0.47 | ) | | | (0.43 | ) | |
| Net Asset Value, End of Period | | $ | 8.12 | | | $ | 8.27 | | | $ | 8.62 | | | $ | 8.69 | | |
| Total return (c)(d) | | | 4.13 | % | | | 1.55 | % | | | 4.69 | % | | | 5.65 | %(e) | |
| Ratios to Average Net Assets/Supplemental Data: | |
| Net expenses before interest expense (f) | | | 1.63 | % | | | 1.57 | % | | | 1.55 | % | | | 1.61 | %(g) | |
| Interest expense | | | — | %(h) | | | — | | | | — | | | | — | | |
| Net expenses (f) | | | 1.63 | % | | | 1.57 | % | | | 1.55 | % | | | 1.61 | %(g) | |
| Waiver/Reimbursement | | | 0.15 | % | | | 0.15 | % | | | 0.15 | % | | | 0.15 | %(g) | |
| Net investment income (f) | | | 5.69 | % | | | 5.37 | % | | | 4.95 | % | | | 5.03 | %(g) | |
| Portfolio turnover rate | | | 42 | % | | | 31 | % | | | 40 | % | | | 41 | % | |
| Net assets, end of period (000's) | | $ | 33,673 | | | $ | 11,653 | | | $ | 18,002 | | | $ | 20,126 | | |
(a) Class C shares were initially offered on October 13, 2003. Per share data and total return reflect activity from that date.
(b) Per share data was calculated using the average shares outstanding during the period.
(c) Total return at net asset value assuming all distributions reinvested and no contingent deferred sales charge.
(d) Had the investment advisor and/or any of its affiliates not waived or reimbursed a portion of expenses, total return would have been reduced.
(e) Not annualized.
(f) The benefits derived from expense reductions had an impact of less than 0.01%.
(g) Annualized.
(h) Rounds to less than 0.01%.
See Accompanying Notes to Financial Statements.
153
Financial Highlights – Columbia Conservative High Yield Fund
Selected data for a fund share outstanding throughout each period is as follows:
| | | Year Ended August 31, | | Period
Ended
August 31, | | Year
Ended
December 31, | |
| Class Z Shares | | 2007 | | 2006 | | 2005 | | 2004 | | 2003 (a) | | 2002 (b) | |
| Net Asset Value, Beginning of Period | | $ | 8.27 | | | $ | 8.62 | | | $ | 8.69 | | | $ | 8.49 | | | $ | 8.37 | | | $ | 8.87 | | |
| Income from Investment Operations: | |
| Net investment income (c) | | | 0.54 | | | | 0.52 | | | | 0.50 | | | | 0.52 | | | | 0.35 | | | | 0.57 | | |
Net realized and unrealized gain (loss)
on investments and foreign currency | | | (0.13 | ) | | | (0.32 | ) | | | (0.03 | ) | | | 0.24 | | | | 0.15 | | | | (0.48 | ) | |
| Total from investment operations | | | 0.41 | | | | 0.20 | | | | 0.47 | | | | 0.76 | | | | 0.50 | | | | 0.09 | | |
| Less Distributions to Shareholders: | |
| From net investment income | | | (0.56 | ) | | | (0.55 | ) | | | (0.54 | ) | | | (0.56 | ) | | | (0.38 | ) | | | (0.59 | ) | |
| Net Asset Value, End of Period | | $ | 8.12 | | | $ | 8.27 | | | $ | 8.62 | | | $ | 8.69 | | | $ | 8.49 | | | $ | 8.37 | | |
| Total return (d) | | | 5.01 | % | | | 2.42 | %(e) | | | 5.54 | % | | | 9.16 | % | | | 6.04 | %(f) | | | 1.17 | % | |
| Ratios to Average Net Assets/Supplemental Data: | |
| Net expenses before interest expense (g) | | | 0.78 | % | | | 0.72 | % | | | 0.70 | % | | | 0.77 | % | | | 0.82 | %(h) | | | 0.77 | % | |
| Interest expense | | | — | %(i) | | | — | | | | — | | | | — | | | | — | | | | — | | |
| Net expenses (g) | | | 0.78 | % | | | 0.72 | % | | | 0.70 | % | | | 0.77 | % | | | 0.82 | %(h) | | | 0.77 | % | |
| Waiver/Reimbursement | | | — | | | | — | %(i) | | | — | | | | — | | | | — | | | | — | | |
| Net investment income (g) | | | 6.49 | % | | | 6.20 | % | | | 5.80 | % | | | 5.97 | % | | | 6.19 | %(h) | | | 6.84 | % | |
| Portfolio turnover rate | | | 42 | % | | | 31 | % | | | 40 | % | | | 41 | % | | | 38 | %(f) | | | 42 | % | |
| Net assets, end of period (000's) | | $ | 614,168 | | | $ | 801,811 | | | $ | 1,073,894 | | | $ | 1,186,454 | | | $ | 1,197,340 | | | $ | 702,785 | | |
(a) The Fund changed its fiscal year end from December 31 to August 31.
(b) On November 1, 2002, the existing Fund shares were renamed Class Z shares.
(c) Per share data was calculated using the average shares outstanding during the period.
(d) Total return at net asset value assuming all distributions reinvested.
(e) Had the investment advisor and/or any of its affiliates not waived or reimbursed a portion of expenses, total return would have been reduced.
(f) Not annualized.
(g) The benefits derived from expense reductions had an impact of less than 0.01%.
(h) Annualized.
(i) Rounds to less than 0.01%.
See Accompanying Notes to Financial Statements.
154
Notes to Financial Statements – Columbia Funds
August 31, 2007
Note 1. Organization
Columbia Funds Series Trust I (the "Trust") is a Massachusetts business trust registered under the Investment Company Act of 1940, as amended, as an open-end management investment company. Information presented in these financial statements pertains to the following funds (individually referred to as a "Fund", collectively referred to as the "Funds"):
Columbia International Stock Fund
Columbia Mid Cap Growth Fund
Columbia Small Cap Growth Fund I
Columbia Real Estate Equity Fund
Columbia Technology Fund
Columbia Strategic Investor Fund
Columbia Balanced Fund
Columbia Oregon Intermediate Municipal Bond Fund
Columbia Conservative High Yield Fund
All Funds currently operate as diversified funds.
Investment Goals
Columbia International Stock Fund seeks long-term capital appreciation by investing, under normal market conditions, at least 80% of its total net assets (plus any borrowings for investment purposes) in stocks issued by companies from at least three countries outside the United States. Columbia Mid Cap Growth Fund seeks significant capital appreciation by investing, under normal market conditions, at least 80% of its total net assets (plus any borrowings for investment purposes) in stocks of companies with a market capitalization, at the time of initial purchase, equal to or less than the largest stock in the Russell Midcap Index. Columbia Small Cap Growth Fund I seeks capital appreciation by investing, under normal market conditions, at least 80% of its net assets (plus any borrowings for investment purposes) in stocks of companies with a market capitalization, at the time of initial purchase, equal to or less than the largest stock in the Standard & Poor's SmallCap 600 Index. Columbia Real Estate Equity Fund seeks capital appreciation and above-average income by investing, under normal market conditions, at least 80% of its net assets (plus any borrowings for investment purposes) in stocks of companies principally engaged in the real estate industry, including real estate investment trusts (REITs). Columbia Technology Fund seeks capital appreciation by investing, under normal market conditions, at least 80% of its total net assets (plus any borrowings for investment purposes) in stocks of technology companies that may benefit from technological improvements, advancements or developments. Columbia Strategic Investor Fund seeks long-term growth of capital by using a "value" approach to investing primarily in common stocks. Columbia Balanced Fund seeks high total return by investing in common stocks and debt securities. Columbia Oregon Intermediate Municipal Bond Fund seeks a high level of income exempt from federal and Oregon income tax by investing at least 80% of its net assets (plus any borrowings for investment purposes) in municipal securities issued by the State of Oregon (and its political subdivisions, agencies, authorities and instrumentalities). Columbia Conservative High Yield Fund seeks a high level of income, with capital appreciation as a secondary goal, by investing in non-investment-grade, corporate debt securities, commonly referred to as "junk" or "high-yield" bonds.
Fund Shares
The Trust may issue an unlimited number of shares. Each of the Funds, except Columbia Mid Cap Growth Fund, offers four classes of shares: Class A, Class B, Class C and Class Z. Columbia Mid Cap Growth Fund offers six classes of shares: Class A, Class B, Class C, Class R, Class T and Class Z. Each share class has its own expense structure and sales charges, as applicable.
Effective August 8, 2007, the Class D shares of a Fund, were converted into Class C shares of the same Fund. Also effective August 8, 2007, the Class G shares of Columbia International Stock Fund were converted into Class A shares of the same Fund, and the Class G shares of Columbia Mid Cap Growth Fund were converted into Class T shares of the same Fund.
With the exception of Class A shares of Columbia Oregon Intermediate Municipal Bond Fund and Columbia Conservative High Yield Fund, Class A and Class T shares are subject to a front-end sales charge of up to 5.75% based on the amount of initial investment. Class A shares of Columbia Oregon Intermediate Municipal Bond Fund and Columbia Conservative High Yield Fund are subject to a front-end sales charge of up to 3.25% and 4.75%, respectively, based on the amount of initial investment. Class A and Class T shares purchased without an initial sales charge in accounts aggregating up to $50 million at the time of purchase are subject to a 1.00% contingent deferred sales charge ("CDSC") on shares sold within twelve months after purchase. With the
155
Columbia Funds, August 31, 2007 (continued)
exception of Class B shares of Columbia Oregon Intermediate Municipal Bond Fund, which are subject to a maximum CDSC of 3.00%, Class B shares are subject to a maximum CDSC of 5.00% based upon the holding period after purchase. Class B shares will generally convert to Class A shares eight years after purchase. Class C shares are subject to a 1.00% CDSC on shares sold within twelve months after purchase. Class R and Class Z shares are offered continuously at net asset value. There are certain restrictions on the purchase of Class R and Class Z shares, as described in each Fund's prospectus.
Note 2. Significant Accounting Policies
The preparation of financial statements in accordance with accounting principles generally accepted in the United States of America ("GAAP") requires management to make certain estimates and assumptions that affect the reported amounts of assets and liabilities, the disclosure of contingent assets and liabilities at the date of the financial statements and the reported amounts of revenue and expenses during the reporting period. Actual results could differ from those estimates. The following is a summary of significant accounting policies consistently followed by the Funds in the preparation of their financial statements.
Security Valuation
Equity securities and certain investment companies are valued at the last sale price on the principal exchange on which they trade, except for securities traded on the NASDAQ, which are valued at the NASDAQ official close price. Unlisted securities or listed securities for which there were no sales during the day are valued at the closing bid price on such exchanges or over-the-counter markets.
Debt securities generally are valued by pricing services approved by the Trust's Board of Trustees, based upon market transactions for normal, institutional-size trading units of similar securities. The services may use various pricing techniques which take into account appropriate factors such as yield, quality, coupon rate, maturity, type of issue, trading characteristics and other data, as well as broker quotes. Debt securities for which quotations are readily available are valued at an over-the-counter or exchange bid quotation. Certain debt securities, which tend to be more thinly traded and of lesser quality, are priced based on fundamental analysis of the financial condition of the issuer and the estimated value of any collateral. Valuations developed through pricing techniques may vary from the actual amounts realized upon sale of the securities, and the potential variation may be greater for those securities valued using fundamental analysis.
Short-term debt obligations maturing within 60 days are valued at amortized cost, which approximates market value.
Investments in other open-end investment companies are valued at net asset value.
Options are valued at the last reported sale price, or in the absence of a sale, the mean between the last quoted bid and ask price.
Forward currency exchange contracts are valued at the prevailing forward exchange rate of the underlying currencies.
Foreign securities are generally valued at the last sale price on the foreign exchange or market on which they trade. If any foreign share prices are not readily available as a result of limited share activity, the securities are valued at the last sale price of the local shares in the principal market in which such securities are normally traded.
Generally, trading in foreign securities is substantially completed each day at various times prior to the close of the New York Stock Exchange ("NYSE"). The values of such securities used in computing the net asset value of the Funds' shares are determined as of such times. Foreign currency exchange rates are generally determined at 4:00 p.m. Eastern (U.S.) time. Events affecting the values of such foreign securities and such exchange rates may occur between the times at which they are determined and the close of the customary trading session of the NYSE, which would not be reflected in the computation of the Funds' net asset values. If events materially affecting the values of such foreign securities occur and it is determined that market quotations are not reliable, then these foreign securities will be valued at their "fair value" using procedures approved by the Board of Trustees. Certain Funds may use a systematic fair val uation model provided by an independent third party to value securities principally traded in foreign markets in order to adjust for possible stale pricing that may occur between the close of the foreign exchanges and the time for valuation. If a security is valued at fair value, such value is likely to be different from the last quoted market price for the security.
Investments for which market quotations are not readily available, or that have quotations which management believes
156
Columbia Funds, August 31, 2007 (continued)
are not reliable, are valued at fair value as determined in good faith under consistently applied procedures established by and under the general supervision of the Board of Trustees. If a security is valued at fair value, such value is likely to be different from the last quoted market price for the security.
In September 2006, Statement of Financial Accounting Standards No. 157, Fair Value Measurements ("SFAS 157"), was issued. SFAS 157 is effective for fiscal years beginning after November 15, 2007. SFAS 157 defines fair value, establishes a framework for measuring fair value and expands disclosures about fair value measurements. Management is evaluating the impact the application of SFAS 157 will have on the Funds' financial statement disclosures.
Security Transactions
Security transactions are accounted for on the trade date. Cost is determined and gains (losses) are based upon the specific identification method for both financial statement and federal income tax purposes.
Options
Writing put options tends to increase a Fund's exposure to the underlying instrument. Writing call options tends to decrease a Fund's exposure to the underlying instrument. When a Fund writes a call or put option, an amount equal to the premium received is recorded as a liability and subsequently marked-to-market to reflect the current value of the option written. Premiums received from writing options which expire are treated as realized gains. Premiums received from writing options which are exercised or closed are added to the proceeds or offset against the amounts paid on the underlying future transaction to determine the realized gain or loss. Each Fund as a writer of an option has no control over whether the underlying security may be sold (call) or purchased (put) and as a result bears the market risk of an unfavorable change in the price of the security underlying the written option. There is the risk that a Fund may not be able to enter into a closing transaction because of an illiquid market. Each Fund's custodian will set aside cash or liquid portfolio securities equal to the amount of the written options contract commitment in a separate account.
Forward Foreign Currency Exchange Contracts
Forward foreign currency exchange contracts are agreements to exchange one currency for another at a future date at a specified price. These contracts are used to minimize the exposure to foreign exchange rate fluctuations during the period between trade and settlement date of the contract. Certain Funds may utilize forward foreign currency exchange contracts in connection with the settlement of purchases and sales of securities. Certain Funds may also enter into these contracts to hedge certain other foreign currency denominated assets. Contracts to buy generally are used to acquire exposure to foreign currencies, while contracts to sell are used to hedge the Funds' investments against currency fluctuations. Forward foreign currency exchange contracts are valued daily at the current exchange rate of the underlying currency, resulting in unrealized gains (losses) which become realized at the time the forward foreign currency exc hange contracts are closed or mature. Realized and unrealized gains (losses) arising from such transactions are included in net realized and unrealized gains (losses) on foreign currency transactions. The use of forward foreign currency exchange contracts does not eliminate fluctuations in the prices of the Funds' portfolio securities. While the maximum potential loss from such contracts is the aggregate face value in U.S. dollars at the time the contract was opened, exposure is typically limited to the change in value of the contract (in U.S. dollars) over the period it remains open. The Funds are also exposed to risk that counterparties of the contracts may be unable to fulfill the terms of the contracts.
Treasury Inflation Protected Securities
Columbia Balanced Fund may invest in treasury inflation protected securities ("TIPS"). The principal amount of TIPS is adjusted periodically for inflation based on a monthly published index. Interest payments are based on the inflation-adjusted principal at the time the interest is paid.
Repurchase Agreements
Each Fund may engage in repurchase agreement transactions with institutions that Columbia Management Advisors, LLC ("Columbia"), the Funds' investment advisor, has determined are creditworthy. Each Fund, through its custodian, receives delivery of underlying securities collateralizing a repurchase agreement. Columbia is responsible for determining that collateral is at least equal, at all times, to the value of the repurchase obligation
157
Columbia Funds, August 31, 2007 (continued)
including interest. A repurchase agreement transaction involves certain risks in the event of default or insolvency of the counterparty. These risks include possible delays or restrictions upon each Fund's ability to dispose of the underlying securities and a possible decline in the value of the underlying securities during the period while the Funds seek to assert their rights.
Delayed Delivery Securities
Certain Funds may trade securities on other than normal settlement terms, including securities purchased or sold on a "when-issued" basis. This may increase the risk if the other party to the transaction fails to deliver and causes a Fund to subsequently invest at less advantageous prices. Each Fund identifies liquid portfolio securities in its records as segregated in an amount equal to the delayed delivery commitment.
Income Recognition
Interest income is recorded on the accrual basis. Premium and discount are amortized and accreted, respectively, on all debt securities. Original issue discount is accreted to interest income over the life of the security with a corresponding increase in the cost basis. Corporate actions and dividend income are recorded on the ex-date, except for certain foreign securities which are recorded as soon after ex-date as the Funds become aware of such, net of non-reclaimable tax withholdings. Awards from class action litigation are recorded as a reduction of cost if the Funds still own the applicable securities on the payment date. If the Funds no longer own the applicable securities, the proceeds are recorded as realized gains.
The value of additional securities received as an income payment is recorded as income and as the cost basis of such securities.
The Funds estimate components of distributions from real estate investment trusts (REITs). Distributions received from REITs in excess of their income are recorded as a reduction of the cost of the related investments and/or realized gain as applicable. If the Funds no longer own the applicable securities, any distributions received in excess of income are recorded as realized gains.
Foreign Currency Transactions
The values of all assets and liabilities quoted in foreign currencies are translated into U.S. dollars at that day's exchange rates. Net realized and unrealized gains (losses) on foreign currency transactions include gains (losses) arising from the fluctuation in exchange rates between trade and settlement dates on securities transactions, gains (losses) arising from the disposition of foreign currency and currency gains (losses) between the accrual and payment dates on dividends, interest income and foreign withholding taxes.
For financial statement purposes, the Funds do not distinguish that portion of gains (losses) on investments which is due to changes in foreign exchange rates from that which is due to changes in market prices of the investments. Such fluctuations are included with the net realized and unrealized gains (losses) on investments in the Statements of Operations.
Determination of Class Net Asset Values
All income, expenses (other than class-specific expenses, as shown on the Statements of Operations) and realized and unrealized gains (losses) are allocated to each class of a Fund on a daily basis for purposes of determining the net asset value of each class. Income and expenses are allocated to each class based on the settled shares method, while realized and unrealized gains (losses) are allocated based on the relative net assets of each class for Columbia Oregon Intermediate Municipal Bond Fund and Columbia Conservative High Yield Fund. For all other Funds, income, expenses (other than class-specific expenses, as shown on the Statements of Operations), and realized and unrealized gains (losses) are allocated to each class of a Fund based on the relative net assets of each class of that Fund.
Federal Income Tax Status
Each Fund intends to qualify each year as a "regulated investment company" under Subchapter M of the Internal Revenue Code, as amended, and will distribute substantially all of its taxable income, if any, for its tax year, and as such will not be subject to federal income taxes. In addition, each Fund intends to distribute in each calendar year substantially all of its net investment income, capital gains and certain other amounts, if any, such that each Fund should not be subject to federal excise tax. Therefore, no federal income or excise tax provision is recorded.
Foreign Capital Gains Taxes
Realized gains in certain countries may be subject to foreign taxes at the fund level, at rates ranging from approximately 10% to 15%. The Funds accrue for such foreign taxes on net realized and unrealized gains at the appropriate rate for each jurisdiction.
158
Columbia Funds, August 31, 2007 (continued)
Dividends and Distributions to Shareholders
Dividends from net investment income of Columbia International Stock Fund, Columbia Mid Cap Growth Fund, Columbia Small Cap Growth Fund I, Columbia Technology Fund and Columbia Strategic Investor Fund are declared and paid annually. Dividends from net investment income of Columbia Real Estate Equity Fund and Columbia Balanced Fund are declared and paid quarterly. Dividends from net investment income of Columbia Oregon Intermediate Municipal Bond Fund and Columbia Conservative High Yield Fund are declared daily and paid monthly. Net realized capital gains, if any, are distributed at least annually for all Funds. Additional distributions of net investment income and capital gains for each Fund may be made at the discretion of the Board of Trustees in accordance with federal income tax regulations.
Indemnification
In the normal course of business, each Fund enters into contracts that contain a variety of representations and warranties and which provide general indemnities. A Fund's maximum exposure under these arrangements is unknown because this would involve future claims against the Fund.
Also, under the Trust's organizational documents and by contract, the Trustees and officers of the Trust are indemnified against certain liabilities that may arise out of actions relating to their duties to the Trust. However, based on experience, the Funds expect the risk of loss due to these representations, warranties and indemnities to be minimal.
Note 3. Federal Tax Information
The timing and character of income and capital gain distributions are determined in accordance with income tax regulations, which may differ from GAAP. Reclassifications are made to the Funds' capital accounts for permanent tax differences to reflect income and gains available for distribution (or available capital loss carryforwards) under income tax regulations.
For the year ended August 31, 2007, permanent book and tax basis differences resulting primarily from differing treatments for net operating loss reclassifications, capital loss carryforwards, paydown reclassifications, distribution reclassifications, PFIC adjustments, redemption based payments treated as dividends paid deduction, market discount reclassifications and discount accretion/premium amortization on debt securities were identified and reclassified among the components of the Funds' net assets as follows:
| | | Undistributed
(Overdistributed)
Net Investment
Income or
Accumulated Net
Investment Loss | | Accumulated
Net Realized
Gain (Loss) | | Paid-In Capital | |
| Columbia International Stock Fund | | $ | 11,163,584 | | | $ | (11,163,582 | ) | | $ | (2 | ) | |
| Columbia Mid Cap Growth Fund | | | (193,208 | ) | | | (50,744,739 | ) | | | 50,937,947 | | |
| Columbia Small Cap Growth Fund I | | | 1,352,516 | | | | (3,027,277 | ) | | | 1,674,761 | | |
| Columbia Real Estate Equity Fund | | | 2,212,664 | | | | (20,359,545 | ) | | | 18,146,881 | | |
| Columbia Technology Fund | | | 2,297,245 | | | | (2,297,245 | ) | | | — | | |
| Columbia Strategic Investor Fund | | | (411,530 | ) | | | (47,455,206 | ) | | | 47,866,736 | | |
| Columbia Balanced Fund | | | 381,532 | | | | (381,531 | ) | | | (1 | ) | |
| Columbia Oregon Intermediate Municipal Bond Fund | | | 3,254 | | | | (3,253 | ) | | | (1 | ) | |
| Columbia Conservative High Yield Fund | | | 4,563,066 | | | | (4,563,066 | ) | | | — | | |
Net investment income and net realized gains (losses), as disclosed on the Statements of Operations, and net assets were not affected by these reclassifications.
159
Columbia Funds, August 31, 2007 (continued)
The tax character of distributions paid during the years ended August 31, 2007 and August 31, 2006 was as follows:
| | | August 31, 2007 | |
| | | Tax-Exempt
Income | | Ordinary
Income* | | Long-Term
Capital Gains | | Total | |
| Columbia International Stock Fund | | $ | — | | | $ | 21,930,885 | | | $ | 136,213,727 | | | $ | 158,144,612 | | |
| Columbia Mid Cap Growth Fund | | | — | | | | 13,102,667 | | | | 74,190,625 | | | | 87,293,292 | | |
| Columbia Small Cap Growth Fund I | | | — | | | | 7,227,574 | | | | 23,653,088 | | | | 30,880,662 | | |
| Columbia Real Estate Equity Fund | | | — | | | | 9,129,456 | | | | 211,804,391 | | | | 220,933,847 | | |
| Columbia Strategic Investor Fund | | | — | | | | 6,325,599 | | | | 54,525,936 | | | | 60,851,535 | | |
| Columbia Balanced Fund | | | — | | | | 5,000,055 | | | | — | | | | 5,000,055 | | |
| Columbia Oregon Intermediate Municipal Bond Fund | | | 15,322,951 | | | | 12,232 | | | | — | | | | 15,335,183 | | |
| Columbia Conservative High Yield Fund | | | — | | | | 63,509,159 | | | | — | | | | 63,509,159 | | |
| | | August 31, 2006 | |
| | | Tax-Exempt
Income | | Ordinary
Income* | | Long-Term
Capital Gains | | Total | |
| Columbia International Stock Fund | | $ | — | | | $ | 11,615,869 | | | $ | 13,994,627 | | | $ | 25,610,496 | | |
| Columbia Mid Cap Growth Fund | | | — | | | | — | | | | 11,213,733 | | | | 11,213,733 | | |
| Columbia Small Cap Growth Fund I | | | — | | | | 1,435,895 | | | | 5,050,791 | | | | 6,486,686 | | |
| Columbia Real Estate Equity Fund | | | — | | | | 12,008,348 | | | | 100,263,948 | | | | 112,272,296 | | |
| Columbia Technology Fund | | | — | | | | 3,110,203 | | | | 2,370,245 | | | | 5,480,448 | | |
| Columbia Strategic Investor Fund | | | — | | | | 12,739,296 | | | | 25,522,746 | | | | 38,262,042 | | |
| Columbia Balanced Fund | | | — | | | | 5,697,932 | | | | — | | | | 5,697,932 | | |
| Columbia Oregon Intermediate Municipal Bond Fund | | | 15,841,867 | | | | 1,845 | | | | — | | | | 15,843,712 | | |
| Columbia Conservative High Yield Fund | | | — | | | | 81,881,822 | | | | — | | | | 81,881,822 | | |
* For tax purposes short-term capital gains distributions, if any, are considered ordinary income distributions.
As of August 31, 2007, the components of distributable earnings on a tax basis were as follows:
| | | Undistributed
Tax-Exempt
Income | | Undistributed
Ordinary
Income | | Undistributed
Long-term
Capital Gains | | Net Unrealized
Appreciation
(Depreciation)* | |
| Columbia International Stock Fund | | $ | — | | | $ | 59,174,529 | | | $ | 118,508,329 | | | $ | 257,121,534 | | |
| Columbia Mid Cap Growth Fund | | | — | | | | 56,786,965 | | | | 114,215,588 | | | | 256,225,948 | | |
| Columbia Small Cap Growth Fund I | | | — | | | | 5,712,239 | | | | 19,947,023 | | | | 40,446,330 | | |
| Columbia Real Estate Equity Fund | | | — | | | | — | | | | 95,906,977 | | | | 135,209,650 | | |
| Columbia Technology Fund | | | — | | | | 462,050 | | | | 11,760,523 | | | | 46,866,499 | | |
| Columbia Strategic Investor Fund | | | — | | | | 5,927,818 | | | | 113,647,620 | | | | 195,846,201 | | |
| Columbia Balanced Fund | | | — | | | | 1,058,907 | | | | 624,689 | | | | 19,271,095 | | |
| Columbia Oregon Intermediate Municipal Bond Fund | | | 317,092 | | | | — | | | | — | | | | 7,968,471 | | |
| Columbia Conservative High Yield Fund | | | — | | | | 2,746,917 | | | | — | | | | (30,127,298 | ) | |
* The differences between book-basis and tax-basis net unrealized appreciation/depreciation are primarily due to deferral of losses from wash sales, PFIC adjustments and discount accretion/premium amortization on debt securities.
160
Columbia Funds, August 31, 2007 (continued)
Unrealized appreciation and depreciation at August 31, 2007, based on cost of investments for federal income tax purposes, and excluding any unrealized appreciation and depreciation from changes in the value of other assets and liabilities resulting from changes in exchange rates, were:
| | | Unrealized
Appreciation | | Unrealized
Depreciation | | Net
Unrealized
Appreciation
(Depreciation) | |
| Columbia International Stock Fund | | $ | 286,092,260 | | | $ | (28,970,726 | ) | | $ | 257,121,534 | | |
| Columbia Mid Cap Growth Fund | | | 281,122,571 | | | | (24,896,623 | ) | | | 256,225,948 | | |
| Columbia Small Cap Growth Fund I | | | 46,810,692 | | | | (6,364,362 | ) | | | 40,446,330 | | |
| Columbia Real Estate Equity Fund | | | 153,077,153 | | | | (17,867,503 | ) | | | 135,209,650 | | |
| Columbia Technology Fund | | | 51,240,578 | | | | (4,374,079 | ) | | | 46,866,499 | | |
| Columbia Strategic Investor Fund | | | 220,849,692 | | | | (25,003,491 | ) | | | 195,846,201 | | |
| Columbia Balanced Fund | | | 22,135,712 | | | | (2,864,617 | ) | | | 19,271,095 | | |
| Columbia Oregon Intermediate Municipal Bond Fund | | | 11,036,522 | | | | (3,068,051 | ) | | | 7,968,471 | | |
| Columbia Conservative High Yield Fund | | | 5,377,697 | | | | (35,504,995 | ) | | | (30,127,298 | ) | |
The following capital loss carryforwards, determined as of August 31, 2007, may be available to reduce taxable income arising from future net realized gains on investments, if any, to the extent permitted by the Internal Revenue Code:
| | | Year of Expiration | |
| | | 2008 | | 2009 | | 2010 | | 2011 | | 2013 | | 2014 | | 2015 | | Total | |
Columbia International
Stock Fund | | $ | 2,139,717 | | | $ | 52,014,158 | | | $ | 20,382,060 | | | $ | — | | | $ | — | | | $ | — | | | $ | — | | | $ | 74,535,935 | | |
Columbia Mid Cap
Growth Fund | | | 1,376,842 | | | | 1,376,842 | | | | — | | | | — | | | | — | | | | — | | | | — | | | | 2,753,684 | | |
Columbia Strategic
Investor Fund | | | — | | | | 10,580,464 | | | | — | | | | 10,580,464 | | | | — | | | | — | | | | — | | | | 21,160,928 | | |
Columbia Oregon
Intermediate
Municipal Bond Fund | | | — | | | | — | | | | — | | | | — | | | | 63,256 | | | | — | | | | — | | | | 63,256 | | |
Columbia Conservative
High Yield Fund | | | — | | | | — | | | | 9,535,110 | | | | — | | | | — | | | | 975,147 | | | | 22,859,341 | | | | 33,369,598 | | |
Capital loss carryforwards that were utilized during the year ended August 31, 2007 were as follows:
| Columbia International Stock Fund | | $ | 28,470,756 | | |
| Columbia Mid Cap Growth Fund | | | 59,390,157 | | |
| Columbia Strategic Investor Fund | | | 26,413,846 | | |
| Columbia Balanced Fund | | | 17,363,719 | | |
| Columbia Oregon Intermediate | | | | | |
| Municipal Bond Fund | | | 677,280 | | |
Of the remaining capital loss carryforwards attributable to Columbia International Stock Fund, $1,480,126 ($1,480,126 expiring August 31, 2008), $1,319,182 ($659,591 expiring August 31, 2008 and $659,591 expiring August 31, 2009) and $71,736,627 ($51,354,567 expiring August 31, 2009 and $20,382,060 expiring August 31, 2010) remain from Columbia International Stock Fund's merger with Liberty Newport International Equity Fund, Stein Roe International Fund, and Columbia International Equity Fund respectively. The availability
161
Columbia Funds, August 31, 2007 (continued)
of the remaining capital loss carryforwards may be limited in a given year.
Of the capital loss carryforwards attributable to Columbia Mid Cap Growth Fund, $2,753,684 ($1,376,842 expiring August 31, 2008 and $1,376,842 expiring August 31, 2009) remain from the Columbia Mid Cap Growth Fund's merger with Liberty Mid Cap Growth Fund.
Of the remaining capital loss carryforwards attributable to Columbia Strategic Income Fund, $10,580,464 ($10,580,464 expiring August 31, 2011), $8,684,300($8,684,300 expiring August 31, 2009) and $1,896,164 ($1,896,164 expiring August 31, 2009) remain from the Columbia Strategic Investor Fund merger with the Columbia Young Investor Fund. The total capital loss carryforwards acquired in the current year from the Columbia Young Investor Fund were $70,768,728 of which $23,193,954 was permanently lost and $26,413,846 was utilized to offset current year gains. The availability of a portion of the remaining capital loss carryforward from the Columbia Young Investor Fund may be limited in a given year.
Under current tax rules, certain currency and capital losses realized after October 31 may be deferred and treated as occurring on the first day of the following fiscal year. As of August 31, 2007, post-October currency losses and capital losses attributed to security transactions were deferred to September 1, 2007, as follows:
| | | Capital
Losses | |
Columbia Conservative
High Yield Fund | | $ | 3,100,004 | | |
In June 2006, the Financial Accounting Standards Board ("FASB") issued FASB Interpretation No. 48, Accounting for Uncertainty in Income Taxes, an Interpretation of FASB Statement No. 109 (the "Interpretation"). This Interpretation is effective on the last business day of the semiannual reporting period for fiscal years beginning after December 15, 2006 and is to be applied to open tax positions upon initial adoption. This Interpretation prescribes a minimum recognition threshold and measurement method for the financial statement recognition of tax positions taken or expected to be taken in a tax return and also requires certain expanded disclosures. Management is evaluating the application of this Interpretation to the Funds and has not at this time quantified the impact, if any, resulting from the adoption of this Interpretation on each Fund's financial statements.
Note 4. Fees and Compensation Paid to Affiliates
Investment Advisory Fee
Columbia, an indirect, wholly-owned subsidiary of Bank of America Corporation ("BOA"), provides administrative and other services to the Funds. Columbia receives a monthly investment advisory fee based on each Fund's average daily net assets at the following annual rates:
| | | First
$500
Million | | $500 Million
to $1
Billion | | $1 Billion
to $1.5
Billion | | $1.5 Billion
to $3
Billion | | $3 Billion
to $6
Billion | | Over
$6 Billion | |
Columbia International
Stock Fund | | | 0.87 | % | | | 0.82 | % | | | 0.77 | % | | | 0.72 | % | | | 0.70 | % | | | 0.68 | % | |
Columbia Mid Cap
Growth Fund | | | 0.82 | % | | | 0.75 | % | | | 0.72 | % | | | 0.67 | % | | | 0.67 | % | | | 0.67 | % | |
Columbia Small Cap
Growth Fund I | | | 0.87 | % | | | 0.82 | % | | | 0.77 | % | | | 0.77 | % | | | 0.77 | % | | | 0.77 | % | |
Columbia Real Estate
Equity Fund | | | 0.75 | % | | | 0.75 | % | | | 0.75 | % | | | 0.75 | % | | | 0.75 | % | | | 0.75 | % | |
| Columbia Technology Fund | | | 0.87 | % | | | 0.82 | % | | | 0.77 | % | | | 0.77 | % | | | 0.77 | % | | | 0.77 | % | |
Columbia Strategic
Investor Fund | | | 0.60 | % | | | 0.55 | % | | | 0.50 | % | | | 0.50 | % | | | 0.50 | % | | | 0.50 | % | |
| Columbia Balanced Fund | | | 0.50 | % | | | 0.50 | % | | | 0.50 | % | | | 0.50 | % | | | 0.50 | % | | | 0.50 | % | |
162
Columbia Funds, August 31, 2007 (continued)
| | | First
$500
Million | | $500 Million
to $1
Billion | | $1 Billion
to $1.5
Billion | | $1.5 Billion
to $3
Billion | | $3 Billion
to $6
Billion | | Over
$6 Billion | |
Columbia Oregon
Intermediate Municipal
Bond Fund | | | 0.50 | % | | | 0.50 | % | | | 0.50 | % | | | 0.50 | % | | | 0.50 | % | | | 0.50 | % | |
Columbia Conservative
High Yield Fund | | | 0.60 | % | | | 0.55 | % | | | 0.52 | % | | | 0.49 | % | | | 0.49 | % | | | 0.49 | % | |
For the year ended August 31, 2007, the effective investment advisory fee rates for the Funds, as a percentage of each Fund's average daily net assets, were as follows:
| | | Effective
Fee Rate | |
| Columbia International Stock Fund | | | 0.82 | % | |
| Columbia Mid Cap Growth Fund | | | 0.76 | % | |
| Columbia Small Cap Growth Fund I | | | 0.87 | % | |
| Columbia Real Estate Equity Fund | | | 0.75 | % | |
| Columbia Technology Fund | | | 0.87 | % | |
| Columbia Strategic Investor Fund | | | 0.57 | %* | |
| Columbia Balanced Fund | | | 0.50 | % | |
| Columbia Oregon Intermediate Municipal Bond Fund | | | 0.50 | % | |
| Columbia Conservative High Yield Fund | | | 0.58 | % | |
* Prior to September 25, 2006, the annual fee rate was 0.75% of the Fund's average daily net assets.
Administration Fee
Effective September 25, 2006, Columbia provides administrative and other services to Columbia Strategic Investor Fund for a monthly administration fee based on the Fund's average daily net assets at the following annual rates:
| Average Daily Net Assets | | Annual Fee Rate | |
| First $1 billion | | | 0.150 | % | |
| Over $1 billion | | | 0.125 | % | |
For the year ended August 31, 2007, the Fund's effective administration fee rate was 0.14% of the Fund's average daily net assets.
Pricing and Bookkeeping Fees
Effective December 15, 2006, the Funds entered into a Financial Reporting Services Agreement (the "Financial Reporting Services Agreement") with State Street Bank & Trust Company ("State Street") and Columbia pursuant to which State Street provides financial reporting services to the Funds. Also effective December 15, 2006, the Funds entered into an Accounting Services Agreement with State Street and Columbia (collectively with the Financial Reporting Services Agreement, the "State Street Agreements") pursuant to which State Street provides accounting services to the Funds. Under the State Street Agreements, each Fund pays State Street an annual fee of $38,000 paid monthly plus a monthly fee based on an annualized percentage rate of average daily net assets of the Fund for the month. The aggregate fee for each Fund will not exceed $140,000 per year (excl usive of out-of-pocket expenses and charges). The Funds also reimburse State Street for certain out-of-pocket expenses and charges.
Effective December 15, 2006, the Funds entered into a Pricing and Bookkeeping Oversight and Services Agreement (the "Services Agreement") with Columbia. Under the Services Agreement, Columbia provides services related to Fund expenses and the requirements of the Sarbanes-Oxley Act of 2002, and provides oversight of the accounting and financial reporting services provided by State Street. Under the Services Agreement, the Funds reimburse Columbia for out-of-pocket expenses and direct internal costs relating to accounting oversight and for services relating to Fund expenses and the requirements of the Sarbanes-Oxley Act of 2002.
Prior to December 15, 2006, Columbia was responsible for providing pricing and bookkeeping services to the Funds under a pricing and bookkeeping agreement and was entitled to receive an annual fee at the same fee structure described above under the State Street Agreements. Under separate agreements between Columbia and State Street, Columbia delegated certain functions to State Street. As a result of the delegation, the total fees payable under the pricing and bookkeeping agreement (other than certain reimbursements paid to Columbia and discussed below) were paid to State Street. The Funds also reimbursed Columbia and State Street for out-of-pocket expenses and charges, including fees payable to third parties for pricing the Funds' portfolio securities and direct internal costs incurred by Columbia in connection with providing fund accounting oversight and monitoring and certain other services.
163
Columbia Funds, August 31, 2007 (continued)
For the year ended August 31, 2007, the total amounts paid and payable to affiliates by the Funds under these agreements and the effective pricing and bookkeeping fee rates for the Funds, inclusive of out-of-pocket expenses, as a percentage of the Funds' average daily net assets, were as follows:
| | | Amounts
Paid
to Affiliates | | Amounts
Payable
to Affiliates | | Effective
Fee Rates | |
| Columbia International Stock Fund | | $ | 63,438 | | | $ | 1,512 | | | | 0.012 | % | |
| Columbia Mid Cap Growth Fund | | | 63,438 | | | | 1,512 | | | | 0.011 | % | |
| Columbia Small Cap Growth Fund I | | | 39,789 | | | | 1,512 | | | | 0.042 | % | |
| Columbia Real Estate Equity Fund | | | 63,096 | | | | 1,512 | | | | 0.024 | % | |
| Columbia Technology Fund | | | 39,843 | | | | 1,512 | | | | 0.039 | % | |
| Columbia Strategic Investor Fund | | | 62,194 | | | | 1,512 | | | | 0.014 | % | |
| Columbia Balanced Fund | | | 41,242 | | | | 1,512 | | | | 0.045 | % | |
| Columbia Oregon Intermediate Municipal Bond Fund | | | 49,100 | | | | 1,512 | | | | 0.036 | % | |
| Columbia Conservative High Yield Fund | | | 63,438 | | | | 1,512 | | | | 0.018 | % | |
Transfer Agent Fee
Columbia Management Services, Inc. (the "Transfer Agent"), an affiliate of Columbia and an indirect, wholly-owned subsidiary of BOA, provides shareholder services to the Funds and has contracted with Boston Financial Data Services ("BFDS") to serve as sub-transfer agent. The Transfer Agent is entitled to receive a fee for its services, paid monthly, at the annual rate of $17.00 per open account plus reimbursement of certain sub-transfer agent fees paid by the Transfer Agent (exclusive of BFDS fees), calculated based on assets held in omnibus accounts and intended to recover the cost of payments to other parties (including affiliates of BOA) for services to those accounts. The Transfer Agent pays the fees of BFDS for services as sub-transfer agent and is not entitled to reimbursement for such fees from the Funds. The Transfer Agent may also retain, as additional compensation for its services, fees for wire, telephone and redempti on orders, IRA trustee agent fees and account transcript fees due the Transfer Agent from shareholders of the Funds and credits (net of bank charges) earned with respect to balances in accounts the Transfer Agent maintains in connection with its services to the Funds. The Transfer Agent also receives reimbursement for certain out-of-pocket expenses.
The Transfer Agent has voluntarily agreed to waive transfer agent fees of up to 0.10% of Columbia International Stock Fund's average daily net assets. For the year ended August 31, 2007, the Transfer Agent waived transfer agent fees of $1,393,904. This agreement may be modified or terminated by the Transfer Agent at any time.
An annual minimum account balance fee of $20 may apply on certain accounts with a value below the initial minimum investment requirements for such accounts to reduce the impact of small accounts on transfer agent fees. These minimum account balance fees are recorded as a reduction of total expenses on the Statements of Operations. For the year ended August 31, 2007, these minimum account balance fees reduced total expenses as follows:
| | | Minimum
Account
Balance Fee | |
| Columbia International Stock Fund | | $ | 36,699 | | |
| Columbia Mid Cap Growth Fund | | | 23,224 | | |
| Columbia Small Cap Growth Fund I | | | 4,420 | | |
| Columbia Real Estate Equity Fund | | | 6,625 | | |
| Columbia Technology Fund | | | 3,841 | | |
| Columbia Strategic Investor Fund | | | 655,032 | | |
| Columbia Balanced Fund | | | 10,221 | | |
Columbia Oregon Intermediate
Municipal Bond Fund | | | 3,280 | | |
| Columbia Conservative High Yield Fund | | | 4,659 | | |
164
Columbia Funds, August 31, 2007 (continued)
For the year ended August 31, 2007, the effective transfer agent fee rates for the Funds, inclusive of out-of-pocket expenses, sub-transfer agent fees, and net of minimum account balance fees and waivers if applicable, as a percentage of the Funds' average daily net assets, were as follows:
| | | Effective
Fee Rates | |
| Columbia International Stock Fund | | | 0.06 | % | |
| Columbia Mid Cap Growth Fund | | | 0.09 | % | |
| Columbia Small Cap Growth Fund I | | | 0.11 | % | |
| Columbia Real Estate Equity Fund | | | 0.12 | % | |
| Columbia Technology Fund | | | 0.16 | % | |
| Columbia Strategic Investor Fund | | | 0.19 | % | |
| Columbia Balanced Fund | | | 0.10 | % | |
| Columbia Oregon Intermediate Municipal Bond Fund | | | 0.03 | % | |
| Columbia Conservative High Yield Fund | | | 0.13 | % | |
Underwriting Discounts, Service and Distribution Fees
Columbia Management Distributors, Inc. (the "Distributor"), an affiliate of Columbia and an indirect, wholly-owned subsidiary of BOA, is the principal underwriter of the Funds. For the year ended August 31, 2007, the Distributor has retained net underwriting discounts on sales of Class A and Class T shares and received net CDSC on Class A, Class B, Class C, Class D, and Class G share redemptions as follows:
| | | Front-End Sales Charge | | Contingent Deferred Sales Charge (CDSC) | |
| | | Class A | | Class T | | Class A | | Class B | | Class C | | Class D | | Class G | |
Columbia International
Stock Fund | | $ | 24,486 | | | $ | — | | | $ | 137 | | | $ | 30,678 | | | $ | 1,607 | | | $ | 13 | | | $ | 1,114 | | |
Columbia Mid Cap
Growth Fund | | | 17,785 | | | | 105 | | | | 116 | | | | 30,129 | | | | 1,796 | | | | 1 | | | | 564 | | |
Columbia Small Cap
Growth Fund I | | | 20,131 | | | | — | | | | 100 | | | | 1,091 | | | | 374 | | | | — | | | | — | | |
Columbia Real Estate
Equity Fund | | | 19,129 | | | | — | | | | 22 | | | | 36,895 | | | | 1,814 | | | | 31 | | | | — | | |
Columbia Technology
Fund | | | 79,308 | | | | — | | | | 56,611 | | | | 39,690 | | | | 30,150 | | | | 1 | | | | — | | |
Columbia Strategic
Investor Fund | | | 48,376 | | | | — | | | | 3,042 | | | | 92,281 | | | | 4,421 | | | | 1 | | | | — | | |
Columbia Balanced
Fund | | | 4,813 | | | | — | | | | 2 | | | | 12,290 | | | | 722 | | | | 1 | | | | — | | |
Columbia Oregon Intermediate
Municipal Bond Fund | | | 692 | | | | — | | | | — | | | | 1,440 | | | | — | | | | 1 | | | | — | | |
Columbia Conservative
High Yield Fund | | | 2,182 | | | | — | | | | 58 | | | | 205,791 | | | | 396 | | | | 126 | | | | — | | |
165
Columbia Funds, August 31, 2007 (continued)
The Funds have adopted Rule 12b-1 plans (the "Plans"), which require the payment of a monthly service and distribution fee to the Distributor based on the average daily net assets of each Fund up to the following annual rates:
| | | Distribution Fee | |
| | | Class A(a) | | Class B | | Class C | | Class D (b) | | Class G (b) | | Class R | |
| Columbia International Stock Fund | | | — | | | | 0.75 | % | | | 0.75 | % | | | 0.75 | % | | | 0.65 | % (c) | | | — | | |
| Columbia Mid Cap Growth Fund | | | 0.10 | % | | | 0.75 | % | | | 0.75 | % | | | 0.75 | % | | | 0.65 | % (c) | | | 0.50 | % | |
| Columbia Small Cap Growth Fund I | | | 0.10 | % | | | 0.75 | % | | | 0.75 | % | | | — | | | | — | | | | — | | |
| Columbia Real Estate Equity Fund | | | 0.10 | % | | | 0.75 | % | | | 0.75 | % | | | 0.75 | % | | | — | | | | — | | |
| Columbia Technology Fund | | | 0.10 | % | | | 0.75 | % | | | 0.75 | % | | | 0.75 | % | | | — | | | | — | | |
| Columbia Strategic Investor Fund | | | — | | | | 0.75 | % | | | 0.75 | % | | | 0.75 | % | | | — | | | | — | | |
| Columbia Balanced Fund | | | 0.10 | % | | | 0.75 | % | | | 0.75 | % | | | 0.75 | % | | | — | | | | — | | |
Columbia Oregon Intermediate
Municipal Bond Fund | | | 0.10 | % | | | 0.75 | % | | | 0.75 | % | | | 0.75 | % | | | — | | | | — | | |
| Columbia Conservative High Yield Fund | | | 0.10 | % | | | 0.75 | % | | | 0.75 | % | | | 0.75 | % | | | — | | | | — | | |
| | | Service Fee | |
| | | Class A(a) | | Class B | | Class C | | Class D (b) | | Class G (b) | |
| Columbia International Stock Fund | | | 0.25 | % | | | 0.25 | % | | | 0.25 | % | | | 0.25 | % | | | 0.50 | % (c) | |
| Columbia Mid Cap Growth Fund | | | 0.25 | % | | | 0.25 | % | | | 0.25 | % | | | 0.25 | % | | | 0.50 | % (c) | |
| Columbia Small Cap Growth Fund I | | | 0.25 | % | | | 0.25 | % | | | 0.25 | % | | | — | | | | — | | |
| Columbia Real Estate Equity Fund | | | 0.25 | % | | | 0.25 | % | | | 0.25 | % | | | 0.25 | % | | | — | | |
| Columbia Technology Fund | | | 0.25 | % | | | 0.25 | % | | | 0.25 | % | | | 0.25 | % | | | — | | |
| Columbia Strategic Investor Fund | | | 0.25 | % | | | 0.25 | % | | | 0.25 | % | | | 0.25 | % | | | — | | |
| Columbia Balanced Fund | | | 0.25 | % | | | 0.25 | % | | | 0.25 | % | | | 0.25 | % | | | — | | |
Columbia Oregon Intermediate
Municipal Bond Fund | | | 0.25 | % | | | 0.25 | % | | | 0.25 | % | | | 0.25 | % | | | — | | |
| Columbia Conservative High Yield Fund | | | 0.25 | % | | | 0.25 | % | | | 0.25 | % | | | 0.25 | % | | | — | | |
(a) Except for Columbia International Stock Fund and Columbia Strategic Investor Fund, the Funds may pay distribution and service fees up to a maximum of 0.35% of each Fund's average daily net assets attributable to Class A shares (comprised of up to 0.25% for shareholder liaison services and up to 0.10% for distribution services), but will limit such fees to an aggregate fee of not more than 0.25% of each Fund's average daily net assets attributable to Class A shares during the current fiscal year.
(b) Effective August 8, 2007, the Class D shares of a Fund, were converted into Class C shares of the same Fund. Also effective August 8, 2007, the Class G shares of Columbia International Stock Fund were converted into Class A shares of the same Fund, and the Class G shares of Columbia Mid Cap Growth Fund were converted into Class T shares of the same Fund.
(c) The Distributor contractually agreed to limit a portion of the Class G distribution and service fees so that the combined fee did not exceed 0.95% annually of the Class G shares average daily net assets. Of the 0.50% service fee, 0.25% related to shareholder liaison fees and 0.25% related to administration support fees.
The Distributor has voluntarily agreed to waive a portion of the Class C and Class D distribution and service fees so that the combined fees do not exceed the annual rate of 0.65% of the average daily net assets of the Class C and Class D shares of Columbia Oregon Intermediate Municipal Bond Fund, and 0.85% of the average daily net assets of the Class C and Class D shares of Columbia Conservative High Yield Fund. The Class C arrangements may be modified or terminated by the Distributor at any time. Effective August 8, 2007, Class D shares of a Fund, were converted into Class C shares of the same Fund.
The CDSC and the distribution fees received from the Plans are used principally as repayment to the Distributor for amounts paid by the Distributor to dealers who sold such shares.
166
Columbia Funds, August 31, 2007 (continued)
Shareholder Services Fees
Columbia Mid Cap Growth Fund has adopted shareholder services plans that permit the Fund to pay for certain services provided to Class T shareholders by its financial advisors. The Fund may pay shareholder service fees up to a maximum of 0.50% of the Fund's average daily net assets attributable to Class T shares (comprised of up to 0.25% for shareholder liaison services and up to 0.25% for administrative support services), but such fees will not exceed the Fund's net investment income attributable to Class T shares and Columbia Mid Cap Growth Fund will limit such fees to an aggregate fee of not more than 0.30% for annual Class T shareholder services fees.
Expense Limits and Fee Reimbursements
Columbia has voluntarily agreed to waive fees and reimburse Columbia Technology Fund for certain expenses so that the expenses incurred by the Fund (exclusive of distribution and service fees, brokerage commissions, interest, taxes and extraordinary expenses, if any) will not exceed the annual rate of 1.65% of the Fund's average daily net assets. This arrangement may be modified or terminated by Columbia at any time.
Columbia has contractually agreed to waive fees and reimburse a portion of Columbia Strategic Investor Fund's expenses so that the expenses incurred by the Fund (exclusive of distribution and service fees, brokerage commissions, interest, taxes and extraordinary expenses, if any) will not exceed 0.98% annually of the Fund's average daily net assets through December 31, 2007. There is no guarantee that this arrangement will continue after December 31, 2007.
Custody Credits
Each Fund has an agreement with its custodian bank under which custody fees may be reduced by balance credits. These credits are recorded as a reduction of total expenses on the Statements of Operations. The Funds could have invested a portion of the assets utilized in connection with the expense offset arrangement in an income-producing asset if they had not entered into such an agreement. For the year ended August 31, 2007, these credits reduced total expenses as follows:
| | | Custody
Credits | |
| Columbia International Stock Fund | | $ | 2,756 | | |
| Columbia Mid Cap Growth Fund | | | 12,527 | | |
| Columbia Small Cap Growth Fund I | | | 3,418 | | |
| Columbia Real Estate Equity Fund | | | 4,683 | | |
| Columbia Technology Fund | | | 2,713 | | |
| Columbia Strategic Investor Fund | | | 3,737 | | |
| Columbia Balanced Fund | | | 1,755 | | |
Columbia Oregon Intermediate
Municipal Bond Fund | | | 2,699 | | |
| Columbia Conservative High Yield Fund | | | 19,917 | | |
Fees Paid to Officers and Trustees
All officers of the Funds are employees of Columbia or its affiliates and, with the exception of the Funds' Chief Compliance Officer, receive no compensation from the Funds. The Board of Trustees has appointed a Chief Compliance Officer to the Funds in accordance with federal securities regulations. The Funds, along with other affiliated funds, pay their pro-rata share of the expenses associated with the Chief Compliance Officer. Each Fund's expenses for the Chief Compliance Officer will not exceed $15,000 per year.
The Funds' Trustees may participate in a deferred compensation plan which may be terminated at any time. Obligations of the plan will be paid solely out of the Funds' assets.
As a result of a fund merger, Columbia Mid Cap Growth Fund assumed the liabilities of the deferred compensation plan of the acquired fund, which is included in "Trustees' Fees" in the Statements of Assets and Liabilities. The deferred compensation plan of the acquired fund may be terminated at any time. Any payments to plan participants are paid solely out of the Fund's assets.
167
Columbia Funds, August 31, 2007 (continued)
Note 5. Portfolio Information
For the year ended August 31, 2007, the cost of purchases and proceeds from sales of securities, excluding short-term obligations, were as follows:
| | | U.S. Government Securities | | Other Investment Securities | |
| | | Purchases | | Sales | | Purchases | | Sales | |
| Columbia International Stock Fund | | $ | — | | | $ | — | | | $ | 892,700,029 | | | $ | 1,092,225,886 | | |
| Columbia Mid Cap Growth Fund | | | — | | | | — | | | | 2,879,184,719 | | | | 2,509,247,250 | | |
| Columbia Small Cap Growth Fund I | | | — | | | | — | | | | 322,012,166 | | | | 326,626,674 | | |
| Columbia Real Estate Equity Fund | | | — | | | | — | | | | 400,104,913 | | | | 638,377,261 | | |
| Columbia Technology Fund | | | — | | | | — | | | | 539,397,316 | | | | 480,387,665 | | |
| Columbia Strategic Investor Fund | | | — | | | | — | | | | 2,053,544,841 | | | | 1,568,046,183 | | |
| Columbia Balanced Fund | | | 37,024,298 | | | | 44,701,071 | | | | 135,363,595 | | | | 179,703,070 | | |
| Columbia Oregon Intermediate Municipal Bond Fund | | | — | | | | — | | | | 59,856,431 | | | | 65,763,725 | | |
| Columbia Conservative High Yield Fund | | | 5,754,816 | | | | 5,846,133 | | | | 382,918,126 | | | | 622,562,860 | | |
Note 6. Redemption Fees
Columbia International Stock Fund assesses a 2.00% redemption fee to shareholders of the Fund who redeem shares held for 60 days or less. The redemption fee is designed to offset brokerage commissions and other costs associated with short term trading of fund shares. The redemption fees, which are retained by the Fund, are accounted for as an addition to paid-in capital and are allocated to each class based on the relative net assets at the time of the redemption. For the year ended August 31, 2007, the redemption fees for Class A, Class B, Class C, Class D, Class G and Class Z shares of Columbia International Stock Fund amounted to $2,056, $260, $201, $6, $4 and $7,050, respectively.
Note 7. Line Of Credit
The Funds and other affiliated funds participate in a $350,000,000 committed unsecured revolving line of credit and a $150,000,000 uncommitted, unsecured line of credit, both provided by State Street. Borrowings are available for temporary or emergency purposes.
Interest on the committed line of credit is charged to each participating fund based on the fund's borrowings at a rate per annum equal to the Federal Funds Rate plus 0.50%. In addition, a commitment fee of 0.10% per annum is accrued and apportioned among the participating funds based on their pro-rata portion of the unutilized committed line of credit. Interest on the uncommitted line of credit is charged to each participating fund based on the fund's borrowings at a variable rate per annum equal to the Federal Funds Rate plus a spread, as determined and quoted by State Street at the time of the request for a loan. A one-time structuring fee of $30,000 is also accrued and apportioned to each fund participating in the uncommitted line of credit based on the average net assets of the participating funds. In addition, if the uncommitted line of credit is exten ded for an additional period, an annual administration fee of $15,000 will be charged and apportioned among each participating fund. The commitment fee and structuring fee are included in "Other expenses" in the Statements of Operations.
For the year ended August 31, 2007, the average daily loan balance outstanding on days where borrowings existed were as follows:
| | | Loan Amount | | Weighted
Average
Interest
Rate | |
| Columbia International | |
| Stock Fund | | $ | 22,666,667 | | | | 5.61 | % | |
| Columbia Mid Cap Growth Fund | | | 7,000,000 | | | | 5.80 | % | |
| Columbia Small Cap Growth Fund I | | | 1,000,000 | | | | 5.81 | % | |
| Columbia Real Estate Equity Fund | | | 2,100,000 | | | | 5.80 | % | |
| Columbia Technology Fund | | | 1,500,000 | | | | 5.79 | % | |
| Columbia Conservative | |
| High Yield Fund | | | 1,666,667 | | | | 5.80 | % | |
168
Columbia Funds, August 31, 2007 (continued)
Note 8. Shares Of Beneficial Interest
As of August 31, 2007, the Funds had shareholders whose shares were beneficially owned by participant accounts over which BOA and/or its affiliates had either sole or joint investment discretion. Subscription and redemption activity in these accounts may have a significant effect on the operations of the Funds. The percentage of shares of beneficial interest outstanding held therein are as follows:
| | | % of Shares
Outstanding
Held | |
Columbia International
Stock Fund | | | 62.4 | | |
Columbia Mid Cap
Growth Fund | | | 39.7 | | |
Columbia Small Cap
Growth Fund I | | | 15.3 | | |
Columbia Real Estate
Equity Fund | | | 23.5 | | |
Columbia Conservative
High Yield Fund | | | 13.3 | | |
In addition, as of August 31, 2007, several of the Funds had shareholders, over which BOA and/or any of its affiliates did not have investment discretion, that held greater than 5% of the shares outstanding. Subscription and redemption activity of these accounts may have a significant effect on the operations of the Funds. The number of shareholders and percentage of shares of beneficial interest outstanding held therein are as follows:
| | | Number of
Shareholders | | % of Shares
Outstanding
Held | |
Columbia Mid Cap
Growth Fund | | | 1 | | | | 5.6 | | |
Columbia Small Cap
Growth Fund I | | | 1 | | | | 17.0 | | |
Columbia Real Estate
Equity Fund | | | 1 | | | | 19.7 | | |
| Columbia Technology Fund | | | 3 | | | | 30.5 | | |
Columbia Strategic
Investor Fund | | | 1 | | | | 7.0 | | |
| Columbia Balanced Fund | | | 1 | | | | 12.0 | | |
Columbia Oregon Intermediate
Municipal Bond Fund | | | 1 | | | | 9.6 | | |
Columbia Conservative
High Yield Fund | | | 1 | | | | 47.9 | | |
Note 9. Other
During the year ended August 31, 2007, Columbia voluntarily reimbursed Columbia International Stock Fund $4,437 for a realized investment loss due to a trading error.
Note 10. Disclosure of Significant Risks And Contingencies
Concentration of Credit Risk
Columbia Oregon Intermediate Municipal Bond Fund holds investments that are insured by private insurers who guarantee the payment of principal and interest in the event of default or that are supported by a letter of credit. The insurers are rated Aaa by Moody's Investors Service, Inc.
At August 31, 2007, private insurers who insured greater than 5% of the total investments of Columbia Oregon Intermediate Municipal Bond Fund were as follows:
| Insurer | | % of Total
Investments | |
| Financial Guaranty Insurance Co. | | | 14.9 | | |
| MBIA Insurance Corp. | | | 14.5 | | |
| Financial Security Assurance, Inc. | | | 10.0 | | |
| AMBAC Assurance Corp. | | | 6.4 | | |
Foreign Securities
There are certain additional risks involved when investing in foreign securities that are not inherent with investments in domestic securities. These risks may involve foreign currency exchange rate fluctuations, adverse political and economic developments and the possible prevention of currency exchange or other foreign governmental laws or restrictions. In addition, the liquidity of foreign securities may be more limited than that of domestic securities.
Investments in emerging market countries are subject to additional risk. The risk of foreign investments is typically increased in less developed countries. These countries are also more likely to experience high levels of inflation, deflation or currency devaluation which could hurt their economies and securities markets.
Geographic Concentration
Columbia Oregon Intermediate Municipal Bond Fund has greater than 5% of its total investments on August 31, 2007
169
Columbia Funds, August 31, 2007 (continued)
invested in debt obligations issued by the state of Oregon and its political subdivisions, agencies, authorities and instrumentalities. This Fund is more susceptible to economic and political factors adversely affecting issuers of the state's municipal securities than are municipal bond funds that are not concentrated to the same extent in these issuers.
High-Yield Securities
Investing in high-yield securities may involve greater credit risk and considerations not typically associated with investing in U.S. Government bonds and other higher quality fixed income securities. These securities are non-investment grade securities, often referred to as "junk" bonds. Economic downturns may disrupt the high yield market and impair the ability of issuers to repay principal and interest. Also, an increase in interest rates would likely have an adverse impact on the value of such obligations. Moreover, high-yield securities may be less liquid to the extent that there is no established secondary market.
Sector Focus
Certain Funds may focus their investments in certain sectors, subjecting them to greater risk than a fund that is unconcentrated.
Tax Development Risk
The U.S. Supreme Court has agreed to hear an appeal of a state-court decision that might significantly affect how states tax-in-state and out-of-state municipal bonds. If the Supreme Court determines that the U.S. Constitution prohibits states from treating the interest income on in-state municipal bonds differently from the interest income on out-of-state municipal bonds for state income tax purposes, most states likely will revisit the way in which they treat the interest on municipal bonds. This has the potential to increase significantly the amount of state tax paid by shareholders on exempt-interest dividends. You should consult your tax advisor to discuss the potential tax consequences of your investment in Columbia Oregon Intermediate Municipal Bond Fund. This also has the potential to cause decline in the value of the municipal securities held by the Fund which, in turn, would reduce the value of the Fund's shares.
Columbia Oregon Intermediate Municipal Bond Fund purchases municipal securities whose interest, in the opinion of bond counsel, is free from federal income tax. There is no assurance that the Internal Revenue Service (IRS) will agree with this opinion. In the event the IRS determines that the issuer does not comply with relevant tax requirements, interest payments from a security could become federally taxable, possibly retroactively to the date the security was issued. As a shareholder of Columbia Oregon Intermediate Municipal Bond Fund, you may be required to file an amended tax return as a result.
Legal Proceedings
On February 9, 2005, Columbia Management Advisors, Inc. (which has since merged into Banc of America Capital Management, LLC (now named Columbia Management Advisors, LLC)) ("Columbia") and Columbia Funds Distributor, Inc. (which has been renamed Columbia Management Distributors, Inc.) (the "Distributor") (collectively, the "Columbia Group") entered into an Assurance of Discontinuance with the New York Attorney General ("NYAG") (the "NYAG Settlement") and consented to the entry of a cease-and-desist order by the Securities and Exchange Commission ("SEC") (the "SEC Order") on matters relating to mutual fund trading.
Under the terms of the SEC Order, the Columbia Group agreed, among other things, to: pay $70 million in disgorgement and $70 million in civil money penalties; cease and desist from violations of the antifraud provisions and certain other provisions of the federal securities laws; maintain certain compliance and ethics oversight structures; retain an independent consultant to review the Columbia Group's applicable supervisory, compliance, control and other policies and procedures; and retain an independent distribution consultant (see below). The Columbia Funds have also voluntarily undertaken to implement certain governance measures designed to maintain the independence of their boards of trustees. The NYAG Settlement also, among other things, requires Columbia and its affiliates to reduce management fees for certain Columbia Funds (including the former Nations Funds) and other mutual funds collectively by $32 million per year f or five years, for a projected total of $160 million in management fee reductions.
Pursuant to the procedures set forth in the SEC Order, the $140 million in settlement amounts described above is being distributed in accordance with a distribution plan that was developed by an independent distribution consultant and approved by the SEC on April 6, 2007. Distributions under the distribution plan began in late June 2007.
170
Columbia Funds, August 31, 2007 (continued)
A copy of the SEC Order is available on the SEC website at http://www.sec.gov. A copy of the NYAG Settlement is available as part of the Bank of America Corporation Form 8-K filing on February 10, 2005.
In connection with the events described above, various parties have filed suit against certain funds, the Trustees of the Columbia Funds, FleetBoston Financial Corporation and its affiliated entities and/or Bank of America and its affiliated entities.
On February 20, 2004, the Judicial Panel on Multidistrict Litigation transferred these cases and cases against other mutual fund companies based on similar allegations to the United States District Court in Maryland for consolidated or coordinated pretrial proceedings (the "MDL"). Subsequently, additional related cases were transferred to the MDL. On September 29, 2004, the plaintiffs in the MDL filed amended and consolidated complaints. One of these amended complaints is a putative class action that includes claims under the federal securities laws and state common law, and that names Columbia, the Distributor, the Trustees of the Columbia Funds, Bank of America Corporation and others as defendants. Another of the amended complaints is a derivative action purportedly on behalf of the Columbia Funds that asserts claims under federal securities laws and state common law.
On February 25, 2005, Columbia and other defendants filed motions to dismiss the claims in the pending cases. On March 1, 2006, for reasons stated in the court's memoranda dated November 3, 2005, the U.S. District Court for the District of Maryland granted in part and denied in part the defendants' motions to dismiss. The court dismissed all of the class action claims pending against the Columbia Funds Trusts. As to Columbia and the Distributor, the claims under the Securities Act of 1933, the claims under Sections 34(b) and 36(a) of the Investment Company Act of 1940 ("ICA") and the state law claims were dismissed. The claims under Sections 10(b) and 20(a) of the Securities Exchange Act of 1934 and claims under Section 36(b) of the ICA were not dismissed.
On March 21, 2005, a purported class action was filed in Massachusetts state court alleging that certain conduct, including market timing, entitled Class B shareholders in certain Columbia funds to an exemption from contingent deferred sales charges upon early redemption ("the CDSC Lawsuit"). The CDSC Lawsuit was removed to federal court in Massachusetts and transferred to the MDL.
On September 14, 2007, the plaintiffs and the Columbia defendants named in the MDL, including the Columbia Funds, entered into a stipulation of settlement with respect to all Columbia-related claims in the MDL described above, including the CDSC Lawsuit. The settlement is subject to court approval.
In 2004, the Columbia Funds' adviser and distributor and certain affiliated entities and individuals were named as defendants in certain purported shareholder class and derivative actions making claims, including claims under the Investment Company and the Investment Advisers Acts of 1940 and state law. Certain Columbia Funds were named as nominal defendants. The suits allege, inter alia, that the fees and expenses paid by the funds are excessive and that the advisers and their affiliates inappropriately used fund assets to distribute the funds and for other improper purposes. On March 2, 2005, the actions were consolidated in the Massachusetts federal court as In re Columbia Entities Litigation. The plaintiffs filed a consolidated amended complaint on June 9, 2005. On November 30, 2005, the judge dismissed all claims by plaintiffs and entered final judgment in favor of the defendants. The plaintiffs appealed to the United States Court of Appeals for the First Circuit on December 30, 2005. A stipulation and settlement agreement dated January 19, 2007 was filed in the First Circuit on February 14, 2007, with a joint stipulation of dismissal and motion for remand to obtain district court approval of the settlement. That joint motion was granted and the appeal was dismissed. On March 6, 2007, the case was remanded to the District Court. On September 18, 2007, the District Court approved the settlement, to be effective following the expiration of the appeal period. The funds' adviser and/or its affiliates will be required, pursuant to the settlement, to make certain payments including plaintiffs' attorneys' fees and costs of notice to clas s members.
Note 11. Business Combinations & Mergers
On October 7, 2005, Columbia Newport Tiger Fund, a series of a separate Massachusetts business trust, merged into Columbia International Stock Fund. Columbia International
171
Columbia Funds, August 31, 2007 (continued)
Stock Fund received a tax-free transfer of assets from Columbia Newport Tiger Fund as follows:
Shares
Issued | | Net Assets
Received | | Unrealized
Appreciation1 | |
| | 17,616,768 | | | $ | 280,994,524 | | | $ | 21,800,458 | | |
Net Assets
of Columbia
International
Stock Fund
Prior to
Combination | | Net Assets
of Columbia
Newport Tiger
Fund Immediately
Prior to Combination | | Net Assets
of Columbia
International
Stock Fund
Immediately
After Combination | |
| $ | 1,061,242,112 | | | $ | 280,994,524 | | | $ | 1,342,236,636 | | |
1 Unrealized appreciation is included in the Net Assets Received.
On September 15, 2006, Columbia Marsico Mid Cap Growth Fund, a series of Columbia Funds Series Trust, merged into Columbia Mid Cap Growth Fund. Columbia Mid Cap Growth Fund received a tax-free transfer of assets from Columbia Marsico Mid Cap Growth Fund as follows:
Shares
Issued | | Net Assets
Received | | Unrealized
Appreciation1 | |
| | 23,857,869 | | | $ | 586,999,596 | | | $ | 69,562,262 | | |
Net Assets
of Columbia
Mid Cap
Growth Fund
Prior to
Combination | | Net Assets
of Columbia
Marsico Mid Cap
Growth Fund
Immediately
Prior to Combination | | Net Assets
of Columbia
Mid Cap
Growth Fund
Immediately
After Combination | |
| $ | 865,801,321 | | | $ | 586,999,596 | | | $ | 1,452,800,917 | | |
1 Unrealized appreciation is included in the Net Assets Received.
On September 22, 2006, Columbia Young Investor Fund, a separate series of Columbia Funds Series Trust I, merged into Columbia Strategic Investor Fund. Columbia Strategic Investor Fund received a tax-free transfer of assets from Columbia Young Investor Fund as follows:
Shares
Issued | | Net Assets
Received | | Unrealized
Appreciation1 | |
| | 38,899,211 | | | $ | 720,344,551 | | | $ | 99,182,704 | | |
Net Assets
of Columbia
Strategic
Investor Fund
Prior to
Combination | | Net Assets
of Columbia
Young Investor
Fund Immediately
Prior to Combination | | Net Assets
of Columbia
Strategic
Investor Fund
Immediately
After Combination | |
| $ | 439,343,046 | | | $ | 720,344,551 | | | $ | 1,159,687,597 | | |
1 Unrealized appreciation is included in the Net Assets Received.
172
Report of Independent Registered Public Accounting Firm
To the Board of Trustees and the Shareholders of Columbia Funds Series Trust I
In our opinion, the accompanying statements of assets and liabilities, including the investment portfolios, and the related statements of operations and of changes in net assets and the financial highlights present fairly, in all material respects, the financial position of Columbia International Stock Fund, Columbia Mid Cap Growth Fund, Columbia Small Cap Growth Fund I, Columbia Real Estate Equity Fund, Columbia Technology Fund, Columbia Strategic Investor Fund, Columbia Balanced Fund, Columbia Oregon Intermediate Municipal Bond Fund and Columbia Conservative High Yield Fund (constituting part of Columbia Funds Series Trust I, hereafter collectively referred to as the "Funds") at August 31, 2007, the results of each of their operations for the year then ended, the changes in each of their net assets for each of the two years in the period then ended, and the financial highlights for each of the periods indicated, in conformity with accounting principles generally accepted in the United States of America. These financial statements and financial highlights (hereafter referred to as "financial statements") are the responsibility of the Funds' management. Our responsibility is to express an opinion on these financial statements based on our audits. We conducted our audits of these financial statements in accordance with the standards of the Public Company Accounting Oversight Board (United States). Those standards require that we plan and perform the audit to obtain reasonable assurance about whether the financial statements are free of material misstatement. An audit includes examining, on a test basis, evidence supporting the amounts and disclosures in the financial statements, assessing the accounting principles used and significant estimates made by management, and evaluating the overall financial statement presentation. We believe that our audits, which included confirmation of securities at August 31, 2007 by correspondence wit h the custodian and brokers, provide a reasonable basis for our opinion.
PricewaterhouseCoopers LLP
Boston, Massachusetts
October 26, 2007
173
Unaudited Information
Federal Income Tax Information
Columbia International Stock Fund
Foreign taxes paid during the fiscal year ended August 31, 2007, amounting to $3,643,434 ($0.05 per share) are expected to be passed through to shareholders as 100% allowable foreign tax credits on Form 1099-DIV for the year ending December 31, 2007.
For the fiscal year ended August 31, 2007, the Fund designates long-term capital gains of $118,706,562.
For non-corporate shareholders 92.70% or the maximum amount allowable under the Jobs and Growth Tax Relief Reconciliation Act of 2003, of income distributed by the Fund for the period September 1, 2006 to August 31, 2007 may represent qualified dividend income. Final information will be provided in your 2007 Form 1099-DIV.
Columbia Mid Cap Growth Fund
For the fiscal year ended August 31, 2007, the Fund designates long-term capital gains of $118,465,345.
For non-corporate shareholders 46.43% or the maximum amount allowable under the Jobs and Growth Tax Relief Reconciliation Act of 2003, of income distributed by the Fund for the period September 1, 2006 to August 31, 2007 may represent qualified dividend income. Final information will be provided in your 2007 Form 1099-DIV.
43.32% of the ordinary income distributed by the Fund, for the year ended August 31, 2007, qualifies for the corporate dividends received deduction.
Columbia Small Cap Growth Fund I
For the fiscal year ended August 31, 2007, the Fund designates long-term capital gains of $23,974,117.
For non-corporate shareholders 3.33% or the maximum amount allowable under the Jobs and Growth Tax Relief Reconciliation Act of 2003, of income distributed by the Fund for the period September 1, 2006 to August 31, 2007 may represent qualified dividend income. Final information will be provided in your 2007 Form 1099-DIV.
3.28% of the ordinary income distributed by the Fund, for the year ended August 31, 2007, qualifies for the corporate dividends received deduction.
Columbia Technology Fund
For the fiscal year ended August 31, 2007, the Fund designates long-term capital gains of $11,760,523.
Columbia Strategic Investor Fund
For the fiscal year ended August 31, 2007, the Fund designates long-term capital gains of $115,442,093.
For non-corporate shareholders 80.56% or the maximum amount allowable under the Jobs and Growth Tax Relief Reconciliation Act of 2003, of income distributed by the Fund for the period September 1, 2006 to August 31, 2007 may represent qualified dividend income. Final information will be provided in your 2007 Form 1099-DIV.
67.61% of the ordinary income distributed by the Fund, for the year ended August 31, 2007, qualifies for the corporate dividends received deduction.
Columbia Balanced Fund
For the fiscal year ended August 31, 2007, the Fund designates long-term capital gains of $624,689.
For non-corporate shareholders 33.12% or the maximum amount allowable under the Jobs and Growth Tax Relief Reconciliation Act of 2003, of income distributed by the Fund for the period September 1, 2006 to August 31, 2007 may represent qualified dividend income. Final information will be provided in your 2007 Form 1099-DIV.
33.56% of the ordinary income distributed by the Fund, for the year ended August 31, 2007, qualifies for the corporate dividends received deduction.
Columbia Oregon Intermediate Municipal Bond Fund
99.92% of the distributions from net investment income will be treated as exempt income for federal income tax purposes.
174
Fund Governance
The Trustees serve terms of indefinite duration. The names, addresses and ages of the Trustees and officers of the Funds in Columbia Funds Series Trust I, the year each was first elected or appointed to office, their principal business occupations during at least the last five years, the number of portfolios overseen by each Trustee and other directorships they hold are shown below. Each officer listed below serves as an officer of each Fund in the Columbia Funds Complex.
Independent Trustees
Name, Address and Year of Birth,
Position with Funds, Year First
Elected or Appointed to Office(1) | | Principal Occupation(s) During Past Five Years, Number of Portfolios in Columbia
Funds Complex Overseen by Trustee, Other Directorships Held
| |
| Douglas A. Hacker (Born 1955) | |
|
c/o Columbia Management Advisors, LLC
One Financial Center
Boston, MA 02111
Trustee (since 1996) | | Independent business executive since May, 2006; Executive Vice President-Strategy of United Airlines (airline) from December, 2002 to May, 2006; President of UAL Loyalty Services (airline marketing company) from September, 2001 to December, 2002; Executive Vice President and Chief Financial Officer of United Airlines from July, 1999 to September, 2001. Oversees 68, Nash Finch Company (food distributor); Aircastle Limited (aircraft leasing) | |
|
| Janet Langford Kelly (Born 1957) | |
|
c/o Columbia Management Advisors, LLC
One Financial Center
Boston, MA 02111
Trustee (since 1996) | | Senior Vice President, General Counsel and Corporate Secretary, ConocoPhillips (integrated energy company) since September, 2007; Deputy General Counsel-Corporate Legal Services, ConocoPhillips from August, 2006 to August, 2007; Partner, Zelle, Hofmann, Voelbel, Mason & Gette LLP (law firm) from March, 2005 to July, 2006; Adjunct Professor of Law, Northwestern University, from September, 2004 to June, 2006, Director, UAL Corporation (airline) from February, 2006 to July, 2006; Chief Administrative Officer and Senior Vice President, Kmart Holding Corporation (consumer goods), from September, 2003 to March, 2004; Executive Vice President-Corporate Development and Administration, General Counsel and Secretary, Kellogg Company (food manufacturer), from September, 1999 to August, 2003. Oversees 68, None | |
|
| Richard W. Lowry (Born 1936) | |
|
c/o Columbia Management Advisors, LLC
One Financial Center
Boston, MA 02111
Trustee (since 1995) | | Private Investor since August, 1987 (formerly Chairman and Chief Executive Officer, U.S. Plywood Corporation (building products manufacturer) until 1987).Oversees 68, Liberty All-Star Equity Fund and Liberty All-Star Growth Fund, Inc. (closed-end funds) | |
|
| Charles R. Nelson (Born 1942) | |
|
c/o Columbia Management Advisors, LLC
One Financial Center
Boston, MA 02111
Trustee (since 1981) | | Professor of Economics, University of Washington, since January, 1976; Ford and Louisa Van Voorhis Professor of Political Economy, University of Washington, since September, 1993; Director, Institute for Economic Research, University of Washington from September, 2001 to June, 2003; Adjunct Professor of Statistics, University of Washington, since September, 1980; Associate Editor, Journal of Money Credit and Banking, since September, 1993; Consultant on econometric and statistical matters. Oversees 68, None | |
|
175
Fund Governance (continued)
Independent Trustees (continued)
Name, Address and Year of Birth,
Position with Funds, Year First
Elected or Appointed to Office(1) | | Principal Occupation(s) During Past Five Years, Number of Portfolios in Columbia
Funds Complex Overseen by Trustee, Other Directorships Held
| |
| John J. Neuhauser (Born 1943) | |
|
c/o Columbia Management Advisors, LLC
One Financial Center
Boston, MA 02111
Trustee (since 1985) | | President, St. Michaels College, since August, 2007; University Professor, Boston College from November, 2005 to August, 2007; Academic Vice President and Dean of Faculties, Boston College from August, 1999 to October, 2005. Oversees 68, Liberty All-Star Equity Fund and Liberty All-Star Growth Fund, Inc. (closed-end funds) | |
|
| Patrick J. Simpson (Born 1944) | |
|
c/o Columbia Management Advisors, LLC
One Financial Center
Boston, MA 02111
Trustee (since 2000) | | Partner, Perkins Coie LLP (law firm). Oversees 68, None | |
|
| Thomas E. Stitzel (Born 1936) | |
|
c/o Columbia Management Advisors, LLC
One Financial Center
Boston, MA 02111
Trustee (since 1998) | | Business Consultant since 1999; Chartered Financial Analyst. Oversees 68, None | |
|
| Thomas C. Theobald (Born 1937) | |
|
c/o Columbia Management Advisors, LLC
One Financial Center
Boston, MA 02111
Trustee and
Chairman of the Board(2) (since 1996) | | Partner and Senior Advisor, Chicago Growth Partners (private equity investing) since September, 2004; Managing Director, William Blair Capital Partners (private equity investing) from September, 1994 to September, 2004. Oversees 68, Anixter International (network support equipment distributor); Ventas, Inc. (real estate investment trust); Jones Lang LaSalle (real estate management services); Ambac Financial Group (financial guaranty insurance) | |
|
| Anne-Lee Verville (Born 1945) | |
|
c/o Columbia Management Advisors, LLC
One Financial Center
Boston, MA 02111
Trustee (since 1998) | | Retired since 1997 (formerly General Manager, Global Education Industry, IBM Corporation (computer and technology) from 1994 to 1997). Oversees 68, None | |
|
176
Fund Governance (continued)
Interested Trustee
Name, Address and Year of Birth,
Position with Funds, Year First
Elected or Appointed to Office(1) | | Principal Occupation(s) During Past Five Years, Number of Portfolios in Columbia
Funds Complex Overseen by Trustee, Other Directorships Held
| |
| William E. Mayer (Born 1940) | |
|
c/o Columbia Management Advisors, LLC
One Financial Center
Boston, MA 02111
Trustee3 (since 1994) | | Partner, Park Avenue Equity Partners (private equity) since February, 1999; Dean and Professor, College of Business, University of Maryland, 1992 to 1997. Oversees 68, Lee Enterprises (print media), WR Hambrecht + Co. (financial service provider); Reader's Digest (publishing) | |
|
1 In December 2000, the boards of each of the former Liberty Funds and former Stein Roe Funds were combined into one board of trustees responsible for the oversight of both fund groups (collectively, the "Liberty Board"). In October 2003, the trustees on the Liberty Board were elected to the boards of the Columbia Funds (the "Columbia Board") and of the CMG Fund Trust (the "CMG Funds Board"); simultaneous with that election, Patrick J. Simpson who had been a director on the Columbia Board and trustee on the CMG Funds Board, was appointed to serve as trustee of the Liberty Board. The date shown is the earliest date on which a trustee/director was elected or appointed to the board of a Fund in the Columbia Funds Complex.
2 Mr. Theobald was appointed as Chairman of the Board effective December 10, 2003.
3 Mr. Mayer is an "interested person" (as defined in the Investment Company Act of 1940) by reason of his affiliation with WR Hambrecht + Co.
The Statement of Additional Information includes additional information about the Trustees of the Funds and is available, without charge, upon request by calling 1-800-345-6611.
Officers
Name, Address and Year of Birth,
Position with Columbia Funds,
Year First Elected or
Appointed to Office | | Principal Occupation(s) During Past Five Years | |
| Christopher L. Wilson (Born 1957) | |
|
One Financial Center
Boston, MA 02111
President (since 2004) | | President-Columbia Funds, since October 2004; Managing Director-Columbia Management Advisors, LLC, since September 2005; Senior Vice President-Columbia Management Distributors, Inc., since January 2005; Director-Columbia Management Services, Inc., since January 2005; Director-Bank of America Global Liquidity Funds, plc and Banc of America Capital Management (Ireland), Limited, since May 2005; Director-FIM Funding, Inc., since January 2005; President and Chief Executive Officer-CDC IXIS AM Services, Inc. (investment management), from September 1998 through August 2004; and a senior officer or director of various other Bank of America- affiliated entities, including other registered and unregistered funds. | |
|
| James R. Bordewick, Jr. (Born 1959) | |
|
One Financial Center
Boston, MA 02111
Senior Vice President, Secretary and Chief Legal Officer (since 2006) | | Associate General Counsel, Bank of America since April, 2005; Senior Vice President and Associate General Counsel, MFS Investment Management (investment management) prior to April, 2005. | |
|
177
Fund Governance (continued)
Officers (continued)
Name, Address and Year of Birth,
Position with Columbia Funds,
Year First Elected or
Appointed to Office | | Principal Occupation(s) During Past Five Years | |
| J. Kevin Connaughton (Born 1964) | |
|
One Financial Center
Boston, MA 02111
Senior Vice President,
Chief Financial Officer and Treasurer (since 2000) | | Treasurer-Columbia Funds, since October 2003; Treasurer-the Liberty Funds, Stein Roe Funds and Liberty All-Star Funds, December 2000-December 2006; Vice President-Columbia Management Advisors, Inc., since April 2003; President-Columbia Funds, Liberty Funds and Stein Roe Funds, February 2004 to October 2004; Treasurer-Galaxy Funds, September 2002 to December 2005; Treasurer, December 2002 to December 2004, and President, February 2004 to December 2004-Columbia Management Multi-Strategy Hedge Fund, LLC; and a senior officer of various other Bank of America-affiliated entities, including other registered and unregistered funds. | |
|
| Linda J. Wondrack (Born 1964) | |
|
One Financial Center
Boston, MA 02111
Senior Vice President,
Chief Compliance Officer (since 2007) | | Director (Columbia Management Group LLC and Investment Product Group Compliance), Bank of America since June 2005; Director of Corporate Compliance and Conflicts Officer, MFS Investment Management (investment management), August 2004 to May 2005; Managing Director, Deutsche Asset Management (investment management) prior to August 2004. | |
|
| Michael G. Clarke (Born 1969) | |
|
One Financial Center
Boston, MA 02111
Chief Accounting Officer and Assistant Treasurer (since 2004) | | Director of Fund Administration of the Advisor since January, 2006; Managing Director of the Advisor September, 2004 to December, 2005; Vice President Fund Administration of the Advisor June, 2002 to September, 2004. Vice President Product Strategy and Development of the Advisor from February, 2001 to June, 2002. | |
|
| Jeffrey R. Coleman (Born 1969) | |
|
One Financial Center
Boston, MA 02111
Deputy Treasurer (since 2006) | | Director of Fund Administration of the Advisor since January, 2006; Fund Controller of the Advisor from October 2004 to January 2006; Vice President of CDC IXIS Asset Management Services, Inc. (investment management) from August, 2000 to September, 2004. | |
|
| Joseph F. DiMaria (Born 1968) | |
|
One Financial Center
Boston, MA 02111
Deputy Treasurer (since 2006) | | Director of Fund Administration of the Advisor since January, 2006; Head of Tax/Compliance and Assistant Treasurer of the Advisor from November, 2004 to December, 2005; Director of Trustee Administration (Sarbanes-Oxley) of the Advisor from May, 2003 to October, 2004; Senior Audit Manager, PricewaterhouseCoopers (independent registered public accounting firm) from July, 2000 to April, 2003. | |
|
| Marybeth C. Pilat (Born 1968) | |
|
One Financial Center
Boston, MA 02111
Deputy Treasurer (since 2007) | | Vice President, Mutual Fund Valuation of the Advisor since January 2006; Vice President, Mutual Fund Accounting Oversight of the Advisor prior to January 2006. | |
|
| Barry S. Vallan (Born 1969) | |
|
One Financial Center
Boston, MA 02111
Controller (since 2006) | | Vice President-Fund Treasury of the Advisor since October, 2004; Vice President-Trustee Reporting of the Advisor from April, 2002 to October, 2004; Management Consultant, PricewaterhouseCoopers (independent registered public accounting firm) prior to October, 2002. | |
|
178
This page intentionally left blank.
This page intentionally left blank.
Important Information About This Report – Columbia Funds
The funds mail one shareholder report to each shareholder address. If you would like more than one report, please call shareholder services at 1-800-345-6611 and additional reports will be sent to you. This report has been prepared for shareholders of the Columbia Funds.
A description of the policies and procedures that each fund uses to determine how to vote proxies and a copy of each fund's voting records are available (i) at www.columbiamanagement.com; (ii) on the Securities and Exchange Commission's website at www.sec.gov, and (iii) without charge, upon request, by calling 1-800-368-0346. Information regarding how each fund voted proxies relating to portfolio securities during the 12-month period ended June 30 is available from the SEC's website. Information regarding how each fund voted proxies relating to portfolio securities is also available from the funds' website.
Each fund files a complete schedule of portfolio holdings with the SEC for the first and third quarters of each fiscal year on Form N-Q. Each fund's Form N-Q is available on the SEC's website at www.sec.gov and may be reviewed and copied at the SEC's Public Reference Room in Washington, DC. Information on the operation of the Public Reference Room may be obtained by calling 1-800-SEC-0330.
Please consider the investment objectives, risks, charges and expenses for a fund carefully before investing. Contact your financial advisor for a prospectus, which contains this and other important information about a fund. You should read it carefully before you invest.
Columbia Management Group, LLC ("Columbia Management") is the investment management division of Bank of America Corporation. Columbia Management entities furnish investment management services and products for institutional and individual investors. Columbia Funds are distributed by Columbia Management Distributors, Inc., member of FINRA, SIPC, part of Columbia Management and an affiliate of Bank of America Corporation.
Transfer Agent
Columbia Management Services, Inc.
P.O. Box 8081
Boston, MA 02266-8081
1-800-345-6611
Distributor
Columbia Management
Distributors, Inc.
One Financial Center
Boston, MA 02111
Investment Advisor
Columbia Management Advisors, LLC
100 Federal Street
Boston, MA 02110
181
Columbia Funds
Annual Report – August 31, 2007
Columbia Management®
PRSRT STD
U.S. Postage
PAID
Holliston, MA
Permit NO. 20
©2007 Columbia Management Distributors, Inc.
One Financial Center, Boston, MA 02111-2621
800-345-6611 www.columbiafunds.com
SHC-42/135302-0807 (10/07) 07/45426
Columbia Funds
Annual Report – August 31, 2007
Columbia Management®
©2007 Columbia Management Distributors, Inc.
One Financial Center, Boston, MA 02111-2621
800-345-6611 www.columbiafunds.com
SHC-42/135302-0807 (10/07) 07/45426
Columbia Funds
Annual Report – August 31, 2007
Columbia Management®
SHC-42/135302-0807 (10/07) 07/45426

Columbia Greater China Fund
Annual Report – August 31, 2007
| | |
| NOT FDIC INSURED | | May Lose Value |
| NOT BANK ISSUED | | No Bank Guarantee |
Table of Contents
The views expressed in this report reflect the current views of the respective parties. These views are not guarantees of future performance and involve certain risks, uncertainties and assumptions that are difficult to predict so actual outcomes and results may differ significantly from the views expressed. These views are subject to change at any time based upon economic, market or other conditions and the respective parties disclaim any responsibility to update such views. These views may not be relied on as investment advice and, because investment decisions for a Columbia Fund are based on numerous factors, may not be relied on as an indication of trading intent on behalf of any particular Columbia Fund. References to specific company securities should not be construed as a recommendation or investment advice.
President’s Message – Columbia Greater China Fund

Dear Shareholder:
Every six months, you receive a shareholder report for your Columbia Funds investment. We strive to bring you the information you need to make intelligent, informed investment decisions, in an attractive, easy-to-understand format.
We know that for many investors, the information contained in shareholder reports can seem very technical, so we would like to take this opportunity to walk you through some of the sections in the beginning of your shareholder report, explain their purpose and point out some of the highlights we think you’ll find useful. In future reports, we will discuss how to use the financial statements in your shareholder reports.
Performance Information
One of the first sections in your shareholder report is the Performance Information section, which contains several tables that illustrate how your fund has performed over time. These tables can be very useful for evaluating how your fund has performed versus its benchmark, though it’s important to remember that past performance is not an indicator of future results.
Understanding Your Expenses
This section explains the ongoing costs associated with your Columbia Funds investment. It includes both general information about mutual fund expenses and specific information pertinent to your fund.
You can use the information to estimate the expenses you paid over the reporting period. You will need your account balance at the end of the period, which can be found by checking your most recent account statement, logging onto your account at www.columbiafunds.com, calling our service center at 800.345.6611 or contacting your financial advisor. Once you have your balance, the section explains how to calculate your estimated expenses step by step.
Portfolio Manager’s Report
The Portfolio Manager’s Report is where you will find your portfolio manager’s thoughts on what happened during the reporting period. Commentary from your portfolio manager(s) includes a summary of the fund’s performance, along with a comparison of the fund’s performance versus the relevant peer group and benchmark indices.
The portfolio manager will also discuss market conditions that impacted the fund, as well as the investment strategy during the period. Please note: In semiannual reports, the portfolio manager’s comments are included in the Fund Profile section.
Other Information
Every shareholder report includes a page containing “Important Information About This Report,” which includes instructions for requesting additional copies of the shareholder report, as well as contact information for the fund’s Transfer Agent, Distributor and Investment Advisor.
Annual reports contain additional information, such as an independent registered public accounting firm’s report and biographies of the fund’s trustees and officers. This information is not included in semiannual reports.
Shareholder reports can be delivered to you electronically through our eDelivery service. Using eDelivery can help your fund save money while at the same time preserve precious natural resources. For even more information about your fund, visit our Web site at www.columbiafunds.com. There you will find prospectuses, shareholder reports and fund fact sheets for all of the funds in the Columbia Funds family.
We hope this guide to your shareholder report will help you get the most out of this important resource. Thank you for your business, and for your continued confidence in Columbia Funds.
Sincerely,

Christopher L. Wilson
President, Columbia Funds
Fund Profile – Columbia Greater China Fund
Performance data quoted represents past performance and current performance may be lower or higher. Past performance is no guarantee of future results. The investment return and principal value will fluctuate so that shares, when redeemed, may be worth more or less than the original cost. Please visit www.columbiafunds.com for daily and most recent month-end performance updates.
Summary
1 year return as of 08/31/07
| | |
| |
 | | +85.39% Class A shares (without sales charge) |
| |
| | +102.73% MSCI China Index |
| |
| | +46.87% Hang Seng Index |
Morningstar Style Box
Style
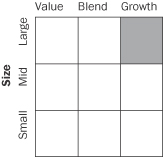
Summary
| n | | For the 12-month period that ended August 31, 2007, the fund’s Class A shares returned 85.39% without sales charge. |
n | | The fund’s return was less than the return of the MSCI China Index but more than the return of the Hang Seng Index.1 |
| n | | The portfolio’s focus on China was the biggest driver of return. While the Hong Kong and Taiwan equity markets delivered relatively strong results, their performance was less than half that of the China equity market. As a result, the fund’s 5.5% position in Hong Kong and its 1.5% position in Taiwan dampened relative return. |
Portfolio Management
Fred Copper, lead manager for the Columbia Greater China Fund, has co-managed the fund since October 2005. Mr. Copper has been with the advisor and its predecessors or affiliate organizations since September 2005.
Jasmine Huang has co-managed the fund since May 2005. Ms. Huang has been with the advisor and its predecessors or affiliate organizations since September 2003.
1 | The Morgan Stanley Capital International (MSCI) China Index is designed to broadly and fairly represent the full diversity of business activities in China. This index aims to capture 85% of the free float adjusted market capitalization in each industry group. The Hang Seng Index tracks the performance of approximately 70% of the total market capitalization of the stock exchange of Hong Kong. Indices are not investments, do not incur fees or expenses and are not professionally managed. It is not possible to invest directly in an index. Securities in the fund may not match those in an index. |
The Morningstar Style Box™ reveals a fund’s investment strategy. For equity funds the vertical axis shows the market capitalization of the stocks owned and the horizontal axis shows a fund’s investment style (value, blend or growth). For fixed-income funds the vertical axis shows the average credit quality of the bonds owned, and the horizontal axis shows interest rate sensitivity as measured by a bond’s duration (short, intermediate or long). All of these numbers are drawn from the data most recently provided by the fund and entered into Morningstar’s database as of month-end. Although the data is gathered from reliable sources, Morningstar cannot guarantee completeness and accuracy. Information shown is as of 08/31/2007.
1
Economic Update – Columbia Greater China Fund
Summary
For the 12-month period that ended August 31, 2007
| | n | | Driven by another year of strong economic growth, the Chinese stock market, as measured by the MSCI China Index, returned 102.73%. Hong Kong stocks, as measured by the Hang Seng Index, were also strong. | |
| | |
MSCI China
Index | | Hang Seng
Index |
| |

[GRAPHIC]
| |
|
102.73% | | 46.87% |
The Morgan Stanley Capital International (MSCI) China Index is designed to broadly and fairly represent the full diversity of business activities in China. This index aims to capture 85% of the free float adjusted market capitalization in each industry group.
The Hang Seng Index tracks the performance of approximately 70% of the total market capitalization of the stock exchange of Hong Kong.
Indices are not investments, do not incur fees or expenses and are not professionally managed. It is not possible to invest directly in an index.
During the 12-month period from September 1, 2006 to August 31, 2007, China’s economy continued to expand at an estimated pace of approximately 11%, which would make 2007 the fifth consecutive year of growth in excess of 10%. During the period, all major economic indicators remained elevated. Industrial production growth ranged between 12% and 15% and capital spending by businesses expanded at around 20%. Per capita income growth increased by approximately 15% over the past 12 months. Retail sales growth — another important domestic indicator — also ranged between 12% and 15% over the period. Altogether, these indicators form a picture of a very strong economy, both on the investment side and in terms of domestic consumption. As a result, China’s stellar stock market returns came as no surprise. The MSCI China Index returned 102.73% and the Hang Seng Index returned 46.87% for the 12-month period that began September 1, 2006 and ended August 31, 2007.
Elsewhere in the Greater China region, the Hong Kong economy continued to improve, especially in domestic consumption, which has been driven by both employment and income growth. Gross domestic product (“GDP”) in Hong Kong averaged approximately 6% over the 12-month reporting period. Taiwan’s GDP growth has been less spectacular, but solid, nevertheless, at around 4%. By virtue of Taiwan’s exposure to the global electronic cycle, the technology sector figures large in its economy. However, stock market performance in Taiwan was driven by companies or sectors that benefit from export growth to China and the region, such as cement, petrochemicals, rubber and plastic.
Challenges of rapid growth
While economic growth has spread prosperity across Greater China, the excessive rate of growth within mainland China’s economy also poses certain risks to the natural environment as well as to the investment environment. Air pollution, water pollution and constraints on resources have been recognized by the Chinese government, which has taken steps to use economic incentive policies to restrain labor and resource-intensive industries. In place of tax rebates and other encouragements to the coal and steel industries, for example, the government has imposed quotas and charges for exporting commodities in order to control or reduce the overuse of resources. In addition, the government has implemented policies to promote industry efficiency through consolidation and cooperation. We believe that environmental issues and resources constraints are among the factors that represent a challenge to long-term economic growth. Rising inflation is another risk to monitor. In August inflation rose above 6%, driven by rising food prices, even though non-food inflation remained rather low at about 1%. We may see a gradually rising rate of structural inflation in China in a rising global price backdrop. Certainly, the state of the US economy is also a factor in the investment outlook for China. However, we believe that China’s domestic economy is well-positioned even in the face of a US economic slow down.
2
Performance Information – Columbia Greater China Fund
|
| Growth of a $10,000 investment 09/01/97 – 08/31/07 |
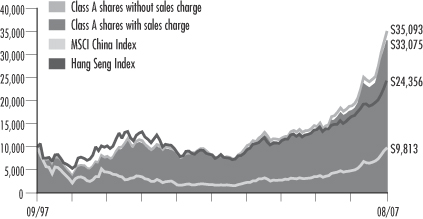
The chart above shows the growth in value of a hypothetical $10,000 investment in Class A shares of Columbia Greater China Fund during the stated time, and does not reflect the deduction of taxes that a shareholder may pay on fund distributions or the redemption of fund shares. The Morgan Stanley Capital International (MSCI) China Index is designed to broadly and fairly represent the full diversity of business activities in China. This index aims to capture 85% of the free float adjusted market capitalization in each industry group. The Hang Seng Index tracks the performance of approximately 70% of the total market capitalization of the stock exchange of Hong Kong. Indices are not investments, do not incur fees or expenses and are not professionally managed. It is not possible to invest directly in an index. Securities in the fund may not match those in an index.
| | | | |
| Performance of a $10,000 investment 09/01/97 – 08/31/07 ($) |
| | |
| Sales charge | | without | | with |
Class A | | 35,093 | | 33,075 |
Class B | | 32,732 | | 32,732 |
Class C | | 33,163 | | 33,163 |
Class Z | | 36,970 | | n/a |
| | | | | | | | | | | | | | |
| Average annual total return as of 08/31/07 (%) |
| | | | |
| Share class | | A | | B | | C | | Z |
| Inception | | 05/16/97 | | 05/16/97 | | 05/16/97 | | 05/16/97 |
| Sales charge | | without | | with | | without | | with | | without | | with | | without |
1-year | | 85.39 | | 74.73 | | 84.01 | | 79.01 | | 83.97 | | 82.97 | | 85.88 |
5-year | | 33.87 | | 32.29 | | 32.87 | | 32.75 | | 32.84 | | 32.84 | | 34.93 |
10-year | | 13.38 | | 12.71 | | 12.59 | | 12.59 | | 12.74 | | 12.74 | | 13.97 |
| | | | | | | | | | | | | | |
| Average annual total return as of 09/30/07 (%) |
| | | | |
| Share class | | A | | B | | C | | Z |
| Sales charge | | without | | with | | without | | with | | without | | with | | without |
1-year | | 112.12 | | 99.93 | | 110.56 | | 105.56 | | 110.51 | | 109.51 | | 112.67 |
5-year | | 40.18 | | 38.52 | | 39.13 | | 39.03 | | 39.11 | | 39.11 | | 41.31 |
10-year | | 14.98 | | 14.30 | | 14.19 | | 14.19 | | 14.34 | | 14.34 | | 15.58 |
Performance data quoted represents past performance and current performance may be lower or higher. Past performance is no guarantee of future results. The investment return and principal value will fluctuate so that shares, when redeemed, may be worth more or less than the original cost. Please visit www.columbiafunds.com for daily and most recent month-end performance updates.
| | |
Annual operating expense
ratio (%)* |
| |
Class A | | 1.75 |
Class B | | 2.50 |
Class C | | 2.50 |
Class Z | | 1.50 |
| * | The annual operating expense ratio is as stated in the fund’s prospectus that is current as of the date of this report. Differences in expense ratios disclosed elsewhere in this report may result from including fee waivers and reimbursements as well as different time periods used in calculating the ratios. |
The “with sales charge” returns include the maximum initial sales charge of 5.75% for Class A shares, the applicable contingent deferred sales charge of 5.00% in the first year, declining to 1.00% in the sixth year and eliminated thereafter for class B shares and 1.00% for class C shares for the first year only. The “without sales charge” returns do not include the effect of sales charges. If they had, returns would be lower.
All results shown assume reinvestment of distributions. Class Z shares are sold at net asset value with no Rule 12b-1 fees. Class Z shares have limited eligibility and the investment minimum requirement may vary. Please see the fund’s prospectus for details. Performance for different share classes will vary based on differences in sales charges and the fees associated with each class.
Performance results reflect any waivers or reimbursements of fund expenses by the investment advisor and/or any of its affiliates. Absent these waivers or reimbursement arrangements, performance results would have been lower.
The tables do not reflect the deduction of taxes that a shareholder may pay on fund distributions or the redemption of fund shares.
The performance stated may have been due to extraordinary market conditions, which may not be duplicated in the future.
3
Understanding Your Expenses – Columbia Greater China Fund
Estimating your actual expenses
To estimate the expenses that you paid over the period, first you will need your account balance at the end of the period:
| | n | | For shareholders who receive their account statements from Columbia Management Services, Inc., your account balance is available online at www.columbiafunds.com or by calling Shareholder Services at 800.345.6611. | |
| | n | | For shareholders who receive their account statements from their brokerage firm, contact your brokerage firm to obtain your account balance. | |
| | 1. | Divide your ending account balance by $1,000.00. For example, if an account balance was $8,600.00 at the end of the period, the result would be 8.6. | |
| | 2. | In the section of the table below titled “Expenses paid during the period,” locate the amount for your share class. You will find this number in the column labeled “actual.” Multiply this number by the result from step 1. Your answer is an estimate of the expenses you paid on your account during the period. | |
A minimum account balance fee of $20 that is charged once per year may be assessed if the value of your account falls below the minimum initial investment applicable to you. This fee is not included in the accompanying table. If you are subject to the fee, keep it in mind when you are estimating the ongoing expenses of investing in the fund and when comparing the expenses of this fund with other funds.
As a fund shareholder, you incur two types of costs. There are transaction costs, which generally include sales charges on purchases and may include redemption or exchange fees. There are also ongoing costs, which generally include investment advisory fees, Rule 12b-1 fees and other fund expenses. The information on this page is intended to help you understand the ongoing costs of investing in the fund and to compare these costs with the ongoing costs of investing in other mutual funds.
Analyzing your fund’s expenses by share class
To illustrate these ongoing costs, we have provided an example and calculated the expenses paid by investors in each share class during the period. The information in the following table is based on an initial investment of $1,000.00, which is invested at the beginning of the reporting period and held for the entire period. Expense information is calculated two ways and each method provides you with different information. The amount listed in the “actual” column is calculated using the fund’s actual operating expenses and total return for the period. The amount listed in the “hypothetical” column for each share class assumes that the return each year is 5% before expenses and is calculated based on the fund’s actual operating expenses. You should not use the hypothetical account values and expenses to estimate either your actual account balance at the end of the period or the expenses you paid during this reporting period.
Compare with other funds
Since all mutual funds are required to include the same hypothetical calculations about expenses in shareholder reports, you can use this information to compare the ongoing costs of investing in the fund with other funds. To do so, compare the 5% hypothetical example with the 5% hypothetical examples that appear in the shareholder reports of other funds. As you compare hypothetical examples of other funds, it is important to note that hypothetical examples are meant to highlight the ongoing costs of investing in a fund and do not reflect any transaction costs, such as sales charges, redemption fees or exchange fees.
| | | | | | | | | | | | | | |
| 03/01/07 – 08/31/07 | | | | | | | | | | |
| | | Account value at the
beginning of the period ($) | | Account value at the
end of the period ($) | | Expenses paid
during the period ($) | | Fund’s annualized
expense ratio (%) |
| | | Actual | | Hypothetical | | Actual | | Hypothetical | | Actual | | Hypothetical | | Actual |
Class A | | 1,000.00 | | 1,000.00 | | 1,456.98 | | 1,016.89 | | 10.22 | | 8.39 | | 1.65 |
Class B | | 1,000.00 | | 1,000.00 | | 1,451.48 | | 1,013.31 | | 14.83 | | 12.18 | | 2.40 |
Class C | | 1,000.00 | | 1,000.00 | | 1,451.28 | | 1,013.31 | | 14.83 | | 12.18 | | 2.40 |
Class Z | | 1,000.00 | | 1,000.00 | | 1,458.79 | | 1,018.15 | | 8.68 | | 7.12 | | 1.40 |
Expenses paid during the period are equal to the annualized expense ratio for the share class, multiplied by the average account value over the period, then multiplied by the number of days in the fund’s most recent fiscal half-year and divided by 365.
It is important to note that the expense amounts shown in the table are meant to highlight only ongoing costs of investing in the fund and do not reflect any transaction costs, such as sales charges, redemption fees or exchange fees. Therefore, the hypothetical examples provided may not help you determine the relative total costs of owning shares of different funds. If these transaction costs were included, your costs would have been higher.
4
Portfolio Managers’ Report – Columbia Greater China Fund
Performance data quoted represents past performance and current performance may be lower or higher. Past performance is no guarantee of future results. The investment return and principal value will fluctuate so that shares, when redeemed, may be worth more or less than the original cost. Please visit www.columbiafunds.com for daily and most recent month-end performance updates.
| | |
Net asset value per share |
| |
as of 08/31/07 ($) | | |
Class A | | 58.78 |
Class B | | 57.29 |
Class C | | 58.05 |
Class Z | | 61.05 |
| | |
| | |
Distributions declared per share |
| |
09/01/06 – 08/31/07 ($) | | |
Class A | | 0.24 |
Class B | | 0.01 |
Class C | | 0.01 |
Class Z | | 0.32 |
For the 12-month period ended August 31, 2007, Columbia Greater China Fund Class A shares returned 85.39% without sales charge. This was less than the 102.73% return of the MSCI China Index, the fund’s benchmark. The fund’s return was more than the 46.87% return of the fund’s other benchmark, the Hang Seng Index, an index that primarily tracks the performance of Hong Kong stocks.1 The fund outperformed the 80.20% average of its peer group, the Lipper China Region Funds Classification.2 The portfolio’s focus on China was the biggest driver of return. While the Hong Kong and Taiwan equity markets delivered relatively strong results, they gained less than half that of the China equity market. As a result, the 5.5% position in Hong Kong and the 1.5% position in Taiwan dampened the fund’s relative return.
Most of the fund’s assets were in mainland China
We reduced the portfolio’s weights in Hong Kong and Taiwan and shifted more emphasis to mainland China, where we favored companies that we believed would benefit from the themes of infrastructure development and rising consumer spending. Financial companies accounted for the largest sector allocation and were the best performers in the portfolio. An example is China Merchants Bank Co., Ltd., a commercial institution with a large market share that is known for its high quality services for businesses and high-end consumers. The stock delivered a triple-digit return. We also invested in real estate companies, such as Guangzhou R&F Properties Co., Ltd., a developer that has tapped into China’s increasing demand for real estate. China Merchants Property Development Co., Ltd. is a similar story. The company is located in an area that saw the biggest appreciation in real estate prices over the past year.
Telecommunications companies were also a substantial part of the portfolio, with China Mobile Ltd. producing a substantial return. The company, which has virtually no competition in the wireless telecommunications sector, benefited from continuously rising mobile penetration and its expansion into China’s rural areas. Consumer stocks also added to performance, with China Mengniu Dairy Co., Ltd., leading the group. In the industrials sector, China Shipping Development Co., Ltd., the largest carrier of bulk materials, benefited from China’s import/export demand for materials such as coal, oil and iron ore.
In Hong Kong we focused on companies that we believed would benefit from the continued growth in domestic consumption that is being driven by rising employment and income. In Taiwan, the fund held several technology and telecommunications stocks, which detracted from performance. The fund had no exposure to companies that export commodities, which were strong performers for the period.
1 | The Lehman Brothers Municipal Bond Index considered representative of the broad market for investment-grade, tax-exempt bonds with maturity of at least one year. Indices are not investments, do not incur fees or expenses and are not professionally managed. It is not possible to invest directly in an index. |
2 | Lipper Inc., a widely respected data provider in the industry, calculates an average total return (assuming reinvestment of distributions) for mutual funds with investment objectives similar to those of the fund. Lipper makes no adjustment for the effect of sales loads. |
1 | The Morgan Stanley Capital International (MSCI) China Index is designed to broadly and fairly represent the full diversity of business activities in China. This index aims to capture 85% of the free float adjusted market capitalization in each industry group. The Hang Seng Index tracks the performance of approximately 70% of the total market capitalization of the stock exchange of Hong Kong. Indices are not investments, do not incur fees or expenses and are not professionally managed. It is not possible to invest directly in an index. Securities in the fund may not match those in an index. |
2 | Lipper Inc., a widely respected data provider in the industry, calculates an average total return (assuming reinvestment of distributions) for mutual funds with investment objectives similar to those of the fund. Lipper makes no adjustment for the effect of sales loads. |
5
Portfolio Managers’ Report (continued) – Columbia Greater China Fund
Seeking opportunity in undervalued areas
Because stocks in Greater China had such a strong run-up over the period, we trimmed several positions whose valuations we believed had reached unsustainable levels. We used the proceeds from these sales to invest in stocks that we thought offered better value. For example, we became more positive about the materials sector and added Aluminum Corp. of China Ltd. to the portfolio.
Emphasizing China’s domestic rebuilding and rising consumption trends
We are positive in our outlook for the Greater China economy and equity markets over the next several months. While we are concerned about the potential for a slowdown in the US economy and, more specifically, about US consumer spending, we believe this would have a relatively small impact on China’s export industry, as only about 8% of China’s exports go to US consumers. China’s central bank has raised interest rates and the reserve requirement ratio over the past year. However, the real interest rate (the current rate minus the rate of inflation) is approximately negative 2%. We believe that the interest-rate environment remains positive for equities, and we think that the government will continue to raise rates to neutralize this negative real interest rate and to prevent the economy from overheating. In terms of portfolio positioning for the next several months, we plan to continue to emphasize the domestic consumption and infrastructure development themes. As a result, the portfolio is overweight in the consumer discretionary, consumer staples and energy sectors. It also has relatively large positions in financials and industrial companies.
The performance stated may have been due to extraordinary market conditions, which may not be duplicated in the future.
Equity investments are affected by stock market fluctuations that occur in response to economic and business developments.
Economic and market conditions frequently change. There is no assurance that the trends described here will continue or commence. The opinions expressed here are strictly those of Columbia Management and are subject to change without notice. Other divisions of Bank of America and/or affiliates of Columbia Management may have opinions that are inconsistent with these opinions.
International investing may involve certain risks, including foreign taxation, currency fluctuations, risks associated with possible differences in financial standards and other monetary and political risks. A portfolio of stocks from a single region poses additional risks due to limited diversification.
Some of the countries the fund invests in are considered emerging economies, which means there may be greater risks associated with investing there than in more developed countries. In addition, concentration of investments in a single region may result in greater volatility.
| | |
| Top 10 holdings | | |
| |
as of 08/31/07 (%) | | |
China Mobile Ltd. | | 15.2 |
China Life Insurance Co., Ltd. | | 7.9 |
Petrochina Co., Ltd. | | 7.6 |
China Merchants Bank Co., Ltd. | | 5.4 |
China Petroleum & Chemical Corp. | | 4.3 |
Industrial & Commercial Bank of China | | 4.3 |
CNOOC Ltd. | | 3.8 |
Guangzhou R&F Properties Co., Ltd. | | 3.8 |
Aluminum Corp. of China Ltd. | | 3.8 |
China Shipping Development Co., Ltd. | | 2.5 |
| | |
| | |
| Top 5 sectors | | |
| |
as of 08/31/07 (%) | | |
Financials | | 30.4 |
Energy | | 19.9 |
Telecommunication Services | | 17.4 |
Industrials | | 13.9 |
Consumer - Discretionary | | 6.1 |
| | |
| | |
| Holdings discussed in this report |
| |
as of 08/31/07 (%) | | |
China Merchants Bank Co., Ltd. | | 5.4 |
Guangzhou R&F Properties Co., Ltd. | | 3.8 |
China Merchants Property Development Co., Ltd. | | 0.9 |
China Mobile Ltd. | | 15.2 |
China Mengniu Dairy Co., Ltd. | | 1.9 |
China Shipping Development Co., Ltd. | | 2.5 |
Aluminum Corp. of China Ltd. | | 3.8 |
Your fund is actively managed and the composition of its portfolio will change over time. Information provided is calculated as a percentage of net assets.
6
Financial Statements – Columbia Greater China Fund
August 31, 2007
| | |
| | A guide to understanding your fund’s financial statements |
| | |
| Investment Portfolio | | The investment portfolio details all of the fund’s holdings and their values as of the last day of the reporting period. Portfolio holdings are organized by type of asset, industry, country or geographic region (if applicable) to demonstrate areas of concentration and diversification. |
| | |
| Statement of Assets and Liabilities | | This statement details the fund’s assets, liabilities, net assets and share price for each share class as of the last day of the reporting period. Net assets are calculated by subtracting all the fund’s liabilities (including any unpaid expenses) from the total of the fund’s investment and non-investment assets. The share price for each class is calculated by dividing net assets for that class by the number of shares outstanding in that class as of the last day of the reporting period. |
| | |
| Statement of Operations | | This statement details income earned by the fund and the expenses accrued by the fund during the reporting period. This statement also shows any net gain or loss the fund realized on the sales of its holdings during the period, as well as any unrealized gains or losses recognized over the period. The total of these results represents the fund’s net increase or decrease in net assets from operations. |
| | |
| Statement of Changes in Net Assets | | This statement demonstrates how the fund’s net assets were affected by its operating results, distributions to shareholders and shareholder transactions (e.g., subscriptions, redemptions and dividend reinvestments) during the reporting period. This statement also details changes in the number of shares outstanding. |
| | |
| Financial Highlights | | The financial highlights demonstrate how the fund’s net asset value per share was affected by the fund’s operating results. The financial highlights table also discloses the classes’ performance and certain key ratios (e.g., class expenses and net investment income as a percentage of average net assets). |
| | |
| Notes to Financial Statements | | These notes disclose the organizational background of the fund, its significant accounting policies (including those surrounding security valuation, income recognition and distributions to shareholders), federal tax information, fees and compensation paid to affiliates and significant risks and contingencies. |
7
Investment Portfolio – Columbia Greater China Fund
August 31, 2007
Common Stocks – 98.1%
| | | | | | |
| | | | | Shares | | Value ($) |
| Consumer Discretionary – 6.1% | | | | | | |
| Automobiles – 1.8% | | Dongfeng Motor Group Co. Ltd., Class H | | 4,780,000 | | 3,095,676 |
| | Great Wall Motor Co., Ltd., Class H | | 2,223,682 | | 2,714,851 |
| | | | | | |
| | Automobiles Total | | | | 5,810,527 |
| | | |
| Distributors – 2.8% | | China Resources Enterprise Ltd. | | 1,100,000 | | 4,485,967 |
| | Li & Fung Ltd. | | 1,157,600 | | 4,290,349 |
| | | | | | |
| | Distributors Total | | | | 8,776,316 |
| | | |
Hotels, Restaurants &
Leisure – 0.1% | | Home Inns & Hotels Management, Inc., ADR (a) | | 14,473 | | 429,269 |
| | | | | | |
| | Hotels, Restaurants & Leisure Total | | | | 429,269 |
| | | |
| Multiline Retail – 0.0% | | New World Department Store China Ltd. (a) | | 61,000 | | 47,485 |
| | | | | | |
| | Multiline Retail Total | | | | 47,485 |
| | | |
| Specialty Retail – 1.3% | | Belle International Holdings Ltd. (a) | | 346,000 | | 397,132 |
| | Esprit Holdings Ltd. | | 248,100 | | 3,611,261 |
| | | | | | |
| | Specialty Retail Total | | | | 4,008,393 |
| | | |
Textiles, Apparel & Luxury
Goods – 0.1% | | Ports Design Ltd. | | 126,000 | | 340,141 |
| | | | | | |
| | Textiles, Apparel & Luxury Goods Total | | | | 340,141 |
| | | | | | |
| Consumer Discretionary Total | | | | | | 19,412,131 |
| | | | | | |
| Consumer Staples – 2.9% | | | | | | |
| Beverages – 0.2% | | Yantai Changyu Pioneer Wine Co., Class B | | 143,010 | | 832,642 |
| | | | | | |
| | Beverages Total | | | | 832,642 |
| | | |
| Food Products – 2.4% | | China Mengniu Dairy Co., Ltd. | | 1,607,000 | | 6,048,675 |
| | China Milk Products Group Ltd. | | 1,926,000 | | 1,478,283 |
| | | | | | |
| | Food Products Total | | | | 7,526,958 |
| | | |
| Personal Products – 0.3% | | China Flavors & Fragrances Co., Ltd. | | 1,714,000 | | 835,277 |
| | | | | | |
| | Personal Products Total | | | | 835,277 |
| | | | | | |
| Consumer Staples Total | | | | | | 9,194,877 |
| | | | | | |
| Energy – 19.9% | | | | | | |
Oil, Gas & Consumable
Fuels – 19.9% | | China Coal Energy Co., Class H (a) | | 494,000 | | 974,360 |
| | China Petroleum & Chemical Corp., Class H | | 12,694,000 | | 13,837,374 |
| | China Shenhua Energy Co., Ltd., Class H | | 1,780,500 | | 7,717,825 |
| | CNOOC Ltd. | | 10,016,500 | | 12,241,797 |
| | PetroChina Co., Ltd., Class H | | 16,444,000 | | 24,040,782 |
| | Yanzhou Coal Mining Co., Ltd., Class H | | 2,654,000 | | 4,669,725 |
| | | | | | |
| | Oil, Gas & Consumable Fuels Total | | | | 63,481,863 |
| | | | | | |
| Energy Total | | | | | | 63,481,863 |
See Accompanying Notes to Financial Statements.
8
Columbia Greater China Fund
August 31, 2007
Common Stocks (continued)
| | | | | | |
| | | | | Shares | | Value ($) |
| Financials – 30.4% | | | | | | |
| Commercial Banks – 12.7% | | Bank of China Ltd., Class H | | 14,889,000 | | 7,637,686 |
| | China Citic Bank, Class H (a) | | 2,299,000 | | 1,768,994 |
| | China Merchants Bank Co., Ltd., Class H | | 4,550,800 | | 17,099,824 |
| | Industrial & Commercial Bank of China, Class H | | 21,075,000 | | 13,783,960 |
| | | | | | |
| | Commercial Banks Total | | | | 40,290,464 |
| | | |
| Insurance – 9.2% | | China Life Insurance Co., Ltd., Class H | | 5,196,000 | | 25,154,887 |
| | Ping An Insurance (Group) Co., Ltd., Class H | | 409,500 | | 4,259,033 |
| | | | | | |
| | Insurance Total | | | | 29,413,920 |
| | | |
| Real Estate Management & Development – 8.5% | | Cheung Kong Holdings Ltd. | | 133,000 | | 1,954,666 |
| | China Merchants Property Development Co., Ltd. | | 551,736 | | 2,745,360 |
| | Guangzhou R&F Properties Co. Ltd., Class H | | 3,003,600 | | 12,133,579 |
| | Shui On Land Ltd. | | 1,863,000 | | 1,961,518 |
| | Sun Hung Kai Properties Ltd. | | 208,000 | | 2,779,504 |
| | Swire Pacific Ltd., Class A | | 214,500 | | 2,369,839 |
| | Yanlord Land Group Ltd. | | 1,444,000 | | 2,993,433 |
| | | | | | |
| | Real Estate Management & Development Total | | | | 26,937,899 |
| | | | | | |
| Financials Total | | | | | | 96,642,283 |
| | | | | | |
| Health Care – 1.0% | | | | | | |
| | | |
Health Care Equipment &
Supplies – 0.6% | | Mindray Medical International Ltd., ADR | | 50,713 | | 1,799,804 |
| | | | | | |
| | Health Care Equipment & Supplies Total | | | | 1,799,804 |
| | | |
| Pharmaceuticals – 0.4% | | China Shineway Pharmaceutical Group Ltd. | | 2,071,000 | | 1,370,459 |
| | | | | | |
| | Pharmaceuticals Total | | | | 1,370,459 |
| | | | | | |
| Health Care Total | | | | | | 3,170,263 |
| | | | | | |
| Industrials – 13.9% | | | | | | |
| Construction & Engineering – 0.5% | | China Communications Construction Co., Ltd., Class H | | 748,425 | | 1,618,237 |
| | | | | | |
| | Construction & Engineering Total | | | | 1,618,237 |
| | | |
| Electrical Equipment – 5.2% | | China High Speed Transmission Equipment Group Co. Ltd. (a) | | 71,000 | | 115,820 |
| | Dongfang Electrical Machinery Co., Ltd., Class H | | 484,000 | | 3,258,674 |
| | Harbin Power Equipment, Class H | | 2,546,000 | | 5,524,526 |
| | Shanghai Electric Group Co., Ltd., Class H | | 4,736,000 | | 3,024,665 |
| | Wasion Meters Group Ltd. | | 3,924,000 | | 2,012,914 |
| | Zhuzhou CSR Times Electric Co., Ltd., Class H | | 1,720,000 | | 2,757,241 |
| | | | | | |
| | Electrical Equipment Total | | | | 16,693,840 |
| | | |
| Machinery – 2.1% | | Enric Energy Equipment Holdings Ltd. (a) | | 1,040,000 | | 920,277 |
| | Xinjiang Tianye Water Saving Irrigation System Co., Ltd., Class H | | 4,214,000 | | 1,745,554 |
| | Yangzijiang Shipbuilding Holdings Ltd. (a) | | 3,405,000 | | 4,154,755 |
| | | | | | |
| | Machinery Total | | | | 6,820,586 |
See Accompanying Notes to Financial Statements.
9
Columbia Greater China Fund
August 31, 2007
Common Stocks (continued)
| | | | | | |
| | | | | Shares | | Value ($) |
| Industrials (continued) | | | | | | |
| Marine – 2.5% | | China Shipping Development Co. Ltd., CLass H | | 2,590,000 | | 7,838,772 |
| | | | | | |
| | Marine Total | | | | 7,838,772 |
| | | |
| Transportation Infrastructure – 3.6% | | Anhui Expressway Co., Ltd., Class H | | 1,600,000 | | 1,356,306 |
| | China Merchants Holdings International Co., Ltd. | | 822,000 | | 4,295,717 |
| | Jiangsu Expressway Co., Ltd., Class H | | 2,554,000 | | 2,659,581 |
| | Zhejiang Expressway Co., Ltd., Class H | | 2,252,000 | | 2,992,019 |
| | | | | | |
| | Transportation Infrastructure Total | | | | 11,303,623 |
| | | | | | |
| Industrials Total | | | | | | 44,275,058 |
| | | | | | |
| Information Technology – 2.7% | | | | | | |
| Electronic Equipment & Instruments – 0.3% | | Hon Hai Precision Industry Co., Ltd. | | 156,854 | | 1,164,522 |
| | | | | | |
| | Electronic Equipment & Instruments Total | | | | 1,164,522 |
| | | |
| Semiconductors & Semiconductor Equipment – 0.6% | | Taiwan Semiconductor Manufacturing Co., Ltd. | | 987,867 | | 1,876,948 |
| | | | | | |
| | Semiconductors & Semiconductor Equipment Total | | | | 1,876,948 |
| | | |
| Software – 1.8% | | Kingdee International Software Group Co. Ltd. | | 1,417,000 | | 1,352,007 |
| | Perfect World Co., Ltd., ADR (a) | | 192,764 | | 4,369,960 |
| | | | | | |
| | Software Total | | | | 5,721,967 |
| | | | | | |
| Information Technology Total | | | | | | 8,763,437 |
| | | | | | |
| Materials – 3.8% | | | | | | |
| Metals & Mining – 3.8% | | Aluminum Corp. of China Ltd. | | 4,334,000 | | 11,949,882 |
| | | | | | |
| | Metals & Mining Total | | | | 11,949,882 |
| | | | | | |
| Materials Total | | | | | | 11,949,882 |
| | | | | | |
| Telecommunication Services – 17.4% | | | | |
| Diversified Telecommunication Services – 2.2% | | China Telecom Corp., Ltd., Class H | | 9,752,000 | | 5,602,837 |
| | Chunghwa Telecom Co., Ltd. | | 748,902 | | 1,329,868 |
| | | | | | |
| | Diversified Telecommunication Services Total | | | | 6,932,705 |
| | | |
| Wireless Telecommunication Services – 15.2% | | China Mobile Ltd. | | 3,559,500 | | 48,478,567 |
| | | | | | |
| | Wireless Telecommunication Services Total | | | | 48,478,567 |
| | | | | | |
| Telecommunication Services Total | | | | | | 55,411,272 |
| | Total Common Stocks
(Cost of $149,284,835) | | | | 312,301,066 |
See Accompanying Notes to Financial Statements.
10
Columbia Greater China Fund
August 31, 2007
Common Stocks (continued)
| | | | | | |
| | | | | Par ($) | | Value ($) |
| Short-Term Obligation – 1.8% | | | | | | |
| | Repurchase agreement with Fixed Income Clearing Corp., dated 08/31/07, due on 09/04/07 at 5.030%, collateralized by a U.S. Treasury Obligation maturing 05/15/08, market value of $5,791,250 (repurchase proceeds $5,679,172) | | 5,676,000 | | 5,676,000 |
| | | | | | |
| | Total Short-Term Obligation (Cost of $5,676,000) | | | | 5,676,000 |
| | | |
| | | | | | |
| | Total Investments – 99.9%
(Cost of $154,960,835) (b) | | | | 317,977,066 |
| | | |
| | | | | | |
| | Other Assets & Liabilities, Net – 0.1% | | | | 267,249 |
| | | |
| | | | | | |
| | Net Assets – 100.0% | | | | 318,244,315 |
Notes to Investment Portfolio:
| | (a) | Non-income producing security. |
| | (b) | Cost for federal income tax purposes is $156,232,535. |
The Fund was invested in the following countries at August 31, 2007:
| | | | | |
Country (Unaudited) | | Value | | % of Total
Investments |
China | | $ | 221,468,375 | | 69.6 |
Hong Kong | | | 82,306,599 | | 25.9 |
United States* | | | 5,676,000 | | 1.8 |
Taiwan | | | 4,371,338 | | 1.4 |
Singapore | | | 4,154,754 | | 1.3 |
| | | | | |
| | | 317,977,066 | | 100.0 |
| | | | | |
* Represents short-term obligation.
Certain securities are listed by country of underlying exposure but may trade predominantly on other exchanges.
At August 31, 2007, the Fund held investments in the following sectors:
| | |
Sector (Unaudited) | | % of Net Assets |
Financials | | 30.4 |
Energy | | 19.9 |
Telecommunication Services | | 17.4 |
Industrials | | 13.9 |
Consumer Discretionary | | 6.1 |
Materials | | 3.8 |
Consumer Staples | | 2.9 |
Information Technology | | 2.7 |
Health Care | | 1.0 |
| | |
| | 98.1 |
Short-Term Obligation | | 1.8 |
Other Assets & Liabilities, Net | | 0.1 |
| | |
| | 100.0 |
| | |
| | |
Acronym | | Name |
| ADR | | American Depositary Receipt |
See Accompanying Notes to Financial Statements.
11
Statement of Assets and Liabilities – Columbia Greater China Fund
August 31, 2007
| | | | | | |
| | | | | ($) | |
| Assets | | Investments, at cost | | | 154,960,835 | |
| | | | | | |
| | Investments, at value | | | 317,977,066 | |
| | Cash | | | 387 | |
| | Foreign currency (cost of $3,122,386) | | | 3,122,197 | |
| | Receivable for: | | | | |
| | Fund shares sold | | | 1,314,311 | |
| | Interest | | | 793 | |
| | Dividends | | | 41,577 | |
| | Deferred Trustees’ compensation plan | | | 16,528 | |
| | | | | | |
| | Total Assets | | | 322,472,859 | |
| | |
| Liabilities | | Payable for: | | | | |
| | Investments purchased | | | 3,063,109 | |
| | Fund shares repurchased | | | 593,917 | |
| | Investment advisory fee | | | 230,136 | |
| | Transfer agent fee | | | 43,469 | |
| | Pricing and bookkeeping fees | | | 11,177 | |
| | Trustees’ fees | | | 2,144 | |
| | Custody fee | | | 60,000 | |
| | Distribution and service fees | | | 99,036 | |
| | Chief compliance officer expenses | | | 138 | |
| | Deferred Trustees’ compensation plan | | | 16,528 | |
| | Other liabilities | | | 108,890 | |
| | | | | | |
| | Total Liabilities | | | 4,228,544 | |
| | |
| | | | | | |
| | Net Assets | | | 318,244,315 | |
| | |
| Net Assets Consist of | | Paid-in capital | | | 155,583,477 | |
| | Undistributed net investment income | | | 408,943 | |
| | Accumulated net realized loss | | | (764,574 | ) |
| | Net unrealized appreciation on: | | | | |
| | Investments | | | 163,016,231 | |
| | Foreign currency translations | | | 238 | |
| | | | | | |
| | Net Assets | | | 318,244,315 | |
| | |
| Class A | | Net assets | | $ | 179,901,614 | |
| | Shares outstanding | | | 3,060,482 | |
| | Net asset value per share | | $ | 58.78 | (a) |
| | Maximum sales charge | | | 5.75 | % |
| | Maximum offering price per share | | $ | 62.37 | (b) |
| Class B | | | | | | |
| | Net assets | | $ | 33,502,098 | |
| | Shares outstanding | | | 584,816 | |
| | Net asset value and offering price per share | | $ | 57.29 | (a) |
| Class C | | | | | | |
| | Net assets | | $ | 51,937,879 | |
| | Shares outstanding | | | 894,778 | |
| | Net asset value and offering price per share | | $ | 58.05 | (a) |
| Class Z | | | | | | |
| | Net assets | | $ | 52,902,724 | |
| | Shares outstanding | | | 866,600 | |
| | Net asset value, offering and redemption price per share | | $ | 61.05 | (a) |
| (a) | Redemption price per share is equal to net asset value less any applicable contingent deferred sales charge and /or any applicable redemption fees. |
| (b) | On sales of $50,000 or more the offering price is reduced. |
See Accompanying Notes to Financial Statements.
12
Statement of Operations – Columbia Greater China Fund
For the Year Ended August 31, 2007
| | | | | |
| | | | | ($) | |
| Investment Income | | Dividends | | 4,878,487 | |
| | Interest | | 226,966 | |
| | Foreign tax withheld | | (51,427 | ) |
| | | | | |
| | Total Investment Income | | 5,054,026 | |
| | |
| Expenses | | Investment advisory fee | | 2,198,923 | |
| | Distribution fee: | | | |
| | Class B | | 183,617 | |
| | Class C | | 273,453 | |
| | Service fee: | | | |
| | Class A | | 336,706 | |
| | Class B | | 61,206 | |
| | Class C | | 91,151 | |
| | Transfer agent fee | | 301,491 | |
| | Pricing and bookkeeping fees | | 101,058 | |
| | Trustees’ fees | | 20,346 | |
| | Custody fee | | 220,018 | |
| | Chief compliance officer expenses | | 455 | |
| | Other expenses | | 269,812 | |
| | | | | |
| | Expenses before interest expense | | 4,058,236 | |
| | Interest expense | | 3,427 | |
| | | | | |
| | Total Expenses | | 4,061,663 | |
| | |
| | Expense reduction | | (3,112 | ) |
| | | | | |
| | Net Expenses | | 4,058,551 | |
| | |
| | | | | |
| | Net Investment Income | | 995,475 | |
| | |
| Net Realized and Unrealized Gain (Loss) on Investments and Foreign Currency | | Net realized gain (loss) on: | | | |
| | Investments | | 23,391,462 | |
| | Foreign currency transactions | | (19,979 | ) |
| | | | | |
| | Net realized gain | | 23,371,483 | |
| | |
| | Net change in unrealized appreciation on: | | | |
| | Investments | | 117,682,786 | |
| | Foreign currency translations | | 1,344 | |
| | | | | |
| | Net change in unrealized appreciation | | 117,684,130 | |
| | | | | |
| | Net Gain | | 141,055,613 | |
| | |
| | | | | |
| | Net Increase Resulting from Operations | | 142,051,088 | |
See Accompanying Notes to Financial Statements.
13
Statement of Changes in Net Assets – Columbia Greater China Fund
| | | | | | | | |
| Increase (Decrease) in Net Assets: | | Year Ended August 31, | | 2007 ($) | | | 2006 ($) | |
| Operations | | Net investment income | | 995,475 | | | 844,128 | |
| | Net realized gain on investments and foreign currency transactions | | 23,371,483 | | | 6,803,941 | |
| | Net change in unrealized appreciation on investments and foreign currency translations | | 117,684,130 | | | 22,218,796 | |
| | | | | | | | |
| | Net Increase Resulting from Operations | | 142,051,088 | | | 29,866,865 | |
| | | |
Distributions
to Shareholders | | From net investment income: | | | | | | |
| | Class A | | (768,683 | ) | | (989,679 | ) |
| | Class B | | (4,865 | ) | | (139,342 | ) |
| | Class C | | (6,946 | ) | | (164,858 | ) |
| | Class Z | | (232,689 | ) | | (181,558 | ) |
| | | | | | | | |
| | Total Distributions to Shareholders | | (1,013,183 | ) | | (1,475,437 | ) |
| | | |
| Share Transactions | | Class A: | | | | | | |
| | Subscriptions | | 66,437,292 | | | 27,817,205 | |
| | Distributions reinvested | | 586,557 | | | 790,677 | |
| | Redemptions | | (53,775,840 | ) | | (14,974,466 | ) |
| | | | | | | | |
| | Net Increase | | 13,248,009 | | | 13,633,416 | |
| | | |
| | Class B: | | | | | | |
| | Subscriptions | | 8,367,025 | | | 4,014,279 | |
| | Distributions reinvested | | 3,540 | | | 98,809 | |
| | Redemptions | | (7,077,338 | ) | | (3,312,272 | ) |
| | | | | | | | |
| | Net Increase | | 1,293,227 | | | 800,816 | |
| | | |
| | Class C: | | | | | | |
| | Subscriptions | | 21,967,604 | | | 7,539,811 | |
| | Distributions reinvested | | 4,881 | | | 121,526 | |
| | Redemptions | | (14,578,840 | ) | | (3,743,795 | ) |
| | | | | | | | |
| | Net Increase | | 7,393,645 | | | 3,917,542 | |
| | | |
| | Class Z: | | | | | | |
| | Subscriptions | | 27,795,899 | | | 9,777,827 | |
| | Distributions reinvested | | 144,105 | | | 133,297 | |
| | Redemptions | | (16,531,539 | ) | | (2,479,717 | ) |
| | | | | | | | |
| | Net Increase | | 11,408,465 | | | 7,431,407 | |
| | Net Increase from Share Transactions | | 33,343,346 | | | 25,783,181 | |
| | Redemption fees | | 145,677 | | | 23,219 | |
| | | |
| | | | | | | | |
| | Total Increase in Net Assets | | 174,526,928 | | | 54,197,828 | |
| | | |
| Net Assets | | Beginning of period | | 143,717,387 | | | 89,519,559 | |
| | End of period | | 318,244,315 | | | 143,717,387 | |
| | Undistributed net investment income at end of period | | 408,943 | | | 396,489 | |
| | | | | | | | |
See Accompanying Notes to Financial Statements.
14
Columbia Greater China Fund
| | | | | | | | |
| | | Year Ended August 31, | | 2007 | | | 2006 | |
| Changes in Shares | | Class A: | | | | | | |
| | Subscriptions | | 1,598,093 | | | 968,912 | |
| | Issued for distributions reinvested | | 14,734 | | | 31,129 | |
| | Redemptions | | (1,200,888 | ) | | (538,245 | ) |
| | | | | | | | |
| | Net Increase | | 411,939 | | | 461,796 | |
| | | |
| | Class B: | | | | | | |
| | Subscriptions | | 201,821 | | | 142,689 | |
| | Issued for distributions reinvested | | 91 | | | 3,963 | |
| | Redemptions | | (168,647 | ) | | (120,972 | ) |
| | | | | | | | |
| | Net Increase | | 33,265 | | | 25,680 | |
| | | |
| | Class C: | | | | | | |
| | Subscriptions | | 527,396 | | | 265,002 | |
| | Issued for distributions reinvested | | 123 | | | 4,811 | |
| | Redemptions | | (337,174 | ) | | (132,451 | ) |
| | | | | | | | |
| | Net Increase | | 190,345 | | | 137,362 | |
| | | |
| | Class Z: | | | | | | |
| | Subscriptions | | 625,073 | | | 327,510 | |
| | Issued for distributions reinvested | | 3,492 | | | 5,065 | |
| | Redemptions | | (360,691 | ) | | (86,003 | ) |
| | | | | | | | |
| | Net Increase | | 267,874 | | | 246,572 | |
See Accompanying Notes to Financial Statements.
15
Financial Highlights – Columbia Greater China Fund
Selected data for a fund share outstanding throughout each period is as follows:
| | | | | | | | | | | | | | | | | | | | |
| Class A Shares | | | | | | | | | | | | | | | |
| | | Year Ended August 31, | |
| | | 2007 | | | 2006 | | | 2005 | | | 2004 | | | 2003 | |
Net Asset Value, Beginning of Period | | $ | 31.90 | | | $ | 24.68 | | | $ | 20.64 | | | $ | 17.88 | | | $ | 14.29 | |
| | | | | |
Income from Investment Operations: | | | | | | | | | | | | | | | | | | | | |
Net investment income (a) | | | 0.26 | | | | 0.26 | | | | 0.31 | | | | 0.17 | | | | 0.14 | |
Net realized and unrealized gain on investments and foreign currency | | | 26.86 | | | | 7.41 | | | | 3.94 | | | | 2.70 | | | | 3.53 | |
| | | | | | | | | | | | | | | | | | | | |
Total from Investment Operations | | | 27.12 | | | | 7.67 | | | | 4.25 | | | | 2.87 | | | | 3.67 | |
| | | | | |
Less Distributions to Shareholders: | | | | | | | | | | | | | | | | | | | | |
From net investment income | | | (0.24 | ) | | | (0.45 | ) | | | (0.21 | ) | | | (0.11 | ) | | | (0.08 | ) |
| | | | | |
Redemption fees: | | | | | | | | | | | | | | | | | | | | |
Redemption fees added to paid-in-capital | | | — | (a)(c) | | | — | (a)(c) | | | — | (a)(c) | | | — | (a)(c) | | | — | |
| | | | | |
Net Asset Value, End of Period | | $ | 58.78 | | | $ | 31.90 | | | $ | 24.68 | | | $ | 20.64 | | | $ | 17.88 | |
Total return (d) | | | 85.39 | % | | | 31.55 | %(e)(f) | | | 20.66 | % | | | 16.11 | % | | | 25.84 | %(e) |
| | | | | |
Ratios to Average Net Assets/Supplemental Data: | | | | | | | | | | | | | | | | | | | | |
Expenses before interest expense (g) | | | 1.59 | % | | | 1.73 | % | | | 1.76 | % | | | 1.89 | % | | | 2.15 | % |
Interest expense | | | — | %(b) | | | — | | | | — | | | | — | | | | — | %(b) |
Net expenses (g) | | | 1.59 | % | | | 1.73 | % | | | 1.76 | % | | | 1.89 | % | | | 2.15 | % |
Waiver/reimbursement | | | — | | | | 0.01 | % | | | — | | | | — | | | | 0.37 | % |
Net investment income (g) | | | 0.61 | % | | | 0.93 | % | | | 1.35 | % | | | 0.84 | % | | | 0.97 | % |
Portfolio turnover rate | | | 36 | % | | | 32 | % | | | 24 | % | | | 25 | % | | | 33 | % |
Net assets, end of period (000’s) | | $ | 179,902 | | | $ | 84,492 | | | $ | 53,975 | | | $ | 47,282 | | | $ | 42,685 | |
| (a) | Per share data was calculated using the average shares outstanding during the period. |
| (b) | Rounds to less than 0.01%. |
| (c) | Rounds to less than $0.01 per share. |
| (d) | Total return at net asset value assuming all distributions reinvested and no initial sales charge or contingent deferred sales charge. |
| (e) | Had the investment advisor and/or any of its affiliates not waived or reimbursed a portion of expenses, total return would have been reduced. |
| (f) | Includes a voluntary reimbursement by the investment advisor for a realized investment loss due to a trading error. This reimbursement increased total return and net asset value per share by 0.03% and $0.01, respectively. |
| (g) | The benefits derived from expense reductions had an impact of less than 0.01%. |
See Accompanying Notes to Financial Statements.
16
Financial Highlights – Columbia Greater China Fund
Selected data for a fund share outstanding throughout each period is as follows:
| | | | | | | | | | | | | | | | | | | | |
| Class B Shares | | | | | | | | | | | | | | | |
| | | Year Ended August 31, | |
| | | 2007 | | | 2006 | | | 2005 | | | 2004 | | | 2003 | |
Net Asset Value, Beginning of Period | | $ | 31.14 | | | $ | 24.11 | | | $ | 20.18 | | | $ | 17.51 | | | $ | 14.02 | |
| | | | | |
Income from Investment Operations: | | | | | | | | | | | | | | | | | | | | |
Net investment income (loss) (a) | | | (0.06 | ) | | | 0.05 | | | | 0.14 | | | | 0.05 | | | | 0.04 | |
Net realized and unrealized gain on investments and foreign currency | | | 26.22 | | | | 7.25 | | | | 3.85 | | | | 2.62 | | | | 3.45 | |
| | | | | | | | | | | | | | | | | | | | |
Total from Investment Operations | | | 26.16 | | | | 7.30 | | | | 3.99 | | | | 2.67 | | | | 3.49 | |
| | | | | |
Less Distributions to Shareholders: | | | | | | | | | | | | | | | | | | | | |
From net investment income | | | (0.01 | ) | | | (0.27 | ) | | | (0.06 | ) | | | — | | | | — | |
| | | | | |
Redemption fees: | | | | | | | | | | | | | | | | | | | | |
Redemption fees added to paid-in-capital | | | — | (a)(c) | | | — | (a)(c) | | | — | (a)(c) | | | — | (a)(c) | | | — | |
| | | | | |
Net Asset Value, End of Period | | $ | 57.29 | | | $ | 31.14 | | | $ | 24.11 | | | $ | 20.18 | | | $ | 17.51 | |
Total return (d) | | | 84.01 | % | | | 30.57 | %(e)(f) | | | 19.77 | % | | | 15.25 | % | | | 24.89 | %(e) |
| | | | | |
Ratios to Average Net Assets/Supplemental Data: | | | | | | | | | | | | | | | | | | | | |
Expenses before interest expense (g) | | | 2.34 | % | | | 2.48 | % | | | 2.51 | % | | | 2.64 | % | | | 2.90 | % |
Interest expense | | | — | %(b) | | | — | | | | — | | | | — | | | | — | %(b) |
Net expenses (g) | | | 2.34 | % | | | 2.48 | % | | | 2.51 | % | | | 2.64 | % | | | 2.90 | % |
Waiver/reimbursement | | | — | | | | 0.01 | % | | | — | | | | — | | | | 0.37 | % |
Net investment income (loss) (g) | | | (0.14 | )% | | | 0.19 | % | | | 0.60 | % | | | 0.23 | % | | | 0.30 | % |
Portfolio turnover rate | | | 36 | % | | | 32 | % | | | 24 | % | | | 25 | % | | | 33 | % |
Net assets, end of period (000’s) | | $ | 33,502 | | | $ | 17,176 | | | $ | 12,680 | | | $ | 10,471 | | | $ | 5,121 | |
| (a) | Per share data was calculated using the average shares outstanding during the period. |
| (b) | Rounds to less than 0.01%. |
| (c) | Rounds to less than $0.01 per share. |
| (d) | Total return at net asset value assuming all distributions reinvested and no contingent deferred sales charge. |
| (e) | Had the investment advisor and/or any of its affiliates not waived or reimbursed a portion of expenses, total return would have been reduced. |
| (f) | Includes a voluntary reimbursement by the investment advisor for a realized investment loss due to a trading error. This reimbursement increased total return and net asset value per share by 0.03% and $0.01, respectively. |
| (g) | The benefits derived from expense reductions had an impact of less than 0.01%. |
See Accompanying Notes to Financial Statements.
17
Financial Highlights – Columbia Greater China Fund
Selected data for a fund share outstanding throughout each period is as follows:
| | | | | | | | | | | | | | | | | | | | |
| Class C Shares | | | | | | | | | | | | | | | |
| | | Year Ended August 31, | |
| | | 2007 | | | 2006 | | | 2005 | | | 2004 | | | 2003 | |
Net Asset Value, Beginning of Period | | $ | 31.56 | | | $ | 24.43 | | | $ | 20.45 | | | $ | 17.76 | | | $ | 14.22 | |
| | | | | |
Income from Investment Operations: | | | | | | | | | | | | | | | | | | | | |
Net investment income (loss) (a) | | | (0.07 | ) | | | 0.05 | | | | 0.14 | | | | 0.04 | | | | 0.05 | |
Net realized and unrealized gain on investments and foreign currency | | | 26.57 | | | | 7.35 | | | | 3.90 | | | | 2.65 | | | | 3.49 | |
| | | | | | | | | | | | | | | | | | | | |
Total from Investment Operations | | | 26.50 | | | | 7.40 | | | | 4.04 | | | | 2.69 | | | | 3.54 | |
| | | | | |
Less Distributions to Shareholders: | | | | | | | | | | | | | | | | | | | | |
From net investment income | | | (0.01 | ) | | | (0.27 | ) | | | (0.06 | ) | | | — | | | | — | |
| | | | | |
Redemption fees: | | | | | | | | | | | | | | | | | | | | |
Redemption fees added to paid-in-capital | | | — | (a)(c) | | | — | (a)(c) | | | — | (a)(c) | | | — | (a)(c) | | | — | |
| | | | | |
Net Asset Value, End of Period | | $ | 58.05 | | | $ | 31.56 | | | $ | 24.43 | | | $ | 20.45 | | | $ | 17.76 | |
Total return (d) | | | 83.97 | % | | | 30.58 | %(e)(f) | | | 19.75 | % | | | 15.15 | % | | | 24.89 | %(e) |
| | | | | |
Ratios to Average Net Assets/Supplemental Data: | | | | | | | | | | | | | | | | | | | | |
Expenses before interest expense (g) | | | 2.34 | % | | | 2.48 | % | | | 2.51 | % | | | 2.64 | % | | | 2.90 | % |
Interest expense | | | — | %(b) | | | — | | | | — | | | | — | | | | — | %(b) |
Net expenses (g) | | | 2.34 | % | | | 2.48 | % | | | 2.51 | % | | | 2.64 | % | | | 2.90 | % |
Waiver/reimbursement | | | — | | | | 0.01 | % | | | — | | | | — | | | | 0.37 | % |
Net investment income (loss) (g) | | | (0.17 | )% | | | 0.20 | % | | | 0.60 | % | | | 0.20 | % | | | 0.35 | % |
Portfolio turnover rate | | | 36 | % | | | 32 | % | | | 24 | % | | | 25 | % | | | 33 | % |
Net assets, end of period (000’s) | | $ | 51,938 | | | $ | 22,229 | | | $ | 13,853 | | | $ | 9,436 | | | $ | 3,316 | |
| (a) | Per share data was calculated using the average shares outstanding during the period. |
| (b) | Rounds to less than 0.01%. |
| (c) | Rounds to less than $0.01 per share. |
| (d) | Total return at net asset value assuming all distributions reinvested and no contingent deferred sales charge. |
| (e) | Had the investment advisor and/or any of its affiliates not waived or reimbursed a portion of expenses, total return would have been reduced. |
| (f) | Includes a voluntary reimbursement by the investment advisor for a realized investment loss due to a trading error. This reimbursement increased total return and net asset value per share by 0.03% and $0.01, respectively. |
| (g) | The benefits derived from expense reductions had an impact of less than 0.01%. |
See Accompanying Notes to Financial Statements.
18
Financial Highlights – Columbia Greater China Fund
Selected data for a fund share outstanding throughout each period is as follows:
| | | | | | | | | | | | | | | | | | | | |
| Class Z Shares | | | | | | | | | | | | | | | |
| | | Year Ended August 31, | |
| | | 2007 | | | 2006 | | | 2005 | | | 2004 | | | 2003 | |
Net Asset Value, Beginning of Period | | $ | 33.10 | | | $ | 25.59 | | | $ | 21.38 | | | $ | 18.51 | | | $ | 14.41 | |
| | | | | |
Income from Investment Operations: | | | | | | | | | | | | | | | | | | | | |
Net investment income (a) | | | 0.37 | | | | 0.37 | | | | 0.40 | | | | 0.22 | | | | 0.11 | |
Net realized and unrealized gain on investments
and foreign currency | | | 27.90 | | | | 7.65 | | | | 4.07 | | | | 2.81 | | | | 4.10 | |
| | | | | | | | | | | | | | | | | | | | |
Total from Investment Operations | | | 28.27 | | | | 8.02 | | | | 4.47 | | | | 3.03 | | | | 4.21 | |
| | | | | |
Less Distributions to Shareholders: | | | | | | | | | | | | | | | | | | | | |
From net investment income | | | (0.32 | ) | | | (0.51 | ) | | | (0.26 | ) | | | (0.16 | ) | | | (0.12 | ) |
| | | | | |
Redemption fees: | | | | | | | | | | | | | | | | | | | | |
Redemption fees added to paid-in-capital | | | — | (a)(c) | | | — | (a)(c) | | | — | (a)(c) | | | — | (a)(c) | | | 0.01 | |
| | | | | |
Net Asset Value, End of Period | | $ | 61.05 | | | $ | 33.10 | | | $ | 25.59 | | | $ | 21.38 | | | $ | 18.51 | |
Total return (d) | | | 85.88 | % | | | 31.86 | %(e)(f) | | | 21.00 | % | | | 16.44 | % | | | 29.51 | %(e) |
| | | | | |
Ratios to Average Net Assets/Supplemental Data: | | | | | | | | | | | | | | | | | | | | |
Expenses before interest expense (g) | | | 1.34 | % | | | 1.48 | % | | | 1.51 | % | | | 1.64 | % | | | 1.90 | % |
Interest expense | | | — | %(b) | | | — | | | | — | | | | — | | | | — | %(b) |
Net expenses (g) | | | 1.34 | % | | | 1.48 | % | | | 1.51 | % | | | 1.64 | % | | | 1.90 | % |
Waiver/reimbursement | | | — | | | | 0.01 | % | | | — | | | | — | | | | 0.37 | % |
Net investment income (g) | | | 0.82 | % | | | 1.25 | % | | | 1.60 | % | | | 1.06 | % | | | 0.70 | % |
Portfolio turnover rate | | | 36 | % | | | 32 | % | | | 24 | % | | | 25 | % | | | 33 | % |
Net assets, end of period (000’s) | | $ | 52,903 | | | $ | 19,821 | | | $ | 9,012 | | | $ | 5,182 | | | $ | 1,996 | |
| (a) | Per share data was calculated using the average shares outstanding during the period. |
| (b) | Rounds to less than 0.01%. |
| (c) | Rounds to less than $0.01 per share. |
| (d) | Total return at net asset value assuming all distributions reinvested. |
| (e) | Had the investment advisor and/or any of its affiliates not waived or reimbursed a portion of expenses, total return would have been reduced. |
| (f) | Includes a voluntary reimbursement by the investment advisor for a realized investment loss due to a trading error. This reimbursement increased total return and net asset value per share by 0.03% and $0.01, respectively. |
| (g) | The benefits derived from expense reductions had an impact of less than 0.01%. |
See Accompanying Notes to Financial Statements.
19
Notes to Financial Statements – Columbia Greater China Fund
August 31, 2007
Note 1. Organization
Columbia Greater China Fund (the “Fund”), a series of Columbia Funds Series Trust I (the “Trust”), is a non-diversified fund. The Trust is a Massachusetts business trust registered under the Investment Company Act of 1940, as amended, as an open-end management investment company.
Investment Goal
The Fund seeks long-term growth of capital.
Fund Shares
The Trust may issue an unlimited number of shares, and offers four classes of shares: Class A, Class B, Class C and Class Z. Each share class has its own expense structure and, as applicable, sales charges.
Class A shares are subject to a maximum front-end sales charge of 5.75% based on the amount of initial investment. Class A shares purchased without an initial sales charge in accounts aggregating $1 million to $50 million at the time of purchase are subject to a 1.00% contingent deferred sales charge (“CDSC”) on shares sold within twelve months of the time of purchase. Class B shares are subject to a maximum CDSC of 5.00% based upon the holding period after purchase. Class B shares will convert to Class A shares eight years after purchase. Class C shares are subject to a 1.00% CDSC on shares sold within one year after purchase. Class Z shares are offered continuously at net asset value. There are certain restrictions on the purchase of Class Z shares, as described in the Fund’s prospectus.
Note 2. Significant Accounting Policies
The preparation of financial statements in accordance with accounting principles generally accepted in the United States of America (“GAAP”) requires management to make certain estimates and assumptions that affect the reported amounts of assets and liabilities, the disclosure of contingent assets and liabilities at the date of the financial statements and the reported amounts of revenue and expenses during the reporting period. Actual results could differ from those estimates. The following is a summary of significant accounting policies consistently followed by the Fund in the preparation of its financial statements.
Security Valuation
Equity securities are valued at the last sale price on the principal exchange on which they trade, except for securities traded on the NASDAQ, which are valued at the NASDAQ official close price. Unlisted securities or listed securities for which there were no sales during the day are valued at the closing bid price on such exchanges or over-the-counter markets.
Short-term debt obligations maturing within 60 days are valued at amortized cost, which approximates market value.
Foreign securities are generally valued at the last sale price on the foreign exchange or market on which they trade. If any foreign share prices are not readily available as a result of limited share activity, the securities are valued at the last sale price of the local shares in the principal market in which such securities are normally traded.
Generally, trading in foreign securities is substantially completed each day at various times prior to the close of the New York Stock Exchange (“NYSE”). The values of such securities used in computing the net asset value of the Fund’s shares are determined as of such times. Foreign currency exchange rates are generally determined at 4:00 p.m. Eastern (U.S.) time. Occasionally, events affecting the values of such foreign securities and such exchange rates may occur between the times at which they are determined and the close of the customary trading session of the NYSE, which would not be reflected in the computation of the Fund’s net asset value. If events materially affecting the values of such foreign securities occur and it is determined that market quotations are not reliable, then these foreign securities will be valued at their “fair value” using procedures approved by the Board of Trustees. The Fund may use a systematic fair valuation model provided by an independent third party to value securities principally traded in foreign markets in order to adjust for possible stale pricing that may occur between the close of the foreign exchanges and the time for valuation. If a security is valued at fair value, such value is likely to be different from the last quoted market price for the security.
Investments for which market quotations are not readily available, or that have quotations which management believes are not reliable, are valued at fair value as determined in good faith under consistently applied procedures established by and under the general supervision of the Board of Trustees. If a security is valued at fair value, such value is likely to be different from the last quoted market price for this security.
20
Columbia Greater China Fund
August 31, 2007
In September 2006, Statement of Financial Accounting Standards No. 157, Fair Value Measurements (“SFAS 157”), was issued. SFAS 157 is effective for fiscal years beginning after November 15, 2007. SFAS 157 defines fair value, establishes a framework for measuring fair value and expands disclosures about fair value measurements. Management has recently begun to evaluate the impact the application of SFAS 157 will have on the Fund’s financial statement disclosures.
Security Transactions
Security transactions are accounted for on the trade date. Cost is determined and gains (losses) are based upon the specific identification method for both financial statement and federal income tax purposes.
Repurchase Agreements
The Fund may engage in repurchase agreement transactions with institutions that Columbia Management Advisors, LLC (“Columbia”), the Fund’s investment advisor, has determined are creditworthy. The Fund, through its custodian, receives delivery of underlying securities collateralizing a repurchase agreement. Columbia is responsible for determining that collateral is at least equal, at all times, to the value of the repurchase obligation including interest. A repurchase agreement transaction involves certain risks in the event of default or insolvency of the counterparty. These risks include possible delays or restrictions upon the Fund’s ability to dispose of the underlying securities and a possible decline in the value of the underlying securities during the period while the Fund seeks to assert its rights.
Income Recognition
Interest income is recorded on the accrual basis. Corporate actions and dividend income are recorded on the ex-date, except for certain foreign securities which are recorded as soon after ex-date as the Fund becomes aware of such, net of non-reclaimable tax withholdings.
Foreign Currency Transactions
The values of all assets and liabilities quoted in foreign currencies are translated into U.S. dollars at that day’s exchange rates. Net realized and unrealized gains (losses) on foreign currency transactions include gains (losses) arising from the fluctuation in exchange rates between trade and settlement dates on securities transactions, gains (losses) arising from the disposition of foreign currency and currency gains (losses) between the accrual and payment dates on dividends, interest income and foreign withholding taxes.
For financial statement purposes, the Fund does not distinguish that portion of gains (losses) on investments which is due to changes in foreign exchange rates from that which is due to changes in market prices of the investments. Such fluctuations are included with the net realized and unrealized gains (losses) on investments in the Statement of Operations.
Determination of Class Net Asset Values
All income, expenses (other than class-specific expenses, as shown on the Statement of Operations), and realized and unrealized gains (losses), are allocated to each class of the Fund on a daily basis, based on the relative net assets of each class, for purposes of determining the net asset value of each class.
Federal Income Tax Status
The Fund intends to qualify each year as a “regulated investment company” under Subchapter M of the Internal Revenue Code, as amended, and will distribute substantially all of its taxable income, if any, for its tax year, and as such will not be subject to federal income taxes. In addition, the Fund intends to distribute in each calendar year substantially all of its net investment income, capital gains and certain other amounts, if any, such that the Fund should not be subject to federal excise tax. Therefore, no federal income or excise tax provision is recorded.
Distributions to Shareholders
Distributions to shareholders are recorded on ex-date. Net realized capital gains, if any, are distributed at least annually.
Indemnification
In the normal course of business, the Fund enters into contracts that contain a variety of representations and warranties and which provide general indemnities. The Fund’s maximum exposure under these arrangements is unknown because this would involve future claims against the Fund. Also, under the Fund’s organizational documents and by contract, the trustees and officers of the Trust are indemnified against certain liabilities that may arise out of
21
Columbia Greater China Fund
August 31, 2007
actions relating to their duties to the Trust. However, based on experience, the Fund expects the risk of loss due to these representations, warranties and indemnities to be minimal.
Note 3. Federal Tax Information
The timing and character of income and capital gain distributions are determined in accordance with income tax regulations, which may differ from GAAP. Reclassifications are made to the Fund’s capital accounts for permanent tax differences to reflect income and gains available for distribution (or available capital loss carryforwards) under income tax regulations.
For the year ended August 31, 2007, permanent book and tax basis differences resulting primarily from differing treatments for foreign currency transactions and Passive Foreign Investment Company (PFIC) adjustments were identified and reclassified among the components of the Fund’s net assets as follows:
| | | | |
| | | |
Undistributed
Net Investment
Income | | Accumulated Net Realized
Gain | | Paid-In Capital |
| $30,162 | | $17,971 | | $(48,133) |
Net investment income and net realized gains (losses), as disclosed on the Statement of Operations, and net assets were not affected by this reclassification.
The tax character of distributions paid during the years ended August 31, 2007 and August 31, 2006 was as follows:
| | | | | | |
| | | August 31,
2007 | | August 31,
2006 |
| Distributions paid from: | | | | |
Ordinary Income* | | $ | 1,013,183 | | $ | 1,475,437 |
| * | For tax purposes short-term capital gains distributions, if any, are considered ordinary income distributions. |
As of August 31, 2007, the components of distributable earnings on a tax basis were as follows:
| | |
| | | |
Undistributed
Ordinary Income | | Net Unrealized Appreciation (Depreciation)* |
| $1,698,351 | | $161,744,531 |
| * | The differences between book-basis and tax-basis net unrealized appreciation/depreciation are due to deferral of losses from wash sales. |
Unrealized appreciation and depreciation at August 31, 2007, based on cost of investments for federal income tax purposes were:
| | | | |
| | |
Unrealized appreciation | | $ | 162,719,819 | |
Unrealized depreciation | | | (975,288 | ) |
Net unrealized appreciation | | $ | 161,744,531 | |
The following capital loss carryforwards, determined as of August 31, 2007, may be available to reduce taxable income arising from future net realized gains on investments, if any, to the extent permitted by the Internal Revenue Code:
| | |
| |
| Year of Expiration | | Capital Loss Carryforward |
| 2010 | | $764,574 |
Capital loss carryforwards of $23,380,084 were utilized during the year ended August 31, 2007. Expired capital loss carryforwards are recorded as a reduction of paid-in capital.
In June 2006, the Financial Accounting Standards Board (“FASB”) issued FASB Interpretation No. 48, Accounting for Uncertainty in Income Taxes, an Interpretation of FASB Statement No. 109 (the “Interpretation”). This Interpretation is effective on the last business day of the semiannual reporting period for fiscal years beginning after December 15, 2006 and is to be applied to open tax positions upon initial adoption. This Interpretation prescribes a minimum recognition threshold and measurement method for the financial statement recognition of tax positions taken or expected to be taken in a tax return and also requires certain expanded disclosures. Management is evaluating the application of this Interpretation to the Fund and has not at this time quantified the impact, if any, resulting from the adoption of this Interpretation on the Fund’s financial statements.
Note 4. Fees and Compensation Paid to Affiliates
Investment Advisory Fee
Columbia, an indirect, wholly-owned subsidiary of Bank of America Corporation (“BOA”), is the investment advisor to the Fund and provides administrative and other services to the Fund. Columbia receives a monthly investment advisory
22
Columbia Greater China Fund
August 31, 2007
fee based on the Fund’s average daily net assets at the following annual rates:
| | |
| | | |
| Average Daily Net Assets | | Annual Fee Rate |
First $1 billion | | 0.95% |
$1 billion to $1.5 billion | | 0.87% |
$1.5 billion to $3 billion | | 0.82% |
$3 billion to $6 billion | | 0.77% |
Over $6 billion | | 0.72% |
For the year ended August 31, 2007, the Fund’s annualized effective investment advisory fee rate was 0.95% of the Fund’s average daily net assets.
Pricing and Bookkeeping Fees
Effective December 15, 2006, the Fund entered into a Financial Reporting Services Agreement (the “Financial Reporting Services Agreement”) with State Street Bank & Trust Company (“State Street”) and Columbia pursuant to which State Street provides financial reporting services to the Fund. Also effective December 15, 2006, the Fund entered into an Accounting Services Agreement with State Street and Columbia (collectively with the Financial Reporting Services Agreement, the “State Street Agreements”) pursuant to which State Street provides accounting services to the Fund. Under the State Street Agreements, the Fund pays State Street an annual fee of $38,000 paid monthly plus an additional monthly fee based on an annualized percentage rate of average daily net assets. Under the State Street Agreements, the combined fee payable to State Street by the Fund will not exceed $140,000 annually. The Fund also reimburses State Street for certain out-of-pocket expenses.
Effective December 15, 2006, the Fund entered into a Pricing and Bookkeeping Oversight and Services Agreement (the “Services Agreement”) with Columbia. Under the Services Agreement, Columbia provides services related to Fund expenses and the requirements of the Sarbanes-Oxley Act of 2002, and provides oversight of the accounting and financial reporting services provided by State Street. Under the Services Agreement, the Fund reimburses Columbia for out-of-pocket expenses and direct internal costs relating to accounting oversight and for services performed in connection with Fund expenses and the requirements of the Sarbanes-Oxley Act of 2002.
Prior to December 15, 2006, Columbia was responsible for providing pricing and bookkeeping services to the Fund under a pricing and bookkeeping agreement. Under its pricing and bookkeeping agreement with the Fund, Columbia was entitled to receive an annual fee at the same fee structure described above under the State Street Agreements. Under separate agreements between Columbia and State Street, Columbia delegated certain functions to State Street. As a result of the delegation, the total fees payable under the pricing and bookkeeping agreement (other than certain reimbursements paid to Columbia and discussed below) were paid to State Street. The Fund also reimbursed Columbia and State Street for out-of-pocket expenses and charges, including fees payable to third parties for pricing the Fund’s portfolio securities and direct internal costs incurred by Columbia in connection with providing fund accounting oversight and monitoring and certain other services.
For the year ended August 31, 2007, the total amounts paid and payable to affiliates by the Fund under these agreements were $38,110 and $1,512, respectively.
Transfer Agent Fees
Columbia Management Services, Inc. (the “Transfer Agent”), an affiliate of Columbia and an indirect, wholly-owned subsidiary of BOA, provides shareholder services to the Fund and has contracted with Boston Financial Data Services (“BFDS”) to serve as sub-transfer agent. The Transfer Agent is entitled to receive a fee for its services, paid monthly, at the annual rate of $17.00 per open account plus reimbursement of certain sub-transfer agent fees paid by the Transfer Agent (exclusive of BFDS fees) calculated based on assets held in omnibus accounts and intended to recover the cost of payments to other parties (including affiliates of BOA) for services to those accounts. The Transfer Agent pays the fees of BFDS for services as sub-transfer agent and is not entitled to reimbursement for such fees from the Fund. The Transfer Agent may also retain, as additional compensation for its services, fees for wire, telephone and redemption orders, IRA trustee agent fees and account transcript fees due the Transfer Agent from shareholders of the Fund and credits (net of bank charges) earned with respect to balances in accounts the Transfer Agent maintains in connection with its services to the Fund. The Transfer Agent also receives reimbursement for certain out-of-pocket expenses.
23
Columbia Greater China Fund
August 31, 2007
An annual minimum account balance fee of $20 may apply on certain accounts with a value below the initial minimum investment requirements for such accounts to reduce the impact of small accounts on transfer agent fees. These minimum account balance fees are recorded as a reduction of total expenses on the Statement of Operations. For the year ended August 31, 2007, these minimum account balance fees reduced total expenses by $1,211.
For the year ended August 31, 2007, the Fund’s effective transfer agent fee rate, inclusive of out-of-pocket expenses, sub-transfer agent fees and net of minimum account balance fees, was 0.13% of the Fund’s average daily net assets.
Underwriting Discounts, Service and Distribution Fees
Columbia Management Distributors, Inc. (the “Distributor”), a subsidiary of Columbia and an indirect, wholly-owned subsidiary of BOA, is the principal underwriter of the Fund. For the year ended August 31, 2007, the Distributor has retained net underwriting discounts of $127,776 on sales of the Fund’s Class A shares and received net CDSC fees of $1,900, $51,861 and $37,304 on Class A, Class B and Class C share redemptions, respectively.
The Fund has adopted a Rule 12b-1 plan (the “Plan”), which requires the payment of a monthly service fee to the Distributor at the annual rate of up to 0.25% of the average daily net assets attributable to Class A, Class B and Class C shares of the Fund. The Plan also requires the payment of a monthly distribution fee to the Distributor at the annual rate of up to 0.75% of the average daily net assets attributable to Class B and Class C shares only.
The CDSC and the distribution fees received from the Plan are used principally as repayment to the Distributor for amounts paid by the Distributor to dealers who sold such shares.
Custody Credits
The Fund has an agreement with its custodian bank under which custody fees may be reduced by balance credits. These credits are recorded as a reduction of total expenses on the Statement of Operations. The Fund could have invested a portion of the assets utilized in connection with the expense offset arrangement in an income-producing asset if it had not entered into such an agreement.
For the year ended August 31, 2007, these credits reduced total expenses by $1,901 for the Fund.
Fees Paid to Officers and Trustees
All officers of the Fund are employees of Columbia or its affiliates and, with the exception of the Fund’s Chief Compliance Officer, receive no compensation from the Fund. The Board of Trustees has appointed a Chief Compliance Officer to the Fund in accordance with federal securities regulations. The Fund, along with other affiliated funds, pays its pro-rata share of the expenses associated with the Chief Compliance Officer. The Fund’s expenses for the Chief Compliance Officer will not exceed $15,000 per year.
The Fund’s Trustees may participate in a deferred compensation plan which may be terminated at any time. Obligations of the plan will be paid solely out of the Fund’s assets.
Note 5. Portfolio Information
For the year ended August 31, 2007, the cost of purchases and proceeds from sales of securities, excluding short-term obligations, were $113,195,909 and $82,902,768, respectively.
Note 6. Redemption Fees
The Fund assesses a 2% redemption fee on the proceeds of Fund shares held for 60 days or less. The redemption fee is designed to offset brokerage commissions and other costs associated with short term trading of fund shares. The redemption fees, which are retained by the Fund, are accounted for as an addition to paid-in capital and are allocated to each class based on the relative net assets at the time of the redemption. For the year ended August 31, 2007, the redemption fees for the Class A, Class B, Class C and Class Z shares of the Fund amounted to $84,977, $14,955, $22,739, and $23,006, respectively.
Note 7. Line of Credit
The Fund and other affiliated funds participate in a $350,000,000 committed unsecured revolving line of credit and a $150,000,000 uncommitted, unsecured line of credit, both provided by State Street. Borrowings are used for temporary or emergency purposes to facilitate portfolio liquidity.
Interest on the committed line of credit is charged to each participating fund based on the fund’s borrowings at a rate per annum equal to the Federal Funds Rate plus 0.50%. In addition, a commitment fee of 0.10% per annum is accrued
24
Columbia Greater China Fund
August 31, 2007
and apportioned among the participating funds based on their pro-rata portion of the unutilized committed line of credit. Interest on the uncommitted line of credit is charged to each participating fund based on the fund’s borrowings at a variable rate per annum equal to the Federal Funds Rate plus a spread, as determined and quoted by State Street at the time of the request for a loan. A one-time structuring fee of $30,000 is also accrued and apportioned to each fund participating in the uncommitted line of credit based on the average net assets of the participating funds. In addition, if the uncommitted line of credit is extended for an additional period, an annual administration fee of $15,000 will be charged and apportioned among the participating funds. The commitment fee and structuring fee are included in “Other expenses” in the Statement of Operations.
For the year ended August 31, 2007, the average daily loan balance outstanding on days where borrowings existed was $1,384,615 at a weighted average interest rate of 5.86%.
Note 8. Shares of Beneficial Interest
As of August 31, 2007 the Fund had one shareholder that held 5.2% of the Fund’s shares outstanding. These shares were beneficially owned by participant accounts over which BOA and/or its affiliates had either sole or joint investment discretion. Subscription and redemption activity of these accounts may have a significant effect on the operations of the Fund.
As of August 31, 2007, the Fund had two shareholders that held 18.5% of the Fund’s shares outstanding over which BOA and/or its affiliates did not have investment discretion. Subscription and redemption activity of these accounts may have a significant effect on the operations of the Fund.
Note 9. Disclosure of Significant Risks and Contingencies
Foreign Securities
There are certain additional risks involved when investing in foreign securities that are not inherent with investments in domestic securities. These risks may involve foreign currency exchange rate fluctuations, adverse political and economic developments and the possible prevention of currency exchange or other foreign governmental laws or restrictions. In addition, the liquidity of foreign securities may be more limited than that of domestic securities.
Investments in emerging market countries are subject to additional risk. The risk of foreign investments is typically increased in less developed countries. These countries are also more likely to experience high levels of inflation, deflation or currency devaluation which could hurt their economies and securities markets.
Geographic Concentration
Because the Fund’s investments are concentrated in the Greater China Region, events within the region will have a greater effect on the Fund than if the Fund were more geographically diversified. In addition, events in any one country within the region may impact the other countries or the region as a whole. Markets in the region can experience significant volatility due to social, regulatory and political uncertainties.
Sector Focus
The Fund may focus its investments in certain sectors, subjecting it to greater risk than a fund that is less concentrated.
As a non-diversified mutual fund, the Fund is allowed to invest a greater percentage of its total assets in the securities of fewer issuers than a “diversified” fund. The Fund may, therefore, have a greater risk of loss from a few issuers than a similar fund that invests more broadly.
Legal Proceedings
On February 9, 2005, Columbia Management Advisors, Inc. (which has since merged into Banc of America Capital Management, LLC (now named Columbia Management Advisors, LLC)) (“Columbia”) and Columbia Funds Distributor, Inc. (which has been renamed Columbia Management Distributors, Inc.) (the “Distributor”) (collectively, the “Columbia Group”) entered into an Assurance of Discontinuance with the New York Attorney General (“NYAG”) (the “NYAG Settlement”) and consented to the entry of a cease-and-desist order by the Securities and Exchange Commission (“SEC”) (the “SEC Order”) on matters relating to mutual fund trading.
Under the terms of the SEC Order, the Columbia Group agreed, among other things, to: pay $70 million in disgorgement and $70 million in civil money penalties; cease and desist from violations of the antifraud provisions and certain other provisions of the federal securities laws; maintain certain compliance and ethics oversight structures; retain an independent consultant to review the Columbia Group’s applicable supervisory, compliance, control and other policies and procedures; and retain an independent distribution consultant (see below). The Columbia Funds have also voluntarily undertaken to implement certain
25
Columbia Greater China Fund
August 31, 2007
governance measures designed to maintain the independence of their boards of trustees. The NYAG Settlement also, among other things, requires Columbia and its affiliates to reduce management fees for certain Columbia Funds (including the former Nations Funds) and other mutual funds collectively by $32 million per year for five years, for a projected total of $160 million in management fee reductions.
Pursuant to the procedures set forth in the SEC Order, the $140 million in settlement amounts described above is being distributed in accordance with a distribution plan that was developed by an independent distribution consultant and approved by the SEC on April 6, 2007. Distributions under the distribution plan began in late June 2007.
A copy of the SEC Order is available on the SEC website at http://www.sec.gov. A copy of the NYAG Settlement is available as part of the Bank of America Corporation Form 8-K filing on February 10, 2005.
In connection with the events described above, various parties have filed suit against certain funds, the Trustees of the Columbia Funds, FleetBoston Financial Corporation and its affiliated entities and/or Bank of America and its affiliated entities.
On February 20, 2004, the Judicial Panel on Multidistrict Litigation transferred these cases and cases against other mutual fund companies based on similar allegations to the United States District Court in Maryland for consolidated or coordinated pretrial proceedings (the “MDL”). Subsequently, additional related cases were transferred to the MDL. On September 29, 2004, the plaintiffs in the MDL filed amended and consolidated complaints. One of these amended complaints is a putative class action that includes claims under the federal securities laws and state common law, and that names Columbia, the Distributor, the Trustees of the Columbia Funds, Bank of America Corporation and others as defendants. Another of the amended complaints is a derivative action purportedly on behalf of the Columbia Funds that asserts claims under federal securities laws and state common law.
On February 25, 2005, Columbia and other defendants filed motions to dismiss the claims in the pending cases. On March 1, 2006, for reasons stated in the court’s memoranda dated November 3, 2005, the U.S. District Court for the District of Maryland granted in part and denied in part the defendants’ motions to dismiss. The court dismissed all of the class action claims pending against the Columbia Funds Trusts. As to Columbia and the Distributor, the claims under the Securities Act of 1933, the claims under Sections 34(b) and 36(a) of the Investment Company Act of 1940 (“ICA”) and the state law claims were dismissed. The claims under Sections 10(b) and 20(a) of the Securities Exchange Act of 1934 and claims under Section 36(b) of the ICA were not dismissed.
On March 21, 2005, a purported class action was filed in Massachusetts state court alleging that certain conduct, including market timing, entitled Class B shareholders in certain Columbia funds to an exemption from contingent deferred sales charges upon early redemption (“the CDSC Lawsuit”). The CDSC Lawsuit was removed to federal court in Massachusetts and transferred to the MDL.
On September 14, 2007, the plaintiffs and the Columbia defendants named in the MDL, including the Columbia Funds, entered into a stipulation of settlement with respect to all Columbia-related claims in the MDL described above, including the CDSC Lawsuit. The settlement is subject to court approval.
In 2004, the Columbia Funds’ adviser and distributor and certain affiliated entities and individuals were named as defendants in certain purported shareholder class and derivative actions making claims, including claims under the Investment Company and the Investment Advisers Acts of 1940 and state law. Certain Columbia Funds were named as nominal defendants. The suits allege, inter alia, that the fees and expenses paid by the funds are excessive and that the advisers and their affiliates inappropriately used fund assets to distribute the funds and for other improper purposes. On March 2, 2005, the actions were consolidated in the Massachusetts federal court as In re Columbia Entities Litigation. The plaintiffs filed a consolidated amended complaint on June 9, 2005. On November 30, 2005, the judge dismissed all claims by plaintiffs and entered final judgment in favor of the defendants. The plaintiffs appealed to the United States Court of Appeals for the First Circuit on December 30, 2005. A stipulation and settlement agreement dated January 19, 2007 was filed in the First Circuit on February 14, 2007, with a joint stipulation of dismissal and motion for remand to obtain district court approval of the settlement. That joint motion was granted and the appeal was dismissed. On March 6, 2007, the case was remanded to the District Court. On September 18, 2007, the District Court approved the settlement, to be effective following the expiration of the appeal period. The funds’ adviser and/or its affiliates will be required, pursuant to the settlement, to make certain payments including plaintiffs’ attorneys’ fees and costs of notice to class members.
26
Report of Independent Registered Public Accounting Firm
To the Trustees of the Columbia Funds Series Trust I and the Shareholders of Columbia Greater China Fund
In our opinion, the accompanying statement of assets and liabilities, including the investment portfolio and the related statements of operations and of changes in net assets and the financial highlights present fairly, in all material respects, the financial position of Columbia Greater China Fund (the “Fund”) (a series of Columbia Funds Series Trust I), at August 31, 2007, the results of its operations for the year then ended, the changes in its net assets for each of the two years in the period then ended and the financial highlights for each of the five years in the period then ended, in conformity with accounting principles generally accepted in the United States of America. These financial statements and financial highlights (hereafter referred to as “financial statements”) are the responsibility of the Fund’s management; our responsibility is to express an opinion on these financial statements based on our audits. We conducted our audits of these financial statements in accordance with the standards of the Public Company Accounting Oversight Board (United States). Those standards require that we plan and perform the audits to obtain reasonable assurance about whether the financial statements are free of material misstatement. An audit includes examining, on a test basis, evidence supporting the amounts and disclosures in the financial statements, assessing the accounting principles used and significant estimates made by management, and evaluating the overall financial statement presentation. We believe that our audits, which included confirmation of securities at August 31, 2007 by correspondence with the custodian and brokers, provide a reasonable basis for our opinion.
PricewaterhouseCoopers LLP
Boston, Massachusetts
October 26, 2007
27
Unaudited Information – Columbia Greater China Fund
Federal Income Tax Information
Foreign taxes paid during the fiscal year ended August 31, 2007, amounting to $51,427 ($0.01 per share) are expected to be passed through to shareholders as 100% allowable foreign tax credits on Form 1099-DIV for the year ending August 31, 2007.
Gross income derived from sources within foreign countries amounted to $4,780,483 ($0.88 per share) for the fiscal year ended August 31, 2007.
For non-corporate shareholders, 87.17% or the maximum amount allowable under the Jobs and Growth Tax Relief Reconciliation Act of 2003, of income earned by the fund for the period September 1, 2006 to August 31, 2007 may represent qualified dividend income. Final information will be provided in your 2007 Form 1099-DIV.
28
Fund Governance
The Trustees serve terms of indefinite duration. The names, addresses and ages of the Trustees and officers of the Funds in Columbia Funds Series Trust I, the year each was first elected or appointed to office, their principal business occupations during at least the last five years, the number of portfolios overseen by each Trustee and other directorships they hold are shown below. Each officer listed below serves as an officer of each Fund in the Columbia Funds Complex.
Independent Trustees
| | |
Name, address and year of birth,
Position with funds, Year first
elected or appointed to office1 | | Principal occupation(s) during past five years, Number of portfolios in Columbia Funds
Complex overseen by trustee, Other directorships held |
| |
| Douglas A. Hacker (Born 1955) | | |
c/o Columbia Management Advisors, LLC
One Financial Center Boston, MA 02111
Trustee (since 1996) | | Independent business executive since May, 2006; Executive Vice President-Strategy of United Airlines (airline) from December, 2002 to May, 2006; President of UAL Loyalty Services (airline marketing company) from September, 2001 to December, 2002; Executive Vice President and Chief Financial Officer of United Airlines from July, 1999 to September, 2001. Oversees 68, Nash Finch Company (food distributor); Aircastle Limited (aircraft leasing) |
| |
| Janet Langford Kelly (Born 1957) | | |
c/o Columbia Management Advisors, LLC
One Financial Center Boston, MA 02111
Trustee (since 1996) | | Senior Vice President, General Counsel and Corporate Secretary, ConocoPhillips (integrated energy company) since September, 2007; Deputy General Counsel–Corporate Legal Services, ConocoPhillips from August, 2006 to August, 2007; Partner, Zelle, Hofmann, Voelbel, Mason & Gette LLP (law firm) from March, 2005 to July, 2006; Adjunct Professor of Law, Northwestern University, from September, 2004 to June, 2006, Director, UAL Corporation (airline) from February, 2006 to July, 2006; Chief Administrative Officer and Senior Vice President, Kmart Holding Corporation (consumer goods), from September, 2003 to March, 2004; Executive Vice President-Corporate Development and Administration, General Counsel and Secretary, Kellogg Company (food manufacturer), from September, 1999 to August, 2003. Oversees 68, None |
| |
| Richard W. Lowry (Born 1936) | | |
c/o Columbia Management Advisors, LLC
One Financial Center Boston, MA 02111
Trustee (since 1995) | | Private Investor since August, 1987 (formerly Chairman and Chief Executive Officer, U.S. Plywood Corporation (building products manufacturer) until 1987). Oversees 68, Liberty All-Star Equity Fund and Liberty All-Star Growth Fund, Inc. (closed-end funds) |
| |
| Charles R. Nelson (Born 1942) | | |
c/o Columbia Management Advisors, LLC
One Financial Center Boston, MA 02111
Trustee (since 1981) | | Professor of Economics, University of Washington, since January, 1976; Ford and Louisa Van Voorhis Professor of Political Economy, University of Washington, since September, 1993; Director, Institute for Economic Research, University of Washington from September, 2001 to June, 2003; Adjunct Professor of Statistics, University of Washington, since September, 1980; Associate Editor, Journal of Money Credit and Banking, since September, 1993; Consultant on econometric and statistical matters. Oversees 68, None |
1 | In December 2000, the boards of each of the former Liberty Funds and former Stein Roe Funds were combined into one board of trustees responsible for the oversight of both fund groups (collectively, the “Liberty Board”). In October 2003, the trustees on the Liberty Board were elected to the boards of the Columbia Funds (the “Columbia Board”) and of the CMG Fund Trust (the “CMG Funds Board”); simultaneous with that election, Patrick J. Simpson who had been a director on the Columbia Board and trustee on the CMG Funds Board, was appointed to serve as trustee of the Liberty Board. The date shown is the earliest date on which a trustee/director was elected or appointed to the board of a Fund in the Columbia Funds Complex. |
29
Fund Governance (continued)
| | |
Name, address and year of birth,
Position with funds, Year first
elected or appointed to office1 | | Principal occupation(s) during past five years, Number of portfolios in Columbia Funds
Complex overseen by trustee, Other directorships held |
| |
| John J. Neuhauser (Born 1943) | | |
c/o Columbia Management Advisors, LLC
One Financial Center Boston, MA 02111
Trustee (since 1985) | | President, St. Michaels College, since August, 2007; University Professor, Boston College from November, 2005 to August, 2007; Academic Vice President and Dean of Faculties, Boston College from August, 1999 to October, 2005. Oversees 68, Liberty All-Star Equity Fund and Liberty All-Star Growth Fund, Inc. (closed-end funds) |
| |
| Patrick J. Simpson (Born 1944) | | |
c/o Columbia Management Advisors, LLC
One Financial Center Boston, MA 02111
Trustee (since 2000) | | Partner, Perkins Coie LLP (law firm). Oversees 68, None |
| |
| Thomas E. Stitzel (Born 1936) | | |
c/o Columbia Management Advisors, LLC
One Financial Center Boston, MA 02111
Trustee (since 1998) | | Business Consultant since 1999; Chartered Financial Analyst. Oversees 68, None |
| |
| Thomas C. Theobald (Born 1937) | | |
c/o Columbia Management Advisors, LLC
One Financial Center Boston, MA 02111
Trustee and Chairman of the Board2 (since 1996) | | Partner and Senior Advisor, Chicago Growth Partners (private equity investing) since September, 2004; Managing Director, William Blair Capital Partners (private equity investing) from September, 1994 to September, 2004. Oversees 68, Anixter International (network support equipment distributor); Ventas, Inc. (real estate investment trust); Jones Lang LaSalle (real estate management services); Ambac Financial Group (financial guaranty insurance) |
| |
| Anne-Lee Verville (Born 1945) | | |
c/o Columbia Management Advisors, LLC
One Financial Center Boston, MA 02111
Trustee (since 1998) | | Retired since 1997 (formerly General Manager, Global Education Industry, IBM Corporation (computer and technology) from 1994 to 1997). Oversees 68, None |
Interested Trustees
| | |
| |
| William E. Mayer (Born 1940) | | |
c/o Columbia Management Advisors, LLC
One Financial Center Boston, MA 02111
Trustee3 (since 1994) | | Partner, Park Avenue Equity Partners (private equity) since February, 1999; Dean and Professor, College of Business, University of Maryland, 1992 to 1997. Oversees 68, Lee Enterprises (print media), WR Hambrecht + Co. (financial service provider); Reader’s Digest (publishing) |
2 | Mr. Theobald was appointed as Chairman of the Board effective December 10, 2003. |
3 | Mr. Mayer is an “interested person” (as defined in the Investment Company Act of 1940) by reason of his affiliation with WR Hambrecht + Co. |
The Statement of Additional Information includes additional information about the Trustees of the Funds and is available, without charge, upon request by calling 1-800-345-6611.
30
Fund Governance (continued)
Officers
| | |
Name, address and year of birth,
Position with Columbia Funds, Year
first elected or appointed to office | | Principal occupation(s) during past five years |
| |
| Christopher L. Wilson (Born 1957) | | |
One Financial Center
Boston, MA 02111
President (since 2004) | | President–Columbia Funds, since October 2004; Managing Director–Columbia Management Advisors, LLC, since September 2005; Senior Vice President–Columbia Management Distributors, Inc., since January 2005; Director–Columbia Management Services, Inc., since January 2005; Director–Bank of America Global Liquidity Funds, plc and Banc of America Capital Management (Ireland), Limited, since May 2005; Director–FIM Funding, Inc., since January 2005; President and Chief Executive Officer–CDC IXIS AM Services, Inc. (investment management), from September 1998 through August 2004; and a senior officer or director of various other Bank of America-affiliated entities, including other registered and unregistered funds. |
|
| James R. Bordewick, Jr. (Born 1959) |
One Financial Center
Boston, MA 02111
Senior Vice President, Secretary
and Chief Legal Officer (since 2006) | | Associate General Counsel, Bank of America since April, 2005; Senior Vice President and Associate General Counsel, MFS Investment Management (investment management) prior to April, 2005. |
| |
| J. Kevin Connaughton (Born 1964) | | |
One Financial Center
Boston, MA 02111
Senior Vice President, Chief Financial Officer and Treasurer (since 2000) | | Treasurer–Columbia Funds, since October 2003; Treasurer–the Liberty Funds, Stein Roe Funds and Liberty All-Star Funds, December 2000–December 2006; Vice President–Columbia Management Advisors, Inc., since April 2003; President–Columbia Funds, Liberty Funds and Stein Roe Funds, February 2004 to October 2004; Treasurer–Galaxy Funds, September 2002 to December 2005; Treasurer, December 2002 to December 2004, and President, February 2004 to December 2004–Columbia Management Multi-Strategy Hedge Fund, LLC; and a senior officer of various other Bank of America-affiliated entities, including other registered and unregistered funds. |
| |
| Linda J. Wondrack (Born 1964) | | |
One Financial Center
Boston, MA 02111
Senior Vice President, Chief Compliance Officer (since 2007) | | Director (Columbia Management Group LLC and Investment Product Group Compliance), Bank of America since June 2005; Director of Corporate Compliance and Conflicts Officer, MFS Investment Management (investment management), August 2004 to May 2005; Managing Director, Deutsche Asset Management (investment management) prior to August 2004. |
| |
| Michael G. Clarke (Born 1969) | | |
One Financial Center
Boston, MA 02111
Chief Accounting Officer and Assistant Treasurer (since 2004) | | Director of Fund Administration of the Advisor since January, 2006; Managing Director of the Advisor September, 2004 to December, 2005; Vice President Fund Administration of the Advisor June, 2002 to September, 2004. Vice President Product Strategy and Development of the Advisor from February, 2001 to June, 2002. |
| |
| Jeffrey R. Coleman (Born 1969) | | |
One Financial Center
Boston, MA 02111
Deputy Treasurer (since 2006) | | Director of Fund Administration of the Advisor since January, 2006; Fund Controller of the Advisor from October 2004 to January 2006; Vice President of CDC IXIS Asset Management Services, Inc. (investment management) from August, 2000 to September, 2004. |
31
Fund Governance (continued)
| | |
Name, address and year of birth,
Position with Columbia Funds, Year
first elected or appointed to office | | Principal occupation(s) during past five years |
| |
| Joseph F. DiMaria (Born 1968) | | |
One Financial Center
Boston, MA 02111
Deputy Treasurer (since 2006) | | Director of Fund Administration of the Advisor since January, 2006; Head of Tax/Compliance and Assistant Treasurer of the Advisor from November, 2004 to December, 2005; Director of Trustee Administration (Sarbanes-Oxley) of the Advisor from May, 2003 to October, 2004; Senior Audit Manager, PricewaterhouseCoopers (independent registered public accounting firm) from July, 2000 to April, 2003. |
| |
| Marybeth C. Pilat (Born 1968) | | |
One Financial Center Boston, MA 02111 Deputy Treasurer (since 2007) | | Vice President, Mutual Fund Valuation of the Advisor since January 2006; Vice President, Mutual Fund Accounting Oversight of the Advisor prior to January 2006. |
| |
| Barry S. Vallan (Born 1969) | | |
One Financial Center
Boston, MA 02111
Controller (since 2006) | | Vice President–Fund Treasury of the Advisor since October, 2004; Vice President–Trustee Reporting of the Advisor from April, 2002 to October, 2004; Management Consultant, PricewaterhouseCoopers (independent registered public accounting firm) prior to October, 2002. |
32
Important Information About This Report
Columbia Greater China Fund
Transfer Agent
Columbia Management Services, Inc.
P.O. Box 8081
Boston, MA 02266-8081
1-800-345-6611
Distributor
Columbia Management
Distributors, Inc.
One Financial Center
Boston, MA 02111
Investment Advisor
Columbia Management Advisors, LLC
100 Federal Street
Boston, MA 02110
The fund mails one shareholder report to each shareholder address. If you would like more than one report, please call shareholder services at 1-800-345-6611 and additional reports will be sent to you. This report has been prepared for shareholders of Columbia Greater China Fund.
A description of the policies and procedures that the fund uses to determine how to vote proxies and a copy of the fund’s voting records are available (i) at www.columbiamanagement.com; (ii) on the Securities and Exchange Commission’s website at www.sec.gov, and (iii) without charge, upon request, by calling 1-800-368-0346. Information regarding how the fund voted proxies relating to portfolio securities during the 12-month period ended June 30 is available from the SEC’s website. Information regarding how the fund voted proxies relating to portfolio securities is also available from the fund’s website.
The fund files a complete schedule of portfolio holdings with the SEC for the first and third quarters of each fiscal year on Form N-Q. The fund’s Form N-Q is available on the SEC’s website at www.sec.gov and may be reviewed and copied at the SEC’s Public Reference Room in Washington, D.C. Information on the operation of the Public Reference Room may be obtained by calling 1-800-SEC-0330.
Please consider the investment objectives, risks, charges and expenses for the fund carefully before investing. Contact your financial advisor for a prospectus, which contains this and other important information about the fund. You should read it carefully before you invest.
Columbia Management Group, LLC (“Columbia Management”) is the investment management division of Bank of America Corporation. Columbia Management entities furnish investment management services and products for institutional and individual investors. Columbia Funds are distributed by Columbia Management Distributors, Inc., member of FINRA, SIPC, part of Columbia Management and an affiliate of Bank of America Corporation.
33
Columbia Greater China Fund
Annual Report – August 31, 2007
©2007 Columbia Management Distributors, Inc.
One Financial Center, Boston, MA 02111-2621
800-345-6611 www.columbiafunds.com
SHC-42/135404-0807 (10/07) 07/44725

Columbia Federal Securities Fund
Annual Report – August 31, 2007
| | |
| NOT FDIC INSURED | | May Lose Value |
| NOT BANK ISSUED | | No Bank Guarantee |
Table of Contents
The views expressed in this report reflect the current views of the respective parties. These views are not guarantees of future performance and involve certain risks, uncertainties and assumptions that are difficult to predict so actual outcomes and results may differ significantly from the views expressed. These views are subject to change at any time based upon economic, market or other conditions and the respective parties disclaim any responsibility to update such views. These views may not be relied on as investment advice and, because investment decisions for a Columbia Fund are based on numerous factors, may not be relied on as an indication of trading intent on behalf of any particular Columbia Fund. References to specific company securities should not be construed as a recommendation or investment advice.
President’s Message – Columbia Federal Securities Fund

Dear Shareholder:
Every six months, you receive a shareholder report for your Columbia Funds investment. We strive to bring you the information you need to make intelligent, informed investment decisions, in an attractive, easy-to-understand format.
We know that for many investors, the information contained in shareholder reports can seem very technical, so we would like to take this opportunity to walk you through some of the sections in the beginning of your shareholder report, explain their purpose and point out some of the highlights we think you’ll find useful. In future reports, we will discuss how to use the financial statements in your shareholder reports.
Performance Information
One of the first sections in your shareholder report is the Performance Information section, which contains several tables that illustrate how your fund has performed over time. These tables can be very useful for evaluating how your fund has performed versus its benchmark, though it’s important to remember that past performance is not an indicator of future results.
Understanding Your Expenses
This section explains the ongoing costs associated with your Columbia Funds investment. It includes both general information about mutual fund expenses and specific information pertinent to your fund.
You can use the information to estimate the expenses you paid over the reporting period. You will need your account balance at the end of the period, which can be found by checking your most recent account statement, logging onto your account at www.columbiafunds.com, calling our service center at 800.345.6611 or contacting your financial advisor. Once you have your balance, the section explains how to calculate your estimated expenses step by step.
Portfolio Manager’s Report
The Portfolio Manager’s Report is where you will find your portfolio manager’s thoughts on what happened during the reporting period. Commentary from your portfolio manager(s) includes a summary of the fund’s performance, along with a comparison of the fund’s performance versus the relevant peer group and benchmark indices.
The portfolio manager will also discuss market conditions that impacted the fund, as well as the investment strategy during the period. Please note: In semiannual reports, the portfolio manager’s comments are included in the Fund Profile section.
Other Information
Every shareholder report includes a page containing “Important Information About This Report,” which includes instructions for requesting additional copies of the shareholder report, as well as contact information for the fund’s Transfer Agent, Distributor and Investment Advisor.
Annual reports contain additional information, such as an independent registered public accounting firm’s report and biographies of the fund’s trustees and officers. This information is not included in semiannual reports.
Shareholder reports can be delivered to you electronically through our eDelivery service. Using eDelivery can help your fund save money while at the same time preserve precious natural resources. For even more information about your fund, visit our Web site at www.columbiafunds.com. There you will find prospectuses, shareholder reports and fund fact sheets for all of the funds in the Columbia Funds family.
We hope this guide to your shareholder report will help you get the most out of this important resource. Thank you for your business, and for your continued confidence in Columbia Funds.
Sincerely,

Christopher L. Wilson
President, Columbia Funds
Fund Profile – Columbia Federal Securities Fund
Performance data quoted represents past performance and current performance may be lower or higher. Past performance is no guarantee of future results. The investment return and principal value will fluctuate so that shares, when redeemed, may be worth more or less than the original cost. Please visit www.columbiafunds.com for daily and most recent month-end performance updates.
Summary
1 year return as of 08/31/2007
| | |
| |
 | | +3.73% Class A shares (without sales charge) |
| |
| | +5.57% Citigroup Government/Mortgage Index |
Morningstar Style Box
Duration
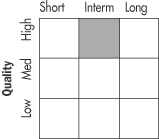
Summary
| n | | For the 12-month period ended August 31, 2007, the fund’s Class A shares returned 3.73% without sales charge. |
n | | The fund’s return was lower than the return of its benchmark, the Citigroup Government/Mortgage Index1, and the average return of its peer group, the Lipper General U.S. Government Funds Classification2. |
| n | | We believe that the fund’s relative performance was hurt by its above-index weight to mortgage-backed securities, which underperformed Treasurys during the period. |
Portfolio Management
Jonathan P. Carlson has managed Columbia Federal Securities Fund since June 2007 and has been with the advisor since June 2007.
1 | The Citigroup Government/Mortgage Index is a combination of the Citigroup U.S. Government Index and the Citigroup Mortgage Index. The Government Index tracks the performance of the Treasury and government-sponsored indices within the U.S. Broad Investment Grade (BIG) Bond Index. The Mortgage Index tracks the performance of the mortgage component of the BIG Bond Index, comprising 30- and 15-year GNMA, FNMA and FHLMC pass-throughs and FNMA and FHLMC balloon mortgages. Indices are not investments, do not incur fees or expenses and are not professionally managed. It is not possible to invest directly in an index. Securities in the fund may not match those in an index. |
2 | Lipper Inc., a widely respected data provider in the industry, calculates an average total return (assuming reinvestment of distributions) for mutual funds with investment objectives similar to those of the fund. Lipper makes no adjustment for the effect of sales loads. |
The Morningstar Style Box™ reveals a fund’s investment strategy. For equity funds the vertical axis shows the market capitalization of the stocks owned and the horizontal axis shows a fund’s investment style (value, blend or growth). For fixed-income funds the vertical axis shows the average credit quality of the bonds owned, and the horizontal axis shows interest rate sensitivity as measured by a bond’s duration (short, intermediate or long). All of these numbers are drawn from the data most recently provided by the fund and entered into Morningstar’s database as of month-end. Although the data is gathered from reliable sources, Morningstar cannot guarantee completeness and accuracy. Information shown is as of 06/30/2007.
1
Portfolio Management
Economic Update – Columbia Federal Securities Fund
Summary
For the 12-month period that ended August 31, 2007
| | n | | Despite volatility, the Lehman Brothers U.S. Aggregate Bond Index delivered a respectable return. High-yield bonds, as measured by the Merrill Lynch U.S. High Yield, Cash Pay Index, led the US fixed-income markets. | |
| | |
Lehman
Index | | Merrill Lynch Index |
| |

| |
|
5.26% | | 6.45% |
| | n | | The broad US stock market, as measured by the S&P 500 Index, returned 15.13%. Stock markets outside the United States were even stronger, as measured by the MSCI EAFE Index. | |
| | |
| S&P Index | | MSCI Index |
| |
| |
|
15.13% | | 18.71% |
The Lehman Brothers U.S. Aggregate Bond Index is a market value-weighted index that tracks the daily price, coupon, pay-downs, and total return performance of fixed-rate, publicly placed, dollar denominated, and non-convertible investment grade debt issues with at least $250 million par amount outstanding and with at least one year to final maturity.
The Merrill Lynch U.S. High Yield, Cash Pay Index tracks the performance of non-investment-grade corporate bonds.
The S&P 500 Index tracks the performance of 500 widely held, large-capitalization US stocks.
The Morgan Stanley Capital International (MSCI) Europe, Australasia, Far East (EAFE) Index is a free float-adjusted market capitalization index that is designed to measure developed market equity performance, excluding the US and Canada.
Indices are not investments, do not incur fees or expenses and are not professionally managed. It is not possible to invest directly in an index.
Despite an uptick early in 2007, the US economy experienced subpar growth for most of the 12-month period that began September 1, 2006 and ended August 31, 2007. An already fragile housing sector struggled to withstand turmoil in the subprime mortgage market, which issues loans to homebuyers with questionable credit records and/or little money for down payments. Rising delinquencies and foreclosures put additional pressure on home sales and triggered a credit crunch that reverberated through global markets. Rising energy prices pinched household budgets and higher industrial metals prices drove up manufacturing costs. Job growth sagged during the early summer months. Consumer spending growth tracked lower in the final months of the period, and consumer confidence retreated from a six-year high.
In mid-August, the Federal Reserve Board (the Fed) stepped in to quiet the credit markets with a cut to its primary discount rate — the rate at which the Fed loans money to member banks. As the period ended, the Fed was expected to cut another key short-term rate — the federal funds rate — to further loosen the reins on credit and inspire confidence, both at home and abroad.
Bonds delivered respectable gains
The US bond market seesawed during the 12-month period. Early in the period, as investors anticipated a Fed rate cut, bond prices rose and yields declined across the maturity spectrum. However, a rate cut became less likely when the economy perked up in the second quarter of 2007, sending bond prices lower while yields rose. Then, in the final months of the period, yields fell and higher quality bond prices rose as investors retreated from riskier investments to the safety of the US Treasury market. The benchmark 10-year US Treasury yield ended the period at 4.53% — lower than a year ago. In this environment, the Lehman Brothers U.S. Aggregate Bond Index returned a respectable 5.26%. High-yield bonds continued to lead the fixed-income markets. However, their gains were cut short near the end of the period. The Merrill Lynch U.S. High Yield, Cash Pay Index returned 6.45%.
Despite volatility, stocks advanced broadly
Against a shifting economic backdrop, corporate profits were better than expected in the first half of 2007 and the US stock market staged a broad rally that took all major stock market averages higher for the 12-month period. However, the volatility that rocked the credit markets midway through the summer spilled over to the stock market and claimed some of its earlier gains. The S&P 500 Index returned 15.13%. Large- and mid-cap stocks outperformed small-cap stocks, as measured by their respective Russell indices1. Growth stocks outperformed value stocks by a significant margin. Generally speaking, foreign stock markets outperformed the US market. The Morgan Stanley Capital International EAFE Index, a broad measure of stock market performance in developed countries, returned 18.71% for the period.
1 | The Russell 1000 Index tracks the performance of 1,000 of the largest US companies, based on market capitalization. The Russell Midcap Growth Index measures the performance of those Russell Midcap companies with higher price-to-book ratios and higher forecasted growth values. The Russell 2000 Index tracks the performance of the 2,000 smallest of the 3,000 largest US companies based on market capitalization. Indices are not investments, do not incur fees or expenses and are not professionally managed. It is not possible to invest directly in an index. |
2
Performance Information – Columbia Federal Securities Fund
|
| Growth of a $10,000 investment 09/01/97 – 08/31/07 |
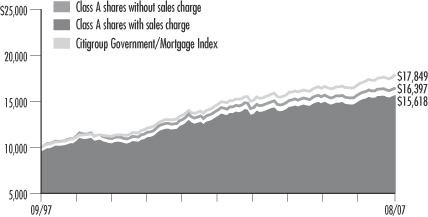
The chart above shows the growth in value of a hypothetical $10,000 investment in Class A shares of Columbia Federal Securities Fund during the stated time period, and does not reflect the deduction of taxes that a shareholder may pay on fund distributions or the redemption of fund shares. The Citigroup Government/Mortgage Index is a combination of the Citigroup U.S. Government Index and the Citigroup Mortgage Index. The Government Index tracks the performance of the Treasury and government-sponsored indices within the U.S. Broad Investment Grade (BIG) Bond Index. The Mortgage Index tracks the performance of the mortgage component of the BIG Bond Index, comprising 30- and 15-year GNMA, FNMA and FHLMC pass-throughs and FNMA and FHLMC balloon mortgages. Indices are not investments, do not incur fees or expenses and are not professionally managed. It is not possible to invest directly in an index. Securities in the fund may not match those in an index.
| | | | |
Performance of a $10,000 investment 09/01/97 – 08/31/07 ($) |
| | |
| Sales charge | | without | | with |
Class A | | 16,397 | | 15,618 |
Class B | | 15,219 | | 15,219 |
Class C | | 15,448 | | 15,448 |
Class Z | | 16,753 | | n/a |
| | | | | | | | | | | | | | |
| Average annual total return as of 08/31/07 (%) |
| | | | |
| Share class | | A | | B | | C | | Z |
| Inception | | 03/30/84 | | 06/08/92 | | 08/01/97 | | 01/11/99 |
| Sales charge | | without | | with | | without | | with | | without | | with | | without |
1- year | | 3.73 | | -1.20 | | 2.96 | | –2.01 | | 3.11 | | 2.12 | | 3.99 |
5- year | | 3.13 | | 2.13 | | 2.36 | | 2.02 | | 2.52 | | 2.52 | | 3.39 |
10- year | | 5.07 | | 4.56 | | 4.29 | | 4.29 | | 4.44 | | 4.44 | | 5.30 |
| | | | | | | | | | | | | | |
| Average annual total return as of 09/30/07 (%) |
| | | | |
| Share class | | A | | B | | C | | Z |
| Sales charge | | without | | with | | without | | with | | without | | with | | without |
1- year | | 3.33 | | -1.58 | | 2.56 | | -2.38 | | 2.72 | | 1.73 | | 3.59 |
5- year | | 2.88 | | 1.88 | | 2.12 | | 1.77 | | 2.27 | | 2.27 | | 3.14 |
10- year | | 4.95 | | 4.44 | | 4.17 | | 4.17 | | 4.32 | | 4.32 | | 5.17 |
Performance data quoted represents past performance and current performance may be lower or higher. Past performance is no guarantee of future results. The investment return and principal value will fluctuate so that shares, when redeemed, may be worth more or less than the original cost. Please visit www.columbiafunds.com for daily and most recent month-end performance updates.
| | |
Annual operating expense
ratio (%)* |
| |
Class A | | 0.98 |
Class B | | 1.73 |
Class C | | 1.73 |
Class Z | | 0.73 |
| * | The annual operating expense ratio is as stated in the fund’s prospectus that is current as of the date of this report. Differences in expense ratios disclosed elsewhere in this report may result from including fee waivers and reimbursements as well as different time periods used in calculating the ratios. |
The “with sales charge” returns include the maximum initial sales charge of 4.75% for Class A shares, the applicable contingent deferred sales charge of 5.00% in the first year, declining to 1.00% in the sixth year, and eliminated thereafter for Class B shares and 1.00% for Class C shares for the first year only. The “without sales charge” returns do not include the effect of sales charges. If they had, returns would be lower.
All results shown assume reinvestment of distributions. Class Z shares are sold at net asset value with no Rule 12b-1 fees. Class Z shares have limited eligibility and the investment minimum requirements may vary. Please see the fund’s prospectus for details. Performance for different share classes will vary based on differences in sales charges and fees associated with each class.
Performance results reflect any waivers or reimbursement of fund expenses by the investment advisor and/or any of its affiliates. Absent these waivers or reimbursement arrangements, performance results would have been lower.
The tables do not reflect the deduction of taxes a shareholder may pay on fund distributions or the redemption of fund shares.
Class Z is a newer class of shares. Class Z share performance information includes returns of the fund’s Class A shares (the oldest existing fund class) for periods prior to the inception of the Class Z shares. These returns have not been adjusted to reflect any difference in expenses (such as Rule 12b-1 fees) between the predecessor shares and the newer class of shares. Had the expense differential been reflected, the returns for the periods prior to the inception of the newer class of shares would have been different. Class A shares were initially offered on March 30, 1984, Class B shares were initially offered on June 8, 1992, Class C shares were initially offered on August 1, 1997 and Class Z shares were initially offered on January 11, 1999.
3
Understanding Your Expenses – Columbia Federal Securities Fund
Estimating your actual expenses
To estimate the expenses that you paid over the period, first you will need your account balance at the end of the period:
| | n | | For shareholders who receive their account statements from Columbia Management Services, Inc., your account balance is available online at www.columbiafunds.com or by calling Shareholder Services at 800.345.6611. | |
| | n | | For shareholders who receive their account statements from their brokerage firm, contact your brokerage firm to obtain your account balance. | |
| | 1. | Divide your ending account balance by $1,000.00. For example, if an account balance was $8,600.00 at the end of the period, the result would be 8.6. | |
| | 2. | In the section of the table below titled “Expenses paid during the period,” locate the amount for your share class. You will find this number in the column labeled “actual.” Multiply this number by the result from step 1. Your answer is an estimate of the expenses you paid on your account during the period. | |
A minimum account balance fee of $20 that is charged once per year may be assessed if the value of your account falls below the minimum initial investment applicable to you. This fee is not included in the accompanying table. If you are subject to the fee, keep it in mind when you are estimating the ongoing expenses of investing in the fund and when comparing the expenses of this fund with other funds.
As a fund shareholder, you incur two types of costs. There are transaction costs, which generally include sales charges on purchases and may include redemption or exchange fees. There are also ongoing costs, which generally include investment advisory fees, Rule 12b-1 fees and other fund expenses. The information on this page is intended to help you understand the ongoing costs of investing in the fund and to compare these costs with the ongoing costs of investing in other mutual funds.
Analyzing your fund’s expenses by share class
To illustrate these ongoing costs, we have provided an example and calculated the expenses paid by investors in each share class during the period. The information in the following table is based on an initial investment of $1,000.00, which is invested at the beginning of the reporting period and held for the entire period. Expense information is calculated two ways and each method provides you with different information. The amount listed in the “actual” column is calculated using the fund’s actual operating expenses and total return for the period. The amount listed in the “hypothetical” column for each share class assumes that the return each year is 5% before expenses and is calculated based on the fund’s actual operating expenses. You should not use the hypothetical account values and expenses to estimate either your actual account balance at the end of the period or the expenses you paid during this reporting period.
Compare with other funds
Since all mutual funds are required to include the same hypothetical calculations about expenses in shareholder reports, you can use this information to compare the ongoing costs of investing in the fund with other funds. To do so, compare the 5% hypothetical example with the 5% hypothetical examples that appear in the shareholder reports of other funds. As you compare hypothetical examples of other funds, it is important to note that hypothetical examples are meant to highlight the ongoing costs of investing in a fund and do not reflect any transaction costs, such as sales charges, redemption fees or exchange fees.
| | | | | | | | | | | | | | |
| 03/01/07 – 08/31/07 | | | | | | | | | | |
| | | | |
| | | Account value at the
beginning of the period | | Account value at the
end of the period ($) | | Expenses paid
during the period ($) | | Fund’s annualized
expense ratio (%) |
| | | Actual | | Hypothetical | | Actual | | Hypothetical | | Actual | | Hypothetical | | Actual |
Class A | | 1,000.00 | | 1,000.00 | | 1,006.10 | | 1,020.32 | | 4.90 | | 4.94 | | 0.97 |
Class B | | 1,000.00 | | 1,000.00 | | 1,002.32 | | 1,016.53 | | 8.68 | | 8.74 | | 1.72 |
Class C | | 1,000.00 | | 1,000.00 | | 1,003.02 | | 1,017.29 | | 7.93 | | 7.98 | | 1.57 |
Class Z | | 1,000.00 | | 1,000.00 | | 1,007.31 | | 1,021.58 | | 3.64 | | 3.67 | | 0.72 |
Expenses paid during the period are equal to the annualized expense ratio for the share class, multiplied by the average account value over the period, then multiplied by the number of days in the fund’s most recent fiscal half-year and divided by 365.
Had the investment advisor and/or any of its affiliates not waived or reimbursed a portion of expenses, account value at the end of the period would have been reduced.
It is important to note that the expense amounts shown in the table are meant to highlight only ongoing costs of investing in the fund and do not reflect any transaction costs, such as sales charges, redemption fees or exchange fees. Therefore, the hypothetical examples provided may not help you determine the relative total costs of owning shares of different funds. If these transaction costs were included, your costs would have been higher.
4
Portfolio Manager’s Report – Columbia Federal Securities Fund
Performance data quoted represents past performance and current performance may be lower or higher. Past performance is no guarantee of future results. The investment return and principal value will fluctuate so that shares, when redeemed, may be worth more or less than the original cost. Please visit www.columbiafunds.com for daily and most recent month-end performance updates.
| | |
| Net asset value per share |
| |
as of 08/31/07 ($) | | |
Class A | | 10.30 |
Class B | | 10.30 |
Class C | | 10.30 |
Class Z | | 10.30 |
| | |
| Distributions declared per share |
| |
09/01/06 – 08/31/07 ($) | | |
Class A | | 0.46 |
Class B | | 0.38 |
Class C | | 0.40 |
Class Z | | 0.49 |
For the 12-month period that ended August 31, 2007, Columbia Federal Securities Fund Class A shares returned 3.73% without sales charge. This was lower than the return of the fund’s benchmark, the Citigroup Government/Mortgage Index1 , which returned 5.57%. The fund also underperformed the average return of its peer group, the Lipper General U.S. Government Funds Classification2, which returned 4.08%. We believe the fund’s above-index weight in mortgage-backed securities generally accounted for its performance shortfall as mortgage-backed securities underperformed Treasurys during the period.
Mortgage-backed securities suffered from subprime contagion
Prices in the mortgage-backed sector of the bond market suffered when investors sold non-Treasury issues to reduce overall risk and offset losses in subprime mortgage-backed bonds, which were hit by a sharp increase in loan delinquencies among less creditworthy home buyers. This negatively affected the fund’s return because the fund held a higher-than-benchmark weight in mortgage-backed securities, which were punished across the board even though the level of credit risk of the fund’s holdings was substantially lower than the extremely high level of risk associated with subprime issues. While the fund itself had minimal exposure to the subprime sector, two of its largest holdings were directly affected: Nomura Asset Acceptance Corp., Japan’s largest brokerage firm, and Suntrust Alternative Loan Trust. We held onto Nomura, which actively reduced its exposure to the US subprime-mortgage market, but we sold Suntrust during the period.
To potentially boost yield and returns, we intend to continue to own a sizable position in mortgage related securities over the long term. However, based on the current market environment, we reduced the fund’s overall position in non-Treasury bonds, including mortgage-backed securities and asset-backed securities. We used the proceeds to purchase short-term Treasurys, which we believe currently have the most attractive risk/return profile in the bond market. Within the fund’s remaining mortgage position — which at 39.5% of the portfolio was its smallest in three years — we have emphasized agency issues, such as Fannie Mae, and higher coupon, longer-maturity issues, such as 30-year mortgage bonds with coupons in the 6.0%-6.5% range. In general, these issues outperformed the lower coupon issues that the fund sold and, thus, this strategy helped bolster returns toward the end of the period.
1 | The Citigroup Government/Mortgage Index is a combination of the Citigroup U.S. Government Index and the Citigroup Mortgage Index. The Government Index tracks the performance of the Treasury and government-sponsored indices within the U.S. Broad Investment Grade (BIG) Bond Index. The Mortgage Index tracks the performance of the mortgage component of the BIG Bond Index, comprising 30- and 15-year GNMA, FNMA and FHLMC pass-throughs and FNMA and FHLMC balloon mortgages. Indices are not investments, do not incur fees or expenses and are not professionally managed. It is not possible to invest directly in an index. Securities in the fund may not match those in an index. |
2 | Lipper Inc., a widely respected data provider in the industry, calculates an average total return (assuming reinvestment of distributions) for mutual funds with investment objectives similar to those of the fund. Lipper makes no adjustment for the effect of sales loads. |
5
Portfolio Manager’s Report (continued) – Columbia Federal Securities Fund
Intermediate positioning and long duration dampened returns
An emphasis on intermediate-term securities hampered the fund’s return during the period when intermediate and longer-term yields rose and prices fell. The fund’s duration was generally longer than both the index and its peers, which also hurt returns slightly overall. Duration is a measure of interest rate sensitivity. We tend to lengthen duration when we believe interest rates will decline. If we are correct, this can boost returns. If, however, rates move upwards and prices decline — as they did during much of the period — a longer duration can hamper performance.
Facing economic uncertainty
With growing market liquidity problems and weaker-than-anticipated economic data, the odds of continued macro-economic weakness in the United States appear to be rising. Against this backdrop, we remain steadfast in our belief that interest rates are more likely to fall than rise over the next year. This view is bolstered by our expectations for a continued benign inflationary picture through the end of 2007. Should the Federal Reserve look poised to cut rates further into 2008, we intend to further lengthen the portfolio’s duration to potentially take advantage of the continued rally in Treasury prices. We also intend to maintain the portfolio’s lower weight in mortgage-backed and asset-backed issues. Once emotion subsides and liquidity returns, we intend to increase the fund’s exposure to these sectors, with an emphasis on what we believe to be attractively valued agency mortgage-backed issues with solid prospects.
Investing in fixed-income securities may involve certain risks, including the credit quality of individual issuers, possible prepayments, market or economic developments and yield and share price fluctuations due to changes in interest rates. When interest rates go up, bond prices typically drop, and vice versa.
| | |
| 30-day SEC yields |
| |
as of 08/31/07 (%) | | |
Class A | | 4.27 |
Class B | | 3.69 |
Class C | | 3.84 |
Class Z | | 4.75 |
The 30-day SEC yields reflect the portfolio’s earning power net of expenses, expressed as an annualized percentage of the public offering price at the end of the period.
| | |
| Average life breakdown |
| |
as of 08/31/07 (%) | | |
0-1 years | | 4.6 |
0-5 years | | 63.3 |
5-10 years | | 10.0 |
10-20 years | | 14.5 |
20+ years | | 7.6 |
Average life is the expected maturity of a bond and is calculated as a percentage of senior securities.
| | |
| Top 5 Sectors |
| |
as of 08/31/07 (%) | | |
Government & Agency Obligations | | 47.5 |
Mortgage-Backed Securities | | 38.3 |
Asset-Backed Securities | | 9.5 |
Collateralized Mortgage Obligations | | 3.7 |
Commercial Mortgage-Backed Securities | | 0.9 |
Table excludes investments in collateral for securities lending and short-term obligation.
| | |
| Holdings discussed in this report |
| |
as of 8/31/07 (%) | | |
Nomura Asset Acceptance Corp. | | 0.3 |
Fannie Mae (multiple pools) | | 24.0 |
Your fund is actively managed and the sector breakdown of its portfolio will change over time. Sector breakdown and holdings discussed are calculated as a percentage of net assets.
6
Investment Portfolio – Columbia Federal Securities Fund
August 31, 2007
Government & Agency Obligations – 47.5%
| | | | | | |
| | | | | Par ($) | | Value ($) |
| U.S. Government Agencies – 4.3% | | | | |
| AID-Israel | | 5.500% 04/26/24 | | 10,000,000 | | 10,271,070 |
| | | |
| Federal Home Loan Bank | | 3.875% 06/14/13 (a) | | 1,750,000 | | 1,662,197 |
| | 5.375% 07/17/09 | | 10,000,000 | | 10,104,340 |
| | | |
| Small Business Administration | | 5.360% 11/01/26 | | 8,839,526 | | 8,839,652 |
| | 7.600% 01/01/12 | | 126,551 | | 128,704 |
| | 8.200% 10/01/11 | | 85,037 | | 86,334 |
| | 8.250% 11/01/11 | | 300,565 | | 305,677 |
| | 8.650% 11/01/14 | | 370,551 | | 383,848 |
| | 8.850% 08/01/11 | | 12,094 | | 12,374 |
| | 9.150% 07/01/11 | | 76,806 | | 78,528 |
| | | | | | |
| | U.S. Government Agencies Total | | | | 31,872,724 |
| | | | | | |
| U.S. Government Obligations – 43.2% | | | | |
| U.S. Treasury Bonds | | 5.500% 08/15/28 (a) | | 52,085,000 | | 56,325,032 |
| | 6.500% 11/15/26 (a)(b) | | 26,944,000 | | 32,364,378 |
| | 6.750% 08/15/26 (a) | | 12,888,000 | | 15,847,201 |
| | 6.875% 08/15/25 (a) | | 3,900,000 | | 4,824,725 |
| | 7.125% 02/15/23 (a) | | 11,619,000 | | 14,468,374 |
| | 7.250% 08/15/22 (a) | | 2,596,000 | | 3,255,545 |
| | 8.750% 08/15/20 (a) | | 11,446,000 | | 15,765,972 |
| | | |
| U.S. Treasury Notes | | 5.000% 02/15/11 (a) | | 78,313,000 | | 80,454,391 |
| | 6.500% 02/15/10 (a) | | 88,643,000 | | 93,317,500 |
| | | |
| U.S. Treasury STRIPS | | (c) 02/15/09 (a) | | 5,500,000 | | 5,185,669 |
| | | | | | |
| | U.S. Government Obligations Total | | | | 321,808,787 |
| | Total Government & Agency Obligations
(Cost of $344,519,287) | | | | 353,681,511 |
| | | | | | |
| Mortgage-Backed Securities – 38.3% | | | | |
| Federal Home Loan Mortgage Corp. | | 5.770% 02/01/18 (d) | | 19,535 | | 19,627 |
| | 6.455% 07/01/19 (d) | | 42,328 | | 42,419 |
| | 6.796% 05/01/18 (d) | | 28,754 | | 28,820 |
| | 7.000% 08/01/29 | | 13 | | 14 |
| | 7.500% 08/01/08 | | 563 | | 564 |
| | 7.500% 10/01/11 | | 10,131 | | 10,365 |
| | 7.500% 03/01/16 | | 10,885 | | 11,106 |
| | 8.000% 12/01/07 | | 112 | | 112 |
| | 8.000% 06/01/09 | | 4,140 | | 4,157 |
| | 8.000% 07/01/09 | | 15,777 | | 16,051 |
| | 8.000% 09/01/09 | | 27,156 | | 27,653 |
| | 8.000% 05/01/10 | | 8,755 | | 8,965 |
| | 8.000% 01/01/11 | | 2,786 | | 2,808 |
| | 8.000% 12/01/11 | | 57,940 | | 58,849 |
| | 8.000% 05/01/16 | | 19,709 | | 19,969 |
| | 8.000% 04/01/17 | | 65,491 | | 68,369 |
| | 8.500% 12/01/07 | | 2,170 | | 2,175 |
See Accompanying Notes to Financial Statements.
7
Columbia Federal Securities Fund
August 31, 2007
Mortgage-Backed Securities (continued)
| | | | | | |
| | | | | Par ($) | | Value ($) |
| | | | | |
Federal Home Loan Mortgage
Corp. (continued) | | 8.500% 01/01/08 | | 373 | | 375 |
| | 8.500% 02/01/08 | | 247 | | 248 |
| | 8.500% 03/01/08 | | 115 | | 117 |
| | 8.500% 10/01/08 | | 676 | | 679 |
| | 8.500% 05/01/09 | | 4,994 | | 5,054 |
| | 8.500% 01/01/10 | | 3,727 | | 3,855 |
| | 8.500% 07/01/10 | | 2,105 | | 2,122 |
| | 8.500% 03/01/17 | | 5,498 | | 5,836 |
| | 8.500% 06/01/17 | | 334 | | 355 |
| | 8.500% 09/01/17 | | 20,979 | | 22,136 |
| | 8.500% 09/01/20 | | 58,389 | | 61,611 |
| | 8.750% 12/01/07 | | 41 | | 41 |
| | 8.750% 05/01/08 | | 189 | | 191 |
| | 8.750% 08/01/08 | | 271 | | 273 |
| | 8.750% 10/01/08 | | 2,810 | | 2,818 |
| | 8.750% 03/01/09 | | 9,169 | | 9,440 |
| | 8.750% 11/01/09 | | 8,793 | | 8,922 |
| | 9.000% 12/01/08 | | 745 | | 757 |
| | 9.000% 05/01/09 | | 15,846 | | 16,075 |
| | 9.000% 06/01/09 | | 909 | | 930 |
| | 9.000% 07/01/09 | | 37,415 | | 38,622 |
| | 9.000% 06/01/11 | | 649 | | 682 |
| | 9.000% 12/01/16 | | 3,906 | | 4,172 |
| | 9.000% 12/01/18 | | 21,235 | | 22,160 |
| | 9.000% 01/01/22 | | 84,560 | | 90,999 |
| | 9.250% 10/01/08 | | 1,024 | | 1,042 |
| | 9.250% 11/01/08 | | 5,033 | | 5,120 |
| | 9.250% 03/01/09 | | 348 | | 349 |
| | 9.250% 01/01/10 | | 38,937 | | 39,606 |
| | 9.250% 03/01/10 | | 12,563 | | 13,128 |
| | 9.250% 07/01/10 | | 827 | | 855 |
| | 9.250% 10/01/10 | | 18,992 | | 19,845 |
| | 9.250% 11/01/10 | | 2,288 | | 2,296 |
| | 9.250% 10/01/19 | | 17,279 | | 18,606 |
| | 9.500% 10/01/08 | | 2,759 | | 2,810 |
| | 9.500% 11/01/08 | | 3,117 | | 3,174 |
| | 9.500% 02/01/09 | | 4,302 | | 4,319 |
| | 9.500% 06/01/09 | | 16,031 | | 16,325 |
| | 9.500% 07/01/09 | | 2,452 | | 2,541 |
| | 9.500% 08/01/09 | | 9,003 | | 9,331 |
| | 9.500% 04/01/11 | | 6,472 | | 6,838 |
| | 9.500% 05/01/12 | | 7,639 | | 8,124 |
| | 9.500% 04/01/16 | | 1,169 | | 1,257 |
| | 9.500% 07/01/16 | | 1,052 | | 1,139 |
| | 9.500% 09/01/16 | | 1,334 | | 1,436 |
| | 9.500% 10/01/16 | | 5,264 | | 5,681 |
| | 9.500% 04/01/18 | | 4,792 | | 4,822 |
| | 9.500% 06/01/20 | | 831 | | 905 |
| | 9.500% 09/01/20 | | 411 | | 444 |
See Accompanying Notes to Financial Statements.
8
Columbia Federal Securities Fund
August 31, 2007
Mortgage-Backed Securities (continued)
| | | | | | |
| | | | | Par ($) | | Value ($) |
| | | | | |
Federal Home Loan Mortgage
Corp. (continued) | | 9.500% 06/01/21 | | 12,362 | | 13,372 |
| | 9.750% 11/01/08 | | 746 | | 762 |
| | 9.750% 12/01/08 | | 6,488 | | 6,631 |
| | 9.750% 04/01/09 | | 7,523 | | 7,688 |
| | 9.750% 09/01/16 | | 8,837 | | 9,573 |
| | 10.000% 09/01/18 | | 1,898 | | 2,065 |
| | 10.000% 11/01/19 | | 41,138 | | 46,038 |
| | 10.250% 06/01/09 | | 1,741 | | 1,829 |
| | 10.250% 09/01/09 | | 5,241 | | 5,448 |
| | 10.250% 10/01/09 | | 14,736 | | 15,094 |
| | 10.250% 06/01/10 | | 24,621 | | 25,835 |
| | 10.250% 10/01/10 | | 10,825 | | 11,088 |
| | 10.250% 08/01/13 | | 10,411 | | 11,154 |
| | 10.250% 11/01/13 | | 5,402 | | 5,534 |
| | 10.500% 09/01/13 | | 763 | | 770 |
| | 10.500% 01/01/16 | | 73,709 | | 81,279 |
| | 10.500% 06/01/17 | | 78,316 | | 85,672 |
| | 10.500% 08/01/19 | | 10,456 | | 10,749 |
| | 10.500% 09/01/19 | | 10,796 | | 11,380 |
| | 10.500% 01/01/20 | | 61,799 | | 69,789 |
| | 10.500% 04/01/21 | | 22,451 | | 23,080 |
| | 11.250% 10/01/09 | | 9,485 | | 10,047 |
| | 11.250% 02/01/10 | | 8,289 | | 8,969 |
| | 11.250% 04/01/11 | | 26,753 | | 29,161 |
| | 11.250% 10/01/12 | | 7,823 | | 8,051 |
| | 11.250% 08/01/13 | | 43,279 | | 45,802 |
| | 11.250% 02/01/15 | | 2,403 | | 2,604 |
| | 11.250% 09/01/15 | | 17,985 | | 18,166 |
| | 11.250% 12/01/15 | | 25,696 | | 28,648 |
| | 11.500% 02/01/15 | | 33,487 | | 36,612 |
| | TBA, | | | | |
| | 6.500% 09/01/37 (e) | | 90,556,000 | | 91,914,340 |
| Federal National Mortgage Association | | 5.474% 07/01/27 (d) | | 23,673 | | 23,852 |
| | 6.000% 12/01/08 | | 395,958 | | 397,136 |
| | 6.000% 01/01/09 | | 329,827 | | 330,808 |
| | 6.000% 01/01/24 | | 266,297 | | 267,538 |
| | 6.000% 02/01/24 | | 130,256 | | 131,186 |
| | 6.000% 03/01/24 | | 969,129 | | 976,043 |
| | 6.000% 04/01/24 | | 773,707 | | 778,913 |
| | 6.000% 05/01/24 | | 252,607 | | 254,409 |
| | 6.000% 08/01/24 | | 68,695 | | 69,185 |
| | 6.000% 01/01/26 | | 4,057 | | 4,087 |
| | 6.000% 03/01/26 | | 66,038 | | 66,497 |
| | 6.000% 04/01/26 | | 3,020 | | 3,041 |
| | 6.000% 05/01/26 | | 7,606 | | 7,658 |
| | 6.500% 12/01/07 | | 193 | | 193 |
| | 6.500% 01/01/09 | | 3,534 | | 3,548 |
| | 6.500% 02/01/09 | | 1,601 | | 1,608 |
See Accompanying Notes to Financial Statements.
9
Columbia Federal Securities Fund
August 31, 2007
Mortgage-Backed Securities (continued)
| | | | | | |
| | | | | Par ($) | | Value ($) |
| | | | | |
| Federal National Mortgage Association (continued) | | 6.500% 06/01/09 | | 1,001 | | 1,012 |
| | 6.500% 08/01/10 | | 12,445 | | 12,639 |
| | 6.500% 12/01/10 | | 902 | | 916 |
| | 6.500% 04/01/11 | | 17,202 | | 17,553 |
| | 6.500% 10/01/22 | | 24,303 | | 24,778 |
| | 6.500% 09/01/25 | | 41,887 | | 42,841 |
| | 6.500% 11/01/25 | | 142,399 | | 145,643 |
| | 6.500% 05/01/26 | | 187,755 | | 192,032 |
| | 6.500% 09/01/28 | | 12,012 | | 12,301 |
| | 6.500% 12/01/28 | | 14,792 | | 15,148 |
| | 6.500% 01/01/29 | | 132,060 | | 135,242 |
| | 6.500% 06/01/29 | | 145,342 | | 148,725 |
| | 6.500% 11/01/36 | | 35,375,579 | | 35,912,563 |
| | 6.565% 07/01/16 | | 4,696,510 | | 4,936,238 |
| | 6.748% 08/01/19 (d) | | 25,016 | | 25,074 |
| | 6.814% 06/01/20 (d) | | 22,107 | | 22,560 |
| | 6.834% 07/01/20 (d) | | 9,924 | | 10,126 |
| | 6.957% 12/01/31 (d) | | 44,426 | | 44,117 |
| | 7.000% 06/01/09 | | 2,776 | | 2,795 |
| | 7.000% 07/01/10 | | 15,490 | | 15,765 |
| | 7.000% 09/01/10 | | 10,029 | | 10,255 |
| | 7.000% 10/01/10 | | 26,118 | | 26,706 |
| | 7.000% 10/01/12 | | 17,841 | | 18,426 |
| | 7.000% 11/01/19 (d) | | 3,062 | | 3,081 |
| | 7.000% 08/01/23 | | 159,356 | | 165,183 |
| | 7.000% 10/01/23 | | 27,941 | | 28,962 |
| | 7.000% 11/01/23 | | 56,506 | | 58,573 |
| | 7.000% 02/01/27 | | 5,762 | | 5,977 |
| | 7.081% 03/01/18 (d) | | 98,629 | | 101,165 |
| | 7.125% 06/01/19 (d) | | 19,736 | | 19,868 |
| | 7.199% 08/01/36 (d) | | 20,774 | | 20,856 |
| | 7.206% 12/01/17 (d) | | 14,900 | | 15,332 |
| | 7.500% 01/01/09 | | 554 | | 557 |
| | 7.500% 05/01/09 | | 365 | | 366 |
| | 7.500% 06/01/09 | | 2,936 | | 2,936 |
| | 7.500% 12/01/09 | | 13,641 | | 13,891 |
| | 7.500% 02/01/10 | | 1,031 | | 1,049 |
| | 7.500% 06/01/10 | | 3,988 | | 4,087 |
| | 7.500% 11/01/11 | | 4,488 | | 4,531 |
| | 7.500% 07/01/13 | | 13,649 | | 14,115 |
| | 7.500% 12/01/14 | | 668 | | 691 |
| | 7.500% 01/01/17 | | 40,064 | | 42,109 |
| | 7.500% 02/01/18 | | 14,922 | | 15,681 |
| | 7.500% 10/01/23 | | 12,389 | | 12,970 |
| | 7.500% 12/01/23 | | 56,744 | | 59,405 |
| | 8.000% 07/01/08 | | 1,258 | | 1,264 |
| | 8.000% 12/01/08 | | 1,692 | | 1,696 |
| | 8.000% 04/01/09 | | 16,114 | | 16,157 |
| | 8.000% 07/01/09 | | 8,981 | | 9,070 |
See Accompanying Notes to Financial Statements.
10
Columbia Federal Securities Fund
August 31, 2007
Mortgage-Backed Securities (continued)
| | | | | | |
| | | | | Par ($) | | Value ($) |
| | | | | |
| Federal National Mortgage Association (continued) | | 8.000% 03/01/13 | | 2,516 | | 2,655 |
| | 8.000% 11/01/15 | | 4,543 | | 4,804 |
| | 8.000% 06/01/25 | | 2,043 | | 2,158 |
| | 8.000% 08/01/27 | | 25,500 | | 26,963 |
| | 8.000% 02/01/30 | | 2,959 | | 3,133 |
| | 8.000% 03/01/30 | | 3,294 | | 3,471 |
| | 8.000% 08/01/30 | | 2,650 | | 2,793 |
| | 8.000% 10/01/30 | | 39,895 | | 42,044 |
| | 8.000% 11/01/30 | | 162,181 | | 170,917 |
| | 8.000% 12/01/30 | | 50,960 | | 53,705 |
| | 8.000% 01/01/31 | | 441,255 | | 467,012 |
| | 8.000% 02/01/31 | | 752 | | 793 |
| | 8.000% 04/01/31 | | 35,955 | | 37,892 |
| | 8.000% 05/01/31 | | 46,562 | | 49,070 |
| | 8.000% 08/01/31 | | 2,240 | | 2,360 |
| | 8.000% 09/01/31 | | 95,144 | | 100,280 |
| | 8.000% 12/01/31 | | 12,880 | | 13,574 |
| | 8.000% 04/01/32 | | 195,162 | | 205,703 |
| | 8.000% 05/01/32 | | 362,553 | | 382,160 |
| | 8.000% 06/01/32 | | 360,912 | | 380,430 |
| | 8.000% 07/01/32 | | 5,956 | | 6,278 |
| | 8.000% 08/01/32 | | 7,138 | | 7,524 |
| | 8.000% 10/01/32 | | 33,770 | | 35,597 |
| | 8.000% 11/01/32 | | 86,443 | | 91,099 |
| | 8.000% 02/01/33 | | 110,276 | | 116,240 |
| | 8.000% 03/01/33 | | 38,815 | | 40,922 |
| | 8.000% 06/01/33 | | 3,093 | | 3,261 |
| | 8.250% 05/01/10 | | 283 | | 284 |
| | 8.500% 02/01/08 | | 1,940 | | 1,947 |
| | 8.500% 11/01/08 | | 886 | | 898 |
| | 8.500% 12/01/08 | | 727 | | 731 |
| | 8.500% 06/01/09 | | 5,947 | | 6,026 |
| | 8.500% 07/01/09 | | 2,521 | | 2,551 |
| | 8.500% 03/01/10 | | 2,578 | | 2,605 |
| | 8.500% 12/01/11 | | 5,563 | | 5,672 |
| | 8.500% 02/01/15 | | 1,798 | | 1,831 |
| | 8.500% 05/01/15 | | 8,118 | | 8,379 |
| | 8.500% 06/01/15 | | 26,674 | | 27,342 |
| | 8.500% 02/01/17 | | 2,393 | | 2,544 |
| | 8.500% 07/01/17 | | 10,064 | | 10,348 |
| | 8.500% 12/01/17 | | 651 | | 656 |
| | 8.500% 09/01/21 | | 26,762 | | 27,518 |
| | 9.000% 03/01/08 | | 479 | | 482 |
| | 9.000% 05/01/08 | | 1,310 | | 1,324 |
| | 9.000% 07/01/08 | | 1,187 | | 1,207 |
| | 9.000% 12/01/08 | | 2,134 | | 2,143 |
| | 9.000% 01/01/09 | | 1,005 | | 1,010 |
| | 9.000% 05/01/09 | | 50,080 | | 50,687 |
| | 9.000% 09/01/09 | | 14,350 | | 14,596 |
See Accompanying Notes to Financial Statements.
11
Columbia Federal Securities Fund
August 31, 2007
Mortgage-Backed Securities (continued)
| | | | | | |
| | | | | Par ($) | | Value ($) |
| | | | | |
| Federal National Mortgage Association (continued) | | 9.000% 12/01/09 | | 13,540 | | 13,820 |
| | 9.000% 04/01/10 | | 1,084 | | 1,121 |
| | 9.000% 05/01/10 | | 1,308 | | 1,320 |
| | 9.000% 06/01/10 | | 4,280 | | 4,353 |
| | 9.000% 11/01/10 | | 377 | | 389 |
| | 9.000% 04/01/11 | | 1,494 | | 1,501 |
| | 9.000% 06/01/11 | | 1,396 | | 1,428 |
| | 9.000% 09/01/13 | | 5,185 | | 5,208 |
| | 9.000% 09/01/14 | | 2,782 | | 2,846 |
| | 9.000% 04/01/15 | | 6,533 | | 6,805 |
| | 9.000% 04/01/16 | | 67,363 | | 69,740 |
| | 9.000% 06/01/16 | | 4,981 | | 5,145 |
| | 9.000% 07/01/16 | | 3,027 | | 3,242 |
| | 9.000% 09/01/16 | | 2,644 | | 2,732 |
| | 9.000% 10/01/16 | | 487 | | 495 |
| | 9.000% 12/01/16 | | 1,144 | | 1,176 |
| | 9.000% 01/01/17 | | 1,788 | | 1,863 |
| | 9.000% 02/01/17 | | 67 | | 69 |
| | 9.000% 05/01/17 | | 450 | | 457 |
| | 9.000% 06/01/17 | | 3,194 | | 3,279 |
| | 9.000% 08/01/17 | | 8,518 | | 8,799 |
| | 9.000% 05/01/18 | | 22,659 | | 23,104 |
| | 9.000% 09/01/19 | | 1,394 | | 1,440 |
| | 9.000% 10/01/19 | | 12,816 | | 13,239 |
| | 9.000% 11/01/19 | | 180 | | 186 |
| | 9.000% 03/01/20 | | 85 | | 86 |
| | 9.000% 07/01/20 | | 1,043 | | 1,061 |
| | 9.000% 08/01/21 | | 122,900 | | 126,956 |
| | 9.000% 06/01/22 | | 2,741 | | 2,855 |
| | 9.000% 09/01/24 | | 17,168 | | 18,504 |
| | 9.500% 12/01/10 | | 3,767 | | 3,841 |
| | 9.500% 03/01/11 | | 218 | | 222 |
| | 9.500% 06/01/15 | | 3,313 | | 3,473 |
| | 9.500% 03/01/16 | | 10,576 | | 10,631 |
| | 9.500% 04/01/16 | | 4,403 | | 4,482 |
| | 9.500% 06/01/16 | | 33,691 | | 33,867 |
| | 9.500% 02/01/17 | | 1,982 | | 2,096 |
| | 9.500% 01/01/19 | | 132,782 | | 142,852 |
| | 9.500% 04/01/20 | | 151,159 | | 163,349 |
| | 9.500% 07/15/21 | | 344,832 | | 375,578 |
| | 9.500% 08/01/21 | | 136,813 | | 150,370 |
| | 10.000% 04/01/20 | | 10,181 | | 11,108 |
| | 10.500% 03/01/14 | | 21,429 | | 22,007 |
| | 10.500% 12/01/15 | | 44,839 | | 47,435 |
| | 11.000% 08/01/15 | | 33,485 | | 35,605 |
| | TBA: | | | | |
| | 6.000% 09/01/37 (e) | | 38,250,000 | | 38,202,188 |
| | 6.500% 09/01/37 (e) | | 89,500,000 | | 90,842,500 |
See Accompanying Notes to Financial Statements.
12
Columbia Federal Securities Fund
August 31, 2007
Mortgage-Backed Securities (continued)
| | | | | | |
| | | | | Par ($) | | Value ($) |
| | | | | |
| Government National Mortgage Association | | 5.750% 08/20/22 (d) | | 5,609 | | 5,640 |
| | 6.000% 12/15/10 | | 24,643 | | 24,941 |
| | 6.375% 05/20/22 (d) | | 34,679 | | 34,909 |
| | 6.375% 06/20/23 (d) | | 22,310 | | 22,475 |
| | 6.500% 06/15/23 | | 15,016 | | 15,361 |
| | 6.500% 08/15/23 | | 1,744 | | 1,785 |
| | 6.500% 09/15/23 | | 20,434 | | 20,905 |
| | 6.500% 10/15/23 | | 32,888 | | 33,646 |
| | 6.500% 11/15/23 | | 147,402 | | 150,798 |
| | 6.500% 12/15/23 | | 52,817 | | 54,034 |
| | 6.500% 01/15/24 | | 38,932 | | 39,827 |
| | 6.500% 02/15/24 | | 32,690 | | 33,441 |
| | 6.500% 03/15/24 | | 96,266 | | 98,477 |
| | 6.500% 04/15/24 | | 17,122 | | 17,515 |
| | 6.500% 05/15/24 | | 25,484 | | 26,071 |
| | 6.500% 07/15/24 | | 113,202 | | 115,810 |
| | 6.500% 09/15/25 | | 31,105 | | 31,815 |
| | 6.500% 12/15/25 | | 34,017 | | 34,793 |
| | 6.500% 01/15/28 | | 21,023 | | 21,517 |
| | 6.500% 02/15/28 | | 75,615 | | 77,391 |
| | 6.500% 07/15/28 | | 110,219 | | 112,808 |
| | 6.500% 08/15/28 | | 82,247 | | 84,179 |
| | 6.500% 10/15/28 | | 74,661 | | 76,415 |
| | 6.500% 11/15/28 | | 25,354 | | 25,949 |
| | 6.500% 12/15/28 | | 195,393 | | 199,983 |
| | 6.500% 01/15/29 | | 136,476 | | 139,607 |
| | 6.500% 02/15/29 | | 42,519 | | 43,494 |
| | 7.000% 03/15/22 | | 8,639 | | 9,005 |
| | 7.000% 04/15/22 | | 1,631 | | 1,700 |
| | 7.000% 10/15/22 | | 4,176 | | 4,353 |
| | 7.000% 11/15/22 | | 11,810 | | 12,312 |
| | 7.000% 01/15/23 | | 170,257 | | 177,659 |
| | 7.000% 03/15/23 | | 2,174 | | 2,269 |
| | 7.000% 05/15/23 | | 79,551 | | 83,009 |
| | 7.000% 06/15/23 | | 23,406 | | 24,424 |
| | 7.000% 07/15/23 | | 5,716 | | 5,965 |
| | 7.000% 10/15/23 | | 75,630 | | 78,918 |
| | 7.000% 12/15/23 | | 56,415 | | 58,840 |
| | 7.000% 01/15/24 | | 1,953 | | 2,037 |
| | 7.000% 03/15/24 | | 973 | | 1,015 |
| | 7.000% 10/15/24 | | 44,549 | | 46,485 |
| | 7.000% 09/15/25 | | 3,187 | | 3,327 |
| | 7.000% 10/15/25 | | 112,003 | | 116,950 |
| | 7.000% 12/15/25 | | 43,542 | | 45,465 |
| | 7.000% 01/15/26 | | 41,680 | | 43,516 |
| | 7.000% 02/15/26 | | 52,306 | | 54,610 |
| | 7.000% 03/15/26 | | 5,568 | | 5,813 |
| | 7.000% 04/15/26 | | 4,129 | | 4,312 |
See Accompanying Notes to Financial Statements.
13
Columbia Federal Securities Fund
August 31, 2007
Mortgage-Backed Securities (continued)
| | | | | | |
| | | | | Par ($) | | Value ($) |
| | | | | |
| Government National Mortgage Association (continued) | | 7.000% 05/15/26 | | 1,587 | | 1,657 |
| | 7.000% 06/15/26 | | 51,807 | | 54,090 |
| | 7.000% 11/15/26 | | 67,316 | | 70,288 |
| | 7.000% 12/15/26 | | 770 | | 803 |
| | 7.000% 01/15/27 | | 4,002 | | 4,177 |
| | 7.000% 02/15/27 | | 852 | | 890 |
| | 7.000% 04/15/27 | | 4,041 | | 4,219 |
| | 7.000% 08/15/27 | | 947 | | 989 |
| | 7.000% 09/15/27 | | 42,680 | | 44,554 |
| | 7.000% 10/15/27 | | 66,128 | | 69,033 |
| | 7.000% 11/15/27 | | 179,901 | | 187,800 |
| | 7.000% 12/15/27 | | 312,912 | | 326,654 |
| | 7.000% 01/15/28 | | 39,185 | | 40,884 |
| | 7.000% 02/15/28 | | 53,590 | | 55,941 |
| | 7.000% 03/15/28 | | 171,604 | | 179,068 |
| | 7.000% 04/15/28 | | 90,764 | | 94,701 |
| | 7.000% 05/15/28 | | 40,898 | | 42,671 |
| | 7.000% 06/15/28 | | 13,568 | | 14,156 |
| | 7.000% 07/15/28 | | 425,047 | | 443,476 |
| | 7.000% 09/15/28 | | 18,332 | | 19,127 |
| | 7.000% 12/15/28 | | 95,900 | | 100,058 |
| | 7.000% 01/15/29 | | 1,450 | | 1,513 |
| | 7.000% 02/15/29 | | 2,019 | | 2,107 |
| | 7.000% 03/15/29 | | 25,530 | | 26,634 |
| | 7.000% 04/15/29 | | 44,548 | | 46,473 |
| | 7.000% 05/15/29 | | 29,285 | | 30,551 |
| | 7.000% 06/15/29 | | 20,680 | | 21,574 |
| | 7.000% 07/15/29 | | 75,434 | | 78,696 |
| | 7.000% 08/15/29 | | 45,746 | | 47,726 |
| | 7.000% 09/15/29 | | 31,372 | | 32,730 |
| | 7.000% 10/15/29 | | 11,479 | | 11,975 |
| | 7.500% 04/15/22 | | 18,872 | | 19,764 |
| | 7.500% 10/15/23 | | 61,672 | | 64,624 |
| | 7.500% 08/15/25 | | 130,691 | | 137,122 |
| | 7.500% 10/15/25 | | 15,050 | | 15,791 |
| | 7.500% 12/15/25 | | 46,499 | | 48,788 |
| | 8.000% 04/15/08 | | 5 | | 5 |
| | 8.000% 11/15/14 | | 22,601 | | 23,797 |
| | 8.000% 06/20/17 | | 151,837 | | 159,403 |
| | 8.000% 06/15/22 | | 68,334 | | 72,375 |
| | 8.000% 02/15/23 | | 98,299 | | 104,195 |
| | 8.000% 03/20/23 | | 600 | | 633 |
| | 8.000% 06/15/23 | | 2,243 | | 2,377 |
| | 8.000% 07/15/23 | | 3,159 | | 3,349 |
| | 8.000% 07/15/26 | | 52,745 | | 56,004 |
| | 8.000% 07/15/29 | | 2,881 | | 3,060 |
| | 8.500% 10/15/09 | | 4,674 | | 4,847 |
| | 8.500% 12/15/21 | | 5,105 | | 5,495 |
| | 8.500% 01/15/22 | | 72,382 | | 78,001 |
See Accompanying Notes to Financial Statements.
14
Columbia Federal Securities Fund
August 31, 2007
Mortgage-Backed Securities (continued)
| | | | | | |
| | | | | Par ($) | | Value ($) |
| | | | | |
| Government National Mortgage Association (continued) | | 8.500% 09/15/22 | | 3,686 | | 3,972 |
| | 8.500% 11/20/22 | | 49,425 | | 53,065 |
| | 8.500% 12/15/22 | | 4,585 | | 4,934 |
| | 8.750% 12/15/21 | | 109,966 | | 117,524 |
| | 8.850% 01/15/19 | | 43,195 | | 46,285 |
| | 8.850% 05/15/19 | | 68,797 | | 73,719 |
| | 9.000% 08/15/08 | | 8,123 | | 8,272 |
| | 9.000% 09/15/08 | | 21,110 | | 21,499 |
| | 9.000% 10/15/08 | | 3,505 | | 3,569 |
| | 9.000% 11/15/08 | | 13,582 | | 13,832 |
| | 9.000% 12/15/08 | | 10,017 | | 10,201 |
| | 9.000% 01/15/09 | | 5,530 | | 5,710 |
| | 9.000% 02/15/09 | | 11,028 | | 11,388 |
| | 9.000% 03/15/09 | | 35,142 | | 36,287 |
| | 9.000% 04/15/09 | | 1,880 | | 1,942 |
| | 9.000% 05/15/09 | | 66,025 | | 68,176 |
| | 9.000% 06/15/09 | | 51,266 | | 52,936 |
| | 9.000% 12/15/09 | | 3,875 | | 4,001 |
| | 9.000% 05/15/16 | | 23,046 | | 24,705 |
| | 9.000% 06/15/16 | | 13,939 | | 14,943 |
| | 9.000% 07/15/16 | | 26,420 | | 28,322 |
| | 9.000% 08/15/16 | | 1,226 | | 1,314 |
| | 9.000% 09/15/16 | | 24,007 | | 25,735 |
| | 9.000% 10/15/16 | | 43,205 | | 46,315 |
| | 9.000% 11/15/16 | | 9,047 | | 9,698 |
| | 9.000% 11/20/16 | | 78,857 | | 84,219 |
| | 9.000% 12/15/16 | | 1,054 | | 1,130 |
| | 9.000% 01/15/17 | | 87,843 | | 94,193 |
| | 9.000% 02/15/17 | | 1,638 | | 1,756 |
| | 9.000% 03/20/17 | | 38,020 | | 40,618 |
| | 9.000% 05/15/17 | | 2,923 | | 3,134 |
| | 9.000% 06/15/17 | | 26,880 | | 28,824 |
| | 9.000% 06/20/17 | | 106,052 | | 113,297 |
| | 9.000% 07/15/17 | | 532 | | 571 |
| | 9.000% 09/15/17 | | 11,995 | | 12,862 |
| | 9.000% 10/15/17 | | 12,222 | | 13,079 |
| | 9.000% 12/15/17 | | 7,635 | | 8,173 |
| | 9.000% 04/20/18 | | 85,523 | | 91,520 |
| | 9.000% 05/20/18 | | 42,076 | | 45,027 |
| | 9.000% 12/15/19 | | 362 | | 389 |
| | 9.000% 04/15/20 | | 1,074 | | 1,157 |
| | 9.000% 05/20/21 | | 3,184 | | 3,421 |
| | 9.000% 09/15/21 | | 196 | | 211 |
| | 9.000% 02/15/25 | | 107,163 | | 115,984 |
| | 9.250% 10/15/16 | | 121,586 | | 130,496 |
| | 9.250% 05/15/18 | | 16,147 | | 17,412 |
| | 9.250% 07/15/21 | | 36,726 | | 39,800 |
| | 9.250% 09/15/21 | | 33,924 | | 36,763 |
| | 9.500% 06/15/09 | | 42,030 | | 43,636 |
See Accompanying Notes to Financial Statements.
15
Columbia Federal Securities Fund
August 31, 2007
Mortgage-Backed Securities (continued)
| | | | | | |
| | | | | Par ($) | | Value ($) |
| | | | | |
| Government National Mortgage Association (continued) | | 9.500% 07/15/09 | | 12,683 | | 13,168 |
| | 9.500% 08/15/09 | | 65,005 | | 67,489 |
| | 9.500% 09/15/09 | | 50,526 | | 52,455 |
| | 9.500% 10/15/09 | | 27,352 | | 28,397 |
| | 9.500% 02/20/18 | | 53,502 | | 58,005 |
| | 9.500% 12/20/24 | | 11,681 | | 12,717 |
| | 9.500% 01/20/25 | | 9,344 | | 10,178 |
| | 10.000% 12/15/17 | | 1,531 | | 1,722 |
| | 10.000% 07/20/18 | | 19,176 | | 21,493 |
| | 10.000% 11/15/18 | | 543 | | 611 |
| | 10.000% 12/15/18 | | 446 | | 502 |
| | 10.000% 03/15/19 | | 473 | | 533 |
| | 10.000% 04/15/20 | | 839 | | 948 |
| | 10.000% 11/15/20 | | 12,372 | | 13,984 |
| | 10.500% 02/15/10 | | 3,309 | | 3,539 |
| | 10.500% 09/15/10 | | 567 | | 606 |
| | 10.500% 06/15/11 | | 12,927 | | 14,022 |
| | 10.500% 06/15/12 | | 13,966 | | 15,334 |
| | 10.500% 03/15/13 | | 46 | | 51 |
| | 10.500% 07/15/13 | | 6,656 | | 7,380 |
| | 10.500% 11/15/13 | | 15,332 | | 17,000 |
| | 10.500% 08/15/15 | | 8,710 | | 9,770 |
| | 10.500% 09/15/15 | | 20,065 | | 22,507 |
| | 10.500% 10/15/15 | | 7,097 | | 7,962 |
| | 10.500% 12/15/15 | | 7,812 | | 8,763 |
| | 10.500% 01/15/16 | | 29,526 | | 33,306 |
| | 10.500% 01/20/16 | | 179 | | 199 |
| | 10.500% 02/15/16 | | 10,826 | | 12,213 |
| | 10.500% 03/15/16 | | 9,923 | | 11,194 |
| | 10.500% 07/15/17 | | 13,215 | | 14,950 |
| | 10.500% 10/15/17 | | 2,102 | | 2,378 |
| | 10.500% 11/15/17 | | 43,492 | | 49,198 |
| | 10.500% 12/15/17 | | 67,209 | | 76,029 |
| | 10.500% 01/15/18 | | 32,083 | | 36,370 |
| | 10.500% 02/15/18 | | 25,224 | | 28,598 |
| | 10.500% 03/15/18 | | 38,334 | | 43,462 |
| | 10.500% 04/15/18 | | 58,282 | | 66,077 |
| | 10.500% 06/15/18 | | 7,947 | | 9,010 |
| | 10.500% 07/15/18 | | 48,205 | | 54,654 |
| | 10.500% 09/15/18 | | 5,717 | | 6,482 |
| | 10.500% 10/15/18 | | 7,481 | | 8,481 |
| | 10.500% 12/15/18 | | 10,296 | | 11,690 |
| | 10.500% 02/15/19 | | 8,077 | | 9,187 |
| | 10.500% 03/15/19 | | 2,703 | | 3,074 |
| | 10.500% 04/15/19 | | 43,567 | | 49,555 |
| | 10.500% 05/15/19 | | 40,402 | | 45,955 |
| | 10.500% 06/15/19 | | 58,403 | | 66,369 |
| | 10.500% 06/20/19 | | 8,651 | | 9,805 |
| | 10.500% 07/15/19 | | 113,576 | | 129,185 |
See Accompanying Notes to Financial Statements.
16
Columbia Federal Securities Fund
August 31, 2007
Mortgage-Backed Securities (continued)
| | | | | | |
| | | | | Par ($) | | Value ($) |
| | | | | |
| Government National Mortgage Association (continued) | | 10.500% 07/20/19 | | 6,148 | | 6,968 |
| | 10.500% 08/15/19 | | 22,538 | | 25,637 |
| | 10.500% 08/20/19 | | 11,987 | | 13,586 |
| | 10.500% 09/15/19 | | 16,752 | | 19,053 |
| | 10.500% 09/20/19 | | 10,215 | | 11,579 |
| | 10.500% 10/15/19 | | 4,322 | | 4,916 |
| | 10.500% 12/15/19 | | 26,369 | | 29,993 |
| | 10.500% 03/15/20 | | 19,295 | | 21,988 |
| | 10.500% 05/15/20 | | 7,380 | | 8,410 |
| | 10.500% 07/15/20 | | 20,257 | | 23,084 |
| | 10.500% 08/15/20 | | 17,807 | | 20,292 |
| | 10.500% 09/15/20 | | 14,035 | | 15,993 |
| | 10.500% 10/15/20 | | 146 | | 166 |
| | 10.500% 11/15/20 | | 2,082 | | 2,372 |
| | 10.500% 12/15/20 | | 804 | | 916 |
| | 10.500% 01/15/21 | | 2,779 | | 3,171 |
| | 10.500% 08/15/21 | | 151,441 | | 171,387 |
| | 10.625% 05/15/10 | | 5,892 | | 6,347 |
| | 11.000% 12/15/09 | | 12,216 | | 12,926 |
| | 11.000% 01/15/10 | | 191 | | 207 |
| | 11.000% 02/15/10 | | 16,992 | | 18,339 |
| | 11.000% 03/15/10 | | 6,171 | | 6,676 |
| | 11.000% 07/15/10 | | 8,270 | | 8,948 |
| | 11.000% 08/15/10 | | 18,409 | | 19,891 |
| | 11.000% 09/15/10 | | 27,994 | | 30,228 |
| | 11.000% 10/15/10 | | 1,199 | | 1,297 |
| | 11.000% 11/15/10 | | 3,530 | | 3,806 |
| | 11.000% 04/15/11 | | 4,605 | | 5,032 |
| | 11.000% 02/15/13 | | 1,438 | | 1,594 |
| | 11.000% 07/15/13 | | 15,183 | | 16,829 |
| | 11.000% 08/15/15 | | 26,446 | | 29,738 |
| | 11.000% 09/15/15 | | 25,004 | | 28,117 |
| | 11.000% 10/15/15 | | 8,421 | | 9,470 |
| | 11.000% 11/15/15 | | 72,385 | | 81,394 |
| | 11.000% 12/15/15 | | 64,097 | | 72,076 |
| | 11.000% 01/15/16 | | 29,708 | | 33,580 |
| | 11.000% 02/15/16 | | 2,910 | | 3,289 |
| | 11.000% 03/15/16 | | 3,805 | | 4,301 |
| | 11.000% 07/15/16 | | 38,806 | | 43,863 |
| | 11.000% 07/15/17 | | 73 | | 77 |
| | 11.000% 08/15/18 | | 4,328 | | 4,894 |
| | 11.000% 09/15/18 | | 83,834 | | 95,016 |
| | 11.000% 11/15/18 | | 9,837 | | 11,149 |
| | 11.000% 12/15/18 | | 35,007 | | 39,676 |
| | 11.000% 06/20/19 | | 9,934 | | 11,252 |
| | 11.000% 07/20/19 | | 185 | | 208 |
| | 11.000% 09/20/19 | | 3,649 | | 4,116 |
| | 11.000% 12/15/20 | | 12,285 | | 13,982 |
| | 11.000% 02/15/21 | | 6,881 | | 7,839 |
See Accompanying Notes to Financial Statements.
17
Columbia Federal Securities Fund
August 31, 2007
Mortgage-Backed Securities (continued)
| | | | | | |
| | | | | Par ($) | | Value ($) |
| | | | | |
| Government National Mortgage Association (continued) | | 11.000% 03/15/21 | | 10,072 | | 11,474 |
| | 11.500% 03/15/10 | | 1,437 | | 1,558 |
| | 11.500% 04/15/10 | | 4,242 | | 4,601 |
| | 11.500% 07/15/10 | | 4,773 | | 5,177 |
| | 11.500% 09/15/10 | | 21,244 | | 23,043 |
| | 11.500% 10/15/10 | | 16,123 | | 17,489 |
| | 11.500% 01/15/13 | | 21,773 | | 24,307 |
| | 11.500% 02/15/13 | | 63,552 | | 71,224 |
| | 11.500% 03/15/13 | | 141,705 | | 158,665 |
| | 11.500% 04/15/13 | | 119,984 | | 134,436 |
| | 11.500% 05/15/13 | | 142,723 | | 159,929 |
| | 11.500% 06/15/13 | | 82,765 | | 92,708 |
| | 11.500% 07/15/13 | | 64,967 | | 72,812 |
| | 11.500% 08/15/13 | | 20,037 | | 22,456 |
| | 11.500% 09/15/13 | | 18,244 | | 20,447 |
| | 11.500% 11/15/13 | | 7,634 | | 8,555 |
| | 11.500% 01/15/14 | | 4,073 | | 4,600 |
| | 11.500% 02/15/14 | | 22,878 | | 25,840 |
| | 11.500% 08/15/15 | | 4,316 | | 4,908 |
| | 11.500% 09/15/15 | | 11,929 | | 13,256 |
| | 11.500% 10/15/15 | | 18,781 | | 21,378 |
| | 11.500% 11/15/15 | | 6,959 | | 7,913 |
| | 11.500% 12/15/15 | | 12,003 | | 13,649 |
| | 11.500% 01/15/16 | | 7,173 | | 8,202 |
| | 11.500% 02/15/16 | | 6,667 | | 7,624 |
| | 11.500% 02/20/16 | | 11,058 | | 12,600 |
| | 11.500% 03/15/16 | | 6,853 | | 7,836 |
| | 11.500% 11/15/17 | | 8,240 | | 9,466 |
| | 11.500% 12/15/17 | | 3,901 | | 4,482 |
| | 11.500% 01/15/18 | | 4,800 | | 5,536 |
| | 11.500% 02/15/18 | | 3,970 | | 4,579 |
| | 11.500% 02/20/18 | | 1,137 | | 1,306 |
| | 11.500% 05/15/18 | | 7,224 | | 8,331 |
| | 11.500% 11/15/19 | | 5,811 | | 6,724 |
| | 11.750% 07/15/13 | | 24,989 | | 28,120 |
| | 11.750% 09/15/13 | | 8,808 | | 9,911 |
| | 11.750% 07/15/15 | | 41,246 | | 46,283 |
| | 12.000% 11/15/12 | | 4,094 | | 4,603 |
| | 12.000% 12/15/12 | | 102,176 | | 114,847 |
| | 12.000% 01/15/13 | | 85,695 | | 97,180 |
| | 12.000% 02/15/13 | | 47,941 | | 54,324 |
| | 12.000% 03/15/13 | | 11,235 | | 12,741 |
| | 12.000% 05/15/13 | | 7,551 | | 8,564 |
| | 12.000% 08/15/13 | | 23,080 | | 26,175 |
| | 12.000% 09/15/13 | | 64,552 | | 73,207 |
| | 12.000% 09/20/13 | | 2,577 | | 2,912 |
| | 12.000% 10/15/13 | | 6,798 | | 7,708 |
| | 12.000% 12/15/13 | | 11,095 | | 12,582 |
| | 12.000% 01/15/14 | | 22,144 | | 25,272 |
See Accompanying Notes to Financial Statements.
18
Columbia Federal Securities Fund
August 31, 2007
Mortgage-Backed Securities (continued)
| | | | | | |
| | | | | Par ($) | | Value ($) |
| | | | | |
| Government National Mortgage Association (continued) | | 12.000% 01/20/14 | | 3,055 | | 3,462 |
| | 12.000% 02/15/14 | | 62,386 | | 71,474 |
| | 12.000% 02/20/14 | | 18,651 | | 21,295 |
| | 12.000% 03/15/14 | | 114,110 | | 130,735 |
| | 12.000% 03/20/14 | | 7,758 | | 8,857 |
| | 12.000% 04/15/14 | | 61,253 | | 70,180 |
| | 12.000% 04/20/14 | | 34,005 | | 38,824 |
| | 12.000% 05/15/14 | | 107,492 | | 123,153 |
| | 12.000% 06/15/14 | | 29,217 | | 33,473 |
| | 12.000% 07/15/14 | | 11,141 | | 12,765 |
| | 12.000% 08/20/14 | | 2,053 | | 2,344 |
| | 12.000% 01/15/15 | | 22,813 | | 25,806 |
| | 12.000% 02/15/15 | | 58,507 | | 66,185 |
| | 12.000% 03/15/15 | | 39,316 | | 44,476 |
| | 12.000% 03/20/15 | | 215 | | 242 |
| | 12.000% 04/15/15 | | 45,219 | | 51,152 |
| | 12.000% 05/15/15 | | 18,903 | | 21,384 |
| | 12.000% 06/15/15 | | 20,933 | | 23,691 |
| | 12.000% 07/15/15 | | 23,291 | | 26,348 |
| | 12.000% 09/20/15 | | 10,598 | | 11,947 |
| | 12.000% 10/15/15 | | 12,336 | | 13,955 |
| | 12.000% 11/15/15 | | 7,996 | | 9,045 |
| | 12.000% 12/20/15 | | 1,452 | | 1,636 |
| | 12.000% 01/15/16 | | 4,752 | | 5,376 |
| | 12.000% 02/15/16 | | 6,615 | | 7,483 |
| | 12.000% 02/20/16 | | 2,964 | | 3,342 |
| | 12.250% 02/15/14 | | 45,795 | | 51,377 |
| | 12.250% 03/15/14 | | 5,893 | | 6,611 |
| | 12.250% 04/15/14 | | 18,510 | | 20,766 |
| | 12.500% 04/15/10 | | 41,345 | | 45,268 |
| | 12.500% 05/15/10 | | 55,125 | | 60,663 |
| | 12.500% 06/15/10 | | 69,530 | | 76,479 |
| | 12.500% 07/15/10 | | 36,046 | | 39,656 |
| | 12.500% 08/15/10 | | 9,875 | | 10,867 |
| | 12.500% 09/15/10 | | 3,171 | | 3,490 |
| | 12.500% 10/15/10 | | 17,636 | | 19,408 |
| | 12.500% 11/15/10 | | 72,923 | | 80,207 |
| | 12.500% 12/15/10 | | 127,669 | | 140,377 |
| | 12.500% 01/15/11 | | 11,376 | | 12,685 |
| | 12.500% 05/15/11 | | 13,008 | | 14,505 |
| | 12.500% 10/15/13 | | 42,147 | | 47,428 |
| | 12.500% 10/20/13 | | 20,579 | | 23,076 |
| | 12.500% 11/15/13 | | 113,393 | | 127,601 |
| | 12.500% 12/15/13 | | 41,689 | | 46,899 |
| | 12.500% 01/15/14 | | 28,418 | | 32,143 |
| | 12.500% 05/15/14 | | 75,115 | | 84,961 |
| | 12.500% 06/15/14 | | 40,131 | | 45,392 |
| | 12.500% 07/15/14 | | 1,718 | | 1,944 |
| | 12.500% 07/20/14 | | 2,600 | | 2,930 |
See Accompanying Notes to Financial Statements.
19
Columbia Federal Securities Fund
August 31, 2007
Mortgage-Backed Securities (continued)
| | | | | | |
| | | | | Par ($) | | Value ($) |
| | | | | |
| Government National Mortgage Association (continued) | | 12.500% 08/15/14 | | 11,339 | | 12,825 |
| | 12.500% 09/20/14 | | 2,505 | | 2,824 |
| | 12.500% 10/20/14 | | 5,855 | | 6,599 |
| | 12.500% 11/15/14 | | 1,111 | | 1,222 |
| | 12.500% 12/15/14 | | 40,608 | | 45,932 |
| | 12.500% 01/15/15 | | 53,417 | | 60,592 |
| | 12.500% 04/15/15 | | 2,387 | | 2,708 |
| | 12.500% 05/15/15 | | 17,507 | | 19,859 |
| | 12.500% 05/20/15 | | 2,849 | | 3,220 |
| | 12.500% 06/15/15 | | 11,055 | | 12,541 |
| | 12.500% 07/15/15 | | 22,520 | | 25,546 |
| | 12.500% 07/20/15 | | 2,960 | | 3,346 |
| | 12.500% 08/15/15 | | 22,757 | | 25,814 |
| | 12.500% 10/15/15 | | 30,913 | | 35,066 |
| | 12.500% 11/20/15 | | 8,715 | | 9,850 |
| | 13.000% 01/15/11 | | 40,660 | | 44,674 |
| | 13.000% 02/15/11 | | 33,675 | | 37,704 |
| | 13.000% 03/15/11 | | 29,268 | | 32,771 |
| | 13.000% 04/15/11 | | 63,092 | | 70,643 |
| | 13.000% 06/15/11 | | 10,443 | | 11,693 |
| | 13.000% 06/15/12 | | 14,695 | | 16,570 |
| | 13.000% 10/15/12 | | 13,238 | | 14,927 |
| | 13.000% 11/15/12 | | 6,605 | | 7,448 |
| | 13.000% 12/15/12 | | 4,906 | | 5,532 |
| | 13.000% 02/15/13 | | 13,007 | | 14,714 |
| | 13.000% 05/15/13 | | 3,597 | | 4,069 |
| | 13.000% 09/15/13 | | 14,136 | | 15,993 |
| | 13.000% 09/20/13 | | 16,098 | | 18,147 |
| | 13.000% 10/15/13 | | 42,286 | | 47,837 |
| | 13.000% 06/15/14 | | 25,970 | | 29,538 |
| | 13.000% 06/20/14 | | 194 | | 220 |
| | 13.000% 07/15/14 | | 15,327 | | 17,432 |
| | 13.000% 07/20/14 | | 1,871 | | 2,121 |
| | 13.000% 09/15/14 | | 21,380 | | 24,301 |
| | 13.000% 10/15/14 | | 14,405 | | 16,385 |
| | 13.000% 11/15/14 | | 29,103 | | 33,288 |
| | 13.000% 12/15/14 | | 27,930 | | 31,769 |
| | 13.000% 03/15/15 | | 5,563 | | 6,312 |
| | 13.000% 06/15/15 | | 6,743 | | 7,692 |
| | 13.000% 01/15/16 | | 13,276 | | 15,177 |
| | 13.500% 05/15/10 | | 5,973 | | 6,651 |
| | 13.500% 06/15/10 | | 958 | | 1,067 |
| | 13.500% 07/15/10 | | 1,320 | | 1,470 |
| | 13.500% 10/15/10 | | 7,547 | | 8,404 |
| | 13.500% 04/15/11 | | 4,030 | | 4,553 |
| | 13.500% 05/15/11 | | 35,734 | | 40,373 |
| | 13.500% 10/15/12 | | 967 | | 1,098 |
| | 13.500% 11/15/12 | | 25,835 | | 29,346 |
| | 13.500% 06/15/13 | | 8,125 | | 9,279 |
See Accompanying Notes to Financial Statements.
20
Columbia Federal Securities Fund
August 31, 2007
Mortgage-Backed Securities (continued)
| | | | | | |
| | | | | Par ($) | | Value ($) |
| | | | | |
| | 13.500% 07/15/14 | | 5,913 | | 6,775 |
| | 13.500% 08/15/14 | | 1,524 | | 1,746 |
| | 13.500% 08/20/14 | | 5,499 | | 6,279 |
| | 13.500% 09/15/14 | | 3,879 | | 4,445 |
| | 13.500% 09/20/14 | | 5,213 | | 5,953 |
| | 13.500% 10/15/14 | | 16,945 | | 19,418 |
| | 13.500% 11/15/14 | | 11,345 | | 13,000 |
| | 13.500% 11/20/14 | | 29,119 | | 33,251 |
| | 13.500% 12/15/14 | | 3,753 | | 4,300 |
| | 13.500% 12/20/14 | | 5,022 | | 5,735 |
| | 13.500% 01/15/15 | | 12,884 | | 14,807 |
| | 13.500% 02/15/15 | | 21,947 | | 25,224 |
| | 13.500% 02/20/15 | | 8,527 | | 9,766 |
| | 13.500% 04/15/15 | | 3,917 | | 4,502 |
| | 13.500% 06/15/15 | | 4,688 | | 5,388 |
| | 14.000% 06/15/11 | | 3,617 | | 4,114 |
| | 14.000% 03/15/12 | | 4,251 | | 4,862 |
| | 14.500% 10/15/12 | | 2,118 | | 2,435 |
| | 15.000% 09/15/11 | | 33,092 | | 38,131 |
| | 15.000% 07/15/12 | | 2,164 | | 2,504 |
| | | | | | |
| | Total Mortgage-Backed Securities
(cost of $284,257,284) | | | | 285,268,223 |
| | | | | | |
| Asset-Backed Securities – 9.5% | | | | | | |
| Bank One Issuance Trust | | 5.721% 12/15/10 (d) | | 10,800,000 | | 10,797,119 |
| | | |
| Capital One Multi-Asset Execution Trust | | 5.861% 05/16/11 (d) | | 10,000,000 | | 10,005,464 |
| | | |
| Chase Credit Card Master Trust | | 5.721% 07/15/10 (d) | | 10,000,000 | | 9,999,438 |
| | | |
| Chase Funding Mortgage Loan | | 5.587% 02/25/32 | | 1,091,918 | | 868,516 |
| | 5.850% 02/25/32 | | 3,928,364 | | 2,494,821 |
| | 6.150% 06/25/31 | | 3,473,003 | | 2,383,852 |
| | 6.899% 03/25/31 | | 1,335,184 | | 1,159,474 |
| | | |
| Citicorp Residential Mortgage Securities, Inc. | | 5.892% 03/25/37 | | 2,650,000 | | 2,551,701 |
| | | |
| First Alliance Mortgage Loan Trust | | 8.225% 09/20/27 | | 193,371 | | 192,712 |
| | | |
| Green Tree Financial Corp. | | 7.850% 08/15/25 | | 9,100,000 | | 9,108,499 |
| | | |
| Harley-Davidson Motorcycle Trust | | 5.540% 04/15/15 | | 1,700,000 | | 1,678,779 |
| | | |
| JPMorgan Mortgage Acquisition Corp. | | 5.784% 01/25/37 | | 5,740,000 | | 5,502,839 |
| | | |
| MBNA Credit Card Master Note Trust | | 4.450% 08/15/16 (f) | | 5,000,000 | | 4,700,315 |
See Accompanying Notes to Financial Statements.
21
Columbia Federal Securities Fund
August 31, 2007
Asset-Backed Securities (continued)
| | | | | | |
| | | | | Par ($) | | Value ($) |
| | | | | | | |
| Residential Asset Mortgage Products, Inc. | | 4.120% 06/25/33 | | 1,758,947 | | 1,628,449 |
| | 5.600% 12/25/33 | | 2,871,765 | | 2,686,963 |
| | | |
| Residential Asset Securities Corp. | | 6.656% 04/25/32 | | 1,838,691 | | 1,322,274 |
| | | |
| Wachovia Auto Loan Owner Trust | | 5.650% 02/20/13 (e) | | 3,800,000 | | 3,783,621 |
| | | | | | |
| | Total Asset-Backed Securities
(cost of $75,233,370) | | | | 70,864,836 |
| | | | | | |
| Collateralized Mortgage Obligations – 3.7% |
| Agency – 1.2% | | | | | | |
| Federal Home Loan Mortgage Corp. | | 6.000% 05/15/29 | | 8,812,000 | | 8,937,614 |
| | I.O.: | | | | |
| | 5.500% 01/15/23 (g) | | 96,299 | | 1,111 |
| | 5.500% 05/15/27 (g) | | 303,445 | | 19,224 |
| | | |
| Vendee Mortgage Trust | | I.O.: | | | | |
| | 0.304% 03/15/29 (d)(g) | | 7,440,754 | | 80,692 |
| | 0.439% 09/15/27 (d)(g) | | 6,129,488 | | 84,434 |
| | | | | | |
| | Agency Total | | | | 9,123,075 |
| | | | | | |
| Non - Agency – 2.5% | | | | | | |
| Citigroup Mortgage Loan Trust, Inc. | | 5.823% 11/25/36 (d) | | 5,196,615 | | 5,178,007 |
| | | |
| Countrywide Home Loans, Inc. | | 6.000% 01/25/33 | | 2,228,011 | | 2,138,889 |
| | | |
| First Horizon Asset Securities, Inc. | | 5.126% 10/25/33 (d) | | 1,773,489 | | 1,501,874 |
| | | |
| Nomura Asset Acceptance Corp. | | 6.664% 05/25/36 (h) | | 4,220,000 | | 2,110,000 |
| | | |
| Residential Accredit Loans, Inc. | | 6.250% 03/25/17 | | 2,946,252 | | 2,939,573 |
| | | |
| Residential Funding Mortgage Securities, Inc. | | 6.000% 02/25/37 | | 1,494,471 | | 1,352,912 |
| | 6.500% 03/25/32 | | 1,018,412 | | 1,001,402 |
| | 6.500% 03/25/32 | | 763,809 | | 745,568 |
| | | |
| Tryon Mortgage Funding, Inc. | | 7.500% 02/20/27 | | 38,489 | | 38,382 |
| | | |
| Washington Mutual Mortgage Loan Trust | | 6.516% 01/25/40 (d) | | 1,300,480 | | 1,300,697 |
| | | | | | |
| | Non - Agency Total | | | | 18,307,304 |
| | Total Collateralized Mortgage Obligations
(cost of $29,954,301) | | | | 27,430,379 |
| | | | | | |
| Commercial Mortgage-Backed Securities – 0.9% | | | | |
| JPMorgan Chase Commercial Mortgage Securities Corp. | | 5.466% 06/12/47 (d) | | 6,000,000 | | 5,857,377 |
| | | |
| Merrill Lynch Mortgage Investors, Inc. | | I.O., | | | | |
| | 0.970% 12/15/30 (d)(g) | | 7,369,682 | | 115,789 |
See Accompanying Notes to Financial Statements.
22
Columbia Federal Securities Fund
August 31, 2007
Collateralized Mortgage Obligations (continued)
| | | | | | | |
| | | | | Par ($) | | Value ($) | |
| | |
| PNC Mortgage Acceptance Corp. | | 5.910% 03/12/34 | | 1,139,869 | | 1,142,454 | |
| | | | | | | |
| | Total Commercial Mortgage-Backed Securities
(cost of $7,392,847) | | | | 7,115,620 | |
| | | | | Shares | | | |
| Securities Lending Collateral – 28.6% | | | | | |
| | State Street Navigator Securities Lending Prime Portfolio (i) (7 day yield of 5.29%) | | 212,862,786 | | 212,862,786 | |
| | | | | | | |
| | Total Securities Lending Collateral
(cost of $212,862,786) | | | | 212,862,786 | |
| | | | | Par ($) | | | |
| Short-Term Obligation – 29.7% | | | | | | | |
| | Repurchase agreement with Greenwich Capital, dated 08/31/07, due 09/04/07 at 5.050% collateralized by U.S. Treasury Obligations with various maturities to 08/15/09, market value $228,207,026 (repurchase proceeds $221,466,197) | | 221,342,000 | | 221,342,000 | |
| | | | | | | |
| | Total Short-Term Obligation (cost of $221,342,000) | | 221,342,000 | |
| | | | | | | |
| | Total Investments – 158.2% (cost of $1,175,561,875) (j) | | 1,178,565,355 | |
| | | | | | | |
| | Other Assets & Liabilities, Net – (58.2)% | | | | (433,541,800 | ) |
| | | | | | | |
| | Net Assets – 100.0% | | | | 745,023,555 | |
Notes to Investment Portfolio:
| | (a) | All or a portion of this security was on loan at August 31, 2007. The total market value of securities on loan at August 31, 2007 is $208,345,423. |
| | (b) | A portion of this security with a market value of $1,699,658 is pledged as collateral for open futures contracts. |
| | (d) | The interest rate shown on floating rate or variable rate securities reflects the rate at August 31, 2007. |
| | (e) | Security purchased on a delayed delivery basis. |
| | (f) | Investments in affiliates during the period ended August 31, 2007: |
| | | Security name: MBNA Credit Card Master Note Trust, 4.450% 08/15/16 |
| | | |
Par as of 08/31/06: | | $ | 5,000,000 |
Par purchased: | | $ | – |
Par sold: | | $ | – |
Par as of 08/31/07: | | $ | 5,000,000 |
Net realized gain/loss: | | $ | – |
Interest income earned: | | $ | 222,500 |
Value at end of period: | | $ | 4,700,315 |
| | (g) | Accrued interest accumulates in the value of this security and is payable at redemption. |
| | (h) | Represents fair value as determined in good faith under procedures approved by the Board of Trustees. |
| | (i) | Investment made with cash collateral received from securities lending activity. |
| | (j) | Cost for federal income tax purposes is $1,178,249,125. |
At August 31, 2007, the asset allocation of the Fund is as follows:
| | | |
Asset Allocation (Unaudited) | | % of Net Assets | |
Government & Agency Obligations | | 47.5 | |
Mortgage-Backed Securities | | 38.3 | |
Asset-Backed Securities | | 9.5 | |
Collateralized Mortgage Obligations | | 3.7 | |
Commercial Mortgage-Backed Securities | | 0.9 | |
| | | |
| | 99.9 | |
Securities Lending Collateral | | 28.6 | |
Short-Term Obligation | | 29.7 | |
Other Assets & Liabilities, Net | | (58.2 | ) |
| | | |
| | 100.0 | |
| | | |
See Accompanying Notes to Financial Statements.
23
Columbia Federal Securities Fund
August 31, 2007
At August 31, 2007, the Fund held the following open long futures contracts:
| | | | | | | | | | | | |
Type | | Number of
Contracts | | Value | | Aggregate
Face Value | | Expiration
Date | | Unrealized
Appreciation |
10-Year U.S. Treasury Notes | | 780 | | $ | 85,056,562 | | 84,736,128 | | Dec-2007 | | $ | 320,434 |
U.S. Treasury Bonds | | 170 | | | 18,965,625 | | 18,726,712 | | Dec-2007 | | | 238,913 |
| | | | | | | | | | | | |
| | | | | | | | | | | $ | 559,347 |
| | | | | | | | | | | | |
| | |
Acronym | | Name |
| I.O. | | Interest Only |
| STRIPS | | Separate Trading of Registered Interest and Principal of Securities |
| TBA | | To Be Announced |
See Accompanying Notes to Financial Statements.
24
Statement of Assets and Liabilities – Columbia Federal Securities Fund
August 31, 2007
| | | | | |
| | | | | ($) | |
| Assets | | Unaffiliated investments, at cost (including repurchase agreement) | | 1,170,576,875 | |
| | Affiliated investments, at cost | | 4,985,000 | |
| | | | | |
| | Total investments, at cost | | 1,175,561,875 | |
| | Unaffiliated investments, at value (including securities on loan of $208,345,423) | | 952,523,040 | |
| | Affiliated investments, at value | | 4,700,315 | |
| | Repurchase agreements, at value | | 221,342,000 | |
| | | | | |
| | Total investments, at value | | 1,178,565,355 | |
| | Receivable for: | | | |
| | Investments sold | | 38,848,333 | |
| | Fund shares sold | | 163,424 | |
| | Interest | | 3,133,030 | |
| | Securities lending | | 51,051 | |
| | Dollar roll income | | 80,904 | |
| | Deferred Trustees’ compensation plan | | 94,143 | |
| | | | | |
| | Total Assets | | 1,220,936,240 | |
| | |
| Liabilities | | Payable to custodian bank | | 200 | |
| | Collateral on securities loaned | | 212,862,786 | |
| | Payable for: | | | |
| | Investments purchased on a delayed delivery basis | | 259,874,885 | |
| | Fund shares repurchased | | 779,024 | |
| | Futures variation margin | | 368,438 | |
| | Distributions | | 1,039,502 | |
| | Investment advisory fee | | 327,511 | |
| | Transfer agent fee | | 116,847 | |
| | Pricing and bookkeeping fees | | 38,739 | |
| | Trustees’ fees | | 73,264 | |
| | Custody fee | | 31,691 | |
| | Distribution and service fees | | 172,218 | |
| | Chief compliance officer expenses | | 235 | |
| | Deferred Trustees’ compensation plan | | 94,143 | |
| | Deferred dollar roll income | | 27,470 | |
| | Other liabilities | | 105,732 | |
| | | | | |
| | Total Liabilities | | 475,912,685 | |
| | |
| | | | | |
| | Net Assets | | 745,023,555 | |
| | |
| Net Assets Consist of | | Paid-in capital | | 837,727,759 | |
| | Overdistributed net investment income | | (2,173,944 | ) |
| | Accumulated net realized loss | | (94,093,087 | ) |
| | Net unrealized appreciation on: | | | |
| | Investments | | 3,003,480 | |
| | Futures contracts | | 559,347 | |
| | | | | |
| | Net Assets | | 745,023,555 | |
See Accompanying Notes to Financial Statements.
25
Statement of Assets and Liabilities (continued) – Columbia Federal Securities Fund
August 31, 2007
| | | | | | |
| | | | | | |
| Class A | | Net assets | | $ | 589,123,663 | |
| | Shares outstanding | | | 57,176,235 | |
| | Net asset value per share | | $ | 10.30 | (a) |
| | Maximum sales charge | | | 4.75 | % |
| | Maximum offering price per share | | $ | 10.81 | (b) |
| | |
| Class B | | Net assets | | $ | 44,345,067 | |
| | Shares outstanding | | | 4,303,786 | |
| | Net asset value and offering price per share | | $ | 10.30 | (a) |
| | |
| Class C | | Net assets | | $ | 7,050,995 | |
| | Shares outstanding | | | 684,327 | |
| | Net asset value and offering price per share | | $ | 10.30 | (a) |
| | |
| Class Z | | Net assets | | $ | 104,503,830 | |
| | Shares outstanding | | | 10,142,526 | |
| | Net asset value, offering and redemption price per share | | $ | 10.30 | |
| (a) | Redemption price per share is equal to net asset value less any applicable contingent deferred sales charge. |
| (b) | On sales of $50,000 or more the offering price is reduced. |
See Accompanying Notes to Financial Statements.
26
Statement of Operations – Columbia Federal Securities Fund
For the Year Ended August 31, 2007
| | | | | |
| | | | | ($) | |
| Investment Income | | Interest | | 41,355,382 | |
| | Interest from affiliates | | 222,500 | |
| | Dollar roll fee income | | 1,169,256 | |
| | Securities lending income | | 222,704 | |
| | | | | |
| | Total Investment Income | | 42,969,842 | |
| | |
| Expenses | | Investment advisory fee | | 4,083,500 | |
| | Distribution fee: | | | |
| | Class B | | 406,675 | |
| | Class C | | 56,508 | |
| | Service fee: | | | |
| | Class A | | 1,566,361 | |
| | Class B | | 135,558 | |
| | Class C | | 18,850 | |
| | Transfer agent fee | | 893,968 | |
| | Pricing and bookkeeping fees | | 282,268 | |
| | Trustees’ fees | | 63,307 | |
| | Custody fee | | 155,498 | |
| | Chief compliance officer expenses | | 650 | |
| | Other expenses | | 354,442 | |
| | | | | |
| | Total Expenses | | 8,017,585 | |
| | |
| | Fees and expenses waived or reimbursed by Investment Advisor | | (193,502 | ) |
| | Fees waived by Distributor – Class C | | (11,268 | ) |
| | Expense reductions | | (31,948 | ) |
| | | | | |
| | Net Expenses | | 7,780,867 | |
| | |
| | | | | |
| | Net Investment Income | | 35,188,975 | |
| | |
| Net Realized and Unrealized Gain (Loss) on Investments and Futures Contracts | | Net realized gain (loss) on: | | | |
| | Investments | | (2,874,380 | ) |
| | Futures contracts | | 1,532,327 | |
| | | | | |
| | Net realized loss | | (1,342,053 | ) |
| | |
| | Net change in unrealized appreciation (depreciation) on: | | | |
| | Investments | | (5,157,224 | ) |
| | Futures contracts | | 1,397,710 | |
| | | | | |
| | Net change in unrealized depreciation | | (3,759,514 | ) |
| | | | | |
| | Net Loss | | (5,101,567 | ) |
| | |
| | | | | |
| | Net Increase Resulting from Operations | | 30,087,408 | |
See Accompanying Notes to Financial Statements.
27
Statement of Changes in Net Assets – Columbia Federal Securities Fund
| | | | | | | | |
| Increase (Decrease) in Net Assets | | Year Ended August 31, | | 2007 ($) | | | 2006 ($) | |
| Operations | | Net investment income | | 35,188,975 | | | 37,973,658 | |
| | Net realized loss on investments and futures contracts | | (1,342,053 | ) | | (11,699,073 | ) |
| | Net change in unrealized depreciation on investments and futures contracts | | (3,759,514 | ) | | (19,173,068 | ) |
| | | | | | | | |
| | Net Increase Resulting from Operations | | 30,087,408 | | | 7,101,517 | |
| | | |
| Distributions to Shareholders | | From net investment income: | | | | | | |
| | Class A | | (27,641,171 | ) | | (30,542,332 | ) |
| | Class B | | (1,979,571 | ) | | (2,711,730 | ) |
| | Class C | | (287,481 | ) | | (321,543 | ) |
| | Class Z | | (5,166,731 | ) | | (4,643,347 | ) |
| | From return of capital: | | | | | | |
| | Class A | | (218,143 | ) | | (815,534 | ) |
| | Class B | | (23,510 | ) | | (88,054 | ) |
| | Class C | | (2,668 | ) | | (9,983 | ) |
| | Class Z | | (31,222 | ) | | (117,590 | ) |
| | | | | | | | |
| | Total Distributions to Shareholders | | (35,350,497 | ) | | (39,250,113 | ) |
| | | |
| Share Transactions | | Class A: | | | | | | |
| | Subscriptions | | 19,878,507 | | | 18,757,500 | |
| | Proceeds received in connection with merger | | — | | | 41,865,133 | |
| | Distributions reinvested | | 18,946,197 | | | 20,875,041 | |
| | Redemptions | | (110,824,949 | ) | | (144,204,115 | ) |
| | | | | | | | |
| | Net Decrease | | (72,000,245 | ) | | (62,706,441 | ) |
| | | |
| | Class B: | | | | | | |
| | Subscriptions | | 2,909,620 | | | 2,911,763 | |
| | Proceeds received in connection with merger | | — | | | 24,211,346 | |
| | Distributions reinvested | | 1,627,310 | | | 2,224,653 | |
| | Redemptions | | (25,760,066 | ) | | (30,008,744 | ) |
| | | | | | | | |
| | Net Decrease | | (21,223,136 | ) | | (660,982 | ) |
| | | |
| | Class C: | | | | | | |
| | Subscriptions | | 1,599,821 | | | 2,439,711 | |
| | Proceeds received in connection with merger | | — | | | 1,038,364 | |
| | Distributions reinvested | | 225,265 | | | 252,964 | |
| | Redemptions | | (2,954,789 | ) | | (3,741,762 | ) |
| | | | | | | | |
| | Net Decrease | | (1,129,703 | ) | | (10,723 | ) |
| | | |
| | Class Z: | | | | | | |
| | Subscriptions | | 31,175,281 | | | 27,249,589 | |
| | Proceeds received in connection with merger | | — | | | 78,066,165 | |
| | Distributions reinvested | | 1,945,362 | | | 1,614,118 | |
| | Redemptions | | (37,079,014 | ) | | (34,510,363 | ) |
| | | | | | | | |
| | Net Increase (Decrease) | | (3,958,371 | ) | | 72,419,509 | |
| | Net Increase (Decrease) from Share Transactions | | (98,311,455 | ) | | 9,041,363 | |
| | | | | | | | |
| | Total Decrease in Net Assets | | (103,574,544 | ) | | (23,107,233 | ) |
| | | |
| Net Assets | | Beginning of period | | 848,598,099 | | | 871,705,332 | |
| | End of period | | 745,023,555 | | | 848,598,099 | |
| | Overdistributed net investment income at end of period | | (2,173,944 | ) | | (3,120,178 | ) |
| | | | | | | | |
See Accompanying Notes to Financial Statements.
28
Statement of Changes in Net Assets (continued) – Columbia Federal Securities Fund
| | | | | | | | |
| | | Year Ended August 31, | | 2007 | | | 2006 | |
| Changes in Shares | | Class A: | | | | | | |
| | Subscriptions | | 1,919,059 | | | 1,810,583 | |
| | Issued in connection with merger | | — | | | 3,940,594 | |
| | Issued for distributions reinvested | | 1,825,566 | | | 2,012,750 | |
| | Redemptions | | (10,685,537 | ) | | (13,900,990 | ) |
| | | | | | | | |
| | Net Decrease | | (6,940,912 | ) | | (6,137,063 | ) |
| | | |
| | Class B: | | | | | | |
| | Subscriptions | | 281,351 | | | 281,163 | |
| | Issued in connection with merger | | — | | | 2,279,693 | |
| | Issued for distributions reinvested | | 156,713 | | | 214,498 | |
| | Redemptions | | (2,485,102 | ) | | (2,895,497 | ) |
| | | | | | | | |
| | Net Decrease | | (2,047,038 | ) | | (120,143 | ) |
| | | |
| | Class C: | | | | | | |
| | Subscriptions | | 154,096 | | | 235,651 | |
| | Issued in connection with merger | | — | | | 97,796 | |
| | Issued for distributions reinvested | | 21,701 | | | 24,402 | |
| | Redemptions | | (284,752 | ) | | (360,929 | ) |
| | | | | | | | |
| | Net Decrease | | (108,955 | ) | | (3,080 | ) |
| | | |
| | Class Z: | | | | | | |
| | Subscriptions | | 3,009,819 | | | 2,625,078 | |
| | Issued in connection with merger | | — | | | 7,351,688 | |
| | Issued for distributions reinvested | | 187,530 | | | 155,726 | |
| | Redemptions | | (3,577,774 | ) | | (3,306,640 | ) |
| | | | | | | | |
| | Net Increase (Decrease) | | (380,425 | ) | | 6,825,852 | |
See Accompanying Notes to Financial Statements.
29
Financial Highlights – Columbia Federal Securities Fund
Selected data for a fund share outstanding throughout each period is as follows:
| | | | | | | | | | | | | | | | | | | | |
| Class A Shares | |
| | | Year Ended August 31, | |
| | | 2007 | | | 2006 | | | 2005 | | | 2004 | | | 2003 | |
Net Asset Value, Beginning of Period | | $ | 10.38 | | | $ | 10.73 | | | $ | 10.75 | | | $ | 10.60 | | | $ | 10.88 | |
| | | | | |
Income From Investment Operations: | | | | | | | | | | | | | | | | | | | | |
Net investment income | | | 0.46 | (a) | | | 0.44 | (a) | | | 0.41 | (a) | | | 0.44 | (a) | | | 0.41 | |
Net realized and unrealized gain (loss) on investments and futures contracts | | | (0.08 | ) | | | (0.32 | ) | | | — | (b) | | | 0.13 | | | | (0.24 | ) |
| | | | | | | | | | | | | | | | | | | | |
Total from Investment Operations | | | 0.38 | | | | 0.12 | | | | 0.41 | | | | 0.57 | | | | 0.17 | |
| | | | | |
Less Distributions to Shareholders: | | | | | | | | | | | | | | | | | | | | |
From net investment income | | | (0.46 | ) | | | (0.46 | ) | | | (0.43 | ) | | | (0.42 | ) | | | (0.45 | ) |
From return of capital | | | — | (b) | | | (0.01 | ) | | | — | | | | — | | | | — | |
| | | | | | | | | | | | | | | | | | | | |
Total Distributions to Shareholders | | | (0.46 | ) | | | (0.47 | ) | | | (0.43 | ) | | | (0.42 | ) | | | (0.45 | ) |
| | | | | |
Net Asset Value, End of Period | | $ | 10.30 | | | $ | 10.38 | | | $ | 10.73 | | | $ | 10.75 | | | $ | 10.60 | |
Total return (c) | | | 3.73 | %(d) | | | 1.07 | %(d) | | | 3.91 | % | | | 5.49 | % | | | 1.52 | % |
| | | | | |
Ratios to Average Net Assets/Supplemental Data: | | | | | | | | | | | | | | | | | | | | |
Expenses (e) | | | 0.95 | % | | | 0.97 | % | | | 1.08 | % | | | 1.16 | % | | | 1.25 | % |
Waiver/Reimbursement | | | 0.02 | % | | | 0.01 | % | | | — | | | | — | | | | — | |
Net investment income (e) | | | 4.43 | % | | | 4.24 | % | | | 3.87 | % | | | 4.11 | % | | | 3.30 | % |
Portfolio turnover rate | | | 121 | % | | | 92 | % | | | 80 | % | | | 93 | % | | | 61 | % |
Net assets, end of period (000’s) | | $ | 589,124 | | | $ | 665,283 | | | $ | 754,026 | | | $ | 853,801 | | | $ | 1,004,181 | |
| (a) | Per share data was calculated using the average shares outstanding during the period. |
| (b) | Rounds to less than $0.01 per share. |
| (c) | Total return at net asset value assuming all distributions reinvested and no initial sales charge or contingent deferred sales charge. |
| (d) | Had the investment advisor and/or any of its affiliates not waived or reimbursed a portion of expenses, total return would have been reduced. |
| (e) | The benefits derived from expense reductions had an impact of less than 0.01%, except for the year ended August 31, 2007 which had a 0.01% impact. |
See Accompanying Notes to Financial Statements.
30
Financial Highlights – Columbia Federal Securities Fund
Selected data for a fund share outstanding throughout each period is as follows:
| | | | | | | | | | | | | | | | | | | | |
| Class B Shares | |
| | | Year Ended August 31, | |
| | | 2007 | | | 2006 | | | 2005 | | | 2004 | | | 2003 | |
Net Asset Value, Beginning of Period | | $ | 10.38 | | | $ | 10.73 | | | $ | 10.75 | | | $ | 10.60 | | | $ | 10.88 | |
| | | | | |
Income From Investment Operations: | | | | | | | | | | | | | | | | | | | | |
Net investment income | | | 0.38 | (a) | | | 0.36 | (a) | | | 0.33 | (a) | | | 0.36 | (a) | | | 0.31 | |
Net realized and unrealized gain (loss) on investments
and futures contracts | | | (0.08 | ) | | | (0.32 | ) | | | — | (b) | | | 0.13 | | | | (0.22 | ) |
| | | | | | | | | | | | | | | | | | | | |
Total from Investment Operations | | | 0.30 | | | | 0.04 | | | | 0.33 | | | | 0.49 | | | | 0.09 | |
| | | | | |
Less Distributions to Shareholders: | | | | | | | | | | | | | | | | | | | | |
From net investment income | | | (0.38 | ) | | | (0.38 | ) | | | (0.35 | ) | | | (0.34 | ) | | | (0.37 | ) |
From return of capital | | | — | (b) | | | (0.01 | ) | | | — | | | | — | | | | — | |
| | | | | | | | | | | | | | | | | | | | |
Total Distributions to Shareholders | | | (0.38 | ) | | | (0.39 | ) | | | (0.35 | ) | | | (0.34 | ) | | | (0.37 | ) |
| | | | | |
Net Asset Value, End of Period | | $ | 10.30 | | | $ | 10.38 | | | $ | 10.73 | | | $ | 10.75 | | | $ | 10.60 | |
Total return (c) | | | 2.96 | %(d) | | | 0.32 | %(d) | | | 3.13 | % | | | 4.71 | % | | | 0.76 | % |
| | | | | |
Ratios to Average Net Assets/Supplemental Data: | | | | | | | | | | | | | | | | | | | | |
Expenses (e) | | | 1.70 | % | | | 1.72 | % | | | 1.83 | % | | | 1.91 | % | | | 2.00 | % |
Waiver/Reimbursement | | | 0.02 | % | | | 0.01 | % | | | — | | | | — | | | | — | |
Net investment income (e) | | | 3.68 | % | | | 3.49 | % | | | 3.12 | % | | | 3.41 | % | | | 2.56 | % |
Portfolio turnover rate | | | 121 | % | | | 92 | % | | | 80 | % | | | 93 | % | | | 61 | % |
Net assets, end of period (000’s) | | $ | 44,345 | | | $ | 65,896 | | | $ | 69,452 | | | $ | 96,527 | | | $ | 143,880 | |
| (a) | Per share data was calculated using the average shares outstanding during the period. |
| (b) | Rounds to less than $0.01 per share. |
| (c) | Total return at net asset value assuming all distributions reinvested and no contingent deferred sales charge. |
| (d) | Had the investment advisor and/or any of its affiliates not waived or reimbursed a portion of expenses, total return would have been reduced. |
| (e) | The benefits derived from expense reductions had an impact of less than 0.01%, except for the year ended August 31, 2007 which had a 0.01% impact. |
See Accompanying Notes to Financial Statements.
31
Financial Highlights – Columbia Federal Securities Fund
Selected data for a fund share outstanding throughout each period is as follows:
| | | | | | | | | | | | | | | | | | | | |
| Class C Shares | |
| | | Year Ended August 31, | |
| | | 2007 | | | 2006 | | | 2005 | | | 2004 | | | 2003 | |
Net Asset Value, Beginning of Period | | $ | 10.38 | | | $ | 10.73 | | | $ | 10.75 | | | $ | 10.60 | | | $ | 10.88 | |
| | | | | |
Income From Investment Operations: | | | | | | | | | | | | | | | | | | | | |
Net investment income | | | 0.40 | (a) | | | 0.38 | (a) | | | 0.35 | (a) | | | 0.38 | (a) | | | 0.32 | |
Net realized and unrealized gain (loss) on investments
and futures contracts | | | (0.08 | ) | | | (0.33 | ) | | | — | (b) | | | 0.13 | | | | (0.22 | ) |
| | | | | | | | | | | | | | | | | | | | |
Total from Investment Operations | | | 0.32 | | | | 0.05 | | | | 0.35 | | | | 0.51 | | | | 0.10 | |
| | | | | |
Less Distributions to Shareholders: | | | | | | | | | | | | | | | | | | | | |
From net investment income | | | (0.40 | ) | | | (0.39 | ) | | | (0.37 | ) | | | (0.36 | ) | | | (0.38 | ) |
From return of capital | | | — | (b) | | | (0.01 | ) | | | — | | | | — | | | | — | |
| | | | | | | | | | | | | | | | | | | | |
Total Distributions to Shareholders | | | (0.40 | ) | | | (0.40 | ) | | | (0.37 | ) | | | (0.36 | ) | | | (0.38 | ) |
| | | | | |
Net Asset Value, End of Period | | $ | 10.30 | | | $ | 10.38 | | | $ | 10.73 | | | $ | 10.75 | | | $ | 10.60 | |
Total return (c) | | | 3.11 | %(d) | | | 0.47 | %(d) | | | 3.29 | %(d) | | | 4.86 | %(d) | | | 0.91 | %(d) |
| | | | | |
Ratios to Average Net Assets/Supplemental Data: | | | | | | | | | | | | | | | | | | | | |
Expenses (e) | | | 1.55 | % | | | 1.57 | % | | | 1.68 | % | | | 1.76 | % | | | 1.85 | % |
Waiver/Reimbursement | | | 0.17 | % | | | 0.16 | % | | | 0.15 | % | | | 0.15 | % | | | 0.15 | % |
Net investment income (e) | | | 3.83 | % | | | 3.65 | % | | | 3.27 | % | | | 3.60 | % | | | 2.76 | % |
Portfolio turnover rate | | | 121 | % | | | 92 | % | | | 80 | % | | | 93 | % | | | 61 | % |
Net assets, end of period (000’s) | | $ | 7,051 | | | $ | 8,231 | | | $ | 8,547 | | | $ | 10,630 | | | $ | 18,934 | |
| (a) | Per share data was calculated using the average shares outstanding during the period. |
| (b) | Rounds to less than $0.01 per share. |
| (c) | Total return at net asset value assuming all distributions reinvested and no contingent deferred sales charge. |
| (d) | Had the investment advisor and/or any of its affiliates not waived or reimbursed a portion of expenses, total return would have been reduced. |
| (e) | The benefits derived from expense reductions had an impact of less than 0.01%, except for the year ended August 31, 2007 which had a 0.01% impact. |
See Accompanying Notes to Financial Statements.
32
Financial Highlights – Columbia Federal Securities Fund
Selected data for a fund share outstanding throughout each period is as follows:
| | | | | | | | | | | | | | | | | | | | |
| Class Z Shares | |
| | | Year Ended August 31, | |
| | | 2007 | | | 2006 | | | 2005 | | | 2004 | | | 2003 | |
Net Asset Value, Beginning of Period | | $ | 10.38 | | | $ | 10.73 | | | $ | 10.75 | | | $ | 10.60 | | | $ | 10.88 | |
| | | | | |
Income From Investment Operations: | | | | | | | | | | | | | | | | | | | | |
Net investment income | | | 0.48 | (a) | | | 0.46 | (a) | | | 0.44 | (a) | | | 0.46 | (a) | | | 0.40 | |
Net realized and unrealized gain (loss) on investments
and futures contracts | | | (0.07 | ) | | | (0.32 | ) | | | — | (b) | | | 0.14 | | | | (0.20 | ) |
| | | | | | | | | | | | | | | | | | | | |
Total from Investment Operations | | | 0.41 | | | | 0.14 | | | | 0.44 | | | | 0.60 | | | | 0.20 | |
| | | | | |
Less Distributions to Shareholders: | | | | | | | | | | | | | | | | | | | | |
From net investment income | | | (0.49 | ) | | | (0.48 | ) | | | (0.46 | ) | | | (0.45 | ) | | | (0.48 | ) |
From return of capital | | | — | (b) | | | (0.01 | ) | | | — | | | | — | | | | — | |
| | | | | | | | | | | | | | | | | | | | |
Total Distributions to Shareholders | | | (0.49 | ) | | | (0.49 | ) | | | (0.46 | ) | | | (0.45 | ) | | | (0.48 | ) |
| | | | | |
Net Asset Value, End of Period | | $ | 10.30 | | | $ | 10.38 | | | $ | 10.73 | | | $ | 10.75 | | | $ | 10.60 | |
Total return (c) | | | 3.99 | %(d) | | | 1.33 | %(d) | | | 4.16 | % | | | 5.75 | % | | | 1.77 | % |
| | | | | |
Ratios to Average Net Assets/Supplemental Data: | | | | | | | | | | | | | | | | | | | | |
Expenses (e) | | | 0.70 | % | | | 0.72 | % | | | 0.83 | % | | | 0.91 | % | | | 1.00 | % |
Waiver/Reimbursement | | | 0.02 | % | | | 0.01 | % | | | — | | | | — | | | | — | |
Net investment income (e) | | | 4.68 | % | | | 4.51 | % | | | 4.12 | % | | | 4.30 | % | | | 3.47 | % |
Portfolio turnover rate | | | 121 | % | | | 92 | % | | | 80 | % | | | 93 | % | | | 61 | % |
Net assets, end of period (000’s) | | $ | 104,504 | | | $ | 109,187 | | | $ | 39,680 | | | $ | 29,848 | | | $ | 9,857 | |
| (a) | Per share data was calculated using the average shares outstanding during the period. |
| (b) | Rounds to less than $0.01 per share. |
| (c) | Total return at net asset value assuming all distributions reinvested. |
| (d) | Had the investment advisor and/or any of its affiliates not waived or reimbursed a portion of expenses, total return would have been reduced. |
| (e) | The benefits derived from expense reductions had an impact of less than 0.01%, except for the year ended August 31, 2007 which had a 0.01% impact. |
See Accompanying Notes to Financial Statements.
33
Notes to Financial Statements – Columbia Federal Securities Fund
August 31, 2007
Note 1. Organization
Columbia Federal Securities Fund (the “Fund”), a series of Columbia Funds Series Trust I (the “Trust”), is a diversified portfolio. The Trust is a Massachusetts business trust registered under the Investment Company Act of 1940, as amended, as an open-end management investment company.
Investment Goal
The Fund seeks as high a level of current income and total return as is consistent with prudent risk.
Fund Shares
The Trust may issue an unlimited number of shares, and the Fund offers four classes of shares: Class A, Class B, Class C and Class Z. Each share class has its own expense structure and sales charges, as applicable.
Class A shares are subject to a maximum front-end sales charge of 4.75% based on the amount of initial investment. Class A shares purchased without an initial sales charge in accounts aggregating up to $50 million at the time of purchase are subject to a 1.00% contingent deferred sales charge (“CDSC”) on shares sold within twelve months after purchase. Class B shares are subject to a maximum CDSC of 5.00% based upon the holding period after purchase. Class B shares will convert to Class A shares eight years after purchase. Class C shares are subject to a 1.00% CDSC on shares sold within twelve months after purchase. Class Z shares are offered continuously at net asset value. There are certain restrictions on the purchase of Class Z shares, as described in the Fund’s prospectus.
Note 2. Significant Accounting Policies
Use of Estimates
The preparation of financial statements in accordance with accounting principles generally accepted in the United States of America (“GAAP”) requires management to make certain estimates and assumptions that affect the reported amounts of assets and liabilities, the disclosure of contingent assets and liabilities at the date of the financial statements and the reported amounts of revenue and expenses during the reporting period. Actual results could differ from those estimates. The following is a summary of significant accounting policies consistently followed by the Fund in the preparation of its financial statements.
Security Valuation
Debt securities generally are valued by pricing services approved by the Trust’s Board of Trustees, based upon market transactions for normal, institutional-size trading units of similar securities. The services may use various pricing techniques which take into account appropriate factors such as yield, quality, coupon rate, maturity, type of issue, trading characteristics and other data, as well as broker quotes. Debt securities for which quotations are readily available are valued at an over-the-counter or exchange bid quotation. Certain debt securities, which tend to be more thinly traded and of lesser quality, are priced based on fundamental analysis of the financial condition of the issuer and the estimated value of any collateral. Valuations developed through pricing techniques may vary from the actual amounts realized upon sale of the securities, and the potential variation may be greater for those securities valued using fundamental analysis.
Short-term debt obligations maturing within 60 days are valued at amortized cost, which approximates market value.
Futures contracts are valued at the settlement price established each day by the board of trade or exchange on which they are traded.
Investments for which market quotations are not readily available, or that have quotations which management believes are not reliable, are valued at fair value as determined in good faith under consistently applied procedures established by and under the general supervision of the Board of Trustees. If a security is valued at fair value, such value is likely to be different from the last quoted market price for the security.
In September 2006, Statement of Financial Accounting Standards No. 157, Fair Value Measurements (“SFAS 157”), was issued. SFAS 157 is effective for fiscal years beginning after November 15, 2007. SFAS 157 defines fair value, establishes a framework for measuring fair value and expands disclosures about fair value measurements. Management is evaluating the impact the application of SFAS 157 will have on the Fund’s financial statement disclosures.
Security Transactions
Security transactions are accounted for on the trade date. Cost is determined and gains (losses) are based upon the specific identification method for both financial statement and federal income tax purposes.
34
Columbia Federal Securities Fund
August 31, 2007
Futures Contracts
The Fund may invest in futures contracts to hedge against the effects of changes in the value of portfolio securities due to anticipated changes in interest rates and/or market conditions, for duration management, or when the transactions are economically appropriate to the reduction of risk inherent in the management of the Fund and for nonhedging purposes. Futures contracts are financial instruments whose values depend on, or are derived from, the value of the underlying security, index or currency.
The use of futures contracts involves certain risks, which include: (1) imperfect correlation between the price movement of the instruments and the underlying securities, (2) inability to close out positions due to differing trading hours, or the temporary absence of a liquid market, for either the instruments or the underlying securities, or (3) an inaccurate prediction by Columbia Management Advisors, LLC (“Columbia”), the Fund’s investment advisor, of the future direction of interest rates. Any of these risks may involve amounts exceeding the variation margin recorded in the Fund’s Statements of Assets and Liabilities at any given time.
Upon entering into a futures contract, the Fund deposits cash or securities with the broker in an amount sufficient to meet the initial margin requirement. Subsequent payments are made or received by the Fund equal to the daily change in the contract value and are recorded as variation margin receivable or payable and offset in unrealized gains or losses. The Fund recognizes a realized gain or loss when the contract is closed or expires.
Repurchase Agreements
The Fund may engage in repurchase agreement transactions with institutions that Columbia has determined are creditworthy. The Fund, through its custodian, receives delivery of underlying securities collateralizing a repurchase agreement. Columbia is responsible for determining that collateral is at least equal, at all times, to the value of the repurchase obligation including interest. A repurchase agreement transaction involves certain risks in the event of default or insolvency of the counterparty. These risks include possible delays or restrictions upon the Fund’s ability to dispose of the underlying securities and a possible decline in the value of the underlying securities during the period while the Fund seeks to assert its rights.
Mortgage Dollar Rolls
The Fund may enter into mortgage “dollar rolls” in which the Fund sells securities for delivery in the current month and simultaneously contracts with the same counterparty to repurchase similar (same type, coupon and maturity) but not identical securities on a specified future date not exceeding 120 days. During the roll period, the Fund loses the right to receive principal and interest paid on the securities sold. However, the Fund would benefit to the extent of any difference between the price received for the securities sold and the lower forward price for the future purchase (often referred to as the “drop”) or fee income plus the interest earned on the cash proceeds of the securities sold until the settlement date of the forward purchase. Unless such benefits exceed the income, capital appreciation and gain or loss due to mortgage prepayments that would have been realized on the securities sold as part of the mortgage dollar roll, the use of this technique will diminish the investment performance of the Fund compared with what such performance would have been without the use of mortgage dollar rolls. All cash proceeds will be invested in instruments that are permissible investments for the Fund. The Fund will hold and maintain in a segregated account until the settlement date, cash or liquid securities in an amount equal to the forward purchase price.
The Fund’s policy is to record the components of mortgage dollar rolls using “to be announced” mortgage-backed securities. For financial reporting and tax purposes, the Fund treats mortgage dollar rolls as two separate transactions, one involving the purchase of a security and a separate transaction involving a sale. The Fund does not currently enter into mortgage dollar rolls that are accounted for as financing.
Mortgage dollar rolls involve certain risks. If the broker-dealer to whom the Fund sells the security becomes insolvent, the Fund’s right to purchase or repurchase the mortgage-related securities may be restricted and the instrument which the Fund is required to repurchase may be worth less than an instrument which the Fund originally held. Successful use of mortgage dollar rolls may depend upon the investment advisor’s ability to predict correctly interest rates and mortgage prepayments. For these reasons, there is no assurance that mortgage dollar rolls can be successfully employed.
35
Columbia Federal Securities Fund
August 31, 2007
Delayed Delivery Securities
The Fund may trade securities on other than normal settlement terms, including securities purchased or sold on a “when-issued” basis. This may increase the risk if the other party to the transaction fails to deliver and causes the Fund to subsequently invest at less advantageous prices. The Fund holds until settlement date, in a segregated account, cash or liquid securities in an amount equal to the delayed delivery commitment.
Income Recognition
Interest income is recorded on the accrual basis. Premium and discount are amortized and accreted, respectively, on all debt securities. Fee income attributable to mortgage dollar roll transactions is recorded on the accrual basis over the term of the transaction.
Determination of Class Net Asset Values
All income, expenses (other than class-specific expenses, as shown on the Statement of Operations) and realized and unrealized gains (losses) are allocated to each class of the Fund on a daily basis for purposes of determining the net asset value of each class. Income and expenses are allocated to each class based on the settled shares method, while realized and unrealized gains (losses) are allocated based on the relative net assets of each class.
Federal Income Tax Status
The Fund intends to qualify each year as a “regulated investment company” under Subchapter M of the Internal Revenue Code, as amended, and will distribute substantially all of its taxable income, if any, for its tax year, and as such will not be subject to federal income taxes. In addition, the Fund intends to distribute in each calendar year substantially all of its net investment income, capital gains and certain other amounts, if any, such that the Fund should not be subject to federal excise tax. Therefore, no federal income or excise tax provision is recorded.
Distributions to Shareholders
Dividends from net investment income are declared daily and paid monthly. Net realized capital gains, if any, are distributed at least annually.
Indemnification
In the normal course of business, the Fund enters into contracts that contain a variety of representations and warranties and which provide general indemnities. The Fund’s maximum exposure under these arrangements is unknown because this would involve future claims against the Fund. Also, under the Fund’s organizational documents and by contract, the Trustees and Officers of the Trust are indemnified against certain liabilities that may arise out of actions relating to their duties to the Trust. However, based on experience, the Fund expects the risk of loss due to these representations, warranties and indemnities to be minimal.
Note 3. Federal Tax Information
The timing and character of income and capital gain distributions are determined in accordance with income tax regulations, which may differ from GAAP. Reclassifications are made to the Fund’s capital accounts for permanent tax differences to reflect income and gains available for distribution (or available capital loss carryforwards) under income tax regulations.
For the year ended August 31, 2007, permanent book and tax basis differences resulting primarily from differing treatments for amortization/accretion adjustments, paydown reclassifications and expired capital loss carryforwards were identified and reclassified among the components of the Fund’s net assets as follows:
| | | | |
| | | | | |
Overdistributed Net Investment
Income | | Accumulated Net Realized Gain | | Paid-In Capital |
| $832,213 | | $8,439,448 | | $(9,271,661) |
Net investment income and net realized gains (losses), as disclosed on the Statement of Operations, and net assets were not affected by this reclassification.
The tax character of distributions paid during the years ended August 31, 2007 and August 31, 2006 was as follows:
| | | | | | |
| | | August 31,
2007 | | August 31,
2006 |
| Distributions paid from: | | |
Ordinary Income* | | $ | 35,074,954 | | $ | 38,218,952 |
Return of Capital | | | 275,543 | | | 1,031,161 |
| * | For tax purposes short-term capital gains distributions, if any, are considered ordinary income distributions. |
36
Columbia Federal Securities Fund
August 31, 2007
As of August 31, 2007, the components of distributable earnings on a tax basis were as follows:
| | | | | | |
| | | | | | | |
| | | | | | | Net Unrealized Appreciation* |
| | | | | | $316,230 |
| * | The differences between book-basis and tax-basis net unrealized appreciation/depreciation are primarily due to deferral of losses from wash sales and amortization/accretion adjustments. |
Unrealized appreciation and depreciation at August 31, 2007, based on cost of investments for federal income tax purposes were:
| | | | |
| | | | |
Unrealized appreciation | | $ | 9,194,094 | |
Unrealized depreciation | | | (8,877,864 | ) |
Net unrealized appreciation | | $ | 316,230 | |
The following capital loss carryforwards, determined as of August 31, 2007, may be available to reduce taxable income arising from future net realized gains on investments, if any, to the extent permitted by the Internal Revenue Code:
| | |
| | | |
| Year of Expiration | | Capital Loss Carryforward |
| 2008 | | $39,883,064 |
| 2009 | | 29,849,094 |
| 2012 | | 24,359 |
| 2014 | | 10,286,822 |
| 2015 | | 7,609,058 |
| | $87,652,397 |
Capital loss carryforwards of $9,271,661 expired during the year ended August 31, 2007. Expired capital loss carryforwards are recorded as a reduction of paid-in-capital. Of the capital loss carryforwards attributable to the Fund, $15,616,545, (expiring 08/31/08) remains from the Liberty Intermediate Government Fund’s merger with the Fund and $259,852 ($235,493 expiring on 8/31/08 and $24,359 expiring on 08/31/12) remains from Nations Government Securities Fund’s merger with the Fund.
Any capital loss carryforwards acquired as part of a merger that are permanently lost due to provisions under the Internal Revenue Code are included as being expired. Expired capital loss carryforwards are recorded as a reduction of paid-in capital.
Under current tax rules, certain capital losses realized after October 31 may be deferred and treated as occurring on the first day of the following fiscal year. As of August 31, 2007 post-October capital losses of $1,974,049 attributed to security transactions were deferred to September 1, 2007.
In June 2006, the Financial Accounting Standards Board (“FASB”) issued FASB Interpretation No. 48, Accounting for Uncertainty in Income Taxes, an Interpretation of FASB Statement No. 109 (the “Interpretation”). This Interpretation is effective on the last business day of the semiannual reporting period for fiscal years beginning after December 15, 2006 and is to be applied to open tax positions upon initial adoption. This Interpretation prescribes a minimum recognition threshold and measurement method for the financial statement recognition of tax positions taken or expected to be taken in a tax return and also requires certain expanded disclosures. Management is evaluating the application of this Interpretation to the Fund and has not at this time quantified the impact, if any, resulting from the adoption of this Interpretation on the Fund’s financial statements.
Note 4. Fees and Compensation Paid to Affiliates
Investment Advisory Fee
Columbia, an indirect, wholly-owned subsidiary of Bank of America Corporation (“BOA”), is the investment advisor to the Fund and provides administrative and other services to the Fund. Columbia receives a monthly investment advisory fee based on the Fund’s average daily net assets at the following annual rates:
| | | |
| | | | |
| Average Daily Net Assets | | Annual Fee Rate | |
First $500 million | | 0.53 | % |
$500 million to $1 billion | | 0.48 | % |
$1 billion to $1.5 billion | | 0.45 | % |
$1.5 billion to $3 billion | | 0.42 | % |
Over $3 billion | | 0.40 | % |
For the year ended August 31, 2007, Columbia voluntarily waived $193,502. For the year ended August 31, 2007, the Fund’s effective investment advisory fee rate was 0.49% of the Fund’s average daily net assets.
37
Columbia Federal Securities Fund
August 31, 2007
Pricing and Bookkeeping Fees
Effective December 15, 2006, the Fund entered into a Financial Reporting Services Agreement (the “Financial Reporting Services Agreement”) with State Street Bank & Trust Company (“State Street”) and Columbia pursuant to which State Street provides financial reporting services to the Fund. Also effective December 15, 2006, the Fund entered into an Accounting Services Agreement with State Street and Columbia (collectively with the Financial Reporting Services Agreement, the “State Street Agreements”) pursuant to which State Street provides accounting services to the Fund. Under the State Street Agreements, the Fund pays State Street an annual fee of $38,000 paid monthly. Plus a monthly fee based on an annualized percentage rate of average daily net assets of the Fund for the month. The aggregate fee will not exceed $140,000 per year (exclusive of out-of-pocket expenses and charges). The Fund also reimburses State Street for certain out-of-pocket expenses and charges.
Effective December 15, 2006, the Fund entered into a Pricing and Bookkeeping Oversight and Services Agreement (the “Services Agreement”) with Columbia. Under the Services Agreement, Columbia provides services related to Fund expenses and the requirements of the Sarbanes-Oxley Act of 2002, and provides oversight of the accounting and financial reporting services provided by State Street. Under the Services Agreement, the Fund reimburses Columbia for out-of-pocket expenses and direct internal costs relating to accounting oversight and for services relating to Fund expenses and the requirements of the Sarbanes-Oxley Act of 2002.
Prior to December 15, 2006, Columbia was responsible for providing pricing and bookkeeping services to the Fund under a pricing and bookkeeping agreement and was entitled to receive an annual fee at the same fee structure described above under the State Street Agreements. Under separate agreements between Columbia and State Street, Columbia delegated certain functions to State Street. As a result of the delegation, the total fees payable under the pricing and bookkeeping agreement (other than certain reimbursements paid to Columbia and discussed below) were paid to State Street. The Fund also reimbursed Columbia and State Street for out-of-pocket expenses and charges, including fees payable to third parties for pricing the Fund’s portfolio securities and direct internal costs incurred by Columbia in connection with providing fund accounting oversight and monitoring and certain other services.
For the year ended August 31, 2007, the total amounts paid and payable to affiliates by the Fund under these agreements were $63,438 and $1,512, respectively.
Transfer Agent Fees
Columbia Management Services, Inc. (the “Transfer Agent”), an affiliate of Columbia and an indirect, wholly-owned subsidiary of BOA, provides shareholder services to the Fund and has contracted with Boston Financial Data Services (“BFDS”) to serve as sub-transfer agent. The Transfer Agent is entitled to receive a fee for its services, paid monthly, at the annual rate of $17.00 per open account plus reimbursement of certain sub-transfer agent fees paid by the Transfer Agent (exclusive of BFDS fees), calculated based on assets held in omnibus accounts and intended to recover the cost of payments to other parties (including affiliates of BOA) for services to those accounts. The Transfer Agent pays the fees of BFDS for services as sub-transfer agent and is not entitled to reimbursement for such fees from the Fund. The Transfer Agent may also retain, as additional compensation for its services, fees for wire, telephone and redemption orders, IRA trustee agent fees and account transcript fees due the Transfer Agent from shareholders of the Fund and credits (net of bank charges) earned with respect to balances in accounts the Transfer Agent maintains in connection with its services to the Fund. The Transfer Agent also receives reimbursement for certain out-of-pocket expenses.
An annual minimum account balance fee of $20, may apply on certain accounts with a value below the initial minimum investment requirements for such accounts to reduce the impact of small accounts on transfer agent fees. These minimum account balance fees are recorded as a reduction of total expenses on the Statement of Operations. For the year ended August 31, 2007, these minimum account balance fees reduced total expenses by $29,557.
For the year ended August 31, 2007, the Fund’s effective transfer agent fee rate, inclusive of out-of-pocket expenses, sub-transfer agent fees and net of minimum account balance fees, was 0.11% of the Fund’s average daily net assets.
38
Columbia Federal Securities Fund
August 31, 2007
Underwriting Discounts, Service and Distribution Fees
Columbia Management Distributors, Inc. (the “Distributor”), an affiliate of Columbia and an indirect, wholly-owned subsidiary of BOA, is the principal underwriter of the Fund. For the year ended August 31, 2007, the Distributor has retained net underwriting discounts of $11,627 on sales of the Fund’s Class A shares and received net CDSC fees of $319, $100,433 and $1,422 on Class A, Class B and Class C share redemptions, respectively.
The Fund has adopted Rule 12b-1 plans (the “Plans”), which require the payment of a monthly service fee to the Distributor at the annual rate of up to 0.25% of the average daily net assets attributable to Class A, Class B and Class C shares of the Fund. The Plans also require the payment of a monthly distribution fee to the Distributor at the annual rate of up to 0.75% of the average daily net assets attributable to Class B and Class C shares. The Distributor has voluntarily agreed to waive a portion of the Class C share distribution fee so that it will not exceed 0.60% annually of the average daily net assets attributable to the Class C shares. This arrangement may be modified or terminated by the Distributor at any time.
The CDSC and the distribution fees received from the Plans are used principally as repayment to the Distributor for amounts paid by the Distributor to dealers who sold such shares.
Custody Credits
The Fund has an agreement with its custodian bank under which custody fees may be reduced by balance credits. These credits are recorded as a reduction of total expenses on the Statement of Operations. The Fund could have invested a portion of the assets utilized in connection with the expense offset arrangement in an income-producing asset if it had not entered into such an agreement.
For the year ended August 31, 2007, these credits reduced total expenses by $2,391 for the Fund.
Fees Paid to Officers and Trustees
All officers of the Fund are employees of Columbia or its affiliates and, with the exception of the Fund’s Chief Compliance Officer, receive no compensation from the Fund. The Board of Trustees has appointed a Chief Compliance Officer to the Fund in accordance with federal securities regulations. The Fund, along with other affiliated funds, pays its pro-rata share of the expenses associated with the Chief Compliance Officer. The Fund’s expenses for the Chief Compliance Officer will not exceed $15,000 per year.
The Fund’s Trustees may participate in a deferred compensation plan which may be terminated at any time. Obligations of the plan will be paid solely out of the Fund’s assets.
As a result of a fund merger, the fund assumed the assets and liabilities of the acquired fund. The deferred compensation plan of the acquired fund may be terminated at any time. Any payments to plan participants are paid solely out of the fund’s assets.
Note 5. Portfolio Information
For the year ended August 31, 2007, the cost of purchases and proceeds from sales of securities, excluding short-term obligations, were $689,951,658 and $692,290,678, respectively, of which $645,904,865 and $661,539,067, respectively, were U.S. Government securities.
Note 6. Line of Credit
The Fund and other affiliated funds participate in a $350,000,000 committed unsecured revolving line of credit and a $150,000,000 uncommitted, unsecured line of credit, both provided by State Street. Borrowings are available for temporary or emergency purposes.
Interest on the committed line of credit is charged to each participating fund based on the fund’s borrowings at a rate per annum equal to the Federal Funds Rate plus 0.50%. In addition, a commitment fee of 0.10% per annum is accrued and apportioned among the participating funds based on their pro-rata portion of the unutilized committed line of credit. Interest on the uncommitted line of credit is charged to each participating fund based on the fund’s borrowings at a variable rate per annum equal to the Federal Funds Rate plus a spread, as determined and quoted by State Street at the time of the request for a loan. A one-time structuring fee of $30,000 is also accrued and apportioned to each fund participating in the uncommitted line of credit based on the average net assets of the participating funds. In addition, if the uncommitted line of credit is extended for an additional period, an annual administration fee of $15,000 will be charged and apportioned among each participating fund. The commitment fee and structuring fee are included in “Other expenses” in the Statement of Operations.
39
Columbia Federal Securities Fund
August 31, 2007
For the year ended August 31, 2007, the Fund did not borrow under these arrangements.
Note 7. Shares of Beneficial Interest
As of August 31, 2007, the Fund had one shareholder that held 8.8% of the Fund’s shares outstanding. These shares were beneficially owned by participant accounts over which BOA and/or any of its affiliates had either sole or joint investment discretion. Subscription and redemption activity of these accounts may have a significant effect on the operations of the Fund.
Note 8. Securities Lending
The Fund commenced a securities lending program in August 2006 and may lend its securities to certain approved brokers, dealers and other financial institutions. Each loan is collateralized by cash, in an amount at least equal to the market value of the securities loaned plus accrued income from the investment of collateral. The market value of the loaned securities is determined at the close of business of the Fund and any additional required collateral is delivered to the Fund on the next business day. The collateral received is invested and the income generated by the investment of the collateral, net of any fees remitted to State Street as the lending agent and borrower rebates, is paid to the Fund. Generally, in the event of borrower default, the Fund has the right to use the collateral to offset any losses incurred. In the event the Fund is delayed or prevented from exercising its right to dispose of the collateral, there may be a potential loss to the Fund. The Fund bears the risk of loss with respect to the investment of collateral.
Note 9. Disclosure of Significant Risks and Contingencies
Legal Proceedings
On February 9, 2005, Columbia Management Advisors, Inc. (which has since merged into Banc of America Capital Management, LLC (now named Columbia Management Advisors, LLC)) (“Columbia”) and Columbia Funds Distributor, Inc. (which has been renamed Columbia Management Distributors, Inc.) (the “Distributor”) (collectively, the “Columbia Group”) entered into an Assurance of Discontinuance with the New York Attorney General (“NYAG”) (the “NYAG Settlement”) and consented to the entry of a cease-and-desist order by the Securities and Exchange Commission (“SEC”) (the “SEC Order”) on matters relating to mutual fund trading.
Under the terms of the SEC Order, the Columbia Group agreed, among other things, to: pay $70 million in disgorgement and $70 million in civil money penalties; cease and desist from violations of the antifraud provisions and certain other provisions of the federal securities laws; maintain certain compliance and ethics oversight structures; retain an independent consultant to review the Columbia Group’s applicable supervisory, compliance, control and other policies and procedures; and retain an independent distribution consultant (see below). The Columbia Funds have also voluntarily undertaken to implement certain governance measures designed to maintain the independence of their boards of trustees. The NYAG Settlement also, among other things, requires Columbia and its affiliates to reduce management fees for certain Columbia Funds (including the former Nations Funds) and other mutual funds collectively by $32 million per year for five years, for a projected total of $160 million in management fee reductions.
Pursuant to the procedures set forth in the SEC Order, the $140 million in settlement amounts described above is being distributed in accordance with a distribution plan that was developed by an independent distribution consultant and approved by the SEC on April 6, 2007. Distributions under the distribution plan began in late June 2007.
A copy of the SEC Order is available on the SEC website at http://www.sec.gov. A copy of the NYAG Settlement is available as part of the Bank of America Corporation Form 8-K filing on February 10, 2005.
In connection with the events described above, various parties have filed suit against certain funds, the Trustees of the Columbia Funds, FleetBoston Financial Corporation and its affiliated entities and/or Bank of America and its affiliated entities.
On February 20, 2004, the Judicial Panel on Multidistrict Litigation transferred these cases and cases against other mutual fund companies based on similar allegations to the United States District Court in Maryland for consolidated or coordinated pretrial proceedings (the “MDL”). Subsequently, additional related cases were transferred to the MDL. On September 29, 2004, the plaintiffs in the MDL filed amended and consolidated complaints. One of these
40
Columbia Federal Securities Fund
August 31, 2007
amended complaints is a putative class action that includes claims under the federal securities laws and state common law, and that names Columbia, the Distributor, the Trustees of the Columbia Funds, Bank of America Corporation and others as defendants. Another of the amended complaints is a derivative action purportedly on behalf of the Columbia Funds that asserts claims under federal securities laws and state common law.
On February 25, 2005, Columbia and other defendants filed motions to dismiss the claims in the pending cases. On March 1, 2006, for reasons stated in the court’s memoranda dated November 3, 2005, the U.S. District Court for the District of Maryland granted in part and denied in part the defendants’ motions to dismiss. The court dismissed all of the class action claims pending against the Columbia Funds Trusts. As to Columbia and the Distributor, the claims under the Securities Act of 1933, the claims under Sections 34(b) and 36(a) of the Investment Company Act of 1940 (“ICA”) and the state law claims were dismissed. The claims under Sections 10(b) and 20(a) of the Securities Exchange Act of 1934 and claims under Section 36(b) of the ICA were not dismissed.
On March 21, 2005, a purported class action was filed in Massachusetts state court alleging that certain conduct, including market timing, entitled Class B shareholders in certain Columbia funds to an exemption from contingent deferred sales charges upon early redemption (“the CDSC Lawsuit”). The CDSC Lawsuit was removed to federal court in Massachusetts and transferred to the MDL.
On September 14, 2007, the plaintiffs and the Columbia defendants named in the MDL, including the Columbia Funds, entered into a stipulation of settlement with respect to all Columbia-related claims in the MDL described above, including the CDSC Lawsuit. The settlement is subject to court approval.
In 2004, the Columbia Funds’ adviser and distributor and certain affiliated entities and individuals were named as defendants in certain purported shareholder class and derivative actions making claims, including claims under the Investment Company and the Investment Advisers Acts of 1940 and state law. Certain Columbia Funds were named as nominal defendants. The suits allege, inter alia, that the fees and expenses paid by the funds are excessive and that the advisers and their affiliates inappropriately used fund assets to distribute the funds and for other improper purposes. On March 2, 2005, the actions were consolidated in the Massachusetts federal court as In re Columbia Entities Litigation. The plaintiffs filed a consolidated amended complaint on June 9, 2005. On November 30, 2005, the judge dismissed all claims by plaintiffs and entered final judgment in favor of the defendants. The plaintiffs appealed to the United States Court of Appeals for the First Circuit on December 30, 2005. A stipulation and settlement agreement dated January 19, 2007 was filed in the First Circuit on February 14, 2007, with a joint stipulation of dismissal and motion for remand to obtain district court approval of the settlement. That joint motion was granted and the appeal was dismissed. On March 6, 2007, the case was remanded to the District Court. On September 18, 2007, the District Court approved the settlement, to be effective following the expiration of the appeal period. The funds’ adviser and/or its affiliates will be required, pursuant to the settlement, to make certain payments including plaintiffs’ attorneys’ fees and costs of notice to class members.
Note 10. Business Combinations & Mergers
On September 23, 2005, Nations Government Securities Fund merged into Columbia Federal Securities Fund. Columbia Federal Securities Fund received a tax-free transfer of assets from Nations Government Securities Fund as follows:
| | | | |
| | | |
Shares
Issued | | Net Assets
Received | | Unrealized
Appreciation1 |
| 13,669,771 | | $145,181,008 | | $270,304 |
| | | | |
| | | |
Net Assets of
Columbia Federal
Securities Fund
Prior to
Combination | | Net Assets of
Nations Government
Securities Fund
Immediately Prior
to Combination | | Net Assets of
Columbia Federal
Securities Fund
Immediately After
Combination |
| $849,411,528 | | $145,181,008 | | $994,592,536 |
1 | Unrealized appreciation is included in the Net Assets received. |
41
Report of Independent Registered Public Accounting Firm
To the Shareholders and Trustees of Columbia Federal Securities Fund
In our opinion, the accompanying statement of assets and liabilities, including the investment portfolio, and the related statements of operations and of changes in net assets and the financial highlights present fairly, in all material respects, the financial position of Columbia Federal Securities Fund (constituting part of Columbia Funds Series Trust I, hereafter referred to as the “Fund”) at August 31, 2007, the results of its operations for the year then ended, and the changes in its net assets for each of the two years in the period then ended and the financial highlights for each of the five years in the period then ended, in conformity with accounting principles generally accepted in the United States of America. These financial statements and financial highlights (hereafter referred to as “financial statements”) are the responsibility of the Fund’s management; our responsibility is to express an opinion on these financial statements based on our audits. We conducted our audits of these financial statements in accordance with the standards of the Public Company Accounting Oversight Board (United States). Those standards require that we plan and perform the audit to obtain reasonable assurance about whether the financial statements are free of material misstatement. An audit includes examining, on a test basis, evidence supporting the amounts and disclosures in the financial statements, assessing the accounting principles used and significant estimates made by management, and evaluating the overall financial statement presentation. We believe that our audits, which included confirmation of securities at August 31, 2007 by correspondence with the custodian and brokers, provide a reasonable basis for our opinion.
PricewaterhouseCoopers LLP
Boston, Massachusetts
October 26, 2007
42
Fund Governance
The Trustees serve terms of indefinite duration. The names, addresses and ages of the Trustees and officers of the Funds in Columbia Funds Series Trust I, the year each was first elected or appointed to office, their principal business occupations during at least the last five years, the number of portfolios overseen by each Trustee and other directorships they hold are shown below. Each officer listed below serves as an officer of each Fund in the Columbia Funds Complex.
Independent Trustees
| | |
Name, address and year of birth,
Position with funds, Year first
elected or appointed to office1 | | Principal occupation(s) during past five years, Number of portfolios in Columbia Funds
Complex overseen by trustee, Other directorships held |
| |
| Douglas A. Hacker (Born 1955) | | |
c/o Columbia Management Advisors, LLC One Financial Center Boston, MA 02111 Trustee (since 1996) | | Independent business executive since May, 2006; Executive Vice President-Strategy of United Airlines (airline) from December, 2002 to May, 2006; President of UAL Loyalty Services (airline marketing company) from September, 2001 to December, 2002; Executive Vice President and Chief Financial Officer of United Airlines from July, 1999 to September, 2001. Oversees 68, Nash Finch Company (food distributor); Aircastle Limited (aircraft leasing) |
| |
| Janet Langford Kelly (Born 1957) | | |
c/o Columbia Management Advisors, LLC One Financial Center Boston, MA 02111 Trustee (since 1996) | | Senior Vice President, General Counsel and Corporate Secretary, ConocoPhillips (integrated energy company) since September, 2007; Deputy General Counsel–Corporate Legal Services, ConocoPhillips from August, 2006 to August, 2007; Partner, Zelle, Hofmann, Voelbel, Mason & Gette LLP (law firm) from March, 2005 to July, 2006; Adjunct Professor of Law, Northwestern University, from September, 2004 to June, 2006, Director, UAL Corporation (airline) from February, 2006 to July, 2006; Chief Administrative Officer and Senior Vice President, Kmart Holding Corporation (consumer goods), from September, 2003 to March, 2004; Executive Vice President–Corporate Development and Administration, General Counsel and Secretary, Kellogg Company (food manufacturer), from September, 1999 to August, 2003. Oversees 68, None |
| |
| Richard W. Lowry (Born 1936) | | |
c/o Columbia Management Advisors, LLC One Financial Center Boston, MA 02111 Trustee (since 1995) | | Private Investor since August, 1987 (formerly Chairman and Chief Executive Officer, U.S. Plywood Corporation (building products manufacturer) until 1987). Oversees 68, Liberty All-Star Equity Fund and Liberty All-Star Growth Fund, Inc. (closed-end funds) |
| |
| Charles R. Nelson (Born 1942) | | |
c/o Columbia Management Advisors, LLC One Financial Center Boston, MA 02111 Trustee (since 1981) | | Professor of Economics, University of Washington, since January, 1976; Ford and Louisa Van Voorhis Professor of Political Economy, University of Washington, since September, 1993; Director, Institute for Economic Research, University of Washington from September, 2001 to June, 2003; Adjunct Professor of Statistics, University of Washington, since September, 1980; Associate Editor, Journal of Money Credit and Banking, since September, 1993; Consultant on econometric and statistical matters. Oversees 68, None |
1 | In December 2000, the boards of each of the former Liberty Funds and former Stein Roe Funds were combined into one board of trustees responsible for the oversight of both fund groups (collectively, the “Liberty Board”). In October 2003, the trustees on the Liberty Board were elected to the boards of the Columbia Funds (the “Columbia Board”) and of the CMG Fund Trust (the “CMG Funds Board”); simultaneous with that election, Patrick J. Simpson who had been a director on the Columbia Board and trustee on the CMG Funds Board, was appointed to serve as trustee of the Liberty Board. The date shown is the earliest date on which a trustee/director was elected or appointed to the board of a Fund in the Columbia Funds Complex. |
43
Fund Governance (continued)
| | |
Name, address and year of birth,
Position with funds, Year first
elected or appointed to office1 | | Principal occupation(s) during past five years, Number of portfolios in Columbia Funds
Complex overseen by trustee, Other directorships held |
| |
| John J. Neuhauser (Born 1943) | | |
c/o Columbia Management Advisors, LLC One Financial Center Boston, MA 02111 Trustee (since 1985) | | President, St. Michaels College, since August, 2007; University Professor, Boston College from November, 2005 to August, 2007; Academic Vice President and Dean of Faculties, Boston College from August, 1999 to October, 2005. Oversees 68, Liberty All-Star Equity Fund and Liberty All-Star Growth Fund, Inc. (closed-end funds) |
| |
| Patrick J. Simpson (Born 1944) | | |
c/o Columbia Management Advisors, LLC One Financial Center Boston, MA 02111 Trustee (since 2000) | | Partner, Perkins Coie LLP (law firm). Oversees 68, None |
| |
| Thomas E. Stitzel (Born 1936) | | |
c/o Columbia Management Advisors, LLC One Financial Center Boston, MA 02111 Trustee (since 1998) | | Business Consultant since 1999; Chartered Financial Analyst. Oversees 68, None |
| |
| Thomas C. Theobald (Born 1937) | | |
c/o Columbia Management Advisors, LLC One Financial Center Boston, MA 02111 Trustee and Chairman of the Board2 (since 1996) | | Partner and Senior Advisor, Chicago Growth Partners (private equity investing) since September, 2004; Managing Director, William Blair Capital Partners (private equity investing) from September, 1994 to September, 2004. Oversees 68, Anixter International (network support equipment distributor); Ventas, Inc. (real estate investment trust); Jones Lang LaSalle (real estate management services); Ambac Financial Group (financial guaranty insurance) |
| |
| Anne-Lee Verville (Born 1945) | | |
c/o Columbia Management Advisors, LLC One Financial Center Boston, MA 02111 Trustee (since 1998) | | Retired since 1997 (formerly General Manager, Global Education Industry, IBM Corporation (computer and technology) from 1994 to 1997). Oversees 68, None |
Interested Trustee
| | |
| |
| William E. Mayer (Born 1940) | | |
c/o Columbia Management Advisors, LLC One Financial Center Boston, MA 02111 Trustee3 (since 1994) | | Partner, Park Avenue Equity Partners (private equity) since February, 1999; Dean and Professor, College of Business, University of Maryland, 1992 to 1997. Oversees 68, Lee Enterprises (print media), WR Hambrecht + Co. (financial service provider); Reader’s Digest (publishing) |
2 | Mr. Theobald was appointed as Chairman of the Board effective December 10, 2003. |
3 | Mr. Mayer is an “interested person” (as defined in the Investment Company Act of 1940) by reason of his affiliation with WR Hambrecht + Co. |
The Statement of Additional Information includes additional information about the Trustees of the Funds and is available, without charge, upon request by calling 1-800-345-6611.
44
Fund Governance (continued)
Officers
| | |
Name, address and year of birth,
Position with Columbia Funds, Year
first elected or appointed to office | | Principal occupation(s) during past five years |
| |
| Christopher L. Wilson (Born 1957) | | |
One Financial Center Boston, MA 02111 President (since 2004) | | President–Columbia Funds, since October 2004; Managing Director–Columbia Management Advisors, LLC, since September 2005; Senior Vice President–Columbia Management Distributors, Inc., since January 2005; Director–Columbia Management Services, Inc., since January 2005; Director–Bank of America Global Liquidity Funds, plc and Banc of America Capital Management (Ireland), Limited, since May 2005; Director–FIM Funding, Inc., since January 2005; President and Chief Executive Officer–CDC IXIS AM Services, Inc. (investment management), from September 1998 through August 2004; and a senior officer or director of various other Bank of America-affiliated entities, including other registered and unregistered funds. |
|
| James R. Bordewick, Jr. (Born 1959) |
One Financial Center Boston, MA 02111 Senior Vice President, Secretary and Chief Legal Officer (since 2006) | | Associate General Counsel, Bank of America since April, 2005; Senior Vice President and Associate General Counsel, MFS Investment Management (investment management) prior to April, 2005. |
| |
| J. Kevin Connaughton (Born 1964) | | |
One Financial Center Boston, MA 02111 Senior Vice President, Chief Financial Officer and Treasurer (since 2000) | | Treasurer–Columbia Funds, since October 2003; Treasurer–the Liberty Funds, Stein Roe Funds and Liberty All-Star Funds, December 2000–December 2006; Vice President–Columbia Management Advisors, Inc., since April 2003; President–Columbia Funds, Liberty Funds and Stein Roe Funds, February 2004 to October 2004; Treasurer–Galaxy Funds, September 2002 to December 2005; Treasurer, December 2002 to December 2004, and President, February 2004 to December 2004–Columbia Management Multi-Strategy Hedge Fund, LLC; and a senior officer of various other Bank of America-affiliated entities, including other registered and unregistered funds. |
| |
| Linda J. Wondrack (Born 1964) | | |
One Financial Center Boston, MA 02111 Senior Vice President, Chief Compliance Officer (since 2007) | | Director (Columbia Management Group LLC and Investment Product Group Compliance), Bank of America since June 2005; Director of Corporate Compliance and Conflicts Officer, MFS Investment Management (investment management), August 2004 to May 2005; Managing Director, Deutsche Asset Management (investment management) prior to August 2004. |
| |
| Michael G. Clarke (Born 1969) | | |
One Financial Center Boston, MA 02111 Chief Accounting Officer and Assistant Treasurer (since 2004) | | Director of Fund Administration of the Advisor since January, 2006; Managing Director of the Advisor September, 2004 to December, 2005; Vice President Fund Administration of the Advisor June, 2002 to September, 2004. Vice President Product Strategy and Development of the Advisor from February, 2001 to June, 2002. |
| |
| Jeffrey R. Coleman (Born 1969) | | |
One Financial Center Boston, MA 02111 Deputy Treasurer (since 2006) | | Director of Fund Administration of the Advisor since January, 2006; Fund Controller of the Advisor from October 2004 to January 2006; Vice President of CDC IXIS Asset Management Services, Inc. (investment management) from August, 2000 to September, 2004. |
45
Fund Governance (continued)
| | |
Name, address and year of birth,
Position with Columbia Funds, Year
first elected or appointed to office | | Principal occupation(s) during past five years |
| |
| Joseph F. DiMaria (Born 1968) | | |
One Financial Center Boston, MA 02111 Deputy Treasurer (since 2006) | | Director of Fund Administration of the Advisor since January, 2006; Head of Tax/Compliance and Assistant Treasurer of the Advisor from November, 2004 to December, 2005; Director of Trustee Administration (Sarbanes-Oxley) of the Advisor from May, 2003 to October, 2004; Senior Audit Manager, PricewaterhouseCoopers (independent registered public accounting firm) from July, 2000 to April, 2003. |
| |
| Marybeth C. Pilat (Born 1968) | | |
One Financial Center Boston, MA 02111 Deputy Treasurer (since 2007) | | Vice President, Mutual Fund Valuation of the Advisor since January 2006; Vice President, Mutual Fund Accounting Oversight of the Advisor prior to January 2006. |
| |
| Barry S. Vallan (Born 1969) | | |
One Financial Center Boston, MA 02111 Controller (since 2006) | | Vice President-Fund Treasury of the Advisor since October, 2004; Vice President–Trustee Reporting of the Advisor from April, 2002 to October, 2004; Management Consultant, PricewaterhouseCoopers (independent registered public accounting firm) prior to October, 2002. |
46
Columbia Funds
| | |
| Growth funds | | Columbia Acorn Fund Columbia Acorn Select Columbia Acorn USA Columbia Large Cap Growth Fund Columbia Marsico 21st Century Fund Columbia Marsico Focused Equities Fund Columbia Marsico Growth Fund Columbia Mid Cap Growth Fund Columbia Small Cap Growth Fund I Columbia Small Cap Growth Fund II |
| Core funds | | Columbia Common Stock Fund Columbia Large Cap Core Fund Columbia Small Cap Core Fund |
| Value funds | | Columbia Disciplined Value Fund Columbia Dividend Income Fund Columbia Large Cap Value Fund Columbia Mid Cap Value Fund Columbia Small Cap Value Fund I Columbia Small Cap Value Fund II Columbia Strategic Investor Fund |
| Asset Allocation/Hybrid funds | | Columbia Asset Allocation Fund Columbia Asset Allocation Fund II Columbia Balanced Fund Columbia Liberty Fund Columbia LifeGoalTM Balanced Growth Portfolio Columbia LifeGoalTM Growth Portfolio Columbia LifeGoalTM Income Portfolio Columbia LifeGoalTM Income and Growth Portfolio Columbia Masters Global Equity Portfolio Columbia Masters Heritage Portfolio Columbia Masters International Equity Portfolio Columbia Thermostat Fund |
| Index funds | | Columbia Large Cap Enhanced Core Fund Columbia Large Cap Index Fund Columbia Mid Cap Index Fund Columbia Small Cap Index Fund |
| Specialty funds | | Columbia Convertible Securities Fund Columbia Real Estate Equity Fund Columbia Technology Fund |
| Global/International funds | | Columbia Acorn International Columbia Acorn International Select Columbia Global Value Fund Columbia Greater China Fund Columbia International Stock Fund Columbia International Value Fund Columbia Marsico International Opportunities Fund Columbia Multi-Advisor International Equity Fund Columbia World Equity Fund |
47
| | |
| Taxable Bond funds | | Columbia Conservative High Yield Fund Columbia Core Bond Fund Columbia Federal Securities Fund Columbia High Income Fund Columbia High Yield Opportunity Fund Columbia Income Fund Columbia Intermediate Bond Fund Columbia Short Term Bond Fund Columbia Strategic Income Fund Columbia Total Return Bond Fund Columbia U.S. Treasury Index Fund |
| Tax-Exempt Bond funds | | Columbia California Tax-Exempt Fund Columbia California Intermediate Municipal Bond Fund Columbia Connecticut Tax-Exempt Fund Columbia Connecticut Intermediate Municipal Bond Fund Columbia Georgia Intermediate Municipal Bond Fund Columbia High Yield Municipal Fund Columbia Intermediate Municipal Bond Fund Columbia Massachusetts Intermediate Municipal Bond Fund Columbia Massachusetts Tax-Exempt Fund Columbia Maryland Intermediate Municipal Bond Fund Columbia North Carolina Intermediate Municipal Bond Fund Columbia New York Tax-Exempt Fund Columbia New Jersey Intermediate Municipal Bond Fund Columbia New York Intermediate Municipal Bond Fund Columbia Oregon Intermediate Municipal Bond Fund Columbia Rhode Island Intermediate Municipal Bond Fund Columbia South Carolina Intermediate Municipal Bond Fund Columbia Short Term Municipal Bond Fund Columbia Tax-Exempt Fund Columbia Virginia Intermediate Municipal Bond Fund |
| Money Market funds | | Columbia California Tax-Exempt Reserves Columbia Cash Reserves Columbia Connecticut Municipal Reserves Columbia Government Plus Reserves Columbia Government Reserves Columbia Massachusetts Municipal Reserves Columbia Money Market Reserves Columbia Municipal Reserves Columbia New York Tax-Exempt Reserves Columbia Prime Reserves Columbia Tax-Exempt Reserves Columbia Treasury Reserves |
For complete product information on any Columbia Fund, visit our website at www.columbiafunds.com.
48
Important Information About This Report
Transfer Agent
Columbia Management Services, Inc.
P.O. Box 8081
Boston, MA 02266-8081
1-800-345-6611
Distributor
Columbia Management
Distributors, Inc.
One Financial Center
Boston, MA 02111
Investment Advisor
Columbia Management Advisors, LLC
100 Federal Street
Boston, MA 02110
The fund mails one shareholder report to each shareholder address. If you would like more than one report, please call shareholder services at 1-800-345-6611 and additional reports will be sent to you. This report has been prepared for shareholders of Columbia Federal Securities Fund.
A description of the policies and procedures that the fund uses to determine how to vote proxies and a copy of the fund’s voting records are available (i) at www.columbiamanagement.com; (ii) on the Securities and Exchange Commission’s website at www.sec.gov, and (iii) without charge, upon request, by calling 1-800-368-0346. Information regarding how the fund voted proxies relating to portfolio securities during the 12-month period ended June 30 is available from the SEC’s website. Information regarding how the fund voted proxies relating to portfolio securities is also available from the fund’s website.
The fund files a complete schedule of portfolio holdings with the SEC for the first and third quarters of each fiscal year on Form N-Q. The fund’s Form N-Q is available on the SEC’s website at www.sec.gov and may be reviewed and copied at the SEC’s Public Reference Room in Washington, D.C. Information on the operation of the Public Reference Room may be obtained by calling 1-800-SEC-0330.
Please consider the investment objectives, risks, charges and expenses for the fund carefully before investing. Contact your financial advisor for a prospectus, which contains this and other important information about the fund. You should read it carefully before you invest.
Columbia Management Group, LLC (“Columbia Management”) is the investment management division of Bank of America Corporation. Columbia Management entities furnish investment management services and products for institutional and individual investors. Columbia Funds are distributed by Columbia Management Distributors, Inc., member of FINRA, SIPC, part of Columbia Management and an affiliate of Bank of America Corporation.
49
Columbia Federal Securities Fund
Annual Report – August 31, 2007
©2007 Columbia Management Distributors, Inc.
One Financial Center, Boston, MA 02111-2621
800-345-6611 www.columbiafunds.com
SHC - 42/135303-0807(10/07)07/44819
Item 2. Code of Ethics.
(a) The registrant has, as of the end of the period covered by this report, adopted a code of ethics that applies to the registrant’s principal executive officer, principal financial officer, principal accounting officer or controller, or persons performing similar functions, regardless of whether these individuals are employed by the registrant or a third party.
(b) During the period covered by this report, there were not any amendments to a provision of the code of ethics adopted in 2(a) above.
(c) During the period covered by this report, there were no waivers, including any implicit waivers, from a provision of the code of ethics described in 2(a) above that relates to one or more of the items set forth in paragraph (b) of this item’s instructions.
Item 3. Audit Committee Financial Expert.
The registrant’s Board of Trustees has determined that Douglas A. Hacker, Thomas E. Stitzel and Anne-Lee Verville, each of whom are members of the registrant’s Board of Trustees and Audit Committee, each qualify as an audit committee financial expert. Mr. Hacker, Mr. Stitzel and Ms. Verville are each independent trustees, as defined in paragraph (a)(2) of this item’s instructions and collectively constitute the entire Audit Committee.
Item 4. Principal Accountant Fees and Services.
Fee information below is disclosed for the eleven series of the registrant whose reports to stockholders are included in this annual filing. Fee information for fiscal year ended August 31, 2007 also includes fees for two series that were merged into the registrant during the period. Comparative fee information for fiscal year ended August 31, 2006 also includes fees for two series that were merged into the registrant.
(a) Audit Fees. Aggregate Audit Fees billed by the principal accountant for professional services rendered during the fiscal years ended August 31, 2007 and August 31, 2006 are approximately as follows:
2007 | | 2006 | |
$ | 383,300 | | $ | 356,000 | |
| | | | | |
Audit Fees include amounts related to the audit of the registrant’s annual financial statements or services that are normally provided by the accountant in connection with statutory and regulatory filings or engagements for those fiscal years.
(b) Audit-Related Fees. Aggregate Audit-Related Fees billed to the registrant by the principal accountant for professional services rendered during the fiscal years ended August 31, 2007 and August 31, 2006 are approximately as follows:
2007 | | 2006 | |
$ | 45,100 | | $ | 63,300 | |
| | | | | |
Audit-Related Fees include amounts for assurance and related services by the principal accountant that are reasonably related to the performance of the audit of the registrant’s financial statements and are not reported in Audit Fees above. In both fiscal years 2007 and 2006, Audit-Related Fees consist of agreed-upon procedures performed for semi-annual shareholder reports. Fiscal year 2006 also includes Audit-Related Fees for agreed-upon procedures related to fund mergers.
During the fiscal years ended August 31, 2007 and August 31, 2006, there were no Audit-Related Fees billed by the registrant’s principal accountant to the registrant’s investment adviser (not including any sub-adviser whose role is primarily portfolio management and is subcontracted with or overseen by another investment adviser) and any entity controlling, controlled by, or under common control with the adviser that provides ongoing services to the registrant for an engagement that related directly to the operations and financial reporting of the registrant.
(c) Tax Fees. Aggregate Tax Fees billed by the principal accountant to the registrant for professional services rendered during the fiscal years ended August 31, 2007 and August 31, 2006 are approximately as follows:
2007 | | 2006 | |
$ | 94,900 | | $ | 85,900 | |
| | | | | |
Tax Fees include amounts for the review of annual tax returns, the review of required shareholder distribution calculations and typically include amounts for professional services by the principal accountant for tax compliance, tax advice and tax planning. Both fiscal years 2007 and 2006 also include tax fees for agreed-upon procedures related to fund mergers and the review of final tax returns and foreign tax assistance.
During the fiscal years ended August 31, 2007 and August 31, 2006, there were no Tax Fees billed by the registrant’s principal accountant to the registrant’s investment adviser (not including any sub-adviser whose role is primarily portfolio management and is subcontracted with or overseen by another investment adviser) and any entity controlling,
controlled by, or under common control with the adviser that provides ongoing services to the registrant for an engagement that related directly to the operations and financial reporting of the registrant.
(d) All Other Fees. Aggregate All Other Fees billed by the principal accountant to the registrant for professional services rendered during the fiscal years ended August 31, 2007 and August 31, 2006 are approximately as follows:
All Other Fees include amounts for products and services provided by the principal accountant, other than the services reported in paragraphs (a) through (c) above. In both fiscal years 2007 and 2006, All Other Fees consist of fees billed for agreed-upon procedures related to the review of the registrant’s anti-money laundering program.
Aggregate All Other Fees billed by the registrant’s principal accountant to the registrant’s investment adviser (not including any sub-adviser whose role is primarily portfolio management and is subcontracted with or overseen by another investment adviser) and any entity controlling, controlled by, or under common control with the adviser that provides ongoing services to the registrant for an engagement that related directly to the operations and financial reporting of the registrant during the fiscal years ended August 31, 2007 and August 31, 2006 are approximately as follows:
2007 | | 2006 | |
$ | 849,100 | | $ 361,600 | |
| | | | |
In both fiscal years 2007 and 2006, All Other Fees consist of fees billed for internal control examinations of the registrant’s transfer agent and investment advisor.
(e)(1) Audit Committee Pre-Approval Policies and Procedures
The registrant’s Audit Committee is required to pre-approve the engagement of the registrant’s independent accountants to provide audit and non-audit services to the registrant and non-audit services to its investment adviser (not including any sub-adviser whose role is primarily portfolio management and is subcontracted with or overseen by another investment adviser) or any entity controlling, controlled by or under common control with such investment adviser that provides ongoing services to the registrant (“Adviser Affiliates”), if the engagement relates directly to the operations and financial reporting of the registrant.
The Audit Committee has adopted a Policy for Engagement of Independent Accountants for Audit and Non-Audit Services (“Policy”). The Po licy sets forth the understanding of the Audit Committee regarding the engagement of the registrant’s independent accountants to provide (i) audit and permissible audit-related, tax and other services to the registrant (collectively “Fund Services”); (ii) non-audit services to the
registrant’s investment adviser (not including any sub-adviser whose role is primarily portfolio management and is subcontracted with or overseen by another investment adviser) and Adviser Affiliates, if the engagement relates directly to the operations or financial reporting of a Fund (collectively “Fund-related Adviser Services”); and (iii) certain other audit and non-audit services to the registrant’s investment adviser (not including any sub-adviser whose role is primarily portfolio management and is subcontracted with or overseen by another investment adviser) and Adviser Affiliates. Unless a type of service receives general pre-approval under the Policy, it requires specific pre-approval by the Audit Committee if it is to be provided by the independent accountants. Pre-approval of non-audit services to the registrant, the registrant’s investment adviser (not including any sub - -adviser whose role is primarily portfolio management and is subcontracted with or overseen by another investment adviser) and Adviser Affiliates may be waived provided that the “de minimis” requirements set forth under paragraph (c)(7)(i)(C) of Rule 2-01 of Regulation S-X are met.
Under the Policy, the Audit Committee may delegate pre-approval authority to any pre-designated member or members who are Independent Trustees/Directors. The member(s) to whom such authority is delegated must report, for informational purposes only, any pre-approval decisions to the Audit Committee at its next regular meeting. The Audit Committee’s responsibilities with respect to the pre-approval of services performed by the independent accountants may not be delegated to management.
The Policy requires the Fund Treasurer and/or Director of Board Administration to submit to the Audit Committee, on an annual basis, a schedule of the types of services that are subject to general pre-approval. The schedule(s) provide a description of each type of service that is subject to general pre-approval and, where possible, will provide estimated fee caps for each instance of providing each service. The Audit Committees will review and approve the types of services and review the projected fees for the next fiscal year and may add to, or subtract from, the list of general pre-approved services from time to time based on subsequent determinations. That approval acknowledges that the Audit Committee is in agreement with the specific types of services that the independent accountants will be permitted to perform.
The Fund Treasurer and/or Director of Board Administration shall report to the Audit Committee at each of its regular meetings regarding all Fund Services or Fund-related Adviser Services initiated since the last such report was rendered, including a general description of the services, actual billed and projected fees, and the means by which such Fund Services or Fund-related Adviser Services were pre-approved by the Audit Committee.
*****
(e)(2) The percentage of services described in paragraphs (b) through (d) of this Item approved pursuant to the “de minimis” exception under paragraph (c)(7)(i)(C) of Rule 2-01 of Regulation S-X during both fiscal years ended August 31, 2007 and August 31, 2006 was zero.
(f) Not applicable.
(g) The aggregate non-audit fees billed by the registrant’s accountant for services rendered to the registrant, and rendered to the registrant’s investment adviser (not including any sub-adviser whose role is primarily portfolio management and is subcontracted with or overseen by another investment adviser), and any entity controlling, controlled by, or under common control with the adviser that provides ongoing services to the registrant for the fiscal years ended August 31, 2007 and August 31, 2006 are approximately as follows:
2007 | | 2006 | |
$ | 989,600 | | $ | 513,300 | |
| | | | | |
(h) The registrant’s Audit Committee of the Board of Directors has considered whether the provision of non-audit services that were rendered to the registrant’s adviser (not including any sub-adviser whose role is primarily portfolio management and is subcontracted with or overseen by another investment adviser), and any entity controlling, controlled by, or under common control with the investment adviser that provides ongoing services to the registrant that were not pre-approved pursuant to paragraph (c)(7)(ii) of Rule 2-01 of Regulation S-X, is compatible with maintaining the principal accountant’s independence.
Item 5. Audit Committee of Listed Registrants.
Not applicable.
Item 6. Schedule of Investments
The registrant’s “Schedule I – Investments in securities of unaffiliated issuers” (as set forth in 17 CFR 210.12-12) is included in Item 1 of this Form N-CSR.
Item 7. Disclosure of Proxy Voting Policies and Procedures for Closed-End Management Investment Companies.
Not applicable.
Item 8. Portfolio Managers of Closed-End Management Investment Companies.
Not applicable.
Item 9. Purchases of Equity Securities by Closed-End Management Investment Company and Affiliated Purchasers.
Not applicable.
Item 10. Submission of Matters to a Vote of Security Holders.
There have not been any material changes to the procedures by which shareholders may recommend nominees to the registrant’s board of directors, since those procedures were last disclosed in response to requirements of Item 7(d)(2)(ii)(G) of Schedule 14A or this Item.
Item 11. Controls and Procedures.
(a) The registrant’s principal executive officer and principal financial officers, based on their evaluation of the registrant’s disclosure controls and procedures as of a date within 90 days of the filing of this report, have concluded that such controls and procedures are adequately designed to ensure that information required to be disclosed by the registrant in Form N-CSR is accumulated and communicated to the registrant’s management, including the principal executive officer and principal financial officer, or persons performing similar functions, as appropriate to allow timely decisions regarding required disclosure.
(b) There was no change in the registrant’s internal control over financial reporting that occurred during the registrant’s second fiscal quarter of the period covered by this report that has materially affected, or is reasonably likely to materially affect, the registrant’s internal control over financial reporting.
Item 12. Exhibits.
(a)(1) Code of ethics required to be disclosed under Item 2 of Form N-CSR attached hereto as Exhibit 99.CODE ETH.
(a)(2) Certifications pursuant to Rule 30a-2(a) under the Investment Company Act of 1940 (17 CFR 270.30a-2(a)) attached hereto as Exhibit 99.CERT.
(a)(3) Not applicable.
(b) Certification pursuant to Rule 30a-2(b) under the Investment Company Act of 1940 (17 CFR 270.30a-2(b)) attached hereto as Exhibit 99.906CERT.
SIGNATURES
Pursuant to the requirements of the Securities Exchange Act of 1934 and the Investment Company Act of 1940, the registrant has duly caused this report to be signed on its behalf by the undersigned, thereunto duly authorized.
(registrant) | | Columbia Funds Series Trust I | |
| | |
| | |
By (Signature and Title) | | /s/ Christopher L. Wilson | |
| Christopher L. Wilson, President | |
| | |
| | |
Date | | October 30, 2007 | |
| | | | | | |
Pursuant to the requirements of the Securities Exchange Act of 1934 and the Investment Company Act of 1940, this report has been signed below by the following persons on behalf of the registrant and in the capacities and on the dates indicated.
By (Signature and Title) | | /s/ Christopher L. Wilson | |
| Christopher L. Wilson, President | |
| | |
| | |
Date | | October 30, 2007 | |
| | | | |
By (Signature and Title) | | /s/ J. Kevin Connaughton | |
| J. Kevin Connaughton, Treasurer | |
| | |
| | |
Date | | October 30, 2007 | |
| | | | |