UNITED STATES
SECURITIES AND EXCHANGE COMMISSION
Washington, D.C. 20549
FORM N-CSR
CERTIFIED SHAREHOLDER REPORT OF REGISTERED
MANAGEMENT INVESTMENT COMPANIES
Investment Company Act file number 811-04367
Columbia Funds Series Trust I
(Exact name of registrant as specified in charter)
225 Franklin Street
Boston, Massachusetts 02110
(Address of principal executive offices) (Zip code)
Ryan Larrenaga
c/o Columbia Management Investment Advisers, LLC
225 Franklin Street
Boston, MA 02110
(Name and address of agent for service)
Registrant’s telephone number, including area code: (800) 345-6611
Date of fiscal year end: April 30
Date of reporting period: April 30, 2017
Form N-CSR is to be used by management investment companies to file reports with the Commission not later than 10 days after the transmission to stockholders of any report that is required to be transmitted to stockholders under Rule 30e-1 under the Investment Company Act of 1940 (17 CFR 270.30e-1). The Commission may use the information provided on Form N-CSR in its regulatory, disclosure review, inspection, and policymaking roles.
A registrant is required to disclose the information specified by Form N-CSR, and the Commission will make this information public. A registrant is not required to respond to the collection of information contained in Form N-CSR unless the Form displays a currently valid Office of Management and Budget (“OMB”) control number. Please direct comments concerning the accuracy of the information collection burden estimate and any suggestions for reducing the burden to Secretary, Securities and Exchange Commission, 450 Fifth Street, NW, Washington, DC 20549-0609. The OMB has reviewed this collection of information under the clearance requirements of 44 U.S.C. § 3507.
Columbia Funds Series Trust I
Item 1. Reports to Stockholders.

Annual Report
April 30, 2017
Not FDIC Insured • No bank guarantee • May lose value
Dear Shareholders,
While emotions have run high following the outcome of the U.S. Presidential election, it remains unclear how the Trump presidency will unfold in terms of policy. We have a sense of the priorities espoused by the President over the past eighteen months, but campaign priorities are not always realized and are often never pursued. What seems certain is that, while some investors have already priced expectations into the market, others have retreated, preferring instead a wait and see approach. The outcome of such behaviors appears to have created conditions ripe for ongoing market volatility.
While volatility in the financial markets can be stressful, volatility itself is not a new phenomenon. Other factors that have been at the root cause of recent volatility include uncertainty following the United Kingdom’s vote to exit the European Union (Brexit), speculation around the Federal Reserve’s decision to increase interest rates, divergent central bank policy and geopolitical unrest. The point is, financial markets have fluctuated for years and may be expected to continue to fluctuate — sometimes wildly. If anything, such volatility seems to be the new normal, perhaps exacerbated by access to information and development of technological tools which have enabled investors to react rapidly to real and perceived change. So what can you do?
Position your portfolio for the reality of market volatility
That there is a historical precedent for market volatility, or even an acceptance that it may persist, offers little comfort. A measured and strategic approach remains the best strategy for investors to stay on track in achieving their investment goals.
Step 1: Review your investment goals
Take this opportunity to review your investment goals and the strategies you are pursuing to achieve those goals in order to remain focused on what’s important to you. It is entirely possible that your goals have changed in response either to your life situation or to changes in the market. Accept what you can’t control — volatility, and focus on what you can — your investment goals and strategies.
Step 2: Reassess your risk tolerance
Sit down with your financial advisor to discuss your investment goals and strategies, as well as any changes to your tolerance for risk. Consider your investment horizon. Increased market volatility and a new investment horizon may impact the strategies that can best help you achieve your investment goals. Remember, achieving your investment goals may require a certain amount of risk. Ultimately, you must maintain vigilance in reassessing your risk tolerance and the strategies you have selected in pursuit of your investment goals, and awareness of how those strategies may react to market volatility.
Step 3: Remain calm and focus on your long-term plan
Remember, investing is about the long game. Short term events are not necessarily evidence of a longer term reality. Investors who attempt to time the market too often end up reacting to a down turn by selling low and then compounding the problem by waiting on the sidelines, ultimately missing the right opportunity to reinvest.
Columbia Bond Fund | Annual Report 2017
President’s Message (continued)
As long as there is a market, there will be volatility. How you respond to that volatility can make a big difference in the measure of your success as an investor. Talk to your financial advisor about how working with Columbia Threadneedle Investments may help you position your portfolio for the reality of ongoing volatility and, perhaps, even turn such volatility into investment opportunity.
Sincerely,
Christopher O. Petersen
President, Columbia Funds
Investors should consider the investment objectives, risks, charges and expenses of a mutual fund carefully before investing. For a free prospectus and summary prospectus, which contains this and other important information about a fund, visit investor.columbiathreadneedleus.com. The prospectus should be read carefully before investing.
Columbia Funds are distributed by Columbia Management Investment Distributors, Inc., member FINRA, and managed by Columbia Management Investment Advisers, LLC.
© 2017 Columbia Management Investment Advisers, LLC. All rights reserved.
Columbia Bond Fund | Annual Report 2017
Columbia Bond Fund | Annual Report 2017
Investment objective
Columbia Bond Fund (the Fund) seeks current income, consistent with minimal fluctuation of principal.
Portfolio management
Carl Pappo, CFA
Lead manager
Managed Fund since 2010
Jason Callan
Co-manager
Managed Fund since January 2016
| Average annual total returns (%) (for the period ended April 30, 2017) |
| | | Inception | 1 Year | 5 Years | 10 Years |
| Class A * | Excluding sales charges | 03/31/08 | 1.34 | 2.08 | 3.98 |
| | Including sales charges | | -3.42 | 1.09 | 3.47 |
| Class B * | Excluding sales charges | 03/07/11 | 0.58 | 1.32 | 3.21 |
| | Including sales charges | | -4.27 | 0.98 | 3.21 |
| Class C * | Excluding sales charges | 03/31/08 | 0.59 | 1.39 | 3.26 |
| | Including sales charges | | -0.39 | 1.39 | 3.26 |
| Class R * | 11/16/11 | 1.09 | 1.83 | 3.65 |
| Class R4 * | 11/08/12 | 1.48 | 2.33 | 4.24 |
| Class R5 * | 11/08/12 | 1.58 | 2.41 | 4.28 |
| Class T * | Excluding sales charges | 09/27/10 | 1.34 | 2.10 | 4.00 |
| | Including sales charges | | -1.15 | 1.58 | 3.74 |
| Class V * | Excluding sales charges | 03/07/11 | 1.44 | 2.18 | 4.09 |
| | Including sales charges | | -3.33 | 1.19 | 3.58 |
| Class Y * | 07/15/09 | 1.63 | 2.50 | 4.34 |
| Class Z | 01/09/86 | 1.60 | 2.34 | 4.25 |
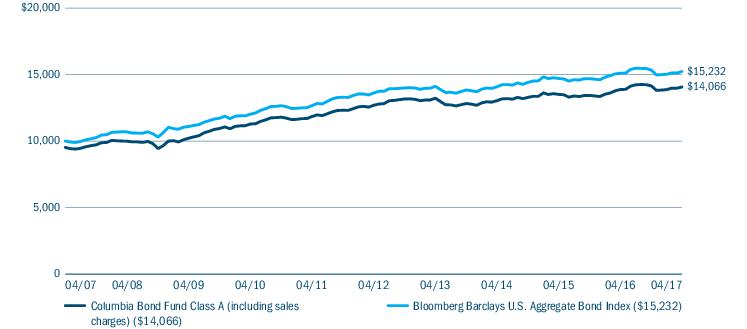
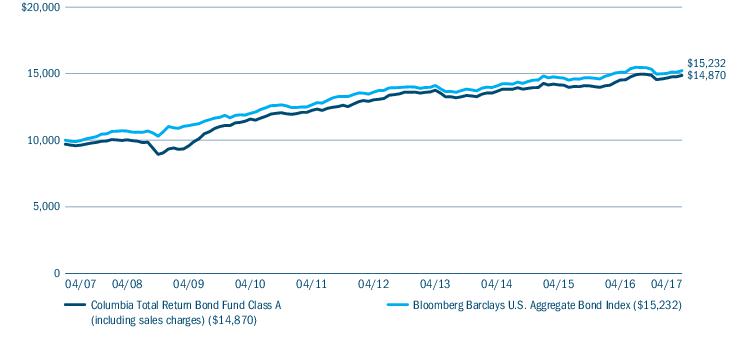
| Bloomberg Barclays U.S. Aggregate Bond Index | | 0.83 | 2.27 | 4.30 |
Returns for Class A and Class V are shown with and without the maximum initial sales charge of 4.75%. Prior to January 24, 2017, Class V shares were known as Class T shares. Class V shares have no relation to, or connection with, the Fund’s current Class T shares, which were renamed and re-designated from Class W shares effective March 27, 2017, as described below. Returns for Class B are shown with and without the applicable contingent deferred sales charge (CDSC) of 5.00% in the first year, declining to 1.00% in the sixth year and eliminated thereafter. The Fund does not accept new investments in Class B shares, except for certain limited transactions. The Fund’s current Class B investors, having held their shares for the requisite time period, are no longer subject to a CDSC upon redemption of their shares. Returns for Class C are shown with and without the 1.00% CDSC for the first year only. The returns for Class T shares are shown with and without the maximum initial sales charge of 2.50% per transaction. Prior to March 27, 2017, Class T shares were known as Class W shares and were sold without a sales charge. The Fund’s other classes are not subject to sales charges and have limited eligibility. Please see the Fund’s prospectus for details. Performance for different share classes will vary based on differences in sales charges and fees associated with each class. All results shown assume reinvestment of distributions during the period. Returns do not reflect the deduction of taxes that a shareholder may pay on Fund distributions or on the redemption of Fund shares. Performance results reflect the effect of any fee waivers or reimbursements of Fund expenses by Columbia Management Investment Advisers, LLC and/or any of its affiliates. Absent these fee waivers or expense reimbursement arrangements, performance results would have been lower.
The performance information shown represents past performance and is not a guarantee of future results. The investment return and principal value of your investment will fluctuate so that your shares, when redeemed, may be worth more or less than their original cost. Current performance may be lower or higher than the performance information shown. You may obtain performance information current to the most recent month-end by contacting your financial intermediary, visiting investor.columbiathreadneedleus.com or calling 800.345.6611.
| * | The returns shown for periods prior to the share class inception date (including returns for the Life of the Fund, if shown, which are since Fund inception) include the returns of the Fund’s oldest share class. These returns are adjusted to reflect any higher class-related operating expenses of the newer share classes, as applicable. Please visit investor.columbiathreadneedleus.com/investment-products/mutual-funds/appended-performance for more information. |
The Bloomberg Barclays U.S. Aggregate Bond Index is a broad-based benchmark that measures the investment-grade, U.S. dollar-denominated, fixed-rate taxable bond market, including Treasuries, government-related and corporate securities, mortgage-backed securities (agency fixed-rate and hybrid adjustable-rate mortgage passthroughs), asset-backed securities, and commercial mortgage-backed securities.
Indices are not available for investment, are not professionally managed and do not reflect sales charges, fees, brokerage commissions, taxes or other expenses of investing. Securities in the Fund may not match those in an index.
Columbia Bond Fund | Annual Report 2017
| 3 |
Fund at a Glance (continued)
Performance of a hypothetical $10,000 investment (April 30, 2007 — April 30, 2017)
The chart above shows the change in value of a hypothetical $10,000 investment in Class A shares of Columbia Bond Fund during the stated time period, and does not reflect the deduction of taxes that a shareholder may pay on Fund distributions or on the redemption of Fund shares.
| Portfolio breakdown (%) (at April 30, 2017) |
| Asset-Backed Securities — Agency | 3.5 |
| Asset-Backed Securities — Non-Agency | 15.6 |
| Commercial Mortgage-Backed Securities - Agency | 1.5 |
| Commercial Mortgage-Backed Securities - Non-Agency | 3.9 |
| Common Stocks | 0.0 (a) |
| Corporate Bonds & Notes | 22.9 |
| Foreign Government Obligations | 0.9 |
| Money Market Funds | 0.5 |
| Municipal Bonds | 2.1 |
| Preferred Debt | 0.1 |
| Residential Mortgage-Backed Securities - Agency | 24.6 |
| Residential Mortgage-Backed Securities - Non-Agency | 2.4 |
| U.S. Government & Agency Obligations | 3.0 |
| U.S. Treasury Obligations | 19.0 |
| Total | 100.0 |
Percentages indicated are based upon total investments. The Fund’s portfolio composition is subject to change.
| Quality breakdown (%) (at April 30, 2017) |
| AAA rating | 74.1 |
| AA rating | 1.5 |
| A rating | 6.6 |
| BBB rating | 16.1 |
| BB rating | 1.3 |
| B rating | 0.3 |
| CCC rating | 0.0 (a) |
| Not rated | 0.1 |
| Total | 100.0 |
Percentages indicated are based upon total fixed income investments (excluding Money Market Funds).
Bond ratings apply to the underlying holdings of the Fund and not the Fund itself and are divided into categories ranging from highest to lowest credit quality, determined by using the middle rating of Moody’s, S&P and Fitch, after dropping the highest and lowest available ratings. When ratings are available from only two rating agencies, the lower rating is used. When a rating is available from only one rating agency, that rating is used. When a bond is not rated by any rating agency, it is designated as “Not rated.” Credit quality ratings assigned by a rating agency are subjective opinions, not statements of fact, and are subject to change, including daily. The ratings assigned by credit rating agencies are but one of the considerations that the Investment Manager and/or Fund’s subadviser incorporates into its credit analysis process, along with such other issuer-specific factors as cash flows, capital structure and leverage ratios, ability to de-leverage (repay) through free cash flow, quality of management, market positioning and access to capital, as well as such security-specific factors as the terms of the security (e.g., interest rate and time to maturity) and the amount and type of any collateral.
| 4 | Columbia Bond Fund | Annual Report 2017 |
Manager Discussion of Fund Performance
For the 12-month period that ended April 30, 2017, the Fund’s Class A shares returned 1.34% excluding sales charges. The Fund’s benchmark, the Bloomberg Barclays U.S. Aggregate Bond Index, returned 0.83% for the same period. The most significant contributor to the Fund’s relative performance was active sector allocation, in particular maintaining underweight exposure to U.S. Treasuries while in turn overweighting investment-grade corporates, asset-backed securities and commercial mortgage-backed securities. Security selection in investment grade credits also added to relative performance.
Credit outperformed against uncertain geopolitical backdrop
As the period began, U.S. interest rates were hovering near historical lows, in part due to negative interest rates overseas as central banks sought to bolster anemic growth. Despite a sub-par global economic backdrop, U.S. credit sentiment was supported by the domestic economy’s continued moderate growth, combined with the expectation that the Federal Reserve would follow a gradual trajectory as it sought to bring short-term interest rates up to more normal levels.
In late-June of 2016, a U.K. referendum which resulted in a vote to exit the European Union spurred a flight-to-safety trade, driving U.S. Treasury yields even lower. While credit-sensitive areas of the market briefly faltered, markets quickly put the impact of “Brexit” on global growth into perspective, with the aid of supportive central banks. Sentiment was also helped as crude oil prices stabilized in the $50 a barrel range, well above the $30 territory explored in early 2016.
The surprise result of the November 2016 U.S. election led to an upturn in both credit sentiment and interest rates, as investors anticipated higher growth and inflation with Republicans in control of the White House and both houses of Congress. In the wake of the election, U.S. Treasury yields trended higher and credit-oriented segments of the bond market outperformed well into 2017. In March 2017, a dip in oil prices led inflation expectations and Treasury rates lower. In addition, the apparent surrender of the Republicans on healthcare reform brought into question the prospects for the rest of President Trump’s pro-growth economic platform. Nonetheless, credit-oriented areas of the bond market notably outperformed for the full 12 months ended April 30, 2017.
Yields rose meaningfully along the U.S. Treasury curve over the 12-month period ended April 30, 2017, and the yield curve flattened modestly as shorter maturities experienced somewhat greater yield increases. To illustrate, the two-year Treasury yield rose 51 basis points from 0.77% to 1.28%, while the 30-year yield rose 30 basis points, from 2.66% to 2.96%.
Contributors and detractors
The Fund’s performance in the period benefited from an underweighting of U.S. Treasuries, which were most directly and negatively impacted by the upturn in interest rates in the wake of the November election. In turn, the Fund had overweight exposure to investment-grade corporates, asset-backed securities and commercial mortgage-backed securities. These holdings benefited from the strengthened credit sentiment in the second half of the period as investors anticipated pro-growth policies from the new administration.
With respect to the Fund’s positioning within investment-grade corporates, we had increased exposure to energy credits in early 2016 on the view that valuations there had overshot on the downside in reaction to the decline in crude oil prices. This worked well for performance over the most recent fiscal period as these credits outperformed as commodity markets rebounded and oil prices stabilized within a reasonably narrow band around $50 per barrel. In addition, we have for some time maintained overweight exposure to financials in view of the tighter regulation and higher capital standards being applied to the industry. This positioning also added to performance as bank credits were boosted by the upward move in interest rates post-election and an outlook for continued Fed tightening.
Security selection within corporate credit was also beneficial to the Fund’s performance. In particular, a focus on integrated energy firms within energy holdings worked well. In addition, performance within financials was helped by our tilt toward preferred securities, which are lower in the capital structure than bonds and thus more subject to swings in credit sentiment.
The Fund’s positioning during the period with respect to overall portfolio duration (and corresponding sensitivity to interest rates) had a neutral to slightly negative impact on performance versus the benchmark, as we generally did not look to take risk in that area.
Columbia Bond Fund | Annual Report 2017
| 5 |
Manager Discussion of Fund Performance (continued)
We invested in highly-liquid, widely-traded Treasury futures and interest rate swap contracts to help manage portfolio duration. These enabled us to efficiently implement our yield curve opinions and offset unintended yield curve impacts from other investments in the portfolio. We also invested in credit default swaps to manage exposure to overall credit risk and individual issuer risk. On a standalone basis, various derivative positions hurt performance.
At period’s end
At the end of the reporting period, the Fund had a modest “barbell” stance, with a position in floating rate issues balanced by holdings in the 10-year maturity range.
While we viewed the fundamental and technical backdrop for credit as positive, valuations for spread sectors had become stretched and we lowered the Fund’s risk profile as the reporting period came to a close. In this vein, we reduced exposure to investment-grade corporates, with respect to both bonds and preferred securities. Given where the Fed was in its hiking cycle, we also increased holdings of floating rate issues.
Market risk may affect a single issuer, sector of the economy, industry or the market as a whole. Mortgage- and asset-backedsecurities are affected by interest rates, financial health of issuers/originators, creditworthiness of entities providing credit enhancements and the value of underlying assets. Fixed-income securities present issuer default risk. A rise in interest rates may result in a price decline of fixed-income instruments held by the Fund, negatively impacting its performance and NAV. Falling rates may result in the Fund investing in lower yielding debt instruments, lowering the Fund’s income and yield. These risks may be heightened for longer maturity and duration securities. Non-investment-grade (high-yield or junk) securities present greater price volatility and more risk to principal and income than higher rated securities. Prepayment and extension risk exists because the timing of payments on a loan, bond or other investment may accelerate when interest rates fall or decelerate when interest rates rise which may reduce investment opportunities and potential returns. Investing in derivatives is a specialized activity that involves special risks that subject the Fund to significant loss potential, including when used as leverage, and may result in greater fluctuation in Fund value. See the Fund’s prospectus for more information on these and other risks.
The views expressed in this report reflect the current views of the respective parties. These views are not guarantees of future performance and involve certain risks, uncertainties and assumptions that are difficult to predict, so actual outcomes and results may differ significantly from the views expressed. These views are subject to change at any time based upon economic, market or other conditions and the respective parties disclaim any responsibility to update such views. These views may not be relied on as investment advice and, because investment decisions for a Columbia fund are based on numerous factors, may not be relied on as an indication of trading intent on behalf of any particular Columbia fund. References to specific securities should not be construed as a recommendation or investment advice.
| 6 | Columbia Bond Fund | Annual Report 2017 |
Understanding Your Fund’s Expenses
(Unaudited)
As an investor, you incur two types of costs. There are transaction costs, which generally include sales charges on purchases and may include redemption fees. There are also ongoing costs, which generally include management fees, distribution and/or service fees, and other fund expenses. The following information is intended to help you understand your ongoing costs (in dollars) of investing in the Fund and to help you compare these costs with the ongoing costs of investing in other mutual funds.
Analyzing your Fund’s expenses
To illustrate these ongoing costs, we have provided examples and calculated the expenses paid by investors in each share class of the Fund during the period. The actual and hypothetical information in the table is based on an initial investment of $1,000 at the beginning of the period indicated and held for the entire period. Expense information is calculated two ways and each method provides you with different information. The amount listed in the “Actual” column is calculated using the Fund’s actual operating expenses and total return for the period. You may use the Actual information, together with the amount invested, to estimate the expenses that you paid over the period. Simply divide your account value by $1,000 (for example, an $8,600 account value divided by $1,000 = 8.6), then multiply the results by the expenses paid during the period under the “Actual” column. The amount listed in the “Hypothetical” column assumes a 5% annual rate of return before expenses (which is not the Fund’s actual return) and then applies the Fund’s actual expense ratio for the period to the hypothetical return. You should not use the hypothetical account values and expenses to estimate either your actual account balance at the end of the period or the expenses you paid during the period. See “Compare with other funds” below for details on how to use the hypothetical data.
Compare with other funds
Since all mutual funds are required to include the same hypothetical calculations about expenses in shareholder reports, you can use this information to compare the ongoing cost of investing in the Fund with other funds. To do so, compare the hypothetical example with the 5% hypothetical examples that appear in the shareholder reports of other funds. As you compare hypothetical examples of other funds, it is important to note that hypothetical examples are meant to highlight the ongoing costs of investing in a fund only and do not reflect any transaction costs, such as sales charges, or redemption or exchange fees. Therefore, the hypothetical calculations are useful in comparing ongoing costs only, and will not help you determine the relative total costs of owning different funds. If transaction costs were included in these calculations, your costs would be higher.
| November 1, 2016 — April 30, 2017 |
| | Account value at the
beginning of the
period ($) | Account value at the
end of the
period ($) | Expenses paid during
the period ($) | Fund’s annualized
expense ratio (%) |
| | Actual | Hypothetical | Actual | Hypothetical | Actual | Hypothetical | Actual |
| Class A | 1,000.00 | 1,000.00 | 994.10 | 1,020.30 | 4.21 | 4.26 | 0.86 |
| Class B | 1,000.00 | 1,000.00 | 990.40 | 1,016.62 | 7.86 | 7.96 | 1.61 |
| Class C | 1,000.00 | 1,000.00 | 990.40 | 1,016.62 | 7.86 | 7.96 | 1.61 |
| Class R | 1,000.00 | 1,000.00 | 992.90 | 1,019.08 | 5.42 | 5.50 | 1.11 |
| Class R4 | 1,000.00 | 1,000.00 | 994.20 | 1,021.53 | 2.98 | 3.02 | 0.61 |
| Class R5 | 1,000.00 | 1,000.00 | 994.70 | 1,022.02 | 2.49 | 2.53 | 0.51 |
| Class T (formerly Class W) | 1,000.00 | 1,000.00 | 994.20 | 1,020.30 | 4.21 | 4.26 | 0.86 |
| Class V (formerly Class T) | 1,000.00 | 1,000.00 | 994.60 | 1,020.79 | 3.72 | 3.77 | 0.76 |
| Class Y | 1,000.00 | 1,000.00 | 995.00 | 1,022.26 | 2.25 | 2.28 | 0.46 |
| Class Z | 1,000.00 | 1,000.00 | 995.40 | 1,021.53 | 2.98 | 3.02 | 0.61 |
Expenses paid during the period are equal to the annualized expense ratio for each class as indicated above, multiplied by the average account value over the period and then multiplied by the number of days in the Fund’s most recent fiscal half year and divided by 365.
Expenses do not include fees and expenses incurred indirectly by the Fund from its investment in underlying funds, including affiliated and non-affiliated pooled investment vehicles, such as mutual funds and exchange-traded funds.
Had Columbia Management Investment Advisers, LLC and/or certain of its affiliates not waived/reimbursed certain fees and expenses, account value at the end of the period would have been reduced.
The Fund’s annualized expense ratio excludes the impact of an expense reimbursement from a third party due to overbilling.
Columbia Bond Fund | Annual Report 2017
| 7 |
Portfolio of Investments
April 30, 2017
(Percentages represent value of investments compared to net assets)
| Asset-Backed Securities — Agency 3.8% |
| Issuer | Coupon
Rate | | Principal
Amount ($) | Value ($) |
| United States Small Business Administration |
| Series 2012-20G Class 1 |
| 07/01/32 | 2.380% | | 276,030 | 274,635 |
| Series 2012-20I Class 1 |
| 09/01/32 | 2.200% | | 290,943 | 288,509 |
| Series 2012-20J Class 1 |
| 10/01/32 | 2.180% | | 1,048,857 | 1,032,259 |
| Series 2012-20L Class 1 |
| 12/01/32 | 1.930% | | 313,748 | 304,605 |
| Series 2013-20E Class 1 |
| 05/01/33 | 2.070% | | 177,961 | 173,761 |
| Series 2014-20D Class 1 |
| 04/01/34 | 3.110% | | 592,468 | 613,201 |
| Series 2014-20F Class 1 |
| 06/01/34 | 2.990% | | 664,211 | 677,037 |
| Series 2015-20C Class 1 |
| 03/01/35 | 2.720% | | 95,060 | 95,502 |
| Series 2015-20E Class 1 |
| 05/01/35 | 2.770% | | 407,311 | 406,921 |
| Series 2016-20K Class 1 |
| 11/01/36 | 2.570% | | 3,645,000 | 3,637,344 |
| Series 2016-20L Class 1 |
| 12/01/36 | 2.810% | | 2,360,000 | 2,375,013 |
| Series 2017-20A Class 1 |
| 01/01/37 | 2.800% | | 4,015,000 | 4,040,611 |
| Series 2017-20B Class 1 |
| 02/01/37 | 2.820% | | 1,330,000 | 1,339,083 |
| Series 2017-20D Class 1 |
| 04/01/37 | 2.840% | | 2,844,000 | 2,864,061 |
Total Asset-Backed Securities — Agency
(Cost $17,986,618) | 18,122,542 |
|
| Asset-Backed Securities — Non-Agency 17.0% |
| | | | |
| Ally Master Owner Trust |
| Series 2012-5 Class A |
| 09/15/19 | 1.540% | | 955,000 | 955,597 |
| AmeriCredit Automobile Receivables Trust(a) |
| Series 2016-2 Class A2B |
| 10/08/19 | 1.689% | | 320,262 | 320,713 |
| Apidos CLO XIX(a),(b) |
| Series 2014-19A Class A2 |
| 10/17/26 | 3.158% | | 1,400,000 | 1,400,543 |
| Ascentium Equipment Receivables Trust(b),(c) |
| Series 2017-1A Class A2 |
| 07/10/19 | 1.870% | | 215,000 | 214,990 |
| Avis Budget Rental Car Funding AESOP LLC(b) |
| Series 2015-2A Class A |
| 12/20/21 | 2.630% | | 1,195,000 | 1,195,459 |
| Asset-Backed Securities — Non-Agency (continued) |
| Issuer | Coupon
Rate | | Principal
Amount ($) | Value ($) |
| BMW Floorplan Master Owner Trust(a),(b) |
| Series 2015-1A Class A |
| 07/15/20 | 1.494% | | 320,000 | 320,633 |
| BMW Vehicle Lease Trust |
| Series 2017-1 Class A2 |
| 07/22/19 | 1.640% | | 380,000 | 380,474 |
| Cabela’s Credit Card Master Note Trust |
| Series 2015-2 Class A1 |
| 07/17/23 | 2.250% | | 990,000 | 995,877 |
| Capital One Multi-Asset Execution Trust |
| Series 2015-A2 Class A2 |
| 03/15/23 | 2.080% | | 3,405,000 | 3,426,216 |
| Series 2015-A8 Class A8 |
| 08/15/23 | 2.050% | | 1,075,000 | 1,079,242 |
| Series 2017-A3 Class A3 |
| 01/15/25 | 2.430% | | 2,320,000 | 2,337,116 |
| Carlyle Global Market Strategies CLO Ltd.(a),(b) |
| Series 2014-1A Class AR |
| 04/17/25 | 2.180% | | 1,040,000 | 1,040,068 |
| CarMax Auto Owner Trust |
| Series 2015-3 Class A3 |
| 05/15/20 | 1.630% | | 1,295,000 | 1,296,094 |
| Series 2016-4 Class A2 |
| 11/15/19 | 1.210% | | 1,015,000 | 1,013,016 |
| Series 2017-1 Class A3 |
| 11/15/21 | 1.980% | | 1,895,000 | 1,899,946 |
| Series 2017-2 Class A2 |
| 06/15/20 | 1.630% | | 1,665,000 | 1,663,854 |
| Chase Issuance Trust |
| Series 2012-A4 Class A4 |
| 08/16/21 | 1.580% | | 860,000 | 857,311 |
| Series 2016-A7 Class A7 |
| 09/16/19 | 1.060% | | 800,000 | 799,367 |
| Chesapeake Funding II LLC(a),(b) |
| Series 2016-2A Class A2 |
| 06/15/28 | 1.994% | | 800,000 | 803,588 |
| Chrysler Capital Auto Receivables Trust(b) |
| Series 2016-BA Class A2 |
| 01/15/20 | 1.360% | | 330,000 | 329,897 |
| Citibank Credit Card Issuance Trust |
| Series 2014-A1 Class A1 |
| 01/23/23 | 2.880% | | 3,455,000 | 3,561,172 |
| Series 2014-A6 Class A6 |
| 07/15/21 | 2.150% | | 475,000 | 479,382 |
| Series 2017-A3 Class A3 |
| 04/07/22 | 1.920% | | 2,850,000 | 2,856,995 |
The accompanying Notes to Financial Statements are an integral part of this statement.
| 8 | Columbia Bond Fund | Annual Report 2017 |
Portfolio of Investments (continued)
April 30, 2017
| Asset-Backed Securities — Non-Agency (continued) |
| Issuer | Coupon
Rate | | Principal
Amount ($) | Value ($) |
| CNH Equipment Trust |
| Series 2015-B Class A3 |
| 07/15/20 | 1.370% | | 182,979 | 182,807 |
| Dell Equipment Finance Trust(b) |
| Series 2015-2 Class A2A |
| 12/22/17 | 1.420% | | 57,180 | 57,188 |
| Series 2016-1 Class A2 |
| 09/24/18 | 1.430% | | 352,718 | 352,689 |
| Dell Equipment Finance Trust(a),(b) |
| Series 2015-2 Class A2B |
| 12/22/17 | 1.888% | | 28,590 | 28,609 |
| Discover Card Execution Note Trust |
| Series 2017-A2 Class A2 |
| 07/15/24 | 2.390% | | 6,220,000 | 6,289,126 |
| Enterprise Fleet Financing LLC(b) |
| Series 2014-2 Class A2 |
| 03/20/20 | 1.050% | | 163,528 | 163,451 |
| Series 2015-1 Class A2 |
| 09/20/20 | 1.300% | | 451,368 | 450,912 |
| Series 2015-2 Class A2 |
| 02/22/21 | 1.590% | | 436,815 | 436,966 |
| Series 2016-2 Class A2 |
| 02/22/22 | 1.740% | | 600,000 | 599,052 |
| Ford Credit Auto Owner Trust(b) |
| Series 2015-1 Class A |
| 07/15/26 | 2.120% | | 3,365,000 | 3,380,307 |
| Series 2015-2 Class A |
| 01/15/27 | 2.440% | | 970,000 | 981,551 |
| Series 2016-1 Class A |
| 08/15/27 | 2.310% | | 4,830,000 | 4,848,003 |
| Series 2017-1 Class A |
| 08/15/28 | 2.620% | | 2,000,000 | 2,021,158 |
| Ford Credit Auto Owner Trust |
| Series 2016-A Class A2A |
| 12/15/18 | 1.120% | | 36,465 | 36,449 |
| Ford Credit Floorplan Master Owner Trust(b) |
| Series 2013-2 Class A |
| 03/15/22 | 2.090% | | 1,570,000 | 1,575,693 |
| GM Financial Automobile Leasing Trust(a) |
| Series 2015-2 Class A2B |
| 04/20/18 | 1.413% | | 67,278 | 67,282 |
| GM Financial Automobile Leasing Trust |
| Series 2015-3 Class A3 |
| 03/20/19 | 1.690% | | 625,000 | 625,676 |
| Series 2016-3 Class A2A |
| 02/20/19 | 1.350% | | 558,526 | 557,716 |
| Asset-Backed Securities — Non-Agency (continued) |
| Issuer | Coupon
Rate | | Principal
Amount ($) | Value ($) |
| GMF Floorplan Owner Revolving Trust(a),(b) |
| Series 2016-1 Class A2 |
| 05/17/21 | 1.844% | | 730,000 | 736,655 |
| Golden Credit Card Trust(a),(b) |
| Series 2015-3A Class A |
| 07/15/19 | 1.414% | | 3,125,000 | 3,125,973 |
| Harley-Davidson Motorcycle Trust |
| Series 2015-1 Class A3 |
| 06/15/20 | 1.410% | | 340,845 | 340,664 |
| Hertz Fleet Lease Funding LP(a),(b) |
| Series 2014-1 Class A |
| 04/10/28 | 1.389% | | 120,924 | 120,931 |
| Series 2016-1 Class A1 |
| 04/10/30 | 1.958% | | 2,180,000 | 2,188,328 |
| Series 2017-1 Class A1 |
| 04/10/31 | 1.641% | | 505,000 | 505,000 |
| Hertz Vehicle Financing II LP(b) |
| Series 2015-3A Class A |
| 09/25/21 | 2.670% | | 1,000,000 | 991,595 |
| Honda Auto Receivables Owner Trust |
| Series 2015-2 Class A3 |
| 02/21/19 | 1.040% | | 154,748 | 154,518 |
| Hyundai Auto Receivables Trust |
| Series 2017-A Class A2A |
| 02/18/20 | 1.480% | | 1,405,000 | 1,405,067 |
| Hyundai Floorplan Master Owner Trust(a),(b) |
| Series 2016-1A Class A1 |
| 03/15/21 | 1.894% | | 330,000 | 332,460 |
| John Deere Owner Trust |
| Series 2016-A Class A2 |
| 10/15/18 | 1.150% | | 428,914 | 428,784 |
| Kubota Credit Owner Trust(b) |
| Series 2016-1A Class A2 |
| 04/15/19 | 1.250% | | 545,935 | 545,180 |
| Madison Park Funding XVI Ltd.(a),(b) |
| Series 2014-12A Class AR |
| 07/20/26 | 2.416% | | 2,500,000 | 2,499,987 |
| Mercedes-Benz Auto Lease Trust |
| Series 2016-B Class A2 |
| 01/15/19 | 1.150% | | 460,000 | 459,518 |
| Series 2017-A Class A2A |
| 08/15/19 | 1.530% | | 1,445,000 | 1,444,999 |
| Navitas Equipment Receivables LLC(b) |
| Series 2015-1 Class A2 |
| 11/15/18 | 2.120% | | 686,426 | 685,917 |
| New York City Tax Lien Trust(b) |
| Series 2015-A Class A |
| 11/10/28 | 1.340% | | 274,806 | 273,536 |
The accompanying Notes to Financial Statements are an integral part of this statement.
Columbia Bond Fund | Annual Report 2017
| 9 |
Portfolio of Investments (continued)
April 30, 2017
| Asset-Backed Securities — Non-Agency (continued) |
| Issuer | Coupon
Rate | | Principal
Amount ($) | Value ($) |
| Series 2016-A Class A |
| 11/10/29 | 1.470% | | 364,770 | 362,539 |
| Nissan Auto Lease Trust |
| Series 2016-B Class A2A |
| 12/17/18 | 1.260% | | 699,072 | 698,309 |
| Nissan Auto Receivables Owner Trust |
| Series 2016-A Class A3 |
| 10/15/20 | 1.340% | | 585,000 | 582,506 |
| PFS Tax Lien Trust(b) |
| Series 2014-1 Class NOTE |
| 05/15/29 | 1.440% | | 279,466 | 277,122 |
| SMART ABS Series Trust(a) |
| Series 2015-3US Class A2B |
| 04/16/18 | 1.744% | | 78,298 | 78,294 |
| SoFi Professional Loan Program LLC(b) |
| Series 2016-A |
| 12/26/36 | 2.760% | | 997,096 | 1,008,602 |
| Synchrony Credit Card Master Note Trust |
| Series 2016-1 Class A |
| 03/15/22 | 2.040% | | 1,295,000 | 1,300,854 |
| Volvo Financial Equipment LLC(b) |
| Series 2015-1A Class A3 |
| 06/17/19 | 1.510% | | 779,179 | 779,273 |
| Voya Ltd.(a),(b) |
| Series 2012-4A Class A1R |
| 10/15/28 | 2.608% | | 1,500,000 | 1,504,525 |
| Wheels SPV 2 LLC(b) |
| Series 2015-1A Class A2 |
| 04/22/24 | 1.270% | | 364,310 | 363,611 |
| World Financial Network Credit Card Master Trust |
| Series 2012-D Class A |
| 04/17/23 | 2.150% | | 790,000 | 795,379 |
| Series 2015-B Class A |
| 06/17/24 | 2.550% | | 1,815,000 | 1,841,099 |
| World Omni Auto Receivables Trust |
| Series 2017-A Class A3 |
| 09/15/22 | 1.930% | | 1,440,000 | 1,439,724 |
| World Omni Automobile Lease Securitization Trust |
| Series 2015-A Class A3 |
| 10/15/18 | 1.540% | | 1,275,000 | 1,276,080 |
Total Asset-Backed Securities — Non-Agency
(Cost $80,124,911) | 80,429,214 |
|
| Commercial Mortgage-Backed Securities - Agency 1.6% |
| Issuer | Coupon
Rate | | Principal
Amount ($) | Value ($) |
| Federal Home Loan Mortgage Corp. |
| Series K724 Class A1 |
| 03/25/23 | 2.776% | | 7,430,511 | 7,609,506 |
Total Commercial Mortgage-Backed Securities - Agency
(Cost $7,573,206) | 7,609,506 |
|
| Commercial Mortgage-Backed Securities - Non-Agency 4.3% |
| | | | |
| American Homes 4 Rent Trust(b) |
| Series 2014-SFR2 Class A |
| 10/17/36 | 3.786% | | 2,615,252 | 2,734,895 |
| Series 2014-SFR3 Class A |
| 12/17/36 | 3.678% | | 2,979,644 | 3,096,283 |
| Series 2015-SFR2 Class A |
| 10/17/45 | 3.732% | | 263,119 | 274,340 |
| Colony Multifamily Mortgage Trust(b) |
| Series 2014-1 Class A |
| 04/20/50 | 2.543% | | 2,042,035 | 2,029,951 |
| Commercial Mortgage Trust |
| Series 2007-C9 Class AM |
| 12/10/49 | 5.650% | | 2,386,119 | 2,390,012 |
| DBUBS Mortgage Trust(b) |
| Series 2011-LC2A Class A4 |
| 07/10/44 | 4.537% | | 2,560,000 | 2,747,222 |
| JPMorgan Chase Commercial Mortgage Securities Trust |
| Series 2012-C6 Class A3 |
| 05/15/45 | 3.507% | | 1,318,913 | 1,377,038 |
| LB Commercial Mortgage Trust(a) |
| Series 2007-C3 Class AM |
| 07/15/44 | 6.206% | | 5,048,000 | 5,062,792 |
| Merrill Lynch Mortgage Investors Trust(a),(d) |
| CMO Series 1998-C3 Class IO |
| 12/15/30 | 1.087% | | 234,643 | 777 |
| Morgan Stanley Re-Remic Trust(a),(b) |
| Series 2009-GG10 Class A4B |
| 08/12/45 | 6.041% | | 306,931 | 307,388 |
| Series 2010-GG10 Class A4B |
| 08/15/45 | 6.041% | | 164,386 | 164,285 |
Total Commercial Mortgage-Backed Securities - Non-Agency
(Cost $21,088,430) | 20,184,983 |
| Common Stocks —% |
| Issuer | Shares | Value ($) |
| Consumer Staples —% |
| Beverages —% |
| Crimson Wine Group Ltd.(e) | 3 | 31 |
| Total Consumer Staples | 31 |
The accompanying Notes to Financial Statements are an integral part of this statement.
| 10 | Columbia Bond Fund | Annual Report 2017 |
Portfolio of Investments (continued)
April 30, 2017
| Common Stocks —% |
| Issuer | Shares | Value ($) |
| Financials —% |
| Diversified Financial Services —% |
| Leucadia National Corp. | 39 | 990 |
| Total Financials | 990 |
Total Common Stocks
(Cost $—) | 1,021 |
| Corporate Bonds & Notes 24.9% |
| Issuer | Coupon
Rate | | Principal
Amount ($) | Value ($) |
| Aerospace & Defense 0.3% |
| L-3 Communications Corp. |
| 12/15/26 | 3.850% | | 384,000 | 394,247 |
| Lockheed Martin Corp. |
| 01/15/26 | 3.550% | | 350,000 | 361,041 |
| 09/01/36 | 6.150% | | 285,000 | 361,625 |
| 12/15/42 | 4.070% | | 470,000 | 468,370 |
| Total | 1,585,283 |
| Banking 10.7% |
| Bank of America Corp.(a) |
| 01/20/28 | 3.824% | | 3,495,000 | 3,520,880 |
| 12/31/49 | 8.125% | | 315,000 | 329,963 |
| Bank of New York Mellon Corp. (The)(a) |
| Junior Subordinated |
| 12/29/49 | 4.500% | | 1,054,000 | 1,005,252 |
| 12/31/49 | 4.625% | | 405,000 | 398,925 |
| BankBoston Capital Trust IV(a) |
| Junior Subordinated |
| 06/08/28 | 1.706% | | 973,000 | 878,132 |
| Citigroup, Inc.(a) |
| 08/14/17 | 1.526% | | 5,525,000 | 5,528,912 |
| Fifth Third Bancorp(a) |
| Junior Subordinated |
| 12/31/49 | 5.100% | | 801,000 | 793,991 |
| First Maryland Capital I(a) |
| Junior Subordinated |
| 01/15/27 | 2.158% | | 843,000 | 767,130 |
| First Maryland Capital II(a) |
| Junior Subordinated |
| 02/01/27 | 1.884% | | 1,930,000 | 1,741,825 |
| HBOS PLC(b) |
| Subordinated |
| 05/21/18 | 6.750% | | 1,395,000 | 1,458,722 |
| HSBC Holdings PLC |
| 01/14/22 | 4.875% | | 515,000 | 560,915 |
| JPMorgan Chase & Co.(a) |
| 02/01/28 | 3.782% | | 8,270,000 | 8,410,855 |
| Corporate Bonds & Notes (continued) |
| Issuer | Coupon
Rate | | Principal
Amount ($) | Value ($) |
| Junior Subordinated |
| 04/29/49 | 7.900% | | 2,528,000 | 2,641,760 |
| 12/29/49 | 6.000% | | 396,000 | 419,265 |
| 12/31/49 | 5.300% | | 1,625,000 | 1,694,144 |
| 12/31/49 | 6.100% | | 405,000 | 434,363 |
| JPMorgan Chase Capital XXI(a) |
| Junior Subordinated |
| 02/02/37 | 1.985% | | 356,000 | 309,944 |
| JPMorgan Chase Capital XXIII(a) |
| Junior Subordinated |
| 05/15/47 | 2.039% | | 255,000 | 220,096 |
| KeyCorp Capital I(a) |
| Junior Subordinated |
| 07/01/28 | 1.888% | | 2,612,000 | 2,305,090 |
| Lloyds Banking Group PLC |
| Subordinated |
| 12/10/25 | 4.582% | | 2,330,000 | 2,410,399 |
| M&T Bank Corp.(a) |
| Junior Subordinated |
| 12/31/49 | 5.125% | | 472,000 | 477,310 |
| NB Capital Trust III(a) |
| Junior Subordinated |
| 01/15/27 | 1.708% | | 1,362,000 | 1,242,825 |
| Northern Trust Corp.(a) |
| Junior Subordinated |
| 12/31/49 | 4.600% | | 425,000 | 422,875 |
| NTC Capital I(a) |
| Junior Subordinated |
| 01/15/27 | 1.678% | | 1,495,000 | 1,352,975 |
| NTC Capital II(a) |
| Junior Subordinated |
| 04/15/27 | 1.748% | | 550,000 | 497,750 |
| Santander Issuances SAU |
| Subordinated |
| 11/19/25 | 5.179% | | 740,000 | 778,279 |
| State Street Corp.(a) |
| 06/15/37 | 2.131% | | 2,115,000 | 1,858,556 |
| SunTrust Capital I(a) |
| Junior Subordinated |
| 05/15/27 | 1.709% | | 970,000 | 851,175 |
| Wachovia Capital Trust II(a) |
| Junior Subordinated |
| 01/15/27 | 1.658% | | 1,510,000 | 1,355,225 |
| Wells Fargo & Co. |
| 10/23/26 | 3.000% | | 3,550,000 | 3,423,077 |
The accompanying Notes to Financial Statements are an integral part of this statement.
Columbia Bond Fund | Annual Report 2017
| 11 |
Portfolio of Investments (continued)
April 30, 2017
| Corporate Bonds & Notes (continued) |
| Issuer | Coupon
Rate | | Principal
Amount ($) | Value ($) |
| Wells Fargo & Co.(a) |
| Junior Subordinated |
| 03/29/49 | 7.980% | | 970,000 | 1,014,862 |
| 12/31/49 | 5.900% | | 1,210,000 | 1,285,625 |
| Total | 50,391,097 |
| Cable and Satellite 0.4% |
| Charter Communications Operating LLC/Capital |
| 10/23/45 | 6.484% | | 105,000 | 123,309 |
| NBCUniversal Enterprise Inc.(b) |
| Junior Subordinated |
| 12/31/49 | 5.250% | | 507,000 | 534,251 |
| Time Warner Cable LLC |
| 06/15/39 | 6.750% | | 610,000 | 726,052 |
| Time Warner Entertainment Co. LP |
| 07/15/33 | 8.375% | | 335,000 | 454,534 |
| Total | 1,838,146 |
| Chemicals 0.7% |
| Celanese U.S. Holdings LLC |
| 06/15/21 | 5.875% | | 1,254,000 | 1,405,524 |
| 11/15/22 | 4.625% | | 963,000 | 1,032,500 |
| LyondellBasell Industries NV |
| 02/26/55 | 4.625% | | 930,000 | 870,704 |
| Total | 3,308,728 |
| Construction Machinery 0.3% |
| John Deere Capital Corp.(a) |
| 01/16/18 | 1.448% | | 1,235,000 | 1,236,917 |
| Diversified Manufacturing 0.4% |
| General Electric Co.(a) |
| Junior Subordinated |
| 12/31/49 | 5.000% | | 1,906,000 | 2,024,744 |
| Electric 2.3% |
| Arizona Public Service Co. |
| 09/15/26 | 2.550% | | 570,000 | 540,162 |
| 11/15/45 | 4.350% | | 495,000 | 519,473 |
| Cleveland Electric Illuminating Co. (The) |
| 12/15/36 | 5.950% | | 230,000 | 263,913 |
| Commonwealth Edison Co. |
| 03/15/36 | 5.900% | | 325,000 | 404,492 |
| Consolidated Edison Co. of New York, Inc. |
| 08/15/37 | 6.300% | | 365,000 | 476,280 |
| DTE Energy Co. |
| 10/01/26 | 2.850% | | 2,295,000 | 2,168,789 |
| Duke Energy Florida Project Finance LLC |
| 09/01/29 | 2.538% | | 1,525,000 | 1,472,714 |
| Corporate Bonds & Notes (continued) |
| Issuer | Coupon
Rate | | Principal
Amount ($) | Value ($) |
| Duke Energy Progress, Inc. |
| 08/15/45 | 4.200% | | 68,000 | 70,123 |
| E.ON International Finance BV(b) |
| 04/30/38 | 6.650% | | 325,000 | 400,462 |
| FPL Energy National Wind LLC(b) |
| 03/10/24 | 5.608% | | 132,366 | 132,366 |
| Jersey Central Power & Light Co. |
| 06/01/37 | 6.150% | | 285,000 | 333,348 |
| Nevada Power Co. |
| 09/15/40 | 5.375% | | 314,000 | 362,364 |
| NextEra Energy Capital Holdings, Inc.(a) |
| Junior Subordinated |
| 09/01/67 | 7.300% | | 525,000 | 527,594 |
| Pacific Gas & Electric Co. |
| 06/15/23 | 3.250% | | 843,000 | 866,897 |
| Southern Co. (The) |
| 07/01/26 | 3.250% | | 1,392,000 | 1,354,871 |
| 07/01/36 | 4.250% | | 350,000 | 345,779 |
| 07/01/46 | 4.400% | | 265,000 | 263,634 |
| Toledo Edison Co. (The) |
| 05/15/37 | 6.150% | | 305,000 | 373,159 |
| Total | 10,876,420 |
| Finance Companies 0.2% |
| HSBC Finance Corp. |
| Subordinated |
| 01/15/21 | 6.676% | | 965,000 | 1,096,326 |
| Food and Beverage 0.3% |
| Anheuser-Busch InBev Finance, Inc. |
| 02/01/26 | 3.650% | | 988,000 | 1,006,803 |
| 02/01/46 | 4.900% | | 370,000 | 404,207 |
| Total | 1,411,010 |
| Health Care 0.4% |
| Becton Dickinson and Co. |
| 12/15/24 | 3.734% | | 671,000 | 674,844 |
| Express Scripts Holding Co. |
| 07/15/46 | 4.800% | | 1,163,000 | 1,130,538 |
| New York and Presbyterian Hospital (The) |
| 08/01/36 | 3.563% | | 245,000 | 230,995 |
| Total | 2,036,377 |
| Independent Energy 0.5% |
| Anadarko Petroleum Corp. |
| 03/15/29 | 7.200% | | 1,060,000 | 1,255,643 |
| 09/15/36 | 6.450% | | 91,000 | 107,843 |
| 07/15/44 | 4.500% | | 5,000 | 4,818 |
The accompanying Notes to Financial Statements are an integral part of this statement.
| 12 | Columbia Bond Fund | Annual Report 2017 |
Portfolio of Investments (continued)
April 30, 2017
| Corporate Bonds & Notes (continued) |
| Issuer | Coupon
Rate | | Principal
Amount ($) | Value ($) |
| Noble Energy, Inc. |
| 04/01/27 | 8.000% | | 909,000 | 1,140,048 |
| Total | 2,508,352 |
| Integrated Energy 0.8% |
| BP Capital Markets PLC |
| 01/16/27 | 3.017% | | 775,000 | 758,135 |
| Cenovus Energy, Inc.(b) |
| 04/15/27 | 4.250% | | 380,000 | 376,922 |
| 06/15/37 | 5.250% | | 1,060,000 | 1,035,031 |
| Cenovus Energy, Inc. |
| 11/15/39 | 6.750% | | 1,495,000 | 1,685,856 |
| Total | 3,855,944 |
| Life Insurance 0.5% |
| Massachusetts Mutual Life Insurance Co.(b) |
| Subordinated |
| 04/15/65 | 4.500% | | 300,000 | 290,764 |
| MetLife, Inc.(a),(b) |
| Junior Subordinated |
| 04/08/68 | 9.250% | | 571,000 | 821,526 |
| Teachers Insurance & Annuity Association of America(b) |
| 12/16/39 | 6.850% | | 275,000 | 375,163 |
| Subordinated |
| 09/15/44 | 4.900% | | 110,000 | 120,908 |
| Voya Financial, Inc. |
| 06/15/26 | 3.650% | | 650,000 | 647,384 |
| 06/15/46 | 4.800% | | 329,000 | 333,071 |
| Total | 2,588,816 |
| Media and Entertainment 0.3% |
| 21st Century Fox America, Inc. |
| 03/15/33 | 6.550% | | 395,000 | 485,838 |
| 03/01/37 | 6.150% | | 340,000 | 406,688 |
| Viacom, Inc. |
| 03/15/43 | 4.375% | | 335,000 | 298,037 |
| Total | 1,190,563 |
| Midstream 1.6% |
| APT Pipelines Ltd.(b) |
| 07/15/27 | 4.250% | | 695,000 | 710,851 |
| El Paso LLC |
| 01/15/32 | 7.750% | | 290,000 | 369,304 |
| Enterprise Products Operating LLC(a) |
| Junior Subordinated |
| 08/01/66 | 4.742% | | 550,000 | 550,000 |
| Kinder Morgan Energy Partners LP |
| 01/15/38 | 6.950% | | 385,000 | 452,792 |
| 11/15/40 | 7.500% | | 270,000 | 332,041 |
| Corporate Bonds & Notes (continued) |
| Issuer | Coupon
Rate | | Principal
Amount ($) | Value ($) |
| Kinder Morgan, Inc. |
| 06/01/45 | 5.550% | | 240,000 | 254,205 |
| Plains All American Pipeline LP/Finance Corp. |
| 01/31/23 | 2.850% | | 335,000 | 325,687 |
| 10/15/23 | 3.850% | | 660,000 | 666,204 |
| 06/01/42 | 5.150% | | 520,000 | 504,852 |
| 02/15/45 | 4.900% | | 371,000 | 357,226 |
| Southern Natural Gas Co. LLC |
| 03/01/32 | 8.000% | | 195,000 | 262,032 |
| Transcanada Trust(a) |
| Junior Subordinated |
| 08/15/76 | 5.875% | | 1,164,000 | 1,251,300 |
| Transcontinental Gas Pipe Line Co., LLC |
| 02/01/26 | 7.850% | | 565,000 | 732,010 |
| Williams Partners LP |
| 04/15/40 | 6.300% | | 625,000 | 719,511 |
| Total | 7,488,015 |
| Natural Gas 0.3% |
| KeySpan Corp. |
| 11/15/30 | 8.000% | | 200,000 | 269,430 |
| NiSource Finance Corp. |
| 02/15/23 | 3.850% | | 685,000 | 706,615 |
| 02/15/44 | 4.800% | | 50,000 | 52,889 |
| Sempra Energy |
| 11/15/25 | 3.750% | | 565,000 | 579,832 |
| Total | 1,608,766 |
| Oil Field Services 0.3% |
| Noble Holding International Ltd.(a) |
| 03/16/18 | 5.750% | | 1,270,000 | 1,284,275 |
| Other Industry 0.3% |
| Massachusetts Institute of Technology |
| 07/01/16 | 3.885% | | 300,000 | 267,425 |
| President and Fellows of Harvard College |
| 10/01/37 | 3.619% | | 315,000 | 320,497 |
| 07/15/46 | 3.150% | | 314,000 | 288,258 |
| 07/15/56 | 3.300% | | 685,000 | 634,207 |
| Total | 1,510,387 |
| Pharmaceuticals 0.9% |
| Actavis, Inc. |
| 10/01/42 | 4.625% | | 965,000 | 952,326 |
| Amgen, Inc. |
| 05/01/45 | 4.400% | | 375,000 | 370,056 |
| 06/15/48 | 4.563% | | 687,000 | 690,800 |
| Johnson & Johnson |
| 12/05/33 | 4.375% | | 492,000 | 546,055 |
| 03/03/37 | 3.625% | | 680,000 | 686,142 |
The accompanying Notes to Financial Statements are an integral part of this statement.
Columbia Bond Fund | Annual Report 2017
| 13 |
Portfolio of Investments (continued)
April 30, 2017
| Corporate Bonds & Notes (continued) |
| Issuer | Coupon
Rate | | Principal
Amount ($) | Value ($) |
| Shire Acquisitions Investments Ireland DAC |
| 09/23/23 | 2.875% | | 785,000 | 767,750 |
| Total | 4,013,129 |
| Property & Casualty 0.6% |
| Chubb Corp. (The)(a) |
| Junior Subordinated |
| 04/15/37 | 3.408% | | 925,000 | 915,750 |
| Loews Corp. |
| 04/01/26 | 3.750% | | 1,477,000 | 1,528,831 |
| 05/15/43 | 4.125% | | 494,000 | 481,518 |
| Total | 2,926,099 |
| Railroads 0.4% |
| BNSF Funding Trust I(a) |
| Junior Subordinated |
| 12/15/55 | 6.613% | | 119,000 | 135,660 |
| CSX Corp.(c) |
| 06/01/27 | 3.250% | | 600,000 | 601,852 |
| CSX Corp. |
| 11/01/66 | 4.250% | | 320,000 | 299,954 |
| Kansas City Southern |
| 08/15/45 | 4.950% | | 759,000 | 781,106 |
| Total | 1,818,572 |
| Retailers 0.1% |
| CVS Pass-Through Trust(b) |
| 08/11/36 | 4.163% | | 681,989 | 694,309 |
| Technology 1.0% |
| Broadcom Corp./Cayman Finance Ltd. |
| 01/15/27 | 3.875% | | 580,000 | 588,553 |
| Cisco Systems, Inc.(a) |
| 09/20/19 | 1.492% | | 1,430,000 | 1,437,706 |
| Dell International LLC/EMC Corp.(b) |
| 06/01/19 | 3.480% | | 1,555,000 | 1,590,451 |
| Oracle Corp. |
| 07/15/26 | 2.650% | | 695,000 | 670,873 |
| 07/15/36 | 3.850% | | 170,000 | 169,737 |
| 07/15/46 | 4.000% | | 290,000 | 283,406 |
| Total | 4,740,726 |
| Transportation Services 0.1% |
| ERAC U.S.A. Finance LLC(b) |
| 12/01/26 | 3.300% | | 700,000 | 679,043 |
| Wireless 0.4% |
| Sprint Spectrum Co. I/II/III LLC(b) |
| 09/20/21 | 3.360% | | 1,684,000 | 1,698,819 |
| Corporate Bonds & Notes (continued) |
| Issuer | Coupon
Rate | | Principal
Amount ($) | Value ($) |
| Wirelines 0.8% |
| AT&T, Inc. |
| 03/01/37 | 5.250% | | 385,000 | 394,856 |
| 03/15/42 | 5.150% | | 350,000 | 346,771 |
| 06/15/44 | 4.800% | | 385,000 | 364,189 |
| Deutsche Telekom International Finance BV |
| 06/01/32 | 9.250% | | 190,000 | 298,540 |
| Verizon Communications, Inc. |
| 09/15/23 | 5.150% | | 936,000 | 1,035,864 |
| 03/16/37 | 5.250% | | 835,000 | 865,083 |
| 11/01/42 | 3.850% | | 300,000 | 251,310 |
| 03/16/47 | 5.500% | | 5,000 | 5,297 |
| Total | 3,561,910 |
Total Corporate Bonds & Notes
(Cost $115,903,104) | 117,972,773 |
|
| Foreign Government Obligations(f) 1.0% |
| | | | |
| Colombia 0.1% |
| Colombia Government International Bond |
| 01/18/41 | 6.125% | | 235,000 | 271,462 |
| France 0.1% |
| Electricite de France SA(b) |
| 10/13/55 | 5.250% | | 704,000 | 718,088 |
| Mexico 0.6% |
| Mexico Government International Bond |
| 03/15/22 | 3.625% | | 781,000 | 805,211 |
| 03/08/44 | 4.750% | | 376,000 | 370,924 |
| Petroleos Mexicanos |
| 09/21/23 | 4.625% | | 639,000 | 642,706 |
| 06/15/35 | 6.625% | | 435,000 | 452,400 |
| Petroleos Mexicanos(b) |
| 03/13/27 | 6.500% | | 402,000 | 435,165 |
| Total | 2,706,406 |
| Panama 0.1% |
| Panama Government International Bond |
| 01/26/36 | 6.700% | | 270,000 | 348,975 |
| Peru 0.1% |
| Peruvian Government International Bond |
| 03/14/37 | 6.550% | | 285,000 | 373,350 |
| Philippines 0.0% |
| Philippine Government International Bond |
| 10/23/34 | 6.375% | | 100,000 | 133,383 |
The accompanying Notes to Financial Statements are an integral part of this statement.
| 14 | Columbia Bond Fund | Annual Report 2017 |
Portfolio of Investments (continued)
April 30, 2017
| Foreign Government Obligations(f) (continued) |
| Issuer | Coupon
Rate | | Principal
Amount ($) | Value ($) |
| Uruguay 0.0% |
| Uruguay Government International Bond |
| 11/20/45 | 4.125% | | 165,000 | 147,923 |
Total Foreign Government Obligations
(Cost $4,551,539) | 4,699,587 |
|
| Municipal Bonds 2.3% |
| Issue Description | Coupon
Rate | | Principal
Amount ($) | Value ($) |
| Higher Education 0.2% |
| University of Texas System (The) |
| Revenue Bonds |
| Series 2017J |
| 08/15/25 | 5.000% | | 490,000 | 600,510 |
| Series 2017J |
| 08/15/26 | 5.000% | | 445,000 | 550,514 |
| Total | 1,151,024 |
| Local General Obligation 0.5% |
| City of Chicago |
| Unlimited General Obligation Taxable Bonds |
| Series 2015B |
| 01/01/33 | 7.375% | | 200,000 | 201,254 |
| City of New York |
| Unlimited General Obligation Bonds |
| Series 2016B-1 |
| 12/01/41 | 5.000% | | 260,000 | 296,309 |
| Los Angeles Unified School District |
| Unlimited General Obligation Bonds |
Taxable Build America Bonds
Series 2009 |
| 07/01/34 | 5.750% | | 1,465,000 | 1,822,621 |
| Total | 2,320,184 |
| Sales Tax 0.1% |
| Central Puget Sound Regional Transit Authority |
| Revenue Bonds |
Green Bonds
Series 2016S-1 |
| 11/01/46 | 5.000% | | 390,000 | 498,798 |
| Special Non Property Tax 0.2% |
| JobsOhio Beverage System |
| Taxable Revenue Bonds |
| Series 2013B |
| 01/01/35 | 4.532% | | 825,000 | 895,397 |
| Municipal Bonds (continued) |
| Issue Description | Coupon
Rate | | Principal
Amount ($) | Value ($) |
| State General Obligation 0.9% |
| State of California |
| Unlimited General Obligation Bonds |
Taxable Build America Bonds
Series 2009 |
| 04/01/39 | 7.550% | | 1,190,000 | 1,757,547 |
| State of Mississippi |
| Unlimited General Obligation Bonds |
| Series 2016B |
| 12/01/27 | 5.000% | | 150,000 | 184,194 |
| State of Texas |
| Unlimited General Obligation Refunding Bonds |
Transportation Commission Mobility Fund
Series 2017 |
| 10/01/33 | 5.000% | | 435,000 | 518,829 |
Transportation Commission Mobility Fund
Series 2017 |
| 10/01/34 | 5.000% | | 1,695,000 | 2,011,541 |
| Total | 4,472,111 |
| Water & Sewer 0.4% |
| City of Chicago Waterworks |
| Revenue Bonds |
2nd Lien
Series 2012 |
| 11/01/42 | 5.000% | | 635,000 | 673,195 |
Build America Bonds
Series 2010 |
| 11/01/40 | 6.742% | | 865,000 | 1,081,190 |
| Total | 1,754,385 |
Total Municipal Bonds
(Cost $9,659,082) | 11,091,899 |
|
| Preferred Debt 0.1% |
| Issuer | Coupon
Rate | | Principal
Amount ($) | Value ($) |
| Banking 0.1% |
| State Street Corp.(a) |
| 12/31/49 | 5.350% | | 14,425 | 385,436 |
Total Preferred Debt
(Cost $360,625) | 385,436 |
|
The accompanying Notes to Financial Statements are an integral part of this statement.
Columbia Bond Fund | Annual Report 2017
| 15 |
Portfolio of Investments (continued)
April 30, 2017
| Residential Mortgage-Backed Securities - Agency 26.8% |
| Issuer | Coupon
Rate | | Principal
Amount ($) | Value ($) |
| Federal Home Loan Mortgage Corp. |
| 06/01/26 | 8.000% | | 380 | 428 |
03/01/21-
05/01/41 | 5.000% | | 912,532 | 1,007,197 |
09/01/25-
10/01/29 | 7.500% | | 25,882 | 29,072 |
11/01/25-
12/01/35 | 7.000% | | 238,971 | 285,410 |
06/01/43-
06/01/46 | 4.000% | | 19,250,109 | 20,311,124 |
01/01/46-
08/01/46 | 3.500% | | 4,485,570 | 4,626,593 |
| Federal National Mortgage Association |
| 10/01/29 | 7.500% | | 13,843 | 16,439 |
| 01/01/31 | 2.500% | | 1,537,453 | 1,549,346 |
| 07/01/38 | 6.000% | | 2,113,399 | 2,394,100 |
| 08/01/40 | 4.500% | | 4,986,079 | 5,386,878 |
| 09/01/40 | 5.000% | | 1,977,392 | 2,169,271 |
| 11/01/45 | 4.000% | | 3,120,224 | 3,306,834 |
10/01/20-
12/01/20 | 10.000% | | 18,176 | 18,463 |
08/01/29-
09/01/45 | 3.000% | | 11,904,310 | 12,123,748 |
12/01/29-
05/01/30 | 8.000% | | 95,068 | 107,924 |
05/01/43-
11/01/46 | 3.500% | | 22,491,802 | 23,188,940 |
| Federal National Mortgage Association(c) |
| 05/16/32 | 2.500% | | 4,100,000 | 4,123,543 |
| 05/11/47 | 4.500% | | 2,425,000 | 2,608,769 |
05/16/32-
05/11/47 | 3.000% | | 21,725,000 | 21,878,603 |
05/16/32-
05/11/47 | 3.500% | | 11,300,000 | 11,686,434 |
| Federal National Mortgage Association(g) |
| 01/01/40 | 5.500% | | 3,100,947 | 3,458,146 |
| Government National Mortgage Association |
| 03/20/28 | 6.000% | | 43,245 | 50,426 |
11/15/17-
12/15/17 | 8.500% | | 291 | 291 |
11/15/17-
06/15/30 | 9.000% | | 18,854 | 20,260 |
11/15/17-
08/15/20 | 9.500% | | 4,257 | 4,270 |
11/15/22-
02/15/30 | 7.000% | | 102,509 | 112,559 |
05/15/23-
12/15/31 | 6.500% | | 96,732 | 108,446 |
06/15/25-
01/15/30 | 8.000% | | 122,585 | 137,494 |
04/15/26-
03/15/30 | 7.500% | | 111,126 | 114,343 |
| Government National Mortgage Association(a) |
07/20/21-
06/20/28 | 2.125% | | 109,235 | 111,900 |
| Residential Mortgage-Backed Securities - Agency (continued) |
| Issuer | Coupon
Rate | | Principal
Amount ($) | Value ($) |
| Government National Mortgage Association(c) |
| 05/18/47 | 3.500% | | 1,000,000 | 1,039,297 |
| 06/21/47 | 4.000% | | 4,375,000 | 4,618,872 |
| Vendee Mortgage Trust(a),(d) |
| CMO Series 1998-1 Class 2IO |
| 03/15/28 | 0.330% | | 1,867,764 | 13,644 |
| CMO Series 1998-3 Class IO |
| 03/15/29 | 0.130% | | 2,427,512 | 2,831 |
Total Residential Mortgage-Backed Securities - Agency
(Cost $126,448,116) | 126,611,895 |
|
| Residential Mortgage-Backed Securities - Non-Agency 2.7% |
| | | | |
| American Mortgage Trust(a),(h) |
| Series 2093-3 Class 3A |
| 07/27/23 | 8.188% | | 3,613 | 2,190 |
| BCAP LLC Trust(a),(b) |
| CMO Series 2012-RR10 Class 9A1 |
| 10/26/35 | 3.134% | | 989,192 | 992,222 |
| Citigroup Mortgage Loan Trust, Inc.(a) |
| CMO Series 2005-WF2 Class MF1 |
| 08/25/35 | 5.227% | | 583,260 | 26,010 |
| Citigroup Mortgage Loan Trust, Inc.(a),(b) |
| CMO Series 2015-A Class A4 |
| 06/25/58 | 4.250% | | 597,501 | 614,194 |
| COLT Mortgage Loan Trust(a),(b) |
| CMO Series 20 17-1 Class A1 |
| 05/27/47 | 2.614% | | 2,210,000 | 2,209,962 |
| Credit Suisse Mortgage Capital Certificates(a),(b) |
| CMO Series 2011-16R Class 7A3 |
| 12/27/36 | 3.090% | | 40,852 | 40,851 |
| Mill City Mortgage Trust(b) |
| CMO Series 2016-1 Class A1 |
| 04/25/57 | 2.500% | | 1,035,170 | 1,032,944 |
| New Residential Mortgage Loan Trust(b) |
| CMO Series 2014-1A Class A |
| 01/25/54 | 3.750% | | 1,343,310 | 1,376,300 |
| CMO Series 2016-3A Class A1 |
| 09/25/56 | 3.750% | | 790,906 | 804,304 |
| Series 2014-2A Class A3 |
| 05/25/54 | 3.750% | | 687,268 | 701,998 |
| RBSSP Resecuritization Trust(a),(b) |
| CMO Series 2010-1 Class 3A1 |
| 08/26/35 | 3.050% | | 1,004,967 | 1,009,300 |
| Towd Point Mortgage Trust(b) |
| CMO Series 2016-2 Class A1 |
| 08/25/55 | 3.000% | | 1,561,679 | 1,578,250 |
The accompanying Notes to Financial Statements are an integral part of this statement.
| 16 | Columbia Bond Fund | Annual Report 2017 |
Portfolio of Investments (continued)
April 30, 2017
| Residential Mortgage-Backed Securities - Non-Agency (continued) |
| Issuer | Coupon
Rate | | Principal
Amount ($) | Value ($) |
| WaMu Mortgage Pass-Through Certificates(a) |
| CMO Series 2003-AR8 Class A |
| 08/25/33 | 2.680% | | 2,187,611 | 2,220,499 |
Total Residential Mortgage-Backed Securities - Non-Agency
(Cost $12,666,129) | 12,609,024 |
|
| U.S. Government & Agency Obligations 3.3% |
| | | | |
| Residual Funding Corp.(i) |
| STRIPS |
| 01/15/30 | 0.000% | | 3,342,000 | 2,269,636 |
| 04/15/30 | 0.000% | | 19,725,000 | 13,253,957 |
Total U.S. Government & Agency Obligations
(Cost $16,129,154) | 15,523,593 |
|
| U.S. Treasury Obligations 20.7% |
| | | | |
| U.S. Treasury |
| 07/15/17 | 0.875% | | 15,155,000 | 15,152,590 |
| 03/31/19 | 1.250% | | 4,439,000 | 4,437,961 |
| 04/15/20 | 1.500% | | 30,082,000 | 30,125,469 |
| 03/31/22 | 1.875% | | 6,253,000 | 6,268,876 |
| 03/31/24 | 2.125% | | 2,951,000 | 2,956,994 |
| 02/15/27 | 2.250% | | 3,245,000 | 3,235,492 |
| U.S. Treasury Obligations (continued) |
| Issuer | Coupon
Rate | | Principal
Amount ($) | Value ($) |
| 11/15/46 | 2.875% | | 17,532,800 | 17,232,831 |
| U.S. Treasury(i) |
| STRIPS |
| 11/15/18 | 0.000% | | 7,057,000 | 6,927,462 |
| 11/15/19 | 0.000% | | 4,135,000 | 3,988,022 |
| 02/15/40 | 0.000% | | 9,861,000 | 5,035,904 |
| 11/15/41 | 0.000% | | 5,013,000 | 2,389,898 |
Total U.S. Treasury Obligations
(Cost $95,726,632) | 97,751,499 |
| Money Market Funds 0.6% |
| | Shares | Value ($) |
| Columbia Short-Term Cash Fund, 0.869%(j),(k) | 2,633,674 | 2,633,674 |
Total Money Market Funds
(Cost $2,633,411) | 2,633,674 |
Total Investments
(Cost: $510,850,957) | 515,626,646 |
| Other Assets & Liabilities, Net | | (42,910,406) |
| Net Assets | 472,716,240 |
At April 30, 2017, securities and/or cash totaling $902,976 were pledged as collateral.
Investments in derivatives
Futures contracts outstanding at April 30, 2017
| Long futures contracts outstanding |
| Contract description | Number of
contracts | Trading
currency | Notional market
value ($) | Expiration date | Unrealized
appreciation ($) | Unrealized
depreciation ($) |
| U.S. Treasury 10-Year Note | 118 | USD | 14,834,812 | 06/2017 | 104,653 | — |
| U.S. Treasury 2-Year Note | 60 | USD | 12,996,563 | 06/2017 | 9,261 | — |
| U.S. Treasury 2-Year Note | 11 | USD | 2,382,703 | 06/2017 | 6,681 | — |
| U.S. Treasury 2-Year Note | 11 | USD | 2,382,703 | 06/2017 | 1,871 | — |
| U.S. Treasury 5-Year Note | 224 | USD | 26,523,000 | 06/2017 | 70,629 | — |
| U.S. Treasury 5-Year Note | 33 | USD | 3,907,406 | 06/2017 | 12,208 | — |
| Total | | | 63,027,187 | | 205,303 | — |
| Short futures contracts outstanding |
| Contract description | Number of
contracts | Trading
currency | Notional market
value ($) | Expiration date | Unrealized
appreciation ($) | Unrealized
depreciation ($) |
| U.S. Long Bond | (3) | USD | (458,906) | 06/2017 | — | (1,464) |
| U.S. Long Bond | (64) | USD | (9,790,000) | 06/2017 | — | (181,973) |
| U.S. Treasury Ultra 10-Year Note | (12) | USD | (1,625,438) | 06/2017 | — | (30,344) |
| U.S. Treasury Ultra 10-Year Note | (49) | USD | (6,637,203) | 06/2017 | — | (47,614) |
| U.S. Ultra Bond | (53) | USD | (8,635,688) | 06/2017 | — | (161,585) |
| Total | | | (27,147,235) | | — | (422,980) |
The accompanying Notes to Financial Statements are an integral part of this statement.
Columbia Bond Fund | Annual Report 2017
| 17 |
Portfolio of Investments (continued)
April 30, 2017
Credit default swap contracts outstanding at April 30, 2017
| Buy protection |
| Counterparty | Reference
entity | Expiration
date | Pay
fixed
rate
(%) | Notional
currency | Notional
amount | Market
value
($) | Periodic
payments
receivable
(payable)
($) | Premium
paid
($) | Premium
received
($) | Unrealized
appreciation
($) | Unrealized
depreciation
($) |
| Barclays | McDonald’s Corp. | 6/20/2022 | 1.000 | USD | 475,000 | (17,259) | (528) | — | (15,256) | — | (2,531) |
| Citi | Goldman Sachs Group, Inc. | 6/20/2022 | 1.000 | USD | 810,000 | (11,122) | (899) | — | (5,810) | — | (6,211) |
| JPMorgan | Goldman Sachs Group, Inc. | 6/20/2022 | 1.000 | USD | 6,480,000 | (88,972) | (7,201) | — | (37,131) | — | (59,042) |
| Total | | | | | | | | — | (58,197) | — | (67,784) |
Cleared credit default swap contracts outstanding at April 30, 2017
| Buy protection |
| Counterparty | Reference
entity | Expiration
date | Pay fixed
rate (%) | Notional
currency | Notional
amount | Unrealized
appreciation ($) | Unrealized
depreciation ($) |
| Morgan Stanley | Markit CDX North America Investment Grade Index, Series 28 | 6/20/2022 | 1.000 | USD | 22,895,000 | — | (55,287) |
Cleared credit default swap contracts outstanding at April 30, 2017
| Sell protection |
| Counterparty | Reference
entity | Expiration
date | Receive fixed
rate (%) | Implied
credit
spread (%)* | Notional
currency | Notional
amount | Unrealized
appreciation ($) | Unrealized
depreciation ($) |
| Morgan Stanley | Markit CDX North America Investment Grade Index, Series 28 | 6/20/2024 | 1.000 | 0.899 | USD | 8,750,000 | 25,074 | — |
| Morgan Stanley | Markit CDX North America Investment Grade Index, Series 28 | 6/20/2027 | 1.000 | 1.078 | USD | 13,000,000 | 20,449 | — |
| Total | | | | | | | 45,523 | — |
| * | Implied credit spreads, represented in absolute terms, utilized in determining the market value of credit default swap agreements on corporate or sovereign issues as of period end serve as an indicator of the current status of the payment/performance risk and represent the likelihood or risk of default for the credit derivative. The implied credit spread of a particular referenced entity reflects the cost of buying/selling protection and may include upfront payments required to be made to enter into the agreement. Wider credit spreads represent a deterioration of the referenced entity’s credit soundness and a greater likelihood or risk of default or other credit event occurring as defined under the terms of the agreement. |
Notes to Portfolio of Investments
| (a) | Variable rate security. |
| (b) | Represents privately placed and other securities and instruments exempt from SEC registration (collectively, private placements), such as Section 4(a)(2) and Rule 144A eligible securities, which are often sold only to qualified institutional buyers. The Fund may invest in private placements determined to be liquid as well as those determined to be illiquid. Private placements may be determined to be liquid under guidelines established by the Fund’s Board of Trustees. At April 30, 2017, the value of these securities amounted to $70,289,521 which represents 14.87% of net assets. |
| (c) | Represents a security purchased on a when-issued basis. |
| (d) | Represents interest only securities which have the right to receive the monthly interest payments on an underlying pool of mortgage loans. |
| (e) | Non-income producing investment. |
| (f) | Principal and interest may not be guaranteed by the government. |
| (g) | This security or a portion of this security has been pledged as collateral in connection with derivative contracts. |
| (h) | Represents fair value as determined in good faith under procedures approved by the Board of Trustees. At April 30, 2017, the value of these securities amounted to $2,190, which represents less than 0.01% of net assets. |
| (i) | Zero coupon bond. |
| (j) | The rate shown is the seven-day current annualized yield at April 30, 2017. |
The accompanying Notes to Financial Statements are an integral part of this statement.
| 18 | Columbia Bond Fund | Annual Report 2017 |
Portfolio of Investments (continued)
April 30, 2017
Notes to Portfolio of Investments (continued)
| (k) | As defined in the Investment Company Act of 1940, an affiliated company is one in which the Fund owns 5% or more of the company’s outstanding voting securities, or a company which is under common ownership or control with the Fund. Holdings and transactions in these affiliated companies during the year ended April 30, 2017 are as follows: |
| Issuer | Beginning
shares | Shares
purchased | Shares
sold | Ending
shares | Realized gain
(loss) ($) | Dividends —
affiliated
issuers($) | Value ($) |
| Columbia Short-Term Cash Fund, 0.869% | 868,546 | 204,687,984 | (202,922,856) | 2,633,674 | 741 | 35,715 | 2,633,674 |
Abbreviation Legend
| CMO | Collateralized Mortgage Obligation |
| STRIPS | Separate Trading of Registered Interest and Principal Securities |
Currency Legend
Fair value measurements
The Fund categorizes its fair value measurements according to a three-level hierarchy that maximizes the use of observable inputs and minimizes the use of unobservable inputs by prioritizing that the most observable input be used when available. Observable inputs are those that market participants would use in pricing an investment based on market data obtained from sources independent of the reporting entity. Unobservable inputs are those that reflect the Fund’s assumptions about the information market participants would use in pricing an investment. An investment’s level within the fair value hierarchy is based on the lowest level of any input that is deemed significant to the asset’s or liability’s fair value measurement. The input levels are not necessarily an indication of the risk or liquidity associated with investments at that level. For example, certain U.S. government securities are generally high quality and liquid, however, they are reflected as Level 2 because the inputs used to determine fair value may not always be quoted prices in an active market.
Fair value inputs are summarized in the three broad levels listed below:
| • | Level 1 – Valuations based on quoted prices for investments in active markets that the Fund has the ability to access at the measurement date (including NAV for open-end mutual funds). Valuation adjustments are not applied to Level 1 investments. |
| • | Level 2 – Valuations based on other significant observable inputs (including quoted prices for similar securities, interest rates, prepayment speeds, credit risks, etc.). |
| • | Level 3 – Valuations based on significant unobservable inputs (including the Fund’s own assumptions and judgment in determining the fair value of investments). |
Inputs that are used in determining fair value of an investment may include price information, credit data, volatility statistics, and other factors. These inputs can be either observable or unobservable. The availability of observable inputs can vary between investments, and is affected by various factors such as the type of investment, and the volume and level of activity for that investment or similar investments in the marketplace. The inputs will be considered by the Investment Manager, along with any other relevant factors in the calculation of an investment’s fair value. The Fund uses prices and inputs that are current as of the measurement date, which may include periods of market dislocations. During these periods, the availability of prices and inputs may be reduced for many investments. This condition could cause an investment to be reclassified between the various levels within the hierarchy.
Certain investments that have been measured at fair value using the net asset value (NAV) per share (or its equivalent) are not categorized in the fair value hierarchy. The fair value amounts presented in the table are intended to reconcile the fair value hierarchy to the amounts presented in the Portfolio of Investments. The Columbia Short-Term Cash Fund seeks to provide shareholders with maximum current income consistent with liquidity and stability of principal. Columbia Short-Term Cash Fund prices its shares with a floating NAV and no longer seeks to maintain a stable NAV.
Investments falling into the Level 3 category are primarily supported by quoted prices from brokers and dealers participating in the market for those investments. However, these may be classified as Level 3 investments due to lack of market transparency and corroboration to support these quoted prices. Additionally, valuation models may be used as the pricing source for any remaining investments classified as Level 3. These models may rely on one or more significant unobservable inputs and/or significant assumptions by the Investment Manager. Inputs used in valuations may include, but are not limited to, financial statement analysis, capital account balances, discount rates and estimated cash flows, and comparable company data.
Under the direction of the Fund’s Board of Trustees (the Board), the Investment Manager’s Valuation Committee (the Committee) is responsible for overseeing the valuation procedures approved by the Board. The Committee consists of voting and non-voting members from various groups within the Investment Manager’s organization, including operations and accounting, trading and investments, compliance, risk management and legal.
The Committee meets at least monthly to review and approve valuation matters, which may include a description of specific valuation determinations, data regarding pricing information received from approved pricing vendors and brokers and the results of Board-approved valuation control policies and procedures (the Policies). The Policies address, among other things, instances when market quotations are or are not readily available, including recommendations of third party pricing vendors and a determination of appropriate pricing methodologies; events that require specific valuation determinations and assessment of fair value techniques; securities with a potential for stale pricing, including those that are illiquid, restricted, or in default; and the effectiveness of third party pricing vendors, including periodic reviews of vendors. The Committee meets more frequently, as needed, to discuss additional valuation matters, which may include the need to review back-testing results, review time-sensitive information or approve related valuation actions. The Committee reports to the Board, with members of the Committee meeting with the Board at each of its regularly scheduled meetings to discuss valuation matters and actions during the period, similar to those described earlier.
The accompanying Notes to Financial Statements are an integral part of this statement.
Columbia Bond Fund | Annual Report 2017
| 19 |
Portfolio of Investments (continued)
April 30, 2017
Fair value measurements (continued)
For investments categorized as Level 3, the Committee monitors information similar to that described above, which may include: (i) data specific to the issuer or comparable issuers, (ii) general market or specific sector news and (iii) quoted prices and specific or similar security transactions. The Committee considers this data and any changes from prior periods in order to assess the reasonableness of observable and unobservable inputs, any assumptions or internal models used to value those securities and changes in fair value. This data is also used to corroborate, when available, information received from approved pricing vendors and brokers. Various factors impact the frequency of monitoring this information (which may occur as often as daily). However, the Committee may determine that changes to inputs, assumptions and models are not required as a result of the monitoring procedures performed.
The following table is a summary of the inputs used to value the Fund’s investments at April 30, 2017:
| | Level 1
quoted prices
in active
markets for
identical
assets ($) | Level 2
other
significant
observable
inputs ($) | Level 3
significant
unobservable
inputs ($) | Investments
measured at
net asset
value ($) | Total ($) |
| Investments | | | | | |
| Asset-Backed Securities — Agency | — | 18,122,542 | — | — | 18,122,542 |
| Asset-Backed Securities — Non-Agency | — | 80,429,214 | — | — | 80,429,214 |
| Commercial Mortgage-Backed Securities - Agency | — | 7,609,506 | — | — | 7,609,506 |
| Commercial Mortgage-Backed Securities - Non-Agency | — | 20,184,983 | — | — | 20,184,983 |
| Common Stocks | | | | | |
| Consumer Staples | 31 | — | — | — | 31 |
| Financials | 990 | — | — | — | 990 |
| Total Common Stocks | 1,021 | — | — | — | 1,021 |
| Corporate Bonds & Notes | — | 117,972,773 | — | — | 117,972,773 |
| Foreign Government Obligations | — | 4,699,587 | — | — | 4,699,587 |
| Municipal Bonds | — | 11,091,899 | — | — | 11,091,899 |
| Preferred Debt | 385,436 | — | — | — | 385,436 |
| Residential Mortgage-Backed Securities - Agency | — | 126,611,895 | — | — | 126,611,895 |
| Residential Mortgage-Backed Securities - Non-Agency | — | 10,396,872 | 2,212,152 | — | 12,609,024 |
| U.S. Government & Agency Obligations | — | 15,523,593 | — | — | 15,523,593 |
| U.S. Treasury Obligations | 79,410,213 | 18,341,286 | — | — | 97,751,499 |
| Money Market Funds | — | — | — | 2,633,674 | 2,633,674 |
| Total Investments | 79,796,670 | 430,984,150 | 2,212,152 | 2,633,674 | 515,626,646 |
| Derivatives | | | | | |
| Asset | | | | | |
| Futures Contracts | 205,303 | — | — | — | 205,303 |
| Swap Contracts | — | 45,523 | — | — | 45,523 |
| Liability | | | | | |
| Futures Contracts | (422,980) | — | — | — | (422,980) |
| Swap Contracts | — | (123,071) | — | — | (123,071) |
| Total | 79,578,993 | 430,906,602 | 2,212,152 | 2,633,674 | 515,331,421 |
See the Portfolio of Investments for all investment classifications not indicated in the table.
The Fund’s assets assigned to the Level 2 input category are generally valued using the market approach, in which a security’s value is determined through reference to prices and information from market transactions for similar or identical assets.
Derivative instruments are valued at unrealized appreciation (depreciation).
There were no transfers of financial assets between levels during the period.
The accompanying Notes to Financial Statements are an integral part of this statement.
| 20 | Columbia Bond Fund | Annual Report 2017 |
Portfolio of Investments (continued)
April 30, 2017
Fair value measurements (continued)
The following table is a reconciliation of Level 3 assets for which significant observable and unobservable inputs were used to determine fair value:
| Investments in securities | Balance
as of
04/30/2016
($) | Increase
(decrease)
in accrued
discounts/
premiums
($) | Realized
gain (loss)
($) | Change
in unrealized
appreciation
(depreciation)(a)
($) | Purchases
($) | Sales
($) | Balance
as of
04/30/2017
($) |
| Asset-Backed Securities — Non-Agency | 1,748,867 | — | 61 | 1,072 | 100,000 | (1,850,000) | — |
| Residential Mortgage-Backed Securities — Agency | 6,845,889 | — | — | (15,944) | — | (6,829,945) | — |
| Residential Mortgage-Backed Securities — Non-Agency | 2,594 | 299 | — | (37) | 2,209,961 | (665) | 2,212,152 |
| Total | 8,597,350 | 299 | 61 | (14,909) | 2,309,961 | (8,680,610) | 2,212,152 |
(a) Change in unrealized depreciation relating to securities held at April 30, 2017 was $37, which is comprised of Residential Mortgage-Backed Securities — Non-Agency of $37.
The Fund’s assets assigned to the Level 3 category are valued utilizing the valuation technique deemed the most appropriate in the circumstances. Certain residential mortgage backed securities and asset backed securities classified as Level 3 securities are valued using the market approach. To determine fair value for these securities, management considered various factors which may have included, but were not limited to, estimated cash flows of the securities, single market quotations, observable transactions for identical or similar assets in the market and the distressed nature of the security. The appropriateness of fair values for these securities is monitored on an ongoing basis which may include results of back testing, manual price reviews and other control procedures. Significant increases (decreases) to any of these inputs would result in a significantly lower (higher) fair value measurement.
The accompanying Notes to Financial Statements are an integral part of this statement.
Columbia Bond Fund | Annual Report 2017
| 21 |
Statement of Assets and Liabilities
April 30, 2017
| Assets | |
| Investments, at cost | |
| Unaffiliated issuers, at cost | $508,217,546 |
| Affiliated issuers, at cost | 2,633,411 |
| Total investments, at cost | 510,850,957 |
| Investments, at value | |
| Unaffiliated issuers, at value | 512,992,972 |
| Affiliated issuers, at value | 2,633,674 |
| Total investments, at value | 515,626,646 |
| Margin deposits | 345,533 |
| Receivable for: | |
| Investments sold | 7,430,251 |
| Investments sold on a delayed delivery basis | 4,623,889 |
| Capital shares sold | 457,719 |
| Dividends | 5,844 |
| Interest | 2,294,102 |
| Foreign tax reclaims | 3,694 |
| Variation margin | 21,012 |
| Expense reimbursement due from Investment Manager | 1,689 |
| Prepaid expenses | 1,036 |
| Trustees’ deferred compensation plan | 155,742 |
| Total assets | 530,967,157 |
| Liabilities | |
| Due to custodian | 159,741 |
| Unrealized depreciation on swap contracts | 67,784 |
| Premiums received on outstanding swap contracts | 58,197 |
| Payable for: | |
| Investments purchased | 5,300,036 |
| Investments purchased on a delayed delivery basis | 51,199,769 |
| Capital shares purchased | 487,924 |
| Distributions to shareholders | 560,982 |
| Variation margin | 71,605 |
| Management services fees | 6,474 |
| Distribution and/or service fees | 677 |
| Transfer agent fees | 63,168 |
| Compensation of board members | 57,325 |
| Compensation of chief compliance officer | 25 |
| Other expenses | 61,468 |
| Trustees’ deferred compensation plan | 155,742 |
| Total liabilities | 58,250,917 |
| Net assets applicable to outstanding capital stock | $472,716,240 |
| Represented by | |
| Paid in capital | 471,204,360 |
| Excess of distributions over net investment income | (430,579) |
| Accumulated net realized loss | (2,538,005) |
| Unrealized appreciation (depreciation) on: | |
| Investments - unaffiliated issuers | 4,775,426 |
| Investments - affiliated issuers | 263 |
| Futures contracts | (217,677) |
| Swap contracts | (77,548) |
| Total - representing net assets applicable to outstanding capital stock | $472,716,240 |
The accompanying Notes to Financial Statements are an integral part of this statement.
| 22 | Columbia Bond Fund | Annual Report 2017 |
Statement of Assets and Liabilities (continued)
April 30, 2017
| Class A | |
| Net assets | $52,029,006 |
| Shares outstanding | 6,144,554 |
| Net asset value per share | $8.47 |
| Maximum offering price per share(a) | $8.89 |
| Class B | |
| Net assets | $132,308 |
| Shares outstanding | 15,623 |
| Net asset value per share | $8.47 |
| Class C | |
| Net assets | $9,460,754 |
| Shares outstanding | 1,118,394 |
| Net asset value per share | $8.46 |
| Class R | |
| Net assets | $922,341 |
| Shares outstanding | 108,899 |
| Net asset value per share | $8.47 |
| Class R4 | |
| Net assets | $515,619 |
| Shares outstanding | 60,925 |
| Net asset value per share | $8.46 |
| Class R5 | |
| Net assets | $735,176 |
| Shares outstanding | 87,059 |
| Net asset value per share | $8.44 |
| Class T(b) | |
| Net assets | $9,658 |
| Shares outstanding | 1,139 |
| Net asset value per share | $8.48 |
| Maximum offering price per share(c) | $8.70 |
| Class V(d) | |
| Net assets | $10,138,791 |
| Shares outstanding | 1,199,108 |
| Net asset value per share | $8.46 |
| Maximum offering price per share(e) | $8.88 |
| Class Y | |
| Net assets | $29,755,879 |
| Shares outstanding | 3,508,055 |
| Net asset value per share | $8.48 |
| Class Z | |
| Net assets | $369,016,708 |
| Shares outstanding | 43,578,311 |
| Net asset value per share | $8.47 |
| (a) | The maximum offering price per share is calculated by dividing the net asset value per share by 1.0 minus the maximum sales charge of 4.75% for Class A. |
| (b) | Effective March 27, 2017, Class W shares were renamed Class T shares. |
| (c) | The maximum offering price per share is calculated by dividing the net asset value per share by 1.0 minus the maximum sales charge of 2.50% for Class T. |
| (d) | Effective January 24, 2017, Class T shares were renamed Class V shares. |
| (e) | The maximum offering price per share is calculated by dividing the net asset value per share by 1.0 minus the maximum sales charge of 4.75% for Class V. |
The accompanying Notes to Financial Statements are an integral part of this statement.
Columbia Bond Fund | Annual Report 2017
| 23 |
Statement of Operations
Year Ended April 30, 2017
| Net investment income | |
| Income: | |
| Dividends — unaffiliated issuers | $53,783 |
| Dividends — affiliated issuers | 35,715 |
| Interest | 13,897,291 |
| Total income | 13,986,789 |
| Expenses: | |
| Management services fees | 2,601,726 |
| Distribution and/or service fees | |
| Class A | 140,756 |
| Class B | 2,951 |
| Class C | 108,524 |
| Class R | 6,978 |
| Class T(a) | 25 |
| Class V(b) | 15,813 |
| Transfer agent fees | |
| Class A | 111,497 |
| Class B | 589 |
| Class C | 21,507 |
| Class R | 2,770 |
| Class R4 | 928 |
| Class R5 | 128 |
| Class T(a) | 21 |
| Class V(b) | 20,877 |
| Class Y | 1,037 |
| Class Z | 812,447 |
| Compensation of board members | 33,882 |
| Custodian fees | 35,613 |
| Printing and postage fees | 44,693 |
| Registration fees | 145,242 |
| Audit fees | 43,799 |
| Legal fees | 13,742 |
| Compensation of chief compliance officer | 239 |
| Other | (148,192) |
| Total expenses | 4,017,592 |
| Fees waived or expenses reimbursed by Investment Manager and its affiliates | (784,175) |
| Expense reduction | (1,220) |
| Total net expenses | 3,232,197 |
| Net investment income | 10,754,592 |
| Realized and unrealized gain (loss) — net | |
| Net realized gain (loss) on: | |
| Investments — unaffiliated issuers | 8,087,141 |
| Investments — affiliated issuers | 741 |
| Futures contracts | 239,007 |
| Swap contracts | (364,773) |
| Net realized gain | 7,962,116 |
| Net change in unrealized appreciation (depreciation) on: | |
| Investments — unaffiliated issuers | (10,484,833) |
| Investments — affiliated issuers | 263 |
| Futures contracts | (689,983) |
| Swap contracts | (16,816) |
| Net change in unrealized appreciation (depreciation) | (11,191,369) |
| Net realized and unrealized loss | (3,229,253) |
| Net increase in net assets resulting from operations | $7,525,339 |
| (a) | Effective March 27, 2017, Class W shares were renamed Class T shares. |
| (b) | Effective January 24, 2017, Class T shares were renamed Class V shares. |
The accompanying Notes to Financial Statements are an integral part of this statement.
| 24 | Columbia Bond Fund | Annual Report 2017 |
Statement of Changes in Net Assets
| | Year Ended
April 30, 2017 | Year Ended
April 30, 2016 |
| Operations | | |
| Net investment income | $10,754,592 | $11,780,787 |
| Net realized gain | 7,962,116 | 8,507,167 |
| Net change in unrealized appreciation (depreciation) | (11,191,369) | (5,506,252) |
| Net increase in net assets resulting from operations | 7,525,339 | 14,781,702 |
| Distributions to shareholders | | |
| Net investment income | | |
| Class A | (1,034,173) | (1,243,824) |
| Class B | (3,217) | (7,906) |
| Class C | (117,504) | (159,772) |
| Class I(a) | (202) | (279) |
| Class R | (22,179) | (43,680) |
| Class R4 | (9,804) | (8,271) |
| Class R5 | (4,047) | (7,526) |
| Class T(b) | (180) | (239) |
| Class V(c) | (203,922) | (280,022) |
| Class Y | (685,915) | (833,619) |
| Class Z | (8,545,326) | (12,419,108) |
| Net realized gains | | |
| Class A | (1,373,217) | (1,218,092) |
| Class B | (7,527) | (11,229) |
| Class C | (265,520) | (225,803) |
| Class I(a) | (233) | (239) |
| Class R | (33,217) | (58,479) |
| Class R4 | (11,833) | (7,353) |
| Class R5 | (2,265) | (7,137) |
| Class T(b) | (233) | (240) |
| Class V(c) | (249,031) | (264,458) |
| Class Y | (694,144) | (728,043) |
| Class Z | (9,771,071) | (11,277,451) |
| Total distributions to shareholders | (23,034,760) | (28,802,770) |
| Decrease in net assets from capital stock activity | (63,208,077) | (89,172,343) |
| Total decrease in net assets | (78,717,498) | (103,193,411) |
| Net assets at beginning of year | 551,433,738 | 654,627,149 |
| Net assets at end of year | $472,716,240 | $551,433,738 |
| Undistributed (excess of distributions over) net investment income | $(430,579) | $270,279 |
| (a) | Effective March 27, 2017, Class I shares were redeemed or exchanged for Class Y shares. |
| (b) | Effective March 27, 2017, Class W shares were renamed Class T shares. |
| (c) | Effective January 24, 2017, Class T shares were renamed Class V shares. |
The accompanying Notes to Financial Statements are an integral part of this statement.
Columbia Bond Fund | Annual Report 2017
| 25 |
Statement of Changes in Net Assets (continued)
| | Year Ended | Year Ended |
| | April 30, 2017 | April 30, 2016 |
| | Shares | Dollars ($) | Shares | Dollars ($) |
| Capital stock activity |
| Class A | | | | |
| Subscriptions (a) | 1,659,903 | 14,441,255 | 1,447,754 | 12,530,595 |
| Distributions reinvested | 204,954 | 1,737,972 | 202,673 | 1,738,276 |
| Redemptions | (2,033,377) | (17,389,013) | (1,201,283) | (10,438,856) |
| Net increase (decrease) | (168,520) | (1,209,786) | 449,144 | 3,830,015 |
| Class B | | | | |
| Subscriptions | 3,079 | 27,031 | 4,391 | 37,833 |
| Distributions reinvested | 897 | 7,588 | 1,460 | 12,501 |
| Redemptions (a) | (30,359) | (258,002) | (37,264) | (324,094) |
| Net decrease | (26,383) | (223,383) | (31,413) | (273,760) |
| Class C | | | | |
| Subscriptions | 343,687 | 2,998,865 | 497,828 | 4,298,550 |
| Distributions reinvested | 37,211 | 314,028 | 35,021 | 299,573 |
| Redemptions | (510,105) | (4,370,918) | (341,850) | (2,955,428) |
| Net increase (decrease) | (129,207) | (1,058,025) | 190,999 | 1,642,695 |
| Class I(b) | | | | |
| Redemptions | (1,136) | (9,587) | — | — |
| Net decrease | (1,136) | (9,587) | — | — |
| Class R | | | | |
| Subscriptions | 13,908 | 120,270 | 107,472 | 930,825 |
| Distributions reinvested | 6,405 | 54,269 | 10,812 | 92,696 |
| Redemptions | (111,998) | (956,730) | (143,113) | (1,223,237) |
| Net decrease | (91,685) | (782,191) | (24,829) | (199,716) |
| Class R4 | | | | |
| Subscriptions | 29,554 | 255,853 | 48,949 | 424,066 |
| Distributions reinvested | 2,501 | 21,197 | 1,766 | 15,113 |
| Redemptions | (15,879) | (135,528) | (8,882) | (76,926) |
| Net increase | 16,176 | 141,522 | 41,833 | 362,253 |
| Class R5 | | | | |
| Subscriptions | 80,727 | 679,688 | 598 | 5,151 |
| Distributions reinvested | 695 | 5,861 | 1,651 | 14,147 |
| Redemptions | (394) | (3,647) | (42,677) | (365,310) |
| Net increase (decrease) | 81,028 | 681,902 | (40,428) | (346,012) |
| Class T(c) | | | | |
| Distributions reinvested | 1 | 9 | — | — |
| Net increase | 1 | 9 | — | — |
| Class V(d) | | | | |
| Subscriptions | 13,760 | 118,220 | 13,848 | 118,683 |
| Distributions reinvested | 39,128 | 331,591 | 45,396 | 388,980 |
| Redemptions | (103,950) | (893,946) | (144,583) | (1,257,650) |
| Net decrease | (51,062) | (444,135) | (85,339) | (749,987) |
| Class Y(b) | | | | |
| Subscriptions | 195,872 | 1,674,782 | 793,703 | 6,891,515 |
| Distributions reinvested | 1,059 | 9,025 | — | — |
| Redemptions | (349,914) | (3,114,746) | (175,234) | (1,500,000) |
| Net increase (decrease) | (152,983) | (1,430,939) | 618,469 | 5,391,515 |
The accompanying Notes to Financial Statements are an integral part of this statement.
| 26 | Columbia Bond Fund | Annual Report 2017 |
Statement of Changes in Net Assets (continued)
| | Year Ended | Year Ended |
| | April 30, 2017 | April 30, 2016 |
| | Shares | Dollars ($) | Shares | Dollars ($) |
| Class Z | | | | |
| Subscriptions | 3,688,460 | 31,717,666 | 3,470,017 | 30,004,058 |
| Distributions reinvested | 324,263 | 2,754,026 | 408,493 | 3,507,215 |
| Redemptions | (10,890,599) | (93,345,156) | (15,227,643) | (132,340,619) |
| Net decrease | (6,877,876) | (58,873,464) | (11,349,133) | (98,829,346) |
| Total net decrease | (7,401,647) | (63,208,077) | (10,230,697) | (89,172,343) |
| (a) | Includes conversions of Class B shares to Class A shares, if any. |
| (b) | Effective March 27, 2017, Class I shares were redeemed or exchanged for Class Y shares. |
| (c) | Effective March 27, 2017, Class W shares were renamed Class T shares. |
| (d) | Effective January 24, 2017, Class T shares were renamed Class V shares. |
The accompanying Notes to Financial Statements are an integral part of this statement.
Columbia Bond Fund | Annual Report 2017
| 27 |
The following table is intended to help you understand the Fund’s financial performance. Certain information reflects financial results for a single share of a class held for the periods shown. Per share net investment income (loss) amounts are calculated based on average shares outstanding during the period. Total return assumes reinvestment of all dividends and distributions, if any. Total return does not reflect payment of sales charges, if any. Total return and portfolio turnover are not annualized for periods of less than one year. The portfolio turnover rate is calculated without regard to purchase and sales transactions of short-term instruments and certain derivatives, if any. If such transactions were included, the Fund’s portfolio turnover rate may be higher.
| Year ended | Net asset value,
beginning of
period | Net
investment
income | Net
realized
and
unrealized
gain (loss) | Total from
investment
operations | Distributions
from net
investment
income | Distributions
from net
realized
gains |
| Class A |
| 4/30/2017 | $8.72 | 0.16 | (0.05) | 0.11 | (0.15) | (0.21) |
| 4/30/2016 | $8.91 | 0.16 | 0.07 | 0.23 | (0.21) | (0.21) |
| 4/30/2015 | $8.86 | 0.17 | 0.15 | 0.32 | (0.16) | (0.11) |
| 4/30/2014 | $9.46 | 0.16 | (0.30) | (0.14) | (0.17) | (0.29) |
| 4/30/2013 | $9.58 | 0.23 | 0.17 | 0.40 | (0.23) | (0.29) |
| Class B |
| 4/30/2017 | $8.72 | 0.10 | (0.05) | 0.05 | (0.09) | (0.21) |
| 4/30/2016 | $8.91 | 0.09 | 0.07 | 0.16 | (0.14) | (0.21) |
| 4/30/2015 | $8.86 | 0.10 | 0.15 | 0.25 | (0.09) | (0.11) |
| 4/30/2014 | $9.46 | 0.10 | (0.31) | (0.21) | (0.10) | (0.29) |
| 4/30/2013 | $9.58 | 0.16 | 0.17 | 0.33 | (0.16) | (0.29) |
| Class C |
| 4/30/2017 | $8.71 | 0.10 | (0.05) | 0.05 | (0.09) | (0.21) |
| 4/30/2016 | $8.90 | 0.09 | 0.07 | 0.16 | (0.14) | (0.21) |
| 4/30/2015 | $8.85 | 0.10 | 0.16 | 0.26 | (0.10) | (0.11) |
| 4/30/2014 | $9.45 | 0.11 | (0.31) | (0.20) | (0.11) | (0.29) |
| 4/30/2013 | $9.57 | 0.17 | 0.17 | 0.34 | (0.17) | (0.29) |
| Class R |
| 4/30/2017 | $8.72 | 0.14 | (0.05) | 0.09 | (0.13) | (0.21) |
| 4/30/2016 | $8.91 | 0.14 | 0.07 | 0.21 | (0.19) | (0.21) |
| 4/30/2015 | $8.86 | 0.14 | 0.16 | 0.30 | (0.14) | (0.11) |
| 4/30/2014 | $9.46 | 0.14 | (0.31) | (0.17) | (0.14) | (0.29) |
| 4/30/2013 | $9.58 | 0.21 | 0.16 | 0.37 | (0.20) | (0.29) |
| Class R4 |
| 4/30/2017 | $8.72 | 0.18 | (0.06) | 0.12 | (0.17) | (0.21) |
| 4/30/2016 | $8.91 | 0.18 | 0.07 | 0.25 | (0.23) | (0.21) |
| 4/30/2015 | $8.85 | 0.19 | 0.16 | 0.35 | (0.18) | (0.11) |
| 4/30/2014 | $9.45 | 0.18 | (0.30) | (0.12) | (0.19) | (0.29) |
| 4/30/2013 (e) | $9.73 | 0.10 | (0.07) (f) | 0.03 | (0.10) | (0.21) |
| Class R5 |
| 4/30/2017 | $8.70 | 0.17 | (0.04) | 0.13 | (0.18) | (0.21) |
| 4/30/2016 | $8.89 | 0.19 | 0.07 | 0.26 | (0.24) | (0.21) |
| 4/30/2015 | $8.84 | 0.20 | 0.15 | 0.35 | (0.19) | (0.11) |
| 4/30/2014 | $9.45 | 0.19 | (0.31) | (0.12) | (0.20) | (0.29) |
| 4/30/2013 (h) | $9.73 | 0.11 | (0.07) (f) | 0.04 | (0.11) | (0.21) |
The accompanying Notes to Financial Statements are an integral part of this statement.
| 28 | Columbia Bond Fund | Annual Report 2017 |
Total
distributions to
shareholders | Net
asset
value,
end of
period | Total
return | Total gross
expense
ratio to
average
net assets(a) | Total net
expense
ratio to
average
net assets(a),(b) | Net investment
income
ratio to
average
net assets(a) | Portfolio
turnover | Net
assets,
end of
period
(000’s) |
| |
| (0.36) | $8.47 | 1.34% | 0.98% (c) | 0.82% (c),(d) | 1.86% | 375% | $52,029 |
| (0.42) | $8.72 | 2.74% | 1.02% | 0.86% (d) | 1.83% | 428% | $55,058 |
| (0.27) | $8.91 | 3.63% | 1.01% | 0.90% (d) | 1.85% | 350% | $52,256 |
| (0.46) | $8.86 | (1.42%) | 0.98% | 0.96% (d) | 1.83% | 360% | $61,159 |
| (0.52) | $9.46 | 4.21% | 0.98% | 0.90% (d) | 2.43% | 221% | $82,739 |
| |
| (0.30) | $8.47 | 0.58% | 1.72% (c) | 1.57% (c),(d) | 1.13% | 375% | $132 |
| (0.35) | $8.72 | 1.98% | 1.77% | 1.61% (d) | 1.08% | 428% | $366 |
| (0.20) | $8.91 | 2.85% | 1.76% | 1.65% (d) | 1.09% | 350% | $654 |
| (0.39) | $8.86 | (2.15%) | 1.73% | 1.71% (d) | 1.07% | 360% | $1,037 |
| (0.45) | $9.46 | 3.43% | 1.73% | 1.65% (d) | 1.70% | 221% | $2,110 |
| |
| (0.30) | $8.46 | 0.59% | 1.73% (c) | 1.57% (c),(d) | 1.11% | 375% | $9,461 |
| (0.35) | $8.71 | 1.98% | 1.77% | 1.61% (d) | 1.08% | 428% | $10,870 |
| (0.21) | $8.90 | 2.91% | 1.76% | 1.60% (d) | 1.15% | 350% | $9,406 |
| (0.40) | $8.85 | (2.01%) | 1.73% | 1.56% (d) | 1.23% | 360% | $10,917 |
| (0.46) | $9.45 | 3.59% | 1.73% | 1.50% (d) | 1.83% | 221% | $15,812 |
| |
| (0.34) | $8.47 | 1.09% | 1.23% (c) | 1.08% (c),(d) | 1.62% | 375% | $922 |
| (0.40) | $8.72 | 2.49% | 1.27% | 1.11% (d) | 1.57% | 428% | $1,750 |
| (0.25) | $8.91 | 3.37% | 1.26% | 1.15% (d) | 1.59% | 350% | $2,009 |
| (0.43) | $8.86 | (1.66%) | 1.23% | 1.21% (d) | 1.59% | 360% | $2,498 |
| (0.49) | $9.46 | 3.95% | 1.23% | 1.15% (d) | 2.16% | 221% | $2,558 |
| |
| (0.38) | $8.46 | 1.48% | 0.73% (c) | 0.57% (c),(d) | 2.10% | 375% | $516 |
| (0.44) | $8.72 | 3.01% | 0.77% | 0.61% (d) | 2.07% | 428% | $390 |
| (0.29) | $8.91 | 4.00% | 0.76% | 0.64% (d) | 2.12% | 350% | $26 |
| (0.48) | $8.85 | (1.18%) | 0.74% | 0.70% (d) | 1.99% | 360% | $28 |
| (0.31) | $9.45 | 0.36% | 0.69% (g) | 0.69% (d),(g) | 2.38% (g) | 221% | $55 |
| |
| (0.39) | $8.44 | 1.58% | 0.63% (c) | 0.49% (c) | 1.99% | 375% | $735 |
| (0.45) | $8.70 | 3.11% | 0.60% | 0.50% | 2.14% | 428% | $52 |
| (0.30) | $8.89 | 4.04% | 0.56% | 0.50% | 2.25% | 350% | $413 |
| (0.49) | $8.84 | (1.10%) | 0.57% | 0.57% | 2.09% | 360% | $471 |
| (0.32) | $9.45 | 0.42% | 0.55% (g) | 0.55% (g) | 2.71% (g) | 221% | $33,221 |
Columbia Bond Fund | Annual Report 2017
| 29 |
Financial Highlights (continued)
| Year ended | Net asset value,
beginning of
period | Net
investment
income | Net
realized
and
unrealized
gain (loss) | Total from
investment
operations | Distributions
from net
investment
income | Distributions
from net
realized
gains |
| Class T(i) |
| 4/30/2017 | $8.73 | 0.16 | (0.05) | 0.11 | (0.15) | (0.21) |
| 4/30/2016 | $8.92 | 0.16 | 0.07 | 0.23 | (0.21) | (0.21) |
| 4/30/2015 | $8.87 | 0.17 | 0.15 | 0.32 | (0.16) | (0.11) |
| 4/30/2014 | $9.47 | 0.17 | (0.31) | (0.14) | (0.17) | (0.29) |
| 4/30/2013 | $9.58 | 0.24 | 0.17 | 0.41 | (0.23) | (0.29) |
| Class V(j) |
| 4/30/2017 | $8.71 | 0.17 | (0.05) | 0.12 | (0.16) | (0.21) |
| 4/30/2016 | $8.90 | 0.17 | 0.07 | 0.24 | (0.22) | (0.21) |
| 4/30/2015 | $8.85 | 0.17 | 0.16 | 0.33 | (0.17) | (0.11) |
| 4/30/2014 | $9.45 | 0.17 | (0.30) | (0.13) | (0.18) | (0.29) |
| 4/30/2013 | $9.57 | 0.24 | 0.17 | 0.41 | (0.24) | (0.29) |
| Class Y |
| 4/30/2017 | $8.74 | 0.19 | (0.05) | 0.14 | (0.19) | (0.21) |
| 4/30/2016 | $8.92 | 0.19 | 0.09 | 0.28 | (0.25) | (0.21) |
| 4/30/2015 | $8.87 | 0.20 | 0.15 | 0.35 | (0.19) | (0.11) |
| 4/30/2014 | $9.47 | 0.20 | (0.30) | (0.10) | (0.21) | (0.29) |
| 4/30/2013 | $9.59 | 0.27 | 0.16 | 0.43 | (0.26) | (0.29) |
| Class Z |
| 4/30/2017 | $8.72 | 0.18 | (0.05) | 0.13 | (0.17) | (0.21) |
| 4/30/2016 | $8.91 | 0.18 | 0.07 | 0.25 | (0.23) | (0.21) |
| 4/30/2015 | $8.86 | 0.19 | 0.15 | 0.34 | (0.18) | (0.11) |
| 4/30/2014 | $9.46 | 0.19 | (0.31) | (0.12) | (0.19) | (0.29) |
| 4/30/2013 | $9.58 | 0.26 | 0.16 | 0.42 | (0.25) | (0.29) |
| Notes to Financial Highlights |
| (a) | In addition to the fees and expenses that the Fund bears directly, the Fund indirectly bears a pro rata share of the fees and expenses of any other funds in which it invests. Such indirect expenses are not included in the Fund’s reported expense ratios. |
| (b) | Total net expenses include the impact of certain fee waivers/expense reimbursements made by the Investment Manager and certain of its affiliates, if applicable. |
| (c) | Expenses have been reduced due to a reimbursement of expenses overbilled by a third party. If the reimbursement had been excluded, the expense ratios would have been higher by the percentages shown for each class in the table below. All fee waivers and expense reimbursements by the Investment Manager and its affiliates were applied before giving effect to this third party reimbursement. |
| | Class A | Class B | Class C | Class R | Class R4 | Class R5 | Class T | Class V | Class Y | Class Z |
| 04/30/2017 | 0.04 % | 0.04 % | 0.04 % | 0.03 % | 0.04 % | 0.02 % | 0.03 % | 0.03 % | 0.03 % | 0.03 % |
| (d) | The benefits derived from expense reductions had an impact of less than 0.01%. |
| (e) | Class R4 shares commenced operations on November 8, 2012. Per share data and total return reflect activity from that date. |
| (f) | Calculation of the net gain (loss) per share (both realized and unrealized) does not correlate to the aggregate realized and unrealized gain (loss) presented in the Statement of Operations due to the timing of subscriptions and redemptions of Fund shares in relation to fluctuations in the market value of the portfolio. |
| (g) | Annualized. |
| (h) | Class R5 shares commenced operations on November 8, 2012. Per share data and total return reflect activity from that date. |
| (i) | Effective March 27, 2017, Class W shares were renamed Class T shares. |
| (j) | Effective January 24, 2017, Class T shares were renamed Class V shares. |
The accompanying Notes to Financial Statements are an integral part of this statement.
| 30 | Columbia Bond Fund | Annual Report 2017 |
Total
distributions to
shareholders | Net
asset
value,
end of
period | Total
return | Total gross
expense
ratio to
average
net assets(a) | Total net
expense
ratio to
average
net assets(a),(b) | Net investment
income
ratio to
average
net assets(a) | Portfolio
turnover | Net
assets,
end of
period
(000’s) |
| |
| (0.36) | $8.48 | 1.34% | 1.01% (c) | 0.83% (c),(d) | 1.85% | 375% | $10 |
| (0.42) | $8.73 | 2.74% | 1.03% | 0.86% (d) | 1.83% | 428% | $10 |
| (0.27) | $8.92 | 3.62% | 1.00% | 0.90% (d) | 1.85% | 350% | $10 |
| (0.46) | $8.87 | (1.40%) | 0.90% | 0.90% (d) | 1.92% | 360% | $10 |
| (0.52) | $9.47 | 4.32% | 0.90% | 0.88% (d) | 2.46% | 221% | $2 |
| |
| (0.37) | $8.46 | 1.44% | 0.88% (c) | 0.73% (c),(d) | 1.95% | 375% | $10,139 |
| (0.43) | $8.71 | 2.85% | 0.92% | 0.76% (d) | 1.93% | 428% | $10,887 |
| (0.28) | $8.90 | 3.73% | 0.91% | 0.80% (d) | 1.95% | 350% | $11,885 |
| (0.47) | $8.85 | (1.32%) | 0.88% | 0.86% (d) | 1.94% | 360% | $12,351 |
| (0.53) | $9.45 | 4.32% | 0.88% | 0.80% (d) | 2.53% | 221% | $14,412 |
| |
| (0.40) | $8.48 | 1.63% | 0.54% (c) | 0.42% (c) | 2.26% | 375% | $29,756 |
| (0.46) | $8.74 | 3.28% | 0.56% | 0.45% | 2.24% | 428% | $31,981 |
| (0.30) | $8.92 | 4.05% | 0.54% | 0.48% | 2.27% | 350% | $27,155 |
| (0.50) | $8.87 | (0.99%) | 0.53% | 0.53% | 2.27% | 360% | $25,147 |
| (0.55) | $9.47 | 4.60% | 0.53% | 0.52% | 2.80% | 221% | $24,368 |
| |
| (0.38) | $8.47 | 1.60% | 0.73% (c) | 0.58% (c),(d) | 2.11% | 375% | $369,017 |
| (0.44) | $8.72 | 3.00% | 0.77% | 0.61% (d) | 2.08% | 428% | $440,059 |
| (0.29) | $8.91 | 3.88% | 0.75% | 0.65% (d) | 2.10% | 350% | $550,803 |
| (0.48) | $8.86 | (1.17%) | 0.73% | 0.71% (d) | 2.07% | 360% | $659,538 |
| (0.54) | $9.46 | 4.47% | 0.73% | 0.65% (d) | 2.69% | 221% | $1,077,125 |
Columbia Bond Fund | Annual Report 2017
| 31 |
Notes to Financial Statements
April 30, 2017
Note 1. Organization
Columbia Bond Fund (the Fund), a series of Columbia Funds Series Trust I (the Trust), is a diversified fund. The Trust is registered under the Investment Company Act of 1940, as amended (the 1940 Act), as an open-end management investment company organized as a Massachusetts business trust.
Fund shares
The Trust may issue an unlimited number of shares (without par value). Although all share classes generally have identical voting, dividend and liquidation rights, each share class votes separately when required by the Trust’s organizational documents or by law. Different share classes pay different distribution amounts to the extent the expenses of such share classes differ, and distributions in liquidation will be proportional to the net asset value of each share class. Each share class has its own expense and sales charge structure. The Fund offers each of the share classes identified below.
Class A shares are subject to a maximum front-end sales charge of 4.75% based on the initial investment amount. Class A shares purchased without an initial sales charge in accounts aggregating $1 million to $50 million at the time of purchase are subject to a contingent deferred sales charge (CDSC) if the shares are sold within 18 months after purchase, charged as follows: 1.00% CDSC if redeemed within 12 months after purchase, and 0.50% CDSC if redeemed more than 12, but less than 18, months after purchase.
The Fund no longer accepts investments by new or existing investors in the Fund’s Class B shares, except in connection with the reinvestment of any dividend and/or capital gain distributions in Class B shares of the Fund and exchanges by existing Class B shareholders of certain other funds within the Columbia Family of Funds. Class B shares are typically subject to a maximum CDSC of 5.00% based upon the holding period after purchase. However, the Fund’s current Class B investors, having held their shares for the requisite time period, are no longer subject to a CDSC upon redemption of their shares. Effective on or about July 17, 2017, Class B shares will automatically convert to Class A shares and the Fund will no longer accept investments by new or existing investors in Class B shares.
Class C shares are subject to a 1.00% CDSC on shares redeemed within 12 months after purchase.
Effective March 27, 2017, Class I shares of the Fund are no longer offered for sale. Class I shares, when available, were not subject to sales charges or distribution and service (12b-1) fees, and were made available only to the Columbia Family of Funds. On March 27, 2017, Class I shares were redeemed or exchanged for Class Y shares of the Fund in a tax free transaction that had no impact on the fees and expenses paid by shareholders.
Class R shares are not subject to sales charges and are generally available only to certain retirement plans and other investors as described in the Fund’s prospectus.
Class R4 shares are not subject to sales charges and are generally available only to omnibus retirement plans and certain investors as described in the Fund’s prospectus.
Class R5 shares are not subject to sales charges and are generally available only to investors purchasing through authorized investment professionals and omnibus retirement plans.
Class T shares are subject to a maximum front-end sales charge of 2.50% per transaction and must be purchased through financial intermediaries that, by written agreement with Columbia Management Investment Distributors, Inc., are specifically authorized to sell Class T shares. Prior to March 27, 2017, Class T shares were known as Class W shares, were not subject to sales charges, and were generally available only to investors purchasing through authorized investment programs managed by investment professionals, including discretionary managed accounts.
Class V shares (formerly Class T shares) are subject to a maximum front-end sales charge of 4.75% based on the investment amount. Class V shares purchased without an initial sales charge in accounts aggregating $1 million to $50 million at the time of purchase are subject to a CDSC if the shares are sold within 18 months after purchase, charged as follows: 1.00% CDSC if redeemed within 12 months after purchase, and 0.50% CDSC if redeemed more than 12, but less than 18, months after purchase. Class V shares are available only to investors who received (and who have continuously held) Class V shares in connection with previous fund reorganizations. Effective January 24, 2017, Class T shares were renamed Class V shares.
| 32 | Columbia Bond Fund | Annual Report 2017 |
Notes to Financial Statements (continued)
April 30, 2017
Class Y shares are not subject to sales charges or distribution and service (12b-1) fees, and are available to institutional and certain other investors as described in the Fund’s prospectus. On March 27, 2017, Class I shares were redeemed or exchanged for Class Y shares of the Fund in a tax free transaction that had no impact on the fees and expenses paid by shareholders. Class I shares of the Fund are no longer offered for sale.
Class Z shares are not subject to sales charges and are generally available only to eligible investors, which are subject to different investment minimums as described in the Fund’s prospectus.
Note 2. Summary of significant accounting policies
Basis of preparation
The Fund is an investment company that applies the accounting and reporting guidance in the Financial Accounting Standards Board (FASB) Accounting Standards Codification Topic 946, Financial Services - Investment Companies (ASC 946). The financial statements are prepared in accordance with U.S. generally accepted accounting principles (GAAP), which requires management to make certain estimates and assumptions that affect the reported amounts of assets and liabilities, the disclosure of contingent assets and liabilities at the date of the financial statements and the reported amounts of income and expenses during the reporting period. Actual results could differ from those estimates. The Fund received a reimbursement for expenses overbilled by a third party. Such reimbursement is included as an offset to Other expenses on the Statement of Operations. All fee waivers and expense reimbursements by the Investment Manager and its affiliates were applied before giving effect to the third party reimbursement.
The following is a summary of significant accounting policies followed by the Fund in the preparation of its financial statements.
Security valuation
All equity securities are valued at the close of business of the New York Stock Exchange. Equity securities are valued at the last quoted sales price on the principal exchange or market on which they trade, except for securities traded on the NASDAQ Stock Market, which are valued at the NASDAQ official close price. Unlisted securities or listed securities for which there were no sales during the day are valued at the mean of the latest quoted bid and ask prices on such exchanges or markets.
Debt securities generally are valued by pricing services approved by the Board of Trustees based upon market transactions for normal, institutional-size trading units of similar securities. The services may use various pricing techniques that take into account, as applicable, factors such as yield, quality, coupon rate, maturity, type of issue, trading characteristics and other data, as well as approved independent broker-dealer quotes. Debt securities for which quotations are not readily available or not believed to be reflective of market value may also be valued based upon a bid quote from an approved independent broker-dealer. Debt securities maturing in 60 days or less are valued primarily at amortized cost value, unless this method results in a valuation that management believes does not approximate market value.
Asset- and mortgage-backed securities are generally valued by pricing services, which utilize pricing models that incorporate the securities’ cash flow and loan performance data. These models also take into account available market data, including trades, market quotations, and benchmark yield curves for identical or similar securities. Factors used to identify similar securities may include, but are not limited to, issuer, collateral type, vintage, prepayment speeds, collateral performance, credit ratings, credit enhancement and expected life. Asset-backed securities for which quotations are readily available may also be valued based upon an over-the-counter or exchange bid quote from an approved independent broker-dealer.
Investments in open-end investment companies, including money market funds, are valued at their latest net asset value.
Futures and options on futures contracts are valued based upon the settlement price at the close of regular trading on their principal exchanges or, in the absence of transactions, at the mean of the latest quoted bid and ask prices.
Swap transactions are valued through an independent pricing service or broker, or if neither is available, through an internal model based upon observable inputs.
Columbia Bond Fund | Annual Report 2017
| 33 |
Notes to Financial Statements (continued)
April 30, 2017
Investments for which market quotations are not readily available, or that have quotations which management believes are not reflective of market value or reliable, are valued at fair value as determined in good faith under procedures approved by and under the general supervision of the Board of Trustees. If a security or class of securities (such as foreign securities) is valued at fair value, such value is likely to be different from the quoted or published price for the security.
The determination of fair value often requires significant judgment. To determine fair value, management may use assumptions including but not limited to future cash flows and estimated risk premiums. Multiple inputs from various sources may be used to determine fair value.
GAAP requires disclosure regarding the inputs and valuation techniques used to measure fair value and any changes in valuation inputs or techniques. In addition, investments shall be disclosed by major category. This information is disclosed following the Fund’s Portfolio of Investments.
Derivative instruments
The Fund invests in certain derivative instruments, as detailed below, to meet its investment objectives. Derivatives are instruments whose values depend on, or are derived from, in whole or in part, the value of one or more securities, currencies, commodities, indices, or other assets or instruments. Derivatives may be used to increase investment flexibility (including to maintain cash reserves while maintaining desired exposure to certain assets), for risk management (hedging) purposes, to facilitate trading, to reduce transaction costs and to pursue higher investment returns. The Fund may also use derivative instruments to mitigate certain investment risks, such as foreign currency exchange rate risk, interest rate risk and credit risk. Derivatives may involve various risks, including the potential inability of the counterparty to fulfill its obligations under the terms of the contract, the potential for an illiquid secondary market (making it difficult for the Fund to sell or terminate, including at favorable prices) and the potential for market movements which may expose the Fund to gains or losses in excess of the amount shown in the Statement of Assets and Liabilities. The notional amounts of derivative instruments, if applicable, are not recorded in the financial statements.
A derivative instrument may suffer a marked-to-market loss if the value of the contract decreases due to an unfavorable change in the market rates or values of the underlying instrument. Losses can also occur if the counterparty does not perform its obligations under the contract. The Fund’s risk of loss from counterparty credit risk on over-the-counter derivatives is generally limited to the aggregate unrealized gain netted against any collateral held by the Fund and the amount of any variation margin held by the counterparty, plus any replacement costs or related amounts. With exchange-traded or centrally cleared derivatives, there is reduced counterparty credit risk to the Fund since the clearinghouse or central counterparty (CCP) provides some protection in the case of clearing member default. The clearinghouse or CCP stands between the buyer and the seller of the contract; therefore, additional counterparty credit risk is failure of the clearinghouse or CCP. However, credit risk still exists in exchange-traded or centrally cleared derivatives with respect to initial and variation margin that is held in a broker’s customer account. While brokers are required to segregate customer margin from their own assets, in the event that a broker becomes insolvent or goes into bankruptcy and at that time there is a shortfall in the aggregate amount of margin held by the broker for all its clients, U.S. bankruptcy laws will typically allocate that shortfall on a pro-rata basis across all the broker’s customers (including the Fund), potentially resulting in losses to the Fund.
In order to better define its contractual rights and to secure rights that will help the Fund mitigate its counterparty risk, the Fund may enter into an International Swaps and Derivatives Association, Inc. Master Agreement (ISDA Master Agreement) or similar agreement with its derivatives contract counterparties. An ISDA Master Agreement is an agreement between the Fund and a counterparty that governs over-the-counter derivatives and typically contains, among other things, collateral posting terms and netting provisions in the event of a default and/or termination event. Under an ISDA Master Agreement, the Fund may, under certain circumstances, offset with the counterparty certain derivative instrument’s payables and/or receivables with collateral held and/or posted and create one single net payment. The provisions of the ISDA Master Agreement typically permit a single net payment in the event of default (close-out netting), including the bankruptcy or insolvency of the counterparty. Note, however, that bankruptcy or insolvency laws of a particular jurisdiction may impose restrictions on or prohibitions against the right of offset or netting in bankruptcy, insolvency or other events.
Collateral (margin) requirements differ by type of derivative. Margin requirements are established by the clearinghouse or CCP for exchange-traded and centrally cleared derivatives. Brokers can ask for margin in excess of the minimum in certain circumstances. Collateral terms are contract specific for over-the-counter derivatives. For over-the-counter derivatives traded
| 34 | Columbia Bond Fund | Annual Report 2017 |
Notes to Financial Statements (continued)
April 30, 2017
under an ISDA Master Agreement, the collateral requirements are typically calculated by netting the marked-to-market amount for each transaction under such agreement and comparing that amount to the value of any variation margin currently pledged by the Fund and/or the counterparty. Generally, the amount of collateral due from or to a party has to exceed a minimum transfer amount threshold (e.g., $250,000) before a transfer has to be made. To the extent amounts due to the Fund from its counterparties are not fully collateralized, contractually or otherwise, the Fund bears the risk of loss from counterparty nonperformance. The Fund attempts to mitigate counterparty risk by only entering into agreements with counterparties that it believes have the financial resources to honor their obligations and by monitoring the financial stability of those counterparties.
Certain ISDA Master Agreements allow counterparties of over-the-counter derivatives transactions to terminate derivatives contracts prior to maturity in the event the Fund’s net asset value declines by a stated percentage over a specified time period or if the Fund fails to meet certain terms of the ISDA Master Agreement, which would cause the Fund to accelerate payment of any net liability owed to the counterparty. The Fund also has termination rights if the counterparty fails to meet certain terms of the ISDA Master Agreement. In addition to considering counterparty credit risk, the Fund would consider terminating the derivatives contracts based on whether termination would result in a net liability owed from the counterparty.
For financial reporting purposes, the Fund does not offset derivative assets and derivative liabilities that are subject to netting arrangements in the Statement of Assets and Liabilities.
Futures contracts
Futures contracts are exchange-traded and represent commitments for the future purchase or sale of an asset at a specified price on a specified date. The Fund bought and sold futures contracts to manage the duration and yield curve exposure of the Fund versus the benchmark. These instruments may be used for other purposes in future periods. Upon entering into futures contracts, the Fund bears risks that it may not achieve the anticipated benefits of the futures contracts and may realize a loss. Additional risks include counterparty credit risk, the possibility of an illiquid market, and that a change in the value of the contract or option may not correlate with changes in the value of the underlying asset.
Upon entering into a futures contract, the Fund deposits cash or securities with the broker, known as a futures commission merchant (FCM), in an amount sufficient to meet the initial margin requirement. The initial margin deposit must be maintained at an established level over the life of the contract. Cash deposited as initial margin is recorded in the Statement of Assets and Liabilities as margin deposits. Securities deposited as initial margin are designated in the Portfolio of Investments. Subsequent payments (variation margin) are made or received by the Fund each day. The variation margin payments are equal to the daily change in the contract value and are recorded as variation margin receivable or payable and are offset in unrealized gains or losses. The Fund recognizes a realized gain or loss when the contract is closed or expires. Futures contracts involve, to varying degrees, risk of loss in excess of the variation margin disclosed in the Statement of Assets and Liabilities.
Swap contracts
Swap contracts are negotiated in the over-the-counter market and may be entered into as a bilateral contract or centrally cleared (centrally cleared swap contract). In a centrally cleared swap contract, immediately following execution of the swap contract with a broker, the swap contract is novated to a central counterparty (the CCP) and the CCP becomes the Fund’s counterparty to the centrally cleared swap contract. The Fund is required to deposit initial margin with the futures commission merchant (FCM), which pledges it through to the CCP in the form of cash or securities in an amount that varies depending on the size and risk profile of the particular swap contract. Securities deposited as initial margin are designated in the Portfolio of Investments and cash deposited is recorded in the Statement of Assets and Liabilities as margin deposits. Unlike a bilateral swap contract, for centrally cleared swap contracts, the Fund has minimal credit exposure to the FCM because the CCP stands between the Fund and the relevant buyer/seller on the other side of the contract. Swap contracts are marked-to-market daily and changes in value are recorded as unrealized appreciation (depreciation). The daily change in valuation of centrally cleared swap contracts, if any, is recorded as a receivable or payable for variation margin in the Statement of Assets and Liabilities.
Columbia Bond Fund | Annual Report 2017
| 35 |
Notes to Financial Statements (continued)
April 30, 2017
Entering into these contracts involves, to varying degrees, elements of interest, liquidity and counterparty credit risk in excess of the amounts recognized in the Statement of Assets and Liabilities. Such risks involve the possibility that there may be unfavorable changes in interest rates, market conditions or other conditions, it may be difficult to initiate a swap transaction or liquidate a position at an advantageous time or price which may result in significant losses, and that the FCM or CCP may not fulfill its obligation under the contract.
Credit default swap contracts
The Fund entered into credit default swap contracts to increase or decrease its credit exposure to an index, increase or decrease its credit exposure to a single issuer of debt securities and manage credit risk exposure. Additionally, credit default swap contracts were used to hedge the Fund’s exposure on a debt security that it owns or in lieu of selling such debt security. These instruments may be used for other purposes in future periods. Credit default swap contracts are agreements in which one party pays fixed periodic payments to a counterparty in consideration for an agreement from the counterparty to make a specific payment should a specified credit event(s) take place. Although specified credit events are contract specific, credit events are generally defined as bankruptcy, failure to pay, restructuring, obligation acceleration, obligation default, or repudiation/moratorium.
As the purchaser of a credit default swap contract, the Fund purchases protection by paying a periodic interest rate on the notional amount to the counterparty. The interest amount is accrued daily as a component of unrealized appreciation (depreciation) and is recorded as a realized loss upon payment. If a credit event as specified in the contract occurs, the Fund may have the option either to deliver the reference obligation to the seller in exchange for a cash payment of its par amount, or to receive a net cash settlement equal to the par amount less an agreed-upon value of the reference obligation as of the date of the credit event. The difference between the value of the obligation or cash delivered and the notional amount received will be recorded as a realized gain (loss).
As the seller of a credit default swap contract, the Fund sells protection to a buyer and will generally receive a periodic interest rate on a notional amount. The interest amount is accrued daily as a component of unrealized appreciation (depreciation) and is recorded as a realized gain upon receipt of the payment. If a credit event as specified in the contract with the counterparty occurs, the Fund may either be required to accept the reference obligation from the buyer in exchange for a cash payment of its notional amount, or to pay the buyer a net cash settlement equal to the notional amount less an agreed-upon value of the reference obligation (recovery value) as of the date of the credit event. The difference between the value of the obligation or cash received and the notional amount paid will be recorded as a realized gain (loss). The maximum potential amount of undiscounted future payments the Fund could be required to make as the seller of protection under a credit default swap contract is equal to the notional amount of the reference obligation. These potential amounts may be partially offset by any recovery values of the respective reference obligations or premiums received upon entering into the agreement. The notional amounts and market values of all credit default swap contracts in which the Fund is the seller of protection, if any, are disclosed in the Credit Default Swap Contracts Outstanding schedule following the Portfolio of Investments.
As a protection seller, the Fund bears the risk of loss from the credit events specified in the contract with the counterparty. For credit default swap contracts on credit indices, quoted market prices and resulting market values serve as an indicator of the current status of the payment/performance risk. Increasing market values, in absolute terms when compared to the notional amount of the swap, represent a deterioration of the reference entity’s credit soundness and a greater likelihood or risk of default or other credit event occurring as defined under the terms of the contract.
Any premium paid or received by the Fund upon entering into a credit default swap contract is recorded as an asset or liability, respectively, and amortized daily as a component of realized gain (loss) in the Statement of Operations. Credit default swap contracts are valued daily, and the change in value is recorded as unrealized appreciation (depreciation) until the termination of the swap, at which time a realized gain (loss) is recorded.
Credit default swap contracts can involve greater risks than if a fund had invested in the reference obligation directly since, in addition to general market risks, credit default swaps are subject to counterparty credit risk, leverage risk, hedging risk, correlation risk and liquidity risk.
| 36 | Columbia Bond Fund | Annual Report 2017 |
Notes to Financial Statements (continued)
April 30, 2017
Effects of derivative transactions in the financial statements
The following tables are intended to provide additional information about the effect of derivatives on the financial statements of the Fund, including: the fair value of derivatives by risk category and the location of those fair values in the Statement of Assets and Liabilities; and the impact of derivative transactions over the period in the Statement of Operations, including realized and unrealized gains (losses). The derivative instrument schedules following the Portfolio of Investments present additional information regarding derivative instruments outstanding at the end of the period, if any.
The following table is a summary of the fair value of derivative instruments (not considered to be hedging instruments for accounting disclosure purposes) at April 30, 2017:
| | Asset derivatives | |
Risk exposure
category | Statement
of assets and liabilities
location | Fair value ($) |
| Credit risk | Net assets — unrealized appreciation on swap contracts | 45,523* |
| Interest rate risk | Net assets — unrealized appreciation on futures contracts | 205,303* |
| Total | | 250,826 |
| | Liability derivatives | |
Risk exposure
category | Statement
of assets and liabilities
location | Fair value ($) |
| Credit risk | Net assets — unrealized depreciation on swap contracts | 123,071* |
| Credit risk | Premiums received on outstanding swap contracts | 58,197 |
| Interest rate risk | Net assets — unrealized depreciation on futures contracts | 422,980* |
| Total | | 604,248 |
| * | Includes cumulative appreciation (depreciation) as reported in the tables following the Portfolio of Investments. Only the current day’s variation margin is reported in receivables or payables in the Statement of Assets and Liabilities. |
The following table indicates the effect of derivative instruments (not considered to be hedging instruments for accounting disclosure purposes) in the Statement of Operations for the year ended April 30, 2017:
| Amount of realized gain (loss) on derivatives recognized in income |
| Risk exposure category | Futures
contracts
($) | Swap
contracts
($) | Total
($) |
| Credit risk | — | (364,773) | (364,773) |
| Interest rate risk | 239,007 | — | 239,007 |
| Total | 239,007 | (364,773) | (125,766) |
| |
| Change in unrealized appreciation (depreciation) on derivatives recognized in income |
| Risk exposure category | Futures
contracts
($) | Swap
contracts
($) | Total
($) |
| Credit risk | — | (16,816) | (16,816) |
| Interest rate risk | (689,983) | — | (689,983) |
| Total | (689,983) | (16,816) | (706,799) |
Columbia Bond Fund | Annual Report 2017
| 37 |
Notes to Financial Statements (continued)
April 30, 2017
The following table is a summary of the average outstanding volume by derivative instrument for the year ended April 30, 2017:
| Derivative instrument | Average notional
amounts ($)* |
| Futures contracts — long | 60,883,318 |
| Futures contracts — short | 21,268,844 |
| Credit default swap contracts — buy protection | 22,755,000 |
| Credit default swap contracts — sell protection | 8,151,250 |
| * | Based on the ending quarterly outstanding amounts for the year ended April 30, 2017. |
Asset- and mortgage-backed securities
The Fund may invest in asset-backed and mortgage-backed securities. The maturity dates shown represent the original maturity of the underlying obligation. Actual maturity may vary based upon prepayment activity on these obligations. All, or a portion, of the obligation may be prepaid at any time because the underlying asset may be prepaid. As a result, decreasing market interest rates could result in an increased level of prepayment. An increased prepayment rate will have the effect of shortening the maturity of the security. Unless otherwise noted, the coupon rates presented are fixed rates.
Delayed delivery securities
The Fund may trade securities on other than normal settlement terms, including securities purchased or sold on a “when-issued” or "forward commitment" basis. This may increase risk to the Fund since the other party to the transaction may fail to deliver, which could cause the Fund to subsequently invest at less advantageous prices. The Fund designates cash or liquid securities in an amount equal to the delayed delivery commitment.
To be announced securities
The Fund may trade securities on a To Be Announced (TBA) basis. As with other delayed-delivery transactions, a seller agrees to issue a TBA security at a future date. However, the seller does not specify the particular securities to be delivered. Instead, the Fund agrees to accept any security that meets specified terms.
In some cases, Master Securities Forward Transaction Agreements (MSFTAs) may be used to govern transactions of certain forward-settling agency mortgage-backed securities, such as delayed-delivery and TBAs, between the Fund and counterparty. The MSFTA maintains provisions for, among other things, initiation and confirmation, payment and transfer, events of default, termination, and maintenance of collateral relating to such transactions.
Mortgage dollar roll transactions
The Fund may enter into mortgage “dollar rolls” in which the Fund sells securities for delivery in the current month and simultaneously contracts with the same counterparty to repurchase similar but not identical securities (same type, coupon and maturity) on a specified future date. During the roll period, the Fund loses the right to receive principal and interest paid on the securities sold. However, the Fund will benefit because it receives negotiated amounts in the form of reductions of the purchase price for the future purchase plus the interest earned on the cash proceeds of the securities sold until the settlement date of the forward purchase. The Fund records the incremental difference between the forward purchase and sale of each forward roll as a realized gain or loss. Unless any realized gains exceed the income, capital appreciation, and gain or loss due to mortgage prepayments that would have been realized on the securities sold as part of the mortgage dollar roll, the use of this technique will diminish the investment performance of the Fund compared to what the performance would have been without the use of mortgage dollar rolls. All cash proceeds will be invested in instruments that are permissible investments for the Fund. The Fund identifies cash or liquid securities in an amount equal to the forward purchase price.
For financial reporting and tax purposes, the Fund treats “to be announced” mortgage dollar rolls as two separate transactions, one involving the purchase of a security and a separate transaction involving a sale. These transactions may increase the Fund’s portfolio turnover rate. The Fund does not currently enter into mortgage dollar rolls that are accounted for as financing transactions.
| 38 | Columbia Bond Fund | Annual Report 2017 |
Notes to Financial Statements (continued)
April 30, 2017
Mortgage dollar rolls involve the risk that the market value of the securities the Fund is obligated to repurchase may decline below the repurchase price, or that the counterparty may default on its obligations.
Interest only and principal only securities
The Fund may invest in Interest Only (IO) or Principal Only (PO) securities. IOs are stripped securities entitled to receive all of the security’s interest, but none of its principal. IOs are particularly sensitive to changes in interest rates and therefore subject to greater fluctuations in price than typical interest bearing debt securities. IOs are also subject to credit risk because the Fund may not receive all or part of the interest payments if the issuer, obligor, guarantor or counterparty defaults on its obligation. Payments received for IOs are included in interest income on the Statement of Operations. Because no principal will be received at the maturity of an IO, adjustments are made to the cost of the security on a monthly basis until maturity. These adjustments are included in interest income on the Statement of Operations. POs are stripped securities entitled to receive the principal from the underlying obligation, but not the interest. POs are particularly sensitive to changes in interest rates and therefore are subject to fluctuations in price. POs are also subject to credit risk because the Fund may not receive all or part of its principal if the issuer, obligor, guarantor or counterparty defaults on its obligation. The Fund may also invest in IO or PO stripped mortgage-backed securities. Payments received for POs are treated as reductions to the cost and par value of the securities.
Offsetting of assets and liabilities
The following table presents the Fund’s gross and net amount of assets and liabilities available for offset under netting arrangements as well as any related collateral received or pledged by the Fund as of April 30, 2017:
| | Barclays ($) | Citi ($) | JPMorgan ($) | Morgan
Stanley ($) | Total ($) |
| Assets | | | | | |
| Centrally cleared credit default swap contracts (a) | - | - | - | 8,152 | 8,152 |
| Liabilities | | | | | |
| Centrally cleared credit default swap contracts (a) | - | - | - | 15,531 | 15,531 |
| OTC credit default swap contracts (b) | 17,787 | 12,021 | 96,173 | - | 125,981 |
| Total liabilities | 17,787 | 12,021 | 96,173 | 15,531 | 141,512 |
| Total financial and derivative net assets | (17,787) | (12,021) | (96,173) | (7,379) | (133,360) |
| Total collateral received (pledged) (c) | - | - | - | (7,379) | (7,379) |
| Net amount (d) | (17,787) | (12,021) | (96,173) | - | (125,981) |
| (a) | Centrally cleared swaps are included within payable/receivable for variation margin on the Statement of Assets and Liabilities. |
| (b) | Over-the-Counter Swap Contracts are presented at market value plus periodic payments receivable (payable), which is comprised of unrealized appreciation, unrealized depreciation, premiums paid and premiums received. |
| (c) | In some instances, the actual collateral received and/or pledged may be more than the amount shown due to overcollateralization. |
| (d) | Represents the net amount due from/(to) counterparties in the event of default. |
Security transactions
Security transactions are accounted for on the trade date. Cost is determined and gains (losses) are based upon the specific identification method for both financial statement and federal income tax purposes.
Income recognition
Interest income is recorded on an accrual basis. Market premiums and discounts, including original issue discounts, are amortized and accreted, respectively, over the expected life of the security on all debt securities, unless otherwise noted.
The Fund may place a debt security on non-accrual status and reduce related interest income when it becomes probable that the interest will not be collected and the amount of uncollectible interest can be reasonably estimated. A defaulted debt security is removed from non-accrual status when the issuer resumes interest payments or when collectibility of interest is reasonably assured.
Corporate actions and dividend income are recorded on the ex-dividend date.
Columbia Bond Fund | Annual Report 2017
| 39 |
Notes to Financial Statements (continued)
April 30, 2017
The Fund may receive distributions from holdings in equity securities, business development companies (BDCs), exchange-traded funds, other regulated investment companies (RICs), and real estate investment trusts (REITs), which report information on the tax character of their distributions annually. These distributions are allocated to dividend income, capital gain and return of capital based on actual information reported. Return of capital is recorded as a reduction of the cost basis of securities held. If the Fund no longer owns the applicable securities, return of capital is recorded as a realized gain. With respect to REITs, to the extent actual information has not yet been reported, estimates for return of capital are made by the Fund’s management. Management’s estimates are subsequently adjusted when the actual character of the distributions is disclosed by the REITs, which could result in a proportionate change in return of capital to shareholders.
Awards from class action litigation are recorded as a reduction of cost basis if the Fund still owns the applicable securities on the payment date. If the Fund no longer owns the applicable securities, the proceeds are recorded as realized gains.
Expenses
General expenses of the Trust are allocated to the Fund and other funds of the Trust based upon relative net assets or other expense allocation methodologies determined by the nature of the expense. Expenses directly attributable to the Fund are charged to the Fund. Expenses directly attributable to a specific class of shares are charged to that share class.
Determination of class net asset value
All income, expenses (other than class-specific expenses, which are charged to that share class, as shown in the Statement of Operations) and realized and unrealized gains (losses) are allocated to each class of the Fund on a daily basis, based on the relative net assets of each class, for purposes of determining the net asset value of each class.
Federal income tax status
The Fund intends to qualify each year as a regulated investment company under Subchapter M of the Internal Revenue Code, as amended, and will distribute substantially all of its taxable income (including net short-term capital gains), if any, for its tax year, and as such will not be subject to federal income taxes. In addition, the Fund intends to distribute in each calendar year substantially all of its net investment income, capital gains and certain other amounts, if any, such that the Fund should not be subject to federal excise tax. Therefore, no federal income or excise tax provision is recorded.
Distributions to shareholders
Distributions from net investment income, if any, are declared daily and paid monthly. Net realized capital gains, if any, are distributed at least annually. Income distributions and capital gain distributions are determined in accordance with federal income tax regulations, which may differ from GAAP.
Guarantees and indemnifications
Under the Trust’s organizational documents and, in some cases, by contract, its officers and trustees are indemnified against certain liabilities arising out of the performance of their duties to the Trust or its funds. In addition, certain of the Fund’s contracts with its service providers contain general indemnification clauses. The Fund’s maximum exposure under these arrangements is unknown since the amount of any future claims that may be made against the Fund cannot be determined, and the Fund has no historical basis for predicting the likelihood of any such claims.
Investment company reporting modernization
In October 2016, the U.S. Securities and Exchange Commission adopted new rules and forms, and amendments to certain current rules and forms, to modernize reporting and disclosure of information by registered investment companies. The amendments to Regulation S-X will require standardized, enhanced disclosure about derivatives in investment company financial statements, and will also change the rules governing the form and content of such financial statements. The amendments to Regulation S-X take effect on August 1, 2017. At this time, management is assessing the anticipated impact of these regulatory developments.
| 40 | Columbia Bond Fund | Annual Report 2017 |
Notes to Financial Statements (continued)
April 30, 2017
Note 3. Fees and other transactions with affiliates
Management services fees
The Fund entered into a Management Agreement with Columbia Management Investment Advisers, LLC (the Investment Manager), a wholly-owned subsidiary of Ameriprise Financial, Inc. (Ameriprise Financial). Under the Management Agreement, the Investment Manager provides the Fund with investment research and advice, as well as administrative and accounting services. The management services fee is an annual fee that is equal to a percentage of the Fund’s average daily net assets that declines from 0.50% to 0.34% as the Fund’s net assets increase. The effective management services fee rate for the year ended April 30, 2017 was 0.50% of the Fund’s average daily net assets.
Compensation of board members
Members of the Board of Trustees, who are not officers or employees of the Investment Manager or Ameriprise Financial, are compensated for their services to the Fund as disclosed in the Statement of Operations. These members of the Board of Trustees may participate in a Deferred Compensation Plan (the Plan) which may be terminated at any time. Obligations of the Plan will be paid solely out of the Fund’s assets, and all amounts payable under the Plan constitute a general unsecured obligation of the Fund.
Compensation of Chief Compliance Officer
The Board of Trustees has appointed a Chief Compliance Officer to the Fund in accordance with federal securities regulations. A portion of the Chief Compliance Officer’s total compensation is allocated to the Fund, along with other affiliated funds governed by the Board of Trustees, based on relative net assets. The total amount allocated to all affiliated funds governed by the Board of Trustees will not exceed $40,000 annually.
Transactions with affiliates
For the year ended April 30, 2017, the Fund engaged in purchase and/or sale transactions with affiliates and/or accounts that have a common investment manager (or affiliated investment managers), common directors/trustees, and/or common officers. Those purchase and sale transactions complied with provisions of Rule 17a-7 under the 1940 Act and were $0 and $77,617, respectively. The sale transactions resulted in a net realized gain of $12,552.
Transfer agency fees
Under a Transfer and Dividend Disbursing Agent Agreement, Columbia Management Investment Services Corp. (the Transfer Agent), an affiliate of the Investment Manager and a wholly-owned subsidiary of Ameriprise Financial, is responsible for providing transfer agency services to the Fund. The Transfer Agent has contracted with Boston Financial Data Services (BFDS) to serve as sub-transfer agent. The Transfer Agent pays the fees of BFDS for services as sub-transfer agent and BFDS is not entitled to reimbursement for such fees from the Fund (with the exception of out-of-pocket fees).
The Fund pays the Transfer Agent a monthly transfer agency fee based on the number or the average value of accounts, depending on the type of account. In addition, prior to October 1, 2016, the Transfer Agent also received sub-transfer agency fees based on a percentage of the average aggregate value of the Fund’s shares maintained in omnibus accounts (other than omnibus accounts for which American Enterprise Investment Services Inc. is the broker of record or accounts where the beneficial shareholder is a customer of Ameriprise Financial Services, Inc., for which the Transfer Agent receives a per account fee). Effective October 1, 2016, the Fund pays the Transfer Agent a fee for shareholder services based on the number of accounts or on a percentage of the average aggregate value of the Fund’s shares maintained in omnibus accounts up to the lesser of the amount charged by the financial intermediary or a cap established by the Board of Trustees from time to time.
The Transfer Agent also receives compensation from the Fund for various shareholder services and reimbursements for certain out-of-pocket fees. Effective January 1, 2017, total transfer agency fees for Class R5 shares are subject to an annual limitation of not more than 0.075% of the average daily net assets attributable to Class R5 shares. Total transfer agency fees for Class I, prior to March 27, 2017 were, and Class Y shares are subject to an annual limitation of not more than 0.025% of
Columbia Bond Fund | Annual Report 2017
| 41 |
Notes to Financial Statements (continued)
April 30, 2017
the average daily net assets attributable to each share class. Prior to January 1, 2017, total transfer agency fees for Class R5 shares were subject to an annual limitation of not more than 0.05% of the average daily net assets attributable to Class R5 shares and Class I and Class Y shares did not pay transfer agency fees.
For the year ended April 30, 2017, the Fund’s effective transfer agency fee rates as a percentage of average daily net assets of each class were as follows:
| | Effective rate (%) |
| Class A | 0.20 |
| Class B | 0.20 |
| Class C | 0.20 |
| Class I | 0.001 (a),(b) |
| Class R | 0.20 |
| Class R4 | 0.20 |
| Class R5 | 0.068 |
| Class T | 0.21 |
| Class V | 0.20 |
| Class Y | 0.003 |
| Class Z | 0.20 |
| (a) | Annualized. |
| (b) | Effective March 27, 2017, Class I shares were redeemed or exchanged for Class Y shares. |
An annual minimum account balance fee of $20 may apply to certain accounts with a value below the applicable share class’s initial minimum investment requirements to reduce the impact of small accounts on transfer agency fees. These minimum account balance fees are remitted to the Fund and recorded as part of expense reductions in the Statement of Operations. For the year ended April 30, 2017, these minimum account balance fees reduced total expenses of the Fund by $1,220.
Distribution and service fees
The Fund has an agreement with Columbia Management Investment Distributors, Inc. (the Distributor), an affiliate of the Investment Manager and a wholly-owned subsidiary of Ameriprise Financial, for distribution and shareholder services. The Board of Trustees has approved, and the Fund has adopted, distribution and shareholder service plans (the Plans) applicable to certain share classes, which set the distribution and service fees for the Fund. These fees are calculated daily and are intended to compensate the Distributor and/or eligible selling and/or servicing agents for selling shares of the Fund and providing services to investors.
Under the Plans, the Fund pays a monthly service fee to the Distributor at the maximum annual rate of 0.25% of the average daily net assets attributable to Class A, Class B, Class C and Class T shares of the Fund. Also under the Plans, the Fund pays a monthly distribution fee to the Distributor at the maximum annual rates of 0.75%, 0.75%, 0.50% and 0.25% of the average daily net assets attributable to Class B, Class C, Class R and Class T shares of the Fund, respectively.
Although the Fund may pay a distribution fee up to 0.25% of the Fund’s average daily net assets attributable to Class T shares and a service fee of up to 0.25% of the Fund’s average daily net assets attributable to Class T shares, the aggregate fee shall not exceed 0.25% of the Fund’s average daily net assets attributable to Class T shares.
Shareholder services fees
The Fund has adopted a shareholder services plan that permits it to pay for certain services provided to Class V shareholders by their selling and/or servicing agents. The Fund may pay shareholder servicing fees up to an aggregate annual rate of 0.40% of the Fund’s average daily net assets attributable to Class V shares (comprised of up to 0.20% for shareholder liaison services and up to 0.20% for administrative support services). These fees are currently limited to an aggregate annual rate of not more than 0.15% of the Fund’s average daily net assets attributable to Class V shares.
| 42 | Columbia Bond Fund | Annual Report 2017 |
Notes to Financial Statements (continued)
April 30, 2017
Sales charges (unaudited)
Sales charges, including front-end charges and CDSCs, received by the Distributor for distributing Fund shares for the year ended April 30, 2017, if any, are listed below:
| | Amount ($) |
| Class A | 81,204 |
| Class C | 1,773 |
| Class V | 120 |
Expenses waived/reimbursed by the Investment Manager and its affiliates
The Investment Manager and certain of its affiliates have contractually agreed to waive fees and/or reimburse expenses (excluding certain fees and expenses described below) for the periods disclosed below, unless sooner terminated at the sole discretion of the Board of Trustees, so that the Fund’s net operating expenses, after giving effect to fees waived/expenses reimbursed and any balance credits and/or overdraft charges from the Fund’s custodian, do not exceed the following annual rates as a percentage of the class’ average daily net assets:
| | September 1, 2016
through
August 31, 2017 | Prior to
September 1, 2016 |
| Class A | 0.860% | 0.86% |
| Class B | 1.610 | 1.61 |
| Class C | 1.610 | 1.61 |
| Class R | 1.110 | 1.11 |
| Class R4 | 0.610 | 0.61 |
| Class R5 | 0.510 | 0.50 |
| Class T | 0.860 | 0.86 |
| Class V | 0.760 | 0.76 |
| Class Y | 0.460 | 0.45 |
| Class Z | 0.610 | 0.61 |
Under the agreement governing these fee waivers and/or expense reimbursement arrangements, the following fees and expenses are excluded from the waiver/reimbursement commitment, and therefore will be paid by the Fund, if applicable: taxes (including foreign transaction taxes), expenses associated with investments in affiliated and non-affiliated pooled investment vehicles (including mutual funds and exchange-traded funds), transaction costs and brokerage commissions, costs related to any securities lending program, dividend and interest expenses associated with securities sold short, inverse floater program fees and expenses, transaction charges and interest on borrowed money, interest, infrequent and/or unusual expenses and any other expenses the exclusion of which is specifically approved by the Board of Trustees. This agreement may be modified or amended only with approval from the Investment Manager, certain of its affiliates and the Fund. Any fees waived and/or expenses reimbursed under the expense reimbursement arrangements described above are not recoverable by the Investment Manager or its affiliates in future periods.
Note 4. Federal tax information
The timing and character of income and capital gain distributions are determined in accordance with income tax regulations, which may differ from GAAP because of temporary or permanent book to tax differences.
At April 30, 2017, these differences are primarily due to differing treatment for deferral/reversal of wash sale losses, derivative investments, tax straddles, post-October capital losses, trustees’ deferred compensation, distributions, principal and/or interest from fixed income securities, distribution reclassifications and certain convertible preferred securities. To the extent these differences are permanent, reclassifications are made among the components of the Fund’s net assets in the Statement of Assets and Liabilities. Temporary differences do not require reclassifications.
In the Statement of Assets and Liabilities the following reclassifications were made:
Columbia Bond Fund | Annual Report 2017
| 43 |
Notes to Financial Statements (continued)
April 30, 2017
Excess of distributions
over net investment
income ($) | Accumulated
net realized
(loss) ($) | Paid in
capital ($) |
| (828,981) | 828,981 | — |
Net investment income (loss) and net realized gains (losses), as disclosed in the Statement of Operations, and net assets were not affected by this reclassification.
The tax character of distributions paid during the years indicated was as follows:
| April 30, 2017 | April 30, 2016 |
Ordinary
income ($) | Long-term
capital gains ($) | Total ($) | Ordinary
income (S) | Long-term
capital gains ($) | Total ($) |
| 20,442,769 | 2,591,991 | 23,034,760 | 20,174,314 | 8,628,456 | 28,802,770 |
Short-term capital gain distributions, if any, are considered ordinary income distributions for tax purposes.
At April 30, 2017, the components of distributable earnings on a tax basis were as follows:
Undistributed
ordinary income ($) | Undistributed
long-term
capital gains ($) | Capital loss
carryforwards ($) | Net unrealized
appreciation ($) |
| 342,137 | — | — | 4,501,465 |
At April 30, 2017, the cost of investments for federal income tax purposes along with the aggregate gross unrealized appreciation and depreciation based on that cost was:
Federal
tax cost ($) | Gross unrealized
appreciation ($) | Gross unrealized
(depreciation) ($) | Net unrealized
appreciation ($) |
| 511,125,181 | 8,112,435 | (3,610,970) | 4,501,465 |
Under current tax rules, regulated investment companies can elect to treat certain late-year ordinary losses incurred and post-October capital losses (capital losses realized after October 31) as arising on the first day of the following taxable year. As of April 30, 2017, the Fund elected to treat the following late-year ordinary losses and post-October capital losses as arising on May 1, 2017.
Late year
ordinary losses ($) | Post-October
capital losses ($) |
| — | 1,299,116 |
Management of the Fund has concluded that there are no significant uncertain tax positions in the Fund that would require recognition in the financial statements. However, management’s conclusion may be subject to review and adjustment at a later date based on factors including, but not limited to, new tax laws, regulations, and administrative interpretations (including relevant court decisions). Generally, the Fund’s federal tax returns for the prior three fiscal years remain subject to examination by the Internal Revenue Service.
Note 5. Portfolio information
The cost of purchases and proceeds from sales of securities, excluding short-term investments and derivatives, if any, aggregated to $2,141,106,047 and $2,247,651,933, respectively, for the year ended April 30, 2017, of which $1,789,010,303 and $1,818,244,374, respectively, were U.S. government securities. The amount of purchase and sale activity impacts the portfolio turnover rate reported in the Financial Highlights.
Note 6. Affiliated money market fund
The Fund invests in Columbia Short-Term Cash Fund, an affiliated money market fund established for the exclusive use by the Fund and other affiliated funds (the Affiliated MMF). The income earned by the Fund from such investments is included as Dividends - affiliated issuers in the Statement of Operations. As an investing fund, the Fund indirectly bears its proportionate
| 44 | Columbia Bond Fund | Annual Report 2017 |
Notes to Financial Statements (continued)
April 30, 2017
share of the expenses of the Affiliated MMF. Effective October 1, 2016, the Affiliated MMF prices its shares with a floating net asset value (NAV) and no longer seeks to maintain a stable NAV. In addition, the Board of Trustees of the Affiliated MMF may impose a fee on redemptions (sometimes referred to as a liquidity fee) or temporarily suspend redemptions (sometimes referred to as imposing a redemption gate) in the event its liquidity falls below regulatory limits.
Note 7. Line of credit
The Fund has access to a revolving credit facility with a syndicate of banks led by Citibank, N.A., HSBC Bank USA, N.A. and JPMorgan Chase Bank, N.A. whereby the Fund may borrow for the temporary funding of shareholder redemptions or for other temporary or emergency purposes. The credit facility agreement, which is a collective agreement between the Fund and certain other funds managed by the Investment Manager, severally and not jointly, permits collective borrowings up to $1 billion. Interest is charged to each participating fund based on its borrowings at a rate equal to the higher of (i) the overnight federal funds rate plus 1.00% or (ii) the one-month LIBOR rate plus 1.00%. Each borrowing under the credit facility matures no later than 60 days after the date of borrowing. The Fund also pays a commitment fee equal to its pro rata share of the amount of the credit facility at a rate of 0.15% per annum. The commitment fee is included in other expenses in the Statement of Operations.
The Fund had no borrowings during the year ended April 30, 2017.
Note 8. Significant risks
Credit risk
Credit risk is the risk that the value of debt securities in the Fund’s portfolio may decline because the issuer may default and fail to pay interest or repay principal when due. Rating agencies assign credit ratings to debt securities to indicate their credit risk. Lower rated or unrated debt securities held by the Fund may present increased credit risk as compared to higher-rated debt securities.
Interest rate risk
Interest rate risk is the risk of losses attributable to changes in interest rates. In general, if prevailing interest rates rise, the values of debt securities tend to fall, and if interest rates fall, the values of debt securities tend to rise. Actions by governments and central banking authorities can result in increases in interest rates. Increasing interest rates may negatively affect the value of debt securities held by the Fund, resulting in a negative impact on the Fund’s performance and net asset value per share. In general, the longer the maturity or duration of a debt security, the greater its sensitivity to changes in interest rates.
Liquidity risk
Liquidity risk is the risk associated with a lack of marketability of investments which may make it difficult to sell the investment at a desirable time or price. Changing regulatory, market or other conditions or environments (for example, the interest rate or credit environments) may adversely affect the liquidity of the Fund’s investments. The Fund may have to accept a lower selling price for the holding, sell other investments, or forego another, more appealing investment opportunity. Generally, the less liquid the market at the time the Fund sells a portfolio investment, the greater the risk of loss or decline of value to the Fund. A less liquid market can lead to an increase in Fund redemptions, which may negatively impact Fund performance and net asset value per share, including, for example, if the Fund is forced to sell securities in a down market.
Mortgage- and other asset-backed securities risk
The value of any mortgage-backed and other asset-backed securities held by the Fund may be affected by, among other things, changes or perceived changes in: interest rates; factors concerning the interests in and structure of the issuer or the originator of the mortgages or other assets; the creditworthiness of the entities that provide any supporting letters of credit, surety bonds or other credit enhancements; or the market’s assessment of the quality of underlying assets. Payment of principal and interest on some mortgage-backed securities (but not the market value of the securities themselves) may be guaranteed by the full faith and credit of a particular U.S. Government agency, authority, enterprise or instrumentality, and some, but not all, are also insured or guaranteed by the U.S. Government. Mortgage-backed securities issued by non-governmental issuers (such as commercial banks, savings and loan institutions, private mortgage insurance companies,
Columbia Bond Fund | Annual Report 2017
| 45 |
Notes to Financial Statements (continued)
April 30, 2017
mortgage bankers and other secondary market issuers) may entail greater risk than obligations guaranteed by the U.S. Government. Mortgage- and other asset-backed securities are subject to prepayment risk, which is the possibility that the underlying mortgage or other asset may be refinanced or prepaid prior to maturity during periods of declining or low interest rates, causing the Fund to have to reinvest the money received in securities that have lower yields. Rising or high interest rates tend to extend the duration of mortgage- and other asset-backed securities, making their prices more volatile and more sensitive to changes in interest rates.
Shareholder concentration risk
At April 30, 2017, one unaffiliated shareholder of record owned 75.6% of the outstanding shares of the Fund in one or more accounts. The Fund has no knowledge about whether any portion of those shares was owned beneficially. Subscription and redemption activity by concentrated accounts may have a significant effect on the operations of the Fund. In the case of a large redemption, the Fund may be forced to sell investments at inopportune times, including its liquid or more liquid positions, resulting in Fund losses and the Fund holding a higher percentage of less liquid or illiquid securities. Large redemptions could result in decreased economies of scale and increased operating expenses for non-redeeming Fund shareholders.
Note 9. Subsequent events
Management has evaluated the events and transactions that have occurred through the date the financial statements were issued. Other than as noted in Note 1 above, there were no items requiring adjustment of the financial statements or additional disclosure.
Note 10. Information regarding pending and settled legal proceedings
Ameriprise Financial and certain of its affiliates have historically been involved in a number of legal, arbitration and regulatory proceedings, including routine litigation, class actions, and governmental actions, concerning matters arising in connection with the conduct of their business activities. Ameriprise Financial believes that the Funds are not currently the subject of, and that neither Ameriprise Financial nor any of its affiliates are the subject of, any pending legal, arbitration or regulatory proceedings that are likely to have a material adverse effect on the Funds or the ability of Ameriprise Financial or its affiliates to perform under their contracts with the Funds. Ameriprise Financial is required to make quarterly (10-Q), annual (10-K) and, as necessary, 8-K filings with the Securities and Exchange Commission (SEC) on legal and regulatory matters that relate to Ameriprise Financial and its affiliates. Copies of these filings may be obtained by accessing the SEC website at www.sec.gov.
There can be no assurance that these matters, or the adverse publicity associated with them, will not result in increased fund redemptions, reduced sale of fund shares or other adverse consequences to the Funds. Further, although we believe proceedings are not likely to have a material adverse effect on the Funds or the ability of Ameriprise Financial or its affiliates to perform under their contracts with the Funds, these proceedings are subject to uncertainties and, as such, we are unable to estimate the possible loss or range of loss that may result. An adverse outcome in one or more of these proceedings could result in adverse judgments, settlements, fines, penalties or other relief that could have a material adverse effect on the consolidated financial condition or results of operations of Ameriprise Financial.
| 46 | Columbia Bond Fund | Annual Report 2017 |
Report of Independent Registered Public Accounting Firm
To the Trustees of Columbia Funds Series Trust I and the Shareholders of Columbia Bond Fund
In our opinion, the accompanying statement of assets and liabilities, including the portfolio of investments, and the related statements of operations and of changes in net assets and the financial highlights present fairly, in all material respects, the financial position of Columbia Bond Fund (the “Fund”, a series of Columbia Funds Series Trust I) as of April 30, 2017, the results of its operations for the year then ended, the changes in its net assets for each of the two years in the period then ended and the financial highlights for each of the five years in the period then ended, in conformity with accounting principles generally accepted in the United States of America. These financial statements and financial highlights (hereafter referred to as “financial statements”) are the responsibility of the Fund’s management. Our responsibility is to express an opinion on these financial statements based on our audits. We conducted our audits of these financial statements in accordance with the standards of the Public Company Accounting Oversight Board (United States). Those standards require that we plan and perform the audit to obtain reasonable assurance about whether the financial statements are free of material misstatement. An audit includes examining, on a test basis, evidence supporting the amounts and disclosures in the financial statements, assessing the accounting principles used and significant estimates made by management, and evaluating the overall financial statement presentation. We believe that our audits, which included confirmation of securities as of April 30, 2017 by correspondence with the custodian, brokers and transfer agent, provide a reasonable basis for our opinion.
PricewaterhouseCoopers LLP
Minneapolis, MN
June 21, 2017
Columbia Bond Fund | Annual Report 2017
| 47 |
Federal Income Tax Information
(Unaudited)
The Fund hereby designates the following tax attributes for the fiscal year ended April 30, 2017. Shareholders will be notified in early 2018 of the amounts for use in preparing 2017 income tax returns.
Capital
gain
dividend | |
| $2,721,591 | |
Capital gain dividend. The Fund designates as a capital gain dividend the amount reflected above, or if subsequently determined to be different, the net capital gain of such fiscal period.
| 48 | Columbia Bond Fund | Annual Report 2017 |
Shareholders elect the Board that oversees the Fund’s operations. The Board appoints officers who are responsible for day-to-day business decisions based on policies set by the Board. The following table provides basic biographical information about the Fund’s Trustees, including their principal occupations during the past five years, although specific titles for individuals may have varied over the period. The year set forth beneath Length of Service in the table below is the year in which the Trustee was first appointed or elected as Trustee to any Fund currently in the Columbia Funds Complex or a predecessor thereof. Under current Board policy, members serve terms of indefinite duration.
Independent trustees
| Name, address, year of birth | Position held with the Trust and length of service | Principal occupation(s) during the past five years and other relevant professional experience | Number of Funds in the Columbia Fund Complex overseen | Other directorships held by Trustee during the past five years |
Janet Langford Carrig
c/o Columbia Management
Investment Advisers, LLC
225 Franklin Street
Mail Drop BX32 05228
Boston, MA 02110
1957 | Trustee
1996 | Senior Vice President, General Counsel and Corporate Secretary, ConocoPhillips (independent energy company) since September 2007 | 57 | None |
Douglas A. Hacker
c/o Columbia Management
Investment Advisers, LLC
225 Franklin Street
Mail Drop BX32 05228
Boston, MA 02110
1955 | Trustee and Chairman of the Board
1996 | Independent business executive since May 2006; Executive Vice President — Strategy of United Airlines from December 2002 to May 2006; President of UAL Loyalty Services (airline marketing company) from September 2001 to December 2002; Executive Vice President and Chief Financial Officer of United Airlines from July 1999 to September 2001 | 57 | Spartan Nash Company, (food distributor); Nash Finch Company (food distributor) from 2005 to 2013; Aircastle Limited (aircraft leasing); SeaCube Container Leasing Ltd. (container leasing) from 2010 to 2013; and Travelport Worldwide Limited (travel information technology) |
Nancy T. Lukitsh
c/o Columbia Management
Investment Advisers, LLC
225 Franklin Street
Mail Drop BX32 05228
Boston, MA 02110
1956 | Trustee
2011 | Senior Vice President, Partner and Director of Marketing, Wellington Management Company, LLP (investment adviser) from 1997 to 2010; Chair, Wellington Management Portfolios (commingled non-U.S. investment pools) from 2007 to 2010; Director, Wellington Trust Company, NA and other Wellington affiliates from 1997 to 2010 | 57 | None |
David M. Moffett
c/o Columbia Management
Investment Advisers, LLC
225 Franklin Street
Mail Drop BX32 05228
Boston, MA 02110
1952 | Trustee
2011 | Retired. Consultant to Bridgewater and Associates | 57 | Director, CSX Corporation; Genworth Financial, Inc. (financial and insurance products and services); Paypal Holdings Inc. (payment and data processing services); Trustee, University of Oklahoma Foundation; former Director, eBay Inc. (online trading community), 2007-2015; and former Director, CIT Bank, CIT Group Inc. (commercial and consumer finance), 2010-2016 |
Columbia Bond Fund | Annual Report 2017
| 49 |
TRUSTEES AND OFFICERS (continued)
Independent trustees (continued)
| Name, address, year of birth | Position held with the Trust and length of service | Principal occupation(s) during the past five years and other relevant professional experience | Number of Funds in the Columbia Fund Complex overseen | Other directorships held by Trustee during the past five years |
Charles R. Nelson
c/o Columbia Management
Investment Advisers, LLC
225 Franklin Street
Mail Drop BX32 05228
Boston, MA 02110
1942 | Trustee
1981 | Retired. Professor Emeritus, University of Washington since 2011; Professor of Economics, University of Washington from 1976 to 2011; Ford and Louisa Van Voorhis Professor of Political Economy, University of Washington from 1993 to 2011; Adjunct Professor of Statistics, University of Washington from 1980 to 2011; Associate Editor, Journal of Money, Credit and Banking from September 1993 to 2008; consultant on econometric and statistical matters | 57 | None |
John J. Neuhauser
c/o Columbia Management
Investment Advisers, LLC
225 Franklin Street
Mail Drop BX32 05228
Boston, MA 02110
1943 | Trustee
1984 | President, Saint Michael’s College since August 2007; Director or Trustee of several non-profit organizations, including University of Vermont Medical Center; Academic Vice President and Dean of Faculties, Boston College from August 1999 to October 2005; University Professor, Boston College from November 2005 to August 2007 | 57 | Liberty All-Star Equity Fund and Liberty All- Star Growth Fund (closed-end funds) |
Patrick J. Simpson
c/o Columbia Management
Investment Advisers, LLC
225 Franklin Street
Mail Drop BX32 05228
Boston, MA 02110
1944 | Trustee
2000 | Of Counsel, Perkins Coie LLP (law firm) since 2015; Partner, Perkins Coie LLP from 1988 to 2014 | 57 | None |
Anne-Lee Verville
c/o Columbia Management
Investment Advisers, LLC
225 Franklin Street
Mail Drop BX32 05228
Boston, MA 02110
1945 | Trustee
1998 | Retired. General Manager, Global Education Industry from 1994 to 1997, President – Application Systems Division from 1991 to 1994, Chief Financial Officer – US Marketing & Services from 1988 to 1991, and Chief Information Officer from 1987 to 1988, IBM Corporation (computer and technology) | 57 | Enesco Group, Inc. (producer of giftware and home and garden decor products) from 2001 to 2006 |
| 50 | Columbia Bond Fund | Annual Report 2017 |
TRUSTEES AND OFFICERS (continued)
Consulants to the Independent Trustees*
| Name, address, year of birth | Position held with the Trust and length of service | Principal occupation(s) during the past five years and other relevant professional experience | Number of Funds in the Columbia Funds complex overseen | Other directorships held by Trustee during the past five years |
J. Kevin Connaughton
c/o Columbia
Management Investment
Advisers, LLC,
225 Franklin Street
Mail Drop BX32 05228,
Boston, MA 02110
1964 | Independent Trustee Consultant
2016 | Independent Trustee Consultant, Columbia Funds since March 2016; Managing Director and General Manager of Mutual Fund Products, Columbia Management Investment Advisers, LLC from May 2010 to February 2015; President, Columbia Funds from 2009 to 2015; and senior officer of Columbia Funds and affiliated funds from 2003 to 2015 | 57 | Board of Governors, Gateway Healthcare since January 2016; Trustee, New Century Portfolios since March 2015; and Director, The Autism Project since March 2015 |
Natalie A. Trunow
c/o Columbia
Management Investment
Advisers, LLC,
225 Franklin Street
Mail Drop BX32 05228,
Boston, MA 02110
1967 | Independent Trustee Consultant
2016 | Independent Trustee Consultant, Columbia Funds since September 2016; Chief Executive Officer, Millennial Partners (investment consulting services to institutions) since January 2016; Director of Investments, Casey Family Programs from April 2016 to September 2016; Senior Vice President and Chief Investment Officer, Calvert Investments from August 2008 to January 2016; Section Head and Portfolio Manager, General Motors Asset Management from June 1997 to August 2008 | 57 | Healthcare Services for Children with Special Needs |
| * | J. Kevin Connaughton was appointed consultant to the Independent Trustees effective March 1, 2016. Natalie A. Trunow was appointed consultant to the Independent Trustees effective September 1, 2016. Shareholders of the Funds are expected to be asked to elect each of Mr. Connaughton and Ms. Trunow as a Trustee at a future shareholder meeting. |
Interested trustee affiliated with Investment Manager*
| Name, address, year of birth | Position held with the Trust and length of service | Principal occupation(s) during the past five years and other relevant professional experience | Number of Funds in the Columbia Funds Complex overseen | Other directorships held by Trustee during the past five years |
William F. Truscott
c/o Columbia Management
Investment Advisers, LLC
225 Franklin Street
Boston, MA 02110
1960 | Trustee
2012 | Chairman of the Board and President, Columbia Management Investment Advisers, LLC since May 2010 and February 2012, respectively; Chief Executive Officer, Global Asset Management, Ameriprise Financial, Inc. since September 2012 (previously Chief Executive Officer, U.S. Asset Management & President, Annuities, May 2010-September 2012); Director and Chief Executive Officer, Columbia Management Investment Distributors, Inc. since May 2010 and February 2012, respectively;Chairman of the Board and Chief Executive Officer, RiverSource Distributors, Inc. since 2006; Director, Threadneedle Asset Management Holdings, SARL since 2014; President and Chief Executive Officer, Ameriprise Certificate Company, 2006-August 2012 | 183 | Chairman of the Board, Columbia Management Investment Advisers, LLC since May 2010; Director, Columbia Management Investment Distributors, Inc. since May 2010; former Director, Ameriprise Certificate Company, 2006 - January 2013 |
| * | Interested person (as defined under the 1940 Act) by reason of being an officer, director, security holder and/or employee of the Investment Manager or Ameriprise Financial. |
The Statement of Additional Information has additional information about the Fund’s Board members and is available,
without charge, upon request by calling 800.345.6611; contacting your financial intermediary; or visiting
investor.columbiathreadneedleus.com.
Columbia Bond Fund | Annual Report 2017
| 51 |
TRUSTEES AND OFFICERS (continued)
The Board has appointed officers who are responsible for day-to-day business decisions based on policies it has established. The officers serve at the pleasure of the Board. The following table provides basic information about the Officers of the Fund, including principal occupations during the past five years, although their specific titles may have varied over the period. In addition to Mr. Truscott, who is Senior Vice President, the Fund’s other officers are:
Fund officers
Name,
address and
year of birth | Position and year
first appointed to
position for any Fund
in the Columbia
Funds complex or a
predecessor thereof | Principal occupation(s) during past five years |
Christopher O. Petersen
5228 Ameriprise
Financial Center
Minneapolis, MN 55474
Born 1970 | President and Principal Executive Officer (2015) | Vice President and Lead Chief Counsel, Ameriprise Financial, Inc. since January 2015 (previously, Vice President and Chief Counsel, January 2010 - December 2014; officer of Columbia Funds and affiliated funds since 2007. |
Michael G. Clarke
225 Franklin Street
Boston, MA 02110
Born 1969 | Treasurer (2011), Chief Financial Officer (2009) and Chief Accounting Officer (2015) | Vice President — Mutual Fund Administration, Columbia Management Investment Advisers, LLC, since May 2010; senior officer of Columbia Funds and affiliated funds since 2002. |
Paul B. Goucher
100 Park Avenue
New York, NY 10017
Born 1968 | Senior Vice President (2011) and Assistant Secretary (2008) | Senior Vice President and Assistant General Counsel, Ameriprise Financial, Inc. since January 2017 (previously Vice President and Lead Chief Counsel, November 2008 - January 2017 and January 2013 - January 2017, respectively; and Chief Counsel, January 2010 - January 2013); Vice President, Chief Legal Officer and Assistant Secretary, Columbia Management Investment Advisers, LLC since May 2010. |
Thomas P. McGuire
225 Franklin Street
Boston, MA 02110
Born 1972 | Senior Vice President and Chief Compliance Officer (2012) | Vice President — Asset Management Compliance, Ameriprise Financial, Inc., since May 2010; Chief Compliance Officer, Ameriprise Certificate Company since September 2010. |
Colin Moore
225 Franklin Street
Boston, MA 02110
Born 1958 | Senior Vice President (2010) | Executive Vice President and Global Chief Investment Officer, Ameriprise Financial, Inc., since July 2013; Executive Vice President and Global Chief Investment Officer, Columbia Management Investment Advisers, LLC since July 2013 (previously Director and Global Chief Investment Officer, 2010 - 2013). |
Michael E. DeFao
225 Franklin Street
Boston, MA 02110
Born 1968 | Vice President (2011) and Assistant Secretary (2010) | Vice President and Chief Counsel, Ameriprise Financial, Inc. since May 2010. |
Amy Johnson
5228 Ameriprise
Financial Center
Minneapolis, MN 55474
Born 1965 | Vice President (2006) | Managing Director and Global Head of Operations, Columbia Management Investment Advisers, LLC since April 2016 (previously Managing Director and Chief Operating Officer, 2010 - 2016). |
Lyn Kephart-Strong
5228 Ameriprise
Financial Center
Minneapolis, MN 55474
Born 1960 | Vice President (2015) | President, Columbia Management Investment Services Corp. since October 2014; Vice President & Resolution Officer, Ameriprise Trust Company since August 2009. |
Ryan C. Larrenaga
225 Franklin Street
Boston, MA 02110
Born 1970 | Senior Vice President (2017), Chief Legal Officer (2017) and Secretary (2015) | Vice President and Group Counsel, Ameriprise Financial, Inc. since August 2011; officer of Columbia Funds and affiliated funds since 2005. |
| 52 | Columbia Bond Fund | Annual Report 2017 |
The Fund mails one shareholder report to each shareholder address. If you would like more than one report, please call shareholder services at 800.345.6611 and additional reports will be sent to you.
Proxy voting policies and procedures
The policy of the Board of Trustees is to vote the proxies of the companies in which the Fund holds investments consistent with the procedures as stated in the Statement of Additional Information (SAI). You may obtain a copy of the SAI without charge by calling 800.345.6611; contacting your financial intermediary; visiting investor.columbiathreadneedleus.com; or searching the website of the Securities and Exchange Commission (SEC) at sec.gov. Information regarding how the Fund voted proxies relating to portfolio securities is filed with the SEC by August 31st for the most recent 12-month period ending June 30th of that year, and is available without charge by visiting investor.columbiathreadneedleus.com, or searching the website of the SEC at sec.gov.
Quarterly schedule of investments
The Fund files a complete schedule of portfolio holdings with the SEC for the first and third quarters of each fiscal year on Form N-Q. The Fund’s Form N-Q is available on the SEC’s website at sec.gov and may be reviewed and copied at the SEC’s Public Reference Room in Washington, D.C. Information on the operation of the Public Reference Room may be obtained by calling 800.SEC.0330. The Fund’s complete schedule of portfolio holdings, as filed on Form N-Q, can also be obtained without charge, upon request, by calling 800.345.6611.
Additional Fund information
For more information about the Fund, please visit investor.columbiathreadneedleus.com or call 800.345.6611. Customer Service Representatives are available to answer your questions Monday through Friday from 8 a.m. to 7 p.m. Eastern time.
Fund investment manager
Columbia Management Investment Advisers, LLC
225 Franklin Street
Boston, MA 02110
Fund distributor
Columbia Management Investment Distributors, Inc.
225 Franklin Street
Boston, MA 02110
Fund transfer agent
Columbia Management Investment Services Corp.
P.O. Box 8081
Boston, MA 02266-8081
Columbia Bond Fund | Annual Report 2017
| 53 |
Columbia Bond Fund
P.O. Box 8081
Boston, MA 02266-8081
Please read and consider the investment objectives, risks, charges and expenses for any fund carefully before investing. For a prospectus and summary prospectus, which contains this and other important information about the Fund, go to
investor.columbiathreadneedleus.com. The Fund is distributed by Columbia Management Investment Distributors, Inc., member FINRA, and managed by Columbia Management Investment Advisers, LLC.
Columbia Threadneedle Investments (Columbia Threadneedle) is the global brand name of the Columbia and Threadneedle group of companies. All rights reserved. Columbia Management Investment Distributors, Inc., 225 Franklin Street, Boston, MA 02110-2804
© 2017 Columbia Management Investment Advisers, LLC.
investor.columbiathreadneedleus.com

Annual Report
April 30, 2017
Columbia Small Cap Value Fund I
Not FDIC Insured • No bank guarantee • May lose value
Dear Shareholders,
While emotions have run high following the outcome of the U.S. Presidential election, it remains unclear how the Trump presidency will unfold in terms of policy. We have a sense of the priorities espoused by the President over the past eighteen months, but campaign priorities are not always realized and are often never pursued. What seems certain is that, while some investors have already priced expectations into the market, others have retreated, preferring instead a wait and see approach. The outcome of such behaviors appears to have created conditions ripe for ongoing market volatility.
While volatility in the financial markets can be stressful, volatility itself is not a new phenomenon. Other factors that have been at the root cause of recent volatility include uncertainty following the United Kingdom’s vote to exit the European Union (Brexit), speculation around the Federal Reserve’s decision to increase interest rates, divergent central bank policy and geopolitical unrest. The point is, financial markets have fluctuated for years and may be expected to continue to fluctuate — sometimes wildly. If anything, such volatility seems to be the new normal, perhaps exacerbated by access to information and development of technological tools which have enabled investors to react rapidly to real and perceived change. So what can you do?
Position your portfolio for the reality of market volatility
That there is a historical precedent for market volatility, or even an acceptance that it may persist, offers little comfort. A measured and strategic approach remains the best strategy for investors to stay on track in achieving their investment goals.
Step 1: Review your investment goals
Take this opportunity to review your investment goals and the strategies you are pursuing to achieve those goals in order to remain focused on what’s important to you. It is entirely possible that your goals have changed in response either to your life situation or to changes in the market. Accept what you can’t control — volatility, and focus on what you can — your investment goals and strategies.
Step 2: Reassess your risk tolerance
Sit down with your financial advisor to discuss your investment goals and strategies, as well as any changes to your tolerance for risk. Consider your investment horizon. Increased market volatility and a new investment horizon may impact the strategies that can best help you achieve your investment goals. Remember, achieving your investment goals may require a certain amount of risk. Ultimately, you must maintain vigilance in reassessing your risk tolerance and the strategies you have selected in pursuit of your investment goals, and awareness of how those strategies may react to market volatility.
Step 3: Remain calm and focus on your long-term plan
Remember, investing is about the long game. Short term events are not necessarily evidence of a longer term reality. Investors who attempt to time the market too often end up reacting to a down turn by selling low and then compounding the problem by waiting on the sidelines, ultimately missing the right opportunity to reinvest.
Columbia Small Cap Value Fund I | Annual Report 2017
President’s Message (continued)
As long as there is a market, there will be volatility. How you respond to that volatility can make a big difference in the measure of your success as an investor. Talk to your financial advisor about how working with Columbia Threadneedle Investments may help you position your portfolio for the reality of ongoing volatility and, perhaps, even turn such volatility into investment opportunity.
Sincerely,
Christopher O. Petersen
President, Columbia Funds
Investors should consider the investment objectives, risks, charges and expenses of a mutual fund carefully before investing. For a free prospectus and summary prospectus, which contains this and other important information about a fund, visit investor.columbiathreadneedleus.com. The prospectus should be read carefully before investing.
Columbia Funds are distributed by Columbia Management Investment Distributors, Inc., member FINRA, and managed by Columbia Management Investment Advisers, LLC.
© 2017 Columbia Management Investment Advisers, LLC. All rights reserved.
Columbia Small Cap Value Fund I | Annual Report 2017
Columbia Small Cap Value Fund I | Annual Report 2017
Investment objective
Columbia Small Cap Value Fund I (the Fund) seeks long-term capital appreciation.
Portfolio management
Jeremy Javidi, CFA
Manager
Managed Fund since 2005
Morningstar style boxTM
The Morningstar Style Box is based on a fund’s portfolio holdings. For equity funds, the vertical axis shows the market capitalization of the stocks owned, and the horizontal axis shows investment style (value, blend, or growth). Information shown is based on the most recent data provided by Morningstar.
© 2017 Morningstar, Inc. All rights reserved. The Morningstar information contained herein: (1) is proprietary to Morningstar and/or its content providers; (2) may not be copied or distributed; and (3) is not warranted to be accurate, complete or timely. Neither Morningstar nor its content providers are responsible for any damages or losses arising from any use of this information.
| Average annual total returns (%) (for the period ended April 30, 2017) |
| | | Inception | 1 Year | 5 Years | 10 Years |
| Class A | Excluding sales charges | 07/25/86 | 26.02 | 12.36 | 6.47 |
| | Including sales charges | | 18.76 | 11.04 | 5.84 |
| Class B | Excluding sales charges | 11/09/92 | 25.00 | 11.52 | 5.67 |
| | Including sales charges | | 20.00 | 11.31 | 5.67 |
| Class C | Excluding sales charges | 01/15/96 | 25.05 | 11.52 | 5.67 |
| | Including sales charges | | 24.05 | 11.52 | 5.67 |
| Class R * | 09/27/10 | 25.71 | 12.09 | 6.21 |
| Class R4 * | 11/08/12 | 26.30 | 12.63 | 6.59 |
| Class R5 * | 11/08/12 | 26.50 | 12.77 | 6.66 |
| Class Y * | 07/15/09 | 26.57 | 12.87 | 6.84 |
| Class Z | 07/31/95 | 26.33 | 12.64 | 6.73 |
| Russell 2000 Value Index | | 27.18 | 12.96 | 6.02 |
Returns for Class A are shown with and without the maximum initial sales charge of 5.75%. Returns for Class B are shown with and without the applicable contingent deferred sales charge (CDSC) of 5.00% in the first year, declining to 1.00% in the sixth year and eliminated thereafter. The Fund does not accept new investments in Class B shares, except for certain limited transactions. The Fund’s current Class B investors, having held their shares for the requisite time period, are no longer subject to a CDSC upon redemption of their shares. Returns for Class C are shown with and without the 1.00% CDSC for the first year only. The Fund’s other classes are not subject to sales charges and have limited eligibility. Please see the Fund’s prospectus for details. Performance for different share classes will vary based on differences in sales charges and fees associated with each class. All results shown assume reinvestment of distributions during the period. Returns do not reflect the deduction of taxes that a shareholder may pay on Fund distributions or on the redemption of Fund shares. Performance results reflect the effect of any fee waivers or reimbursements of Fund expenses by Columbia Management Investment Advisers, LLC and/or any of its affiliates. Absent these fee waivers or expense reimbursement arrangements, performance results would have been lower.
The performance information shown represents past performance and is not a guarantee of future results. The investment return and principal value of your investment will fluctuate so that your shares, when redeemed, may be worth more or less than their original cost. Current performance may be lower or higher than the performance information shown. You may obtain performance information current to the most recent month-end by contacting your financial intermediary, visiting investor.columbiathreadneedleus.com or calling 800.345.6611.
| * | The returns shown for periods prior to the share class inception date (including returns for the Life of the Fund, if shown, which are since Fund inception) include the returns of the Fund’s oldest share class. These returns are adjusted to reflect any higher class-related operating expenses of the newer share classes, as applicable. Please visit investor.columbiathreadneedleus.com/investment-products/mutual-funds/appended-performance for more information. |
The Russell 2000 Value Index, an unmanaged index, tracks the performance of those Russell 2000 Index companies with lower price-to-book ratios and lower forecasted growth values.
Indices are not available for investment, are not professionally managed and do not reflect sales charges, fees, brokerage commissions, taxes or other expenses of investing. Securities in the Fund may not match those in an index.
Columbia Small Cap Value Fund I | Annual Report 2017
| 3 |
Fund at a Glance (continued)
Performance of a hypothetical $10,000 investment (April 30, 2007 — April 30, 2017)
The chart above shows the change in value of a hypothetical $10,000 investment in Class A shares of Columbia Small Cap Value Fund I during the stated time period, and does not reflect the deduction of taxes that a shareholder may pay on Fund distributions or on the redemption of Fund shares.
| Top 10 holdings (%) (at April 30, 2017) |
| Sunstone Hotel Investors, Inc. | 1.3 |
| UMB Financial Corp. | 1.1 |
| MGIC Investment Corp. | 1.1 |
| American Equity Investment Life Holding Co. | 1.0 |
| Radian Group, Inc. | 1.0 |
| Towne Bank | 1.0 |
| Webster Financial Corp. | 0.9 |
| Chesapeake Lodging Trust | 0.9 |
| Pebblebrook Hotel Trust | 0.9 |
| National Western Life Group, Inc., Class A | 0.9 |
Percentages indicated are based upon total investments (excluding Money Market Funds).
For further detail about these holdings, please refer to the section entitled “Portfolio of Investments.”
Fund holdings are as of the date given, are subject to change at any time, and are not recommendations to buy or sell any security.
| Portfolio breakdown (%) (at April 30, 2017) |
| Common Stocks | 99.4 |
| Money Market Funds | 0.6 |
| Total | 100.0 |
Percentages indicated are based upon total investments. The Fund’s portfolio composition is subject to change.
| Equity sector breakdown (%) (at April 30, 2017) |
| Consumer Discretionary | 11.2 |
| Consumer Staples | 2.7 |
| Energy | 7.0 |
| Financials | 32.0 |
| Health Care | 10.6 |
| Industrials | 12.7 |
| Information Technology | 9.4 |
| Materials | 6.2 |
| Real Estate | 5.9 |
| Telecommunication Services | 1.0 |
| Utilities | 1.3 |
| Total | 100.0 |
Percentages indicated are based upon total equity investments. The Fund’s portfolio composition is subject to change.
| 4 | Columbia Small Cap Value Fund I | Annual Report 2017 |
Manager Discussion of Fund Performance
For the 12-month period that ended April 30, 2017, the Fund’s Class A shares returned 26.02% excluding sales charges. The Fund’s benchmark, the Russell 2000 Value Index, returned 27.18% over the same period. The period had a tumultuous beginning, and small-cap stocks were particularly hard hit in the aftermath of the UK’s decision to exit the European Union. However, they picked up as the period progressed and rallied strongly after the election of a new president who promised lower taxes and lighter regulation, both of which could have significant impact on small companies. In this environment, stock selection in real estate, base materials, consumer discretionary, utilities and staples sectors drove performance while individual selections within energy, health care, financials and information technology detracted from relative results.
U.S. equity markets logged solid gains
Global events, political uncertainty and mixed economic data were enough to keep investors off balance for most of calendar year 2016, as financial markets moved sharply in reaction to each significant change on the world stage. However, the end of a contentious U.S. presidential election eliminated a key element of uncertainty, and the U.S. equity markets moved solidly higher in the final three months of the period. Positive economic data, steady job growth, rising corporate earnings and accelerated manufacturing activity further bolstered investor confidence. Against this backdrop, small cap value stocks were the market’s top performers.
In December 2016, the Federal Reserve (the Fed) raised the target range of its benchmark interest rate by a quarter of a point to between 0.50% and 0.75%, its first such move in a year. In March 2017, the Fed again raised the target short-term interest rate to between 0.75% and 1.00%. The Fed signaled that it was prepared to raise rates more aggressively in 2017 on the heels of strong job gains and progress towards its inflation target.
Fund positioning aided performance
The Fund was well positioned to take advantage of the significant rally that took place in the second half of the Fund’s fiscal year. Overweight sector allocations to materials, information technology and financials aided the Fund’s relative results as did a decision to pull back some on information technology and financials by the end of the period. These positioning decisions helped offset the impact of disappointing stock selection, which was primarily the result of our emphasis on higher quality holdings. It is not unusual for the Fund to lag the benchmark in stock selection when stocks that are out of our risk tolerance perform strongly. However, we believe that our disciplined investment approach has the potential to aid performance over the long term.
Contributors and detractors
Real estate, materials, consumer discretionary and consumer staples provided most of the Fund’s top performers for the 12-month period. In the real estate sector, the timing of the Fund’s investment in CoreCivic, which is not in the benchmark, and GEO Group, benefited results. Both are private prison companies, which sold off dramatically when the Obama administration signaled in 2016 that it would unload for-profit-prison contracts. We invested in both companies at significant discounts, and they have logged substantial gains since President Trump rescinded the order in the early days of his administration.
The Fund did well with names that were related to the rebound in the housing sector, which we believe still has considerable upside potential. In the materials sector, shares of Tronox, which makes titanium dioxide (TiO(2)), soared as the company announced its intention to acquire competitor Cristal’s TiO(2) business. TiO(2) provides brightness to applications such as coatings, plastics and paper. Other housing-related names that did well include Olin Corporation, which makes polyvinyl chloride (PVC), which is used in construction for pipe and in profile applications such as doors and windows, and Axiall Corporation, which was acquired during the period. Louisiana-Pacific, which manufactures oriented strand board (OSB), a building material used in homebuilding and remodeling, did well as profits improved due to strong demand and improved pricing. In the consumer discretionary sector, Aaron’s, a lease-to-own retailer of furniture, appliances and electronics, and Hooker Furniture benefited from the uptick in the housing sector and a mismatch between supply and demand. Homebuilder UCP, which announced that it would be acquired, was also up strongly for the period.
In the consumer staples sector, a sizeable position in Fresh Del Monte Produce had a positive impact on relative returns. The company has done well by satisfying the consumer preference for convenience and for eating healthy in buying fresh fruit and other items, such as salsa, that are cut, prepared and packaged for grocery and food markets.
Columbia Small Cap Value Fund I | Annual Report 2017
| 5 |
Manager Discussion of Fund Performance (continued)
Disappointing returns from certain energy, health care, financials and information technology holdings offset some of the gains from these top performers. Within the energy sector, positions in Cobalt International Energy, SM Energy and Gulfport Energy were a drag on relative results and trimmed Fund gains. A November 2016 decision by the Organization of the Petroleum Exporting Countries (OPEC) to curb production helped lift oil prices and shares of energy companies as well. However, energy stocks came under pressure near the end of the period on rising concern that OPEC would not extend this action and as oil prices moved lower. We held onto Cobalt International Energy and SM Energy but sold Gulfport Energy, which had made a questionable acquisition and exercised poor judgement, in our opinion, in funding it.
Within health care, biotechnology stocks Infinity Pharmaceuticals, Novavax and OncoMed Pharmaceuticals lost ground after experiencing disappointing results from drug trials. Despite these disappointments, we remained positive in our outlook for biotechnology and continued to own a range of stocks within the industry to help minimize the impact of event risk — and maximize the potential opportunity — for the portfolio.
Within the financials sector, the Fund’s biggest detractor was First NBC Bank, a New Orleans lender that was the subject of scrutiny for its accounting practices, especially of tax credit-related projects. The bank was closed by the Louisiana Office of Financial Institutions and its shares plummeted. Within the information technology sector, a position in Fitbit was a significant drag on relative results. (The stock is not in the benchmark.) A weak holiday season put pressure on Fitbit shares and we exited the stock.
At period’s end
Because we remained excited about the dynamics and innovation within the health care sector, we increased the Fund’s exposure to health care by reducing exposure to utilities and trimming positions in banks given that industry’s significant outperformance in 2016. Overall, we continued to maintain our discipline in executing a high-quality, pure small-cap value strategy for our shareholders. We believed that over a full market cycle, strong companies with good growth prospects, strong balance sheets and cash flow have the potential to outperform.
Market risk may affect a single issuer, sector of the economy, industry or the market as a whole. Foreign investments subject the Fund to risks, including political, economic, market, social and others within a particular country, as well as to currency instabilities and less stringent financial and accounting standards generally applicable to U.S. issuers. Investments in small-cap companies may be subject to greater volatility and price fluctuations because they may be thinly traded and less liquid. Value securities may be unprofitable if the market fails to recognize their intrinsic worth or the portfolio manager misgauged that worth. The Fund may invest significantly in issuers within a particular sector, which may be negatively affected by market, economic or other conditions, making the Fund more vulnerable to unfavorable developments in the sector. See the Fund’s prospectus for more information on these and other risks.
The views expressed in this report reflect the current views of the respective parties. These views are not guarantees of future performance and involve certain risks, uncertainties and assumptions that are difficult to predict, so actual outcomes and results may differ significantly from the views expressed. These views are subject to change at any time based upon economic, market or other conditions and the respective parties disclaim any responsibility to update such views. These views may not be relied on as investment advice and, because investment decisions for a Columbia fund are based on numerous factors, may not be relied on as an indication of trading intent on behalf of any particular Columbia fund. References to specific securities should not be construed as a recommendation or investment advice.
| 6 | Columbia Small Cap Value Fund I | Annual Report 2017 |
Understanding Your Fund’s Expenses
(Unaudited)
As an investor, you incur two types of costs. There are transaction costs, which generally include sales charges on purchases and may include redemption fees. There are also ongoing costs, which generally include management fees, distribution and/or service fees, and other fund expenses. The following information is intended to help you understand your ongoing costs (in dollars) of investing in the Fund and to help you compare these costs with the ongoing costs of investing in other mutual funds.
Analyzing your Fund’s expenses
To illustrate these ongoing costs, we have provided examples and calculated the expenses paid by investors in each share class of the Fund during the period. The actual and hypothetical information in the table is based on an initial investment of $1,000 at the beginning of the period indicated and held for the entire period. Expense information is calculated two ways and each method provides you with different information. The amount listed in the “Actual” column is calculated using the Fund’s actual operating expenses and total return for the period. You may use the Actual information, together with the amount invested, to estimate the expenses that you paid over the period. Simply divide your account value by $1,000 (for example, an $8,600 account value divided by $1,000 = 8.6), then multiply the results by the expenses paid during the period under the “Actual” column. The amount listed in the “Hypothetical” column assumes a 5% annual rate of return before expenses (which is not the Fund’s actual return) and then applies the Fund’s actual expense ratio for the period to the hypothetical return. You should not use the hypothetical account values and expenses to estimate either your actual account balance at the end of the period or the expenses you paid during the period. See “Compare with other funds” below for details on how to use the hypothetical data.
Compare with other funds
Since all mutual funds are required to include the same hypothetical calculations about expenses in shareholder reports, you can use this information to compare the ongoing cost of investing in the Fund with other funds. To do so, compare the hypothetical example with the 5% hypothetical examples that appear in the shareholder reports of other funds. As you compare hypothetical examples of other funds, it is important to note that hypothetical examples are meant to highlight the ongoing costs of investing in a fund only and do not reflect any transaction costs, such as sales charges, or redemption or exchange fees. Therefore, the hypothetical calculations are useful in comparing ongoing costs only, and will not help you determine the relative total costs of owning different funds. If transaction costs were included in these calculations, your costs would be higher.
| November 1, 2016 — April 30, 2017 |
| | Account value at the
beginning of the
period ($) | Account value at the
end of the
period ($) | Expenses paid during
the period ($) | Fund’s annualized
expense ratio (%) |
| | Actual | Hypothetical | Actual | Hypothetical | Actual | Hypothetical | Actual |
| Class A | 1,000.00 | 1,000.00 | 1,201.20 | 1,017.80 | 7.39 | 6.78 | 1.37 |
| Class B | 1,000.00 | 1,000.00 | 1,196.50 | 1,014.12 | 11.42 | 10.47 | 2.12 |
| Class C | 1,000.00 | 1,000.00 | 1,196.50 | 1,014.12 | 11.42 | 10.47 | 2.12 |
| Class R | 1,000.00 | 1,000.00 | 1,199.60 | 1,016.58 | 8.74 | 8.01 | 1.62 |
| Class R4 | 1,000.00 | 1,000.00 | 1,202.50 | 1,019.03 | 6.05 | 5.54 | 1.12 |
| Class R5 | 1,000.00 | 1,000.00 | 1,203.50 | 1,019.76 | 5.24 | 4.80 | 0.97 |
| Class Y | 1,000.00 | 1,000.00 | 1,203.90 | 1,019.96 | 5.03 | 4.61 | 0.93 |
| Class Z | 1,000.00 | 1,000.00 | 1,202.80 | 1,019.03 | 6.05 | 5.54 | 1.12 |
Expenses paid during the period are equal to the annualized expense ratio for each class as indicated above, multiplied by the average account value over the period and then multiplied by the number of days in the Fund’s most recent fiscal half year and divided by 365.
Expenses do not include fees and expenses incurred indirectly by the Fund from its investment in underlying funds, including affiliated and non-affiliated pooled investment vehicles, such as mutual funds and exchange-traded funds.
Had Columbia Management Investment Advisers, LLC and/or certain of its affiliates not waived/reimbursed certain fees and expenses, account value at the end of the period would have been reduced.
The Fund’s annualized expense ratio excludes the impact of an expense reimbursement from a third party due to overbilling.
Columbia Small Cap Value Fund I | Annual Report 2017
| 7 |
Portfolio of Investments
April 30, 2017
(Percentages represent value of investments compared to net assets)
| Common Stocks 99.8% |
| Issuer | Shares | Value ($) |
| Consumer Discretionary 11.2% |
| Auto Components 2.5% |
| Cooper Tire & Rubber Co. | 136,436 | 5,225,499 |
| Gentherm, Inc.(a) | 74,216 | 2,757,124 |
| Modine Manufacturing Co.(a) | 219,517 | 2,656,156 |
| Visteon Corp.(a) | 38,200 | 3,932,690 |
| Total | | 14,571,469 |
| Automobiles 0.4% |
| Winnebago Industries, Inc. | 86,783 | 2,490,672 |
| Hotels, Restaurants & Leisure 0.2% |
| Marcus Corp. (The) | 37,220 | 1,258,036 |
| Household Durables 2.3% |
| Cavco Industries, Inc.(a) | 25,127 | 2,983,831 |
| Ethan Allen Interiors, Inc. | 96,830 | 2,885,534 |
| Hooker Furniture Corp. | 59,370 | 2,579,627 |
| Lifetime Brands, Inc. | 118,167 | 2,268,806 |
| UCP, Inc., Class A(a) | 244,800 | 2,802,960 |
| Total | | 13,520,758 |
| Leisure Products 0.9% |
| Johnson Outdoors, Inc., Class A | 64,576 | 2,345,400 |
| Malibu Boats, Inc., Class A(a) | 139,542 | 3,215,048 |
| Total | | 5,560,448 |
| Media 1.2% |
| AMC Entertainment Holdings, Inc., Class A | 153,381 | 4,647,444 |
| Lions Gate Entertainment Corp. | 72,782 | 1,904,705 |
| Lions Gate Entertainment Corp., Class B(a) | 27,619 | 658,713 |
| Total | | 7,210,862 |
| Multiline Retail 0.5% |
| Hudson’s Bay Co. | 286,926 | 2,623,227 |
| Specialty Retail 1.5% |
| Aaron’s, Inc. | 133,501 | 4,798,026 |
| DSW, Inc., Class A | 102,260 | 2,108,601 |
| Sally Beauty Holdings, Inc.(a) | 111,370 | 2,118,258 |
| Total | | 9,024,885 |
| Common Stocks (continued) |
| Issuer | Shares | Value ($) |
| Textiles, Apparel & Luxury Goods 1.7% |
| Deckers Outdoor Corp.(a) | 53,499 | 3,188,005 |
| Oxford Industries, Inc. | 33,155 | 1,922,327 |
| Skechers U.S.A., Inc., Class A(a) | 112,010 | 2,828,253 |
| Steven Madden Ltd.(a) | 55,285 | 2,103,594 |
| Total | | 10,042,179 |
| Total Consumer Discretionary | 66,302,536 |
| Consumer Staples 2.7% |
| Beverages 0.4% |
| Boston Beer Co., Inc. (The), Class A(a) | 15,400 | 2,222,990 |
| Food & Staples Retailing 0.6% |
| Andersons, Inc. (The) | 93,230 | 3,482,141 |
| Food Products 1.2% |
| Fresh Del Monte Produce, Inc. | 74,926 | 4,592,964 |
| Sanderson Farms, Inc. | 25,400 | 2,940,812 |
| Total | | 7,533,776 |
| Personal Products 0.5% |
| Inter Parfums, Inc. | 73,972 | 2,807,237 |
| Total Consumer Staples | 16,046,144 |
| Energy 7.0% |
| Energy Equipment & Services 1.8% |
| Aspen Aerogels, Inc.(a) | 485,490 | 1,971,089 |
| C&J Energy Services, Inc.(a) | 97,969 | 2,861,674 |
| CARBO Ceramics, Inc.(a) | 218,631 | 1,501,995 |
| Dawson Geophysical Co.(a) | 183,552 | 923,267 |
| Geospace Technologies Corp.(a) | 81,757 | 1,352,261 |
| Natural Gas Services Group, Inc.(a) | 82,811 | 2,269,021 |
| Total | | 10,879,307 |
| Oil, Gas & Consumable Fuels 5.2% |
| Alon USA Energy, Inc. | 261,259 | 3,158,621 |
| Callon Petroleum Co.(a) | 281,341 | 3,331,078 |
| Carrizo Oil & Gas, Inc.(a) | 129,120 | 3,247,368 |
| Cobalt International Energy, Inc.(a) | 2,315,376 | 905,544 |
| Contango Oil & Gas Co.(a) | 224,694 | 1,608,809 |
| CVR Energy, Inc. | 67,670 | 1,481,296 |
| Earthstone Energy, Inc.(a) | 148,326 | 1,997,951 |
| Eclipse Resources Corp.(a) | 776,382 | 1,560,528 |
| Jagged Peak Energy, Inc.(a) | 212,721 | 2,369,712 |
The accompanying Notes to Financial Statements are an integral part of this statement.
| 8 | Columbia Small Cap Value Fund I | Annual Report 2017 |
Portfolio of Investments (continued)
April 30, 2017
| Common Stocks (continued) |
| Issuer | Shares | Value ($) |
| Jones Energy, Inc., Class A(a) | 611,265 | 1,222,530 |
| Sanchez Energy Corp.(a) | 303,060 | 2,345,684 |
| SM Energy Co. | 111,790 | 2,525,336 |
| SRC Energy, Inc.(a) | 374,875 | 2,826,558 |
| WildHorse Resource Development Corp.(a) | 178,630 | 1,948,853 |
| Total | | 30,529,868 |
| Total Energy | 41,409,175 |
| Financials 31.9% |
| Banks 16.5% |
| BancFirst Corp. | 43,812 | 4,208,143 |
| BankUnited, Inc. | 129,906 | 4,584,383 |
| Banner Corp. | 92,471 | 5,104,399 |
| Boston Private Financial Holdings, Inc. | 303,537 | 4,735,177 |
| Bridge Bancorp, Inc. | 76,697 | 2,780,266 |
| Brookline Bancorp, Inc. | 255,063 | 3,711,167 |
| Capital City Bank Group, Inc. | 143,309 | 2,953,598 |
| Centerstate Banks, Inc. | 201,309 | 5,079,026 |
| Columbia Banking System, Inc. | 120,293 | 4,752,776 |
| Community Trust Bancorp, Inc. | 63,237 | 2,842,503 |
| FCB Financial Holdings, Inc., Class A(a) | 106,833 | 5,047,859 |
| First Citizens BancShares Inc., Class A | 12,727 | 4,429,760 |
| First Financial Corp. | 65,310 | 3,187,128 |
| First NBC Bank Holding Co.(a) | 548,385 | 1,453,220 |
| First of Long Island Corp. (The) | 109,360 | 2,974,592 |
| Heritage Financial Corp. | 69,253 | 1,828,279 |
| Investors Bancorp, Inc. | 330,432 | 4,576,483 |
| National Bank Holdings Corp., Class A | 108,520 | 3,425,976 |
| Northrim BanCorp, Inc. | 151,551 | 4,849,632 |
| Sierra Bancorp | 60,142 | 1,507,760 |
| Synovus Financial Corp. | 56,550 | 2,363,790 |
| Towne Bank | 176,620 | 5,731,319 |
| UMB Financial Corp. | 90,750 | 6,578,468 |
| Union Bankshares Corp. | 106,574 | 3,649,094 |
| Webster Financial Corp. | 108,450 | 5,510,345 |
| Total | | 97,865,143 |
| Common Stocks (continued) |
| Issuer | Shares | Value ($) |
| Capital Markets 1.7% |
| GAIN Capital Holdings, Inc. | 416,450 | 2,952,631 |
| INTL FCStone, Inc.(a) | 109,140 | 4,076,379 |
| Moelis & Co., ADR, Class A | 74,092 | 2,719,176 |
| Total | | 9,748,186 |
| Consumer Finance 1.0% |
| Enova International, Inc.(a) | 103,642 | 1,471,716 |
| FirstCash, Inc. | 86,508 | 4,494,091 |
| Total | | 5,965,807 |
| Diversified Financial Services 0.4% |
| Pico Holdings, Inc.(a) | 153,817 | 2,476,454 |
| Insurance 6.8% |
| American Equity Investment Life Holding Co. | 260,540 | 6,180,009 |
| Baldwin & Lyons, Inc., Class B | 92,341 | 2,262,354 |
| EMC Insurance Group, Inc. | 87,551 | 2,510,963 |
| Employers Holdings, Inc. | 108,924 | 4,356,960 |
| FBL Financial Group, Inc., Class A | 62,116 | 4,130,714 |
| Global Indemnity Ltd(a) | 54,468 | 2,208,677 |
| Heritage Insurance Holdings, Inc. | 233,366 | 2,823,729 |
| Horace Mann Educators Corp. | 72,241 | 2,792,115 |
| National Western Life Group, Inc., Class A | 17,124 | 5,244,054 |
| Navigators Group, Inc. (The) | 74,930 | 4,049,966 |
| United Fire Group, Inc. | 79,430 | 3,494,920 |
| Total | | 40,054,461 |
| Mortgage Real Estate Investment Trusts (REITS) 0.6% |
| Altisource Residential Corp. | 248,699 | 3,576,292 |
| Thrifts & Mortgage Finance 4.9% |
| HomeStreet, Inc.(a) | 141,458 | 3,677,908 |
| MGIC Investment Corp.(a) | 606,530 | 6,392,826 |
| Provident Financial Holdings, Inc. | 83,010 | 1,596,282 |
| Radian Group, Inc. | 359,120 | 6,061,946 |
| Washington Federal, Inc. | 141,263 | 4,760,563 |
| Western New England Bancorp, Inc. | 323,879 | 3,400,730 |
| WSFS Financial Corp. | 68,872 | 3,250,758 |
| Total | | 29,141,013 |
| Total Financials | 188,827,356 |
The accompanying Notes to Financial Statements are an integral part of this statement.
Columbia Small Cap Value Fund I | Annual Report 2017
| 9 |
Portfolio of Investments (continued)
April 30, 2017
| Common Stocks (continued) |
| Issuer | Shares | Value ($) |
| Health Care 10.6% |
| Biotechnology 5.3% |
| ACADIA Pharmaceuticals, Inc.(a) | 89,794 | 3,082,628 |
| bluebird bio, Inc.(a) | 42,520 | 3,782,154 |
| Coherus Biosciences, Inc.(a) | 156,863 | 3,011,770 |
| Dynavax Technologies Corp.(a) | 451,831 | 2,507,662 |
| Eagle Pharmaceuticals, Inc.(a) | 34,909 | 3,162,406 |
| Exelixis, Inc.(a) | 53,352 | 1,195,085 |
| Juno Therapeutics, Inc.(a) | 112,281 | 2,800,288 |
| Keryx Biopharmaceuticals, Inc.(a) | 291,107 | 1,723,353 |
| Momenta Pharmaceuticals, Inc.(a) | 151,548 | 2,174,714 |
| Novavax, Inc.(a) | 1,189,487 | 970,740 |
| OncoMed Pharmaceuticals, Inc.(a) | 318,393 | 1,254,468 |
| Puma Biotechnology, Inc.(a) | 58,406 | 2,371,284 |
| Spark Therapeutics, Inc.(a) | 53,340 | 3,092,120 |
| Total | | 31,128,672 |
| Health Care Equipment & Supplies 1.6% |
| Alere, Inc.(a) | 98,800 | 4,857,996 |
| Quotient Ltd.(a) | 261,876 | 1,783,376 |
| Sientra, Inc.(a) | 355,516 | 2,986,334 |
| Total | | 9,627,706 |
| Life Sciences Tools & Services 0.3% |
| PAREXEL International Corp.(a) | 30,180 | 1,926,390 |
| Pharmaceuticals 3.4% |
| Aerie Pharmaceuticals, Inc.(a) | 51,480 | 2,267,694 |
| Akorn, Inc.(a) | 118,312 | 3,957,536 |
| BioDelivery Sciences International, Inc.(a) | 1,266,243 | 2,310,893 |
| Flex Pharma, Inc.(a) | 44,183 | 151,990 |
| Impax Laboratories, Inc.(a) | 278,560 | 3,913,768 |
| Lannett Co., Inc.(a) | 82,610 | 2,147,860 |
| Pacira Pharmaceuticals, Inc.(a) | 50,582 | 2,455,756 |
| Supernus Pharmaceuticals, Inc.(a) | 85,271 | 2,779,835 |
| Total | | 19,985,332 |
| Total Health Care | 62,668,100 |
| Common Stocks (continued) |
| Issuer | Shares | Value ($) |
| Industrials 12.7% |
| Building Products 1.0% |
| Simpson Manufacturing Co., Inc. | 80,524 | 3,358,656 |
| Universal Forest Products, Inc. | 29,743 | 2,834,211 |
| Total | | 6,192,867 |
| Commercial Services & Supplies 0.7% |
| Unifirst Corp. | 28,815 | 4,011,048 |
| Construction & Engineering 0.4% |
| Northwest Pipe Co.(a) | 189,905 | 2,660,569 |
| Electrical Equipment 1.1% |
| Encore Wire Corp. | 81,446 | 3,599,913 |
| General Cable Corp. | 159,900 | 2,878,200 |
| Total | | 6,478,113 |
| Industrial Conglomerates 0.5% |
| Raven Industries, Inc. | 89,830 | 2,784,730 |
| Machinery 6.7% |
| Albany International Corp., Class A | 80,041 | 3,901,999 |
| Altra Industrial Motion Corp. | 87,726 | 3,873,103 |
| DMC Global Inc | 179,407 | 2,744,927 |
| EnPro Industries, Inc. | 45,426 | 3,209,347 |
| Gorman-Rupp Co. | 76,875 | 2,200,162 |
| Hardinge, Inc. | 68,342 | 717,591 |
| Kadant, Inc. | 36,337 | 2,258,345 |
| LB Foster Co., Class A | 185,487 | 2,633,915 |
| Lydall, Inc.(a) | 64,953 | 3,403,537 |
| Mueller Industries, Inc. | 121,132 | 3,881,069 |
| Standex International Corp. | 40,244 | 3,780,924 |
| Titan International, Inc. | 270,084 | 2,892,600 |
| Wabash National Corp. | 182,600 | 4,159,628 |
| Total | | 39,657,147 |
| Professional Services 0.4% |
| TrueBlue, Inc.(a) | 93,717 | 2,563,160 |
| Road & Rail 0.7% |
| Heartland Express, Inc. | 71,380 | 1,436,165 |
| Werner Enterprises, Inc. | 92,299 | 2,519,763 |
| Total | | 3,955,928 |
The accompanying Notes to Financial Statements are an integral part of this statement.
| 10 | Columbia Small Cap Value Fund I | Annual Report 2017 |
Portfolio of Investments (continued)
April 30, 2017
| Common Stocks (continued) |
| Issuer | Shares | Value ($) |
| Trading Companies & Distributors 1.2% |
| CAI International, Inc.(a) | 139,666 | 2,879,913 |
| Houston Wire & Cable Co. | 202,506 | 1,265,662 |
| Textainer Group Holdings Ltd. | 180,659 | 2,700,852 |
| Total | | 6,846,427 |
| Total Industrials | 75,149,989 |
| Information Technology 9.4% |
| Communications Equipment 0.4% |
| Digi International, Inc.(a) | 180,738 | 2,241,151 |
| Electronic Equipment, Instruments & Components 2.2% |
| AVX Corp. | 200,162 | 3,384,739 |
| Benchmark Electronics, Inc.(a) | 128,590 | 4,076,303 |
| MTS Systems Corp. | 42,537 | 1,975,844 |
| OSI Systems, Inc.(a) | 49,430 | 3,825,882 |
| Total | | 13,262,768 |
| Internet Software & Services 1.0% |
| Criteo SA, ADR(a) | 18,720 | 1,018,181 |
| WebMD Health Corp.(a) | 87,949 | 4,769,474 |
| Total | | 5,787,655 |
| IT Services 1.2% |
| Mantech International Corp., Class A | 108,697 | 3,858,744 |
| TeleTech Holdings, Inc. | 101,777 | 3,180,531 |
| Total | | 7,039,275 |
| Semiconductors & Semiconductor Equipment 3.3% |
| Entegris, Inc.(a) | 194,812 | 4,831,338 |
| IXYS Corp. | 195,700 | 2,730,015 |
| MACOM Technology Solutions Holdings, Inc.(a) | 104,891 | 5,127,072 |
| Silicon Laboratories, Inc.(a) | 29,768 | 2,117,993 |
| Synaptics, Inc.(a) | 84,616 | 4,634,418 |
| Total | | 19,440,836 |
| Software 0.8% |
| MicroStrategy, Inc., Class A(a) | 11,900 | 2,263,023 |
| Silver Spring Networks, Inc.(a) | 211,140 | 2,409,108 |
| Total | | 4,672,131 |
| Technology Hardware, Storage & Peripherals 0.5% |
| Stratasys Ltd.(a) | 125,324 | 3,103,022 |
| Total Information Technology | 55,546,838 |
| Common Stocks (continued) |
| Issuer | Shares | Value ($) |
| Materials 6.2% |
| Chemicals 1.9% |
| Flotek Industries, Inc.(a) | 192,630 | 2,313,486 |
| Olin Corp. | 154,220 | 4,955,089 |
| Tronox Ltd., Class A | 242,337 | 4,000,984 |
| Total | | 11,269,559 |
| Containers & Packaging 0.5% |
| Greif, Inc., Class A | 47,279 | 2,771,495 |
| Metals & Mining 3.0% |
| Allegheny Technologies, Inc. | 171,447 | 3,146,052 |
| Capstone Mining Corp.(a) | 92,514 | 71,840 |
| Commercial Metals Co. | 197,710 | 3,685,314 |
| Ferroglobe PLC | 432,401 | 4,172,670 |
| Olympic Steel, Inc. | 37,601 | 847,903 |
| TimkenSteel Corp.(a) | 149,280 | 2,251,142 |
| Universal Stainless & Alloy Products, Inc.(a) | 195,658 | 3,531,627 |
| Total | | 17,706,548 |
| Paper & Forest Products 0.8% |
| Louisiana-Pacific Corp.(a) | 195,088 | 5,021,565 |
| Total Materials | 36,769,167 |
| Real Estate 5.8% |
| Equity Real Estate Investment Trusts (REITS) 5.8% |
| Chesapeake Lodging Trust | 228,714 | 5,331,323 |
| CoreCivic, Inc. | 59,370 | 2,045,297 |
| EastGroup Properties, Inc. | 37,358 | 2,923,263 |
| GEO Group, Inc. (The) | 93,120 | 3,102,758 |
| Getty Realty Corp. | 107,620 | 2,755,072 |
| National Health Investors, Inc. | 27,780 | 2,032,663 |
| Pebblebrook Hotel Trust | 176,580 | 5,255,021 |
| Potlatch Corp. | 80,916 | 3,645,266 |
| Sunstone Hotel Investors, Inc. | 514,755 | 7,664,702 |
| Total | | 34,755,365 |
| Total Real Estate | 34,755,365 |
| Telecommunication Services 1.0% |
| Diversified Telecommunication Services 0.3% |
| magicJack VocalTec Ltd.(a) | 176,673 | 1,448,719 |
The accompanying Notes to Financial Statements are an integral part of this statement.
Columbia Small Cap Value Fund I | Annual Report 2017
| 11 |
Portfolio of Investments (continued)
April 30, 2017
| Common Stocks (continued) |
| Issuer | Shares | Value ($) |
| Wireless Telecommunication Services 0.7% |
| Shenandoah Telecommunications Co. | 133,976 | 4,287,232 |
| Total Telecommunication Services | 5,735,951 |
| Utilities 1.3% |
| Gas Utilities 1.1% |
| Chesapeake Utilities Corp. | 13,784 | 1,010,367 |
| Northwest Natural Gas Co. | 26,263 | 1,565,275 |
| Southwest Gas Corp. | 46,715 | 3,912,848 |
| Total | | 6,488,490 |
| Water Utilities 0.2% |
| Consolidated Water Co., Ltd. | 118,319 | 1,396,164 |
| Total Utilities | 7,884,654 |
Total Common Stocks
(Cost $379,685,801) | 591,095,275 |
|
| Money Market Funds 0.6% |
| | Shares | Value ($) |
| Columbia Short-Term Cash Fund, 0.869%(b),(c) | 3,566,306 | 3,566,306 |
Total Money Market Funds
(Cost $3,566,072) | 3,566,306 |
Total Investments
(Cost: $383,251,873) | 594,661,581 |
| Other Assets & Liabilities, Net | | (2,143,555) |
| Net Assets | 592,518,026 |
Notes to Portfolio of Investments
| (a) | Non-income producing investment. |
| (b) | The rate shown is the seven-day current annualized yield at April 30, 2017. |
| (c) | As defined in the Investment Company Act of 1940, an affiliated company is one in which the Fund owns 5% or more of the company’s outstanding voting securities, or a company which is under common ownership or control with the Fund. Holdings and transactions in these affiliated companies during the year ended April 30, 2017 are as follows: |
| Issuer | Beginning
shares | Shares
purchased | Shares
sold | Ending
shares | Realized gain
(loss) ($) | Dividends —
affiliated
issuers($) | Value ($) |
| Columbia Short-Term Cash Fund, 0.869% | 10,221,763 | 133,895,824 | (140,551,281) | 3,566,306 | 997 | 28,519 | 3,566,306 |
Abbreviation Legend
| ADR | American Depositary Receipt |
Fair value measurements
The Fund categorizes its fair value measurements according to a three-level hierarchy that maximizes the use of observable inputs and minimizes the use of unobservable inputs by prioritizing that the most observable input be used when available. Observable inputs are those that market participants would use in pricing an investment based on market data obtained from sources independent of the reporting entity. Unobservable inputs are those that reflect the Fund’s assumptions about the information market participants would use in pricing an investment. An investment’s level within the fair value hierarchy is based on the lowest level of any input that is deemed significant to the asset’s or liability’s fair value measurement. The input levels are not necessarily an indication of the risk or liquidity associated with investments at that level. For example, certain U.S. government securities are generally high quality and liquid, however, they are reflected as Level 2 because the inputs used to determine fair value may not always be quoted prices in an active market.
Fair value inputs are summarized in the three broad levels listed below:
| • | Level 1 – Valuations based on quoted prices for investments in active markets that the Fund has the ability to access at the measurement date (including NAV for open-end mutual funds). Valuation adjustments are not applied to Level 1 investments. |
| • | Level 2 – Valuations based on other significant observable inputs (including quoted prices for similar securities, interest rates, prepayment speeds, credit risks, etc.). |
| • | Level 3 – Valuations based on significant unobservable inputs (including the Fund’s own assumptions and judgment in determining the fair value of investments). |
Inputs that are used in determining fair value of an investment may include price information, credit data, volatility statistics, and other factors. These inputs can be either observable or unobservable. The availability of observable inputs can vary between investments, and is affected by various factors such as the type of investment, and the volume and level of activity for that investment or similar investments in the marketplace. The inputs will be considered by the Investment Manager, along with any other relevant factors in the calculation of an investment’s fair value. The Fund uses prices and inputs that are current as of the measurement date, which may include periods of market dislocations. During these periods, the availability of prices and inputs may be reduced for many investments. This condition could cause an investment to be reclassified between the various levels within the hierarchy.
The accompanying Notes to Financial Statements are an integral part of this statement.
| 12 | Columbia Small Cap Value Fund I | Annual Report 2017 |
Portfolio of Investments (continued)
April 30, 2017
Fair value measurements (continued)
Certain investments that have been measured at fair value using the net asset value (NAV) per share (or its equivalent) are not categorized in the fair value hierarchy. The fair value amounts presented in the table are intended to reconcile the fair value hierarchy to the amounts presented in the Portfolio of Investments. The Columbia Short-Term Cash Fund seeks to provide shareholders with maximum current income consistent with liquidity and stability of principal. Columbia Short-Term Cash Fund prices its shares with a floating NAV and no longer seeks to maintain a stable NAV.
Investments falling into the Level 3 category are primarily supported by quoted prices from brokers and dealers participating in the market for those investments. However, these may be classified as Level 3 investments due to lack of market transparency and corroboration to support these quoted prices. Additionally, valuation models may be used as the pricing source for any remaining investments classified as Level 3. These models may rely on one or more significant unobservable inputs and/or significant assumptions by the Investment Manager. Inputs used in valuations may include, but are not limited to, financial statement analysis, capital account balances, discount rates and estimated cash flows, and comparable company data.
Under the direction of the Fund’s Board of Trustees (the Board), the Investment Manager’s Valuation Committee (the Committee) is responsible for overseeing the valuation procedures approved by the Board. The Committee consists of voting and non-voting members from various groups within the Investment Manager’s organization, including operations and accounting, trading and investments, compliance, risk management and legal.
The Committee meets at least monthly to review and approve valuation matters, which may include a description of specific valuation determinations, data regarding pricing information received from approved pricing vendors and brokers and the results of Board-approved valuation control policies and procedures (the Policies). The Policies address, among other things, instances when market quotations are or are not readily available, including recommendations of third party pricing vendors and a determination of appropriate pricing methodologies; events that require specific valuation determinations and assessment of fair value techniques; securities with a potential for stale pricing, including those that are illiquid, restricted, or in default; and the effectiveness of third party pricing vendors, including periodic reviews of vendors. The Committee meets more frequently, as needed, to discuss additional valuation matters, which may include the need to review back-testing results, review time-sensitive information or approve related valuation actions. The Committee reports to the Board, with members of the Committee meeting with the Board at each of its regularly scheduled meetings to discuss valuation matters and actions during the period, similar to those described earlier.
For investments categorized as Level 3, the Committee monitors information similar to that described above, which may include: (i) data specific to the issuer or comparable issuers, (ii) general market or specific sector news and (iii) quoted prices and specific or similar security transactions. The Committee considers this data and any changes from prior periods in order to assess the reasonableness of observable and unobservable inputs, any assumptions or internal models used to value those securities and changes in fair value. This data is also used to corroborate, when available, information received from approved pricing vendors and brokers. Various factors impact the frequency of monitoring this information (which may occur as often as daily). However, the Committee may determine that changes to inputs, assumptions and models are not required as a result of the monitoring procedures performed.
The following table is a summary of the inputs used to value the Fund’s investments at April 30, 2017:
| | Level 1
quoted prices
in active
markets for
identical
assets ($) | Level 2
other
significant
observable
inputs ($) | Level 3
significant
unobservable
inputs ($) | Investments
measured at
net asset
value ($) | Total ($) |
| Investments | | | | | |
| Common Stocks | | | | | |
| Consumer Discretionary | 66,302,536 | — | — | — | 66,302,536 |
| Consumer Staples | 16,046,144 | — | — | — | 16,046,144 |
| Energy | 41,409,175 | — | — | — | 41,409,175 |
| Financials | 188,827,356 | — | — | — | 188,827,356 |
| Health Care | 62,668,100 | — | — | — | 62,668,100 |
| Industrials | 75,149,989 | — | — | — | 75,149,989 |
| Information Technology | 55,546,838 | — | — | — | 55,546,838 |
| Materials | 36,769,167 | — | — | — | 36,769,167 |
| Real Estate | 34,755,365 | — | — | — | 34,755,365 |
| Telecommunication Services | 5,735,951 | — | — | — | 5,735,951 |
| Utilities | 7,884,654 | — | — | — | 7,884,654 |
| Total Common Stocks | 591,095,275 | — | — | — | 591,095,275 |
| Money Market Funds | — | — | — | 3,566,306 | 3,566,306 |
| Total Investments | 591,095,275 | — | — | 3,566,306 | 594,661,581 |
See the Portfolio of Investments for all investment classifications not indicated in the table.
There were no transfers of financial assets between levels during the period.
The accompanying Notes to Financial Statements are an integral part of this statement.
Columbia Small Cap Value Fund I | Annual Report 2017
| 13 |
Statement of Assets and Liabilities
April 30, 2017
| Assets | |
| Investments, at cost | |
| Unaffiliated issuers, at cost | $379,685,801 |
| Affiliated issuers, at cost | 3,566,072 |
| Total investments, at cost | 383,251,873 |
| Investments, at value | |
| Unaffiliated issuers, at value | 591,095,275 |
| Affiliated issuers, at value | 3,566,306 |
| Total investments, at value | 594,661,581 |
| Receivable for: | |
| Investments sold | 919,794 |
| Capital shares sold | 615,158 |
| Dividends | 78,631 |
| Foreign tax reclaims | 3,542 |
| Expense reimbursement due from Investment Manager | 1,076 |
| Prepaid expenses | 1,082 |
| Trustees’ deferred compensation plan | 117,872 |
| Total assets | 596,398,736 |
| Liabilities | |
| Due to custodian | 456,102 |
| Payable for: | |
| Investments purchased | 2,477,846 |
| Capital shares purchased | 565,902 |
| Management services fees | 14,161 |
| Distribution and/or service fees | 2,488 |
| Transfer agent fees | 185,437 |
| Compensation of chief compliance officer | 23 |
| Other expenses | 60,879 |
| Trustees’ deferred compensation plan | 117,872 |
| Total liabilities | 3,880,710 |
| Net assets applicable to outstanding capital stock | $592,518,026 |
| Represented by | |
| Paid in capital | 349,447,641 |
| Excess of distributions over net investment income | (117,872) |
| Accumulated net realized gain | 31,779,292 |
| Unrealized appreciation (depreciation) on: | |
| Investments - unaffiliated issuers | 211,409,474 |
| Investments - affiliated issuers | 234 |
| Foreign currency translations | (743) |
| Total - representing net assets applicable to outstanding capital stock | $592,518,026 |
The accompanying Notes to Financial Statements are an integral part of this statement.
| 14 | Columbia Small Cap Value Fund I | Annual Report 2017 |
Statement of Assets and Liabilities (continued)
April 30, 2017
| Class A | |
| Net assets | $245,314,988 |
| Shares outstanding | 5,893,825 |
| Net asset value per share | $41.62 |
| Maximum offering price per share(a) | $44.16 |
| Class B | |
| Net assets | $128,320 |
| Shares outstanding | 4,895 |
| Net asset value per share | $26.21 |
| Class C | |
| Net assets | $26,703,177 |
| Shares outstanding | 894,203 |
| Net asset value per share | $29.86 |
| Class R | |
| Net assets | $3,031,785 |
| Shares outstanding | 72,829 |
| Net asset value per share | $41.63 |
| Class R4 | |
| Net assets | $4,728,830 |
| Shares outstanding | 100,842 |
| Net asset value per share | $46.89 |
| Class R5 | |
| Net assets | $9,134,555 |
| Shares outstanding | 194,839 |
| Net asset value per share | $46.88 |
| Class Y | |
| Net assets | $64,230,086 |
| Shares outstanding | 1,400,582 |
| Net asset value per share | $45.86 |
| Class Z | |
| Net assets | $239,246,285 |
| Shares outstanding | 5,235,671 |
| Net asset value per share | $45.70 |
| (a) | The maximum offering price per share is calculated by dividing the net asset value per share by 1.0 minus the maximum sales charge of 5.75% for Class A. |
The accompanying Notes to Financial Statements are an integral part of this statement.
Columbia Small Cap Value Fund I | Annual Report 2017
| 15 |
Statement of Operations
Year Ended April 30, 2017
| Net investment income | |
| Income: | |
| Dividends — unaffiliated issuers | $8,678,637 |
| Dividends — affiliated issuers | 28,519 |
| Foreign taxes withheld | (2,279) |
| Total income | 8,704,877 |
| Expenses: | |
| Management services fees | 5,104,454 |
| Distribution and/or service fees | |
| Class A | 615,253 |
| Class B | 5,759 |
| Class C | 272,557 |
| Class R | 14,605 |
| Transfer agent fees | |
| Class A | 534,886 |
| Class B | 1,208 |
| Class C | 59,215 |
| Class I(a) | 1,505 |
| Class R | 6,358 |
| Class R4 | 9,835 |
| Class R5 | 4,323 |
| Class Y | 781 |
| Class Z | 511,311 |
| Compensation of board members | 27,631 |
| Custodian fees | 11,628 |
| Printing and postage fees | 66,438 |
| Registration fees | 121,686 |
| Audit fees | 39,034 |
| Legal fees | 14,204 |
| Line of credit interest expense | 667 |
| Compensation of chief compliance officer | 234 |
| Other | 5,977 |
| Total expenses | 7,429,549 |
| Fees waived or expenses reimbursed by Investment Manager and its affiliates | (43,690) |
| Expense reduction | (3,047) |
| Total net expenses | 7,382,812 |
| Net investment income | 1,322,065 |
| Realized and unrealized gain (loss) — net | |
| Net realized gain (loss) on: | |
| Investments — unaffiliated issuers | 77,114,707 |
| Investments — affiliated issuers | 997 |
| Foreign currency translations | (2,602) |
| Net realized gain | 77,113,102 |
| Net change in unrealized appreciation (depreciation) on: | |
| Investments — unaffiliated issuers | 57,799,106 |
| Investments — affiliated issuers | 234 |
| Foreign currency translations | (236) |
| Net change in unrealized appreciation (depreciation) | 57,799,104 |
| Net realized and unrealized gain | 134,912,206 |
| Net increase in net assets resulting from operations | $136,234,271 |
| (a) | Effective March 27, 2017, Class I shares were redeemed or exchanged for Class Y shares. |
The accompanying Notes to Financial Statements are an integral part of this statement.
| 16 | Columbia Small Cap Value Fund I | Annual Report 2017 |
Statement of Changes in Net Assets
| | Year Ended
April 30, 2017 | Year Ended
April 30, 2016 |
| Operations | | |
| Net investment income | $1,322,065 | $3,433,330 |
| Net realized gain | 77,113,102 | 92,215,898 |
| Net change in unrealized appreciation (depreciation) | 57,799,104 | (149,291,935) |
| Net increase (decrease) in net assets resulting from operations | 136,234,271 | (53,642,707) |
| Distributions to shareholders | | |
| Net investment income | | |
| Class A | (402,914) | (778,172) |
| Class I(a) | (303,984) | (387,612) |
| Class R | — | (4,134) |
| Class R4 | (15,647) | (34,007) |
| Class R5 | (34,589) | (33,337) |
| Class Y | (37,836) | (49,392) |
| Class Z | (743,137) | (1,971,771) |
| Net realized gains | | |
| Class A | (29,365,698) | (27,922,693) |
| Class B | (124,956) | (203,344) |
| Class C | (4,281,190) | (3,861,089) |
| Class I(a) | (6,695,481) | (6,618,772) |
| Class R | (342,834) | (369,442) |
| Class R4 | (489,083) | (763,352) |
| Class R5 | (795,145) | (603,651) |
| Class Y | (891,840) | (843,404) |
| Class Z | (25,774,096) | (44,260,011) |
| Total distributions to shareholders | (70,298,430) | (88,704,183) |
| Decrease in net assets from capital stock activity | (62,712,941) | (357,316,161) |
| Total increase (decrease) in net assets | 3,222,900 | (499,663,051) |
| Net assets at beginning of year | 589,295,126 | 1,088,958,177 |
| Net assets at end of year | $592,518,026 | $589,295,126 |
| Undistributed (excess of distributions over) net investment income | $(117,872) | $33,272 |
| (a) | Effective March 27, 2017, Class I shares were redeemed or exchanged for Class Y shares. |
The accompanying Notes to Financial Statements are an integral part of this statement.
Columbia Small Cap Value Fund I | Annual Report 2017
| 17 |
Statement of Changes in Net Assets (continued)
| | Year Ended | Year Ended |
| | April 30, 2017 | April 30, 2016 |
| | Shares | Dollars ($) | Shares | Dollars ($) |
| Capital stock activity |
| Class A | | | | |
| Subscriptions (a) | 785,638 | 31,247,604 | 638,944 | 24,505,930 |
| Distributions reinvested | 759,710 | 27,717,081 | 685,345 | 26,289,825 |
| Redemptions | (2,035,269) | (80,478,189) | (2,067,612) | (79,432,029) |
| Net decrease | (489,921) | (21,513,504) | (743,323) | (28,636,274) |
| Class B | | | | |
| Subscriptions | 608 | 14,678 | 617 | 16,075 |
| Distributions reinvested | 5,061 | 115,903 | 7,136 | 185,535 |
| Redemptions (a) | (38,466) | (979,775) | (40,425) | (1,113,591) |
| Net decrease | (32,797) | (849,194) | (32,672) | (911,981) |
| Class C | | | | |
| Subscriptions | 137,450 | 3,992,173 | 108,380 | 3,092,788 |
| Distributions reinvested | 141,810 | 3,750,457 | 114,293 | 3,313,349 |
| Redemptions | (335,761) | (9,675,452) | (242,652) | (7,040,384) |
| Net decrease | (56,501) | (1,932,822) | (19,979) | (634,247) |
| Class I(b) | | | | |
| Subscriptions | — | — | 111,600 | 4,997,173 |
| Distributions reinvested | 175,328 | 6,999,185 | 168,255 | 7,006,120 |
| Redemptions | (1,657,130) | (73,016,567) | (232,699) | (9,427,243) |
| Net increase (decrease) | (1,481,802) | (66,017,382) | 47,156 | 2,576,050 |
| Class R | | | | |
| Subscriptions | 8,532 | 342,347 | 8,810 | 334,327 |
| Distributions reinvested | 9,429 | 342,834 | 9,716 | 373,576 |
| Redemptions | (18,652) | (741,217) | (30,202) | (1,100,834) |
| Net decrease | (691) | (56,036) | (11,676) | (392,931) |
| Class R4 | | | | |
| Subscriptions | 52,682 | 2,384,146 | 54,216 | 2,375,495 |
| Distributions reinvested | 12,209 | 504,495 | 18,734 | 797,138 |
| Redemptions | (60,234) | (2,743,341) | (185,049) | (7,983,153) |
| Net increase (decrease) | 4,657 | 145,300 | (112,099) | (4,810,520) |
| Class R5 | | | | |
| Subscriptions | 71,221 | 3,222,086 | 130,585 | 5,631,370 |
| Distributions reinvested | 20,143 | 829,496 | 14,979 | 636,765 |
| Redemptions | (67,404) | (2,948,653) | (62,593) | (2,703,919) |
| Net increase | 23,960 | 1,102,929 | 82,971 | 3,564,216 |
| Class Y(b) | | | | |
| Subscriptions | 1,417,765 | 62,312,773 | 183,997 | 7,709,011 |
| Distributions reinvested | 23,533 | 929,435 | 21,415 | 892,568 |
| Redemptions | (286,153) | (11,968,088) | (159,677) | (6,619,275) |
| Net increase | 1,155,145 | 51,274,120 | 45,735 | 1,982,304 |
| Class Z | | | | |
| Subscriptions | 1,608,782 | 69,670,796 | 1,381,342 | 57,252,240 |
| Distributions reinvested | 405,179 | 16,020,336 | 852,652 | 35,461,780 |
| Redemptions | (2,617,833) | (110,557,484) | (10,529,071) | (422,766,798) |
| Net decrease | (603,872) | (24,866,352) | (8,295,077) | (330,052,778) |
| Total net decrease | (1,481,822) | (62,712,941) | (9,038,964) | (357,316,161) |
| (a) | Includes conversions of Class B shares to Class A shares, if any. |
| (b) | Effective March 27, 2017, Class I shares were redeemed or exchanged for Class Y shares. |
The accompanying Notes to Financial Statements are an integral part of this statement.
| 18 | Columbia Small Cap Value Fund I | Annual Report 2017 |
[THIS PAGE INTENTIONALLY LEFT BLANK]
Columbia Small Cap Value Fund I | Annual Report 2017
| 19 |
The following table is intended to help you understand the Fund’s financial performance. Certain information reflects financial results for a single share of a class held for the periods shown. Per share net investment income (loss) amounts are calculated based on average shares outstanding during the period. Total return assumes reinvestment of all dividends and distributions, if any. Total return does not reflect payment of sales charges, if any. Total return and portfolio turnover are not annualized for periods of less than one year. The portfolio turnover rate is calculated without regard to purchase and sales transactions of short-term instruments and certain derivatives, if any. If such transactions were included, the Fund’s portfolio turnover rate may be higher.
| Year ended | Net asset value,
beginning of
period | Net
investment
income
(loss) | Net
realized
and
unrealized
gain (loss) | Total from
investment
operations | Distributions
from net
investment
income | Distributions
from net
realized
gains |
| Class A |
| 4/30/2017 | $37.50 | 0.05 | 8.85 | 8.90 | (0.06) | (4.72) |
| 4/30/2016 | $43.03 | 0.11 | (1.13) | (1.02) | (0.12) | (4.39) |
| 4/30/2015 | $48.23 | 0.13 | 1.32 | 1.45 | (0.18) | (6.47) |
| 4/30/2014 | $45.66 | 0.14 | 9.96 | 10.10 | (0.30) | (7.23) |
| 4/30/2013 | $41.67 | 0.29 | 5.58 | 5.87 | (0.24) | (1.64) |
| Class B |
| 4/30/2017 | $25.33 | (0.17) | 5.68 | 5.51 | — | (4.63) |
| 4/30/2016 | $30.61 | (0.13) | (0.76) | (0.89) | — | (4.39) |
| 4/30/2015 | $36.31 | (0.15) | 0.92 | 0.77 | — | (6.47) |
| 4/30/2014 | $35.96 | (0.18) | 7.76 | 7.58 | — | (7.23) |
| 4/30/2013 | $33.22 | 0.04 | 4.34 | 4.38 | — | (1.64) |
| Class C |
| 4/30/2017 | $28.24 | (0.19) | 6.44 | 6.25 | — | (4.63) |
| 4/30/2016 | $33.63 | (0.13) | (0.87) | (1.00) | — | (4.39) |
| 4/30/2015 | $39.24 | (0.17) | 1.03 | 0.86 | — | (6.47) |
| 4/30/2014 | $38.36 | (0.19) | 8.30 | 8.11 | — | (7.23) |
| 4/30/2013 | $35.33 | (0.01) | 4.68 | 4.67 | — | (1.64) |
| Class R |
| 4/30/2017 | $37.54 | (0.06) | 8.87 | 8.81 | — | (4.72) |
| 4/30/2016 | $43.09 | 0.02 | (1.13) | (1.11) | (0.05) | (4.39) |
| 4/30/2015 | $48.28 | 0.01 | 1.32 | 1.33 | (0.05) | (6.47) |
| 4/30/2014 | $45.70 | 0.01 | 9.98 | 9.99 | (0.18) | (7.23) |
| 4/30/2013 | $41.70 | 0.14 | 5.63 | 5.77 | (0.13) | (1.64) |
| Class R4 |
| 4/30/2017 | $41.66 | 0.15 | 9.94 | 10.09 | (0.14) | (4.72) |
| 4/30/2016 | $47.24 | 0.24 | (1.24) | (1.00) | (0.19) | (4.39) |
| 4/30/2015 | $52.31 | 0.27 | 1.43 | 1.70 | (0.30) | (6.47) |
| 4/30/2014 | $48.96 | 0.27 | 10.73 | 11.00 | (0.42) | (7.23) |
| 4/30/2013 (e) | $43.31 | 0.22 | 7.42 | 7.64 | (0.35) | (1.64) |
| Class R5 |
| 4/30/2017 | $41.64 | 0.23 | 9.92 | 10.15 | (0.19) | (4.72) |
| 4/30/2016 | $47.21 | 0.31 | (1.25) | (0.94) | (0.24) | (4.39) |
| 4/30/2015 | $52.27 | 0.33 | 1.46 | 1.79 | (0.38) | (6.47) |
| 4/30/2014 | $48.93 | 0.32 | 10.75 | 11.07 | (0.50) | (7.23) |
| 4/30/2013 (g) | $43.31 | 0.24 | 7.41 | 7.65 | (0.39) | (1.64) |
The accompanying Notes to Financial Statements are an integral part of this statement.
| 20 | Columbia Small Cap Value Fund I | Annual Report 2017 |
Total
distributions to
shareholders | Net
asset
value,
end of
period | Total
return | Total gross
expense
ratio to
average
net assets(a) | Total net
expense
ratio to
average
net assets(a),(b) | Net investment
income (loss)
ratio to
average
net assets | Portfolio
turnover | Net
assets,
end of
period
(000’s) |
| |
| (4.78) | $41.62 | 26.02% | 1.38% (c) | 1.37% (c),(d) | 0.12% | 50% | $245,315 |
| (4.51) | $37.50 | (2.60%) | 1.36% | 1.36% (d) | 0.29% | 65% | $239,419 |
| (6.65) | $43.03 | 3.48% | 1.33% | 1.33% (d) | 0.29% | 42% | $306,663 |
| (7.53) | $48.23 | 22.95% | 1.31% (c) | 1.31% (c),(d) | 0.28% | 38% | $411,968 |
| (1.88) | $45.66 | 14.68% | 1.32% | 1.32% (d) | 0.70% | 42% | $518,968 |
| |
| (4.63) | $26.21 | 25.00% | 2.11% (c) | 2.11% (c),(d) | (0.68%) | 50% | $128 |
| (4.39) | $25.33 | (3.28%) | 2.12% | 2.11% (d) | (0.47%) | 65% | $955 |
| (6.47) | $30.61 | 2.69% | 2.08% | 2.08% (d) | (0.44%) | 42% | $2,154 |
| (7.23) | $36.31 | 22.02% | 2.06% (c) | 2.06% (c),(d) | (0.46%) | 38% | $3,982 |
| (1.64) | $35.96 | 13.84% | 2.06% | 2.06% (d) | 0.11% | 42% | $5,466 |
| |
| (4.63) | $29.86 | 25.05% | 2.12% (c) | 2.12% (c),(d) | (0.65%) | 50% | $26,703 |
| (4.39) | $28.24 | (3.32%) | 2.12% | 2.11% (d) | (0.45%) | 65% | $26,846 |
| (6.47) | $33.63 | 2.72% | 2.08% | 2.08% (d) | (0.47%) | 42% | $32,642 |
| (7.23) | $39.24 | 22.03% | 2.06% (c) | 2.06% (c),(d) | (0.48%) | 38% | $37,568 |
| (1.64) | $38.36 | 13.83% | 2.07% | 2.07% (d) | (0.04%) | 42% | $36,007 |
| |
| (4.72) | $41.63 | 25.71% | 1.63% (c) | 1.62% (c),(d) | (0.15%) | 50% | $3,032 |
| (4.44) | $37.54 | (2.83%) | 1.61% | 1.61% (d) | 0.06% | 65% | $2,760 |
| (6.52) | $43.09 | 3.22% | 1.58% | 1.58% (d) | 0.01% | 42% | $3,671 |
| (7.41) | $48.28 | 22.65% | 1.56% (c) | 1.56% (c),(d) | 0.01% | 38% | $3,360 |
| (1.77) | $45.70 | 14.40% | 1.57% | 1.57% (d) | 0.33% | 42% | $2,240 |
| |
| (4.86) | $46.89 | 26.30% | 1.13% (c) | 1.12% (c),(d) | 0.34% | 50% | $4,729 |
| (4.58) | $41.66 | (2.31%) | 1.11% | 1.11% (d) | 0.56% | 65% | $4,007 |
| (6.77) | $47.24 | 3.71% | 1.08% | 1.08% (d) | 0.53% | 42% | $9,840 |
| (7.65) | $52.31 | 23.26% | 1.06% (c) | 1.06% (c),(d) | 0.51% | 38% | $9,620 |
| (1.99) | $48.96 | 18.27% | 0.99% (f) | 0.99% (f) | 1.00% (f) | 42% | $3 |
| |
| (4.91) | $46.88 | 26.50% | 0.97% (c) | 0.97% (c) | 0.52% | 50% | $9,135 |
| (4.63) | $41.64 | (2.19%) | 0.96% | 0.96% | 0.74% | 65% | $7,115 |
| (6.85) | $47.21 | 3.90% | 0.93% | 0.93% | 0.67% | 42% | $4,150 |
| (7.73) | $52.27 | 23.44% | 0.91% (c) | 0.91% (c) | 0.61% | 38% | $2,494 |
| (2.03) | $48.93 | 18.31% | 0.89% (f) | 0.89% (f) | 1.10% (f) | 42% | $3 |
Columbia Small Cap Value Fund I | Annual Report 2017
| 21 |
Financial Highlights (continued)
| Year ended | Net asset value,
beginning of
period | Net
investment
income
(loss) | Net
realized
and
unrealized
gain (loss) | Total from
investment
operations | Distributions
from net
investment
income | Distributions
from net
realized
gains |
| Class Y |
| 4/30/2017 | $40.83 | 0.09 | 9.87 | 9.96 | (0.21) | (4.72) |
| 4/30/2016 | $46.37 | 0.29 | (1.18) | (0.89) | (0.26) | (4.39) |
| 4/30/2015 | $51.46 | 0.36 | 1.42 | 1.78 | (0.40) | (6.47) |
| 4/30/2014 | $48.26 | 0.31 | 10.63 | 10.94 | (0.51) | (7.23) |
| 4/30/2013 | $43.93 | 0.50 | 5.90 | 6.40 | (0.43) | (1.64) |
| Class Z |
| 4/30/2017 | $40.71 | 0.14 | 9.71 | 9.85 | (0.14) | (4.72) |
| 4/30/2016 | $46.28 | 0.23 | (1.22) | (0.99) | (0.19) | (4.39) |
| 4/30/2015 | $51.37 | 0.27 | 1.41 | 1.68 | (0.30) | (6.47) |
| 4/30/2014 | $48.21 | 0.27 | 10.55 | 10.82 | (0.43) | (7.23) |
| 4/30/2013 | $43.89 | 0.41 | 5.89 | 6.30 | (0.34) | (1.64) |
| Notes to Financial Highlights |
| (a) | In addition to the fees and expenses that the Fund bears directly, the Fund indirectly bears a pro rata share of the fees and expenses of any other funds in which it invests. Such indirect expenses are not included in the Fund’s reported expense ratios. |
| (b) | Total net expenses include the impact of certain fee waivers/expense reimbursements made by the Investment Manager and certain of its affiliates, if applicable. |
| (c) | Ratios include line of credit interest expense which is less than 0.01%. |
| (d) | The benefits derived from expense reductions had an impact of less than 0.01%. |
| (e) | Class R4 shares commenced operations on November 8, 2012. Per share data and total return reflect activity from that date. |
| (f) | Annualized. |
| (g) | Class R5 shares commenced operations on November 8, 2012. Per share data and total return reflect activity from that date. |
The accompanying Notes to Financial Statements are an integral part of this statement.
| 22 | Columbia Small Cap Value Fund I | Annual Report 2017 |
Total
distributions to
shareholders | Net
asset
value,
end of
period | Total
return | Total gross
expense
ratio to
average
net assets(a) | Total net
expense
ratio to
average
net assets(a),(b) | Net investment
income (loss)
ratio to
average
net assets | Portfolio
turnover | Net
assets,
end of
period
(000’s) |
| |
| (4.93) | $45.86 | 26.57% | 0.92% (c) | 0.92% (c) | 0.22% | 50% | $64,230 |
| (4.65) | $40.83 | (2.13%) | 0.91% | 0.91% | 0.70% | 65% | $10,022 |
| (6.87) | $46.37 | 3.95% | 0.88% | 0.88% | 0.74% | 42% | $9,261 |
| (7.74) | $51.46 | 23.50% | 0.87% (c) | 0.87% (c) | 0.61% | 38% | $10,234 |
| (2.07) | $48.26 | 15.20% | 0.87% | 0.87% | 1.14% | 42% | $1,229 |
| |
| (4.86) | $45.70 | 26.33% | 1.13% (c) | 1.12% (c),(d) | 0.34% | 50% | $239,246 |
| (4.58) | $40.71 | (2.34%) | 1.11% | 1.11% (d) | 0.54% | 65% | $237,720 |
| (6.77) | $46.28 | 3.75% | 1.08% | 1.08% (d) | 0.54% | 42% | $654,100 |
| (7.66) | $51.37 | 23.24% | 1.06% (c) | 1.06% (c),(d) | 0.53% | 38% | $819,275 |
| (1.98) | $48.21 | 14.97% | 1.07% | 1.07% (d) | 0.93% | 42% | $928,340 |
Columbia Small Cap Value Fund I | Annual Report 2017
| 23 |
Notes to Financial Statements
April 30, 2017
Note 1. Organization
Columbia Small Cap Value Fund I (the Fund), a series of Columbia Funds Series Trust I (the Trust), is a diversified fund. The Trust is registered under the Investment Company Act of 1940, as amended (the 1940 Act), as an open-end management investment company organized as a Massachusetts business trust.
Fund shares
The Trust may issue an unlimited number of shares (without par value). Although all share classes generally have identical voting, dividend and liquidation rights, each share class votes separately when required by the Trust’s organizational documents or by law. Different share classes pay different distribution amounts to the extent the expenses of such share classes differ, and distributions in liquidation will be proportional to the net asset value of each share class. Each share class has its own expense and sales charge structure. The Fund offers each of the share classes identified below.
Class A shares are subject to a maximum front-end sales charge of 5.75% based on the initial investment amount. Class A shares purchased without an initial sales charge in accounts aggregating $1 million to $50 million at the time of purchase are subject to a contingent deferred sales charge (CDSC) if the shares are sold within 18 months after purchase, charged as follows: 1.00% CDSC if redeemed within 12 months after purchase, and 0.50% CDSC if redeemed more than 12, but less than 18, months after purchase.
The Fund no longer accepts investments by new or existing investors in the Fund’s Class B shares, except in connection with the reinvestment of any dividend and/or capital gain distributions in Class B shares of the Fund and exchanges by existing Class B shareholders of certain other funds within the Columbia Family of Funds. Class B shares are typically subject to a maximum CDSC of 5.00% based upon the holding period after purchase. However, the Fund’s current Class B investors, having held their shares for the requisite time period, are no longer subject to a CDSC upon redemption of their shares. Effective on or about July 17, 2017, Class B shares will automatically convert to Class A shares and the Fund will no longer accept investments by new or existing investors in Class B shares.
Class C shares are subject to a 1.00% CDSC on shares redeemed within 12 months after purchase.
Effective March 27, 2017, Class I shares of the Fund are no longer offered for sale. Class I shares, when available, were not subject to sales charges or distribution and service (12b-1) fees, and were made available only to the Columbia Family of Funds. On March 27, 2017, Class I shares were redeemed or exchanged for Class Y shares of the Fund in a tax free transaction that had no impact on the fees and expenses paid by shareholders.
Class R shares are not subject to sales charges and are generally available only to certain retirement plans and other investors as described in the Fund’s prospectus.
Class R4 shares are not subject to sales charges and are generally available only to omnibus retirement plans and certain investors as described in the Fund’s prospectus.
Class R5 shares are not subject to sales charges and are generally available only to investors purchasing through authorized investment professionals and omnibus retirement plans.
Class Y shares are not subject to sales charges or distribution and service (12b-1) fees, and are available to institutional and certain other investors as described in the Fund’s prospectus. On March 27, 2017, Class I shares were redeemed or exchanged for Class Y shares of the Fund in a tax free transaction that had no impact on the fees and expenses paid by shareholders. Class I shares of the Fund are no longer offered for sale.
Class Z shares are not subject to sales charges and are generally available only to eligible investors, which are subject to different investment minimums as described in the Fund’s prospectus.
| 24 | Columbia Small Cap Value Fund I | Annual Report 2017 |
Notes to Financial Statements (continued)
April 30, 2017
Note 2. Summary of significant accounting policies
Basis of preparation
The Fund is an investment company that applies the accounting and reporting guidance in the Financial Accounting Standards Board (FASB) Accounting Standards Codification Topic 946, Financial Services - Investment Companies (ASC 946). The financial statements are prepared in accordance with U.S. generally accepted accounting principles (GAAP), which requires management to make certain estimates and assumptions that affect the reported amounts of assets and liabilities, the disclosure of contingent assets and liabilities at the date of the financial statements and the reported amounts of income and expenses during the reporting period. Actual results could differ from those estimates.
The following is a summary of significant accounting policies followed by the Fund in the preparation of its financial statements.
Security valuation
All equity securities are valued at the close of business of the New York Stock Exchange. Equity securities are valued at the last quoted sales price on the principal exchange or market on which they trade, except for securities traded on the NASDAQ Stock Market, which are valued at the NASDAQ official close price. Unlisted securities or listed securities for which there were no sales during the day are valued at the mean of the latest quoted bid and ask prices on such exchanges or markets.
Foreign equity securities are valued based on the closing price on the foreign exchange in which such securities are primarily traded. If any foreign equity security closing prices are not readily available, the securities are valued at the mean of the latest quoted bid and ask prices on such exchanges or markets. Foreign currency exchange rates are generally determined at 4:00 p.m. Eastern (U.S.) time. Many securities markets and exchanges outside the U.S. close prior to the close of the New York Stock Exchange; therefore, the closing prices for securities in such markets or on such exchanges may not fully reflect events that occur after such close but before the close of the New York Stock Exchange. In those situations, foreign securities will be fair valued pursuant to a policy adopted by the Board of Trustees, including, if available, utilizing a third party pricing service to determine these fair values. The third party pricing service takes into account multiple factors, including, but not limited to, movements in the U.S. securities markets, certain depositary receipts, futures contracts and foreign exchange rates that have occurred subsequent to the close of the foreign exchange or market, to determine a good faith estimate that reasonably reflects the current market conditions as of the close of the New York Stock Exchange. The fair value of a security is likely to be different from the quoted or published price, if available.
Investments in open-end investment companies, including money market funds, are valued at their latest net asset value.
Investments for which market quotations are not readily available, or that have quotations which management believes are not reflective of market value or reliable, are valued at fair value as determined in good faith under procedures approved by and under the general supervision of the Board of Trustees. If a security or class of securities (such as foreign securities) is valued at fair value, such value is likely to be different from the quoted or published price for the security.
The determination of fair value often requires significant judgment. To determine fair value, management may use assumptions including but not limited to future cash flows and estimated risk premiums. Multiple inputs from various sources may be used to determine fair value.
GAAP requires disclosure regarding the inputs and valuation techniques used to measure fair value and any changes in valuation inputs or techniques. In addition, investments shall be disclosed by major category. This information is disclosed following the Fund’s Portfolio of Investments.
Foreign currency transactions and translations
The values of all assets and liabilities denominated in foreign currencies are generally translated into U.S. dollars at exchange rates determined at the close of regular trading on the New York Stock Exchange. Net realized and unrealized gains (losses) on foreign currency transactions and translations include gains (losses) arising from the fluctuation in exchange
Columbia Small Cap Value Fund I | Annual Report 2017
| 25 |
Notes to Financial Statements (continued)
April 30, 2017
rates between trade and settlement dates on securities transactions, gains (losses) arising from the disposition of foreign currency and currency gains (losses) between the accrual and payment dates on dividends, interest income and foreign withholding taxes.
For financial statement purposes, the Fund does not distinguish that portion of gains (losses) on investments which is due to changes in foreign exchange rates from that which is due to changes in market prices of the investments. Such fluctuations are included with the net realized and unrealized gains (losses) on investments in the Statement of Operations.
Security transactions
Security transactions are accounted for on the trade date. Cost is determined and gains (losses) are based upon the specific identification method for both financial statement and federal income tax purposes.
Income recognition
Corporate actions and dividend income are generally recorded net of any non-reclaimable tax withholdings, on the ex-dividend date or upon receipt of ex-dividend notification in the case of certain foreign securities.
The Fund may receive distributions from holdings in equity securities, business development companies (BDCs), exchange-traded funds, other regulated investment companies (RICs), and real estate investment trusts (REITs), which report information on the tax character of their distributions annually. These distributions are allocated to dividend income, capital gain and return of capital based on actual information reported. Return of capital is recorded as a reduction of the cost basis of securities held. If the Fund no longer owns the applicable securities, return of capital is recorded as a realized gain. With respect to REITs, to the extent actual information has not yet been reported, estimates for return of capital are made by the Fund’s management. Management’s estimates are subsequently adjusted when the actual character of the distributions is disclosed by the REITs, which could result in a proportionate change in return of capital to shareholders.
Awards from class action litigation are recorded as a reduction of cost basis if the Fund still owns the applicable securities on the payment date. If the Fund no longer owns the applicable securities, the proceeds are recorded as realized gains.
Expenses
General expenses of the Trust are allocated to the Fund and other funds of the Trust based upon relative net assets or other expense allocation methodologies determined by the nature of the expense. Expenses directly attributable to the Fund are charged to the Fund. Expenses directly attributable to a specific class of shares are charged to that share class.
Determination of class net asset value
All income, expenses (other than class-specific expenses, which are charged to that share class, as shown in the Statement of Operations) and realized and unrealized gains (losses) are allocated to each class of the Fund on a daily basis, based on the relative net assets of each class, for purposes of determining the net asset value of each class.
Federal income tax status
The Fund intends to qualify each year as a regulated investment company under Subchapter M of the Internal Revenue Code, as amended, and will distribute substantially all of its taxable income (including net short-term capital gains), if any, for its tax year, and as such will not be subject to federal income taxes. In addition, the Fund intends to distribute in each calendar year substantially all of its net investment income, capital gains and certain other amounts, if any, such that the Fund should not be subject to federal excise tax. Therefore, no federal income or excise tax provision is recorded.
Foreign taxes
The Fund may be subject to foreign taxes on income, gains on investments or currency repatriation, a portion of which may be recoverable. The Fund will accrue such taxes and recoveries, as applicable, based upon its current interpretation of tax rules and regulations that exist in the markets in which it invests.
| 26 | Columbia Small Cap Value Fund I | Annual Report 2017 |
Notes to Financial Statements (continued)
April 30, 2017
Realized gains in certain countries may be subject to foreign taxes at the Fund level, based on statutory rates. The Fund accrues for such foreign taxes on realized and unrealized gains at the appropriate rate for each jurisdiction, as applicable. The amount, if any, is disclosed as a liability on the Statement of Assets and Liabilities.
Distributions to shareholders
Distributions from net investment income, if any, are declared and paid at least annually. Net realized capital gains, if any, are distributed at least annually. Income distributions and capital gain distributions are determined in accordance with federal income tax regulations, which may differ from GAAP.
Guarantees and indemnifications
Under the Trust’s organizational documents and, in some cases, by contract, its officers and trustees are indemnified against certain liabilities arising out of the performance of their duties to the Trust or its funds. In addition, certain of the Fund’s contracts with its service providers contain general indemnification clauses. The Fund’s maximum exposure under these arrangements is unknown since the amount of any future claims that may be made against the Fund cannot be determined, and the Fund has no historical basis for predicting the likelihood of any such claims.
Investment company reporting modernization
In October 2016, the U.S. Securities and Exchange Commission adopted new rules and forms, and amendments to certain current rules and forms, to modernize reporting and disclosure of information by registered investment companies. The amendments to Regulation S-X will require standardized, enhanced disclosure about derivatives in investment company financial statements, and will also change the rules governing the form and content of such financial statements. The amendments to Regulation S-X take effect on August 1, 2017. At this time, management is assessing the anticipated impact of these regulatory developments.
Note 3. Fees and other transactions with affiliates
Management services fees
The Fund entered into a Management Agreement with Columbia Management Investment Advisers, LLC (the Investment Manager), a wholly-owned subsidiary of Ameriprise Financial, Inc. (Ameriprise Financial). Under the Management Agreement, the Investment Manager provides the Fund with investment research and advice, as well as administrative and accounting services. The management services fee is an annual fee that is equal to a percentage of the Fund’s average daily net assets that declines from 0.87% to 0.75% as the Fund’s net assets increase. The effective management services fee rate for the year ended April 30, 2017 was 0.86% of the Fund’s average daily net assets.
Compensation of board members
Members of the Board of Trustees, who are not officers or employees of the Investment Manager or Ameriprise Financial, are compensated for their services to the Fund as disclosed in the Statement of Operations. These members of the Board of Trustees may participate in a Deferred Compensation Plan (the Plan) which may be terminated at any time. Obligations of the Plan will be paid solely out of the Fund’s assets, and all amounts payable under the Plan constitute a general unsecured obligation of the Fund.
Compensation of Chief Compliance Officer
The Board of Trustees has appointed a Chief Compliance Officer to the Fund in accordance with federal securities regulations. A portion of the Chief Compliance Officer’s total compensation is allocated to the Fund, along with other affiliated funds governed by the Board of Trustees, based on relative net assets. The total amount allocated to all affiliated funds governed by the Board of Trustees will not exceed $40,000 annually.
Columbia Small Cap Value Fund I | Annual Report 2017
| 27 |
Notes to Financial Statements (continued)
April 30, 2017
Transfer agency fees
Under a Transfer and Dividend Disbursing Agent Agreement, Columbia Management Investment Services Corp. (the Transfer Agent), an affiliate of the Investment Manager and a wholly-owned subsidiary of Ameriprise Financial, is responsible for providing transfer agency services to the Fund. The Transfer Agent has contracted with Boston Financial Data Services (BFDS) to serve as sub-transfer agent. The Transfer Agent pays the fees of BFDS for services as sub-transfer agent and BFDS is not entitled to reimbursement for such fees from the Fund (with the exception of out-of-pocket fees).
The Fund pays the Transfer Agent a monthly transfer agency fee based on the number or the average value of accounts, depending on the type of account. In addition, prior to October 1, 2016, the Transfer Agent also received sub-transfer agency fees based on a percentage of the average aggregate value of the Fund’s shares maintained in omnibus accounts (other than omnibus accounts for which American Enterprise Investment Services Inc. is the broker of record or accounts where the beneficial shareholder is a customer of Ameriprise Financial Services, Inc., for which the Transfer Agent receives a per account fee). Effective October 1, 2016, the Fund pays the Transfer Agent a fee for shareholder services based on the number of accounts or on a percentage of the average aggregate value of the Fund’s shares maintained in omnibus accounts up to the lesser of the amount charged by the financial intermediary or a cap established by the Board of Trustees from time to time.
The Transfer Agent also receives compensation from the Fund for various shareholder services and reimbursements for certain out-of-pocket fees. Effective January 1, 2017, total transfer agency fees for Class R5 shares are subject to an annual limitation of not more than 0.075% of the average daily net assets attributable to Class R5 shares. Total transfer agency fees for Class I, prior to March 27, 2017 were, and Class Y shares are subject to an annual limitation of not more than 0.025% of the average daily net assets attributable to each share class. Prior to January 1, 2017, total transfer agency fees for Class R5 shares were subject to an annual limitation of not more than 0.05% of the average daily net assets attributable to Class R5 shares and Class I and Class Y shares did not pay transfer agency fees.
For the year ended April 30, 2017, the Fund’s effective transfer agency fee rates as a percentage of average daily net assets of each class were as follows:
| | Effective rate (%) |
| Class A | 0.22 |
| Class B | 0.21 |
| Class C | 0.22 |
| Class I | 0.003 (a),(b) |
| Class R | 0.22 |
| Class R4 | 0.22 |
| Class R5 | 0.055 |
| Class Y | 0.006 |
| Class Z | 0.22 |
| (a) | Annualized. |
| (b) | Effective March 27, 2017, Class I shares were redeemed or exchanged for Class Y shares. |
An annual minimum account balance fee of $20 may apply to certain accounts with a value below the applicable share class’s initial minimum investment requirements to reduce the impact of small accounts on transfer agency fees. These minimum account balance fees are remitted to the Fund and recorded as part of expense reductions in the Statement of Operations. For the year ended April 30, 2017, these minimum account balance fees reduced total expenses of the Fund by $3,047.
Distribution and service fees
The Fund has an agreement with Columbia Management Investment Distributors, Inc. (the Distributor), an affiliate of the Investment Manager and a wholly-owned subsidiary of Ameriprise Financial, for distribution and shareholder services. The Board of Trustees has approved, and the Fund has adopted, distribution and shareholder service plans (the Plans) applicable
| 28 | Columbia Small Cap Value Fund I | Annual Report 2017 |
Notes to Financial Statements (continued)
April 30, 2017
to certain share classes, which set the distribution and service fees for the Fund. These fees are calculated daily and are intended to compensate the Distributor and/or eligible selling and/or servicing agents for selling shares of the Fund and providing services to investors.
Under the Plans, the Fund pays a monthly service fee to the Distributor at the maximum annual rate of 0.25% of the average daily net assets attributable to Class A, Class B and Class C shares of the Fund. Also under the Plans, the Fund pays a monthly distribution fee to the Distributor at the maximum annual rates of 0.75%, 0.75% and 0.50% of the average daily net assets attributable to Class B, Class C and Class R shares of the Fund, respectively.
Sales charges (unaudited)
Sales charges, including front-end charges and CDSCs, received by the Distributor for distributing Fund shares for the year ended April 30, 2017, if any, are listed below:
| | Amount ($) |
| Class A | 131,626 |
| Class C | 205 |
Expenses waived/reimbursed by the Investment Manager and its affiliates
The Investment Manager and certain of its affiliates have contractually agreed to waive fees and/or reimburse expenses (excluding certain fees and expenses described below) for the periods disclosed below, unless sooner terminated at the sole discretion of the Board of Trustees, so that the Fund’s net operating expenses, after giving effect to fees waived/expenses reimbursed and any balance credits and/or overdraft charges from the Fund’s custodian, do not exceed the following annual rates as a percentage of the class’ average daily net assets:
| | September 1, 2016
through
August 31, 2017 | Prior to
September 1, 2016 |
| Class A | 1.370% | 1.37% |
| Class B | 2.120 | 2.12 |
| Class C | 2.120 | 2.12 |
| Class R | 1.620 | 1.62 |
| Class R4 | 1.120 | 1.12 |
| Class R5 | 1.020 | 1.01 |
| Class Y | 0.970 | 0.96 |
| Class Z | 1.120 | 1.12 |
Under the agreement governing these fee waivers and/or expense reimbursement arrangements, the following fees and expenses are excluded from the waiver/reimbursement commitment, and therefore will be paid by the Fund, if applicable: taxes (including foreign transaction taxes), expenses associated with investments in affiliated and non-affiliated pooled investment vehicles (including mutual funds and exchange-traded funds), transaction costs and brokerage commissions, costs related to any securities lending program, dividend and interest expenses associated with securities sold short, inverse floater program fees and expenses, transaction charges and interest on borrowed money, interest, infrequent and/or unusual expenses and any other expenses the exclusion of which is specifically approved by the Board of Trustees. This agreement may be modified or amended only with approval from the Investment Manager, certain of its affiliates and the Fund. Any fees waived and/or expenses reimbursed under the expense reimbursement arrangements described above are not recoverable by the Investment Manager or its affiliates in future periods.
Note 4. Federal tax information
The timing and character of income and capital gain distributions are determined in accordance with income tax regulations, which may differ from GAAP because of temporary or permanent book to tax differences.
Columbia Small Cap Value Fund I | Annual Report 2017
| 29 |
Notes to Financial Statements (continued)
April 30, 2017
At April 30, 2017, these differences are primarily due to differing treatment for deferral/reversal of wash sale losses, post-October capital losses, trustees’ deferred compensation, foreign currency transactions, distribution reclassifications and earnings and profits distributed to shareholders on the redemption of shares. To the extent these differences are permanent, reclassifications are made among the components of the Fund’s net assets in the Statement of Assets and Liabilities. Temporary differences do not require reclassifications.
In the Statement of Assets and Liabilities the following reclassifications were made:
Excess of distributions
over net investment
income ($) | Accumulated
net realized
gain ($) | Paid in
capital ($) |
| 64,898 | (6,449,642) | 6,384,744 |
Net investment income (loss) and net realized gains (losses), as disclosed in the Statement of Operations, and net assets were not affected by this reclassification.
The tax character of distributions paid during the years indicated was as follows:
| April 30, 2017 | April 30, 2016 |
Ordinary
income ($) | Long-term
capital gains ($) | Total ($) | Ordinary
income (S) | Long-term
capital gains ($) | Total ($) |
| 9,014,200 | 61,284,230 | 70,298,430 | 3,258,425 | 85,445,758 | 88,704,183 |
Short-term capital gain distributions, if any, are considered ordinary income distributions for tax purposes.
At April 30, 2017, the components of distributable earnings on a tax basis were as follows:
Undistributed
ordinary income ($) | Undistributed
long-term
capital gains ($) | Capital loss
carryforwards ($) | Net unrealized
appreciation ($) |
| — | 37,716,859 | — | 208,205,031 |
At April 30, 2017, the cost of investments for federal income tax purposes along with the aggregate gross unrealized appreciation and depreciation based on that cost was:
Federal
tax cost ($) | Gross unrealized
appreciation ($) | Gross unrealized
(depreciation) ($) | Net unrealized
appreciation ($) |
| 386,456,550 | 219,067,301 | (10,862,270) | 208,205,031 |
Under current tax rules, regulated investment companies can elect to treat certain late-year ordinary losses incurred and post-October capital losses (capital losses realized after October 31) as arising on the first day of the following taxable year. As of April 30, 2017, the Fund will elect to treat the following late-year ordinary losses and post-October capital losses as arising on May 1, 2017.
Late year
ordinary losses ($) | Post-October
capital losses ($) |
| — | 2,732,890 |
Management of the Fund has concluded that there are no significant uncertain tax positions in the Fund that would require recognition in the financial statements. However, management’s conclusion may be subject to review and adjustment at a later date based on factors including, but not limited to, new tax laws, regulations, and administrative interpretations (including relevant court decisions). Generally, the Fund’s federal tax returns for the prior three fiscal years remain subject to examination by the Internal Revenue Service.
| 30 | Columbia Small Cap Value Fund I | Annual Report 2017 |
Notes to Financial Statements (continued)
April 30, 2017
Note 5. Portfolio information
The cost of purchases and proceeds from sales of securities, excluding short-term investments and derivatives, if any, aggregated to $293,485,571 and $414,709,064, respectively, for the year ended April 30, 2017. The amount of purchase and sale activity impacts the portfolio turnover rate reported in the Financial Highlights.
Note 6. Affiliated money market fund
The Fund invests in Columbia Short-Term Cash Fund, an affiliated money market fund established for the exclusive use by the Fund and other affiliated funds (the Affiliated MMF). The income earned by the Fund from such investments is included as Dividends - affiliated issuers in the Statement of Operations. As an investing fund, the Fund indirectly bears its proportionate share of the expenses of the Affiliated MMF. Effective October 1, 2016, the Affiliated MMF prices its shares with a floating net asset value (NAV) and no longer seeks to maintain a stable NAV. In addition, the Board of Trustees of the Affiliated MMF may impose a fee on redemptions (sometimes referred to as a liquidity fee) or temporarily suspend redemptions (sometimes referred to as imposing a redemption gate) in the event its liquidity falls below regulatory limits.
Note 7. Line of credit
The Fund has access to a revolving credit facility with a syndicate of banks led by Citibank, N.A., HSBC Bank USA, N.A. and JPMorgan Chase Bank, N.A. whereby the Fund may borrow for the temporary funding of shareholder redemptions or for other temporary or emergency purposes. The credit facility agreement, which is a collective agreement between the Fund and certain other funds managed by the Investment Manager, severally and not jointly, permits collective borrowings up to $1 billion. Interest is charged to each participating fund based on its borrowings at a rate equal to the higher of (i) the overnight federal funds rate plus 1.00% or (ii) the one-month LIBOR rate plus 1.00%. Each borrowing under the credit facility matures no later than 60 days after the date of borrowing. The Fund also pays a commitment fee equal to its pro rata share of the amount of the credit facility at a rate of 0.15% per annum. The commitment fee is included in other expenses in the Statement of Operations.
For the year ended April 30, 2017, the average daily loan balance outstanding on days when borrowing existed was $13,600,000 at a weighted average interest rate of 1.77%. Interest expense incurred by the Fund is recorded as a line of credit interest expense in the Statement of Operations.
Note 8. Significant risks
Financial sector risk
The Fund may be more susceptible to the particular risks that may affect companies in the financial services sector than if it were invested in a wider variety of companies in unrelated sectors. Companies in the financial services sector are subject to certain risks, including the risk of regulatory change, decreased liquidity in credit markets and unstable interest rates. Such companies may have concentrated portfolios, such as a high level of loans to real estate developers, which makes them vulnerable to economic conditions that affect that industry. Performance of such companies may be affected by competitive pressures and exposure to investments or agreements that, under certain circumstances, may lead to losses (e.g., subprime loans). Companies in the financial services sector are subject to extensive governmental regulation that may limit the amount and types of loans and other financial commitments they can make, and interest rates and fees that they may charge. In addition, profitability of such companies is largely dependent upon the availability and the cost of capital.
Shareholder concentration risk
At April 30, 2017, one unaffiliated shareholder of record owned 19.8% of the outstanding shares of the Fund in one or more accounts. The Fund has no knowledge about whether any portion of those shares was owned beneficially. Affiliated shareholders of record owned 15.7% of the outstanding shares of the Fund in one or more accounts. Subscription and redemption activity by concentrated accounts may have a significant effect on the operations of the Fund. In the case of a large redemption, the Fund may be forced to sell investments at inopportune times, including its liquid or more liquid positions, resulting in Fund losses and the Fund holding a higher percentage of less liquid or illiquid securities. Large redemptions could result in decreased economies of scale and increased operating expenses for non-redeeming Fund shareholders.
Columbia Small Cap Value Fund I | Annual Report 2017
| 31 |
Notes to Financial Statements (continued)
April 30, 2017
Note 9. Subsequent events
Management has evaluated the events and transactions that have occurred through the date the financial statements were issued. Other than as noted in Note 1 above, there were no items requiring adjustment of the financial statements or additional disclosure.
Note 10. Information regarding pending and settled legal proceedings
Ameriprise Financial and certain of its affiliates have historically been involved in a number of legal, arbitration and regulatory proceedings, including routine litigation, class actions, and governmental actions, concerning matters arising in connection with the conduct of their business activities. Ameriprise Financial believes that the Funds are not currently the subject of, and that neither Ameriprise Financial nor any of its affiliates are the subject of, any pending legal, arbitration or regulatory proceedings that are likely to have a material adverse effect on the Funds or the ability of Ameriprise Financial or its affiliates to perform under their contracts with the Funds. Ameriprise Financial is required to make quarterly (10-Q), annual (10-K) and, as necessary, 8-K filings with the Securities and Exchange Commission (SEC) on legal and regulatory matters that relate to Ameriprise Financial and its affiliates. Copies of these filings may be obtained by accessing the SEC website at www.sec.gov.
There can be no assurance that these matters, or the adverse publicity associated with them, will not result in increased fund redemptions, reduced sale of fund shares or other adverse consequences to the Funds. Further, although we believe proceedings are not likely to have a material adverse effect on the Funds or the ability of Ameriprise Financial or its affiliates to perform under their contracts with the Funds, these proceedings are subject to uncertainties and, as such, we are unable to estimate the possible loss or range of loss that may result. An adverse outcome in one or more of these proceedings could result in adverse judgments, settlements, fines, penalties or other relief that could have a material adverse effect on the consolidated financial condition or results of operations of Ameriprise Financial.
| 32 | Columbia Small Cap Value Fund I | Annual Report 2017 |
Report of Independent Registered Public Accounting Firm
To the Trustees of Columbia Funds Series Trust I and the Shareholders of Columbia Small Cap Value Fund I
In our opinion, the accompanying statement of assets and liabilities, including the portfolio of investments, and the related statements of operations and of changes in net assets and the financial highlights present fairly, in all material respects, the financial position of Columbia Small Cap Value Fund I (the “Fund”, a series of Columbia Funds Series Trust I) as of April 30, 2017, the results of its operations for the year then ended, the changes in its net assets for each of the two years in the period then ended and the financial highlights for each of the five years in the period then ended, in conformity with accounting principles generally accepted in the United States of America. These financial statements and financial highlights (hereafter referred to as “financial statements”) are the responsibility of the Fund’s management. Our responsibility is to express an opinion on these financial statements based on our audits. We conducted our audits of these financial statements in accordance with the standards of the Public Company Accounting Oversight Board (United States). Those standards require that we plan and perform the audit to obtain reasonable assurance about whether the financial statements are free of material misstatement. An audit includes examining, on a test basis, evidence supporting the amounts and disclosures in the financial statements, assessing the accounting principles used and significant estimates made by management, and evaluating the overall financial statement presentation. We believe that our audits, which included confirmation of securities as of April 30, 2017 by correspondence with the custodian and brokers, provide a reasonable basis for our opinion.
PricewaterhouseCoopers LLP
Minneapolis, MN
June 21, 2017
Columbia Small Cap Value Fund I | Annual Report 2017
| 33 |
Federal Income Tax Information
(Unaudited)
The Fund hereby designates the following tax attributes for the fiscal year ended April 30, 2017. Shareholders will be notified in early 2018 of the amounts for use in preparing 2017 income tax returns.
Qualified
dividend
income | Dividends
received
deduction | Capital
gain
dividend |
| 81.83% | 79.72% | $74,067,825 |
Qualified dividend income. For taxable, non-corporate shareholders, the percentage of ordinary income distributed during the fiscal year that represents qualified dividend income subject to reduced tax rates.
Dividends received deduction. The percentage of ordinary income distributed during the fiscal year that qualifies for the corporate dividends received deduction.
Capital gain dividend. The Fund designates as a capital gain dividend the amount reflected above, or if subsequently determined to be different, the net capital gain of such fiscal period.
| 34 | Columbia Small Cap Value Fund I | Annual Report 2017 |
Shareholders elect the Board that oversees the Fund’s operations. The Board appoints officers who are responsible for day-to-day business decisions based on policies set by the Board. The following table provides basic biographical information about the Fund’s Trustees, including their principal occupations during the past five years, although specific titles for individuals may have varied over the period. The year set forth beneath Length of Service in the table below is the year in which the Trustee was first appointed or elected as Trustee to any Fund currently in the Columbia Funds Complex or a predecessor thereof. Under current Board policy, members serve terms of indefinite duration.
Independent trustees
| Name, address, year of birth | Position held with the Trust and length of service | Principal occupation(s) during the past five years and other relevant professional experience | Number of Funds in the Columbia Fund Complex overseen | Other directorships held by Trustee during the past five years |
Janet Langford Carrig
c/o Columbia Management
Investment Advisers, LLC
225 Franklin Street
Mail Drop BX32 05228
Boston, MA 02110
1957 | Trustee
1996 | Senior Vice President, General Counsel and Corporate Secretary, ConocoPhillips (independent energy company) since September 2007 | 57 | None |
Douglas A. Hacker
c/o Columbia Management
Investment Advisers, LLC
225 Franklin Street
Mail Drop BX32 05228
Boston, MA 02110
1955 | Trustee and Chairman of the Board
1996 | Independent business executive since May 2006; Executive Vice President — Strategy of United Airlines from December 2002 to May 2006; President of UAL Loyalty Services (airline marketing company) from September 2001 to December 2002; Executive Vice President and Chief Financial Officer of United Airlines from July 1999 to September 2001 | 57 | Spartan Nash Company, (food distributor); Nash Finch Company (food distributor) from 2005 to 2013; Aircastle Limited (aircraft leasing); SeaCube Container Leasing Ltd. (container leasing) from 2010 to 2013; and Travelport Worldwide Limited (travel information technology) |
Nancy T. Lukitsh
c/o Columbia Management
Investment Advisers, LLC
225 Franklin Street
Mail Drop BX32 05228
Boston, MA 02110
1956 | Trustee
2011 | Senior Vice President, Partner and Director of Marketing, Wellington Management Company, LLP (investment adviser) from 1997 to 2010; Chair, Wellington Management Portfolios (commingled non-U.S. investment pools) from 2007 to 2010; Director, Wellington Trust Company, NA and other Wellington affiliates from 1997 to 2010 | 57 | None |
David M. Moffett
c/o Columbia Management
Investment Advisers, LLC
225 Franklin Street
Mail Drop BX32 05228
Boston, MA 02110
1952 | Trustee
2011 | Retired. Consultant to Bridgewater and Associates | 57 | Director, CSX Corporation; Genworth Financial, Inc. (financial and insurance products and services); Paypal Holdings Inc. (payment and data processing services); Trustee, University of Oklahoma Foundation; former Director, eBay Inc. (online trading community), 2007-2015; and former Director, CIT Bank, CIT Group Inc. (commercial and consumer finance), 2010-2016 |
Columbia Small Cap Value Fund I | Annual Report 2017
| 35 |
TRUSTEES AND OFFICERS (continued)
Independent trustees (continued)
| Name, address, year of birth | Position held with the Trust and length of service | Principal occupation(s) during the past five years and other relevant professional experience | Number of Funds in the Columbia Fund Complex overseen | Other directorships held by Trustee during the past five years |
Charles R. Nelson
c/o Columbia Management
Investment Advisers, LLC
225 Franklin Street
Mail Drop BX32 05228
Boston, MA 02110
1942 | Trustee
1981 | Retired. Professor Emeritus, University of Washington since 2011; Professor of Economics, University of Washington from 1976 to 2011; Ford and Louisa Van Voorhis Professor of Political Economy, University of Washington from 1993 to 2011; Adjunct Professor of Statistics, University of Washington from 1980 to 2011; Associate Editor, Journal of Money, Credit and Banking from September 1993 to 2008; consultant on econometric and statistical matters | 57 | None |
John J. Neuhauser
c/o Columbia Management
Investment Advisers, LLC
225 Franklin Street
Mail Drop BX32 05228
Boston, MA 02110
1943 | Trustee
1984 | President, Saint Michael’s College since August 2007; Director or Trustee of several non-profit organizations, including University of Vermont Medical Center; Academic Vice President and Dean of Faculties, Boston College from August 1999 to October 2005; University Professor, Boston College from November 2005 to August 2007 | 57 | Liberty All-Star Equity Fund and Liberty All- Star Growth Fund (closed-end funds) |
Patrick J. Simpson
c/o Columbia Management
Investment Advisers, LLC
225 Franklin Street
Mail Drop BX32 05228
Boston, MA 02110
1944 | Trustee
2000 | Of Counsel, Perkins Coie LLP (law firm) since 2015; Partner, Perkins Coie LLP from 1988 to 2014 | 57 | None |
Anne-Lee Verville
c/o Columbia Management
Investment Advisers, LLC
225 Franklin Street
Mail Drop BX32 05228
Boston, MA 02110
1945 | Trustee
1998 | Retired. General Manager, Global Education Industry from 1994 to 1997, President – Application Systems Division from 1991 to 1994, Chief Financial Officer – US Marketing & Services from 1988 to 1991, and Chief Information Officer from 1987 to 1988, IBM Corporation (computer and technology) | 57 | Enesco Group, Inc. (producer of giftware and home and garden decor products) from 2001 to 2006 |
| 36 | Columbia Small Cap Value Fund I | Annual Report 2017 |
TRUSTEES AND OFFICERS (continued)
Consultants to the Independent Trustees*
| Name, address, year of birth | Position held with the Trust and length of service | Principal occupation(s) during the past five years and other relevant professional experience | Number of Funds in the Columbia Funds complex overseen | Other directorships held by Trustee during the past five years |
J. Kevin Connaughton
c/o Columbia
Management Investment
Advisers, LLC,
225 Franklin Street
Mail Drop BX32 05228,
Boston, MA 02110
1964 | Independent Trustee Consultant
2016 | Independent Trustee Consultant, Columbia Funds since March 2016; Managing Director and General Manager of Mutual Fund Products, Columbia Management Investment Advisers, LLC from May 2010 to February 2015; President, Columbia Funds from 2009 to 2015; and senior officer of Columbia Funds and affiliated funds from 2003 to 2015 | 57 | Board of Governors, Gateway Healthcare since January 2016; Trustee, New Century Portfolios since March 2015; and Director, The Autism Project since March 2015 |
Natalie A. Trunow
c/o Columbia
Management Investment
Advisers, LLC,
225 Franklin Street
Mail Drop BX32 05228,
Boston, MA 02110
1967 | Independent Trustee Consultant
2016 | Independent Trustee Consultant, Columbia Funds since September 2016; Chief Executive Officer, Millennial Partners (investment consulting services to institutions) since January 2016; Director of Investments, Casey Family Programs from April 2016 to September 2016; Senior Vice President and Chief Investment Officer, Calvert Investments from August 2008 to January 2016; Section Head and Portfolio Manager, General Motors Asset Management from June 1997 to August 2008 | 57 | Healthcare Services for Children with Special Needs |
| * | J. Kevin Connaughton was appointed consultant to the Independent Trustees effective March 1, 2016. Natalie A. Trunow was appointed consultant to the Independent Trustees effective September 1, 2016. Shareholders of the Funds are expected to be asked to elect each of Mr. Connaughton and Ms. Trunow as a Trustee at a future shareholder meeting. |
Interested trustee affiliated with Investment Manager*
| Name, address, year of birth | Position held with the Trust and length of service | Principal occupation(s) during the past five years and other relevant professional experience | Number of Funds in the Columbia Funds Complex overseen | Other directorships held by Trustee during the past five years |
William F. Truscott
c/o Columbia Management
Investment Advisers, LLC
225 Franklin Street
Boston, MA 02110
1960 | Trustee
2012 | Chairman of the Board and President, Columbia Management Investment Advisers, LLC since May 2010 and February 2012, respectively; Chief Executive Officer, Global Asset Management, Ameriprise Financial, Inc. since September 2012 (previously Chief Executive Officer, U.S. Asset Management & President, Annuities, May 2010-September 2012); Director and Chief Executive Officer, Columbia Management Investment Distributors, Inc. since May 2010 and February 2012, respectively;Chairman of the Board and Chief Executive Officer, RiverSource Distributors, Inc. since 2006; Director, Threadneedle Asset Management Holdings, SARL since 2014; President and Chief Executive Officer, Ameriprise Certificate Company, 2006-August 2012 | 183 | Chairman of the Board, Columbia Management Investment Advisers, LLC since May 2010; Director, Columbia Management Investment Distributors, Inc. since May 2010; former Director, Ameriprise Certificate Company, 2006 - January 2013 |
| * | Interested person (as defined under the 1940 Act) by reason of being an officer, director, security holder and/or employee of the Investment Manager or Ameriprise Financial. |
The Statement of Additional Information has additional information about the Fund’s Board members and is available,
without charge, upon request by calling 800.345.6611; contacting your financial intermediary; or visiting
investor.columbiathreadneedleus.com.
Columbia Small Cap Value Fund I | Annual Report 2017
| 37 |
TRUSTEES AND OFFICERS (continued)
The Board has appointed officers who are responsible for day-to-day business decisions based on policies it has established. The officers serve at the pleasure of the Board. The following table provides basic information about the Officers of the Fund, including principal occupations during the past five years, although their specific titles may have varied over the period. In addition to Mr. Truscott, who is Senior Vice President, the Fund’s other officers are:
Fund officers
Name,
address and
year of birth | Position and year
first appointed to
position for any Fund
in the Columbia
Funds complex or a
predecessor thereof | Principal occupation(s) during past five years |
Christopher O. Petersen
5228 Ameriprise
Financial Center
Minneapolis, MN 55474
Born 1970 | President and Principal Executive Officer (2015) | Vice President and Lead Chief Counsel, Ameriprise Financial, Inc. since January 2015 (previously, Vice President and Chief Counsel, January 2010 - December 2014; officer of Columbia Funds and affiliated funds since 2007. |
Michael G. Clarke
225 Franklin Street
Boston, MA 02110
Born 1969 | Treasurer (2011), Chief Financial Officer (2009) and Chief Accounting Officer (2015) | Vice President — Mutual Fund Administration, Columbia Management Investment Advisers, LLC, since May 2010; senior officer of Columbia Funds and affiliated funds since 2002. |
Paul B. Goucher
100 Park Avenue
New York, NY 10017
Born 1968 | Senior Vice President (2011) and Assistant Secretary (2008) | Senior Vice President and Assistant General Counsel, Ameriprise Financial, Inc. since January 2017 (previously Vice President and Lead Chief Counsel, November 2008 - January 2017 and January 2013 - January 2017, respectively; and Chief Counsel, January 2010 - January 2013); Vice President, Chief Legal Officer and Assistant Secretary, Columbia Management Investment Advisers, LLC since May 2010. |
Thomas P. McGuire
225 Franklin Street
Boston, MA 02110
Born 1972 | Senior Vice President and Chief Compliance Officer (2012) | Vice President — Asset Management Compliance, Ameriprise Financial, Inc., since May 2010; Chief Compliance Officer, Ameriprise Certificate Company since September 2010. |
Colin Moore
225 Franklin Street
Boston, MA 02110
Born 1958 | Senior Vice President (2010) | Executive Vice President and Global Chief Investment Officer, Ameriprise Financial, Inc., since July 2013; Executive Vice President and Global Chief Investment Officer, Columbia Management Investment Advisers, LLC since July 2013 (previously Director and Global Chief Investment Officer, 2010 - 2013). |
Michael E. DeFao
225 Franklin Street
Boston, MA 02110
Born 1968 | Vice President (2011) and Assistant Secretary (2010) | Vice President and Chief Counsel, Ameriprise Financial, Inc. since May 2010. |
Amy Johnson
5228 Ameriprise
Financial Center
Minneapolis, MN 55474
Born 1965 | Vice President (2006) | Managing Director and Global Head of Operations, Columbia Management Investment Advisers, LLC since April 2016 (previously Managing Director and Chief Operating Officer, 2010 - 2016). |
Lyn Kephart-Strong
5228 Ameriprise
Financial Center
Minneapolis, MN 55474
Born 1960 | Vice President (2015) | President, Columbia Management Investment Services Corp. since October 2014; Vice President & Resolution Officer, Ameriprise Trust Company since August 2009. |
Ryan C. Larrenaga
225 Franklin Street
Boston, MA 02110
Born 1970 | Senior Vice President (2017), Chief Legal Officer (2017) and Secretary (2015) | Vice President and Group Counsel, Ameriprise Financial, Inc. since August 2011; officer of Columbia Funds and affiliated funds since 2005. |
| 38 | Columbia Small Cap Value Fund I | Annual Report 2017 |
The Fund mails one shareholder report to each shareholder address. If you would like more than one report, please call shareholder services at 800.345.6611 and additional reports will be sent to you.
Proxy voting policies and procedures
The policy of the Board of Trustees is to vote the proxies of the companies in which the Fund holds investments consistent with the procedures as stated in the Statement of Additional Information (SAI). You may obtain a copy of the SAI without charge by calling 800.345.6611; contacting your financial intermediary; visiting investor.columbiathreadneedleus.com; or searching the website of the Securities and Exchange Commission (SEC) at sec.gov. Information regarding how the Fund voted proxies relating to portfolio securities is filed with the SEC by August 31st for the most recent 12-month period ending June 30th of that year, and is available without charge by visiting investor.columbiathreadneedleus.com, or searching the website of the SEC at sec.gov.
Quarterly schedule of investments
The Fund files a complete schedule of portfolio holdings with the SEC for the first and third quarters of each fiscal year on Form N-Q. The Fund’s Form N-Q is available on the SEC’s website at sec.gov and may be reviewed and copied at the SEC’s Public Reference Room in Washington, D.C. Information on the operation of the Public Reference Room may be obtained by calling 800.SEC.0330. The Fund’s complete schedule of portfolio holdings, as filed on Form N-Q, can also be obtained without charge, upon request, by calling 800.345.6611.
Additional Fund information
For more information about the Fund, please visit investor.columbiathreadneedleus.com or call 800.345.6611. Customer Service Representatives are available to answer your questions Monday through Friday from 8 a.m. to 7 p.m. Eastern time.
Fund investment manager
Columbia Management Investment Advisers, LLC
225 Franklin Street
Boston, MA 02110
Fund distributor
Columbia Management Investment Distributors, Inc.
225 Franklin Street
Boston, MA 02110
Fund transfer agent
Columbia Management Investment Services Corp.
P.O. Box 8081
Boston, MA 02266-8081
Columbia Small Cap Value Fund I | Annual Report 2017
| 39 |
[THIS PAGE INTENTIONALLY LEFT BLANK]
[THIS PAGE INTENTIONALLY LEFT BLANK]
Columbia Small Cap Value Fund I
P.O. Box 8081
Boston, MA 02266-8081
Please read and consider the investment objectives, risks, charges and expenses for any fund carefully before investing. For a prospectus and summary prospectus, which contains this and other important information about the Fund, go to
investor.columbiathreadneedleus.com. The Fund is distributed by Columbia Management Investment Distributors, Inc., member FINRA, and managed by Columbia Management Investment Advisers, LLC.
Columbia Threadneedle Investments (Columbia Threadneedle) is the global brand name of the Columbia and Threadneedle group of companies. All rights reserved. Columbia Management Investment Distributors, Inc., 225 Franklin Street, Boston, MA 02110-2804
© 2017 Columbia Management Investment Advisers, LLC.
investor.columbiathreadneedleus.com

Annual Report
April 30, 2017
Columbia Multi-Asset Income Fund
Not FDIC Insured • No bank guarantee • May lose value
Dear Shareholders,
While emotions have run high following the outcome of the U.S. Presidential election, it remains unclear how the Trump presidency will unfold in terms of policy. We have a sense of the priorities espoused by the President over the past eighteen months, but campaign priorities are not always realized and are often never pursued. What seems certain is that, while some investors have already priced expectations into the market, others have retreated, preferring instead a wait and see approach. The outcome of such behaviors appears to have created conditions ripe for ongoing market volatility.
While volatility in the financial markets can be stressful, volatility itself is not a new phenomenon. Other factors that have been at the root cause of recent volatility include uncertainty following the United Kingdom’s vote to exit the European Union (Brexit), speculation around the Federal Reserve’s decision to increase interest rates, divergent central bank policy and geopolitical unrest. The point is, financial markets have fluctuated for years and may be expected to continue to fluctuate — sometimes wildly. If anything, such volatility seems to be the new normal, perhaps exacerbated by access to information and development of technological tools which have enabled investors to react rapidly to real and perceived change. So what can you do?
Position your portfolio for the reality of market volatility
That there is a historical precedent for market volatility, or even an acceptance that it may persist, offers little comfort. A measured and strategic approach remains the best strategy for investors to stay on track in achieving their investment goals.
Step 1: Review your investment goals
Take this opportunity to review your investment goals and the strategies you are pursuing to achieve those goals in order to remain focused on what’s important to you. It is entirely possible that your goals have changed in response either to your life situation or to changes in the market. Accept what you can’t control — volatility, and focus on what you can — your investment goals and strategies.
Step 2: Reassess your risk tolerance
Sit down with your financial advisor to discuss your investment goals and strategies, as well as any changes to your tolerance for risk. Consider your investment horizon. Increased market volatility and a new investment horizon may impact the strategies that can best help you achieve your investment goals. Remember, achieving your investment goals may require a certain amount of risk. Ultimately, you must maintain vigilance in reassessing your risk tolerance and the strategies you have selected in pursuit of your investment goals, and awareness of how those strategies may react to market volatility.
Step 3: Remain calm and focus on your long-term plan
Remember, investing is about the long game. Short term events are not necessarily evidence of a longer term reality. Investors who attempt to time the market too often end up reacting to a down turn by selling low and then compounding the problem by waiting on the sidelines, ultimately missing the right opportunity to reinvest.
Columbia Multi-Asset Income Fund | Annual Report 2017
President’s Message (continued)
As long as there is a market, there will be volatility. How you respond to that volatility can make a big difference in the measure of your success as an investor. Talk to your financial advisor about how working with Columbia Threadneedle Investments may help you position your portfolio for the reality of ongoing volatility and, perhaps, even turn such volatility into investment opportunity.
Sincerely,
Christopher O. Petersen
President, Columbia Funds
Investors should consider the investment objectives, risks, charges and expenses of a mutual fund carefully before investing. For a free prospectus and summary prospectus, which contains this and other important information about a fund, visit investor.columbiathreadneedleus.com. The prospectus should be read carefully before investing.
Columbia Funds are distributed by Columbia Management Investment Distributors, Inc., member FINRA, and managed by Columbia Management Investment Advisers, LLC.
© 2017 Columbia Management Investment Advisers, LLC. All rights reserved.
Columbia Multi-Asset Income Fund | Annual Report 2017
Columbia Multi-Asset Income Fund | Annual Report 2017
Investment objective
Columbia Multi-Asset Income Fund (the Fund) seeks to provide shareholders with a high level of current income. The Fund’s secondary objective is total return.
Portfolio management
Jeffrey Knight, CFA
Co-manager
Managed Fund since 2015
Anwiti Bahuguna, Ph.D.
Co-manager
Managed Fund since 2015
Dan Boncarosky, CFA
Co-manager
Managed Fund since 2015
Joshua Kutin, CFA
Co-manager
Managed Fund since 2015
| Average annual total returns (%) (for the period ended April 30, 2017) |
| | | Inception | 1 Year | Life |
| Class A | Excluding sales charges | 03/27/15 | 8.88 | 4.18 |
| | Including sales charges | | 3.71 | 1.78 |
| Class C | Excluding sales charges | 03/27/15 | 8.07 | 3.40 |
| | Including sales charges | | 7.07 | 3.40 |
| Class R4 | 03/27/15 | 9.17 | 4.45 |
| Class R5 | 03/27/15 | 9.22 | 4.49 |
| Class T | Excluding sales charges | 03/27/15 | 8.89 | 4.19 |
| | Including sales charges | | 6.19 | 2.92 |
| Class Y * | 03/01/17 | 8.83 | 4.16 |
| Class Z | 03/27/15 | 9.27 | 4.50 |
| Blended Benchmark | | 7.43 | 4.83 |
| Bloomberg Barclays U.S. Aggregate Bond Index | | 0.83 | 1.57 |
Returns for Class A are shown with and without the maximum initial sales charge of 4.75%. Returns for Class C are shown with and without the 1.00% CDSC for the first year only. The returns for Class T shares are shown with and without the maximum applicable sales charge of 2.50% per transaction. Prior to March 27, 2017, Class T shares were known as Class W shares and were sold without a sales charge. The Fund’s other classes are not subject to sales charges and have limited eligibility. Please see the Fund’s prospectus for details. Performance for different share classes will vary based on differences in sales charges and fees associated with each class. All results shown assume reinvestment of distributions during the period. Returns do not reflect the deduction of taxes that a shareholder may pay on Fund distributions or on the redemption of Fund shares. Performance results reflect the effect of any fee waivers or reimbursements of Fund expenses by Columbia Management Investment Advisers, LLC and/or any of its affiliates. Absent these fee waivers or expense reimbursement arrangements, performance results would have been lower.
The performance information shown represents past performance and is not a guarantee of future results. The investment return and principal value of your investment will fluctuate so that your shares, when redeemed, may be worth more or less than their original cost. Current performance may be lower or higher than the performance information shown. You may obtain performance information current to the most recent month-end by contacting your financial intermediary, visiting investor.columbiathreadneedleus.com or calling 800.345.6611.
| * | The returns shown for periods prior to the share class inception date (including returns for the Life of the Fund, if shown, which are since Fund inception) include the returns of the Fund’s oldest share class. These returns are adjusted to reflect any higher class-related operating expenses of the newer share classes, as applicable. Please visit investor.columbiathreadneedleus.com/investment-products/mutual-funds/appended-performance for more information. |
The Blended Index is a weighted custom composite consisting of 60% Bloomberg Barclays U.S. Aggregate Bond Index and 40% S&P 500 Index. The S&P 500 Index, an unmanaged index, measures the performance of 500 widely held, large capitalization U.S. stocks and is frequently used as a general measure of market performance.
The Bloomberg Barclays U.S. Aggregate Bond Index is a broad-based benchmark that measures the investment-grade, U.S. dollar denominated, fixed-rate taxable bond market, including Treasuries, government-related and corporate securities, mortgage-backed securities (agency fixed-rate and hybrid adjustable-rate mortgage passthroughs), asset-backed securities, and commercial mortgage-backed securities.
Indices are not available for investment, are not professionally managed and do not reflect sales charges, fees, brokerage commissions, taxes or other expenses of investing. Securities in the Fund may not match those in an index.
Columbia Multi-Asset Income Fund | Annual Report 2017
| 3 |
Fund at a Glance (continued)
Performance of a hypothetical $10,000 investment (March 27, 2015 — April 30, 2017)
The chart above shows the change in value of a hypothetical $10,000 investment in Class A shares of Columbia Multi-Asset Income Fund during the stated time period, and does not reflect the deduction of taxes that a shareholder may pay on Fund distributions or on the redemption of Fund shares.
| Top 10 holdings (%) (at April 30, 2017) |
| SPDR Blackstone/GSO Senior Loan ETF | 4.7 |
Societe Generale SA
10/02/17 12.750% | 3.5 |
Barclays Bank PLC
09/11/17 12.080% | 3.5 |
Deutsche Bank AG
08/07/17 12.850% | 3.4 |
Nomura International Funding Pte. Ltd
07/12/17 13.450% | 3.4 |
Royal Bank of Canada
05/05/17 14.430% | 3.3 |
BNP Paribas
06/06/17 14.150% | 3.3 |
| SPDR Bloomberg Barclays Convertible Securities ETF | 3.2 |
| SPDR Bloomberg Barclays Long Term Corporate Bond ETF | 2.3 |
| Global X SuperDividend ETF | 1.7 |
Percentages indicated are based upon total investments (excluding Money Market Funds).
For further detail about these holdings, please refer to the section entitled “Portfolio of Investments.”
Fund holdings are as of the date given, are subject to change at any time, and are not recommendations to buy or sell any security.
| Portfolio breakdown (%) (at April 30, 2017) |
| Asset-Backed Securities — Non-Agency | 1.8 |
| Commercial Mortgage-Backed Securities - Non-Agency | 0.6 |
| Common Stocks | 8.6 |
| Corporate Bonds & Notes | 23.8 |
| Equity-Linked Notes | 19.3 |
| Exchange-Traded Funds | 12.8 |
| Foreign Government Obligations | 11.4 |
| Limited Partnerships | 4.0 |
| Money Market Funds | 6.0 |
| Residential Mortgage-Backed Securities - Agency | 3.0 |
| Residential Mortgage-Backed Securities - Non-Agency | 5.7 |
| Senior Loans | 0.2 |
| U.S. Treasury Obligations | 2.8 |
| Total | 100.0 |
Percentages indicated are based upon total investments. The Fund’s portfolio composition is subject to change.
| 4 | Columbia Multi-Asset Income Fund | Annual Report 2017 |
Manager Discussion of Fund Performance
For the 12-month period that ended April 30, 2017, the Fund’s Class A shares returned 8.88% excluding sales charges. During the same time period, the Fund outperformed its blended index, which returned 7.43%, as well as the Bloomberg Barclays U.S. Aggregate Bond Index, which returned 0.83%. To compare, the S&P 500 Index returned 17.92% for the same period. The Fund’s performance is primarily attributable to a combination of asset allocation decisions and security selection across the asset class spectrum.
Fixed-income markets significantly lagged equities
The annual period ended April 30, 2017 saw a market environment with positive absolute returns in most asset classes, although riskier asset classes, such as equities, generally outperformed other asset classes, rewarding investors with double-digit gains. The unexpected vote by the U.K. to leave the European Union, popularly known as Brexit; the surprise outcome of the U.S. presidential election; and two interest rate increases by the Federal Reserve based on better U.S. economic growth were among the key factors that boosted investor confidence. Within the broad equities market, U.S. equities performed better than their developed international equity counterparts. More specifically, the S&P 500 Index, representing the larger companies in the U.S. equity market, returned 17.92% for the annual period, while the MSCI EAFE Index (Net), representing developed international equities, posted a return of 11.29% for the same period. Within the U.S., high dividend-paying equities, as represented by the MSCI USA High Dividend Yield Index, posted a return of 14.99%. Preferred stocks posted a return of 6.50%, as represented by the Bank of America Merrill Lynch (BofAML) Preferred Stock Fixed Rate Index.
Among alternative asset classes, convertible securities were strong performers, as the BofAML All Convertibles All Qualities Index posted an impressive return of 17.71% for the annual period. Master limited partnerships (MLPs) also performed well, with the Alerian MLP Index posting a return of 14.08%. Real estate investment trusts (REITs) and floating rate loans generated less robust, yet still solid, positive returns of 6.22% and 8.16%, respectively, as measured by the FTSE NAREIT Equity REITs Index and the Credit Suisse Leveraged Loan Index.
More traditional fixed income generated positive returns as well, although returns more muted in comparison. Still, within this asset class, too, investors willing to take on more risk were rewarded during the annual period, as high-yield corporate bonds and emerging market bonds both posted strong gains. The BofAML U.S. High Yield-Cash Pay-Constrained Index posted a return of 13.56% during the annual period, while the JPMorgan Emerging Markets Bond Index-Global gained 8.52% for the same period. Long maturity investment-grade corporate bonds posted a solid return of 4.31%, as measured by the Bloomberg Barclays U.S. Corporate Investment Grade Long Index. Securitized bonds, including mortgage-backed securities, generated a more modest return of 0.7%, as measured by the Bloomberg Barclays U.S. Securitized Index. U.S. Treasuries were one of the few segments of the fixed-income market to post a negative, albeit modestly so, return for the annual period, with the Bloomberg Barclays Treasury Index returning -0.65%.
Positioning performance generated mixed results
Overall, asset allocation decisions contributed positively to the Fund’s relative results during the annual period. The Fund had an underweight to fixed income, which helped as fixed income underperformed equities during the annual period. Despite that, fixed-income positioning within the Fund was the largest positive contributor to relative outperformance, while equity income positioning generally detracted.
More specifically, within the Fund’s fixed-income allocation, exposure to high-yield corporate bonds and emerging market debt were the biggest positive contributor to relative results. Underlying security selection decisions within the emerging market debt sector also bolstered relative performance. A position in U.S. Treasuries, which posted negative absolute returns detracted, but the Fund had only modest exposure to the sector, so the effect was relatively small.
Within the Fund’s equity allocation, positions in preferred stocks and covered call-writing strategies detracted from relative results, as these positions did not keep pace with the strong absolute returns of the S&P 500 Index during the annual period. Still, underlying security selection among preferred stocks added value. Positions in dividend-paying equities detracted from relative returns.
Columbia Multi-Asset Income Fund | Annual Report 2017
| 5 |
Manager Discussion of Fund Performance (continued)
Among non-traditional income sources, REITs were the biggest detractor from the Fund’s relative results, as these positions did not keep pace with the strong absolute returns of the S&P 500 Index. Selection within REITs was a positive contributor to the Fund’s results, but was not enough to offset the negative allocation effect. Bank loans contributed positively to relative results, as the asset class outpaced the Bloomberg Barclays U.S. Aggregate Bond Index during the annual period. Security selection amongst bank loans, however, detracted, as the Fund’s returns within the sector lagged those of the Credit Suisse Leveraged Loan Index. Exposure to MLPs contributed positively, albeit modestly, to the Fund’s relative performance during the annual period.
Various factors drove portfolio changes
Asset class changes within the Fund can be driven by active trading, by tactically adjusting allocations to select asset classes or by market appreciation or depreciation within a given asset class. During the annual period, we decreased the Fund’s allocation to fixed income overall. However, within traditional fixed income, we increased the Fund’s weighting to emerging market bonds given the relative value advantage of emerging market debt spreads, or yield differentials to U.S. Treasuries, relative to other fixed-income sectors. We decreased the Fund’s exposure to securitized bonds, as we found other sectors’ return profiles to be more favorable, and to U.S. Treasuries, as we had a conservative outlook for interest rate risk. In other asset classes, we increased the Fund’s allocation to equities, especially seeking opportunities to do so on market weakness. Among non-traditional income sources, we increased the Fund’s allocation to convertible bonds, given their equity sensitivity, and allowed the Fund’s exposure to MLPs to drift downward, as we had higher conviction in other income-generating sectors.
Derivative positions in the Fund
During the annual period, we used equity linked notes to implement our covered call writing strategy. We used credit default swap indices to manage the Fund’s emerging market debt exposure. We used U.S. Treasury futures to manage the Fund’s duration positioning. The use of these equity linked notes, credit default swap indices and U.S. Treasury futures detracted from the Fund’s relative performance. We used equity futures for hedging purposes and to manage the Fund’s investment exposures. The use of equity futures added value to the Fund’s relative results during the annual period.
Investing in derivatives is a specialized activity that involves special risks that subject the Fund to significant loss potential, including when used as leverage, and may result in greater fluctuation in fund value. Asset allocation does not assure a profit or protect against loss. International investing involves certain risks and volatility due to potential political, economic or currency instabilities and different financial and accounting standards. Risks are enhanced for emerging market issuers. Market or other (e.g., interest rate) environments may adversely affect the liquidity of fund investments, negatively impacting their price. Generally, the less liquid the market at the time the Fund sells a holding, the greater the risk of loss or decline of value to the Fund. Investments in Equity-Linked Notes (ELNs) have the potential to lead to significant losses because ELNs are subject to the market and volatility risks associated with their underlying equity. In addition, because ELNs often take the form of unsecured notes of the issuer, the Fund may be subject to counterparty risk that the issuer may default on its obligations under the ELN. Market risk may affect a single issuer, sector of the economy, industry or the market as a whole. The Fund’s investment in other funds subjects it to the investment performance (positive or negative), risks and expenses of these underlying funds. Fixed-income securities present issuer default risk. A rise in interest rates may result in a price decline of fixed-income instruments held by the Fund, negatively impacting its performance and NAV. Falling rates may result in the Fund investing in lower yielding debt instruments, lowering the Fund’s income and yield. These risks may be heightened for longer maturity and duration securities. Non-investment-grade (high-yield or junk) securities present greater price volatility and more risk to principal and income than higher rated securities. Prepayment and extension risk exists because the timing of payments on a loan, bond or other investment may accelerate when interest rates fall or decelerate when interest rates rise which may reduce investment opportunities and potential returns. See the Fund’s prospectus for more information on these and other risks.
The views expressed in this report reflect the current views of the respective parties. These views are not guarantees of future performance and involve certain risks, uncertainties and assumptions that are difficult to predict, so actual outcomes and results may differ significantly from the views expressed. These views are subject to change at any time based upon economic, market or other conditions and the respective parties disclaim any responsibility to update such views. These
| 6 | Columbia Multi-Asset Income Fund | Annual Report 2017 |
Manager Discussion of Fund Performance (continued)
views may not be relied on as investment advice and, because investment decisions for a Columbia fund are based on numerous factors, may not be relied on as an indication of trading intent on behalf of any particular Columbia fund. References to specific securities should not be construed as a recommendation or investment advice.
Columbia Multi-Asset Income Fund | Annual Report 2017
| 7 |
Understanding Your Fund’s Expenses
(Unaudited)
As an investor, you incur two types of costs. There are transaction costs, which generally include sales charges on purchases and may include redemption fees. There are also ongoing costs, which generally include management fees, distribution and/or service fees, and other fund expenses. The following information is intended to help you understand your ongoing costs (in dollars) of investing in the Fund and to help you compare these costs with the ongoing costs of investing in other mutual funds.
Analyzing your Fund’s expenses
To illustrate these ongoing costs, we have provided examples and calculated the expenses paid by investors in each share class of the Fund during the period. The actual and hypothetical information in the table is based on an initial investment of $1,000 at the beginning of the period indicated and held for the entire period. Expense information is calculated two ways and each method provides you with different information. The amount listed in the “Actual” column is calculated using the Fund’s actual operating expenses and total return for the period. You may use the Actual information, together with the amount invested, to estimate the expenses that you paid over the period. Simply divide your account value by $1,000 (for example, an $8,600 account value divided by $1,000 = 8.6), then multiply the results by the expenses paid during the period under the “Actual” column. The amount listed in the “Hypothetical” column assumes a 5% annual rate of return before expenses (which is not the Fund’s actual return) and then applies the Fund’s actual expense ratio for the period to the hypothetical return. You should not use the hypothetical account values and expenses to estimate either your actual account balance at the end of the period or the expenses you paid during the period. See “Compare with other funds” below for details on how to use the hypothetical data.
Compare with other funds
Since all mutual funds are required to include the same hypothetical calculations about expenses in shareholder reports, you can use this information to compare the ongoing cost of investing in the Fund with other funds. To do so, compare the hypothetical example with the 5% hypothetical examples that appear in the shareholder reports of other funds. As you compare hypothetical examples of other funds, it is important to note that hypothetical examples are meant to highlight the ongoing costs of investing in a fund only and do not reflect any transaction costs, such as sales charges, or redemption or exchange fees. Therefore, the hypothetical calculations are useful in comparing ongoing costs only, and will not help you determine the relative total costs of owning different funds. If transaction costs were included in these calculations, your costs would be higher.
| November 1, 2016 — April 30, 2017 |
| | Account value at the
beginning of the
period ($) | Account value at the
end of the
period ($) | Expenses paid during
the period ($) | Fund’s annualized
expense ratio (%) |
| | Actual | Hypothetical | Actual | Hypothetical | Actual | Hypothetical | Actual |
| Class A | 1,000.00 | 1,000.00 | 1,049.30 | 1,019.91 | 4.72 | 4.66 | 0.94 |
| Class C | 1,000.00 | 1,000.00 | 1,046.50 | 1,016.23 | 8.48 | 8.36 | 1.69 |
| Class R4 | 1,000.00 | 1,000.00 | 1,051.70 | 1,021.14 | 3.47 | 3.42 | 0.69 |
| Class R5 | 1,000.00 | 1,000.00 | 1,050.90 | 1,021.33 | 3.27 | 3.22 | 0.65 |
| Class T (formerly Class W) | 1,000.00 | 1,000.00 | 1,049.30 | 1,019.91 | 4.72 | 4.66 | 0.94 |
| Class Y | 1,000.00 | 1,000.00 | 1,006.60 (a) | 1,021.58 | 0.94 (a) | 2.97 | 0.60 (a) |
| Class Z | 1,000.00 | 1,000.00 | 1,051.70 | 1,021.14 | 3.47 | 3.42 | 0.69 |
| (a) | Based on operations from March 1, 2017 (commencement of operations) through the stated period end. |
Expenses paid during the period are equal to the annualized expense ratio for each class as indicated above, multiplied by the average account value over the period and then multiplied by the number of days in the Fund’s most recent fiscal half year and divided by 365.
Expenses do not include fees and expenses incurred indirectly by the Fund from its investment in underlying funds, including affiliated and non-affiliated pooled investment vehicles, such as mutual funds and exchange-traded funds.
Had Columbia Management Investment Advisers, LLC and/or certain of its affiliates not waived/reimbursed certain fees and expenses, account value at the end of the period would have been reduced.
| 8 | Columbia Multi-Asset Income Fund | Annual Report 2017 |
Portfolio of Investments
April 30, 2017
(Percentages represent value of investments compared to net assets)
| Asset-Backed Securities — Non-Agency 1.8% |
| Issuer | Coupon
Rate | | Principal
Amount ($) | Value ($) |
| ALM XIV Ltd.(a),(b) |
| Series 2014-14A Class C |
| 07/28/26 | 4.622% | | 500,000 | 500,067 |
| Conn Funding II LP(a) |
| Series 2017-A Class B |
| 05/15/20 | 5.110% | | 300,000 | 300,000 |
| Marlette Funding Trust(a) |
| Series 2017-1A Class A |
| 03/15/24 | 2.827% | | 1,500,000 | 1,502,269 |
Total Asset-Backed Securities — Non-Agency
(Cost $2,288,029) | 2,302,336 |
|
| Commercial Mortgage-Backed Securities - Non-Agency 0.6% |
| | | | |
| BHMS Mortgage Trust(a),(b) |
| Series 2014-ATLS Class DFX |
| 07/05/33 | 5.483% | | 500,000 | 499,183 |
| Rialto Real Estate Fund LLC(a) |
| Subordinated, Series 2015-LT7 Class B |
| 12/25/32 | 5.071% | | 350,000 | 349,850 |
Total Commercial Mortgage-Backed Securities - Non-Agency
(Cost $861,325) | 849,033 |
| Common Stocks 8.6% |
| Issuer | Shares | Value ($) |
| Consumer Discretionary 0.1% |
| Hotels, Restaurants & Leisure —% |
| Las Vegas Sands Corp. | 889 | 52,442 |
| Multiline Retail 0.1% |
| Kohl’s Corp. | 1,198 | 46,758 |
| Nordstrom, Inc. | 265 | 12,792 |
| Total | | 59,550 |
| Total Consumer Discretionary | 111,992 |
| Consumer Staples 0.9% |
| Household Products 0.1% |
| Procter & Gamble Co. (The) | 1,436 | 125,406 |
| Tobacco 0.8% |
| Altria Group, Inc. | 3,773 | 270,826 |
| British American Tobacco PLC | 1,824 | 123,201 |
| Imperial Brands PLC | 2,860 | 140,095 |
| Philip Morris International, Inc. | 3,839 | 425,515 |
| Reynolds American, Inc. | 564 | 36,378 |
| Total | | 996,015 |
| Total Consumer Staples | 1,121,421 |
| Common Stocks (continued) |
| Issuer | Shares | Value ($) |
| Energy 1.4% |
| Oil, Gas & Consumable Fuels 1.4% |
| BP PLC, ADR | 3,929 | 134,843 |
| Chevron Corp. | 2,655 | 283,289 |
| Enbridge, Inc. | 1,123 | 46,549 |
| ENI SpA | 4,178 | 64,944 |
| Exxon Mobil Corp. | 1,751 | 142,969 |
| Hess Corp. | 112 | 5,469 |
| Kinder Morgan, Inc. | 16,303 | 336,331 |
| Occidental Petroleum Corp. | 2,419 | 148,865 |
| Royal Dutch Shell PLC, Class A | 3,425 | 88,832 |
| Targa Resources Corp. | 8,156 | 449,640 |
| Total SA | 1,431 | 73,528 |
| Valero Energy Corp. | 1,331 | 85,996 |
| Total | | 1,861,255 |
| Total Energy | 1,861,255 |
| Financials 0.3% |
| Banks 0.2% |
| Bank of America Corp. | 2,310 | 53,915 |
| Bank of Montreal | 1,070 | 75,810 |
| JPMorgan Chase & Co. | 450 | 39,150 |
| PacWest Bancorp | 557 | 27,510 |
| Toronto-Dominion Bank (The) | 684 | 32,210 |
| Total | | 228,595 |
| Capital Markets 0.1% |
| Invesco Ltd. | 1,195 | 39,363 |
| Morgan Stanley | 1,208 | 52,391 |
| Total | | 91,754 |
| Insurance —% |
| Principal Financial Group, Inc. | 1,146 | 74,639 |
| Mortgage Real Estate Investment Trusts (REITS) —% |
| Altisource Residential Corp. | 4,047 | 58,196 |
| Total Financials | 453,184 |
| Health Care 0.6% |
| Biotechnology —% |
| AbbVie, Inc. | 630 | 41,542 |
The accompanying Notes to Financial Statements are an integral part of this statement.
Columbia Multi-Asset Income Fund | Annual Report 2017
| 9 |
Portfolio of Investments (continued)
April 30, 2017
| Common Stocks (continued) |
| Issuer | Shares | Value ($) |
| Pharmaceuticals 0.6% |
| GlaxoSmithKline PLC | 4,442 | 89,176 |
| Johnson & Johnson | 1,745 | 215,455 |
| Merck & Co., Inc. | 2,501 | 155,887 |
| Pfizer, Inc. | 6,994 | 237,237 |
| Sanofi | 68 | 6,416 |
| Teva Pharmaceutical Industries Ltd., ADR | 971 | 30,664 |
| Total | | 734,835 |
| Total Health Care | 776,377 |
| Industrials 0.2% |
| Aerospace & Defense 0.1% |
| BAE Systems PLC | 7,832 | 63,603 |
| Lockheed Martin Corp. | 94 | 25,328 |
| Total | | 88,931 |
| Airlines —% |
| American Airlines Group, Inc. | 170 | 7,245 |
| Industrial Conglomerates —% |
| Siemens AG, Registered Shares | 332 | 47,593 |
| Road & Rail 0.1% |
| Kansas City Southern | 958 | 86,287 |
| Total Industrials | 230,056 |
| Information Technology 0.7% |
| Communications Equipment 0.2% |
| Cisco Systems, Inc. | 6,876 | 234,265 |
| Nokia OYJ | 6,420 | 36,715 |
| Telefonaktiebolaget LM Ericsson, Class B | 889 | 5,731 |
| Total | | 276,711 |
| IT Services 0.1% |
| International Business Machines Corp. | 672 | 107,715 |
| Semiconductors & Semiconductor Equipment 0.2% |
| Intel Corp. | 7,132 | 257,822 |
| Software 0.2% |
| Microsoft Corp. | 3,349 | 229,272 |
| Oracle Corp. | 383 | 17,220 |
| Total | | 246,492 |
| Total Information Technology | 888,740 |
| Common Stocks (continued) |
| Issuer | Shares | Value ($) |
| Materials 0.2% |
| Chemicals 0.1% |
| CF Industries Holdings, Inc. | 1,310 | 35,029 |
| Dow Chemical Co. (The) | 2,420 | 151,976 |
| Eastman Chemical Co. | 285 | 22,729 |
| Total | | 209,734 |
| Containers & Packaging 0.1% |
| Graphic Packaging Holding Co. | 1,647 | 22,366 |
| International Paper Co. | 1,208 | 65,196 |
| Total | | 87,562 |
| Total Materials | 297,296 |
| Real Estate 3.3% |
| Equity Real Estate Investment Trusts (REITS) 3.3% |
| Alexandria Real Estate Equities, Inc. | 2,112 | 237,621 |
| Armada Hoffler Properties, Inc. | 1,962 | 27,978 |
| Ashford Hospitality Trust, Inc. | 4,367 | 27,294 |
| Brandywine Realty Trust | 2,833 | 48,076 |
| Chesapeake Lodging Trust | 2,181 | 50,839 |
| Coresite Realty Corp. | 623 | 60,961 |
| Digital Realty Trust, Inc. | 2,840 | 326,146 |
| Duke Realty Corp. | 1,632 | 45,255 |
| DuPont Fabros Technology, Inc. | 1,288 | 66,396 |
| EastGroup Properties, Inc. | 1,422 | 111,272 |
| Education Realty Trust, Inc. | 1,827 | 70,833 |
| EPR Properties | 2,495 | 181,411 |
| Four Corners Property Trust, Inc. | 2,040 | 47,593 |
| Gaming and Leisure Properties, Inc. | 4,022 | 139,966 |
| GEO Group, Inc. (The) | 4,269 | 142,243 |
| Getty Realty Corp. | 2,735 | 70,016 |
| Gladstone Commercial Corp. | 1,695 | 37,799 |
| Government Properties Income Trust | 2,789 | 59,461 |
| HCP, Inc. | 4,929 | 154,524 |
| Healthcare Trust of America, Inc., Class A | 3,772 | 120,289 |
| Highwoods Properties, Inc. | 2,786 | 141,752 |
| Host Hotels & Resorts, Inc. | 6,211 | 111,487 |
| LaSalle Hotel Properties | 1,782 | 50,894 |
| Lexington Realty Trust | 12,790 | 130,074 |
| Life Storage, Inc. | 791 | 62,007 |
The accompanying Notes to Financial Statements are an integral part of this statement.
| 10 | Columbia Multi-Asset Income Fund | Annual Report 2017 |
Portfolio of Investments (continued)
April 30, 2017
| Common Stocks (continued) |
| Issuer | Shares | Value ($) |
| Medical Properties Trust, Inc. | 6,986 | 91,307 |
| Mid-America Apartment Communities, Inc. | 876 | 86,908 |
| One Liberty Properties, Inc. | 2,576 | 62,545 |
| Outfront Media, Inc. | 1,586 | 41,490 |
| Pebblebrook Hotel Trust | 2,591 | 77,108 |
| Physicians Realty Trust | 4,761 | 93,506 |
| Ramco-Gershenson Properties Trust | 4,535 | 60,452 |
| Retail Properties of America, Inc., Class A | 4,076 | 54,374 |
| RLJ Lodging Trust | 4,074 | 87,550 |
| Sabra Health Care REIT, Inc. | 1,594 | 43,341 |
| Select Income REIT | 3,354 | 84,051 |
| Senior Housing Properties Trust | 1,890 | 40,673 |
| Spirit Realty Capital, Inc. | 12,507 | 117,816 |
| STAG Industrial, Inc. | 8,848 | 233,233 |
| Sun Communities, Inc. | 1,879 | 157,103 |
| UDR, Inc. | 2,492 | 93,051 |
| Ventas, Inc. | 998 | 63,882 |
| Washington Prime Group, Inc. | 14,591 | 128,401 |
| WP Carey, Inc. | 1,830 | 114,558 |
| Total | | 4,253,536 |
| Total Real Estate | 4,253,536 |
| Telecommunication Services 0.5% |
| Diversified Telecommunication Services 0.4% |
| AT&T, Inc. | 7,717 | 305,825 |
| BCE, Inc. | 1,248 | 56,871 |
| CenturyLink, Inc. | 3,169 | 81,348 |
| Orange SA | 2,495 | 38,593 |
| Verizon Communications, Inc. | 1,169 | 53,669 |
| Total | | 536,306 |
| Wireless Telecommunication Services 0.1% |
| Vodafone Group PLC | 7,187 | 18,529 |
| Vodafone Group PLC, ADR | 1,351 | 35,382 |
| Total | | 53,911 |
| Total Telecommunication Services | 590,217 |
| Common Stocks (continued) |
| Issuer | Shares | Value ($) |
| Utilities 0.4% |
| Electric Utilities 0.3% |
| American Electric Power Co., Inc. | 995 | 67,491 |
| Duke Energy Corp. | 1,159 | 95,617 |
| Entergy Corp. | 414 | 31,572 |
| Exelon Corp. | 1,045 | 36,188 |
| PPL Corp. | 1,912 | 72,866 |
| Scottish & Southern Energy PLC | 1,689 | 30,429 |
| Xcel Energy, Inc. | 1,910 | 86,046 |
| Total | | 420,209 |
| Multi-Utilities 0.1% |
| Ameren Corp. | 1,290 | 70,550 |
| DTE Energy Co. | 558 | 58,361 |
| Veolia Environnement SA | 1,755 | 33,341 |
| Total | | 162,252 |
| Total Utilities | 582,461 |
Total Common Stocks
(Cost $10,285,832) | 11,166,535 |
| Corporate Bonds & Notes 23.6% |
| Issuer | Coupon
Rate | | Principal
Amount ($) | Value ($) |
| Aerospace & Defense 0.3% |
| Bombardier, Inc.(a) |
| 12/01/21 | 8.750% | | 56,000 | 62,300 |
| TransDigm, Inc. |
| 07/15/24 | 6.500% | | 102,000 | 104,805 |
| 05/15/25 | 6.500% | | 45,000 | 46,013 |
| 06/15/26 | 6.375% | | 137,000 | 138,027 |
| TransDigm, Inc.(a) |
| 05/15/25 | 6.500% | | 40,000 | 40,900 |
| Total | 392,045 |
| Automotive 0.3% |
| Eagle Holding Co., II LLC PIK(a),(c) |
| 05/15/22 | 7.625% | | 15,000 | 15,273 |
| Gates Global LLC/Co.(a) |
| 07/15/22 | 6.000% | | 104,000 | 104,520 |
| IHO Verwaltungs GmbH PIK(a) |
| 09/15/26 | 4.750% | | 33,000 | 32,670 |
| Schaeffler Finance BV(a) |
| 05/15/21 | 4.250% | | 94,000 | 96,096 |
The accompanying Notes to Financial Statements are an integral part of this statement.
Columbia Multi-Asset Income Fund | Annual Report 2017
| 11 |
Portfolio of Investments (continued)
April 30, 2017
| Corporate Bonds & Notes (continued) |
| Issuer | Coupon
Rate | | Principal
Amount ($) | Value ($) |
| ZF North America Capital, Inc.(a) |
| 04/29/25 | 4.750% | | 125,000 | 130,009 |
| Total | 378,568 |
| Banking 1.4% |
| Agromercantil Senior Trust(a) |
| 04/10/19 | 6.250% | | 200,000 | 205,410 |
| Ally Financial, Inc. |
| 05/19/22 | 4.625% | | 50,000 | 51,000 |
| 03/30/25 | 4.625% | | 113,000 | 111,517 |
| Banco de Bogota SA(a) |
| Subordinated |
| 05/12/26 | 6.250% | | 200,000 | 213,013 |
| Banco Mercantil del Norte SA(a),(b) |
| Subordinated |
| 10/04/31 | 5.750% | | 200,000 | 196,400 |
| Bank of New York Mellon Corp. (The)(b) |
| Junior Subordinated |
| 12/29/49 | 4.500% | | 185,000 | 176,444 |
| Citigroup, Inc.(b) |
| Junior Subordinated |
| 12/31/49 | 6.300% | | 170,000 | 179,401 |
| Fifth Third Bancorp(b) |
| Junior Subordinated |
| 12/31/49 | 5.100% | | 185,000 | 183,381 |
| JPMorgan Chase & Co.(b) |
| Junior Subordinated |
| 12/31/49 | 6.100% | | 230,000 | 246,675 |
| PNC Financial Services Group, Inc. (The)(b) |
| Junior Subordinated |
| 12/31/49 | 4.850% | | 15,000 | 15,030 |
| Wells Fargo & Co.(b) |
| Junior Subordinated |
| 12/31/49 | 5.900% | | 170,000 | 180,625 |
| Wells Fargo Capital X |
| Junior Subordinated |
| 12/15/36 | 5.950% | | 80,000 | 86,400 |
| Total | 1,845,296 |
| Brokerage/Asset Managers/Exchanges 0.0% |
| NPF Corp.(a) |
| 07/15/21 | 9.000% | | 14,000 | 14,805 |
| Building Materials 0.8% |
| Allegion PLC |
| 09/15/23 | 5.875% | | 32,000 | 34,160 |
| Allegion US Holding Co., Inc. |
| 10/01/21 | 5.750% | | 40,000 | 41,725 |
| Corporate Bonds & Notes (continued) |
| Issuer | Coupon
Rate | | Principal
Amount ($) | Value ($) |
| American Builders & Contractors Supply Co., Inc.(a) |
| 04/15/21 | 5.625% | | 28,000 | 28,805 |
| 12/15/23 | 5.750% | | 75,000 | 79,688 |
| Beacon Roofing Supply, Inc. |
| 10/01/23 | 6.375% | | 98,000 | 105,595 |
| Cementos Pacasmayo SAA(a) |
| 02/08/23 | 4.500% | | 200,000 | 204,000 |
| Cemex SAB de CV(a) |
| 04/16/26 | 7.750% | | 200,000 | 227,260 |
| Elementia SAB de CV(a) |
| 01/15/25 | 5.500% | | 200,000 | 203,000 |
| HD Supply, Inc.(a) |
| 04/15/24 | 5.750% | | 34,000 | 36,125 |
| US Concrete, Inc.(a) |
| 06/01/24 | 6.375% | | 37,000 | 38,665 |
| US Concrete, Inc. |
| 06/01/24 | 6.375% | | 21,000 | 21,945 |
| Total | 1,020,968 |
| Cable and Satellite 1.7% |
| Altice US Finance I Corp.(a) |
| 07/15/23 | 5.375% | | 33,000 | 34,444 |
| 05/15/26 | 5.500% | | 84,000 | 86,835 |
| CCO Holdings LLC/Capital Corp.(a) |
| 05/01/23 | 5.125% | | 178,000 | 185,787 |
| 04/01/24 | 5.875% | | 60,000 | 64,275 |
| 02/15/26 | 5.750% | | 47,000 | 49,922 |
| 05/01/26 | 5.500% | | 87,000 | 91,296 |
| Cequel Communications Holdings I LLC/Capital Corp.(a) |
| 12/15/21 | 5.125% | | 76,000 | 77,710 |
| 12/15/21 | 5.125% | | 26,000 | 26,585 |
| 07/15/25 | 7.750% | | 60,000 | 66,900 |
| CSC Holdings LLC |
| 06/01/24 | 5.250% | | 124,000 | 125,472 |
| CSC Holdings LLC(a) |
| 10/15/25 | 6.625% | | 83,000 | 90,678 |
| 10/15/25 | 10.875% | | 89,000 | 106,911 |
| DISH DBS Corp. |
| 06/01/21 | 6.750% | | 66,000 | 71,775 |
| 11/15/24 | 5.875% | | 21,000 | 22,050 |
| 07/01/26 | 7.750% | | 197,000 | 230,736 |
| Quebecor Media, Inc. |
| 01/15/23 | 5.750% | | 40,000 | 42,100 |
| Radiate HoldCo LLC/Finance, Inc.(a) |
| 02/15/25 | 6.625% | | 29,000 | 28,928 |
| Sirius XM Radio, Inc.(a) |
| 04/15/25 | 5.375% | | 50,000 | 51,250 |
| 07/15/26 | 5.375% | | 51,000 | 52,275 |
The accompanying Notes to Financial Statements are an integral part of this statement.
| 12 | Columbia Multi-Asset Income Fund | Annual Report 2017 |
Portfolio of Investments (continued)
April 30, 2017
| Corporate Bonds & Notes (continued) |
| Issuer | Coupon
Rate | | Principal
Amount ($) | Value ($) |
| Unitymedia GmbH(a) |
| 01/15/25 | 6.125% | | 174,000 | 185,764 |
| Videotron Ltd. |
| 07/15/22 | 5.000% | | 55,000 | 58,306 |
| Videotron Ltd./Ltee(a) |
| 04/15/27 | 5.125% | | 57,000 | 58,123 |
| Virgin Media Finance PLC(a) |
| 10/15/24 | 6.000% | | 284,000 | 297,490 |
| Ziggo Secured Finance BV(a) |
| 01/15/27 | 5.500% | | 134,000 | 137,354 |
| Total | 2,242,966 |
| Chemicals 0.9% |
| Angus Chemical Co.(a) |
| 02/15/23 | 8.750% | | 74,000 | 76,960 |
| Atotech USA, Inc.(a) |
| 02/01/25 | 6.250% | | 74,000 | 75,110 |
| Axalta Coating Systems LLC(a) |
| 08/15/24 | 4.875% | | 64,000 | 66,280 |
| Chemours Co. (The) |
| 05/15/23 | 6.625% | | 59,000 | 63,130 |
| 05/15/25 | 7.000% | | 73,000 | 80,209 |
| Eco Services Operations LLC/Finance Corp.(a) |
| 11/01/22 | 8.500% | | 62,000 | 65,410 |
| Huntsman International LLC |
| 11/15/22 | 5.125% | | 20,000 | 21,025 |
| INEOS Group Holdings SA(a) |
| 08/01/24 | 5.625% | | 92,000 | 93,610 |
| Koppers, Inc.(a) |
| 02/15/25 | 6.000% | | 21,000 | 21,998 |
| Mexichem SAB de CV(a) |
| 09/17/44 | 5.875% | | 200,000 | 197,900 |
| Olin Corp. |
| 09/15/27 | 5.125% | | 37,000 | 38,526 |
| Platform Specialty Products Corp.(a) |
| 05/01/21 | 10.375% | | 70,000 | 77,962 |
| 02/01/22 | 6.500% | | 25,000 | 25,625 |
| PQ Corp.(a) |
| 11/15/22 | 6.750% | | 122,000 | 131,455 |
| SPCM SA(a) |
| 09/15/25 | 4.875% | | 58,000 | 58,652 |
| WR Grace & Co.(a) |
| 10/01/21 | 5.125% | | 60,000 | 64,425 |
| Total | 1,158,277 |
| Corporate Bonds & Notes (continued) |
| Issuer | Coupon
Rate | | Principal
Amount ($) | Value ($) |
| Construction Machinery 0.2% |
| Ritchie Bros. Auctioneers, Inc.(a) |
| 01/15/25 | 5.375% | | 18,000 | 18,585 |
| United Rentals North America, Inc. |
| 06/15/23 | 6.125% | | 99,000 | 103,455 |
| 09/15/26 | 5.875% | | 63,000 | 66,465 |
| 05/15/27 | 5.500% | | 95,000 | 97,731 |
| Total | 286,236 |
| Consumer Cyclical Services 0.4% |
| APX Group, Inc. |
| 12/01/19 | 6.375% | | 10,000 | 10,350 |
| 12/01/20 | 8.750% | | 58,000 | 60,102 |
| 12/01/22 | 7.875% | | 91,000 | 99,190 |
| APX Group, Inc.(a) |
| 12/01/22 | 7.875% | | 40,000 | 43,600 |
| Carlson Travel, Inc.(a) |
| 12/15/23 | 6.750% | | 13,000 | 13,431 |
| IHS Markit Ltd.(a) |
| 11/01/22 | 5.000% | | 82,000 | 87,637 |
| 02/15/25 | 4.750% | | 79,000 | 82,654 |
| Interval Acquisition Corp. |
| 04/15/23 | 5.625% | | 139,000 | 143,170 |
| Total | 540,134 |
| Consumer Products 0.5% |
| American Greetings Corp.(a) |
| 02/15/25 | 7.875% | | 9,000 | 9,607 |
| Prestige Brands, Inc.(a) |
| 03/01/24 | 6.375% | | 85,000 | 90,950 |
| Scotts Miracle-Gro Co. (The) |
| 10/15/23 | 6.000% | | 122,000 | 130,387 |
| Scotts Miracle-Gro Co. (The)(a) |
| 12/15/26 | 5.250% | | 2,000 | 2,055 |
| Spectrum Brands, Inc. |
| 11/15/22 | 6.625% | | 20,000 | 21,050 |
| 12/15/24 | 6.125% | | 117,000 | 124,685 |
| 07/15/25 | 5.750% | | 44,000 | 47,164 |
| Springs Industries, Inc. |
| 06/01/21 | 6.250% | | 47,000 | 48,410 |
| Tempur Sealy International, Inc. |
| 10/15/23 | 5.625% | | 32,000 | 32,704 |
| 06/15/26 | 5.500% | | 76,000 | 75,573 |
| Valvoline, Inc.(a) |
| 07/15/24 | 5.500% | | 64,000 | 67,680 |
| Total | 650,265 |
The accompanying Notes to Financial Statements are an integral part of this statement.
Columbia Multi-Asset Income Fund | Annual Report 2017
| 13 |
Portfolio of Investments (continued)
April 30, 2017
| Corporate Bonds & Notes (continued) |
| Issuer | Coupon
Rate | | Principal
Amount ($) | Value ($) |
| Diversified Manufacturing 0.6% |
| Entegris, Inc.(a) |
| 04/01/22 | 6.000% | | 78,000 | 81,315 |
| General Electric Co.(b) |
| Junior Subordinated |
| 12/31/49 | 5.000% | | 470,000 | 499,281 |
| SPX FLOW, Inc.(a) |
| 08/15/24 | 5.625% | | 13,000 | 13,163 |
| 08/15/26 | 5.875% | | 48,000 | 48,600 |
| Welbilt, Inc. |
| 02/15/24 | 9.500% | | 23,000 | 26,565 |
| WESCO Distribution, Inc. |
| 06/15/24 | 5.375% | | 64,000 | 65,760 |
| Zekelman Industries, Inc.(a) |
| 06/15/23 | 9.875% | | 31,000 | 35,030 |
| Total | 769,714 |
| Electric 0.6% |
| AES Corp. (The) |
| 07/01/21 | 7.375% | | 94,000 | 107,160 |
| 05/15/26 | 6.000% | | 18,000 | 18,990 |
| Calpine Corp. |
| 02/01/24 | 5.500% | | 66,000 | 63,690 |
| Calpine Corp.(a) |
| 06/01/26 | 5.250% | | 99,000 | 99,495 |
| Dynegy, Inc. |
| 11/01/24 | 7.625% | | 25,000 | 22,875 |
| NRG Energy, Inc. |
| 07/15/22 | 6.250% | | 56,000 | 57,053 |
| 05/01/24 | 6.250% | | 61,000 | 60,787 |
| 05/15/26 | 7.250% | | 34,000 | 34,765 |
| 01/15/27 | 6.625% | | 61,000 | 60,390 |
| NRG Yield Operating LLC |
| 08/15/24 | 5.375% | | 114,000 | 116,565 |
| NRG Yield Operating LLC(a) |
| 09/15/26 | 5.000% | | 53,000 | 51,940 |
| Pattern Energy Group, Inc.(a) |
| 02/01/24 | 5.875% | | 70,000 | 71,837 |
| Total | 765,547 |
| Finance Companies 0.7% |
| Aircastle Ltd. |
| 03/15/21 | 5.125% | | 60,000 | 63,975 |
| 04/01/23 | 5.000% | | 8,000 | 8,540 |
| CIT Group, Inc. |
| 05/15/20 | 5.375% | | 128,000 | 137,760 |
| 08/01/23 | 5.000% | | 38,000 | 40,850 |
| Corporate Bonds & Notes (continued) |
| Issuer | Coupon
Rate | | Principal
Amount ($) | Value ($) |
| iStar, Inc. |
| 04/01/22 | 6.000% | | 48,000 | 49,200 |
| Navient Corp. |
| 03/25/20 | 8.000% | | 7,000 | 7,683 |
| 10/26/20 | 5.000% | | 99,000 | 100,856 |
| 07/26/21 | 6.625% | | 39,000 | 41,291 |
| 06/15/22 | 6.500% | | 69,000 | 71,329 |
| OneMain Financial Holdings LLC(a) |
| 12/15/21 | 7.250% | | 122,000 | 126,894 |
| Park Aerospace Holdings Ltd.(a) |
| 08/15/22 | 5.250% | | 28,000 | 29,575 |
| 02/15/24 | 5.500% | | 28,000 | 29,610 |
| Provident Funding Associates LP/Finance Corp.(a) |
| 06/15/21 | 6.750% | | 110,000 | 112,750 |
| Quicken Loans, Inc.(a) |
| 05/01/25 | 5.750% | | 51,000 | 51,510 |
| Springleaf Finance Corp. |
| 10/01/23 | 8.250% | | 29,000 | 30,939 |
| Total | 902,762 |
| Food and Beverage 0.8% |
| B&G Foods, Inc. |
| 06/01/21 | 4.625% | | 30,000 | 30,450 |
| 04/01/25 | 5.250% | | 39,000 | 39,927 |
| Chobani LLC/Finance Corp., Inc.(a) |
| 04/15/25 | 7.500% | | 55,000 | 56,719 |
| FAGE International SA/USA Dairy Industry, Inc.(a) |
| 08/15/26 | 5.625% | | 64,000 | 65,120 |
| Lamb Weston Holdings, Inc.(a) |
| 11/01/24 | 4.625% | | 25,000 | 25,813 |
| 11/01/26 | 4.875% | | 42,000 | 43,312 |
| MARB BondCo PLC(a) |
| 03/15/24 | 7.000% | | 200,000 | 202,240 |
| MHP SA(a) |
| 04/02/20 | 8.250% | | 200,000 | 208,000 |
| Pinnacle Foods Finance LLC/Corp. |
| 01/15/24 | 5.875% | | 38,000 | 40,517 |
| Post Holdings, Inc.(a) |
| 03/01/25 | 5.500% | | 24,000 | 25,080 |
| 08/15/26 | 5.000% | | 117,000 | 116,415 |
| 03/01/27 | 5.750% | | 97,000 | 100,759 |
| WhiteWave Foods Co. (The) |
| 10/01/22 | 5.375% | | 66,000 | 73,755 |
| Total | 1,028,107 |
| Gaming 0.8% |
| Boyd Gaming Corp. |
| 05/15/23 | 6.875% | | 31,000 | 33,364 |
| 04/01/26 | 6.375% | | 20,000 | 21,550 |
The accompanying Notes to Financial Statements are an integral part of this statement.
| 14 | Columbia Multi-Asset Income Fund | Annual Report 2017 |
Portfolio of Investments (continued)
April 30, 2017
| Corporate Bonds & Notes (continued) |
| Issuer | Coupon
Rate | | Principal
Amount ($) | Value ($) |
| GLP Capital LP/Financing II, Inc. |
| 04/15/26 | 5.375% | | 49,000 | 51,695 |
| International Game Technology PLC(a) |
| 02/15/22 | 6.250% | | 148,000 | 161,320 |
| Isle of Capri Casinos LLC(a) |
| 04/01/25 | 6.000% | | 30,000 | 31,012 |
| Jack Ohio Finance LLC/1 Corp.(a) |
| 11/15/21 | 6.750% | | 77,000 | 80,465 |
| MGM Growth Properties Operating Partnership LP/Finance Co-Issuer, Inc. |
| 05/01/24 | 5.625% | | 21,000 | 22,654 |
| 09/01/26 | 4.500% | | 27,000 | 26,899 |
| MGM Resorts International |
| 12/15/21 | 6.625% | | 98,000 | 110,005 |
| 03/15/23 | 6.000% | | 92,000 | 100,510 |
| Penn National Gaming, Inc.(a) |
| 01/15/27 | 5.625% | | 18,000 | 18,135 |
| Rivers Pittsburgh Borrower LP/Finance Corp.(a) |
| 08/15/21 | 6.125% | | 13,000 | 13,141 |
| Scientific Games International, Inc.(a) |
| 01/01/22 | 7.000% | | 218,000 | 233,395 |
| Scientific Games International, Inc. |
| 12/01/22 | 10.000% | | 102,000 | 110,670 |
| SugarHouse HSP Gaming LP/Finance Corp.(a) |
| 06/01/21 | 6.375% | | 65,000 | 66,248 |
| Total | 1,081,063 |
| Health Care 1.4% |
| Acadia Healthcare Co., Inc. |
| 07/01/22 | 5.125% | | 32,000 | 32,360 |
| 03/01/24 | 6.500% | | 32,000 | 33,920 |
| Amsurg Corp. |
| 07/15/22 | 5.625% | | 24,000 | 24,760 |
| Change Healthcare Holdings LLC/Finance, Inc.(a) |
| 03/01/25 | 5.750% | | 67,000 | 68,759 |
| CHS/Community Health Systems, Inc. |
| 02/01/22 | 6.875% | | 61,000 | 50,477 |
| 03/31/23 | 6.250% | | 116,000 | 118,030 |
| Envision Healthcare Corp.(a) |
| 12/01/24 | 6.250% | | 31,000 | 32,628 |
| Fresenius Medical Care U.S. Finance II, Inc.(a) |
| 01/31/22 | 5.875% | | 132,000 | 144,705 |
| HCA Holdings, Inc. |
| Junior Subordinated |
| 02/15/21 | 6.250% | | 163,000 | 176,855 |
| Corporate Bonds & Notes (continued) |
| Issuer | Coupon
Rate | | Principal
Amount ($) | Value ($) |
| HCA, Inc. |
| 02/15/20 | 6.500% | | 97,000 | 106,463 |
| 02/01/25 | 5.375% | | 137,000 | 142,651 |
| 02/15/26 | 5.875% | | 40,000 | 42,500 |
| 02/15/27 | 4.500% | | 72,000 | 72,683 |
| Hill-Rom Holdings, Inc.(a) |
| 02/15/25 | 5.000% | | 38,000 | 38,475 |
| Hologic, Inc.(a) |
| 07/15/22 | 5.250% | | 36,000 | 37,935 |
| MEDNAX, Inc.(a) |
| 12/01/23 | 5.250% | | 30,000 | 30,675 |
| MPH Acquisition Holdings LLC(a) |
| 06/01/24 | 7.125% | | 140,000 | 150,500 |
| Quintiles IMS, Inc.(a) |
| 05/15/23 | 4.875% | | 42,000 | 43,155 |
| 10/15/26 | 5.000% | | 89,000 | 90,780 |
| Sterigenics-Nordion Holdings LLC(a) |
| 05/15/23 | 6.500% | | 76,000 | 78,280 |
| Team Health Holdings, Inc.(a) |
| 02/01/25 | 6.375% | | 51,000 | 49,342 |
| Teleflex, Inc. |
| 06/01/26 | 4.875% | | 12,000 | 12,180 |
| Tenet Healthcare Corp. |
| 04/01/21 | 4.500% | | 181,000 | 180,774 |
| 04/01/22 | 8.125% | | 53,000 | 53,795 |
| 06/15/23 | 6.750% | | 26,000 | 24,830 |
| Tenet Healthcare Corp.(a) |
| 01/01/22 | 7.500% | | 32,000 | 34,240 |
| Total | 1,871,752 |
| Healthcare Insurance 0.2% |
| Centene Corp. |
| 02/15/24 | 6.125% | | 126,000 | 135,765 |
| 01/15/25 | 4.750% | | 52,000 | 52,845 |
| Molina Healthcare, Inc. |
| 11/15/22 | 5.375% | | 25,000 | 26,125 |
| WellCare Health Plans, Inc. |
| 04/01/25 | 5.250% | | 92,000 | 95,680 |
| Total | 310,415 |
| Home Construction 0.3% |
| CalAtlantic Group, Inc. |
| 11/15/24 | 5.875% | | 121,000 | 130,075 |
| 06/01/26 | 5.250% | | 2,000 | 2,055 |
| Lennar Corp. |
| 04/30/24 | 4.500% | | 74,000 | 74,740 |
| Meritage Homes Corp. |
| 04/01/22 | 7.000% | | 72,000 | 81,720 |
The accompanying Notes to Financial Statements are an integral part of this statement.
Columbia Multi-Asset Income Fund | Annual Report 2017
| 15 |
Portfolio of Investments (continued)
April 30, 2017
| Corporate Bonds & Notes (continued) |
| Issuer | Coupon
Rate | | Principal
Amount ($) | Value ($) |
| Taylor Morrison Communities, Inc./Holdings II(a) |
| 04/15/21 | 5.250% | | 59,000 | 60,636 |
| 04/15/23 | 5.875% | | 24,000 | 25,560 |
| Total | 374,786 |
| Independent Energy 2.1% |
| Antero Resources Corp. |
| 12/01/22 | 5.125% | | 88,000 | 89,320 |
| Callon Petroleum Co.(a) |
| 10/01/24 | 6.125% | | 32,000 | 33,520 |
| Carrizo Oil & Gas, Inc. |
| 04/15/23 | 6.250% | | 225,000 | 226,687 |
| Chesapeake Energy Corp.(a) |
| 01/15/25 | 8.000% | | 80,000 | 79,100 |
| Concho Resources, Inc. |
| 04/01/23 | 5.500% | | 237,000 | 245,739 |
| Continental Resources, Inc. |
| 04/15/23 | 4.500% | | 55,000 | 54,175 |
| 06/01/24 | 3.800% | | 38,000 | 35,720 |
| CrownRock LP/Finance, Inc.(a) |
| 02/15/23 | 7.750% | | 161,000 | 172,270 |
| Denbury Resources, Inc.(a) |
| 05/15/21 | 9.000% | | 56,000 | 59,080 |
| Diamondback Energy, Inc.(a) |
| 11/01/24 | 4.750% | | 18,000 | 18,045 |
| 05/31/25 | 5.375% | | 105,000 | 108,675 |
| Extraction Oil & Gas Holdings LLC/Finance Corp.(a) |
| 07/15/21 | 7.875% | | 105,000 | 109,988 |
| Halcon Resources Corp.(a) |
| 02/15/25 | 6.750% | | 68,000 | 65,280 |
| Laredo Petroleum, Inc. |
| 03/15/23 | 6.250% | | 294,000 | 296,940 |
| MEG Energy Corp.(a) |
| 01/15/25 | 6.500% | | 40,000 | 39,500 |
| Newfield Exploration Co. |
| 07/01/24 | 5.625% | | 58,000 | 61,299 |
| Oasis Petroleum, Inc. |
| 01/15/23 | 6.875% | | 7,000 | 7,070 |
| Parsley Energy LLC/Finance Corp.(a) |
| 06/01/24 | 6.250% | | 31,000 | 32,783 |
| 01/15/25 | 5.375% | | 100,000 | 101,000 |
| 08/15/25 | 5.250% | | 72,000 | 72,540 |
| PDC Energy, Inc.(a) |
| 09/15/24 | 6.125% | | 129,000 | 132,225 |
| Range Resources Corp.(a) |
| 08/15/22 | 5.000% | | 52,000 | 51,415 |
| RSP Permian, Inc.(a) |
| 01/15/25 | 5.250% | | 105,000 | 106,575 |
| Corporate Bonds & Notes (continued) |
| Issuer | Coupon
Rate | | Principal
Amount ($) | Value ($) |
| SM Energy Co. |
| 06/01/25 | 5.625% | | 19,000 | 18,145 |
| 09/15/26 | 6.750% | | 163,000 | 164,222 |
| Whiting Petroleum Corp. |
| 03/15/21 | 5.750% | | 68,000 | 67,660 |
| 04/01/23 | 6.250% | | 52,000 | 52,000 |
| WPX Energy, Inc. |
| 01/15/22 | 6.000% | | 202,000 | 205,030 |
| Total | 2,706,003 |
| Integrated Energy 0.1% |
| Lukoil International Finance BV(a) |
| 11/02/26 | 4.750% | | 200,000 | 204,730 |
| Leisure 0.2% |
| AMC Entertainment Holdings, Inc.(a) |
| 05/15/27 | 6.125% | | 27,000 | 27,574 |
| Cedar Fair LP/Canada’s Wonderland Co./Magnum Management Corp./Millenium Operations LLC(a) |
| 04/15/27 | 5.375% | | 57,000 | 58,918 |
| Live Nation Entertainment, Inc.(a) |
| 11/01/24 | 4.875% | | 56,000 | 56,420 |
| LTF Merger Sub, Inc.(a) |
| 06/15/23 | 8.500% | | 53,000 | 56,312 |
| Silversea Cruise Finance Ltd.(a) |
| 02/01/25 | 7.250% | | 24,000 | 25,440 |
| Total | 224,664 |
| Life Insurance 0.1% |
| MetLife, Inc. |
| Junior Subordinated |
| 08/01/39 | 10.750% | | 105,000 | 168,000 |
| Prudential Financial, Inc.(b) |
| Junior Subordinated |
| 09/15/42 | 5.875% | | 15,000 | 16,572 |
| Total | 184,572 |
| Lodging 0.2% |
| Choice Hotels International, Inc. |
| 07/01/22 | 5.750% | | 96,000 | 105,360 |
| Hilton Domestic Operating Co., Inc.(a) |
| 09/01/24 | 4.250% | | 35,000 | 35,262 |
| Hilton Grand Vacations Borrower LLC/Inc.(a) |
| 12/01/24 | 6.125% | | 27,000 | 28,755 |
| Playa Resorts Holding BV(a) |
| 08/15/20 | 8.000% | | 107,000 | 112,484 |
| Total | 281,861 |
The accompanying Notes to Financial Statements are an integral part of this statement.
| 16 | Columbia Multi-Asset Income Fund | Annual Report 2017 |
Portfolio of Investments (continued)
April 30, 2017
| Corporate Bonds & Notes (continued) |
| Issuer | Coupon
Rate | | Principal
Amount ($) | Value ($) |
| Media and Entertainment 0.8% |
| AMC Networks, Inc. |
| 04/01/24 | 5.000% | | 29,000 | 29,381 |
| CBS Radio, Inc.(a) |
| 11/01/24 | 7.250% | | 15,000 | 16,313 |
| Lamar Media Corp. |
| 02/01/26 | 5.750% | | 74,000 | 80,567 |
| Match Group, Inc. |
| 06/01/24 | 6.375% | | 85,000 | 92,544 |
| MDC Partners, Inc.(a) |
| 05/01/24 | 6.500% | | 131,000 | 127,725 |
| Netflix, Inc. |
| 02/15/22 | 5.500% | | 107,000 | 114,490 |
| 02/15/25 | 5.875% | | 63,000 | 68,355 |
| Netflix, Inc.(a) |
| 11/15/26 | 4.375% | | 156,000 | 153,660 |
| Nielsen Luxembourg SARL(a) |
| 02/01/25 | 5.000% | | 81,000 | 81,101 |
| Outfront Media Capital LLC/Corp. |
| 02/15/24 | 5.625% | | 72,000 | 75,420 |
| 03/15/25 | 5.875% | | 56,000 | 59,220 |
| Univision Communications, Inc.(a) |
| 02/15/25 | 5.125% | | 96,000 | 95,640 |
| Total | 994,416 |
| Metals and Mining 0.9% |
| BHP Billiton Finance USA Ltd.(a),(b) |
| Junior Subordinated |
| 10/19/75 | 6.750% | | 200,000 | 226,500 |
| Constellium NV(a) |
| 05/15/24 | 5.750% | | 116,000 | 108,750 |
| 03/01/25 | 6.625% | | 48,000 | 47,280 |
| First Quantum Minerals Ltd.(a) |
| 04/01/25 | 7.500% | | 55,000 | 56,100 |
| Freeport-McMoRan, Inc. |
| 03/01/22 | 3.550% | | 19,000 | 17,860 |
| 03/15/23 | 3.875% | | 37,000 | 34,317 |
| 11/14/24 | 4.550% | | 166,000 | 155,957 |
| Grinding Media, Inc./MC Canada, Inc.(a) |
| 12/15/23 | 7.375% | | 41,000 | 43,739 |
| HudBay Minerals, Inc.(a) |
| 01/15/23 | 7.250% | | 17,000 | 18,084 |
| 01/15/25 | 7.625% | | 53,000 | 56,776 |
| Novelis Corp.(a) |
| 08/15/24 | 6.250% | | 30,000 | 31,575 |
| 09/30/26 | 5.875% | | 124,000 | 127,410 |
| Teck Resources Ltd.(a) |
| 06/01/24 | 8.500% | | 48,000 | 55,620 |
| Corporate Bonds & Notes (continued) |
| Issuer | Coupon
Rate | | Principal
Amount ($) | Value ($) |
| Teck Resources Ltd. |
| 07/15/41 | 6.250% | | 152,000 | 161,120 |
| Total | 1,141,088 |
| Midstream 1.0% |
| Energy Transfer Equity LP |
| 06/01/27 | 5.500% | | 256,000 | 275,200 |
| Holly Energy Partners LP/Finance Corp.(a) |
| 08/01/24 | 6.000% | | 130,000 | 137,475 |
| NuStar Logistics LP |
| 04/28/27 | 5.625% | | 58,000 | 59,814 |
| Tallgrass Energy Partners LP/Finance Corp.(a) |
| 09/15/24 | 5.500% | | 22,000 | 22,110 |
| Targa Resources Partners LP/Finance Corp. |
| 05/01/23 | 5.250% | | 52,000 | 53,560 |
| 11/15/23 | 4.250% | | 32,000 | 31,680 |
| 03/15/24 | 6.750% | | 46,000 | 50,140 |
| Targa Resources Partners LP/Finance Corp.(a) |
| 02/01/27 | 5.375% | | 110,000 | 114,950 |
| Tesoro Logistics LP/Finance Corp. |
| 10/15/22 | 6.250% | | 82,000 | 87,945 |
| 05/01/24 | 6.375% | | 24,000 | 26,220 |
| 01/15/25 | 5.250% | | 126,000 | 133,718 |
| Williams Companies, Inc. (The) |
| 01/15/23 | 3.700% | | 50,000 | 49,250 |
| 06/24/24 | 4.550% | | 229,000 | 234,439 |
| Total | 1,276,501 |
| Oil Field Services 0.2% |
| Nabors Industries, Inc.(a) |
| 01/15/23 | 5.500% | | 13,000 | 13,146 |
| Precision Drilling Corp.(a) |
| 12/15/23 | 7.750% | | 6,000 | 6,360 |
| SESI LLC |
| 12/15/21 | 7.125% | | 24,000 | 24,240 |
| Trinidad Drilling Ltd.(a) |
| 02/15/25 | 6.625% | | 18,000 | 18,135 |
| Weatherford International Ltd. |
| 06/15/21 | 7.750% | | 44,000 | 46,915 |
| 06/15/23 | 8.250% | | 104,000 | 112,710 |
| 08/01/36 | 6.500% | | 33,000 | 31,185 |
| Weatherford International Ltd.(a) |
| 02/15/24 | 9.875% | | 70,000 | 81,550 |
| Total | 334,241 |
| Other Financial Institutions 0.0% |
| Icahn Enterprises LP/Finance Corp.(a) |
| 02/01/22 | 6.250% | | 33,000 | 34,320 |
The accompanying Notes to Financial Statements are an integral part of this statement.
Columbia Multi-Asset Income Fund | Annual Report 2017
| 17 |
Portfolio of Investments (continued)
April 30, 2017
| Corporate Bonds & Notes (continued) |
| Issuer | Coupon
Rate | | Principal
Amount ($) | Value ($) |
| Other Industry 0.0% |
| Booz Allen Hamilton, Inc.(a) |
| 05/01/25 | 5.125% | | 10,000 | 10,175 |
| Other REIT 0.0% |
| CyrusOne LP/Finance Corp.(a) |
| 03/15/24 | 5.000% | | 24,000 | 24,660 |
| 03/15/27 | 5.375% | | 24,000 | 24,720 |
| Total | 49,380 |
| Packaging 0.7% |
| ARD Finance SA PIK(a) |
| 09/15/23 | 7.125% | | 41,000 | 42,538 |
| Ardagh Packaging Finance PLC/Holdings USA, Inc.(a) |
| 05/15/23 | 4.625% | | 39,000 | 39,829 |
| 05/15/24 | 7.250% | | 137,000 | 149,159 |
| 02/15/25 | 6.000% | | 67,000 | 69,261 |
| Berry Plastics Corp. |
| 05/15/22 | 5.500% | | 30,000 | 31,350 |
| 10/15/22 | 6.000% | | 57,000 | 60,562 |
| 07/15/23 | 5.125% | | 116,000 | 120,605 |
| Novolex (a) |
| 01/15/25 | 6.875% | | 23,000 | 23,690 |
| Owens-Brockway Glass Container, Inc.(a) |
| 01/15/25 | 5.375% | | 24,000 | 25,020 |
| Plastipak Holdings, Inc.(a) |
| 10/01/21 | 6.500% | | 49,000 | 50,347 |
| Reynolds Group Issuer, Inc./LLC |
| 10/15/20 | 5.750% | | 90,000 | 92,700 |
| 02/15/21 | 6.875% | | 30,462 | 31,300 |
| Reynolds Group Issuer, Inc./LLC(a) |
| 07/15/24 | 7.000% | | 99,000 | 106,549 |
| Signode Industrial Group Luxembourg SA/US, Inc.(a) |
| 05/01/22 | 6.375% | | 19,000 | 19,572 |
| Total | 862,482 |
| Pharmaceuticals 0.5% |
| Endo Dac/Finance LLC/Finco, Inc.(a),(b) |
| 02/01/25 | 6.000% | | 61,000 | 51,515 |
| Jaguar Holding Co. II/Pharmaceutical Product Development LLC(a) |
| 08/01/23 | 6.375% | | 120,000 | 125,100 |
| Mallinckrodt International Finance SA/CB LLC(a) |
| 10/15/23 | 5.625% | | 22,000 | 21,010 |
| 04/15/25 | 5.500% | | 20,000 | 18,200 |
| Valeant Pharmaceuticals International, Inc.(a) |
| 03/15/22 | 6.500% | | 24,000 | 24,570 |
| 03/15/24 | 7.000% | | 94,000 | 95,880 |
| 04/15/25 | 6.125% | | 420,000 | 310,065 |
| Total | 646,340 |
| Corporate Bonds & Notes (continued) |
| Issuer | Coupon
Rate | | Principal
Amount ($) | Value ($) |
| Property & Casualty 0.2% |
| Alliant Holdings Intermediate LP(a) |
| 08/01/23 | 8.250% | | 4,000 | 4,271 |
| HUB International Ltd.(a) |
| 10/01/21 | 7.875% | | 205,000 | 214,768 |
| Total | 219,039 |
| Railroads 0.2% |
| BNSF Funding Trust I(b) |
| Junior Subordinated |
| 12/15/55 | 6.613% | | 210,000 | 239,400 |
| Restaurants 0.2% |
| BC ULC/New Red Finance, Inc.(a) |
| 01/15/22 | 4.625% | | 76,000 | 78,303 |
| 04/01/22 | 6.000% | | 36,000 | 37,530 |
| KFC Holding Co./Pizza Hut Holdings LLC/Taco Bell of America LLC(a) |
| 06/01/26 | 5.250% | | 125,000 | 128,125 |
| Total | 243,958 |
| Retailers 0.4% |
| Asbury Automotive Group, Inc. |
| 12/15/24 | 6.000% | | 69,000 | 71,242 |
| Dollar Tree, Inc. |
| 03/01/23 | 5.750% | | 80,000 | 84,880 |
| Group 1 Automotive, Inc. |
| 06/01/22 | 5.000% | | 52,000 | 52,650 |
| Group 1 Automotive, Inc.(a) |
| 12/15/23 | 5.250% | | 5,000 | 5,038 |
| Hanesbrands, Inc.(a) |
| 05/15/24 | 4.625% | | 27,000 | 26,797 |
| 05/15/26 | 4.875% | | 27,000 | 26,865 |
| L Brands, Inc. |
| 11/01/35 | 6.875% | | 55,000 | 54,230 |
| Penske Automotive Group, Inc. |
| 12/01/24 | 5.375% | | 92,000 | 92,690 |
| Rite Aid Corp.(a) |
| 04/01/23 | 6.125% | | 55,000 | 54,450 |
| Sally Holdings LLC/Capital, Inc. |
| 06/01/22 | 5.750% | | 40,000 | 41,200 |
| 12/01/25 | 5.625% | | 15,000 | 15,488 |
| Total | 525,530 |
| Supermarkets 0.2% |
| Cencosud SA(a) |
| 02/12/45 | 6.625% | | 200,000 | 209,648 |
The accompanying Notes to Financial Statements are an integral part of this statement.
| 18 | Columbia Multi-Asset Income Fund | Annual Report 2017 |
Portfolio of Investments (continued)
April 30, 2017
| Corporate Bonds & Notes (continued) |
| Issuer | Coupon
Rate | | Principal
Amount ($) | Value ($) |
| Technology 1.4% |
| Camelot Finance SA(a) |
| 10/15/24 | 7.875% | | 34,000 | 36,465 |
| Equinix, Inc. |
| 01/01/22 | 5.375% | | 120,000 | 126,900 |
| 01/15/26 | 5.875% | | 121,000 | 130,377 |
| 05/15/27 | 5.375% | | 123,000 | 128,509 |
| First Data Corp.(a) |
| 08/15/23 | 5.375% | | 60,000 | 62,400 |
| 12/01/23 | 7.000% | | 129,000 | 138,314 |
| 01/15/24 | 5.000% | | 48,000 | 49,092 |
| 01/15/24 | 5.750% | | 183,000 | 189,862 |
| Gartner, Inc.(a) |
| 04/01/25 | 5.125% | | 84,000 | 86,940 |
| Informatica LLC(a) |
| 07/15/23 | 7.125% | | 41,000 | 40,334 |
| Microsemi Corp.(a) |
| 04/15/23 | 9.125% | | 93,000 | 106,950 |
| MSCI, Inc.(a) |
| 11/15/24 | 5.250% | | 70,000 | 74,200 |
| 08/15/25 | 5.750% | | 35,000 | 37,713 |
| 08/01/26 | 4.750% | | 37,000 | 38,018 |
| PTC, Inc. |
| 05/15/24 | 6.000% | | 72,000 | 77,040 |
| Qualitytech LP/Finance Corp. |
| 08/01/22 | 5.875% | | 128,000 | 131,840 |
| Riverbed Technology, Inc.(a) |
| 03/01/23 | 8.875% | | 23,000 | 23,690 |
| Sensata Technologies UK Financing Co. PLC(a) |
| 02/15/26 | 6.250% | | 85,000 | 92,012 |
| Solera LLC/Finance, Inc.(a) |
| 03/01/24 | 10.500% | | 71,000 | 81,029 |
| Symantec Corp.(a) |
| 04/15/25 | 5.000% | | 60,000 | 62,025 |
| Tempo Acquisition LLC/Finance Corp.(a),(c) |
| 06/01/25 | 6.750% | | 34,000 | 34,935 |
| VeriSign, Inc. |
| 05/01/23 | 4.625% | | 104,000 | 106,444 |
| Total | 1,855,089 |
| Transportation Services 0.1% |
| Avis Budget Car Rental LLC/Finance, Inc.(a) |
| 03/15/25 | 5.250% | | 81,000 | 76,343 |
| Hertz Corp. (The)(a) |
| 10/15/24 | 5.500% | | 102,000 | 87,975 |
| Total | 164,318 |
| Corporate Bonds & Notes (continued) |
| Issuer | Coupon
Rate | | Principal
Amount ($) | Value ($) |
| Wireless 1.4% |
| Comcel Trust(a) |
| 02/06/24 | 6.875% | | 200,000 | 211,956 |
| SBA Communications Corp.(a) |
| 09/01/24 | 4.875% | | 322,000 | 324,818 |
| SFR Group SA(a) |
| 05/01/26 | 7.375% | | 259,000 | 272,274 |
| Sprint Communications, Inc.(a) |
| 03/01/20 | 7.000% | | 158,000 | 172,615 |
| Sprint Corp. |
| 06/15/24 | 7.125% | | 280,000 | 305,376 |
| 02/15/25 | 7.625% | | 127,000 | 141,764 |
| T-Mobile USA, Inc. |
| 03/01/25 | 6.375% | | 87,000 | 95,075 |
| 01/15/26 | 6.500% | | 145,000 | 160,769 |
| 04/15/27 | 5.375% | | 27,000 | 28,890 |
| Wind Acquisition Finance SA(a) |
| 07/15/20 | 4.750% | | 44,000 | 44,660 |
| 04/23/21 | 7.375% | | 21,000 | 21,840 |
| Total | 1,780,037 |
| Wirelines 0.8% |
| CenturyLink, Inc. |
| 04/01/25 | 5.625% | | 189,000 | 184,511 |
| Frontier Communications Corp. |
| 09/15/20 | 8.875% | | 59,000 | 62,282 |
| 09/15/22 | 10.500% | | 25,000 | 25,125 |
| 01/15/23 | 7.125% | | 228,000 | 199,500 |
| 09/15/25 | 11.000% | | 64,000 | 61,680 |
| Level 3 Communications, Inc. |
| 12/01/22 | 5.750% | | 48,000 | 49,980 |
| Level 3 Financing, Inc. |
| 08/15/22 | 5.375% | | 100,000 | 103,270 |
| 01/15/24 | 5.375% | | 13,000 | 13,455 |
| 03/15/26 | 5.250% | | 51,000 | 52,598 |
| Telecom Italia SpA(a) |
| 05/30/24 | 5.303% | | 51,000 | 52,530 |
| Zayo Group LLC/Capital, Inc. |
| 04/01/23 | 6.000% | | 88,000 | 93,830 |
| 05/15/25 | 6.375% | | 54,000 | 58,387 |
| Zayo Group LLC/Capital, Inc.(a) |
| 01/15/27 | 5.750% | | 50,000 | 53,063 |
| Total | 1,010,211 |
Total Corporate Bonds & Notes
(Cost $29,964,092) | 30,831,709 |
The accompanying Notes to Financial Statements are an integral part of this statement.
Columbia Multi-Asset Income Fund | Annual Report 2017
| 19 |
Portfolio of Investments (continued)
April 30, 2017
| Equity-Linked Notes 19.1% |
| Issuer | Coupon
Rate | Shares | Value ($) |
| Barclays Bank PLC(a) |
| (linked to a basket of 37 US common stocks) |
| 09/11/17 | 12.080% | 4,291 | 4,234,765 |
| BNP Paribas(a) |
| (linked to a basket of 40 US common stocks) |
| 06/06/17 | 14.150% | 4,017 | 3,992,792 |
| Credit Suisse AG(a) |
| (linked to common stock of Telefonaktiebolaget LM Ericsson) |
| 06/21/17 | 16.000% | 768 | 44,118 |
| Deutsche Bank AG(a) |
| (linked to a basket of 40 US common stocks) |
| 08/07/17 | 12.850% | 4,210 | 4,152,884 |
| (linked to common stock of Nordstrom, Inc.) |
| 05/17/17 | 19.280% | 443 | 20,876 |
| Goldman Sachs International(a) |
| (linked to common stock of Graphic Packaging Holding Co.) |
| 08/01/17 | 8.220% | 2,036 | 27,451 |
| Nomura International Funding Pte. Ltd(a) |
| (linked to a basket of 40 US common stocks) |
| 07/12/17 | 13.450% | 41,400 | 4,134,210 |
| Royal Bank of Canada(a) |
| (linked to a basket of 38 US common stocks) |
| 05/05/17 | 14.430% | 4,052 | 4,049,974 |
| Societe Generale SA(a) |
| (linked to a basket of 37 US common stocks) |
| 10/02/17 | 12.750% | 4,270 | 4,268,292 |
| (linked to common stock of American Airlines Group, Inc.) |
| 05/23/17 | 12.000% | 746 | 31,624 |
| (linked to common stock of Hess Corp.) |
| 05/23/17 | 11.650% | 769 | 37,414 |
Total Equity-Linked Notes
(Cost $25,147,618) | 24,994,400 |
| Exchange-Traded Funds 12.7% |
| | Shares | Value ($) |
| Global X SuperDividend ETF | 96,516 | 2,088,606 |
| PowerShares S&P 500 High Dividend Low Volatility Portfolio ETF | 51,637 | 2,061,865 |
| SPDR Blackstone/GSO Senior Loan ETF | 121,414 | 5,770,807 |
| SPDR Bloomberg Barclays Convertible Securities ETF | 79,714 | 3,886,855 |
| SPDR Bloomberg Barclays Long Term Corporate Bond ETF | 68,668 | 2,789,981 |
Total Exchange-Traded Funds
(Cost $16,585,554) | 16,598,114 |
| Foreign Government Obligations(d) 11.4% |
| Issuer | Coupon
Rate | | Principal
Amount ($) | Value ($) |
| Argentina 0.9% |
| Argentine Republic Government International Bond |
| 04/22/21 | 6.875% | | 200,000 | 218,800 |
| City of Buenos Aires Argentina(a) |
| 06/01/27 | 7.500% | | 250,000 | 267,800 |
| Provincia de Buenos Aires(a) |
| 03/16/24 | 9.125% | | 295,000 | 334,972 |
| 06/15/27 | 7.875% | | 200,000 | 208,786 |
| Provincia de Cordoba(a) |
| 06/10/21 | 7.125% | | 150,000 | 158,250 |
| Total | 1,188,608 |
| Brazil 0.8% |
| Brazilian Government International Bond |
| 04/07/26 | 6.000% | | 400,000 | 438,600 |
| 01/07/41 | 5.625% | | 650,000 | 645,938 |
| Total | 1,084,538 |
| Colombia 0.4% |
| Ecopetrol SA |
| 01/16/25 | 4.125% | | 100,000 | 96,700 |
| 06/26/26 | 5.375% | | 200,000 | 205,000 |
| 09/18/43 | 7.375% | | 260,000 | 282,100 |
| Total | 583,800 |
| Costa Rica 0.3% |
| Costa Rica Government International Bond(a) |
| 03/12/45 | 7.158% | | 400,000 | 417,000 |
| Croatia 0.3% |
| Hrvatska Elektroprivreda(a) |
| 10/23/22 | 5.875% | | 400,000 | 429,200 |
| Dominican Republic 0.9% |
| Banco de Reservas de la Republica Dominicana(a) |
| Subordinated |
| 02/01/23 | 7.000% | | 150,000 | 154,055 |
| 02/01/23 | 7.000% | | 150,000 | 154,054 |
| Dominican Republic International Bond(a) |
| 01/29/26 | 6.875% | | 400,000 | 446,168 |
| 04/20/27 | 8.625% | | 300,000 | 357,819 |
| Total | 1,112,096 |
| Ecuador 0.2% |
| Ecuador Government International Bond(a) |
| 03/28/22 | 10.750% | | 250,000 | 270,740 |
| Egypt 0.2% |
| Egypt Government International Bond(a) |
| 01/31/27 | 7.500% | | 300,000 | 323,625 |
The accompanying Notes to Financial Statements are an integral part of this statement.
| 20 | Columbia Multi-Asset Income Fund | Annual Report 2017 |
Portfolio of Investments (continued)
April 30, 2017
| Foreign Government Obligations(d) (continued) |
| Issuer | Coupon
Rate | | Principal
Amount ($) | Value ($) |
| El Salvador 0.2% |
| El Salvador Government International Bond(a) |
| 01/18/27 | 6.375% | | 320,000 | 285,600 |
| Gabon 0.1% |
| Gabon Government International Bond(a) |
| 12/12/24 | 6.375% | | 200,000 | 195,850 |
| Georgia 0.2% |
| Georgian Railway JSC(a) |
| 07/11/22 | 7.750% | | 200,000 | 219,750 |
| Ghana 0.2% |
| Ghana Government International Bond(a) |
| 10/14/30 | 10.750% | | 200,000 | 241,300 |
| Honduras 0.3% |
| Honduras Government International Bond(a) |
| 03/15/24 | 7.500% | | 400,000 | 443,252 |
| Hungary 0.3% |
| Hungary Government International Bond |
| 03/29/41 | 7.625% | | 100,000 | 147,774 |
| MFB Magyar Fejlesztesi Bank Zrt.(a) |
| 10/21/20 | 6.250% | | 200,000 | 220,250 |
| Total | 368,024 |
| Indonesia 1.2% |
| PT Pertamina Persero(a) |
| 05/03/22 | 4.875% | | 400,000 | 422,016 |
| 05/27/41 | 6.500% | | 500,000 | 562,500 |
| PT Perusahaan Listrik Negara(a) |
| 11/22/21 | 5.500% | | 500,000 | 545,760 |
| Total | 1,530,276 |
| Ivory Coast 0.2% |
| Ivory Coast Government International Bond(a) |
| 03/03/28 | 6.375% | | 200,000 | 201,056 |
| Kazakhstan 0.3% |
| Kazakhstan Government International Bond(a) |
| 07/21/45 | 6.500% | | 200,000 | 237,828 |
| KazMunayGas National Co. JSC(a) |
| 07/02/18 | 9.125% | | 100,000 | 107,375 |
| Total | 345,203 |
| Mexico 1.4% |
| Petroleos Mexicanos |
| 06/02/41 | 6.500% | | 1,800,000 | 1,802,700 |
| Foreign Government Obligations(d) (continued) |
| Issuer | Coupon
Rate | | Principal
Amount ($) | Value ($) |
| Pakistan 0.2% |
| Pakistan Government International Bond(a) |
| 04/15/24 | 8.250% | | 200,000 | 222,578 |
| Russian Federation 0.6% |
| Gazprom Neft OAO Via GPN Capital SA(a) |
| 09/19/22 | 4.375% | | 200,000 | 202,500 |
| Gazprom OAO Via Gaz Capital SA(a) |
| 02/06/28 | 4.950% | | 200,000 | 201,000 |
| Russian Foreign Bond - Eurobond(a) |
| 04/04/22 | 4.500% | | 400,000 | 428,032 |
| Total | 831,532 |
| Senegal 0.2% |
| Senegal Government International Bond(a) |
| 07/30/24 | 6.250% | | 200,000 | 204,300 |
| Serbia 0.2% |
| Serbia International Bond(a) |
| 12/03/18 | 5.875% | | 200,000 | 210,250 |
| Trinidad and Tobago 0.3% |
| Petroleum Co. of Trinidad & Tobago Ltd.(a) |
| 08/14/19 | 9.750% | | 250,000 | 265,625 |
| 08/14/19 | 9.750% | | 100,000 | 106,250 |
| Total | 371,875 |
| Turkey 0.7% |
| Export Credit Bank of Turkey(a) |
| 09/23/21 | 5.000% | | 300,000 | 303,750 |
| Turkey Government International Bond |
| 03/25/27 | 6.000% | | 200,000 | 214,000 |
| 03/17/36 | 6.875% | | 400,000 | 453,300 |
| Total | 971,050 |
| Venezuela 0.5% |
| Petroleos de Venezuela SA(a) |
| 11/17/21 | 9.000% | | 117,772 | 62,031 |
| 05/16/24 | 6.000% | | 629,556 | 248,882 |
| 11/15/26 | 6.000% | | 120,724 | 46,056 |
| Venezuela Government International Bond(a) |
| 10/13/19 | 7.750% | | 220,000 | 132,374 |
| 05/07/23 | 9.000% | | 250,000 | 124,425 |
| Total | 613,768 |
| Virgin Islands 0.3% |
| State Grid Overseas Investment 2016 Ltd.(a),(c) |
| 05/04/27 | 3.500% | | 400,000 | 399,038 |
Total Foreign Government Obligations
(Cost $14,552,440) | 14,867,009 |
The accompanying Notes to Financial Statements are an integral part of this statement.
Columbia Multi-Asset Income Fund | Annual Report 2017
| 21 |
Portfolio of Investments (continued)
April 30, 2017
| Limited Partnerships 4.0% |
| Issuer | Shares | Value ($) |
| Energy 3.8% |
| Oil, Gas & Consumable Fuels 3.8% |
| Buckeye Partners LP | 2,620 | 181,252 |
| Cheniere Energy Partners LP | 6,620 | 210,185 |
| DCP Midstream Partners LP | 10,835 | 410,538 |
| Energy Transfer Partners LP | 26,917 | 644,405 |
| Enterprise Products Partners LP | 27,016 | 738,077 |
| MPLX LP | 11,308 | 398,381 |
| PBF Logistics LP | 18,293 | 378,665 |
| Phillips 66 Partners LP | 4,000 | 210,720 |
| Plains All American Pipeline LP | 12,500 | 365,625 |
| Tesoro Logistics LP | 6,298 | 345,508 |
| Valero Energy Partners LP | 4,713 | 223,868 |
| Western Gas Partners LP | 6,171 | 362,299 |
| Williams Partners LP | 11,481 | 469,917 |
| Total | | 4,939,440 |
| Total Energy | 4,939,440 |
| Utilities 0.2% |
| Gas Utilities 0.2% |
| AmeriGas Partners LP | 6,986 | 314,510 |
| Total Utilities | 314,510 |
Total Limited Partnerships
(Cost $5,778,317) | 5,253,950 |
| Residential Mortgage-Backed Securities - Agency 3.0% |
| Issuer | Coupon
Rate | | Principal
Amount ($) | Value ($) |
| Federal Home Loan Mortgage Corp. |
| 01/01/45 | 3.500% | | 539,423 | 557,636 |
| Federal Home Loan Mortgage Corp.(b),(e) |
| CMO Series 311 Class S1 |
| 08/15/43 | 4.956% | | 2,539,087 | 522,430 |
| CMO Series 326 Class S2 |
| 03/15/44 | 4.956% | | 2,553,245 | 529,377 |
| Federal Home Loan Mortgage Corp.(e) |
| CMO Series 4098 Class AI |
| 05/15/39 | 3.500% | | 2,642,246 | 286,838 |
| CMO Series 4121 Class IA |
| 01/15/41 | 3.500% | | 1,765,594 | 235,259 |
| Federal National Mortgage Association(e) |
| CMO Series 2012-121 Class GI |
| 08/25/39 | 3.500% | | 367,247 | 47,119 |
| Residential Mortgage-Backed Securities - Agency (continued) |
| Issuer | Coupon
Rate | | Principal
Amount ($) | Value ($) |
| Federal National Mortgage Association(b),(e) |
| CMO Series 2013-101 Class CS |
| 10/25/43 | 4.909% | | 1,547,213 | 341,755 |
| CMO Series 2016-45 Class AS |
| 07/25/46 | 5.009% | | 469,373 | 112,438 |
| CMO Series 2016-50 Class GS |
| 08/25/46 | 4.959% | | 1,817,200 | 388,596 |
| CMO Series 2016-62 Class AS |
| 09/25/46 | 1.901% | | 4,111,640 | 224,483 |
| Government National Mortgage Association(e) |
| CMO Series 2015-53 Class EI |
| 04/16/45 | 3.500% | | 3,341,582 | 642,584 |
Total Residential Mortgage-Backed Securities - Agency
(Cost $4,030,162) | 3,888,515 |
|
| Residential Mortgage-Backed Securities - Non-Agency 5.6% |
| | | | |
| Angel Oak Mortgage Trust I LLC(a) |
| Series 2016-1 Class A1 |
| 07/25/46 | 3.500% | | 366,031 | 369,691 |
| Angel Oak Mortgage Trust LLC(a) |
| Series 2015-1 |
| 11/25/45 | 4.500% | | 168,140 | 168,560 |
| Bayview Opportunity Master Fund IVb Trust(a) |
| CMO Series 2017-NPL1 Class A1 |
| 01/28/32 | 3.598% | | 273,991 | 273,393 |
| CAM Mortgage Trust(a) |
| CMO Series 2016-2 Class A1 |
| 06/15/57 | 3.250% | | 219,822 | 219,281 |
| Citigroup Mortgage Loan Trust, Inc.(a),(b) |
| CMO Series 2014-C Class A |
| 02/25/54 | 3.250% | | 1,018,277 | 992,673 |
| CMO Series 2015-A Class B3 |
| 06/25/58 | 4.500% | | 239,292 | 223,589 |
| Series 2013-11 Class 3A3 |
| 09/25/34 | 3.083% | | 198,399 | 194,385 |
| Citigroup Mortgage Loan Trust, Inc.(a),(e) |
| CMO Series 2015-A Class A1IO |
| 06/25/58 | 1.000% | | 6,191,725 | 156,807 |
| COLT Mortgage Loan Trust(a) |
| CMO Series 2016-1 Class A2 |
| 05/25/46 | 3.500% | | 297,278 | 297,489 |
| Credit Suisse Mortgage Capital Certificates(a) |
| CMO Series 2010-9R Class 1A5 |
| 08/27/37 | 4.000% | | 200,000 | 196,778 |
| Credit Suisse Mortgage Capital Certificates(a),(b) |
| CMO Series 2014-RPL4 Class A1 |
| 08/25/62 | 3.625% | | 194,156 | 197,123 |
| CMO Series 2014-RPL4 Class A2 |
| 08/25/62 | 4.826% | | 1,000,000 | 993,045 |
The accompanying Notes to Financial Statements are an integral part of this statement.
| 22 | Columbia Multi-Asset Income Fund | Annual Report 2017 |
Portfolio of Investments (continued)
April 30, 2017
| Residential Mortgage-Backed Securities - Non-Agency (continued) |
| Issuer | Coupon
Rate | | Principal
Amount ($) | Value ($) |
| GCAT (a) |
| Series 2017-1 Class A2 |
| 03/25/47 | 3.375% | | 245,754 | 245,294 |
| Oaktown Re Ltd.(a),(b),(c) |
| CMO Series 2017-1A Class M1 |
| 04/25/27 | 3.250% | | 500,000 | 500,000 |
| Pretium Mortgage Credit Partners I LLC(a) |
| CMO Series 2016-NPL6 Class A1 |
| 10/27/31 | 3.500% | | 924,337 | 925,014 |
| RBSSP Resecuritization Trust(a),(b) |
| CMO Series 2010-1 Class 3A2 |
| 08/26/35 | 3.050% | | 250,000 | 243,506 |
| Vericrest Opportunity Loan Transferee XLVIII LLC(a) |
| Series 2016-NPL8 Class A1 |
| 07/25/46 | 3.500% | | 878,534 | 881,115 |
| VML LLC(a) |
| CMO Series 2014-NPL1 Class A1 |
| 04/27/54 | 3.875% | | 295,389 | 296,021 |
Total Residential Mortgage-Backed Securities - Non-Agency
(Cost $7,367,259) | 7,373,764 |
|
| Senior Loans 0.2% |
| Borrower | Weighted
Average Coupon | | Principal
Amount ($) | Value ($) |
| Consumer Products 0.1% |
| Serta Simmons Holdings, LLC(b),(f) |
| 2nd Lien Term Loan |
| 11/08/24 | 9.038% | | 102,825 | 104,110 |
| Technology 0.1% |
| Ancestry.com Operations, Inc.(b),(f) |
| 2nd Lien Term Loan |
| 10/19/24 | 9.270% | | 22,926 | 23,442 |
| Kronos, Inc.(b),(f) |
| 2nd Lien Term Loan |
| 11/01/24 | 9.420% | | 33,000 | 34,337 |
| Misys Ltd.(b),(c),(f) |
| 2nd Lien Term Loan |
| 04/28/24 | 0.000% | | 12,971 | 13,230 |
| Senior Loans (continued) |
| Borrower | Weighted
Average Coupon | | Principal
Amount ($) | Value ($) |
| Term Loan |
| 04/26/24 | 0.000% | | 34,673 | 34,912 |
| Total | 105,921 |
Total Senior Loans
(Cost $204,772) | 210,031 |
|
| U.S. Treasury Obligations 2.8% |
| Issuer | Coupon
Rate | | Principal
Amount ($) | Value ($) |
| U.S. Treasury |
| 02/15/29 | 5.250% | | 256,000 | 331,360 |
| 02/15/36 | 4.500% | | 57,000 | 73,109 |
| 02/15/38 | 4.375% | | 30,000 | 37,899 |
| 02/15/39 | 3.500% | | 236,000 | 263,214 |
| 11/15/39 | 4.375% | | 284,000 | 356,986 |
| 02/15/41 | 4.750% | | 23,000 | 30,494 |
| 08/15/42 | 2.750% | | 527,000 | 509,070 |
| 05/15/43 | 2.875% | | 361,000 | 356,318 |
| 05/15/44 | 3.375% | | 419,000 | 453,142 |
| 08/15/44 | 3.125% | | 163,000 | 168,457 |
| 11/15/44 | 3.000% | | 163,000 | 164,471 |
| 02/15/45 | 2.500% | | 62,000 | 56,497 |
| 02/15/46 | 2.500% | | 840,000 | 763,448 |
| 08/15/46 | 2.250% | | 34,000 | 29,187 |
| 11/15/46 | 2.875% | | 20,000 | 19,658 |
| 02/15/47 | 3.000% | | 50,000 | 50,471 |
Total U.S. Treasury Obligations
(Cost $3,962,817) | 3,663,781 |
| Money Market Funds 5.9% |
| | Shares | Value ($) |
| Columbia Short-Term Cash Fund, 0.869%(g),(h) | 7,735,482 | 7,735,482 |
Total Money Market Funds
(Cost $7,735,324) | 7,735,482 |
Total Investments
(Cost: $128,763,541) | 129,734,659 |
| Other Assets & Liabilities, Net | | 853,981 |
| Net Assets | 130,588,640 |
The accompanying Notes to Financial Statements are an integral part of this statement.
Columbia Multi-Asset Income Fund | Annual Report 2017
| 23 |
Portfolio of Investments (continued)
April 30, 2017
At April 30, 2017, securities and/or cash totaling $703,100 were pledged as collateral.
Investments in derivatives
Futures contracts outstanding at April 30, 2017
| Long futures contracts outstanding |
| Contract description | Number of
contracts | Trading
currency | Notional market
value ($) | Expiration date | Unrealized
appreciation ($) | Unrealized
depreciation ($) |
| S&P 500 E-mini | 97 | USD | 11,545,425 | 06/2017 | 57,474 | — |
| U.S. Treasury 10-Year Note | 66 | USD | 8,297,438 | 06/2017 | 118,876 | — |
| U.S. Ultra Bond | 24 | USD | 3,910,500 | 06/2017 | — | (14,298) |
| Total | | | 23,753,363 | | 176,350 | (14,298) |
Credit default swap contracts outstanding at April 30, 2017
| Buy protection |
| Counterparty | Reference
entity | Expiration
date | Pay
fixed
rate
(%) | Notional
currency | Notional
amount | Market
value
($) | Periodic
payments
receivable
(payable)
($) | Premium
paid
($) | Premium
received
($) | Unrealized
appreciation
($) | Unrealized
depreciation
($) |
| Morgan Stanley | Markit CDX Emerging Markets Index, Series 27 | 6/20/2022 | 1.000 | USD | 5,250,000 | 235,192 | (5,833) | 273,645 | — | — | (44,286) |
Notes to Portfolio of Investments
| (a) | Represents privately placed and other securities and instruments exempt from SEC registration (collectively, private placements), such as Section 4(a)(2) and Rule 144A eligible securities, which are often sold only to qualified institutional buyers. The Fund may invest in private placements determined to be liquid as well as those determined to be illiquid. Private placements may be determined to be liquid under guidelines established by the Fund’s Board of Trustees. At April 30, 2017, the value of these securities amounted to $61,911,163 which represents 47.41% of net assets. |
| (b) | Variable rate security. |
| (c) | Represents a security purchased on a when-issued basis. |
| (d) | Principal and interest may not be guaranteed by the government. |
| (e) | Represents interest only securities which have the right to receive the monthly interest payments on an underlying pool of mortgage loans. |
| (f) | Senior loans have interest rates that float periodically based primarily on the London Interbank Offered Rate (“LIBOR”) and other short-term rates. The interest rate shown reflects the weighted average coupon as of April 30, 2017. The interest rate shown for senior loans purchased on a when-issued or delayed delivery basis, if any, reflects an estimated average coupon. Remaining maturities of senior loans may be less than the stated maturities shown as a result of contractual or optional prepayments by the borrower. Such prepayments cannot be predicted. |
| (g) | The rate shown is the seven-day current annualized yield at April 30, 2017. |
| (h) | As defined in the Investment Company Act of 1940, an affiliated company is one in which the Fund owns 5% or more of the company’s outstanding voting securities, or a company which is under common ownership or control with the Fund. Holdings and transactions in these affiliated companies during the year ended April 30, 2017 are as follows: |
| Issuer | Beginning
shares | Shares
purchased | Shares
sold | Ending
shares | Realized gain
(loss) ($) | Dividends —
affiliated
issuers($) | Value ($) |
| Columbia Short-Term Cash Fund, 0.869% | 3,386,008 | 88,714,379 | (84,364,905) | 7,735,482 | (93) | 26,531 | 7,735,482 |
Abbreviation Legend
| ADR | American Depositary Receipt |
| CMO | Collateralized Mortgage Obligation |
| PIK | Payment In Kind |
The accompanying Notes to Financial Statements are an integral part of this statement.
| 24 | Columbia Multi-Asset Income Fund | Annual Report 2017 |
Portfolio of Investments (continued)
April 30, 2017
Currency Legend
Fair value measurements
The Fund categorizes its fair value measurements according to a three-level hierarchy that maximizes the use of observable inputs and minimizes the use of unobservable inputs by prioritizing that the most observable input be used when available. Observable inputs are those that market participants would use in pricing an investment based on market data obtained from sources independent of the reporting entity. Unobservable inputs are those that reflect the Fund’s assumptions about the information market participants would use in pricing an investment. An investment’s level within the fair value hierarchy is based on the lowest level of any input that is deemed significant to the asset’s or liability’s fair value measurement. The input levels are not necessarily an indication of the risk or liquidity associated with investments at that level. For example, certain U.S. government securities are generally high quality and liquid, however, they are reflected as Level 2 because the inputs used to determine fair value may not always be quoted prices in an active market.
Fair value inputs are summarized in the three broad levels listed below:
| • | Level 1 – Valuations based on quoted prices for investments in active markets that the Fund has the ability to access at the measurement date (including NAV for open-end mutual funds). Valuation adjustments are not applied to Level 1 investments. |
| • | Level 2 – Valuations based on other significant observable inputs (including quoted prices for similar securities, interest rates, prepayment speeds, credit risks, etc.). |
| • | Level 3 – Valuations based on significant unobservable inputs (including the Fund’s own assumptions and judgment in determining the fair value of investments). |
Inputs that are used in determining fair value of an investment may include price information, credit data, volatility statistics, and other factors. These inputs can be either observable or unobservable. The availability of observable inputs can vary between investments, and is affected by various factors such as the type of investment, and the volume and level of activity for that investment or similar investments in the marketplace. The inputs will be considered by the Investment Manager, along with any other relevant factors in the calculation of an investment’s fair value. The Fund uses prices and inputs that are current as of the measurement date, which may include periods of market dislocations. During these periods, the availability of prices and inputs may be reduced for many investments. This condition could cause an investment to be reclassified between the various levels within the hierarchy.
Foreign equity securities actively traded in markets where there is a significant delay in the local close relative to the New York Stock Exchange are classified as Level 2. The values of these securities may include an adjustment to reflect the impact of significant market movements following the close of local trading, as described in Note 2 to the financial statements – Security valuation.
Certain investments that have been measured at fair value using the net asset value (NAV) per share (or its equivalent) are not categorized in the fair value hierarchy. The fair value amounts presented in the table are intended to reconcile the fair value hierarchy to the amounts presented in the Portfolio of Investments. The Columbia Short-Term Cash Fund seeks to provide shareholders with maximum current income consistent with liquidity and stability of principal. Columbia Short-Term Cash Fund prices its shares with a floating NAV and no longer seeks to maintain a stable NAV.
Investments falling into the Level 3 category are primarily supported by quoted prices from brokers and dealers participating in the market for those investments. However, these may be classified as Level 3 investments due to lack of market transparency and corroboration to support these quoted prices. Additionally, valuation models may be used as the pricing source for any remaining investments classified as Level 3. These models may rely on one or more significant unobservable inputs and/or significant assumptions by the Investment Manager. Inputs used in valuations may include, but are not limited to, financial statement analysis, capital account balances, discount rates and estimated cash flows, and comparable company data.
Under the direction of the Fund’s Board of Trustees (the Board), the Investment Manager’s Valuation Committee (the Committee) is responsible for overseeing the valuation procedures approved by the Board. The Committee consists of voting and non-voting members from various groups within the Investment Manager’s organization, including operations and accounting, trading and investments, compliance, risk management and legal.
The Committee meets at least monthly to review and approve valuation matters, which may include a description of specific valuation determinations, data regarding pricing information received from approved pricing vendors and brokers and the results of Board-approved valuation control policies and procedures (the Policies). The Policies address, among other things, instances when market quotations are or are not readily available, including recommendations of third party pricing vendors and a determination of appropriate pricing methodologies; events that require specific valuation determinations and assessment of fair value techniques; securities with a potential for stale pricing, including those that are illiquid, restricted, or in default; and the effectiveness of third party pricing vendors, including periodic reviews of vendors. The Committee meets more frequently, as needed, to discuss additional valuation matters, which may include the need to review back-testing results, review time-sensitive information or approve related valuation actions. The Committee reports to the Board, with members of the Committee meeting with the Board at each of its regularly scheduled meetings to discuss valuation matters and actions during the period, similar to those described earlier.
For investments categorized as Level 3, the Committee monitors information similar to that described above, which may include: (i) data specific to the issuer or comparable issuers, (ii) general market or specific sector news and (iii) quoted prices and specific or similar security transactions. The Committee considers this data and any changes from prior periods in order to assess the reasonableness of observable and unobservable inputs, any assumptions or internal models used to value those securities and changes in fair value. This data is also used to corroborate, when available, information received from approved pricing vendors and brokers. Various factors impact the frequency of monitoring this information (which may occur as often as daily). However, the Committee may determine that changes to inputs, assumptions and models are not required as a result of the monitoring procedures performed.
The accompanying Notes to Financial Statements are an integral part of this statement.
Columbia Multi-Asset Income Fund | Annual Report 2017
| 25 |
Portfolio of Investments (continued)
April 30, 2017
Fair value measurements (continued)
The following table is a summary of the inputs used to value the Fund’s investments at April 30, 2017:
| | Level 1
quoted prices
in active
markets for
identical
assets ($) | Level 2
other
significant
observable
inputs ($) | Level 3
significant
unobservable
inputs ($) | Investments
measured at
net asset
value ($) | Total ($) |
| Investments | | | | | |
| Asset-Backed Securities — Non-Agency | — | 2,302,336 | — | — | 2,302,336 |
| Commercial Mortgage-Backed Securities - Non-Agency | — | 849,033 | — | — | 849,033 |
| Common Stocks | | | | | |
| Consumer Discretionary | 111,992 | — | — | — | 111,992 |
| Consumer Staples | 858,125 | 263,296 | — | — | 1,121,421 |
| Energy | 1,633,951 | 227,304 | — | — | 1,861,255 |
| Financials | 453,184 | — | — | — | 453,184 |
| Health Care | 680,785 | 95,592 | — | — | 776,377 |
| Industrials | 118,860 | 111,196 | — | — | 230,056 |
| Information Technology | 846,294 | 42,446 | — | — | 888,740 |
| Materials | 297,296 | — | — | — | 297,296 |
| Real Estate | 4,253,536 | — | — | — | 4,253,536 |
| Telecommunication Services | 533,095 | 57,122 | — | — | 590,217 |
| Utilities | 518,691 | 63,770 | — | — | 582,461 |
| Total Common Stocks | 10,305,809 | 860,726 | — | — | 11,166,535 |
| Corporate Bonds & Notes | — | 30,831,709 | — | — | 30,831,709 |
| Equity-Linked Notes | — | 24,994,400 | — | — | 24,994,400 |
| Exchange-Traded Funds | 16,598,114 | — | — | — | 16,598,114 |
| Foreign Government Obligations | — | 14,867,009 | — | — | 14,867,009 |
| Limited Partnerships | | | | | |
| Energy | 4,939,440 | — | — | — | 4,939,440 |
| Utilities | 314,510 | — | — | — | 314,510 |
| Total Limited Partnerships | 5,253,950 | — | — | — | 5,253,950 |
| Residential Mortgage-Backed Securities - Agency | — | 3,888,515 | — | — | 3,888,515 |
| Residential Mortgage-Backed Securities - Non-Agency | — | 6,628,470 | 745,294 | — | 7,373,764 |
| Senior Loans | — | 210,031 | — | — | 210,031 |
| U.S. Treasury Obligations | 3,663,781 | — | — | — | 3,663,781 |
| Money Market Funds | — | — | — | 7,735,482 | 7,735,482 |
| Total Investments | 35,821,654 | 85,432,229 | 745,294 | 7,735,482 | 129,734,659 |
| Derivatives | | | | | |
| Asset | | | | | |
| Futures Contracts | 176,350 | — | — | — | 176,350 |
| Liability | | | | | |
| Futures Contracts | (14,298) | — | — | — | (14,298) |
| Swap Contracts | — | (44,286) | — | — | (44,286) |
| Total | 35,983,706 | 85,387,943 | 745,294 | 7,735,482 | 129,852,425 |
See the Portfolio of Investments for all investment classifications not indicated in the table.
The Fund’s assets assigned to the Level 2 input category are generally valued using the market approach, in which a security’s value is determined through reference to prices and information from market transactions for similar or identical assets. These assets include certain foreign securities for which a third party statistical pricing service may be employed for purposes of fair market valuation. The model utilized by such third party statistical pricing service takes into account a security’s correlation to available market data including, but not limited to, intraday index, ADR, and exchange-traded fund movements.
Derivative instruments are valued at unrealized appreciation (depreciation).
There were no transfers of financial assets between levels during the period.
The Fund does not hold any significant investments (greater than one percent of net assets) categorized as Level 3.
The accompanying Notes to Financial Statements are an integral part of this statement.
| 26 | Columbia Multi-Asset Income Fund | Annual Report 2017 |
Portfolio of Investments (continued)
April 30, 2017
Fair value measurements (continued)
The Fund’s assets assigned to the Level 3 category are valued utilizing the valuation technique deemed the most appropriate in the circumstances. Certain residential mortgage-backed securities classified as Level 3 securities are valued using the market approach and utilize single market quotations from broker dealers which may have included, but were not limited to, observable transactions for identical or similar assets in the market and the distressed nature of the security. The appropriateness of fair values for these securities is monitored on an ongoing basis which may include results of back testing, manual price reviews and other control procedures. Significant increases (decreases) to any of these inputs would result in a significantly lower (higher) fair value measurement.
The accompanying Notes to Financial Statements are an integral part of this statement.
Columbia Multi-Asset Income Fund | Annual Report 2017
| 27 |
Statement of Assets and Liabilities
April 30, 2017
| Assets | |
| Investments, at cost | |
| Unaffiliated issuers, at cost | $121,028,217 |
| Affiliated issuers, at cost | 7,735,324 |
| Total investments, at cost | 128,763,541 |
| Investments, at value | |
| Unaffiliated issuers, at value | 121,999,177 |
| Affiliated issuers, at value | 7,735,482 |
| Total investments, at value | 129,734,659 |
| Margin deposits | 703,100 |
| Premiums paid on outstanding swap contracts | 273,645 |
| Receivable for: | |
| Investments sold | 222,434 |
| Capital shares sold | 11,132 |
| Dividends | 62,759 |
| Interest | 986,388 |
| Foreign tax reclaims | 7,287 |
| Variation margin | 14,906 |
| Expense reimbursement due from Investment Manager | 1,153 |
| Prepaid expenses | 179 |
| Trustees’ deferred compensation plan | 6,826 |
| Other assets | 14,402 |
| Total assets | 132,038,870 |
| Liabilities | |
| Due to custodian | 10,812 |
| Unrealized depreciation on swap contracts | 44,286 |
| Payable for: | |
| Investments purchased | 313,115 |
| Investments purchased on a delayed delivery basis | 996,105 |
| Variation margin | 27,160 |
| Management services fees | 2,363 |
| Distribution and/or service fees | 24 |
| Transfer agent fees | 222 |
| Compensation of chief compliance officer | 4 |
| Other expenses | 49,313 |
| Trustees’ deferred compensation plan | 6,826 |
| Total liabilities | 1,450,230 |
| Net assets applicable to outstanding capital stock | $130,588,640 |
| Represented by | |
| Paid in capital | 131,978,293 |
| Undistributed net investment income | 1,236,410 |
| Accumulated net realized loss | (3,714,984) |
| Unrealized appreciation (depreciation) on: | |
| Investments - unaffiliated issuers | 970,960 |
| Investments - affiliated issuers | 158 |
| Foreign currency translations | 37 |
| Futures contracts | 162,052 |
| Swap contracts | (44,286) |
| Total - representing net assets applicable to outstanding capital stock | $130,588,640 |
The accompanying Notes to Financial Statements are an integral part of this statement.
| 28 | Columbia Multi-Asset Income Fund | Annual Report 2017 |
Statement of Assets and Liabilities (continued)
April 30, 2017
| Class A | |
| Net assets | $799,603 |
| Shares outstanding | 81,751 |
| Net asset value per share | $9.78 |
| Maximum offering price per share(a) | $10.27 |
| Class C | |
| Net assets | $668,075 |
| Shares outstanding | 68,287 |
| Net asset value per share | $9.78 |
| Class R4 | |
| Net assets | $159,793 |
| Shares outstanding | 16,333 |
| Net asset value per share | $9.78 |
| Class R5 | |
| Net assets | $12,909 |
| Shares outstanding | 1,319 |
| Net asset value per share(b) | $9.78 |
| Class T(c) | |
| Net assets | $9,785 |
| Shares outstanding | 1,000 |
| Net asset value per share(b) | $9.78 |
| Maximum offering price per share(d) | $10.03 |
| Class Y | |
| Net assets | $127,555,352 |
| Shares outstanding | 13,063,008 |
| Net asset value per share | $9.76 |
| Class Z | |
| Net assets | $1,383,123 |
| Shares outstanding | 141,335 |
| Net asset value per share | $9.79 |
| (a) | The maximum offering price per share is calculated by dividing the net asset value per share by 1.0 minus the maximum sales charge of 4.75% for Class A. |
| (b) | Net asset value per share rounds to this amount due to fractional shares outstanding. |
| (c) | Effective March 27, 2017, Class W shares were renamed Class T shares. |
| (d) | The maximum offering price per share is calculated by dividing the net asset value per share by 1.0 minus the maximum sales charge of 2.50% for Class T. |
The accompanying Notes to Financial Statements are an integral part of this statement.
Columbia Multi-Asset Income Fund | Annual Report 2017
| 29 |
Statement of Operations
Year Ended April 30, 2017
| Net investment income | |
| Income: | |
| Dividends — unaffiliated issuers | $1,199,035 |
| Dividends — affiliated issuers | 26,531 |
| Interest | 6,450,509 |
| Foreign taxes withheld | (4,689) |
| Total income | 7,671,386 |
| Expenses: | |
| Management services fees | 767,760 |
| Distribution and/or service fees | |
| Class A | 1,062 |
| Class C | 2,641 |
| Class T(a) | 24 |
| Transfer agent fees | |
| Class A | 603 |
| Class C | 362 |
| Class I(b) | 3,063 |
| Class R4 | 26 |
| Class R5 | 6 |
| Class T(a) | 13 |
| Class Y(c) | 1,301 |
| Class Z | 862 |
| Compensation of board members | 19,589 |
| Custodian fees | 51,263 |
| Printing and postage fees | 19,715 |
| Registration fees | 93,337 |
| Audit fees | 42,572 |
| Legal fees | 3,113 |
| Compensation of chief compliance officer | 52 |
| Other | 15,580 |
| Total expenses | 1,022,944 |
| Fees waived or expenses reimbursed by Investment Manager and its affiliates | (330,226) |
| Total net expenses | 692,718 |
| Net investment income | 6,978,668 |
| Realized and unrealized gain (loss) — net | |
| Net realized gain (loss) on: | |
| Investments — unaffiliated issuers | (434,006) |
| Investments — affiliated issuers | (93) |
| Foreign currency translations | 2,830 |
| Forward foreign currency exchange contracts | 13,172 |
| Futures contracts | 408,509 |
| Swap contracts | (2,330) |
| Net realized loss | (11,918) |
| Net change in unrealized appreciation (depreciation) on: | |
| Investments — unaffiliated issuers | 2,864,851 |
| Investments — affiliated issuers | 158 |
| Foreign currency translations | (99) |
| Futures contracts | 135,448 |
| Swap contracts | (44,286) |
| Net change in unrealized appreciation (depreciation) | 2,956,072 |
| Net realized and unrealized gain | 2,944,154 |
| Net increase in net assets resulting from operations | $9,922,822 |
| (a) | Effective March 27, 2017, Class W shares were renamed Class T shares. |
| (b) | Effective March 27, 2017, Class I shares were redeemed or exchanged for Class Y shares. |
| (c) | Class Y shares are based on operations from March 1, 2017 (commencement of operations) through the stated period end. |
The accompanying Notes to Financial Statements are an integral part of this statement.
| 30 | Columbia Multi-Asset Income Fund | Annual Report 2017 |
Statement of Changes in Net Assets
| | Year Ended
April 30, 2017 (a) | Year Ended
April 30, 2016 |
| Operations | | |
| Net investment income | $6,978,668 | $5,446,858 |
| Net realized loss | (11,918) | (3,678,682) |
| Net change in unrealized appreciation (depreciation) | 2,956,072 | (2,024,943) |
| Net increase (decrease) in net assets resulting from operations | 9,922,822 | (256,767) |
| Distributions to shareholders | | |
| Net investment income | | |
| Class A | (22,265) | (2,908) |
| Class C | (11,782) | (3,416) |
| Class I(b) | (5,513,329) | (5,385,064) |
| Class R4 | (1,074) | (561) |
| Class R5 | (577) | (564) |
| Class T(c) | (469) | (537) |
| Class Y | (542,196) | — |
| Class Z | (32,785) | (18,023) |
| Total distributions to shareholders | (6,124,477) | (5,411,073) |
| Increase in net assets from capital stock activity | 33,791,213 | 5,620,509 |
| Total increase (decrease) in net assets | 37,589,558 | (47,331) |
| Net assets at beginning of year | 92,999,082 | 93,046,413 |
| Net assets at end of year | $130,588,640 | $92,999,082 |
| Undistributed net investment income | $1,236,410 | $375,985 |
| (a) | Class Y shares are based on operations from March 1, 2017 (commencement of operations) through the stated period end. |
| (b) | Effective March 27, 2017, Class I shares were redeemed or exchanged for Class Y shares. |
| (c) | Effective March 27, 2017, Class W shares were renamed Class T shares. |
The accompanying Notes to Financial Statements are an integral part of this statement.
Columbia Multi-Asset Income Fund | Annual Report 2017
| 31 |
Statement of Changes in Net Assets (continued)
| | Year Ended | Year Ended |
| | April 30, 2017 (a) | April 30, 2016 |
| | Shares | Dollars ($) | Shares | Dollars ($) |
| Capital stock activity |
| Class A | | | | |
| Subscriptions | 102,135 | 986,637 | 19,017 | 177,010 |
| Distributions reinvested | 2,263 | 21,796 | 256 | 2,371 |
| Redemptions | (37,248) | (359,017) | (5,672) | (53,313) |
| Net increase | 67,150 | 649,416 | 13,601 | 126,068 |
| Class C | | | | |
| Subscriptions | 62,581 | 604,966 | 9,746 | 92,484 |
| Distributions reinvested | 1,159 | 11,200 | 319 | 2,950 |
| Redemptions | (6,199) | (58,594) | (319) | (2,950) |
| Net increase | 57,541 | 557,572 | 9,746 | 92,484 |
| Class I(b) | | | | |
| Subscriptions | 2,612,739 | 25,332,376 | — | — |
| Distributions reinvested | 574,056 | 5,512,867 | 577,518 | 5,384,495 |
| Redemptions | (12,983,391) | (125,392,271) | — | — |
| Net increase (decrease) | (9,796,596) | (94,547,028) | 577,518 | 5,384,495 |
| Class R4 | | | | |
| Subscriptions | 15,273 | 148,536 | — | — |
| Distributions reinvested | 60 | 580 | — | — |
| Net increase | 15,333 | 149,116 | — | — |
| Class R5 | | | | |
| Subscriptions | 311 | 3,000 | — | — |
| Distributions reinvested | 8 | 78 | — | — |
| Net increase | 319 | 3,078 | — | — |
| Class Y(b) | | | | |
| Subscriptions | 13,007,521 | 125,392,639 | — | — |
| Distributions reinvested | 55,487 | 542,111 | — | — |
| Net increase | 13,063,008 | 125,934,750 | — | — |
| Class Z | | | | |
| Subscriptions | 110,740 | 1,068,041 | — | — |
| Distributions reinvested | 3,301 | 31,870 | 1,872 | 17,462 |
| Redemptions | (5,873) | (55,602) | — | — |
| Net increase | 108,168 | 1,044,309 | 1,872 | 17,462 |
| Total net increase | 3,514,923 | 33,791,213 | 602,737 | 5,620,509 |
| (a) | Class Y shares are based on operations from March 1, 2017 (commencement of operations) through the stated period end. |
| (b) | Effective March 27, 2017, Class I shares were redeemed or exchanged for Class Y shares. |
The accompanying Notes to Financial Statements are an integral part of this statement.
| 32 | Columbia Multi-Asset Income Fund | Annual Report 2017 |
[THIS PAGE INTENTIONALLY LEFT BLANK]
Columbia Multi-Asset Income Fund | Annual Report 2017
| 33 |
The following table is intended to help you understand the Fund’s financial performance. Certain information reflects financial results for a single share of a class held for the periods shown. Per share net investment income (loss) amounts are calculated based on average shares outstanding during the period. Total return assumes reinvestment of all dividends and distributions, if any. Total return does not reflect payment of sales charges, if any. Total return and portfolio turnover are not annualized for periods of less than one year. The portfolio turnover rate is calculated without regard to purchase and sales transactions of short-term instruments and certain derivatives, if any. If such transactions were included, the Fund’s portfolio turnover rate may be higher.
| Year ended | Net asset value,
beginning of
period | Net
investment
income | Net
realized
and
unrealized
gain (loss) | Total from
investment
operations | Distributions
from net
investment
income |
| Class A |
| 4/30/2017 | $9.43 | 0.56 | 0.26 | 0.82 | (0.47) |
| 4/30/2016 | $10.05 | 0.57 | (0.65) | (0.08) | (0.54) |
| 4/30/2015 (c) | $10.00 | 0.03 | 0.04 | 0.07 | (0.02) |
| Class C |
| 4/30/2017 | $9.43 | 0.49 | 0.26 | 0.75 | (0.40) |
| 4/30/2016 | $10.05 | 0.48 | (0.63) | (0.15) | (0.47) |
| 4/30/2015 (e) | $10.00 | 0.02 | 0.04 | 0.06 | (0.01) |
| Class R4 |
| 4/30/2017 | $9.43 | 0.61 | 0.23 | 0.84 | (0.49) |
| 4/30/2016 | $10.05 | 0.56 | (0.62) | (0.06) | (0.56) |
| 4/30/2015 (f) | $10.00 | 0.03 | 0.04 | 0.07 | (0.02) |
| Class R5 |
| 4/30/2017 | $9.43 | 0.57 | 0.28 | 0.85 | (0.50) |
| 4/30/2016 | $10.05 | 0.57 | (0.63) | (0.06) | (0.56) |
| 4/30/2015 (g) | $10.00 | 0.03 | 0.04 | 0.07 | (0.02) |
| Class T(h) |
| 4/30/2017 | $9.43 | 0.54 | 0.28 | 0.82 | (0.47) |
| 4/30/2016 | $10.05 | 0.54 | (0.62) | (0.08) | (0.54) |
| 4/30/2015 (i) | $10.00 | 0.03 | 0.04 | 0.07 | (0.02) |
| Class Y |
| 4/30/2017 (j) | $9.78 | 0.11 | (0.05) (k) | 0.06 | (0.08) |
The accompanying Notes to Financial Statements are an integral part of this statement.
| 34 | Columbia Multi-Asset Income Fund | Annual Report 2017 |
Total
distributions to
shareholders | Net
asset
value,
end of
period | Total
return | Total gross
expense
ratio to
average
net assets(a) | Total net
expense
ratio to
average
net assets(a),(b) | Net investment
income
ratio to
average
net assets | Portfolio
turnover | Net
assets,
end of
period
(000’s) |
| |
| (0.47) | $9.78 | 8.88% | 1.27% | 0.94% | 5.83% | 69% | $800 |
| (0.54) | $9.43 | (0.62%) | 1.34% | 0.91% | 6.15% | 70% | $138 |
| (0.02) | $10.05 | 0.69% | 1.24% (d) | 0.75% (d) | 2.70% (d) | 30% | $10 |
| |
| (0.40) | $9.78 | 8.07% | 2.02% | 1.69% | 5.10% | 69% | $668 |
| (0.47) | $9.43 | (1.37%) | 2.12% | 1.65% | 5.24% | 70% | $101 |
| (0.01) | $10.05 | 0.61% | 1.99% (d) | 1.50% (d) | 2.00% (d) | 30% | $10 |
| |
| (0.49) | $9.78 | 9.17% | 1.05% | 0.69% | 6.57% | 69% | $160 |
| (0.56) | $9.43 | (0.36%) | 1.10% | 0.64% | 5.99% | 70% | $9 |
| (0.02) | $10.05 | 0.71% | 0.99% (d) | 0.50% (d) | 3.00% (d) | 30% | $10 |
| |
| (0.50) | $9.78 | 9.22% | 0.93% | 0.64% | 5.99% | 69% | $13 |
| (0.56) | $9.43 | (0.34%) | 1.06% | 0.60% | 6.03% | 70% | $9 |
| (0.02) | $10.05 | 0.73% | 0.97% (d) | 0.47% (d) | 3.02% (d) | 30% | $10 |
| |
| (0.47) | $9.78 | 8.89% | 1.27% | 0.94% | 5.63% | 69% | $10 |
| (0.54) | $9.43 | (0.62%) | 1.35% | 0.89% | 5.75% | 70% | $9 |
| (0.02) | $10.05 | 0.69% | 1.24% (d) | 0.75% (d) | 2.75% (d) | 30% | $10 |
| |
| (0.08) | $9.76 | 0.66% | 0.93% (d) | 0.60% (d) | 7.22% (d) | 69% | $127,555 |
Columbia Multi-Asset Income Fund | Annual Report 2017
| 35 |
Financial Highlights (continued)
| Year ended | Net asset value,
beginning of
period | Net
investment
income | Net
realized
and
unrealized
gain (loss) | Total from
investment
operations | Distributions
from net
investment
income |
| Class Z |
| 4/30/2017 | $9.43 | 0.59 | 0.26 | 0.85 | (0.49) |
| 4/30/2016 | $10.06 | 0.56 | (0.63) | (0.07) | (0.56) |
| 4/30/2015 (l) | $10.00 | 0.03 | 0.05 | 0.08 | (0.02) |
| Notes to Financial Highlights |
| (a) | In addition to the fees and expenses that the Fund bears directly, the Fund indirectly bears a pro rata share of the fees and expenses of any other funds in which it invests. Such indirect expenses are not included in the Fund’s reported expense ratios. |
| (b) | Total net expenses include the impact of certain fee waivers/expense reimbursements made by the Investment Manager and certain of its affiliates, if applicable. |
| (c) | Class A shares commenced operations on March 27, 2015. Per share data and total return reflect activity from that date. |
| (d) | Annualized. |
| (e) | Class C shares commenced operations on March 27, 2015. Per share data and total return reflect activity from that date. |
| (f) | Class R4 shares commenced operations on March 27, 2015. Per share data and total return reflect activity from that date. |
| (g) | Class R5 shares commenced operations on March 27, 2015. Per share data and total return reflect activity from that date. |
| (h) | Effective March 27, 2017, Class W shares were renamed Class T shares. |
| (i) | Class T shares commenced operations on March 27, 2015. Per share data and total return reflect activity from that date. |
| (j) | Class Y shares commenced operations on March 1, 2017. Per share data and total return reflect activity from that date. |
| (k) | Calculation of the net gain (loss) per share (both realized and unrealized) does not correlate to the aggregate realized and unrealized gain (loss) presented in the Statement of Operations due to the timing of subscriptions and redemptions of Fund shares in relation to fluctuations in the market value of the portfolio. |
| (l) | Class Z shares commenced operations on March 27, 2015. Per share data and total return reflect activity from that date. |
The accompanying Notes to Financial Statements are an integral part of this statement.
| 36 | Columbia Multi-Asset Income Fund | Annual Report 2017 |
Total
distributions to
shareholders | Net
asset
value,
end of
period | Total
return | Total gross
expense
ratio to
average
net assets(a) | Total net
expense
ratio to
average
net assets(a),(b) | Net investment
income
ratio to
average
net assets | Portfolio
turnover | Net
assets,
end of
period
(000’s) |
| |
| (0.49) | $9.79 | 9.27% | 1.03% | 0.69% | 6.24% | 69% | $1,383 |
| (0.56) | $9.43 | (0.47%) | 1.11% | 0.65% | 5.99% | 70% | $313 |
| (0.02) | $10.06 | 0.82% | 0.99% (d) | 0.50% (d) | 3.61% (d) | 30% | $315 |
Columbia Multi-Asset Income Fund | Annual Report 2017
| 37 |
Notes to Financial Statements
April 30, 2017
Note 1. Organization
Columbia Multi-Asset Income Fund (the Fund), a series of Columbia Funds Series Trust I (the Trust), is a diversified fund. The Trust is registered under the Investment Company Act of 1940, as amended (the 1940 Act), as an open-end management investment company organized as a Massachusetts business trust.
Fund shares
The Trust may issue an unlimited number of shares (without par value). Although all share classes generally have identical voting, dividend and liquidation rights, each share class votes separately when required by the Trust’s organizational documents or by law. Different share classes pay different distribution amounts to the extent the expenses of such share classes differ, and distributions in liquidation will be proportional to the net asset value of each share class. Each share class has its own expense and sales charge structure. The Fund offers each of the share classes identified below.
Class A shares are subject to a maximum front-end sales charge of 4.75% based on the initial investment amount. Class A shares purchased without an initial sales charge in accounts aggregating $1 million to $50 million at the time of purchase are subject to a contingent deferred sales charge (CDSC) if the shares are sold within 18 months after purchase, charged as follows: 1.00% CDSC if redeemed within 12 months after purchase, and 0.50% CDSC if redeemed more than 12, but less than 18, months after purchase.
Class C shares are subject to a 1.00% CDSC on shares redeemed within 12 months after purchase.
Effective March 27, 2017, Class I shares of the Fund are no longer offered for sale. Class I shares, when available, were not subject to sales charges or distribution and service (12b-1) fees, and were made available only to the Columbia Family of Funds. On March 27, 2017, Class I shares were redeemed or exchanged for Class Y shares of the Fund in a tax free transaction that had no impact on the fees and expenses paid by shareholders.
Class R4 shares are not subject to sales charges and are generally available only to omnibus retirement plans and certain investors as described in the Fund’s prospectus.
Class R5 shares are not subject to sales charges and are generally available only to investors purchasing through authorized investment professionals and omnibus retirement plans.
Class T shares are subject to a maximum front-end sales charge of 2.50% per transaction and must be purchased through financial intermediaries that, by written agreement with Columbia Management Investment Distributors, Inc., are specifically authorized to sell Class T shares. Prior to March 27, 2017, Class T shares were known as Class W shares, were not subject to sales charges, and were generally available only to investors purchasing through authorized investment programs managed by investment professionals, including discretionary managed accounts.
Class Y shares are not subject to sales charges or distribution and service (12b-1) fees, and are available to institutional and certain other investors as described in the Fund’s prospectus. Class Y shares commenced operations on March 1, 2017. On March 27, 2017, Class I shares were redeemed or exchanged for Class Y shares of the Fund in a tax free transaction that had no impact on the fees and expenses paid by shareholders. Class I shares of the Fund are no longer offered for sale.
Class Z shares are not subject to sales charges and are generally available only to eligible investors, which are subject to different investment minimums as described in the Fund’s prospectus.
Note 2. Summary of significant accounting policies
Basis of preparation
The Fund is an investment company that applies the accounting and reporting guidance in the Financial Accounting Standards Board (FASB) Accounting Standards Codification Topic 946, Financial Services - Investment Companies (ASC 946). The financial statements are prepared in accordance with U.S. generally accepted accounting principles (GAAP), which requires management to make certain estimates and assumptions that affect the reported amounts of assets and liabilities, the disclosure of contingent assets and liabilities at the date of the financial statements and the reported amounts of income and expenses during the reporting period. Actual results could differ from those estimates.
| 38 | Columbia Multi-Asset Income Fund | Annual Report 2017 |
Notes to Financial Statements (continued)
April 30, 2017
The following is a summary of significant accounting policies followed by the Fund in the preparation of its financial statements.
Security valuation
All equity securities and exchange-traded funds are valued at the close of business of the New York Stock Exchange. Equity securities and exchange-traded funds are valued at the last quoted sales price on the principal exchange or market on which they trade, except for securities traded on the NASDAQ Stock Market, which are valued at the NASDAQ official close price. Unlisted securities or listed securities for which there were no sales during the day are valued at the mean of the latest quoted bid and ask prices on such exchanges or markets.
Debt securities generally are valued by pricing services approved by the Board of Trustees based upon market transactions for normal, institutional-size trading units of similar securities. The services may use various pricing techniques that take into account, as applicable, factors such as yield, quality, coupon rate, maturity, type of issue, trading characteristics and other data, as well as approved independent broker-dealer quotes. Debt securities for which quotations are not readily available or not believed to be reflective of market value may also be valued based upon a bid quote from an approved independent broker-dealer. Debt securities maturing in 60 days or less are valued primarily at amortized cost value, unless this method results in a valuation that management believes does not approximate market value.
Asset- and mortgage-backed securities are generally valued by pricing services, which utilize pricing models that incorporate the securities’ cash flow and loan performance data. These models also take into account available market data, including trades, market quotations, and benchmark yield curves for identical or similar securities. Factors used to identify similar securities may include, but are not limited to, issuer, collateral type, vintage, prepayment speeds, collateral performance, credit ratings, credit enhancement and expected life. Asset-backed securities for which quotations are readily available may also be valued based upon an over-the-counter or exchange bid quote from an approved independent broker-dealer.
Senior loan securities for which reliable market quotations are readily available are generally valued by pricing services at the average of the bids received.
Foreign equity securities are valued based on the closing price on the foreign exchange in which such securities are primarily traded. If any foreign equity security closing prices are not readily available, the securities are valued at the mean of the latest quoted bid and ask prices on such exchanges or markets. Foreign currency exchange rates are generally determined at 4:00 p.m. Eastern (U.S.) time. Many securities markets and exchanges outside the U.S. close prior to the close of the New York Stock Exchange; therefore, the closing prices for securities in such markets or on such exchanges may not fully reflect events that occur after such close but before the close of the New York Stock Exchange. In those situations, foreign securities will be fair valued pursuant to a policy adopted by the Board of Trustees, including, if available, utilizing a third party pricing service to determine these fair values. The third party pricing service takes into account multiple factors, including, but not limited to, movements in the U.S. securities markets, certain depositary receipts, futures contracts and foreign exchange rates that have occurred subsequent to the close of the foreign exchange or market, to determine a good faith estimate that reasonably reflects the current market conditions as of the close of the New York Stock Exchange. The fair value of a security is likely to be different from the quoted or published price, if available.
Investments in open-end investment companies, including money market funds, are valued at their latest net asset value.
Futures and options on futures contracts are valued based upon the settlement price at the close of regular trading on their principal exchanges or, in the absence of transactions, at the mean of the latest quoted bid and ask prices.
Swap transactions are valued through an independent pricing service or broker, or if neither is available, through an internal model based upon observable inputs.
Investments for which market quotations are not readily available, or that have quotations which management believes are not reflective of market value or reliable, are valued at fair value as determined in good faith under procedures approved by and under the general supervision of the Board of Trustees. If a security or class of securities (such as foreign securities) is valued at fair value, such value is likely to be different from the quoted or published price for the security.
Columbia Multi-Asset Income Fund | Annual Report 2017
| 39 |
Notes to Financial Statements (continued)
April 30, 2017
The determination of fair value often requires significant judgment. To determine fair value, management may use assumptions including but not limited to future cash flows and estimated risk premiums. Multiple inputs from various sources may be used to determine fair value.
GAAP requires disclosure regarding the inputs and valuation techniques used to measure fair value and any changes in valuation inputs or techniques. In addition, investments shall be disclosed by major category. This information is disclosed following the Fund’s Portfolio of Investments.
Foreign currency transactions and translations
The values of all assets and liabilities denominated in foreign currencies are generally translated into U.S. dollars at exchange rates determined at the close of regular trading on the New York Stock Exchange. Net realized and unrealized gains (losses) on foreign currency transactions and translations include gains (losses) arising from the fluctuation in exchange rates between trade and settlement dates on securities transactions, gains (losses) arising from the disposition of foreign currency and currency gains (losses) between the accrual and payment dates on dividends, interest income and foreign withholding taxes.
For financial statement purposes, the Fund does not distinguish that portion of gains (losses) on investments which is due to changes in foreign exchange rates from that which is due to changes in market prices of the investments. Such fluctuations are included with the net realized and unrealized gains (losses) on investments in the Statement of Operations.
Derivative instruments
The Fund invests in certain derivative instruments, as detailed below, to meet its investment objectives. Derivatives are instruments whose values depend on, or are derived from, in whole or in part, the value of one or more securities, currencies, commodities, indices, or other assets or instruments. Derivatives may be used to increase investment flexibility (including to maintain cash reserves while maintaining desired exposure to certain assets), for risk management (hedging) purposes, to facilitate trading, to reduce transaction costs and to pursue higher investment returns. The Fund may also use derivative instruments to mitigate certain investment risks, such as foreign currency exchange rate risk, interest rate risk and credit risk. Derivatives may involve various risks, including the potential inability of the counterparty to fulfill its obligations under the terms of the contract, the potential for an illiquid secondary market (making it difficult for the Fund to sell or terminate, including at favorable prices) and the potential for market movements which may expose the Fund to gains or losses in excess of the amount shown in the Statement of Assets and Liabilities. The notional amounts of derivative instruments, if applicable, are not recorded in the financial statements.
A derivative instrument may suffer a marked-to-market loss if the value of the contract decreases due to an unfavorable change in the market rates or values of the underlying instrument. Losses can also occur if the counterparty does not perform its obligations under the contract. The Fund’s risk of loss from counterparty credit risk on over-the-counter derivatives is generally limited to the aggregate unrealized gain netted against any collateral held by the Fund and the amount of any variation margin held by the counterparty, plus any replacement costs or related amounts. With exchange-traded or centrally cleared derivatives, there is reduced counterparty credit risk to the Fund since the clearinghouse or central counterparty (CCP) provides some protection in the case of clearing member default. The clearinghouse or CCP stands between the buyer and the seller of the contract; therefore, additional counterparty credit risk is failure of the clearinghouse or CCP. However, credit risk still exists in exchange-traded or centrally cleared derivatives with respect to initial and variation margin that is held in a broker’s customer account. While brokers are required to segregate customer margin from their own assets, in the event that a broker becomes insolvent or goes into bankruptcy and at that time there is a shortfall in the aggregate amount of margin held by the broker for all its clients, U.S. bankruptcy laws will typically allocate that shortfall on a pro-rata basis across all the broker’s customers (including the Fund), potentially resulting in losses to the Fund.
In order to better define its contractual rights and to secure rights that will help the Fund mitigate its counterparty risk, the Fund may enter into an International Swaps and Derivatives Association, Inc. Master Agreement (ISDA Master Agreement) or similar agreement with its derivatives contract counterparties. An ISDA Master Agreement is an agreement between the Fund and a counterparty that governs over-the-counter derivatives and typically contains, among other things, collateral posting terms and netting provisions in the event of a default and/or termination event. Under an ISDA Master Agreement, the Fund may, under certain circumstances, offset with the counterparty certain derivative instrument’s payables and/or receivables
| 40 | Columbia Multi-Asset Income Fund | Annual Report 2017 |
Notes to Financial Statements (continued)
April 30, 2017
with collateral held and/or posted and create one single net payment. The provisions of the ISDA Master Agreement typically permit a single net payment in the event of default (close-out netting), including the bankruptcy or insolvency of the counterparty. Note, however, that bankruptcy or insolvency laws of a particular jurisdiction may impose restrictions on or prohibitions against the right of offset or netting in bankruptcy, insolvency or other events.
Collateral (margin) requirements differ by type of derivative. Margin requirements are established by the clearinghouse or CCP for exchange-traded and centrally cleared derivatives. Brokers can ask for margin in excess of the minimum in certain circumstances. Collateral terms are contract specific for over-the-counter derivatives. For over-the-counter derivatives traded under an ISDA Master Agreement, the collateral requirements are typically calculated by netting the marked-to-market amount for each transaction under such agreement and comparing that amount to the value of any variation margin currently pledged by the Fund and/or the counterparty. Generally, the amount of collateral due from or to a party has to exceed a minimum transfer amount threshold (e.g., $250,000) before a transfer has to be made. To the extent amounts due to the Fund from its counterparties are not fully collateralized, contractually or otherwise, the Fund bears the risk of loss from counterparty nonperformance. The Fund attempts to mitigate counterparty risk by only entering into agreements with counterparties that it believes have the financial resources to honor their obligations and by monitoring the financial stability of those counterparties.
Certain ISDA Master Agreements allow counterparties of over-the-counter derivatives transactions to terminate derivatives contracts prior to maturity in the event the Fund’s net asset value declines by a stated percentage over a specified time period or if the Fund fails to meet certain terms of the ISDA Master Agreement, which would cause the Fund to accelerate payment of any net liability owed to the counterparty. The Fund also has termination rights if the counterparty fails to meet certain terms of the ISDA Master Agreement. In addition to considering counterparty credit risk, the Fund would consider terminating the derivatives contracts based on whether termination would result in a net liability owed from the counterparty.
For financial reporting purposes, the Fund does not offset derivative assets and derivative liabilities that are subject to netting arrangements in the Statement of Assets and Liabilities.
Forward foreign currency exchange contracts
Forward foreign currency exchange contracts are over-the-counter agreements between two parties to buy and sell a currency at a set price on a future date. The Fund utilized forward foreign currency exchange contracts to hedge the currency exposure associated with some or all of the Fund’s securities. These instruments may be used for other purposes in future periods.
The values of forward foreign currency exchange contracts fluctuate daily with changes in foreign currency exchange rates. Changes in the value of these contracts are recorded as unrealized appreciation or depreciation until the contract is exercised or has expired. The Fund will realize a gain or loss when the forward foreign currency exchange contract is closed or expires.
The use of forward foreign currency exchange contracts does not eliminate fluctuations in the prices of the Fund’s portfolio securities. The risks of forward foreign currency exchange contracts include movement in the values of the foreign currencies relative to the U.S. dollar (or other foreign currencies) and the possibility that counterparties will not complete their contractual obligations, which may be in excess of the amount reflected, if any, in the Statement of Assets and Liabilities.
Futures contracts
Futures contracts are exchange-traded and represent commitments for the future purchase or sale of an asset at a specified price on a specified date. The Fund bought and sold futures contracts to produce incremental earnings, to manage the duration and yield curve exposure of the Fund versus the benchmark, to manage exposure to movements in interest rates and to manage exposure to the securities market. These instruments may be used for other purposes in future periods. Upon entering into futures contracts, the Fund bears risks that it may not achieve the anticipated benefits of the futures contracts and may realize a loss. Additional risks include counterparty credit risk, the possibility of an illiquid market, and that a change in the value of the contract or option may not correlate with changes in the value of the underlying asset.
Upon entering into a futures contract, the Fund deposits cash or securities with the broker, known as a futures commission merchant (FCM), in an amount sufficient to meet the initial margin requirement. The initial margin deposit must be maintained at an established level over the life of the contract. Cash deposited as initial margin is recorded in the Statement of Assets
Columbia Multi-Asset Income Fund | Annual Report 2017
| 41 |
Notes to Financial Statements (continued)
April 30, 2017
and Liabilities as margin deposits. Securities deposited as initial margin are designated in the Portfolio of Investments. Subsequent payments (variation margin) are made or received by the Fund each day. The variation margin payments are equal to the daily change in the contract value and are recorded as variation margin receivable or payable and are offset in unrealized gains or losses. The Fund recognizes a realized gain or loss when the contract is closed or expires. Futures contracts involve, to varying degrees, risk of loss in excess of the variation margin disclosed in the Statement of Assets and Liabilities.
Swap contracts
Swap contracts are negotiated in the over-the-counter market and may be entered into as a bilateral contract or centrally cleared (centrally cleared swap contract). In a centrally cleared swap contract, immediately following execution of the swap contract with a broker, the swap contract is novated to a central counterparty (the CCP) and the CCP becomes the Fund’s counterparty to the centrally cleared swap contract. The Fund is required to deposit initial margin with the futures commission merchant (FCM), which pledges it through to the CCP in the form of cash or securities in an amount that varies depending on the size and risk profile of the particular swap contract. Securities deposited as initial margin are designated in the Portfolio of Investments and cash deposited is recorded in the Statement of Assets and Liabilities as margin deposits. Unlike a bilateral swap contract, for centrally cleared swap contracts, the Fund has minimal credit exposure to the FCM because the CCP stands between the Fund and the relevant buyer/seller on the other side of the contract. Swap contracts are marked-to-market daily and changes in value are recorded as unrealized appreciation (depreciation). The daily change in valuation of centrally cleared swap contracts, if any, is recorded as a receivable or payable for variation margin in the Statement of Assets and Liabilities.
Entering into these contracts involves, to varying degrees, elements of interest, liquidity and counterparty credit risk in excess of the amounts recognized in the Statement of Assets and Liabilities. Such risks involve the possibility that there may be unfavorable changes in interest rates, market conditions or other conditions, it may be difficult to initiate a swap transaction or liquidate a position at an advantageous time or price which may result in significant losses, and that the FCM or CCP may not fulfill its obligation under the contract.
Credit default swap contracts
The Fund entered into credit default swap contracts to increase or decrease its credit exposure to a specific debt security or a basket of debt securities, as a protection buyer, to reduce overall credit exposure. These instruments may be used for other purposes in future periods. Credit default swap contracts are agreements in which one party pays fixed periodic payments to a counterparty in consideration for an agreement from the counterparty to make a specific payment should a specified credit event(s) take place. Although specified credit events are contract specific, credit events are generally defined as bankruptcy, failure to pay, restructuring, obligation acceleration, obligation default, or repudiation/moratorium.
As the purchaser of a credit default swap contract, the Fund purchases protection by paying a periodic interest rate on the notional amount to the counterparty. The interest amount is accrued daily as a component of unrealized appreciation (depreciation) and is recorded as a realized loss upon payment. If a credit event as specified in the contract occurs, the Fund may have the option either to deliver the reference obligation to the seller in exchange for a cash payment of its par amount, or to receive a net cash settlement equal to the par amount less an agreed-upon value of the reference obligation as of the date of the credit event. The difference between the value of the obligation or cash delivered and the notional amount received will be recorded as a realized gain (loss).
Any premium paid or received by the Fund upon entering into a credit default swap contract is recorded as an asset or liability, respectively, and amortized daily as a component of realized gain (loss) in the Statement of Operations. Credit default swap contracts are valued daily, and the change in value is recorded as unrealized appreciation (depreciation) until the termination of the swap, at which time a realized gain (loss) is recorded.
Credit default swap contracts can involve greater risks than if a fund had invested in the reference obligation directly since, in addition to general market risks, credit default swaps are subject to counterparty credit risk, leverage risk, hedging risk, correlation risk and liquidity risk.
| 42 | Columbia Multi-Asset Income Fund | Annual Report 2017 |
Notes to Financial Statements (continued)
April 30, 2017
Effects of derivative transactions in the financial statements
The following tables are intended to provide additional information about the effect of derivatives on the financial statements of the Fund, including: the fair value of derivatives by risk category and the location of those fair values in the Statement of Assets and Liabilities; and the impact of derivative transactions over the period in the Statement of Operations, including realized and unrealized gains (losses). The derivative instrument schedules following the Portfolio of Investments present additional information regarding derivative instruments outstanding at the end of the period, if any.
The following table is a summary of the fair value of derivative instruments (not considered to be hedging instruments for accounting disclosure purposes) at April 30, 2017:
| | Asset derivatives | |
Risk exposure
category | Statement
of assets and liabilities
location | Fair value ($) |
| Credit risk | Premiums paid on outstanding swap contracts | 273,645 |
| Equity risk | Net assets — unrealized appreciation on futures contracts | 57,474* |
| Interest rate risk | Net assets — unrealized appreciation on futures contracts | 118,876* |
| Total | | 449,995 |
| | Liability derivatives | |
Risk exposure
category | Statement
of assets and liabilities
location | Fair value ($) |
| Credit risk | Net assets — unrealized depreciation on swap contracts | 44,286* |
| Interest rate risk | Net assets — unrealized depreciation on futures contracts | 14,298* |
| Total | | 58,584 |
| * | Includes cumulative appreciation (depreciation) as reported in the tables following the Portfolio of Investments. Only the current day’s variation margin is reported in receivables or payables in the Statement of Assets and Liabilities. |
The following table indicates the effect of derivative instruments (not considered to be hedging instruments for accounting disclosure purposes) in the Statement of Operations for the year ended April 30, 2017:
| Amount of realized gain (loss) on derivatives recognized in income |
| Risk exposure category | Forward
foreign
currency
exchange
contracts
($) | Futures
contracts
($) | Swap
contracts
($) | Total
($) |
| Credit risk | — | — | (2,330) | (2,330) |
| Equity risk | — | 784,803 | — | 784,803 |
| Foreign exchange risk | 13,172 | — | — | 13,172 |
| Interest rate risk | — | (376,294) | — | (376,294) |
| Total | 13,172 | 408,509 | (2,330) | 419,351 |
| Change in unrealized appreciation (depreciation) on derivatives recognized in income |
| Risk exposure category | Futures
contracts
($) | Swap
contracts
($) | Total
($) |
| Credit risk | — | (44,286) | (44,286) |
| Equity risk | 19,817 | — | 19,817 |
| Interest rate risk | 115,631 | — | 115,631 |
| Total | 135,448 | (44,286) | 91,162 |
Columbia Multi-Asset Income Fund | Annual Report 2017
| 43 |
Notes to Financial Statements (continued)
April 30, 2017
The following table is a summary of the average outstanding volume by derivative instrument for the year ended April 30, 2017:
| Derivative instrument | Average notional
amounts ($) |
| Futures contracts — long | 16,072,196* |
| Futures contracts — short | 508,071* |
| Credit default swap contracts — buy protection | 875,000** |
| Derivative instrument | Average unrealized
appreciation ($)** | Average unrealized
depreciation ($)** |
| Forward foreign currency exchange contracts | 2,033 | (33) |
| * | Based on the ending quarterly outstanding amounts for the year ended April 30, 2017. |
| ** | Based on the ending monthly outstanding amounts for the year ended April 30, 2017. |
Investments in senior loans
The Fund may invest in senior loan assignments. When the Fund purchases an assignment of a senior loan, the Fund typically has direct rights against the borrower; provided, however, that the Fund’s rights may be more limited than the lender from which it acquired the assignment and the Fund may be able to enforce its rights only through an administrative agent. Although certain senior loan assignments are secured by collateral, the Fund could experience delays or limitations in realizing such collateral or have its interest subordinated to other indebtedness of the obligor. In the event that the administrator or collateral agent of a loan becomes insolvent, enters into receivership or bankruptcy, the Fund may incur costs and delays in realizing payment or may suffer a loss of principal and/or interest. The risk of loss is greater for unsecured or subordinated loans. In addition, senior loan assignments are vulnerable to market, economic or other conditions or events that may reduce the demand for senior loan assignments and certain senior loan assignments which were liquid, when purchased, may become illiquid.
The Fund may enter into senior loan assignments where all or a portion of the loan may be unfunded. The Fund is obligated to fund these commitments at the borrower’s discretion. These commitments are generally traded and priced in the same manner as other senior loan securities and are disclosed as unfunded senior loan commitments in the Fund’s Portfolio of Investments with a corresponding payable for investments purchased. The Fund designates cash or liquid securities to cover these commitments.
Asset- and mortgage-backed securities
The Fund may invest in asset-backed and mortgage-backed securities. The maturity dates shown represent the original maturity of the underlying obligation. Actual maturity may vary based upon prepayment activity on these obligations. All, or a portion, of the obligation may be prepaid at any time because the underlying asset may be prepaid. As a result, decreasing market interest rates could result in an increased level of prepayment. An increased prepayment rate will have the effect of shortening the maturity of the security. Unless otherwise noted, the coupon rates presented are fixed rates.
Delayed delivery securities
The Fund may trade securities on other than normal settlement terms, including securities purchased or sold on a “when-issued” or "forward commitment" basis. This may increase risk to the Fund since the other party to the transaction may fail to deliver, which could cause the Fund to subsequently invest at less advantageous prices. The Fund designates cash or liquid securities in an amount equal to the delayed delivery commitment.
Equity-linked notes
The Fund may invest in equity-linked notes (ELNs). An ELN is a debt instrument, generally valued based on a quotation received from a counterparty, which is based on the value of a single equity security, basket of equity securities or an index of equity securities (each, an Underlying Equity). An ELN typically provides interest income, thereby offering a yield advantage over investing directly in an Underlying Equity. However, the holder of an ELN may have limited or no benefit from any appreciation in the Underlying Equity, but is exposed to various risks, including, without limitation, volatility, issuer and
| 44 | Columbia Multi-Asset Income Fund | Annual Report 2017 |
Notes to Financial Statements (continued)
April 30, 2017
market risk. The Fund may purchase ELNs that trade on a securities exchange or those that trade on the over-the-counter markets, including securities offered and sold under Rule 144A of the Securities Act of 1933, as amended. The Fund may also purchase an ELN in a privately negotiated transaction with the issuer of the ELN (or its broker-dealer affiliate).
Interest only and principal only securities
The Fund may invest in Interest Only (IO) or Principal Only (PO) securities. IOs are stripped securities entitled to receive all of the security’s interest, but none of its principal. IOs are particularly sensitive to changes in interest rates and therefore subject to greater fluctuations in price than typical interest bearing debt securities. IOs are also subject to credit risk because the Fund may not receive all or part of the interest payments if the issuer, obligor, guarantor or counterparty defaults on its obligation. Payments received for IOs are included in interest income on the Statement of Operations. Because no principal will be received at the maturity of an IO, adjustments are made to the cost of the security on a monthly basis until maturity. These adjustments are included in interest income on the Statement of Operations. POs are stripped securities entitled to receive the principal from the underlying obligation, but not the interest. POs are particularly sensitive to changes in interest rates and therefore are subject to fluctuations in price. POs are also subject to credit risk because the Fund may not receive all or part of its principal if the issuer, obligor, guarantor or counterparty defaults on its obligation. The Fund may also invest in IO or PO stripped mortgage-backed securities. Payments received for POs are treated as reductions to the cost and par value of the securities.
Offsetting of assets and liabilities
The following table presents the Fund’s gross and net amount of assets and liabilities available for offset under netting arrangements as well as any related collateral received or pledged by the Fund as of April 30, 2017:
| | Morgan
Stanley
($) |
| Assets | |
| OTC credit default swap contracts (a) | 229,359 |
| Total financial and derivative net assets | 229,359 |
| Total collateral received (pledged) (b) | 229,359 |
| Net amount (c) | - |
| (a) | Over-the-Counter Swap Contracts are presented at market value plus periodic payments receivable (payable), which is comprised of unrealized appreciation, unrealized depreciation, premiums paid and premiums received. |
| (b) | In some instances, the actual collateral received and/or pledged may be more than the amount shown due to overcollateralization. |
| (c) | Represents the net amount due from/(to) counterparties in the event of default. |
Security transactions
Security transactions are accounted for on the trade date. Cost is determined and gains (losses) are based upon the specific identification method for both financial statement and federal income tax purposes.
Trade date for senior loans purchased in the primary market is the date on which the loan is allocated. Trade date for senior loans purchased in the secondary market is the date on which the transaction is entered into.
Income recognition
Interest income is recorded on an accrual basis. Market premiums and discounts, including original issue discounts, are amortized and accreted, respectively, over the expected life of the security on all debt securities, unless otherwise noted. The Fund classifies gains and losses realized on prepayments received on mortgage-backed securities as adjustments to interest income.
The Fund may place a debt security on non-accrual status and reduce related interest income when it becomes probable that the interest will not be collected and the amount of uncollectible interest can be reasonably estimated. A defaulted debt security is removed from non-accrual status when the issuer resumes interest payments or when collectibility of interest is reasonably assured.
Columbia Multi-Asset Income Fund | Annual Report 2017
| 45 |
Notes to Financial Statements (continued)
April 30, 2017
Corporate actions and dividend income are generally recorded net of any non-reclaimable tax withholdings, on the ex-dividend date or upon receipt of ex-dividend notification in the case of certain foreign securities.
The Fund may receive distributions from holdings in equity securities, business development companies (BDCs), exchange-traded funds, other regulated investment companies (RICs), and real estate investment trusts (REITs), which report information on the tax character of their distributions annually. These distributions are allocated to dividend income, capital gain and return of capital based on actual information reported. Return of capital is recorded as a reduction of the cost basis of securities held. If the Fund no longer owns the applicable securities, return of capital is recorded as a realized gain. With respect to REITs, to the extent actual information has not yet been reported, estimates for return of capital are made by the Fund’s management. Management’s estimates are subsequently adjusted when the actual character of the distributions is disclosed by the REITs, which could result in a proportionate change in return of capital to shareholders.
Awards from class action litigation are recorded as a reduction of cost basis if the Fund still owns the applicable securities on the payment date. If the Fund no longer owns the applicable securities, the proceeds are recorded as realized gains.
The value of additional securities received as an income payment is recorded as income and increases the cost basis of such securities.
The Fund may receive other income from senior loans, including amendment fees, consent fees and commitment fees. These fees are recorded as income when received by the Fund. These amounts are included in Interest Income in the Statement of Operations.
Expenses
General expenses of the Trust are allocated to the Fund and other funds of the Trust based upon relative net assets or other expense allocation methodologies determined by the nature of the expense. Expenses directly attributable to the Fund are charged to the Fund. Expenses directly attributable to a specific class of shares are charged to that share class.
Determination of class net asset value
All income, expenses (other than class-specific expenses, which are charged to that share class, as shown in the Statement of Operations) and realized and unrealized gains (losses) are allocated to each class of the Fund on a daily basis, based on the relative net assets of each class, for purposes of determining the net asset value of each class.
Federal income tax status
The Fund intends to qualify each year as a regulated investment company under Subchapter M of the Internal Revenue Code, as amended, and will distribute substantially all of its taxable income (including net short-term capital gains), if any, for its tax year, and as such will not be subject to federal income taxes. In addition, the Fund intends to distribute in each calendar year substantially all of its net investment income, capital gains and certain other amounts, if any, such that the Fund should not be subject to federal excise tax. Therefore, no federal income or excise tax provision is recorded.
Foreign taxes
The Fund may be subject to foreign taxes on income, gains on investments or currency repatriation, a portion of which may be recoverable. The Fund will accrue such taxes and recoveries, as applicable, based upon its current interpretation of tax rules and regulations that exist in the markets in which it invests.
Realized gains in certain countries may be subject to foreign taxes at the Fund level, based on statutory rates. The Fund accrues for such foreign taxes on realized and unrealized gains at the appropriate rate for each jurisdiction, as applicable. The amount, if any, is disclosed as a liability on the Statement of Assets and Liabilities.
Distributions to shareholders
Distributions from net investment income, if any, are declared and paid monthly. Net realized capital gains, if any, are distributed at least annually. Income distributions and capital gain distributions are determined in accordance with federal income tax regulations, which may differ from GAAP.
| 46 | Columbia Multi-Asset Income Fund | Annual Report 2017 |
Notes to Financial Statements (continued)
April 30, 2017
Guarantees and indemnifications
Under the Trust’s organizational documents and, in some cases, by contract, its officers and trustees are indemnified against certain liabilities arising out of the performance of their duties to the Trust or its funds. In addition, certain of the Fund’s contracts with its service providers contain general indemnification clauses. The Fund’s maximum exposure under these arrangements is unknown since the amount of any future claims that may be made against the Fund cannot be determined, and the Fund has no historical basis for predicting the likelihood of any such claims.
Investment company reporting modernization
In October 2016, the U.S. Securities and Exchange Commission adopted new rules and forms, and amendments to certain current rules and forms, to modernize reporting and disclosure of information by registered investment companies. The amendments to Regulation S-X will require standardized, enhanced disclosure about derivatives in investment company financial statements, and will also change the rules governing the form and content of such financial statements. The amendments to Regulation S-X take effect on August 1, 2017. At this time, management is assessing the anticipated impact of these regulatory developments.
Note 3. Fees and other transactions with affiliates
Management services fees
The Fund entered into a Management Agreement with Columbia Management Investment Advisers, LLC (the Investment Manager), a wholly-owned subsidiary of Ameriprise Financial, Inc. (Ameriprise Financial). Under the Management Agreement, the Investment Manager provides the Fund with investment research and advice, as well as administrative and accounting services. The management services fee is an annual fee that is equal to a percentage of the Fund’s average daily net assets that declines from 0.66% to 0.51% as the Fund’s net assets increase. The effective management services fee rate for the year ended April 30, 2017 was 0.66% of the Fund’s average daily net assets.
Subadvisory agreement
The Fund’s Board of Trustees has approved a subadvisory agreement between the Investment Manager and Threadneedle International Limited (Threadneedle), an affiliate of the Investment Manager and an indirect wholly-owned subsidiary of Ameriprise Financial. As of April 30, 2017, Threadneedle is not providing services to the Fund pursuant to the subadvisory agreement.
Compensation of board members
Members of the Board of Trustees, who are not officers or employees of the Investment Manager or Ameriprise Financial, are compensated for their services to the Fund as disclosed in the Statement of Operations. These members of the Board of Trustees may participate in a Deferred Compensation Plan (the Plan) which may be terminated at any time. Obligations of the Plan will be paid solely out of the Fund’s assets, and all amounts payable under the Plan constitute a general unsecured obligation of the Fund.
Compensation of Chief Compliance Officer
The Board of Trustees has appointed a Chief Compliance Officer to the Fund in accordance with federal securities regulations. A portion of the Chief Compliance Officer’s total compensation is allocated to the Fund, along with other affiliated funds governed by the Board of Trustees, based on relative net assets. The total amount allocated to all affiliated funds governed by the Board of Trustees will not exceed $40,000 annually.
Transfer agency fees
Under a Transfer and Dividend Disbursing Agent Agreement, Columbia Management Investment Services Corp. (the Transfer Agent), an affiliate of the Investment Manager and a wholly-owned subsidiary of Ameriprise Financial, is responsible for providing transfer agency services to the Fund. The Transfer Agent has contracted with Boston Financial Data Services (BFDS) to serve as sub-transfer agent. The Transfer Agent pays the fees of BFDS for services as sub-transfer agent and BFDS is not entitled to reimbursement for such fees from the Fund (with the exception of out-of-pocket fees).
Columbia Multi-Asset Income Fund | Annual Report 2017
| 47 |
Notes to Financial Statements (continued)
April 30, 2017
The Fund pays the Transfer Agent a monthly transfer agency fee based on the number or the average value of accounts, depending on the type of account. In addition, prior to October 1, 2016, the Transfer Agent also received sub-transfer agency fees based on a percentage of the average aggregate value of the Fund’s shares maintained in omnibus accounts (other than omnibus accounts for which American Enterprise Investment Services Inc. is the broker of record or accounts where the beneficial shareholder is a customer of Ameriprise Financial Services, Inc., for which the Transfer Agent receives a per account fee). Effective October 1, 2016, the Fund pays the Transfer Agent a fee for shareholder services based on the number of accounts or on a percentage of the average aggregate value of the Fund’s shares maintained in omnibus accounts up to the lesser of the amount charged by the financial intermediary or a cap established by the Board of Trustees from time to time.
The Transfer Agent also receives compensation from the Fund for various shareholder services and reimbursements for certain out-of-pocket fees. Effective January 1, 2017, total transfer agency fees for Class R5 shares are subject to an annual limitation of not more than 0.075% of the average daily net assets attributable to Class R5 shares. Total transfer agency fees for Class I shares were subject to an annual limitation of not more than 0.025% of the average daily net assets attributable to Class I shares. Prior to January 1, 2017, total transfer agency fees for Class R5 shares were subject to an annual limitation of not more than 0.05% of the average daily net assets attributable to Class R5 shares and Class I shares did not pay transfer agency fees. Total transfer agency fees for Class Y shares are subject to an annual limitation of not more than 0.025% of the average daily net assets attributable to Class Y shares.
For the year ended April 30, 2017, the Fund’s effective transfer agency fee rates as a percentage of average daily net assets of each class were as follows:
| | Effective rate (%) |
| Class A | 0.14 |
| Class C | 0.14 |
| Class I | 0.003 (a),(b) |
| Class R4 | 0.14 |
| Class R5 | 0.059 |
| Class T | 0.15 |
| Class Y | 0.011 (a) |
| Class Z | 0.14 |
| (a) | Annualized. |
| (b) | Effective March 27, 2017, Class I shares were redeemed or exchanged for Class Y shares. |
An annual minimum account balance fee of $20 may apply to certain accounts with a value below the applicable share class’s initial minimum investment requirements to reduce the impact of small accounts on transfer agency fees. These minimum account balance fees are remitted to the Fund and recorded as part of expense reductions in the Statement of Operations. For the year ended April 30, 2017, no minimum account balance fees were charged by the Fund.
Distribution and service fees
The Fund has an agreement with Columbia Management Investment Distributors, Inc. (the Distributor), an affiliate of the Investment Manager and a wholly-owned subsidiary of Ameriprise Financial, for distribution and shareholder services. The Board of Trustees has approved, and the Fund has adopted, distribution and shareholder service plans (the Plans) applicable to certain share classes, which set the distribution and service fees for the Fund. These fees are calculated daily and are intended to compensate the Distributor and/or eligible selling and/or servicing agents for selling shares of the Fund and providing services to investors.
Under the Plans, the Fund pays a monthly service fee to the Distributor at the maximum annual rate of 0.25% of the average daily net assets attributable to Class A, Class C and Class T shares of the Fund. Also under the Plans, the Fund pays a monthly distribution fee to the Distributor at the maximum annual rates of 0.75% and 0.25% of the average daily net assets attributable to Class C and Class T shares of the Fund, respectively.
| 48 | Columbia Multi-Asset Income Fund | Annual Report 2017 |
Notes to Financial Statements (continued)
April 30, 2017
Although the Fund may pay a distribution fee up to 0.25% of the Fund’s average daily net assets attributable to Class T shares and a service fee of up to 0.25% of the Fund’s average daily net assets attributable to Class T shares, the aggregate fee shall not exceed 0.25% of the Fund’s average daily net assets attributable to Class T shares.
Sales charges (unaudited)
Sales charges, including front-end charges and CDSCs, received by the Distributor for distributing Fund shares for the year ended April 30, 2017, if any, are listed below:
| | Amount ($) |
| Class A | 3,009 |
| Class C | 500 |
Expenses waived/reimbursed by the Investment Manager and its affiliates
The Investment Manager and certain of its affiliates have contractually agreed to waive fees and/or reimburse expenses (excluding certain fees and expenses described below) for the periods disclosed below, unless sooner terminated at the sole discretion of the Board of Trustees, so that the Fund’s net operating expenses, after giving effect to fees waived/expenses reimbursed and any balance credits and/or overdraft charges from the Fund’s custodian, do not exceed the following annual rates as a percentage of the class’ average daily net assets:
| | September 1, 2016
through
August 31, 2017 | Prior to
September 1, 2016 |
| Class A | 0.990% | 0.99% |
| Class C | 1.740 | 1.74 |
| Class R4 | 0.740 | 0.74 |
| Class R5 | 0.700 | 0.64 |
| Class T | 0.990 | 0.99 |
| Class Y | 0.650* | — |
| Class Z | 0.740 | 0.74 |
*Expense cap rate is contractual from March 1, 2017 (the commencement of operations of Class Y shares) through August 31, 2017.
Under the agreement governing these fee waivers and/or expense reimbursement arrangements, the following fees and expenses are excluded from the waiver/reimbursement commitment, and therefore will be paid by the Fund, if applicable: taxes (including foreign transaction taxes), transaction costs and brokerage commissions, costs related to any securities lending program, dividend and interest expenses associated with securities sold short, inverse floater program fees and expenses, transaction charges and interest on borrowed money, interest, infrequent and/or unusual expenses and any other expenses the exclusion of which is specifically approved by the Board of Trustees. This agreement may be modified or amended only with approval from the Investment Manager, certain of its affiliates and the Fund. In addition to the contractual agreement, the Investment Manager and certain of its affiliates have voluntarily agreed to waive fees and/or reimburse Fund expenses (excluding certain fees and expenses described above) so that Fund level expenses (expenses directly attributable to the Fund and not to a specific share class) are waived proportionately across all share classes, but the Fund’s net operating expenses shall not exceed the contractual annual rates listed in the table above. This arrangement may be revised or discontinued at any time. Any fees waived and/or expenses reimbursed under the expense reimbursement arrangements described above are not recoverable by the Investment Manager or its affiliates in future periods.
Note 4. Federal tax information
The timing and character of income and capital gain distributions are determined in accordance with income tax regulations, which may differ from GAAP because of temporary or permanent book to tax differences.
At April 30, 2017, these differences are primarily due to differing treatment for deferral/reversal of wash sale losses, re-characterization of distributions for investments, derivative investments, post-October capital losses, capital loss carryforwards, trustees’ deferred compensation, principal and/or interest from fixed income securities, foreign currency
Columbia Multi-Asset Income Fund | Annual Report 2017
| 49 |
Notes to Financial Statements (continued)
April 30, 2017
transactions and investments in partnerships. To the extent these differences are permanent, reclassifications are made among the components of the Fund’s net assets in the Statement of Assets and Liabilities. Temporary differences do not require reclassifications.
In the Statement of Assets and Liabilities the following reclassifications were made:
Undistributed net
investment
income ($) | Accumulated
net realized
(loss) ($) | Paid in
capital ($) |
| 6,234 | (16,827) | 10,593 |
Net investment income (loss) and net realized gains (losses), as disclosed in the Statement of Operations, and net assets were not affected by this reclassification.
The tax character of distributions paid during the years indicated was as follows:
| April 30, 2017 | April 30, 2016 |
Ordinary
income ($) | Long-term
capital gains ($) | Total ($) | Ordinary
income (S) | Long-term
capital gains ($) | Total ($) |
| 6,124,477 | — | 6,124,477 | 5,411,073 | — | 5,411,073 |
Short-term capital gain distributions, if any, are considered ordinary income distributions for tax purposes.
At April 30, 2017, the components of distributable earnings on a tax basis were as follows:
Undistributed
ordinary income ($) | Undistributed
long-term
capital gains ($) | Capital loss
carryforwards ($) | Net unrealized
appreciation ($) |
| 615,373 | — | (3,308,467) | 1,581,394 |
At April 30, 2017, the cost of investments for federal income tax purposes along with the aggregate gross unrealized appreciation and depreciation based on that cost was:
Federal
tax cost ($) | Gross unrealized
appreciation ($) | Gross unrealized
(depreciation) ($) | Net unrealized
appreciation ($) |
| 128,153,265 | 4,058,601 | (2,477,207) | 1,581,394 |
The following capital loss carryforwards, determined at April 30, 2017, may be available to reduce taxable income arising from future net realized gains on investments, if any, to the extent permitted by the Internal Revenue Code. Capital loss carryforwards with no expiration are required to be utilized prior to any capital losses which carry an expiration date. As a result of this ordering rule, capital loss carryforwards which carry an expiration date may be more likely to expire unused. In addition, for the year ended April 30, 2017, capital loss carryforwards utilized, expired unused and permanently lost were as follows:
| 2018 ($) | 2019 ($) | No expiration
short-term ($) | No expiration
long-term ($) | Total ($) | Utilized ($) | Expired ($) | Permanently
lost ($) |
| — | — | 3,308,467 | — | 3,308,467 | 320,224 | — | — |
Under current tax rules, regulated investment companies can elect to treat certain late-year ordinary losses incurred and post-October capital losses (capital losses realized after October 31) as arising on the first day of the following taxable year. As of April 30, 2017, the Fund elected to treat the following late-year ordinary losses and post-October capital losses as arising on May 1, 2017.
Late year
ordinary losses ($) | Post-October
capital losses ($) |
| — | 214,952 |
| 50 | Columbia Multi-Asset Income Fund | Annual Report 2017 |
Notes to Financial Statements (continued)
April 30, 2017
Management of the Fund has concluded that there are no significant uncertain tax positions in the Fund that would require recognition in the financial statements. However, management’s conclusion may be subject to review and adjustment at a later date based on factors including, but not limited to, new tax laws, regulations, and administrative interpretations (including relevant court decisions). Generally, the Fund’s federal tax returns for the prior three fiscal years remain subject to examination by the Internal Revenue Service.
Note 5. Portfolio information
The cost of purchases and proceeds from sales of securities, excluding short-term investments and derivatives, if any, aggregated to $107,224,535 and $76,374,837, respectively, for the year ended April 30, 2017, of which $1,279,107 and $862,534, respectively, were U.S. government securities. The amount of purchase and sale activity impacts the portfolio turnover rate reported in the Financial Highlights.
Note 6. Affiliated money market fund
The Fund invests in Columbia Short-Term Cash Fund, an affiliated money market fund established for the exclusive use by the Fund and other affiliated funds (the Affiliated MMF). The income earned by the Fund from such investments is included as Dividends - affiliated issuers in the Statement of Operations. As an investing fund, the Fund indirectly bears its proportionate share of the expenses of the Affiliated MMF. Effective October 1, 2016, the Affiliated MMF prices its shares with a floating net asset value (NAV) and no longer seeks to maintain a stable NAV. In addition, the Board of Trustees of the Affiliated MMF may impose a fee on redemptions (sometimes referred to as a liquidity fee) or temporarily suspend redemptions (sometimes referred to as imposing a redemption gate) in the event its liquidity falls below regulatory limits.
Note 7. Line of credit
The Fund has access to a revolving credit facility with a syndicate of banks led by Citibank, N.A., HSBC Bank USA, N.A. and JPMorgan Chase Bank, N.A. whereby the Fund may borrow for the temporary funding of shareholder redemptions or for other temporary or emergency purposes. The credit facility agreement, which is a collective agreement between the Fund and certain other funds managed by the Investment Manager, severally and not jointly, permits collective borrowings up to $1 billion. Interest is charged to each participating fund based on its borrowings at a rate equal to the higher of (i) the overnight federal funds rate plus 1.00% or (ii) the one-month LIBOR rate plus 1.00%. Each borrowing under the credit facility matures no later than 60 days after the date of borrowing. The Fund also pays a commitment fee equal to its pro rata share of the amount of the credit facility at a rate of 0.15% per annum. The commitment fee is included in other expenses in the Statement of Operations.
The Fund had no borrowings during the year ended April 30, 2017.
Note 8. Significant risks
Credit risk
Credit risk is the risk that the value of debt securities in the Fund’s portfolio may decline because the issuer may default and fail to pay interest or repay principal when due. Rating agencies assign credit ratings to debt securities to indicate their credit risk. Lower rated or unrated debt securities held by the Fund may present increased credit risk as compared to higher-rated debt securities.
Foreign securities and emerging market countries risk
Investing in foreign securities may include certain risks and considerations not typically associated with investing in U.S. securities, such as fluctuating currency values and changing local and regional economic, political and social conditions, which may result in greater market volatility. In addition, certain foreign securities may not be as liquid as U.S. securities. Investing in emerging markets may accentuate these risks. These countries are also more likely to experience high levels of inflation, deflation or currency devaluation which could hurt their economies and securities markets. To the extent that the Fund concentrates its investment exposure to any one or a few specific countries, the Fund will be particularly susceptible to the various conditions, events or other factors impacting those countries and may, therefore, have a greater risk than that of a fund which is more geographically diversified.
Columbia Multi-Asset Income Fund | Annual Report 2017
| 51 |
Notes to Financial Statements (continued)
April 30, 2017
Interest rate risk
Interest rate risk is the risk of losses attributable to changes in interest rates. In general, if prevailing interest rates rise, the values of debt securities tend to fall, and if interest rates fall, the values of debt securities tend to rise. Actions by governments and central banking authorities can result in increases in interest rates. Increasing interest rates may negatively affect the value of debt securities held by the Fund, resulting in a negative impact on the Fund’s performance and net asset value per share. In general, the longer the maturity or duration of a debt security, the greater its sensitivity to changes in interest rates.
Liquidity risk
Liquidity risk is the risk associated with a lack of marketability of investments which may make it difficult to sell the investment at a desirable time or price. Changing regulatory, market or other conditions or environments (for example, the interest rate or credit environments) may adversely affect the liquidity of the Fund’s investments. The Fund may have to accept a lower selling price for the holding, sell other investments, or forego another, more appealing investment opportunity. Generally, the less liquid the market at the time the Fund sells a portfolio investment, the greater the risk of loss or decline of value to the Fund. A less liquid market can lead to an increase in Fund redemptions, which may negatively impact Fund performance and net asset value per share, including, for example, if the Fund is forced to sell securities in a down market.
Shareholder concentration risk
At April 30, 2017, affiliated shareholders of record owned 98.0% of the outstanding shares of the Fund in one or more accounts. Subscription and redemption activity by concentrated accounts may have a significant effect on the operations of the Fund. In the case of a large redemption, the Fund may be forced to sell investments at inopportune times, including its liquid or more liquid positions, resulting in Fund losses and the Fund holding a higher percentage of less liquid or illiquid securities. Large redemptions could result in decreased economies of scale and increased operating expenses for non-redeeming Fund shareholders.
Note 9. Subsequent events
Management has evaluated the events and transactions that have occurred through the date the financial statements were issued and noted no items requiring adjustment of the financial statements or additional disclosure.
Note 10. Information regarding pending and settled legal proceedings
Ameriprise Financial and certain of its affiliates have historically been involved in a number of legal, arbitration and regulatory proceedings, including routine litigation, class actions, and governmental actions, concerning matters arising in connection with the conduct of their business activities. Ameriprise Financial believes that the Funds are not currently the subject of, and that neither Ameriprise Financial nor any of its affiliates are the subject of, any pending legal, arbitration or regulatory proceedings that are likely to have a material adverse effect on the Funds or the ability of Ameriprise Financial or its affiliates to perform under their contracts with the Funds. Ameriprise Financial is required to make quarterly (10-Q), annual (10-K) and, as necessary, 8-K filings with the Securities and Exchange Commission (SEC) on legal and regulatory matters that relate to Ameriprise Financial and its affiliates. Copies of these filings may be obtained by accessing the SEC website at www.sec.gov.
There can be no assurance that these matters, or the adverse publicity associated with them, will not result in increased fund redemptions, reduced sale of fund shares or other adverse consequences to the Funds. Further, although we believe proceedings are not likely to have a material adverse effect on the Funds or the ability of Ameriprise Financial or its affiliates to perform under their contracts with the Funds, these proceedings are subject to uncertainties and, as such, we are unable to estimate the possible loss or range of loss that may result. An adverse outcome in one or more of these proceedings could result in adverse judgments, settlements, fines, penalties or other relief that could have a material adverse effect on the consolidated financial condition or results of operations of Ameriprise Financial.
| 52 | Columbia Multi-Asset Income Fund | Annual Report 2017 |
Report of Independent Registered Public Accounting Firm
To the Trustees of Columbia Funds Series Trust I and the Shareholders of Columbia Multi-Asset Income Fund
In our opinion, the accompanying statement of assets and liabilities, including the portfolio of investments, and the related statements of operations and of changes in net assets and the financial highlights present fairly, in all material respects, the financial position of Columbia Multi-Asset Income Fund (the “Fund”, a series of Columbia Funds Series Trust I) as of April 30, 2017, the results of its operations for the year then ended, the changes in its net assets for each of the two years in the period then ended and the financial highlights for each of the three years in the period then ended, in conformity with accounting principles generally accepted in the United States of America. These financial statements and financial highlights (hereafter referred to as “financial statements”) are the responsibility of the Fund’s management. Our responsibility is to express an opinion on these financial statements based on our audits. We conducted our audits of these financial statements in accordance with the standards of the Public Company Accounting Oversight Board (United States). Those standards require that we plan and perform the audit to obtain reasonable assurance about whether the financial statements are free of material misstatement. An audit includes examining, on a test basis, evidence supporting the amounts and disclosures in the financial statements, assessing the accounting principles used and significant estimates made by management, and evaluating the overall financial statement presentation. We believe that our audits, which included confirmation of securities as of April 30, 2017 by correspondence with the custodian, brokers, agent banks and transfer agent, provide a reasonable basis for our opinion.
PricewaterhouseCoopers LLP
Minneapolis, MN
June 21, 2017
Columbia Multi-Asset Income Fund | Annual Report 2017
| 53 |
Federal Income Tax Information
(Unaudited)
The Fund hereby designates the following tax attributes for the fiscal year ended April 30, 2017. Shareholders will be notified in early 2018 of the amounts for use in preparing 2017 income tax returns.
Qualified
dividend
income | Dividends
received
deduction |
| 3.81% | 2.97% |
Qualified dividend income. For taxable, non-corporate shareholders, the percentage of ordinary income distributed during the fiscal year that represents qualified dividend income subject to reduced tax rates.
Dividends received deduction. The percentage of ordinary income distributed during the fiscal year that qualifies for the corporate dividends received deduction.
| 54 | Columbia Multi-Asset Income Fund | Annual Report 2017 |
Shareholders elect the Board that oversees the Fund’s operations. The Board appoints officers who are responsible for day-to-day business decisions based on policies set by the Board. The following table provides basic biographical information about the Fund’s Trustees, including their principal occupations during the past five years, although specific titles for individuals may have varied over the period. The year set forth beneath Length of Service in the table below is the year in which the Trustee was first appointed or elected as Trustee to any Fund currently in the Columbia Funds Complex or a predecessor thereof. Under current Board policy, members serve terms of indefinite duration.
Independent trustees
| Name, address, year of birth | Position held with the Trust and length of service | Principal occupation(s) during the past five years and other relevant professional experience | Number of Funds in the Columbia Fund Complex overseen | Other directorships held by Trustee during the past five years |
Janet Langford Carrig
c/o Columbia Management
Investment Advisers, LLC
225 Franklin Street
Mail Drop BX32 05228
Boston, MA 02110
1957 | Trustee
1996 | Senior Vice President, General Counsel and Corporate Secretary, ConocoPhillips (independent energy company) since September 2007 | 57 | None |
Douglas A. Hacker
c/o Columbia Management
Investment Advisers, LLC
225 Franklin Street
Mail Drop BX32 05228
Boston, MA 02110
1955 | Trustee and Chairman of the Board
1996 | Independent business executive since May 2006; Executive Vice President — Strategy of United Airlines from December 2002 to May 2006; President of UAL Loyalty Services (airline marketing company) from September 2001 to December 2002; Executive Vice President and Chief Financial Officer of United Airlines from July 1999 to September 2001 | 57 | Spartan Nash Company, (food distributor); Nash Finch Company (food distributor) from 2005 to 2013; Aircastle Limited (aircraft leasing); SeaCube Container Leasing Ltd. (container leasing) from 2010 to 2013; and Travelport Worldwide Limited (travel information technology) |
Nancy T. Lukitsh
c/o Columbia Management
Investment Advisers, LLC
225 Franklin Street
Mail Drop BX32 05228
Boston, MA 02110
1956 | Trustee
2011 | Senior Vice President, Partner and Director of Marketing, Wellington Management Company, LLP (investment adviser) from 1997 to 2010; Chair, Wellington Management Portfolios (commingled non-U.S. investment pools) from 2007 to 2010; Director, Wellington Trust Company, NA and other Wellington affiliates from 1997 to 2010 | 57 | None |
David M. Moffett
c/o Columbia Management
Investment Advisers, LLC
225 Franklin Street
Mail Drop BX32 05228
Boston, MA 02110
1952 | Trustee
2011 | Retired. Consultant to Bridgewater and Associates | 57 | Director, CSX Corporation; Genworth Financial, Inc. (financial and insurance products and services); Paypal Holdings Inc. (payment and data processing services); Trustee, University of Oklahoma Foundation; former Director, eBay Inc. (online trading community), 2007-2015; and former Director, CIT Bank, CIT Group Inc. (commercial and consumer finance), 2010-2016 |
Columbia Multi-Asset Income Fund | Annual Report 2017
| 55 |
TRUSTEES AND OFFICERS (continued)
Independent trustees (continued)
| Name, address, year of birth | Position held with the Trust and length of service | Principal occupation(s) during the past five years and other relevant professional experience | Number of Funds in the Columbia Fund Complex overseen | Other directorships held by Trustee during the past five years |
Charles R. Nelson
c/o Columbia Management
Investment Advisers, LLC
225 Franklin Street
Mail Drop BX32 05228
Boston, MA 02110
1942 | Trustee
1981 | Retired. Professor Emeritus, University of Washington since 2011; Professor of Economics, University of Washington from 1976 to 2011; Ford and Louisa Van Voorhis Professor of Political Economy, University of Washington from 1993 to 2011; Adjunct Professor of Statistics, University of Washington from 1980 to 2011; Associate Editor, Journal of Money, Credit and Banking from September 1993 to 2008; consultant on econometric and statistical matters | 57 | None |
John J. Neuhauser
c/o Columbia Management
Investment Advisers, LLC
225 Franklin Street
Mail Drop BX32 05228
Boston, MA 02110
1943 | Trustee
1984 | President, Saint Michael’s College since August 2007; Director or Trustee of several non-profit organizations, including University of Vermont Medical Center; Academic Vice President and Dean of Faculties, Boston College from August 1999 to October 2005; University Professor, Boston College from November 2005 to August 2007 | 57 | Liberty All-Star Equity Fund and Liberty All- Star Growth Fund (closed-end funds) |
Patrick J. Simpson
c/o Columbia Management
Investment Advisers, LLC
225 Franklin Street
Mail Drop BX32 05228
Boston, MA 02110
1944 | Trustee
2000 | Of Counsel, Perkins Coie LLP (law firm) since 2015; Partner, Perkins Coie LLP from 1988 to 2014 | 57 | None |
Anne-Lee Verville
c/o Columbia Management
Investment Advisers, LLC
225 Franklin Street
Mail Drop BX32 05228
Boston, MA 02110
1945 | Trustee
1998 | Retired. General Manager, Global Education Industry from 1994 to 1997, President – Application Systems Division from 1991 to 1994, Chief Financial Officer – US Marketing & Services from 1988 to 1991, and Chief Information Officer from 1987 to 1988, IBM Corporation (computer and technology) | 57 | Enesco Group, Inc. (producer of giftware and home and garden decor products) from 2001 to 2006 |
| 56 | Columbia Multi-Asset Income Fund | Annual Report 2017 |
TRUSTEES AND OFFICERS (continued)
Consultants to the Independent Trustees*
| Name, address, year of birth | Position held with the Trust and length of service | Principal occupation(s) during the past five years and other relevant professional experience | Number of Funds in the Columbia Funds complex overseen | Other directorships held by Trustee during the past five years |
J. Kevin Connaughton
c/o Columbia
Management Investment
Advisers, LLC,
225 Franklin Street
Mail Drop BX32 05228,
Boston, MA 02110
1964 | Independent Trustee Consultant
2016 | Independent Trustee Consultant, Columbia Funds since March 2016; Managing Director and General Manager of Mutual Fund Products, Columbia Management Investment Advisers, LLC from May 2010 to February 2015; President, Columbia Funds from 2009 to 2015; and senior officer of Columbia Funds and affiliated funds from 2003 to 2015 | 57 | Board of Governors, Gateway Healthcare since January 2016; Trustee, New Century Portfolios since March 2015; and Director, The Autism Project since March 2015 |
Natalie A. Trunow
c/o Columbia
Management Investment
Advisers, LLC,
225 Franklin Street
Mail Drop BX32 05228,
Boston, MA 02110
1967 | Independent Trustee Consultant
2016 | Independent Trustee Consultant, Columbia Funds since September 2016; Chief Executive Officer, Millennial Partners (investment consulting services to institutions) since January 2016; Director of Investments, Casey Family Programs from April 2016 to September 2016; Senior Vice President and Chief Investment Officer, Calvert Investments from August 2008 to January 2016; Section Head and Portfolio Manager, General Motors Asset Management from June 1997 to August 2008 | 57 | Healthcare Services for Children with Special Needs |
| * | J. Kevin Connaughton was appointed consultant to the Independent Trustees effective March 1, 2016. Natalie A. Trunow was appointed consultant to the Independent Trustees effective September 1, 2016. Shareholders of the Funds are expected to be asked to elect each of Mr. Connaughton and Ms. Trunow as a Trustee at a future shareholder meeting. |
Interested trustee affiliated with Investment Manager*
| Name, address, year of birth | Position held with the Trust and length of service | Principal occupation(s) during the past five years and other relevant professional experience | Number of Funds in the Columbia Funds Complex overseen | Other directorships held by Trustee during the past five years |
William F. Truscott
c/o Columbia Management
Investment Advisers, LLC
225 Franklin Street
Boston, MA 02110
1960 | Trustee
2012 | Chairman of the Board and President, Columbia Management Investment Advisers, LLC since May 2010 and February 2012, respectively; Chief Executive Officer, Global Asset Management, Ameriprise Financial, Inc. since September 2012 (previously Chief Executive Officer, U.S. Asset Management & President, Annuities, May 2010-September 2012); Director and Chief Executive Officer, Columbia Management Investment Distributors, Inc. since May 2010 and February 2012, respectively;Chairman of the Board and Chief Executive Officer, RiverSource Distributors, Inc. since 2006; Director, Threadneedle Asset Management Holdings, SARL since 2014; President and Chief Executive Officer, Ameriprise Certificate Company, 2006-August 2012 | 183 | Chairman of the Board, Columbia Management Investment Advisers, LLC since May 2010; Director, Columbia Management Investment Distributors, Inc. since May 2010; former Director, Ameriprise Certificate Company, 2006 - January 2013 |
| * | Interested person (as defined under the 1940 Act) by reason of being an officer, director, security holder and/or employee of the Investment Manager or Ameriprise Financial. |
The Statement of Additional Information has additional information about the Fund’s Board members and is available,
without charge, upon request by calling 800.345.6611; contacting your financial intermediary; or visiting
investor.columbiathreadneedleus.com.
Columbia Multi-Asset Income Fund | Annual Report 2017
| 57 |
TRUSTEES AND OFFICERS (continued)
The Board has appointed officers who are responsible for day-to-day business decisions based on policies it has established. The officers serve at the pleasure of the Board. The following table provides basic information about the Officers of the Fund, including principal occupations during the past five years, although their specific titles may have varied over the period. In addition to Mr. Truscott, who is Senior Vice President, the Fund’s other officers are:
Fund officers
Name,
address and
year of birth | Position and year
first appointed to
position for any Fund
in the Columbia
Funds complex or a
predecessor thereof | Principal occupation(s) during past five years |
Christopher O. Petersen
5228 Ameriprise
Financial Center
Minneapolis, MN 55474
Born 1970 | President and Principal Executive Officer (2015) | Vice President and Lead Chief Counsel, Ameriprise Financial, Inc. since January 2015 (previously, Vice President and Chief Counsel, January 2010 - December 2014; officer of Columbia Funds and affiliated funds since 2007. |
Michael G. Clarke
225 Franklin Street
Boston, MA 02110
Born 1969 | Treasurer (2011), Chief Financial Officer (2009) and Chief Accounting Officer (2015) | Vice President — Mutual Fund Administration, Columbia Management Investment Advisers, LLC, since May 2010; senior officer of Columbia Funds and affiliated funds since 2002. |
Paul B. Goucher
100 Park Avenue
New York, NY 10017
Born 1968 | Senior Vice President (2011) and Assistant Secretary (2008) | Senior Vice President and Assistant General Counsel, Ameriprise Financial, Inc. since January 2017 (previously Vice President and Lead Chief Counsel, November 2008 - January 2017 and January 2013 - January 2017, respectively; and Chief Counsel, January 2010 - January 2013); Vice President, Chief Legal Officer and Assistant Secretary, Columbia Management Investment Advisers, LLC since May 2010. |
Thomas P. McGuire
225 Franklin Street
Boston, MA 02110
Born 1972 | Senior Vice President and Chief Compliance Officer (2012) | Vice President — Asset Management Compliance, Ameriprise Financial, Inc., since May 2010; Chief Compliance Officer, Ameriprise Certificate Company since September 2010. |
Colin Moore
225 Franklin Street
Boston, MA 02110
Born 1958 | Senior Vice President (2010) | Executive Vice President and Global Chief Investment Officer, Ameriprise Financial, Inc., since July 2013; Executive Vice President and Global Chief Investment Officer, Columbia Management Investment Advisers, LLC since July 2013 (previously Director and Global Chief Investment Officer, 2010 - 2013). |
Michael E. DeFao
225 Franklin Street
Boston, MA 02110
Born 1968 | Vice President (2011) and Assistant Secretary (2010) | Vice President and Chief Counsel, Ameriprise Financial, Inc. since May 2010. |
Amy Johnson
5228 Ameriprise
Financial Center
Minneapolis, MN 55474
Born 1965 | Vice President (2006) | Managing Director and Global Head of Operations, Columbia Management Investment Advisers, LLC since April 2016 (previously Managing Director and Chief Operating Officer, 2010 - 2016). |
Lyn Kephart-Strong
5228 Ameriprise
Financial Center
Minneapolis, MN 55474
Born 1960 | Vice President (2015) | President, Columbia Management Investment Services Corp. since October 2014; Vice President & Resolution Officer, Ameriprise Trust Company since August 2009. |
Ryan C. Larrenaga
225 Franklin Street
Boston, MA 02110
Born 1970 | Senior Vice President (2017), Chief Legal Officer (2017) and Secretary (2015) | Vice President and Group Counsel, Ameriprise Financial, Inc. since August 2011; officer of Columbia Funds and affiliated funds since 2005. |
| 58 | Columbia Multi-Asset Income Fund | Annual Report 2017 |
The Fund mails one shareholder report to each shareholder address. If you would like more than one report, please call shareholder services at 800.345.6611 and additional reports will be sent to you.
Proxy voting policies and procedures
The policy of the Board of Trustees is to vote the proxies of the companies in which the Fund holds investments consistent with the procedures as stated in the Statement of Additional Information (SAI). You may obtain a copy of the SAI without charge by calling 800.345.6611; contacting your financial intermediary; visiting investor.columbiathreadneedleus.com; or searching the website of the Securities and Exchange Commission (SEC) at sec.gov. Information regarding how the Fund voted proxies relating to portfolio securities is filed with the SEC by August 31st for the most recent 12-month period ending June 30th of that year, and is available without charge by visiting investor.columbiathreadneedleus.com, or searching the website of the SEC at sec.gov.
Quarterly schedule of investments
The Fund files a complete schedule of portfolio holdings with the SEC for the first and third quarters of each fiscal year on Form N-Q. The Fund’s Form N-Q is available on the SEC’s website at sec.gov and may be reviewed and copied at the SEC’s Public Reference Room in Washington, D.C. Information on the operation of the Public Reference Room may be obtained by calling 800.SEC.0330. The Fund’s complete schedule of portfolio holdings, as filed on Form N-Q, can also be obtained without charge, upon request, by calling 800.345.6611.
Additional Fund information
For more information about the Fund, please visit investor.columbiathreadneedleus.com or call 800.345.6611. Customer Service Representatives are available to answer your questions Monday through Friday from 8 a.m. to 7 p.m. Eastern time.
Fund investment manager
Columbia Management Investment Advisers, LLC
225 Franklin Street
Boston, MA 02110
Fund distributor
Columbia Management Investment Distributors, Inc.
225 Franklin Street
Boston, MA 02110
Fund transfer agent
Columbia Management Investment Services Corp.
P.O. Box 8081
Boston, MA 02266-8081
Columbia Multi-Asset Income Fund | Annual Report 2017
| 59 |
[THIS PAGE INTENTIONALLY LEFT BLANK]
[THIS PAGE INTENTIONALLY LEFT BLANK]
Columbia Multi-Asset Income Fund
P.O. Box 8081
Boston, MA 02266-8081
Please read and consider the investment objectives, risks, charges and expenses for any fund carefully before investing. For a prospectus and summary prospectus, which contains this and other important information about the Fund, go to
investor.columbiathreadneedleus.com. The Fund is distributed by Columbia Management Investment Distributors, Inc., member FINRA, and managed by Columbia Management Investment Advisers, LLC.
Columbia Threadneedle Investments (Columbia Threadneedle) is the global brand name of the Columbia and Threadneedle group of companies. All rights reserved. Columbia Management Investment Distributors, Inc., 225 Franklin Street, Boston, MA 02110-2804
© 2017 Columbia Management Investment Advisers, LLC.
investor.columbiathreadneedleus.com

Annual Report
April 30, 2017
Columbia Total Return Bond Fund
Not FDIC Insured • No bank guarantee • May lose value
Dear Shareholders,
While emotions have run high following the outcome of the U.S. Presidential election, it remains unclear how the Trump presidency will unfold in terms of policy. We have a sense of the priorities espoused by the President over the past eighteen months, but campaign priorities are not always realized and are often never pursued. What seems certain is that, while some investors have already priced expectations into the market, others have retreated, preferring instead a wait and see approach. The outcome of such behaviors appears to have created conditions ripe for ongoing market volatility.
While volatility in the financial markets can be stressful, volatility itself is not a new phenomenon. Other factors that have been at the root cause of recent volatility include uncertainty following the United Kingdom’s vote to exit the European Union (Brexit), speculation around the Federal Reserve’s decision to increase interest rates, divergent central bank policy and geopolitical unrest. The point is, financial markets have fluctuated for years and may be expected to continue to fluctuate — sometimes wildly. If anything, such volatility seems to be the new normal, perhaps exacerbated by access to information and development of technological tools which have enabled investors to react rapidly to real and perceived change. So what can you do?
Position your portfolio for the reality of market volatility
That there is a historical precedent for market volatility, or even an acceptance that it may persist, offers little comfort. A measured and strategic approach remains the best strategy for investors to stay on track in achieving their investment goals.
Step 1: Review your investment goals
Take this opportunity to review your investment goals and the strategies you are pursuing to achieve those goals in order to remain focused on what’s important to you. It is entirely possible that your goals have changed in response either to your life situation or to changes in the market. Accept what you can’t control — volatility, and focus on what you can — your investment goals and strategies.
Step 2: Reassess your risk tolerance
Sit down with your financial advisor to discuss your investment goals and strategies, as well as any changes to your tolerance for risk. Consider your investment horizon. Increased market volatility and a new investment horizon may impact the strategies that can best help you achieve your investment goals. Remember, achieving your investment goals may require a certain amount of risk. Ultimately, you must maintain vigilance in reassessing your risk tolerance and the strategies you have selected in pursuit of your investment goals, and awareness of how those strategies may react to market volatility.
Step 3: Remain calm and focus on your long-term plan
Remember, investing is about the long game. Short term events are not necessarily evidence of a longer term reality. Investors who attempt to time the market too often end up reacting to a down turn by selling low and then compounding the problem by waiting on the sidelines, ultimately missing the right opportunity to reinvest.
Columbia Total Return Bond Fund | Annual Report 2017
President’s Message (continued)
As long as there is a market, there will be volatility. How you respond to that volatility can make a big difference in the measure of your success as an investor. Talk to your financial advisor about how working with Columbia Threadneedle Investments may help you position your portfolio for the reality of ongoing volatility and, perhaps, even turn such volatility into investment opportunity.
Sincerely,
Christopher O. Petersen
President, Columbia Funds
Investors should consider the investment objectives, risks, charges and expenses of a mutual fund carefully before investing. For a free prospectus and summary prospectus, which contains this and other important information about a fund, visit investor.columbiathreadneedleus.com. The prospectus should be read carefully before investing.
Columbia Funds are distributed by Columbia Management Investment Distributors, Inc., member FINRA, and managed by Columbia Management Investment Advisers, LLC.
© 2017 Columbia Management Investment Advisers, LLC. All rights reserved.
Columbia Total Return Bond Fund | Annual Report 2017
Columbia Total Return Bond Fund | Annual Report 2017
Investment objective
Columbia Total Return Bond Fund (the Fund) seeks total return, consisting of current income and capital appreciation.
Portfolio management
Carl Pappo, CFA
Lead manager
Managed Fund since 2005
Brian Lavin, CFA
Co-manager
Managed Fund since 2010
Jason Callan
Co-manager
Managed Fund since January 2016
| Average annual total returns (%) (for the period ended April 30, 2017) |
| | | Inception | 1 Year | 5 Years | 10 Years |
| Class A | Excluding sales charges | 07/31/00 | 2.37 | 2.66 | 4.36 |
| | Including sales charges | | -0.65 | 2.04 | 4.05 |
| Class B | Excluding sales charges | 02/01/02 | 1.72 | 1.90 | 3.58 |
| | Including sales charges | | -1.23 | 1.90 | 3.58 |
| Class C | Excluding sales charges | 02/01/02 | 1.61 | 1.98 | 3.70 |
| | Including sales charges | | 0.63 | 1.98 | 3.70 |
| Class K * | 02/28/13 | 2.42 | 2.73 | 4.41 |
| Class R | 01/23/06 | 2.12 | 2.41 | 4.10 |
| Class R4 * | 11/08/12 | 2.63 | 2.89 | 4.61 |
| Class R5 * | 11/08/12 | 2.79 | 2.98 | 4.65 |
| Class T * | Excluding sales charges | 09/27/10 | 2.15 | 2.63 | 4.37 |
| | Including sales charges | | -0.45 | 2.12 | 4.10 |
| Class Y * | 11/08/12 | 2.74 | 3.02 | 4.67 |
| Class Z | 12/05/78 | 2.63 | 2.92 | 4.62 |
| Bloomberg Barclays U.S. Aggregate Bond Index | | 0.83 | 2.27 | 4.30 |
Returns for Class A are shown with and without the maximum initial sales charge of 3.00%. Returns for Class B are shown with and without the applicable contingent deferred sales charge (CDSC) of 3.00% in the first year, declining to 1.00% in the fourth year and eliminated thereafter. The Fund does not accept new investments in Class B shares, except for certain limited transactions. The Fund’s current Class B investors, having held their shares for the requisite time period, are no longer subject to a CDSC upon redemption of their shares. Returns for Class C are shown with and without the applicable contingent deferred sales charge (CDSC) of 1.00% in the first year only. The returns for Class T shares are shown with and without the maximum initial sales charge of 2.50% per transaction. Prior to March 27, 2017, Class T shares were known as Class W shares and were sold without a sales charge. The Fund’s other classes are not subject to sales charges and have limited eligibility. Please see the Fund’s prospectus for details. Performance for different share classes will vary based on differences in sales charges and fees associated with each class. All results shown assume reinvestment of distributions during the period. Returns do not reflect the deduction of taxes that a shareholder may pay on Fund distributions or on the redemption of Fund shares. Performance results reflect the effect of any fee waivers or reimbursements of Fund expenses by Columbia Management Investment Advisers, LLC and/or any of its affiliates. Absent these fee waivers or expense reimbursement arrangements, performance results would have been lower.
The performance information shown represents past performance and is not a guarantee of future results. The investment return and principal value of your investment will fluctuate so that your shares, when redeemed, may be worth more or less than their original cost. Current performance may be lower or higher than the performance information shown. You may obtain performance information current to the most recent month-end by contacting your financial intermediary, visiting investor.columbiathreadneedleus.com or calling 800.345.6611.
| * | The returns shown for periods prior to the share class inception date (including returns for the Life of the Fund, if shown, which are since Fund inception) include the returns of the Fund’s oldest share class. These returns are adjusted to reflect any higher class-related operating expenses of the newer share classes, as applicable. Please visit investor.columbiathreadneedleus.com/investment-products/mutual-funds/appended-performance for more information. |
The Bloomberg Barclays U.S. Aggregate Bond Index, is a broad-based benchmark that measures the investment grade, U.S. dollar denominated, fixed-rate taxable bond market, including Treasuries, government-related and corporate securities, mortgage-backed securities (agency fixed-rate and hybrid adjustable-rate mortgage passthroughs), asset-backed securities, and commercial mortgage-backed securities.
Indices are not available for investment, are not professionally managed and do not reflect sales charges, fees, brokerage commissions, taxes or other expenses of investing. Securities in the Fund may not match those in an index.
Columbia Total Return Bond Fund | Annual Report 2017
| 3 |
Fund at a Glance (continued)
Performance of a hypothetical $10,000 investment (April 30, 2007 — April 30, 2017)
The chart above shows the change in value of a hypothetical $10,000 investment in Class A shares of Columbia Total Return Bond Fund during the stated time period, and does not reflect the deduction of taxes that a shareholder may pay on Fund distributions or on the redemption of Fund shares.
| Portfolio breakdown (%) (at April 30, 2017) |
| Asset-Backed Securities — Agency | 2.5 |
| Asset-Backed Securities — Non-Agency | 16.6 |
| Commercial Mortgage-Backed Securities - Agency | 0.8 |
| Commercial Mortgage-Backed Securities - Non-Agency | 2.5 |
| Common Stocks | 0.0 (a) |
| Convertible Preferred Stocks | 0.2 |
| Corporate Bonds & Notes | 28.1 |
| Foreign Government Obligations | 1.0 |
| Money Market Funds | 0.2 |
| Municipal Bonds | 1.6 |
| Preferred Debt | 1.1 |
| Residential Mortgage-Backed Securities - Agency | 23.2 |
| Residential Mortgage-Backed Securities - Non-Agency | 4.3 |
| Senior Loans | 0.1 |
| U.S. Government & Agency Obligations | 1.0 |
| U.S. Treasury Obligations | 16.8 |
| Total | 100.0 |
Percentages indicated are based upon total investments. The Fund’s portfolio composition is subject to change.
| Quality breakdown (%) (at April 30, 2017) |
| AAA rating | 62.2 |
| AA rating | 1.8 |
| A rating | 6.0 |
| BBB rating | 18.9 |
| BB rating | 3.7 |
| B rating | 2.5 |
| CCC rating | 0.6 |
| CC rating | 0.2 |
| Not rated | 4.1 |
| Total | 100.0 |
Percentages indicated are based upon total fixed income investments (excluding Money Market Funds).
Bond ratings apply to the underlying holdings of the Fund and not the Fund itself and are divided into categories ranging from highest to lowest credit quality, determined by using the middle rating of Moody’s, S&P and Fitch, after dropping the highest and lowest available ratings. When ratings are available from only two rating agencies, the lower rating is used. When a rating is available from only one rating agency, that rating is used. When a bond is not rated by any rating agency, it is designated as “Not rated.” Credit quality ratings assigned by a rating agency are subjective opinions, not statements of fact, and are subject to change, including daily. The ratings assigned by credit rating agencies are but one of the considerations that the Investment Manager and/or Fund’s subadviser incorporates into its credit analysis process, along with such other issuer-specific factors as cash flows, capital structure and leverage ratios, ability to de-leverage (repay) through free cash flow, quality of management, market positioning and access to capital, as well as such security-specific factors as the terms of the security (e.g., interest rate and time to maturity) and the amount and type of any collateral.
| 4 | Columbia Total Return Bond Fund | Annual Report 2017 |
Fund at a Glance (continued)
| Market exposure through derivatives investments (% of notional exposure) (at April 30, 2017)(a) |
| | Long | Short | Net |
| Fixed Income Derivative Contracts | 656.2 | (556.2) | 100.0 |
| Total Notional Market Value of Derivative Contracts | 656.2 | (556.2) | 100.0 |
(a) The Fund has market exposure (long and/or short) to the fixed income asset class through its investments in derivatives. The notional exposure of a financial instrument is the nominal or face amount that is used to calculate payments made on that instrument and/or changes in value for the instrument. The notional exposure is a hypothetical underlying quantity upon which payment obligations are computed. Notional exposures provide a gauge for how the Fund may behave given changes in individual markets. For a description of the Fund’s investments in derivatives, see Investments in derivatives following the Portfolio of Investments, and Note 2 to the Notes to Financial Statements.
Columbia Total Return Bond Fund | Annual Report 2017
| 5 |
Manager Discussion of Fund Performance
For the 12-month period that ended April 30, 2017, the Fund’s Class A shares returned 2.37% excluding sales charges. The Fund’s benchmark, the Bloomberg Barclays U.S. Aggregate Bond Index, returned 0.83% for the same period. The most significant contributor to the Fund’s relative performance was active sector allocation, in particular maintaining underweight exposure to U.S. Treasuries while in turn overweighting investment-grade corporates, asset-backed securities and commercial mortgage-backed securities. Security selection in investment-grade credits also added to relative performance.
Credit outperformed against uncertain geopolitical backdrop
As the period began, U.S. interest rates were hovering near historical lows, in part due to negative interest rates overseas as central banks sought to bolster anemic growth. Despite a sub-par global economic backdrop, U.S. credit sentiment was supported by the domestic economy’s continued moderate growth, combined with the expectation that the Federal Reserve (the Fed) would follow a gradual trajectory as it sought to bring short-term interest rates up to more normal levels.
In late-June of 2016, a U.K. referendum which resulted in a vote to exit the European Union spurred a flight-to-safety trade, driving U.S. Treasury yields even lower. While credit-sensitive areas of the market briefly faltered, markets quickly put the impact of “Brexit” on global growth into perspective, with the aid of supportive central banks. Sentiment was also helped as crude oil prices stabilized in the $50 a barrel range, well above the $30 territory explored in early 2016.
The surprise result of the November 2016 U.S. election led to an upturn in both credit sentiment and interest rates, as investors anticipated higher growth and inflation with Republicans in control of the White House and both houses of Congress. In the wake of the election, U.S. Treasury yields trended higher and credit-oriented segments of the bond market outperformed well into 2017. In March 2017, a dip in oil prices led inflation expectations and Treasury rates lower. In addition, the apparent surrender of the Republicans on healthcare reform brought into question the prospects for the rest of President Trump’s pro-growth economic platform. Nonetheless, credit-oriented areas of the bond market notably outperformed for the full 12 months ended April 30, 2017.
Yields rose meaningfully along the U.S. Treasury curve over the 12-month period ended April 30, 2017, and the yield curve flattened modestly as shorter maturities experienced somewhat greater yield increases. To illustrate, the two-year Treasury yield rose 51 basis points from 0.77% to 1.28%, while the 30-year yield rose 30 basis points, from 2.66% to 2.96%.
Contributors and detractors
The Fund’s performance in the period benefited from an underweighting of U.S. Treasuries, which were most directly and negatively impacted by the upturn in interest rates in the wake of the November election. In turn, the Fund had overweight exposure to investment-grade corporates, asset-backed securities and commercial mortgage-backed securities. These holdings benefited from the strengthened credit sentiment in the second half of the period as investors anticipated pro-growth policies from the new administration. Out-of-benchmark exposure to below-investment-grade, high-yield corporates also aided performance, as did holdings of non-rated, non-agency structured credits.
With respect to the Fund’s positioning within investment-grade corporates, we had increased exposure to energy credits in early 2016 on the view that valuations there had overshot on the downside in reaction to the decline in crude oil prices. This worked well for performance over the most recent fiscal period as these credits outperformed as commodity markets rebounded and oil prices stabilized within a reasonably narrow band around $50 per barrel. In addition, we have for some time maintained overweight exposure to financials in view of the tighter regulation and higher capital standards being applied to the industry. This positioning also added to performance as bank credits were boosted by the upward move in interest rates post-election and outlook for continued Fed tightening.
Security selection within corporate credit was also beneficial to the Fund’s performance. In particular, a focus on integrated energy firms within energy holdings worked well. In addition, performance within financials was helped by our tilt toward preferred securities, which are lower in the capital structure than bonds and thus more subject to swings in credit sentiment.
The Fund’s positioning during the period with respect to overall portfolio duration (and corresponding sensitivity to interest rates) had a neutral to slightly negative impact on performance versus the benchmark, as we generally did not look to take risk in that area.
| 6 | Columbia Total Return Bond Fund | Annual Report 2017 |
Manager Discussion of Fund Performance (continued)
We invested in highly-liquid, widely-traded Treasury futures and interest rate swap contracts to help manage portfolio duration. These enable us to efficiently implement our yield curve opinions and offset unintended yield curve impacts from other investments in the portfolio. We also invested in credit default swaps to manage exposure to overall credit risk and individual issuer risk. On a standalone basis, various derivative positions hurt performance.
At period’s end
At the end of the reporting end, the Fund had a modest “barbell” stance, with a position in floating rate issues balanced by holdings in the 10-year maturity range.
While we viewed the fundamental and technical backdrop for credit as positive, valuations for spread sectors had become stretched and we had lowered the Fund’s risk profile as the report period ended. In this vein, we reduced exposure to investment-grade corporates, with respect to both bonds and preferred securities. Given where the Fed was in its hiking cycle at the close of the period, we had increased holdings of floating rate issues.
Market risk may affect a single issuer, sector of the economy, industry or the market as a whole. Fixed-income securities present issuer default risk. A rise in interest rates may result in a price decline of fixed-income instruments held by the Fund, negatively impacting its performance and NAV. Falling rates may result in the Fund investing in lower yielding debt instruments, lowering the Fund’s income and yield. These risks may be heightened for longer maturity and duration securities. Prepayment and extension risk exists because the timing of payments on a loan, bond or other investment may accelerate when interest rates fall or decelerate when interest rates rise which may reduce investment opportunities and potential returns. Non-investment-grade (high-yield or junk) securities present greater price volatility and more risk to principal and income than higher rated securities. Investing in derivatives is a specialized activity that involves special risks that subject the Fund to significant loss potential, including when used as leverage, and may result in greater fluctuation in fund value. Market or other (e.g., interest rate) environments may adversely affect the liquidity of fund investments, negatively impacting their price. Generally, the less liquid the market at the time the Fund sells a holding, the greater the risk of loss or decline of value to the Fund. See the Fund’s prospectus for more information on these and other risks.
The views expressed in this report reflect the current views of the respective parties. These views are not guarantees of future performance and involve certain risks, uncertainties and assumptions that are difficult to predict, so actual outcomes and results may differ significantly from the views expressed. These views are subject to change at any time based upon economic, market or other conditions and the respective parties disclaim any responsibility to update such views. These views may not be relied on as investment advice and, because investment decisions for a Columbia fund are based on numerous factors, may not be relied on as an indication of trading intent on behalf of any particular Columbia fund. References to specific securities should not be construed as a recommendation or investment advice.
Columbia Total Return Bond Fund | Annual Report 2017
| 7 |
Understanding Your Fund’s Expenses
(Unaudited)
As an investor, you incur two types of costs. There are transaction costs, which generally include sales charges on purchases and may include redemption fees. There are also ongoing costs, which generally include management fees, distribution and/or service fees, and other fund expenses. The following information is intended to help you understand your ongoing costs (in dollars) of investing in the Fund and to help you compare these costs with the ongoing costs of investing in other mutual funds.
Analyzing your Fund’s expenses
To illustrate these ongoing costs, we have provided examples and calculated the expenses paid by investors in each share class of the Fund during the period. The actual and hypothetical information in the table is based on an initial investment of $1,000 at the beginning of the period indicated and held for the entire period. Expense information is calculated two ways and each method provides you with different information. The amount listed in the “Actual” column is calculated using the Fund’s actual operating expenses and total return for the period. You may use the Actual information, together with the amount invested, to estimate the expenses that you paid over the period. Simply divide your account value by $1,000 (for example, an $8,600 account value divided by $1,000 = 8.6), then multiply the results by the expenses paid during the period under the “Actual” column. The amount listed in the “Hypothetical” column assumes a 5% annual rate of return before expenses (which is not the Fund’s actual return) and then applies the Fund’s actual expense ratio for the period to the hypothetical return. You should not use the hypothetical account values and expenses to estimate either your actual account balance at the end of the period or the expenses you paid during the period. See “Compare with other funds” below for details on how to use the hypothetical data.
Compare with other funds
Since all mutual funds are required to include the same hypothetical calculations about expenses in shareholder reports, you can use this information to compare the ongoing cost of investing in the Fund with other funds. To do so, compare the hypothetical example with the 5% hypothetical examples that appear in the shareholder reports of other funds. As you compare hypothetical examples of other funds, it is important to note that hypothetical examples are meant to highlight the ongoing costs of investing in a fund only and do not reflect any transaction costs, such as sales charges, or redemption or exchange fees. Therefore, the hypothetical calculations are useful in comparing ongoing costs only, and will not help you determine the relative total costs of owning different funds. If transaction costs were included in these calculations, your costs would be higher.
| November 1, 2016 — April 30, 2017 |
| | Account value at the
beginning of the
period ($) | Account value at the
end of the
period ($) | Expenses paid during
the period ($) | Fund’s annualized
expense ratio (%) |
| | Actual | Hypothetical | Actual | Hypothetical | Actual | Hypothetical | Actual |
| Class A | 1,000.00 | 1,000.00 | 999.00 | 1,020.30 | 4.22 | 4.26 | 0.86 |
| Class B | 1,000.00 | 1,000.00 | 996.40 | 1,016.62 | 7.88 | 7.96 | 1.61 |
| Class C | 1,000.00 | 1,000.00 | 995.30 | 1,016.62 | 7.88 | 7.96 | 1.61 |
| Class K | 1,000.00 | 1,000.00 | 999.20 | 1,020.55 | 3.97 | 4.01 | 0.81 |
| Class R | 1,000.00 | 1,000.00 | 997.80 | 1,019.08 | 5.44 | 5.50 | 1.11 |
| Class R4 | 1,000.00 | 1,000.00 | 1,000.20 | 1,021.53 | 2.99 | 3.02 | 0.61 |
| Class R5 | 1,000.00 | 1,000.00 | 1,001.60 | 1,021.77 | 2.75 | 2.78 | 0.56 |
| Class T (formerly Class W) | 1,000.00 | 1,000.00 | 996.80 | 1,020.30 | 4.21 | 4.26 | 0.86 |
| Class Y | 1,000.00 | 1,000.00 | 1,000.80 | 1,022.02 | 2.50 | 2.53 | 0.51 |
| Class Z | 1,000.00 | 1,000.00 | 1,000.30 | 1,021.53 | 2.99 | 3.02 | 0.61 |
Expenses paid during the period are equal to the annualized expense ratio for each class as indicated above, multiplied by the average account value over the period and then multiplied by the number of days in the Fund’s most recent fiscal half year and divided by 365.
Expenses do not include fees and expenses incurred indirectly by the Fund from its investment in underlying funds, including affiliated and non-affiliated pooled investment vehicles, such as mutual funds and exchange-traded funds.
Had Columbia Management Investment Advisers, LLC and/or certain of its affiliates not waived/reimbursed certain fees and expenses, account value at the end of the period would have been reduced.
The Fund’s annualized expense ratio excludes the impact of an expense reimbursement from a third party due to overbilling.
| 8 | Columbia Total Return Bond Fund | Annual Report 2017 |
Portfolio of Investments
April 30, 2017
(Percentages represent value of investments compared to net assets)
| Asset-Backed Securities — Agency 2.8% |
| Issuer | Coupon
Rate | | Principal
Amount ($) | Value ($) |
| United States Small Business Administration |
| Series 2012-20C Class 1 |
| 03/01/32 | 2.510% | | 802,543 | 803,032 |
| Series 2012-20G Class 1 |
| 07/01/32 | 2.380% | | 1,299,911 | 1,293,339 |
| Series 2012-20L Class 1 |
| 12/01/32 | 1.930% | | 1,478,585 | 1,435,497 |
| Series 2013-20A Class 1 |
| 01/01/33 | 2.130% | | 3,379,194 | 3,316,798 |
| Series 2013-20C Class 1 |
| 03/01/33 | 2.220% | | 7,256,409 | 7,127,139 |
| Series 2014-20D Class 1 |
| 04/01/34 | 3.110% | | 3,242,271 | 3,355,731 |
| Series 2014-20F Class 1 |
| 06/01/34 | 2.990% | | 3,583,283 | 3,652,479 |
| Series 2015-20C Class 1 |
| 03/01/35 | 2.720% | | 1,382,683 | 1,389,120 |
| Series 2016-20F Class 1 |
| 06/01/36 | 2.180% | | 13,707,393 | 13,372,921 |
| Series 2016-20K Class 1 |
| 11/01/36 | 2.570% | | 8,860,000 | 8,841,390 |
| Series 2016-20L Class 1 |
| 12/01/36 | 2.810% | | 10,900,000 | 10,969,341 |
| Series 2017-20D Class 1 |
| 04/01/37 | 2.840% | | 13,503,000 | 13,598,245 |
Total Asset-Backed Securities — Agency
(Cost $69,263,177) | 69,155,032 |
|
| Asset-Backed Securities — Non-Agency 18.9% |
| | | | |
| Ally Master Owner Trust(a) |
| Series 2014-5 Class A1 |
| 10/15/19 | 1.484% | | 1,590,000 | 1,592,097 |
| AmeriCredit Automobile Receivables Trust(a) |
| Series 2016-2 Class A2B |
| 10/08/19 | 1.689% | | 1,369,861 | 1,371,788 |
| Apidos CLO XIX(a),(b) |
| Series 2014-19A Class A2 |
| 10/17/26 | 3.158% | | 16,500,000 | 16,506,402 |
| Ascentium Equipment Receivables Trust(b),(c) |
| Series 2017-1A Class A2 |
| 07/10/19 | 1.870% | | 1,290,000 | 1,289,941 |
| Avery Point VII CLO Ltd.(a),(b) |
| 01/15/28 | 7.758% | | 1,400,000 | 1,406,751 |
| Birchwood Park CLO Ltd.(a),(b) |
| Series 2014-1A Class AR |
| 07/15/26 | 2.174% | | 2,500,000 | 2,500,090 |
| Asset-Backed Securities — Non-Agency (continued) |
| Issuer | Coupon
Rate | | Principal
Amount ($) | Value ($) |
| BMW Floorplan Master Owner Trust(a),(b) |
| Series 2015-1A Class A |
| 07/15/20 | 1.494% | | 1,200,000 | 1,202,375 |
| BMW Vehicle Lease Trust |
| Series 2017-1 Class A2 |
| 07/22/19 | 1.640% | | 1,625,000 | 1,627,026 |
| Cabela’s Credit Card Master Note Trust |
| Series 2015-2 Class A1 |
| 07/17/23 | 2.250% | | 5,640,000 | 5,673,478 |
| Capital One Multi-Asset Execution Trust |
| Series 2015-A4 Class A4 |
| 05/15/25 | 2.750% | | 9,995,000 | 10,253,860 |
| Series 2017-A3 Class A3 |
| 01/15/25 | 2.430% | | 14,300,000 | 14,405,498 |
| Carlyle Global Market Strategies CLO Ltd.(a),(b) |
| Series 2014-1A Class AR |
| 04/17/25 | 2.180% | | 4,915,000 | 4,915,319 |
| Series 2016-1A Class D |
| 04/20/27 | 8.756% | | 1,200,000 | 1,203,274 |
| CarMax Auto Owner Trust |
| Series 2016-4 Class A2 |
| 11/15/19 | 1.210% | | 3,895,000 | 3,887,388 |
| Series 2017-2 Class A2 |
| 06/15/20 | 1.630% | | 9,935,000 | 9,928,164 |
| Chase Issuance Trust |
| Series 2016-A7 Class A7 |
| 09/16/19 | 1.060% | | 10,300,000 | 10,291,844 |
| Chesapeake Funding II LLC(a),(b) |
| Series 2016-2A Class A2 |
| 06/15/28 | 1.994% | | 5,200,000 | 5,223,323 |
| Chrysler Capital Auto Receivables Trust(b) |
| Series 2016-BA Class A2 |
| 01/15/20 | 1.360% | | 1,260,000 | 1,259,608 |
| CNH Equipment Trust |
| Series 2015-B Class A3 |
| 07/15/20 | 1.370% | | 883,750 | 882,918 |
| Conn Funding II LP(b) |
| Series 2017-A Class A |
| 05/15/20 | 2.730% | | 12,500,000 | 12,500,000 |
| Series 2017-A Class B |
| 05/15/20 | 5.110% | | 1,500,000 | 1,500,000 |
| Conn’s Receivables Funding LLC(b) |
| Series 2016-A Class A |
| 04/16/18 | 4.680% | | 89,090 | 89,176 |
| Series 2016-B Class A |
| 10/15/18 | 3.730% | | 759,325 | 761,283 |
| Subordinated, Series 2016-A Class B |
| 08/15/18 | 8.960% | | 1,000,000 | 1,009,401 |
The accompanying Notes to Financial Statements are an integral part of this statement.
Columbia Total Return Bond Fund | Annual Report 2017
| 9 |
Portfolio of Investments (continued)
April 30, 2017
| Asset-Backed Securities — Non-Agency (continued) |
| Issuer | Coupon
Rate | | Principal
Amount ($) | Value ($) |
| Dell Equipment Finance Trust(a),(b) |
| Series 2015-2 Class A2B |
| 12/22/17 | 1.888% | | 175,544 | 175,657 |
| Dell Equipment Finance Trust(b) |
| Series 2016-1 Class A2 |
| 09/24/18 | 1.430% | | 1,662,125 | 1,661,985 |
| Dell Equipment Finance Trust(b),(c) |
| Series 2017-1 Class A2 |
| 06/24/19 | 1.860% | | 1,475,000 | 1,474,859 |
| Discover Card Execution Note Trust |
| Series 2017-A2 Class A2 |
| 07/15/24 | 2.390% | | 29,430,000 | 29,757,070 |
| DRB Prime Student Loan Trust(b) |
| Series 2016-B Class A2 |
| 06/25/40 | 2.890% | | 3,706,648 | 3,712,599 |
| Dryden 33 Senior Loan Fund(a),(b) |
| Series 2014-33A Class AR |
| 10/15/28 | 2.588% | | 9,000,000 | 9,025,812 |
| Series 2014-33A Class ER |
| 10/15/28 | 8.698% | | 1,500,000 | 1,528,522 |
| Dryden XXIV Senior Loan Fund(a),(b) |
| Series 2012-24RA Class AR |
| 11/15/23 | 2.329% | | 5,156,796 | 5,165,681 |
| DT Auto Owner Trust(b) |
| Subordinated, Series 2014-1A Class D |
| 01/15/21 | 3.980% | | 3,335,432 | 3,362,863 |
| Enterprise Fleet Financing LLC(b) |
| Series 2015-1 Class A2 |
| 09/20/20 | 1.300% | | 2,405,526 | 2,403,097 |
| Series 2015-2 Class A2 |
| 02/22/21 | 1.590% | | 2,511,687 | 2,512,556 |
| Series 2016-2 Class A2 |
| 02/22/22 | 1.740% | | 2,800,000 | 2,795,576 |
| Ford Credit Auto Owner Trust(b) |
| Series 2015-2 Class A |
| 01/15/27 | 2.440% | | 5,695,000 | 5,762,815 |
| Series 2016-1 Class A |
| 08/15/27 | 2.310% | | 11,955,000 | 11,999,561 |
| Series 2016-2 Class A |
| 12/15/27 | 2.030% | | 19,300,000 | 19,144,124 |
| Series 2017-1 Class A |
| 08/15/28 | 2.620% | | 17,000,000 | 17,179,845 |
| Ford Credit Auto Owner Trust |
| Series 2016-A Class A2A |
| 12/15/18 | 1.120% | | 408,405 | 408,234 |
| GM Financial Automobile Leasing Trust |
| Series 2016-3 Class A2A |
| 02/20/19 | 1.350% | | 2,895,885 | 2,891,685 |
| Asset-Backed Securities — Non-Agency (continued) |
| Issuer | Coupon
Rate | | Principal
Amount ($) | Value ($) |
| GMF Floorplan Owner Revolving Trust(a),(b) |
| Series 2016-1 Class A2 |
| 05/17/21 | 1.844% | | 3,440,000 | 3,471,363 |
| Golden Credit Card Trust(a),(b) |
| Series 2015-3A Class A |
| 07/15/19 | 1.414% | | 5,555,000 | 5,556,730 |
| Green Tree Agency Advance Funding Trust I(b) |
| Series 2016-T1 Class AT1 |
| 10/15/48 | 2.380% | | 3,700,000 | 3,674,544 |
| Harley-Davidson Motorcycle Trust |
| Series 2015-1 Class A3 |
| 06/15/20 | 1.410% | | 1,617,876 | 1,617,018 |
| Hertz Fleet Lease Funding LP(a),(b) |
| Series 2014-1 Class A |
| 04/10/28 | 1.389% | | 838,225 | 838,269 |
| Series 2015-1 Class A |
| 07/10/29 | 1.428% | | 5,687,629 | 5,694,286 |
| Series 2016-1 Class A1 |
| 04/10/30 | 1.958% | | 9,335,000 | 9,370,661 |
| Series 2017-1 Class A1 |
| 04/10/31 | 1.641% | | 3,020,000 | 3,020,000 |
| Hertz Vehicle Financing II LP(b) |
| Series 2015-3A Class A |
| 09/25/21 | 2.670% | | 2,870,000 | 2,845,878 |
| Hertz Vehicle Financing LLC(b) |
| Series 2016-1A Class A |
| 03/25/20 | 2.320% | | 2,600,000 | 2,590,174 |
| Hyundai Floorplan Master Owner Trust(a),(b) |
| Series 2016-1A Class A1 |
| 03/15/21 | 1.894% | | 1,425,000 | 1,435,625 |
| John Deere Owner Trust |
| Series 2016-A Class A2 |
| 10/15/18 | 1.150% | | 1,911,110 | 1,910,529 |
| Kubota Credit Owner Trust(b) |
| Series 2016-1A Class A2 |
| 04/15/19 | 1.250% | | 2,586,007 | 2,582,431 |
| Madison Park Funding XVI Ltd.(a),(b) |
| Series 2014-12A Class AR |
| 07/20/26 | 2.416% | | 11,000,000 | 10,999,945 |
| Mercedes-Benz Auto Lease Trust |
| Series 2016-B Class A2 |
| 01/15/19 | 1.150% | | 1,770,000 | 1,768,143 |
| Series 2017-A Class A2A |
| 08/15/19 | 1.530% | | 8,620,000 | 8,619,991 |
| MMAF Equipment Finance LLC(b),(c) |
| Series 2017-AA Class A2 |
| 05/18/20 | 1.730% | | 1,130,000 | 1,129,882 |
The accompanying Notes to Financial Statements are an integral part of this statement.
| 10 | Columbia Total Return Bond Fund | Annual Report 2017 |
Portfolio of Investments (continued)
April 30, 2017
| Asset-Backed Securities — Non-Agency (continued) |
| Issuer | Coupon
Rate | | Principal
Amount ($) | Value ($) |
| New Residential Advance Receivables Trust Advance Receivables-Backed Notes(b) |
| Series 2017-T1 Class AT1 |
| 02/15/51 | 3.214% | | 5,400,000 | 5,438,502 |
| New York City Tax Lien Trust(b) |
| Series 2015-A Class A |
| 11/10/28 | 1.340% | | 637,427 | 634,479 |
| Series 2016-A Class A |
| 11/10/29 | 1.470% | | 1,717,226 | 1,706,722 |
| Nissan Auto Lease Trust |
| Series 2016-B Class A2A |
| 12/17/18 | 1.260% | | 3,625,852 | 3,621,894 |
| Nissan Auto Receivables Owner Trust(a) |
| Series 2015-A Class A1 |
| 01/15/20 | 1.394% | | 5,895,000 | 5,903,029 |
| Ocwen Master Advance Receivables Trust(b) |
| Series 2016-T1 Class AT1 |
| 08/17/48 | 2.521% | | 7,500,000 | 7,488,281 |
| OneMain Direct Auto Receivables Trust(b) |
| Series 2016-1A Class A |
| 01/15/21 | 2.040% | | 2,365,118 | 2,369,046 |
| OneMain Financial Issuance Trust(b) |
| Series 2015-1A Class A |
| 03/18/26 | 3.190% | | 5,085,000 | 5,138,437 |
| Series 2015-2A Class A |
| 07/18/25 | 2.570% | | 11,165,000 | 11,187,244 |
| Sierra Timeshare Receivables Funding LLC(b) |
| Series 2016-2A Class A |
| 07/20/33 | 2.330% | | 2,365,320 | 2,372,785 |
| SMART ABS Series Trust(a) |
| Series 2015-3US Class A2B |
| 04/16/18 | 1.744% | | 480,713 | 480,691 |
| SoFi Professional Loan Program(b),(d),(e) |
| Series 2017-A Class R |
| 03/26/40 | 0.000% | | 12,500 | 736,250 |
| SoFi Professional Loan Program LLC(b),(d),(e),(f) |
| Series 2015-D Class RC |
| 10/26/37 | 0.000% | | 2 | 1,493,333 |
| Series 2016-A Class RIO |
| 01/25/38 | 0.000% | | 3 | 1,290,000 |
| Series 2016-A Class RPO |
| 01/25/38 | 0.000% | | 4 | 2,840,000 |
| Series 2016-B Class RC |
| 04/25/37 | 0.000% | | 1 | 605,000 |
| SoFi Professional Loan Program LLC(b) |
| Series 2016-A |
| 12/26/36 | 2.760% | | 5,952,810 | 6,021,503 |
| Springleaf Funding Trust(b) |
| Series 2016-AA Class A |
| 11/15/29 | 2.900% | | 5,400,000 | 5,427,105 |
| Asset-Backed Securities — Non-Agency (continued) |
| Issuer | Coupon
Rate | | Principal
Amount ($) | Value ($) |
| SPS Servicer Advance Receivables Trust(b) |
| Series 2016-T2 Class AT2 |
| 11/15/49 | 2.750% | | 7,500,000 | 7,487,792 |
| Symphony CLO V Ltd.(a),(b) |
| Series 2007-5A Class A1 |
| 01/15/24 | 1.908% | | 7,320,780 | 7,320,751 |
| TAL Advantage V LLC(b) |
| Series 2014-2A Class A1 |
| 05/20/39 | 1.700% | | 957,013 | 949,487 |
| TCF Auto Receivables Owner Trust(b) |
| Series 2016-PT1A Class A |
| 06/15/22 | 1.930% | | 5,233,385 | 5,237,511 |
| Venture XI CLO Ltd.(a),(b) |
| Series 2012-11A Class AR |
| 11/14/22 | 2.336% | | 8,407,217 | 8,414,733 |
| Voya Ltd.(a),(b) |
| Series 2012-4A Class A1R |
| 10/15/28 | 2.608% | | 10,000,000 | 10,030,170 |
| VSE VOI Mortgage LLC(b) |
| Series 2016-A Class A |
| 07/20/33 | 2.540% | | 5,210,397 | 5,150,772 |
| Wells Fargo Dealer Floorplan Master Note Trust(a) |
| Series 2014-1 Class A |
| 07/20/19 | 1.373% | | 7,625,000 | 7,628,019 |
| Series 2015-1 Class A |
| 01/20/20 | 1.493% | | 7,845,000 | 7,858,438 |
| Wheels SPV 2 LLC(b) |
| Series 2015-1A Class A2 |
| 04/22/24 | 1.270% | | 1,272,991 | 1,270,550 |
| World Financial Network Credit Card Master Trust |
| Series 2012-D Class A |
| 04/17/23 | 2.150% | | 11,475,000 | 11,553,136 |
| Series 2015-B Class A |
| 06/17/24 | 2.550% | | 10,735,000 | 10,889,363 |
| Series 2015-C Class A |
| 03/15/21 | 1.260% | | 1,555,000 | 1,555,001 |
| World Omni Auto Receivables Trust |
| Series 2017-A Class A2A |
| 08/17/20 | 1.500% | | 8,935,000 | 8,934,972 |
| World Omni Automobile Lease Securitization Trust |
| Series 2015-A Class A3 |
| 10/15/18 | 1.540% | | 6,015,000 | 6,020,095 |
Total Asset-Backed Securities — Non-Agency
(Cost $461,532,147) | 464,424,105 |
|
| Commercial Mortgage-Backed Securities - Agency 0.9% |
| | | | |
| Federal Home Loan Mortgage Corp. |
| Series K026 Class A2 |
| 11/25/22 | 2.510% | | 4,910,000 | 4,969,073 |
The accompanying Notes to Financial Statements are an integral part of this statement.
Columbia Total Return Bond Fund | Annual Report 2017
| 11 |
Portfolio of Investments (continued)
April 30, 2017
| Commercial Mortgage-Backed Securities - Agency (continued) |
| Issuer | Coupon
Rate | | Principal
Amount ($) | Value ($) |
| Series K027 Class A2 |
| 01/25/23 | 2.637% | | 4,161,000 | 4,213,507 |
| Series K722 Class A2 |
| 03/25/23 | 2.406% | | 3,000,000 | 3,015,594 |
| Series K724 Class A1 |
| 03/25/23 | 2.776% | | 6,445,745 | 6,601,018 |
| Federal Home Loan Mortgage Corp. Multifamily Structured Pass-Through Certificates |
| Series 20K720 Class A2 |
| 06/25/22 | 2.716% | | 3,985,000 | 4,078,165 |
Total Commercial Mortgage-Backed Securities - Agency
(Cost $22,792,924) | 22,877,357 |
|
| Commercial Mortgage-Backed Securities - Non-Agency 2.8% |
| | | | |
| American Homes 4 Rent(b) |
| Series 2015-SFR1 Class F |
| 04/17/52 | 5.885% | | 1,000,000 | 1,022,455 |
| American Homes 4 Rent Trust(b) |
| Series 2014-SFR3 Class A |
| 12/17/36 | 3.678% | | 1,532,936 | 1,592,943 |
| Series 2015-SFR2 Class A |
| 10/17/45 | 3.732% | | 4,458,402 | 4,648,544 |
| B2R Mortgage Trust(a),(b) |
| Series 2015-2 Class E |
| 11/15/48 | 5.663% | | 500,000 | 457,175 |
| BHMS Mortgage Trust(a),(b) |
| Series 2014-ATLS Class DFX |
| 07/05/33 | 5.483% | | 1,500,000 | 1,497,549 |
| Capmark Mortgage Securities, Inc.(a),(g) |
| CMO Series 1997-C1 Class X |
| 07/15/29 | 1.662% | | 1,176,619 | 27,027 |
| Citigroup Commercial Mortgage Trust |
| Series 2015-GC29 Class A3 |
| 04/10/48 | 2.935% | | 2,215,000 | 2,201,702 |
| Commercial Mortgage Trust |
| Series 2015-LC19 Class A4 |
| 02/10/48 | 3.183% | | 2,140,000 | 2,167,959 |
| DBUBS Mortgage Trust(b) |
| Series 2011-LC2A Class A4 |
| 07/10/44 | 4.537% | | 10,865,000 | 11,659,595 |
| General Electric Capital Assurance Co.(b) |
| Series 2003-1 Class A5 |
| 05/12/35 | 5.743% | | 1,601,618 | 1,689,960 |
| Hilton USA Trust(b) |
| Series 2016-HHV Class A |
| 11/05/38 | 3.719% | | 4,700,000 | 4,856,048 |
| Series 2016-SFP Class A |
| 11/05/35 | 2.828% | | 3,000,000 | 2,974,841 |
| Subordinated, Series 2016-SFP Class E |
| 11/05/35 | 5.519% | | 1,500,000 | 1,505,459 |
| Commercial Mortgage-Backed Securities - Non-Agency (continued) |
| Issuer | Coupon
Rate | | Principal
Amount ($) | Value ($) |
| Hilton USA Trust(a),(b) |
| Series 2016-HHV Class F |
| 11/05/38 | 4.333% | | 4,000,000 | 3,126,828 |
| Houston Galleria Mall Trust(b) |
| Series 2015-HGLR Class A1A2 |
| 03/05/37 | 3.087% | | 3,000,000 | 2,991,868 |
| Invitation Homes Trust(a),(b) |
| Subordinated, Series 2014-SFR3 Class F |
| 12/17/31 | 5.994% | | 1,000,000 | 1,003,268 |
| Subordinated, Series 2015-SFR2 Class E |
| 06/17/32 | 4.144% | | 749,000 | 755,660 |
| Subordinated, Series 2015-SFR2 Class F |
| 06/17/32 | 4.694% | | 800,000 | 804,692 |
| JPMBB Commercial Mortgage Securities Trust |
| Series 2014-C26 Class A3 |
| 01/15/48 | 3.231% | | 765,000 | 777,476 |
| JPMCC Re-REMIC Trust(a),(b) |
| Series 2016-GG10 Class AMA |
| 08/15/45 | 5.949% | | 9,500,000 | 9,583,263 |
| JPMorgan Commercial Mortgage-Backed Securities Trust(b) |
| Series 2009-RR1 Class A4B1 |
| 03/18/51 | 1.000% | | 1,738,798 | 1,731,403 |
| LB Commercial Mortgage Trust(a) |
| Series 2007-C3 Class AM |
| 07/15/44 | 6.206% | | 4,640,000 | 4,653,597 |
| Merrill Lynch Mortgage Investors Trust(a),(g) |
| CMO Series 1998-C3 Class IO |
| 12/15/30 | 1.087% | | 1,534,602 | 5,078 |
| Morgan Stanley Capital I Trust(b) |
| Series 2014-150E Class A |
| 09/09/32 | 3.912% | | 4,080,000 | 4,307,542 |
| Morgan Stanley Re-Remic Trust(a),(b) |
| Series 2009-GG10 Class A4B |
| 08/12/45 | 6.041% | | 985,168 | 986,633 |
| Series 2010-GG10 Class A4B |
| 08/15/45 | 6.041% | | 612,713 | 612,337 |
| Rialto Real Estate Fund LLC(b) |
| Subordinated, Series 2015-LT7 Class B |
| 12/25/32 | 5.071% | | 2,000,000 | 1,999,141 |
Total Commercial Mortgage-Backed Securities - Non-Agency
(Cost $72,238,753) | 69,640,043 |
The accompanying Notes to Financial Statements are an integral part of this statement.
| 12 | Columbia Total Return Bond Fund | Annual Report 2017 |
Portfolio of Investments (continued)
April 30, 2017
| Common Stocks —% |
| Issuer | Shares | Value ($) |
| Financials —% |
| Insurance —% |
| WMI Holdings Corp. Escrow(f),(h),(i) | 2,725 | — |
| WMIH Corp.(h) | 54,217 | 81,325 |
| Total | | 81,325 |
| Total Financials | 81,325 |
| Industrials —% |
| Airlines —% |
| United Continental Holdings, Inc.(h) | 1,493 | 104,824 |
| Total Industrials | 104,824 |
Total Common Stocks
(Cost $1,511,104) | 186,149 |
| Convertible Preferred Stocks 0.2% |
| Issuer | Coupon
Rate | Shares | Value ($) |
| Financials 0.2% |
| Banks 0.2% |
| Bank of America Corp. | 7.250% | 5,000 | 6,067,100 |
| Total Financials | 6,067,100 |
Total Convertible Preferred Stocks
(Cost $5,950,000) | 6,067,100 |
| Corporate Bonds & Notes 31.9% |
| Issuer | Coupon
Rate | | Principal
Amount ($) | Value ($) |
| Aerospace & Defense 0.5% |
| Bombardier, Inc.(b) |
| 12/01/21 | 8.750% | | 162,000 | 180,225 |
| L-3 Communications Corp. |
| 12/15/26 | 3.850% | | 2,322,000 | 2,383,963 |
| Lockheed Martin Corp. |
| 01/15/26 | 3.550% | | 5,015,000 | 5,173,203 |
| 09/01/36 | 6.150% | | 1,320,000 | 1,674,895 |
| 12/15/42 | 4.070% | | 1,790,000 | 1,783,790 |
| TransDigm, Inc. |
| 07/15/24 | 6.500% | | 244,000 | 250,710 |
| 06/15/26 | 6.375% | | 459,000 | 462,442 |
| TransDigm, Inc.(b) |
| 05/15/25 | 6.500% | | 247,000 | 252,558 |
| Total | 12,161,786 |
| Automotive 0.1% |
| Eagle Holding Co., II LLC PIK(b),(c) |
| 05/15/22 | 7.625% | | 41,000 | 41,746 |
| Corporate Bonds & Notes (continued) |
| Issuer | Coupon
Rate | | Principal
Amount ($) | Value ($) |
| Ford Motor Co. |
| 02/01/29 | 6.375% | | 2,340,000 | 2,675,324 |
| Gates Global LLC/Co.(b) |
| 07/15/22 | 6.000% | | 359,000 | 360,795 |
| ZF North America Capital, Inc.(b) |
| 04/29/25 | 4.750% | | 298,000 | 309,941 |
| Total | 3,387,806 |
| Banking 8.6% |
| Ally Financial, Inc. |
| 09/30/24 | 5.125% | | 443,000 | 452,414 |
| Bank of America Corp.(a) |
| 12/31/49 | 8.125% | | 1,625,000 | 1,702,188 |
| Bank of America Corp. |
| Subordinated |
| 01/22/25 | 4.000% | | 1,625,000 | 1,639,620 |
| Bank of New York Mellon Corp. (The) |
| 05/15/19 | 5.450% | | 3,325,000 | 3,559,309 |
| Bank of New York Mellon Corp. (The)(a) |
| Junior Subordinated |
| 12/29/49 | 4.500% | | 2,612,000 | 2,491,195 |
| 12/31/49 | 4.625% | | 1,287,000 | 1,267,695 |
| Barclays PLC |
| Subordinated |
| 05/12/26 | 5.200% | | 4,500,000 | 4,676,625 |
| Citigroup, Inc.(a) |
| 08/14/17 | 1.526% | | 13,820,000 | 13,829,785 |
| Citigroup, Inc. |
| Subordinated |
| 08/25/36 | 6.125% | | 1,046,000 | 1,230,463 |
| Discover Financial Services |
| 04/27/22 | 5.200% | | 3,712,000 | 4,030,820 |
| 11/21/22 | 3.850% | | 2,190,000 | 2,244,936 |
| Fifth Third Bancorp(a) |
| Junior Subordinated |
| 12/31/49 | 5.100% | | 5,456,000 | 5,408,260 |
| HBOS PLC(b) |
| Subordinated |
| 05/21/18 | 6.750% | | 8,382,000 | 8,764,881 |
| JPMorgan Chase & Co.(a) |
| 02/01/28 | 3.782% | | 8,480,000 | 8,624,431 |
| Junior Subordinated |
| 04/29/49 | 7.900% | | 13,100,000 | 13,689,500 |
| 12/31/49 | 5.300% | | 3,235,000 | 3,372,649 |
| 12/31/49 | 6.100% | | 2,600,000 | 2,788,500 |
| JPMorgan Chase Capital XXI(a) |
| Junior Subordinated |
| 02/02/37 | 1.985% | | 23,096,000 | 20,108,070 |
The accompanying Notes to Financial Statements are an integral part of this statement.
Columbia Total Return Bond Fund | Annual Report 2017
| 13 |
Portfolio of Investments (continued)
April 30, 2017
| Corporate Bonds & Notes (continued) |
| Issuer | Coupon
Rate | | Principal
Amount ($) | Value ($) |
| JPMorgan Chase Capital XXIII(a) |
| Junior Subordinated |
| 05/15/47 | 2.039% | | 449,000 | 387,541 |
| KeyCorp (a) |
| Junior Subordinated |
| 12/31/49 | 5.000% | | 8,743,000 | 8,743,000 |
| KeyCorp Capital I(a) |
| Junior Subordinated |
| 07/01/28 | 1.888% | | 6,591,000 | 5,816,558 |
| Lloyds Banking Group PLC |
| Subordinated |
| 12/10/25 | 4.582% | | 23,813,000 | 24,634,691 |
| M&T Bank Corp.(a) |
| Junior Subordinated |
| 12/31/49 | 5.125% | | 2,306,000 | 2,331,943 |
| PNC Bank NA |
| 06/01/25 | 3.250% | | 3,395,000 | 3,442,741 |
| Santander Issuances SAU |
| Subordinated |
| 11/19/25 | 5.179% | | 4,250,000 | 4,469,844 |
| Santander UK Group Holdings PLC(b) |
| Subordinated |
| 09/15/25 | 4.750% | | 4,589,000 | 4,631,246 |
| 09/15/45 | 5.625% | | 2,096,000 | 2,160,953 |
| State Street Corp.(a) |
| 06/15/37 | 2.131% | | 6,060,000 | 5,325,225 |
| SunTrust Capital I(a) |
| Junior Subordinated |
| 05/15/27 | 1.709% | | 1,560,000 | 1,368,900 |
| Synchrony Financial |
| 01/15/19 | 2.600% | | 4,895,000 | 4,931,159 |
| Synovus Financial Corp.(a) |
| Subordinated |
| 12/15/25 | 5.750% | | 8,090,000 | 8,555,175 |
| U.S. Bancorp |
| Subordinated |
| 04/27/26 | 3.100% | | 3,025,000 | 2,997,203 |
| Wachovia Capital Trust II(a) |
| Junior Subordinated |
| 01/15/27 | 1.658% | | 2,350,000 | 2,109,125 |
| Washington Mutual Bank(f),(j) |
| Subordinated |
| 01/15/15 | 0.000% | | 27,379,000 | 41,069 |
| Wells Fargo & Co. |
| 10/23/26 | 3.000% | | 10,995,000 | 10,601,896 |
| Corporate Bonds & Notes (continued) |
| Issuer | Coupon
Rate | | Principal
Amount ($) | Value ($) |
| Wells Fargo & Co.(a) |
| Junior Subordinated |
| 03/29/49 | 7.980% | | 5,025,000 | 5,257,406 |
| 12/31/49 | 5.900% | | 13,508,000 | 14,352,250 |
| Total | 212,039,266 |
| Brokerage/Asset Managers/Exchanges 0.0% |
| NPF Corp.(b) |
| 07/15/21 | 9.000% | | 93,000 | 98,348 |
| Building Materials 0.1% |
| Allegion PLC |
| 09/15/23 | 5.875% | | 500,000 | 533,750 |
| American Builders & Contractors Supply Co., Inc.(b) |
| 12/15/23 | 5.750% | | 192,000 | 204,000 |
| Beacon Roofing Supply, Inc. |
| 10/01/23 | 6.375% | | 333,000 | 358,807 |
| HD Supply, Inc.(b) |
| 04/15/24 | 5.750% | | 203,000 | 215,688 |
| US Concrete, Inc.(b) |
| 06/01/24 | 6.375% | | 203,000 | 212,135 |
| Total | 1,524,380 |
| Cable and Satellite 0.6% |
| Altice US Finance I Corp.(b) |
| 05/15/26 | 5.500% | | 913,000 | 943,814 |
| CCO Holdings LLC/Capital Corp.(b) |
| 05/01/27 | 5.875% | | 913,000 | 971,204 |
| Charter Communications Operating LLC/Capital |
| 10/23/45 | 6.484% | | 255,000 | 299,465 |
| CSC Holdings LLC(b) |
| 10/15/25 | 6.625% | | 829,000 | 905,682 |
| 10/15/25 | 10.875% | | 153,000 | 183,791 |
| DISH DBS Corp. |
| 07/01/26 | 7.750% | | 770,000 | 901,862 |
| NBCUniversal Enterprise Inc.(b) |
| Junior Subordinated |
| 12/31/49 | 5.250% | | 2,237,000 | 2,357,239 |
| Radiate HoldCo LLC/Finance, Inc.(b) |
| 02/15/25 | 6.625% | | 110,000 | 109,725 |
| Sirius XM Radio, Inc.(b) |
| 04/15/25 | 5.375% | | 354,000 | 362,850 |
| 07/15/26 | 5.375% | | 18,000 | 18,450 |
| Time Warner Cable LLC |
| 05/01/37 | 6.550% | | 2,625,000 | 3,050,998 |
| Time Warner Entertainment Co. LP |
| 07/15/33 | 8.375% | | 1,965,000 | 2,666,143 |
The accompanying Notes to Financial Statements are an integral part of this statement.
| 14 | Columbia Total Return Bond Fund | Annual Report 2017 |
Portfolio of Investments (continued)
April 30, 2017
| Corporate Bonds & Notes (continued) |
| Issuer | Coupon
Rate | | Principal
Amount ($) | Value ($) |
| Unitymedia Hessen GmbH & Co. KG NRW(b) |
| 01/15/23 | 5.500% | | 558,000 | 579,623 |
| Videotron Ltd./Ltee(b) |
| 04/15/27 | 5.125% | | 155,000 | 158,054 |
| Virgin Media Finance PLC(b) |
| 01/15/25 | 5.750% | | 140,000 | 142,800 |
| Virgin Media Secured Finance PLC(b) |
| 01/15/26 | 5.250% | | 810,000 | 820,125 |
| Ziggo Secured Finance BV(b) |
| 01/15/27 | 5.500% | | 534,000 | 547,366 |
| Total | 15,019,191 |
| Chemicals 0.7% |
| Angus Chemical Co.(b) |
| 02/15/23 | 8.750% | | 285,000 | 296,400 |
| Atotech USA, Inc.(b) |
| 02/01/25 | 6.250% | | 358,000 | 363,370 |
| Axalta Coating Systems LLC(b) |
| 08/15/24 | 4.875% | | 359,000 | 371,788 |
| Celanese U.S. Holdings LLC |
| 06/15/21 | 5.875% | | 5,970,000 | 6,691,373 |
| 11/15/22 | 4.625% | | 2,678,000 | 2,871,271 |
| Chemours Co. (The) |
| 05/15/23 | 6.625% | | 338,000 | 361,660 |
| Eco Services Operations LLC/Finance Corp.(b) |
| 11/01/22 | 8.500% | | 268,000 | 282,740 |
| INEOS Group Holdings SA(b) |
| 08/01/24 | 5.625% | | 358,000 | 364,265 |
| Koppers, Inc.(b) |
| 02/15/25 | 6.000% | | 145,000 | 151,888 |
| LyondellBasell Industries NV |
| 02/26/55 | 4.625% | | 4,680,000 | 4,381,608 |
| PQ Corp.(b) |
| 11/15/22 | 6.750% | | 401,000 | 432,077 |
| SPCM SA(b) |
| 09/15/25 | 4.875% | | 120,000 | 121,350 |
| Total | 16,689,790 |
| Construction Machinery 0.3% |
| John Deere Capital Corp.(a) |
| 01/16/18 | 1.448% | | 6,355,000 | 6,364,863 |
| Ritchie Bros. Auctioneers, Inc.(b) |
| 01/15/25 | 5.375% | | 124,000 | 128,030 |
| United Rentals North America, Inc. |
| 09/15/26 | 5.875% | | 613,000 | 646,715 |
| 05/15/27 | 5.500% | | 165,000 | 169,744 |
| Total | 7,309,352 |
| Corporate Bonds & Notes (continued) |
| Issuer | Coupon
Rate | | Principal
Amount ($) | Value ($) |
| Consumer Cyclical Services 0.1% |
| APX Group, Inc. |
| 12/01/20 | 8.750% | | 174,000 | 180,307 |
| APX Group, Inc.(b) |
| 12/01/22 | 7.875% | | 495,000 | 539,550 |
| Carlson Travel, Inc.(b) |
| 12/15/23 | 6.750% | | 89,000 | 91,948 |
| Interval Acquisition Corp. |
| 04/15/23 | 5.625% | | 345,000 | 355,350 |
| Total | 1,167,155 |
| Consumer Products 0.1% |
| Prestige Brands, Inc.(b) |
| 03/01/24 | 6.375% | | 545,000 | 583,150 |
| Scotts Miracle-Gro Co. (The) |
| 10/15/23 | 6.000% | | 267,000 | 285,356 |
| Scotts Miracle-Gro Co. (The)(b) |
| 12/15/26 | 5.250% | | 76,000 | 78,090 |
| Spectrum Brands, Inc. |
| 07/15/25 | 5.750% | | 344,000 | 368,737 |
| Springs Industries, Inc. |
| 06/01/21 | 6.250% | | 279,000 | 287,370 |
| Tempur Sealy International, Inc. |
| 06/15/26 | 5.500% | | 291,000 | 289,365 |
| Total | 1,892,068 |
| Diversified Manufacturing 1.4% |
| General Electric Co.(a) |
| Junior Subordinated |
| 12/31/49 | 5.000% | | 32,536,000 | 34,562,993 |
| SPX FLOW, Inc.(b) |
| 08/15/24 | 5.625% | | 181,000 | 183,262 |
| Zekelman Industries, Inc.(b) |
| 06/15/23 | 9.875% | | 188,000 | 212,440 |
| Total | 34,958,695 |
| Electric 3.2% |
| Arizona Public Service Co. |
| 09/15/26 | 2.550% | | 2,970,000 | 2,814,526 |
| 11/15/45 | 4.350% | | 2,065,000 | 2,167,096 |
| Calpine Corp. |
| 01/15/23 | 5.375% | | 359,000 | 353,615 |
| Cleveland Electric Illuminating Co. (The) |
| 12/15/36 | 5.950% | | 1,950,000 | 2,237,520 |
| Consolidated Edison Co. of New York, Inc. |
| 06/15/46 | 3.850% | | 1,650,000 | 1,604,199 |
The accompanying Notes to Financial Statements are an integral part of this statement.
Columbia Total Return Bond Fund | Annual Report 2017
| 15 |
Portfolio of Investments (continued)
April 30, 2017
| Corporate Bonds & Notes (continued) |
| Issuer | Coupon
Rate | | Principal
Amount ($) | Value ($) |
| DTE Energy Co. |
| 10/01/26 | 2.850% | | 13,258,000 | 12,528,890 |
| Duke Energy Progress LLC |
| 03/30/44 | 4.375% | | 1,635,000 | 1,732,139 |
| Duke Energy Progress, Inc. |
| 08/15/45 | 4.200% | | 1,505,000 | 1,551,989 |
| E.ON International Finance BV(b) |
| 04/30/38 | 6.650% | | 1,885,000 | 2,322,682 |
| Emera, Inc.(a) |
| Subordinated |
| 06/15/76 | 6.750% | | 15,095,000 | 16,682,994 |
| Exelon Corp. |
| 04/15/46 | 4.450% | | 1,815,000 | 1,821,182 |
| FPL Energy National Wind LLC(b) |
| 03/10/24 | 5.608% | | 190,078 | 190,078 |
| Jersey Central Power & Light Co. |
| 06/01/37 | 6.150% | | 1,235,000 | 1,444,508 |
| NextEra Energy Capital Holdings, Inc.(a) |
| Junior Subordinated |
| 09/01/67 | 7.300% | | 3,695,000 | 3,713,253 |
| NRG Energy, Inc. |
| 07/15/22 | 6.250% | | 355,000 | 361,678 |
| 05/01/24 | 6.250% | | 180,000 | 179,370 |
| NRG Yield Operating LLC |
| 08/15/24 | 5.375% | | 565,000 | 577,712 |
| NRG Yield Operating LLC(b) |
| 09/15/26 | 5.000% | | 26,000 | 25,480 |
| Pacific Gas & Electric Co. |
| 06/15/23 | 3.250% | | 3,567,000 | 3,668,117 |
| 03/01/26 | 2.950% | | 2,470,000 | 2,441,449 |
| 03/01/34 | 6.050% | | 945,000 | 1,187,401 |
| Pattern Energy Group, Inc.(b) |
| 02/01/24 | 5.875% | | 402,000 | 412,553 |
| Southern Co. (The) |
| 07/01/26 | 3.250% | | 6,593,000 | 6,417,145 |
| 07/01/36 | 4.250% | | 1,275,000 | 1,259,623 |
| 07/01/46 | 4.400% | | 1,745,000 | 1,736,003 |
| Toledo Edison Co. (The) |
| 05/15/37 | 6.150% | | 1,886,000 | 2,307,468 |
| TransAlta Corp. |
| 06/03/17 | 1.900% | | 6,929,000 | 6,929,327 |
| Total | 78,667,997 |
| Finance Companies 0.3% |
| HSBC Finance Corp. |
| Subordinated |
| 01/15/21 | 6.676% | | 4,809,000 | 5,463,452 |
| Corporate Bonds & Notes (continued) |
| Issuer | Coupon
Rate | | Principal
Amount ($) | Value ($) |
| iStar, Inc. |
| 04/01/22 | 6.000% | | 130,000 | 133,250 |
| Navient Corp. |
| 06/15/18 | 8.450% | | 171,000 | 182,329 |
| 06/15/22 | 6.500% | | 402,000 | 415,567 |
| OneMain Financial Holdings LLC(b) |
| 12/15/21 | 7.250% | | 514,000 | 534,617 |
| Park Aerospace Holdings Ltd.(b) |
| 08/15/22 | 5.250% | | 192,000 | 202,800 |
| Provident Funding Associates LP/Finance Corp.(b) |
| 06/15/21 | 6.750% | | 352,000 | 360,800 |
| Quicken Loans, Inc.(b) |
| 05/01/25 | 5.750% | | 297,000 | 299,970 |
| Total | 7,592,785 |
| Food and Beverage 0.5% |
| Anheuser-Busch InBev Finance, Inc. |
| 02/01/26 | 3.650% | | 3,282,000 | 3,344,460 |
| 02/01/46 | 4.900% | | 2,925,000 | 3,195,425 |
| B&G Foods, Inc. |
| 04/01/25 | 5.250% | | 105,000 | 107,497 |
| Chobani LLC/Finance Corp., Inc.(b) |
| 04/15/25 | 7.500% | | 149,000 | 153,656 |
| ConAgra Foods, Inc. |
| 01/25/23 | 3.200% | | 3,549,000 | 3,595,510 |
| FAGE International SA/USA Dairy Industry, Inc.(b) |
| 08/15/26 | 5.625% | | 278,000 | 282,865 |
| Lamb Weston Holdings, Inc.(b) |
| 11/01/24 | 4.625% | | 172,000 | 177,590 |
| 11/01/26 | 4.875% | | 175,000 | 180,469 |
| Post Holdings, Inc.(b) |
| 08/15/26 | 5.000% | | 529,000 | 526,355 |
| 03/01/27 | 5.750% | | 198,000 | 205,672 |
| Total | 11,769,499 |
| Gaming 0.1% |
| Boyd Gaming Corp. |
| 05/15/23 | 6.875% | | 198,000 | 213,097 |
| International Game Technology PLC(b) |
| 02/15/22 | 6.250% | | 508,000 | 553,720 |
| Isle of Capri Casinos LLC(b) |
| 04/01/25 | 6.000% | | 83,000 | 85,801 |
| Jack Ohio Finance LLC/1 Corp.(b) |
| 11/15/21 | 6.750% | | 209,000 | 218,405 |
| MGM Growth Properties Operating Partnership LP/Finance Co-Issuer, Inc. |
| 05/01/24 | 5.625% | | 306,000 | 330,097 |
| 09/01/26 | 4.500% | | 303,000 | 301,864 |
The accompanying Notes to Financial Statements are an integral part of this statement.
| 16 | Columbia Total Return Bond Fund | Annual Report 2017 |
Portfolio of Investments (continued)
April 30, 2017
| Corporate Bonds & Notes (continued) |
| Issuer | Coupon
Rate | | Principal
Amount ($) | Value ($) |
| MGM Resorts International |
| 03/15/23 | 6.000% | | 198,000 | 216,315 |
| 09/01/26 | 4.625% | | 330,000 | 329,175 |
| Penn National Gaming, Inc.(b) |
| 01/15/27 | 5.625% | | 127,000 | 127,953 |
| Rivers Pittsburgh Borrower LP/Finance Corp.(b) |
| 08/15/21 | 6.125% | | 185,000 | 187,004 |
| Scientific Games International, Inc.(b) |
| 01/01/22 | 7.000% | | 507,000 | 542,804 |
| Tunica-Biloxi Gaming Authority(b),(j) |
| 11/15/16 | 0.000% | | 577,000 | 201,950 |
| Total | 3,308,185 |
| Health Care 1.0% |
| Acadia Healthcare Co., Inc. |
| 03/01/24 | 6.500% | | 245,000 | 259,700 |
| Amsurg Corp. |
| 07/15/22 | 5.625% | | 355,000 | 366,236 |
| Becton Dickinson and Co. |
| 12/15/24 | 3.734% | | 4,002,000 | 4,024,927 |
| Change Healthcare Holdings LLC/Finance, Inc.(b) |
| 03/01/25 | 5.750% | | 211,000 | 216,539 |
| CHS/Community Health Systems, Inc. |
| 02/01/22 | 6.875% | | 207,000 | 171,293 |
| 03/31/23 | 6.250% | | 461,000 | 469,067 |
| Express Scripts Holding Co. |
| 07/15/46 | 4.800% | | 6,614,000 | 6,429,390 |
| HCA, Inc. |
| 04/15/25 | 5.250% | | 1,358,000 | 1,459,429 |
| Hill-Rom Holdings, Inc.(b) |
| 02/15/25 | 5.000% | | 218,000 | 220,725 |
| MEDNAX, Inc.(b) |
| 12/01/23 | 5.250% | | 246,000 | 251,535 |
| Memorial Sloan-Kettering Cancer Center |
| 07/01/52 | 4.125% | | 9,530,000 | 9,376,233 |
| MPH Acquisition Holdings LLC(b) |
| 06/01/24 | 7.125% | | 404,000 | 434,300 |
| Quintiles IMS, Inc.(b) |
| 10/15/26 | 5.000% | | 531,000 | 541,620 |
| Sterigenics-Nordion Holdings LLC(b) |
| 05/15/23 | 6.500% | | 348,000 | 358,440 |
| Team Health Holdings, Inc.(b) |
| 02/01/25 | 6.375% | | 185,000 | 178,987 |
| Tenet Healthcare Corp. |
| 04/01/21 | 4.500% | | 126,000 | 125,843 |
| 04/01/22 | 8.125% | | 202,000 | 205,030 |
| Corporate Bonds & Notes (continued) |
| Issuer | Coupon
Rate | | Principal
Amount ($) | Value ($) |
| Tenet Healthcare Corp.(b) |
| 01/01/22 | 7.500% | | 218,000 | 233,260 |
| Total | 25,322,554 |
| Healthcare Insurance 0.0% |
| Centene Corp. |
| 02/15/24 | 6.125% | | 204,000 | 219,810 |
| 01/15/25 | 4.750% | | 232,000 | 235,770 |
| Molina Healthcare, Inc. |
| 11/15/22 | 5.375% | | 68,000 | 71,060 |
| WellCare Health Plans, Inc. |
| 04/01/25 | 5.250% | | 264,000 | 274,560 |
| Total | 801,200 |
| Home Construction 0.8% |
| CalAtlantic Group, Inc. |
| 11/15/24 | 5.875% | | 338,000 | 363,350 |
| 06/01/26 | 5.250% | | 2,000 | 2,055 |
| D.R. Horton, Inc. |
| 05/15/17 | 4.750% | | 5,210,000 | 5,211,815 |
| Lennar Corp. |
| 12/15/17 | 4.750% | | 1,560,000 | 1,573,650 |
| 04/30/24 | 4.500% | | 203,000 | 205,030 |
| Meritage Homes Corp. |
| 04/01/22 | 7.000% | | 318,000 | 360,930 |
| Taylor Morrison Communities, Inc./Holdings II(b) |
| 04/15/23 | 5.875% | | 246,000 | 261,990 |
| Toll Brothers Finance Corp. |
| 10/15/17 | 8.910% | | 10,415,000 | 10,727,450 |
| Total | 18,706,270 |
| Independent Energy 0.6% |
| Anadarko Petroleum Corp. |
| 09/15/36 | 6.450% | | 514,000 | 609,135 |
| Callon Petroleum Co.(b) |
| 10/01/24 | 6.125% | | 135,000 | 141,413 |
| Carrizo Oil & Gas, Inc. |
| 04/15/23 | 6.250% | | 367,000 | 369,753 |
| Chesapeake Energy Corp.(b) |
| 01/15/25 | 8.000% | | 223,000 | 220,491 |
| Continental Resources, Inc. |
| 04/15/23 | 4.500% | | 366,000 | 360,510 |
| 06/01/24 | 3.800% | | 3,404,000 | 3,199,760 |
| CrownRock LP/Finance, Inc.(b) |
| 02/15/23 | 7.750% | | 747,000 | 799,290 |
| Denbury Resources, Inc.(b) |
| 05/15/21 | 9.000% | | 201,000 | 212,055 |
The accompanying Notes to Financial Statements are an integral part of this statement.
Columbia Total Return Bond Fund | Annual Report 2017
| 17 |
Portfolio of Investments (continued)
April 30, 2017
| Corporate Bonds & Notes (continued) |
| Issuer | Coupon
Rate | | Principal
Amount ($) | Value ($) |
| Diamondback Energy, Inc.(b) |
| 05/31/25 | 5.375% | | 727,000 | 752,445 |
| Extraction Oil & Gas Holdings LLC/Finance Corp.(b) |
| 07/15/21 | 7.875% | | 513,000 | 537,367 |
| Halcon Resources Corp.(b) |
| 02/15/25 | 6.750% | | 397,000 | 381,120 |
| Laredo Petroleum, Inc. |
| 03/15/23 | 6.250% | | 357,000 | 360,570 |
| MEG Energy Corp.(b) |
| 01/15/25 | 6.500% | | 109,000 | 107,638 |
| Newfield Exploration Co. |
| 07/01/24 | 5.625% | | 174,000 | 183,897 |
| Oasis Petroleum, Inc. |
| 01/15/23 | 6.875% | | 43,000 | 43,430 |
| Parsley Energy LLC/Finance Corp.(b) |
| 01/15/25 | 5.375% | | 111,000 | 112,110 |
| 08/15/25 | 5.250% | | 808,000 | 814,060 |
| PDC Energy, Inc.(b) |
| 09/15/24 | 6.125% | | 414,000 | 424,350 |
| Ras Laffan Liquefied Natural Gas Co., Ltd. II(b) |
| 09/30/20 | 5.298% | | 2,447,965 | 2,573,424 |
| RSP Permian, Inc.(b) |
| 01/15/25 | 5.250% | | 711,000 | 721,665 |
| SM Energy Co. |
| 09/15/26 | 6.750% | | 705,000 | 710,287 |
| Whiting Petroleum Corp. |
| 03/15/21 | 5.750% | | 175,000 | 174,125 |
| 04/01/23 | 6.250% | | 355,000 | 355,000 |
| WPX Energy, Inc. |
| 01/15/22 | 6.000% | | 534,000 | 542,010 |
| Total | 14,705,905 |
| Integrated Energy 0.8% |
| BP Capital Markets PLC |
| 01/16/27 | 3.017% | | 3,545,000 | 3,467,857 |
| Cenovus Energy, Inc.(b) |
| 04/15/27 | 4.250% | | 2,275,000 | 2,256,575 |
| 06/15/37 | 5.250% | | 5,490,000 | 5,360,678 |
| Cenovus Energy, Inc. |
| 11/15/39 | 6.750% | | 8,385,000 | 9,455,454 |
| Total | 20,540,564 |
| Leisure 0.0% |
| AMC Entertainment Holdings, Inc.(b) |
| 05/15/27 | 6.125% | | 83,000 | 84,764 |
| Cedar Fair LP/Canada’s Wonderland Co./Magnum Management Corp./Millenium Operations LLC(b) |
| 04/15/27 | 5.375% | | 157,000 | 162,283 |
| Corporate Bonds & Notes (continued) |
| Issuer | Coupon
Rate | | Principal
Amount ($) | Value ($) |
| Live Nation Entertainment, Inc.(b) |
| 11/01/24 | 4.875% | | 388,000 | 390,910 |
| LTF Merger Sub, Inc.(b) |
| 06/15/23 | 8.500% | | 167,000 | 177,437 |
| Silversea Cruise Finance Ltd.(b) |
| 02/01/25 | 7.250% | | 165,000 | 174,900 |
| Total | 990,294 |
| Life Insurance 1.0% |
| Five Corners Funding Trust(b) |
| 11/15/23 | 4.419% | | 3,290,000 | 3,535,809 |
| Massachusetts Mutual Life Insurance Co.(b) |
| Subordinated |
| 04/15/65 | 4.500% | | 1,095,000 | 1,061,289 |
| MetLife, Inc.(a),(b) |
| Junior Subordinated |
| 04/08/68 | 9.250% | | 9,153,000 | 13,168,879 |
| Prudential Financial, Inc. |
| 12/01/17 | 6.000% | | 83,000 | 85,088 |
| Teachers Insurance & Annuity Association of America(b) |
| Subordinated |
| 09/15/44 | 4.900% | | 1,695,000 | 1,863,088 |
| Voya Financial, Inc. |
| 06/15/26 | 3.650% | | 3,012,000 | 2,999,877 |
| 06/15/46 | 4.800% | | 1,858,000 | 1,880,987 |
| Total | 24,595,017 |
| Lodging 0.0% |
| Hilton Domestic Operating Co., Inc.(b) |
| 09/01/24 | 4.250% | | 397,000 | 399,978 |
| Playa Resorts Holding BV(b) |
| 08/15/20 | 8.000% | | 260,000 | 273,325 |
| Total | 673,303 |
| Media and Entertainment 0.4% |
| 21st Century Fox America, Inc. |
| 03/15/33 | 6.550% | | 1,830,000 | 2,250,843 |
| 03/01/37 | 6.150% | | 1,610,000 | 1,925,785 |
| AMC Networks, Inc. |
| 04/01/24 | 5.000% | | 107,000 | 108,407 |
| Match Group, Inc. |
| 06/01/24 | 6.375% | | 334,000 | 363,642 |
| MDC Partners, Inc.(b) |
| 05/01/24 | 6.500% | | 446,000 | 434,850 |
| Netflix, Inc.(b) |
| 11/15/26 | 4.375% | | 905,000 | 891,425 |
| Nielsen Luxembourg SARL(b) |
| 02/01/25 | 5.000% | | 362,000 | 362,453 |
The accompanying Notes to Financial Statements are an integral part of this statement.
| 18 | Columbia Total Return Bond Fund | Annual Report 2017 |
Portfolio of Investments (continued)
April 30, 2017
| Corporate Bonds & Notes (continued) |
| Issuer | Coupon
Rate | | Principal
Amount ($) | Value ($) |
| Outfront Media Capital LLC/Corp. |
| 03/15/25 | 5.875% | | 406,000 | 429,345 |
| Univision Communications, Inc.(b) |
| 02/15/25 | 5.125% | | 186,000 | 185,303 |
| Viacom, Inc. |
| 03/15/43 | 4.375% | | 1,825,000 | 1,623,637 |
| Total | 8,575,690 |
| Metals and Mining 0.4% |
| ArcelorMittal (a) |
| 03/01/41 | 7.500% | | 1,646,000 | 1,851,750 |
| BHP Billiton Finance USA Ltd.(a),(b) |
| Junior Subordinated |
| 10/19/75 | 6.750% | | 4,335,000 | 4,909,387 |
| Constellium NV(b) |
| 05/15/24 | 5.750% | | 571,000 | 535,313 |
| First Quantum Minerals Ltd.(b) |
| 04/01/25 | 7.500% | | 150,000 | 153,000 |
| Freeport-McMoRan, Inc. |
| 11/14/24 | 4.550% | | 655,000 | 615,372 |
| Grinding Media, Inc./MC Canada, Inc.(b) |
| 12/15/23 | 7.375% | | 284,000 | 302,971 |
| HudBay Minerals, Inc.(b) |
| 01/15/25 | 7.625% | | 297,000 | 318,161 |
| Novelis Corp.(b) |
| 09/30/26 | 5.875% | | 525,000 | 539,438 |
| Teck Resources Ltd. |
| 07/15/41 | 6.250% | | 523,000 | 554,380 |
| Total | 9,779,772 |
| Midstream 1.8% |
| APT Pipelines Ltd.(b) |
| 07/15/27 | 4.250% | | 3,580,000 | 3,661,653 |
| El Paso LLC |
| 01/15/32 | 7.750% | | 1,680,000 | 2,139,414 |
| Energy Transfer Equity LP |
| 06/01/27 | 5.500% | | 686,000 | 737,450 |
| Enterprise Products Operating LLC(a) |
| Junior Subordinated |
| 08/01/66 | 4.742% | | 6,928,000 | 6,928,000 |
| Kinder Morgan Energy Partners LP |
| 01/15/38 | 6.950% | | 1,345,000 | 1,581,832 |
| 11/15/40 | 7.500% | | 1,555,000 | 1,912,308 |
| Kinder Morgan, Inc. |
| 06/01/45 | 5.550% | | 1,630,000 | 1,726,476 |
| NuStar Logistics LP |
| 04/28/27 | 5.625% | | 159,000 | 163,974 |
| Corporate Bonds & Notes (continued) |
| Issuer | Coupon
Rate | | Principal
Amount ($) | Value ($) |
| Plains All American Pipeline LP/Finance Corp. |
| 01/31/23 | 2.850% | | 2,055,000 | 1,997,869 |
| 10/15/23 | 3.850% | | 1,715,000 | 1,731,121 |
| 06/01/42 | 5.150% | | 2,134,000 | 2,071,834 |
| 02/15/45 | 4.900% | | 380,000 | 365,892 |
| Targa Resources Partners LP/Finance Corp. |
| 03/15/24 | 6.750% | | 74,000 | 80,660 |
| Targa Resources Partners LP/Finance Corp.(b) |
| 02/01/27 | 5.375% | | 626,000 | 654,170 |
| Tesoro Logistics LP/Finance Corp. |
| 05/01/24 | 6.375% | | 116,000 | 126,730 |
| 01/15/25 | 5.250% | | 567,000 | 601,729 |
| Transcanada Trust(a) |
| Junior Subordinated |
| 08/15/76 | 5.875% | | 9,128,000 | 9,812,600 |
| Transcontinental Gas Pipe Line Co., LLC |
| 02/01/26 | 7.850% | | 2,915,000 | 3,776,654 |
| Williams Partners LP |
| 04/15/40 | 6.300% | | 2,615,000 | 3,010,432 |
| Total | 43,080,798 |
| Natural Gas 0.6% |
| KeySpan Corp. |
| 11/15/30 | 8.000% | | 1,160,000 | 1,562,696 |
| NiSource Finance Corp. |
| 02/15/23 | 3.850% | | 3,305,000 | 3,409,286 |
| Sempra Energy |
| 11/15/20 | 2.850% | | 5,135,000 | 5,213,217 |
| 11/15/25 | 3.750% | | 3,620,000 | 3,715,032 |
| Total | 13,900,231 |
| Oil Field Services 0.8% |
| Noble Holding International Ltd.(a) |
| 03/16/18 | 5.750% | | 18,055,000 | 18,257,938 |
| SESI LLC |
| 12/15/21 | 7.125% | | 136,000 | 137,360 |
| Trinidad Drilling Ltd.(b) |
| 02/15/25 | 6.625% | | 126,000 | 126,945 |
| Weatherford International Ltd.(b) |
| 02/15/24 | 9.875% | | 463,000 | 539,395 |
| Weatherford International Ltd. |
| 08/01/36 | 6.500% | | 240,000 | 226,800 |
| Total | 19,288,438 |
| Other Industry 0.3% |
| Booz Allen Hamilton, Inc.(b) |
| 05/01/25 | 5.125% | | 26,000 | 26,455 |
The accompanying Notes to Financial Statements are an integral part of this statement.
Columbia Total Return Bond Fund | Annual Report 2017
| 19 |
Portfolio of Investments (continued)
April 30, 2017
| Corporate Bonds & Notes (continued) |
| Issuer | Coupon
Rate | | Principal
Amount ($) | Value ($) |
| Massachusetts Institute of Technology |
| 07/01/14 | 4.678% | | 2,869,000 | 3,013,081 |
| 07/01/16 | 3.885% | | 1,510,000 | 1,346,037 |
| President and Fellows of Harvard College |
| 07/15/46 | 3.150% | | 1,454,000 | 1,334,799 |
| 07/15/56 | 3.300% | | 2,495,000 | 2,309,996 |
| Total | 8,030,368 |
| Other REIT 0.0% |
| CyrusOne LP/Finance Corp.(b) |
| 03/15/24 | 5.000% | | 141,000 | 144,878 |
| 03/15/27 | 5.375% | | 142,000 | 146,260 |
| Total | 291,138 |
| Packaging 0.1% |
| ARD Finance SA PIK(b) |
| 09/15/23 | 7.125% | | 169,000 | 175,338 |
| Ardagh Packaging Finance PLC/Holdings USA, Inc.(b) |
| 02/15/25 | 6.000% | | 501,000 | 517,909 |
| Berry Plastics Corp. |
| 10/15/22 | 6.000% | | 342,000 | 363,375 |
| Novolex (b) |
| 01/15/25 | 6.875% | | 158,000 | 162,740 |
| Reynolds Group Issuer, Inc./LLC(b) |
| 07/15/24 | 7.000% | | 409,000 | 440,186 |
| Signode Industrial Group Luxembourg SA/US, Inc.(b) |
| 05/01/22 | 6.375% | | 148,000 | 152,456 |
| Total | 1,812,004 |
| Pharmaceuticals 1.2% |
| Actavis Funding SCS |
| 03/15/35 | 4.550% | | 1,640,000 | 1,651,508 |
| Actavis, Inc. |
| 10/01/42 | 4.625% | | 4,162,000 | 4,107,336 |
| Amgen, Inc. |
| 05/01/45 | 4.400% | | 1,805,000 | 1,781,205 |
| 06/15/48 | 4.563% | | 3,663,000 | 3,683,260 |
| Endo Dac/Finance LLC/Finco, Inc.(a),(b) |
| 02/01/25 | 6.000% | | 168,000 | 141,876 |
| Forest Laboratories LLC(b) |
| 02/01/19 | 4.375% | | 6,608,000 | 6,829,983 |
| Jaguar Holding Co. II/Pharmaceutical Product Development LLC(b) |
| 08/01/23 | 6.375% | | 511,000 | 532,717 |
| Johnson & Johnson |
| 12/05/33 | 4.375% | | 1,798,000 | 1,995,543 |
| 03/03/37 | 3.625% | | 2,815,000 | 2,840,428 |
| Mallinckrodt International Finance SA/CB LLC(b) |
| 04/15/25 | 5.500% | | 118,000 | 107,380 |
| Corporate Bonds & Notes (continued) |
| Issuer | Coupon
Rate | | Principal
Amount ($) | Value ($) |
| Shire Acquisitions Investments Ireland DAC |
| 09/23/23 | 2.875% | | 4,670,000 | 4,567,377 |
| Valeant Pharmaceuticals International, Inc.(b) |
| 03/15/22 | 6.500% | | 68,000 | 69,615 |
| 03/15/24 | 7.000% | | 269,000 | 274,380 |
| 04/15/25 | 6.125% | | 1,238,000 | 913,953 |
| Total | 29,496,561 |
| Property & Casualty 0.9% |
| Chubb Corp. (The)(a) |
| Junior Subordinated |
| 04/15/37 | 3.408% | | 5,405,000 | 5,350,950 |
| HUB International Ltd.(b) |
| 10/01/21 | 7.875% | | 674,000 | 706,116 |
| Liberty Mutual Group, Inc.(b) |
| 05/01/22 | 4.950% | | 4,055,000 | 4,440,574 |
| 05/01/42 | 6.500% | | 1,150,000 | 1,450,178 |
| Loews Corp. |
| 04/01/26 | 3.750% | | 6,114,000 | 6,328,552 |
| 05/15/43 | 4.125% | | 2,975,000 | 2,899,834 |
| Total | 21,176,204 |
| Railroads 0.5% |
| BNSF Funding Trust I(a) |
| Junior Subordinated |
| 12/15/55 | 6.613% | | 582,000 | 663,480 |
| CSX Corp.(c) |
| 06/01/27 | 3.250% | | 3,120,000 | 3,129,631 |
| CSX Corp. |
| 11/01/66 | 4.250% | | 1,830,000 | 1,715,365 |
| Kansas City Southern |
| 05/15/23 | 3.000% | | 3,000,000 | 2,971,389 |
| 08/15/45 | 4.950% | | 3,351,000 | 3,448,598 |
| Total | 11,928,463 |
| Restaurants 0.0% |
| KFC Holding Co./Pizza Hut Holdings LLC/Taco Bell of America LLC(b) |
| 06/01/26 | 5.250% | | 372,000 | 381,300 |
| Retail REIT 0.1% |
| Kimco Realty Corp. |
| 06/01/23 | 3.125% | | 3,363,000 | 3,345,321 |
| Retailers 0.3% |
| CVS Health Corp. |
| 12/01/22 | 4.750% | | 4,790,000 | 5,242,257 |
| CVS Pass-Through Trust(b) |
| 08/11/36 | 4.163% | | 2,453,317 | 2,497,638 |
| L Brands, Inc. |
| 11/01/35 | 6.875% | | 225,000 | 221,850 |
The accompanying Notes to Financial Statements are an integral part of this statement.
| 20 | Columbia Total Return Bond Fund | Annual Report 2017 |
Portfolio of Investments (continued)
April 30, 2017
| Corporate Bonds & Notes (continued) |
| Issuer | Coupon
Rate | | Principal
Amount ($) | Value ($) |
| Penske Automotive Group, Inc. |
| 12/01/24 | 5.375% | | 248,000 | 249,860 |
| Rite Aid Corp. |
| Junior Subordinated |
| 02/15/27 | 7.700% | | 234,000 | 252,720 |
| Total | 8,464,325 |
| Technology 1.4% |
| Broadcom Corp./Cayman Finance Ltd.(b) |
| 01/15/27 | 3.875% | | 3,010,000 | 3,054,388 |
| Camelot Finance SA(b) |
| 10/15/24 | 7.875% | | 389,000 | 417,203 |
| Cisco Systems, Inc.(a) |
| 09/20/19 | 1.492% | | 7,345,000 | 7,384,582 |
| Dell International LLC/EMC Corp.(b) |
| 06/01/19 | 3.480% | | 5,260,000 | 5,379,917 |
| 06/15/23 | 5.450% | | 5,150,000 | 5,557,715 |
| 06/15/26 | 6.020% | | 1,050,000 | 1,153,245 |
| Equinix, Inc. |
| 01/15/26 | 5.875% | | 382,000 | 411,605 |
| 05/15/27 | 5.375% | | 361,000 | 377,169 |
| First Data Corp.(b) |
| 12/01/23 | 7.000% | | 1,011,000 | 1,083,994 |
| Gartner, Inc.(b) |
| 04/01/25 | 5.125% | | 235,000 | 243,225 |
| Informatica LLC(b) |
| 07/15/23 | 7.125% | | 221,000 | 217,409 |
| Oracle Corp. |
| 07/15/26 | 2.650% | | 3,785,000 | 3,653,600 |
| 07/15/36 | 3.850% | | 1,470,000 | 1,467,729 |
| 07/15/46 | 4.000% | | 1,950,000 | 1,905,661 |
| PTC, Inc. |
| 05/15/24 | 6.000% | | 335,000 | 358,450 |
| Qualitytech LP/Finance Corp. |
| 08/01/22 | 5.875% | | 455,000 | 468,650 |
| Riverbed Technology, Inc.(b) |
| 03/01/23 | 8.875% | | 63,000 | 64,890 |
| Sensata Technologies UK Financing Co. PLC(b) |
| 02/15/26 | 6.250% | | 237,000 | 256,553 |
| Solera LLC/Finance, Inc.(b) |
| 03/01/24 | 10.500% | | 320,000 | 365,200 |
| Symantec Corp.(b) |
| 04/15/25 | 5.000% | | 348,000 | 359,745 |
| Tempo Acquisition LLC/Finance Corp.(b),(c) |
| 06/01/25 | 6.750% | | 93,000 | 95,558 |
| Total | 34,276,488 |
| Corporate Bonds & Notes (continued) |
| Issuer | Coupon
Rate | | Principal
Amount ($) | Value ($) |
| Transportation Services 0.4% |
| Avis Budget Car Rental LLC/Finance, Inc.(b) |
| 03/15/25 | 5.250% | | 271,000 | 255,417 |
| ERAC U.S.A. Finance LLC(b) |
| 11/01/23 | 2.700% | | 3,800,000 | 3,667,175 |
| 12/01/26 | 3.300% | | 3,455,000 | 3,351,561 |
| Hertz Corp. (The) |
| 04/01/18 | 4.250% | | 1,295,000 | 1,311,187 |
| Hertz Corp. (The)(b) |
| 10/15/24 | 5.500% | | 277,000 | 238,913 |
| Total | 8,824,253 |
| Wireless 0.5% |
| SBA Communications Corp.(b) |
| 09/01/24 | 4.875% | | 744,000 | 750,510 |
| SFR Group SA(b) |
| 05/01/26 | 7.375% | | 705,000 | 741,131 |
| Sprint Communications, Inc.(b) |
| 03/01/20 | 7.000% | | 266,000 | 290,605 |
| Sprint Corp. |
| 06/15/24 | 7.125% | | 476,000 | 519,140 |
| 02/15/25 | 7.625% | | 661,000 | 737,841 |
| Sprint Spectrum Co. I/II/III LLC(b) |
| 09/20/21 | 3.360% | | 9,295,000 | 9,376,796 |
| T-Mobile USA, Inc. |
| 01/15/26 | 6.500% | | 709,000 | 786,104 |
| Total | 13,202,127 |
| Wirelines 1.4% |
| AT&T, Inc. |
| 03/01/37 | 5.250% | | 2,720,000 | 2,789,632 |
| 03/15/42 | 5.150% | | 2,265,000 | 2,244,103 |
| 06/15/44 | 4.800% | | 1,555,000 | 1,470,946 |
| 03/01/47 | 5.450% | | 2,305,000 | 2,379,468 |
| CenturyLink, Inc. |
| 12/01/23 | 6.750% | | 311,000 | 333,159 |
| 04/01/25 | 5.625% | | 230,000 | 224,538 |
| Deutsche Telekom International Finance BV |
| 06/01/32 | 9.250% | | 1,100,000 | 1,728,391 |
| Frontier Communications Corp. |
| 09/15/25 | 11.000% | | 966,000 | 930,982 |
| Level 3 Financing, Inc. |
| 05/01/25 | 5.375% | | 246,000 | 256,455 |
| 03/15/26 | 5.250% | | 226,000 | 233,081 |
| Telecom Italia SpA(b) |
| 05/30/24 | 5.303% | | 250,000 | 257,500 |
The accompanying Notes to Financial Statements are an integral part of this statement.
Columbia Total Return Bond Fund | Annual Report 2017
| 21 |
Portfolio of Investments (continued)
April 30, 2017
| Corporate Bonds & Notes (continued) |
| Issuer | Coupon
Rate | | Principal
Amount ($) | Value ($) |
| Verizon Communications, Inc. |
| 09/15/23 | 5.150% | | 5,029,000 | 5,565,554 |
| 03/16/37 | 5.250% | | 2,435,000 | 2,522,726 |
| Zayo Group LLC/Capital, Inc. |
| 04/01/23 | 6.000% | | 518,000 | 552,318 |
| 05/15/25 | 6.375% | | 1,917,000 | 2,072,756 |
| Zayo Group LLC/Capital, Inc.(b) |
| 01/15/27 | 5.750% | | 9,714,000 | 10,308,982 |
| Total | 33,870,591 |
Total Corporate Bonds & Notes
(Cost $780,094,744) | 783,645,482 |
|
| Foreign Government Obligations(k) 1.1% |
| | | | |
| Chile 0.1% |
| Chile Government International Bond |
| 10/30/22 | 2.250% | | 2,900,000 | 2,857,950 |
| Colombia 0.1% |
| Colombia Government International Bond |
| 01/18/41 | 6.125% | | 1,697,000 | 1,960,301 |
| France 0.3% |
| Electricite de France SA(b) |
| 10/13/55 | 5.250% | | 7,276,000 | 7,421,607 |
| Mexico 0.3% |
| Mexico Government International Bond |
| 03/15/22 | 3.625% | | 4,114,000 | 4,241,534 |
| 03/08/44 | 4.750% | | 1,537,000 | 1,516,251 |
| Petroleos Mexicanos(b) |
| 03/13/27 | 6.500% | | 2,241,000 | 2,425,882 |
| Total | 8,183,667 |
| Panama 0.1% |
| Panama Government International Bond |
| 01/26/36 | 6.700% | | 1,635,000 | 2,113,238 |
| Peru 0.1% |
| Peruvian Government International Bond |
| 03/14/37 | 6.550% | | 1,725,000 | 2,259,750 |
| Philippines 0.0% |
| Philippine Government International Bond |
| 10/23/34 | 6.375% | | 525,000 | 700,260 |
| Qatar 0.1% |
| Nakilat, Inc.(b) |
| 12/31/33 | 6.067% | | 2,293,000 | 2,697,256 |
Total Foreign Government Obligations
(Cost $26,241,719) | 28,194,029 |
|
| Municipal Bonds 1.8% |
| Issue Description | Coupon
Rate | | Principal
Amount ($) | Value ($) |
| Higher Education 0.3% |
| University of Texas System (The) |
| Revenue Bonds |
| Series 2017J |
| 08/15/25 | 5.000% | | 2,765,000 | 3,388,591 |
| Series 2017J |
| 08/15/26 | 5.000% | | 2,485,000 | 3,074,218 |
| Total | 6,462,809 |
| Local General Obligation 0.4% |
| City of Chicago |
| Unlimited General Obligation Bonds |
Taxable Project
Series 2011-C1 |
| 01/01/35 | 7.781% | | 1,090,000 | 1,122,013 |
| Unlimited General Obligation Refunding Bonds |
Taxable
Series 2014B |
| 01/01/44 | 6.314% | | 1,405,000 | 1,240,643 |
| Unlimited General Obligation Taxable Bonds |
| Series 2015B |
| 01/01/33 | 7.375% | | 835,000 | 840,236 |
| City of New York |
| Unlimited General Obligation Bonds |
| Series 2016B-1 |
| 12/01/41 | 5.000% | | 1,500,000 | 1,709,475 |
| Los Angeles Unified School District |
| Unlimited General Obligation Bonds |
Taxable Build America Bonds
Series 2009 |
| 07/01/34 | 5.750% | | 3,500,000 | 4,354,385 |
| Total | 9,266,752 |
| Sales Tax 0.3% |
| Central Puget Sound Regional Transit Authority |
| Revenue Bonds |
Green Bonds
Series 2016S-1 |
| 11/01/46 | 5.000% | | 1,815,000 | 2,321,330 |
| Puerto Rico Sales Tax Financing Corp.(l) |
| Revenue Bonds |
| 1st Senior Series 2009C |
| 08/01/57 | 5.750% | | 1,010,000 | 657,581 |
| Subordinated Revenue Bonds |
| 1st Series 2009A-1 |
| 08/01/43 | 5.250% | | 4,335,000 | 1,468,481 |
| 1st Series 2009B |
| 08/01/44 | 6.500% | | 1,020,000 | 365,925 |
The accompanying Notes to Financial Statements are an integral part of this statement.
| 22 | Columbia Total Return Bond Fund | Annual Report 2017 |
Portfolio of Investments (continued)
April 30, 2017
| Municipal Bonds (continued) |
| Issue Description | Coupon
Rate | | Principal
Amount ($) | Value ($) |
| 1st Series 2010C |
| 08/01/41 | 5.250% | | 5,075,000 | 1,693,781 |
| Total | 6,507,098 |
| Special Non Property Tax 0.2% |
| JobsOhio Beverage System |
| Taxable Revenue Bonds |
| Series 2013B |
| 01/01/35 | 4.532% | | 3,945,000 | 4,281,627 |
| State General Obligation 0.6% |
| State of Mississippi |
| Unlimited General Obligation Bonds |
| Series 2016B |
| 12/01/27 | 5.000% | | 865,000 | 1,062,185 |
| State of Texas |
| Unlimited General Obligation Refunding Bonds |
Transportation Commission Mobility Fund
Series 2017 |
| 10/01/33 | 5.000% | | 4,345,000 | 5,182,325 |
Transportation Commission Mobility Fund
Series 2017 |
| 10/01/34 | 5.000% | | 8,230,000 | 9,766,953 |
| Total | 16,011,463 |
| Water & Sewer 0.0% |
| City of Chicago Waterworks |
| Revenue Bonds |
Build America Bonds
Series 2010 |
| 11/01/40 | 6.742% | | 840,000 | 1,049,941 |
Total Municipal Bonds
(Cost $45,153,788) | 43,579,690 |
|
| Preferred Debt 1.2% |
| Issuer | Coupon
Rate | | Principal
Amount ($) | Value ($) |
| Banking 1.2% |
| M&T Bank Corp.(a) |
| 12/31/49 | 6.375% | | 7,423 | 7,939,158 |
| 12/31/49 | 6.375% | | 1,660 | 1,792,028 |
| State Street Corp.(a) |
| 12/31/49 | 5.350% | | 86,965 | 2,323,705 |
| 12/31/49 | 5.900% | | 64,890 | 1,826,005 |
| Wells Fargo & Co. |
| 12/31/49 | 7.500% | | 12,000 | 15,240,000 |
| Total | 29,120,896 |
| Preferred Debt (continued) |
| Issuer | Coupon
Rate | | Principal
Amount ($) | Value ($) |
| Property & Casualty 0.0% |
| Allstate Corp. (The)(a) |
| 01/15/53 | 5.100% | | 30,605 | 847,146 |
Total Preferred Debt
(Cost $28,059,662) | 29,968,042 |
|
| Residential Mortgage-Backed Securities - Agency 26.3% |
| | | | |
| Federal Home Loan Mortgage Corp. |
| 04/01/21 | 9.000% | | 728 | 735 |
03/01/22-
11/01/26 | 8.500% | | 63,134 | 70,731 |
08/01/24-
02/01/25 | 8.000% | | 53,788 | 59,442 |
10/01/28-
07/01/32 | 7.000% | | 725,915 | 837,563 |
10/01/31-
07/01/37 | 6.000% | | 2,110,312 | 2,444,314 |
04/01/33-
06/01/33 | 5.500% | | 1,557,170 | 1,777,157 |
01/01/46-
12/01/46 | 3.500% | | 38,145,850 | 39,305,319 |
04/01/46-
06/01/46 | 4.000% | | 36,158,207 | 38,094,241 |
| Federal Home Loan Mortgage Corp.(a),(g) |
| CMO Series 311 Class S1 |
| 08/15/43 | 4.956% | | 3,840,369 | 790,175 |
| CMO Series 4097 Class ST |
| 08/15/42 | 5.056% | | 2,696,890 | 513,600 |
| CMO Series 4620 Class AS |
| 11/15/42 | 1.766% | | 4,076,741 | 214,261 |
| CMO STRIPS Series 309 Class S4 |
| 08/15/43 | 4.976% | | 1,507,021 | 320,475 |
| Federal Home Loan Mortgage Corp.(g) |
| CMO Series 4120 Class IA |
| 10/15/42 | 3.500% | | 10,495,559 | 2,245,822 |
| CMO Series 4176 Class BI |
| 03/15/43 | 3.500% | | 3,400,676 | 615,698 |
| CMO Series 4182 Class DI |
| 05/15/39 | 3.500% | | 11,198,732 | 1,278,843 |
| Federal National Mortgage Association |
| 09/01/18 | 10.000% | | 4,419 | 4,472 |
| 04/01/23 | 8.500% | | 3,280 | 3,312 |
| 06/01/24 | 9.000% | | 12,259 | 13,171 |
| 01/01/31 | 2.500% | | 9,272,359 | 9,344,086 |
| 08/01/43 | 4.000% | | 11,581,136 | 12,271,480 |
02/01/25-
08/01/27 | 8.000% | | 100,764 | 114,016 |
03/01/26-
07/01/38 | 7.000% | | 2,207,956 | 2,580,838 |
04/01/27-
06/01/32 | 7.500% | | 198,209 | 224,761 |
The accompanying Notes to Financial Statements are an integral part of this statement.
Columbia Total Return Bond Fund | Annual Report 2017
| 23 |
Portfolio of Investments (continued)
April 30, 2017
| Residential Mortgage-Backed Securities - Agency (continued) |
| Issuer | Coupon
Rate | | Principal
Amount ($) | Value ($) |
05/01/29-
08/01/38 | 6.000% | | 12,521,106 | 14,273,777 |
12/01/30-
12/01/43 | 3.000% | | 38,827,965 | 39,321,531 |
03/01/33-
01/01/40 | 5.500% | | 5,235,213 | 5,900,274 |
08/01/40-
05/01/41 | 5.000% | | 12,977,740 | 14,237,627 |
10/01/40-
07/01/41 | 4.500% | | 8,245,899 | 8,907,276 |
05/01/43-
11/01/46 | 3.500% | | 64,383,593 | 66,548,980 |
| CMO Series 1988-4 Class Z |
| 03/25/18 | 9.250% | | 782 | 788 |
| Federal National Mortgage Association(c) |
| 05/16/32 | 2.500% | | 27,000,000 | 27,155,039 |
| 05/11/47 | 3.500% | | 63,000,000 | 64,779,259 |
| 05/11/47 | 4.000% | | 122,000,000 | 128,481,250 |
| 05/11/47 | 4.500% | | 14,000,000 | 15,060,937 |
05/16/32-
05/11/47 | 3.000% | | 105,000,000 | 106,279,609 |
| Federal National Mortgage Association(a) |
| 06/01/32 | 2.665% | | 3,613 | 3,625 |
| 07/01/37 | 5.964% | | 119,133 | 119,426 |
| Federal National Mortgage Association(m) |
| 02/01/46 | 3.500% | | 25,577,624 | 26,324,281 |
| Federal National Mortgage Association(g) |
| CMO Series 2012-118 Class BI |
| 12/25/39 | 3.500% | | 5,663,633 | 778,687 |
| CMO Series 2012-148 Class BI |
| 01/25/43 | 3.500% | | 14,704,443 | 3,002,130 |
| Federal National Mortgage Association(a),(g) |
| CMO Series 2013-101 Class CS |
| 10/25/43 | 4.909% | | 6,459,192 | 1,426,732 |
| CMO Series 2013-107 Class SB |
| 02/25/43 | 4.959% | | 6,557,798 | 1,494,562 |
| CMO Series 2014-93 Class ES |
| 01/25/45 | 5.159% | | 3,539,687 | 715,815 |
| CMO Series 2016-31 Class VS |
| 06/25/46 | 5.009% | | 3,643,570 | 603,985 |
| CMO Series 2016-37 Class SA |
| 06/25/46 | 4.859% | | 6,544,683 | 1,377,956 |
| CMO Series 2016-45 Class AS |
| 07/25/46 | 5.009% | | 5,632,478 | 1,349,254 |
| CMO Series 2016-50 Class GS |
| 08/25/46 | 4.959% | | 6,360,199 | 1,360,087 |
| CMO Series 2017-8 Class SB |
| 02/25/47 | 5.109% | | 3,835,688 | 675,167 |
| CMO Series 416 Class S1 |
| 11/25/42 | 5.109% | | 3,809,332 | 782,238 |
| Residential Mortgage-Backed Securities - Agency (continued) |
| Issuer | Coupon
Rate | | Principal
Amount ($) | Value ($) |
| Federal National Mortgage Association(n) |
| CMO STRIPS Series 43 Class 1 |
| 09/25/18 | 0.000% | | 456 | 451 |
| Government National Mortgage Association |
| 02/15/25 | 8.500% | | 19,100 | 21,904 |
| 01/15/30 | 7.000% | | 213,337 | 252,246 |
12/15/23-
07/20/28 | 7.500% | | 174,282 | 195,643 |
| Government National Mortgage Association(a) |
| 07/20/25 | 2.125% | | 18,612 | 19,155 |
| Government National Mortgage Association(g) |
| CMO Series 2014-184 Class CI |
| 11/16/41 | 3.500% | | 7,939,788 | 1,211,939 |
| CMO Series 2015-53 Class EI |
| 04/16/45 | 3.500% | | 2,088,489 | 401,615 |
Total Residential Mortgage-Backed Securities - Agency
(Cost $642,718,706) | 646,187,757 |
|
| Residential Mortgage-Backed Securities - Non-Agency 4.9% |
| | | | |
| Ajax Mortgage Loan Trust(b) |
| CMO Series 2016-C Class A |
| 10/25/57 | 4.000% | | 1,513,614 | 1,515,945 |
| American Mortgage Trust(a),(f) |
| Series 2093-3 Class 3A |
| 07/27/23 | 8.188% | | 2,369 | 1,436 |
| Angel Oak Mortgage Trust LLC(b) |
| Series 2015-1 |
| 11/25/45 | 4.500% | | 462,771 | 463,927 |
| 11/25/45 | 5.500% | | 1,500,000 | 1,496,481 |
| ASG Resecuritization Trust(a),(b) |
| CMO Series 2009-2 Class G70 |
| 05/24/36 | 3.238% | | 3,378,632 | 3,372,473 |
| CMO Series 2009-2 Class G75 |
| 05/24/36 | 3.238% | | 4,335,000 | 4,312,258 |
| Bayview Opportunity Master Fund IIA Trust(b) |
| Series 2016-RPL3 Class A1 |
| 07/28/31 | 3.475% | | 952,334 | 949,297 |
| Bayview Opportunity Master Fund IIIB Trust(b) |
| CMO Series 2016-RPL4 Class A1 |
| 07/28/18 | 3.475% | | 3,291,988 | 3,278,076 |
| Bayview Opportunity Master Fund IVA Trust(b) |
| Subordinated, CMO Series 2016-SPL1 Class B3 |
| 04/28/55 | 5.500% | | 1,000,000 | 1,001,044 |
| Bayview Opportunity Master Fund IVb Trust(b) |
| CMO Series 2017-NPL1 Class A1 |
| 01/28/32 | 3.598% | | 821,972 | 820,066 |
| Bayview Opportunity Master Fund Trust(b) |
| CMO Series 2016-LT1 Class A1 |
| 10/28/31 | 3.475% | | 1,093,783 | 1,088,008 |
The accompanying Notes to Financial Statements are an integral part of this statement.
| 24 | Columbia Total Return Bond Fund | Annual Report 2017 |
Portfolio of Investments (continued)
April 30, 2017
| Residential Mortgage-Backed Securities - Non-Agency (continued) |
| Issuer | Coupon
Rate | | Principal
Amount ($) | Value ($) |
| BCAP LLC Trust(a),(b) |
| CMO Series 2012-RR10 Class 9A1 |
| 10/26/35 | 3.134% | | 536,246 | 537,888 |
| CMO Series 2014-RR3 Class 3A1 |
| 07/26/36 | 1.052% | | 294,651 | 288,863 |
| Series 2010-RR11 Class 8A1 |
| 05/27/37 | 3.857% | | 2,985,688 | 2,985,160 |
| Series 2011-RR5 Class 11A4 |
| 05/28/36 | 1.132% | | 1,981,429 | 1,906,416 |
| BCAP LLC Trust(b) |
| CMO Series 2013-RR2 Class 7A1 |
| 07/26/36 | 3.000% | | 1,287,222 | 1,287,222 |
| CMO Series 2013-RR5 Class 1A1 |
| 10/26/36 | 3.500% | | 1,566,039 | 1,564,156 |
| CMO Series 2013-RR5 Class 3A1 |
| 09/26/36 | 3.500% | | 2,367,154 | 2,360,776 |
| Bellemeade Re II Ltd.(a),(b) |
| CMO Series 2016-1A Class M2A |
| 04/25/26 | 5.491% | | 722,174 | 727,185 |
| CAM Mortgage Trust(b) |
| CMO Series 2016-1 Class A |
| 01/15/56 | 4.000% | | 776,609 | 778,683 |
| Citigroup Mortgage Loan Trust, Inc.(a) |
| CMO Series 2005-WF2 Class MF1 |
| 08/25/35 | 5.227% | | 786,359 | 35,066 |
| Citigroup Mortgage Loan Trust, Inc.(a),(b) |
| CMO Series 2012-7 Class 12A1 |
| 03/25/36 | 3.093% | | 511,451 | 508,343 |
| CMO Series 2012-9 Class 1A1 |
| 02/20/36 | 3.179% | | 824,090 | 822,962 |
| CMO Series 2013-2 Class 1A1 |
| 11/25/37 | 3.139% | | 2,178,954 | 2,179,518 |
| CMO Series 2014-11 Class 3A3 |
| 09/25/36 | 1.142% | | 601,000 | 572,704 |
| CMO Series 2014-12 Class 3A1 |
| 10/25/35 | 3.478% | | 4,832,174 | 4,914,108 |
| CMO Series 2014-2 Class 3A3 |
| 08/25/37 | 1.122% | | 501,863 | 495,449 |
| CMO Series 2014-C Class A |
| 02/25/54 | 3.250% | | 1,018,277 | 992,673 |
| CMO Series 2015-A Class A4 |
| 06/25/58 | 4.250% | | 3,219,078 | 3,309,011 |
| CMO Series 2015-A Class B3 |
| 06/25/58 | 4.500% | | 957,169 | 894,355 |
| Series 2013-11 Class 3A3 |
| 09/25/34 | 3.083% | | 793,598 | 777,537 |
| Residential Mortgage-Backed Securities - Non-Agency (continued) |
| Issuer | Coupon
Rate | | Principal
Amount ($) | Value ($) |
| Citigroup Mortgage Loan Trust, Inc.(b),(g) |
| CMO Series 2015-A Class A1IO |
| 06/25/58 | 1.000% | | 15,479,312 | 392,017 |
| COLT LLC(a),(b) |
| CMO Series 15-1 Class A2 |
| 12/26/45 | 4.741% | | 446,964 | 453,816 |
| COLT Mortgage Loan Trust(b) |
| CMO Series 2016-1 Class A2 |
| 05/25/46 | 3.500% | | 594,557 | 594,978 |
| Contimortgage Home Equity Loan Trust |
| CMO Series 1996-4 Class A9 (NPFGC) |
| 01/15/28 | 6.880% | | 16,401 | 16,087 |
| Countrywide Home Equity Loan Trust |
| CMO Series 2007-S2 Class A3 (NPFGC) |
| 05/25/37 | 5.813% | | 889,727 | 889,051 |
| CMO Series 2007-S2 Class A6 (NPFGC) |
| 05/25/37 | 5.779% | | 693,238 | 690,779 |
| Credit Suisse Mortgage Capital Certificates(a),(b) |
| CMO Series 2009-14R Class 4A9 |
| 10/26/35 | 3.134% | | 7,740,000 | 7,785,914 |
| CMO Series 2011-12R Class 3A1 |
| 07/27/36 | 2.946% | | 2,174,757 | 2,152,085 |
| CMO Series 2011-16R Class 7A3 |
| 12/27/36 | 3.090% | | 127,455 | 127,452 |
| CMO Series 2014-RPL4 Class A1 |
| 08/25/62 | 3.625% | | 7,766,226 | 7,884,899 |
| CMO Series 2014-RPL4 Class A2 |
| 08/25/62 | 4.826% | | 3,500,000 | 3,475,659 |
| Series 2012-11 Class 3A2 |
| 06/29/47 | 1.995% | | 440,521 | 403,735 |
| Credit Suisse Mortgage Capital Certificates(b) |
| CMO Series 2010-9R Class 1A5 |
| 08/27/37 | 4.000% | | 1,000,000 | 983,891 |
| Credit Suisse Securities (USA) LLC(a),(b) |
| CMO Series 2014-RPL1 Class A1 |
| 02/25/54 | 3.250% | | 6,930,738 | 6,858,268 |
| Credit Suisse Securities (USA) LLC(b) |
| CMO Series 2014-RPL1 Class A3 |
| 02/25/54 | 4.179% | | 500,000 | 499,827 |
| CSMC Trust(a),(b) |
| CMO Series 2015-RPL1 Class A2 |
| 02/25/57 | 4.720% | | 1,600,000 | 1,575,922 |
| Deephaven Residential Mortgage Trust(b) |
| Series 2016-1A Class A2 |
| 07/25/46 | 5.500% | | 1,540,117 | 1,539,561 |
| GCAT LLC(b),(f) |
| CMO Series 20 17-2 Class A1 |
| 04/25/47 | 3.500% | | 6,500,000 | 6,487,546 |
The accompanying Notes to Financial Statements are an integral part of this statement.
Columbia Total Return Bond Fund | Annual Report 2017
| 25 |
Portfolio of Investments (continued)
April 30, 2017
| Residential Mortgage-Backed Securities - Non-Agency (continued) |
| Issuer | Coupon
Rate | | Principal
Amount ($) | Value ($) |
| JPMorgan Resecuritization Trust(a),(b) |
| CMO Series 2014-1 Class 1016 |
| 03/26/36 | 3.108% | | 4,210,000 | 4,162,449 |
| JPMorgan Resecuritization Trust(b) |
| CMO Series 2014-5 Class 6A |
| 09/27/36 | 4.000% | | 1,916,539 | 1,934,369 |
| Morgan Stanley Re-Remic Trust(a),(b) |
| CMO Series 2010-R1 Class 2B |
| 07/26/35 | 3.220% | | 2,476,318 | 2,468,517 |
| Nomura Asset Acceptance Corp. Alternative Loan Trust(a) |
| CMO Series 2007-1 Class 1A3 (AGM) |
| 03/25/47 | 5.957% | | 315,959 | 312,974 |
| CMO Series 2007-1 Class 1A4 (AGM) |
| 03/25/47 | 6.138% | | 2,001,866 | 1,982,684 |
| Nomura Resecuritization Trust(a),(b) |
| CMO Series 2012-3R Class 1A1 |
| 01/26/37 | 1.154% | | 136,889 | 136,679 |
| CMO Series 2014-6R Class 3A1 |
| 01/26/36 | 1.242% | | 3,689,510 | 3,554,888 |
| NRPL Trust(a),(b) |
| Series 2014-1A Class A1 |
| 04/25/54 | 3.250% | | 1,484,891 | 1,529,760 |
| NRZ Excess Spread-Collateralized Notes(b) |
| CMO Series 2016-PLS2 Class A |
| 07/25/21 | 5.683% | | 863,408 | 863,408 |
| Oaktown Re Ltd.(a),(b),(c) |
| CMO Series 2017-1A Class M1 |
| 04/25/27 | 3.250% | | 8,500,000 | 8,500,000 |
| PennyMac Mortgage Investment Trust(a),(b) |
| Series 2017-GT1 Class A |
| 02/25/50 | 5.741% | | 1,500,000 | 1,510,956 |
| Renaissance Home Equity Loan Trust(a) |
| CMO Series 2005-3 Class M2 |
| 11/25/35 | 5.355% | | 3,844,667 | 264,917 |
| Sequoia Mortgage Trust(j) |
| CMO Series 2004-6 Class B2 |
| 07/20/34 | 2.313% | | 767,589 | 270,374 |
| SGR Residential Mortgage Trust(b) |
| CMO Series 2016-1 Class A1 |
| 11/25/46 | 3.750% | | 939,557 | 932,964 |
| Structured Asset Securities Corp. Mortgage Pass-Through Certificates(a) |
| CMO Series 2004-21XS Class 2A6A |
| 12/25/34 | 5.240% | | 5,731 | 5,805 |
| Vericrest Opportunity Loan Transferee(b) |
| CMO Series 2015-NPL4 Class A1 |
| 02/25/55 | 3.500% | | 765,606 | 770,453 |
| Residential Mortgage-Backed Securities - Non-Agency (continued) |
| Issuer | Coupon
Rate | | Principal
Amount ($) | Value ($) |
| VML LLC(b) |
| CMO Series 2014-NPL1 Class A1 |
| 04/27/54 | 3.875% | | 1,187,093 | 1,189,635 |
Total Residential Mortgage-Backed Securities - Non-Agency
(Cost $122,880,223) | 119,439,405 |
|
| Senior Loans 0.1% |
| Borrower | Weighted
Average Coupon | | Principal
Amount ($) | Value ($) |
| Consumer Products 0.0% |
| Serta Simmons Holdings, LLC(a),(o) |
| 2nd Lien Term Loan |
| 11/08/24 | 9.038% | | 354,580 | 359,012 |
| Diversified Manufacturing 0.0% |
| Accudyne Industries Borrower SCA/LLC(a),(o) |
| Term Loan |
| 12/13/19 | 4.147% | | 298,000 | 296,343 |
| Independent Energy 0.0% |
| Chesapeake Energy Corp.(a),(o) |
| Tranche A Term Loan |
| 08/23/21 | 8.553% | | 202,904 | 219,073 |
| Technology 0.1% |
| Ancestry.com Operations, Inc.(a),(o) |
| 2nd Lien Term Loan |
| 10/19/24 | 9.270% | | 160,485 | 164,096 |
| Information Resources, Inc.(a),(o) |
| 2nd Lien Term Loan |
| 01/20/25 | 9.250% | | 427,000 | 425,668 |
| Kronos, Inc.(a),(o) |
| 2nd Lien Term Loan |
| 11/01/24 | 9.420% | | 226,000 | 235,153 |
| Misys Ltd.(a),(c),(o) |
| 2nd Lien Term Loan |
| 04/28/24 | 0.000% | | 35,590 | 36,302 |
| Term Loan |
| 04/26/24 | 0.000% | | 94,908 | 95,561 |
| Total | 956,780 |
Total Senior Loans
(Cost $1,760,883) | 1,831,208 |
|
The accompanying Notes to Financial Statements are an integral part of this statement.
| 26 | Columbia Total Return Bond Fund | Annual Report 2017 |
Portfolio of Investments (continued)
April 30, 2017
| U.S. Government & Agency Obligations 1.2% |
| Issuer | Coupon
Rate | | Principal
Amount ($) | Value ($) |
| Residual Funding Corp.(e) |
| STRIPS |
| 01/15/30 | 0.000% | | 22,716,000 | 15,427,004 |
| 04/15/30 | 0.000% | | 20,573,000 | 13,823,760 |
Total U.S. Government & Agency Obligations
(Cost $29,392,330) | 29,250,764 |
|
| U.S. Treasury Obligations 19.1% |
| | | | |
| U.S. Treasury |
| 07/15/17 | 0.875% | | 56,250,000 | 56,241,056 |
| 08/31/17 | 0.625% | | 47,395,000 | 47,341,302 |
| 03/31/19 | 1.250% | | 14,900,000 | 14,896,514 |
| 10/15/19 | 1.000% | | 32,126,000 | 31,856,206 |
| 04/15/20 | 1.500% | | 37,385,000 | 37,439,021 |
| 03/31/22 | 1.875% | | 82,943,000 | 83,153,592 |
| 03/31/24 | 2.125% | | 57,996,000 | 58,113,790 |
| 02/15/27 | 2.250% | | 47,913,900 | 47,773,512 |
| 05/15/41 | 4.375% | | 379,000 | 477,762 |
| 11/15/46 | 2.875% | | 54,144,400 | 53,218,044 |
| U.S. Treasury(e),(m) |
| STRIPS |
| 05/15/43 | 0.000% | | 53,889,000 | 24,327,650 |
| U.S. Treasury Obligations (continued) |
| Issuer | Coupon
Rate | | Principal
Amount ($) | Value ($) |
| U.S. Treasury(e) |
| STRIPS |
| 02/15/45 | 0.000% | | 33,260,000 | 14,204,215 |
Total U.S. Treasury Obligations
(Cost $464,145,028) | 469,042,664 |
| Money Market Funds 0.2% |
| | Shares | Value ($) |
| Columbia Short-Term Cash Fund, 0.869%(p),(q) | 6,149,431 | 6,149,431 |
Total Money Market Funds
(Cost $6,148,997) | 6,149,431 |
Total Investments
(Cost: $2,779,884,185) | 2,789,638,258 |
| Other Assets & Liabilities, Net | | (329,861,522) |
| Net Assets | 2,459,776,736 |
At April 30, 2017, securities and/or cash totaling $22,561,942 were pledged as collateral.
Investments in derivatives
Futures contracts outstanding at April 30, 2017
| Long futures contracts outstanding |
| Contract description | Number of
contracts | Trading
currency | Notional market
value ($) | Expiration date | Unrealized
appreciation ($) | Unrealized
depreciation ($) |
| U.S. Treasury 10-Year Note | 15 | USD | 1,885,781 | 06/2017 | 5,131 | — |
| U.S. Treasury 5-Year Note | 147 | USD | 17,405,719 | 06/2017 | 271,402 | — |
| U.S. Treasury 5-Year Note | 74 | USD | 8,762,063 | 06/2017 | — | (730) |
| U.S. Treasury 5-Year Note | 300 | USD | 35,521,875 | 06/2017 | — | (14,762) |
| Total | | | 63,575,438 | | 276,533 | (15,492) |
| Short futures contracts outstanding |
| Contract description | Number of
contracts | Trading
currency | Notional market
value ($) | Expiration date | Unrealized
appreciation ($) | Unrealized
depreciation ($) |
| U.S. Long Bond | (49) | USD | (7,495,469) | 06/2017 | — | (27,864) |
| U.S. Long Bond | (147) | USD | (22,486,406) | 06/2017 | — | (417,970) |
| U.S. Treasury 2-Year Note | (119) | USD | (25,776,516) | 06/2017 | 22,086 | — |
| U.S. Treasury 2-Year Note | (101) | USD | (21,877,547) | 06/2017 | 4,199 | — |
| U.S. Treasury Ultra 10-Year Note | (8) | USD | (1,083,625) | 06/2017 | 2,983 | — |
| U.S. Treasury Ultra 10-Year Note | (108) | USD | (14,628,937) | 06/2017 | — | (106,997) |
| U.S. Ultra Bond | (18) | USD | (2,932,875) | 06/2017 | 8,962 | — |
| U.S. Ultra Bond | (246) | USD | (40,082,625) | 06/2017 | — | (832,617) |
| Total | | | (136,364,000) | | 38,230 | (1,385,448) |
The accompanying Notes to Financial Statements are an integral part of this statement.
Columbia Total Return Bond Fund | Annual Report 2017
| 27 |
Portfolio of Investments (continued)
April 30, 2017
Credit default swap contracts outstanding at April 30, 2017
| Buy protection |
| Counterparty | Reference
entity | Expiration
date | Pay
fixed
rate
(%) | Notional
currency | Notional
amount | Market
value
($) | Periodic
payments
receivable
(payable)
($) | Premium
paid
($) | Premium
received
($) | Unrealized
appreciation
($) | Unrealized
depreciation
($) |
| Barclays | American International Group, Inc. | 6/20/2022 | 1.000 | USD | 5,815,000 | (43,982) | (6,461) | — | (27,756) | — | (22,687) |
| Barclays | Electricite de France SA | 6/20/2022 | 1.000 | USD | 7,905,000 | (84,029) | (8,783) | — | — | — | (92,812) |
| Barclays | Home Depot, Inc. | 6/20/2022 | 1.000 | USD | 18,300,000 | (646,306) | (20,333) | — | (592,457) | — | (74,182) |
| Barclays | International Business Machines Corp. | 6/20/2022 | 1.000 | USD | 2,615,000 | (77,935) | (2,906) | — | (72,939) | — | (7,902) |
| Barclays | McDonald’s Corp. | 6/20/2022 | 1.000 | USD | 2,370,000 | (86,114) | (2,633) | — | (76,117) | — | (12,630) |
| Barclays | Morgan Stanley | 6/20/2022 | 1.000 | USD | 4,145,000 | (65,091) | (4,606) | — | (37,737) | — | (31,960) |
| Citi | Bank of America Corp. | 6/20/2022 | 1.000 | USD | 8,255,000 | (170,671) | (9,172) | — | (139,357) | — | (40,486) |
| Citi | Carnival Corp. | 6/20/2022 | 1.000 | USD | 2,600,000 | (79,841) | (2,889) | — | (78,729) | — | (4,001) |
| Citi | Eastman Chemical Co. | 12/20/2021 | 1.000 | USD | 6,010,000 | (117,930) | (6,678) | — | (52,514) | — | (72,094) |
| Citi | Energy Transfer Partners LP | 12/20/2021 | 1.000 | USD | 1,520,000 | (584) | (1,689) | 55,687 | — | — | (57,960) |
| Citi | Energy Transfer Partners LP | 12/20/2021 | 1.000 | USD | 3,040,000 | (1,167) | (3,378) | 102,731 | — | — | (107,276) |
| Citi | Goldman Sachs Group, Inc. | 6/20/2022 | 1.000 | USD | 10,100,000 | (138,676) | (11,222) | — | (72,449) | — | (77,449) |
| Citi | International Business Machines Corp. | 6/20/2022 | 1.000 | USD | 7,845,000 | (233,806) | (8,717) | — | (216,868) | — | (25,655) |
| Citi | Lowe’s Companies, Inc. | 6/20/2022 | 1.000 | USD | 7,825,000 | (284,287) | (8,694) | — | (268,163) | — | (24,818) |
| Citi | Markit CDX Emerging Markets Index, Series 26 | 12/20/2021 | 1.000 | USD | 21,245,000 | 768,953 | (23,606) | 1,227,489 | — | — | (482,142) |
| Citi | Markit CDX Emerging Markets Index, Series 26 | 12/20/2021 | 1.000 | USD | 30,370,000 | 1,099,228 | (33,745) | 1,747,480 | — | — | (681,997) |
| Citi | Nordstrom, Inc. | 6/20/2022 | 1.000 | USD | 9,155,000 | 203,746 | (10,172) | 277,910 | — | — | (84,336) |
| Credit Suisse | Carnival Corp. | 6/20/2022 | 1.000 | USD | 7,815,000 | (239,983) | (8,683) | — | (232,835) | — | (15,831) |
| Credit Suisse | Lowe’s Companies, Inc. | 6/20/2022 | 1.000 | USD | 5,215,000 | (189,464) | (5,794) | — | (186,704) | — | (8,554) |
| Credit Suisse | Nordstrom, Inc. | 6/20/2022 | 1.000 | USD | 3,925,000 | 87,352 | (4,361) | 122,785 | — | — | (39,794) |
| Goldman Sachs International | D.R. Horton, Inc. | 12/20/2021 | 1.000 | USD | 12,880,000 | (167,820) | (14,311) | 246,928 | — | — | (429,059) |
| Goldman Sachs International | Eastman Chemical Co. | 12/20/2021 | 1.000 | USD | 3,010,000 | (59,063) | (3,344) | — | (19,695) | — | (42,712) |
| Goldman Sachs International | Eastman Chemical Co. | 12/20/2021 | 1.000 | USD | 4,520,000 | (88,694) | (5,022) | — | (29,602) | — | (64,114) |
| Goldman Sachs International | Electricite de France SA | 6/20/2022 | 1.000 | USD | 10,350,000 | (110,019) | (11,500) | 4,916 | — | — | (126,435) |
| Goldman Sachs International | Energy Transfer Partners LP | 12/20/2021 | 1.000 | USD | 1,520,000 | (583) | (1,689) | 51,415 | — | — | (53,687) |
| Goldman Sachs International | Energy Transfer Partners LP | 12/20/2021 | 1.000 | USD | 4,560,000 | (1,751) | (5,067) | 135,386 | — | — | (142,204) |
| Goldman Sachs International | General Motors Co. | 6/20/2022 | 5.000 | USD | 6,530,000 | (1,164,025) | (36,278) | — | (1,127,785) | — | (72,518) |
| Goldman Sachs International | Home Depot, Inc. | 6/20/2022 | 1.000 | USD | 13,070,000 | (461,597) | (14,522) | — | (423,039) | — | (53,080) |
| Goldman Sachs International | Lincoln National Corp. | 12/20/2021 | 1.000 | USD | 1,505,000 | (12,553) | (1,672) | 5,200 | — | — | (19,425) |
| Goldman Sachs International | Lincoln National Corp. | 12/20/2021 | 1.000 | USD | 4,515,000 | (37,658) | (5,017) | 3,911 | — | — | (46,586) |
| Goldman Sachs International | McDonald’s Corp. | 6/20/2022 | 1.000 | USD | 8,920,000 | (324,105) | (9,911) | — | (282,019) | — | (51,997) |
| Goldman Sachs International | PulteGroup, Inc. | 6/20/2022 | 5.000 | USD | 5,215,000 | (947,959) | (28,972) | — | (896,418) | — | (80,513) |
| Goldman Sachs International | Walt Disney Co. (The) | 6/20/2022 | 1.000 | USD | 6,535,000 | (237,651) | (7,261) | — | (211,519) | — | (33,393) |
| JPMorgan | Citigroup, Inc. | 6/20/2022 | 1.000 | USD | 2,605,000 | (52,568) | (2,894) | — | (42,704) | — | (12,758) |
The accompanying Notes to Financial Statements are an integral part of this statement.
| 28 | Columbia Total Return Bond Fund | Annual Report 2017 |
Portfolio of Investments (continued)
April 30, 2017
| Buy protection (continued) |
| Counterparty | Reference
entity | Expiration
date | Pay
fixed
rate
(%) | Notional
currency | Notional
amount | Market
value
($) | Periodic
payments
receivable
(payable)
($) | Premium
paid
($) | Premium
received
($) | Unrealized
appreciation
($) | Unrealized
depreciation
($) |
| JPMorgan | Energy Transfer Partners LP | 12/20/2021 | 1.000 | USD | 1,520,000 | (584) | (1,689) | 60,601 | — | — | (62,874) |
| JPMorgan | Goldman Sachs Group, Inc. | 6/20/2022 | 1.000 | USD | 3,580,000 | (49,155) | (3,978) | — | (20,514) | — | (32,619) |
| JPMorgan | International Business Machines Corp. | 6/20/2022 | 1.000 | USD | 5,230,000 | (155,870) | (5,811) | — | (144,578) | — | (17,103) |
| JPMorgan | Markit CDX Emerging Markets Index, Series 26 | 12/20/2021 | 1.000 | USD | 9,110,000 | 329,731 | (10,122) | 525,804 | — | — | (206,195) |
| JPMorgan | Markit CDX Emerging Markets Index, Series 26 | 12/20/2021 | 1.000 | USD | 30,130,000 | 1,090,541 | (33,478) | 2,375,170 | — | — | (1,318,107) |
| JPMorgan | McDonald’s Corp. | 6/20/2022 | 1.000 | USD | 7,870,000 | (285,955) | (8,744) | — | (253,887) | — | (40,812) |
| JPMorgan | Morgan Stanley | 6/20/2022 | 1.000 | USD | 7,580,000 | (119,033) | (8,422) | — | (68,996) | — | (58,459) |
| JPMorgan | Textron, Inc. | 6/20/2022 | 1.000 | USD | 5,215,000 | (43,968) | (5,794) | — | (62,596) | 12,834 | — |
| JPMorgan | Toll Brothers, Inc. | 6/20/2022 | 1.000 | USD | 15,025,000 | 146,148 | (16,695) | 211,193 | — | — | (81,740) |
| JPMorgan | Valero Energy Corp. | 6/20/2022 | 1.000 | USD | 11,770,000 | (75,026) | (13,078) | 77,512 | — | — | (165,616) |
| JPMorgan | Weyerhaeuser Co. | 6/20/2022 | 1.000 | USD | 2,620,000 | (52,127) | (2,911) | — | (42,812) | — | (12,226) |
| Morgan Stanley | Goldman Sachs Group, Inc. | 6/20/2022 | 1.000 | USD | 7,575,000 | (104,007) | (8,417) | — | (72,755) | — | (39,669) |
| Total | | | | | | | | 7,232,118 | (5,753,544) | 12,834 | (5,228,467) |
Cleared credit default swap contracts outstanding at April 30, 2017
| Buy protection |
| Counterparty | Reference
entity | Expiration
date | Pay fixed
rate (%) | Notional
currency | Notional
amount | Unrealized
appreciation ($) | Unrealized
depreciation ($) |
| Morgan Stanley | Markit CDX North America High Yield Index, Series 28 | 6/20/2022 | 5.000 | USD | 187,520,000 | — | (2,645,249) |
| Morgan Stanley | Markit CDX North America Investment Grade Index, Series 27 | 12/20/2021 | 1.000 | USD | 29,595,000 | — | (180,294) |
| Morgan Stanley | Markit CDX North America Investment Grade Index, Series 28 | 6/20/2022 | 1.000 | USD | 116,160,000 | — | (235,436) |
| Total | | | | | | — | (3,060,979) |
Credit default swap contracts outstanding at April 30, 2017
| Sell protection |
| Counterparty | Reference
entity | Expiration
date | Receive
fixed
rate
(%) | Implied
credit
spread
(%)* | Notional
currency | Notional
amount | Market
value
($) | Periodic
payments
receivable
(payable)
($) | Premium
paid
($) | Premium
received
($) | Unrealized
appreciation
($) | Unrealized
depreciation
($) |
| Barclays | Anadarko Petroleum Corp. | 12/20/2020 | 1.000 | 0.735 | USD | 6,235,000 | 58,778 | 6,928 | — | (453,781) | 519,487 | — |
| Barclays | Anadarko Petroleum Corp. | 6/20/2021 | 1.000 | 0.859 | USD | 3,080,000 | 17,374 | 3,422 | — | (281,445) | 302,241 | — |
| Barclays | Bank of America Corp. | 6/20/2018 | 1.000 | 0.213 | USD | 15,565,000 | 140,884 | 17,294 | 108,020 | — | 50,158 | — |
| Barclays | Canadian Natural Resources Ltd. | 12/20/2020 | 1.000 | 0.752 | USD | 3,120,000 | 27,502 | 3,467 | — | (279,825) | 310,794 | — |
| Barclays | Citigroup, Inc. | 6/20/2018 | 1.000 | 0.206 | USD | 15,340,000 | 140,121 | 17,044 | 88,975 | — | 68,190 | — |
| Barclays | Frontier Communications Corp. | 6/20/2019 | 5.000 | 2.658 | USD | 2,595,000 | 125,319 | 14,417 | 143,506 | — | — | (3,770) |
| Barclays | JPMorgan Chase & Co. | 6/20/2019 | 1.000 | 0.276 | USD | 13,035,000 | 201,450 | 14,483 | 196,241 | — | 19,692 | — |
The accompanying Notes to Financial Statements are an integral part of this statement.
Columbia Total Return Bond Fund | Annual Report 2017
| 29 |
Portfolio of Investments (continued)
April 30, 2017
| Sell protection (continued) |
| Counterparty | Reference
entity | Expiration
date | Receive
fixed
rate
(%) | Implied
credit
spread
(%)* | Notional
currency | Notional
amount | Market
value
($) | Periodic
payments
receivable
(payable)
($) | Premium
paid
($) | Premium
received
($) | Unrealized
appreciation
($) | Unrealized
depreciation
($) |
| Barclays | JPMorgan Chase & Co. | 6/20/2019 | 1.000 | 0.276 | USD | 6,510,000 | 100,610 | 7,233 | 100,845 | — | 6,998 | — |
| Barclays | JPMorgan Chase & Co. | 6/20/2019 | 1.000 | 0.276 | USD | 6,510,000 | 100,610 | 7,233 | 100,845 | — | 6,998 | — |
| Barclays | Navient Corp. | 6/20/2020 | 5.000 | 2.123 | USD | 2,595,000 | 224,084 | 14,417 | 217,198 | — | 21,303 | — |
| Barclays | Valeant Pharmaceuticals International, Inc. | 6/20/2019 | 5.000 | 4.524 | USD | 2,595,000 | 25,071 | 14,417 | — | (32,558) | 72,046 | — |
| Barclays | Verizon Communications, Inc. | 6/20/2017 | 1.000 | 0.228 | USD | 22,175,000 | 25,118 | 24,639 | 22,134 | — | 27,623 | — |
| Citi | Dow Chemical Co. (The) | 12/20/2021 | 1.000 | 0.592 | USD | 6,010,000 | 110,011 | 6,678 | 28,775 | — | 87,914 | — |
| Citi | JPMorgan Chase & Co. | 6/20/2019 | 1.000 | 0.276 | USD | 5,210,000 | 80,518 | 5,789 | 80,687 | — | 5,620 | — |
| Citi | Plains All American Pipeline LP | 12/20/2021 | 1.000 | 1.382 | USD | 3,040,000 | (50,864) | 3,378 | — | (121,217) | 73,731 | — |
| Citi | Royal Caribbean Cruises, Ltd. | 6/20/2022 | 5.000 | 0.984 | USD | 2,600,000 | 510,615 | 14,444 | 497,600 | — | 27,459 | — |
| Citi | Target Corp. | 6/20/2022 | 1.000 | 0.605 | USD | 7,825,000 | 152,427 | 8,694 | 135,906 | — | 25,215 | — |
| Citi | Verizon Communications, Inc. | 12/20/2021 | 1.000 | 0.745 | USD | 2,890,000 | 32,806 | 3,211 | 31,561 | — | 4,456 | — |
| Credit Suisse | Markit CMBX North America Index, Series 6 BBB- | 5/11/2063 | 3.000 | 5.523 | USD | 1,000,000 | (111,764) | 333 | — | (108,724) | — | (2,707) |
| Credit Suisse | Markit CMBX North America Index, Series 7 BBB- | 1/17/2047 | 3.000 | 4.522 | USD | 7,500,000 | (607,778) | 2,500 | — | (643,050) | 37,772 | — |
| Credit Suisse | Markit CMBX North America Index, Series 7 BBB- | 1/17/2047 | 3.000 | 4.522 | USD | 7,500,000 | (607,778) | 2,500 | — | (570,865) | — | (34,413) |
| Credit Suisse | Markit CMBX North America Index, Series 7 BBB- | 1/17/2047 | 3.000 | 4.522 | USD | 6,000,000 | (486,222) | 2,000 | — | (391,288) | — | (92,934) |
| Credit Suisse | Royal Caribbean Cruises, Ltd. | 6/20/2022 | 5.000 | 0.984 | USD | 7,815,000 | 1,534,791 | 43,417 | 1,478,869 | — | 99,339 | — |
| Credit Suisse | Target Corp. | 6/20/2022 | 1.000 | 0.605 | USD | 5,215,000 | 101,586 | 5,794 | 98,295 | — | 9,085 | — |
| Credit Suisse | Tyson Foods, Inc. | 12/20/2021 | 1.000 | 0.535 | USD | 4,330,000 | 90,488 | 4,811 | 56,858 | — | 38,441 | — |
| Credit Suisse | Verizon Communications, Inc. | 12/20/2021 | 1.000 | 0.745 | USD | 2,900,000 | 32,920 | 3,222 | 33,004 | — | 3,138 | — |
| Credit Suisse | Weatherford International Ltd. | 6/20/2020 | 1.000 | 2.41 | USD | 520,000 | (21,895) | 578 | — | (22,062) | 745 | — |
| Goldman Sachs International | Anadarko Petroleum Corp. | 12/20/2020 | 1.000 | 0.735 | USD | 3,120,000 | 29,412 | 3,467 | — | (249,741) | 282,620 | — |
The accompanying Notes to Financial Statements are an integral part of this statement.
| 30 | Columbia Total Return Bond Fund | Annual Report 2017 |
Portfolio of Investments (continued)
April 30, 2017
| Sell protection (continued) |
| Counterparty | Reference
entity | Expiration
date | Receive
fixed
rate
(%) | Implied
credit
spread
(%)* | Notional
currency | Notional
amount | Market
value
($) | Periodic
payments
receivable
(payable)
($) | Premium
paid
($) | Premium
received
($) | Unrealized
appreciation
($) | Unrealized
depreciation
($) |
| Goldman Sachs International | Anadarko Petroleum Corp. | 12/20/2020 | 1.000 | 0.735 | USD | 3,120,000 | 29,412 | 3,467 | — | (249,357) | 282,236 | — |
| Goldman Sachs International | AT&T, Inc. | 12/20/2017 | 1.000 | 0.159 | USD | 13,015,000 | 71,319 | 14,461 | 59,181 | — | 26,599 | — |
| Goldman Sachs International | Citigroup, Inc. | 6/20/2018 | 1.000 | 0.206 | USD | 7,800,000 | 71,247 | 8,667 | 40,724 | — | 39,190 | — |
| Goldman Sachs International | Dow Chemical Co. (The) | 12/20/2021 | 1.000 | 0.592 | USD | 4,520,000 | 82,738 | 5,022 | 15,742 | — | 72,018 | — |
| Goldman Sachs International | Dow Chemical Co. (The) | 12/20/2021 | 1.000 | 0.592 | USD | 3,010,000 | 55,098 | 3,344 | 10,474 | — | 47,968 | — |
| Goldman Sachs International | Ford Motor Co. | 6/20/2022 | 5.000 | 1.432 | USD | 6,530,000 | 1,128,407 | 36,278 | 1,131,324 | — | 33,361 | — |
| Goldman Sachs International | JPMorgan Chase & Co. | 6/20/2019 | 1.000 | 0.276 | USD | 13,035,000 | 201,450 | 14,483 | 196,241 | — | 19,692 | — |
| Goldman Sachs International | Markit CMBX North America Index, Series 6 BBB- | 5/11/2063 | 3.000 | 5.523 | USD | 2,250,000 | (251,471) | 750 | — | (235,823) | — | (14,898) |
| Goldman Sachs International | Markit CMBX North America Index, Series 6 BBB- | 5/11/2063 | 3.000 | 5.523 | USD | 2,500,000 | (279,411) | 833 | — | (223,433) | — | (55,145) |
| Goldman Sachs International | Markit CMBX North America Index, Series 6 BBB- | 5/11/2063 | 3.000 | 5.523 | USD | 3,100,000 | (346,471) | 1,033 | — | (269,267) | — | (76,171) |
| Goldman Sachs International | Markit CMBX North America Index, Series 6 BBB- | 5/11/2063 | 3.000 | 5.523 | USD | 6,400,000 | (715,294) | 2,133 | — | (522,813) | — | (190,348) |
| Goldman Sachs International | MetLife, Inc. | 12/20/2021 | 1.000 | 0.686 | USD | 4,515,000 | 63,452 | 5,017 | 11,773 | — | 56,696 | — |
| Goldman Sachs International | MetLife, Inc. | 12/20/2021 | 1.000 | 0.686 | USD | 1,505,000 | 21,151 | 1,672 | — | — | 22,823 | — |
| Goldman Sachs International | Verizon Communications, Inc. | 6/20/2022 | 1.000 | 0.823 | USD | 14,580,000 | 126,152 | — | 126,152 | — | — | — |
| JPMorgan | Ally Financial, Inc. | 6/20/2020 | 5.000 | 1.677 | USD | 3,900,000 | 390,224 | 21,667 | 426,871 | — | — | (14,980) |
| JPMorgan | Anadarko Petroleum Corp. | 6/20/2021 | 1.000 | 0.859 | USD | 3,050,000 | 17,204 | 3,389 | — | (220,155) | 240,748 | — |
| JPMorgan | Avis Budget Car Rental LLC/Finance, Inc. | 6/20/2020 | 5.000 | 2.148 | USD | 6,495,000 | 558,647 | 36,083 | 547,727 | — | 47,003 | — |
| JPMorgan | Bank of America Corp. | 6/20/2018 | 1.000 | 0.213 | USD | 23,480,000 | 212,524 | 26,089 | 141,430 | — | 97,183 | — |
| JPMorgan | Bank of America Corp. | 6/20/2021 | 1.000 | 0.454 | USD | 15,280,000 | 335,543 | 16,978 | 81,198 | — | 271,323 | — |
| JPMorgan | Calpine Corp. | 6/20/2020 | 5.000 | 1.609 | USD | 3,900,000 | 400,580 | 21,667 | 439,717 | — | — | (17,470) |
| JPMorgan | CenturyLink, Inc. | 6/20/2020 | 1.000 | 1.161 | USD | 3,900,000 | (19,283) | 4,333 | — | (5,894) | — | (9,056) |
| JPMorgan | Citigroup, Inc. | 6/20/2018 | 1.000 | 0.206 | USD | 23,350,000 | 213,287 | 25,944 | 167,421 | — | 71,810 | — |
| JPMorgan | Citigroup, Inc. | 6/20/2018 | 1.000 | 0.206 | USD | 15,280,000 | 139,572 | 16,978 | 100,830 | — | 55,720 | — |
| JPMorgan | Citigroup, Inc. | 6/20/2018 | 1.000 | 0.206 | USD | 7,825,000 | 71,477 | 8,694 | 48,930 | — | 31,241 | — |
| JPMorgan | CSC Holdings LLC | 6/20/2020 | 5.000 | 1.293 | USD | 3,900,000 | 441,884 | 21,667 | 486,504 | — | — | (22,953) |
The accompanying Notes to Financial Statements are an integral part of this statement.
Columbia Total Return Bond Fund | Annual Report 2017
| 31 |
Portfolio of Investments (continued)
April 30, 2017
| Sell protection (continued) |
| Counterparty | Reference
entity | Expiration
date | Receive
fixed
rate
(%) | Implied
credit
spread
(%)* | Notional
currency | Notional
amount | Market
value
($) | Periodic
payments
receivable
(payable)
($) | Premium
paid
($) | Premium
received
($) | Unrealized
appreciation
($) | Unrealized
depreciation
($) |
| JPMorgan | CVS Health Corp. | 6/20/2022 | 1.000 | 0.465 | USD | 7,870,000 | 208,499 | 8,744 | 194,906 | — | 22,337 | — |
| JPMorgan | DISH DBS Corp. | 6/20/2020 | 5.000 | 1.356 | USD | 3,900,000 | 433,620 | 21,667 | 437,142 | — | 18,145 | — |
| JPMorgan | DISH DBS Corp. | 6/20/2022 | 5.000 | 2.608 | USD | 6,565,000 | 735,098 | 36,472 | 843,888 | — | — | (72,318) |
| JPMorgan | Energy Transfer Equity LP | 6/20/2020 | 1.000 | 1.648 | USD | 3,900,000 | (75,112) | 4,333 | 17,774 | — | — | (88,553) |
| JPMorgan | Equinix, Inc. | 6/20/2020 | 1.000 | 0.83 | USD | 3,900,000 | 20,097 | 4,333 | 75,602 | — | — | (51,172) |
| JPMorgan | Freeport-McMoRan, Inc. | 6/20/2020 | 1.000 | 1.659 | USD | 3,900,000 | (77,793) | 4,333 | — | (45,563) | — | (27,897) |
| JPMorgan | Frontier Communications Corp. | 6/20/2019 | 5.000 | 2.658 | USD | 10,395,000 | 502,000 | 57,750 | 647,706 | — | — | (87,956) |
| JPMorgan | HD Supply, Inc. | 6/20/2020 | 5.000 | 0.468 | USD | 3,900,000 | 542,015 | 21,667 | 554,271 | — | 9,411 | — |
| JPMorgan | Hertz Corp. (The) | 6/20/2019 | 5.000 | 3.577 | USD | 10,395,000 | 303,498 | 57,750 | 161,502 | — | 199,746 | — |
| JPMorgan | iStar, Inc. | 6/20/2020 | 5.000 | 1.713 | USD | 3,900,000 | 386,177 | 21,667 | 388,725 | — | 19,119 | — |
| JPMorgan | Markit CMBX North America Index, Series 6 BBB- | 5/11/2063 | 3.000 | 5.523 | USD | 1,500,000 | (167,647) | 500 | — | (146,604) | — | (20,543) |
| JPMorgan | Markit CMBX North America Index, Series 7 BBB- | 1/17/2047 | 3.000 | 4.522 | USD | 3,000,000 | (243,111) | 1,000 | — | (262,754) | 20,643 | — |
| JPMorgan | MGM Resorts International | 6/20/2020 | 5.000 | 0.925 | USD | 3,900,000 | 488,167 | 21,667 | 531,487 | — | — | (21,653) |
| JPMorgan | Navient Corp. | 6/20/2020 | 5.000 | 2.123 | USD | 6,495,000 | 560,858 | 36,083 | 609,723 | — | — | (12,782) |
| JPMorgan | NRG Energy, Inc. | 6/20/2020 | 5.000 | 1.506 | USD | 3,900,000 | 413,734 | 21,667 | 439,717 | — | — | (4,316) |
| JPMorgan | Pactiv Corp. | 6/20/2020 | 5.000 | 1.289 | USD | 3,900,000 | 440,454 | 21,667 | 491,756 | — | — | (29,635) |
| JPMorgan | Plains All American Pipeline LP | 6/20/2021 | 1.000 | 1.231 | USD | 1,555,000 | (14,191) | 1,728 | — | (209,257) | 196,794 | — |
| JPMorgan | Plains All American Pipeline LP | 6/20/2021 | 1.000 | 1.231 | USD | 1,565,000 | (14,282) | 1,739 | — | (171,524) | 158,981 | — |
| JPMorgan | Plains All American Pipeline LP | 6/20/2021 | 1.000 | 1.231 | USD | 1,555,000 | (14,191) | 1,728 | — | (146,633) | 134,170 | — |
| JPMorgan | Rite Aid Corp. | 6/20/2020 | 5.000 | 1.329 | USD | 2,595,000 | 290,694 | 14,417 | 250,272 | — | 54,839 | — |
| JPMorgan | Rite Aid Corp. | 6/20/2020 | 5.000 | 1.329 | USD | 3,900,000 | 436,881 | 21,667 | 465,604 | — | — | (7,056) |
| JPMorgan | Sprint Communications, Inc. | 6/20/2020 | 5.000 | 1.762 | USD | 3,900,000 | 382,057 | 21,667 | 414,091 | — | — | (10,367) |
| JPMorgan | Targa Resources Partners LP/Finance Corp. | 6/20/2020 | 1.000 | 1.65 | USD | 6,495,000 | (125,453) | 7,217 | 29,601 | — | — | (147,837) |
| JPMorgan | TransDigm, Inc. | 6/20/2020 | 1.000 | 2.513 | USD | 6,495,000 | (290,489) | 7,217 | — | (10,871) | — | (272,401) |
| JPMorgan | Tyson Foods, Inc. | 12/20/2021 | 1.000 | 0.535 | USD | 7,225,000 | 150,988 | 8,028 | 94,944 | — | 64,072 | — |
| JPMorgan | United Rentals North America, Inc. | 6/20/2020 | 5.000 | 1.023 | USD | 3,900,000 | 475,845 | 21,667 | 501,632 | — | — | (4,120) |
| JPMorgan | Valeant Pharmaceuticals International, Inc. | 6/20/2019 | 5.000 | 4.524 | USD | 10,395,000 | 100,431 | 57,750 | 20,326 | — | 137,855 | — |
The accompanying Notes to Financial Statements are an integral part of this statement.
| 32 | Columbia Total Return Bond Fund | Annual Report 2017 |
Portfolio of Investments (continued)
April 30, 2017
| Sell protection (continued) |
| Counterparty | Reference
entity | Expiration
date | Receive
fixed
rate
(%) | Implied
credit
spread
(%)* | Notional
currency | Notional
amount | Market
value
($) | Periodic
payments
receivable
(payable)
($) | Premium
paid
($) | Premium
received
($) | Unrealized
appreciation
($) | Unrealized
depreciation
($) |
| JPMorgan | Verizon Communications, Inc. | 6/20/2017 | 1.000 | 0.228 | USD | 13,175,000 | 14,924 | 14,639 | 13,197 | — | 16,366 | — |
| JPMorgan | Verizon Communications, Inc. | 12/20/2021 | 1.000 | 0.745 | USD | 14,715,000 | 167,039 | 16,350 | 180,278 | — | 3,111 | — |
| JPMorgan | Weatherford International Ltd. | 6/20/2020 | 1.000 | 2.41 | USD | 3,900,000 | (164,204) | 4,333 | — | (119,123) | — | (40,748) |
| JPMorgan | Whiting Petroleum Corp. | 6/20/2020 | 5.000 | 2.799 | USD | 520,000 | 33,041 | 2,889 | 26,753 | — | 9,177 | — |
| JPMorgan | Whiting Petroleum Corp. | 6/20/2020 | 5.000 | 2.799 | USD | 6,495,000 | 412,687 | 36,083 | 480,614 | — | — | (31,844) |
| Morgan Stanley | Anadarko Petroleum Corp. | 12/20/2020 | 1.000 | 0.735 | USD | 4,740,000 | 44,684 | 5,267 | — | (560,294) | 610,245 | — |
| Morgan Stanley | Anadarko Petroleum Corp. | 12/20/2020 | 1.000 | 0.735 | USD | 6,435,000 | 60,663 | 7,150 | — | (508,096) | 575,909 | — |
| Morgan Stanley | Anadarko Petroleum Corp. | 12/20/2020 | 1.000 | 0.735 | USD | 6,445,000 | 60,758 | 7,161 | — | (424,988) | 492,907 | — |
| Morgan Stanley | Bank of America Corp. | 6/20/2018 | 1.000 | 0.213 | USD | 7,800,000 | 70,600 | 8,667 | 39,832 | — | 39,435 | — |
| Morgan Stanley | Bank of America Corp. | 6/20/2018 | 1.000 | 0.213 | USD | 7,875,000 | 71,279 | 8,750 | 43,826 | — | 36,203 | — |
| Morgan Stanley | Canadian Natural Resources Ltd. | 6/20/2021 | 1.000 | 0.882 | USD | 1,560,000 | 7,314 | 1,733 | — | (96,645) | 105,692 | — |
| Morgan Stanley | Enterprise Products Partners LP | 6/20/2021 | 1.000 | 0.837 | USD | 9,370,000 | 61,000 | 10,411 | — | (398,706) | 470,117 | — |
| Morgan Stanley | Markit CMBX North America Index, Series 6 BBB- | 5/11/2063 | 3.000 | 5.523 | USD | 750,000 | (83,824) | 250 | — | (73,302) | — | (10,272) |
| Morgan Stanley | Markit CMBX North America Index, Series 6 BBB- | 5/11/2063 | 3.000 | 5.523 | USD | 3,500,000 | (391,177) | 1,167 | — | (372,933) | — | (17,077) |
| Morgan Stanley | Markit CMBX North America Index, Series 6 BBB- | 5/11/2063 | 3.000 | 5.523 | USD | 1,300,000 | (145,294) | 433 | — | (126,817) | — | (18,044) |
| Morgan Stanley | Markit CMBX North America Index, Series 6 BBB- | 5/11/2063 | 3.000 | 5.523 | USD | 2,300,000 | (257,060) | 767 | — | (175,772) | — | (80,521) |
| Morgan Stanley | Markit CMBX North America Index, Series 6 BBB- | 5/11/2063 | 3.000 | 5.523 | USD | 5,000,000 | (558,824) | 1,667 | — | (451,815) | — | (105,342) |
| Morgan Stanley | Markit CMBX North America Index, Series 6 BBB- | 5/11/2063 | 3.000 | 5.523 | USD | 6,000,000 | (670,588) | 2,000 | — | (488,920) | — | (179,668) |
The accompanying Notes to Financial Statements are an integral part of this statement.
Columbia Total Return Bond Fund | Annual Report 2017
| 33 |
Portfolio of Investments (continued)
April 30, 2017
| Sell protection (continued) |
| Counterparty | Reference
entity | Expiration
date | Receive
fixed
rate
(%) | Implied
credit
spread
(%)* | Notional
currency | Notional
amount | Market
value
($) | Periodic
payments
receivable
(payable)
($) | Premium
paid
($) | Premium
received
($) | Unrealized
appreciation
($) | Unrealized
depreciation
($) |
| Morgan Stanley | Markit CMBX North America Index, Series 6 BBB- | 5/11/2063 | 3.000 | 5.523 | USD | 7,000,000 | (782,353) | 2,333 | — | (574,444) | — | (205,576) |
| Morgan Stanley | Markit CMBX North America Index, Series 7 BBB- | 1/17/2047 | 3.000 | 4.522 | USD | 4,100,000 | (332,252) | 1,367 | — | (466,689) | 135,804 | — |
| Morgan Stanley | Noble Energy, Inc. | 6/20/2021 | 1.000 | 1.083 | USD | 7,680,000 | (25,475) | 8,533 | — | (445,525) | 428,583 | — |
| Morgan Stanley | Noble Energy, Inc. | 12/20/2021 | 1.000 | 1.254 | USD | 7,625,000 | (85,257) | 8,472 | — | (579,743) | 502,958 | — |
| Morgan Stanley | Noble Energy, Inc. | 12/20/2021 | 1.000 | 1.254 | USD | 7,590,000 | (84,866) | 8,433 | — | (426,261) | 349,828 | — |
| Morgan Stanley | Plains All American Pipeline LP | 6/20/2021 | 1.000 | 1.231 | USD | 4,620,000 | (42,161) | 5,133 | — | (560,061) | 523,033 | — |
| Morgan Stanley | Plains All American Pipeline LP | 6/20/2021 | 1.000 | 1.231 | USD | 3,115,000 | (28,427) | 3,461 | — | (448,710) | 423,744 | — |
| Morgan Stanley | Plains All American Pipeline LP | 6/20/2021 | 1.000 | 1.231 | USD | 3,125,000 | (28,518) | 3,472 | — | (386,081) | 361,035 | — |
| Morgan Stanley | Tyson Foods, Inc. | 6/20/2022 | 1.000 | 0.607 | USD | 2,590,000 | 50,251 | 2,878 | 50,201 | — | 2,928 | — |
| Total | | | | | | | | | 15,456,928 | (13,559,429) | 9,639,863 | (2,082,543) |
| * | Implied credit spreads, represented in absolute terms, utilized in determining the market value of credit default swap agreements on corporate or sovereign issues as of period end serve as an indicator of the current status of the payment/performance risk and represent the likelihood or risk of default for the credit derivative. The implied credit spread of a particular referenced entity reflects the cost of buying/selling protection and may include upfront payments required to be made to enter into the agreement. Wider credit spreads represent a deterioration of the referenced entity’s credit soundness and a greater likelihood or risk of default or other credit event occurring as defined under the terms of the agreement. |
Cleared credit default swap contracts outstanding at April 30, 2017
| Sell protection |
| Counterparty | Reference
entity | Expiration
date | Receive fixed
rate (%) | Implied
credit
spread (%)* | Notional
currency | Notional
amount | Unrealized
appreciation ($) | Unrealized
depreciation ($) |
| Morgan Stanley | Markit CDX North America High Yield Index, Series 21 | 12/20/2018 | 5.000 | 1.405 | USD | 156,928,600 | 2,489,238 | — |
| Morgan Stanley | Markit CDX North America Investment Grade Index, Series 28 | 6/20/2024 | 1.000 | 0.899 | USD | 50,270,000 | 144,051 | — |
| Morgan Stanley | Markit CDX North America Investment Grade Index, Series 28 | 6/20/2027 | 1.000 | 1.078 | USD | 57,600,000 | 90,612 | — |
| Total | | | | | | | 2,723,901 | — |
| * | Implied credit spreads, represented in absolute terms, utilized in determining the market value of credit default swap agreements on corporate or sovereign issues as of period end serve as an indicator of the current status of the payment/performance risk and represent the likelihood or risk of default for the credit derivative. The implied credit spread of a particular referenced entity reflects the cost of buying/selling protection and may include upfront payments required to be made to enter into the agreement. Wider credit spreads represent a deterioration of the referenced entity’s credit soundness and a greater likelihood or risk of default or other credit event occurring as defined under the terms of the agreement. |
The accompanying Notes to Financial Statements are an integral part of this statement.
| 34 | Columbia Total Return Bond Fund | Annual Report 2017 |
Portfolio of Investments (continued)
April 30, 2017
Notes to Portfolio of Investments
| (a) | Variable rate security. |
| (b) | Represents privately placed and other securities and instruments exempt from SEC registration (collectively, private placements), such as Section 4(a)(2) and Rule 144A eligible securities, which are often sold only to qualified institutional buyers. The Fund may invest in private placements determined to be liquid as well as those determined to be illiquid. Private placements may be determined to be liquid under guidelines established by the Fund’s Board of Trustees. At April 30, 2017, the value of these securities amounted to $638,560,495 which represents 25.96% of net assets. |
| (c) | Represents a security purchased on a when-issued basis. |
| (d) | Represents shares owned in the residual interest of an asset-backed securitization. |
| (e) | Zero coupon bond. |
| (f) | Represents fair value as determined in good faith under procedures approved by the Board of Trustees. At April 30, 2017, the value of these securities amounted to $12,758,384, which represents 0.52% of net assets. |
| (g) | Represents interest only securities which have the right to receive the monthly interest payments on an underlying pool of mortgage loans. |
| (h) | Non-income producing investment. |
| (i) | Negligible market value. |
| (j) | Represents securities that have defaulted on payment of interest. The Fund has stopped accruing interest on these securities. At April 30, 2017, the value of these securities amounted to $513,393 which represents 0.02% of net assets. |
| (k) | Principal and interest may not be guaranteed by the government. |
| (l) | Municipal obligations include debt obligations issued by or on behalf of territories, possessions, or sovereign nations within the territorial boundaries of the United States. At April 30, 2017, the value of these securities amounted to $4,185,768 which represents 0.17% of net assets. |
| (m) | This security or a portion of this security has been pledged as collateral in connection with derivative contracts. |
| (n) | Represents principal only securities which have the right to receive the principal portion only on an underlying pool of mortgage loans. |
| (o) | Senior loans have interest rates that float periodically based primarily on the London Interbank Offered Rate (“LIBOR”) and other short-term rates. The interest rate shown reflects the weighted average coupon as of April 30, 2017. The interest rate shown for senior loans purchased on a when-issued or delayed delivery basis, if any, reflects an estimated average coupon. Remaining maturities of senior loans may be less than the stated maturities shown as a result of contractual or optional prepayments by the borrower. Such prepayments cannot be predicted. |
| (p) | The rate shown is the seven-day current annualized yield at April 30, 2017. |
| (q) | As defined in the Investment Company Act of 1940, an affiliated company is one in which the Fund owns 5% or more of the company’s outstanding voting securities, or a company which is under common ownership or control with the Fund. Holdings and transactions in these affiliated companies during the year ended April 30, 2017 are as follows: |
| Issuer | Beginning
shares | Shares
purchased | Shares
sold | Ending
shares | Realized gain
(loss) ($) | Dividends —
affiliated
issuers($) | Value ($) |
| Columbia Short-Term Cash Fund, 0.869% | 4,335,392 | 1,372,457,348 | (1,370,643,309) | 6,149,431 | (5,569) | 103,736 | 6,149,431 |
Abbreviation Legend
| AGM | Assured Guaranty Municipal Corporation |
| CMO | Collateralized Mortgage Obligation |
| NPFGC | National Public Finance Guarantee Corporation |
| PIK | Payment In Kind |
| STRIPS | Separate Trading of Registered Interest and Principal Securities |
Currency Legend
Fair value measurements
The Fund categorizes its fair value measurements according to a three-level hierarchy that maximizes the use of observable inputs and minimizes the use of unobservable inputs by prioritizing that the most observable input be used when available. Observable inputs are those that market participants would use in pricing an investment based on market data obtained from sources independent of the reporting entity. Unobservable inputs are those that reflect the Fund’s assumptions about the information market participants would use in pricing an investment. An investment’s level within the fair value hierarchy is based on the lowest level of any input that is deemed significant to the asset’s or liability’s fair value measurement. The input levels are not necessarily an indication of the risk or liquidity associated with investments at that level. For example, certain U.S. government securities are generally high quality and liquid, however, they are reflected as Level 2 because the inputs used to determine fair value may not always be quoted prices in an active market.
Fair value inputs are summarized in the three broad levels listed below:
| • | Level 1 – Valuations based on quoted prices for investments in active markets that the Fund has the ability to access at the measurement date (including NAV for open-end mutual funds). Valuation adjustments are not applied to Level 1 investments. |
The accompanying Notes to Financial Statements are an integral part of this statement.
Columbia Total Return Bond Fund | Annual Report 2017
| 35 |
Portfolio of Investments (continued)
April 30, 2017
Fair value measurements (continued)
| • | Level 2 – Valuations based on other significant observable inputs (including quoted prices for similar securities, interest rates, prepayment speeds, credit risks, etc.). |
| • | Level 3 – Valuations based on significant unobservable inputs (including the Fund’s own assumptions and judgment in determining the fair value of investments). |
Inputs that are used in determining fair value of an investment may include price information, credit data, volatility statistics, and other factors. These inputs can be either observable or unobservable. The availability of observable inputs can vary between investments, and is affected by various factors such as the type of investment, and the volume and level of activity for that investment or similar investments in the marketplace. The inputs will be considered by the Investment Manager, along with any other relevant factors in the calculation of an investment’s fair value. The Fund uses prices and inputs that are current as of the measurement date, which may include periods of market dislocations. During these periods, the availability of prices and inputs may be reduced for many investments. This condition could cause an investment to be reclassified between the various levels within the hierarchy.
Certain investments that have been measured at fair value using the net asset value (NAV) per share (or its equivalent) are not categorized in the fair value hierarchy. The fair value amounts presented in the table are intended to reconcile the fair value hierarchy to the amounts presented in the Portfolio of Investments. The Columbia Short-Term Cash Fund seeks to provide shareholders with maximum current income consistent with liquidity and stability of principal. Columbia Short-Term Cash Fund prices its shares with a floating NAV and no longer seeks to maintain a stable NAV.
Investments falling into the Level 3 category are primarily supported by quoted prices from brokers and dealers participating in the market for those investments. However, these may be classified as Level 3 investments due to lack of market transparency and corroboration to support these quoted prices. Additionally, valuation models may be used as the pricing source for any remaining investments classified as Level 3. These models may rely on one or more significant unobservable inputs and/or significant assumptions by the Investment Manager. Inputs used in valuations may include, but are not limited to, financial statement analysis, capital account balances, discount rates and estimated cash flows, and comparable company data.
Under the direction of the Fund’s Board of Trustees (the Board), the Investment Manager’s Valuation Committee (the Committee) is responsible for overseeing the valuation procedures approved by the Board. The Committee consists of voting and non-voting members from various groups within the Investment Manager’s organization, including operations and accounting, trading and investments, compliance, risk management and legal.
The Committee meets at least monthly to review and approve valuation matters, which may include a description of specific valuation determinations, data regarding pricing information received from approved pricing vendors and brokers and the results of Board-approved valuation control policies and procedures (the Policies). The Policies address, among other things, instances when market quotations are or are not readily available, including recommendations of third party pricing vendors and a determination of appropriate pricing methodologies; events that require specific valuation determinations and assessment of fair value techniques; securities with a potential for stale pricing, including those that are illiquid, restricted, or in default; and the effectiveness of third party pricing vendors, including periodic reviews of vendors. The Committee meets more frequently, as needed, to discuss additional valuation matters, which may include the need to review back-testing results, review time-sensitive information or approve related valuation actions. The Committee reports to the Board, with members of the Committee meeting with the Board at each of its regularly scheduled meetings to discuss valuation matters and actions during the period, similar to those described earlier.
For investments categorized as Level 3, the Committee monitors information similar to that described above, which may include: (i) data specific to the issuer or comparable issuers, (ii) general market or specific sector news and (iii) quoted prices and specific or similar security transactions. The Committee considers this data and any changes from prior periods in order to assess the reasonableness of observable and unobservable inputs, any assumptions or internal models used to value those securities and changes in fair value. This data is also used to corroborate, when available, information received from approved pricing vendors and brokers. Various factors impact the frequency of monitoring this information (which may occur as often as daily). However, the Committee may determine that changes to inputs, assumptions and models are not required as a result of the monitoring procedures performed.
The following table is a summary of the inputs used to value the Fund’s investments at April 30, 2017:
| | Level 1
quoted prices
in active
markets for
identical
assets ($) | Level 2
other
significant
observable
inputs ($) | Level 3
significant
unobservable
inputs ($) | Investments
measured at
net asset
value ($) | Total ($) |
| Investments | | | | | |
| Asset-Backed Securities — Agency | — | 69,155,032 | — | — | 69,155,032 |
| Asset-Backed Securities — Non-Agency | — | 457,459,522 | 6,964,583 | — | 464,424,105 |
| Commercial Mortgage-Backed Securities - Agency | — | 22,877,357 | — | — | 22,877,357 |
| Commercial Mortgage-Backed Securities - Non-Agency | — | 69,640,043 | — | — | 69,640,043 |
| Common Stocks | | | | | |
| Financials | 81,325 | — | — | — | 81,325 |
| Industrials | 104,824 | — | — | — | 104,824 |
| Total Common Stocks | 186,149 | — | — | — | 186,149 |
| Convertible Preferred Stocks | | | | | |
| Financials | 6,067,100 | — | — | — | 6,067,100 |
| Corporate Bonds & Notes | — | 783,604,413 | 41,069 | — | 783,645,482 |
| Foreign Government Obligations | — | 28,194,029 | — | — | 28,194,029 |
| Municipal Bonds | — | 43,579,690 | — | — | 43,579,690 |
| Preferred Debt | 29,968,042 | — | — | — | 29,968,042 |
| Residential Mortgage-Backed Securities - Agency | — | 646,187,757 | — | — | 646,187,757 |
| Residential Mortgage-Backed Securities - Non-Agency | — | 98,391,725 | 21,047,680 | — | 119,439,405 |
| Senior Loans | — | 1,831,208 | — | — | 1,831,208 |
The accompanying Notes to Financial Statements are an integral part of this statement.
| 36 | Columbia Total Return Bond Fund | Annual Report 2017 |
Portfolio of Investments (continued)
April 30, 2017
Fair value measurements (continued)
| | Level 1
quoted prices
in active
markets for
identical
assets ($) | Level 2
other
significant
observable
inputs ($) | Level 3
significant
unobservable
inputs ($) | Investments
measured at
net asset
value ($) | Total ($) |
| U.S. Government & Agency Obligations | — | 29,250,764 | — | — | 29,250,764 |
| U.S. Treasury Obligations | 430,510,799 | 38,531,865 | — | — | 469,042,664 |
| Money Market Funds | — | — | — | 6,149,431 | 6,149,431 |
| Total Investments | 466,732,090 | 2,288,703,405 | 28,053,332 | 6,149,431 | 2,789,638,258 |
| Derivatives | | | | | |
| Asset | | | | | |
| Futures Contracts | 314,763 | — | — | — | 314,763 |
| Swap Contracts | — | 12,376,598 | — | — | 12,376,598 |
| Liability | | | | | |
| Futures Contracts | (1,400,940) | — | — | — | (1,400,940) |
| Swap Contracts | — | (10,371,989) | — | — | (10,371,989) |
| Total | 465,645,913 | 2,290,708,014 | 28,053,332 | 6,149,431 | 2,790,556,690 |
See the Portfolio of Investments for all investment classifications not indicated in the table.
The Fund’s assets assigned to the Level 2 input category are generally valued using the market approach, in which a security’s value is determined through reference to prices and information from market transactions for similar or identical assets.
Derivative instruments are valued at unrealized appreciation (depreciation).
There were no transfers of financial assets between Levels 1 and 2 during the period.
Financial assets were transferred from Level 3 to Level 2 as observable market inputs were utilized and management determined that there was sufficient, reliable and observable market data to value these assets as of period end.
Transfers between Levels are determined based on the fair value at the beginning of the period for security positions held throughout the period.
The following table is a reconciliation of Level 3 assets for which significant observable and unobservable inputs were used to determine fair value:
| Investments in securities | Balance
as of
04/30/2016
($) | Increase
(decrease)
in accrued
discounts/
premiums
($) | Realized
gain (loss)
($) | Change
in unrealized
appreciation
(depreciation)(a)
($) | Purchases
($) | Sales
($) | Transfers
into
Level 3
($) | Transfers
out of
Level 3
($) | Balance
as of
04/30/2017
($) |
| Asset-Backed Securities — Non-Agency | 23,480,213 | 934 | 169,130 | 821,294 | 4,196,200 | (21,703,188) | — | — | 6,964,583 |
| Commercial Mortgage-Backed Securities — Non-Agency | 2,932,244 | (248) | 60,791 | (32,920) | — | (2,959,867) | — | — | — |
| Common Stocks | — | — | — | — | — | — | — | — | — |
| Corporate Bonds & Notes | 41,069 | — | — | — | — | — | — | — | 41,069 |
| Residential Mortgage-Backed Securities — Agency | 15,149,681 | — | — | (35,283) | — | (15,114,398) | — | — | — |
| Residential Mortgage-Backed Securities — Non-Agency | 9,905,918 | 47,730 | 35,999 | 151,361 | 20,159,233 | (7,538,012) | — | (1,714,549) | 21,047,680 |
| Total | 51,509,125 | 48,416 | 265,920 | 904,452 | 24,355,433 | (47,315,465) | — | (1,714,549) | 28,053,332 |
(a) Change in unrealized appreciation (depreciation) relating to securities held at April 30, 2017 was $957,791, which is comprised of Asset-Backed Securities — Non-Agency of $866,716 and Residential Mortgage-Backed Securities — Non-Agency of $91,075.
The Fund’s assets assigned to the Level 3 category are valued utilizing the valuation technique deemed the most appropriate in the circumstances.
Certain corporate bonds and common stocks classified as Level 3 are valued using a market approach. To determine fair value for these securities, management considered various factors which may have included, but were not limited to, trades of similar securities, estimated earnings of the respective company, market multiples derived from a set of comparable companies, and the position of the security within the respective company’s capital structure. Significant increases (decreases) to any of these inputs would result in a significantly lower (higher) fair value measurement. Generally, a change in estimated earnings of the respective company might result in change to the comparable companies and market multiples.
Certain residential and asset backed securities classified as Level 3 securities are valued using the market approach and utilize single market quotations from broker dealers which may have included, but were not limited to, observable transactions for identical or similar assets in the market and the distressed nature of the security. The appropriateness of fair values for these securities is monitored on an ongoing basis which may include results of back testing, manual price reviews and other control procedures. Significant increases (decreases) to any of these inputs would result in a significantly lower (higher) fair value measurement.
The accompanying Notes to Financial Statements are an integral part of this statement.
Columbia Total Return Bond Fund | Annual Report 2017
| 37 |
Statement of Assets and Liabilities
April 30, 2017
| Assets | |
| Investments, at cost | |
| Unaffiliated issuers, at cost | $2,773,735,188 |
| Affiliated issuers, at cost | 6,148,997 |
| Total investments, at cost | 2,779,884,185 |
| Investments, at value | |
| Unaffiliated issuers, at value | 2,783,488,827 |
| Affiliated issuers, at value | 6,149,431 |
| Total investments, at value | 2,789,638,258 |
| Foreign currency (identified cost $157,957) | 106,009 |
| Cash collateral held at broker | 3,944,400 |
| Unrealized appreciation on swap contracts | 9,652,697 |
| Premiums paid on outstanding swap contracts | 22,689,046 |
| Receivable for: | |
| Investments sold | 24,899,622 |
| Investments sold on a delayed delivery basis | 32,538,667 |
| Capital shares sold | 5,039,235 |
| Dividends | 245,541 |
| Interest | 14,741,613 |
| Foreign tax reclaims | 29,456 |
| Variation margin | 672,392 |
| Expense reimbursement due from Investment Manager | 1,872 |
| Prepaid expenses | 5,984 |
| Trustees’ deferred compensation plan | 193,693 |
| Total assets | 2,904,398,485 |
| Liabilities | |
| Due to custodian | 1,233,395 |
| Unrealized depreciation on swap contracts | 7,311,010 |
| Premiums received on outstanding swap contracts | 19,312,973 |
| Payable for: | |
| Investments purchased | 19,214,227 |
| Investments purchased on a delayed delivery basis | 387,991,154 |
| Capital shares purchased | 2,944,047 |
| Distributions to shareholders | 5,075,957 |
| Variation margin | 834,674 |
| Management services fees | 32,524 |
| Distribution and/or service fees | 7,110 |
| Transfer agent fees | 257,041 |
| Plan administration fees | 23 |
| Compensation of board members | 39,003 |
| Compensation of chief compliance officer | 155 |
| Other expenses | 162,829 |
| Trustees’ deferred compensation plan | 193,693 |
| Other liabilities | 11,934 |
| Total liabilities | 444,621,749 |
| Net assets applicable to outstanding capital stock | $2,459,776,736 |
| Represented by | |
| Paid in capital | 2,479,224,681 |
| Excess of distributions over net investment income | (11,436,277) |
| Accumulated net realized loss | (18,632,225) |
| Unrealized appreciation (depreciation) on: | |
| Investments - unaffiliated issuers | 9,753,639 |
| Investments - affiliated issuers | 434 |
| Foreign currency translations | (51,948) |
| Futures contracts | (1,086,177) |
| Swap contracts | 2,004,609 |
| Total - representing net assets applicable to outstanding capital stock | $2,459,776,736 |
The accompanying Notes to Financial Statements are an integral part of this statement.
| 38 | Columbia Total Return Bond Fund | Annual Report 2017 |
Statement of Assets and Liabilities (continued)
April 30, 2017
| Class A | |
| Net assets | $820,441,232 |
| Shares outstanding | 90,797,740 |
| Net asset value per share | $9.04 |
| Maximum offering price per share(a) | $9.32 |
| Class B | |
| Net assets | $2,201,538 |
| Shares outstanding | 243,604 |
| Net asset value per share | $9.04 |
| Class C | |
| Net assets | $49,380,255 |
| Shares outstanding | 5,464,457 |
| Net asset value per share | $9.04 |
| Class K | |
| Net assets | $3,353,158 |
| Shares outstanding | 371,181 |
| Net asset value per share | $9.03 |
| Class R | |
| Net assets | $2,283,504 |
| Shares outstanding | 252,690 |
| Net asset value per share | $9.04 |
| Class R4 | |
| Net assets | $18,056,574 |
| Shares outstanding | 2,001,153 |
| Net asset value per share | $9.02 |
| Class R5 | |
| Net assets | $27,781,556 |
| Shares outstanding | 3,077,823 |
| Net asset value per share | $9.03 |
| Class T(b) | |
| Net assets | $7,177,581 |
| Shares outstanding | 794,591 |
| Net asset value per share | $9.03 |
| Maximum offering price per share(c) | $9.26 |
| Class Y | |
| Net assets | $445,183,863 |
| Shares outstanding | 49,240,352 |
| Net asset value per share | $9.04 |
| Class Z | |
| Net assets | $1,083,917,475 |
| Shares outstanding | 119,906,672 |
| Net asset value per share | $9.04 |
| (a) | The maximum offering price per share is calculated by dividing the net asset value per share by 1.0 minus the maximum sales charge of 3.00% for Class A. |
| (b) | Effective March 27, 2017, Class W shares were renamed Class T shares. |
| (c) | The maximum offering price per share is calculated by dividing the net asset value per share by 1.0 minus the maximum sales charge of 2.50% for Class T. |
The accompanying Notes to Financial Statements are an integral part of this statement.
Columbia Total Return Bond Fund | Annual Report 2017
| 39 |
Statement of Operations
Year Ended April 30, 2017
| Net investment income | |
| Income: | |
| Dividends — unaffiliated issuers | $2,001,860 |
| Dividends — affiliated issuers | 103,736 |
| Interest | 101,912,264 |
| Total income | 104,017,860 |
| Expenses: | |
| Management services fees | 13,987,904 |
| Distribution and/or service fees | |
| Class A | 2,323,070 |
| Class B | 40,323 |
| Class C | 541,007 |
| Class R | 10,627 |
| Class T(a) | 1,046,345 |
| Transfer agent fees | |
| Class A | 1,387,724 |
| Class B | 5,983 |
| Class C | 80,813 |
| Class I(b) | 10,665 |
| Class K | 5,123 |
| Class R | 3,195 |
| Class R4 | 19,877 |
| Class R5 | 13,499 |
| Class T(a) | 615,316 |
| Class Y | 4,967 |
| Class Z | 1,514,373 |
| Plan administration fees | |
| Class K | 24,234 |
| Compensation of board members | 77,745 |
| Custodian fees | 79,445 |
| Printing and postage fees | 236,607 |
| Registration fees | 158,902 |
| Audit fees | 47,637 |
| Legal fees | 77,312 |
| Compensation of chief compliance officer | 1,369 |
| Other | (393,555) |
| Total expenses | 21,920,507 |
| Fees waived or expenses reimbursed by Investment Manager and its affiliates | (1,085,663) |
| Expense reduction | (1,960) |
| Total net expenses | 20,832,884 |
| Net investment income | 83,184,976 |
The accompanying Notes to Financial Statements are an integral part of this statement.
| 40 | Columbia Total Return Bond Fund | Annual Report 2017 |
Statement of Operations (continued)
Year Ended April 30, 2017
| Realized and unrealized gain (loss) — net | |
| Net realized gain (loss) on: | |
| Investments — unaffiliated issuers | $48,830,529 |
| Investments — affiliated issuers | (5,569) |
| Foreign currency translations | (80,532) |
| Forward foreign currency exchange contracts | 90,382 |
| Futures contracts | (5,049,287) |
| Options purchased | 3,290,731 |
| Options contracts written | 1,316,345 |
| Swap contracts | (36,022,299) |
| Net realized gain | 12,370,300 |
| Net change in unrealized appreciation (depreciation) on: | |
| Investments — unaffiliated issuers | (27,915,734) |
| Investments — affiliated issuers | 434 |
| Foreign currency translations | (9,985) |
| Futures contracts | (1,948,539) |
| Options purchased | 439,071 |
| Options contracts written | 43,092 |
| Swap contracts | 5,540,240 |
| Net change in unrealized appreciation (depreciation) | (23,851,421) |
| Net realized and unrealized loss | (11,481,121) |
| Net increase in net assets resulting from operations | $71,703,855 |
| (a) | Effective March 27, 2017, Class W shares were renamed Class T shares. |
| (b) | Effective March 27, 2017, Class I shares were redeemed or exchanged for Class Y shares. |
The accompanying Notes to Financial Statements are an integral part of this statement.
Columbia Total Return Bond Fund | Annual Report 2017
| 41 |
Statement of Changes in Net Assets
| | Year Ended
April 30, 2017 | Year Ended
April 30, 2016 |
| Operations | | |
| Net investment income | $83,184,976 | $84,277,103 |
| Net realized gain (loss) | 12,370,300 | (12,864,379) |
| Net change in unrealized appreciation (depreciation) | (23,851,421) | 10,198,513 |
| Net increase in net assets resulting from operations | 71,703,855 | 81,611,237 |
| Distributions to shareholders | | |
| Net investment income | | |
| Class A | (23,614,095) | (21,854,015) |
| Class B | (71,803) | (86,058) |
| Class C | (967,189) | (652,734) |
| Class I(a) | (11,324,590) | (8,486,350) |
| Class K | (253,593) | (228,572) |
| Class R | (49,004) | (45,010) |
| Class R4 | (369,491) | (171,793) |
| Class R5 | (687,723) | (501,470) |
| Class T(b) | (10,761,090) | (10,390,799) |
| Class Y | (1,724,891) | (409,821) |
| Class Z | (28,260,974) | (25,015,987) |
| Net realized gains | | |
| Class A | (14,462,320) | (13,263,948) |
| Class B | (60,023) | (84,555) |
| Class C | (843,556) | (646,345) |
| Class I(a) | (6,422,044) | (4,464,242) |
| Class K | (178,228) | (132,525) |
| Class R | (35,864) | (36,080) |
| Class R4 | (282,696) | (92,423) |
| Class R5 | (361,965) | (266,663) |
| Class T(b) | (7,513,363) | (6,730,155) |
| Class Y | (291,165) | (218,301) |
| Class Z | (15,192,584) | (13,507,425) |
| Total distributions to shareholders | (123,728,251) | (107,285,271) |
| Decrease in net assets from capital stock activity | (654,270,816) | (305,143,329) |
| Total decrease in net assets | (706,295,212) | (330,817,363) |
| Net assets at beginning of year | 3,166,071,948 | 3,496,889,311 |
| Net assets at end of year | $2,459,776,736 | $3,166,071,948 |
| Undistributed (excess of distributions over) net investment income | $(11,436,277) | $4,536,980 |
| (a) | Effective March 27, 2017, Class I shares were redeemed or exchanged for Class Y shares. |
| (b) | Effective March 27, 2017, Class W shares were renamed Class T shares. |
The accompanying Notes to Financial Statements are an integral part of this statement.
| 42 | Columbia Total Return Bond Fund | Annual Report 2017 |
Statement of Changes in Net Assets (continued)
| | Year Ended | Year Ended |
| | April 30, 2017 | April 30, 2016 |
| | Shares | Dollars ($) | Shares | Dollars ($) |
| Capital stock activity |
| Class A | | | | |
| Subscriptions (a) | 6,661,894 | 61,144,580 | 8,240,977 | 74,719,720 |
| Distributions reinvested | 3,942,127 | 35,754,633 | 3,616,019 | 32,681,095 |
| Redemptions | (26,215,905) | (237,927,346) | (40,336,791) | (367,210,613) |
| Net decrease | (15,611,884) | (141,028,133) | (28,479,795) | (259,809,798) |
| Class B | | | | |
| Subscriptions | 12,286 | 113,871 | 30,181 | 273,499 |
| Distributions reinvested | 13,334 | 120,868 | 16,731 | 151,039 |
| Redemptions (a) | (355,161) | (3,239,503) | (699,553) | (6,350,408) |
| Net decrease | (329,541) | (3,004,764) | (652,641) | (5,925,870) |
| Class C | | | | |
| Subscriptions | 714,416 | 6,574,669 | 716,784 | 6,494,185 |
| Distributions reinvested | 178,381 | 1,614,690 | 125,289 | 1,130,608 |
| Redemptions | (1,515,584) | (13,806,947) | (1,304,196) | (11,844,278) |
| Net decrease | (622,787) | (5,617,588) | (462,123) | (4,219,485) |
| Class I(b) | | | | |
| Subscriptions | 8,248,118 | 75,149,073 | 15,526,943 | 141,479,693 |
| Distributions reinvested | 1,865,934 | 16,971,503 | 1,430,441 | 12,950,244 |
| Redemptions | (55,924,363) | (504,565,813) | (23,686,150) | (215,994,196) |
| Net decrease | (45,810,311) | (412,445,237) | (6,728,766) | (61,564,259) |
| Class K | | | | |
| Subscriptions | 108,353 | 990,928 | 245,441 | 2,225,606 |
| Distributions reinvested | 47,551 | 431,401 | 39,932 | 360,779 |
| Redemptions | (1,072,105) | (9,652,634) | (185,611) | (1,686,186) |
| Net increase (decrease) | (916,201) | (8,230,305) | 99,762 | 900,199 |
| Class R | | | | |
| Subscriptions | 141,055 | 1,301,408 | 166,721 | 1,515,815 |
| Distributions reinvested | 7,898 | 71,447 | 7,411 | 66,945 |
| Redemptions | (158,013) | (1,449,847) | (211,519) | (1,914,425) |
| Net decrease | (9,060) | (76,992) | (37,387) | (331,665) |
| Class R4 | | | | |
| Subscriptions | 1,412,732 | 12,919,784 | 433,627 | 3,947,722 |
| Distributions reinvested | 69,549 | 626,988 | 27,223 | 245,785 |
| Redemptions | (381,168) | (3,462,997) | (389,251) | (3,546,202) |
| Net increase | 1,101,113 | 10,083,775 | 71,599 | 647,305 |
| Class R5 | | | | |
| Subscriptions | 779,317 | 7,043,171 | 517,182 | 4,707,971 |
| Distributions reinvested | 115,782 | 1,049,222 | 85,019 | 767,788 |
| Redemptions | (280,143) | (2,554,494) | (473,998) | (4,291,461) |
| Net increase | 614,956 | 5,537,899 | 128,203 | 1,184,298 |
| Class T(c) | | | | |
| Subscriptions | 9,080,031 | 84,105,553 | 26,310,748 | 239,845,328 |
| Distributions reinvested | 2,008,338 | 18,274,032 | 1,893,054 | 17,120,639 |
| Redemptions | (71,410,520) | (646,272,181) | (16,023,295) | (145,618,334) |
| Net increase (decrease) | (60,322,151) | (543,892,596) | 12,180,507 | 111,347,633 |
| Class Y | | | | |
| Subscriptions | 49,029,754 | 440,859,174 | 511,585 | 4,636,517 |
| Distributions reinvested | 222,421 | 2,013,245 | 69,282 | 626,841 |
| Redemptions | (1,977,204) | (17,865,913) | (586,205) | (5,289,699) |
| Net increase (decrease) | 47,274,971 | 425,006,506 | (5,338) | (26,341) |
The accompanying Notes to Financial Statements are an integral part of this statement.
Columbia Total Return Bond Fund | Annual Report 2017
| 43 |
Statement of Changes in Net Assets (continued)
| | Year Ended | Year Ended |
| | April 30, 2017 | April 30, 2016 |
| | Shares | Dollars ($) | Shares | Dollars ($) |
| Class Z | | | | |
| Subscriptions | 29,415,866 | 265,586,748 | 23,866,857 | 217,046,791 |
| Distributions reinvested | 2,394,950 | 21,738,389 | 1,889,016 | 17,081,530 |
| Redemptions | (29,190,155) | (267,928,518) | (35,463,542) | (321,473,667) |
| Net increase (decrease) | 2,620,661 | 19,396,619 | (9,707,669) | (87,345,346) |
| Total net decrease | (72,010,234) | (654,270,816) | (33,593,648) | (305,143,329) |
| (a) | Includes conversions of Class B shares to Class A shares, if any. |
| (b) | Effective March 27, 2017, Class I shares were redeemed or exchanged for Class Y shares. |
| (c) | Effective March 27, 2017, Class W shares were renamed Class T shares. |
The accompanying Notes to Financial Statements are an integral part of this statement.
| 44 | Columbia Total Return Bond Fund | Annual Report 2017 |
[THIS PAGE INTENTIONALLY LEFT BLANK]
Columbia Total Return Bond Fund | Annual Report 2017
| 45 |
The following table is intended to help you understand the Fund’s financial performance. Certain information reflects financial results for a single share of a class held for the periods shown. Per share net investment income (loss) amounts are calculated based on average shares outstanding during the period. Total return assumes reinvestment of all dividends and distributions, if any. Total return does not reflect payment of sales charges, if any. Total return and portfolio turnover are not annualized for periods of less than one year. The portfolio turnover rate is calculated without regard to purchase and sales transactions of short-term instruments and certain derivatives, if any. If such transactions were included, the Fund’s portfolio turnover rate may be higher.
| Year ended | Net asset value,
beginning of
period | Net
investment
income | Net
realized
and
unrealized
gain (loss) | Total from
investment
operations | Distributions
from net
investment
income | Distributions
from net
realized
gains |
| Class A |
| 4/30/2017 | $9.20 | 0.25 | (0.04) | 0.21 | (0.23) | (0.14) |
| 4/30/2016 | $9.25 | 0.22 | 0.01 (e) | 0.23 | (0.17) | (0.11) |
| 4/30/2015 | $9.15 | 0.23 | 0.09 | 0.32 | (0.22) | — |
| 4/30/2014 | $9.49 | 0.24 | (0.31) | (0.07) | (0.21) | (0.06) |
| 4/30/2013 | $9.39 | 0.28 | 0.23 | 0.51 | (0.26) | (0.15) |
| Class B |
| 4/30/2017 | $9.19 | 0.18 | (0.03) | 0.15 | (0.16) | (0.14) |
| 4/30/2016 | $9.25 | 0.14 | 0.01 (e) | 0.15 | (0.10) | (0.11) |
| 4/30/2015 | $9.15 | 0.16 | 0.09 | 0.25 | (0.15) | — |
| 4/30/2014 | $9.49 | 0.17 | (0.30) | (0.13) | (0.15) | (0.06) |
| 4/30/2013 | $9.39 | 0.21 | 0.23 | 0.44 | (0.19) | (0.15) |
| Class C |
| 4/30/2017 | $9.20 | 0.18 | (0.04) | 0.14 | (0.16) | (0.14) |
| 4/30/2016 | $9.25 | 0.15 | 0.01 (e) | 0.16 | (0.10) | (0.11) |
| 4/30/2015 | $9.15 | 0.17 | 0.09 | 0.26 | (0.16) | — |
| 4/30/2014 | $9.49 | 0.19 | (0.31) | (0.12) | (0.16) | (0.06) |
| 4/30/2013 | $9.39 | 0.22 | 0.23 | 0.45 | (0.20) | (0.15) |
| Class K |
| 4/30/2017 | $9.19 | 0.26 | (0.04) | 0.22 | (0.24) | (0.14) |
| 4/30/2016 | $9.25 | 0.22 | 0.01 (e) | 0.23 | (0.18) | (0.11) |
| 4/30/2015 | $9.15 | 0.23 | 0.10 | 0.33 | (0.23) | — |
| 4/30/2014 | $9.49 | 0.25 | (0.31) | (0.06) | (0.22) | (0.06) |
| 4/30/2013 (f) | $9.42 | 0.05 | 0.06 | 0.11 | (0.04) | — |
| Class R |
| 4/30/2017 | $9.20 | 0.22 | (0.03) | 0.19 | (0.21) | (0.14) |
| 4/30/2016 | $9.26 | 0.19 | 0.01 (e) | 0.20 | (0.15) | (0.11) |
| 4/30/2015 | $9.15 | 0.20 | 0.11 | 0.31 | (0.20) | — |
| 4/30/2014 | $9.49 | 0.22 | (0.31) | (0.09) | (0.19) | (0.06) |
| 4/30/2013 | $9.39 | 0.26 | 0.23 | 0.49 | (0.24) | (0.15) |
| Class R4 |
| 4/30/2017 | $9.18 | 0.26 | (0.02) | 0.24 | (0.26) | (0.14) |
| 4/30/2016 | $9.24 | 0.24 | 0.00 (e),(h) | 0.24 | (0.19) | (0.11) |
| 4/30/2015 | $9.14 | 0.25 | 0.10 | 0.35 | (0.25) | — |
| 4/30/2014 | $9.48 | 0.27 | (0.31) | (0.04) | (0.24) | (0.06) |
| 4/30/2013 (i) | $9.66 | 0.14 | (0.05) (e) | 0.09 | (0.12) | (0.15) |
The accompanying Notes to Financial Statements are an integral part of this statement.
| 46 | Columbia Total Return Bond Fund | Annual Report 2017 |
Total
distributions to
shareholders | Net
asset
value,
end of
period | Total
return | Total gross
expense
ratio to
average
net assets(a) | Total net
expense
ratio to
average
net assets(a),(b) | Net investment
income
ratio to
average
net assets | Portfolio
turnover | Net
assets,
end of
period
(000’s) |
| |
| (0.37) | $9.04 | 2.37% | 0.89% (c) | 0.84% (c),(d) | 2.70% | 379% | $820,441 |
| (0.28) | $9.20 | 2.58% | 0.91% | 0.86% (d) | 2.39% | 458% | $978,460 |
| (0.22) | $9.25 | 3.56% | 0.92% | 0.85% (d) | 2.45% | 316% | $1,248,168 |
| (0.27) | $9.15 | (0.62%) | 0.91% | 0.85% (d) | 2.67% | 274% | $1,473,961 |
| (0.41) | $9.49 | 5.52% | 0.94% | 0.86% (d) | 2.94% | 239% | $2,168,079 |
| |
| (0.30) | $9.04 | 1.72% | 1.63% (c) | 1.59% (c),(d) | 1.99% | 379% | $2,202 |
| (0.21) | $9.19 | 1.70% | 1.66% | 1.61% (d) | 1.59% | 458% | $5,270 |
| (0.15) | $9.25 | 2.79% | 1.67% | 1.60% (d) | 1.71% | 316% | $11,344 |
| (0.21) | $9.15 | (1.36%) | 1.66% | 1.60% (d) | 1.90% | 274% | $18,976 |
| (0.34) | $9.49 | 4.74% | 1.69% | 1.61% (d) | 2.20% | 239% | $41,955 |
| |
| (0.30) | $9.04 | 1.61% | 1.64% (c) | 1.59% (c),(d) | 1.95% | 379% | $49,380 |
| (0.21) | $9.20 | 1.81% | 1.66% | 1.61% (d) | 1.65% | 458% | $55,975 |
| (0.16) | $9.25 | 2.89% | 1.67% | 1.50% (d) | 1.80% | 316% | $60,605 |
| (0.22) | $9.15 | (1.21%) | 1.66% | 1.45% (d) | 2.07% | 274% | $64,739 |
| (0.35) | $9.49 | 4.90% | 1.69% | 1.46% (d) | 2.37% | 239% | $95,745 |
| |
| (0.38) | $9.03 | 2.42% | 0.79% (c) | 0.78% (c) | 2.81% | 379% | $3,353 |
| (0.29) | $9.19 | 2.54% | 0.80% | 0.79% | 2.49% | 458% | $11,833 |
| (0.23) | $9.25 | 3.63% | 0.80% | 0.79% | 2.52% | 316% | $10,984 |
| (0.28) | $9.15 | (0.53%) | 0.74% | 0.74% | 2.67% | 274% | $14,168 |
| (0.04) | $9.49 | 1.19% | 0.79% (g) | 0.79% (g) | 2.97% (g) | 239% | $75,741 |
| |
| (0.35) | $9.04 | 2.12% | 1.14% (c) | 1.09% (c),(d) | 2.43% | 379% | $2,284 |
| (0.26) | $9.20 | 2.21% | 1.16% | 1.11% (d) | 2.13% | 458% | $2,407 |
| (0.20) | $9.26 | 3.41% | 1.17% | 1.10% (d) | 2.19% | 316% | $2,769 |
| (0.25) | $9.15 | (0.87%) | 1.16% | 1.10% (d) | 2.43% | 274% | $2,750 |
| (0.39) | $9.49 | 5.26% | 1.20% | 1.12% (d) | 2.73% | 239% | $3,052 |
| |
| (0.40) | $9.02 | 2.63% | 0.63% (c) | 0.59% (c),(d) | 2.87% | 379% | $18,057 |
| (0.30) | $9.18 | 2.72% | 0.66% | 0.61% (d) | 2.65% | 458% | $8,265 |
| (0.25) | $9.24 | 3.82% | 0.67% | 0.60% (d) | 2.70% | 316% | $7,656 |
| (0.30) | $9.14 | (0.38%) | 0.67% | 0.60% (d) | 3.02% | 274% | $7,477 |
| (0.27) | $9.48 | 0.99% | 0.67% (g) | 0.60% (g) | 3.26% (g) | 239% | $57 |
Columbia Total Return Bond Fund | Annual Report 2017
| 47 |
Financial Highlights (continued)
| Year ended | Net asset value,
beginning of
period | Net
investment
income | Net
realized
and
unrealized
gain (loss) | Total from
investment
operations | Distributions
from net
investment
income | Distributions
from net
realized
gains |
| Class R5 |
| 4/30/2017 | $9.18 | 0.27 | (0.02) | 0.25 | (0.26) | (0.14) |
| 4/30/2016 | $9.24 | 0.25 | 0.00 (e),(h) | 0.25 | (0.20) | (0.11) |
| 4/30/2015 | $9.14 | 0.25 | 0.10 | 0.35 | (0.25) | — |
| 4/30/2014 | $9.48 | 0.28 | (0.31) | (0.03) | (0.25) | (0.06) |
| 4/30/2013 (j) | $9.66 | 0.15 | (0.05) (e) | 0.10 | (0.13) | (0.15) |
| Class T(k) |
| 4/30/2017 | $9.21 | 0.26 | (0.07) | 0.19 | (0.23) | (0.14) |
| 4/30/2016 | $9.26 | 0.22 | 0.01 (e) | 0.23 | (0.17) | (0.11) |
| 4/30/2015 | $9.16 | 0.23 | 0.09 | 0.32 | (0.22) | — |
| 4/30/2014 | $9.50 | 0.24 | (0.30) | (0.06) | (0.22) | (0.06) |
| 4/30/2013 | $9.39 | 0.27 | 0.25 | 0.52 | (0.26) | (0.15) |
| Class Y |
| 4/30/2017 | $9.20 | 0.24 | 0.01 (e) | 0.25 | (0.27) | (0.14) |
| 4/30/2016 | $9.26 | 0.25 | 0.00 (e),(h) | 0.25 | (0.20) | (0.11) |
| 4/30/2015 | $9.16 | 0.26 | 0.10 | 0.36 | (0.26) | — |
| 4/30/2014 | $9.49 | 0.29 | (0.31) | (0.02) | (0.25) | (0.06) |
| 4/30/2013 (l) | $9.67 | 0.14 | (0.04) (e) | 0.10 | (0.13) | (0.15) |
| Class Z |
| 4/30/2017 | $9.20 | 0.27 | (0.03) | 0.24 | (0.26) | (0.14) |
| 4/30/2016 | $9.26 | 0.24 | 0.00 (e),(h) | 0.24 | (0.19) | (0.11) |
| 4/30/2015 | $9.15 | 0.25 | 0.11 | 0.36 | (0.25) | — |
| 4/30/2014 | $9.49 | 0.27 | (0.31) | (0.04) | (0.24) | (0.06) |
| 4/30/2013 | $9.39 | 0.31 | 0.23 | 0.54 | (0.29) | (0.15) |
| Notes to Financial Highlights |
| (a) | In addition to the fees and expenses that the Fund bears directly, the Fund indirectly bears a pro rata share of the fees and expenses of any other funds in which it invests. Such indirect expenses are not included in the Fund’s reported expense ratios. |
| (b) | Total net expenses include the impact of certain fee waivers/expense reimbursements made by the Investment Manager and certain of its affiliates, if applicable. |
| (c) | Expenses have been reduced due to a reimbursement of expenses overbilled by a third party. If the reimbursement had been excluded, the expense ratios would have been higher by the percentages shown for each class in the table below. All fee waivers and expense reimbursements by the Investment Manager and its affiliates were applied before giving effect to this third party reimbursement. |
| | Class A | Class B | Class C | Class K | Class R | Class R4 | Class R5 | Class T | Class Y | Class Z |
| 04/30/2017 | 0.02 % | 0.02 % | 0.02 % | 0.02 % | 0.02 % | 0.02 % | 0.02 % | 0.02 % | 0.01 % | 0.02 % |
| (d) | The benefits derived from expense reductions had an impact of less than 0.01%. |
| (e) | Calculation of the net gain (loss) per share (both realized and unrealized) does not correlate to the aggregate realized and unrealized gain (loss) presented in the Statement of Operations due to the timing of subscriptions and redemptions of Fund shares in relation to fluctuations in the market value of the portfolio. |
| (f) | Class K shares commenced operations on February 28, 2013. Per share data and total return reflect activity from that date. |
| (g) | Annualized. |
| (h) | Rounds to zero. |
| (i) | Class R4 shares commenced operations on November 8, 2012. Per share data and total return reflect activity from that date. |
| (j) | Class R5 shares commenced operations on November 8, 2012. Per share data and total return reflect activity from that date. |
| (k) | Effective March 27, 2017, Class W shares were renamed Class T shares. |
| (l) | Class Y shares commenced operations on November 8, 2012. Per share data and total return reflect activity from that date. |
The accompanying Notes to Financial Statements are an integral part of this statement.
| 48 | Columbia Total Return Bond Fund | Annual Report 2017 |
Total
distributions to
shareholders | Net
asset
value,
end of
period | Total
return | Total gross
expense
ratio to
average
net assets(a) | Total net
expense
ratio to
average
net assets(a),(b) | Net investment
income
ratio to
average
net assets | Portfolio
turnover | Net
assets,
end of
period
(000’s) |
| |
| (0.40) | $9.03 | 2.79% | 0.54% (c) | 0.54% (c) | 2.99% | 379% | $27,782 |
| (0.31) | $9.18 | 2.80% | 0.55% | 0.54% | 2.73% | 458% | $22,621 |
| (0.25) | $9.24 | 3.89% | 0.55% | 0.54% | 2.74% | 316% | $21,580 |
| (0.31) | $9.14 | (0.28%) | 0.51% | 0.50% | 3.15% | 274% | $15,980 |
| (0.28) | $9.48 | 1.03% | 0.54% (g) | 0.54% (g) | 3.30% (g) | 239% | $318 |
| |
| (0.37) | $9.03 | 2.15% | 0.88% (c) | 0.84% (c),(d) | 2.81% | 379% | $7,178 |
| (0.28) | $9.21 | 2.58% | 0.91% | 0.86% (d) | 2.41% | 458% | $562,638 |
| (0.22) | $9.26 | 3.56% | 0.92% | 0.85% (d) | 2.45% | 316% | $453,340 |
| (0.28) | $9.16 | (0.62%) | 0.91% | 0.85% (d) | 2.68% | 274% | $507,419 |
| (0.41) | $9.50 | 5.59% | 0.92% | 0.85% (d) | 2.91% | 239% | $752,819 |
| |
| (0.41) | $9.04 | 2.74% | 0.50% (c) | 0.50% (c) | 2.70% | 379% | $445,184 |
| (0.31) | $9.20 | 2.85% | 0.50% | 0.49% | 2.77% | 458% | $18,086 |
| (0.26) | $9.26 | 3.94% | 0.50% | 0.49% | 2.80% | 316% | $18,249 |
| (0.31) | $9.16 | (0.17%) | 0.51% | 0.50% | 3.21% | 274% | $15,642 |
| (0.28) | $9.49 | 1.05% | 0.45% (g) | 0.45% (g) | 3.18% (g) | 239% | $2 |
| |
| (0.40) | $9.04 | 2.63% | 0.64% (c) | 0.59% (c),(d) | 2.94% | 379% | $1,083,917 |
| (0.30) | $9.20 | 2.72% | 0.66% | 0.61% (d) | 2.64% | 458% | $1,078,815 |
| (0.25) | $9.26 | 3.93% | 0.67% | 0.60% (d) | 2.69% | 316% | $1,175,483 |
| (0.30) | $9.15 | (0.37%) | 0.66% | 0.60% (d) | 2.92% | 274% | $1,289,621 |
| (0.44) | $9.49 | 5.79% | 0.70% | 0.62% (d) | 3.23% | 239% | $1,915,534 |
Columbia Total Return Bond Fund | Annual Report 2017
| 49 |
Notes to Financial Statements
April 30, 2017
Note 1. Organization
Columbia Total Return Bond Fund (the Fund), a series of Columbia Funds Series Trust I (the Trust), is a diversified fund. The Trust is registered under the Investment Company Act of 1940, as amended (the 1940 Act), as an open-end management investment company organized as a Massachusetts business trust.
Fund shares
The Trust may issue an unlimited number of shares (without par value). Although all share classes generally have identical voting, dividend and liquidation rights, each share class votes separately when required by the Trust’s organizational documents or by law. Different share classes pay different distribution amounts to the extent the expenses of such share classes differ, and distributions in liquidation will be proportional to the net asset value of each share class. Each share class has its own expense and sales charge structure. The Fund offers each of the share classes identified below.
Class A shares are subject to a maximum front-end sales charge of 3.00% based on the initial investment amount. Class A shares purchased without an initial sales charge in accounts aggregating $1 million to $50 million at the time of purchase are subject to a contingent deferred sales charge (CDSC) if the shares are sold within 18 months after purchase, charged as follows: 1.00% CDSC if redeemed within 12 months after purchase, and 0.50% CDSC if redeemed more than 12, but less than 18, months after purchase.
The Fund no longer accepts investments by new or existing investors in the Fund’s Class B shares, except in connection with the reinvestment of any dividend and/or capital gain distributions in Class B shares of the Fund and exchanges by existing Class B shareholders of certain other funds within the Columbia Family of Funds. Class B shares are typically subject to a maximum CDSC of 3.00% based upon the holding period after purchase. However, the Fund’s current Class B investors, having held their shares for the requisite time period, are no longer subject to a CDSC upon redemption of their shares. Effective on or about July 17, 2017, Class B shares will automatically convert to Class A shares and the Fund will no longer accept investments by new or existing investors in Class B shares.
Class C shares are subject to a 1.00% CDSC on shares redeemed within 12 months after purchase.
Effective March 27, 2017, Class I shares of the Fund are no longer offered for sale. Class I shares, when available, were not subject to sales charges or distribution and service (12b-1) fees, and were made available only to the Columbia Family of Funds. On March 27, 2017, Class I shares were redeemed or exchanged for Class Y shares of the Fund in a tax free transaction that had no impact on the fees and expenses paid by shareholders.
Class K shares are not subject to sales charges; however, this share class is closed to new investors.
Class R shares are not subject to sales charges and are generally available only to certain retirement plans and other investors as described in the Fund’s prospectus.
Class R4 shares are not subject to sales charges and are generally available only to omnibus retirement plans and certain investors as described in the Fund’s prospectus.
Class R5 shares are not subject to sales charges and are generally available only to investors purchasing through authorized investment professionals and omnibus retirement plans.
Class T shares are subject to a maximum front-end sales charge of 2.50% per transaction and must be purchased through financial intermediaries that, by written agreement with Columbia Management Investment Distributors, Inc., are specifically authorized to sell Class T shares. Prior to March 27, 2017, Class T shares were known as Class W shares, were not subject to sales charges, and were generally available only to investors purchasing through authorized investment programs managed by investment professionals, including discretionary managed accounts.
Class Y shares are not subject to sales charges or distribution and service (12b-1) fees, and are available to institutional and certain other investors as described in the Fund’s prospectus. On March 27, 2017, Class I shares were redeemed or exchanged for Class Y shares of the Fund in a tax free transaction that had no impact on the fees and expenses paid by shareholders. Class I shares of the Fund are no longer offered for sale.
| 50 | Columbia Total Return Bond Fund | Annual Report 2017 |
Notes to Financial Statements (continued)
April 30, 2017
Class Z shares are not subject to sales charges and are generally available only to eligible investors, which are subject to different investment minimums as described in the Fund’s prospectus.
Note 2. Summary of significant accounting policies
Basis of preparation
The Fund is an investment company that applies the accounting and reporting guidance in the Financial Accounting Standards Board (FASB) Accounting Standards Codification Topic 946, Financial Services - Investment Companies (ASC 946). The financial statements are prepared in accordance with U.S. generally accepted accounting principles (GAAP), which requires management to make certain estimates and assumptions that affect the reported amounts of assets and liabilities, the disclosure of contingent assets and liabilities at the date of the financial statements and the reported amounts of income and expenses during the reporting period. Actual results could differ from those estimates. The Fund received a reimbursement for expenses overbilled by a third party. Such reimbursement is included as an offset to Other expenses on the Statement of Operations. All fee waivers and expense reimbursements by the Investment Manager and its affiliates were applied before giving effect to the third party reimbursement.
The following is a summary of significant accounting policies followed by the Fund in the preparation of its financial statements.
Security valuation
All equity securities are valued at the close of business of the New York Stock Exchange. Equity securities are valued at the last quoted sales price on the principal exchange or market on which they trade, except for securities traded on the NASDAQ Stock Market, which are valued at the NASDAQ official close price. Unlisted securities or listed securities for which there were no sales during the day are valued at the mean of the latest quoted bid and ask prices on such exchanges or markets.
Debt securities generally are valued by pricing services approved by the Board of Trustees based upon market transactions for normal, institutional-size trading units of similar securities. The services may use various pricing techniques that take into account, as applicable, factors such as yield, quality, coupon rate, maturity, type of issue, trading characteristics and other data, as well as approved independent broker-dealer quotes. Debt securities for which quotations are not readily available or not believed to be reflective of market value may also be valued based upon a bid quote from an approved independent broker-dealer. Debt securities maturing in 60 days or less are valued primarily at amortized cost value, unless this method results in a valuation that management believes does not approximate market value.
Asset- and mortgage-backed securities are generally valued by pricing services, which utilize pricing models that incorporate the securities’ cash flow and loan performance data. These models also take into account available market data, including trades, market quotations, and benchmark yield curves for identical or similar securities. Factors used to identify similar securities may include, but are not limited to, issuer, collateral type, vintage, prepayment speeds, collateral performance, credit ratings, credit enhancement and expected life. Asset-backed securities for which quotations are readily available may also be valued based upon an over-the-counter or exchange bid quote from an approved independent broker-dealer.
Senior loan securities for which reliable market quotations are readily available are generally valued by pricing services at the average of the bids received.
Investments in open-end investment companies, including money market funds, are valued at their latest net asset value.
Futures and options on futures contracts are valued based upon the settlement price at the close of regular trading on their principal exchanges or, in the absence of transactions, at the mean of the latest quoted bid and ask prices.
Swap transactions are valued through an independent pricing service or broker, or if neither is available, through an internal model based upon observable inputs.
Columbia Total Return Bond Fund | Annual Report 2017
| 51 |
Notes to Financial Statements (continued)
April 30, 2017
Investments for which market quotations are not readily available, or that have quotations which management believes are not reflective of market value or reliable, are valued at fair value as determined in good faith under procedures approved by and under the general supervision of the Board of Trustees. If a security or class of securities (such as foreign securities) is valued at fair value, such value is likely to be different from the quoted or published price for the security.
The determination of fair value often requires significant judgment. To determine fair value, management may use assumptions including but not limited to future cash flows and estimated risk premiums. Multiple inputs from various sources may be used to determine fair value.
GAAP requires disclosure regarding the inputs and valuation techniques used to measure fair value and any changes in valuation inputs or techniques. In addition, investments shall be disclosed by major category. This information is disclosed following the Fund’s Portfolio of Investments.
Foreign currency transactions and translations
The values of all assets and liabilities denominated in foreign currencies are generally translated into U.S. dollars at exchange rates determined at the close of regular trading on the New York Stock Exchange. Net realized and unrealized gains (losses) on foreign currency transactions and translations include gains (losses) arising from the fluctuation in exchange rates between trade and settlement dates on securities transactions, gains (losses) arising from the disposition of foreign currency and currency gains (losses) between the accrual and payment dates on dividends, interest income and foreign withholding taxes.
For financial statement purposes, the Fund does not distinguish that portion of gains (losses) on investments which is due to changes in foreign exchange rates from that which is due to changes in market prices of the investments. Such fluctuations are included with the net realized and unrealized gains (losses) on investments in the Statement of Operations.
Derivative instruments
The Fund invests in certain derivative instruments, as detailed below, to meet its investment objectives. Derivatives are instruments whose values depend on, or are derived from, in whole or in part, the value of one or more securities, currencies, commodities, indices, or other assets or instruments. Derivatives may be used to increase investment flexibility (including to maintain cash reserves while maintaining desired exposure to certain assets), for risk management (hedging) purposes, to facilitate trading, to reduce transaction costs and to pursue higher investment returns. The Fund may also use derivative instruments to mitigate certain investment risks, such as foreign currency exchange rate risk, interest rate risk and credit risk. Derivatives may involve various risks, including the potential inability of the counterparty to fulfill its obligations under the terms of the contract, the potential for an illiquid secondary market (making it difficult for the Fund to sell or terminate, including at favorable prices) and the potential for market movements which may expose the Fund to gains or losses in excess of the amount shown in the Statement of Assets and Liabilities. The notional amounts of derivative instruments, if applicable, are not recorded in the financial statements.
A derivative instrument may suffer a marked-to-market loss if the value of the contract decreases due to an unfavorable change in the market rates or values of the underlying instrument. Losses can also occur if the counterparty does not perform its obligations under the contract. The Fund’s risk of loss from counterparty credit risk on over-the-counter derivatives is generally limited to the aggregate unrealized gain netted against any collateral held by the Fund and the amount of any variation margin held by the counterparty, plus any replacement costs or related amounts. With exchange-traded or centrally cleared derivatives, there is reduced counterparty credit risk to the Fund since the clearinghouse or central counterparty (CCP) provides some protection in the case of clearing member default. The clearinghouse or CCP stands between the buyer and the seller of the contract; therefore, additional counterparty credit risk is failure of the clearinghouse or CCP. However, credit risk still exists in exchange-traded or centrally cleared derivatives with respect to initial and variation margin that is held in a broker’s customer account. While brokers are required to segregate customer margin from their own assets, in the event that a broker becomes insolvent or goes into bankruptcy and at that time there is a shortfall in the aggregate amount of margin held by the broker for all its clients, U.S. bankruptcy laws will typically allocate that shortfall on a pro-rata basis across all the broker’s customers (including the Fund), potentially resulting in losses to the Fund.
| 52 | Columbia Total Return Bond Fund | Annual Report 2017 |
Notes to Financial Statements (continued)
April 30, 2017
In order to better define its contractual rights and to secure rights that will help the Fund mitigate its counterparty risk, the Fund may enter into an International Swaps and Derivatives Association, Inc. Master Agreement (ISDA Master Agreement) or similar agreement with its derivatives contract counterparties. An ISDA Master Agreement is an agreement between the Fund and a counterparty that governs over-the-counter derivatives and typically contains, among other things, collateral posting terms and netting provisions in the event of a default and/or termination event. Under an ISDA Master Agreement, the Fund may, under certain circumstances, offset with the counterparty certain derivative instrument’s payables and/or receivables with collateral held and/or posted and create one single net payment. The provisions of the ISDA Master Agreement typically permit a single net payment in the event of default (close-out netting), including the bankruptcy or insolvency of the counterparty. Note, however, that bankruptcy or insolvency laws of a particular jurisdiction may impose restrictions on or prohibitions against the right of offset or netting in bankruptcy, insolvency or other events.
Collateral (margin) requirements differ by type of derivative. Margin requirements are established by the clearinghouse or CCP for exchange-traded and centrally cleared derivatives. Brokers can ask for margin in excess of the minimum in certain circumstances. Collateral terms are contract specific for over-the-counter derivatives. For over-the-counter derivatives traded under an ISDA Master Agreement, the collateral requirements are typically calculated by netting the marked-to-market amount for each transaction under such agreement and comparing that amount to the value of any variation margin currently pledged by the Fund and/or the counterparty. Generally, the amount of collateral due from or to a party has to exceed a minimum transfer amount threshold (e.g., $250,000) before a transfer has to be made. To the extent amounts due to the Fund from its counterparties are not fully collateralized, contractually or otherwise, the Fund bears the risk of loss from counterparty nonperformance. The Fund attempts to mitigate counterparty risk by only entering into agreements with counterparties that it believes have the financial resources to honor their obligations and by monitoring the financial stability of those counterparties.
Certain ISDA Master Agreements allow counterparties of over-the-counter derivatives transactions to terminate derivatives contracts prior to maturity in the event the Fund’s net asset value declines by a stated percentage over a specified time period or if the Fund fails to meet certain terms of the ISDA Master Agreement, which would cause the Fund to accelerate payment of any net liability owed to the counterparty. The Fund also has termination rights if the counterparty fails to meet certain terms of the ISDA Master Agreement. In addition to considering counterparty credit risk, the Fund would consider terminating the derivatives contracts based on whether termination would result in a net liability owed from the counterparty.
For financial reporting purposes, the Fund does not offset derivative assets and derivative liabilities that are subject to netting arrangements in the Statement of Assets and Liabilities.
Forward foreign currency exchange contracts
Forward foreign currency exchange contracts are over-the-counter agreements between two parties to buy and sell a currency at a set price on a future date. The Fund utilized forward foreign currency exchange contracts to hedge the currency exposure associated with some or all of the Fund’s securities and to shift foreign currency exposure back to U.S. dollars. These instruments may be used for other purposes in future periods.
The values of forward foreign currency exchange contracts fluctuate daily with changes in foreign currency exchange rates. Changes in the value of these contracts are recorded as unrealized appreciation or depreciation until the contract is exercised or has expired. The Fund will realize a gain or loss when the forward foreign currency exchange contract is closed or expires.
The use of forward foreign currency exchange contracts does not eliminate fluctuations in the prices of the Fund’s portfolio securities. The risks of forward foreign currency exchange contracts include movement in the values of the foreign currencies relative to the U.S. dollar (or other foreign currencies) and the possibility that counterparties will not complete their contractual obligations, which may be in excess of the amount reflected, if any, in the Statement of Assets and Liabilities.
Futures contracts
Futures contracts are exchange-traded and represent commitments for the future purchase or sale of an asset at a specified price on a specified date. The Fund bought and sold futures contracts to manage the duration and yield curve exposure of the Fund versus the benchmark. These instruments may be used for other purposes in future periods. Upon entering into futures
Columbia Total Return Bond Fund | Annual Report 2017
| 53 |
Notes to Financial Statements (continued)
April 30, 2017
contracts, the Fund bears risks that it may not achieve the anticipated benefits of the futures contracts and may realize a loss. Additional risks include counterparty credit risk, the possibility of an illiquid market, and that a change in the value of the contract or option may not correlate with changes in the value of the underlying asset.
Upon entering into a futures contract, the Fund deposits cash or securities with the broker, known as a futures commission merchant (FCM), in an amount sufficient to meet the initial margin requirement. The initial margin deposit must be maintained at an established level over the life of the contract. Cash deposited as initial margin is recorded in the Statement of Assets and Liabilities as margin deposits. Securities deposited as initial margin are designated in the Portfolio of Investments. Subsequent payments (variation margin) are made or received by the Fund each day. The variation margin payments are equal to the daily change in the contract value and are recorded as variation margin receivable or payable and are offset in unrealized gains or losses. The Fund recognizes a realized gain or loss when the contract is closed or expires. Futures contracts involve, to varying degrees, risk of loss in excess of the variation margin disclosed in the Statement of Assets and Liabilities.
Options contracts
Options are contracts which entitle the holder to purchase or sell securities or other identified assets at a specified price, or in the case of index option contracts, to receive or pay the difference between the index value and the strike price of the index option contract. Option contracts can be either exchange-traded or over-the-counter. The Fund purchased and wrote option contracts to hedge portfolio investments and to manage exposure to fluctuations in interest rates and to hedge the fair value of the Fund’s investments. These instruments may be used for other purposes in future periods. Completion of transactions for option contracts traded in the over-the-counter market depends upon the performance of the other party. Cash collateral may be collected or posted by the Fund to secure certain over-the-counter option contract trades. Cash collateral held or posted by the Fund for such option contract trades must be returned to the broker or the Fund upon closure, exercise or expiration of the contract.
Options contracts purchased are recorded as investments. When the Fund writes an options contract, the premium received is recorded as an asset and an amount equivalent to the premium is recorded as a liability in the Statement of Assets and Liabilities and is subsequently adjusted to reflect the current fair value of the option written. Changes in the fair value of the written option are recorded as unrealized appreciation or depreciation until the contract is exercised or has expired. The Fund will realize a gain or loss when the option contract is closed or expires. When option contracts are exercised, the proceeds on sales for a written call or purchased put option contract, or the purchase cost for a written put or purchased call option contract, is adjusted by the amount of premium received or paid.
For over-the-counter options purchased, the Fund bears the risk of loss of the amount of the premiums paid plus the positive change in market values net of any collateral held by the Fund should the counterparty fail to perform under the contracts. Option contracts written by the Fund do not typically give rise to significant counterparty credit risk, as options written generally obligate the Fund and not the counterparty to perform. The risk in writing a call option contract is that the Fund gives up the opportunity for profit if the market price of the security increases above the strike price and the option contract is exercised. The risk in writing a put option contract is that the Fund may incur a loss if the market price of the security decreases below the strike price and the option contract is exercised. Exercise of a written option could result in the Fund purchasing or selling a security or foreign currency when it otherwise would not, or at a price different from the current market value. In purchasing and writing options, the Fund bears the risk of an unfavorable change in the value of the underlying instrument or the risk that the Fund may not be able to enter into a closing transaction due to an illiquid market.
Interest rate swaption contracts
Interest rate swaption contracts entered into by the Fund typically represent an option that gives the purchaser the right, but not the obligation, to enter into an interest rate swap contract on a future date. Each interest rate swaption agreement will specify if the buyer is entitled to receive the fixed or floating rate if the interest rate is exercised. Changes in the value of a purchased interest rate swaption contracts are reported as unrealized appreciation or depreciation on options in the Statement of Assets and Liabilities. Gain or loss is recognized in the Statement of Operations when the interest rate swaption contract is closed or expires.
| 54 | Columbia Total Return Bond Fund | Annual Report 2017 |
Notes to Financial Statements (continued)
April 30, 2017
When the Fund writes an interest rate swaption contract, the premium received is recorded as an asset and an amount equivalent to the premium is recorded as a liability in the Statement of Assets and Liabilities and is subsequently adjusted to reflect the current fair value of the interest rate swaption contract written. Premiums received from writing interest rate swaption contracts that expire unexercised are recorded by the Fund on the expiration date as realized gains from options written in the Statement of Operations. The difference between the premium and the amount paid on effecting a closing purchase transaction, including brokerage commissions, is also recorded as realized gain, or if the premium is less than the amount paid for the closing purchase, as realized loss. These amounts are reflected as net realized gain (loss) on options written in the Statement of Operations.
Contracts and premiums associated with options contracts written for the year ended April 30, 2017 are as follows:
| | Calls | Puts |
| | Contracts | Premiums ($) | Contracts | Premiums ($) |
| Balance at April 30, 2016 | — | — | (30,000,000) | (249,750) |
| Opened | (71,500,000) | (429,000) | (145,000,000) | (999,500) |
| Closed | 71,500,000 | 429,000 | 145,000,000 | 999,500 |
| Expired | — | — | 30,000,000 | 249,750 |
| Exercised | — | — | — | — |
| Balance at April 30, 2017 | — | — | — | — |
Swap contracts
Swap contracts are negotiated in the over-the-counter market and may be entered into as a bilateral contract or centrally cleared (centrally cleared swap contract). In a centrally cleared swap contract, immediately following execution of the swap contract with a broker, the swap contract is novated to a central counterparty (the CCP) and the CCP becomes the Fund’s counterparty to the centrally cleared swap contract. The Fund is required to deposit initial margin with the futures commission merchant (FCM), which pledges it through to the CCP in the form of cash or securities in an amount that varies depending on the size and risk profile of the particular swap contract. Securities deposited as initial margin are designated in the Portfolio of Investments and cash deposited is recorded in the Statement of Assets and Liabilities as margin deposits. Unlike a bilateral swap contract, for centrally cleared swap contracts, the Fund has minimal credit exposure to the FCM because the CCP stands between the Fund and the relevant buyer/seller on the other side of the contract. Swap contracts are marked-to-market daily and changes in value are recorded as unrealized appreciation (depreciation). The daily change in valuation of centrally cleared swap contracts, if any, is recorded as a receivable or payable for variation margin in the Statement of Assets and Liabilities.
Entering into these contracts involves, to varying degrees, elements of interest, liquidity and counterparty credit risk in excess of the amounts recognized in the Statement of Assets and Liabilities. Such risks involve the possibility that there may be unfavorable changes in interest rates, market conditions or other conditions, it may be difficult to initiate a swap transaction or liquidate a position at an advantageous time or price which may result in significant losses, and that the FCM or CCP may not fulfill its obligation under the contract.
Credit default swap contracts
The Fund entered into credit default swap contracts to increase or decrease its credit exposure to an index, to increase or decrease its credit exposure to a single issuer of debt securities and to manage credit risk exposure. Additionally, credit default swap contracts were used to hedge the Fund’s exposure on a debt security that it owns or in lieu of selling such debt security. These instruments may be used for other purposes in future periods. Credit default swap contracts are agreements in which one party pays fixed periodic payments to a counterparty in consideration for an agreement from the counterparty to make a specific payment should a specified credit event(s) take place. Although specified credit events are contract specific, credit events are generally defined as bankruptcy, failure to pay, restructuring, obligation acceleration, obligation default, or repudiation/moratorium.
As the purchaser of a credit default swap contract, the Fund purchases protection by paying a periodic interest rate on the notional amount to the counterparty. The interest amount is accrued daily as a component of unrealized appreciation (depreciation) and is recorded as a realized loss upon payment. If a credit event as specified in the contract occurs, the Fund may have the option either to deliver the reference obligation to the seller in exchange for a cash payment of its par amount,
Columbia Total Return Bond Fund | Annual Report 2017
| 55 |
Notes to Financial Statements (continued)
April 30, 2017
or to receive a net cash settlement equal to the par amount less an agreed-upon value of the reference obligation as of the date of the credit event. The difference between the value of the obligation or cash delivered and the notional amount received will be recorded as a realized gain (loss).
As the seller of a credit default swap contract, the Fund sells protection to a buyer and will generally receive a periodic interest rate on a notional amount. The interest amount is accrued daily as a component of unrealized appreciation (depreciation) and is recorded as a realized gain upon receipt of the payment. If a credit event as specified in the contract with the counterparty occurs, the Fund may either be required to accept the reference obligation from the buyer in exchange for a cash payment of its notional amount, or to pay the buyer a net cash settlement equal to the notional amount less an agreed-upon value of the reference obligation (recovery value) as of the date of the credit event. The difference between the value of the obligation or cash received and the notional amount paid will be recorded as a realized gain (loss). The maximum potential amount of undiscounted future payments the Fund could be required to make as the seller of protection under a credit default swap contract is equal to the notional amount of the reference obligation. These potential amounts may be partially offset by any recovery values of the respective reference obligations or premiums received upon entering into the agreement. The notional amounts and market values of all credit default swap contracts in which the Fund is the seller of protection, if any, are disclosed in the Credit Default Swap Contracts Outstanding schedule following the Portfolio of Investments.
As a protection seller, the Fund bears the risk of loss from the credit events specified in the contract with the counterparty. For credit default swap contracts on credit indices, quoted market prices and resulting market values serve as an indicator of the current status of the payment/performance risk. Increasing market values, in absolute terms when compared to the notional amount of the swap, represent a deterioration of the reference entity’s credit soundness and a greater likelihood or risk of default or other credit event occurring as defined under the terms of the contract.
Any premium paid or received by the Fund upon entering into a credit default swap contract is recorded as an asset or liability, respectively, and amortized daily as a component of realized gain (loss) in the Statement of Operations. Credit default swap contracts are valued daily, and the change in value is recorded as unrealized appreciation (depreciation) until the termination of the swap, at which time a realized gain (loss) is recorded.
Credit default swap contracts can involve greater risks than if a fund had invested in the reference obligation directly since, in addition to general market risks, credit default swaps are subject to counterparty credit risk, leverage risk, hedging risk, correlation risk and liquidity risk.
Interest rate swap contracts
The Fund entered into interest rate swap transactions which may include inflation rate swap contracts to gain exposure to or protect itself from market rate changes and to hedge the portfolio risk associated with some or all of the Fund’s securities. These instruments may be used for other purposes in future periods. An interest rate swap is an agreement between two parties where there are two flows and payments are made between the two counterparties and the payments are dependent upon changes in an interest rate, inflation rate or inflation index calculated on a nominal amount. Interest rate swaps are agreements between two parties that involve the exchange of one type of interest rate for another type of interest rate cash flow on specified dates in the future, based on a predetermined, specified notional amount. Certain interest rate swaps are considered forward-starting, whereby the accrual for the exchange of cash flows does not begin until a specified date in the future. The net cash flow for a standard interest rate swap transaction is generally the difference between a floating market interest rate versus a fixed interest rate.
Interest rate swaps are valued daily and unrealized appreciation (depreciation) is recorded. Certain interest rate swaps may accrue periodic interest on a daily basis as a component of unrealized appreciation (depreciation); the Fund will realize a gain or loss upon the payment or receipt of accrued interest. The Fund will realize a gain or a loss when the interest rate swap is terminated.
| 56 | Columbia Total Return Bond Fund | Annual Report 2017 |
Notes to Financial Statements (continued)
April 30, 2017
Effects of derivative transactions in the financial statements
The following tables are intended to provide additional information about the effect of derivatives on the financial statements of the Fund, including: the fair value of derivatives by risk category and the location of those fair values in the Statement of Assets and Liabilities; and the impact of derivative transactions over the period in the Statement of Operations, including realized and unrealized gains (losses). The derivative instrument schedules following the Portfolio of Investments present additional information regarding derivative instruments outstanding at the end of the period, if any.
The following table is a summary of the fair value of derivative instruments (not considered to be hedging instruments for accounting disclosure purposes) at April 30, 2017:
| | Asset derivatives | |
Risk exposure
category | Statement
of assets and liabilities
location | Fair value ($) |
| Credit risk | Net assets — unrealized appreciation on swap contracts | 12,376,598* |
| Credit risk | Premiums paid on outstanding swap contracts | 22,689,046 |
| Interest rate risk | Net assets — unrealized appreciation on futures contracts | 314,763* |
| Total | | 35,380,407 |
| | Liability derivatives | |
Risk exposure
category | Statement
of assets and liabilities
location | Fair value ($) |
| Credit risk | Net assets — unrealized depreciation on swap contracts | 10,371,989* |
| Credit risk | Premiums received on outstanding swap contracts | 19,312,973 |
| Interest rate risk | Net assets — unrealized depreciation on futures contracts | 1,400,940* |
| Total | | 31,085,902 |
| * | Includes cumulative appreciation (depreciation) as reported in the tables following the Portfolio of Investments. Only the current day’s variation margin is reported in receivables or payables in the Statement of Assets and Liabilities. |
The following table indicates the effect of derivative instruments (not considered to be hedging instruments for accounting disclosure purposes) in the Statement of Operations for the year ended April 30, 2017:
| Amount of realized gain (loss) on derivatives recognized in income |
| Risk exposure category | Forward
foreign
currency
exchange
contracts
($) | Futures
contracts
($) | Options
contracts
written
($) | Options
contracts
purchased
($) | Swap
contracts
($) | Total
($) |
| Credit risk | — | — | — | — | (35,321,171) | (35,321,171) |
| Foreign exchange risk | 90,382 | — | — | — | — | 90,382 |
| Interest rate risk | — | (5,049,287) | 1,316,345 | 3,290,731 | (701,128) | (1,143,339) |
| Total | 90,382 | (5,049,287) | 1,316,345 | 3,290,731 | (36,022,299) | (36,374,128) |
| Change in unrealized appreciation (depreciation) on derivatives recognized in income |
| Risk exposure category | Futures
contracts
($) | Options
contracts
written
($) | Options
contracts
purchased
($) | Swap
contracts
($) | Total
($) |
| Credit risk | — | — | — | 5,142,419 | 5,142,419 |
| Interest rate risk | (1,948,539) | 43,092 | 439,071 | 397,821 | (1,068,555) |
| Total | (1,948,539) | 43,092 | 439,071 | 5,540,240 | 4,073,864 |
Columbia Total Return Bond Fund | Annual Report 2017
| 57 |
Notes to Financial Statements (continued)
April 30, 2017
The following table is a summary of the average outstanding volume by derivative instrument for the year ended April 30, 2017:
| Derivative instrument | Average notional
amounts ($)* |
| Futures contracts — long | 248,790,087 |
| Futures contracts — short | 172,755,915 |
| Credit default swap contracts — buy protection | 792,652,139 |
| Credit default swap contracts — sell protection | 700,224,820 |
| Derivative instrument | Average market
value ($)* |
| Options contracts — purchased | 2,268,861 |
| Options contracts — written | (81,776) |
| Derivative instrument | Average unrealized
appreciation ($)* | Average unrealized
depreciation ($)* |
| Forward foreign currency exchange contracts | 618 | (7,818) |
| * | Based on the ending quarterly outstanding amounts for the year ended April 30, 2017. |
Investments in senior loans
The Fund may invest in senior loan assignments. When the Fund purchases an assignment of a senior loan, the Fund typically has direct rights against the borrower; provided, however, that the Fund’s rights may be more limited than the lender from which it acquired the assignment and the Fund may be able to enforce its rights only through an administrative agent. Although certain senior loan assignments are secured by collateral, the Fund could experience delays or limitations in realizing such collateral or have its interest subordinated to other indebtedness of the obligor. In the event that the administrator or collateral agent of a loan becomes insolvent, enters into receivership or bankruptcy, the Fund may incur costs and delays in realizing payment or may suffer a loss of principal and/or interest. The risk of loss is greater for unsecured or subordinated loans. In addition, senior loan assignments are vulnerable to market, economic or other conditions or events that may reduce the demand for senior loan assignments and certain senior loan assignments which were liquid, when purchased, may become illiquid.
The Fund may enter into senior loan assignments where all or a portion of the loan may be unfunded. The Fund is obligated to fund these commitments at the borrower’s discretion. These commitments are generally traded and priced in the same manner as other senior loan securities and are disclosed as unfunded senior loan commitments in the Fund’s Portfolio of Investments with a corresponding payable for investments purchased. The Fund designates cash or liquid securities to cover these commitments.
Asset- and mortgage-backed securities
The Fund may invest in asset-backed and mortgage-backed securities. The maturity dates shown represent the original maturity of the underlying obligation. Actual maturity may vary based upon prepayment activity on these obligations. All, or a portion, of the obligation may be prepaid at any time because the underlying asset may be prepaid. As a result, decreasing market interest rates could result in an increased level of prepayment. An increased prepayment rate will have the effect of shortening the maturity of the security. Unless otherwise noted, the coupon rates presented are fixed rates.
Delayed delivery securities
The Fund may trade securities on other than normal settlement terms, including securities purchased or sold on a “when-issued” or "forward commitment" basis. This may increase risk to the Fund since the other party to the transaction may fail to deliver, which could cause the Fund to subsequently invest at less advantageous prices. The Fund designates cash or liquid securities in an amount equal to the delayed delivery commitment.
| 58 | Columbia Total Return Bond Fund | Annual Report 2017 |
Notes to Financial Statements (continued)
April 30, 2017
To be announced securities
The Fund may trade securities on a To Be Announced (TBA) basis. As with other delayed-delivery transactions, a seller agrees to issue a TBA security at a future date. However, the seller does not specify the particular securities to be delivered. Instead, the Fund agrees to accept any security that meets specified terms.
In some cases, Master Securities Forward Transaction Agreements (MSFTAs) may be used to govern transactions of certain forward-settling agency mortgage-backed securities, such as delayed-delivery and TBAs, between the Fund and counterparty. The MSFTA maintains provisions for, among other things, initiation and confirmation, payment and transfer, events of default, termination, and maintenance of collateral relating to such transactions.
Mortgage dollar roll transactions
The Fund may enter into mortgage “dollar rolls” in which the Fund sells securities for delivery in the current month and simultaneously contracts with the same counterparty to repurchase similar but not identical securities (same type, coupon and maturity) on a specified future date. During the roll period, the Fund loses the right to receive principal and interest paid on the securities sold. However, the Fund will benefit because it receives negotiated amounts in the form of reductions of the purchase price for the future purchase plus the interest earned on the cash proceeds of the securities sold until the settlement date of the forward purchase. The Fund records the incremental difference between the forward purchase and sale of each forward roll as a realized gain or loss. Unless any realized gains exceed the income, capital appreciation, and gain or loss due to mortgage prepayments that would have been realized on the securities sold as part of the mortgage dollar roll, the use of this technique will diminish the investment performance of the Fund compared to what the performance would have been without the use of mortgage dollar rolls. All cash proceeds will be invested in instruments that are permissible investments for the Fund. The Fund identifies cash or liquid securities in an amount equal to the forward purchase price.
For financial reporting and tax purposes, the Fund treats “to be announced” mortgage dollar rolls as two separate transactions, one involving the purchase of a security and a separate transaction involving a sale. These transactions may increase the Fund’s portfolio turnover rate. The Fund does not currently enter into mortgage dollar rolls that are accounted for as financing transactions.
Mortgage dollar rolls involve the risk that the market value of the securities the Fund is obligated to repurchase may decline below the repurchase price, or that the counterparty may default on its obligations.
Interest only and principal only securities
The Fund may invest in Interest Only (IO) or Principal Only (PO) securities. IOs are stripped securities entitled to receive all of the security’s interest, but none of its principal. IOs are particularly sensitive to changes in interest rates and therefore subject to greater fluctuations in price than typical interest bearing debt securities. IOs are also subject to credit risk because the Fund may not receive all or part of the interest payments if the issuer, obligor, guarantor or counterparty defaults on its obligation. Payments received for IOs are included in interest income on the Statement of Operations. Because no principal will be received at the maturity of an IO, adjustments are made to the cost of the security on a monthly basis until maturity. These adjustments are included in interest income on the Statement of Operations. POs are stripped securities entitled to receive the principal from the underlying obligation, but not the interest. POs are particularly sensitive to changes in interest rates and therefore are subject to fluctuations in price. POs are also subject to credit risk because the Fund may not receive all or part of its principal if the issuer, obligor, guarantor or counterparty defaults on its obligation. The Fund may also invest in IO or PO stripped mortgage-backed securities. Payments received for POs are treated as reductions to the cost and par value of the securities.
Columbia Total Return Bond Fund | Annual Report 2017
| 59 |
Notes to Financial Statements (continued)
April 30, 2017
Offsetting of assets and liabilities
The following table presents the Fund’s gross and net amount of assets and liabilities available for offset under netting arrangements as well as any related collateral received or pledged by the Fund as of April 30, 2017:
| | Barclays ($) | Citi ($) | Credit
Suisse ($) | Goldman
Sachs
International
($) | JPMorgan ($)(a) | JPMorgan ($)(a) | Morgan
Stanley ($)(a) | Morgan
Stanley ($)(a) | Total ($) |
| Assets | | | | | | | | | |
| Centrally cleared credit default swap contracts (b) | - | - | - | - | - | - | - | 633,956 | 633,956 |
| OTC credit default swap contracts (c) | 1,331,915 | 2,929,597 | 1,900,020 | 1,975,716 | 12,531,318 | - | 478,566 | - | 21,147,132 |
| Total assets | 1,331,915 | 2,929,597 | 1,900,020 | 1,975,716 | 12,531,318 | - | 478,566 | 633,956 | 21,781,088 |
| Liabilities | | | | | | | | | |
| Centrally cleared credit default swap contracts (b) | - | - | - | - | - | - | - | 648,346 | 648,346 |
| OTC credit default swap contracts (c) | 1,049,179 | 1,126,887 | 2,271,450 | 5,345,942 | 1,645,644 | 409,258 | 3,581,012 | - | 15,429,372 |
| Total liabilities | 1,049,179 | 1,126,887 | 2,271,450 | 5,345,942 | 1,645,644 | 409,258 | 3,581,012 | 648,346 | 16,077,718 |
| Total financial and derivative net assets | 282,736 | 1,802,710 | (371,430) | (3,370,226) | 10,885,674 | (409,258) | (3,102,446) | (14,390) | 5,703,370 |
| Total collateral received (pledged) (d) | 265,207 | 1,802,710 | (371,430) | (3,370,226) | 10,673,000 | (409,258) | (3,102,446) | (14,390) | 5,473,167 |
| Net amount (e) | 17,529 | - | - | - | 212,674 | - | - | - | 230,203 |
| (a) | Exposure can only be netted across transactions governed under the same master agreement with the same legal entity. |
| (b) | Centrally cleared swaps are included within payable/receivable for variation margin on the Statement of Assets and Liabilities. |
| (c) | Over-the-Counter Swap Contracts are presented at market value plus periodic payments receivable (payable), which is comprised of unrealized appreciation, unrealized depreciation, premiums paid and premiums received. |
| (d) | In some instances, the actual collateral received and/or pledged may be more than the amount shown due to overcollateralization. |
| (e) | Represents the net amount due from/(to) counterparties in the event of default. |
Security transactions
Security transactions are accounted for on the trade date. Cost is determined and gains (losses) are based upon the specific identification method for both financial statement and federal income tax purposes.
Income recognition
Interest income is recorded on an accrual basis. Market premiums and discounts, including original issue discounts, are amortized and accreted, respectively, over the expected life of the security on all debt securities, unless otherwise noted. The Fund classifies gains and losses realized on prepayments received on mortgage-backed securities as adjustments to interest income.
The Fund may place a debt security on non-accrual status and reduce related interest income when it becomes probable that the interest will not be collected and the amount of uncollectible interest can be reasonably estimated. A defaulted debt security is removed from non-accrual status when the issuer resumes interest payments or when collectibility of interest is reasonably assured.
Corporate actions and dividend income are recorded on the ex-dividend date.
The Fund may receive distributions from holdings in equity securities, business development companies (BDCs), exchange-traded funds, other regulated investment companies (RICs), and real estate investment trusts (REITs), which report information on the tax character of their distributions annually. These distributions are allocated to dividend income, capital gain and return of capital based on actual information reported. Return of capital is recorded as a reduction of the cost basis of securities held. If the Fund no longer owns the applicable securities, return of capital is recorded as a realized gain. With
| 60 | Columbia Total Return Bond Fund | Annual Report 2017 |
Notes to Financial Statements (continued)
April 30, 2017
respect to REITs, to the extent actual information has not yet been reported, estimates for return of capital are made by the Fund’s management. Management’s estimates are subsequently adjusted when the actual character of the distributions is disclosed by the REITs, which could result in a proportionate change in return of capital to shareholders.
Awards from class action litigation are recorded as a reduction of cost basis if the Fund still owns the applicable securities on the payment date. If the Fund no longer owns the applicable securities, the proceeds are recorded as realized gains.
The value of additional securities received as an income payment is recorded as income and increases the cost basis of such securities.
The Fund may receive other income from senior loans, including amendment fees, consent fees and commitment fees. These fees are recorded as income when received by the Fund. These amounts are included in Interest Income in the Statement of Operations.
Expenses
General expenses of the Trust are allocated to the Fund and other funds of the Trust based upon relative net assets or other expense allocation methodologies determined by the nature of the expense. Expenses directly attributable to the Fund are charged to the Fund. Expenses directly attributable to a specific class of shares are charged to that share class.
Determination of class net asset value
All income, expenses (other than class-specific expenses, which are charged to that share class, as shown in the Statement of Operations) and realized and unrealized gains (losses) are allocated to each class of the Fund on a daily basis, based on the relative net assets of each class, for purposes of determining the net asset value of each class.
Federal income tax status
The Fund intends to qualify each year as a regulated investment company under Subchapter M of the Internal Revenue Code, as amended, and will distribute substantially all of its taxable income (including net short-term capital gains), if any, for its tax year, and as such will not be subject to federal income taxes. In addition, the Fund intends to distribute in each calendar year substantially all of its net investment income, capital gains and certain other amounts, if any, such that the Fund should not be subject to federal excise tax. Therefore, no federal income or excise tax provision is recorded.
Distributions to shareholders
Distributions from net investment income, if any, are declared daily and paid monthly. Net realized capital gains, if any, are distributed at least annually. Income distributions and capital gain distributions are determined in accordance with federal income tax regulations, which may differ from GAAP.
Guarantees and indemnifications
Under the Trust’s organizational documents and, in some cases, by contract, its officers and trustees are indemnified against certain liabilities arising out of the performance of their duties to the Trust or its funds. In addition, certain of the Fund’s contracts with its service providers contain general indemnification clauses. The Fund’s maximum exposure under these arrangements is unknown since the amount of any future claims that may be made against the Fund cannot be determined, and the Fund has no historical basis for predicting the likelihood of any such claims.
Investment company reporting modernization
In October 2016, the U.S. Securities and Exchange Commission adopted new rules and forms, and amendments to certain current rules and forms, to modernize reporting and disclosure of information by registered investment companies. The amendments to Regulation S-X will require standardized, enhanced disclosure about derivatives in investment company financial statements, and will also change the rules governing the form and content of such financial statements. The amendments to Regulation S-X take effect on August 1, 2017. At this time, management is assessing the anticipated impact of these regulatory developments.
Columbia Total Return Bond Fund | Annual Report 2017
| 61 |
Notes to Financial Statements (continued)
April 30, 2017
Note 3. Fees and other transactions with affiliates
Management services fees
The Fund entered into a Management Agreement with Columbia Management Investment Advisers, LLC (the Investment Manager), a wholly-owned subsidiary of Ameriprise Financial, Inc. (Ameriprise Financial). Under the Management Agreement, the Investment Manager provides the Fund with investment research and advice, as well as administrative and accounting services. The management services fee is an annual fee that is equal to a percentage of the Fund’s average daily net assets that declines from 0.50% to 0.34% as the Fund’s net assets increase. The effective management services fee rate for the year ended April 30, 2017 was 0.48% of the Fund’s average daily net assets.
Compensation of board members
Members of the Board of Trustees, who are not officers or employees of the Investment Manager or Ameriprise Financial, are compensated for their services to the Fund as disclosed in the Statement of Operations. These members of the Board of Trustees may participate in a Deferred Compensation Plan (the Plan) which may be terminated at any time. Obligations of the Plan will be paid solely out of the Fund’s assets, and all amounts payable under the Plan constitute a general unsecured obligation of the Fund.
Compensation of Chief Compliance Officer
The Board of Trustees has appointed a Chief Compliance Officer to the Fund in accordance with federal securities regulations. A portion of the Chief Compliance Officer’s total compensation is allocated to the Fund, along with other affiliated funds governed by the Board of Trustees, based on relative net assets. The total amount allocated to all affiliated funds governed by the Board of Trustees will not exceed $40,000 annually.
Transactions with affiliates
For the year ended April 30, 2017, the Fund engaged in purchase and/or sale transactions with affiliates and/or accounts that have a common investment manager (or affiliated investment managers), common directors/trustees, and/or common officers. Those purchase and sale transactions complied with provisions of Rule 17a-7 under the 1940 Act and were $0 and $39,523,487, respectively. The sale transactions resulted in a net realized gain of $2,826,989.
Transfer agency fees
Under a Transfer and Dividend Disbursing Agent Agreement, Columbia Management Investment Services Corp. (the Transfer Agent), an affiliate of the Investment Manager and a wholly-owned subsidiary of Ameriprise Financial, is responsible for providing transfer agency services to the Fund. The Transfer Agent has contracted with Boston Financial Data Services (BFDS) to serve as sub-transfer agent. The Transfer Agent pays the fees of BFDS for services as sub-transfer agent and BFDS is not entitled to reimbursement for such fees from the Fund (with the exception of out-of-pocket fees).
The Fund pays the Transfer Agent a monthly transfer agency fee based on the number or the average value of accounts, depending on the type of account. In addition, prior to October 1, 2016, the Transfer Agent also received sub-transfer agency fees based on a percentage of the average aggregate value of the Fund’s shares maintained in omnibus accounts (other than omnibus accounts for which American Enterprise Investment Services Inc. is the broker of record or accounts where the beneficial shareholder is a customer of Ameriprise Financial Services, Inc., for which the Transfer Agent receives a per account fee). Effective October 1, 2016, the Fund pays the Transfer Agent a fee for shareholder services based on the number of accounts or on a percentage of the average aggregate value of the Fund’s shares maintained in omnibus accounts up to the lesser of the amount charged by the financial intermediary or a cap established by the Board of Trustees from time to time.
The Transfer Agent also receives compensation from the Fund for various shareholder services and reimbursements for certain out-of-pocket fees. Effective January 1, 2017, total transfer agency fees for Class K and Class R5 shares are subject to an annual limitation of not more than 0.075% of the average daily net assets attributable to each share class. Total transfer agency fees for Class I, prior to March 27, 2017 were, and Class Y shares are subject to an annual limitation of not
| 62 | Columbia Total Return Bond Fund | Annual Report 2017 |
Notes to Financial Statements (continued)
April 30, 2017
more than 0.025% of the average daily net assets attributable to each share class. Prior to January 1, 2017, total transfer agency fees for Class K and Class R5 shares were subject to an annual limitation of not more than 0.05% of the average daily net assets attributable to each share class and Class I and Class Y shares did not pay transfer agency fees.
For the year ended April 30, 2017, the Fund’s effective transfer agency fee rates as a percentage of average daily net assets of each class were as follows:
| | Effective rate (%) |
| Class A | 0.15 |
| Class B | 0.15 |
| Class C | 0.15 |
| Class I | 0.003 (a),(b) |
| Class K | 0.053 |
| Class R | 0.15 |
| Class R4 | 0.15 |
| Class R5 | 0.056 |
| Class T | 0.15 |
| Class Y | 0.008 |
| Class Z | 0.15 |
| (a) | Annualized. |
| (b) | Effective March 27, 2017, Class I shares were redeemed or exchanged for Class Y shares. |
The Fund and certain other associated investment companies have severally, but not jointly, guaranteed the performance and observance of all the terms and conditions of a lease entered into by Seligman Data Corp. (SDC), the former transfer agent, including the payment of rent by SDC (the Guaranty). SDC was the legacy Seligman funds’ former transfer agent.
The lease and the Guaranty expire in January 2019. At April 30, 2017, the Fund’s total potential future obligation over the life of the Guaranty is $5,681. The liability remaining at April 30, 2017 for non-recurring charges associated with the lease amounted to $5,051 and is recorded as a part of the payable for other expenses in the Statement of Assets and Liabilities.
An annual minimum account balance fee of $20 may apply to certain accounts with a value below the applicable share class’s initial minimum investment requirements to reduce the impact of small accounts on transfer agency fees. These minimum account balance fees are remitted to the Fund and recorded as part of expense reductions in the Statement of Operations. For the year ended April 30, 2017, these minimum account balance fees reduced total expenses of the Fund by $1,960.
Plan administration fees
Under a Plan Administration Services Agreement with the Transfer Agent, the Fund pays an annual fee at a rate of 0.25% of the Fund’s average daily net assets attributable to Class K shares for the provision of various administrative, recordkeeping, communication and educational services.
Distribution and service fees
The Fund has an agreement with Columbia Management Investment Distributors, Inc. (the Distributor), an affiliate of the Investment Manager and a wholly-owned subsidiary of Ameriprise Financial, for distribution and shareholder services. The Board of Trustees has approved, and the Fund has adopted, distribution and shareholder service plans (the Plans) applicable to certain share classes, which set the distribution and service fees for the Fund. These fees are calculated daily and are intended to compensate the Distributor and/or eligible selling and/or servicing agents for selling shares of the Fund and providing services to investors.
Under the Plans, the Fund pays a monthly service fee to the Distributor at the maximum annual rate of 0.25% of the average daily net assets attributable to Class A, Class B, Class C and Class T shares of the Fund. Also under the Plans, the Fund pays a monthly distribution fee to the Distributor at the maximum annual rates of 0.10%, 0.75%, 0.75%, 0.50% and 0.25% of the average daily net assets attributable to Class A, Class B, Class C, Class R and Class T shares of the Fund, respectively.
Columbia Total Return Bond Fund | Annual Report 2017
| 63 |
Notes to Financial Statements (continued)
April 30, 2017
Although the Fund may pay distribution and service fees up to a maximum annual rate of 0.35% of the Fund’s average daily net assets attributable to Class A shares (comprised of up to 0.10% for distribution services and up to 0.25% for shareholder liaison services), the Fund currently limits such fees to an aggregate fee of not more than 0.25% of the Fund’s average daily net assets attributable to Class A shares.
Although the Fund may pay a distribution fee up to 0.25% of the Fund’s average daily net assets attributable to Class T shares and a service fee of up to 0.25% of the Fund’s average daily net assets attributable to Class T shares, the aggregate fee shall not exceed 0.25% of the Fund’s average daily net assets attributable to Class T shares.
Sales charges (unaudited)
Sales charges, including front-end charges and CDSCs, received by the Distributor for distributing Fund shares for the year ended April 30, 2017, if any, are listed below:
| | Amount ($) |
| Class A | 272,383 |
| Class B | 42 |
| Class C | 2,386 |
Expenses waived/reimbursed by the Investment Manager and its affiliates
The Investment Manager and certain of its affiliates have contractually agreed to waive fees and/or reimburse expenses (excluding certain fees and expenses described below) for the periods disclosed below, unless sooner terminated at the sole discretion of the Board of Trustees, so that the Fund’s net operating expenses, after giving effect to fees waived/expenses reimbursed and any balance credits and/or overdraft charges from the Fund’s custodian, do not exceed the following annual rates as a percentage of the class’ average daily net assets:
| | September 1, 2016
through
August 31, 2017 | Prior to
September 1, 2016 |
| Class A | 0.860% | 0.86% |
| Class B | 1.610 | 1.61 |
| Class C | 1.610 | 1.61 |
| Class K | 0.810 | 0.79 |
| Class R | 1.110 | 1.11 |
| Class R4 | 0.610 | 0.61 |
| Class R5 | 0.560 | 0.54 |
| Class T | 0.860 | 0.86 |
| Class Y | 0.510 | 0.49 |
| Class Z | 0.610 | 0.61 |
Under the agreement governing these fee waivers and/or expense reimbursement arrangements, the following fees and expenses are excluded from the waiver/reimbursement commitment, and therefore will be paid by the Fund, if applicable: taxes (including foreign transaction taxes), expenses associated with investments in affiliated and non-affiliated pooled investment vehicles (including mutual funds and exchange-traded funds), transaction costs and brokerage commissions, costs related to any securities lending program, dividend and interest expenses associated with securities sold short, inverse floater program fees and expenses, transaction charges and interest on borrowed money, interest, infrequent and/or unusual expenses and any other expenses the exclusion of which is specifically approved by the Board of Trustees. This agreement may be modified or amended only with approval from the Investment Manager, certain of its affiliates and the Fund. Any fees waived and/or expenses reimbursed under the expense reimbursement arrangements described above are not recoverable by the Investment Manager or its affiliates in future periods.
Note 4. Federal tax information
The timing and character of income and capital gain distributions are determined in accordance with income tax regulations, which may differ from GAAP because of temporary or permanent book to tax differences.
| 64 | Columbia Total Return Bond Fund | Annual Report 2017 |
Notes to Financial Statements (continued)
April 30, 2017
At April 30, 2017, these differences are primarily due to differing treatment for deferral/reversal of wash sale losses, derivative investments, tax straddles, post-October capital losses, late-year ordinary losses, trustees’ deferred compensation, distributions, principal and/or interest from fixed income securities, foreign currency transactions, distribution reclassifications, swap investments, swap reclassifications and investments in partnerships. To the extent these differences are permanent, reclassifications are made among the components of the Fund’s net assets in the Statement of Assets and Liabilities. Temporary differences do not require reclassifications.
In the Statement of Assets and Liabilities the following reclassifications were made:
Excess of distributions
over net investment
income ($) | Accumulated
net realized
(loss) ($) | Paid in
capital ($) |
| (21,073,790) | 21,073,790 | — |
Net investment income (loss) and net realized gains (losses), as disclosed in the Statement of Operations, and net assets were not affected by this reclassification.
The tax character of distributions paid during the years indicated was as follows:
| April 30, 2017 | April 30, 2016 |
Ordinary
income ($) | Long-term
capital gains ($) | Total ($) | Ordinary
income (S) | Long-term
capital gains ($) | Total ($) |
| 110,767,058 | 12,961,193 | 123,728,251 | 77,090,799 | 30,194,472 | 107,285,271 |
Short-term capital gain distributions, if any, are considered ordinary income distributions for tax purposes.
At April 30, 2017, the components of distributable earnings on a tax basis were as follows:
Undistributed
ordinary income ($) | Undistributed
long-term
capital gains ($) | Capital loss
carryforwards ($) | Net unrealized
appreciation ($) |
| 2,268,015 | — | — | 4,629,143 |
At April 30, 2017, the cost of investments for federal income tax purposes along with the aggregate gross unrealized appreciation and depreciation based on that cost was:
Federal
tax cost ($) | Gross unrealized
appreciation ($) | Gross unrealized
(depreciation) ($) | Net unrealized
appreciation ($) |
| 2,785,009,115 | 49,828,325 | (45,199,182) | 4,629,143 |
Under current tax rules, regulated investment companies can elect to treat certain late-year ordinary losses incurred and post-October capital losses (capital losses realized after October 31) as arising on the first day of the following taxable year. As of April 30, 2017, the Fund elected to treat the following late-year ordinary losses and post-October capital losses as arising on May 1, 2017.
Late year
ordinary losses ($) | Post-October
capital losses ($) |
| 4,826,791 | 11,684,357 |
Management of the Fund has concluded that there are no significant uncertain tax positions in the Fund that would require recognition in the financial statements. However, management’s conclusion may be subject to review and adjustment at a later date based on factors including, but not limited to, new tax laws, regulations, and administrative interpretations (including relevant court decisions). Generally, the Fund’s federal tax returns for the prior three fiscal years remain subject to examination by the Internal Revenue Service.
Columbia Total Return Bond Fund | Annual Report 2017
| 65 |
Notes to Financial Statements (continued)
April 30, 2017
Note 5. Portfolio information
The cost of purchases and proceeds from sales of securities, excluding short-term investments and derivatives, if any, aggregated to $12,351,410,869 and $13,097,169,416, respectively, for the year ended April 30, 2017, of which $10,171,907,227 and $9,926,515,764, respectively, were U.S. government securities. The amount of purchase and sale activity impacts the portfolio turnover rate reported in the Financial Highlights.
Note 6. Affiliated money market fund
The Fund invests in Columbia Short-Term Cash Fund, an affiliated money market fund established for the exclusive use by the Fund and other affiliated funds (the Affiliated MMF). The income earned by the Fund from such investments is included as Dividends - affiliated issuers in the Statement of Operations. As an investing fund, the Fund indirectly bears its proportionate share of the expenses of the Affiliated MMF. Effective October 1, 2016, the Affiliated MMF prices its shares with a floating net asset value (NAV) and no longer seeks to maintain a stable NAV. In addition, the Board of Trustees of the Affiliated MMF may impose a fee on redemptions (sometimes referred to as a liquidity fee) or temporarily suspend redemptions (sometimes referred to as imposing a redemption gate) in the event its liquidity falls below regulatory limits.
Note 7. Line of credit
The Fund has access to a revolving credit facility with a syndicate of banks led by Citibank, N.A., HSBC Bank USA, N.A. and JPMorgan Chase Bank, N.A. whereby the Fund may borrow for the temporary funding of shareholder redemptions or for other temporary or emergency purposes. The credit facility agreement, which is a collective agreement between the Fund and certain other funds managed by the Investment Manager, severally and not jointly, permits collective borrowings up to $1 billion. Interest is charged to each participating fund based on its borrowings at a rate equal to the higher of (i) the overnight federal funds rate plus 1.00% or (ii) the one-month LIBOR rate plus 1.00%. Each borrowing under the credit facility matures no later than 60 days after the date of borrowing. The Fund also pays a commitment fee equal to its pro rata share of the amount of the credit facility at a rate of 0.15% per annum. The commitment fee is included in other expenses in the Statement of Operations.
The Fund had no borrowings during the year ended April 30, 2017.
Note 8. Significant risks
Credit risk
Credit risk is the risk that the value of debt securities in the Fund’s portfolio may decline because the issuer may default and fail to pay interest or repay principal when due. Rating agencies assign credit ratings to debt securities to indicate their credit risk. Lower rated or unrated debt securities held by the Fund may present increased credit risk as compared to higher-rated debt securities.
Derivatives risk
Losses involving derivative instruments may be substantial, because a relatively small price movement in the underlying security(ies), commodity, currency or index or other instrument or asset may result in a substantial loss for the Fund. In addition to the potential for increased losses, the use of derivative instruments may lead to increased volatility within the Fund. Derivatives will typically increase the Fund’s exposure to principal risks to which it is otherwise exposed, and may expose the Fund to additional risks, including correlation risk, counterparty risk, hedging risk, leverage risk and liquidity risk.
Interest rate risk
Interest rate risk is the risk of losses attributable to changes in interest rates. In general, if prevailing interest rates rise, the values of debt securities tend to fall, and if interest rates fall, the values of debt securities tend to rise. Actions by governments and central banking authorities can result in increases in interest rates. Increasing interest rates may negatively affect the value of debt securities held by the Fund, resulting in a negative impact on the Fund’s performance and net asset value per share. In general, the longer the maturity or duration of a debt security, the greater its sensitivity to changes in interest rates.
| 66 | Columbia Total Return Bond Fund | Annual Report 2017 |
Notes to Financial Statements (continued)
April 30, 2017
Liquidity risk
Liquidity risk is the risk associated with a lack of marketability of investments which may make it difficult to sell the investment at a desirable time or price. Changing regulatory, market or other conditions or environments (for example, the interest rate or credit environments) may adversely affect the liquidity of the Fund’s investments. The Fund may have to accept a lower selling price for the holding, sell other investments, or forego another, more appealing investment opportunity. Generally, the less liquid the market at the time the Fund sells a portfolio investment, the greater the risk of loss or decline of value to the Fund. A less liquid market can lead to an increase in Fund redemptions, which may negatively impact Fund performance and net asset value per share, including, for example, if the Fund is forced to sell securities in a down market.
Mortgage- and other asset-backed securities risk
The value of any mortgage-backed and other asset-backed securities held by the Fund may be affected by, among other things, changes or perceived changes in: interest rates; factors concerning the interests in and structure of the issuer or the originator of the mortgages or other assets; the creditworthiness of the entities that provide any supporting letters of credit, surety bonds or other credit enhancements; or the market’s assessment of the quality of underlying assets. Payment of principal and interest on some mortgage-backed securities (but not the market value of the securities themselves) may be guaranteed by the full faith and credit of a particular U.S. Government agency, authority, enterprise or instrumentality, and some, but not all, are also insured or guaranteed by the U.S. Government. Mortgage-backed securities issued by non-governmental issuers (such as commercial banks, savings and loan institutions, private mortgage insurance companies, mortgage bankers and other secondary market issuers) may entail greater risk than obligations guaranteed by the U.S. Government. Mortgage- and other asset-backed securities are subject to prepayment risk, which is the possibility that the underlying mortgage or other asset may be refinanced or prepaid prior to maturity during periods of declining or low interest rates, causing the Fund to have to reinvest the money received in securities that have lower yields. Rising or high interest rates tend to extend the duration of mortgage- and other asset-backed securities, making their prices more volatile and more sensitive to changes in interest rates.
Shareholder concentration risk
At April 30, 2017, one unaffiliated shareholder of record owned 18.4% of the outstanding shares of the Fund in one or more accounts. The Fund has no knowledge about whether any portion of those shares was owned beneficially. Affiliated shareholders of record owned 59.5% of the outstanding shares of the Fund in one or more accounts. Subscription and redemption activity by concentrated accounts may have a significant effect on the operations of the Fund. In the case of a large redemption, the Fund may be forced to sell investments at inopportune times, including its liquid or more liquid positions, resulting in Fund losses and the Fund holding a higher percentage of less liquid or illiquid securities. Large redemptions could result in decreased economies of scale and increased operating expenses for non-redeeming Fund shareholders.
Note 9. Subsequent events
Management has evaluated the events and transactions that have occurred through the date the financial statements were issued. Other than as noted in Note 1 above, there were no items requiring adjustment of the financial statements or additional disclosure.
Note 10. Information regarding pending and settled legal proceedings
Ameriprise Financial and certain of its affiliates have historically been involved in a number of legal, arbitration and regulatory proceedings, including routine litigation, class actions, and governmental actions, concerning matters arising in connection with the conduct of their business activities. Ameriprise Financial believes that the Funds are not currently the subject of, and that neither Ameriprise Financial nor any of its affiliates are the subject of, any pending legal, arbitration or regulatory proceedings that are likely to have a material adverse effect on the Funds or the ability of Ameriprise Financial or its affiliates to perform under their contracts with the Funds. Ameriprise Financial is required to make quarterly (10-Q), annual (10-K) and, as necessary, 8-K filings with the Securities and Exchange Commission (SEC) on legal and regulatory matters that relate to Ameriprise Financial and its affiliates. Copies of these filings may be obtained by accessing the SEC website at www.sec.gov.
Columbia Total Return Bond Fund | Annual Report 2017
| 67 |
Notes to Financial Statements (continued)
April 30, 2017
There can be no assurance that these matters, or the adverse publicity associated with them, will not result in increased fund redemptions, reduced sale of fund shares or other adverse consequences to the Funds. Further, although we believe proceedings are not likely to have a material adverse effect on the Funds or the ability of Ameriprise Financial or its affiliates to perform under their contracts with the Funds, these proceedings are subject to uncertainties and, as such, we are unable to estimate the possible loss or range of loss that may result. An adverse outcome in one or more of these proceedings could result in adverse judgments, settlements, fines, penalties or other relief that could have a material adverse effect on the consolidated financial condition or results of operations of Ameriprise Financial.
| 68 | Columbia Total Return Bond Fund | Annual Report 2017 |
Report of Independent Registered Public Accounting Firm
To the Trustees of Columbia Funds Series Trust I and the Shareholders of Columbia Total Return Bond Fund
In our opinion, the accompanying statement of assets and liabilities, including the portfolio of investments, and the related statements of operations and of changes in net assets and the financial highlights present fairly, in all material respects, the financial position of Columbia Total Return Bond Fund (the “Fund”, a series of Columbia Funds Series Trust I) as of April 30, 2017, the results of its operations for the year then ended, the changes in its net assets for each of the two years in the period then ended and the financial highlights for each of the five years in the period then ended, in conformity with accounting principles generally accepted in the United States of America. These financial statements and financial highlights (hereafter referred to as “financial statements”) are the responsibility of the Fund’s management. Our responsibility is to express an opinion on these financial statements based on our audits. We conducted our audits of these financial statements in accordance with the standards of the Public Company Accounting Oversight Board (United States). Those standards require that we plan and perform the audit to obtain reasonable assurance about whether the financial statements are free of material misstatement. An audit includes examining, on a test basis, evidence supporting the amounts and disclosures in the financial statements, assessing the accounting principles used and significant estimates made by management, and evaluating the overall financial statement presentation. We believe that our audits, which included confirmation of securities as of April 30, 2017 by correspondence with the custodian, brokers, agent banks and transfer agent, provide a reasonable basis for our opinion.
PricewaterhouseCoopers LLP
Minneapolis, MN
June 21, 2017
Columbia Total Return Bond Fund | Annual Report 2017
| 69 |
Federal Income Tax Information
(Unaudited)
The Fund hereby designates the following tax attributes for the fiscal year ended April 30, 2017. Shareholders will be notified in early 2018 of the amounts for use in preparing 2017 income tax returns.
Capital
gain
dividend | |
| $11,682,004 | |
Capital gain dividend. The Fund designates as a capital gain dividend the amount reflected above, or if subsequently determined to be different, the net capital gain of such fiscal period.
| 70 | Columbia Total Return Bond Fund | Annual Report 2017 |
Shareholders elect the Board that oversees the Fund’s operations. The Board appoints officers who are responsible for day-to-day business decisions based on policies set by the Board. The following table provides basic biographical information about the Fund’s Trustees, including their principal occupations during the past five years, although specific titles for individuals may have varied over the period. The year set forth beneath Length of Service in the table below is the year in which the Trustee was first appointed or elected as Trustee to any Fund currently in the Columbia Funds Complex or a predecessor thereof. Under current Board policy, members serve terms of indefinite duration.
Independent trustees
| Name, address, year of birth | Position held with the Trust and length of service | Principal occupation(s) during the past five years and other relevant professional experience | Number of Funds in the Columbia Fund Complex overseen | Other directorships held by Trustee during the past five years |
Janet Langford Carrig
c/o Columbia Management
Investment Advisers, LLC
225 Franklin Street
Mail Drop BX32 05228
Boston, MA 02110
1957 | Trustee
1996 | Senior Vice President, General Counsel and Corporate Secretary, ConocoPhillips (independent energy company) since September 2007 | 57 | None |
Douglas A. Hacker
c/o Columbia Management
Investment Advisers, LLC
225 Franklin Street
Mail Drop BX32 05228
Boston, MA 02110
1955 | Trustee and Chairman of the Board
1996 | Independent business executive since May 2006; Executive Vice President — Strategy of United Airlines from December 2002 to May 2006; President of UAL Loyalty Services (airline marketing company) from September 2001 to December 2002; Executive Vice President and Chief Financial Officer of United Airlines from July 1999 to September 2001 | 57 | Spartan Nash Company, (food distributor); Nash Finch Company (food distributor) from 2005 to 2013; Aircastle Limited (aircraft leasing); SeaCube Container Leasing Ltd. (container leasing) from 2010 to 2013; and Travelport Worldwide Limited (travel information technology) |
Nancy T. Lukitsh
c/o Columbia Management
Investment Advisers, LLC
225 Franklin Street
Mail Drop BX32 05228
Boston, MA 02110
1956 | Trustee
2011 | Senior Vice President, Partner and Director of Marketing, Wellington Management Company, LLP (investment adviser) from 1997 to 2010; Chair, Wellington Management Portfolios (commingled non-U.S. investment pools) from 2007 to 2010; Director, Wellington Trust Company, NA and other Wellington affiliates from 1997 to 2010 | 57 | None |
David M. Moffett
c/o Columbia Management
Investment Advisers, LLC
225 Franklin Street
Mail Drop BX32 05228
Boston, MA 02110
1952 | Trustee
2011 | Retired. Consultant to Bridgewater and Associates | 57 | Director, CSX Corporation; Genworth Financial, Inc. (financial and insurance products and services); Paypal Holdings Inc. (payment and data processing services); Trustee, University of Oklahoma Foundation; former Director, eBay Inc. (online trading community), 2007-2015; and former Director, CIT Bank, CIT Group Inc. (commercial and consumer finance), 2010-2016 |
Columbia Total Return Bond Fund | Annual Report 2017
| 71 |
TRUSTEES AND OFFICERS (continued)
Independent trustees (continued)
| Name, address, year of birth | Position held with the Trust and length of service | Principal occupation(s) during the past five years and other relevant professional experience | Number of Funds in the Columbia Fund Complex overseen | Other directorships held by Trustee during the past five years |
Charles R. Nelson
c/o Columbia Management
Investment Advisers, LLC
225 Franklin Street
Mail Drop BX32 05228
Boston, MA 02110
1942 | Trustee
1981 | Retired. Professor Emeritus, University of Washington since 2011; Professor of Economics, University of Washington from 1976 to 2011; Ford and Louisa Van Voorhis Professor of Political Economy, University of Washington from 1993 to 2011; Adjunct Professor of Statistics, University of Washington from 1980 to 2011; Associate Editor, Journal of Money, Credit and Banking from September 1993 to 2008; consultant on econometric and statistical matters | 57 | None |
John J. Neuhauser
c/o Columbia Management
Investment Advisers, LLC
225 Franklin Street
Mail Drop BX32 05228
Boston, MA 02110
1943 | Trustee
1984 | President, Saint Michael’s College since August 2007; Director or Trustee of several non-profit organizations, including University of Vermont Medical Center; Academic Vice President and Dean of Faculties, Boston College from August 1999 to October 2005; University Professor, Boston College from November 2005 to August 2007 | 57 | Liberty All-Star Equity Fund and Liberty All- Star Growth Fund (closed-end funds) |
Patrick J. Simpson
c/o Columbia Management
Investment Advisers, LLC
225 Franklin Street
Mail Drop BX32 05228
Boston, MA 02110
1944 | Trustee
2000 | Of Counsel, Perkins Coie LLP (law firm) since 2015; Partner, Perkins Coie LLP from 1988 to 2014 | 57 | None |
Anne-Lee Verville
c/o Columbia Management
Investment Advisers, LLC
225 Franklin Street
Mail Drop BX32 05228
Boston, MA 02110
1945 | Trustee
1998 | Retired. General Manager, Global Education Industry from 1994 to 1997, President – Application Systems Division from 1991 to 1994, Chief Financial Officer – US Marketing & Services from 1988 to 1991, and Chief Information Officer from 1987 to 1988, IBM Corporation (computer and technology) | 57 | Enesco Group, Inc. (producer of giftware and home and garden decor products) from 2001 to 2006 |
| 72 | Columbia Total Return Bond Fund | Annual Report 2017 |
TRUSTEES AND OFFICERS (continued)
Consultants to the Independent Trustees*
| Name, address, year of birth | Position held with the Trust and length of service | Principal occupation(s) during the past five years and other relevant professional experience | Number of Funds in the Columbia Funds complex overseen | Other directorships held by Trustee during the past five years |
J. Kevin Connaughton
c/o Columbia
Management Investment
Advisers, LLC,
225 Franklin Street
Mail Drop BX32 05228,
Boston, MA 02110
1964 | Independent Trustee Consultant
2016 | Independent Trustee Consultant, Columbia Funds since March 2016; Managing Director and General Manager of Mutual Fund Products, Columbia Management Investment Advisers, LLC from May 2010 to February 2015; President, Columbia Funds from 2009 to 2015; and senior officer of Columbia Funds and affiliated funds from 2003 to 2015 | 57 | Board of Governors, Gateway Healthcare since January 2016; Trustee, New Century Portfolios since March 2015; and Director, The Autism Project since March 2015 |
Natalie A. Trunow
c/o Columbia
Management Investment
Advisers, LLC,
225 Franklin Street
Mail Drop BX32 05228,
Boston, MA 02110
1967 | Independent Trustee Consultant
2016 | Independent Trustee Consultant, Columbia Funds since September 2016; Chief Executive Officer, Millennial Partners (investment consulting services to institutions) since January 2016; Director of Investments, Casey Family Programs from April 2016 to September 2016; Senior Vice President and Chief Investment Officer, Calvert Investments from August 2008 to January 2016; Section Head and Portfolio Manager, General Motors Asset Management from June 1997 to August 2008 | 57 | Healthcare Services for Children with Special Needs |
| * | J. Kevin Connaughton was appointed consultant to the Independent Trustees effective March 1, 2016. Natalie A. Trunow was appointed consultant to the Independent Trustees effective September 1, 2016. Shareholders of the Funds are expected to be asked to elect each of Mr. Connaughton and Ms. Trunow as a Trustee at a future shareholder meeting. |
Interested trustee affiliated with Investment Manager*
| Name, address, year of birth | Position held with the Trust and length of service | Principal occupation(s) during the past five years and other relevant professional experience | Number of Funds in the Columbia Funds Complex overseen | Other directorships held by Trustee during the past five years |
William F. Truscott
c/o Columbia Management
Investment Advisers, LLC
225 Franklin Street
Boston, MA 02110
1960 | Trustee
2012 | Chairman of the Board and President, Columbia Management Investment Advisers, LLC since May 2010 and February 2012, respectively; Chief Executive Officer, Global Asset Management, Ameriprise Financial, Inc. since September 2012 (previously Chief Executive Officer, U.S. Asset Management & President, Annuities, May 2010-September 2012); Director and Chief Executive Officer, Columbia Management Investment Distributors, Inc. since May 2010 and February 2012, respectively;Chairman of the Board and Chief Executive Officer, RiverSource Distributors, Inc. since 2006; Director, Threadneedle Asset Management Holdings, SARL since 2014; President and Chief Executive Officer, Ameriprise Certificate Company, 2006-August 2012 | 183 | Chairman of the Board, Columbia Management Investment Advisers, LLC since May 2010; Director, Columbia Management Investment Distributors, Inc. since May 2010; former Director, Ameriprise Certificate Company, 2006 - January 2013 |
| * | Interested person (as defined under the 1940 Act) by reason of being an officer, director, security holder and/or employee of the Investment Manager or Ameriprise Financial. |
The Statement of Additional Information has additional information about the Fund’s Board members and is available,
without charge, upon request by calling 800.345.6611; contacting your financial intermediary; or visiting
investor.columbiathreadneedleus.com.
Columbia Total Return Bond Fund | Annual Report 2017
| 73 |
TRUSTEES AND OFFICERS (continued)
The Board has appointed officers who are responsible for day-to-day business decisions based on policies it has established. The officers serve at the pleasure of the Board. The following table provides basic information about the Officers of the Fund, including principal occupations during the past five years, although their specific titles may have varied over the period. In addition to Mr. Truscott, who is Senior Vice President, the Fund’s other officers are:
Fund officers
Name,
address and
year of birth | Position and year
first appointed to
position for any Fund
in the Columbia
Funds complex or a
predecessor thereof | Principal occupation(s) during past five years |
Christopher O. Petersen
5228 Ameriprise
Financial Center
Minneapolis, MN 55474
Born 1970 | President and Principal Executive Officer (2015) | Vice President and Lead Chief Counsel, Ameriprise Financial, Inc. since January 2015 (previously, Vice President and Chief Counsel, January 2010 - December 2014; officer of Columbia Funds and affiliated funds since 2007. |
Michael G. Clarke
225 Franklin Street
Boston, MA 02110
Born 1969 | Treasurer (2011), Chief Financial Officer (2009) and Chief Accounting Officer (2015) | Vice President — Mutual Fund Administration, Columbia Management Investment Advisers, LLC, since May 2010; senior officer of Columbia Funds and affiliated funds since 2002. |
Paul B. Goucher
100 Park Avenue
New York, NY 10017
Born 1968 | Senior Vice President (2011) and Assistant Secretary (2008) | Senior Vice President and Assistant General Counsel, Ameriprise Financial, Inc. since January 2017 (previously Vice President and Lead Chief Counsel, November 2008 - January 2017 and January 2013 - January 2017, respectively; and Chief Counsel, January 2010 - January 2013); Vice President, Chief Legal Officer and Assistant Secretary, Columbia Management Investment Advisers, LLC since May 2010. |
Thomas P. McGuire
225 Franklin Street
Boston, MA 02110
Born 1972 | Senior Vice President and Chief Compliance Officer (2012) | Vice President — Asset Management Compliance, Ameriprise Financial, Inc., since May 2010; Chief Compliance Officer, Ameriprise Certificate Company since September 2010. |
Colin Moore
225 Franklin Street
Boston, MA 02110
Born 1958 | Senior Vice President (2010) | Executive Vice President and Global Chief Investment Officer, Ameriprise Financial, Inc., since July 2013; Executive Vice President and Global Chief Investment Officer, Columbia Management Investment Advisers, LLC since July 2013 (previously Director and Global Chief Investment Officer, 2010 - 2013). |
Michael E. DeFao
225 Franklin Street
Boston, MA 02110
Born 1968 | Vice President (2011) and Assistant Secretary (2010) | Vice President and Chief Counsel, Ameriprise Financial, Inc. since May 2010. |
Amy Johnson
5228 Ameriprise
Financial Center
Minneapolis, MN 55474
Born 1965 | Vice President (2006) | Managing Director and Global Head of Operations, Columbia Management Investment Advisers, LLC since April 2016 (previously Managing Director and Chief Operating Officer, 2010 - 2016). |
Lyn Kephart-Strong
5228 Ameriprise
Financial Center
Minneapolis, MN 55474
Born 1960 | Vice President (2015) | President, Columbia Management Investment Services Corp. since October 2014; Vice President & Resolution Officer, Ameriprise Trust Company since August 2009. |
Ryan C. Larrenaga
225 Franklin Street
Boston, MA 02110
Born 1970 | Senior Vice President (2017), Chief Legal Officer (2017) and Secretary (2015) | Vice President and Group Counsel, Ameriprise Financial, Inc. since August 2011; officer of Columbia Funds and affiliated funds since 2005. |
| 74 | Columbia Total Return Bond Fund | Annual Report 2017 |
The Fund mails one shareholder report to each shareholder address. If you would like more than one report, please call shareholder services at 800.345.6611 and additional reports will be sent to you.
Proxy voting policies and procedures
The policy of the Board of Trustees is to vote the proxies of the companies in which the Fund holds investments consistent with the procedures as stated in the Statement of Additional Information (SAI). You may obtain a copy of the SAI without charge by calling 800.345.6611; contacting your financial intermediary; visiting investor.columbiathreadneedleus.com; or searching the website of the Securities and Exchange Commission (SEC) at sec.gov. Information regarding how the Fund voted proxies relating to portfolio securities is filed with the SEC by August 31st for the most recent 12-month period ending June 30th of that year, and is available without charge by visiting investor.columbiathreadneedleus.com, or searching the website of the SEC at sec.gov.
Quarterly schedule of investments
The Fund files a complete schedule of portfolio holdings with the SEC for the first and third quarters of each fiscal year on Form N-Q. The Fund’s Form N-Q is available on the SEC’s website at sec.gov and may be reviewed and copied at the SEC’s Public Reference Room in Washington, D.C. Information on the operation of the Public Reference Room may be obtained by calling 800.SEC.0330. The Fund’s complete schedule of portfolio holdings, as filed on Form N-Q, can also be obtained without charge, upon request, by calling 800.345.6611.
Additional Fund information
For more information about the Fund, please visit investor.columbiathreadneedleus.com or call 800.345.6611. Customer Service Representatives are available to answer your questions Monday through Friday from 8 a.m. to 7 p.m. Eastern time.
Fund investment manager
Columbia Management Investment Advisers, LLC
225 Franklin Street
Boston, MA 02110
Fund distributor
Columbia Management Investment Distributors, Inc.
225 Franklin Street
Boston, MA 02110
Fund transfer agent
Columbia Management Investment Services Corp.
P.O. Box 8081
Boston, MA 02266-8081
Columbia Total Return Bond Fund | Annual Report 2017
| 75 |
[THIS PAGE INTENTIONALLY LEFT BLANK]
[THIS PAGE INTENTIONALLY LEFT BLANK]
Columbia Total Return Bond Fund
P.O. Box 8081
Boston, MA 02266-8081
Please read and consider the investment objectives, risks, charges and expenses for any fund carefully before investing. For a prospectus and summary prospectus, which contains this and other important information about the Fund, go to
investor.columbiathreadneedleus.com. The Fund is distributed by Columbia Management Investment Distributors, Inc., member FINRA, and managed by Columbia Management Investment Advisers, LLC.
Columbia Threadneedle Investments (Columbia Threadneedle) is the global brand name of the Columbia and Threadneedle group of companies. All rights reserved. Columbia Management Investment Distributors, Inc., 225 Franklin Street, Boston, MA 02110-2804
© 2017 Columbia Management Investment Advisers, LLC.
investor.columbiathreadneedleus.com

Annual Report
April 30, 2017
Multi-Manager Directional Alternative Strategies Fund
(formerly ACTIVE PORTFOLIOS® MULTI-MANAGER DIRECTIONAL ALTERNATIVES FUND)
Not FDIC Insured • No bank guarantee • May lose value
Dear Shareholders,
While emotions have run high following the outcome of the U.S. Presidential election, it remains unclear how the Trump presidency will unfold in terms of policy. We have a sense of the priorities espoused by the President over the past eighteen months, but campaign priorities are not always realized and are often never pursued. What seems certain is that, while some investors have already priced expectations into the market, others have retreated, preferring instead a wait and see approach. The outcome of such behaviors appears to have created conditions ripe for ongoing market volatility.
While volatility in the financial markets can be stressful, volatility itself is not a new phenomenon. Other factors that have been at the root cause of recent volatility include uncertainty following the United Kingdom’s vote to exit the European Union (Brexit), speculation around the Federal Reserve’s decision to increase interest rates, divergent central bank policy and geopolitical unrest. The point is, financial markets have fluctuated for years and may be expected to continue to fluctuate — sometimes wildly. If anything, such volatility seems to be the new normal, perhaps exacerbated by access to information and development of technological tools which have enabled investors to react rapidly to real and perceived change. So what can you do?
Position your portfolio for the reality of market volatility
That there is a historical precedent for market volatility, or even an acceptance that it may persist, offers little comfort. A measured and strategic approach remains the best strategy for investors to stay on track in achieving their investment goals.
Step 1: Review your investment goals
Take this opportunity to review your investment goals and the strategies you are pursuing to achieve those goals in order to remain focused on what’s important to you. It is entirely possible that your goals have changed in response either to your life situation or to changes in the market. Accept what you can’t control — volatility, and focus on what you can — your investment goals and strategies.
Step 2: Reassess your risk tolerance
Sit down with your financial advisor to discuss your investment goals and strategies, as well as any changes to your tolerance for risk. Consider your investment horizon. Increased market volatility and a new investment horizon may impact the strategies that can best help you achieve your investment goals. Remember, achieving your investment goals may require a certain amount of risk. Ultimately, you must maintain vigilance in reassessing your risk tolerance and the strategies you have selected in pursuit of your investment goals, and awareness of how those strategies may react to market volatility.
Step 3: Remain calm and focus on your long-term plan
Remember, investing is about the long game. Short term events are not necessarily evidence of a longer term reality. Investors who attempt to time the market too often end up reacting to a down turn by selling low and then compounding the problem by waiting on the sidelines, ultimately missing the right opportunity to reinvest.
Multi-Manager Directional Alternative Strategies Fund | Annual Report 2017
President’s Message (continued)
As long as there is a market, there will be volatility. How you respond to that volatility can make a big difference in the measure of your success as an investor. Talk to your financial advisor about how working with Columbia Threadneedle Investments may help you position your portfolio for the reality of ongoing volatility and, perhaps, even turn such volatility into investment opportunity.
Sincerely,
Christopher O. Petersen
President, Columbia Funds
Investors should consider the investment objectives, risks, charges and expenses of a mutual fund carefully before investing. For a free prospectus and summary prospectus, which contains this and other important information about a fund, visit investor.columbiathreadneedleus.com. The prospectus should be read carefully before investing.
Columbia Funds are distributed by Columbia Management Investment Distributors, Inc., member FINRA, and managed by Columbia Management Investment Advisers, LLC.
© 2017 Columbia Management Investment Advisers, LLC. All rights reserved.
Multi-Manager Directional Alternative Strategies Fund | Annual Report 2017
Multi-Manager Directional Alternative Strategies Fund | Annual Report 2017
Investment objective
Multi-Manager Directional Alternative Strategies Fund (the Fund) seeks capital appreciation.
Portfolio management
Boston Partners
Joseph Feeney, Jr., CFA
Eric Connerly, CFA
AQR Capital Management, LLC
Michelle Aghassi, Ph.D.
Andrea Frazzini, Ph.D., M.S.
Jacques Friedman, M.S.
Hoon Kim, Ph.D., M.B.A., CFA
Analytic
Harindra de Silva, CFA
Dennis Bein, CFA
David Krider, CFA
| Average annual total returns (%) (for the period ended April 30, 2017) |
| | | Inception | Life |
| Class A | 10/17/16 | 6.27 |
| Class Z * | 01/03/17 | 6.38 |
| HFRX Equity Hedge Index | | 4.85 |
| Wilshire Liquid Alternative Equity Hedge Index | | 4.68 |
| MSCI World Index (Net) | | 12.37 |
All results shown assume reinvestment of distributions during the period. Returns do not reflect the deduction of taxes that a shareholder may pay on Fund distributions or on the redemption of Fund shares. Performance results reflect the effect of any fee waivers or reimbursements of Fund expenses by Columbia Management Investment Advisers, LLC and/or any of its affiliates. Absent these fee waivers or expense reimbursement arrangements, performance results would have been lower.
The performance information shown represents past performance and is not a guarantee of future results. The investment return and principal value of your investment will fluctuate so that your shares, when redeemed, may be worth more or less than their original cost. Current performance may be lower or higher than the performance information shown. You may obtain performance information current to the most recent month-end by contacting your financial intermediary, visiting investor.columbiathreadneedleus.com or calling 800.345.6611.
| * | The returns shown for periods prior to the share class inception date (including returns for the Life of the Fund, if shown, which are since Fund inception) include the returns of the Fund’s oldest share class. These returns are adjusted to reflect any higher class-related operating expenses of the newer share classes, as applicable. Please visit investor.columbiathreadneedleus.com/investment-products/mutual-funds/appended-performance for more information. |
The HFRX Equity Hedge Index strategies maintain positions both long and short in primarily equity and equity derivative securities. Equity Hedgemanagers would typically maintain at least 50%, and may in some cases be substantially entirely invested in equities, both long and short. Hedge Fund Research, Inc. (HFR) utilizes a UCITSIII compliant methodology to construct the HFRX Hedge Fund Indices. The methodology is based on defined and predetermined rules and objective criteria to select and rebalance components to maximize representation of the Hedge Fund Universe. HFRX Indices utilize state-of-the-art quantitative techniques and analysis; multi-level screening, cluster analysis, Monte-Carlo simulations and optimization techniques ensure that each Index is a pure representation of its corresponding investment focus.
The Wilshire Liquid Alternative Equity Hedge Index measures the performance of the equity hedge strategy component of the Wilshire Liquid Alternative IndexSM. Equity hedge investment strategies predominantly invest in long and short equities. The Wilshire Liquid Alternative Equity Hedge Index (WLIQAEH) is designed to provide a broad measure of the liquid alternative equity hedge market.
The MSCI World Index (Net) is a free float-adjusted market capitalization weighted index that is designed to measure the equity market performance of developed markets.
Indices are not available for investment, are not professionally managed and do not reflect sales charges, fees, brokerage commissions, taxes (except the MSCI World Index (Net), which reflect reinvested dividends net of withholding taxes) or other expenses of investing. Securities in the Fund may not match those in an index.
Multi-Manager Directional Alternative Strategies Fund | Annual Report 2017
| 3 |
Fund at a Glance (continued)
Performance of a hypothetical $10,000 investment (October 17, 2016 — April 30, 2017)
The chart above shows the change in value of a hypothetical $10,000 investment in Class A shares of Multi-Manager Directional Alternative Strategies Fund during the stated time period, and does not reflect the deduction of taxes that a shareholder may pay on Fund distributions or on the redemption of Fund shares.
| Portfolio breakdown — long positions (%) (at April 30, 2017) |
| Common Stocks | 124.7 |
| Limited Partnerships | 1.0 |
| Preferred Stocks | 0.0 (a) |
| Short-Term Investments Segregated in Connection with Open Derivatives Contracts(b) | 30.3 |
| Total | 156.0 |
| (a) | Rounds to zero. |
| (b) | Includes investments in Money Market Funds (amounting to $187.1 million) which have been segregated to cover obligations relating to the Fund’s investment in derivatives which provide exposure to multiple markets. For a description of the Fund’s investments in derivatives, see Investments in Derivatives following the Portfolio of Investments and Note 2 to the Notes to Financial Statements. |
Percentages indicated are based upon total investments, net of investments sold short. The Fund’s portfolio composition is subject to change.
| Portfolio breakdown — short positions (%) (at April 30, 2017) |
| Common Stocks | (55.6) |
| Preferred Stocks | (0.4) |
| Total | (56.0) |
Percentages indicated are based upon total investments, net of investments sold short. The Fund’s portfolio composition is subject to change.
| Equity sector breakdown — long positions (%) (at April 30, 2017) |
| Consumer Discretionary | 8.0 |
| Consumer Staples | 4.5 |
| Energy | 5.5 |
| Financials | 16.0 |
| Health Care | 19.1 |
| Industrials | 10.3 |
| Information Technology | 22.0 |
| Materials | 7.5 |
| Real Estate | 2.1 |
| Telecommunication Services | 3.3 |
| Utilities | 1.7 |
| Total | 100.0 |
Percentages indicated are based upon total long equity investments. The Fund’s portfolio composition is subject to change.
| 4 | Multi-Manager Directional Alternative Strategies Fund | Annual Report 2017 |
Fund at a Glance (continued)
| Equity sector breakdown — short positions (%) (at April 30, 2017) |
| Consumer Discretionary | (17.1) |
| Consumer Staples | (5.1) |
| Energy | (15.1) |
| Financials | (15.3) |
| Health Care | (7.8) |
| Industrials | (7.9) |
| Information Technology | (15.4) |
| Materials | (6.5) |
| Real Estate | (6.8) |
| Telecommunication Services | (2.3) |
| Utilities | (0.7) |
| Total | (100.0) |
Percentages indicated are based upon total short equity investments. The Fund’s portfolio composition is subject to change.
| Market exposure through derivatives investments (% of notional exposure) (at April 30, 2017)(a) |
| | Long | Short | Net |
| Equity Derivative Contracts | 224.0 | (147.1) | 76.9 |
| Foreign Currency Derivative Contracts | 23.9 | (0.8) | 23.1 |
| Total Notional Market Value of Derivative Contracts | 247.9 | (147.9) | 100.0 |
(a) The Fund has market exposure (long and/or short) to the equity asset classes and foreign currency through its investments in derivatives. The notional exposure of a financial instrument is the nominal or face amount that is used to calculate payments made on that instrument and/or changes in value for the instrument. The notional exposure is a hypothetical underlying quantity upon which payment obligations are computed. Notional exposures provide a gauge for how the Fund may behave given changes in individual markets. For a description of the Fund’s investments in derivatives, see Investments in derivatives following the Portfolio of Investments, and Note 2 to the Notes to Financial Statements.
Multi-Manager Directional Alternative Strategies Fund | Annual Report 2017
| 5 |
Manager Discussion of Fund Performance
Effective February 28, 2017, the Fund’s name was changed to Multi-Manager Directional Alternatives Strategies Fund. During the period from inception on October 17, 2016 through April 30, 2017 (the reporting period), the Fund was managed by three independent money management firms and each invested a portion of the portfolio’s assets. As of April 30, 2017, Analytic Investors, LLC (Analytic), AQR Capital Management, LLC (AQR) and Boston Partners Global Investors, Inc. (Boston Partners) managed approximately 29.6%, 31.1% and 39.3% of the Fund’s assets, respectively.
For the reporting period that ended April 30, 2017, the Fund’s Class A shares returned 6.27%. During the same time period, the Fund outperformed the HFRX Equity Hedge Index, which returned 4.85%, as well as the Wilshire Liquid Alternative Equity Hedge Index, which returned 4.68%. The Fund underperformed the MSCI World Index (Net), which returned 12.37% during the reporting period. The Fund’s relative performance can be attributed to the performance of the Fund’s Subadvisers, who employ a variety of alternative investment strategies, involving strategies, techniques and practices designed to seek capital appreciation through participation in the broad equity and other markets while hedging overall market exposure relative to traditional long-only equity strategies. Generally, the Fund seeks to provide higher risk-adjusted returns with lower volatility compared to equity markets.
High risk stocks outpaced low risk stocks
The U.S. presidential election gave rise to large moves across asset classes, including equity markets, during the fourth quarter of 2016. In particular, developed market stocks fared well, with U.S. indices rising to record highs following the election on expectations of fiscal stimulus, market-friendly policies, lower taxes and greater infrastructure spending. Japanese stocks gained, supported by positive earnings reports and a weaker yen, which aided export prospects. European equities also performed well, boosted by a weaker euro, stronger than expected manufacturing data and reduced concerns around the banking sector. Conversely, emerging market equities were broadly lower during the reporting period. Notably, Chinese H-shares were weighed down by concerns that the new U.S. administration’s policies may reduce trade between the two countries as well by concerns about capital outflows and tighter financial conditions.
While many asset classes experienced reversals after the late-2016 moves higher, global stock markets continued to deliver strong returns in the first quarter of 2017. Consumer sentiment surveys rose to new multi-years highs in the U.S., and households seemed to be investing accordingly, with data showing robust inflows into mutual funds and exchange-traded funds (ETFs). Given favorable fundamentals, including stronger global economic growth data and relatively stable monetary policy, stock market gains seem not to have required any bold changes from the new U.S. administration. Equities likely also benefited from diminished concerns about international risks. The rebound in the Chinese currency early in 2017 assuaged fears of a repeat of the abrupt devaluations of 2015 and 2016. In Europe, the then-upcoming French presidential election generated some nervousness in financial markets early in the year, as a scandal weighed on the center-right candidate, and polls showed strong support for the more right-wing candidate, who called for a referendum on exiting the European Union and abandoning the euro. However, European equities staged a healthy rebound late in the reporting period, boosted by better than expected economic growth data and reduced odds of the right-wing candidate winning the French presidential election, as the independent candidate gained in the polls.
During the reporting period overall, higher risk, lower quality stocks outperformed lower risk, higher quality stocks. More specifically, the highest risk quintile of the HFRX Equity Hedge Index returned 16.1%, while the lowest risk quintile returned 8.1% during the reporting period. Realized and implied volatility were near historic lows.
Stock selection strategies overall boosted relative results
Analytic: Our portion of the Fund outperformed the HFRX Equity Hedge Index during the reporting period due primarily to effective stock selection. The market rewarding higher risk, lower quality companies during the reporting period served as a headwind for our strategy, as we take most of our short positions in higher risk names. However, most of our model’s valuation factors helped relative returns. Having an underweight to growth also boosted results, as more value-oriented factors outperformed during the reporting period.
From a sector perspective, having a short position in energy helped relative returns, as the sector posted negative absolute returns and underperformed the HFRX Equity Hedge Index during the reporting period. Stock selection within the energy sector also added value. Similarly, having a short position in real estate contributed positively. While the real estate sector posted positive absolute returns, it significantly underperformed the HFRX Equity Hedge Index. Having an overweight to health
| 6 | Multi-Manager Directional Alternative Strategies Fund | Annual Report 2017 |
Manager Discussion of Fund Performance (continued)
care contributed positively as did stock selection within the sector. Conversely, overweights to telecommunication services and consumer staples detracted from relative results, as each sector posted gains but underperformed the HFRX Equity Hedge Index during the reporting period. Stock selection within each of these sector also hurt. Stock selection in and having an underweighted allocation to materials dampened relative results, as the sector outperformed the HFRX Equity Hedge Index during the reporting period.
The top individual contributors to our portion of the Fund’s results during the reporting period were long positions in biopharmaceutical company Actelion, pharmaceuticals developer United Therapeutics and semiconductor equipment manufacturer KLA-Tencor. The biggest individual detractors from our portion of the Fund’s results were long positions in communication services providers Frontier Communications and KDDI and a short position in Royal Bank of Scotland.
The top contributing countries on a relative basis were Switzerland, Japan and the U.S., where strong stock selection in each drove results. The countries that detracted most from our portion of the Fund’s results were Australia, the U.K. and Canada, driven primarily by weak stock selection. Having an overweight to Canada, which underperformed the HRFX Equity Hedge Index during the reporting period, also dampened relative results.
AQR: Our portion of the Fund outperformed the HFRX Equity Hedge Index during the reporting period due primarily to effective stock selection. Passive market exposure and tactical market exposure also contributed positively, albeit more modestly. From a theme perspective within the global stock selection component of our portion of the Fund’s strategy, investor sentiment and valuation within industries were the best performing, while the momentum within industries and momentum across industries themes were the weakest performing.
From a sector perspective, it is important to note that our process implements a market neutral model that does not think in benchmark relative terms, along with a static passive exposure via futures. It targets a portfolio beta of zero, but has a perennial long dollar bias associated with low beta signals in its stability theme. We equilibriate the portfolio beta by running more Fund assets long than short. While net sector exposures in a long-only portfolio are zero sum and can imply a view-based forecast, this is not the case within our process. All that said, industrials, information technology and consumer discretionary were the strongest positive contributors. Industrials and information technology benefited from stronger growth expectations since the U.S. elections, while consumer discretionary stocks lagged. A small component of our portion of the Fund’s model considers industry relative views, and these modestly favored economically sensitive sectors, such as industrials, funding them from more traditional defensive sectors, such as utilities and consumer staples. Conversely, consumer staples, energy and telecommunication services were the sectors that detracted the most. Consumer staples and telecommunication services lagged more economically sensitive sectors since the U.S. elections and within the first months of 2017. Energy maintained a protracted resolution of supply and demand imbalances with respect to oil, which weighed on performance for the sector.
The top individual contributors to our portion of the Fund’s results during the reporting period were semiconductor manufacturer STMicroelectronics, digital services company Atos and residential housing developer Persimmon. The biggest individual detractors from our portion of the Fund’s results during the reporting period were specialty chemicals company Platform Specialty Products, copper miner Antofagasta and cable and mobile telephony services provider Altice. It is important to keep in mind that our process is a systematic one in which securities are held based on their characteristics against hundreds of individual factors used by our investment model. Decisions to add or remove positions are based on relative attractiveness across all factors and themes as well as optimization indications of marginal risk and trading costs. We do not make security level weight decisions based on data points of individual stocks in isolation. We attempt to diversify away more idiosyncratic risk by holding hundreds of securities with position-sized constraints.
Similarly with countries, our process is a market neutral model that takes essentially no relative country or currency views. Still, within the global stock selection component, the U.S., France and Italy were the largest positive contributors to returns. Conversely, the Netherlands, the U.K. and the European Union were the biggest detractors from results during the reporting period.
Multi-Manager Directional Alternative Strategies Fund | Annual Report 2017
| 7 |
Manager Discussion of Fund Performance (continued)
Boston Partners: Our portion of the Fund outperformed the HFRX Equity Hedge Index during the reporting period. The most important factors in our portion of the Fund’s return during the reporting period were a bias to value on the long side and effective stock selection in the information technology sector. Style returns during the reporting period favored large growth companies. On an absolute basis, our portion of the Fund posted solid returns due to its net long positioning amid a strongly rising stock market.
The market segments that contributed most positively to our portion of the Fund’s absolute return during the reporting period were information technology, finance and capital goods on the long side of the portfolio. Within the information technology sector on the long side, we saw strength within our portion of the Fund’s semiconductor holdings, as profitability improved with industry consolidation and positive mix shifts to higher margin end-markets, such as industrial, autos and health care rather than consumer electronics. Capital goods and finance stocks rose on optimism for faster economic growth, lower regulatory burdens and higher tariff barriers under the new U.S. presidential administration. Conversely, the market segments that detracted most from our portion of the Fund’s absolute returns during the reporting period were technology, capital goods and finance on the short side of the portfolio. Small- and mid-cap technology short positions suffered amid a strong start to the calendar year for the sector. Software and equipment names hurt the most. We believe most of this underperformance was driven by short-term sentiment swings rather than any meaningful improvements in company-specific prospects. Similar to the long side, capital goods and finance stocks rose on expectations for the new administration’s various policies.
The top individual contributors to our portion of the Fund’s absolute returns during the reporting period were Bank of America, SLM and Samsung Electronics. Diversified financials institution Bank of America and student loan provider SLM, commonly known as Sallie Mae, responded positively to the improved regulatory outlook resulting from change in both Congress and the White House. Shares of electronic equipment and products manufacturer Samsung Electronics rose on surprisingly strong financial results and on guidance to a strong 2017 profit outlook. The biggest individual detractors from our portion of the Fund’s absolute returns during the reporting period were short positions in machine vision systems manufacturer Cognex, telecommunication services company Sprint and technology hardware and equipment provider Arista Networks. Share prices of Cognex and Arista Networks increased on strong profit reports accompanied by improved profit expectations during the reporting period. Sprint’s shares gained on optimism for the potential of a combination with another mobile communications company in the wake of the political transition. We reduced all three short positions during the reporting period.
Purchases and sales drove Fund portfolio changes
Analytic: Our portion of the Fund takes a total portfolio approach and does not make company-specific buys and sells. That said, during the reporting period, our portion of the Fund increased its exposures to health care and financials, while decreasing its relative weights to consumer discretionary and consumer staples. Within health care, our portion of the Fund purchased Johnson & Johnson, Pfizer and Unitedhealth Group, as our models indicated each had relatively low risk and an attractive valuation. Elsewhere, we established short positions in Equinix and Core Laboratories and increased short position in SBA Communications. In our view, Equinix was of below average quality and high valuation, while Core Laboratories, we believed, increased its risk. We increased the short position in SBA Communications due to its high valuation and higher than average earnings estimates revisions. From a country perspective, our portion of the Fund increased weights to the U.S., Hong Kong and Australia and decreased weights to Switzerland, Sweden and Finland during the reporting period.
At the end of the reporting period, our portion of the Fund was overweight in health care and telecommunication services and underweight in consumer staples, real estate, financials, industrials, consumer discretionary and energy relative to the HFRX Equity Hedge Index. Our portion of the Fund was rather neutrally weighted to information technology, materials and utilities compared to the HFRX Equity Hedge Index at the end of the reporting period. Geographically, our portion of the Fund was overweight relative to the HFRX Equity Hedge Index in Hong Kong, Japan, Norway, Australia and Canada; was underweight Spain, Finland, Italy, Sweden, Germany, Switzerland, France, the U.K. and the U.S.; and was rather neutrally allocated to Denmark, Portugal, New Zealand, Austria, Ireland, Israel, the Netherlands, Belgium and Singapore at the end of the reporting period. From a factor perspective, our portion of the Fund was overweight valuation and quality factors at the end of the reporting period, while underweight growth and risk factors relative to the HFRX Equity Hedge Index.
| 8 | Multi-Manager Directional Alternative Strategies Fund | Annual Report 2017 |
Manager Discussion of Fund Performance (continued)
AQR: Our strategy’s systematic investment process utilizes a model that ranks securities preferences along hundreds of factors on a daily basis. The securities most desired for inclusion in that model view are ones that display characteristics that rank well on the suite of factors as a whole, rather than upon a single metric, narrative or catalyst. The strategy rebalances periodically, attempting to stay close to the model while adhering to prospectus constraints and minimizing turnover, trading costs and other undesired effects.
The majority of themes in our investment model evaluate companies on an industry-neutral basis. For example, within the momentum theme, three sub-components—industry momentum, indirect momentum and factor momentum—either take explicit industry views based on relative performance or are allowed to take industry/sector views as a by-product of the momentum within their signals. During the reporting period, the largest shift within these momentum sub-components was to move from a view that echoed the markets’ preference for stability areas to one of more pro-growth and risk-on sentiments following the U.S. election in the fourth quarter of 2016 and on better than expected economic growth from continental Europe and emerging markets during the first quarter of 2017. The strategy does not take active country allocation risk and therefore no meaningful shifts in country weightings were made during the reporting period relative to the HFRX Equity Hedge Index.
At the end of the reporting period, our portion of the Fund was overweight financials, industrials, materials, consumer discretionary, information technology, real estate and health care relative to the HFRX Equity Hedge Index. Conversely, our portion of the Fund was underweight the HFRX Equity Hedge Index in energy, consumer staples, telecommunication services and utilities. Since our portion of the Fund does not take active country allocation risk, country positioning at the end of the reporting period was neutrally-weighted relative to the HFRX Equity Hedge Index.
Boston Partners: U.K. bank Lloyds Banking Group and U.S. domain name and Internet security services provider VeriSign were purchased for our portion of the Fund during the reporting period based on what we considered to be inexpensive valuations, improving profitability and positive business momentum. U.S.-based international insurance and retirement services organization American International Group and U.S.-based alcoholic beverage producer Constellation Brands were sold by our portion of the Fund during the reporting period due to what we viewed as elevated valuations, flattening profitability and stagnating business momentum.
From a sector perspective, new long positions and new short positions taken during the reporting period were concentrated in the energy and services market segments. We closed more long positions in energy than in any other sector due to rising valuations; closed short positions were concentrated in capital goods names.
At the end of the reporting period, long and short exposures were near our long/short research strategy’s historical averages, as prospectively improving revenues and taxes are balanced by high average market valuations, in our view. Our analysis process is rooted in a three circles framework of low valuation, positive business momentum and superior economic fundamentals, a process our portfolio managers have been employing for more than a quarter century.
Derivative positions in the Fund
Analytic: Our portion of the Fund did not invest in derivatives during the reporting period.
AQR: Our portion of the Fund utilized equity swaps, equity index futures and currency forwards during the reporting period. We used equity derivative instruments as a substitute for investing in conventional securities and for investment purposes to increase economic exposure to a particular security or index in a cost-effective manner. Typically, our portion of the Fund invests in common stocks and swaps on individual common stocks. Additionally, our portion of Fund uses both equity index futures and currency forwards to gain passive equity market exposure. Our portion of the Fund’s passive market exposure and tactical market exposure components are implemented entirely using derivatives. The global stock selection component is implemented using both physical equities and equity swaps. All three components contributed positively to our portion of the Fund’s results during the reporting period.
Multi-Manager Directional Alternative Strategies Fund | Annual Report 2017
| 9 |
Manager Discussion of Fund Performance (continued)
Boston Partners: Our portion of the Fund utilized several options during the reporting period, though they represented a rather small portion of the portfolio and thus had a minimal effect on performance. Derivatives were used to gain short exposure when 1) exchanges forbade cash short sales; 2) taxes or other market features made cash long purchases or sales expensive; and 3) additional return was sought when implied volatilities were sufficiently high and stocks held long were near their target price.
Market risk may affect a single issuer, sector of the economy, industry or the market as a whole. The Fund is managed by multiple advisers independently of one another, which may result in contradicting trades (i.e., with no net benefit to the Fund), while increasing transaction costs. Foreign investments subject the Fund to risks, including political, economic, market, social and others within a particular country, as well as to currency instabilities and less stringent financial and accounting standards generally applicable to U.S. issuers. Risks are enhanced for emerging market issuers. Growth securities, at times, may not perform as well as value securities or the stock market in general and may be out of favor with investors. Investments in a limited number of companies subject the Fund to greater risk of loss. The Fund may invest significantly in issuers within a particular sector, which may be negatively affected by market, economic or other conditions, making the Fund more vulnerable to unfavorable developments in the sector. Quantitative Model Risk Investments selected using quantitative methods may perform differently from the market as a whole. There can be no assurance that these methodologies will enable the Fund to achieve its objective. See the Fund’s prospectus for more information on these and other risks.
The views expressed in this report reflect the current views of the respective parties. These views are not guarantees of future performance and involve certain risks, uncertainties and assumptions that are difficult to predict, so actual outcomes and results may differ significantly from the views expressed. These views are subject to change at any time based upon economic, market or other conditions and the respective parties disclaim any responsibility to update such views. These views may not be relied on as investment advice and, because investment decisions for a Columbia fund are based on numerous factors, may not be relied on as an indication of trading intent on behalf of any particular Columbia fund. References to specific securities should not be construed as a recommendation or investment advice.
| 10 | Multi-Manager Directional Alternative Strategies Fund | Annual Report 2017 |
Understanding Your Fund’s Expenses
(Unaudited)
As an investor, you incur two types of costs. There are transaction costs, which generally include sales charges on purchases and may include redemption fees. There are also ongoing costs, which generally include management fees, distribution and/or service fees, and other fund expenses. The following information is intended to help you understand your ongoing costs (in dollars) of investing in the Fund and to help you compare these costs with the ongoing costs of investing in other mutual funds.
Analyzing your Fund’s expenses
To illustrate these ongoing costs, we have provided examples and calculated the expenses paid by investors in each share class of the Fund during the period. The actual and hypothetical information in the table is based on an initial investment of $1,000 at the beginning of the period indicated and held for the entire period. Expense information is calculated two ways and each method provides you with different information. The amount listed in the “Actual” column is calculated using the Fund’s actual operating expenses and total return for the period. You may use the Actual information, together with the amount invested, to estimate the expenses that you paid over the period. Simply divide your account value by $1,000 (for example, an $8,600 account value divided by $1,000 = 8.6), then multiply the results by the expenses paid during the period under the “Actual” column. The amount listed in the “Hypothetical” column assumes a 5% annual rate of return before expenses (which is not the Fund’s actual return) and then applies the Fund’s actual expense ratio for the period to the hypothetical return. You should not use the hypothetical account values and expenses to estimate either your actual account balance at the end of the period or the expenses you paid during the period. See “Compare with other funds” below for details on how to use the hypothetical data.
Compare with other funds
Since all mutual funds are required to include the same hypothetical calculations about expenses in shareholder reports, you can use this information to compare the ongoing cost of investing in the Fund with other funds. To do so, compare the hypothetical example with the 5% hypothetical examples that appear in the shareholder reports of other funds. As you compare hypothetical examples of other funds, it is important to note that hypothetical examples are meant to highlight the ongoing costs of investing in a fund only and do not reflect any transaction costs, such as sales charges, or redemption or exchange fees. Therefore, the hypothetical calculations are useful in comparing ongoing costs only, and will not help you determine the relative total costs of owning different funds. If transaction costs were included in these calculations, your costs would be higher.
| November 1, 2016 – April 30, 2017 |
| | Account value at the
beginning of the
period ($) | Account value at the
end of the
period ($) | Expenses paid during
the period ($) | Fund’s annualized
expense ratio (%) |
| | Actual | Hypothetical | Actual | Hypothetical | Actual | Hypothetical | Actual |
| Class A | 1,000.00 | 1,000.00 | 1,062.70 | 1,010.59 | 14.36 | 14.00 | 2.84 |
| Class Z | 1,000.00 | 1,000.00 | 1,034.10 (a) | 1,012.31 | 7.91 (a) | 12.29 | 2.49 (a) |
| (a) | Based on operations from January 3, 2017 (commencement of operations) through the stated period end. |
Expenses paid during the period are equal to the annualized expense ratio for each class as indicated above, multiplied by the average account value over the period and then multiplied by the number of days in the Fund’s most recent fiscal half year and divided by 365.
Expenses do not include fees and expenses incurred indirectly by the Fund from its investment in underlying funds, including affiliated and non-affiliated pooled investment vehicles, such as mutual funds and exchange-traded funds.
Had Columbia Management Investment Advisers, LLC and/or certain of its affiliates not waived/reimbursed certain fees and expenses, account value at the end of the period would have been reduced.
The Fund is available only to certain eligible investors through certain wrap fee programs sponsored and/or managed by Ameriprise Financial, Inc. or its affiliates. Participants in wrap fee programs pay other fees that are not included in the above table. Please refer to the wrap program documents for information about the fees charged.
Multi-Manager Directional Alternative Strategies Fund | Annual Report 2017
| 11 |
Portfolio of Investments
April 30, 2017
(Percentages represent value of investments compared to net assets)
| Common Stocks 73.2% |
| Issuer | Shares | Value ($) |
| Consumer Discretionary 5.9% |
| Auto Components 0.2% |
| BorgWarner, Inc. | 26,368 | 1,114,839 |
| Hella KGaA Hueck & Co. | 10,775 | 533,045 |
| Linamar Corp | 3,180 | 135,209 |
| Magna International, Inc. | 12,237 | 511,156 |
| Total | | 2,294,249 |
| Automobiles 0.2% |
| Ferrari NV | 1,901 | 142,986 |
| Fiat Chrysler Automobiles NV(a) | 164,812 | 1,865,313 |
| Total | | 2,008,299 |
| Hotels, Restaurants & Leisure 0.8% |
| Autogrill SpA | 53,243 | 605,495 |
| Darden Restaurants, Inc.(b) | 64,822 | 5,522,186 |
| Flight Centre Travel Group Ltd. | 31,328 | 736,887 |
| Genting Singapore PLC | 198,000 | 157,755 |
| Restaurant Brands International Inc | 997 | 55,961 |
| Six Flags Entertainment Corp. | 28,034 | 1,755,209 |
| Total | | 8,833,493 |
| Household Durables 0.1% |
| Electrolux AB, Class B | 20,391 | 605,701 |
| Internet & Direct Marketing Retail 0.2% |
| Priceline Group, Inc. (The)(a),(b) | 537 | 991,742 |
| Start Today Co., Ltd. | 33,400 | 712,699 |
| Vipshop Holdings Ltd., ADR(a) | 65,151 | 903,645 |
| Total | | 2,608,086 |
| Leisure Products 0.3% |
| Brunswick Corp.(b) | 39,957 | 2,267,560 |
| Hasbro, Inc.(b) | 8,856 | 877,718 |
| Total | | 3,145,278 |
| Media 2.8% |
| 21st Century Fox, Inc., Class A | 91,922 | 2,807,298 |
| CBS Corp., Class B Non Voting(b) | 37,385 | 2,488,346 |
| Comcast Corp., Class A(b) | 115,284 | 4,517,980 |
| Interpublic Group of Companies, Inc. (The)(b) | 86,076 | 2,028,811 |
| Liberty Broadband Corp. Class C(a),(b) | 8,246 | 751,705 |
| Liberty Global PLC LiLAC(a),(b) | 34,242 | 747,845 |
| Liberty Global PLC, Class C(a),(b) | 117,622 | 4,070,898 |
| Common Stocks (continued) |
| Issuer | Shares | Value ($) |
| Omnicom Group, Inc.(b) | 20,981 | 1,722,960 |
| ProSiebenSat.1 Media AG | 52,477 | 2,228,792 |
| Quebecor, Inc., Class B | 5,166 | 157,699 |
| Scripps Networks Interactive, Inc., Class A(b) | 31,085 | 2,322,671 |
| Shaw Communications Inc | 3,501 | 74,224 |
| Time Warner, Inc.(b) | 35,995 | 3,573,224 |
| WPP PLC | 77,322 | 1,655,436 |
| Total | | 29,147,889 |
| Multiline Retail 0.2% |
| Canadian Tire Corp., Ltd., Class A | 7,957 | 971,126 |
| Dollarama, Inc. | 13,509 | 1,182,613 |
| Total | | 2,153,739 |
| Specialty Retail 1.0% |
| Best Buy Co., Inc.(b) | 80,952 | 4,194,123 |
| Dick’s Sporting Goods, Inc.(b) | 36,229 | 1,831,376 |
| Home Depot, Inc. (The) | 9,793 | 1,528,687 |
| Lowe’s Companies, Inc.(b) | 21,608 | 1,834,087 |
| TJX Companies, Inc. (The) | 17,678 | 1,390,198 |
| Total | | 10,778,471 |
| Textiles, Apparel & Luxury Goods 0.1% |
| Moncler SpA | 25,997 | 641,698 |
| Total Consumer Discretionary | 62,216,903 |
| Consumer Staples 3.3% |
| Beverages 0.4% |
| Coca-Cola Bottlers Japan, Inc. | 49,600 | 1,478,943 |
| Coca-Cola European Partners PLC(b) | 60,287 | 2,328,284 |
| Total | | 3,807,227 |
| Food & Staples Retailing 1.1% |
| Alimentation Couche-Tard, Inc., Class B | 928 | 42,680 |
| CVS Health Corp.(b) | 75,215 | 6,200,725 |
| Metro, Inc. | 9,003 | 308,531 |
| Tesco PLC(a) | 896,829 | 2,128,581 |
| Wal-Mart Stores, Inc.(b) | 37,208 | 2,797,297 |
| Total | | 11,477,814 |
The accompanying Notes to Financial Statements are an integral part of this statement.
| 12 | Multi-Manager Directional Alternative Strategies Fund | Annual Report 2017 |
Portfolio of Investments (continued)
April 30, 2017
| Common Stocks (continued) |
| Issuer | Shares | Value ($) |
| Food Products 1.5% |
| Archer-Daniels-Midland Co.(b) | 40,262 | 1,841,987 |
| Bunge Ltd.(b) | 3,502 | 276,763 |
| Greencore Group PLC | 482,108 | 1,423,691 |
| Leroy Seafood Group ASA | 12,014 | 603,918 |
| Marine Harvest ASA | 347,553 | 5,780,406 |
| Nomad Foods Ltd.(a),(b) | 166,518 | 1,964,912 |
| SalMar ASA | 20,723 | 491,646 |
| Saputo, Inc. | 21,826 | 717,594 |
| Suedzucker AG | 54,607 | 1,167,956 |
| Tate & Lyle PLC | 46,365 | 454,293 |
| WH Group Ltd. | 1,302,000 | 1,161,584 |
| Total | | 15,884,750 |
| Personal Products 0.1% |
| Pola Orbis Holdings, Inc. | 37,200 | 859,053 |
| Tobacco 0.2% |
| Altria Group, Inc.(b) | 27,444 | 1,969,931 |
| Swedish Match AB | 21,122 | 696,809 |
| Total | | 2,666,740 |
| Total Consumer Staples | 34,695,584 |
| Energy 3.5% |
| Energy Equipment & Services 0.1% |
| NCS Multistage Holdings, Inc.(a) | 59,672 | 1,194,037 |
| Oil, Gas & Consumable Fuels 3.4% |
| Cimarex Energy Co. | 16,764 | 1,956,023 |
| Diamondback Energy, Inc.(a) | 36,142 | 3,608,417 |
| Enagas SA | 33,857 | 890,662 |
| EnCana Corp. | 39,001 | 417,424 |
| Energen Corp.(a),(b) | 43,551 | 2,264,216 |
| Enerplus Corp. | 168,805 | 1,218,072 |
| Galp Energia SGPS SA | 7,369 | 114,546 |
| Gulfport Energy Corp.(a) | 63,477 | 1,008,015 |
| Halcon Resources Corp.(a) | 91,118 | 610,491 |
| Jagged Peak Energy, Inc.(a) | 91,803 | 1,022,685 |
| JX Holdings, Inc. | 938,400 | 4,234,091 |
| Kosmos Energy Ltd.(a),(b) | 170,099 | 1,022,295 |
| Lukoil PJSC, ADR | 18,538 | 918,094 |
| Marathon Petroleum Corp. | 64,291 | 3,274,983 |
| Common Stocks (continued) |
| Issuer | Shares | Value ($) |
| Neste OYJ | 42,535 | 1,737,038 |
| Parsley Energy, Inc., Class A(a),(b) | 70,173 | 2,090,454 |
| Pioneer Natural Resources Co. | 7,684 | 1,329,255 |
| QEP Resources, Inc.(a),(b) | 141,063 | 1,665,954 |
| RSP Permian, Inc.(a) | 28,376 | 1,079,707 |
| Seven Generations Energy Ltd.(a) | 10,424 | 184,571 |
| Tesoro Corp. | 27,822 | 2,217,692 |
| Total SA | 33,800 | 1,736,721 |
| Tourmaline Oil Corp.(a) | 2,228 | 43,775 |
| WildHorse Resource Development Corp.(a) | 71,692 | 782,160 |
| Total | | 35,427,341 |
| Total Energy | 36,621,378 |
| Financials 11.8% |
| Banks 5.1% |
| ABN AMRO Bank NV(c) | 118,276 | 3,104,996 |
| Bank of America Corp.(b) | 215,810 | 5,037,005 |
| Bank of Montreal | 10,629 | 752,646 |
| Bank of Nova Scotia (The) | 12,367 | 687,453 |
| BB&T Corp.(b) | 31,747 | 1,370,836 |
| Canadian Imperial Bank of Commerce | 106,409 | 8,594,258 |
| Citigroup, Inc.(b) | 77,495 | 4,581,504 |
| Citizens Financial Group, Inc.(b) | 26,717 | 980,781 |
| East West Bancorp, Inc.(b) | 34,484 | 1,871,447 |
| Fifth Third Bancorp(b) | 67,487 | 1,648,707 |
| Fukuoka Financial Group, Inc. | 100,000 | 456,188 |
| Huntington Bancshares, Inc.(b) | 184,439 | 2,371,886 |
| ICICI Bank Ltd., ADR(b) | 119,599 | 1,024,963 |
| Intesa Sanpaolo SpA | 471,629 | 1,289,501 |
| JPMorgan Chase & Co.(b) | 48,025 | 4,178,175 |
| Lloyds Banking Group PLC | 1,774,148 | 1,590,130 |
| Mediobanca SpA | 6,908 | 66,407 |
| National Bank of Canada | 141,340 | 5,492,903 |
| Resona Holdings, Inc. | 128,800 | 716,024 |
| Royal Bank of Canada | 681 | 46,631 |
| Sumitomo Mitsui Trust Holdings, Inc. | 18,900 | 647,433 |
| SunTrust Banks, Inc.(b) | 25,872 | 1,469,788 |
| U.S. Bancorp(b) | 27,343 | 1,402,149 |
| Wells Fargo & Co.(b) | 68,699 | 3,698,754 |
| Total | | 53,080,565 |
The accompanying Notes to Financial Statements are an integral part of this statement.
Multi-Manager Directional Alternative Strategies Fund | Annual Report 2017
| 13 |
Portfolio of Investments (continued)
April 30, 2017
| Common Stocks (continued) |
| Issuer | Shares | Value ($) |
| Capital Markets 0.9% |
| Charles Schwab Corp. (The)(b) | 58,315 | 2,265,538 |
| Goldman Sachs Group, Inc. (The)(b) | 6,838 | 1,530,344 |
| Morgan Stanley(b) | 12,103 | 524,907 |
| Raymond James Financial, Inc.(b) | 23,353 | 1,740,266 |
| State Street Corp.(b) | 26,076 | 2,187,776 |
| TD Ameritrade Holding Corp.(b) | 42,912 | 1,642,242 |
| Total | | 9,891,073 |
| Consumer Finance 1.4% |
| Capital One Financial Corp.(b) | 28,479 | 2,289,142 |
| Discover Financial Services(b) | 58,998 | 3,692,685 |
| Navient Corp.(b) | 170,577 | 2,592,770 |
| SLM Corp.(a),(b) | 262,637 | 3,293,468 |
| Synchrony Financial(b) | 95,220 | 2,647,116 |
| Total | | 14,515,181 |
| Diversified Financial Services 0.3% |
| Berkshire Hathaway, Inc., Class B(a),(b) | 12,532 | 2,070,412 |
| First Pacific Co., Ltd. | 322,000 | 247,947 |
| Voya Financial, Inc.(b) | 15,995 | 597,893 |
| Total | | 2,916,252 |
| Insurance 2.5% |
| Aegon NV | 62,019 | 316,101 |
| Ageas | 19,723 | 807,808 |
| Alleghany Corp.(a),(b) | 2,761 | 1,686,143 |
| Allstate Corp. (The) | 30,483 | 2,477,963 |
| Aon PLC(b) | 21,908 | 2,625,455 |
| ASR Nederland NV(a) | 1,782 | 52,711 |
| Assicurazioni Generali SpA | 58,762 | 930,057 |
| Chubb Ltd. | 12,353 | 1,695,449 |
| Industrial Alliance Insurance & Financial Services, Inc. | 10,197 | 430,201 |
| Jardine Lloyd Thompson Group | 38,557 | 547,831 |
| Marsh & McLennan Companies, Inc. | 20,766 | 1,539,384 |
| MetLife, Inc.(b) | 32,948 | 1,707,036 |
| NN Group NV | 16,407 | 544,028 |
| Power Corp. of Canada | 52,800 | 1,223,445 |
| Prudential Financial, Inc.(b) | 32,038 | 3,429,027 |
| Sompo Holdings, Inc. | 39,100 | 1,477,609 |
| Swiss Re AG | 4,705 | 409,501 |
| Common Stocks (continued) |
| Issuer | Shares | Value ($) |
| Talanx AG | 14,716 | 530,437 |
| Travelers Companies, Inc. (The)(b) | 9,937 | 1,208,935 |
| Unipol Gruppo Finanziario SpA | 149,769 | 667,582 |
| Unum Group(b) | 41,893 | 1,940,903 |
| Zurich Insurance Group AG | 1,740 | 481,604 |
| Total | | 26,729,210 |
| Mortgage Real Estate Investment Trusts (REITS) 1.6% |
| AGNC Investment Corp.(b) | 466,611 | 9,831,494 |
| Annaly Capital Management Inc(b) | 601,998 | 7,109,596 |
| Total | | 16,941,090 |
| Total Financials | 124,073,371 |
| Health Care 14.1% |
| Biotechnology 2.8% |
| AbbVie, Inc.(b) | 112,605 | 7,425,174 |
| Amgen, Inc.(b) | 46,949 | 7,667,711 |
| Biogen, Inc.(a),(b) | 16,825 | 4,563,108 |
| Celgene Corp.(a),(b) | 11,151 | 1,383,282 |
| Galapagos NV(a) | 5,289 | 463,555 |
| Gilead Sciences, Inc.(b) | 105,651 | 7,242,376 |
| United Therapeutics Corp.(a),(b) | 5,635 | 708,319 |
| Total | | 29,453,525 |
| Health Care Equipment & Supplies 1.8% |
| Align Technology, Inc.(a),(b) | 15,813 | 2,128,746 |
| Baxter International, Inc.(b) | 95,204 | 5,300,959 |
| CR Bard, Inc.(b) | 3,813 | 1,172,421 |
| Danaher Corp.(b) | 24,219 | 2,018,169 |
| DiaSorin SpA | 3,367 | 252,336 |
| Getinge AB, Series CPO | 31,675 | 619,031 |
| GN Store Nord | 28,768 | 748,244 |
| IDEXX Laboratories, Inc.(a),(b) | 27,970 | 4,691,408 |
| Straumann Holding AG, Registered Shares | 1,023 | 539,774 |
| Zimmer Biomet Holdings, Inc.(b) | 9,108 | 1,089,772 |
| Total | | 18,560,860 |
| Health Care Providers & Services 4.1% |
| Aetna, Inc.(b) | 15,328 | 2,070,353 |
| Alfresa Holdings Corp. | 10,700 | 193,217 |
| Anthem, Inc.(b) | 17,492 | 3,111,652 |
| Cardinal Health, Inc.(b) | 77,782 | 5,646,195 |
The accompanying Notes to Financial Statements are an integral part of this statement.
| 14 | Multi-Manager Directional Alternative Strategies Fund | Annual Report 2017 |
Portfolio of Investments (continued)
April 30, 2017
| Common Stocks (continued) |
| Issuer | Shares | Value ($) |
| Centene Corp.(a),(b) | 28,695 | 2,134,908 |
| CIGNA Corp.(b) | 17,829 | 2,787,921 |
| DaVita, Inc.(a),(b) | 34,925 | 2,410,174 |
| Express Scripts Holding Co.(a),(b) | 93,339 | 5,725,414 |
| Humana, Inc.(b) | 7,123 | 1,581,164 |
| Laboratory Corp. of America Holdings(a),(b) | 14,746 | 2,066,652 |
| Quest Diagnostics, Inc. | 15,489 | 1,634,244 |
| Suzuken Co., Ltd. | 19,300 | 638,654 |
| UnitedHealth Group, Inc.(b) | 66,009 | 11,543,654 |
| Universal Health Services, Inc., Class B(b) | 15,642 | 1,888,928 |
| Total | | 43,433,130 |
| Life Sciences Tools & Services 0.1% |
| Waters Corp.(a) | 5,745 | 976,018 |
| Pharmaceuticals 5.3% |
| Astellas Pharma, Inc. | 16,400 | 216,268 |
| Dainippon Sumitomo Pharma Co., Ltd. | 81,700 | 1,341,772 |
| GlaxoSmithKline PLC | 251,089 | 5,040,759 |
| H Lundbeck A/S | 37,292 | 1,911,500 |
| Johnson & Johnson(b) | 108,210 | 13,360,689 |
| Mallinckrodt PLC(a),(b) | 48,800 | 2,289,696 |
| Merck & Co., Inc.(b) | 216,193 | 13,475,310 |
| Mitsubishi Tanabe Pharma Corp. | 76,200 | 1,547,841 |
| Novo Nordisk A/S, Class B | 88,024 | 3,425,179 |
| Orion Oyj, Class B | 5,414 | 310,502 |
| Pfizer, Inc.(b) | 285,243 | 9,675,442 |
| Recordati SpA | 10,783 | 399,479 |
| Roche Holding AG, Genusschein Shares | 4,356 | 1,139,564 |
| Sanofi, ADR(b) | 20,639 | 976,225 |
| STADA Arzneimittel AG | 15,697 | 1,111,931 |
| UCB SA | 1,411 | 109,988 |
| Total | | 56,332,145 |
| Total Health Care | 148,755,678 |
| Industrials 7.6% |
| Aerospace & Defense 2.5% |
| BAE Systems PLC | 127,192 | 1,032,913 |
| CAE, Inc. | 27,876 | 425,783 |
| General Dynamics Corp.(b) | 19,718 | 3,821,151 |
| Huntington Ingalls Industries, Inc.(b) | 9,329 | 1,874,103 |
| Common Stocks (continued) |
| Issuer | Shares | Value ($) |
| L-3 Communications Corp.(b) | 7,739 | 1,329,328 |
| Leonardo-Finmeccanica SpA(a) | 62,300 | 979,268 |
| Lockheed Martin Corp.(b) | 12,408 | 3,343,336 |
| Northrop Grumman Corp.(b) | 8,354 | 2,054,750 |
| Raytheon Co.(b) | 22,640 | 3,513,954 |
| Saab AB, Class B | 18,882 | 936,287 |
| Safran SA | 12,192 | 1,009,602 |
| Textron, Inc.(b) | 70,045 | 3,268,300 |
| United Technologies Corp.(b) | 21,863 | 2,601,478 |
| Total | | 26,190,253 |
| Air Freight & Logistics 0.1% |
| bpost SA | 33,798 | 809,955 |
| Airlines 0.3% |
| Air Canada(a) | 42,504 | 404,474 |
| Delta Air Lines, Inc. | 21,524 | 978,050 |
| Deutsche Lufthansa AG, Registered Shares | 43,983 | 758,905 |
| United Continental Holdings, Inc.(a) | 14,795 | 1,038,757 |
| WestJet Airlines Ltd. | 6,812 | 112,681 |
| Total | | 3,292,867 |
| Building Products 0.3% |
| Asahi Glass Co., Ltd. | 28,000 | 242,608 |
| dorma+kaba Holding AG, Class B Registered Shares | 479 | 410,399 |
| Geberit AG | 622 | 283,307 |
| Masco Corp. | 71,553 | 2,648,892 |
| Total | | 3,585,206 |
| Commercial Services & Supplies 0.3% |
| Babcock International Group PLC | 185,554 | 2,160,562 |
| ISS A/S | 12,234 | 507,402 |
| Securitas AB | 2,735 | 45,206 |
| Total | | 2,713,170 |
| Construction & Engineering 0.4% |
| Hochtief AG | 3,820 | 688,250 |
| NCC AB, Class B | 24,682 | 656,251 |
| SNC-Lavalin Group, Inc. | 1,062 | 42,712 |
| Tutor Perini Corp.(a) | 31,340 | 966,839 |
| VINCI SA | 26,420 | 2,247,663 |
| Total | | 4,601,715 |
The accompanying Notes to Financial Statements are an integral part of this statement.
Multi-Manager Directional Alternative Strategies Fund | Annual Report 2017
| 15 |
Portfolio of Investments (continued)
April 30, 2017
| Common Stocks (continued) |
| Issuer | Shares | Value ($) |
| Electrical Equipment 0.8% |
| AMETEK, Inc.(b) | 35,566 | 2,034,375 |
| Eaton Corp. PLC | 23,519 | 1,778,977 |
| EnerSys | 6,520 | 541,877 |
| Melrose Industries PLC(a) | 264,057 | 808,845 |
| OSRAM Licht AG | 6,449 | 431,961 |
| Philips Lighting NV(a) | 1,783 | 60,326 |
| Prysmian SpA | 39,780 | 1,148,740 |
| Vestas Wind Systems A/S | 13,939 | 1,200,327 |
| Total | | 8,005,428 |
| Industrial Conglomerates 1.2% |
| Carlisle Companies, Inc. | 18,144 | 1,839,620 |
| Honeywell International, Inc.(b) | 17,850 | 2,340,849 |
| Koninklijke Philips NV | 87,407 | 3,029,659 |
| NWS Holdings Ltd. | 256,000 | 480,755 |
| Rheinmetall AG | 12,992 | 1,192,321 |
| Siemens AG, Registered Shares | 25,200 | 3,612,467 |
| Total | | 12,495,671 |
| Machinery 0.8% |
| Cargotec OYJ, Class B | 7,088 | 422,722 |
| Georg Fischer AG, Registered Shares | 519 | 489,268 |
| Illinois Tool Works, Inc. | 12,385 | 1,710,245 |
| Ingersoll-Rand PLC | 13,367 | 1,186,321 |
| KION Group AG | 3,622 | 245,367 |
| Stanley Black & Decker, Inc.(b) | 18,677 | 2,542,874 |
| Sumitomo Heavy Industries Ltd. | 61,000 | 425,541 |
| WABCO Holdings, Inc.(a) | 9,869 | 1,173,128 |
| Yangzijiang Shipbuilding Holdings Ltd. | 469,200 | 385,520 |
| Total | | 8,580,986 |
| Professional Services 0.5% |
| Adecco Group AG, Registered Shares | 12,474 | 926,461 |
| Nielsen Holdings PLC(b) | 60,151 | 2,474,010 |
| Randstad Holding NV | 6,138 | 365,798 |
| Robert Half International, Inc.(b) | 26,281 | 1,210,240 |
| Wolters Kluwer NV | 15,186 | 644,977 |
| Total | | 5,621,486 |
| Common Stocks (continued) |
| Issuer | Shares | Value ($) |
| Road & Rail 0.1% |
| Canadian Pacific Railway Ltd. | 1,121 | 171,765 |
| Nippon Express Co., Ltd. | 141,000 | 774,017 |
| Total | | 945,782 |
| Trading Companies & Distributors 0.3% |
| Air Lease Corp. | 18,548 | 707,421 |
| Marubeni Corp. | 344,000 | 2,120,325 |
| Total | | 2,827,746 |
| Transportation Infrastructure —% |
| Flughafen Zuerich AG, Registered Shares | 583 | 128,436 |
| Total Industrials | 79,798,701 |
| Information Technology 16.2% |
| Communications Equipment 1.0% |
| Brocade Communications Systems, Inc.(b) | 211,584 | 2,659,611 |
| Cisco Systems, Inc.(b) | 72,818 | 2,480,909 |
| CommScope Holding Co., Inc.(a),(b) | 28,520 | 1,198,981 |
| Harris Corp.(b) | 40,848 | 4,570,483 |
| Total | | 10,909,984 |
| Electronic Equipment, Instruments & Components 1.5% |
| Arrow Electronics, Inc.(a),(b) | 50,678 | 3,572,799 |
| Avnet, Inc.(b) | 26,360 | 1,019,868 |
| CDW Corp.(b) | 35,654 | 2,106,795 |
| Flex Ltd.(a),(b) | 268,774 | 4,155,246 |
| Hitachi High-Technologies Corp. | 3,800 | 151,693 |
| Hollysys Automation Technologies Ltd.(b) | 34,342 | 550,846 |
| Jabil Circuit, Inc.(b) | 70,621 | 2,049,421 |
| TE Connectivity Ltd.(b) | 31,609 | 2,445,588 |
| Total | | 16,052,256 |
| Internet Software & Services 2.7% |
| Alibaba Group Holding Ltd., ADR(a),(b) | 21,774 | 2,514,897 |
| Alphabet, Inc., Class A(a),(b) | 7,993 | 7,389,688 |
| Baidu, Inc., ADR(a),(b) | 10,770 | 1,941,077 |
| DeNA Co., Ltd. | 156,400 | 3,352,791 |
| eBay, Inc.(a),(b) | 109,845 | 3,669,921 |
| Mixi, Inc. | 6,100 | 338,393 |
| Moneysupermarket.com Group PLC | 376,451 | 1,686,536 |
| NetEase, Inc., ADR(b) | 15,123 | 4,013,493 |
| Shopify, Inc., Class A(a) | 1,546 | 117,469 |
The accompanying Notes to Financial Statements are an integral part of this statement.
| 16 | Multi-Manager Directional Alternative Strategies Fund | Annual Report 2017 |
Portfolio of Investments (continued)
April 30, 2017
| Common Stocks (continued) |
| Issuer | Shares | Value ($) |
| VeriSign, Inc.(a) | 7,764 | 690,375 |
| Yandex NV, Class A(a),(b) | 31,788 | 866,541 |
| YY, Inc., ADR(a),(b) | 32,866 | 1,609,448 |
| Total | | 28,190,629 |
| IT Services 1.5% |
| Alliance Data Systems Corp. | 3,485 | 869,961 |
| Amdocs Ltd.(b) | 43,029 | 2,635,096 |
| Cap Gemini SA | 24,765 | 2,479,141 |
| CGI Group, Inc., Class A(a) | 1,831 | 88,368 |
| DXC Technology Co.(a),(b) | 67,235 | 5,065,485 |
| Equiniti Group PLC(c) | 92,176 | 263,545 |
| EVERTEC, Inc.(b) | 45,491 | 721,032 |
| Leidos Holdings, Inc.(b) | 50,714 | 2,670,599 |
| PayPal Holdings, Inc.(a),(b) | 18,177 | 867,406 |
| Total | | 15,660,633 |
| Semiconductors & Semiconductor Equipment 4.2% |
| Applied Materials, Inc.(b) | 144,068 | 5,850,601 |
| ASM International NV | 10,413 | 626,694 |
| Broadcom Ltd.(b) | 19,898 | 4,393,677 |
| Dialog Semiconductor PLC(a) | 31,235 | 1,461,343 |
| Infineon Technologies AG | 20,368 | 421,550 |
| Intel Corp.(b) | 42,477 | 1,535,544 |
| KLA-Tencor Corp.(b) | 54,194 | 5,322,935 |
| Marvell Technology Group Ltd. | 158,581 | 2,381,887 |
| Maxim Integrated Products, Inc.(b) | 82,020 | 3,621,183 |
| Micron Technology, Inc.(a),(b) | 45,189 | 1,250,380 |
| ON Semiconductor Corp.(a),(b) | 288,711 | 4,093,922 |
| Qorvo, Inc.(a),(b) | 24,572 | 1,671,633 |
| STMicroelectronics NV | 169,297 | 2,736,721 |
| Texas Instruments, Inc.(b) | 48,516 | 3,841,497 |
| Tokyo Electron Ltd. | 34,400 | 4,175,941 |
| Versum Materials, Inc. | 37,344 | 1,195,755 |
| Total | | 44,581,263 |
| Software 2.4% |
| Activision Blizzard, Inc.(b) | 19,938 | 1,041,760 |
| CA, Inc.(b) | 105,432 | 3,461,333 |
| Constellation Software, Inc. | 228 | 104,280 |
| Dell Technologies, Inc. - VMware, Inc., Class V(a),(b) | 17,526 | 1,176,170 |
| Common Stocks (continued) |
| Issuer | Shares | Value ($) |
| Electronic Arts, Inc.(a),(b) | 23,684 | 2,245,717 |
| Gemalto NV | 4,244 | 237,714 |
| Microsoft Corp.(b) | 67,922 | 4,649,940 |
| Open Text Corp. | 5,178 | 179,535 |
| Oracle Corp.(b) | 94,905 | 4,266,929 |
| Software AG | 30,234 | 1,330,529 |
| Temenos Group AG | 12,880 | 1,115,188 |
| VMware, Inc., Class A(a),(b) | 57,487 | 5,410,676 |
| Total | | 25,219,771 |
| Technology Hardware, Storage & Peripherals 2.9% |
| Apple, Inc.(b) | 19,461 | 2,795,573 |
| Brother Industries Ltd. | 23,100 | 475,297 |
| Hewlett Packard Enterprise Co.(b) | 228,798 | 4,262,507 |
| HP, Inc.(b) | 294,821 | 5,548,531 |
| Konica Minolta, Inc. | 17,200 | 152,265 |
| NetApp, Inc.(b) | 120,630 | 4,807,105 |
| Seagate Technology PLC(b) | 91,612 | 3,859,614 |
| Seiko Epson Corp. | 131,400 | 2,691,502 |
| Xerox Corp.(b) | 744,295 | 5,351,481 |
| Total | | 29,943,875 |
| Total Information Technology | 170,558,411 |
| Materials 5.6% |
| Chemicals 1.3% |
| Celanese Corp., Class A | 12,420 | 1,081,037 |
| Covestro AG | 28,597 | 2,229,144 |
| Evonik Industries AG | 21,426 | 715,467 |
| Ferro Corp.(a),(b) | 38,449 | 689,006 |
| FMC Corp. | 13,458 | 985,529 |
| Koninklijke DSM NV | 8,566 | 612,763 |
| LANXESS AG | 2,472 | 178,529 |
| PPG Industries, Inc.(b) | 23,801 | 2,614,302 |
| Sika AG | 159 | 1,014,724 |
| Solvay SA | 4,927 | 626,595 |
| Umicore SA | 16,779 | 982,408 |
| Valvoline, Inc. | 43,982 | 978,600 |
| Yara International ASA | 35,109 | 1,305,240 |
| Total | | 14,013,344 |
The accompanying Notes to Financial Statements are an integral part of this statement.
Multi-Manager Directional Alternative Strategies Fund | Annual Report 2017
| 17 |
Portfolio of Investments (continued)
April 30, 2017
| Common Stocks (continued) |
| Issuer | Shares | Value ($) |
| Construction Materials 0.4% |
| CRH PLC | 78,771 | 2,876,060 |
| HeidelbergCement AG | 1,554 | 143,886 |
| Wienerberger AG | 35,874 | 840,167 |
| Total | | 3,860,113 |
| Containers & Packaging 1.2% |
| Berry Global Group, Inc.(a),(b) | 58,032 | 2,901,600 |
| Billerudkorsnas AB | 39,823 | 638,441 |
| CCL Industries, Inc. | 966 | 223,623 |
| Crown Holdings, Inc.(a) | 40,095 | 2,248,928 |
| Graphic Packaging Holding Co.(b) | 161,839 | 2,197,774 |
| Huhtamaki OYJ | 5,242 | 203,166 |
| RPC Group PLC | 77,843 | 817,668 |
| Sealed Air Corp.(b) | 32,118 | 1,413,834 |
| WestRock Co.(b) | 39,666 | 2,124,511 |
| Total | | 12,769,545 |
| Metals & Mining 2.5% |
| ArcelorMittal (a) | 164,870 | 1,300,791 |
| Aurubis AG | 7,990 | 558,591 |
| Barrick Gold Corp. | 2,170 | 36,277 |
| Boliden AB | 41,224 | 1,178,453 |
| Fortescue Metals Group Ltd. | 964,873 | 3,824,423 |
| Nucor Corp.(b) | 75,520 | 4,631,642 |
| Rio Tinto Ltd. | 124,972 | 5,657,696 |
| Salzgitter AG | 18,336 | 628,663 |
| South32 Ltd. | 1,479,320 | 3,065,590 |
| SSAB AB, Class A(a) | 28,362 | 123,665 |
| Steel Dynamics, Inc. | 36,200 | 1,308,268 |
| Stornoway Diamond Corp.(a) | 1,779,394 | 1,068,901 |
| SunCoke Energy, Inc. | 96,227 | 882,401 |
| Teck Resources Ltd., Class B | 34,380 | 713,264 |
| Yamana Gold, Inc. | 441,700 | 1,187,531 |
| Total | | 26,166,156 |
| Common Stocks (continued) |
| Issuer | Shares | Value ($) |
| Paper & Forest Products 0.2% |
| Holmen AB, Class B | 11,849 | 499,522 |
| UPM-Kymmene OYJ | 18,549 | 489,578 |
| West Fraser Timber Co., Ltd. | 11,167 | 501,801 |
| Total | | 1,490,901 |
| Total Materials | 58,300,059 |
| Real Estate 1.6% |
| Equity Real Estate Investment Trusts (REITS) 0.3% |
| Colony NorthStar, Inc.(b) | 219,382 | 2,867,323 |
| RioCan Real Estate Investment Trust | 16,400 | 311,528 |
| Smart Real Estate Investment Trust | 4,600 | 109,048 |
| Total | | 3,287,899 |
| Real Estate Management & Development 1.3% |
| Hang Lung Group Ltd. | 168,000 | 700,547 |
| Kerry Properties Ltd. | 541,500 | 2,024,291 |
| New World Development Co., Ltd. | 3,161,000 | 3,930,731 |
| Wharf Holdings Ltd. (The) | 518,000 | 4,416,486 |
| Wheelock & Co., Ltd. | 251,000 | 1,955,143 |
| Total | | 13,027,198 |
| Total Real Estate | 16,315,097 |
| Telecommunication Services 2.4% |
| Diversified Telecommunication Services 0.6% |
| Frontier Communications Corp.(b) | 121,089 | 227,647 |
| Nippon Telegraph & Telephone Corp. | 27,100 | 1,161,388 |
| TDC A/S | 181,204 | 972,596 |
| Telecom Italia SpA, Savings Shares | 2,847,450 | 2,033,182 |
| Verizon Communications, Inc.(b) | 39,248 | 1,801,876 |
| Total | | 6,196,689 |
| Wireless Telecommunication Services 1.8% |
| KDDI Corp. | 300,500 | 7,967,479 |
| NTT DoCoMo, Inc. | 403,200 | 9,756,264 |
| Vodafone Group PLC | 574,284 | 1,480,558 |
| Total | | 19,204,301 |
| Total Telecommunication Services | 25,400,990 |
The accompanying Notes to Financial Statements are an integral part of this statement.
| 18 | Multi-Manager Directional Alternative Strategies Fund | Annual Report 2017 |
Portfolio of Investments (continued)
April 30, 2017
| Common Stocks (continued) |
| Issuer | Shares | Value ($) |
| Utilities 1.2% |
| Electric Utilities 0.6% |
| Enel SpA | 171,889 | 817,109 |
| Exelon Corp.(b) | 161,561 | 5,594,858 |
| Total | | 6,411,967 |
| Independent Power and Renewable Electricity Producers 0.2% |
| AES Corp. (The)(b) | 155,608 | 1,759,927 |
| Uniper SE(a) | 25,097 | 411,986 |
| Total | | 2,171,913 |
| Multi-Utilities 0.4% |
| A2A SpA | 1,001,012 | 1,488,399 |
| Atco Ltd., Class I | 19,118 | 695,645 |
| E.ON SE | 281,831 | 2,197,188 |
| Total | | 4,381,232 |
| Total Utilities | 12,965,112 |
Total Common Stocks
(Cost $709,516,877) | 769,701,284 |
|
| Limited Partnerships 0.6% |
| | |
| Energy 0.6% |
| Oil, Gas & Consumable Fuels 0.6% |
| Boardwalk Pipeline Partners LP(b) | 152,469 | 2,765,787 |
| Enterprise Products Partners LP | 43,249 | 1,181,563 |
| MPLX LP | 26,000 | 915,980 |
| Viper Energy Partners LP(b) | 80,203 | 1,359,441 |
| Total | | 6,222,771 |
| Total Energy | 6,222,771 |
Total Limited Partnerships
(Cost $5,915,292) | 6,222,771 |
| Preferred Stocks —% |
| Issuer | Coupon
Rate | Shares | Value ($) |
| Consumer Discretionary —% |
| Auto Components —% |
| Schaeffler AG | — | 9,738 | 167,759 |
| Total Consumer Discretionary | 167,759 |
Total Preferred Stocks
(Cost $156,853) | 167,759 |
| Money Market Funds 17.8% |
| | Shares | Value ($) |
| Columbia Short-Term Cash Fund, 0.869%(d),(e) | 187,098,394 | 187,098,394 |
Total Money Market Funds
(Cost $187,097,891) | 187,098,394 |
Total Investments
(Cost $902,686,913) | 963,190,208 |
|
| Investments Sold Short (32.9) |
|
| Common Stocks (32.7)% |
| Issuer | Shares | Value ($) |
| Consumer Discretionary (5.5)% |
| Auto Components (0.2)% |
| Autoliv, Inc. | (12,463) | (1,248,668) |
| Nokian Renkaat OYJ | (4,887) | (210,275) |
| Total | | (1,458,943) |
| Automobiles (0.5)% |
| Bayerische Motoren Werke AG(a) | (4,488) | (428,501) |
| Ferrari NV | (7,079) | (532,341) |
| Ferrari NV | (7,195) | (541,180) |
| Harley-Davidson, Inc. | (19,133) | (1,086,946) |
| Tesla Motors, Inc.(a) | (5,111) | (1,605,212) |
| Thor Industries, Inc. | (10,530) | (1,012,775) |
| Total | | (5,206,955) |
| Hotels, Restaurants & Leisure (1.2)% |
| Buffalo Wild Wings, Inc.(a) | (7,438) | (1,171,857) |
| Cheesecake Factory, Inc. (The) | (22,259) | (1,428,137) |
| Chipotle Mexican Grill, Inc.(a) | (2,623) | (1,244,535) |
| Cracker Barrel Old Country Store, Inc. | (6,637) | (1,063,181) |
| Dunkin’ Brands Group, Inc. | (17,706) | (989,057) |
| Marriott International, Inc., Class A | (13,244) | (1,250,498) |
| Seaworld Entertainment, Inc. | (75,042) | (1,315,486) |
| Texas Roadhouse, Inc. | (16,454) | (771,364) |
| Wynn Resorts Ltd. | (29,755) | (3,660,163) |
| Total | | (12,894,278) |
| Household Durables (0.1)% |
| Berkeley Group Holdings (The) | (22,203) | (936,913) |
The accompanying Notes to Financial Statements are an integral part of this statement.
Multi-Manager Directional Alternative Strategies Fund | Annual Report 2017
| 19 |
Portfolio of Investments (continued)
April 30, 2017
| Investments Sold Short (continued) |
|
| Common Stocks (continued) |
| Issuer | Shares | Value ($) |
| Internet & Direct Marketing Retail (0.4)% |
| Netflix, Inc.(a) | (9,302) | (1,415,764) |
| Wayfair, Inc., Class A(a) | (27,159) | (1,241,438) |
| Yoox Net-A-Porter Group SpA(a) | (36,552) | (971,513) |
| Zalando SE(a) | (7,329) | (323,211) |
| Total | | (3,951,926) |
| Leisure Products (0.3)% |
| Amer Sports Oyj | (7,851) | (174,035) |
| Mattel, Inc. | (54,263) | (1,216,576) |
| Shimano, Inc. | (12,200) | (1,867,136) |
| Total | | (3,257,747) |
| Media (1.1)% |
| Altice NV, Class A(a) | (114,322) | (2,839,927) |
| Axel Springer SE | (2,647) | (148,523) |
| Eutelsat Communications SA | (35,368) | (837,177) |
| EW Scripps Co/The(a) | (47,660) | (1,061,865) |
| Liberty Global PLC LiLAC(a) | (20,071) | (438,351) |
| Pearson PLC | (169,174) | (1,400,139) |
| ProSiebenSat.1 Media SE | (21,691) | (921,256) |
| Schibsted ASA, Class A | (32,705) | (813,244) |
| SES SA FDR | (44,012) | (962,441) |
| Telenet Group Holding NV(a) | (10,644) | (646,510) |
| Television Francaise 1 | (105,495) | (1,293,950) |
| Total | | (11,363,383) |
| Multiline Retail (0.5)% |
| Dollar General Corp | (13,980) | (1,016,486) |
| Dollarama, Inc. | (10,032) | (878,227) |
| Don Quijote Holdings Co., Ltd. | (61,700) | (2,247,973) |
| Isetan Mitsukoshi Holdings Ltd. | (45,300) | (495,002) |
| Next PLC(a) | (16,078) | (896,483) |
| Total | | (5,534,171) |
| Investments Sold Short (continued) |
|
| Common Stocks (continued) |
| Issuer | Shares | Value ($) |
| Specialty Retail (0.6)% |
| CarMax, Inc.(a) | (23,225) | (1,358,663) |
| Dufry AG, Registered Shares(a) | (1,853) | (303,557) |
| Fielmann AG | (5,594) | (427,645) |
| Hennes & Mauritz AB, Class B | (141,738) | (3,510,925) |
| Monro Muffler Brake, Inc. | (17,117) | (887,516) |
| Total | | (6,488,306) |
| Textiles, Apparel & Luxury Goods (0.6)% |
| Cie Financiere Richemont SA, Class A, Registered Shares | (8,417) | (703,390) |
| Columbia Sportswear Co. | (14,936) | (845,676) |
| Gildan Activewear Inc | (44,714) | (1,253,781) |
| Gildan Activewear, Inc.(a) | (18,173) | (509,491) |
| HUGO BOSS AG(a) | (2,394) | (182,102) |
| Luxottica Group SPA | (9,770) | (566,179) |
| Salvatore Ferragamo SpA | (22,990) | (736,515) |
| Swatch Group AG (The) | (1,849) | (740,157) |
| Under Armour, Inc., Class A(a) | (47,865) | (1,028,619) |
| Total | | (6,565,910) |
| Total Consumer Discretionary | (57,658,532) |
| Consumer Staples (1.7)% |
| Beverages (0.4)% |
| Anheuser-Busch InBev SA/NV | (27,676) | (3,117,247) |
| Boston Beer Co., Inc. (The), Class A(a) | (6,947) | (1,002,800) |
| Heineken NV | (587) | (52,336) |
| Remy Cointreau SA | (4,321) | (435,950) |
| Total | | (4,608,333) |
| Food & Staples Retailing (0.3)% |
| Caseys General Stores, Inc. | (9,472) | (1,061,527) |
| Empire Co., Ltd., Class A(a) | (24,827) | (382,486) |
| Pricesmart, Inc. | (11,137) | (968,362) |
| Whole Foods Market, Inc. | (24,898) | (905,540) |
| Total | | (3,317,915) |
The accompanying Notes to Financial Statements are an integral part of this statement.
| 20 | Multi-Manager Directional Alternative Strategies Fund | Annual Report 2017 |
Portfolio of Investments (continued)
April 30, 2017
| Investments Sold Short (continued) |
|
| Common Stocks (continued) |
| Issuer | Shares | Value ($) |
| Food Products (0.7)% |
| Aryzta AG | (17,783) | (577,456) |
| B&G Foods, Inc. | (32,265) | (1,355,130) |
| Chocoladefabriken Lindt & Spruengli AG | (344) | (1,934,352) |
| McCormick & Co., Inc. | (11,878) | (1,186,612) |
| Snyders-Lance, Inc. | (13,082) | (461,271) |
| TreeHouse Foods, Inc.(a) | (14,541) | (1,273,792) |
| Total | | (6,788,613) |
| Household Products (0.1)% |
| Colgate-Palmolive Co. | (8,454) | (609,026) |
| Personal Products (0.2)% |
| Coty, Inc., Class A | (57,586) | (1,027,910) |
| Unilever NV | (22,059) | (1,156,869) |
| Total | | (2,184,779) |
| Total Consumer Staples | (17,508,666) |
| Energy (5.0)% |
| Energy Equipment & Services (2.1)% |
| Core Laboratories NV | (41,380) | (4,585,732) |
| Halliburton Co. | (42,480) | (1,948,982) |
| National Oilwell Varco, Inc.(a) | (34,399) | (1,202,933) |
| Saipem SpA(a) | (10,208,976) | (4,399,323) |
| Schlumberger Ltd. | (39,777) | (2,887,413) |
| TechnipFMC PLC(a) | (27,053) | (815,107) |
| Tenaris SA | (265,783) | (4,163,259) |
| Transocean Ltd.(a) | (91,758) | (1,012,091) |
| Weatherford International PLC(a) | (188,187) | (1,085,839) |
| Total | | (22,100,679) |
| Oil, Gas & Consumable Fuels (2.9)% |
| AltaGas, Ltd. | (19,224) | (430,799) |
| Anadarko Petroleum Corp.(a) | (24,459) | (1,394,652) |
| Apache Corp. | (24,927) | (1,212,449) |
| Cameco Corp.(a) | (96,476) | (925,146) |
| Carrizo Oil & Gas Inc(a) | (40,119) | (1,008,993) |
| Cenovus Energy, Inc. | (33,127) | (330,287) |
| Cheniere Energy, Inc.(a) | (110,206) | (4,997,842) |
| Concho Resources, Inc.(a) | (3,885) | (492,074) |
| Continental Resources, Inc.(a) | (10,861) | (460,615) |
| Investments Sold Short (continued) |
|
| Common Stocks (continued) |
| Issuer | Shares | Value ($) |
| Enbridge, Inc.(a) | (16,045) | (665,050) |
| EP Energy Corp.(a) | (99,126) | (448,050) |
| Hess Corp. | (94,663) | (4,622,394) |
| Hollyfrontier Corp. | (55,998) | (1,575,784) |
| Imperial Oil Ltd. | (6,153) | (178,994) |
| International Petroleum Corp.(a) | (37,538) | (136,466) |
| Keyera Corp.(a) | (9,001) | (249,117) |
| Laredo Petroleum, Inc.(a) | (95,882) | (1,233,043) |
| Lundin Petroleum AB(a) | (112,614) | (2,149,981) |
| Matador Resources Co.(a) | (55,672) | (1,206,969) |
| Murphy Oil Corp. | (22,876) | (598,894) |
| Neste OYJ | (27,340) | (1,116,507) |
| PrairieSky Royalty, Ltd.(a) | (7,323) | (159,598) |
| Statoil ASA | (12,029) | (198,522) |
| Suncor Energy, Inc.(a) | (38,300) | (1,200,303) |
| Tallgrass Energy GP LP | (27,636) | (744,790) |
| Transcanada Corp. | (11,041) | (512,640) |
| Ultra Petroleum Corp.(a) | (74,915) | (839,048) |
| Whitecap Resources, Inc. | (5,677) | (40,174) |
| Whiting Petroleum Corp.(a) | (121,771) | (1,010,699) |
| Total | | (30,139,880) |
| Total Energy | (52,240,559) |
| Financials (5.0)% |
| Banks (2.6)% |
| Banco BPM SpA | (535,354) | (1,557,040) |
| Banco Comercial Portugues SA(a) | (603,721) | (134,683) |
| BancorpSouth, Inc. | (27,642) | (841,699) |
| Bankinter SA | (88,347) | (777,878) |
| BOK Financial Corp. | (9,122) | (768,893) |
| CaixaBank SA | (125,588) | (570,331) |
| Canadian Western Bank | (43,091) | (846,952) |
| Commerzbank AG(a) | (90,153) | (883,342) |
| Community Bank System, Inc. | (20,464) | (1,144,961) |
| Cullen/Frost Bankers, Inc. | (7,108) | (670,924) |
| CVB Financial Corp. | (45,079) | (971,002) |
| FinecoBank Banca Fineco SpA | (24,732) | (175,922) |
| First Financial Bankshares, Inc. | (46,401) | (1,853,720) |
The accompanying Notes to Financial Statements are an integral part of this statement.
Multi-Manager Directional Alternative Strategies Fund | Annual Report 2017
| 21 |
Portfolio of Investments (continued)
April 30, 2017
| Investments Sold Short (continued) |
|
| Common Stocks (continued) |
| Issuer | Shares | Value ($) |
| Glacier Bancorp, Inc. | (25,446) | (859,566) |
| Home Bancshares, Inc. | (26,001) | (661,725) |
| M&T Bank Corp. | (4,297) | (667,797) |
| MB Financial, Inc. | (20,671) | (878,724) |
| People’s United Financial, Inc. | (49,518) | (865,079) |
| Prosperity Bancshares, Inc. | (9,930) | (667,296) |
| Royal Bank of Scotland Group PLC(a) | (1,354,118) | (4,654,725) |
| Trustmark Corp. | (28,572) | (949,162) |
| UMB Financial Corp. | (10,864) | (787,531) |
| UniCredit SpA | (81,390) | (1,324,552) |
| United Bankshares, Inc. | (41,562) | (1,658,324) |
| Valley National Bancorp | (59,014) | (694,005) |
| Westamerica Bancorporation | (29,093) | (1,600,697) |
| Total | | (27,466,530) |
| Capital Markets (1.0)% |
| Aberdeen Asset Management PLC | (157,617) | (569,566) |
| Azimut Holding SpA | (56,564) | (1,104,143) |
| Banca Generali SpA | (24,898) | (715,733) |
| CI Financial Corp.(a) | (8,818) | (172,478) |
| Credit Suisse Group AG, Registered Shares(a) | (73,048) | (1,110,770) |
| Deutsche Bank AG | (7,202) | (129,680) |
| Eaton Vance Corp. | (36,071) | (1,548,528) |
| Factset Research Systems, Inc. | (7,277) | (1,188,043) |
| Financial Engines, Inc. | (26,867) | (1,141,848) |
| GAM Holding AG | (10,582) | (135,598) |
| Hargreaves Lansdown PLC | (55,555) | (991,537) |
| Japan Exchange Group, Inc. | (34,100) | (478,143) |
| Thomson Reuters Corp.(a) | (1,647) | (74,842) |
| WisdomTree Investments, Inc. | (67,377) | (562,598) |
| Total | | (9,923,507) |
| Consumer Finance (0.0)% |
| Acom Co., Ltd.(a) | (69,800) | (310,036) |
| Diversified Financial Services (0.3)% |
| Element Fleet Management Corp.(a) | (56,658) | (497,659) |
| Kinnevik AB(a) | (109,331) | (2,918,028) |
| Onex Corp.(a) | (1,459) | (105,269) |
| Total | | (3,520,956) |
| Investments Sold Short (continued) |
|
| Common Stocks (continued) |
| Issuer | Shares | Value ($) |
| Insurance (1.0)% |
| Cincinnati Financial Corp. | (14,356) | (1,034,924) |
| Fairfax Financial Holdings Ltd.(a) | (683) | (312,217) |
| Hiscox, Ltd. | (77,412) | (1,134,988) |
| Mercury General Corp. | (18,712) | (1,150,601) |
| RLI Corp. | (17,137) | (980,579) |
| Sampo OYJ | (983) | (47,104) |
| St. James’s Place PLC | (83,609) | (1,243,173) |
| Willis Towers Watson PLC | (38,124) | (5,056,005) |
| Total | | (10,959,591) |
| Thrifts & Mortgage Finance (0.1)% |
| New York Community Bancorp, Inc. | (54,531) | (724,717) |
| Total Financials | (52,905,337) |
| Health Care (2.5)% |
| Biotechnology (0.3)% |
| Alnylam Pharmaceuticals, Inc.(a) | (36,243) | (1,942,625) |
| Juno Therapeutics, Inc.(a) | (34,260) | (854,444) |
| TESARO Inc(a) | (4,346) | (641,426) |
| Total | | (3,438,495) |
| Health Care Equipment & Supplies (0.8)% |
| Coloplast A/S, Class B | (25,243) | (2,160,807) |
| Elekta AB, Class B | (94,905) | (990,592) |
| Getinge AB | (4,335) | (84,720) |
| IDEXX Laboratories, Inc.(a) | (5,977) | (1,002,522) |
| Intuitive Surgical, Inc.(a) | (1,771) | (1,480,326) |
| Sonova Holding AG, Registered Shares | (5,334) | (788,574) |
| West Pharmaceutical Services | (14,925) | (1,373,548) |
| Wright Medical Group NV(a) | (32,622) | (991,382) |
| Total | | (8,872,471) |
| Health Care Providers & Services (0.2)% |
| AmerisourceBergen Corp. | (11,251) | (923,145) |
| Henry Schein, Inc.(a) | (3,689) | (641,148) |
| Total | | (1,564,293) |
The accompanying Notes to Financial Statements are an integral part of this statement.
| 22 | Multi-Manager Directional Alternative Strategies Fund | Annual Report 2017 |
Portfolio of Investments (continued)
April 30, 2017
| Investments Sold Short (continued) |
|
| Common Stocks (continued) |
| Issuer | Shares | Value ($) |
| Health Care Technology (0.5)% |
| athenahealth, Inc.(a) | (8,528) | (835,829) |
| Medidata Solutions, Inc.(a) | (41,241) | (2,698,399) |
| Veeva Systems Inc., Class A(a) | (34,513) | (1,850,587) |
| Total | | (5,384,815) |
| Life Sciences Tools & Services (0.1)% |
| Illumina, Inc.(a) | (4,937) | (912,654) |
| QIAGEN NV | (4,988) | (149,147) |
| Total | | (1,061,801) |
| Pharmaceuticals (0.6)% |
| Bristol-Myers Squibb Co. | (24,581) | (1,377,765) |
| Chugai Pharmaceutical Co., Ltd. | (28,500) | (1,012,722) |
| Eli Lilly & Co. | (16,267) | (1,334,870) |
| Ono Pharmaceutical Co., Ltd. | (40,900) | (843,634) |
| Takeda Pharmaceutical Co., Ltd.(a) | (15,400) | (738,794) |
| Valeant Pharmaceuticals International, Inc.(a) | (55,279) | (512,274) |
| Total | | (5,820,059) |
| Total Health Care | (26,141,934) |
| Industrials (2.6)% |
| Aerospace & Defense (0.4)% |
| Airbus Group SE(a) | (17,469) | (1,412,521) |
| Bombardier, Inc., Class B(a) | (140,630) | (217,376) |
| MTU Aero Engines AG | (8,378) | (1,201,458) |
| Rolls-Royce Holdings PLC(a),(f) | (8,160,101) | (10,569) |
| Rolls-Royce Holdings PLC | (114,931) | (1,208,731) |
| Total | | (4,050,655) |
| Air Freight & Logistics (0.1)% |
| Panalpina Welttransport Holding AG, Registered Shares | (8,278) | (1,095,691) |
| Singapore Post, Ltd. | (297,100) | (293,169) |
| Total | | (1,388,860) |
| Airlines (0.0)% |
| International Consolidated Airlines Group SA(a) | (58,867) | (426,936) |
| Investments Sold Short (continued) |
|
| Common Stocks (continued) |
| Issuer | Shares | Value ($) |
| Building Products (0.1)% |
| ASSA ABLOY AB, Class B | (17,648) | (382,357) |
| Trex Company, Inc.(a) | (3,735) | (273,365) |
| Total | | (655,722) |
| Commercial Services & Supplies (0.4)% |
| Bilfinger SE(a) | (3,036) | (131,888) |
| Mobile Mini, Inc. | (30,672) | (880,286) |
| Multi-Color Corp(a) | (13,111) | (1,006,925) |
| Rollins, Inc. | (17,651) | (685,388) |
| Waste Connections, Inc. | (8,141) | (748,945) |
| Waste Connections, Inc.(a) | (10,259) | (944,033) |
| Total | | (4,397,465) |
| Construction & Engineering (0.0)% |
| WSP Global, Inc. | (6,228) | (226,892) |
| Electrical Equipment (0.0)% |
| Nordex SE(a) | (26,818) | (404,306) |
| Industrial Conglomerates (0.1)% |
| Keppel Corp., Ltd. | (49,500) | (230,151) |
| Sembcorp Industries, Ltd. | (198,400) | (429,876) |
| Total | | (660,027) |
| Machinery (0.9)% |
| Actuant Corp., Class A(a) | (47,666) | (1,301,282) |
| Alfa Laval AB | (2,244) | (46,034) |
| Deere & Co. | (10,634) | (1,186,861) |
| Duerr AG | (855) | (85,219) |
| Flowserve Corp. | (8,190) | (416,625) |
| GEA Group AG | (16,329) | (694,411) |
| Krones AG(a) | (1,124) | (133,457) |
| MAN SE | (3,426) | (359,908) |
| Metso OYJ | (17,551) | (629,566) |
| Middleby Corp.(a) | (9,963) | (1,356,263) |
| OC Oerlikon Corp. AG, Registered Shares | (10,546) | (126,658) |
| Sun Hydraulics Corp. | (19,666) | (763,828) |
| Toro Co. | (15,621) | (1,014,115) |
The accompanying Notes to Financial Statements are an integral part of this statement.
Multi-Manager Directional Alternative Strategies Fund | Annual Report 2017
| 23 |
Portfolio of Investments (continued)
April 30, 2017
| Investments Sold Short (continued) |
|
| Common Stocks (continued) |
| Issuer | Shares | Value ($) |
| Wabtec Corp.(a) | (8,333) | (699,055) |
| Wartsila OYJ | (10,521) | (640,643) |
| Total | | (9,453,925) |
| Marine (0.1)% |
| Kuehne + Nagel International AG, Registered Shares | (6,442) | (973,745) |
| Professional Services (0.1)% |
| Stantec, Inc.(a) | (24,053) | (617,250) |
| Road & Rail (0.3)% |
| DSV A/S(a) | (10,825) | (603,058) |
| Heartland Express, Inc.(a) | (42,636) | (857,836) |
| JB Hunt Transport Services, Inc. | (9,622) | (862,709) |
| Old Dominion Freight Line(a) | (10,096) | (893,698) |
| Total | | (3,217,301) |
| Trading Companies & Distributors (0.0)% |
| Finning International, Inc. | (3,087) | (58,707) |
| Transportation Infrastructure (0.1)% |
| Fraport AG Frankfurt Airport Services Worldwide | (11,670) | (917,816) |
| Total Industrials | (27,449,607) |
| Information Technology (5.1)% |
| Communications Equipment (0.9)% |
| Arista Networks, Inc.(a) | (13,736) | (1,918,095) |
| F5 Networks, Inc.(a) | (4,794) | (619,049) |
| Nokia OYJ | (827,927) | (4,734,769) |
| Palo Alto Networks, Inc.(a) | (8,868) | (961,380) |
| Telefonaktiebolaget LM Ericsson | (172,758) | (1,113,712) |
| Viasat, Inc.(a) | (8,944) | (572,684) |
| Total | | (9,919,689) |
| Electronic Equipment, Instruments & Components (0.8)% |
| Cognex Corp.(a) | (16,600) | (1,416,644) |
| Hexagon AB, Class B(a) | (54,012) | (2,352,007) |
| Itron, Inc.(a) | (28,281) | (1,834,023) |
| National Instruments Corp. | (85,220) | (2,975,030) |
| Total | | (8,577,704) |
| Investments Sold Short (continued) |
|
| Common Stocks (continued) |
| Issuer | Shares | Value ($) |
| Internet Software & Services (0.7)% |
| 2U, Inc.(a) | (25,922) | (1,176,859) |
| 58.Com, Inc., ADR(a) | (19,869) | (786,415) |
| Cimpress NV(a) | (17,669) | (1,450,272) |
| Costar Group, Inc.(a) | (4,348) | (1,047,390) |
| Just Eat PLC(a) | (144,110) | (1,076,977) |
| United Internet AG, Registered Shares | (30,933) | (1,423,795) |
| Total | | (6,961,708) |
| IT Services (0.5)% |
| Acxiom Corp.(a) | (30,059) | (868,705) |
| DH Corp. | (6,415) | (119,319) |
| Infosys Ltd., ADR | (66,659) | (970,555) |
| Nets A/S(a) | (4,313) | (78,450) |
| Sabre Corp. | (29,763) | (696,752) |
| Wipro, Ltd., ADR(a) | (192,861) | (1,899,681) |
| Wirecard AG(a) | (6,683) | (394,637) |
| Total | | (5,028,099) |
| Semiconductors & Semiconductor Equipment (0.4)% |
| ams AG(a) | (13,761) | (885,130) |
| Cavium, Inc.(a) | (14,024) | (965,552) |
| Infineon Technologies AG | (45,988) | (951,800) |
| United Microelectronics Corp., ADR | (574,961) | (1,115,424) |
| Total | | (3,917,906) |
| Software (1.6)% |
| ACI Worldwide, Inc.(a) | (97,863) | (2,103,076) |
| Blackbaud, Inc. | (30,412) | (2,445,429) |
| Dassault Systemes | (19,309) | (1,723,257) |
| Guidewire Software, Inc.(a) | (29,793) | (1,831,971) |
| Nintendo Co., Ltd.(a) | (4,100) | (1,037,569) |
| Proofpoint, Inc.(a) | (18,114) | (1,365,252) |
| Salesforce.com, Inc.(a) | (17,756) | (1,529,147) |
| Snap Inc(a) | (28,749) | (648,290) |
| Ultimate Software Group, Inc.(a) | (8,576) | (1,738,098) |
| Workday, Inc., Class A(a) | (23,905) | (2,089,297) |
| Total | | (16,511,386) |
The accompanying Notes to Financial Statements are an integral part of this statement.
| 24 | Multi-Manager Directional Alternative Strategies Fund | Annual Report 2017 |
Portfolio of Investments (continued)
April 30, 2017
| Investments Sold Short (continued) |
|
| Common Stocks (continued) |
| Issuer | Shares | Value ($) |
| Technology Hardware, Storage & Peripherals (0.2)% |
| Blackberry Ltd.(a) | (82,494) | (770,520) |
| Electronics for Imaging, Inc.(a) | (31,545) | (1,444,130) |
| Total | | (2,214,650) |
| Total Information Technology | (53,131,142) |
| Materials (2.1)% |
| Chemicals (1.2)% |
| Air Liquide SA(a) | (39,552) | (4,765,088) |
| Balchem Corp.(a) | (12,693) | (1,030,164) |
| Cf Industries Holdings, Inc. | (20,925) | (559,535) |
| Christian Hansen Holding A/S | (15,962) | (1,075,783) |
| HB Fuller Co. | (15,067) | (795,990) |
| Hexpol AB | (15,143) | (168,316) |
| Ingevity Corp.(a) | (14,639) | (925,624) |
| Newmarket Corp. | (2,915) | (1,372,090) |
| Novozymes A/S, Class B | (44,577) | (1,925,854) |
| Potash Corp. of Saskatchewan, Inc. | (26,596) | (448,511) |
| Symrise AG | (2,308) | (161,581) |
| Total | | (13,228,536) |
| Construction Materials (0.1)% |
| James Hardie Industries PLC | (55,296) | (935,628) |
| Containers & Packaging (0.5)% |
| AptarGroup, Inc. | (17,248) | (1,385,014) |
| Ball Corp. | (27,982) | (2,151,536) |
| Bemis Co., Inc. | (13,718) | (616,350) |
| Sonoco Products Co. | (24,777) | (1,296,085) |
| Total | | (5,448,985) |
| Metals & Mining (0.3)% |
| Agnico Eagle Mines Ltd | (1,183) | (56,548) |
| Antofagasta PLC(a) | (64,632) | (701,501) |
| Eldorado Gold Corp.(a) | (64,876) | (237,157) |
| First Quantum Minerals Ltd(a) | (4,919) | (46,882) |
| Franco-Nevada Corp. | (7,579) | (515,464) |
| Goldcorp, Inc.(a) | (16,495) | (229,834) |
| Kinross Gold Corp.(a) | (207,592) | (724,496) |
| Investments Sold Short (continued) |
|
| Common Stocks (continued) |
| Issuer | Shares | Value ($) |
| Silver Wheaton Corp. | (11,856) | (236,590) |
| Yamana Gold, Inc. | (13,708) | (36,855) |
| Total | | (2,785,327) |
| Total Materials | (22,398,476) |
| Real Estate (2.2)% |
| Equity Real Estate Investment Trusts (REITS) (1.7)% |
| Equinix, Inc. | (22,083) | (9,224,069) |
| Pebblebrook Hotel Trust | (26,478) | (787,985) |
| SBA Communications Corp.(a) | (61,573) | (7,788,369) |
| Total | | (17,800,423) |
| Real Estate Management & Development (0.5)% |
| Hulic Co., Ltd. | (179,900) | (1,696,594) |
| Mitsubishi Estate Co., Ltd. | (212,000) | (4,059,334) |
| Total | | (5,755,928) |
| Total Real Estate | (23,556,351) |
| Telecommunication Services (0.8)% |
| Diversified Telecommunication Services (0.5)% |
| Cogent Communications Group | (40,029) | (1,801,305) |
| Elisa OYJ | (6,838) | (232,919) |
| Frontier Communications Corp. | (197,091) | (370,531) |
| Koninklijke KPN NV | (16,500) | (47,719) |
| Numericable Group | (10,024) | (328,229) |
| TalkTalk Telecom Group PLC | (196,713) | (492,240) |
| Telefonica Deutschland Holdi | (150,078) | (727,486) |
| Telefonica SA, ADR | (61,084) | (678,032) |
| Total | | (4,678,461) |
| Wireless Telecommunication Services (0.3)% |
| Millicom International Cellular SA, SDR | (9,910) | (543,762) |
| Sprint Corp.(a) | (205,463) | (1,855,331) |
| Tele2 AB, Class B | (90,483) | (911,235) |
| Total | | (3,310,328) |
| Total Telecommunication Services | (7,988,789) |
| Utilities (0.2)% |
| Electric Utilities (0.0)% |
| Terna Rete Elettrica Nazionale SpA | (79,861) | (402,775) |
The accompanying Notes to Financial Statements are an integral part of this statement.
Multi-Manager Directional Alternative Strategies Fund | Annual Report 2017
| 25 |
Portfolio of Investments (continued)
April 30, 2017
| Investments Sold Short (continued) |
|
| Common Stocks (continued) |
| Issuer | Shares | Value ($) |
| Independent Power and Renewable Electricity Producers (0.1)% |
| Ormat Technologies, Inc. | (15,643) | (923,876) |
| Multi-Utilities (0.1)% |
| Canadian Utilities Ltd., Class A | (3,030) | (87,345) |
| E.ON SE | (142,336) | (1,109,668) |
| Total | | (1,197,013) |
| Total Utilities | (2,523,664) |
Total Common Stocks
(Proceeds $319,407,704) | (343,503,057) |
| Preferred Stocks (0.2)% |
| Issuer | Coupon
Rate | Shares | Value ($) |
| Consumer Discretionary (0.1)% |
| Automobiles (0.1)% |
| Volkswagen AG(a) | — | (9,522) | (1,509,690) |
| Total Consumer Discretionary | (1,509,690) |
| Preferred Stocks (continued) |
| Issuer | Coupon
Rate | Shares | Value ($) |
| Health Care (0.1)% |
| Health Care Equipment & Supplies (0.1)% |
| Sartorius AG(a) | — | (8,174) | (748,465) |
| Total Health Care | (748,465) |
Total Preferred Stocks
(Proceeds $1,982,866) | (2,258,155) |
Total Investments Sold Short
(Proceeds $321,390,570) | (345,761,212) |
| Total Investments, Net of Investments Sold Short | 617,428,996 |
| Other Assets & Liabilities, Net | | 434,461,842 |
| Net Assets | 1,051,890,838 |
At April 30, 2017, securities and/or cash totaling $745,877,906 were pledged as collateral.
Investments in derivatives
| Forward foreign currency exchange contracts open at April 30, 2017 |
| Counterparty | Exchange
date | Currency to
be delivered | Currency to
be received | Unrealized
appreciation ($) | Unrealized
depreciation ($) |
| Citi | 6/21/2017 | 38,000 AUD | 29,142 USD | 714 | — |
| Citi | 6/21/2017 | 418,000 CAD | 313,033 USD | 6,580 | — |
| Citi | 6/21/2017 | 187,000 CHF | 188,801 USD | 255 | — |
| Citi | 6/21/2017 | 83,000 CHF | 83,243 USD | — | (443) |
| Citi | 6/21/2017 | 168,000 DKK | 24,198 USD | — | (471) |
| Citi | 6/21/2017 | 174,000 EUR | 187,864 USD | — | (2,170) |
| Citi | 6/21/2017 | 219,000 GBP | 273,158 USD | — | (10,911) |
| Citi | 6/21/2017 | 69,000 ILS | 18,936 USD | — | (147) |
| Citi | 6/21/2017 | 65,225,000 JPY | 590,720 USD | 4,416 | — |
| Citi | 6/21/2017 | 1,564,000 NOK | 183,903 USD | 1,636 | — |
| Citi | 6/21/2017 | 13,000 NZD | 9,050 USD | 136 | — |
| Citi | 6/21/2017 | 1,476,000 SEK | 167,865 USD | 772 | — |
| Citi | 6/21/2017 | 114,000 SEK | 12,735 USD | — | (171) |
| Citi | 6/21/2017 | 7,000 SGD | 4,935 USD | — | (78) |
| Citi | 6/21/2017 | 4,636,036 USD | 6,049,000 AUD | — | (110,658) |
| Citi | 6/21/2017 | 5,866,550 USD | 7,800,000 CAD | — | (148,061) |
| Citi | 6/21/2017 | 5,443,540 USD | 5,462,000 CHF | 63,641 | — |
| Citi | 6/21/2017 | 1,249,200 USD | 8,727,000 DKK | 32,310 | — |
| Citi | 6/21/2017 | 14,644,460 USD | 13,755,000 EUR | 378,019 | — |
| Citi | 6/21/2017 | 10,937,675 USD | 8,762,000 GBP | 427,658 | — |
| Citi | 6/21/2017 | 2,106,686 USD | 16,332,000 HKD | — | (4,729) |
| Citi | 6/21/2017 | 413,094 USD | 1,522,000 ILS | 7,835 | — |
The accompanying Notes to Financial Statements are an integral part of this statement.
| 26 | Multi-Manager Directional Alternative Strategies Fund | Annual Report 2017 |
Portfolio of Investments (continued)
April 30, 2017
Investments in derivatives (continued)
| Forward foreign currency exchange contracts open at April 30, 2017 (continued) |
| Counterparty | Exchange
date | Currency to
be delivered | Currency to
be received | Unrealized
appreciation ($) | Unrealized
depreciation ($) |
| Citi | 6/21/2017 | 14,534,305 USD | 1,634,100,000 JPY | 154,533 | — |
| Citi | 6/21/2017 | 4,532 USD | 39,000 NOK | 13 | — |
| Citi | 6/21/2017 | 295,820 USD | 2,474,000 NOK | — | (7,501) |
| Citi | 6/21/2017 | 110,613 USD | 156,000 NZD | — | (3,642) |
| Citi | 6/21/2017 | 2,337,369 USD | 20,896,000 SEK | 28,188 | — |
| Citi | 6/21/2017 | 8,069 USD | 71,000 SEK | — | (32) |
| Citi | 6/21/2017 | 950,269 USD | 1,338,000 SGD | 7,907 | — |
| Total | | | | 1,114,613 | (289,014) |
Futures contracts outstanding at April 30, 2017
| Long futures contracts outstanding |
| Contract description | Number of
contracts | Trading
currency | Notional market
value ($) | Expiration date | Unrealized
appreciation ($) | Unrealized
depreciation ($) |
| Amsterdam IDX | 36 | EUR | 4,052,064 | 05/2017 | 87,128 | — |
| CAC40 Index | 115 | EUR | 6,532,803 | 05/2017 | 299,470 | — |
| DAX Index | 18 | EUR | 6,111,380 | 06/2017 | 208,211 | — |
| FTSE 100 Index | 120 | GBP | 11,136,123 | 06/2017 | — | (137,228) |
| FTSE/MIB Index(1) | 13 | EUR | 1,436,269 | 06/2017 | 81,269 | — |
| Hang Seng Index | 14 | HKD | 2,210,327 | 05/2017 | 30,301 | — |
| IBEX 35 Index | 19 | EUR | 2,220,341 | 05/2017 | 98,723 | — |
| MSCI Singapore IX ETS | 34 | SGD | 845,772 | 05/2017 | 14,967 | — |
| OMXS30 Index | 104 | SEK | 1,899,811 | 05/2017 | 78,957 | — |
| S&P 500 E-mini | 848 | USD | 100,933,200 | 06/2017 | 659,149 | — |
| S&P/TSX 60 Index | 38 | CAD | 5,104,341 | 06/2017 | 33,866 | — |
| SPI 200 Index | 46 | AUD | 5,091,803 | 06/2017 | 137,783 | — |
| TOPIX Index | 104 | JPY | 14,274,053 | 06/2017 | — | (30,559) |
| Total | | | 161,848,287 | | 1,729,824 | (167,787) |
| (1) | Represents fair value as determined in good faith under procedures approved by the Board of Trustees. At April 30, 2017, the value of these futures amounted to $81,269, which represents less than 0.01% of net assets. |
| Total return swap contracts outstanding at April 30, 2017 |
| Counterparty | Fund receives | Fund pays | Expiration
date | Notional
currency | Notional
amount | Premium
paid
($) | Premium
received
($) | Unrealized
appreciation
($) | Unrealized
depreciation
($) |
| Macquarie | Floating rate based on 1-month USD LIBOR minus 0.500% | Total return on China Resources Beer Holdings Co., Ltd. | 10/17/2017 | HKD | 11,628,000 | — | — | 23,308 | — |
| Macquarie | Floating rate based on 1-month HKD HIBOR minus 0.500% | Total return on Hang Seng Bank Ltd. | 10/17/2017 | HKD | 1,834,731 | — | — | — | (5,145) |
| Macquarie | Floating rate based on 1-month HKD HIBOR minus 0.500% | Total return on Hang Seng Bank Ltd. | 10/17/2017 | HKD | 4,500,800 | — | — | — | (8,724) |
| Macquarie | Floating rate based on 1-month HKD HIBOR minus 1.000% | Total return on Bank of East Asia Ltd. (The) | 10/17/2017 | HKD | 7,789,310 | — | — | — | (39,215) |
| Macquarie | Floating rate based on 1-month HKD HIBOR minus 1.500% | Total return on Semiconductor Manufacturing International Corp. | 10/17/2017 | HKD | 14,076,774 | — | — | — | (146,331) |
The accompanying Notes to Financial Statements are an integral part of this statement.
Multi-Manager Directional Alternative Strategies Fund | Annual Report 2017
| 27 |
Portfolio of Investments (continued)
April 30, 2017
| Total return swap contracts outstanding at April 30, 2017 (continued) |
| Counterparty | Fund receives | Fund pays | Expiration
date | Notional
currency | Notional
amount | Premium
paid
($) | Premium
received
($) | Unrealized
appreciation
($) | Unrealized
depreciation
($) |
| Macquarie | Total return on Samsung Electronics Co., Ltd. | Floating rate based on 1-month USD LIBOR plus 0.800% | 10/20/2017 | USD | 4,544,114 | — | — | 419,238 | — |
| Macquarie | Floating rate based on 1-month USD LIBOR minus 0.750% | Total return on Innolux Corp. | 10/20/2017 | USD | 1,069,189 | — | — | 32,555 | — |
| Macquarie | Floating rate based on 1-month USD LIBOR minus 7.000% | Total return on AU Optronics Corp. | 10/20/2017 | USD | 1,334,225 | — | — | — | (28,448) |
| Macquarie | Floating rate based on 1-month USD LIBOR minus 0.500% | Total return on Hyundai Motor Co. | 4/13/2018 | USD | 1,552,173 | — | — | — | (38,102) |
| Total | | | | | | — | — | 475,101 | (265,965) |
| Total return swap contracts on futures at April 30, 2017 |
| Counterparty | Reference instrument | Expiration
date | Trading
currency | Notional
amount ($) | Unrealized
appreciation
($) | Unrealized
depreciation
($) |
| Morgan Stanley International | MSCI Singapore Index ETS May 2017 | 05/2017 | SGD | 74,627 | 879 | — |
| Morgan Stanley International | Swiss Market Index Jun 2017 | 06/2017 | CHF | 5,890,613 | 197,329 | — |
| Total | | | | | 198,208 | — |
Total return basket swap contracts outstanding at April 30, 2017
| Counterparty | Description | Termination
date | Net unrealized
appreciation
(depreciation) ($) |
| JPMorgan | The Fund receives the total return on a portfolio of long and short positions and pays the AUD BBSW 1-month, HKD HIBOR 1-month, or JPY LIBOR 1-month based on the local currencies of the positions within the swap. | 1/14/2021 | 543,047 |
Additional information — Total return basket swaps
The following table represents the individual long and short positions and related values within the total return basket swap as of April 30, 2017:
| Long Positions |
| Description | Shares | Notional (1) | Net unrealized
appreciation
(depreciation) |
| Common Stocks |
| Australia |
| Adelaide Brighton Ltd. | 74,776 | 331,518 | 16,097 |
| AGL Energy Ltd. | 67,262 | 1,346,642 | (55,202) |
| Ansell Ltd. | 3,083 | 54,880 | (75) |
| Aristocrat Leisure Ltd. | 63,661 | 935,542 | 20,694 |
| Aurizon Holdings Ltd. | 42,576 | 164,179 | (2,838) |
| Bendigo & Adelaide Bank Ltd. | 10,452 | 96,187 | 3,427 |
| Boral Ltd. | 9,824 | 45,284 | 1,765 |
| Long Positions |
| Description | Shares | Notional (1) | Net unrealized
appreciation
(depreciation) |
| Caltex Australia Ltd. | 4,567 | 101,941 | 1,131 |
| Coca-Cola Amatil Ltd. | 59,021 | 413,644 | (67,327) |
| Cochlear Ltd. | 841 | 88,036 | 429 |
| Fortescue Metals Group Ltd. | 118,435 | 469,435 | 13,723 |
| Harvey Norman Holdings Ltd. | 52,988 | 166,204 | (5,236) |
| Leighton Holdings Ltd. | 17,730 | 491,349 | 7,769 |
| LendLease Group | 26,058 | 312,844 | (757) |
| Newcrest Mining Ltd. | 30,557 | 490,236 | (63,691) |
| Orica Ltd. | 7,101 | 98,381 | 2,133 |
The accompanying Notes to Financial Statements are an integral part of this statement.
| 28 | Multi-Manager Directional Alternative Strategies Fund | Annual Report 2017 |
Portfolio of Investments (continued)
April 30, 2017
| Long Positions |
| Description | Shares | Notional (1) | Net unrealized
appreciation
(depreciation) |
| Origin Energy Ltd. | 27,301 | 146,914 | (5,808) |
| Santos Ltd. | 66,782 | 173,373 | (12,408) |
| South32 Ltd. | 282,545 | 585,517 | (10,399) |
| Suncorp Group Ltd. | 51,563 | 531,545 | 9,226 |
| Treasury Wine Estates Ltd. | 21,918 | 196,788 | (3,365) |
| Woodside Petroleum Ltd. | 3,575 | 86,056 | (3,155) |
| Total Australia | | | (153,867) |
| China |
| WH Group Ltd. | 452,000 | 403,253 | 2,628 |
| Hong Kong |
| Cheung Kong Property Holding Ltd. | 73,000 | 522,623 | 11,292 |
| CLP Holdings Ltd. | 28,500 | 300,567 | 6,348 |
| Henderson Land Development Co., Ltd. | 8,000 | 50,644 | (298) |
| Kerry Properties Ltd. | 143,000 | 534,577 | (11,775) |
| New World Development Co., Ltd. | 517,000 | 642,894 | (6,885) |
| Sino Land Co., Ltd. | 196,000 | 331,682 | 1,886 |
| SJM Holdings Ltd. | 80,000 | 77,555 | 3,458 |
| Sun Hung Kai Properties Ltd. | 35,000 | 524,475 | (7,714) |
| Wharf Holdings Ltd. (The) | 35,000 | 298,411 | 2,826 |
| Wheelock & Co., Ltd. | 76,000 | 591,995 | (2,919) |
| Xinyi Glass Holdings Ltd. | 626,000 | 554,719 | 3,897 |
| Yue Yuen Industrial Holdings Ltd. | 104,500 | 413,118 | (17,731) |
| Total Hong Kong | | | (17,615) |
| Japan |
| Advantest Corp. | 13,900 | 259,742 | 17,897 |
| Aisin Seiki Co., Ltd. | 5,900 | 288,965 | 18,867 |
| Alfresa Holdings Corp. | 32,000 | 577,845 | 3,966 |
| Amada Holdings Co., Ltd. | 89,900 | 1,068,851 | 39,338 |
| Aozora Bank Ltd. | 334,000 | 1,217,000 | 33,130 |
| Asahi Glass Co., Ltd. | 5,000 | 43,323 | 2,770 |
| Asahi Group Holdings Ltd. | 3,400 | 128,465 | (8,187) |
| Asahi Kasei Corp. | 95,000 | 905,882 | 14,574 |
| Astellas Pharma, Inc. | 76,900 | 1,014,089 | (61,894) |
| Bandai Namco Holdings, Inc. | 46,800 | 1,468,893 | 44,892 |
| Brother Industries Ltd. | 7,100 | 146,087 | 4,421 |
| Century Tokyo Leasing Corp. | 10,900 | 375,703 | 4,849 |
| Chubu Electric Power Co., Inc. | 68,700 | 922,431 | (2,712) |
| Long Positions |
| Description | Shares | Notional (1) | Net unrealized
appreciation
(depreciation) |
| Citizen Watch Co., Ltd. | 116,400 | 772,253 | 44,540 |
| Cosmos Pharmaceutical Corp. | 600 | 121,402 | (2,225) |
| Daicel Corp. | 5,100 | 58,546 | 659 |
| Daiichi Sankyo Co., Ltd. | 19,000 | 422,253 | (213) |
| Dainippon Sumitomo Pharma Co., Ltd. | 70,000 | 1,149,621 | (124) |
| DeNA Co., Ltd. | 6,600 | 141,486 | 1,703 |
| Disco Corp. | 1,500 | 237,267 | 14,594 |
| Ezaki Glico Co., Ltd. | 2,800 | 147,554 | (120) |
| Fuji Electric Co., Ltd. | 51,000 | 279,545 | (248) |
| FUJIFILM Holdings Corp. | 16,600 | 616,103 | (20,163) |
| Fujitsu Ltd. | 242,000 | 1,510,642 | 49,783 |
| Fukuoka Financial Group, Inc. | 41,000 | 187,037 | 10,116 |
| GungHo Online Entertainment, Inc. | 35,600 | 79,871 | (1,961) |
| Gunma Bank Ltd. (The) | 152,600 | 818,573 | 30,634 |
| Hakuhodo DY Holdings, Inc. | 44,400 | 541,198 | 2,855 |
| Hankyu Hanshin Holdings, Inc. | 1,500 | 49,550 | (932) |
| Haseko Corp. | 54,000 | 616,395 | 37,833 |
| Hikari Tsushin, Inc. | 2,200 | 211,294 | (385) |
| Hirose Electric Co., Ltd. | 1,200 | 161,281 | 624 |
| Hitachi Chemical Co., Ltd. | 61,000 | 1,746,987 | 87,211 |
| Hitachi Construction Machine Co., Ltd. | 1,800 | 46,404 | 3,816 |
| Hitachi High-Technologies Corp. | 36,400 | 1,453,057 | 50,152 |
| Hitachi Metals Ltd. | 11,300 | 158,249 | 9,464 |
| Ibiden Co., Ltd. | 9,000 | 158,423 | 25,068 |
| Idemitsu Kosan Co., Ltd. | 31,900 | 1,019,905 | (27,202) |
| Inpex Corp. | 100,000 | 958,243 | (17,153) |
| Ito En Ltd. | 9,300 | 337,227 | (9,631) |
| ITOCHU Corp. | 46,800 | 662,219 | 15,378 |
| ITOCHU Techno-Solutions Corp. | 34,500 | 1,004,466 | (7,806) |
| Japan Airlines Co., Ltd. | 18,700 | 590,572 | 4,683 |
| JTEKT Corp. | 9,100 | 143,543 | 4,847 |
| JX Holdings, Inc. | 212,600 | 959,258 | (19,777) |
| Kajima Corp. | 105,000 | 712,973 | 9,618 |
| Kamigumi Co., Ltd. | 48,000 | 436,185 | 1,129 |
| Kaneka Corp. | 44,000 | 346,933 | 12,232 |
| Kewpie Corp. | 5,300 | 134,859 | (2,656) |
| Keyence Corp. | 300 | 120,604 | 250 |
| Kobayashi Pharmaceutical Co., Ltd. | 2,700 | 141,638 | 3,221 |
The accompanying Notes to Financial Statements are an integral part of this statement.
Multi-Manager Directional Alternative Strategies Fund | Annual Report 2017
| 29 |
Portfolio of Investments (continued)
April 30, 2017
| Long Positions |
| Description | Shares | Notional (1) | Net unrealized
appreciation
(depreciation) |
| Konami Holdings Corp. | 16,000 | 666,037 | (7,422) |
| Konica Minolta, Inc. | 35,600 | 315,154 | 9,556 |
| Kuraray Co., Ltd. | 46,400 | 748,855 | 37,807 |
| Kurita Water Industries Ltd. | 3,600 | 92,962 | 1,514 |
| Kyushu Financial Group, Inc. | 55,100 | 343,555 | 6,213 |
| Lion Corp. | 40,000 | 722,801 | (12,251) |
| Makita Corp. | 4,000 | 142,719 | 1,093 |
| Marubeni Corp. | 30,600 | 188,610 | 3,862 |
| Maruichi Steel Tube Ltd. | 15,400 | 436,701 | (4,901) |
| Matsumotokiyoshi Holdings Co., Ltd. | 15,700 | 787,401 | (20,363) |
| Mazda Motor Corp. | 7,800 | 115,224 | 10,006 |
| Mebuki Financial Group, Inc. | 28,500 | 111,829 | 2,775 |
| Medipal Holdings Corp. | 15,200 | 251,833 | 1,385 |
| Miraca Holdings, Inc. | 10,300 | 474,893 | (4,707) |
| Mitsubishi Corp. | 41,900 | 904,206 | 3,079 |
| Mitsubishi Electric Corp. | 47,200 | 658,743 | 16,818 |
| Mitsubishi Gas Chemical Co., Inc. | 63,500 | 1,357,831 | 80,655 |
| Mitsubishi Tanabe Pharma Corp. | 41,900 | 851,109 | (38,235) |
| Mitsubishi UFJ Lease & Finance Co., Ltd. | 125,900 | 657,937 | 13,665 |
| Mitsui & Co., Ltd. | 8,200 | 115,789 | 34 |
| Mitsui Chemicals, Inc. | 311,000 | 1,591,293 | 79,513 |
| Mixi, Inc. | 8,400 | 465,983 | 36,128 |
| Mizuho Financial Group, Inc. | 502,400 | 918,352 | 42,840 |
| MS&AD Insurance Group Holdings, Inc. | 37,400 | 1,219,392 | 17,268 |
| Nexon Co., Ltd. | 4,900 | 83,395 | 6,101 |
| NGK Insulators Ltd. | 2,000 | 42,792 | (613) |
| NH Foods Ltd. | 24,000 | 684,071 | 12,025 |
| NHK Spring Co., Ltd. | 20,100 | 224,535 | 9,737 |
| Nippon Express Co., Ltd. | 195,000 | 1,070,449 | 42,004 |
| Nippon Shinyaku Co., Ltd. | 9,300 | 494,563 | 21,947 |
| Nippon Shokubai Co., Ltd. | 4,800 | 322,439 | 9,977 |
| Nippon Telegraph & Telephone Corp. | 22,000 | 942,824 | (22,738) |
| Nitori Co., Ltd. | 3,200 | 416,360 | (19,434) |
| Nitto Denko Corp. | 1,600 | 120,481 | 1,073 |
| Obayashi Corp. | 41,700 | 404,861 | 11,526 |
| Oji Holdings Corp. | 15,000 | 72,600 | 2,479 |
| Omron Corp. | 1,700 | 71,174 | (1,948) |
| Oracle Corp. Japan | 5,500 | 316,880 | (7,679) |
| Long Positions |
| Description | Shares | Notional (1) | Net unrealized
appreciation
(depreciation) |
| ORIX Corp. | 2,800 | 42,792 | (465) |
| Osaka Gas Co., Ltd. | 61,000 | 228,337 | (9,296) |
| Otsuka Corp. | 1,600 | 85,704 | (3,107) |
| Pola Orbis Holdings, Inc. | 3,100 | 71,588 | (1,277) |
| Resona Holdings, Inc. | 325,600 | 1,810,073 | 131,182 |
| Rohm Co., Ltd. | 3,700 | 259,843 | 20,352 |
| Sankyo Co., Ltd. | 13,600 | 474,305 | 7,199 |
| Sega Sammy Holdings, Inc. | 45,200 | 606,877 | 4,238 |
| Seiko Epson Corp. | 36,400 | 745,591 | 10,241 |
| Sekisui Chemical Co., Ltd. | 34,600 | 580,714 | 17,951 |
| Shimamura Co., Ltd. | 8,600 | 1,177,011 | (28,281) |
| Shimizu Corp. | 29,000 | 278,108 | 6,705 |
| Shin-Etsu Chemical Co., Ltd. | 4,700 | 408,513 | 8,045 |
| Shinsei Bank Ltd. | 350,000 | 653,469 | 44,989 |
| Shionogi & Co., Ltd. | 16,200 | 834,265 | (1,464) |
| Sojitz Corp. | 417,800 | 1,062,167 | 41,310 |
| Sompo Holdings, Inc. | 11,300 | 427,033 | 18,097 |
| Sotetsu Holdings, Inc. | 4,000 | 18,598 | (654) |
| Square Enix Holdings Co., Ltd. | 47,800 | 1,376,269 | (3,376) |
| Start Today Co., Ltd. | 21,500 | 458,773 | (7,286) |
| Subaru Corp. | 24,100 | 913,682 | 46,388 |
| Sumitomo Chemical Co., Ltd. | 10,000 | 56,435 | 2,680 |
| Sumitomo Corp. | 18,500 | 247,222 | 4,660 |
| Sumitomo Electric Industries Ltd. | 16,400 | 267,844 | 10,516 |
| Sumitomo Heavy Industries Ltd. | 171,000 | 1,192,910 | 51,385 |
| Sumitomo Mitsui Financial Group, Inc. | 21,400 | 794,596 | 41,635 |
| Sumitomo Mitsui Trust Holdings, Inc. | 24,200 | 828,989 | 11,649 |
| Sumitomo Rubber Industries Ltd. | 22,700 | 408,570 | 25,126 |
| Suzuken Co., Ltd. | 5,800 | 191,927 | (863) |
| Suzuki Motor Corp. | 3,200 | 133,770 | 3,474 |
| Taiheiyo Cement Corp. | 14,000 | 46,524 | 570 |
| Taisei Corp. | 96,000 | 732,038 | 12,403 |
| Taisho Pharmaceutical Holdings Co., Ltd. | 2,700 | 222,158 | 343 |
| Teijin Ltd. | 35,900 | 695,576 | 21,303 |
| THK Co., Ltd. | 15,300 | 394,634 | 14,585 |
| Tokio Marine Holdings, Inc. | 8,400 | 354,174 | 5,023 |
| Tokyo Broadcasting System Holdings, Inc. | 13,600 | 241,409 | 646 |
The accompanying Notes to Financial Statements are an integral part of this statement.
| 30 | Multi-Manager Directional Alternative Strategies Fund | Annual Report 2017 |
Portfolio of Investments (continued)
April 30, 2017
| Long Positions |
| Description | Shares | Notional (1) | Net unrealized
appreciation
(depreciation) |
| Tokyo Electron Ltd. | 3,500 | 424,878 | 52,949 |
| Tokyo Gas Co., Ltd. | 9,000 | 41,786 | (361) |
| Toppan Printing Co., Ltd. | 56,000 | 563,741 | (106) |
| Tosoh Corp. | 168,000 | 1,578,965 | 110,485 |
| Toyo Seikan Group Holdings Ltd. | 15,900 | 266,658 | 4,529 |
| Toyo Suisan Kaisha Ltd. | 19,600 | 736,132 | (27,411) |
| Toyoda Gosei Co., Ltd. | 33,800 | 898,275 | 83,311 |
| Toyota Boshoku Corp. | 40,900 | 865,432 | (14,140) |
| Toyota Tsusho Corp. | 22,000 | 694,606 | 45,488 |
| Yamazaki Baking Co., Ltd | 10,200 | 215,289 | (2,245) |
| Yokogawa Electric Corp. | 39,200 | 605,848 | 6,941 |
| Yokohama Rubber Co., Ltd. (The) | 7,900 | 155,121 | 6,743 |
| Total Japan | | | 1,535,323 |
| Common Stocks Long Positions Total | 1,366,469 |
| |
| Short Positions |
| | | |
| Common Stocks |
| Australia |
| Alumina Ltd. | (252,916) | (347,195) | (17,389) |
| AMP Ltd. | (234,172) | (938,251) | (10,654) |
| APA Group | (136,408) | (935,498) | 4,934 |
| Bank of Queensland Ltd. | (4,671) | (41,792) | 1,251 |
| Brambles Ltd | (49,241) | (381,031) | (23,684) |
| Challenger Ltd. | (4,442) | (43,873) | (757) |
| Domino’s Pizza Enterprises Ltd. | (9,536) | (436,081) | 5,670 |
| Healthscope Ltd. | (302,649) | (499,837) | (7,944) |
| Iluka Resources Ltd. | (110,872) | (696,724) | (74,827) |
| Incitec Pivot Ltd. | (21,508) | (60,935) | (2,078) |
| Magellan Financial Group Ltd. | (23,764) | (418,881) | 2,743 |
| Platinum Asset Management Ltd. | (123,442) | (430,050) | 27,199 |
| REA Group Ltd. | (12,519) | (574,928) | (6,536) |
| SEEK Ltd. | (52,775) | (672,257) | (5,208) |
| Sydney Airport | (30,677) | (158,443) | 1,802 |
| TPG Telecom Ltd. | (81,620) | (360,119) | (20,787) |
| Transurban Group | (31,051) | (283,679) | 110 |
| Vocus Communications Ltd. | (153,960) | (388,126) | (26,671) |
| Total Australia | | | (152,826) |
| Short Positions |
| Description | Shares | Notional (1) | Net unrealized
appreciation
(depreciation) |
| Bermuda |
| Haitong International Securities Group Ltd. | (554,000) | (300,041) | 7,834 |
| Hong Kong |
| AIA Group Ltd. | (72,400) | (501,112) | (42,881) |
| Bank of East Asia Ltd. (The) | (13,926) | (57,588) | (2,142) |
| Cathay Pacific Airways Ltd. | (667,000) | (959,960) | (24,833) |
| Guotai Junan International Holdings Ltd | (478,000) | (149,728) | (3,996) |
| Hang Seng Bank Ltd. | (13,800) | (279,532) | (4,013) |
| Hong Kong & China Gas Co., Ltd. | (344,000) | (687,271) | (6,665) |
| MTR Corp., Ltd. | (75,000) | (431,488) | (3,595) |
| Samsonite International SA | (102,600) | (395,909) | (19,089) |
| Sands China Ltd. | (40,800) | (184,789) | 6,784 |
| Swire Pacific Ltd., Class A | (4,500) | (43,393) | (34) |
| Swire Properties Ltd. | (59,200) | (198,471) | (3,512) |
| Techtronic Industries Co., Ltd. | (11,000) | (47,194) | (1,841) |
| Value Partners Group Ltd. | (711,000) | (657,000) | (6,695) |
| Wynn Macau Ltd. | (153,600) | (336,699) | 5,532 |
| Total Hong Kong | | | (106,980) |
| Japan |
| Acom Co., Ltd. | (323,600) | (1,437,360) | (149,631) |
| Aeon Co., Ltd. | (95,800) | (1,419,842) | (353) |
| AEON Financial Service Co., Ltd. | (38,300) | (736,043) | 37,691 |
| Air Water, Inc. | (20,000) | (385,219) | (14,742) |
| Alps Electric Co., Ltd. | (54,000) | (1,587,207) | (151,256) |
| Asahi Intecc Co Ltd | (1,700) | (75,576) | 133 |
| Asics Corp. | (66,100) | (1,169,878) | (53,330) |
| Bank of Kyoto Ltd. (The) | (185,000) | (1,465,134) | (59,574) |
| Benesse Holdings, Inc. | (4,800) | (144,851) | 7,397 |
| Calbee, Inc. | (77,700) | (2,716,506) | 36,795 |
| Canon, Inc. | (9,300) | (308,648) | (18,900) |
| Casio Computer Co., Ltd. | (61,800) | (870,978) | (21,698) |
| Chiba Bank Ltd. (The) | (8,000) | (53,592) | (2,548) |
| Chiyoda Corp. | (18,000) | (119,674) | 527 |
| Chugai Pharmaceutical Co., Ltd. | (31,900) | (1,133,538) | (9,957) |
| Chugoku Electric Power Co., Inc. (The) | (143,400) | (1,563,264) | 59,256 |
| Concordia Financial Group Ltd. | (101,700) | (467,800) | 1,152 |
The accompanying Notes to Financial Statements are an integral part of this statement.
Multi-Manager Directional Alternative Strategies Fund | Annual Report 2017
| 31 |
Portfolio of Investments (continued)
April 30, 2017
| Short Positions |
| Description | Shares | Notional (1) | Net unrealized
appreciation
(depreciation) |
| Daiwa Securities Group, Inc. | (16,000) | (97,334) | (984) |
| Don Quijote Holdings Co., Ltd. | (39,700) | (1,446,427) | (528) |
| Eisai Co., Ltd. | (3,600) | (189,287) | (2,042) |
| Electric Power Development Co., Ltd. | (57,500) | (1,333,899) | 8,918 |
| FamilyMart UNY Holdings Co., Ltd. | (12,000) | (678,323) | 23,230 |
| Fast Retailing Co., Ltd. | (1,900) | (620,574) | (6,191) |
| Hamamatsu Photonics KK | (34,100) | (1,002,746) | (35,917) |
| Hiroshima Bank Ltd. (The) | (20,000) | (86,338) | (2,432) |
| Hitachi Capital Corp. | (6,800) | (166,502) | (789) |
| Hokuriku Electric Power Co. | (104,900) | (969,555) | 14,801 |
| Honda Motor Co., Ltd. | (12,300) | (358,000) | (6,539) |
| Hoshizaki Electric Co., Ltd. | (500) | (41,716) | (1,331) |
| Isetan Mitsukoshi Holdings Ltd. | (63,500) | (693,877) | 4,902 |
| Iyo Bank Ltd. (The) | (78,400) | (556,887) | (13,281) |
| Izumi Co., Ltd. | (1,700) | (85,025) | 1,029 |
| J Front Retailing Co., Ltd. | (17,100) | (246,496) | (3,435) |
| Japan Airport Terminal Co., Ltd. | (7,000) | (243,152) | 1,530 |
| Japan Post Insurance Co., Ltd. | (3,800) | (86,640) | (1,312) |
| JFE Holdings, Inc. | (31,700) | (540,694) | (15,016) |
| JGC Corp. | (32,800) | (572,756) | (2,676) |
| Kakaku.com, Inc. | (67,500) | (974,120) | 19,889 |
| Kansai Electric Power Co., Inc. (The) | (35,600) | (481,104) | (18,441) |
| Kansai Paint Co., Ltd. | (15,300) | (338,685) | (14,642) |
| Kawasaki Heavy Industries Ltd. | (85,000) | (257,347) | (6,552) |
| Keihan Holdings Co., Ltd. | (118,000) | (742,350) | 6,200 |
| Keikyu Corp. | (113,000) | (1,297,112) | (3,063) |
| Keio Corp. | (75,000) | (600,634) | 21,677 |
| Keisei Electric Railway Co., Ltd. | (12,400) | (295,110) | 10,960 |
| Kikkoman Corp. | (17,600) | (541,652) | 6,852 |
| Kintetsu Group Holdings Co., Ltd. | (309,000) | (1,128,403) | 25,298 |
| Kobe Steel, Ltd. | (131,200) | (1,165,588) | (19,896) |
| Kubota Corp. | (5,400) | (85,065) | (4,007) |
| Kyowa Hakko Kirin Co., Ltd. | (7,300) | (125,421) | (11,400) |
| Kyushu Electric Power Co., Inc. | (51,400) | (554,444) | 10,479 |
| Kyushu Railway Co | (2,400) | (75,271) | 1,517 |
| Lawson Inc | (3,600) | (238,857) | 7,439 |
| LIXIK Group Corp. | (21,000) | (524,849) | 5,887 |
| Marui Group Co., Ltd. | (80,500) | (1,102,476) | 1,415 |
| Short Positions |
| Description | Shares | Notional (1) | Net unrealized
appreciation
(depreciation) |
| Mitsubishi Heavy Industries Ltd. | (146,000) | (585,003) | (6,010) |
| Mitsubishi Logistics Corp. | (44,000) | (569,253) | 10,084 |
| Mitsubishi Motors Corp. | (159,200) | (1,019,603) | (94,833) |
| MonotaRO Co., Ltd. | (41,800) | (1,360,446) | (19,208) |
| Murata Manufacturing Co., Ltd. | (1,000) | (134,326) | (3,718) |
| Nagoya Railroad Co., Ltd. | (112,000) | (514,514) | 12,156 |
| Nankai Electric Railway Co., Ltd. | (170,000) | (836,033) | 22,941 |
| NGK Spark Plug Co., Ltd. | (80,000) | (1,734,992) | (81,219) |
| Nippon Paint Holdings Co., Ltd. | (17,200) | (659,764) | (45,223) |
| Nippon Yusen KK | (428,000) | (860,519) | 23,460 |
| Nissin Foods Holdings Co., Ltd. | (900) | (51,536) | 1,076 |
| NOK Corp. | (23,700) | (564,898) | (48,527) |
| Obic Co., Ltd. | (8,800) | (475,425) | (41,328) |
| Odakyu Electric Railway Co., Ltd. | (84,200) | (1,634,561) | 55,289 |
| Olympus Corp. | (8,400) | (323,886) | (11,756) |
| Ono Pharmaceutical Co., Ltd. | (30,900) | (637,366) | (151) |
| Orient Corp. | (283,600) | (506,188) | (6,740) |
| Oriental Land Co., Ltd. | (19,300) | (1,108,483) | 44,659 |
| Pigeon Corp. | (27,800) | (861,963) | 23,648 |
| Ricoh Co., Ltd. | (162,500) | (1,354,505) | (3,857) |
| Rinnai Corp. | (6,200) | (515,580) | 1,206 |
| Ryohin Keikaku Co., Ltd. | (2,500) | (563,748) | 11,145 |
| Santen Pharmaceutical Co., Ltd. | (29,200) | (410,864) | (10) |
| Sawai Pharmaceutical Co., Ltd. | (3,500) | (191,258) | (3,438) |
| Seibu Holdings, Inc. | (84,300) | (1,472,722) | 21,989 |
| Seven Bank Ltd. | (609,500) | (2,047,107) | 32,235 |
| Shikoku Electric Power Co., Inc. | (167,200) | (2,008,902) | (130,618) |
| Shimano, Inc. | (13,800) | (2,112,006) | (29,015) |
| Shizuoka Bank Ltd. (The) | (19,000) | (160,372) | (5,681) |
| Sohgo Security Services Co., Ltd. | (6,600) | (288,145) | 1,524 |
| Sony Financial Holdings, Inc. | (111,300) | (1,851,221) | (86,852) |
| Sosei Group Corp. | (3,200) | (329,108) | (10,155) |
| Stanley Electric Co., Ltd. | (4,500) | (131,770) | (9,037) |
| Sumco Corp. | (2,600) | (45,515) | (2,603) |
| Suntory Beverage & Food Ltd. | (2,800) | (126,152) | (3,779) |
| Sysmex Corp. | (7,700) | (468,989) | 8,822 |
| Taiyo Nippon Sanso Corp. | (3,800) | (45,426) | (2,470) |
| Tobu Railway Co., Ltd. | (56,000) | (284,019) | 7,715 |
The accompanying Notes to Financial Statements are an integral part of this statement.
| 32 | Multi-Manager Directional Alternative Strategies Fund | Annual Report 2017 |
Portfolio of Investments (continued)
April 30, 2017
| Short Positions |
| Description | Shares | Notional (1) | Net unrealized
appreciation
(depreciation) |
| Tohoku Electric Power Co., Inc. | (20,500) | (273,303) | 12,493 |
| Toray Industries, Inc. | (8,100) | (71,688) | (491) |
| TOTO Ltd. | (2,500) | (95,381) | (1,102) |
| Toyota Industries Corp. | (25,200) | (1,255,322) | (74,962) |
| Trend Micro, Inc. | (7,200) | (316,791) | (7,096) |
| Unicharm Corp. | (16,000) | (389,107) | (4,284) |
| USS Co., Ltd. | (14,700) | (260,056) | (1,717) |
| Yahoo Japan Corp. | (130,300) | (558,104) | 58,225 |
| Yakult Honsha Co., Ltd. | (38,300) | (2,182,954) | 73,622 |
| Yamaha Motor Co., Ltd. | (42,900) | (1,018,812) | (47,723) |
| Yaskawa Electric Corp. | (60,700) | (1,160,220) | (39,742) |
| Total Japan | | | (738,545) |
| Short Positions |
| Description | Shares | Notional (1) | Net unrealized
appreciation
(depreciation) |
| Macao |
| MGM China Holdings Ltd. | (58,400) | (132,848) | (775) |
| Common Stocks Short Positions Total | (991,292) |
| Total of Long and Short Positions | 375,177 |
| Net Cash and Other Receivable/(Payables)(2) | | | 167,870 |
| Swaps, at Value | 543,047 |
| (1) | The notional amounts of the positions held in the total return basket swap represent the market values (including any fees or commissions) of the long and short positions when they are established. The total return basket swap is valued daily, and the change in value is recorded as unrealized appreciation (depreciation). Payments received or made are recorded as realized gains (losses). |
| (2) | Net cash and other receivables (payables) includes gains (losses) which will be paid upon the swap reset. |
| Counterparty | Description | Termination
Date | Net unrealized
appreciation
(depreciation) ($) |
| Morgan Stanley International | The Fund receives the total return on a portfolio of long and short positions and pays the FEDEF 1-day, EONIA 1-day, or SONIA 1-day based on the local currencies of the positions within the swap. | 10/29/2018 | 2,279,536 |
Additional information — Total return basket swaps
The following table represents the individual long and short positions and related values within the total return basket swap as of April 30, 2017:
| Long Positions |
| Description | Shares | Notional (1) | Net unrealized
appreciation
(depreciation) |
| Common Stocks |
| Bermuda |
| Hiscox Ltd. | 4,014 | 58,852 | 1,006 |
| France |
| Air France-KLM | 39,317 | 330,418 | 26,557 |
| Arkema SA | 13,833 | 1,464,788 | 123,388 |
| AtoS | 36,461 | 4,777,950 | 345,657 |
| BNP Paribas SA | 942 | 66,472 | 8,513 |
| Cap Gemini SA | 15,151 | 1,516,716 | 135,980 |
| Christian Dior SE | 564 | 154,789 | 20,028 |
| Cie de Saint-Gobain | 26,522 | 1,431,520 | 139,325 |
| Long Positions |
| Description | Shares | Notional (1) | Net unrealized
appreciation
(depreciation) |
| Cie Generale des Etablissements Michelin | 18,598 | 2,430,043 | 232,106 |
| CNP Assurances | 45,997 | 960,504 | 52,037 |
| Eiffage SA | 9,086 | 769,620 | 72,774 |
| Elior Group | 16,877 | 420,996 | 29,786 |
| Faurecia | 19,273 | 940,954 | 88,934 |
| Imerys SA | 1,607 | 138,272 | 5,140 |
| Ipsen SA | 9,525 | 1,108,631 | 143,779 |
| Lagardere SCA | 26,484 | 811,234 | 31,883 |
| Legrand SA | 1,302 | 84,288 | 5,716 |
| Peugeot SA | 133,036 | 2,787,461 | 307,724 |
| Plastic Omnium SA | 15,592 | 609,908 | 52,417 |
The accompanying Notes to Financial Statements are an integral part of this statement.
Multi-Manager Directional Alternative Strategies Fund | Annual Report 2017
| 33 |
Portfolio of Investments (continued)
April 30, 2017
| Long Positions |
| Description | Shares | Notional (1) | Net unrealized
appreciation
(depreciation) |
| Publicis Groupe SA | 1,606 | 115,934 | 6,260 |
| Renault SA | 1,996 | 186,137 | 18,936 |
| Rexel SA | 27,701 | 494,865 | 26,402 |
| Schneider Electric SE | 8,929 | 705,161 | 57,831 |
| SEB SA | 5,774 | 930,863 | 116,471 |
| Sodexo SA | 9,488 | 1,206,127 | 57,833 |
| Teleperformance SA | 10,394 | 1,306,014 | 187,532 |
| Thales SA | 19,054 | 2,003,322 | 138,457 |
| Ubisoft Entertainment SA | 12,740 | 603,679 | 49,016 |
| Valeo SA | 20,220 | 1,453,692 | 158,606 |
| Total France | | | 2,639,088 |
| Germany |
| TUI AG | 21,635 | 314,683 | 17,907 |
| Guernsey |
| Amdocs Ltd. | 6,979 | 427,394 | 4,676 |
| Hong Kong |
| Michael Kors Holdings Ltd. | 9,822 | 366,655 | 98 |
| Ireland |
| Eaton Corp. PLC | 774 | 58,545 | 1,053 |
| Ingersoll-Rand PLC | 29,744 | 2,639,780 | 193,633 |
| Mallinckrodt PLC | 14,108 | 661,947 | 39,528 |
| Total Ireland | | | 234,214 |
| Jersey |
| IWG PLC | 59,759 | 251,472 | 7,930 |
| UBM PLC | 21,836 | 200,943 | (2,251) |
| Total Jersey | | | 5,679 |
| Luxembourg |
| B&M European Value Retail SA | 51,864 | 226,377 | 12,479 |
| Netherlands |
| LyondellBasell Industries NV, Class A | 11,202 | 949,482 | (6,196) |
| Mylan NV | 1,312 | 49,003 | (262) |
| Total Netherlands | | | (6,458) |
| Puerto Rico |
| Popular, Inc. | 44,912 | 1,882,262 | 124,750 |
| Singapore |
| Flex Ltd. | 60,291 | 932,099 | (32,557) |
| Long Positions |
| Description | Shares | Notional (1) | Net unrealized
appreciation
(depreciation) |
| Spain |
| ACS Actividades de Construccion y Servicios SA | 10,628 | 393,968 | 22,577 |
| Banco Santander SA | 29,903 | 195,017 | 19,281 |
| Ebro Foods SA | 13,181 | 294,771 | 17,602 |
| Endesa SA | 80,802 | 1,904,261 | 474 |
| Mapfre SA | 217,132 | 757,816 | 25,745 |
| Melia Hotels International SA | 23,733 | 352,368 | 23,231 |
| Prosegur Cia de Seguridad SA, Registered Shares | 70,664 | 461,076 | 35,553 |
| Repsol SA | 145,122 | 2,297,712 | 55,346 |
| Tecnicas Reunidas SA | 26,791 | 1,060,818 | (23,339) |
| Total Spain | | | 176,470 |
| Switzerland |
| Coca-Cola HBC AG | 19,671 | 545,736 | 19,457 |
| TE Connectivity Ltd. | 6,425 | 497,102 | 29,555 |
| Total Switzerland | | | 49,012 |
| United Kingdom |
| Aberdeen Asset Management PLC | 75,501 | 272,831 | 5,475 |
| Ashtead Group PLC | 48,781 | 1,030,484 | 28,642 |
| ASOS PLC | 9,065 | 683,325 | 33,641 |
| Babcock International Group PLC | 7,370 | 85,815 | 3,082 |
| BAE Systems PLC | 19,146 | 155,483 | (1,040) |
| Barclays Bank PLC | 83,779 | 230,314 | 7,247 |
| Barratt Developments PLC | 286,152 | 2,147,765 | 16,071 |
| BBA Aviation PLC | 22,216 | 89,574 | 2,887 |
| Bellway PLC | 33,353 | 1,229,437 | 44,522 |
| Berendsen PLC | 44,309 | 481,494 | 46,982 |
| Britvic PLC | 25,965 | 223,638 | (2,804) |
| BT Group PLC | 16,491 | 65,092 | (643) |
| Carphone Warehouse Group PLC | 196,822 | 855,269 | 47,074 |
| Centrica PLC | 238,078 | 610,241 | (42,003) |
| Close Brothers Group PLC | 39,769 | 871,529 | 49,152 |
| Compass Group PLC | 3,388 | 68,367 | 2,224 |
| DCC PLC | 3,859 | 356,370 | 6,193 |
| Direct Line Insurance Group PLC | 24,053 | 108,788 | 3,935 |
| DS Smith PLC | 43,259 | 241,765 | 8,128 |
| Ensco PLC, Class A | 75,943 | 599,190 | (31,589) |
The accompanying Notes to Financial Statements are an integral part of this statement.
| 34 | Multi-Manager Directional Alternative Strategies Fund | Annual Report 2017 |
Portfolio of Investments (continued)
April 30, 2017
| Long Positions |
| Description | Shares | Notional (1) | Net unrealized
appreciation
(depreciation) |
| Galiform PLC | 110,586 | 663,159 | 5,388 |
| GKN PLC | 248,772 | 1,156,409 | 56,612 |
| GlaxoSmithKline PLC | 26,600 | 534,011 | (8,018) |
| Greene King PLC | 23,032 | 224,031 | 9,707 |
| Hays PLC | 129,090 | 286,242 | 8,521 |
| HSBC Holdings PLC | 15,302 | 126,149 | 3,076 |
| Inchcape PLC | 83,365 | 922,640 | 12,512 |
| Indivior PLC | 314,652 | 1,365,249 | 73,621 |
| InterContinental Hotels Group PLC | 4,217 | 223,718 | 15,623 |
| Intermediate Capital Group PLC | 72,587 | 734,254 | 35,024 |
| International Game Technology PLC | 40,746 | 904,561 | 37,079 |
| Investec PLC | 130,653 | 967,102 | 54,212 |
| JD Sports Fashion PLC | 10,810 | 62,305 | 589 |
| Jupiter Fund Management PLC | 74,506 | 457,990 | 30,231 |
| Kingfisher PLC | 20,257 | 89,546 | 4,077 |
| Legal & General Group PLC | 34,790 | 110,893 | (505) |
| Lloyds Banking Group PLC | 320,066 | 286,868 | 31,168 |
| Man Group PLC | 140,563 | 279,822 | 17,860 |
| Mondi PLC | 39,952 | 1,035,433 | 37,370 |
| Moneysupermarket.com Group PLC | 157,663 | 706,345 | 42,138 |
| Paysafe Group PLC | 104,209 | 612,635 | (2,922) |
| Persimmon PLC | 97,933 | 2,955,436 | 135,334 |
| Rowan Companies PLC, Class A | 4,087 | 57,504 | (1,063) |
| Royal Mail PLC | 363,455 | 1,894,755 | (53,291) |
| RSA Insurance Group PLC | 19,023 | 146,846 | 4,401 |
| Sage Group PLC (The) | 52,666 | 457,027 | 17,001 |
| Severn Trent PLC | 6,837 | 205,885 | (5,923) |
| Smiths Group PLC | 2,544 | 54,038 | 2,640 |
| Spectris PLC | 3,286 | 117,466 | 8,956 |
| Tate & Lyle PLC | 159,796 | 1,565,710 | (20,810) |
| Taylor Wimpey PLC | 687,925 | 1,782,000 | 27,229 |
| WH Smith PLC | 18,813 | 431,045 | (6,796) |
| William Hill PLC | 248,532 | 944,772 | (12,552) |
| Wm Morrison Supermarkets PLC | 385,203 | 1,196,896 | 68,361 |
| Wolseley PLC | 1,600 | 101,627 | 3,581 |
| WPP PLC | 70,126 | 1,501,373 | (31,615) |
| Total United Kingdom | | | 825,992 |
| Long Positions |
| Description | Shares | Notional (1) | Net unrealized
appreciation
(depreciation) |
| United States |
| AbbVie, Inc. | 7,961 | 524,948 | 18,403 |
| Accenture PLC, Class A | 2,010 | 243,813 | 11,216 |
| Activision Blizzard, Inc. | 11,875 | 620,469 | 40,969 |
| Adobe Systems, Inc. | 1,144 | 152,999 | 4,290 |
| AdvanSix, Inc. | 2,067 | 56,346 | 4,072 |
| Aetna, Inc. | 13,833 | 1,868,423 | 79,678 |
| Aflac, Inc. | 35,170 | 2,633,530 | 46,313 |
| AGCO Corp. | 1,370 | 87,666 | 6,940 |
| Agilent Technologies, Inc. | 13,977 | 769,434 | 22,223 |
| Akamai Technologies, Inc. | 6,747 | 411,162 | 14,304 |
| Alaska Air Group, Inc. | 4,577 | 389,457 | (8,330) |
| Alexion Pharmaceuticals, Inc. | 5,878 | 751,091 | 55,600 |
| Allstate Corp. (The) | 25,061 | 2,037,209 | (5,263) |
| Alphabet, Inc., Class A | 645 | 596,315 | 44,757 |
| AMC Networks, Inc., Class A | 9,009 | 537,657 | 8,919 |
| Ameren Corp. | 7,117 | 389,229 | (5,267) |
| American Eagle Outfitters, Inc. | 65,717 | 925,953 | 44,866 |
| American Electric Power Co., Inc. | 33,560 | 2,276,375 | 3,020 |
| American Financial Group, Inc. | 11,377 | 1,107,096 | 29,808 |
| American International Group, Inc. | 9,779 | 595,639 | 9,583 |
| Amgen, Inc. | 13,078 | 2,135,899 | 18,922 |
| Anadarko Petroleum Corp. | 1,974 | 112,557 | (8,271) |
| Anthem, Inc. | 13,966 | 2,484,412 | 152,928 |
| Apple, Inc. | 427 | 61,339 | 777 |
| Applied Materials, Inc. | 29,325 | 1,190,888 | 75,952 |
| Archer-Daniels-Midland Co. | 24,825 | 1,135,744 | 26,563 |
| Arrow Electronics, Inc. | 19,215 | 1,354,658 | (7,686) |
| Aspen Insurance Holdings Ltd. | 4,222 | 221,022 | 4,433 |
| Assurant, Inc. | 6,755 | 650,101 | 13,645 |
| Assured Guaranty Ltd. | 53,143 | 2,026,343 | (553) |
| Avery Dennison Corp. | 22,448 | 1,867,898 | 65,548 |
| Avnet, Inc. | 10,006 | 387,132 | (52,031) |
| Axis Capital Holdings Ltd. | 6,837 | 450,558 | (1,846) |
| BancorpSouth, Inc. | 24,666 | 751,080 | 20,966 |
| Bank of America Corp. | 18,565 | 433,307 | 9,839 |
| Bank of New York Mellon Corp. (The) | 13,448 | 632,863 | 134 |
| Baxter International, Inc. | 33,336 | 1,856,148 | 95,341 |
The accompanying Notes to Financial Statements are an integral part of this statement.
Multi-Manager Directional Alternative Strategies Fund | Annual Report 2017
| 35 |
Portfolio of Investments (continued)
April 30, 2017
| Long Positions |
| Description | Shares | Notional (1) | Net unrealized
appreciation
(depreciation) |
| BB&T Corp. | 2,012 | 86,878 | 60 |
| Bed Bath & Beyond, Inc. | 6,986 | 270,708 | 1,737 |
| Belden, Inc. | 664 | 46,281 | 2,437 |
| Bemis Co., Inc. | 3,152 | 141,619 | (11,000) |
| Best Buy Co., Inc. | 21,316 | 1,104,382 | 73,540 |
| Big Lots, Inc. | 11,365 | 573,819 | 27,390 |
| Biogen, Inc. | 8,162 | 2,213,616 | (23,180) |
| Bioverativ, Inc. | 9,865 | 580,161 | 25,154 |
| Boeing Co. (The) | 12,145 | 2,244,760 | 70,562 |
| Booz Allen Hamilton Holdings Corp. | 23,383 | 840,151 | 23,617 |
| Boston Beer Co., Inc. (The), Class A | 313 | 45,182 | 1,398 |
| Boston Properties, Inc. | 369 | 46,715 | (3,790) |
| Brixmor Property Group, Inc. | 18,352 | 362,452 | (33,217) |
| Broadridge Financial Solutions, Inc. | 5,461 | 381,942 | 11,468 |
| Bruker Corp. | 39,058 | 952,625 | 86,318 |
| Brunswick Corp. | 20,009 | 1,135,511 | (7,003) |
| Bunge Ltd. | 14,516 | 1,147,199 | 17,313 |
| Burlington Stores, Inc. | 12,833 | 1,269,440 | 94,610 |
| BWX Technologies, Inc. | 22,616 | 1,112,029 | 19,902 |
| CA, Inc. | 30,302 | 994,815 | 31,472 |
| Cabot Corp. | 28,990 | 1,744,908 | 76,534 |
| Cadence Design Systems, Inc. | 7,764 | 252,873 | 9,239 |
| Camden Property Trust | 2,994 | 246,496 | (359) |
| Capital One Financial Corp. | 12,584 | 1,011,502 | (31,858) |
| Care Capital Properties, Inc. | 7,086 | 190,401 | (6,904) |
| Carlisle Companies, Inc. | 6,150 | 623,549 | (16,297) |
| Carter’s, Inc. | 3,330 | 306,493 | 8,758 |
| CDK Global, Inc. | 11,103 | 721,806 | 6,329 |
| CDW Corp. | 9,531 | 563,187 | 18,585 |
| Celanese Corp., Class A | 7,543 | 656,543 | (26,099) |
| Celgene Corp. | 3,823 | 474,243 | (3,899) |
| Centene Corp. | 11,155 | 829,932 | 37,592 |
| Charles River Laboratories International, Inc. | 11,467 | 1,028,590 | 21,115 |
| Cheesecake Factory, Inc. (The) | 3,649 | 234,120 | 8,429 |
| Chico’s FAS, Inc. | 62,189 | 859,452 | 27,758 |
| CIGNA Corp. | 2,944 | 460,353 | 15,309 |
| Cintas Corp. | 3,592 | 439,912 | (1,832) |
| Long Positions |
| Description | Shares | Notional (1) | Net unrealized
appreciation
(depreciation) |
| Cirrus Logic, Inc. | 17,939 | 1,154,375 | 27,447 |
| Cisco Systems, Inc. | 32,655 | 1,112,556 | 47,676 |
| Citigroup, Inc. | 5,676 | 335,565 | 738 |
| Citrix Systems, Inc. | 5,549 | 449,136 | (13,872) |
| CNO Financial Group, Inc. | 41,038 | 864,671 | 29,137 |
| Comcast Corp., Class A | 16,174 | 633,859 | 32,186 |
| Comerica, Inc. | 4,124 | 291,567 | 15,547 |
| Commerce Bancshares, Inc. | 19,257 | 1,058,172 | 19,257 |
| CommScope Holding Co., Inc. | 21,386 | 899,067 | 30,154 |
| CommVault Systems, Inc. | 4,524 | 228,236 | (452) |
| ConAgra Foods, Inc. | 11,943 | 463,150 | (20,064) |
| ConocoPhillips | 11,228 | 537,933 | (11,677) |
| Consolidated Edison, Inc. | 11,254 | 892,217 | 4,614 |
| Constellation Brands, Inc., Class A | 303 | 52,280 | 733 |
| Convergys Corp. | 41,443 | 932,882 | 44,260 |
| CoreLogic, Inc. | 15,768 | 673,924 | 21,228 |
| Corning, Inc. | 30,697 | 885,608 | 70,910 |
| Crane Co. | 22,545 | 1,801,571 | 114,980 |
| Cullen/Frost Bankers, Inc. | 4,277 | 403,706 | 26,945 |
| Cummins, Inc. | 10,942 | 1,651,585 | 43,112 |
| Curtiss-Wright Corp. | 18,808 | 1,757,796 | 74,856 |
| CVS Health Corp. | 1,858 | 153,174 | 8,107 |
| D.R. Horton, Inc. | 36,895 | 1,213,477 | (46,857) |
| Dana, Inc. | 27,309 | 530,341 | 39,646 |
| Darden Restaurants, Inc. | 4,843 | 412,575 | 12,350 |
| Delta Air Lines, Inc. | 61,443 | 2,791,970 | 66,973 |
| Deluxe Corp. | 5,343 | 384,215 | 14,800 |
| DeVry Education Group, Inc. | 6,028 | 228,160 | 21,098 |
| Diamond Offshore Drilling, Inc. | 12,748 | 183,826 | (10,963) |
| Dick’s Sporting Goods, Inc. | 12,317 | 622,624 | 3,449 |
| Dillard’s, Inc., Class A | 4,749 | 262,952 | 15,850 |
| Discover Financial Services | 14,045 | 879,077 | (43,399) |
| Dolby Laboratories, Inc., Class A | 20,768 | 1,095,097 | 19,937 |
| Dr. Pepper Snapple Group, Inc. | 2,613 | 239,481 | (16,984) |
| DST Systems, Inc. | 10,246 | 1,261,385 | 2,766 |
| DTE Energy Co. | 17,580 | 1,838,692 | 2,637 |
| Duke Energy Corp. | 3,287 | 271,178 | (1,413) |
| Eastman Chemical Co. | 16,012 | 1,276,957 | 23,378 |
The accompanying Notes to Financial Statements are an integral part of this statement.
| 36 | Multi-Manager Directional Alternative Strategies Fund | Annual Report 2017 |
Portfolio of Investments (continued)
April 30, 2017
| Long Positions |
| Description | Shares | Notional (1) | Net unrealized
appreciation
(depreciation) |
| eBay, Inc. | 79,688 | 2,662,376 | (74,066) |
| Edison International | 12,218 | 977,073 | (8,553) |
| Electronic Arts, Inc. | 4,683 | 444,042 | 26,272 |
| Eli Lilly & Co. | 9,525 | 781,622 | 4,424 |
| EMCOR Group, Inc. | 6,226 | 409,297 | 25,402 |
| Emerson Electric Co. | 2,063 | 124,358 | 3,878 |
| Endo International PLC | 21,034 | 239,157 | 13,251 |
| Energen Corp. | 2,287 | 118,901 | (5,512) |
| EnerSys | 6,242 | 518,773 | 35,704 |
| EPR Properties | 3,311 | 240,743 | (12,218) |
| Equity LifeStyle Properties, Inc. | 673 | 54,452 | 686 |
| Esterline Technologies Corp. | 12,749 | 1,165,896 | 58,645 |
| Euronet Worldwide, Inc. | 923 | 76,258 | (1,948) |
| Everest Re Group Ltd. | 1,180 | 297,018 | 20,237 |
| Express Scripts Holding Co. | 9,548 | 585,674 | (50,891) |
| Fair Isaac Corp. | 4,936 | 668,729 | 36,526 |
| Fifth Third Bancorp | 14,747 | 360,269 | 442 |
| First American Financial Corp. | 20,138 | 874,191 | 90,017 |
| Fiserv, Inc. | 1,289 | 153,571 | 3,467 |
| FLIR Systems, Inc. | 19,492 | 715,941 | 30,602 |
| Foot Locker, Inc. | 21,281 | 1,645,873 | 103,466 |
| Ford Motor Co. | 12,761 | 146,369 | 2,425 |
| Fortinet, Inc. | 2,805 | 109,395 | 2,609 |
| Franklin Resources, Inc. | 23,974 | 1,033,519 | 41,715 |
| FTI Consulting, Inc. | 13,132 | 454,236 | (87,590) |
| Fulton Financial Corp. | 34,003 | 627,355 | 37,403 |
| GameStop Corp., Class A | 11,854 | 268,967 | (2,371) |
| Gap, Inc. (The) | 2,832 | 74,198 | 6,503 |
| General Dynamics Corp. | 2,009 | 389,324 | 9,844 |
| General Motors Co. | 34,260 | 1,186,766 | 25,352 |
| Genpact Ltd. | 22,383 | 546,593 | 16,340 |
| Gilead Sciences, Inc. | 46,227 | 3,168,861 | 89,026 |
| Globus Medical, Inc., Class A | 4,331 | 131,359 | (83) |
| Goldman Sachs Group, Inc. (The) | 3,984 | 891,619 | 7,513 |
| Goodyear Tire & Rubber Co. (The) | 5,772 | 209,120 | 7,446 |
| Graham Holdings Co., Class B | 360 | 216,612 | 1,224 |
| Graphic Packaging Holding Co. | 60,908 | 827,131 | 34,109 |
| Greif, Inc., Class A | 13,759 | 806,553 | 58,751 |
| Long Positions |
| Description | Shares | Notional (1) | Net unrealized
appreciation
(depreciation) |
| Hancock Holding Co. | 3,351 | 156,492 | 8,042 |
| Hawaiian Electric Industries, Inc. | 46,728 | 1,566,323 | (14,486) |
| HCA Holdings, Inc. | 3,799 | 319,914 | (5,471) |
| HCP, Inc. | 12,251 | 384,069 | (11,271) |
| HD Supply Holdings, Inc. | 13,455 | 542,237 | 8,073 |
| Healthcare Realty Trust, Inc. | 1,606 | 52,677 | (1,654) |
| Healthcare Trust of America, Inc., Class A | 4,846 | 154,539 | (4,410) |
| Herman Miller, Inc. | 8,947 | 296,146 | 16,105 |
| Hewlett Packard Enterprise Co. | 97,623 | 1,818,716 | 50,764 |
| HNI Corp. | 3,147 | 147,154 | 1,574 |
| Honeywell International, Inc. | 10,985 | 1,440,573 | 84,694 |
| HP, Inc. | 83,175 | 1,565,354 | 51,569 |
| HSN, Inc. | 6,527 | 240,846 | 6,853 |
| Hubbell, Inc. | 8,316 | 940,789 | (44,990) |
| Huntington Ingalls Industries, Inc. | 13,448 | 2,701,569 | 1,345 |
| Huntsman Corp. | 36,673 | 908,390 | 46,208 |
| Hyatt Hotels Corp., Class A | 9,568 | 531,024 | 11,960 |
| IAC/InterActiveCorp | 12,097 | 1,004,172 | 95,557 |
| IDACORP, Inc. | 7,115 | 601,360 | (5,977) |
| Ingredion, Inc. | 8,135 | 1,007,276 | 26,520 |
| Intel Corp. | 22,016 | 795,878 | 12,278 |
| InterDigital, Inc. | 11,620 | 1,044,638 | 63,329 |
| International Business Machines Corp. | 3,130 | 501,708 | (33,835) |
| International Paper Co. | 2,259 | 121,918 | 7,907 |
| Intuit, Inc. | 3,690 | 462,025 | 24,243 |
| Invesco Ltd. | 9,238 | 304,300 | 20,502 |
| Ionis Pharmaceuticals, Inc. | 2,332 | 112,379 | 14,120 |
| ITT, Inc. | 10,437 | 439,711 | 30,059 |
| Jabil Circuit, Inc. | 31,732 | 920,863 | 12,375 |
| Jack Henry & Associates, Inc. | 3,717 | 360,252 | 10,222 |
| Jack in the Box, Inc. | 3,431 | 349,859 | 11,528 |
| Jacobs Engineering Group, Inc. | 10,639 | 584,294 | 15,639 |
| JetBlue Airways Corp. | 56,755 | 1,238,962 | 51,854 |
| John Wiley & Sons, Inc., Class A | 10,588 | 557,988 | 7,941 |
| Johnson & Johnson | 7,111 | 877,995 | (16,000) |
| JPMorgan Chase & Co. | 12,644 | 1,100,028 | 15,245 |
| Juniper Networks, Inc. | 33,993 | 1,022,170 | 79,912 |
| KeyCorp | 40,145 | 732,245 | 36,131 |
The accompanying Notes to Financial Statements are an integral part of this statement.
Multi-Manager Directional Alternative Strategies Fund | Annual Report 2017
| 37 |
Portfolio of Investments (continued)
April 30, 2017
| Long Positions |
| Description | Shares | Notional (1) | Net unrealized
appreciation
(depreciation) |
| Keysight Technologies, Inc. | 5,306 | 198,604 | 7,853 |
| Kohl’s Corp. | 17,838 | 696,217 | 2,277 |
| L-3 Communications Corp. | 9,756 | 1,675,788 | 51,024 |
| Laboratory Corp. of America Holdings | 6,771 | 948,956 | (13,788) |
| Lam Research Corp. | 743 | 107,624 | 13,017 |
| Lancaster Colony Corp. | 3,351 | 421,891 | (5,496) |
| Landstar System, Inc. | 967 | 82,630 | 1,064 |
| Las Vegas Sands Corp. | 5,203 | 306,925 | 13,268 |
| Lear Corp. | 16,248 | 2,317,940 | 132,259 |
| Legg Mason, Inc. | 2,103 | 78,610 | 81 |
| Leidos Holdings, Inc. | 7,746 | 407,904 | 10,689 |
| Liberty Property Trust | 2,874 | 116,598 | (661) |
| Lincoln National Corp. | 6,305 | 415,689 | 11,601 |
| Lockheed Martin Corp. | 458 | 123,408 | 234 |
| Louisiana-Pacific Corp. | 2,476 | 63,732 | 74 |
| Macy’s, Inc. | 9,635 | 281,535 | 4,227 |
| ManpowerGroup, Inc. | 9,467 | 955,978 | 15,621 |
| Marathon Petroleum Corp. | 5,641 | 287,353 | 5,867 |
| MarketAxess Holdings, Inc. | 2,444 | 470,519 | 24,000 |
| Maxim Integrated Products, Inc. | 12,285 | 542,383 | 491 |
| McKesson Corp. | 8,412 | 1,163,295 | (49,883) |
| Merck & Co., Inc. | 29,583 | 1,843,908 | (13,904) |
| Meredith Corp. | 2,456 | 143,799 | (10,192) |
| MetLife, Inc. | 3,606 | 186,827 | (325) |
| Micron Technology, Inc. | 23,389 | 647,174 | 12,661 |
| Microsoft Corp. | 10,895 | 745,872 | 32,467 |
| Molina Healthcare, Inc. | 3,734 | 185,916 | 8,277 |
| Molson Coors Brewing Co., Class B | 1,070 | 102,602 | 813 |
| Morningstar, Inc. | 2,976 | 217,635 | (13,065) |
| MSA Safety, Inc. | 1,483 | 115,452 | 14,348 |
| MSC Industrial Direct Co., Inc., Class A | 11,615 | 1,039,891 | 1,278 |
| Nasdaq, Inc. | 3,254 | 224,103 | (683) |
| National Retail Properties, Inc. | 17,971 | 758,736 | (57,801) |
| Navient Corp. | 4,184 | 63,597 | 806 |
| NCR Corp. | 2,463 | 101,599 | (6,084) |
| NeuStar, Inc., Class A | 16,438 | 545,742 | (145) |
| New York Times Co. (The), Class A | 33,248 | 480,434 | 0 |
| Norfolk Southern Corp. | 756 | 88,822 | 3,251 |
| Long Positions |
| Description | Shares | Notional (1) | Net unrealized
appreciation
(depreciation) |
| Northrop Grumman Corp. | 8,257 | 2,030,892 | 23,615 |
| Nu Skin Enterprises, Inc., Class A | 17,479 | 965,365 | 2,097 |
| Nuance Communications, Inc. | 2,595 | 46,425 | 3,036 |
| NVR, Inc. | 674 | 1,422,983 | (23,853) |
| Oceaneering International, Inc. | 40,263 | 1,062,541 | (30,941) |
| Old Republic International Corp. | 5,582 | 115,436 | 3,405 |
| Omnicom Group, Inc. | 2,598 | 213,348 | (10,522) |
| ON Semiconductor Corp. | 4,872 | 69,085 | (684) |
| ONE Gas, Inc. | 16,866 | 1,160,887 | (7,421) |
| Oracle Corp. | 2,953 | 132,767 | 1,883 |
| Orbital ATK, Inc. | 2,223 | 220,077 | 4,735 |
| Oshkosh Corp. | 18,878 | 1,309,944 | 23,409 |
| Owens Corning | 15,106 | 919,200 | (11,934) |
| PAREXEL International Corp. | 8,633 | 551,044 | 21,065 |
| Parker-Hannifin Corp. | 10,758 | 1,729,886 | 54,651 |
| Pfizer, Inc. | 63,753 | 2,162,502 | 1,120 |
| PG&E Corp. | 8,110 | 543,776 | (3,487) |
| Pilgrim’s Pride Corp. | 18,512 | 480,572 | 54,240 |
| Pinnacle West Capital Corp. | 16,197 | 1,378,203 | (10,528) |
| PNC Financial Services Group, Inc. (The) | 23,276 | 2,787,301 | 31,190 |
| PolyOne Corp. | 10,997 | 431,192 | 53,006 |
| Procter & Gamble Co. (The) | 9,592 | 837,669 | (29,352) |
| ProLogis, Inc. | 1,581 | 86,022 | (1,344) |
| Prudential Financial, Inc. | 7,789 | 833,657 | 21,264 |
| Public Service Enterprise Group, Inc. | 19,067 | 839,901 | (31,079) |
| PVH Corp. | 3,646 | 368,355 | 3,974 |
| QUALCOMM, Inc. | 15,104 | 811,689 | 12,838 |
| Quanta Services, Inc. | 2,165 | 76,728 | 1,234 |
| Raymond James Financial, Inc. | 3,642 | 271,402 | 2,914 |
| Raytheon Co. | 12,966 | 2,012,453 | 25,543 |
| Realty Income Corp. | 2,384 | 139,106 | (8,249) |
| Regal Beloit Corp. | 9,493 | 748,523 | 36,548 |
| Regions Financial Corp. | 52,870 | 726,963 | (12,689) |
| Reinsurance Group of America, Inc. | 16,992 | 2,124,680 | (13,254) |
| Reliance Steel & Aluminum Co. | 10,166 | 801,284 | 30,498 |
| Rockwell Automation, Inc. | 2,895 | 455,528 | 19,773 |
| Ross Stores, Inc. | 19,952 | 1,296,880 | 34,317 |
| RPM International, Inc. | 7,044 | 370,233 | 14,088 |
The accompanying Notes to Financial Statements are an integral part of this statement.
| 38 | Multi-Manager Directional Alternative Strategies Fund | Annual Report 2017 |
Portfolio of Investments (continued)
April 30, 2017
| Long Positions |
| Description | Shares | Notional (1) | Net unrealized
appreciation
(depreciation) |
| SCANA Corp. | 18,825 | 1,248,286 | 188 |
| Science Applications International Corp. | 5,308 | 387,431 | 6,847 |
| Scripps Networks Interactive, Inc., Class A | 4,617 | 344,982 | (462) |
| Seagate Technology PLC | 7,447 | 313,742 | (46,358) |
| Sensient Technologies Corp. | 612 | 50,062 | 1,151 |
| Silicon Laboratories, Inc. | 2,468 | 175,598 | 2,962 |
| Skechers U.S.A., Inc., Class A | 5,757 | 145,364 | (1,727) |
| Skyworks Solutions, Inc. | 649 | 64,731 | 636 |
| SLM Corp. | 35,567 | 446,010 | 28,809 |
| Sonoco Products Co. | 12,350 | 646,029 | 8,398 |
| Southwest Airlines Co. | 30,008 | 1,687,050 | 45,012 |
| Southwest Gas Corp. | 3,791 | 317,534 | (5,345) |
| Southwestern Energy Co. | 14,372 | 107,934 | 287 |
| Spirit AeroSystems Holdings, Inc., Class A | 47,202 | 2,698,066 | 12,119 |
| Stanley Black & Decker, Inc. | 5,746 | 782,318 | 28,615 |
| Staples, Inc. | 7,528 | 73,549 | 1,280 |
| Starbucks Corp. | 1,256 | 75,435 | 2,192 |
| State Street Corp. | 5,930 | 497,527 | 32,141 |
| Steel Dynamics, Inc. | 12,124 | 438,161 | 41,222 |
| STORE Capital Corp. | 22,832 | 547,740 | (26,679) |
| SunTrust Banks, Inc. | 23,712 | 1,347,079 | 54,538 |
| Synaptics, Inc. | 7,232 | 396,097 | 27,482 |
| Synchrony Financial | 12,286 | 341,551 | (64,133) |
| SYNNEX Corp. | 7,534 | 816,912 | 12,958 |
| Synopsys, Inc. | 18,205 | 1,341,709 | 46,787 |
| Synovus Financial Corp. | 8,931 | 373,316 | 16,880 |
| Target Corp. | 13,973 | 780,392 | 30,321 |
| TCF Financial Corp. | 5,027 | 82,996 | 0 |
| Tech Data Corp. | 16,575 | 1,585,399 | 108,401 |
| TEGNA, Inc. | 5,788 | 147,478 | 405 |
| Teledyne Technologies, Inc. | 797 | 107,460 | 7,986 |
| Teleflex, Inc. | 832 | 172,132 | 8,029 |
| Teradyne, Inc. | 17,507 | 617,472 | 68,452 |
| Texas Instruments, Inc. | 11,933 | 944,855 | 5,489 |
| Texas Roadhouse, Inc. | 14,292 | 670,009 | 31,299 |
| Textron, Inc. | 9,685 | 451,902 | (1,840) |
| Long Positions |
| Description | Shares | Notional (1) | Net unrealized
appreciation
(depreciation) |
| Thor Industries, Inc. | 2,368 | 227,754 | 13,261 |
| Timken Co. (The) | 26,979 | 1,301,737 | 136,244 |
| TJX Companies, Inc. (The) | 13,306 | 1,046,384 | 28,741 |
| Toll Brothers, Inc. | 5,286 | 190,243 | (4,440) |
| Torchmark Corp. | 14,422 | 1,106,312 | 16,730 |
| Toro Co. (The) | 17,742 | 1,151,811 | 60,145 |
| Travelers Companies, Inc. (The) | 9,942 | 1,209,544 | (2,585) |
| Trinity Industries, Inc. | 3,009 | 80,942 | 3,761 |
| Trustmark Corp. | 5,273 | 175,169 | 11,232 |
| Tupperware Brands Corp. | 3,534 | 253,777 | 25,445 |
| Tyson Foods, Inc., Class A | 8,309 | 533,936 | (1,662) |
| U.S. Bancorp | 11,335 | 581,259 | 8,388 |
| UGI Corp. | 31,507 | 1,580,391 | 11,343 |
| UMB Financial Corp. | 753 | 54,585 | (1,340) |
| Umpqua Holdings Corp. | 12,455 | 220,080 | 9,864 |
| Union Pacific Corp. | 1,186 | 132,785 | 7,092 |
| United Continental Holdings, Inc. | 28,639 | 2,010,744 | (16,038) |
| United States Steel Corp. | 8,663 | 193,358 | (56,829) |
| United Technologies Corp. | 2,544 | 302,711 | 14,552 |
| United Therapeutics Corp. | 13,749 | 1,728,249 | 62,468 |
| UnitedHealth Group, Inc. | 8,756 | 1,531,249 | 67,421 |
| Unum Group | 27,474 | 1,272,870 | 22,254 |
| Urban Outfitters, Inc. | 23,707 | 542,416 | 3,793 |
| Vail Resorts, Inc. | 1,390 | 274,747 | 10,842 |
| Valero Energy Corp. | 2,797 | 180,714 | (1,622) |
| Validus Holdings Ltd. | 2,034 | 112,440 | (488) |
| Vectren Corp. | 19,279 | 1,145,558 | (5,398) |
| Ventas, Inc. | 12,286 | 786,427 | (22,483) |
| Verizon Communications, Inc. | 5,880 | 269,951 | (17,052) |
| Versum Materials, Inc. | 7,428 | 237,845 | 18,421 |
| Vertex Pharmaceuticals, Inc. | 3,589 | 424,579 | 13,330 |
| Vishay Intertechnology, Inc. | 13,798 | 225,597 | 8,969 |
| Visteon Corp. | 1,507 | 155,146 | 11,785 |
| Walgreens Boots Alliance, Inc. | 3,628 | 313,967 | 12,591 |
| Wal-Mart Stores, Inc. | 33,721 | 2,535,145 | 56,989 |
| Walt Disney Co. (The) | 1,922 | 222,183 | 3,498 |
| Waste Management, Inc. | 17,330 | 1,261,277 | 4,852 |
| Waters Corp. | 2,628 | 446,471 | 32,981 |
The accompanying Notes to Financial Statements are an integral part of this statement.
Multi-Manager Directional Alternative Strategies Fund | Annual Report 2017
| 39 |
Portfolio of Investments (continued)
April 30, 2017
| Long Positions |
| Description | Shares | Notional (1) | Net unrealized
appreciation
(depreciation) |
| Watsco, Inc. | 983 | 136,440 | 2,123 |
| WellCare Health Plans, Inc. | 18,601 | 2,853,579 | 127,782 |
| Wells Fargo & Co. | 17,377 | 935,578 | 19,462 |
| WESCO International, Inc. | 11,135 | 678,678 | (53,448) |
| West Pharmaceutical Services, Inc. | 7,768 | 714,889 | 99,042 |
| Western Digital Corp. | 1,102 | 98,155 | 5,776 |
| Western Union Co. (The) | 3,874 | 76,938 | 1,375 |
| WestRock Co. | 21,267 | 1,139,061 | 72,520 |
| Whirlpool Corp. | 4,817 | 894,421 | 80,588 |
| Woodward, Inc. | 11,699 | 791,671 | (12,635) |
| World Fuel Services Corp. | 19,029 | 700,838 | 23,339 |
| Worthington Industries, Inc. | 14,739 | 641,147 | 31,984 |
| Wyndham Worldwide Corp. | 9,325 | 888,766 | 69,844 |
| Xerox Corp. | 198,025 | 1,423,800 | 33,664 |
| Zions Bancorporation | 2,170 | 86,865 | (325) |
| Zynga, Inc., Class A | 50,050 | 144,645 | 5,506 |
| Total United States | | | 5,314,163 |
| Virgin Islands |
| Playtech Ltd. | 14,822 | 184,103 | 7,151 |
| Common Stocks Long Positions Total | 9,373,670 |
| |
| Short Positions |
| | | |
| Common Stocks |
| Bermuda |
| IHS Markit Ltd. | (26,832) | (1,164,509) | (20,661) |
| White Mountains Insurance Group Ltd. | (59) | (50,677) | 240 |
| XL Group Ltd. | (9,135) | (382,300) | (10,779) |
| Total Bermuda | | | (31,200) |
| Canada |
| Lions Gate Entertainment Corp., Class B | (7,205) | (171,839) | (2,234) |
| France |
| Accor SA | (57,442) | (2,618,307) | (230,283) |
| Aeroports de Paris | (9,581) | (1,277,959) | (84,987) |
| Air Liquide SA | (8,609) | (1,037,183) | (50,716) |
| Bollore SA | (296,886) | (1,207,891) | (85,509) |
| Bureau Veritas A | (17,294) | (400,597) | (30,258) |
| Carrefour SA | (5,494) | (129,417) | (9,703) |
| Short Positions |
| Description | Shares | Notional (1) | Net unrealized
appreciation
(depreciation) |
| Casino Guichard Perrachon SA | (20,903) | (1,259,161) | (133,258) |
| Danone SA | (4,324) | (302,296) | (5,898) |
| Edenred | (96,321) | (2,466,202) | (146,108) |
| Electricite de France SA | (131,590) | (1,098,852) | (49,374) |
| ENGIE | (12,234) | (172,578) | (4,357) |
| Essilor International | (12,898) | (1,671,222) | (92,232) |
| Eutelsat Communications SA | (37,673) | (891,738) | (26,967) |
| Groupe Eurotunnel SE | (185,664) | (2,039,628) | (152,534) |
| Hermes International | (89) | (42,579) | 940 |
| Iliad SA | (2,443) | (593,172) | (48,780) |
| Ingenico Group SA | (16,162) | (1,464,406) | (56,418) |
| JCDecaux SA | (22,888) | (807,419) | (30,703) |
| L’Oreal SA | (5,200) | (1,035,728) | (30,467) |
| Natixis | (90,984) | (633,008) | (103,777) |
| Numericable Group | (43,572) | (1,426,737) | (122,316) |
| Orpea | (7,445) | (760,378) | (47,939) |
| Pernod-Ricard SA | (5,816) | (727,617) | (21,233) |
| Remy Cointreau SA | (3,169) | (319,723) | (5,959) |
| Suez | (17,496) | (287,496) | (9,173) |
| Veolia Environnement SA | (55,363) | (1,051,752) | (40,905) |
| Vivendi | (26,825) | (532,251) | (23,893) |
| Zodiac Aerospace | (28,259) | (686,142) | 6,972 |
| Total France | | | (1,635,835) |
| Ireland |
| Adient PLC | (8,872) | (652,624) | (56,214) |
| Alkermes PLC | (21,969) | (1,279,694) | (34,715) |
| Allergan PLC | (3,027) | (738,164) | (23,399) |
| Pentair PLC | (4,173) | (269,200) | (5,008) |
| Weatherford International PLC | (514,514) | (2,968,746) | 76,680 |
| Willis Towers Watson PLC | (7,199) | (954,731) | (28,724) |
| Total Ireland | | | (71,380) |
| Jersey |
| Glencore PLC | (19,324) | (75,999) | (3,575) |
| Henderson Group PLC | (209,502) | (626,268) | (15,716) |
| Petrofac Ltd | (39,068) | (412,144) | 21,904 |
| Total Jersey | | | 2,613 |
The accompanying Notes to Financial Statements are an integral part of this statement.
| 40 | Multi-Manager Directional Alternative Strategies Fund | Annual Report 2017 |
Portfolio of Investments (continued)
April 30, 2017
| Short Positions |
| Description | Shares | Notional (1) | Net unrealized
appreciation
(depreciation) |
| Luxembourg |
| Eurofins Scientific SE | (2,232) | (1,099,198) | (105,888) |
| SES SA FDR | (32,641) | (713,783) | 46,692 |
| Total Luxembourg | | | (59,196) |
| Netherlands |
| Core Laboratories NV | (10,867) | (1,204,281) | 62,901 |
| Patheon NV | (13,125) | (353,194) | (18,238) |
| Sensata Technologies Holding NV | (51,090) | (2,103,886) | (38,317) |
| Total Netherlands | | | 6,346 |
| Spain |
| Abertis Infraestructuras SA | (2,821) | (49,628) | (285) |
| Atresmedia Corp. de Medios de Comunicacion SA | (21,620) | (271,539) | (2,339) |
| Bankia SA | (690,196) | (837,539) | (92,237) |
| Cellnex Telecom SA | (106,066) | (1,874,599) | (121,858) |
| Distribuidora Internacional de Alimentacion SA | (7,409) | (44,106) | (1,646) |
| Ferrovial SA | (68,832) | (1,464,708) | (45,761) |
| Grifols SA | (15,606) | (419,125) | (29,235) |
| Inditex | (37,919) | (1,454,355) | (63,558) |
| Red Electrica Corp. SA | (11,439) | (223,043) | 3,006 |
| Total Spain | | | (353,913) |
| United Kingdom |
| AA PLC | (234,697) | (794,298) | 15,684 |
| Aggreko PLC | (99,714) | (1,146,202) | (46,058) |
| Antofagasta PLC | (165,461) | (1,795,876) | (81,918) |
| ARRIS International PLC | (39,639) | (1,030,218) | 6,414 |
| Associated British Foods PLC | (31,744) | (1,155,326) | (47,144) |
| Atlassian Corp PLC | (18,054) | (622,502) | (54,180) |
| Balfour Beatty PLC | (74,953) | (283,277) | (10,641) |
| BP PLC | (56,490) | (323,759) | 4,629 |
| British American Tobacco PLC | (6,023) | (406,821) | 321 |
| BTG PLC | (45,778) | (403,480) | (35,997) |
| Capita PLC | (193,506) | (1,393,496) | (9,134) |
| Cobham PLC | (517,317) | (887,788) | 32,464 |
| ConvaTec Group PLC | (29,334) | (116,678) | (7,529) |
| Croda International PLC | (2,185) | (106,522) | (6,782) |
| Easyjet PLC | (20,100) | (304,071) | (29,385) |
| Short Positions |
| Description | Shares | Notional (1) | Net unrealized
appreciation
(depreciation) |
| Essentra PLC | (16,982) | (119,103) | (7,755) |
| Experian PLC | (2,133) | (45,833) | (2,519) |
| Halma PLC | (7,967) | (108,658) | (3,771) |
| Hargreaves Lansdown PLC | (96,516) | (1,722,603) | (88,743) |
| Hikma Pharmaceuticals PLC | (89,531) | (2,246,155) | (83,126) |
| IMI PLC | (24,783) | (410,545) | (30,161) |
| Inmarsat PLC | (167,474) | (1,773,257) | (2,955) |
| Intertek Group PLC | (12,655) | (666,448) | (26,200) |
| ITV PLC | (129,986) | (353,551) | 7,904 |
| John Wood Group PLC | (22,533) | (221,658) | 11,320 |
| Just Eat PLC | (182,474) | (1,363,683) | (46,526) |
| Liberty Global PLC, Class A | (19,252) | (681,906) | (20,985) |
| LivaNova PLC | (15,002) | (790,605) | (17,754) |
| Mediclinic International PLC | (185,635) | (1,973,966) | (211,972) |
| Meggitt PLC | (7,792) | (46,676) | (2,020) |
| Merlin Entertainments PLC, Registered Shares | (188,084) | (1,231,430) | (73,078) |
| NEX Group PLC | (9,235) | (73,621) | (4,528) |
| Nielsen Holdings PLC | (6,399) | (263,191) | 704 |
| Pennon Group PLC | (138,695) | (1,539,495) | 46,840 |
| Provident Financial PLC | (25,735) | (1,067,956) | (39,645) |
| Rotork PLC | (266,087) | (847,459) | 2,845 |
| Royal Bank of Scotland Group PLC | (339,546) | (1,167,175) | (187,230) |
| Royal Dutch Shell PLC, Class A | (70,936) | (1,839,822) | 27,481 |
| Schroders PLC | (5,685) | (234,665) | (11,303) |
| Serco Group PLC | (56,302) | (84,298) | (3,162) |
| Signet Jewelers Ltd. | (21,513) | (1,416,416) | 23,234 |
| St. James’s Place PLC | (37,304) | (554,669) | (46,309) |
| Tesco PLC | (526,742) | (1,250,197) | (58,121) |
| Thomas Cook Group PLC | (411,130) | (509,332) | (53,884) |
| United Utilities Group PLC | (127,574) | (1,608,551) | 33,286 |
| Vodafone Group PLC | (152,863) | (394,095) | (2,010) |
| Weir Group PLC (The) | (14,505) | (374,046) | (13,924) |
| Whitbread PLC | (11,170) | (583,759) | 9,479 |
| Worldpay Group PLC | (254,541) | (989,044) | (17,728) |
| Total United Kingdom | | | (1,161,572) |
The accompanying Notes to Financial Statements are an integral part of this statement.
Multi-Manager Directional Alternative Strategies Fund | Annual Report 2017
| 41 |
Portfolio of Investments (continued)
April 30, 2017
| Short Positions |
| Description | Shares | Notional (1) | Net unrealized
appreciation
(depreciation) |
| United States |
| 3D Systems Corp. | (22,079) | (349,511) | (19,655) |
| Acadia Healthcare Co., Inc. | (67,745) | (2,952,327) | (46,067) |
| ACI Worldwide, Inc. | (42,413) | (911,455) | (27,568) |
| Acuity Brands, Inc. | (7,521) | (1,324,448) | (7,747) |
| Advance Auto Parts, Inc. | (6,256) | (889,228) | (8,133) |
| AECOM Technology Corp. | (5,256) | (179,808) | (4,415) |
| Agios Pharmaceuticals, Inc. | (13,642) | (678,144) | 63,970 |
| Air Lease Corp. | (17,683) | (674,430) | (27,762) |
| Akorn, Inc. | (32,579) | (1,089,768) | (44,708) |
| Albemarle Corp | (524) | (57,069) | (2,243) |
| Align Technology Inc | (2,792) | (375,859) | (54,277) |
| Allegheny Technologies, Inc. | (83,299) | (1,528,537) | (118,642) |
| Alliance Data Systems Corp. | (4,752) | (1,186,242) | (52,842) |
| Alliant Energy Corp. | (7,567) | (297,534) | 4,238 |
| Allscripts Healthcare Solutions, Inc. | (39,271) | (470,074) | (393) |
| Alnylam Pharmaceuticals, Inc. | (18,790) | (1,007,144) | (51,719) |
| AMERCO | (552) | (206,702) | (6,668) |
| American Airlines Group, Inc. | (6,955) | (296,422) | 11,198 |
| AMETEK, Inc. | (3,183) | (182,068) | (10,281) |
| Amphenol Corp., Class A | (11,098) | (802,496) | (30,852) |
| Amtrust Financial Services | (22,798) | (365,908) | (10,715) |
| Antero Resources Corp. | (36,440) | (772,164) | 29,516 |
| AptarGroup, Inc. | (8,841) | (709,932) | (26,788) |
| Arch Capital Group Ltd. | (461) | (44,703) | (1,033) |
| Arconic, Inc. | (33,192) | (907,137) | (41,683) |
| Arista Networks, Inc. | (8,273) | (1,155,242) | (57,001) |
| Armstrong World Industries, Inc. | (23,576) | (1,102,178) | (31,828) |
| Arthur J Gallagher & Co. | (5,544) | (309,411) | 2,606 |
| Artisan Partners Asset Management, Inc., Class A | (14,194) | (415,884) | (16,323) |
| athenahealth, Inc. | (5,634) | (552,188) | 73,298 |
| Autodesk, Inc. | (6,141) | (553,120) | (25,055) |
| Avangrid, Inc. | (13,747) | (597,995) | 2,612 |
| Avis Budget Group, Inc. | (33,955) | (1,035,628) | (65,533) |
| Axalta Coating Systems Ltd. | (34,910) | (1,095,127) | (1,363) |
| Ball Corp. | (40,948) | (3,148,492) | (188,304) |
| Bank of the Ozarks, Inc. | (36,789) | (1,746,374) | 4,047 |
| Short Positions |
| Description | Shares | Notional (1) | Net unrealized
appreciation
(depreciation) |
| Biomarin Pharmaceutical, Inc. | (7,742) | (741,993) | (39,794) |
| Bio-Rad Laboratories, Inc., Class A | (1,808) | (394,614) | (26,017) |
| Bio-Techne Corp. | (3,507) | (375,530) | (20,726) |
| Black Hills Corp. | (19,068) | (1,297,005) | 440 |
| Blue Buffalo Pet Products, Inc. | (38,261) | (943,134) | (49,685) |
| Brookdale Senior Living, Inc. | (31,257) | (406,028) | (3,126) |
| Brown & Brown, Inc. | (3,258) | (139,768) | (3,160) |
| Brown-Forman Corp., Class B | (27,249) | (1,289,423) | (37,876) |
| Cabot Oil & Gas Corp | (12,353) | (287,084) | 11,460 |
| CalAtlantic Group, Inc. | (3,100) | (112,282) | 5,983 |
| Calpine Corp. | (62,122) | (633,644) | 40,379 |
| CarMax, Inc. | (15,731) | (920,264) | (37,282) |
| Carpenter Technology Corp | (1,355) | (55,013) | (7,669) |
| Caseys General Stores, Inc. | (4,720) | (528,970) | 897 |
| Catalent, Inc. | (21,298) | (623,605) | (25,345) |
| Cf Industries Holdings, Inc. | (58,795) | (1,572,178) | 45,272 |
| Charles Schwab Corp. (The) | (23,935) | (929,875) | (19,488) |
| Charter Communications, Inc., Class A | (2,692) | (929,171) | (39,842) |
| Cheniere Energy, Inc. | (41,417) | (1,878,261) | 57,155 |
| Chevron Corp. | (1,232) | (131,454) | (653) |
| Chipotle Mexican Grill, Inc. | (2,426) | (1,151,064) | (11,111) |
| Churchill Downs, Inc. | (1,419) | (236,689) | (13,906) |
| Ciena Corp. | (12,082) | (276,799) | (12,928) |
| Cincinnati Financial Corp. | (6,782) | (488,914) | (3,323) |
| Clean Harbors, Inc. | (17,273) | (1,003,734) | (10,709) |
| Cognex Corp. | (5,748) | (490,534) | (24,314) |
| Colfax Corp. | (4,150) | (167,951) | (5,146) |
| Compass Minerals International, Inc. | (17,680) | (1,166,880) | 12,069 |
| comScore, Inc. | (4,807) | (123,155) | 2,428 |
| Concho Resources, Inc. | (7,364) | (932,724) | 36,157 |
| Conduent, Inc. | (18,571) | (302,893) | (6,711) |
| CONSOL Energy, Inc. | (27,716) | (420,729) | 23,004 |
| Copart, Inc. | (21,690) | (670,221) | (21,256) |
| Costar Group, Inc. | (1,047) | (252,212) | (35,273) |
| Coty, Inc., Class A | (85,922) | (1,533,708) | 25,777 |
| Cousins Properties, Inc. | (81,556) | (692,410) | (2,813) |
| Covanta Holding Corp. | (91,009) | (1,324,181) | 77,358 |
| Cree, Inc. | (13,365) | (292,426) | 31,541 |
The accompanying Notes to Financial Statements are an integral part of this statement.
| 42 | Multi-Manager Directional Alternative Strategies Fund | Annual Report 2017 |
Portfolio of Investments (continued)
April 30, 2017
| Short Positions |
| Description | Shares | Notional (1) | Net unrealized
appreciation
(depreciation) |
| Cypress Semiconductor Corp. | (106,158) | (1,487,274) | (56,288) |
| Denbury Resources, Inc. | (103,727) | (230,274) | 7,261 |
| DENTSPLY SIRONA, Inc. | (12,654) | (800,239) | (10,503) |
| Dexcom, Inc. | (34,992) | (2,727,976) | (97,908) |
| Diebold, Inc. | (43,142) | (1,216,604) | 17,257 |
| Discovery Communications, Inc., Class A | (10,452) | (300,809) | (2,927) |
| Dominion Resources, Inc. | (34,845) | (2,698,048) | 17,771 |
| Dunkin’ Brands Group, Inc. | (3,945) | (220,368) | (8,127) |
| Dycom Industries Inc | (7,562) | (799,001) | (61,555) |
| Ecolab, Inc. | (5,765) | (744,204) | (21,158) |
| Energizer Holdings, Inc. | (4,834) | (286,318) | (435) |
| Envision Healthcare Corp | (38,100) | (2,134,743) | 125,504 |
| EOG Resources, Inc. | (2,163) | (200,078) | 6,082 |
| EQT Corp. | (6,932) | (403,026) | 31,055 |
| Factset Research Systems, Inc. | (3,907) | (637,857) | (8,478) |
| Fastenal Co. | (33,583) | (1,500,488) | 37,613 |
| FireEye, Inc. | (107,623) | (1,346,364) | (22,601) |
| First Data Corp., Class A | (124,755) | (1,948,673) | (83,586) |
| Fitbit, Inc., Class A | (89,929) | (514,394) | (18,609) |
| Fleetcor Technologies, Inc. | (1,408) | (198,725) | 4,506 |
| Flowers Foods, Inc. | (14,729) | (288,836) | (884) |
| Flowserve Corp. | (17,510) | (890,734) | (51,304) |
| FMC Corp. | (1,678) | (122,880) | 419 |
| FNB Corp. | (119,030) | (1,694,987) | (16,664) |
| Fossil Group, Inc. | (6,156) | (106,191) | (2,709) |
| Freeport-McMoRan Copper & Gold, Inc. | (75,242) | (959,336) | (425) |
| Frontier Communications Corp. | (163,089) | (306,607) | 10,228 |
| Gartner, Inc. | (4,612) | (526,183) | (14,989) |
| Genesee & Wyoming, Inc., Class A | (13,422) | (909,475) | (24,294) |
| Global Payments, Inc. | (15,730) | (1,286,085) | (50,021) |
| GoDaddy, Inc., Class A | (12,894) | (501,834) | (26,421) |
| Graco, Inc. | (2,185) | (235,652) | (31,136) |
| Granite Construction, Inc. | (10,852) | (572,009) | (2,822) |
| Groupon Inc | (12,638) | (49,541) | (3,412) |
| Guidewire Software, Inc. | (23,793) | (1,463,032) | (67,544) |
| Hain Celestial Group, Inc. (The) | (9,059) | (335,092) | 91 |
| Halyard Health, Inc. | (22,413) | (885,314) | (43,257) |
| Hanesbrands, Inc. | (25,888) | (564,617) | (12,426) |
| Short Positions |
| Description | Shares | Notional (1) | Net unrealized
appreciation
(depreciation) |
| HealthSouth Corp. | (8,070) | (378,483) | (25,259) |
| HEICO Corp. | (19,883) | (1,413,085) | (58,814) |
| Helmerich & Payne | (10,376) | (629,201) | 68,269 |
| Hertz Global Holdings, Inc. | (31,203) | (514,537) | (17,634) |
| Hertz Global Holdings, Inc. | (4,398) | (199,977) | 7,908 |
| Hess Corp. | (23,959) | (1,169,918) | 13,896 |
| Hormel Foods Corp. | (5,146) | (180,522) | (3,191) |
| Howard Hughes Corp. (The) | (4,958) | (610,379) | (4,908) |
| Idex Corp. | (467) | (48,923) | (5,371) |
| Illumina, Inc. | (10,245) | (1,893,891) | (106,900) |
| Inovalon Holdings, Inc. | (4,847) | (59,376) | (1,939) |
| International Flavors & Fragrances, Inc. | (2,734) | (378,905) | (15,228) |
| IPG Photonics Corp. | (7,992) | (1,009,549) | (67,612) |
| JCPenney Co., Inc. | (22,069) | (118,731) | 6,841 |
| Juno Therapeutics, Inc. | (13,842) | (345,219) | (9,551) |
| KBR, Inc. | (18,662) | (262,201) | 15,288 |
| Kirby Corp. | (3,238) | (228,603) | (9,714) |
| KLX, Inc. | (31,229) | (1,477,132) | (18,737) |
| Knowles Corp. | (59,197) | (1,049,563) | 70,444 |
| Kosmos Energy Ltd. | (183,253) | (1,101,351) | 11,043 |
| Kraft Heinz Co. (The) | (7,012) | (633,815) | 8,344 |
| L Brands, Inc. | (7,462) | (394,068) | (37,235) |
| Laredo Petroleum, Inc. | (25,129) | (323,159) | 39,704 |
| LaSalle Hotel Properties | (5,793) | (165,448) | 2,201 |
| Lennar Corp., Class A | (8,978) | (453,389) | 16,609 |
| Liberty Broadband Corp. | (1,075) | (97,997) | (4,504) |
| Liberty Expedia Holdings, Inc., Class A | (6,525) | (315,223) | (9,396) |
| Lifepoint Hospitals, Inc. | (12,514) | (777,745) | 17,207 |
| Live Nation Entertainment, Inc. | (5,111) | (164,370) | (6,491) |
| Loews Corp. | (6,583) | (306,899) | (922) |
| Macquarie Infrastructure Corp. | (16,356) | (1,330,888) | (35,772) |
| Madison Square Garden Co. (The), Class A | (6,875) | (1,387,169) | (12,375) |
| Markel Corp. | (1,670) | (1,619,232) | 668 |
| Mattel, Inc. | (19,949) | (447,257) | 56,256 |
| Maximus, Inc. | (4,921) | (300,132) | (12,204) |
| McCormick & Co., Inc. | (5,619) | (561,338) | 1,180 |
| MDU Resources Group, Inc. | (1,588) | (42,717) | 730 |
The accompanying Notes to Financial Statements are an integral part of this statement.
Multi-Manager Directional Alternative Strategies Fund | Annual Report 2017
| 43 |
Portfolio of Investments (continued)
April 30, 2017
| Short Positions |
| Description | Shares | Notional (1) | Net unrealized
appreciation
(depreciation) |
| Mednax, Inc. | (20,814) | (1,256,333) | 158,811 |
| MercadoLibre Inc | (693) | (158,635) | (5,842) |
| Mercury General Corp. | (13,851) | (851,698) | (27,286) |
| Microchip Technology, Inc. | (3,689) | (278,815) | (9,444) |
| Middleby Corp. | (11,355) | (1,545,756) | (17,033) |
| Monolithic Power Systems Inc | (530) | (48,495) | (572) |
| Moody’s Corp. | (1,325) | (156,774) | (5,366) |
| Motorola Solutions Inc | (5,987) | (514,702) | (17,302) |
| National Fuel Gas Co. | (15,036) | (832,694) | (28,228) |
| National Instruments Corp. | (24,080) | (840,633) | (62,608) |
| National Oilwell Varco, Inc. | (9,340) | (326,620) | 24,191 |
| Netflix, Inc. | (3,004) | (457,209) | (14,870) |
| Netscout Systems, Inc. | (38,290) | (1,441,619) | (40,205) |
| Neurocrine Biosciences, Inc. | (15,865) | (847,191) | 14,596 |
| New Jersey Resources Corp. | (32,273) | (1,302,216) | (16,137) |
| Newell Rubbermaid, Inc. | (14,222) | (678,958) | (21,316) |
| Newfield Exploration Co. | (14,393) | (498,286) | 19,143 |
| Noble Corp. PLC | (44,459) | (213,403) | 30,677 |
| Noble Energy, Inc. | (12,251) | (396,075) | 37,121 |
| Norwegian Cruise Line Holdings Ltd. | (20,068) | (1,082,267) | (99,738) |
| NOW, Inc. | (37,395) | (636,089) | (6,731) |
| NRG Energy, Inc. | (86,536) | (1,462,458) | 134,131 |
| NuVasive, Inc. | (7,922) | (574,424) | 1,901 |
| Occidental Petroleum Corp. | (6,006) | (369,609) | 14,955 |
| Office Depot, Inc. | (9,297) | (46,206) | (2,549) |
| OGE Energy Corp. | (20,833) | (724,572) | (2,708) |
| Olin Corp. | (24,022) | (771,827) | (41,558) |
| OneMain Holdings, Inc. | (12,834) | (299,289) | 4,620 |
| ONEOK, Inc. | (35,941) | (1,890,856) | 64,694 |
| OPKO Health, Inc. | (37,175) | (288,850) | (11,524) |
| Owens-Illinois, Inc. | (54,348) | (1,185,873) | (87,500) |
| PacWest Bancorp | (11,778) | (581,715) | (16,843) |
| Palo Alto Networks, Inc. | (14,480) | (1,569,777) | 21,141 |
| Pandora Media, Inc. | (142,190) | (1,542,762) | (21,095) |
| Paramount Group, Inc. | (10,369) | (170,052) | 8,399 |
| Parsley Energy, Inc. | (27,510) | (819,523) | 40,715 |
| Patterson Cos, Inc. | (18,221) | (810,652) | (11,115) |
| Patterson-UTI Energy, Inc. | (9,946) | (215,281) | 20,041 |
| Short Positions |
| Description | Shares | Notional (1) | Net unrealized
appreciation
(depreciation) |
| Pbf Energy, Inc. | (15,702) | (350,469) | (23,553) |
| Penske Automotive Group, Inc. | (4,350) | (207,539) | (11,484) |
| People’s United Financial, Inc. | (15,555) | (271,746) | 778 |
| Perrigo Co. PLC | (8,611) | (636,697) | (52,097) |
| Platform Specialty Products Corp. | (118,888) | (1,684,643) | (153,366) |
| Pnm Resources, Inc. | (24,928) | (928,568) | 18,696 |
| Post Holdings, Inc. | (14,116) | (1,188,426) | 51,806 |
| Premier, Inc. | (36,915) | (1,247,727) | (40,237) |
| Prestige Brands Holdings, Inc. | (16,801) | (964,545) | (15,289) |
| Priceline Group Inc/The | (26) | (48,017) | (1,981) |
| Primerica, Inc. | (5,133) | (430,145) | (4,876) |
| Principal Financial Group, Inc. | (1,051) | (68,452) | (2,628) |
| ProAssurance Corp. | (1,114) | (68,957) | (2,005) |
| PTC, Inc. | (7,939) | (429,103) | (12,623) |
| Qorvo, Inc. | (10,939) | (744,180) | 11,377 |
| Range Resources Corp | (7,245) | (191,920) | 9,998 |
| Realogy Holdings Corp. | (2,041) | (62,353) | (4,449) |
| Regeneron Pharmaceuticals, Inc. | (761) | (295,641) | (17,236) |
| RenaissanceRe Holdings Ltd. | (1,941) | (275,952) | (2,717) |
| ResMed, Inc. | (6,063) | (412,223) | 7,639 |
| RH | (4,575) | (219,463) | (4,804) |
| Rice Energy Inc | (16,511) | (351,519) | 26,748 |
| Rockwell Collins, Inc. | (6,006) | (625,165) | (39,099) |
| Rollins, Inc. | (22,828) | (886,411) | (46,797) |
| Roper Technologies, Inc. | (10,856) | (2,374,207) | (122,239) |
| RR Donnelley & Sons Co. | (10,214) | (128,390) | (11,485) |
| Sabre Corp. | (36,008) | (842,947) | (52,572) |
| Salesforce.com, Inc. | (17,988) | (1,549,127) | (34,537) |
| Sally Beauty Holdings, Inc. | (5,897) | (112,161) | 5,130 |
| SBA Communications Corp. | (12,757) | (1,613,633) | (19,391) |
| Schlumberger Ltd. | (5,326) | (386,614) | 30,092 |
| Scotts Miracle-Gro Co. (The), Class A | (1,694) | (163,640) | (3,371) |
| Seattle Genetics, Inc. | (5,720) | (390,676) | (10,010) |
| Sempra Energy | (10,618) | (1,200,046) | (8,070) |
| Service Corp. International | (5,611) | (180,786) | (6,845) |
| ServiceNow, Inc. | (8,955) | (846,068) | (72,267) |
| Silgan Holdings, Inc. | (3,039) | (184,224) | (6,655) |
| Six Flags Entertainment Corp. | (7,283) | (455,989) | (20,465) |
The accompanying Notes to Financial Statements are an integral part of this statement.
| 44 | Multi-Manager Directional Alternative Strategies Fund | Annual Report 2017 |
Portfolio of Investments (continued)
April 30, 2017
| Short Positions |
| Description | Shares | Notional (1) | Net unrealized
appreciation
(depreciation) |
| SM Energy Co. | (14,198) | (320,733) | 8,234 |
| Snyders-Lance, Inc. | (60,191) | (2,122,335) | (90,287) |
| Sotheby’s | (10,492) | (496,901) | (29,152) |
| Southern Co. (The) | (14,943) | (744,161) | (299) |
| Splunk, Inc. | (18,901) | (1,215,523) | (78,817) |
| Sprint Corp. | (6,738) | (60,844) | (4,245) |
| Sprouts Farmers Market, Inc. | (66,889) | (1,492,294) | 42,140 |
| Square, Inc., Class A | (67,903) | (1,238,551) | (78,768) |
| SS&C Technologies Holdings, Inc. | (40,355) | (1,482,643) | (33,495) |
| Stericycle, Inc. | (15,423) | (1,316,199) | (36,861) |
| Stifel Financial Corp. | (12,653) | (618,352) | (29,482) |
| Superior Energy Services, Inc. | (61,523) | (743,198) | 95,846 |
| Tableau Software, Inc., Class A | (8,661) | (464,922) | (22,605) |
| Targa Resources Corp. | (16,303) | (898,784) | 44,670 |
| Tenet Healthcare Corp. | (4,843) | (75,890) | 1,986 |
| Tesla Motors, Inc. | (2,244) | (704,773) | (29,052) |
| Tiffany & Co. | (4,638) | (425,073) | (603) |
| T-Mobile USA, Inc. | (4,770) | (320,878) | (11,114) |
| Tractor Supply Co. | (1,153) | (71,382) | 1,891 |
| TransDigm Group, Inc. | (9,328) | (2,301,497) | (69,960) |
| TransUnion | (10,574) | (423,277) | (15,015) |
| TreeHouse Foods, Inc. | (28,015) | (2,454,114) | 65,555 |
| Tri Pointe Homes, Inc. | (83,695) | (1,042,003) | (9,396) |
| Trimble, Inc. | (1,414) | (50,098) | (6,575) |
| TripAdvisor, Inc. | (29,321) | (1,319,738) | (95,000) |
| Triumph Group, Inc. | (17,796) | (466,255) | (12,457) |
| Twitter, Inc. | (56,220) | (926,506) | (116,705) |
| Tyler Technologies, Inc. | (8,974) | (1,468,057) | (73,587) |
| Ultimate Software Group, Inc. | (7,566) | (1,533,401) | (9,722) |
| Under Armour, Inc., Class A | (10,885) | (233,919) | (26,258) |
| United Natural Foods, Inc. | (11,873) | (493,086) | 7,836 |
| Uniti Group Inc | (16,674) | (457,868) | (9,728) |
| USG Corp. | (1,444) | (43,753) | 1,776 |
| Valley National Bancorp | (29,740) | (349,742) | (6,840) |
| Short Positions |
| Description | Shares | Notional (1) | Net unrealized
appreciation
(depreciation) |
| Varex Imaging Corp. | (2,491) | (83,598) | 1,096 |
| Veeva Systems Inc., Class A | (12,036) | (645,370) | (35,221) |
| VEREIT, Inc. | (52,122) | (436,261) | 27,103 |
| VeriFone Systems, Inc. | (53,268) | (987,589) | (53,715) |
| VeriSign Inc | (3,071) | (273,073) | (246) |
| VF Corp. | (1,901) | (103,852) | 779 |
| Viasat, Inc. | (22,678) | (1,452,072) | (32,172) |
| Vista Outdoor Inc | (9,606) | (187,893) | (4,806) |
| WABCO Holdings, Inc. | (2,775) | (329,864) | (15,512) |
| Wabtec Corp. | (13,484) | (1,131,173) | (39,758) |
| Webster Financial Corp. | (15,769) | (801,223) | (42,261) |
| Welbilt Inc | (50,108) | (1,027,214) | (72,657) |
| Wendy’s Co. (The) | (11,816) | (174,168) | (14,416) |
| Wex, Inc. | (4,190) | (425,117) | 10,391 |
| Whiting Petroleum Corp. | (11,198) | (92,943) | 4,255 |
| Whole Foods Market, Inc. | (8,931) | (324,820) | (16,522) |
| Williams-Sonoma Inc | (3,001) | (162,204) | 210 |
| WisdomTree Investments, Inc. | (146,619) | (1,224,269) | (7,331) |
| Workday, Inc., Class A | (18,771) | (1,640,585) | (68,326) |
| WPX Energy, Inc. | (36,273) | (432,737) | 36,273 |
| WR Berkley Corp. | (13,135) | (892,917) | 13,004 |
| Wynn Resorts Ltd. | (16,644) | (2,047,378) | (139,310) |
| Yahoo!, Inc. | (6,948) | (334,963) | (5,697) |
| Yelp Inc | (7,924) | (280,589) | (21,480) |
| Zayo Group Holdings, Inc. | (58,681) | (2,057,943) | (27,621) |
| Zebra Technologies Corp., Class A | (9,854) | (928,937) | (53,113) |
| Zillow Group, Inc., Class C | (29,756) | (1,160,484) | (113,775) |
| Total United States | | | (3,396,446) |
| Common Stocks Short Positions Total | (6,702,817) |
| Total of Long and Short Positions | 2,670,853 |
| Net Cash and Other Receivable/(Payables)(2) | | | (391,317) |
| Swaps, at Value | 2,279,536 |
| (1) | The notional amounts of the positions held in the total return basket swap represent the market values (including any fees or commissions) of the long and short positions when they are established. The total return basket swap is valued daily, and the change in value is recorded as unrealized appreciation (depreciation). Payments received or made are recorded as realized gains (losses). |
| (2) | Net cash and other receivables (payables) includes gains (losses) which will be paid upon the swap reset. |
The accompanying Notes to Financial Statements are an integral part of this statement.
Multi-Manager Directional Alternative Strategies Fund | Annual Report 2017
| 45 |
Portfolio of Investments (continued)
April 30, 2017
Notes to Portfolio of Investments
| (a) | Non-income producing investment. |
| (b) | This security or a portion of this security has been pledged as collateral in connection with securities sold short. |
| (c) | Represents privately placed and other securities and instruments exempt from SEC registration (collectively, private placements), such as Section 4(a)(2) and Rule 144A eligible securities, which are often sold only to qualified institutional buyers. The Fund may invest in private placements determined to be liquid as well as those determined to be illiquid. Private placements may be determined to be liquid under guidelines established by the Fund’s Board of Trustees. At April 30, 2017, the value of these securities amounted to $3,368,541 or 0.32% of net assets. |
| (d) | The rate shown is the seven-day current annualized yield at April 30, 2017. |
| (e) | As defined in the Investment Company Act of 1940, an affiliated company is one in which the Fund owns 5% or more of the company’s outstanding voting securities, or a company which is under common ownership or control with the Fund. Holdings and transactions in these affiliated companies during the year ended April 30, 2017 are as follows: |
| Issuer | Beginning
shares | Shares
purchased | Shares
sold | Ending
shares | Realized gain
(loss) ($) | Dividends —
affiliated
issuers($) | Value ($) |
| Columbia Short-Term Cash Fund, 0.869% | 20,000 | 1,085,604,348 | 898,525,954 | 187,098,394 | (440) | 628,459 | 187,098,394 |
| (f) | Represents fair value as determined in good faith under procedures approved by the Board of Trustees. At April 30, 2017, the value of these securities amounted to $(10,569), which represents less than 0.01% of net assets. |
Abbreviation Legend
| ADR | American Depositary Receipt |
| SDR | Swedish Depositary Receipt |
Currency Legend
| AUD | Australian Dollar |
| CAD | Canada Dollar |
| CHF | Swiss Franc |
| DKK | Danish Krone |
| EUR | Euro |
| GBP | British Pound |
| HKD | Hong Kong Dollar |
| ILS | New Israeli Sheqel |
| JPY | Japanese Yen |
| NOK | Norwegian Krone |
| NZD | New Zealand Dollar |
| SEK | Swedish Krona |
| SGD | Singapore Dollar |
| USD | US Dollar |
Fair value measurements
The Fund categorizes its fair value measurements according to a three-level hierarchy that maximizes the use of observable inputs and minimizes the use of unobservable inputs by prioritizing that the most observable input be used when available. Observable inputs are those that market participants would use in pricing an investment based on market data obtained from sources independent of the reporting entity. Unobservable inputs are those that reflect the Fund’s assumptions about the information market participants would use in pricing an investment. An investment’s level within the fair value hierarchy is based on the lowest level of any input that is deemed significant to the asset’s or liability’s fair value measurement. The input levels are not necessarily an indication of the risk or liquidity associated with investments at that level. For example, certain U.S. government securities are generally high quality and liquid, however, they are reflected as Level 2 because the inputs used to determine fair value may not always be quoted prices in an active market.
Fair value inputs are summarized in the three broad levels listed below:
| • | Level 1 – Valuations based on quoted prices for investments in active markets that the Fund has the ability to access at the measurement date (including NAV for open-end mutual funds). Valuation adjustments are not applied to Level 1 investments. |
| • | Level 2 – Valuations based on other significant observable inputs (including quoted prices for similar securities, interest rates, prepayment speeds, credit risks, etc.). |
| • | Level 3 – Valuations based on significant unobservable inputs (including the Fund’s own assumptions and judgment in determining the fair value of investments). |
The accompanying Notes to Financial Statements are an integral part of this statement.
| 46 | Multi-Manager Directional Alternative Strategies Fund | Annual Report 2017 |
Portfolio of Investments (continued)
April 30, 2017
Fair value measurements (continued)
Inputs that are used in determining fair value of an investment may include price information, credit data, volatility statistics, and other factors. These inputs can be either observable or unobservable. The availability of observable inputs can vary between investments, and is affected by various factors such as the type of investment, and the volume and level of activity for that investment or similar investments in the marketplace. The inputs will be considered by the Investment Manager, along with any other relevant factors in the calculation of an investment’s fair value. The Fund uses prices and inputs that are current as of the measurement date, which may include periods of market dislocations. During these periods, the availability of prices and inputs may be reduced for many investments. This condition could cause an investment to be reclassified between the various levels within the hierarchy.
Foreign equity securities actively traded in markets where there is a significant delay in the local close relative to the New York Stock Exchange are classified as Level 2. The values of these securities may include an adjustment to reflect the impact of significant market movements following the close of local trading, as described in Note 2 to the financial statements – Security valuation.
Certain investments that have been measured at fair value using the net asset value (NAV) per share (or its equivalent) are not categorized in the fair value hierarchy. The fair value amounts presented in the table are intended to reconcile the fair value hierarchy to the amounts presented in the Portfolio of Investments. The Columbia Short-Term Cash Fund seeks to provide shareholders with maximum current income consistent with liquidity and stability of principal. Columbia Short-Term Cash Fund prices its shares with a floating NAV and no longer seeks to maintain a stable NAV.
Investments falling into the Level 3 category are primarily supported by quoted prices from brokers and dealers participating in the market for those investments. However, these may be classified as Level 3 investments due to lack of market transparency and corroboration to support these quoted prices. Additionally, valuation models may be used as the pricing source for any remaining investments classified as Level 3. These models may rely on one or more significant unobservable inputs and/or significant assumptions by the Investment Manager. Inputs used in valuations may include, but are not limited to, financial statement analysis, capital account balances, discount rates and estimated cash flows, and comparable company data.
Under the direction of the Fund’s Board of Trustees (the Board), the Investment Manager’s Valuation Committee (the Committee) is responsible for overseeing the valuation procedures approved by the Board. The Committee consists of voting and non-voting members from various groups within the Investment Manager’s organization, including operations and accounting, trading and investments, compliance, risk management and legal.
The Committee meets at least monthly to review and approve valuation matters, which may include a description of specific valuation determinations, data regarding pricing information received from approved pricing vendors and brokers and the results of Board-approved valuation control policies and procedures (the Policies). The Policies address, among other things, instances when market quotations are or are not readily available, including recommendations of third party pricing vendors and a determination of appropriate pricing methodologies; events that require specific valuation determinations and assessment of fair value techniques; securities with a potential for stale pricing, including those that are illiquid, restricted, or in default; and the effectiveness of third party pricing vendors, including periodic reviews of vendors. The Committee meets more frequently, as needed, to discuss additional valuation matters, which may include the need to review back-testing results, review time-sensitive information or approve related valuation actions. The Committee reports to the Board, with members of the Committee meeting with the Board at each of its regularly scheduled meetings to discuss valuation matters and actions during the period, similar to those described earlier.
For investments categorized as Level 3, the Committee monitors information similar to that described above, which may include: (i) data specific to the issuer or comparable issuers, (ii) general market or specific sector news and (iii) quoted prices and specific or similar security transactions. The Committee considers this data and any changes from prior periods in order to assess the reasonableness of observable and unobservable inputs, any assumptions or internal models used to value those securities and changes in fair value. This data is also used to corroborate, when available, information received from approved pricing vendors and brokers. Various factors impact the frequency of monitoring this information (which may occur as often as daily). However, the Committee may determine that changes to inputs, assumptions and models are not required as a result of the monitoring procedures performed.
The following table is a summary of the inputs used to value the Fund’s investments at April 30, 2017:
| | Level 1
quoted prices
in active
markets for
identical
assets ($) | Level 2
other
significant
observable
inputs ($) | Level 3
significant
unobservable
inputs ($) | Investments
measured at
net asset
value ($) | Total ($) |
| Investments | | | | | |
| Common Stocks | | | | | |
| Consumer Discretionary | 52,331,096 | 9,885,807 | — | — | 62,216,903 |
| Consumer Staples | 18,448,704 | 16,246,880 | — | — | 34,695,584 |
| Energy | 27,908,320 | 8,713,058 | — | — | 36,621,378 |
| Financials | 109,189,476 | 14,883,895 | — | — | 124,073,371 |
| Health Care | 128,746,084 | 20,009,594 | — | — | 148,755,678 |
| Industrials | 48,136,290 | 31,662,411 | — | — | 79,798,701 |
| Information Technology | 146,861,568 | 23,696,843 | — | — | 170,558,411 |
| Materials | 27,788,829 | 30,511,230 | — | — | 58,300,059 |
| Real Estate | 3,287,899 | 13,027,198 | — | — | 16,315,097 |
The accompanying Notes to Financial Statements are an integral part of this statement.
Multi-Manager Directional Alternative Strategies Fund | Annual Report 2017
| 47 |
Portfolio of Investments (continued)
April 30, 2017
Fair value measurements (continued)
| | Level 1
quoted prices
in active
markets for
identical
assets ($) | Level 2
other
significant
observable
inputs ($) | Level 3
significant
unobservable
inputs ($) | Investments
measured at
net asset
value ($) | Total ($) |
| Telecommunication Services | 2,029,523 | 23,371,467 | — | — | 25,400,990 |
| Utilities | 8,050,430 | 4,914,682 | — | — | 12,965,112 |
| Total Common Stocks | 572,778,219 | 196,923,065 | — | — | 769,701,284 |
| Limited Partnerships | | | | | |
| Energy | 6,222,771 | — | — | — | 6,222,771 |
| Preferred Stocks | | | | | |
| Consumer Discretionary | — | 167,759 | — | — | 167,759 |
| Money Market Funds | — | — | — | 187,098,394 | 187,098,394 |
| Total Investments | 579,000,990 | 197,090,824 | — | 187,098,394 | 963,190,208 |
| Investments Sold Short | | | | | |
| Common Stocks | | | | | |
| Consumer Discretionary | (31,532,673) | (26,125,859) | — | — | (57,658,532) |
| Consumer Staples | (10,234,456) | (7,274,210) | — | — | (17,508,666) |
| Energy | (40,076,501) | (12,164,058) | — | — | (52,240,559) |
| Financials | (31,938,365) | (20,966,972) | — | — | (52,905,337) |
| Health Care | (19,372,944) | (6,768,990) | — | — | (26,141,934) |
| Industrials | (15,011,439) | (12,427,599) | (10,569) | — | (27,449,607) |
| Information Technology | (37,359,039) | (15,772,103) | — | — | (53,131,142) |
| Materials | (12,664,725) | (9,733,751) | — | — | (22,398,476) |
| Real Estate | (17,800,423) | (5,755,928) | — | — | (23,556,351) |
| Telecommunication Services | (4,705,199) | (3,283,590) | — | — | (7,988,789) |
| Utilities | (1,011,221) | (1,512,443) | — | — | (2,523,664) |
| Total Common Stocks | (221,706,985) | (121,785,503) | (10,569) | — | (343,503,057) |
| Preferred Stocks | | | | | |
| Consumer Discretionary | — | (1,509,690) | — | — | (1,509,690) |
| Health Care | — | (748,465) | — | — | (748,465) |
| Total Preferred Stocks | — | (2,258,155) | — | — | (2,258,155) |
| Total Investments Sold Short | (221,706,985) | (124,043,658) | (10,569) | — | (345,761,212) |
| Total Investments, Net of Investments Sold Short | 357,294,005 | 73,047,166 | (10,569) | 187,098,394 | 617,428,996 |
| Derivatives | | | | | |
| Asset | | | | | |
| Forward Foreign Currency Exchange Contracts | — | 1,114,613 | — | — | 1,114,613 |
| Futures Contracts | 1,648,555 | 81,269 | — | — | 1,729,824 |
| Swap Contracts | — | 3,495,892 | — | — | 3,495,892 |
| Liability | | | | | |
| Forward Foreign Currency Exchange Contracts | — | (289,014) | — | — | (289,014) |
| Futures Contracts | (167,787) | — | — | — | (167,787) |
| Swap Contracts | — | (265,965) | — | — | (265,965) |
| Total | 358,774,773 | 77,183,961 | (10,569) | 187,098,394 | 623,046,559 |
See the Portfolio of Investments for all investment classifications not indicated in the table.
The Fund’s assets assigned to the Level 2 input category are generally valued using the market approach, in which a security’s value is determined through reference to prices and information from market transactions for similar or identical assets. These assets include certain foreign securities for which a third party statistical pricing service may be employed for purposes of fair market valuation. The model utilized by such third party statistical pricing service takes into account a security’s correlation to available market data including, but not limited to, intraday index, ADR, and exchange-traded fund movements.
Derivative instruments are valued at unrealized appreciation (depreciation).
There were no transfers of financial assets between levels during the period.
The Fund does not hold any significant investments (greater than one percent of net assets) categorized as Level 3.
The accompanying Notes to Financial Statements are an integral part of this statement.
| 48 | Multi-Manager Directional Alternative Strategies Fund | Annual Report 2017 |
Portfolio of Investments (continued)
April 30, 2017
Fair value measurements (continued)
The Fund’s assets assigned to the Level 3 category are valued utilizing the valuation technique deemed the most appropriate in the circumstances. Certain common stocks classified as Level 3 are valued using an income approach. To determine fair value for these securities, management considered estimates of future distributions from the company assets or potential actions related to the respective company’s restructuring. Significant increases (decreases) to any of these inputs would result in a significantly lower (higher) fair value measurement.
The accompanying Notes to Financial Statements are an integral part of this statement.
Multi-Manager Directional Alternative Strategies Fund | Annual Report 2017
| 49 |
Statement of Assets and Liabilities
April 30, 2017
| Assets | |
| Investments, at cost | |
| Unaffiliated issuers, at cost | $715,589,022 |
| Affiliated issuers, at cost | 187,097,891 |
| Total investments, at cost | 902,686,913 |
| Investments, at value | |
| Unaffiliated issuers, at value | 776,091,814 |
| Affiliated issuers, at value | 187,098,394 |
| Total investments, at value | 963,190,208 |
| Cash | 410,720 |
| Foreign currency (identified cost $484,747) | 482,807 |
| Cash collateral held at broker | 431,507,819 |
| Margin deposits | 7,542,397 |
| Unrealized appreciation on forward foreign currency exchange contracts | 1,114,613 |
| Unrealized appreciation on swap contracts | 3,495,892 |
| Receivable for: | |
| Investments sold | 5,772,249 |
| Capital shares sold | 1,897,713 |
| Dividends | 1,331,990 |
| Foreign tax reclaims | 147,565 |
| Variation margin | 55,817 |
| Expense reimbursement due from Investment Manager | 76,793 |
| Trustees’ deferred compensation plan | 1,312 |
| Other assets | 33,078 |
| Total assets | 1,417,060,973 |
| Liabilities | |
| Securities sold short, at value (proceeds $321,390,570) | 345,761,212 |
| Unrealized depreciation on forward foreign currency exchange contracts | 289,014 |
| Unrealized depreciation on swap contracts | 265,965 |
| Payable for: | |
| Investments purchased | 11,196,366 |
| Capital shares purchased | 4,820,887 |
| Dividends and interest on securities sold short | 328,019 |
| Variation margin | 359,149 |
| Due to broker | 1,674,032 |
| Management services fees | 46,228 |
| Distribution and/or service fees | 13 |
| Transfer agent fees | 242,340 |
| Compensation of chief compliance officer | 39 |
| Other expenses | 185,559 |
| Trustees’ deferred compensation plan | 1,312 |
| Total liabilities | 365,170,135 |
| Net assets applicable to outstanding capital stock | $1,051,890,838 |
| Represented by | |
| Paid in capital | 988,833,098 |
| Undistributed net investment income | 4,886,041 |
| Accumulated net realized gain | 15,898,857 |
| Unrealized appreciation (depreciation) on: | |
| Investments - unaffiliated issuers | 60,502,792 |
| Investments - affiliated issuers | 503 |
| Foreign currency translations | 522,626 |
| Forward foreign currency exchange contracts | 825,599 |
| Futures contracts | 1,562,037 |
| Securities sold short | (24,370,642) |
| Swap contracts | 3,229,927 |
| Total - representing net assets applicable to outstanding capital stock | $1,051,890,838 |
The accompanying Notes to Financial Statements are an integral part of this statement.
| 50 | Multi-Manager Directional Alternative Strategies Fund | Annual Report 2017 |
Statement of Assets and Liabilities (continued)
April 30, 2017
| Class A | |
| Net assets | $1,939,247 |
| Shares outstanding | 182,540 |
| Net asset value per share | $10.62 |
| Class Z | |
| Net assets | $1,049,951,591 |
| Shares outstanding | 99,033,378 |
| Net asset value per share | $10.60 |
The accompanying Notes to Financial Statements are an integral part of this statement.
Multi-Manager Directional Alternative Strategies Fund | Annual Report 2017
| 51 |
Statement of Operations
Year Ended April 30, 2017
| Net investment income | |
| Income: | |
| Dividends — unaffiliated issuers | $8,557,793 |
| Dividends — affiliated issuers | 628,459 |
| Foreign taxes withheld | (275,480) |
| Total income | 8,910,772 |
| Expenses: | |
| Management services fees | 8,637,630 |
| Distribution and/or service fees | |
| Class A(a) | 1,061,513 |
| Transfer agent fees | |
| Class A(a) | 1,418,532 |
| Class Z(b) | 362,494 |
| Compensation of board members | 13,256 |
| Custodian fees | 128,176 |
| Printing and postage fees | 224,422 |
| Registration fees | 300,472 |
| Audit fees | 68,538 |
| Legal fees | 13,699 |
| Dividends and interest on securities sold short | 2,940,558 |
| Compensation of chief compliance officer | 271 |
| Other | 50,988 |
| Total expenses | 15,220,549 |
| Fees waived or expenses reimbursed by Investment Manager and its affiliates | (268,331) |
| Total net expenses | 14,952,218 |
| Net investment loss | (6,041,446) |
| Realized and unrealized gain (loss) — net | |
| Net realized gain (loss) on: | |
| Investments — unaffiliated issuers | 16,800,401 |
| Investments — affiliated issuers | (440) |
| Foreign currency translations | (722,947) |
| Forward foreign currency exchange contracts | (1,571,097) |
| Futures contracts | 16,068,776 |
| Options contracts written | 301,936 |
| Securities sold short | (17,093,817) |
| Swap contracts | 13,695,535 |
| Net realized gain | 27,478,347 |
| Net change in unrealized appreciation (depreciation) on: | |
| Investments — unaffiliated issuers | 60,502,792 |
| Investments — affiliated issuers | 503 |
| Foreign currency translations | 522,626 |
| Forward foreign currency exchange contracts | 825,599 |
| Futures contracts | 1,562,037 |
| Securities sold short | (24,370,642) |
| Swap contracts | 3,229,927 |
| Net change in unrealized appreciation (depreciation) | 42,272,842 |
| Net realized and unrealized gain | 69,751,189 |
| Net increase in net assets resulting from operations | $63,709,743 |
| (a) | Class A shares are based on operations from October 17, 2016 (commencement of operations) through the stated period end. |
| (b) | Class Z shares are based on operations from January 3, 2017 (commencement of operations) through the stated period end. |
The accompanying Notes to Financial Statements are an integral part of this statement.
| 52 | Multi-Manager Directional Alternative Strategies Fund | Annual Report 2017 |
Statement of Changes in Net Assets
| | Year Ended
April 30, 2017 |
| Operations | |
| Net investment loss | $(6,041,446) |
| Net realized gain | 27,478,347 |
| Net change in unrealized appreciation (depreciation) | 42,272,842 |
| Net increase in net assets resulting from operations | 63,709,743 |
| Distributions to shareholders | |
| Net investment income | |
| Class A | (652,003) |
| Total distributions to shareholders | (652,003) |
| Increase in net assets from capital stock activity | 988,813,098 |
| Total increase in net assets | 1,051,870,838 |
| Net assets at beginning of period | 20,000 |
| Net assets at end of period | $1,051,890,838 |
| Undistributed net investment income | $4,886,041 |
The accompanying Notes to Financial Statements are an integral part of this statement.
Multi-Manager Directional Alternative Strategies Fund | Annual Report 2017
| 53 |
Statement of Changes in Net Assets (continued)
| | Year Ended |
| | April 30, 2017 (a),(b) |
| | Shares | Dollars ($) |
| Capital stock activity |
| Class A | | |
| Subscriptions | 113,001,284 | 1,133,473,560 |
| Distributions reinvested | 63,300 | 651,990 |
| Redemptions | (112,884,044) | (1,200,600,106) |
| Net increase (decrease) | 180,540 | (66,474,556) |
| Class Z | | |
| Subscriptions | 102,126,850 | 1,088,107,135 |
| Redemptions | (3,093,472) | (32,819,481) |
| Net increase | 99,033,378 | 1,055,287,654 |
| Total net increase | 99,213,918 | 988,813,098 |
| (a) | Class A shares are based on operations from October 17, 2016 (commencement of operations) through the stated period end. |
| (b) | Class Z shares are based on operations from January 3, 2017 (commencement of operations) through the stated period end. |
The accompanying Notes to Financial Statements are an integral part of this statement.
| 54 | Multi-Manager Directional Alternative Strategies Fund | Annual Report 2017 |
[THIS PAGE INTENTIONALLY LEFT BLANK]
Multi-Manager Directional Alternative Strategies Fund | Annual Report 2017
| 55 |
The following table is intended to help you understand the Fund’s financial performance. Certain information reflects financial results for a single share of a class held for the periods shown. Per share net investment income (loss) amounts are calculated based on average shares outstanding during the period. Total return assumes reinvestment of all dividends and distributions, if any. Total return does not reflect payment of sales charges, if any. Total return and portfolio turnover are not annualized for periods of less than one year. The portfolio turnover rate is calculated without regard to purchase and sales transactions of short-term instruments and certain derivatives, if any. If such transactions were included, the Fund’s portfolio turnover rate may be higher.
| Year ended | Net asset value,
beginning of
period | Net
investment
income
(loss) | Net
realized
and
unrealized
gain | Total from
investment
operations | Distributions
from net
investment
income |
| Class A |
| 4/30/2017 (c) | $10.00 | (0.07) | 0.70 | 0.63 | (0.01) |
| Class Z |
| 4/30/2017 (f) | $10.25 | (0.01) | 0.36 | 0.35 | — |
| Notes to Financial Highlights |
| (a) | In addition to the fees and expenses that the Fund bears directly, the Fund indirectly bears a pro rata share of the fees and expenses of any other funds in which it invests. Such indirect expenses are not included in the Fund’s reported expense ratios. |
| (b) | Total net expenses include the impact of certain fee waivers/expense reimbursements made by the Investment Manager and certain of its affiliates, if applicable. |
| (c) | Class A shares commenced operations on October 17, 2016. Per share data and total return reflect activity from that date. |
| (d) | Annualized. |
| (e) | Ratios include dividends and interest on securities sold short. If dividends and interest on securities sold short had been excluded, annualized expenses would have been lower by: |
| Class | 04/30/2017 |
| Class A | 0.54% |
| Class Z | 0.46% |
| (f) | Class Z shares commenced operations on January 3, 2017. Per share data and total return reflect activity from that date. |
The accompanying Notes to Financial Statements are an integral part of this statement.
| 56 | Multi-Manager Directional Alternative Strategies Fund | Annual Report 2017 |
Total
distributions to
shareholders | Net
asset
value,
end of
period | Total
return | Total gross
expense
ratio to
average
net assets(a) | Total net
expense
ratio to
average
net assets(a),(b) | Net investment
income (loss)
ratio to
average
net assets | Portfolio
turnover | Net
assets,
end of
period
(000’s) |
| |
| (0.01) | $10.62 | 6.27% | 2.82% (d),(e) | 2.81% (d),(e) | (1.32%) (d) | 100% | $1,939 |
| |
| — | $10.60 | 3.41% | 2.49% (d),(e) | 2.29% (d),(e) | (0.05%) (d) | 100% | $1,049,952 |
Multi-Manager Directional Alternative Strategies Fund | Annual Report 2017
| 57 |
Notes to Financial Statements
April 30, 2017
Note 1. Organization
Multi-Manager Directional Alternative Strategies Fund (formerly known as Active Portfolios® Multi-Manager Directional Alternatives Fund) (the Fund), a series of Columbia Funds Series Trust I (the Trust), is a non-diversified fund. The Trust is registered under the Investment Company Act of 1940, as amended (the 1940 Act), as an open-end management investment company organized as a Massachusetts business trust.
Effective February 28, 2017, Active Portfolios® Multi-Manager Directional Alternatives Fund was renamed Multi-Manager Directional Alternative Strategies Fund.
On October 3, 2016, Columbia Management Investment Advisers, LLC (the Investment Manager), a wholly-owned subsidiary of Ameriprise Financial, Inc. (Ameriprise Financial), invested $20,000 in the Fund (2,000 shares for Class A), which represented the initial capital for Class A at $10 per share. Shares of the Fund were first offered to the public on October 17, 2016.
These financial statements cover the period from October 17, 2016 (commencement of operations) through April 30, 2017.
Fund shares
The Trust may issue an unlimited number of shares (without par value). The Fund is offered only through certain wrap fee programs sponsored and/or managed by Ameriprise Financial, Inc. (Ameriprise Financial) or its affiliates. The Fund offers each of the share classes identified below.
Class A shares are not subject to any front-end sales charge or contingent deferred sales charge.
Class Z shares are not subject to any front-end sales charge or contingent deferred sales charge. Class Z shares commenced operations on January 3, 2017.
Note 2. Summary of significant accounting policies
Basis of preparation
The Fund is an investment company that applies the accounting and reporting guidance in the Financial Accounting Standards Board (FASB) Accounting Standards Codification Topic 946, Financial Services - Investment Companies (ASC 946). The financial statements are prepared in accordance with U.S. generally accepted accounting principles (GAAP), which requires management to make certain estimates and assumptions that affect the reported amounts of assets and liabilities, the disclosure of contingent assets and liabilities at the date of the financial statements and the reported amounts of income and expenses during the reporting period. Actual results could differ from those estimates.
The following is a summary of significant accounting policies followed by the Fund in the preparation of its financial statements.
Security valuation
All equity securities and exchange-traded funds are valued at the close of business of the New York Stock Exchange. Equity securities and exchange-traded funds are valued at the last quoted sales price on the principal exchange or market on which they trade, except for securities traded on the NASDAQ Stock Market, which are valued at the NASDAQ official close price. Unlisted securities or listed securities for which there were no sales during the day are valued at the mean of the latest quoted bid and ask prices on such exchanges or markets.
Foreign equity securities are valued based on the closing price on the foreign exchange in which such securities are primarily traded. If any foreign equity security closing prices are not readily available, the securities are valued at the mean of the latest quoted bid and ask prices on such exchanges or markets. Foreign currency exchange rates are generally determined at 4:00 p.m. Eastern (U.S.) time. Many securities markets and exchanges outside the U.S. close prior to the close of the New York Stock Exchange; therefore, the closing prices for securities in such markets or on such exchanges may not fully reflect events that occur after such close but before the close of the New York Stock Exchange. In those situations, foreign securities will be fair valued pursuant to a policy adopted by the Board of Trustees, including, if available, utilizing a third party
| 58 | Multi-Manager Directional Alternative Strategies Fund | Annual Report 2017 |
Notes to Financial Statements (continued)
April 30, 2017
pricing service to determine these fair values. The third party pricing service takes into account multiple factors, including, but not limited to, movements in the U.S. securities markets, certain depositary receipts, futures contracts and foreign exchange rates that have occurred subsequent to the close of the foreign exchange or market, to determine a good faith estimate that reasonably reflects the current market conditions as of the close of the New York Stock Exchange. The fair value of a security is likely to be different from the quoted or published price, if available.
Investments in open-end investment companies, including money market funds, are valued at their latest net asset value.
Forward foreign currency exchange contracts are marked-to-market based upon foreign currency exchange rates provided by a pricing service.
Futures and options on futures contracts are valued based upon the settlement price at the close of regular trading on their principal exchanges or, in the absence of transactions, at the mean of the latest quoted bid and ask prices.
Swap transactions are valued through an independent pricing service or broker, or if neither is available, through an internal model based upon observable inputs.
Investments for which market quotations are not readily available, or that have quotations which management believes are not reflective of market value or reliable, are valued at fair value as determined in good faith under procedures approved by and under the general supervision of the Board of Trustees. If a security or class of securities (such as foreign securities) is valued at fair value, such value is likely to be different from the quoted or published price for the security.
The determination of fair value often requires significant judgment. To determine fair value, management may use assumptions including but not limited to future cash flows and estimated risk premiums. Multiple inputs from various sources may be used to determine fair value.
GAAP requires disclosure regarding the inputs and valuation techniques used to measure fair value and any changes in valuation inputs or techniques. In addition, investments shall be disclosed by major category. This information is disclosed following the Fund’s Portfolio of Investments.
Foreign currency transactions and translations
The values of all assets and liabilities denominated in foreign currencies are generally translated into U.S. dollars at exchange rates determined at the close of regular trading on the New York Stock Exchange. Net realized and unrealized gains (losses) on foreign currency transactions and translations include gains (losses) arising from the fluctuation in exchange rates between trade and settlement dates on securities transactions, gains (losses) arising from the disposition of foreign currency and currency gains (losses) between the accrual and payment dates on dividends, interest income and foreign withholding taxes.
For financial statement purposes, the Fund does not distinguish that portion of gains (losses) on investments which is due to changes in foreign exchange rates from that which is due to changes in market prices of the investments. Such fluctuations are included with the net realized and unrealized gains (losses) on investments in the Statement of Operations.
Derivative instruments
The Fund invests in certain derivative instruments, as detailed below, to meet its investment objectives. Derivatives are instruments whose values depend on, or are derived from, in whole or in part, the value of one or more securities, currencies, commodities, indices, or other assets or instruments. Derivatives may be used to increase investment flexibility (including to maintain cash reserves while maintaining desired exposure to certain assets), for risk management (hedging) purposes, to facilitate trading, to reduce transaction costs and to pursue higher investment returns. The Fund may also use derivative instruments to mitigate certain investment risks, such as foreign currency exchange rate risk, interest rate risk and credit risk. Derivatives may involve various risks, including the potential inability of the counterparty to fulfill its obligations under the terms of the contract, the potential for an illiquid secondary market (making it difficult for the Fund to sell or terminate, including at favorable prices) and the potential for market movements which may expose the Fund to gains or losses in excess of the amount shown in the Statement of Assets and Liabilities. The notional amounts of derivative instruments, if applicable, are not recorded in the financial statements.
Multi-Manager Directional Alternative Strategies Fund | Annual Report 2017
| 59 |
Notes to Financial Statements (continued)
April 30, 2017
A derivative instrument may suffer a marked-to-market loss if the value of the contract decreases due to an unfavorable change in the market rates or values of the underlying instrument. Losses can also occur if the counterparty does not perform its obligations under the contract. The Fund’s risk of loss from counterparty credit risk on over-the-counter derivatives is generally limited to the aggregate unrealized gain netted against any collateral held by the Fund and the amount of any variation margin held by the counterparty, plus any replacement costs or related amounts. With exchange-traded or centrally cleared derivatives, there is reduced counterparty credit risk to the Fund since the clearinghouse or central counterparty (CCP) provides some protection in the case of clearing member default. The clearinghouse or CCP stands between the buyer and the seller of the contract; therefore, additional counterparty credit risk is failure of the clearinghouse or CCP. However, credit risk still exists in exchange-traded or centrally cleared derivatives with respect to initial and variation margin that is held in a broker’s customer account. While brokers are required to segregate customer margin from their own assets, in the event that a broker becomes insolvent or goes into bankruptcy and at that time there is a shortfall in the aggregate amount of margin held by the broker for all its clients, U.S. bankruptcy laws will typically allocate that shortfall on a pro-rata basis across all the broker’s customers (including the Fund), potentially resulting in losses to the Fund.
In order to better define its contractual rights and to secure rights that will help the Fund mitigate its counterparty risk, the Fund may enter into an International Swaps and Derivatives Association, Inc. Master Agreement (ISDA Master Agreement) or similar agreement with its derivatives contract counterparties. An ISDA Master Agreement is an agreement between the Fund and a counterparty that governs over-the-counter derivatives and typically contains, among other things, collateral posting terms and netting provisions in the event of a default and/or termination event. Under an ISDA Master Agreement, the Fund may, under certain circumstances, offset with the counterparty certain derivative instrument’s payables and/or receivables with collateral held and/or posted and create one single net payment. The provisions of the ISDA Master Agreement typically permit a single net payment in the event of default (close-out netting), including the bankruptcy or insolvency of the counterparty. Note, however, that bankruptcy or insolvency laws of a particular jurisdiction may impose restrictions on or prohibitions against the right of offset or netting in bankruptcy, insolvency or other events.
Collateral (margin) requirements differ by type of derivative. Margin requirements are established by the clearinghouse or CCP for exchange-traded and centrally cleared derivatives. Brokers can ask for margin in excess of the minimum in certain circumstances. Collateral terms are contract specific for over-the-counter derivatives. For over-the-counter derivatives traded under an ISDA Master Agreement, the collateral requirements are typically calculated by netting the marked-to-market amount for each transaction under such agreement and comparing that amount to the value of any variation margin currently pledged by the Fund and/or the counterparty. Generally, the amount of collateral due from or to a party has to exceed a minimum transfer amount threshold (e.g., $250,000) before a transfer has to be made. To the extent amounts due to the Fund from its counterparties are not fully collateralized, contractually or otherwise, the Fund bears the risk of loss from counterparty nonperformance. The Fund attempts to mitigate counterparty risk by only entering into agreements with counterparties that it believes have the financial resources to honor their obligations and by monitoring the financial stability of those counterparties.
Certain ISDA Master Agreements allow counterparties of over-the-counter derivatives transactions to terminate derivatives contracts prior to maturity in the event the Fund’s net asset value declines by a stated percentage over a specified time period or if the Fund fails to meet certain terms of the ISDA Master Agreement, which would cause the Fund to accelerate payment of any net liability owed to the counterparty. The Fund also has termination rights if the counterparty fails to meet certain terms of the ISDA Master Agreement. In addition to considering counterparty credit risk, the Fund would consider terminating the derivatives contracts based on whether termination would result in a net liability owed from the counterparty.
For financial reporting purposes, the Fund does not offset derivative assets and derivative liabilities that are subject to netting arrangements in the Statement of Assets and Liabilities.
Forward foreign currency exchange contracts
Forward foreign currency exchange contracts are over-the-counter agreements between two parties to buy and sell a currency at a set price on a future date. The Fund utilized forward foreign currency exchange contracts to hedge the currency exposure associated with some or all of the Fund’s securities and to shift U.S. dollar exposure to achieve a representative weighted mix of major currencies in its benchmark and/or recover an underweight country exposure in its portfolio. These instruments may be used for other purposes in future periods.
| 60 | Multi-Manager Directional Alternative Strategies Fund | Annual Report 2017 |
Notes to Financial Statements (continued)
April 30, 2017
The values of forward foreign currency exchange contracts fluctuate daily with changes in foreign currency exchange rates. Changes in the value of these contracts are recorded as unrealized appreciation or depreciation until the contract is exercised or has expired. The Fund will realize a gain or loss when the forward foreign currency exchange contract is closed or expires.
The use of forward foreign currency exchange contracts does not eliminate fluctuations in the prices of the Fund’s portfolio securities. The risks of forward foreign currency exchange contracts include movement in the values of the foreign currencies relative to the U.S. dollar (or other foreign currencies) and the possibility that counterparties will not complete their contractual obligations, which may be in excess of the amount reflected, if any, in the Statement of Assets and Liabilities.
Futures contracts
Futures contracts are exchange-traded and represent commitments for the future purchase or sale of an asset at a specified price on a specified date. The Fund bought and sold futures contracts to manage exposure to the securities market. These instruments may be used for other purposes in future periods. Upon entering into futures contracts, the Fund bears risks that it may not achieve the anticipated benefits of the futures contracts and may realize a loss. Additional risks include counterparty credit risk, the possibility of an illiquid market, and that a change in the value of the contract or option may not correlate with changes in the value of the underlying asset.
Upon entering into a futures contract, the Fund deposits cash or securities with the broker, known as a futures commission merchant (FCM), in an amount sufficient to meet the initial margin requirement. The initial margin deposit must be maintained at an established level over the life of the contract. Cash deposited as initial margin is recorded in the Statement of Assets and Liabilities as margin deposits. Securities deposited as initial margin are designated in the Portfolio of Investments. Subsequent payments (variation margin) are made or received by the Fund each day. The variation margin payments are equal to the daily change in the contract value and are recorded as variation margin receivable or payable and are offset in unrealized gains or losses. The Fund recognizes a realized gain or loss when the contract is closed or expires. Futures contracts involve, to varying degrees, risk of loss in excess of the variation margin disclosed in the Statement of Assets and Liabilities.
Options contracts
Options are contracts which entitle the holder to purchase or sell securities or other identified assets at a specified price, or in the case of index option contracts, to receive or pay the difference between the index value and the strike price of the index option contract. Option contracts can be either exchange-traded or over-the-counter. The Fund purchased and wrote option contracts to produce incremental earnings and to decrease the Fund’s exposure to equity market risk and increase return on investments. These instruments may be used for other purposes in future periods. Completion of transactions for option contracts traded in the over-the-counter market depends upon the performance of the other party. Cash collateral may be collected or posted by the Fund to secure certain over-the-counter option contract trades. Cash collateral held or posted by the Fund for such option contract trades must be returned to the broker or the Fund upon closure, exercise or expiration of the contract.
Options contracts purchased are recorded as investments. When the Fund writes an options contract, the premium received is recorded as an asset and an amount equivalent to the premium is recorded as a liability in the Statement of Assets and Liabilities and is subsequently adjusted to reflect the current fair value of the option written. Changes in the fair value of the written option are recorded as unrealized appreciation or depreciation until the contract is exercised or has expired. The Fund will realize a gain or loss when the option contract is closed or expires. When option contracts are exercised, the proceeds on sales for a written call or purchased put option contract, or the purchase cost for a written put or purchased call option contract, is adjusted by the amount of premium received or paid.
For over-the-counter options purchased, the Fund bears the risk of loss of the amount of the premiums paid plus the positive change in market values net of any collateral held by the Fund should the counterparty fail to perform under the contracts. Option contracts written by the Fund do not typically give rise to significant counterparty credit risk, as options written generally obligate the Fund and not the counterparty to perform. The risk in writing a call option contract is that the Fund gives up the opportunity for profit if the market price of the security increases above the strike price and the option contract is exercised. The risk in writing a put option contract is that the Fund may incur a loss if the market price of the security
Multi-Manager Directional Alternative Strategies Fund | Annual Report 2017
| 61 |
Notes to Financial Statements (continued)
April 30, 2017
decreases below the strike price and the option contract is exercised. Exercise of a written option could result in the Fund purchasing or selling a security or foreign currency when it otherwise would not, or at a price different from the current market value. In purchasing and writing options, the Fund bears the risk of an unfavorable change in the value of the underlying instrument or the risk that the Fund may not be able to enter into a closing transaction due to an illiquid market.
Contracts and premiums associated with options contracts written for the year ended April 30, 2017 are as follows:
| | Calls | |
| | Contracts | Premiums ($) | | |
| Balance at October 17, 2016 | — | — | | |
| Opened | (616) | (315,746) | | |
| Closed | 353 | 283,671 | | |
| Expired | 263 | 32,075 | | |
| Balance at April 30, 2017 | — | — | | |
Swap contracts
Swap contracts are negotiated in the over-the-counter market and may be entered into as a bilateral contract or centrally cleared (centrally cleared swap contract). In a centrally cleared swap contract, immediately following execution of the swap contract with a broker, the swap contract is novated to a central counterparty (the CCP) and the CCP becomes the Fund’s counterparty to the centrally cleared swap contract. The Fund is required to deposit initial margin with the futures commission merchant (FCM), which pledges it through to the CCP in the form of cash or securities in an amount that varies depending on the size and risk profile of the particular swap contract. Securities deposited as initial margin are designated in the Portfolio of Investments and cash deposited is recorded in the Statement of Assets and Liabilities as margin deposits. Unlike a bilateral swap contract, for centrally cleared swap contracts, the Fund has minimal credit exposure to the FCM because the CCP stands between the Fund and the relevant buyer/seller on the other side of the contract. Swap contracts are marked-to-market daily and changes in value are recorded as unrealized appreciation (depreciation). The daily change in valuation of centrally cleared swap contracts, if any, is recorded as a receivable or payable for variation margin in the Statement of Assets and Liabilities.
Entering into these contracts involves, to varying degrees, elements of interest, liquidity and counterparty credit risk in excess of the amounts recognized in the Statement of Assets and Liabilities. Such risks involve the possibility that there may be unfavorable changes in interest rates, market conditions or other conditions, it may be difficult to initiate a swap transaction or liquidate a position at an advantageous time or price which may result in significant losses, and that the FCM or CCP may not fulfill its obligation under the contract.
Total return basket swap contracts
The Fund entered into total return basket swap transactions. These instruments allow the Fund to manage exposure to a custom basket of securities and foreign markets (both long and short exposures) without owning or taking physical custody of such securities. Under the terms of the contract, payments made by the Fund or the counterparty are based on the total return of the reference assets within the basket in return for a specified interest rate. The contract allows the Investment Manager of the Fund to alter the composition of the custom basket by trading in and out of the notional reference security positions at its discretion.
The total return basket swap is valued daily, and the change in value is recorded as unrealized appreciation (depreciation). The swap resets monthly at which time the Fund settles in cash with the counterparty. Payments received (or made) by the Fund are recorded as realized gains (losses). Total return basket swaps are subject to the risk associated with the investment in the reference securities within the basket. The risk in the case of short swaps transactions is unlimited based on the potential for unlimited increases in the market value of the reference securities in the basket. The risk may be offset if the Fund holds any of the reference securities. The risk in the case of long swap transactions is limited to the current notional amount of the swap.
| 62 | Multi-Manager Directional Alternative Strategies Fund | Annual Report 2017 |
Notes to Financial Statements (continued)
April 30, 2017
Total return swap contracts
The Fund entered into total return swap contracts to manage long or short exposure to the total return on a specified reference security in return for periodic payments based on a fixed or variable interest rate. These instruments may be used for other purposes in future periods. Total return swap contracts may be used to obtain exposure to an underlying reference security, instrument, or other asset or index or market without owning, taking physical custody of, or short selling any such security, instrument or asset in a market.
Total return swap contracts are valued daily, and the change in value is recorded as unrealized appreciation (depreciation) until the termination of the swap, at which time the Fund will realize a gain (loss). Periodic payments received (or made) by the Fund over the term of the contract are recorded as realized gains (losses). Total return swap contracts are subject to the risk associated with the investment in the underlying reference security, instrument or asset. The risk in the case of short total return swap contracts is unlimited based on the potential for unlimited increases in the market value of the underlying reference security, instrument or asset. This risk may be offset if the Fund holds any of the underlying reference security, instrument or asset. The risk in the case of long total return swap contracts is limited to the current notional amount of the total return swap contract.
Effects of derivative transactions in the financial statements
The following tables are intended to provide additional information about the effect of derivatives on the financial statements of the Fund, including: the fair value of derivatives by risk category and the location of those fair values in the Statement of Assets and Liabilities; and the impact of derivative transactions over the period in the Statement of Operations, including realized and unrealized gains (losses). The derivative instrument schedules following the Portfolio of Investments present additional information regarding derivative instruments outstanding at the end of the period, if any.
The following table is a summary of the fair value of derivative instruments (not considered to be hedging instruments for accounting disclosure purposes) at April 30, 2017:
| | Asset derivatives | |
Risk exposure
category | Statement
of assets and liabilities
location | Fair value ($) |
| Equity risk | Net assets — unrealized appreciation on futures contracts | 1,729,824* |
| Equity risk | Net assets — unrealized appreciation on swap contracts | 3,495,892* |
| Foreign exchange risk | Unrealized appreciation on forward foreign currency exchange contracts | 1,114,613 |
| Total | | 6,340,329 |
| | Liability derivatives | |
Risk exposure
category | Statement
of assets and liabilities
location | Fair value ($) |
| Equity risk | Net assets — unrealized depreciation on futures contracts | 167,787* |
| Equity risk | Net assets — unrealized depreciation on swap contracts | 265,965* |
| Foreign exchange risk | Unrealized depreciation on forward foreign currency exchange contracts | 289,014 |
| Total | | 722,766 |
| * | Includes cumulative appreciation (depreciation) as reported in the tables following the Portfolio of Investments. Only the current day’s variation margin is reported in receivables or payables in the Statement of Assets and Liabilities. |
Multi-Manager Directional Alternative Strategies Fund | Annual Report 2017
| 63 |
Notes to Financial Statements (continued)
April 30, 2017
The following table indicates the effect of derivative instruments (not considered to be hedging instruments for accounting disclosure purposes) in the Statement of Operations for the year ended April 30, 2017:
| Amount of realized gain (loss) on derivatives recognized in income |
| Risk exposure category | Forward
foreign
currency
exchange
contracts
($) | Futures
contracts
($) | Options
contracts
written
($) | Swap
contracts
($) | Total
($) |
| Equity risk | — | 16,068,776 | 301,936 | 13,695,535 | 30,066,247 |
| Foreign exchange risk | (1,571,097) | — | — | — | (1,571,097) |
| Total | (1,571,097) | 16,068,776 | 301,936 | 13,695,535 | 28,495,150 |
| Change in unrealized appreciation (depreciation) on derivatives recognized in income |
| Risk exposure category | Forward
foreign
currency
exchange
contracts
($) | Futures
contracts
($) | Swap
contracts
($) | Total
($) |
| Equity risk | — | 1,562,037 | 3,229,927 | 4,791,964 |
| Foreign exchange risk | 825,599 | — | — | 825,599 |
| Total | 825,599 | 1,562,037 | 3,229,927 | 5,617,563 |
The following table is a summary of the average outstanding volume by derivative instrument for the year ended April 30, 2017:
| Derivative instrument | Average notional
amounts ($)* |
| Futures contracts — long | 152,512,176 |
| Derivative instrument | Average market
value ($)* |
| Options contracts — written | (170,071) |
| Derivative instrument | Average unrealized
appreciation ($)* | Average unrealized
depreciation ($)* |
| Forward foreign currency exchange contracts | 697,112 | (204,753) |
| Total return swap contracts | 3,317,844 | (208,859) |
| * | Based on the ending quarterly outstanding amounts for the year ended April 30, 2017. |
Short Sales
The Fund may sell a security it does not own in anticipation of a decline in the fair value of the security. When the Fund sells a security short, it must borrow the security sold short and deliver it to the broker-dealer through which it made the short sale. The Fund is required to maintain a margin account with the broker and to pledge assets to the broker as collateral for the borrowed security. Securities pledged as collateral are designated in the Portfolio of Investments. In addition, cash collateral is recorded as cash collateral held at broker in the Statement of Assets and Liabilities. The Fund can purchase the same security at the current market price and deliver it to the broker to close out the short sale. The Fund is obligated to pay the broker a fee for borrowing the security. The fee is included in "Dividends and interest on securities sold short" in the Statement of Operations and a short position is reported as a liability at fair value in the Statement of Assets and Liabilities. The Fund must also pay the broker for any dividends accrued (recognized on ex-date) on the borrowed security. This amount is recorded as an expense in the Statement of Operations. The Fund will record a gain if the security declines in value, and will realize a loss if the security appreciates. Such gain, limited to the price at which the Fund sold the security short, or such loss, potentially unlimited in size because the short position loses value as the market price of the security sold short increases, will be recognized upon the termination of a short sale.
| 64 | Multi-Manager Directional Alternative Strategies Fund | Annual Report 2017 |
Notes to Financial Statements (continued)
April 30, 2017
Offsetting of assets and liabilities
The following table presents the Fund’s gross and net amount of assets and liabilities available for offset under netting arrangements as well as any related collateral received or pledged by the Fund as of April 30, 2017:
| | Citi ($) | JPMorgan ($) (a) | JPMorgan ($) (a) | Macquarie ($) | Morgan
Stanley ($) | Morgan
Stanley
International ($) | Total ($) | | |
| Assets | | | | | | | | | |
| Forward foreign currency exchange contracts | 1,114,613 | - | - | - | - | - | 1,114,613 | | |
| OTC total return basket swap contracts (b) | - | - | 543,047 | - | - | 2,279,536 | 2,822,583 | | |
| OTC total return swap contracts (b) | - | - | - | 475,101 | - | - | 475,101 | | |
| OTC total return swap contracts on futures (b) | - | - | - | - | - | 198,208 | 198,208 | | |
| Total assets | 1,114,613 | - | 543,047 | 475,101 | - | 2,477,744 | 4,610,505 | | |
| Liabilities | | | | | | | | | |
| Forward foreign currency exchange contracts | 289,014 | - | - | - | - | - | 289,014 | | |
| OTC total return swap contracts (b) | - | - | - | 265,965 | - | - | 265,965 | | |
| Securities borrowed | - | 181,680,068 | - | - | 164,081,144 | - | 345,761,212 | | |
| Total liabilities | 289,014 | 181,680,068 | - | 265,965 | 164,081,144 | - | 346,316,191 | | |
| Total financial and derivative net assets | 825,599 | (181,680,068) | 543,047 | 209,136 | (164,081,144) | 2,477,744 | (341,705,686) | | |
| Total collateral received (pledged) (c) | - | (181,680,068) | - | - | (164,081,144) | - | (345,761,212) | | |
| Net amount (d) | 825,599 | - | 543,047 | 209,136 | - | 2,477,744 | 4,055,526 | | |
| (a) | Exposure can only be netted across transactions governed under the same master agreement with the same legal entity. |
| (b) | Over-the-Counter Swap Contracts are presented at market value plus periodic payments receivable (payable), which is comprised of unrealized appreciation, unrealized depreciation, premiums paid and premiums received. |
| (c) | In some instances, the actual collateral received and/or pledged may be more than the amount shown due to overcollateralization. |
| (d) | Represents the net amount due from/(to) counterparties in the event of default. |
Security transactions
Security transactions are accounted for on the trade date. Cost is determined and gains (losses) are based upon the specific identification method for both financial statement and federal income tax purposes.
Income recognition
Corporate actions and dividend income are generally recorded net of any non-reclaimable tax withholdings, on the ex-dividend date or upon receipt of ex-dividend notification in the case of certain foreign securities.
The Fund may receive distributions from holdings in equity securities, business development companies (BDCs), exchange-traded funds, other regulated investment companies (RICs), and real estate investment trusts (REITs), which report information on the tax character of their distributions annually. These distributions are allocated to dividend income, capital gain and return of capital based on actual information reported. Return of capital is recorded as a reduction of the cost basis of securities held. If the Fund no longer owns the applicable securities, return of capital is recorded as a realized gain. With respect to REITs, to the extent actual information has not yet been reported, estimates for return of capital are made by the Fund’s management. Management’s estimates are subsequently adjusted when the actual character of the distributions is disclosed by the REITs, which could result in a proportionate change in return of capital to shareholders.
Awards from class action litigation are recorded as a reduction of cost basis if the Fund still owns the applicable securities on the payment date. If the Fund no longer owns the applicable securities, the proceeds are recorded as realized gains.
Expenses
General expenses of the Trust are allocated to the Fund and other funds of the Trust based upon relative net assets or other expense allocation methodologies determined by the nature of the expense. Expenses directly attributable to the Fund are charged to the Fund. Expenses directly attributable to a specific class of shares are charged to that share class.
Multi-Manager Directional Alternative Strategies Fund | Annual Report 2017
| 65 |
Notes to Financial Statements (continued)
April 30, 2017
Determination of class net asset value
All income, expenses (other than class-specific expenses, which are charged to that share class, as shown in the Statement of Operations) and realized and unrealized gains (losses) are allocated to each class of the Fund on a daily basis, based on the relative net assets of each class, for purposes of determining the net asset value of each class.
Federal income tax status
The Fund intends to qualify each year as a regulated investment company under Subchapter M of the Internal Revenue Code, as amended, and will distribute substantially all of its taxable income (including net short-term capital gains), if any, for its tax year, and as such will not be subject to federal income taxes. In addition, the Fund intends to distribute in each calendar year substantially all of its net investment income, capital gains and certain other amounts, if any, such that the Fund should not be subject to federal excise tax. Therefore, no federal income or excise tax provision is recorded.
Foreign taxes
The Fund may be subject to foreign taxes on income, gains on investments or currency repatriation, a portion of which may be recoverable. The Fund will accrue such taxes and recoveries, as applicable, based upon its current interpretation of tax rules and regulations that exist in the markets in which it invests.
Realized gains in certain countries may be subject to foreign taxes at the Fund level, based on statutory rates. The Fund accrues for such foreign taxes on realized and unrealized gains at the appropriate rate for each jurisdiction, as applicable. The amount, if any, is disclosed as a liability on the Statement of Assets and Liabilities.
Distributions to shareholders
Distributions from net investment income, if any, are declared and paid annually. Net realized capital gains, if any, are distributed along with the income distribution. Income distributions and capital gain distributions are determined in accordance with federal income tax regulations, which may differ from GAAP.
Guarantees and indemnifications
Under the Trust’s organizational documents and, in some cases, by contract, its officers and trustees are indemnified against certain liabilities arising out of the performance of their duties to the Trust or its funds. In addition, certain of the Fund’s contracts with its service providers contain general indemnification clauses. The Fund’s maximum exposure under these arrangements is unknown since the amount of any future claims that may be made against the Fund cannot be determined, and the Fund has no historical basis for predicting the likelihood of any such claims.
Investment company reporting modernization
In October 2016, the U.S. Securities and Exchange Commission adopted new rules and forms, and amendments to certain current rules and forms, to modernize reporting and disclosure of information by registered investment companies. The amendments to Regulation S-X will require standardized, enhanced disclosure about derivatives in investment company financial statements, and will also change the rules governing the form and content of such financial statements. The amendments to Regulation S-X take effect on August 1, 2017. At this time, management is assessing the anticipated impact of these regulatory developments.
Note 3. Fees and other transactions with affiliates
Management services fees
The Fund entered into a Management Agreement with Columbia Management Investment Advisers, LLC (the Investment Manager), a wholly-owned subsidiary of Ameriprise Financial, Inc. (Ameriprise Financial). Under the Management Agreement, the Investment Manager provides the Fund with investment research and advice, as well as administrative and accounting services. The Investment Manager is responsible for the ultimate oversight of investments made by the Fund. The Fund’s subadvisers (see Subadvisory agreement below) have the primary responsibility for the day-to-day portfolio management of their portion of the Fund. The management services fee is equal to 1.60% of the Fund’s average daily net assets.
| 66 | Multi-Manager Directional Alternative Strategies Fund | Annual Report 2017 |
Notes to Financial Statements (continued)
April 30, 2017
Subadvisory agreement
The Investment Manager has entered into Subadvisory Agreements with Boston Partners, AQR Capital Management, LLC and Analytic, each of which subadvises a portion of the assets of the Fund. New investments in the Fund, net of any redemptions, are allocated in accordance with the Investment Manager’s determination, subject to the oversight of the Fund’s Board of Trustees. Each subadviser’s proportionate share of investments in the Fund will vary due to market fluctuations. The Investment Manager compensates each subadviser to manage the investment of the Fund’s assets.
Other expenses
Other expenses include offering costs which were incurred prior to the shares of the Fund being offered. Offering costs include, among other things, state registration filing fees and printing costs. The Fund amortizes offering costs over a period of 12 months from the commencement of operations.
Compensation of board members
Members of the Board of Trustees, who are not officers or employees of the Investment Manager or Ameriprise Financial, are compensated for their services to the Fund as disclosed in the Statement of Operations. These members of the Board of Trustees may participate in a Deferred Compensation Plan (the Plan) which may be terminated at any time. Obligations of the Plan will be paid solely out of the Fund’s assets, and all amounts payable under the Plan constitute a general unsecured obligation of the Fund.
Compensation of Chief Compliance Officer
The Board of Trustees has appointed a Chief Compliance Officer to the Fund in accordance with federal securities regulations. A portion of the Chief Compliance Officer’s total compensation is allocated to the Fund, along with other affiliated funds governed by the Board of Trustees, based on relative net assets. The total amount allocated to all affiliated funds governed by the Board of Trustees will not exceed $40,000 annually.
Transfer agency fees
Under a Transfer and Dividend Disbursing Agent Agreement, Columbia Management Investment Services Corp. (the Transfer Agent), an affiliate of the Investment Manager and a wholly-owned subsidiary of Ameriprise Financial, is responsible for providing transfer agency services to the Fund. The Transfer Agent has contracted with Boston Financial Data Services (BFDS) to serve as sub-transfer agent. The Transfer Agent pays the fees of BFDS for services as sub-transfer agent and BFDS is not entitled to reimbursement for such fees from the Fund (with the exception of out-of-pocket fees).
The Fund pays the Transfer Agent a monthly transfer agency fee based on the number or the average value of accounts, depending on the type of account. In addition, the Fund pays the Transfer Agent a fee for shareholder services based on the number of accounts or on a percentage of the average aggregate value of the Fund’s shares maintained in omnibus accounts up to the lesser of the amount charged by the financial intermediary or a cap established by the Board of Trustees from time to time.
The Transfer Agent also receives compensation from the Fund for various shareholder services and reimbursements for certain out-of-pocket fees.
For the year ended April 30, 2017, the Fund’s effective transfer agency fee rates as a percentage of average daily net assets of each class were as follows:
| | Effective rate (%) |
| Class A | 0.33 (a) |
| Class Z | 0.35 (a) |
Multi-Manager Directional Alternative Strategies Fund | Annual Report 2017
| 67 |
Notes to Financial Statements (continued)
April 30, 2017
Distribution and service fees
The Fund has an agreement with Columbia Management Investment Distributors, Inc. (the Distributor), an affiliate of the Investment Manager and a wholly-owned subsidiary of Ameriprise Financial, for distribution and shareholder services. The Board of Trustees has approved, and the Fund has adopted, distribution and shareholder service plans (the Plans) applicable to certain share classes, which set the distribution and service fees for the Fund. These fees are calculated daily and are intended to compensate the Distributor and/or eligible selling and/or servicing agents for selling shares of the Fund and providing services to investors.
The Fund may pay distribution fee of up to 0.25% of the Fund’s average daily net assets attributable to Class A shares and a service fee of up to 0.25% of the Fund’s average daily net assets attributable to Class A shares, provided that the aggregate fee shall not exceed 0.25% of the Fund’s average daily net assets attributable to Class A shares.
Expenses waived/reimbursed by the Investment Manager and its affiliates
The Investment Manager and certain of its affiliates have contractually agreed to waive fees and/or reimburse expenses (excluding certain fees and expenses described below) for the period disclosed below, unless sooner terminated at the sole discretion of the Board of Trustees, so that the Fund’s net operating expenses, after giving effect to fees waived/expenses reimbursed and any balance credits and/or overdraft charges from the Fund’s custodian, do not exceed the following annual rates as a percentage of the class’ average daily net assets:
| | October 17, 2016 through August 31, 2018 |
| Class A | 2.29% |
| Class Z | 2.04* |
| *Expense cap rate is contractual from January 3, 2017 (the commencement of operations of Class Z shares) through August 31, 2018. | |
Under the agreement governing these fee waivers and/or expense reimbursement arrangements, the following fees and expenses are excluded from the waiver/reimbursement commitment, and therefore will be paid by the Fund, if applicable: taxes (including foreign transaction taxes), expenses associated with investments in affiliated and non-affiliated pooled investment vehicles (including mutual funds and exchange-traded funds), transaction costs and brokerage commissions, costs related to any securities lending program, dividend and interest expenses associated with securities sold short, inverse floater program fees and expenses, transaction charges and interest on borrowed money, interest, infrequent and/or unusual expenses and any other expenses the exclusion of which is specifically approved by the Board of Trustees. This agreement may be modified or amended only with approval from the Investment Manager, certain of its affiliates and the Fund. Any fees waived and/or expenses reimbursed under the expense reimbursement arrangements described above are not recoverable by the Investment Manager or its affiliates in future periods.
Note 4. Federal tax information
The timing and character of income and capital gain distributions are determined in accordance with income tax regulations, which may differ from GAAP because of temporary or permanent book to tax differences.
At April 30, 2017, these differences are primarily due to differing treatment for deferral/reversal of wash sale losses, passive foreign investment company (PFIC) holdings, derivative investments, tax straddles, swap investments, non-deductible expenses, trustees’ deferred compensation, foreign currency transactions, investments in partnerships and constructive sales of appreciated financial positions. To the extent these differences are permanent, reclassifications are made among the components of the Fund’s net assets in the Statement of Assets and Liabilities. Temporary differences do not require reclassifications.
In the Statement of Assets and Liabilities the following reclassifications were made:
Undistributed net
investment
income ($) | Accumulated
net realized
gain ($) | Paid in
capital ($) |
| 11,579,490 | (11,579,490) | — |
| 68 | Multi-Manager Directional Alternative Strategies Fund | Annual Report 2017 |
Notes to Financial Statements (continued)
April 30, 2017
Net investment income (loss) and net realized gains (losses), as disclosed in the Statement of Operations, and net assets were not affected by this reclassification.
The tax character of distributions paid during the years indicated was as follows:
| April 30, 2017 |
Ordinary
income ($) | Long-term
capital gains ($) | Total ($) |
| 652,003 | — | 652,003 |
Short-term capital gain distributions, if any, are considered ordinary income distributions for tax purposes.
At April 30, 2017, the components of distributable earnings on a tax basis were as follows:
Undistributed
ordinary income ($) | Undistributed
long-term
capital gains ($) | Capital loss
carryforwards ($) | Net unrealized
appreciation ($) |
| 22,557,059 | 7,457,681 | — | 57,699,729 |
At April 30, 2017, the cost of investments for federal income tax purposes along with the aggregate gross unrealized appreciation and depreciation based on that cost was:
Federal
tax cost ($) | Gross unrealized
appreciation ($) | Gross unrealized
(depreciation) ($) | Net unrealized
appreciation ($) |
| 905,490,479 | 70,801,913 | (13,102,184) | 57,699,729 |
Management of the Fund has concluded that there are no significant uncertain tax positions in the Fund that would require recognition in the financial statements. However, management’s conclusion may be subject to review and adjustment at a later date based on factors including, but not limited to, new tax laws, regulations, and administrative interpretations (including relevant court decisions). Generally, the Fund’s federal tax returns for the prior three fiscal years remain subject to examination by the Internal Revenue Service.
Note 5. Portfolio information
The cost of purchases and proceeds from sales of securities, excluding short-term investments and derivatives, if any, aggregated to $1,496,154,491 and $1,101,616,936, respectively, for the year ended April 30, 2017. The amount of purchase and sale activity impacts the portfolio turnover rate reported in the Financial Highlights.
Note 6. Affiliated money market fund
The Fund invests in Columbia Short-Term Cash Fund, an affiliated money market fund established for the exclusive use by the Fund and other affiliated funds (the Affiliated MMF). The income earned by the Fund from such investments is included as Dividends - affiliated issuers in the Statement of Operations. As an investing fund, the Fund indirectly bears its proportionate share of the expenses of the Affiliated MMF. Effective October 1, 2016, the Affiliated MMF prices its shares with a floating net asset value (NAV) and no longer seeks to maintain a stable NAV. In addition, the Board of Trustees of the Affiliated MMF may impose a fee on redemptions (sometimes referred to as a liquidity fee) or temporarily suspend redemptions (sometimes referred to as imposing a redemption gate) in the event its liquidity falls below regulatory limits.
Note 7. Line of credit
The Fund has access to a revolving credit facility with a syndicate of banks led by Citibank, N.A., HSBC Bank USA, N.A. and JPMorgan Chase Bank, N.A. whereby the Fund may borrow for the temporary funding of shareholder redemptions or for other temporary or emergency purposes. The credit facility agreement, which is a collective agreement between the Fund and certain other funds managed by the Investment Manager, severally and not jointly, permits collective borrowings up to $1 billion. Interest is charged to each participating fund based on its borrowings at a rate equal to the higher of (i) the overnight federal funds rate plus 1.00% or (ii) the one-month LIBOR rate plus 1.00%. Each borrowing under the credit facility
Multi-Manager Directional Alternative Strategies Fund | Annual Report 2017
| 69 |
Notes to Financial Statements (continued)
April 30, 2017
matures no later than 60 days after the date of borrowing. The Fund also pays a commitment fee equal to its pro rata share of the amount of the credit facility at a rate of 0.15% per annum. The commitment fee is included in other expenses in the Statement of Operations.
The Fund had no borrowings during the year ended April 30, 2017.
Note 8. Significant risks
Derivatives risk
Losses involving derivative instruments may be substantial, because a relatively small price movement in the underlying security(ies), commodity, currency or index or other instrument or asset may result in a substantial loss for the Fund. In addition to the potential for increased losses, the use of derivative instruments may lead to increased volatility within the Fund. Derivatives will typically increase the Fund’s exposure to principal risks to which it is otherwise exposed, and may expose the Fund to additional risks, including correlation risk, counterparty risk, hedging risk, leverage risk and liquidity risk.
Foreign securities and emerging market countries risk
Investing in foreign securities may include certain risks and considerations not typically associated with investing in U.S. securities, such as fluctuating currency values and changing local and regional economic, political and social conditions, which may result in greater market volatility. In addition, certain foreign securities may not be as liquid as U.S. securities. Investing in emerging markets may accentuate these risks. These countries are also more likely to experience high levels of inflation, deflation or currency devaluation which could hurt their economies and securities markets. To the extent that the Fund concentrates its investment exposure to any one or a few specific countries, the Fund will be particularly susceptible to the various conditions, events or other factors impacting those countries and may, therefore, have a greater risk than that of a fund which is more geographically diversified.
Non-diversification risk
A non-diversified fund is permitted to invest a greater percentage of its total assets in fewer issuers than a diversified fund. The Fund may, therefore, have a greater risk of loss from a few issuers than a similar fund that invests more broadly.
Shareholder concentration risk
At April 30, 2017, affiliated shareholders of record owned 100.0% of the outstanding shares of the Fund in one or more accounts. Subscription and redemption activity by concentrated accounts may have a significant effect on the operations of the Fund. In the case of a large redemption, the Fund may be forced to sell investments at inopportune times, including its liquid or more liquid positions, resulting in Fund losses and the Fund holding a higher percentage of less liquid or illiquid securities. Large redemptions could result in decreased economies of scale and increased operating expenses for non-redeeming Fund shareholders.
Short Selling Risk
Leverage occurs when the Fund increases its assets available for investment using borrowings, short sales, derivatives, or similar instruments or techniques. Because short sales involve borrowing securities and then selling them, the Fund’s short sales effectively leverage the Fund’s assets. The Fund’s assets that are used as collateral to secure the Fund’s obligations to return the securities sold short may decrease in value while the short positions are outstanding, which may force the Fund to use its other assets to increase the collateral. Leverage can create an interest expense that may lower the Fund’s overall returns. Leverage presents the opportunity for increased net income and capital gains, but may also exaggerate the Fund’s volatility and risk of loss. There can be no guarantee that a leveraging strategy will be successful.
Technology and technology-related investment risk
The Fund may be more susceptible to the particular risks that may affect companies in the information technology sector, as well as other technology-related sectors (collectively, the technology sectors) than if it were invested in a wider variety of companies in unrelated sectors. Companies in the technology sectors are subject to certain risks, including the risk that new services, equipment or technologies will not be accepted by consumers and businesses or will become rapidly obsolete. Performance of such companies may be affected by factors including obtaining and protecting patents (or the failure to do so)
| 70 | Multi-Manager Directional Alternative Strategies Fund | Annual Report 2017 |
Notes to Financial Statements (continued)
April 30, 2017
and significant competitive pressures, including aggressive pricing of their products or services, new market entrants, competition for market share and short product cycles due to an accelerated rate of technological developments. Such competitive pressures may lead to limited earnings and/or falling profit margins. As a result, the value of their securities may fall or fail to rise. In addition, many technology sector companies have limited operating histories and prices of these companies’ securities historically have been more volatile than other securities, especially over the short term.
Note 9. Subsequent events
Management has evaluated the events and transactions that have occurred through the date the financial statements were issued and noted no items requiring adjustment of the financial statements or additional disclosure.
Note 10. Information regarding pending and settled legal proceedings
Ameriprise Financial and certain of its affiliates have historically been involved in a number of legal, arbitration and regulatory proceedings, including routine litigation, class actions, and governmental actions, concerning matters arising in connection with the conduct of their business activities. Ameriprise Financial believes that the Funds are not currently the subject of, and that neither Ameriprise Financial nor any of its affiliates are the subject of, any pending legal, arbitration or regulatory proceedings that are likely to have a material adverse effect on the Funds or the ability of Ameriprise Financial or its affiliates to perform under their contracts with the Funds. Ameriprise Financial is required to make quarterly (10-Q), annual (10-K) and, as necessary, 8-K filings with the Securities and Exchange Commission (SEC) on legal and regulatory matters that relate to Ameriprise Financial and its affiliates. Copies of these filings may be obtained by accessing the SEC website at www.sec.gov.
There can be no assurance that these matters, or the adverse publicity associated with them, will not result in increased fund redemptions, reduced sale of fund shares or other adverse consequences to the Funds. Further, although we believe proceedings are not likely to have a material adverse effect on the Funds or the ability of Ameriprise Financial or its affiliates to perform under their contracts with the Funds, these proceedings are subject to uncertainties and, as such, we are unable to estimate the possible loss or range of loss that may result. An adverse outcome in one or more of these proceedings could result in adverse judgments, settlements, fines, penalties or other relief that could have a material adverse effect on the consolidated financial condition or results of operations of Ameriprise Financial.
Multi-Manager Directional Alternative Strategies Fund | Annual Report 2017
| 71 |
Report of Independent Registered Public Accounting Firm
To the Trustees of Columbia Funds Series Trust I and the Shareholders of Multi-Manager Directional Alternative Strategies Fund (formerly known as Active Portfolios® Multi-Manager Directional Alternatives Fund)
In our opinion, the accompanying statement of assets and liabilities, including the portfolio of investments, and the related statements of operations and of changes in net assets and the financial highlights present fairly, in all material respects, the financial position of Multi-Manager Directional Alternative Strategies Fund (formerly known as Active Portfolios® Multi-Manager Directional Alternatives Fund) (the "Fund," a series of Columbia Funds Series Trust I) as of April 30, 2017, and the results of its operations, the changes in its net assets and the financial highlights for the period October 17, 2016 (commencement of operations) through April 30, 2017, in conformity with accounting principles generally accepted in the United States of America. These financial statements and financial highlights (hereafter referred to as "financial statements") are the responsibility of the Fund’s management. Our responsibility is to express an opinion on these financial statements based on our audit. We conducted our audit of these financial statements in accordance with the standards of the Public Company Accounting Oversight Board (United States). Those standards require that we plan and perform the audit to obtain reasonable assurance about whether the financial statements are free of material misstatement. An audit includes examining, on a test basis, evidence supporting the amounts and disclosures in the financial statements, assessing the accounting principles used and significant estimates made by management, and evaluating the overall financial statement presentation. We believe that our audit, which included confirmation of securities as of April 30, 2017 by correspondence with the custodian, brokers, agent banks and transfer agent, provides a reasonable basis for our opinion.
PricewaterhouseCoopers LLP
Minneapolis, MN
June 23, 2017
| 72 | Multi-Manager Directional Alternative Strategies Fund | Annual Report 2017 |
Federal Income Tax Information
(Unaudited)
The Fund hereby designates the following tax attributes for the fiscal year ended April 30, 2017. Shareholders will be notified in early 2018 of the amounts for use in preparing 2017 income tax returns.
Qualified
dividend
income | Dividends
received
deduction | Capital
gain
dividend |
| 30.90% | 18.43% | $7,830,565 |
Qualified dividend income. For taxable, non-corporate shareholders, the percentage of ordinary income distributed during the fiscal year that represents qualified dividend income subject to reduced tax rates.
Dividends received deduction. The percentage of ordinary income distributed during the fiscal year that qualifies for the corporate dividends received deduction.
Capital gain dividend. The Fund designates as a capital gain dividend the amount reflected above, or if subsequently determined to be different, the net capital gain of such fiscal period.
Multi-Manager Directional Alternative Strategies Fund | Annual Report 2017
| 73 |
Shareholders elect the Board that oversees the Fund’s operations. The Board appoints officers who are responsible for day-to-day business decisions based on policies set by the Board. The following table provides basic biographical information about the Fund’s Trustees, including their principal occupations during the past five years, although specific titles for individuals may have varied over the period. The year set forth beneath Length of Service in the table below is the year in which the Trustee was first appointed or elected as Trustee to any Fund currently in the Columbia Funds Complex or a predecessor thereof. Under current Board policy, members serve terms of indefinite duration.
Independent trustees
| Name, address, year of birth | Position held with the Trust and length of service | Principal occupation(s) during the past five years and other relevant professional experience | Number of Funds in the Columbia Fund Complex overseen | Other directorships held by Trustee during the past five years |
Janet Langford Carrig
c/o Columbia Management
Investment Advisers, LLC
225 Franklin Street
Mail Drop BX32 05228
Boston, MA 02110
1957 | Trustee
1996 | Senior Vice President, General Counsel and Corporate Secretary, ConocoPhillips (independent energy company) since September 2007 | 57 | None |
Douglas A. Hacker
c/o Columbia Management
Investment Advisers, LLC
225 Franklin Street
Mail Drop BX32 05228
Boston, MA 02110
1955 | Trustee and Chairman of the Board
1996 | Independent business executive since May 2006; Executive Vice President — Strategy of United Airlines from December 2002 to May 2006; President of UAL Loyalty Services (airline marketing company) from September 2001 to December 2002; Executive Vice President and Chief Financial Officer of United Airlines from July 1999 to September 2001 | 57 | Spartan Nash Company, (food distributor); Nash Finch Company (food distributor) from 2005 to 2013; Aircastle Limited (aircraft leasing); SeaCube Container Leasing Ltd. (container leasing) from 2010 to 2013; and Travelport Worldwide Limited (travel information technology) |
Nancy T. Lukitsh
c/o Columbia Management
Investment Advisers, LLC
225 Franklin Street
Mail Drop BX32 05228
Boston, MA 02110
1956 | Trustee
2011 | Senior Vice President, Partner and Director of Marketing, Wellington Management Company, LLP (investment adviser) from 1997 to 2010; Chair, Wellington Management Portfolios (commingled non-U.S. investment pools) from 2007 to 2010; Director, Wellington Trust Company, NA and other Wellington affiliates from 1997 to 2010 | 57 | None |
David M. Moffett
c/o Columbia Management
Investment Advisers, LLC
225 Franklin Street
Mail Drop BX32 05228
Boston, MA 02110
1952 | Trustee
2011 | Retired. Consultant to Bridgewater and Associates | 57 | Director, CSX Corporation; Genworth Financial, Inc. (financial and insurance products and services); Paypal Holdings Inc. (payment and data processing services); Trustee, University of Oklahoma Foundation; former Director, eBay Inc. (online trading community), 2007-2015; and former Director, CIT Bank, CIT Group Inc. (commercial and consumer finance), 2010-2016 |
| 74 | Multi-Manager Directional Alternative Strategies Fund | Annual Report 2017 |
TRUSTEES AND OFFICERS (continued)
Independent trustees (continued)
| Name, address, year of birth | Position held with the Trust and length of service | Principal occupation(s) during the past five years and other relevant professional experience | Number of Funds in the Columbia Fund Complex overseen | Other directorships held by Trustee during the past five years |
Charles R. Nelson
c/o Columbia Management
Investment Advisers, LLC
225 Franklin Street
Mail Drop BX32 05228
Boston, MA 02110
1942 | Trustee
1981 | Retired. Professor Emeritus, University of Washington since 2011; Professor of Economics, University of Washington from 1976 to 2011; Ford and Louisa Van Voorhis Professor of Political Economy, University of Washington from 1993 to 2011; Adjunct Professor of Statistics, University of Washington from 1980 to 2011; Associate Editor, Journal of Money, Credit and Banking from September 1993 to 2008; consultant on econometric and statistical matters | 57 | None |
John J. Neuhauser
c/o Columbia Management
Investment Advisers, LLC
225 Franklin Street
Mail Drop BX32 05228
Boston, MA 02110
1943 | Trustee
1984 | President, Saint Michael’s College since August 2007; Director or Trustee of several non-profit organizations, including University of Vermont Medical Center; Academic Vice President and Dean of Faculties, Boston College from August 1999 to October 2005; University Professor, Boston College from November 2005 to August 2007 | 57 | Liberty All-Star Equity Fund and Liberty All- Star Growth Fund (closed-end funds) |
Patrick J. Simpson
c/o Columbia Management
Investment Advisers, LLC
225 Franklin Street
Mail Drop BX32 05228
Boston, MA 02110
1944 | Trustee
2000 | Of Counsel, Perkins Coie LLP (law firm) since 2015; Partner, Perkins Coie LLP from 1988 to 2014 | 57 | None |
Anne-Lee Verville
c/o Columbia Management
Investment Advisers, LLC
225 Franklin Street
Mail Drop BX32 05228
Boston, MA 02110
1945 | Trustee
1998 | Retired. General Manager, Global Education Industry from 1994 to 1997, President – Application Systems Division from 1991 to 1994, Chief Financial Officer – US Marketing & Services from 1988 to 1991, and Chief Information Officer from 1987 to 1988, IBM Corporation (computer and technology) | 57 | Enesco Group, Inc. (producer of giftware and home and garden decor products) from 2001 to 2006 |
Multi-Manager Directional Alternative Strategies Fund | Annual Report 2017
| 75 |
TRUSTEES AND OFFICERS (continued)
Consultants to the Independent Trustees*
| Name, address, year of birth | Position held with the Trust and length of service | Principal occupation(s) during the past five years and other relevant professional experience | Number of Funds in the Columbia Funds complex overseen | Other directorships held by Trustee during the past five years |
J. Kevin Connaughton
c/o Columbia
Management Investment
Advisers, LLC,
225 Franklin Street
Mail Drop BX32 05228,
Boston, MA 02110
1964 | Independent Trustee Consultant
2016 | Independent Trustee Consultant, Columbia Funds since March 2016; Managing Director and General Manager of Mutual Fund Products, Columbia Management Investment Advisers, LLC from May 2010 to February 2015; President, Columbia Funds from 2009 to 2015; and senior officer of Columbia Funds and affiliated funds from 2003 to 2015 | 57 | Board of Governors, Gateway Healthcare since January 2016; Trustee, New Century Portfolios since March 2015; and Director, The Autism Project since March 2015 |
Natalie A. Trunow
c/o Columbia
Management Investment
Advisers, LLC,
225 Franklin Street
Mail Drop BX32 05228,
Boston, MA 02110
1967 | Independent Trustee Consultant
2016 | Independent Trustee Consultant, Columbia Funds since September 2016; Chief Executive Officer, Millennial Partners (investment consulting services to institutions) since January 2016; Director of Investments, Casey Family Programs from April 2016 to September 2016; Senior Vice President and Chief Investment Officer, Calvert Investments from August 2008 to January 2016; Section Head and Portfolio Manager, General Motors Asset Management from June 1997 to August 2008 | 57 | Healthcare Services for Children with Special Needs |
| * | J. Kevin Connaughton was appointed consultant to the Independent Trustees effective March 1, 2016. Natalie A. Trunow was appointed consultant to the Independent Trustees effective September 1, 2016. Shareholders of the Funds are expected to be asked to elect each of Mr. Connaughton and Ms. Trunow as a Trustee at a future shareholder meeting. |
Interested trustee affiliated with Investment Manager*
| Name, address, year of birth | Position held with the Trust and length of service | Principal occupation(s) during the past five years and other relevant professional experience | Number of Funds in the Columbia Funds Complex overseen | Other directorships held by Trustee during the past five years |
William F. Truscott
c/o Columbia Management
Investment Advisers, LLC
225 Franklin Street
Boston, MA 02110
1960 | Trustee
2012 | Chairman of the Board and President, Columbia Management Investment Advisers, LLC since May 2010 and February 2012, respectively; Chief Executive Officer, Global Asset Management, Ameriprise Financial, Inc. since September 2012 (previously Chief Executive Officer, U.S. Asset Management & President, Annuities, May 2010-September 2012); Director and Chief Executive Officer, Columbia Management Investment Distributors, Inc. since May 2010 and February 2012, respectively;Chairman of the Board and Chief Executive Officer, RiverSource Distributors, Inc. since 2006; Director, Threadneedle Asset Management Holdings, SARL since 2014; President and Chief Executive Officer, Ameriprise Certificate Company, 2006-August 2012 | 183 | Chairman of the Board, Columbia Management Investment Advisers, LLC since May 2010; Director, Columbia Management Investment Distributors, Inc. since May 2010; former Director, Ameriprise Certificate Company, 2006 - January 2013 |
| * | Interested person (as defined under the 1940 Act) by reason of being an officer, director, security holder and/or employee of the Investment Manager or Ameriprise Financial. |
The Statement of Additional Information has additional information about the Fund’s Board members and is available,
without charge, upon request by calling 800.345.6611; contacting your financial intermediary; or visiting
investor.columbiathreadneedleus.com.
| 76 | Multi-Manager Directional Alternative Strategies Fund | Annual Report 2017 |
TRUSTEES AND OFFICERS (continued)
The Board has appointed officers who are responsible for day-to-day business decisions based on policies it has established. The officers serve at the pleasure of the Board. The following table provides basic information about the Officers of the Fund, including principal occupations during the past five years, although their specific titles may have varied over the period. In addition to Mr. Truscott, who is Senior Vice President, the Fund’s other officers are:
Fund officers
Name,
address and
year of birth | Position and year
first appointed to
position for any Fund
in the Columbia
Funds complex or a
predecessor thereof | Principal occupation(s) during past five years |
Christopher O. Petersen
5228 Ameriprise
Financial Center
Minneapolis, MN 55474
Born 1970 | President and Principal Executive Officer (2015) | Vice President and Lead Chief Counsel, Ameriprise Financial, Inc. since January 2015 (previously, Vice President and Chief Counsel, January 2010 - December 2014; officer of Columbia Funds and affiliated funds since 2007. |
Michael G. Clarke
225 Franklin Street
Boston, MA 02110
Born 1969 | Treasurer (2011), Chief Financial Officer (2009) and Chief Accounting Officer (2015) | Vice President — Mutual Fund Administration, Columbia Management Investment Advisers, LLC, since May 2010; senior officer of Columbia Funds and affiliated funds since 2002. |
Paul B. Goucher
100 Park Avenue
New York, NY 10017
Born 1968 | Senior Vice President (2011) and Assistant Secretary (2008) | Senior Vice President and Assistant General Counsel, Ameriprise Financial, Inc. since January 2017 (previously Vice President and Lead Chief Counsel, November 2008 - January 2017 and January 2013 - January 2017, respectively; and Chief Counsel, January 2010 - January 2013); Vice President, Chief Legal Officer and Assistant Secretary, Columbia Management Investment Advisers, LLC since May 2010. |
Thomas P. McGuire
225 Franklin Street
Boston, MA 02110
Born 1972 | Senior Vice President and Chief Compliance Officer (2012) | Vice President — Asset Management Compliance, Ameriprise Financial, Inc., since May 2010; Chief Compliance Officer, Ameriprise Certificate Company since September 2010. |
Colin Moore
225 Franklin Street
Boston, MA 02110
Born 1958 | Senior Vice President (2010) | Executive Vice President and Global Chief Investment Officer, Ameriprise Financial, Inc., since July 2013; Executive Vice President and Global Chief Investment Officer, Columbia Management Investment Advisers, LLC since July 2013 (previously Director and Global Chief Investment Officer, 2010 - 2013). |
Michael E. DeFao
225 Franklin Street
Boston, MA 02110
Born 1968 | Vice President (2011) and Assistant Secretary (2010) | Vice President and Chief Counsel, Ameriprise Financial, Inc. since May 2010. |
Amy Johnson
5228 Ameriprise
Financial Center
Minneapolis, MN 55474
Born 1965 | Vice President (2006) | Managing Director and Global Head of Operations, Columbia Management Investment Advisers, LLC since April 2016 (previously Managing Director and Chief Operating Officer, 2010 - 2016). |
Lyn Kephart-Strong
5228 Ameriprise
Financial Center
Minneapolis, MN 55474
Born 1960 | Vice President (2015) | President, Columbia Management Investment Services Corp. since October 2014; Vice President & Resolution Officer, Ameriprise Trust Company since August 2009. |
Ryan C. Larrenaga
225 Franklin Street
Boston, MA 02110
Born 1970 | Senior Vice President (2017), Chief Legal Officer (2017) and Secretary (2015) | Vice President and Group Counsel, Ameriprise Financial, Inc. since August 2011; officer of Columbia Funds and affiliated funds since 2005. |
Multi-Manager Directional Alternative Strategies Fund | Annual Report 2017
| 77 |
The Fund mails one shareholder report to each shareholder address. If you would like more than one report, please call shareholder services at 800.345.6611 and additional reports will be sent to you.
Proxy voting policies and procedures
The policy of the Board of Trustees is to vote the proxies of the companies in which the Fund holds investments consistent with the procedures as stated in the Statement of Additional Information (SAI). You may obtain a copy of the SAI without charge by calling 800.345.6611; contacting your financial intermediary; visiting investor.columbiathreadneedleus.com; or searching the website of the Securities and Exchange Commission (SEC) at sec.gov. Information regarding how the Fund voted proxies relating to portfolio securities is filed with the SEC by August 31st for the most recent 12-month period ending June 30th of that year, and is available without charge by visiting investor.columbiathreadneedleus.com, or searching the website of the SEC at sec.gov.
Quarterly schedule of investments
The Fund files a complete schedule of portfolio holdings with the SEC for the first and third quarters of each fiscal year on Form N-Q. The Fund’s Form N-Q is available on the SEC’s website at sec.gov and may be reviewed and copied at the SEC’s Public Reference Room in Washington, D.C. Information on the operation of the Public Reference Room may be obtained by calling 800.SEC.0330. The Fund’s complete schedule of portfolio holdings, as filed on Form N-Q, can also be obtained without charge, upon request, by calling 800.345.6611.
Additional Fund information
For more information about the Fund, please visit investor.columbiathreadneedleus.com or call 800.345.6611. Customer Service Representatives are available to answer your questions Monday through Friday from 8 a.m. to 7 p.m. Eastern time.
Fund investment manager
Columbia Management Investment Advisers, LLC
225 Franklin Street
Boston, MA 02110
Fund distributor
Columbia Management Investment Distributors, Inc.
225 Franklin Street
Boston, MA 02110
Fund transfer agent
Columbia Management Investment Services Corp.
P.O. Box 8081
Boston, MA 02266-8081
| 78 | Multi-Manager Directional Alternative Strategies Fund | Annual Report 2017 |
[THIS PAGE INTENTIONALLY LEFT BLANK]
[THIS PAGE INTENTIONALLY LEFT BLANK]
[THIS PAGE INTENTIONALLY LEFT BLANK]
Multi-Manager Directional Alternative Strategies Fund
P.O. Box 8081
Boston, MA 02266-8081
Please read and consider the investment objectives, risks, charges and expenses for any fund carefully before investing. For a prospectus and summary prospectus, which contains this and other important information about the Fund, go to
investor.columbiathreadneedleus.com. The Fund is distributed by Columbia Management Investment Distributors, Inc., member FINRA, and managed by Columbia Management Investment Advisers, LLC.
Columbia Threadneedle Investments (Columbia Threadneedle) is the global brand name of the Columbia and Threadneedle group of companies. All rights reserved. Columbia Management Investment Distributors, Inc., 225 Franklin Street, Boston, MA 02110-2804
© 2017 Columbia Management Investment Advisers, LLC.
investor.columbiathreadneedleus.com

Annual Report
April 30, 2017
Columbia Corporate Income Fund
Not FDIC Insured • No bank guarantee • May lose value
Dear Shareholders,
While emotions have run high following the outcome of the U.S. Presidential election, it remains unclear how the Trump presidency will unfold in terms of policy. We have a sense of the priorities espoused by the President over the past eighteen months, but campaign priorities are not always realized and are often never pursued. What seems certain is that, while some investors have already priced expectations into the market, others have retreated, preferring instead a wait and see approach. The outcome of such behaviors appears to have created conditions ripe for ongoing market volatility.
While volatility in the financial markets can be stressful, volatility itself is not a new phenomenon. Other factors that have been at the root cause of recent volatility include uncertainty following the United Kingdom’s vote to exit the European Union (Brexit), speculation around the Federal Reserve’s decision to increase interest rates, divergent central bank policy and geopolitical unrest. The point is, financial markets have fluctuated for years and may be expected to continue to fluctuate — sometimes wildly. If anything, such volatility seems to be the new normal, perhaps exacerbated by access to information and development of technological tools which have enabled investors to react rapidly to real and perceived change. So what can you do?
Position your portfolio for the reality of market volatility
That there is a historical precedent for market volatility, or even an acceptance that it may persist, offers little comfort. A measured and strategic approach remains the best strategy for investors to stay on track in achieving their investment goals.
Step 1: Review your investment goals
Take this opportunity to review your investment goals and the strategies you are pursuing to achieve those goals in order to remain focused on what’s important to you. It is entirely possible that your goals have changed in response either to your life situation or to changes in the market. Accept what you can’t control — volatility, and focus on what you can — your investment goals and strategies.
Step 2: Reassess your risk tolerance
Sit down with your financial advisor to discuss your investment goals and strategies, as well as any changes to your tolerance for risk. Consider your investment horizon. Increased market volatility and a new investment horizon may impact the strategies that can best help you achieve your investment goals. Remember, achieving your investment goals may require a certain amount of risk. Ultimately, you must maintain vigilance in reassessing your risk tolerance and the strategies you have selected in pursuit of your investment goals, and awareness of how those strategies may react to market volatility.
Step 3: Remain calm and focus on your long-term plan
Remember, investing is about the long game. Short term events are not necessarily evidence of a longer term reality. Investors who attempt to time the market too often end up reacting to a down turn by selling low and then compounding the problem by waiting on the sidelines, ultimately missing the right opportunity to reinvest.
Columbia Corporate Income Fund | Annual Report 2017
President’s Message (continued)
As long as there is a market, there will be volatility. How you respond to that volatility can make a big difference in the measure of your success as an investor. Talk to your financial advisor about how working with Columbia Threadneedle Investments may help you position your portfolio for the reality of ongoing volatility and, perhaps, even turn such volatility into investment opportunity.
Sincerely,
Christopher O. Petersen
President, Columbia Funds
Investors should consider the investment objectives, risks, charges and expenses of a mutual fund carefully before investing. For a free prospectus and summary prospectus, which contains this and other important information about a fund, visit investor.columbiathreadneedleus.com. The prospectus should be read carefully before investing.
Columbia Funds are distributed by Columbia Management Investment Distributors, Inc., member FINRA, and managed by Columbia Management Investment Advisers, LLC.
© 2017 Columbia Management Investment Advisers, LLC. All rights reserved.
Columbia Corporate Income Fund | Annual Report 2017
Columbia Corporate Income Fund | Annual Report 2017
Investment objective
Columbia Corporate Income Fund (the Fund) seeks total return, consisting primarily of current income and secondarily of capital appreciation.
Portfolio management
Tom Murphy, CFA
Lead manager
Managed Fund since 2011
Timothy Doubek, CFA
Co-manager
Managed Fund since 2011
Brian Lavin, CFA
Co-manager
Managed Fund since 2010
| Average annual total returns (%) (for the period ended April 30, 2017) |
| | | Inception | 1 Year | 5 Years | 10 Years |
| Class A | Excluding sales charges | 07/31/00 | 3.72 | 3.61 | 5.14 |
| | Including sales charges | | -1.22 | 2.62 | 4.64 |
| Class B | Excluding sales charges | 07/15/02 | 2.94 | 2.84 | 4.36 |
| | Including sales charges | | -2.06 | 2.49 | 4.36 |
| Class C | Excluding sales charges | 07/15/02 | 3.10 | 3.00 | 4.52 |
| | Including sales charges | | 2.10 | 3.00 | 4.52 |
| Class R4 * | 11/08/12 | 3.98 | 3.89 | 5.42 |
| Class R5 * | 11/08/12 | 4.09 | 3.99 | 5.46 |
| Class T * | Excluding sales charges | 09/27/10 | 3.71 | 3.61 | 5.14 |
| | Including sales charges | | 1.08 | 3.10 | 4.88 |
| Class Y * | 11/08/12 | 4.14 | 4.05 | 5.49 |
| Class Z | 03/05/86 | 3.98 | 3.87 | 5.40 |
| Blended Benchmark | | 4.53 | 4.35 | 5.80 |
| Bloomberg Barclays U.S. Corporate Bond Index | | 3.00 | 3.89 | 5.48 |
Returns for Class A are shown with and without the maximum initial sales charge of 4.75%. Returns for Class B are shown with and without the applicable contingent deferred sales charge (CDSC) of 5.00% in the first year, declining to 1.00% in the sixth year and eliminated thereafter. The Fund does not accept new investments in Class B shares, except for certain limited transactions. The Fund’s current Class B investors, having held their shares for the requisite time period, are no longer subject to a CDSC upon redemption of their shares. Returns for Class C are shown with and without the 1.00% CDSC for the first year only. The returns for Class T shares are shown with and without the maximum applicable sales charge of 2.50% per transaction. Prior to March 27, 2017, Class T shares were known as Class W shares and were sold without a sales charge. The Fund’s other classes are not subject to sales charges and have limited eligibility. Please see the Fund’s prospectus for details. Performance for different share classes will vary based on differences in sales charges and fees associated with each class. All results shown assume reinvestment of distributions during the period. Returns do not reflect the deduction of taxes that a shareholder may pay on Fund distributions or on the redemption of Fund shares. Performance results reflect the effect of any fee waivers or reimbursements of Fund expenses by Columbia Management Investment Advisers, LLC and/or any of its affiliates. Absent these fee waivers or expense reimbursement arrangements, performance results would have been lower.
The performance information shown represents past performance and is not a guarantee of future results. The investment return and principal value of your investment will fluctuate so that your shares, when redeemed, may be worth more or less than their original cost. Current performance may be lower or higher than the performance information shown. You may obtain performance information current to the most recent month-end by contacting your financial intermediary, visiting investor.columbiathreadneedleus.com or calling 800.345.6611.
| * | The returns shown for periods prior to the share class inception date (including returns for the Life of the Fund, if shown, which are since Fund inception) include the returns of the Fund’s oldest share class. These returns are adjusted to reflect any higher class-related operating expenses of the newer share classes, as applicable. Please visit investor.columbiathreadneedleus.com/investment-products/mutual-funds/appended-performance for more information. |
The Blended Benchmark is a weighted custom benchmark, established by the Investment Manager, consisting of an 85% weighting in the Bloomberg Barclays U.S. Corporate Bond Index and a 15% weighting in the Bank of America Merrill Lynch (BofAML) U.S. Cash Pay High Yield Constrained Index tracks the performance of U.S. dollar-denominated below investment grade corporate debt, currently in a coupon paying period that is publicly issued in the U.S. domestic market.
The Bloomberg Barclays U.S. Corporate Bond Index measures the investment-grade, fixed-rate, taxable, corporate bond market.
Indices are not available for investment, are not professionally managed and do not reflect sales charges, fees, brokerage commissions, taxes or other expenses of investing. Securities in the Fund may not match those in an index.
Columbia Corporate Income Fund | Annual Report 2017
| 3 |
Fund at a Glance (continued)
Performance of a hypothetical $10,000 investment (April 30, 2007 — April 30, 2017)
The chart above shows the change in value of a hypothetical $10,000 investment in Class A shares of Columbia Corporate Income Fund during the stated time period, and does not reflect the deduction of taxes that a shareholder may pay on Fund distributions or on the redemption of Fund shares.
| Portfolio breakdown (%) (at April 30, 2017) |
| Common Stocks | 0.0 (a) |
| Corporate Bonds & Notes | 90.3 |
| Foreign Government Obligations | 0.1 |
| Money Market Funds | 7.2 |
| Senior Loans | 0.0 (a) |
| U.S. Treasury Obligations | 2.4 |
| Total | 100.0 |
Percentages indicated are based upon total investments. The Fund’s portfolio composition is subject to change.
| Quality breakdown (%) (at April 30, 2017) |
| AAA rating | 3.0 |
| AA rating | 3.3 |
| A rating | 17.7 |
| BBB rating | 66.0 |
| BB rating | 3.9 |
| B rating | 4.6 |
| CCC rating | 1.5 |
| CC rating | 0.0 (a) |
| Total | 100.0 |
Percentages indicated are based upon total fixed income investments (excluding Money Market Funds).
Bond ratings apply to the underlying holdings of the Fund and not the Fund itself and are divided into categories ranging from highest to lowest credit quality, determined by using the middle rating of Moody’s, S&P and Fitch, after dropping the highest and lowest available ratings. When ratings are available from only two rating agencies, the lower rating is used. When a rating is available from only one rating agency, that rating is used. When a bond is not rated by any rating agency, it is designated as “Not rated.” Credit quality ratings assigned by a rating agency are subjective opinions, not statements of fact, and are subject to change, including daily. The ratings assigned by credit rating agencies are but one of the considerations that the Investment Manager and/or Fund’s subadviser incorporates into its credit analysis process, along with such other issuer-specific factors as cash flows, capital structure and leverage ratios, ability to de-leverage (repay) through free cash flow, quality of management, market positioning and access to capital, as well as such security-specific factors as the terms of the security (e.g., interest rate and time to maturity) and the amount and type of any collateral.
| 4 | Columbia Corporate Income Fund | Annual Report 2017 |
Manager Discussion of Fund Performance
For the 12-month period that ended April 30, 2017, the Fund’s Class A shares returned 3.72% excluding sales charges. During the same 12-month period, the Fund underperformed its Blended Benchmark, which returned 4.53%, and outperformed the Bloomberg Barclays U.S. Corporate Bond Index, which returned 3.00%. During the period, the largest positive contribution to the Fund’s performance relative to the benchmark came from a significant allocation to energy-related bonds, while positive performance was also generated within electric utilities. On the downside, a bias toward higher quality issues within below-investment-grade, high-yield corporates detracted.
Credit outperformed against uncertain geopolitical backdrop
U.S. interest rates began the period at very low levels, in part due to negative interest rates overseas as central banks sought to bolster anemic growth. Despite a sub-par global economic backdrop, U.S. credit sentiment was supported by the recovery in commodity prices, expectations for benign domestic monetary policy, and a global search for positive-yielding assets.
In late-June of 2016, a U.K. referendum which resulted in a vote to exit the European Union spurred a flight-to-safety trade, driving U.S. Treasury yields even lower. While credit-sensitive areas of the market briefly faltered, markets quickly put the impact of “Brexit” on global growth, with the aid of supportive central banks, into perspective. While concern over the domestic economy’s resilience in the face of global shocks stayed the Fed’s hand, the committee took on a more hawkish tone as the third quarter progressed. Market pricing began to reflect the renewed likelihood that the Fed could move later in the calendar year and Treasury yields drifted higher off their lows.
The surprise result of the November 8th U.S. election caused interest rates to rise meaningfully alongside expectations for higher growth and inflation with Republicans in control of the White House and both houses of Congress. These expectations, along with supportive economic data, sustained returns in economically sensitive, credit-oriented segments of the bond market well into 2017. In March 2017, a dovish interpretation of the Federal Reserve’s statement led inflation expectations and Treasury rates lower. In addition, the apparent surrender of the Republicans on healthcare reform brought into question the prospects for the rest of President Trump’s pro-growth economic platform. Nonetheless, credit-oriented areas of the bond market notably outperformed for the full 12 months ended April 30, 2017.
Yields rose meaningfully along the U.S. Treasury curve over the 12-month period ended April 30, 2017, and the yield curve flattened modestly as shorter maturities experienced greater yield increases. To illustrate, the two-year Treasury yield rose 51 basis points from 0.77% to 1.28%, while the 30-year yield rose 30 basis points, from 2.66% to 2.96%.
Contributors and detractors
During the period the largest positive contribution to the Fund’s performance relative to the benchmark came from a significant allocation to energy-related bonds, which saw their prices rebound strongly in 2016. Within energy, the Fund’s positions in midstream pipelines and independent producers posted especially strong returns. Positive performance was also generated within electric utilities, where the Fund’s holdings outperformed the broader segment. On the downside, a bias toward higher quality issues within below-investment-grade, high-yield corporates detracted, as riskier segments of the market outperformed. The high-yield allocation was approximately unchanged at 9% over the period.
The Fund maintained a shorter duration than its benchmark during the period in review, which was executed by selling Treasury futures contracts. This resulted in a relative give-up in performance early in the period as interest rates collapsed to all-time lows. As interest rates subsequently rose, we moderated the magnitude of our underweight and ended the period approximately 0.25 years short versus the benchmark.
At period’s end
While valuations appeared rich, corporate bond yields were meaningfully above their five-year average and continue to attract demand from foreign and domestic investors alike. Our positioning continued to be driven by a preference for industries and individual issues where our credit analysts had strong convictions with respect to industry dynamics and individual company positioning within those industries as gauged by strength of product, strategic direction, financial flexibility, and management
Columbia Corporate Income Fund | Annual Report 2017
| 5 |
Manager Discussion of Fund Performance (continued)
stewardship. We believe that adhering to this established research process, combined with opportunistic selection based on our assessment of valuation and the accompanying risk/reward profile, has the potential to provide strong relative performance over time regardless of unforeseeable macroeconomic developments.
Market risk may affect a single issuer, sector of the economy, industry or the market as a whole. Fixed-income securities present issuer default risk. A rise in interest rates may result in a price decline of fixed-income instruments held by the Fund, negatively impacting its performance and NAV. Falling rates may result in the Fund investing in lower yielding debt instruments, lowering the Fund’s income and yield. These risks may be heightened for longer maturity and duration securities. Non-investment-grade (high-yield or junk) securities present greater price volatility and more risk to principal and income than higher rated securities. Prepayment and extension risk exists because the timing of payments on a loan, bond or other investment may accelerate when interest rates fall or decelerate when interest rates rise which may reduce investment opportunities and potential returns. Investing in derivatives is a specialized activity that involves special risks that subject the Fund to significant loss potential, including when used as leverage, and may result in greater fluctuation in fund value. Liquidity risk is associated with the difficulty of selling underlying investments at a desirable time or price. See the Fund’s prospectus for more information on these and other risks.
The views expressed in this report reflect the current views of the respective parties. These views are not guarantees of future performance and involve certain risks, uncertainties and assumptions that are difficult to predict, so actual outcomes and results may differ significantly from the views expressed. These views are subject to change at any time based upon economic, market or other conditions and the respective parties disclaim any responsibility to update such views. These views may not be relied on as investment advice and, because investment decisions for a Columbia fund are based on numerous factors, may not be relied on as an indication of trading intent on behalf of any particular Columbia fund. References to specific securities should not be construed as a recommendation or investment advice.
| 6 | Columbia Corporate Income Fund | Annual Report 2017 |
Understanding Your Fund’s Expenses
(Unaudited)
As an investor, you incur two types of costs. There are transaction costs, which generally include sales charges on purchases and may include redemption fees. There are also ongoing costs, which generally include management fees, distribution and/or service fees, and other fund expenses. The following information is intended to help you understand your ongoing costs (in dollars) of investing in the Fund and to help you compare these costs with the ongoing costs of investing in other mutual funds.
Analyzing your Fund’s expenses
To illustrate these ongoing costs, we have provided examples and calculated the expenses paid by investors in each share class of the Fund during the period. The actual and hypothetical information in the table is based on an initial investment of $1,000 at the beginning of the period indicated and held for the entire period. Expense information is calculated two ways and each method provides you with different information. The amount listed in the “Actual” column is calculated using the Fund’s actual operating expenses and total return for the period. You may use the Actual information, together with the amount invested, to estimate the expenses that you paid over the period. Simply divide your account value by $1,000 (for example, an $8,600 account value divided by $1,000 = 8.6), then multiply the results by the expenses paid during the period under the “Actual” column. The amount listed in the “Hypothetical” column assumes a 5% annual rate of return before expenses (which is not the Fund’s actual return) and then applies the Fund’s actual expense ratio for the period to the hypothetical return. You should not use the hypothetical account values and expenses to estimate either your actual account balance at the end of the period or the expenses you paid during the period. See “Compare with other funds” below for details on how to use the hypothetical data.
Compare with other funds
Since all mutual funds are required to include the same hypothetical calculations about expenses in shareholder reports, you can use this information to compare the ongoing cost of investing in the Fund with other funds. To do so, compare the hypothetical example with the 5% hypothetical examples that appear in the shareholder reports of other funds. As you compare hypothetical examples of other funds, it is important to note that hypothetical examples are meant to highlight the ongoing costs of investing in a fund only and do not reflect any transaction costs, such as sales charges, or redemption or exchange fees. Therefore, the hypothetical calculations are useful in comparing ongoing costs only, and will not help you determine the relative total costs of owning different funds. If transaction costs were included in these calculations, your costs would be higher.
| November 1, 2016 – April 30, 2017 |
| | Account value at the
beginning of the
period ($) | Account value at the
end of the
period ($) | Expenses paid during
the period ($) | Fund’s annualized
expense ratio (%) |
| | Actual | Hypothetical | Actual | Hypothetical | Actual | Hypothetical | Actual |
| Class A | 1,000.00 | 1,000.00 | 1,005.70 | 1,020.01 | 4.52 | 4.56 | 0.92 |
| Class B | 1,000.00 | 1,000.00 | 1,002.00 | 1,016.33 | 8.20 | 8.26 | 1.67 |
| Class C | 1,000.00 | 1,000.00 | 1,002.70 | 1,017.07 | 7.46 | 7.52 | 1.52 |
| Class R4 | 1,000.00 | 1,000.00 | 1,006.90 | 1,021.23 | 3.30 | 3.32 | 0.67 |
| Class R5 | 1,000.00 | 1,000.00 | 1,006.50 | 1,021.77 | 2.76 | 2.78 | 0.56 |
| Class T (formerly Class W) | 1,000.00 | 1,000.00 | 1,005.60 | 1,020.01 | 4.52 | 4.56 | 0.92 |
| Class Y | 1,000.00 | 1,000.00 | 1,007.70 | 1,022.02 | 2.51 | 2.53 | 0.51 |
| Class Z | 1,000.00 | 1,000.00 | 1,007.00 | 1,021.23 | 3.30 | 3.32 | 0.67 |
Expenses paid during the period are equal to the annualized expense ratio for each class as indicated above, multiplied by the average account value over the period and then multiplied by the number of days in the Fund’s most recent fiscal half year and divided by 365.
Expenses do not include fees and expenses incurred indirectly by the Fund from its investment in underlying funds, including affiliated and non-affiliated pooled investment vehicles, such as mutual funds and exchange-traded funds.
Had Columbia Management Investment Advisers, LLC and/or certain of its affiliates not waived/reimbursed certain fees and expenses, account value at the end of the period would have been reduced.
The Fund’s annualized expense ratio excludes the impact of an expense reimbursement from a third party due to overbilling.
Columbia Corporate Income Fund | Annual Report 2017
| 7 |
Portfolio of Investments
April 30, 2017
(Percentages represent value of investments compared to net assets)
| Common Stocks —% |
| Issuer | Shares | Value ($) |
| Financials —% |
| Insurance —% |
| WMI Holdings Corp. Escrow(a),(b),(c) | 1,075 | — |
| WMIH Corp.(b) | 21,388 | 32,082 |
| Total | | 32,082 |
| Total Financials | 32,082 |
Total Common Stocks
(Cost $1,077,672) | 32,082 |
| Corporate Bonds & Notes 90.0% |
| Issuer | Coupon
Rate | | Principal
Amount ($) | Value ($) |
| Aerospace & Defense 2.3% |
| BAE Systems Holdings, Inc.(d) |
| 10/07/24 | 3.800% | | 7,294,000 | 7,525,876 |
| Bombardier, Inc.(d) |
| 12/01/21 | 8.750% | | 250,000 | 278,125 |
| L-3 Communications Corp. |
| 05/28/24 | 3.950% | | 7,409,000 | 7,686,608 |
| Lockheed Martin Corp. |
| 01/15/23 | 3.100% | | 3,090,000 | 3,157,235 |
| Northrop Grumman Corp. |
| 06/01/18 | 1.750% | | 7,855,000 | 7,870,427 |
| TransDigm, Inc. |
| 05/15/25 | 6.500% | | 250,000 | 255,625 |
| 06/15/26 | 6.375% | | 843,000 | 849,323 |
| TransDigm, Inc.(d) |
| 05/15/25 | 6.500% | | 231,000 | 236,198 |
| Total | 27,859,417 |
| Automotive 0.1% |
| Eagle Holding Co., II LLC PIK(e) |
| 05/15/22 | 7.625% | | 62,000 | 63,127 |
| Gates Global LLC/Co.(d) |
| 07/15/22 | 6.000% | | 423,000 | 425,115 |
| IHO Verwaltungs GmbH PIK(d) |
| 09/15/23 | 4.500% | | 204,000 | 204,000 |
| Schaeffler Finance BV(d) |
| 05/15/21 | 4.250% | | 625,000 | 638,938 |
| Total | 1,331,180 |
| Banking 6.1% |
| Ally Financial, Inc. |
| 05/19/22 | 4.625% | | 534,000 | 544,680 |
| 09/30/24 | 5.125% | | 138,000 | 140,933 |
| Bank of America Corp.(f) |
| 01/20/28 | 3.824% | | 14,925,000 | 15,035,520 |
| Corporate Bonds & Notes (continued) |
| Issuer | Coupon
Rate | | Principal
Amount ($) | Value ($) |
| Citigroup, Inc. |
| 05/01/26 | 3.400% | | 7,095,000 | 7,000,785 |
| 10/21/26 | 3.200% | | 7,420,000 | 7,170,792 |
| Goldman Sachs Group, Inc. (The) |
| 02/25/26 | 3.750% | | 5,000,000 | 5,070,345 |
| 01/26/27 | 3.850% | | 6,665,000 | 6,772,926 |
| JPMorgan Chase & Co. |
| 10/01/26 | 2.950% | | 10,591,000 | 10,174,710 |
| Morgan Stanley |
| 07/27/26 | 3.125% | | 5,295,000 | 5,109,087 |
| 01/20/27 | 3.625% | | 7,985,000 | 8,006,743 |
| Washington Mutual Bank(a),(g) |
| Subordinated |
| 01/15/15 | 0.000% | | 6,350,000 | 9,525 |
| Wells Fargo & Co. |
| 10/23/26 | 3.000% | | 11,000,000 | 10,606,717 |
| Total | 75,642,763 |
| Brokerage/Asset Managers/Exchanges 0.0% |
| NPF Corp.(d) |
| 07/15/21 | 9.000% | | 138,000 | 145,935 |
| Building Materials 0.1% |
| Allegion PLC |
| 09/15/23 | 5.875% | | 111,000 | 118,492 |
| Allegion US Holding Co., Inc. |
| 10/01/21 | 5.750% | | 327,000 | 341,102 |
| American Builders & Contractors Supply Co., Inc.(d) |
| 04/15/21 | 5.625% | | 249,000 | 256,159 |
| Beacon Roofing Supply, Inc. |
| 10/01/23 | 6.375% | | 112,000 | 120,680 |
| HD Supply, Inc.(d) |
| 04/15/24 | 5.750% | | 100,000 | 106,250 |
| US Concrete, Inc.(d) |
| 06/01/24 | 6.375% | | 159,000 | 166,155 |
| US Concrete, Inc. |
| 06/01/24 | 6.375% | | 116,000 | 121,220 |
| Total | 1,230,058 |
| Cable and Satellite 3.5% |
| Altice US Finance I Corp.(d) |
| 07/15/23 | 5.375% | | 321,000 | 335,044 |
| Altice US Finance I Corp. |
| 05/15/26 | 5.500% | | 427,000 | 441,411 |
| CCO Holdings LLC/Capital Corp.(d) |
| 04/01/24 | 5.875% | | 689,000 | 738,091 |
| 05/01/25 | 5.375% | | 341,000 | 355,492 |
| 02/15/26 | 5.750% | | 481,000 | 510,909 |
| 05/01/26 | 5.500% | | 39,000 | 40,926 |
The accompanying Notes to Financial Statements are an integral part of this statement.
| 8 | Columbia Corporate Income Fund | Annual Report 2017 |
Portfolio of Investments (continued)
April 30, 2017
| Corporate Bonds & Notes (continued) |
| Issuer | Coupon
Rate | | Principal
Amount ($) | Value ($) |
| Cequel Communications Holdings I LLC/Capital Corp.(d) |
| 09/15/20 | 6.375% | | 289,000 | 297,852 |
| 12/15/21 | 5.125% | | 182,000 | 186,095 |
| 07/15/25 | 7.750% | | 251,000 | 279,865 |
| Comcast Corp. |
| 02/15/18 | 5.875% | | 5,940,000 | 6,142,999 |
| 07/15/46 | 3.400% | | 6,010,000 | 5,210,712 |
| CSC Holdings LLC |
| 02/15/19 | 8.625% | | 425,000 | 468,159 |
| 06/01/24 | 5.250% | | 420,000 | 424,985 |
| CSC Holdings LLC(d) |
| 10/15/25 | 6.625% | | 562,000 | 613,985 |
| 10/15/25 | 10.875% | | 344,000 | 413,230 |
| 04/15/27 | 5.500% | | 229,000 | 236,729 |
| DISH DBS Corp. |
| 11/15/24 | 5.875% | | 805,000 | 845,250 |
| 07/01/26 | 7.750% | | 533,000 | 624,276 |
| Radiate HoldCo LLC/Finance, Inc.(d) |
| 02/15/25 | 6.625% | | 123,000 | 122,693 |
| Sirius XM Radio, Inc.(d) |
| 07/15/26 | 5.375% | | 435,000 | 445,875 |
| Sky PLC(d) |
| 11/26/22 | 3.125% | | 11,974,000 | 12,010,940 |
| 09/16/24 | 3.750% | | 8,537,000 | 8,697,880 |
| Unitymedia GmbH(d) |
| 01/15/25 | 6.125% | | 382,000 | 407,827 |
| Unitymedia Hessen GmbH & Co. KG NRW(d) |
| 01/15/25 | 5.000% | | 439,000 | 455,743 |
| Videotron Ltd. |
| 07/15/22 | 5.000% | | 286,000 | 303,189 |
| Videotron Ltd./Ltee(d) |
| 04/15/27 | 5.125% | | 244,000 | 248,807 |
| Virgin Media Finance PLC(d) |
| 01/15/25 | 5.750% | | 674,000 | 687,480 |
| Virgin Media Secured Finance PLC(d) |
| 01/15/26 | 5.250% | | 506,000 | 512,325 |
| Ziggo Bond Finance BV(d) |
| 01/15/27 | 6.000% | | 240,000 | 244,800 |
| Ziggo Secured Finance BV(d) |
| 01/15/27 | 5.500% | | 608,000 | 623,218 |
| Total | 42,926,787 |
| Chemicals 0.8% |
| Angus Chemical Co.(d) |
| 02/15/23 | 8.750% | | 437,000 | 454,480 |
| Atotech USA, Inc.(d) |
| 02/01/25 | 6.250% | | 311,000 | 315,665 |
| Corporate Bonds & Notes (continued) |
| Issuer | Coupon
Rate | | Principal
Amount ($) | Value ($) |
| Axalta Coating Systems LLC(d) |
| 08/15/24 | 4.875% | | 203,000 | 210,231 |
| Chemours Co. (The) |
| 05/15/23 | 6.625% | | 570,000 | 609,900 |
| 05/15/25 | 7.000% | | 24,000 | 26,370 |
| Eco Services Operations LLC/Finance Corp.(d) |
| 11/01/22 | 8.500% | | 398,000 | 419,890 |
| EI du Pont de Nemours & Co.(e) |
| 05/01/20 | 2.200% | | 2,225,000 | 2,227,447 |
| INEOS Group Holdings SA(d) |
| 08/01/24 | 5.625% | | 389,000 | 395,808 |
| Koppers, Inc.(d) |
| 02/15/25 | 6.000% | | 89,000 | 93,228 |
| LYB International Finance BV |
| 03/15/44 | 4.875% | | 3,515,000 | 3,639,174 |
| Olin Corp. |
| 09/15/27 | 5.125% | | 160,000 | 166,600 |
| Platform Specialty Products Corp.(d) |
| 05/01/21 | 10.375% | | 258,000 | 287,348 |
| 02/01/22 | 6.500% | | 147,000 | 150,675 |
| PQ Corp.(d) |
| 11/15/22 | 6.750% | | 250,000 | 269,375 |
| SPCM SA |
| 09/15/25 | 4.875% | | 217,000 | 219,441 |
| WR Grace & Co.(d) |
| 10/01/21 | 5.125% | | 331,000 | 355,411 |
| Total | 9,841,043 |
| Construction Machinery 0.1% |
| Ritchie Bros. Auctioneers, Inc.(d) |
| 01/15/25 | 5.375% | | 77,000 | 79,502 |
| United Rentals North America, Inc. |
| 09/15/26 | 5.875% | | 524,000 | 552,820 |
| 05/15/27 | 5.500% | | 345,000 | 354,919 |
| Total | 987,241 |
| Consumer Cyclical Services 0.2% |
| APX Group, Inc. |
| 12/01/19 | 6.375% | | 44,000 | 45,540 |
| 12/01/20 | 8.750% | | 339,000 | 351,289 |
| 12/01/22 | 7.875% | | 377,000 | 410,930 |
| APX Group, Inc.(d) |
| 12/01/22 | 7.875% | | 111,000 | 120,990 |
| Carlson Travel, Inc.(d) |
| 12/15/23 | 6.750% | | 55,000 | 56,822 |
| IHS Markit Ltd.(d) |
| 11/01/22 | 5.000% | | 594,000 | 634,837 |
| 02/15/25 | 4.750% | | 160,000 | 167,400 |
The accompanying Notes to Financial Statements are an integral part of this statement.
Columbia Corporate Income Fund | Annual Report 2017
| 9 |
Portfolio of Investments (continued)
April 30, 2017
| Corporate Bonds & Notes (continued) |
| Issuer | Coupon
Rate | | Principal
Amount ($) | Value ($) |
| Interval Acquisition Corp. |
| 04/15/23 | 5.625% | | 483,000 | 497,490 |
| Total | 2,285,298 |
| Consumer Products 0.2% |
| American Greetings Corp.(d) |
| 02/15/25 | 7.875% | | 37,000 | 39,498 |
| Prestige Brands, Inc.(d) |
| 03/01/24 | 6.375% | | 284,000 | 303,880 |
| Scotts Miracle-Gro Co. (The) |
| 10/15/23 | 6.000% | | 266,000 | 284,287 |
| Scotts Miracle-Gro Co. (The)(d) |
| 12/15/26 | 5.250% | | 74,000 | 76,035 |
| Spectrum Brands, Inc. |
| 11/15/22 | 6.625% | | 385,000 | 405,212 |
| 07/15/25 | 5.750% | | 422,000 | 452,346 |
| Springs Industries, Inc. |
| 06/01/21 | 6.250% | | 201,000 | 207,030 |
| Tempur Sealy International, Inc. |
| 10/15/23 | 5.625% | | 187,000 | 191,114 |
| 06/15/26 | 5.500% | | 216,000 | 214,786 |
| Valvoline, Inc.(d) |
| 07/15/24 | 5.500% | | 39,000 | 41,243 |
| Total | 2,215,431 |
| Diversified Manufacturing 1.4% |
| Entegris, Inc.(d) |
| 04/01/22 | 6.000% | | 350,000 | 364,875 |
| General Electric Co. |
| 10/09/42 | 4.125% | | 3,185,000 | 3,289,064 |
| Honeywell International, Inc. |
| 10/30/19 | 1.400% | | 8,325,000 | 8,264,702 |
| SPX FLOW, Inc.(d) |
| 08/15/24 | 5.625% | | 72,000 | 72,900 |
| 08/15/26 | 5.875% | | 266,000 | 269,325 |
| United Technologies Corp. |
| 11/01/46 | 3.750% | | 5,360,000 | 5,150,751 |
| Welbilt, Inc. |
| 02/15/24 | 9.500% | | 68,000 | 78,540 |
| WESCO Distribution, Inc. |
| 06/15/24 | 5.375% | | 104,000 | 106,860 |
| Zekelman Industries, Inc.(d) |
| 06/15/23 | 9.875% | | 139,000 | 157,070 |
| Total | 17,754,087 |
| Electric 21.0% |
| AES Corp. (The) |
| 05/15/26 | 6.000% | | 216,000 | 227,880 |
| Corporate Bonds & Notes (continued) |
| Issuer | Coupon
Rate | | Principal
Amount ($) | Value ($) |
| Appalachian Power Co. |
| 05/15/44 | 4.400% | | 3,268,000 | 3,367,314 |
| 06/01/45 | 4.450% | | 30,000 | 31,356 |
| Arizona Public Service Co. |
| 05/15/46 | 3.750% | | 3,435,000 | 3,253,055 |
| Berkshire Hathaway Energy Co. |
| 11/15/23 | 3.750% | | 7,440,000 | 7,827,297 |
| 02/01/45 | 4.500% | | 804,000 | 847,954 |
| Calpine Corp.(d) |
| 01/15/22 | 6.000% | | 441,000 | 459,742 |
| CMS Energy Corp. |
| 03/01/24 | 3.875% | | 5,250,000 | 5,451,873 |
| 11/15/25 | 3.600% | | 12,670,000 | 12,820,558 |
| 02/15/27 | 2.950% | | 3,035,000 | 2,895,241 |
| 03/31/43 | 4.700% | | 945,000 | 978,820 |
| 03/01/44 | 4.875% | | 42,000 | 45,086 |
| Consolidated Edison Co. of New York, Inc. |
| 06/15/46 | 3.850% | | 2,655,000 | 2,581,302 |
| DTE Energy Co. |
| 06/01/24 | 3.500% | | 19,404,000 | 19,639,526 |
| 10/01/26 | 2.850% | | 18,690,000 | 17,662,162 |
| Duke Energy Corp. |
| 10/15/23 | 3.950% | | 8,133,000 | 8,589,774 |
| 04/15/24 | 3.750% | | 6,036,000 | 6,277,217 |
| 09/01/46 | 3.750% | | 2,475,000 | 2,267,075 |
| Duke Energy Florida LLC |
| 01/15/27 | 3.200% | | 4,265,000 | 4,310,337 |
| Duke Energy Progress LLC |
| 10/15/46 | 3.700% | | 2,415,000 | 2,306,318 |
| Dynegy, Inc. |
| 11/01/24 | 7.625% | | 110,000 | 100,650 |
| Emera US Finance LP |
| 06/15/46 | 4.750% | | 8,419,000 | 8,548,998 |
| Eversource Energy |
| 03/15/22 | 2.750% | | 1,235,000 | 1,244,985 |
| Indiana Michigan Power Co. |
| 03/15/23 | 3.200% | | 13,195,000 | 13,417,494 |
| MidAmerican Energy Co. |
| 08/01/47 | 3.950% | | 1,540,000 | 1,543,522 |
| NextEra Energy Capital Holdings, Inc. |
| 05/01/27 | 3.550% | | 7,135,000 | 7,180,800 |
| NRG Energy, Inc. |
| 05/01/24 | 6.250% | | 340,000 | 338,810 |
| 05/15/26 | 7.250% | | 149,000 | 152,352 |
| 01/15/27 | 6.625% | | 396,000 | 392,040 |
| NRG Yield Operating LLC |
| 08/15/24 | 5.375% | | 596,000 | 609,410 |
The accompanying Notes to Financial Statements are an integral part of this statement.
| 10 | Columbia Corporate Income Fund | Annual Report 2017 |
Portfolio of Investments (continued)
April 30, 2017
| Corporate Bonds & Notes (continued) |
| Issuer | Coupon
Rate | | Principal
Amount ($) | Value ($) |
| NRG Yield Operating LLC(d) |
| 09/15/26 | 5.000% | | 139,000 | 136,220 |
| Oncor Electric Delivery Co. LLC |
| 09/30/17 | 5.000% | | 4,000,000 | 4,056,976 |
| Pacific Gas & Electric Co. |
| 06/15/23 | 3.250% | | 5,128,000 | 5,273,368 |
| 02/15/24 | 3.750% | | 12,370,000 | 13,058,106 |
| 03/15/27 | 3.300% | | 730,000 | 739,389 |
| 02/15/44 | 4.750% | | 3,463,000 | 3,844,082 |
| Pattern Energy Group, Inc.(d) |
| 02/01/24 | 5.875% | | 294,000 | 301,717 |
| PPL Capital Funding, Inc. |
| 06/01/23 | 3.400% | | 15,116,000 | 15,444,199 |
| 03/15/24 | 3.950% | | 4,000 | 4,164 |
| Progress Energy, Inc. |
| 04/01/22 | 3.150% | | 21,180,000 | 21,566,959 |
| Public Service Enterprise Group, Inc. |
| 11/15/19 | 1.600% | | 3,270,000 | 3,235,652 |
| Sierra Pacific Power Co. |
| 05/01/26 | 2.600% | | 4,900,000 | 4,732,832 |
| Southern Co. (The) |
| 07/01/46 | 4.400% | | 11,995,000 | 11,933,154 |
| TransAlta Corp. |
| 06/03/17 | 1.900% | | 15,885,000 | 15,885,751 |
| Virginia Electric & Power Co. |
| 11/15/46 | 4.000% | | 1,280,000 | 1,277,666 |
| WEC Energy Group, Inc. |
| 06/15/25 | 3.550% | | 8,425,000 | 8,694,811 |
| Xcel Energy, Inc. |
| 12/01/26 | 3.350% | | 14,135,000 | 14,261,324 |
| Total | 259,815,318 |
| Finance Companies 0.3% |
| Aircastle Ltd. |
| 03/15/21 | 5.125% | | 198,000 | 211,117 |
| 04/01/23 | 5.000% | | 61,000 | 65,118 |
| iStar, Inc. |
| 04/01/22 | 6.000% | | 209,000 | 214,225 |
| Navient Corp. |
| 03/25/20 | 8.000% | | 34,000 | 37,315 |
| 10/26/20 | 5.000% | | 91,000 | 92,706 |
| 07/26/21 | 6.625% | | 258,000 | 273,157 |
| 06/15/22 | 6.500% | | 184,000 | 190,210 |
| 10/25/24 | 5.875% | | 368,000 | 357,880 |
| OneMain Financial Holdings LLC(d) |
| 12/15/19 | 6.750% | | 271,000 | 284,550 |
| 12/15/21 | 7.250% | | 365,000 | 379,640 |
| Corporate Bonds & Notes (continued) |
| Issuer | Coupon
Rate | | Principal
Amount ($) | Value ($) |
| Park Aerospace Holdings Ltd.(d) |
| 08/15/22 | 5.250% | | 119,000 | 125,694 |
| 02/15/24 | 5.500% | | 119,000 | 125,843 |
| Provident Funding Associates LP/Finance Corp.(d) |
| 06/15/21 | 6.750% | | 698,000 | 715,450 |
| Quicken Loans, Inc.(d) |
| 05/01/25 | 5.750% | | 297,000 | 299,970 |
| Springleaf Finance Corp. |
| 10/01/21 | 7.750% | | 36,000 | 38,588 |
| Total | 3,411,463 |
| Food and Beverage 10.6% |
| Anheuser-Busch InBev Finance, Inc. |
| 02/01/26 | 3.650% | | 26,160,000 | 26,657,851 |
| B&G Foods, Inc. |
| 04/01/25 | 5.250% | | 164,000 | 167,900 |
| Bacardi Ltd.(d) |
| 07/15/26 | 2.750% | | 7,870,000 | 7,485,716 |
| Chobani LLC/Finance Corp., Inc.(d) |
| 04/15/25 | 7.500% | | 233,000 | 240,281 |
| ConAgra Foods, Inc. |
| 01/25/23 | 3.200% | | 20,178,000 | 20,442,433 |
| FAGE International SA/USA Dairy Industry, Inc.(d) |
| 08/15/26 | 5.625% | | 190,000 | 193,325 |
| General Mills, Inc. |
| 10/20/17 | 1.400% | | 3,520,000 | 3,523,161 |
| Grupo Bimbo SAB de CV(d) |
| 06/27/44 | 4.875% | | 1,850,000 | 1,801,718 |
| JM Smucker Co. (The) |
| 03/15/18 | 1.750% | | 20,500,000 | 20,522,960 |
| Kellogg Co. |
| 12/01/23 | 2.650% | | 5,288,000 | 5,190,907 |
| Kraft Heinz Foods Co. |
| 06/05/17 | 2.250% | | 180,000 | 180,133 |
| 06/01/46 | 4.375% | | 5,925,000 | 5,637,264 |
| Lamb Weston Holdings, Inc.(d) |
| 11/01/24 | 4.625% | | 113,000 | 116,672 |
| 11/01/26 | 4.875% | | 188,000 | 193,875 |
| Molson Coors Brewing Co.(d) |
| 03/15/19 | 1.900% | | 3,940,000 | 3,937,597 |
| Molson Coors Brewing Co. |
| 07/15/26 | 3.000% | | 11,615,000 | 11,150,725 |
| 05/01/42 | 5.000% | | 1,460,000 | 1,556,411 |
| 07/15/46 | 4.200% | | 214,000 | 202,408 |
| Mondelez International, Inc.(d) |
| 10/28/19 | 1.625% | | 7,515,000 | 7,392,070 |
| PepsiCo, Inc.(e) |
| 05/02/19 | 1.550% | | 6,170,000 | 6,165,496 |
The accompanying Notes to Financial Statements are an integral part of this statement.
Columbia Corporate Income Fund | Annual Report 2017
| 11 |
Portfolio of Investments (continued)
April 30, 2017
| Corporate Bonds & Notes (continued) |
| Issuer | Coupon
Rate | | Principal
Amount ($) | Value ($) |
| Pinnacle Foods Finance LLC/Corp. |
| 01/15/24 | 5.875% | | 42,000 | 44,783 |
| Post Holdings, Inc.(d) |
| 03/15/24 | 7.750% | | 140,000 | 155,575 |
| 03/01/25 | 5.500% | | 101,000 | 105,545 |
| 08/15/26 | 5.000% | | 488,000 | 485,560 |
| 03/01/27 | 5.750% | | 169,000 | 175,549 |
| Sysco Corp. |
| 07/15/21 | 2.500% | | 2,055,000 | 2,059,523 |
| Tyson Foods, Inc. |
| 08/15/19 | 2.650% | | 5,884,000 | 5,943,240 |
| Total | 131,728,678 |
| Gaming 0.4% |
| Boyd Gaming Corp. |
| 05/15/23 | 6.875% | | 297,000 | 319,646 |
| 04/01/26 | 6.375% | | 103,000 | 110,983 |
| GLP Capital LP/Financing II, Inc. |
| 11/01/23 | 5.375% | | 292,000 | 315,360 |
| 04/15/26 | 5.375% | | 61,000 | 64,355 |
| International Game Technology PLC(d) |
| 02/15/22 | 6.250% | | 542,000 | 590,780 |
| Isle of Capri Casinos LLC(d) |
| 04/01/25 | 6.000% | | 127,000 | 131,286 |
| Jack Ohio Finance LLC/1 Corp.(d) |
| 11/15/21 | 6.750% | | 349,000 | 364,705 |
| MGM Growth Properties Operating Partnership LP/Finance Co-Issuer, Inc. |
| 05/01/24 | 5.625% | | 104,000 | 112,190 |
| 09/01/26 | 4.500% | | 122,000 | 121,543 |
| MGM Resorts International |
| 10/01/20 | 6.750% | | 616,000 | 685,300 |
| 03/15/23 | 6.000% | | 281,000 | 306,992 |
| 09/01/26 | 4.625% | | 608,000 | 606,480 |
| Penn National Gaming, Inc.(d) |
| 01/15/27 | 5.625% | | 79,000 | 79,593 |
| Rivers Pittsburgh Borrower LP/Finance Corp.(d) |
| 08/15/21 | 6.125% | | 73,000 | 73,791 |
| Scientific Games International, Inc.(d) |
| 01/01/22 | 7.000% | | 987,000 | 1,056,702 |
| Seminole Tribe of Florida, Inc.(d) |
| 10/01/20 | 6.535% | | 156,000 | 159,120 |
| 10/01/20 | 7.804% | | 250,000 | 257,972 |
| Tunica-Biloxi Gaming Authority(d),(g) |
| 11/15/16 | 0.000% | | 203,000 | 71,050 |
| Total | 5,427,848 |
| Corporate Bonds & Notes (continued) |
| Issuer | Coupon
Rate | | Principal
Amount ($) | Value ($) |
| Health Care 2.6% |
| Acadia Healthcare Co., Inc. |
| 02/15/23 | 5.625% | | 159,000 | 164,524 |
| 03/01/24 | 6.500% | | 188,000 | 199,280 |
| Becton Dickinson and Co. |
| 12/15/19 | 2.675% | | 9,195,000 | 9,258,777 |
| Change Healthcare Holdings LLC/Finance, Inc. |
| 03/01/25 | 5.750% | | 282,000 | 289,402 |
| CHS/Community Health Systems, Inc. |
| 02/01/22 | 6.875% | | 259,000 | 214,323 |
| 03/31/23 | 6.250% | | 494,000 | 502,645 |
| DaVita, Inc. |
| 07/15/24 | 5.125% | | 608,000 | 625,103 |
| Envision Healthcare Corp.(d) |
| 12/01/24 | 6.250% | | 220,000 | 231,550 |
| Express Scripts Holding Co. |
| 07/15/46 | 4.800% | | 4,770,000 | 4,636,860 |
| HCA, Inc. |
| 02/01/25 | 5.375% | | 429,000 | 446,696 |
| 04/15/25 | 5.250% | | 560,000 | 601,826 |
| 02/15/26 | 5.875% | | 335,000 | 355,937 |
| 02/15/27 | 4.500% | | 327,000 | 330,103 |
| Hill-Rom Holdings, Inc.(d) |
| 02/15/25 | 5.000% | | 162,000 | 164,025 |
| Hologic, Inc.(d) |
| 07/15/22 | 5.250% | | 341,000 | 359,329 |
| MEDNAX, Inc.(d) |
| 12/01/23 | 5.250% | | 177,000 | 180,983 |
| Medtronic Global Holdings SCA |
| 03/28/19 | 1.700% | | 10,255,000 | 10,251,113 |
| MPH Acquisition Holdings LLC(d) |
| 06/01/24 | 7.125% | | 465,000 | 499,875 |
| Quintiles IMS, Inc.(d) |
| 10/15/26 | 5.000% | | 564,000 | 575,280 |
| Sterigenics-Nordion Holdings LLC(d) |
| 05/15/23 | 6.500% | | 449,000 | 462,470 |
| Team Health Holdings, Inc.(d) |
| 02/01/25 | 6.375% | | 217,000 | 209,948 |
| Teleflex, Inc. |
| 06/01/26 | 4.875% | | 62,000 | 62,930 |
| Tenet Healthcare Corp. |
| 06/01/20 | 4.750% | | 638,000 | 647,570 |
| 04/01/22 | 8.125% | | 235,000 | 238,525 |
| 06/15/23 | 6.750% | | 109,000 | 104,095 |
| Tenet Healthcare Corp.(d) |
| 01/01/22 | 7.500% | | 142,000 | 151,940 |
| Total | 31,765,109 |
The accompanying Notes to Financial Statements are an integral part of this statement.
| 12 | Columbia Corporate Income Fund | Annual Report 2017 |
Portfolio of Investments (continued)
April 30, 2017
| Corporate Bonds & Notes (continued) |
| Issuer | Coupon
Rate | | Principal
Amount ($) | Value ($) |
| Healthcare Insurance 1.1% |
| Centene Corp. |
| 05/15/22 | 4.750% | | 440,000 | 456,500 |
| 02/15/24 | 6.125% | | 324,000 | 349,110 |
| 01/15/25 | 4.750% | | 91,000 | 92,479 |
| Molina Healthcare, Inc. |
| 11/15/22 | 5.375% | | 104,000 | 108,680 |
| UnitedHealth Group, Inc. |
| 12/15/17 | 1.400% | | 7,835,000 | 7,835,250 |
| 04/15/47 | 4.250% | | 4,030,000 | 4,159,331 |
| WellCare Health Plans, Inc. |
| 04/01/25 | 5.250% | | 392,000 | 407,680 |
| Total | 13,409,030 |
| Home Construction 0.1% |
| CalAtlantic Group, Inc. |
| 12/15/21 | 6.250% | | 271,000 | 301,447 |
| 11/15/24 | 5.875% | | 195,000 | 209,625 |
| 06/01/26 | 5.250% | | 63,000 | 64,733 |
| Lennar Corp. |
| 04/30/24 | 4.500% | | 312,000 | 315,120 |
| Meritage Homes Corp. |
| 06/01/25 | 6.000% | | 444,000 | 473,082 |
| Taylor Morrison Communities, Inc./Holdings II(d) |
| 04/15/21 | 5.250% | | 355,000 | 364,844 |
| Total | 1,728,851 |
| Independent Energy 2.3% |
| Anadarko Petroleum Corp. |
| 07/15/44 | 4.500% | | 4,630,000 | 4,461,343 |
| Antero Resources Corp. |
| 12/01/22 | 5.125% | | 440,000 | 446,600 |
| Callon Petroleum Co.(d) |
| 10/01/24 | 6.125% | | 139,000 | 145,603 |
| Canadian Natural Resources Ltd. |
| 02/01/35 | 5.850% | | 2,674,000 | 2,926,014 |
| Carrizo Oil & Gas, Inc. |
| 04/15/23 | 6.250% | | 989,000 | 996,417 |
| Chesapeake Energy Corp.(d) |
| 01/15/25 | 8.000% | | 345,000 | 341,119 |
| Concho Resources, Inc. |
| 04/01/23 | 5.500% | | 881,000 | 913,487 |
| Continental Resources, Inc. |
| 09/15/22 | 5.000% | | 1,817,000 | 1,832,899 |
| CrownRock LP/Finance, Inc.(d) |
| 02/15/23 | 7.750% | | 462,000 | 494,340 |
| Corporate Bonds & Notes (continued) |
| Issuer | Coupon
Rate | | Principal
Amount ($) | Value ($) |
| Denbury Resources, Inc.(d) |
| 05/15/21 | 9.000% | | 301,000 | 317,555 |
| Diamondback Energy, Inc.(d) |
| 11/01/24 | 4.750% | | 82,000 | 82,205 |
| 05/31/25 | 5.375% | | 444,000 | 459,540 |
| Extraction Oil & Gas Holdings LLC/Finance Corp.(d) |
| 07/15/21 | 7.875% | | 575,000 | 602,312 |
| Halcon Resources Corp.(d) |
| 02/15/25 | 6.750% | | 290,000 | 278,400 |
| Hess Corp. |
| 04/01/47 | 5.800% | | 1,080,000 | 1,121,703 |
| Laredo Petroleum, Inc. |
| 01/15/22 | 5.625% | | 1,141,000 | 1,141,000 |
| MEG Energy Corp.(d) |
| 01/15/25 | 6.500% | | 169,000 | 166,888 |
| Newfield Exploration Co. |
| 07/01/24 | 5.625% | | 240,000 | 253,651 |
| Noble Energy, Inc. |
| 11/15/43 | 5.250% | | 2,928,000 | 3,063,127 |
| Oasis Petroleum, Inc. |
| 01/15/23 | 6.875% | | 41,000 | 41,410 |
| Parsley Energy LLC/Finance Corp.(d) |
| 06/01/24 | 6.250% | | 163,000 | 172,372 |
| 01/15/25 | 5.375% | | 397,000 | 400,970 |
| Parsley Energy LLC/Finance Corp. |
| 08/15/25 | 5.250% | | 352,000 | 354,640 |
| PDC Energy, Inc.(d) |
| 09/15/24 | 6.125% | | 396,000 | 405,900 |
| RSP Permian, Inc.(d) |
| 01/15/25 | 5.250% | | 676,000 | 686,140 |
| SM Energy Co. |
| 06/01/25 | 5.625% | | 85,000 | 81,175 |
| 09/15/26 | 6.750% | | 695,000 | 700,212 |
| Whiting Petroleum Corp. |
| 03/15/21 | 5.750% | | 368,000 | 366,160 |
| 04/01/23 | 6.250% | | 227,000 | 227,000 |
| Woodside Finance Ltd.(d) |
| 03/05/25 | 3.650% | | 4,518,000 | 4,471,239 |
| WPX Energy, Inc. |
| 01/15/22 | 6.000% | | 951,000 | 965,265 |
| Total | 28,916,686 |
| Integrated Energy 1.1% |
| Cenovus Energy, Inc. |
| 09/15/42 | 4.450% | | 9,661,000 | 8,341,732 |
| 09/15/43 | 5.200% | | 5,384,000 | 5,115,500 |
| Total | 13,457,232 |
The accompanying Notes to Financial Statements are an integral part of this statement.
Columbia Corporate Income Fund | Annual Report 2017
| 13 |
Portfolio of Investments (continued)
April 30, 2017
| Corporate Bonds & Notes (continued) |
| Issuer | Coupon
Rate | | Principal
Amount ($) | Value ($) |
| Leisure 0.1% |
| AMC Entertainment Holdings, Inc.(d) |
| 05/15/27 | 6.125% | | 115,000 | 117,444 |
| Cedar Fair LP/Canada’s Wonderland Co./Magnum Management Corp./Millenium Operations LLC |
| 04/15/27 | 5.375% | | 245,000 | 253,244 |
| Live Nation Entertainment, Inc.(d) |
| 11/01/24 | 4.875% | | 256,000 | 257,920 |
| LTF Merger Sub, Inc.(d) |
| 06/15/23 | 8.500% | | 281,000 | 298,563 |
| Silversea Cruise Finance Ltd.(d) |
| 02/01/25 | 7.250% | | 102,000 | 108,120 |
| Total | 1,035,291 |
| Life Insurance 7.1% |
| Five Corners Funding Trust(d) |
| 11/15/23 | 4.419% | | 31,430,000 | 33,778,261 |
| Guardian Life Insurance Co. of America (The)(d) |
| Subordinated |
| 06/19/64 | 4.875% | | 7,781,000 | 8,145,174 |
| MetLife, Inc. |
| 09/15/23 | 4.368% | | 3,482,000 | 3,779,063 |
| Northwestern Mutual Life Insurance Co. (The)(d) |
| Subordinated |
| 03/30/40 | 6.063% | | 3,457,000 | 4,443,421 |
| Peachtree Corners Funding Trust(d) |
| 02/15/25 | 3.976% | | 12,368,000 | 12,542,067 |
| Teachers Insurance & Annuity Association of America(d) |
| Subordinated |
| 09/15/44 | 4.900% | | 8,670,000 | 9,529,778 |
| TIAA Asset Management Finance Co. LLC(d) |
| 11/01/19 | 2.950% | | 12,340,000 | 12,538,600 |
| Voya Financial, Inc. |
| 06/15/46 | 4.800% | | 2,635,000 | 2,667,600 |
| Total | 87,423,964 |
| Lodging 0.1% |
| Hilton Domestic Operating Co., Inc.(d) |
| 09/01/24 | 4.250% | | 159,000 | 160,193 |
| Hilton Grand Vacations Borrower LLC/Inc.(d) |
| 12/01/24 | 6.125% | | 118,000 | 125,670 |
| Playa Resorts Holding BV(d) |
| 08/15/20 | 8.000% | | 428,000 | 449,935 |
| Total | 735,798 |
| Corporate Bonds & Notes (continued) |
| Issuer | Coupon
Rate | | Principal
Amount ($) | Value ($) |
| Media and Entertainment 2.1% |
| 21st Century Fox America, Inc. |
| 09/15/44 | 4.750% | | 8,918,000 | 9,077,168 |
| 11/15/46 | 4.750% | | 950,000 | 966,712 |
| AMC Networks, Inc. |
| 04/01/24 | 5.000% | | 147,000 | 148,933 |
| CBS Radio, Inc.(d) |
| 11/01/24 | 7.250% | | 63,000 | 68,513 |
| Lamar Media Corp. |
| 02/01/26 | 5.750% | | 89,000 | 96,899 |
| Match Group, Inc. |
| 06/01/24 | 6.375% | | 280,000 | 304,850 |
| MDC Partners, Inc.(d) |
| 05/01/24 | 6.500% | | 628,000 | 612,300 |
| Netflix, Inc. |
| 02/15/25 | 5.875% | | 756,000 | 820,260 |
| Netflix, Inc.(d) |
| 11/15/26 | 4.375% | | 702,000 | 691,470 |
| Nielsen Luxembourg SARL(d) |
| 02/01/25 | 5.000% | | 345,000 | 345,431 |
| Outfront Media Capital LLC/Corp. |
| 03/15/25 | 5.875% | | 551,000 | 582,682 |
| Scripps Networks Interactive, Inc. |
| 11/15/24 | 3.900% | | 6,356,000 | 6,491,154 |
| Thomson Reuters Corp. |
| 05/23/43 | 4.500% | | 3,578,000 | 3,413,831 |
| Time Warner, Inc. |
| 03/29/41 | 6.250% | | 2,200,000 | 2,532,721 |
| Univision Communications, Inc.(d) |
| 02/15/25 | 5.125% | | 410,000 | 408,463 |
| Total | 26,561,387 |
| Metals and Mining 0.3% |
| Constellium NV(d) |
| 05/15/24 | 5.750% | | 516,000 | 483,750 |
| 03/01/25 | 6.625% | | 188,000 | 185,180 |
| First Quantum Minerals Ltd.(d) |
| 04/01/25 | 7.500% | | 232,000 | 236,640 |
| Freeport-McMoRan, Inc. |
| 03/01/22 | 3.550% | | 92,000 | 86,480 |
| 03/15/23 | 3.875% | | 238,000 | 220,745 |
| 11/14/24 | 4.550% | | 669,000 | 628,525 |
| Grinding Media, Inc./MC Canada, Inc.(d) |
| 12/15/23 | 7.375% | | 176,000 | 187,757 |
| HudBay Minerals, Inc.(d) |
| 01/15/23 | 7.250% | | 75,000 | 79,781 |
| 01/15/25 | 7.625% | | 224,000 | 239,960 |
The accompanying Notes to Financial Statements are an integral part of this statement.
| 14 | Columbia Corporate Income Fund | Annual Report 2017 |
Portfolio of Investments (continued)
April 30, 2017
| Corporate Bonds & Notes (continued) |
| Issuer | Coupon
Rate | | Principal
Amount ($) | Value ($) |
| Novelis Corp.(d) |
| 08/15/24 | 6.250% | | 128,000 | 134,720 |
| 09/30/26 | 5.875% | | 574,000 | 589,785 |
| Teck Resources Ltd.(d) |
| 06/01/24 | 8.500% | | 214,000 | 247,973 |
| Teck Resources Ltd. |
| 07/15/41 | 6.250% | | 650,000 | 689,000 |
| Total | 4,010,296 |
| Midstream 4.7% |
| Energy Transfer Equity LP |
| 06/01/27 | 5.500% | | 1,089,000 | 1,170,675 |
| Enterprise Products Operating LLC |
| 02/15/45 | 5.100% | | 6,436,000 | 6,883,353 |
| 05/15/46 | 4.900% | | 3,000 | 3,138 |
| Holly Energy Partners LP/Finance Corp.(d) |
| 08/01/24 | 6.000% | | 54,000 | 57,105 |
| Kinder Morgan Energy Partners LP |
| 03/01/43 | 5.000% | | 10,396,000 | 10,137,940 |
| Kinder Morgan, Inc. |
| 02/15/46 | 5.050% | | 5,235,000 | 5,209,186 |
| NuStar Logistics LP |
| 04/28/27 | 5.625% | | 247,000 | 254,726 |
| Plains All American Pipeline LP/Finance Corp. |
| 10/15/23 | 3.850% | | 11,497,000 | 11,605,072 |
| 11/01/24 | 3.600% | | 1,355,000 | 1,334,022 |
| 06/15/44 | 4.700% | | 6,235,000 | 5,790,762 |
| Southern Natural Gas Co. LLC(d) |
| 03/15/47 | 4.800% | | 4,327,000 | 4,462,418 |
| Tallgrass Energy Partners LP/Finance Corp.(d) |
| 09/15/24 | 5.500% | | 100,000 | 100,500 |
| Targa Resources Partners LP/Finance Corp. |
| 11/15/23 | 4.250% | | 262,000 | 259,380 |
| 03/15/24 | 6.750% | | 267,000 | 291,030 |
| Targa Resources Partners LP/Finance Corp.(d) |
| 02/01/27 | 5.375% | | 596,000 | 622,820 |
| Tesoro Logistics LP/Finance Corp. |
| 10/15/22 | 6.250% | | 476,000 | 510,510 |
| 05/01/24 | 6.375% | | 67,000 | 73,198 |
| 01/15/25 | 5.250% | | 629,000 | 667,526 |
| Williams Companies, Inc. (The) |
| 01/15/23 | 3.700% | | 244,000 | 240,340 |
| 06/24/24 | 4.550% | | 698,000 | 714,577 |
| Williams Partners LP |
| 09/15/45 | 5.100% | | 7,379,000 | 7,526,300 |
| Total | 57,914,578 |
| Corporate Bonds & Notes (continued) |
| Issuer | Coupon
Rate | | Principal
Amount ($) | Value ($) |
| Natural Gas 3.2% |
| CenterPoint Energy Resources Corp. |
| 11/01/17 | 6.125% | | 7,966,000 | 8,127,256 |
| NiSource Finance Corp. |
| 02/15/43 | 5.250% | | 5,620,000 | 6,214,439 |
| Sempra Energy |
| 12/01/23 | 4.050% | | 17,905,000 | 18,895,343 |
| 06/15/24 | 3.550% | | 6,110,000 | 6,252,448 |
| Total | 39,489,486 |
| Oil Field Services 0.1% |
| Nabors Industries, Inc.(d) |
| 01/15/23 | 5.500% | | 54,000 | 54,608 |
| Precision Drilling Corp.(d) |
| 12/15/23 | 7.750% | | 28,000 | 29,680 |
| SESI LLC |
| 12/15/21 | 7.125% | | 54,000 | 54,540 |
| Trinidad Drilling Ltd.(d) |
| 02/15/25 | 6.625% | | 76,000 | 76,570 |
| Weatherford International Ltd. |
| 06/15/23 | 8.250% | | 643,000 | 696,851 |
| 08/01/36 | 6.500% | | 175,000 | 165,375 |
| Weatherford International Ltd.(d) |
| 02/15/24 | 9.875% | | 262,000 | 305,230 |
| Total | 1,382,854 |
| Other Financial Institutions 0.0% |
| Icahn Enterprises LP/Finance Corp.(d) |
| 02/01/22 | 6.250% | | 142,000 | 147,680 |
| Other Industry 0.0% |
| Booz Allen Hamilton, Inc. |
| 05/01/25 | 5.125% | | 40,000 | 40,700 |
| Other REIT 0.0% |
| CyrusOne LP/Finance Corp.(d) |
| 03/15/24 | 5.000% | | 104,000 | 106,860 |
| 03/15/27 | 5.375% | | 104,000 | 107,120 |
| Total | 213,980 |
| Packaging 0.3% |
| ARD Finance SA PIK(d) |
| 09/15/23 | 7.125% | | 180,000 | 186,750 |
| Ardagh Packaging Finance PLC/Holdings USA, Inc.(d) |
| 05/15/23 | 4.625% | | 213,000 | 217,526 |
| 05/15/24 | 7.250% | | 510,000 | 555,262 |
| 02/15/25 | 6.000% | | 548,000 | 566,495 |
The accompanying Notes to Financial Statements are an integral part of this statement.
Columbia Corporate Income Fund | Annual Report 2017
| 15 |
Portfolio of Investments (continued)
April 30, 2017
| Corporate Bonds & Notes (continued) |
| Issuer | Coupon
Rate | | Principal
Amount ($) | Value ($) |
| Berry Plastics Corp. |
| 10/15/22 | 6.000% | | 205,000 | 217,813 |
| 07/15/23 | 5.125% | | 480,000 | 499,056 |
| Novolex (d) |
| 01/15/25 | 6.875% | | 97,000 | 99,910 |
| Owens-Brockway Glass Container, Inc.(d) |
| 01/15/25 | 5.375% | | 99,000 | 103,208 |
| Plastipak Holdings, Inc.(d) |
| 10/01/21 | 6.500% | | 236,000 | 242,490 |
| Reynolds Group Issuer, Inc./LLC |
| 10/15/20 | 5.750% | | 645,000 | 664,350 |
| Reynolds Group Issuer, Inc./LLC(d) |
| 07/15/24 | 7.000% | | 374,000 | 402,517 |
| Signode Industrial Group Luxembourg SA/US, Inc.(d) |
| 05/01/22 | 6.375% | | 125,000 | 128,764 |
| Total | 3,884,141 |
| Pharmaceuticals 2.9% |
| AbbVie, Inc. |
| 05/14/46 | 4.450% | | 740,000 | 721,314 |
| Actavis Funding |
| 03/15/45 | 4.750% | | 4,007,000 | 4,081,093 |
| Actavis Funding SCS |
| 03/12/18 | 2.350% | | 5,365,000 | 5,387,694 |
| Amgen Inc. |
| 06/15/51 | 4.663% | | 7,220,000 | 7,273,955 |
| Endo Dac/Finance LLC/Finco, Inc.(d) |
| 07/15/23 | 6.000% | | 251,000 | 219,939 |
| Gilead Sciences, Inc. |
| 03/01/47 | 4.150% | | 3,535,000 | 3,338,818 |
| Jaguar Holding Co. II/Pharmaceutical Product Development LLC(d) |
| 08/01/23 | 6.375% | | 791,000 | 824,617 |
| Mallinckrodt International Finance SA/CB LLC(d) |
| 10/15/23 | 5.625% | | 20,000 | 19,100 |
| 04/15/25 | 5.500% | | 163,000 | 148,330 |
| Pfizer, Inc. |
| 12/15/46 | 4.125% | | 1,190,000 | 1,210,068 |
| Shire Acquisitions Investments Ireland DAC |
| 09/23/19 | 1.900% | | 8,295,000 | 8,248,117 |
| Teva Pharmaceutical Finance III BV |
| 10/01/26 | 3.150% | | 560,000 | 521,415 |
| Teva Pharmaceutical Finance Netherlands III BV |
| 10/01/46 | 4.100% | | 1,625,000 | 1,398,652 |
| Valeant Pharmaceuticals International, Inc.(d) |
| 10/15/20 | 6.375% | | 535,000 | 460,100 |
| 03/15/22 | 6.500% | | 101,000 | 103,399 |
| 05/15/23 | 5.875% | | 633,000 | 467,629 |
| 03/15/24 | 7.000% | | 400,000 | 408,000 |
| Corporate Bonds & Notes (continued) |
| Issuer | Coupon
Rate | | Principal
Amount ($) | Value ($) |
| 04/15/25 | 6.125% | | 844,000 | 623,083 |
| Total | 35,455,323 |
| Property & Casualty 3.4% |
| Alleghany Corp. |
| 06/27/22 | 4.950% | | 6,143,000 | 6,753,995 |
| Alliant Holdings Intermediate LP(d) |
| 08/01/23 | 8.250% | | 24,000 | 25,623 |
| Berkshire Hathaway Finance Corp. |
| 05/15/42 | 4.400% | | 6,077,000 | 6,448,779 |
| CNA Financial Corp. |
| 05/15/24 | 3.950% | | 5,686,000 | 5,890,486 |
| 03/01/26 | 4.500% | | 1,740,000 | 1,858,191 |
| HUB International Ltd.(d) |
| 10/01/21 | 7.875% | | 1,165,000 | 1,220,512 |
| Liberty Mutual Group, Inc.(d) |
| 06/15/23 | 4.250% | | 10,511,000 | 11,188,150 |
| Liberty Mutual Insurance Co.(d) |
| Subordinated |
| 10/15/26 | 7.875% | | 6,285,000 | 8,058,577 |
| Total | 41,444,313 |
| Railroads 0.6% |
| CSX Corp. |
| 11/01/46 | 3.800% | | 8,110,000 | 7,625,776 |
| Restaurants 0.6% |
| McDonald’s Corp. |
| 12/09/45 | 4.875% | | 2,284,000 | 2,460,069 |
| Yum! Brands, Inc. |
| 11/01/43 | 5.350% | | 5,950,000 | 5,221,125 |
| Total | 7,681,194 |
| Retailers 1.8% |
| Asbury Automotive Group, Inc. |
| 12/15/24 | 6.000% | | 359,000 | 370,667 |
| CVS Health Corp. |
| 06/01/21 | 2.125% | | 6,910,000 | 6,818,512 |
| 07/20/22 | 3.500% | | 3,955,000 | 4,110,602 |
| 07/20/25 | 3.875% | | 7,295,000 | 7,588,631 |
| Dollar Tree, Inc. |
| 03/01/23 | 5.750% | | 509,000 | 540,049 |
| Group 1 Automotive, Inc. |
| 06/01/22 | 5.000% | | 157,000 | 158,962 |
| Group 1 Automotive, Inc.(d) |
| 12/15/23 | 5.250% | | 127,000 | 127,953 |
| Hanesbrands, Inc.(d) |
| 05/15/24 | 4.625% | | 137,000 | 135,972 |
| 05/15/26 | 4.875% | | 136,000 | 135,320 |
The accompanying Notes to Financial Statements are an integral part of this statement.
| 16 | Columbia Corporate Income Fund | Annual Report 2017 |
Portfolio of Investments (continued)
April 30, 2017
| Corporate Bonds & Notes (continued) |
| Issuer | Coupon
Rate | | Principal
Amount ($) | Value ($) |
| L Brands, Inc. |
| 11/01/35 | 6.875% | | 235,000 | 231,710 |
| Penske Automotive Group, Inc. |
| 12/01/24 | 5.375% | | 248,000 | 249,860 |
| 05/15/26 | 5.500% | | 93,000 | 92,535 |
| Rite Aid Corp.(d) |
| 04/01/23 | 6.125% | | 40,000 | 39,600 |
| Rite Aid Corp. |
| Junior Subordinated |
| 02/15/27 | 7.700% | | 198,000 | 213,840 |
| Sally Holdings LLC/Capital, Inc. |
| 12/01/25 | 5.625% | | 87,000 | 89,828 |
| Target Corp. |
| 04/15/46 | 3.625% | | 1,300,000 | 1,187,520 |
| Total | 22,091,561 |
| Technology 2.8% |
| Apple, Inc. |
| 02/09/45 | 3.450% | | 6,447,000 | 5,868,014 |
| Broadcom Corp./Cayman Finance Ltd. |
| 01/15/27 | 3.875% | | 7,055,000 | 7,159,040 |
| Camelot Finance SA(d) |
| 10/15/24 | 7.875% | | 153,000 | 164,093 |
| Cisco Systems, Inc. |
| 09/20/19 | 1.400% | | 7,310,000 | 7,262,295 |
| Equinix, Inc. |
| 01/15/26 | 5.875% | | 84,000 | 90,510 |
| 05/15/27 | 5.375% | | 932,000 | 973,744 |
| First Data Corp.(d) |
| 08/15/23 | 5.375% | | 574,000 | 596,960 |
| 12/01/23 | 7.000% | | 770,000 | 825,594 |
| 01/15/24 | 5.750% | | 895,000 | 928,562 |
| Gartner, Inc.(d) |
| 04/01/25 | 5.125% | | 358,000 | 370,530 |
| Informatica LLC(d) |
| 07/15/23 | 7.125% | | 176,000 | 173,140 |
| Microsemi Corp.(d) |
| 04/15/23 | 9.125% | | 244,000 | 280,600 |
| Microsoft Corp. |
| 08/08/46 | 3.700% | | 2,870,000 | 2,736,591 |
| 02/06/47 | 4.250% | | 1,965,000 | 2,044,791 |
| MSCI, Inc.(d) |
| 11/15/24 | 5.250% | | 447,000 | 473,820 |
| 08/15/25 | 5.750% | | 268,000 | 288,770 |
| 08/01/26 | 4.750% | | 81,000 | 83,228 |
| Oracle Corp. |
| 07/15/46 | 4.000% | | 2,335,000 | 2,281,907 |
| Corporate Bonds & Notes (continued) |
| Issuer | Coupon
Rate | | Principal
Amount ($) | Value ($) |
| PTC, Inc. |
| 05/15/24 | 6.000% | | 281,000 | 300,670 |
| Riverbed Technology, Inc.(d) |
| 03/01/23 | 8.875% | | 101,000 | 104,030 |
| Sensata Technologies UK Financing Co. PLC(d) |
| 02/15/26 | 6.250% | | 200,000 | 216,500 |
| Solera LLC/Finance, Inc.(d) |
| 03/01/24 | 10.500% | | 258,000 | 294,442 |
| Symantec Corp.(d) |
| 04/15/25 | 5.000% | | 255,000 | 263,606 |
| Tempo Acquisition LLC/Finance Corp.(e) |
| 06/01/25 | 6.750% | | 142,000 | 145,905 |
| VeriSign, Inc. |
| 05/01/23 | 4.625% | | 382,000 | 390,977 |
| Total | 34,318,319 |
| Transportation Services 2.5% |
| Avis Budget Car Rental LLC/Finance, Inc.(d) |
| 03/15/25 | 5.250% | | 343,000 | 323,277 |
| ERAC U.S.A. Finance LLC(d) |
| 11/01/23 | 2.700% | | 7,490,000 | 7,228,195 |
| 11/15/24 | 3.850% | | 5,159,000 | 5,289,889 |
| 12/01/26 | 3.300% | | 15,275,000 | 14,817,682 |
| FedEx Corp. |
| 04/01/46 | 4.550% | | 3,440,000 | 3,475,284 |
| Hertz Corp. (The)(d) |
| 10/15/24 | 5.500% | | 437,000 | 376,912 |
| Total | 31,511,239 |
| Wireless 0.7% |
| Rogers Communications, Inc. |
| 08/15/18 | 6.800% | | 2,570,000 | 2,733,090 |
| SBA Communications Corp.(d) |
| 09/01/24 | 4.875% | | 891,000 | 898,796 |
| SFR Group SA(d) |
| 05/15/22 | 6.000% | | 333,000 | 347,152 |
| 05/01/26 | 7.375% | | 639,000 | 671,749 |
| Sprint Communications, Inc.(d) |
| 11/15/18 | 9.000% | | 839,000 | 917,656 |
| Sprint Communications, Inc. |
| 11/15/22 | 6.000% | | 448,000 | 466,760 |
| Sprint Corp. |
| 09/15/21 | 7.250% | | 679,000 | 742,656 |
| 06/15/24 | 7.125% | | 136,000 | 148,326 |
| 02/15/25 | 7.625% | | 535,000 | 597,194 |
| T-Mobile USA, Inc. |
| 01/15/26 | 6.500% | | 1,101,000 | 1,220,734 |
The accompanying Notes to Financial Statements are an integral part of this statement.
Columbia Corporate Income Fund | Annual Report 2017
| 17 |
Portfolio of Investments (continued)
April 30, 2017
| Corporate Bonds & Notes (continued) |
| Issuer | Coupon
Rate | | Principal
Amount ($) | Value ($) |
| Wind Acquisition Finance SA(d) |
| 07/15/20 | 4.750% | | 313,000 | 317,695 |
| 04/23/21 | 7.375% | | 96,000 | 99,840 |
| Total | 9,161,648 |
| Wirelines 2.4% |
| AT&T, Inc. |
| 06/15/45 | 4.350% | | 11,097,000 | 9,847,898 |
| 03/01/47 | 5.450% | | 3,875,000 | 4,000,190 |
| CenturyLink, Inc. |
| 12/01/23 | 6.750% | | 687,000 | 735,949 |
| 04/01/25 | 5.625% | | 155,000 | 151,319 |
| Frontier Communications Corp. |
| 09/15/20 | 8.875% | | 101,000 | 106,618 |
| 09/15/22 | 10.500% | | 404,000 | 406,020 |
| 04/15/24 | 7.625% | | 245,000 | 210,088 |
| 01/15/25 | 6.875% | | 527,000 | 438,859 |
| 09/15/25 | 11.000% | | 344,000 | 331,530 |
| Level 3 Communications, Inc. |
| 12/01/22 | 5.750% | | 288,000 | 299,880 |
| Level 3 Financing, Inc. |
| 08/15/22 | 5.375% | | 422,000 | 435,799 |
| 01/15/24 | 5.375% | | 77,000 | 79,695 |
| 03/15/26 | 5.250% | | 33,000 | 34,034 |
| Telecom Italia SpA(d) |
| 05/30/24 | 5.303% | | 171,000 | 176,130 |
| Verizon Communications, Inc. |
| 11/01/42 | 3.850% | | 6,879,000 | 5,762,538 |
| 03/15/55 | 4.672% | | 6,180,000 | 5,641,969 |
| Zayo Group LLC/Capital, Inc. |
| 04/01/23 | 6.000% | | 425,000 | 453,156 |
| 05/15/25 | 6.375% | | 169,000 | 182,731 |
| Zayo Group LLC/Capital, Inc.(d) |
| 01/15/27 | 5.750% | | 223,000 | 236,659 |
| Total | 29,531,062 |
Total Corporate Bonds & Notes
(Cost $1,099,715,613) | 1,113,540,045 |
|
| Foreign Government Obligations(h) 0.1% |
| | | | |
| Mexico 0.1% |
| Petroleos Mexicanos |
| 06/27/44 | 5.500% | | 334,000 | 293,085 |
| 09/21/47 | 6.750% | | 666,000 | 676,856 |
| Total | 969,941 |
Total Foreign Government Obligations
(Cost $967,670) | 969,941 |
|
| Senior Loans 0.0% |
| Borrower | Weighted
Average Coupon | | Principal
Amount ($) | Value ($) |
| Technology 0.0% |
| Misys Ltd.(e),(f),(i) |
| 2nd Lien Term Loan |
| 04/28/24 | 0.000% | | 54,571 | 55,662 |
| Term Loan |
| 04/26/24 | 0.000% | | 146,791 | 147,801 |
| Total | 203,463 |
Total Senior Loans
(Cost $200,082) | 203,463 |
|
| U.S. Treasury Obligations 2.4% |
| Issuer | Coupon
Rate | | Principal
Amount ($) | Value ($) |
| U.S. Treasury |
| 12/15/19 | 1.375% | | 30,000,000 | 29,991,810 |
Total U.S. Treasury Obligations
(Cost $29,787,890) | 29,991,810 |
| Money Market Funds 7.1% |
| | Shares | Value ($) |
| Columbia Short-Term Cash Fund, 0.869%(j),(k) | 88,021,127 | 88,021,127 |
Total Money Market Funds
(Cost $88,020,536) | 88,021,127 |
Total Investments
(Cost: $1,219,769,463) | 1,232,758,468 |
| Other Assets & Liabilities, Net | | 4,584,163 |
| Net Assets | 1,237,342,631 |
At April 30, 2017, securities and/or cash totaling $2,362,155 were pledged as collateral.
The accompanying Notes to Financial Statements are an integral part of this statement.
| 18 | Columbia Corporate Income Fund | Annual Report 2017 |
Portfolio of Investments (continued)
April 30, 2017
Investments in derivatives
Futures contracts outstanding at April 30, 2017
| Long futures contracts outstanding |
| Contract description | Number of
contracts | Trading
currency | Notional market
value ($) | Expiration date | Unrealized
appreciation ($) | Unrealized
depreciation ($) |
| U.S. Treasury 2-Year Note | 254 | USD | 55,018,782 | 06/2017 | 37,888 | — |
| U.S. Treasury 5-Year Note | 1,046 | USD | 123,852,937 | 06/2017 | 1,047,478 | — |
| U.S. Ultra Bond | 420 | USD | 68,433,750 | 06/2017 | 1,344,330 | — |
| Total | | | 247,305,469 | | 2,429,696 | — |
| Short futures contracts outstanding |
| Contract description | Number of
contracts | Trading
currency | Notional market
value ($) | Expiration date | Unrealized
appreciation ($) | Unrealized
depreciation ($) |
| U.S. Long Bond | (623) | USD | (95,299,531) | 06/2017 | — | (1,845,598) |
| U.S. Treasury 10-Year Note | (949) | USD | (119,307,094) | 06/2017 | — | (1,484,378) |
| U.S. Treasury Ultra 10-Year Note | (501) | USD | (67,862,016) | 06/2017 | — | (661,010) |
| Total | | | (282,468,641) | | — | (3,990,986) |
Notes to Portfolio of Investments
| (a) | Represents fair value as determined in good faith under procedures approved by the Board of Trustees. At April 30, 2017, the value of these securities amounted to $9,525, which represents less than 0.01% of net assets. |
| (b) | Non-income producing investment. |
| (c) | Negligible market value. |
| (d) | Represents privately placed and other securities and instruments exempt from SEC registration (collectively, private placements), such as Section 4(a)(2) and Rule 144A eligible securities, which are often sold only to qualified institutional buyers. The Fund may invest in private placements determined to be liquid as well as those determined to be illiquid. Private placements may be determined to be liquid under guidelines established by the Fund’s Board of Trustees. At April 30, 2017, the value of these securities amounted to $240,458,973 or 19.43% of net assets. |
| (e) | Represents a security purchased on a when-issued basis. |
| (f) | Variable rate security. |
| (g) | Represents securities that have defaulted on payment of interest. The Fund has stopped accruing interest on these securities. At April 30, 2017, the value of these securities amounted to $80,575 which represents less than 0.01% of net assets. |
| (h) | Principal and interest may not be guaranteed by the government. |
| (i) | Senior loans have interest rates that float periodically based primarily on the London Interbank Offered Rate (“LIBOR”) and other short-term rates. The interest rate shown reflects the weighted average coupon as of April 30, 2017. The interest rate shown for senior loans purchased on a when-issued or delayed delivery basis, if any, reflects an estimated average coupon. Remaining maturities of senior loans may be less than the stated maturities shown as a result of contractual or optional prepayments by the borrower. Such prepayments cannot be predicted. |
| (j) | The rate shown is the seven-day current annualized yield at April 30, 2017. |
| (k) | As defined in the Investment Company Act of 1940, an affiliated company is one in which the Fund owns 5% or more of the company’s outstanding voting securities, or a company which is under common ownership or control with the Fund. Holdings and transactions in these affiliated companies during the year ended April 30, 2017 are as follows: |
| Issuer | Beginning
shares | Shares
purchased | Shares
sold | Ending
shares | Realized gain
(loss) ($) | Dividends —
affiliated
issuers ($) | Value ($) |
| Columbia Short-Term Cash Fund, 0.869% | 193,913,794 | 567,323,307 | (673,215,974) | 88,021,127 | (1,610) | 686,809 | 88,021,127 |
Abbreviation Legend
Currency Legend
The accompanying Notes to Financial Statements are an integral part of this statement.
Columbia Corporate Income Fund | Annual Report 2017
| 19 |
Portfolio of Investments (continued)
April 30, 2017
Fair value measurements
The Fund categorizes its fair value measurements according to a three-level hierarchy that maximizes the use of observable inputs and minimizes the use of unobservable inputs by prioritizing that the most observable input be used when available. Observable inputs are those that market participants would use in pricing an investment based on market data obtained from sources independent of the reporting entity. Unobservable inputs are those that reflect the Fund’s assumptions about the information market participants would use in pricing an investment. An investment’s level within the fair value hierarchy is based on the lowest level of any input that is deemed significant to the asset’s or liability’s fair value measurement. The input levels are not necessarily an indication of the risk or liquidity associated with investments at that level. For example, certain U.S. government securities are generally high quality and liquid, however, they are reflected as Level 2 because the inputs used to determine fair value may not always be quoted prices in an active market.
Fair value inputs are summarized in the three broad levels listed below:
| • | Level 1 – Valuations based on quoted prices for investments in active markets that the Fund has the ability to access at the measurement date (including NAV for open-end mutual funds). Valuation adjustments are not applied to Level 1 investments. |
| • | Level 2 – Valuations based on other significant observable inputs (including quoted prices for similar securities, interest rates, prepayment speeds, credit risks, etc.). |
| • | Level 3 – Valuations based on significant unobservable inputs (including the Fund’s own assumptions and judgment in determining the fair value of investments). |
Inputs that are used in determining fair value of an investment may include price information, credit data, volatility statistics, and other factors. These inputs can be either observable or unobservable. The availability of observable inputs can vary between investments, and is affected by various factors such as the type of investment, and the volume and level of activity for that investment or similar investments in the marketplace. The inputs will be considered by the Investment Manager, along with any other relevant factors in the calculation of an investment’s fair value. The Fund uses prices and inputs that are current as of the measurement date, which may include periods of market dislocations. During these periods, the availability of prices and inputs may be reduced for many investments. This condition could cause an investment to be reclassified between the various levels within the hierarchy.
Certain investments that have been measured at fair value using the net asset value (NAV) per share (or its equivalent) are not categorized in the fair value hierarchy. The fair value amounts presented in the table are intended to reconcile the fair value hierarchy to the amounts presented in the Portfolio of Investments. The Columbia Short-Term Cash Fund seeks to provide shareholders with maximum current income consistent with liquidity and stability of principal. Columbia Short-Term Cash Fund prices its shares with a floating NAV and no longer seeks to maintain a stable NAV.
Investments falling into the Level 3 category are primarily supported by quoted prices from brokers and dealers participating in the market for those investments. However, these may be classified as Level 3 investments due to lack of market transparency and corroboration to support these quoted prices. Additionally, valuation models may be used as the pricing source for any remaining investments classified as Level 3. These models may rely on one or more significant unobservable inputs and/or significant assumptions by the Investment Manager. Inputs used in valuations may include, but are not limited to, financial statement analysis, capital account balances, discount rates and estimated cash flows, and comparable company data.
Under the direction of the Fund’s Board of Trustees (the Board), the Investment Manager’s Valuation Committee (the Committee) is responsible for overseeing the valuation procedures approved by the Board. The Committee consists of voting and non-voting members from various groups within the Investment Manager’s organization, including operations and accounting, trading and investments, compliance, risk management and legal.
The Committee meets at least monthly to review and approve valuation matters, which may include a description of specific valuation determinations, data regarding pricing information received from approved pricing vendors and brokers and the results of Board-approved valuation control policies and procedures (the Policies). The Policies address, among other things, instances when market quotations are or are not readily available, including recommendations of third party pricing vendors and a determination of appropriate pricing methodologies; events that require specific valuation determinations and assessment of fair value techniques; securities with a potential for stale pricing, including those that are illiquid, restricted, or in default; and the effectiveness of third party pricing vendors, including periodic reviews of vendors. The Committee meets more frequently, as needed, to discuss additional valuation matters, which may include the need to review back-testing results, review time-sensitive information or approve related valuation actions. The Committee reports to the Board, with members of the Committee meeting with the Board at each of its regularly scheduled meetings to discuss valuation matters and actions during the period, similar to those described earlier.
For investments categorized as Level 3, the Committee monitors information similar to that described above, which may include: (i) data specific to the issuer or comparable issuers, (ii) general market or specific sector news and (iii) quoted prices and specific or similar security transactions. The Committee considers this data and any changes from prior periods in order to assess the reasonableness of observable and unobservable inputs, any assumptions or internal models used to value those securities and changes in fair value. This data is also used to corroborate, when available, information received from approved pricing vendors and brokers. Various factors impact the frequency of monitoring this information (which may occur as often as daily). However, the Committee may determine that changes to inputs, assumptions and models are not required as a result of the monitoring procedures performed.
The following table is a summary of the inputs used to value the Fund’s investments at April 30, 2017:
| | Level 1
quoted prices
in active
markets for
identical
assets ($) | Level 2
other
significant
observable
inputs ($) | Level 3
significant
unobservable
inputs ($) | Investments
measured at
net asset
value ($) | Total ($) |
| Investments | | | | | |
| Common Stocks | | | | | |
| Financials | 32,082 | — | — | — | 32,082 |
| Corporate Bonds & Notes | — | 1,113,530,520 | 9,525 | — | 1,113,540,045 |
| Foreign Government Obligations | — | 969,941 | — | — | 969,941 |
| Senior Loans | — | 203,463 | — | — | 203,463 |
| U.S. Treasury Obligations | 29,991,810 | — | — | — | 29,991,810 |
| Money Market Funds | — | — | — | 88,021,127 | 88,021,127 |
| Total Investments | 30,023,892 | 1,114,703,924 | 9,525 | 88,021,127 | 1,232,758,468 |
The accompanying Notes to Financial Statements are an integral part of this statement.
| 20 | Columbia Corporate Income Fund | Annual Report 2017 |
Portfolio of Investments (continued)
April 30, 2017
Fair value measurements (continued)
| | Level 1
quoted prices
in active
markets for
identical
assets ($) | Level 2
other
significant
observable
inputs ($) | Level 3
significant
unobservable
inputs ($) | Investments
measured at
net asset
value ($) | Total ($) |
| Derivatives | | | | | |
| Asset | | | | | |
| Futures Contracts | 2,429,696 | — | — | — | 2,429,696 |
| Liability | | | | | |
| Futures Contracts | (3,990,986) | — | — | — | (3,990,986) |
| Total | 28,462,602 | 1,114,703,924 | 9,525 | 88,021,127 | 1,231,197,178 |
See the Portfolio of Investments for all investment classifications not indicated in the table.
The Fund’s assets assigned to the Level 2 input category are generally valued using the market approach, in which a security’s value is determined through reference to prices and information from market transactions for similar or identical assets.
Derivative instruments are valued at unrealized appreciation (depreciation).
There were no transfers of financial assets between levels during the period.
The Fund does not hold any significant investments (greater than one percent of net assets) categorized as Level 3.
The Fund’s assets assigned to the Level 3 category are valued utilizing the valuation technique deemed the most appropriate in the circumstances. Certain corporate bonds and common stocks classified as Level 3 are valued using an income approach. To determine fair value for these securities, management considered estimates of future distributions from the liquidation of company assets or potential actions related to the respective company’s bankruptcy filing. Significant increases (decreases) to any of these inputs would result in a significantly lower (higher) fair value measurement. Generally, a change in the bankruptcy filings would result in a directionally similar change to estimates of future distributions.
The accompanying Notes to Financial Statements are an integral part of this statement.
Columbia Corporate Income Fund | Annual Report 2017
| 21 |
Statement of Assets and Liabilities
April 30, 2017
| Assets | |
| Investments, at cost | |
| Unaffiliated issuers, at cost | $1,131,748,927 |
| Affiliated issuers, at cost | 88,020,536 |
| Total investments, at cost | 1,219,769,463 |
| Investments, at value | |
| Unaffiliated issuers, at value | 1,144,737,341 |
| Affiliated issuers, at value | 88,021,127 |
| Total investments, at value | 1,232,758,468 |
| Margin deposits | 2,362,155 |
| Receivable for: | |
| Investments sold | 2,062,374 |
| Capital shares sold | 3,524,651 |
| Dividends | 75,497 |
| Interest | 11,836,621 |
| Foreign tax reclaims | 13,344 |
| Variation margin | 195,906 |
| Expense reimbursement due from Investment Manager | 1,949 |
| Prepaid expenses | 2,203 |
| Trustees’ deferred compensation plan | 97,245 |
| Total assets | 1,252,930,413 |
| Liabilities | |
| Due to custodian | 470,236 |
| Payable for: | |
| Investments purchased | 2,126,187 |
| Investments purchased on a delayed delivery basis | 8,792,007 |
| Capital shares purchased | 751,536 |
| Distributions to shareholders | 2,846,814 |
| Variation margin | 309,983 |
| Management services fees | 16,712 |
| Distribution and/or service fees | 809 |
| Transfer agent fees | 114,902 |
| Compensation of chief compliance officer | 45 |
| Other expenses | 61,306 |
| Trustees’ deferred compensation plan | 97,245 |
| Total liabilities | 15,587,782 |
| Net assets applicable to outstanding capital stock | $1,237,342,631 |
| Represented by | |
| Paid in capital | 1,241,269,196 |
| Excess of distributions over net investment income | (832,959) |
| Accumulated net realized loss | (14,521,321) |
| Unrealized appreciation (depreciation) on: | |
| Investments - unaffiliated issuers | 12,988,414 |
| Investments - affiliated issuers | 591 |
| Futures contracts | (1,561,290) |
| Total - representing net assets applicable to outstanding capital stock | $1,237,342,631 |
The accompanying Notes to Financial Statements are an integral part of this statement.
| 22 | Columbia Corporate Income Fund | Annual Report 2017 |
Statement of Assets and Liabilities (continued)
April 30, 2017
| Class A | |
| Net assets | $81,802,080 |
| Shares outstanding | 8,090,785 |
| Net asset value per share | $10.11 |
| Maximum offering price per share(a) | $10.61 |
| Class B | |
| Net assets | $56,827 |
| Shares outstanding | 5,619 |
| Net asset value per share | $10.11 |
| Class C | |
| Net assets | $10,542,590 |
| Shares outstanding | 1,042,945 |
| Net asset value per share | $10.11 |
| Class R4 | |
| Net assets | $12,533,785 |
| Shares outstanding | 1,241,446 |
| Net asset value per share | $10.10 |
| Class R5 | |
| Net assets | $2,075,911 |
| Shares outstanding | 205,652 |
| Net asset value per share | $10.09 |
| Class T(b) | |
| Net assets | $655,599 |
| Shares outstanding | 64,861 |
| Net asset value per share | $10.11 |
| Maximum offering price per share(c) | $10.37 |
| Class Y | |
| Net assets | $542,814,494 |
| Shares outstanding | 53,704,561 |
| Net asset value per share | $10.11 |
| Class Z | |
| Net assets | $586,861,345 |
| Shares outstanding | 58,051,131 |
| Net asset value per share | $10.11 |
| (a) | The maximum offering price per share is calculated by dividing the net asset value per share by 1.0 minus the maximum sales charge of 4.75% for Class A. |
| (b) | Effective March 27, 2017, Class W shares were renamed Class T shares. |
| (c) | The maximum offering price per share is calculated by dividing the net asset value per share by 1.0 minus the maximum sales charge of 2.50% for Class T. |
The accompanying Notes to Financial Statements are an integral part of this statement.
Columbia Corporate Income Fund | Annual Report 2017
| 23 |
Statement of Operations
Year Ended April 30, 2017
| Net investment income | |
| Income: | |
| Dividends — affiliated issuers | $686,809 |
| Interest | 40,890,375 |
| Total income | 41,577,184 |
| Expenses: | |
| Management services fees | 5,913,133 |
| Distribution and/or service fees | |
| Class A | 237,708 |
| Class B | 2,008 |
| Class C | 117,010 |
| Class T(a) | 61,475 |
| Transfer agent fees | |
| Class A | 205,557 |
| Class B | 437 |
| Class C | 25,299 |
| Class I(b) | 12,857 |
| Class R4 | 30,324 |
| Class R5 | 976 |
| Class T(a) | 53,948 |
| Class Y | 5,873 |
| Class Z | 1,073,601 |
| Compensation of board members | 38,242 |
| Custodian fees | 17,417 |
| Printing and postage fees | 66,362 |
| Registration fees | 144,201 |
| Audit fees | 34,530 |
| Legal fees | 31,193 |
| Compensation of chief compliance officer | 529 |
| Other | (70,302) |
| Total expenses | 8,002,378 |
| Fees waived or expenses reimbursed by Investment Manager and its affiliates | (555,872) |
| Fees waived by distributor | |
| Class C | (17,580) |
| Expense reduction | (980) |
| Total net expenses | 7,427,946 |
| Net investment income | 34,149,238 |
| Realized and unrealized gain (loss) — net | |
| Net realized gain (loss) on: | |
| Investments — unaffiliated issuers | 22,212,755 |
| Investments — affiliated issuers | (1,610) |
| Futures contracts | (1,531,346) |
| Swap contracts | 3,118 |
| Net realized gain | 20,682,917 |
| Net change in unrealized appreciation (depreciation) on: | |
| Investments — unaffiliated issuers | (4,647,496) |
| Investments — affiliated issuers | 591 |
| Futures contracts | (3,633,421) |
| Swap contracts | 463,114 |
| Net change in unrealized appreciation (depreciation) | (7,817,212) |
| Net realized and unrealized gain | 12,865,705 |
| Net increase in net assets resulting from operations | $47,014,943 |
| (a) | Effective March 27, 2017, Class W shares were renamed Class T shares. |
| (b) | Effective March 27, 2017, Class I shares were redeemed or exchanged for Class Y shares. |
The accompanying Notes to Financial Statements are an integral part of this statement.
| 24 | Columbia Corporate Income Fund | Annual Report 2017 |
Statement of Changes in Net Assets
| | Year Ended
April 30, 2017 | Year Ended
April 30, 2016 |
| Operations | | |
| Net investment income | $34,149,238 | $45,174,843 |
| Net realized gain (loss) | 20,682,917 | (32,588,988) |
| Net change in unrealized appreciation (depreciation) | (7,817,212) | (1,151,281) |
| Net increase in net assets resulting from operations | 47,014,943 | 11,434,574 |
| Distributions to shareholders | | |
| Net investment income | | |
| Class A | (2,443,839) | (3,353,086) |
| Class B | (3,674) | (9,055) |
| Class C | (230,634) | (333,742) |
| Class I(a) | (14,395,993) | (20,991,202) |
| Class R4 | (395,656) | (671,248) |
| Class R5 | (48,908) | (58,735) |
| Class T(b) | (638,588) | (1,725,776) |
| Class Y | (2,012,755) | (590,408) |
| Class Z | (14,072,183) | (17,541,312) |
| Total distributions to shareholders | (34,242,230) | (45,274,564) |
| Increase (decrease) in net assets from capital stock activity | 25,143,113 | (295,017,836) |
| Total increase (decrease) in net assets | 37,915,826 | (328,857,826) |
| Net assets at beginning of year | 1,199,426,805 | 1,528,284,631 |
| Net assets at end of year | $1,237,342,631 | $1,199,426,805 |
| Excess of distributions over net investment income | $(832,959) | $(753,511) |
| (a) | Effective March 27, 2017, Class I shares were redeemed or exchanged for Class Y shares. |
| (b) | Effective March 27, 2017, Class W shares were renamed Class T shares. |
The accompanying Notes to Financial Statements are an integral part of this statement.
Columbia Corporate Income Fund | Annual Report 2017
| 25 |
Statement of Changes in Net Assets (continued)
| | Year Ended | Year Ended |
| | April 30, 2017 | April 30, 2016 |
| | Shares | Dollars ($) | Shares | Dollars ($) |
| Capital stock activity |
| Class A | | | | |
| Subscriptions (a) | 2,661,800 | 26,871,945 | 1,412,250 | 13,676,283 |
| Distributions reinvested | 219,359 | 2,215,780 | 314,528 | 3,050,265 |
| Redemptions | (4,607,041) | (46,250,920) | (4,674,183) | (45,520,121) |
| Net decrease | (1,725,882) | (17,163,195) | (2,947,405) | (28,793,573) |
| Class B | | | | |
| Subscriptions | 69 | 694 | 1,761 | 17,314 |
| Distributions reinvested | 262 | 2,649 | 652 | 6,344 |
| Redemptions (a) | (23,703) | (238,226) | (36,495) | (358,412) |
| Net decrease | (23,372) | (234,883) | (34,082) | (334,754) |
| Class C | | | | |
| Subscriptions | 178,692 | 1,805,033 | 158,912 | 1,532,883 |
| Distributions reinvested | 19,825 | 200,195 | 30,088 | 291,619 |
| Redemptions | (329,880) | (3,320,899) | (524,015) | (5,061,927) |
| Net decrease | (131,363) | (1,315,671) | (335,015) | (3,237,425) |
| Class I(b) | | | | |
| Subscriptions | 4,912,447 | 49,090,606 | 4,176,878 | 39,537,190 |
| Distributions reinvested | 1,324,044 | 13,378,500 | 2,165,499 | 20,990,857 |
| Redemptions | (60,219,392) | (604,314,340) | (14,029,743) | (136,028,520) |
| Net decrease | (53,982,901) | (541,845,234) | (7,687,366) | (75,500,473) |
| Class R4 | | | | |
| Subscriptions | 397,814 | 4,019,165 | 1,039,548 | 10,103,217 |
| Distributions reinvested | 39,173 | 395,322 | 69,390 | 670,898 |
| Redemptions | (743,789) | (7,471,630) | (1,369,440) | (13,067,778) |
| Net decrease | (306,802) | (3,057,143) | (260,502) | (2,293,663) |
| Class R5 | | | | |
| Subscriptions | 92,431 | 933,838 | 39,896 | 394,301 |
| Distributions reinvested | 4,819 | 48,589 | 6,034 | 58,379 |
| Redemptions | (37,794) | (378,847) | (75,850) | (728,843) |
| Net increase (decrease) | 59,456 | 603,580 | (29,920) | (276,163) |
| Class T(c) | | | | |
| Subscriptions | 877,265 | 8,836,124 | 710,742 | 6,941,685 |
| Distributions reinvested | 63,161 | 638,332 | 176,959 | 1,725,471 |
| Redemptions | (4,201,825) | (42,063,632) | (9,847,164) | (97,148,500) |
| Net decrease | (3,261,399) | (32,589,176) | (8,959,463) | (88,481,344) |
| Class Y(b) | | | | |
| Subscriptions | 54,296,656 | 544,617,060 | 768,450 | 7,587,732 |
| Distributions reinvested | 192,871 | 1,948,281 | 58,102 | 562,736 |
| Redemptions | (2,616,675) | (26,220,613) | (231,102) | (2,252,483) |
| Net increase | 51,872,852 | 520,344,728 | 595,450 | 5,897,985 |
| Class Z | | | | |
| Subscriptions | 28,223,895 | 284,012,408 | 9,548,773 | 92,787,837 |
| Distributions reinvested | 499,597 | 5,042,676 | 690,470 | 6,695,978 |
| Redemptions | (18,786,474) | (188,654,977) | (20,781,782) | (201,482,241) |
| Net increase (decrease) | 9,937,018 | 100,400,107 | (10,542,539) | (101,998,426) |
| Total net increase (decrease) | 2,437,607 | 25,143,113 | (30,200,842) | (295,017,836) |
| (a) | Includes conversions of Class B shares to Class A shares, if any. |
| (b) | Effective March 27, 2017, Class I shares were redeemed or exchanged for Class Y shares. |
| (c) | Effective March 27, 2017, Class W shares were renamed Class T shares. |
The accompanying Notes to Financial Statements are an integral part of this statement.
| 26 | Columbia Corporate Income Fund | Annual Report 2017 |
[THIS PAGE INTENTIONALLY LEFT BLANK]
Columbia Corporate Income Fund | Annual Report 2017
| 27 |
The following table is intended to help you understand the Fund’s financial performance. Certain information reflects financial results for a single share of a class held for the periods shown. Per share net investment income (loss) amounts are calculated based on average shares outstanding during the period. Total return assumes reinvestment of all dividends and distributions, if any. Total return does not reflect payment of sales charges, if any. Total return and portfolio turnover are not annualized for periods of less than one year. The portfolio turnover rate is calculated without regard to purchase and sales transactions of short-term instruments and certain derivatives, if any. If such transactions were included, the Fund’s portfolio turnover rate may be higher.
| Year ended | Net asset value,
beginning of
period | Net
investment
income | Net
realized
and
unrealized
gain (loss) | Total from
investment
operations | Distributions
from net
investment
income | Distributions
from net
realized
gains |
| Class A |
| 4/30/2017 | $10.00 | 0.26 | 0.11 | 0.37 | (0.26) | — |
| 4/30/2016 | $10.18 | 0.31 | (0.18) | 0.13 | (0.31) | — |
| 4/30/2015 | $10.20 | 0.28 | (0.02) | 0.26 | (0.28) | — |
| 4/30/2014 | $10.67 | 0.29 | (0.14) | 0.15 | (0.29) | (0.33) |
| 4/30/2013 | $10.30 | 0.32 | 0.59 | 0.91 | (0.32) | (0.22) |
| Class B |
| 4/30/2017 | $10.00 | 0.18 | 0.11 | 0.29 | (0.18) | — |
| 4/30/2016 | $10.18 | 0.23 | (0.18) | 0.05 | (0.23) | — |
| 4/30/2015 | $10.20 | 0.20 | (0.01) | 0.19 | (0.21) | — |
| 4/30/2014 | $10.67 | 0.21 | (0.14) | 0.07 | (0.21) | (0.33) |
| 4/30/2013 | $10.30 | 0.24 | 0.59 | 0.83 | (0.24) | (0.22) |
| Class C |
| 4/30/2017 | $10.00 | 0.20 | 0.11 | 0.31 | (0.20) | — |
| 4/30/2016 | $10.18 | 0.25 | (0.18) | 0.07 | (0.25) | — |
| 4/30/2015 | $10.20 | 0.22 | (0.02) | 0.20 | (0.22) | — |
| 4/30/2014 | $10.67 | 0.22 | (0.13) | 0.09 | (0.23) | (0.33) |
| 4/30/2013 | $10.30 | 0.26 | 0.58 | 0.84 | (0.25) | (0.22) |
| Class R4 |
| 4/30/2017 | $9.99 | 0.28 | 0.11 | 0.39 | (0.28) | — |
| 4/30/2016 | $10.16 | 0.33 | (0.17) | 0.16 | (0.33) | — |
| 4/30/2015 | $10.19 | 0.31 | (0.03) | 0.28 | (0.31) | — |
| 4/30/2014 | $10.65 | 0.31 | (0.13) | 0.18 | (0.31) | (0.33) |
| 4/30/2013 (e) | $10.81 | 0.14 | 0.07 | 0.21 | (0.15) | (0.22) |
| Class R5 |
| 4/30/2017 | $9.98 | 0.29 | 0.11 | 0.40 | (0.29) | — |
| 4/30/2016 | $10.16 | 0.34 | (0.18) | 0.16 | (0.34) | — |
| 4/30/2015 | $10.19 | 0.32 | (0.03) | 0.29 | (0.32) | — |
| 4/30/2014 | $10.65 | 0.33 | (0.13) | 0.20 | (0.33) | (0.33) |
| 4/30/2013 (g) | $10.81 | 0.14 | 0.08 | 0.22 | (0.16) | (0.22) |
| Class T(h) |
| 4/30/2017 | $10.00 | 0.26 | 0.11 | 0.37 | (0.26) | — |
| 4/30/2016 | $10.18 | 0.30 | (0.17) | 0.13 | (0.31) | — |
| 4/30/2015 | $10.20 | 0.28 | (0.02) | 0.26 | (0.28) | — |
| 4/30/2014 | $10.67 | 0.29 | (0.14) | 0.15 | (0.29) | (0.33) |
| 4/30/2013 | $10.30 | 0.32 | 0.59 | 0.91 | (0.32) | (0.22) |
The accompanying Notes to Financial Statements are an integral part of this statement.
| 28 | Columbia Corporate Income Fund | Annual Report 2017 |
Total
distributions to
shareholders | Net
asset
value,
end of
period | Total
return | Total gross
expense
ratio to
average
net assets(a) | Total net
expense
ratio to
average
net assets(a),(b) | Net investment
income
ratio to
average
net assets | Portfolio
turnover | Net
assets,
end of
period
(000’s) |
| |
| (0.26) | $10.11 | 3.72% | 0.98% (c) | 0.91% (c),(d) | 2.56% | 76% | $81,802 |
| (0.31) | $10.00 | 1.38% | 1.00% | 0.93% (d) | 3.15% | 50% | $98,149 |
| (0.28) | $10.18 | 2.59% | 0.97% | 0.96% (d) | 2.75% | 78% | $129,902 |
| (0.62) | $10.20 | 1.60% | 0.96% | 0.96% (d) | 2.80% | 105% | $120,603 |
| (0.54) | $10.67 | 8.97% | 0.96% | 0.95% (d) | 3.04% | 109% | $140,322 |
| |
| (0.18) | $10.11 | 2.94% | 1.73% (c) | 1.66% (c),(d) | 1.83% | 76% | $57 |
| (0.23) | $10.00 | 0.62% | 1.74% | 1.69% (d) | 2.36% | 50% | $290 |
| (0.21) | $10.18 | 1.82% | 1.72% | 1.71% (d) | 1.99% | 78% | $642 |
| (0.54) | $10.20 | 0.84% | 1.71% | 1.71% (d) | 2.04% | 105% | $1,259 |
| (0.46) | $10.67 | 8.16% | 1.71% | 1.70% (d) | 2.32% | 109% | $2,455 |
| |
| (0.20) | $10.11 | 3.10% | 1.73% (c) | 1.51% (c),(d) | 1.96% | 76% | $10,543 |
| (0.25) | $10.00 | 0.78% | 1.75% | 1.53% (d) | 2.55% | 50% | $11,740 |
| (0.22) | $10.18 | 1.98% | 1.72% | 1.56% (d) | 2.15% | 78% | $15,359 |
| (0.56) | $10.20 | 0.99% | 1.71% | 1.56% (d) | 2.20% | 105% | $15,587 |
| (0.47) | $10.67 | 8.32% | 1.71% | 1.55% (d) | 2.42% | 109% | $24,821 |
| |
| (0.28) | $10.10 | 3.98% | 0.73% (c) | 0.66% (c),(d) | 2.81% | 76% | $12,534 |
| (0.33) | $9.99 | 1.73% | 0.75% | 0.68% (d) | 3.42% | 50% | $15,459 |
| (0.31) | $10.16 | 2.74% | 0.72% | 0.71% (d) | 3.01% | 78% | $18,384 |
| (0.64) | $10.19 | 1.95% | 0.72% | 0.71% (d) | 3.13% | 105% | $11,454 |
| (0.37) | $10.65 | 2.03% | 0.74% (f) | 0.71% (f) | 2.97% (f) | 109% | $865 |
| |
| (0.29) | $10.09 | 4.09% | 0.57% (c) | 0.55% (c) | 2.92% | 76% | $2,076 |
| (0.34) | $9.98 | 1.76% | 0.57% | 0.56% | 3.53% | 50% | $1,459 |
| (0.32) | $10.16 | 2.89% | 0.57% | 0.57% | 3.14% | 78% | $1,790 |
| (0.66) | $10.19 | 2.09% | 0.57% | 0.57% | 3.17% | 105% | $1,630 |
| (0.38) | $10.65 | 2.08% | 0.58% (f) | 0.58% (f) | 3.05% (f) | 109% | $117 |
| |
| (0.26) | $10.11 | 3.71% | 0.98% (c) | 0.91% (c),(d) | 2.60% | 76% | $656 |
| (0.31) | $10.00 | 1.39% | 1.00% | 0.94% (d) | 3.09% | 50% | $33,250 |
| (0.28) | $10.18 | 2.59% | 0.97% | 0.96% (d) | 2.75% | 78% | $125,035 |
| (0.62) | $10.20 | 1.60% | 0.96% | 0.96% (d) | 2.81% | 105% | $132,166 |
| (0.54) | $10.67 | 8.97% | 0.96% | 0.95% (d) | 3.06% | 109% | $159,179 |
Columbia Corporate Income Fund | Annual Report 2017
| 29 |
Financial Highlights (continued)
| Year ended | Net asset value,
beginning of
period | Net
investment
income | Net
realized
and
unrealized
gain (loss) | Total from
investment
operations | Distributions
from net
investment
income | Distributions
from net
realized
gains |
| Class Y |
| 4/30/2017 | $10.00 | 0.29 | 0.12 | 0.41 | (0.30) | — |
| 4/30/2016 | $10.18 | 0.35 | (0.18) | 0.17 | (0.35) | — |
| 4/30/2015 | $10.20 | 0.33 | (0.02) | 0.31 | (0.33) | — |
| 4/30/2014 | $10.66 | 0.33 | (0.13) | 0.20 | (0.33) | (0.33) |
| 4/30/2013 (i) | $10.82 | 0.17 | 0.05 | 0.22 | (0.16) | (0.22) |
| Class Z |
| 4/30/2017 | $10.00 | 0.28 | 0.11 | 0.39 | (0.28) | — |
| 4/30/2016 | $10.18 | 0.33 | (0.18) | 0.15 | (0.33) | — |
| 4/30/2015 | $10.20 | 0.31 | (0.02) | 0.29 | (0.31) | — |
| 4/30/2014 | $10.67 | 0.31 | (0.14) | 0.17 | (0.31) | (0.33) |
| 4/30/2013 | $10.30 | 0.35 | 0.58 | 0.93 | (0.34) | (0.22) |
| Notes to Financial Highlights |
| (a) | In addition to the fees and expenses that the Fund bears directly, the Fund indirectly bears a pro rata share of the fees and expenses of any other funds in which it invests. Such indirect expenses are not included in the Fund’s reported expense ratios. |
| (b) | Total net expenses include the impact of certain fee waivers/expense reimbursements made by the Investment Manager and certain of its affiliates, if applicable. |
| (c) | Expenses have been reduced due to a reimbursement of expenses overbilled by a third party. If the reimbursement had been excluded, the expense ratios would have been higher by the percentages shown for each class in the table below. All fee waivers and expense reimbursements by the Investment Manager and its affiliates were applied before giving effect to this third party reimbursement. |
| | Class A | Class B | Class C | Class R4 | Class R5 | Class T | Class Y | Class Z |
| 04/30/2017 | 0.01 % | 0.01 % | 0.01 % | 0.01 % | 0.01 % | 0.01 % | 0.00% | 0.01 % |
| (d) | The benefits derived from expense reductions had an impact of less than 0.01%. |
| (e) | Class R4 shares commenced operations on November 8, 2012. Per share data and total return reflect activity from that date. |
| (f) | Annualized. |
| (g) | Class R5 shares commenced operations on November 8, 2012. Per share data and total return reflect activity from that date. |
| (h) | Effective March 27, 2017, Class W shares were renamed Class T shares. |
| (i) | Class Y shares commenced operations on November 8, 2012. Per share data and total return reflect activity from that date. |
The accompanying Notes to Financial Statements are an integral part of this statement.
| 30 | Columbia Corporate Income Fund | Annual Report 2017 |
Total
distributions to
shareholders | Net
asset
value,
end of
period | Total
return | Total gross
expense
ratio to
average
net assets(a) | Total net
expense
ratio to
average
net assets(a),(b) | Net investment
income
ratio to
average
net assets | Portfolio
turnover | Net
assets,
end of
period
(000’s) |
| |
| (0.30) | $10.11 | 4.14% | 0.54% (c) | 0.51% (c) | 2.91% | 76% | $542,814 |
| (0.35) | $10.00 | 1.81% | 0.52% | 0.51% | 3.60% | 50% | $18,312 |
| (0.33) | $10.18 | 3.04% | 0.52% | 0.52% | 3.24% | 78% | $12,581 |
| (0.66) | $10.20 | 2.14% | 0.51% | 0.51% | 3.30% | 105% | $28 |
| (0.38) | $10.66 | 2.09% | 0.45% (f) | 0.45% (f) | 3.35% (f) | 109% | $2 |
| |
| (0.28) | $10.11 | 3.98% | 0.73% (c) | 0.66% (c),(d) | 2.81% | 76% | $586,861 |
| (0.33) | $10.00 | 1.64% | 0.75% | 0.68% (d) | 3.40% | 50% | $481,013 |
| (0.31) | $10.18 | 2.84% | 0.72% | 0.71% (d) | 3.01% | 78% | $596,908 |
| (0.64) | $10.20 | 1.85% | 0.71% | 0.71% (d) | 3.05% | 105% | $462,215 |
| (0.56) | $10.67 | 9.24% | 0.71% | 0.70% (d) | 3.30% | 109% | $537,860 |
Columbia Corporate Income Fund | Annual Report 2017
| 31 |
Notes to Financial Statements
April 30, 2017
Note 1. Organization
Columbia Corporate Income Fund (the Fund), a series of Columbia Funds Series Trust I (the Trust), is a diversified fund. The Trust is registered under the Investment Company Act of 1940, as amended (the 1940 Act), as an open-end management investment company organized as a Massachusetts business trust.
Fund shares
The Trust may issue an unlimited number of shares (without par value). Although all share classes generally have identical voting, dividend and liquidation rights, each share class votes separately when required by the Trust’s organizational documents or by law. Different share classes pay different distribution amounts to the extent the expenses of such share classes differ, and distributions in liquidation will be proportional to the net asset value of each share class. Each share class has its own expense and sales charge structure. The Fund offers each of the share classes identified below.
Class A shares are subject to a maximum front-end sales charge of 4.75% based on the initial investment amount. Class A shares purchased without an initial sales charge in accounts aggregating $1 million to $50 million at the time of purchase are subject to a contingent deferred sales charge (CDSC) if the shares are sold within 18 months after purchase, charged as follows: 1.00% CDSC if redeemed within 12 months after purchase, and 0.50% CDSC if redeemed more than 12, but less than 18, months after purchase.
The Fund no longer accepts investments by new or existing investors in the Fund’s Class B shares, except in connection with the reinvestment of any dividend and/or capital gain distributions in Class B shares of the Fund and exchanges by existing Class B shareholders of certain other funds within the Columbia Family of Funds. Class B shares are typically subject to a maximum CDSC of 5.00% based upon the holding period after purchase. However, the Fund’s current Class B investors, having held their shares for the requisite time period, are no longer subject to a CDSC upon redemption of their shares. Effective on or about July 17, 2017, Class B shares will automatically convert to Class A shares and the Fund will no longer accept investments by new or existing investors in Class B shares.
Class C shares are subject to a 1.00% CDSC on shares redeemed within 12 months after purchase.
Effective March 27, 2017, Class I shares of the Fund are no longer offered for sale. Class I shares, when available, were not subject to sales charges or distribution and service (12b-1) fees, and were made available only to the Columbia Family of Funds. On March 27, 2017, Class I shares were redeemed or exchanged for Class Y shares of the Fund in a tax free transaction that had no impact on the fees and expenses paid by shareholders.
Class R4 shares are not subject to sales charges and are generally available only to omnibus retirement plans and certain investors as described in the Fund’s prospectus.
Class R5 shares are not subject to sales charges and are generally available only to investors purchasing through authorized investment professionals and omnibus retirement plans.
Class T shares are subject to a maximum front-end sales charge of 2.50% per transaction and must be purchased through financial intermediaries that, by written agreement with Columbia Management Investment Distributors, Inc., are specifically authorized to sell Class T shares. Prior to March 27, 2017, Class T shares were known as Class W shares, were not subject to sales charges, and were generally available only to investors purchasing through authorized investment programs managed by investment professionals, including discretionary managed accounts.
Class Y shares are not subject to sales charges or distribution and service (12b-1) fees, and are available to institutional and certain other investors as described in the Fund’s prospectus. On March 27, 2017, Class I shares were redeemed or exchanged for Class Y shares of the Fund in a tax free transaction that had no impact on the fees and expenses paid by shareholders. Class I shares of the Fund are no longer offered for sale.
Class Z shares are not subject to sales charges and are generally available only to eligible investors, which are subject to different investment minimums as described in the Fund’s prospectus.
| 32 | Columbia Corporate Income Fund | Annual Report 2017 |
Notes to Financial Statements (continued)
April 30, 2017
Note 2. Summary of significant accounting policies
Basis of preparation
The Fund is an investment company that applies the accounting and reporting guidance in the Financial Accounting Standards Board (FASB) Accounting Standards Codification Topic 946, Financial Services - Investment Companies (ASC 946). The financial statements are prepared in accordance with U.S. generally accepted accounting principles (GAAP), which requires management to make certain estimates and assumptions that affect the reported amounts of assets and liabilities, the disclosure of contingent assets and liabilities at the date of the financial statements and the reported amounts of income and expenses during the reporting period. Actual results could differ from those estimates. The Fund received a reimbursement for expenses overbilled by a third party. Such reimbursement is included as an offset to Other expenses on the Statement of Operations. All fee waivers and expense reimbursements by the Investment Manager and its affiliates were applied before giving effect to the third party reimbursement.
The following is a summary of significant accounting policies followed by the Fund in the preparation of its financial statements.
Security valuation
Debt securities generally are valued by pricing services approved by the Board of Trustees based upon market transactions for normal, institutional-size trading units of similar securities. The services may use various pricing techniques that take into account, as applicable, factors such as yield, quality, coupon rate, maturity, type of issue, trading characteristics and other data, as well as approved independent broker-dealer quotes. Debt securities for which quotations are not readily available or not believed to be reflective of market value may also be valued based upon a bid quote from an approved independent broker-dealer. Debt securities maturing in 60 days or less are valued primarily at amortized cost value, unless this method results in a valuation that management believes does not approximate market value.
All equity securities are valued at the close of business of the New York Stock Exchange. Equity securities are valued at the last quoted sales price on the principal exchange or market on which they trade, except for securities traded on the NASDAQ Stock Market, which are valued at the NASDAQ official close price. Unlisted securities or listed securities for which there were no sales during the day are valued at the mean of the latest quoted bid and ask prices on such exchanges or markets.
Senior loan securities for which reliable market quotations are readily available are generally valued by pricing services at the average of the bids received.
Investments in open-end investment companies, including money market funds, are valued at their latest net asset value.
Futures and options on futures contracts are valued based upon the settlement price at the close of regular trading on their principal exchanges or, in the absence of transactions, at the mean of the latest quoted bid and ask prices.
Investments for which market quotations are not readily available, or that have quotations which management believes are not reflective of market value or reliable, are valued at fair value as determined in good faith under procedures approved by and under the general supervision of the Board of Trustees. If a security or class of securities (such as foreign securities) is valued at fair value, such value is likely to be different from the quoted or published price for the security.
The determination of fair value often requires significant judgment. To determine fair value, management may use assumptions including but not limited to future cash flows and estimated risk premiums. Multiple inputs from various sources may be used to determine fair value.
GAAP requires disclosure regarding the inputs and valuation techniques used to measure fair value and any changes in valuation inputs or techniques. In addition, investments shall be disclosed by major category. This information is disclosed following the Fund’s Portfolio of Investments.
Columbia Corporate Income Fund | Annual Report 2017
| 33 |
Notes to Financial Statements (continued)
April 30, 2017
Derivative instruments
The Fund invests in certain derivative instruments, as detailed below, to meet its investment objectives. Derivatives are instruments whose values depend on, or are derived from, in whole or in part, the value of one or more securities, currencies, commodities, indices, or other assets or instruments. Derivatives may be used to increase investment flexibility (including to maintain cash reserves while maintaining desired exposure to certain assets), for risk management (hedging) purposes, to facilitate trading, to reduce transaction costs and to pursue higher investment returns. The Fund may also use derivative instruments to mitigate certain investment risks, such as foreign currency exchange rate risk, interest rate risk and credit risk. Derivatives may involve various risks, including the potential inability of the counterparty to fulfill its obligations under the terms of the contract, the potential for an illiquid secondary market (making it difficult for the Fund to sell or terminate, including at favorable prices) and the potential for market movements which may expose the Fund to gains or losses in excess of the amount shown in the Statement of Assets and Liabilities. The notional amounts of derivative instruments, if applicable, are not recorded in the financial statements.
A derivative instrument may suffer a marked-to-market loss if the value of the contract decreases due to an unfavorable change in the market rates or values of the underlying instrument. Losses can also occur if the counterparty does not perform its obligations under the contract. The Fund’s risk of loss from counterparty credit risk on over-the-counter derivatives is generally limited to the aggregate unrealized gain netted against any collateral held by the Fund and the amount of any variation margin held by the counterparty, plus any replacement costs or related amounts. With exchange-traded or centrally cleared derivatives, there is reduced counterparty credit risk to the Fund since the clearinghouse or central counterparty (CCP) provides some protection in the case of clearing member default. The clearinghouse or CCP stands between the buyer and the seller of the contract; therefore, additional counterparty credit risk is failure of the clearinghouse or CCP. However, credit risk still exists in exchange-traded or centrally cleared derivatives with respect to initial and variation margin that is held in a broker’s customer account. While brokers are required to segregate customer margin from their own assets, in the event that a broker becomes insolvent or goes into bankruptcy and at that time there is a shortfall in the aggregate amount of margin held by the broker for all its clients, U.S. bankruptcy laws will typically allocate that shortfall on a pro-rata basis across all the broker’s customers (including the Fund), potentially resulting in losses to the Fund.
In order to better define its contractual rights and to secure rights that will help the Fund mitigate its counterparty risk, the Fund may enter into an International Swaps and Derivatives Association, Inc. Master Agreement (ISDA Master Agreement) or similar agreement with its derivatives contract counterparties. An ISDA Master Agreement is an agreement between the Fund and a counterparty that governs over-the-counter derivatives and typically contains, among other things, collateral posting terms and netting provisions in the event of a default and/or termination event. Under an ISDA Master Agreement, the Fund may, under certain circumstances, offset with the counterparty certain derivative instrument’s payables and/or receivables with collateral held and/or posted and create one single net payment. The provisions of the ISDA Master Agreement typically permit a single net payment in the event of default (close-out netting), including the bankruptcy or insolvency of the counterparty. Note, however, that bankruptcy or insolvency laws of a particular jurisdiction may impose restrictions on or prohibitions against the right of offset or netting in bankruptcy, insolvency or other events.
Collateral (margin) requirements differ by type of derivative. Margin requirements are established by the clearinghouse or CCP for exchange-traded and centrally cleared derivatives. Brokers can ask for margin in excess of the minimum in certain circumstances. Collateral terms are contract specific for over-the-counter derivatives. For over-the-counter derivatives traded under an ISDA Master Agreement, the collateral requirements are typically calculated by netting the marked-to-market amount for each transaction under such agreement and comparing that amount to the value of any variation margin currently pledged by the Fund and/or the counterparty. Generally, the amount of collateral due from or to a party has to exceed a minimum transfer amount threshold (e.g., $250,000) before a transfer has to be made. To the extent amounts due to the Fund from its counterparties are not fully collateralized, contractually or otherwise, the Fund bears the risk of loss from counterparty nonperformance. The Fund attempts to mitigate counterparty risk by only entering into agreements with counterparties that it believes have the financial resources to honor their obligations and by monitoring the financial stability of those counterparties.
Certain ISDA Master Agreements allow counterparties of over-the-counter derivatives transactions to terminate derivatives contracts prior to maturity in the event the Fund’s net asset value declines by a stated percentage over a specified time period or if the Fund fails to meet certain terms of the ISDA Master Agreement, which would cause the Fund to accelerate
| 34 | Columbia Corporate Income Fund | Annual Report 2017 |
Notes to Financial Statements (continued)
April 30, 2017
payment of any net liability owed to the counterparty. The Fund also has termination rights if the counterparty fails to meet certain terms of the ISDA Master Agreement. In addition to considering counterparty credit risk, the Fund would consider terminating the derivatives contracts based on whether termination would result in a net liability owed from the counterparty.
For financial reporting purposes, the Fund does not offset derivative assets and derivative liabilities that are subject to netting arrangements in the Statement of Assets and Liabilities.
Futures contracts
Futures contracts are exchange-traded and represent commitments for the future purchase or sale of an asset at a specified price on a specified date. The Fund bought and sold futures contracts to manage the duration and yield curve exposure of the Fund versus the benchmark and to manage exposure to movements in interest rates. These instruments may be used for other purposes in future periods. Upon entering into futures contracts, the Fund bears risks that it may not achieve the anticipated benefits of the futures contracts and may realize a loss. Additional risks include counterparty credit risk, the possibility of an illiquid market, and that a change in the value of the contract or option may not correlate with changes in the value of the underlying asset.
Upon entering into a futures contract, the Fund deposits cash or securities with the broker, known as a futures commission merchant (FCM), in an amount sufficient to meet the initial margin requirement. The initial margin deposit must be maintained at an established level over the life of the contract. Cash deposited as initial margin is recorded in the Statement of Assets and Liabilities as margin deposits. Securities deposited as initial margin are designated in the Portfolio of Investments. Subsequent payments (variation margin) are made or received by the Fund each day. The variation margin payments are equal to the daily change in the contract value and are recorded as variation margin receivable or payable and are offset in unrealized gains or losses. The Fund recognizes a realized gain or loss when the contract is closed or expires. Futures contracts involve, to varying degrees, risk of loss in excess of the variation margin disclosed in the Statement of Assets and Liabilities.
Effects of derivative transactions in the financial statements
The following tables are intended to provide additional information about the effect of derivatives on the financial statements of the Fund, including: the fair value of derivatives by risk category and the location of those fair values in the Statement of Assets and Liabilities; and the impact of derivative transactions over the period in the Statement of Operations, including realized and unrealized gains (losses). The derivative instrument schedules following the Portfolio of Investments present additional information regarding derivative instruments outstanding at the end of the period, if any.
The following table is a summary of the fair value of derivative instruments (not considered to be hedging instruments for accounting disclosure purposes) at April 30, 2017:
| | Asset derivatives | |
Risk exposure
category | Statement
of assets and liabilities
location | Fair value ($) |
| Interest rate risk | Net assets — unrealized appreciation on futures contracts | 2,429,696* |
| | Liability derivatives | |
Risk exposure
category | Statement
of assets and liabilities
location | Fair value ($) |
| Interest rate risk | Net assets — unrealized depreciation on futures contracts | 3,990,986* |
| * | Includes cumulative appreciation (depreciation) as reported in the tables following the Portfolio of Investments. Only the current day’s variation margin is reported in receivables or payables in the Statement of Assets and Liabilities. |
Columbia Corporate Income Fund | Annual Report 2017
| 35 |
Notes to Financial Statements (continued)
April 30, 2017
The following table indicates the effect of derivative instruments (not considered to be hedging instruments for accounting disclosure purposes) in the Statement of Operations for the year ended April 30, 2017:
| Amount of realized gain (loss) on derivatives recognized in income |
| Risk exposure category | | | | Futures
contracts
($) | Swap
contracts
($) | Total
($) |
| Credit risk | | | | — | 3,118 | 3,118 |
| Equity risk | | | | (1,531,346) | — | (1,531,346) |
| Total | | | | (1,531,346) | 3,118 | (1,528,228) |
| |
| Change in unrealized appreciation (depreciation) on derivatives recognized in income |
| Risk exposure category | | | | Futures
contracts
($) | Swap
contracts
($) | Total
($) |
| Credit risk | | | | — | 463,114 | 463,114 |
| Interest rate risk | | | | (3,633,421) | — | (3,633,421) |
| Total | | | | (3,633,421) | 463,114 | (3,170,307) |
The following table is a summary of the average outstanding volume by derivative instrument for the year ended April 30, 2017:
| Derivative instrument | Average notional
amounts ($)* |
| Futures contracts — long | 246,706,526 |
| Futures contracts — short | 345,991,942 |
| * | Based on the ending quarterly outstanding amounts for the year ended April 30, 2017. |
Investments in senior loans
The Fund may invest in senior loan assignments. When the Fund purchases an assignment of a senior loan, the Fund typically has direct rights against the borrower; provided, however, that the Fund’s rights may be more limited than the lender from which it acquired the assignment and the Fund may be able to enforce its rights only through an administrative agent. Although certain senior loan assignments are secured by collateral, the Fund could experience delays or limitations in realizing such collateral or have its interest subordinated to other indebtedness of the obligor. In the event that the administrator or collateral agent of a loan becomes insolvent, enters into receivership or bankruptcy, the Fund may incur costs and delays in realizing payment or may suffer a loss of principal and/or interest. The risk of loss is greater for unsecured or subordinated loans. In addition, senior loan assignments are vulnerable to market, economic or other conditions or events that may reduce the demand for senior loan assignments and certain senior loan assignments which were liquid, when purchased, may become illiquid.
The Fund may enter into senior loan assignments where all or a portion of the loan may be unfunded. The Fund is obligated to fund these commitments at the borrower’s discretion. These commitments are generally traded and priced in the same manner as other senior loan securities and are disclosed as unfunded senior loan commitments in the Fund’s Portfolio of Investments with a corresponding payable for investments purchased. The Fund designates cash or liquid securities to cover these commitments.
Delayed delivery securities
The Fund may trade securities on other than normal settlement terms, including securities purchased or sold on a “when-issued” or "forward commitment" basis. This may increase risk to the Fund since the other party to the transaction may fail to deliver, which could cause the Fund to subsequently invest at less advantageous prices. The Fund designates cash or liquid securities in an amount equal to the delayed delivery commitment.
| 36 | Columbia Corporate Income Fund | Annual Report 2017 |
Notes to Financial Statements (continued)
April 30, 2017
Security transactions
Security transactions are accounted for on the trade date. Cost is determined and gains (losses) are based upon the specific identification method for both financial statement and federal income tax purposes.
Trade date for senior loans purchased in the primary market is the date on which the loan is allocated. Trade date for senior loans purchased in the secondary market is the date on which the transaction is entered into.
Income recognition
Interest income is recorded on an accrual basis. Market premiums and discounts, including original issue discounts, are amortized and accreted, respectively, over the expected life of the security on all debt securities, unless otherwise noted. The Fund classifies gains and losses realized on prepayments received on mortgage-backed securities as adjustments to interest income.
The Fund may place a debt security on non-accrual status and reduce related interest income when it becomes probable that the interest will not be collected and the amount of uncollectible interest can be reasonably estimated. A defaulted debt security is removed from non-accrual status when the issuer resumes interest payments or when collectibility of interest is reasonably assured.
Dividend income is recorded on the ex-dividend date.
The Fund may receive other income from senior loans, including amendment fees, consent fees and commitment fees. These fees are recorded as income when received by the Fund. These amounts are included in Interest Income in the Statement of Operations.
Expenses
General expenses of the Trust are allocated to the Fund and other funds of the Trust based upon relative net assets or other expense allocation methodologies determined by the nature of the expense. Expenses directly attributable to the Fund are charged to the Fund. Expenses directly attributable to a specific class of shares are charged to that share class.
Determination of class net asset value
All income, expenses (other than class-specific expenses, which are charged to that share class, as shown in the Statement of Operations) and realized and unrealized gains (losses) are allocated to each class of the Fund on a daily basis, based on the relative net assets of each class, for purposes of determining the net asset value of each class.
Federal income tax status
The Fund intends to qualify each year as a regulated investment company under Subchapter M of the Internal Revenue Code, as amended, and will distribute substantially all of its taxable income (including net short-term capital gains), if any, for its tax year, and as such will not be subject to federal income taxes. In addition, the Fund intends to distribute in each calendar year substantially all of its net investment income, capital gains and certain other amounts, if any, such that the Fund should not be subject to federal excise tax. Therefore, no federal income or excise tax provision is recorded.
Foreign taxes
The Fund may be subject to foreign taxes on income, gains on investments or currency repatriation, a portion of which may be recoverable. The Fund will accrue such taxes and recoveries, as applicable, based upon its current interpretation of tax rules and regulations that exist in the markets in which it invests.
Realized gains in certain countries may be subject to foreign taxes at the Fund level, based on statutory rates. The Fund accrues for such foreign taxes on realized and unrealized gains at the appropriate rate for each jurisdiction, as applicable. The amount, if any, is disclosed as a liability on the Statement of Assets and Liabilities.
Columbia Corporate Income Fund | Annual Report 2017
| 37 |
Notes to Financial Statements (continued)
April 30, 2017
Distributions to shareholders
Distributions from net investment income, if any, are declared daily and paid monthly. Net realized capital gains, if any, are distributed at least annually. Income distributions and capital gain distributions are determined in accordance with federal income tax regulations, which may differ from GAAP.
Guarantees and indemnifications
Under the Trust’s organizational documents and, in some cases, by contract, its officers and trustees are indemnified against certain liabilities arising out of the performance of their duties to the Trust or its funds. In addition, certain of the Fund’s contracts with its service providers contain general indemnification clauses. The Fund’s maximum exposure under these arrangements is unknown since the amount of any future claims that may be made against the Fund cannot be determined, and the Fund has no historical basis for predicting the likelihood of any such claims.
Investment company reporting modernization
In October 2016, the U.S. Securities and Exchange Commission adopted new rules and forms, and amendments to certain current rules and forms, to modernize reporting and disclosure of information by registered investment companies. The amendments to Regulation S-X will require standardized, enhanced disclosure about derivatives in investment company financial statements, and will also change the rules governing the form and content of such financial statements. The amendments to Regulation S-X take effect on August 1, 2017. At this time, management is assessing the anticipated impact of these regulatory developments.
Note 3. Fees and other transactions with affiliates
Management services fees
The Fund entered into a Management Agreement with Columbia Management Investment Advisers, LLC (the Investment Manager), a wholly-owned subsidiary of Ameriprise Financial, Inc. (Ameriprise Financial). Under the Management Agreement, the Investment Manager provides the Fund with investment research and advice, as well as administrative and accounting services. The management services fee is an annual fee that is equal to a percentage of the Fund’s average daily net assets that declines from 0.50% to 0.34% as the Fund’s net assets increase. The effective management services fee rate for the year ended April 30, 2017 was 0.49% of the Fund’s average daily net assets.
Compensation of board members
Members of the Board of Trustees, who are not officers or employees of the Investment Manager or Ameriprise Financial, are compensated for their services to the Fund as disclosed in the Statement of Operations. These members of the Board of Trustees may participate in a Deferred Compensation Plan (the Plan) which may be terminated at any time. Obligations of the Plan will be paid solely out of the Fund’s assets, and all amounts payable under the Plan constitute a general unsecured obligation of the Fund.
Compensation of Chief Compliance Officer
The Board of Trustees has appointed a Chief Compliance Officer to the Fund in accordance with federal securities regulations. A portion of the Chief Compliance Officer’s total compensation is allocated to the Fund, along with other affiliated funds governed by the Board of Trustees, based on relative net assets. The total amount allocated to all affiliated funds governed by the Board of Trustees will not exceed $40,000 annually.
Transfer agency fees
Under a Transfer and Dividend Disbursing Agent Agreement, Columbia Management Investment Services Corp. (the Transfer Agent), an affiliate of the Investment Manager and a wholly-owned subsidiary of Ameriprise Financial, is responsible for providing transfer agency services to the Fund. The Transfer Agent has contracted with Boston Financial Data Services (BFDS) to serve as sub-transfer agent. The Transfer Agent pays the fees of BFDS for services as sub-transfer agent and BFDS is not entitled to reimbursement for such fees from the Fund (with the exception of out-of-pocket fees).
| 38 | Columbia Corporate Income Fund | Annual Report 2017 |
Notes to Financial Statements (continued)
April 30, 2017
The Fund pays the Transfer Agent a monthly transfer agency fee based on the number or the average value of accounts, depending on the type of account. In addition, prior to October 1, 2016, the Transfer Agent also received sub-transfer agency fees based on a percentage of the average aggregate value of the Fund’s shares maintained in omnibus accounts (other than omnibus accounts for which American Enterprise Investment Services Inc. is the broker of record or accounts where the beneficial shareholder is a customer of Ameriprise Financial Services, Inc., for which the Transfer Agent receives a per account fee). Effective October 1, 2016, the Fund pays the Transfer Agent a fee for shareholder services based on the number of accounts or on a percentage of the average aggregate value of the Fund’s shares maintained in omnibus accounts up to the lesser of the amount charged by the financial intermediary or a cap established by the Board of Trustees from time to time.
The Transfer Agent also receives compensation from the Fund for various shareholder services and reimbursements for certain out-of-pocket fees. Effective January 1, 2017, total transfer agency fees for Class R5 shares are subject to an annual limitation of not more than 0.075% of the average daily net assets attributable to Class R5 shares. Total transfer agency fees for Class I, prior to March 27, 2017 were, and Class Y shares are subject to an annual limitation of not more than 0.025% of the average daily net assets attributable to each share class. Prior to January 1, 2017, total transfer agency fees for Class R5 shares were subject to an annual limitation of not more than 0.05% of the average daily net assets attributable to Class R5 shares and Class I and Class Y shares did not pay transfer agency fees.
For the year ended April 30, 2017, the Fund’s effective transfer agency fee rates as a percentage of average daily net assets of each class were as follows:
| | Effective rate (%) |
| Class A | 0.22 |
| Class B | 0.22 |
| Class C | 0.22 |
| Class I | 0.003 (a),(b) |
| Class R4 | 0.22 |
| Class R5 | 0.059 |
| Class T | 0.22 |
| Class Y | 0.009 |
| Class Z | 0.21 |
| (a) | Annualized. |
| (b) | Effective March 27, 2017, Class I shares were redeemed or exchanged for Class Y shares. |
An annual minimum account balance fee of $20 may apply to certain accounts with a value below the applicable share class’s initial minimum investment requirements to reduce the impact of small accounts on transfer agency fees. These minimum account balance fees are remitted to the Fund and recorded as part of expense reductions in the Statement of Operations. For the year ended April 30, 2017, these minimum account balance fees reduced total expenses of the Fund by $980.
Distribution and service fees
The Fund has an agreement with Columbia Management Investment Distributors, Inc. (the Distributor), an affiliate of the Investment Manager and a wholly-owned subsidiary of Ameriprise Financial, for distribution and shareholder services. The Board of Trustees has approved, and the Fund has adopted, distribution and shareholder service plans (the Plans) applicable to certain share classes, which set the distribution and service fees for the Fund. These fees are calculated daily and are intended to compensate the Distributor and/or eligible selling and/or servicing agents for selling shares of the Fund and providing services to investors.
Under the Plans, the Fund pays a monthly service fee to the Distributor at the maximum annual rate of 0.25% of the average daily net assets attributable to Class A, Class B, Class C and Class T shares of the Fund. Also under the Plans, the Fund pays a monthly distribution fee to the Distributor at the maximum annual rates of 0.75%, 0.75% and 0.25% of the average daily net assets attributable to Class B, Class C and Class T shares of the Fund, respectively.
Columbia Corporate Income Fund | Annual Report 2017
| 39 |
Notes to Financial Statements (continued)
April 30, 2017
Although the Fund may pay a distribution fee up to 0.25% of the Fund’s average daily net assets attributable to Class T shares and a service fee of up to 0.25% of the Fund’s average daily net assets attributable to Class T shares, the aggregate fee shall not exceed 0.25% of the Fund’s average daily net assets attributable to Class T shares.
The Distributor has voluntarily agreed to waive a portion of the distribution fee for Class C shares so that the distribution fee does not exceed 0.60% annually of the average daily net assets attributable to Class C shares. This arrangement may be modified or terminated by the Distributor at any time.
Sales charges (unaudited)
Sales charges, including front-end charges and CDSCs, received by the Distributor for distributing Fund shares for the year ended April 30, 2017, if any, are listed below:
| | Amount ($) |
| Class A | 77,132 |
| Class C | 580 |
Expenses waived/reimbursed by the Investment Manager and its affiliates
The Investment Manager and certain of its affiliates have contractually agreed to waive fees and/or reimburse expenses (excluding certain fees and expenses described below) for the period disclosed below, unless sooner terminated at the sole discretion of the Board of Trustees, so that the Fund’s net operating expenses, after giving effect to fees waived/expenses reimbursed and any balance credits and/or overdraft charges from the Fund’s custodian, do not exceed the following annual rates as a percentage of the class’ average daily net assets:
| | Fee rates contractual through August 31, 2017 |
| Class A | 0.92% |
| Class B | 1.67 |
| Class C | 1.67 |
| Class R4 | 0.67 |
| Class R5 | 0.56 |
| Class T | 0.92 |
| Class Y | 0.51 |
| Class Z | 0.67 |
Under the agreement governing these fee waivers and/or expense reimbursement arrangements, the following fees and expenses are excluded from the waiver/reimbursement commitment, and therefore will be paid by the Fund, if applicable: taxes (including foreign transaction taxes), expenses associated with investments in affiliated and non-affiliated pooled investment vehicles (including mutual funds and exchange-traded funds), transaction costs and brokerage commissions, costs related to any securities lending program, dividend and interest expenses associated with securities sold short, inverse floater program fees and expenses, transaction charges and interest on borrowed money, interest, infrequent and/or unusual expenses and any other expenses the exclusion of which is specifically approved by the Board of Trustees. This agreement may be modified or amended only with approval from the Investment Manager, certain of its affiliates and the Fund. Any fees waived and/or expenses reimbursed under the expense reimbursement arrangements described above are not recoverable by the Investment Manager or its affiliates in future periods. Class C distribution fees waived by the Distributor, as discussed above, are in addition to the waiver/reimbursement commitment under the agreement.
Note 4. Federal tax information
The timing and character of income and capital gain distributions are determined in accordance with income tax regulations, which may differ from GAAP because of temporary or permanent book to tax differences.
| 40 | Columbia Corporate Income Fund | Annual Report 2017 |
Notes to Financial Statements (continued)
April 30, 2017
At April 30, 2017, these differences are primarily due to differing treatment for deferral/reversal of wash sale losses, derivative investments, capital loss carryforwards, trustees’ deferred compensation, distributions and principal and/or interest from fixed income securities. To the extent these differences are permanent, reclassifications are made among the components of the Fund’s net assets in the Statement of Assets and Liabilities. Temporary differences do not require reclassifications.
In the Statement of Assets and Liabilities the following reclassifications were made:
Excess of distributions
over net investment
income ($) | Accumulated
net realized
(loss) ($) | Paid in
capital ($) |
| 13,544 | (13,544) | — |
Net investment income (loss) and net realized gains (losses), as disclosed in the Statement of Operations, and net assets were not affected by this reclassification.
The tax character of distributions paid during the years indicated was as follows:
| April 30, 2017 | April 30, 2016 |
Ordinary
income ($) | Long-term
capital gains ($) | Total ($) | Ordinary
income (S) | Long-term
capital gains ($) | Total ($) |
| 34,242,230 | — | 34,242,230 | 45,274,564 | — | 45,274,564 |
Short-term capital gain distributions, if any, are considered ordinary income distributions for tax purposes.
At April 30, 2017, the components of distributable earnings on a tax basis were as follows:
Undistributed
ordinary income ($) | Undistributed
long-term
capital gains ($) | Capital loss
carryforwards ($) | Net unrealized
appreciation ($) |
| 2,664,773 | — | (13,814,802) | 11,609,064 |
At April 30, 2017, the cost of investments for federal income tax purposes along with the aggregate gross unrealized appreciation and depreciation based on that cost was:
Federal
tax cost ($) | Gross unrealized
appreciation ($) | Gross unrealized
(depreciation) ($) | Net unrealized
appreciation ($) |
| 1,221,149,404 | 24,883,844 | (13,274,780) | 11,609,064 |
The following capital loss carryforwards, determined at April 30, 2017, may be available to reduce taxable income arising from future net realized gains on investments, if any, to the extent permitted by the Internal Revenue Code. Capital loss carryforwards with no expiration are required to be utilized prior to any capital losses which carry an expiration date. As a result of this ordering rule, capital loss carryforwards which carry an expiration date may be more likely to expire unused. In addition, for the year ended April 30, 2017, capital loss carryforwards utilized, expired unused and permanently lost were as follows:
| 2018 ($) | 2019 ($) | No expiration
short-term ($) | No expiration
long-term ($) | Total ($) | Utilized ($) | Expired ($) | Permanently
lost ($) |
| — | — | 1,247,636 | 12,567,166 | 13,814,802 | 17,720,038 | — | — |
Management of the Fund has concluded that there are no significant uncertain tax positions in the Fund that would require recognition in the financial statements. However, management’s conclusion may be subject to review and adjustment at a later date based on factors including, but not limited to, new tax laws, regulations, and administrative interpretations (including relevant court decisions). Generally, the Fund’s federal tax returns for the prior three fiscal years remain subject to examination by the Internal Revenue Service.
Columbia Corporate Income Fund | Annual Report 2017
| 41 |
Notes to Financial Statements (continued)
April 30, 2017
Note 5. Portfolio information
The cost of purchases and proceeds from sales of securities, excluding short-term investments and derivatives, if any, aggregated to $934,972,326 and $802,533,513, respectively, for the year ended April 30, 2017, of which $54,611,133 and $24,985,352, respectively, were U.S. government securities. The amount of purchase and sale activity impacts the portfolio turnover rate reported in the Financial Highlights.
Note 6. Affiliated money market fund
The Fund invests in Columbia Short-Term Cash Fund, an affiliated money market fund established for the exclusive use by the Fund and other affiliated funds (the Affiliated MMF). The income earned by the Fund from such investments is included as Dividends - affiliated issuers in the Statement of Operations. As an investing fund, the Fund indirectly bears its proportionate share of the expenses of the Affiliated MMF. Effective October 1, 2016, the Affiliated MMF prices its shares with a floating net asset value (NAV) and no longer seeks to maintain a stable NAV. In addition, the Board of Trustees of the Affiliated MMF may impose a fee on redemptions (sometimes referred to as a liquidity fee) or temporarily suspend redemptions (sometimes referred to as imposing a redemption gate) in the event its liquidity falls below regulatory limits.
Note 7. Line of credit
The Fund has access to a revolving credit facility with a syndicate of banks led by Citibank, N.A., HSBC Bank USA, N.A. and JPMorgan Chase Bank, N.A. whereby the Fund may borrow for the temporary funding of shareholder redemptions or for other temporary or emergency purposes. The credit facility agreement, which is a collective agreement between the Fund and certain other funds managed by the Investment Manager, severally and not jointly, permits collective borrowings up to $1 billion. Interest is charged to each participating fund based on its borrowings at a rate equal to the higher of (i) the overnight federal funds rate plus 1.00% or (ii) the one-month LIBOR rate plus 1.00%. Each borrowing under the credit facility matures no later than 60 days after the date of borrowing. The Fund also pays a commitment fee equal to its pro rata share of the amount of the credit facility at a rate of 0.15% per annum. The commitment fee is included in other expenses in the Statement of Operations.
The Fund had no borrowings during the year ended April 30, 2017.
Note 8. Significant risks
Credit risk
Credit risk is the risk that the value of debt securities in the Fund’s portfolio may decline because the issuer may default and fail to pay interest or repay principal when due. Rating agencies assign credit ratings to debt securities to indicate their credit risk. Lower rated or unrated debt securities held by the Fund may present increased credit risk as compared to higher-rated debt securities.
Interest rate risk
Interest rate risk is the risk of losses attributable to changes in interest rates. In general, if prevailing interest rates rise, the values of debt securities tend to fall, and if interest rates fall, the values of debt securities tend to rise. Actions by governments and central banking authorities can result in increases in interest rates. Increasing interest rates may negatively affect the value of debt securities held by the Fund, resulting in a negative impact on the Fund’s performance and net asset value per share. In general, the longer the maturity or duration of a debt security, the greater its sensitivity to changes in interest rates.
Liquidity risk
Liquidity risk is the risk associated with a lack of marketability of investments which may make it difficult to sell the investment at a desirable time or price. Changing regulatory, market or other conditions or environments (for example, the interest rate or credit environments) may adversely affect the liquidity of the Fund’s investments. The Fund may have to accept a lower selling price for the holding, sell other investments, or forego another, more appealing investment opportunity.
| 42 | Columbia Corporate Income Fund | Annual Report 2017 |
Notes to Financial Statements (continued)
April 30, 2017
Generally, the less liquid the market at the time the Fund sells a portfolio investment, the greater the risk of loss or decline of value to the Fund. A less liquid market can lead to an increase in Fund redemptions, which may negatively impact Fund performance and net asset value per share, including, for example, if the Fund is forced to sell securities in a down market.
Shareholder concentration risk
At April 30, 2017, unaffiliated shareholders of record owned 24.9% of the outstanding shares of the Fund in one or more accounts. The Fund has no knowledge about whether any portion of those shares was owned beneficially. Affiliated shareholders of record owned 61.1% of the outstanding shares of the Fund in one or more accounts. Subscription and redemption activity by concentrated accounts may have a significant effect on the operations of the Fund. In the case of a large redemption, the Fund may be forced to sell investments at inopportune times, including its liquid or more liquid positions, resulting in Fund losses and the Fund holding a higher percentage of less liquid or illiquid securities. Large redemptions could result in decreased economies of scale and increased operating expenses for non-redeeming Fund shareholders.
Note 9. Subsequent events
Management has evaluated the events and transactions that have occurred through the date the financial statements were issued. Other than as noted in Note 1 above, there were no items requiring adjustment of the financial statements or additional disclosure.
Note 10. Information regarding pending and settled legal proceedings
Ameriprise Financial and certain of its affiliates have historically been involved in a number of legal, arbitration and regulatory proceedings, including routine litigation, class actions, and governmental actions, concerning matters arising in connection with the conduct of their business activities. Ameriprise Financial believes that the Funds are not currently the subject of, and that neither Ameriprise Financial nor any of its affiliates are the subject of, any pending legal, arbitration or regulatory proceedings that are likely to have a material adverse effect on the Funds or the ability of Ameriprise Financial or its affiliates to perform under their contracts with the Funds. Ameriprise Financial is required to make quarterly (10-Q), annual (10-K) and, as necessary, 8-K filings with the Securities and Exchange Commission (SEC) on legal and regulatory matters that relate to Ameriprise Financial and its affiliates. Copies of these filings may be obtained by accessing the SEC website at www.sec.gov.
There can be no assurance that these matters, or the adverse publicity associated with them, will not result in increased fund redemptions, reduced sale of fund shares or other adverse consequences to the Funds. Further, although we believe proceedings are not likely to have a material adverse effect on the Funds or the ability of Ameriprise Financial or its affiliates to perform under their contracts with the Funds, these proceedings are subject to uncertainties and, as such, we are unable to estimate the possible loss or range of loss that may result. An adverse outcome in one or more of these proceedings could result in adverse judgments, settlements, fines, penalties or other relief that could have a material adverse effect on the consolidated financial condition or results of operations of Ameriprise Financial.
Columbia Corporate Income Fund | Annual Report 2017
| 43 |
Report of Independent Registered Public Accounting Firm
To the Trustees of Columbia Funds Series Trust I and the Shareholders of Columbia Corporate Income Fund
In our opinion, the accompanying statement of assets and liabilities, including the portfolio of investments, and the related statements of operations and of changes in net assets and the financial highlights present fairly, in all material respects, the financial position of Columbia Corporate Income Fund (the “Fund”, a series of Columbia Funds Series Trust I) as of April 30, 2017, the results of its operations for the year then ended, the changes in its net assets for each of the two years in the period then ended and the financial highlights for each of the five years in the period then ended, in conformity with accounting principles generally accepted in the United States of America. These financial statements and financial highlights (hereafter referred to as “financial statements”) are the responsibility of the Fund’s management. Our responsibility is to express an opinion on these financial statements based on our audits. We conducted our audits of these financial statements in accordance with the standards of the Public Company Accounting Oversight Board (United States).Those standards require that we plan and perform the audit to obtain reasonable assurance about whether the financial statements are free of material misstatement. An audit includes examining, on a test basis, evidence supporting the amounts and disclosures in the financial statements, assessing the accounting principles used and significant estimates made by management, and evaluating the overall financial statement presentation. We believe that our audits, which included confirmation of securities as of April 30, 2017 by correspondence with the custodian, brokers, agent banks and transfer agent, provide a reasonable basis for our opinion.
PricewaterhouseCoopers LLP
Minneapolis, MN
June 21, 2017
| 44 | Columbia Corporate Income Fund | Annual Report 2017 |
Shareholders elect the Board that oversees the Fund’s operations. The Board appoints officers who are responsible for day-to-day business decisions based on policies set by the Board. The following table provides basic biographical information about the Fund’s Trustees, including their principal occupations during the past five years, although specific titles for individuals may have varied over the period. The year set forth beneath Length of Service in the table below is the year in which the Trustee was first appointed or elected as Trustee to any Fund currently in the Columbia Funds Complex or a predecessor thereof. Under current Board policy, members serve terms of indefinite duration.
Independent trustees
| Name, address, year of birth | Position held with the Trust and length of service | Principal occupation(s) during the past five years and other relevant professional experience | Number of Funds in the Columbia Fund Complex overseen | Other directorships held by Trustee during the past five years |
Janet Langford Carrig
c/o Columbia Management
Investment Advisers, LLC
225 Franklin Street
Mail Drop BX32 05228
Boston, MA 02110
1957 | Trustee
1996 | Senior Vice President, General Counsel and Corporate Secretary, ConocoPhillips (independent energy company) since September 2007 | 57 | None |
Douglas A. Hacker
c/o Columbia Management
Investment Advisers, LLC
225 Franklin Street
Mail Drop BX32 05228
Boston, MA 02110
1955 | Trustee and Chairman of the Board
1996 | Independent business executive since May 2006; Executive Vice President — Strategy of United Airlines from December 2002 to May 2006; President of UAL Loyalty Services (airline marketing company) from September 2001 to December 2002; Executive Vice President and Chief Financial Officer of United Airlines from July 1999 to September 2001 | 57 | Spartan Nash Company, (food distributor); Nash Finch Company (food distributor) from 2005 to 2013; Aircastle Limited (aircraft leasing); SeaCube Container Leasing Ltd. (container leasing) from 2010 to 2013; and Travelport Worldwide Limited (travel information technology) |
Nancy T. Lukitsh
c/o Columbia Management
Investment Advisers, LLC
225 Franklin Street
Mail Drop BX32 05228
Boston, MA 02110
1956 | Trustee
2011 | Senior Vice President, Partner and Director of Marketing, Wellington Management Company, LLP (investment adviser) from 1997 to 2010; Chair, Wellington Management Portfolios (commingled non-U.S. investment pools) from 2007 to 2010; Director, Wellington Trust Company, NA and other Wellington affiliates from 1997 to 2010 | 57 | None |
David M. Moffett
c/o Columbia Management
Investment Advisers, LLC
225 Franklin Street
Mail Drop BX32 05228
Boston, MA 02110
1952 | Trustee
2011 | Retired. Consultant to Bridgewater and Associates | 57 | Director, CSX Corporation; Genworth Financial, Inc. (financial and insurance products and services); Paypal Holdings Inc. (payment and data processing services); Trustee, University of Oklahoma Foundation; former Director, eBay Inc. (online trading community), 2007-2015; and former Director, CIT Bank, CIT Group Inc. (commercial and consumer finance), 2010-2016 |
Columbia Corporate Income Fund | Annual Report 2017
| 45 |
TRUSTEES AND OFFICERS (continued)
Independent trustees (continued)
| Name, address, year of birth | Position held with the Trust and length of service | Principal occupation(s) during the past five years and other relevant professional experience | Number of Funds in the Columbia Fund Complex overseen | Other directorships held by Trustee during the past five years |
Charles R. Nelson
c/o Columbia Management
Investment Advisers, LLC
225 Franklin Street
Mail Drop BX32 05228
Boston, MA 02110
1942 | Trustee
1981 | Retired. Professor Emeritus, University of Washington since 2011; Professor of Economics, University of Washington from 1976 to 2011; Ford and Louisa Van Voorhis Professor of Political Economy, University of Washington from 1993 to 2011; Adjunct Professor of Statistics, University of Washington from 1980 to 2011; Associate Editor, Journal of Money, Credit and Banking from September 1993 to 2008; consultant on econometric and statistical matters | 57 | None |
John J. Neuhauser
c/o Columbia Management
Investment Advisers, LLC
225 Franklin Street
Mail Drop BX32 05228
Boston, MA 02110
1943 | Trustee
1984 | President, Saint Michael’s College since August 2007; Director or Trustee of several non-profit organizations, including University of Vermont Medical Center; Academic Vice President and Dean of Faculties, Boston College from August 1999 to October 2005; University Professor, Boston College from November 2005 to August 2007 | 57 | Liberty All-Star Equity Fund and Liberty All- Star Growth Fund (closed-end funds) |
Patrick J. Simpson
c/o Columbia Management
Investment Advisers, LLC
225 Franklin Street
Mail Drop BX32 05228
Boston, MA 02110
1944 | Trustee
2000 | Of Counsel, Perkins Coie LLP (law firm) since 2015; Partner, Perkins Coie LLP from 1988 to 2014 | 57 | None |
Anne-Lee Verville
c/o Columbia Management
Investment Advisers, LLC
225 Franklin Street
Mail Drop BX32 05228
Boston, MA 02110
1945 | Trustee
1998 | Retired. General Manager, Global Education Industry from 1994 to 1997, President – Application Systems Division from 1991 to 1994, Chief Financial Officer – US Marketing & Services from 1988 to 1991, and Chief Information Officer from 1987 to 1988, IBM Corporation (computer and technology) | 57 | Enesco Group, Inc. (producer of giftware and home and garden decor products) from 2001 to 2006 |
| 46 | Columbia Corporate Income Fund | Annual Report 2017 |
TRUSTEES AND OFFICERS (continued)
Consultants to the Independent Trustees*
| Name, address, year of birth | Position held with the Trust and length of service | Principal occupation(s) during the past five years and other relevant professional experience | Number of Funds in the Columbia Funds complex overseen | Other directorships held by Trustee during the past five years |
J. Kevin Connaughton
c/o Columbia
Management Investment
Advisers, LLC,
225 Franklin Street
Mail Drop BX32 05228,
Boston, MA 02110
1964 | Independent Trustee Consultant
2016 | Independent Trustee Consultant, Columbia Funds since March 2016; Managing Director and General Manager of Mutual Fund Products, Columbia Management Investment Advisers, LLC from May 2010 to February 2015; President, Columbia Funds from 2009 to 2015; and senior officer of Columbia Funds and affiliated funds from 2003 to 2015 | 57 | Board of Governors, Gateway Healthcare since January 2016; Trustee, New Century Portfolios since March 2015; and Director, The Autism Project since March 2015 |
Natalie A. Trunow
c/o Columbia
Management Investment
Advisers, LLC,
225 Franklin Street
Mail Drop BX32 05228,
Boston, MA 02110
1967 | Independent Trustee Consultant
2016 | Independent Trustee Consultant, Columbia Funds since September 2016; Chief Executive Officer, Millennial Partners (investment consulting services to institutions) since January 2016; Director of Investments, Casey Family Programs from April 2016 to September 2016; Senior Vice President and Chief Investment Officer, Calvert Investments from August 2008 to January 2016; Section Head and Portfolio Manager, General Motors Asset Management from June 1997 to August 2008 | 57 | Healthcare Services for Children with Special Needs |
| * | J. Kevin Connaughton was appointed consultant to the Independent Trustees effective March 1, 2016. Natalie A. Trunow was appointed consultant to the Independent Trustees effective September 1, 2016. Shareholders of the Funds are expected to be asked to elect each of Mr. Connaughton and Ms. Trunow as a Trustee at a future shareholder meeting. |
Interested trustee affiliated with Investment Manager*
| Name, address, year of birth | Position held with the Trust and length of service | Principal occupation(s) during the past five years and other relevant professional experience | Number of Funds in the Columbia Funds Complex overseen | Other directorships held by Trustee during the past five years |
William F. Truscott
c/o Columbia Management
Investment Advisers, LLC
225 Franklin Street
Boston, MA 02110
1960 | Trustee
2012 | Chairman of the Board and President, Columbia Management Investment Advisers, LLC since May 2010 and February 2012, respectively; Chief Executive Officer, Global Asset Management, Ameriprise Financial, Inc. since September 2012 (previously Chief Executive Officer, U.S. Asset Management & President, Annuities, May 2010-September 2012); Director and Chief Executive Officer, Columbia Management Investment Distributors, Inc. since May 2010 and February 2012, respectively;Chairman of the Board and Chief Executive Officer, RiverSource Distributors, Inc. since 2006; Director, Threadneedle Asset Management Holdings, SARL since 2014; President and Chief Executive Officer, Ameriprise Certificate Company, 2006-August 2012 | 183 | Chairman of the Board, Columbia Management Investment Advisers, LLC since May 2010; Director, Columbia Management Investment Distributors, Inc. since May 2010; former Director, Ameriprise Certificate Company, 2006 - January 2013 |
| * | Interested person (as defined under the 1940 Act) by reason of being an officer, director, security holder and/or employee of the Investment Manager or Ameriprise Financial. |
The Statement of Additional Information has additional information about the Fund’s Board members and is available,
without charge, upon request by calling 800.345.6611; contacting your financial intermediary; or visiting
investor.columbiathreadneedleus.com.
Columbia Corporate Income Fund | Annual Report 2017
| 47 |
TRUSTEES AND OFFICERS (continued)
The Board has appointed officers who are responsible for day-to-day business decisions based on policies it has established. The officers serve at the pleasure of the Board. The following table provides basic information about the Officers of the Fund, including principal occupations during the past five years, although their specific titles may have varied over the period. In addition to Mr. Truscott, who is Senior Vice President, the Fund’s other officers are:
Fund officers
Name,
address and
year of birth | Position and year
first appointed to
position for any Fund
in the Columbia
Funds complex or a
predecessor thereof | Principal occupation(s) during past five years |
Christopher O. Petersen
5228 Ameriprise
Financial Center
Minneapolis, MN 55474
Born 1970 | President and Principal Executive Officer (2015) | Vice President and Lead Chief Counsel, Ameriprise Financial, Inc. since January 2015 (previously, Vice President and Chief Counsel, January 2010 - December 2014; officer of Columbia Funds and affiliated funds since 2007. |
Michael G. Clarke
225 Franklin Street
Boston, MA 02110
Born 1969 | Treasurer (2011), Chief Financial Officer (2009) and Chief Accounting Officer (2015) | Vice President — Mutual Fund Administration, Columbia Management Investment Advisers, LLC, since May 2010; senior officer of Columbia Funds and affiliated funds since 2002. |
Paul B. Goucher
100 Park Avenue
New York, NY 10017
Born 1968 | Senior Vice President (2011) and Assistant Secretary (2008) | Senior Vice President and Assistant General Counsel, Ameriprise Financial, Inc. since January 2017 (previously Vice President and Lead Chief Counsel, November 2008 - January 2017 and January 2013 - January 2017, respectively; and Chief Counsel, January 2010 - January 2013); Vice President, Chief Legal Officer and Assistant Secretary, Columbia Management Investment Advisers, LLC since May 2010. |
Thomas P. McGuire
225 Franklin Street
Boston, MA 02110
Born 1972 | Senior Vice President and Chief Compliance Officer (2012) | Vice President — Asset Management Compliance, Ameriprise Financial, Inc., since May 2010; Chief Compliance Officer, Ameriprise Certificate Company since September 2010. |
Colin Moore
225 Franklin Street
Boston, MA 02110
Born 1958 | Senior Vice President (2010) | Executive Vice President and Global Chief Investment Officer, Ameriprise Financial, Inc., since July 2013; Executive Vice President and Global Chief Investment Officer, Columbia Management Investment Advisers, LLC since July 2013 (previously Director and Global Chief Investment Officer, 2010 - 2013). |
Michael E. DeFao
225 Franklin Street
Boston, MA 02110
Born 1968 | Vice President (2011) and Assistant Secretary (2010) | Vice President and Chief Counsel, Ameriprise Financial, Inc. since May 2010. |
Amy Johnson
5228 Ameriprise
Financial Center
Minneapolis, MN 55474
Born 1965 | Vice President (2006) | Managing Director and Global Head of Operations, Columbia Management Investment Advisers, LLC since April 2016 (previously Managing Director and Chief Operating Officer, 2010 - 2016). |
Lyn Kephart-Strong
5228 Ameriprise
Financial Center
Minneapolis, MN 55474
Born 1960 | Vice President (2015) | President, Columbia Management Investment Services Corp. since October 2014; Vice President & Resolution Officer, Ameriprise Trust Company since August 2009. |
Ryan C. Larrenaga
225 Franklin Street
Boston, MA 02110
Born 1970 | Senior Vice President (2017), Chief Legal Officer (2017) and Secretary (2015) | Vice President and Group Counsel, Ameriprise Financial, Inc. since August 2011; officer of Columbia Funds and affiliated funds since 2005. |
| 48 | Columbia Corporate Income Fund | Annual Report 2017 |
The Fund mails one shareholder report to each shareholder address. If you would like more than one report, please call shareholder services at 800.345.6611 and additional reports will be sent to you.
Proxy voting policies and procedures
The policy of the Board of Trustees is to vote the proxies of the companies in which the Fund holds investments consistent with the procedures as stated in the Statement of Additional Information (SAI). You may obtain a copy of the SAI without charge by calling 800.345.6611; contacting your financial intermediary; visiting investor.columbiathreadneedleus.com; or searching the website of the Securities and Exchange Commission (SEC) at sec.gov. Information regarding how the Fund voted proxies relating to portfolio securities is filed with the SEC by August 31st for the most recent 12-month period ending June 30th of that year, and is available without charge by visiting investor.columbiathreadneedleus.com, or searching the website of the SEC at sec.gov.
Quarterly schedule of investments
The Fund files a complete schedule of portfolio holdings with the SEC for the first and third quarters of each fiscal year on Form N-Q. The Fund’s Form N-Q is available on the SEC’s website at sec.gov and may be reviewed and copied at the SEC’s Public Reference Room in Washington, D.C. Information on the operation of the Public Reference Room may be obtained by calling 800.SEC.0330. The Fund’s complete schedule of portfolio holdings, as filed on Form N-Q, can also be obtained without charge, upon request, by calling 800.345.6611.
Additional Fund information
For more information about the Fund, please visit investor.columbiathreadneedleus.com or call 800.345.6611. Customer Service Representatives are available to answer your questions Monday through Friday from 8 a.m. to 7 p.m. Eastern time.
Fund investment manager
Columbia Management Investment Advisers, LLC
225 Franklin Street
Boston, MA 02110
Fund distributor
Columbia Management Investment Distributors, Inc.
225 Franklin Street
Boston, MA 02110
Fund transfer agent
Columbia Management Investment Services Corp.
P.O. Box 8081
Boston, MA 02266-8081
Columbia Corporate Income Fund | Annual Report 2017
| 49 |
Columbia Corporate Income Fund
P.O. Box 8081
Boston, MA 02266-8081
Please read and consider the investment objectives, risks, charges and expenses for any fund carefully before investing. For a prospectus and summary prospectus, which contains this and other important information about the Fund, go to
investor.columbiathreadneedleus.com. The Fund is distributed by Columbia Management Investment Distributors, Inc., member FINRA, and managed by Columbia Management Investment Advisers, LLC.
Columbia Threadneedle Investments (Columbia Threadneedle) is the global brand name of the Columbia and Threadneedle group of companies. All rights reserved. Columbia Management Investment Distributors, Inc., 225 Franklin Street, Boston, MA 02110-2804
© 2017 Columbia Management Investment Advisers, LLC.
investor.columbiathreadneedleus.com

Annual Report
April 30, 2017
Columbia U.S. Treasury Index Fund
Not FDIC Insured • No bank guarantee • May lose value
Dear Shareholders,
While emotions have run high following the outcome of the U.S. Presidential election, it remains unclear how the Trump presidency will unfold in terms of policy. We have a sense of the priorities espoused by the President over the past eighteen months, but campaign priorities are not always realized and are often never pursued. What seems certain is that, while some investors have already priced expectations into the market, others have retreated, preferring instead a wait and see approach. The outcome of such behaviors appears to have created conditions ripe for ongoing market volatility.
While volatility in the financial markets can be stressful, volatility itself is not a new phenomenon. Other factors that have been at the root cause of recent volatility include uncertainty following the United Kingdom’s vote to exit the European Union (Brexit), speculation around the Federal Reserve’s decision to increase interest rates, divergent central bank policy and geopolitical unrest. The point is, financial markets have fluctuated for years and may be expected to continue to fluctuate — sometimes wildly. If anything, such volatility seems to be the new normal, perhaps exacerbated by access to information and development of technological tools which have enabled investors to react rapidly to real and perceived change. So what can you do?
Position your portfolio for the reality of market volatility
That there is a historical precedent for market volatility, or even an acceptance that it may persist, offers little comfort. A measured and strategic approach remains the best strategy for investors to stay on track in achieving their investment goals.
Step 1: Review your investment goals
Take this opportunity to review your investment goals and the strategies you are pursuing to achieve those goals in order to remain focused on what’s important to you. It is entirely possible that your goals have changed in response either to your life situation or to changes in the market. Accept what you can’t control — volatility, and focus on what you can — your investment goals and strategies.
Step 2: Reassess your risk tolerance
Sit down with your financial advisor to discuss your investment goals and strategies, as well as any changes to your tolerance for risk. Consider your investment horizon. Increased market volatility and a new investment horizon may impact the strategies that can best help you achieve your investment goals. Remember, achieving your investment goals may require a certain amount of risk. Ultimately, you must maintain vigilance in reassessing your risk tolerance and the strategies you have selected in pursuit of your investment goals, and awareness of how those strategies may react to market volatility.
Step 3: Remain calm and focus on your long-term plan
Remember, investing is about the long game. Short term events are not necessarily evidence of a longer term reality. Investors who attempt to time the market too often end up reacting to a down turn by selling low and then compounding the problem by waiting on the sidelines, ultimately missing the right opportunity to reinvest.
Columbia U.S. Treasury Index Fund | Annual Report 2017
President’s Message (continued)
As long as there is a market, there will be volatility. How you respond to that volatility can make a big difference in the measure of your success as an investor. Talk to your financial advisor about how working with Columbia Threadneedle Investments may help you position your portfolio for the reality of ongoing volatility and, perhaps, even turn such volatility into investment opportunity.
Sincerely,
Christopher O. Petersen
President, Columbia Funds
Investors should consider the investment objectives, risks, charges and expenses of a mutual fund carefully before investing. For a free prospectus and summary prospectus, which contains this and other important information about a fund, visit investor.columbiathreadneedleus.com. The prospectus should be read carefully before investing.
Columbia Funds are distributed by Columbia Management Investment Distributors, Inc., member FINRA, and managed by Columbia Management Investment Advisers, LLC.
© 2017 Columbia Management Investment Advisers, LLC. All rights reserved.
Columbia U.S. Treasury Index Fund | Annual Report 2017
Columbia U.S. Treasury Index Fund | Annual Report 2017
Investment objective
Columbia U.S. Treasury Index Fund (the Fund) seeks total return that corresponds to the total return of the Citi Bond U.S. Treasury Index, before fees and expenses.
Portfolio management
Alan Erickson, CFA
Manager
Managed Fund since January 2017
Effective January 27, 2017, Orhan Imer and William Finan no longer serve as portfolio managers of the Fund.
| Average annual total returns (%) (for the period ended April 30, 2017) |
| | | Inception | 1 Year | 5 Years | 10 Years |
| Class A | 11/25/02 | -0.94 | 1.03 | 3.48 |
| Class B | Excluding sales charges | 11/25/02 | -1.68 | 0.28 | 2.71 |
| | Including sales charges | | -6.55 | -0.09 | 2.71 |
| Class C | Excluding sales charges | 11/25/02 | -1.63 | 0.38 | 2.83 |
| | Including sales charges | | -2.60 | 0.38 | 2.83 |
| Class R5 * | 11/08/12 | -0.80 | 1.23 | 3.71 |
| Class T * | Excluding sales charges | 06/18/12 | -0.95 | 0.97 | 3.34 |
| | Including sales charges | | -3.43 | 0.47 | 3.08 |
| Class Y * | 03/01/17 | -0.80 | 1.23 | 3.71 |
| Class Z | 06/04/91 | -0.79 | 1.23 | 3.71 |
| Citi Bond U.S. Treasury Index | | -0.62 | 1.43 | 3.87 |
Returns for Class B are shown with and without the applicable contingent deferred sales charge (CDSC) of 5.00% in the first year, declining to 1.00% in the sixth year and eliminated thereafter. The Fund does not accept new investments in Class B shares, except for certain limited transactions. The Fund’s current Class B investors, having held their shares for the requisite time period, are no longer subject to a CDSC upon redemption of their shares. Returns for Class C are shown with and without the 1.00% CDSC for the first year only. The returns for Class T shares are shown with and without the maximum applicable sales charge of 2.50% per transaction. Prior to March 27, 2017, Class T shares were known as Class W shares and were sold without a sales charge. The Fund’s other classes are not subject to sales charges and have limited eligibility. Please see the Fund’s prospectus for details. Performance for different share classes will vary based on differences in sales charges and fees associated with each class. All results shown assume reinvestment of distributions during the period. Returns do not reflect the deduction of taxes that a shareholder may pay on Fund distributions or on the redemption of Fund shares. Performance results reflect the effect of any fee waivers or reimbursements of Fund expenses by Columbia Management Investment Advisers, LLC and/or any of its affiliates. Absent these fee waivers or expense reimbursement arrangements, performance results would have been lower.
The performance information shown represents past performance and is not a guarantee of future results. The investment return and principal value of your investment will fluctuate so that your shares, when redeemed, may be worth more or less than their original cost. Current performance may be lower or higher than the performance information shown. You may obtain performance information current to the most recent month-end by contacting your financial intermediary, visiting investor.columbiathreadneedleus.com or calling 800.345.6611.
| * | The returns shown for periods prior to the share class inception date (including returns for the Life of the Fund, if shown, which are since Fund inception) include the returns of the Fund’s oldest share class. These returns are adjusted to reflect any higher class-related operating expenses of the newer share classes, as applicable. Please visit investor.columbiathreadneedleus.com/investment-products/mutual-funds/appended-performance for more information. |
The Citi Bond U.S. Treasury Index is an index composed of all U.S. Treasury notes and bonds with remaining maturities of at least one year and outstanding principal of at least $25 million that are included in the Citi Broad Investment-Grade Bond Index.
Indices are not available for investment, are not professionally managed and do not reflect sales charges, fees, brokerage commissions, taxes or other expenses of investing. Securities in the Fund may not match those in an index.
Columbia U.S. Treasury Index Fund | Annual Report 2017
| 3 |
Fund at a Glance (continued)
Performance of a hypothetical $10,000 investment (April 30, 2007 — April 30, 2017)
The chart above shows the change in value of a hypothetical $10,000 investment in Class A shares of Columbia U.S. Treasury Index Fund during the stated time period, and does not reflect the deduction of taxes that a shareholder may pay on Fund distributions or on the redemption of Fund shares.
| Portfolio breakdown (%) (at April 30, 2017) |
| Money Market Funds | 0.7 |
| U.S. Treasury Obligations | 99.3 |
| Total | 100.0 |
Percentages indicated are based upon total investments. The Fund’s portfolio composition is subject to change.
| Quality breakdown (%) (at April 30, 2017) |
| AAA rating | 100.0 |
| Total | 100.0 |
Percentages indicated are based upon total fixed income investments (excluding Money Market Funds).
Bond ratings apply to the underlying holdings of the Fund and not the Fund itself and are divided into categories ranging from highest to lowest credit quality, determined by using the middle rating of Moody’s, S&P and Fitch, after dropping the highest and lowest available ratings. When ratings are available from only two rating agencies, the lower rating is used. When a rating is available from only one rating agency, that rating is used. When a bond is not rated by any rating agency, it is designated as “Not rated.” Credit quality ratings assigned by a rating agency are subjective opinions, not statements of fact, and are subject to change, including daily. The ratings assigned by credit rating agencies are but one of the considerations that the Investment Manager and/or Fund’s subadviser incorporates into its credit analysis process, along with such other issuer-specific factors as cash flows, capital structure and leverage ratios, ability to de-leverage (repay) through free cash flow, quality of management, market positioning and access to capital, as well as such security-specific factors as the terms of the security (e.g., interest rate and time to maturity) and the amount and type of any collateral.
| 4 | Columbia U.S. Treasury Index Fund | Annual Report 2017 |
Manager Discussion of Fund Performance
For the 12-month period that ended April 30, 2017, the Fund’s Class A shares returned -0.94% excluding sales charges. The Citi Bond U.S. Treasury Index returned -0.62% over the same period. The Fund generally tracked the benchmark in a period that in the end was largely neutral for U.S. Treasury securities. Fees, which the Fund incurs but the benchmark does not, generally accounted for the slight difference in returns.
An early rally in U.S. Treasuries subsided
Over the past 12 months, changes to the U.S. Treasury yield curve – and therefore Treasury security performance – were primarily driven by unforeseen international referendum and U.S. election results. The Treasury curve flattened during the second quarter of 2016, mainly due to the UK’s “Brexit” vote to leave the European Union, which drove yields within all developed markets lower as security prices rose. The difference in yield between two- and 30-year U.S. Treasuries was 189 basis points at the end of the second quarter of 2016 and dipped to as low as 140 basis points in last August 2016. Most of the rate changes came at the long end of the Treasury yield curve as the market priced in continued slow economic growth and a lack of inflationary pressures. However, the market quickly reversed course after the U.S. election. In the wake of Donald Trump’s surprise victory, investors looked for additional fiscal stimulus, lower taxes and a diminished regulatory burden from the new administration. The two-year versus 30-year Treasury rate differential rose as high as 200 basis points following the election. Subsequently, in the wake of legislative disappointments in Congress and political turmoil within the administration, we saw a slight retracement in this reflation story as the Treasury yield curve returned to pre-Brexit levels. Following all the shifts to the yield curve, the end result was largely neutral Treasury performance over the Fund’s most recent fiscal year ended April 30, 2017.
During the period, the U.S. Federal Reserve (the Fed) raised short-term interest rates in December 2016 and March 2017, and the market consensus as of the end of April was that the U.S. central bank would increase the fed funds rate in June 2017 as well. Over the 12 months ended April 30, 2017, the Fed was very deliberate in its inter-meeting and post-meeting communications, consistently stating that U.S. labor market conditions were improving, economic growth was moderate and inflation was running below their long-term target. Fed officials gave no indication that they believed they were behind the curve (i.e., they feel they have been raising short-term rates quickly enough to head off excess inflation). Instead, they have stated that they can adjust the fed funds rate closer to its typical long-term average in a measured fashion. More recently, the Fed has begun to address its balance sheet. In this case, Fed officials wanted to demonstrate that they plan to adjust the Federal Reserve balance sheet in a way that is least disruptive to the markets. We believe that the Fed will taper its reinvestments in agency mortgage-backed securities and U.S. Treasuries at a predictable level over an extended time horizon. This could keep the yield curve steeper (i.e., longer term rates measurably higher than short-term rates) as the Fed’s longer term Treasury security purchases would be diminished.
At period’s end
As stated, the Brexit referendum and the U.S. presidential election had the biggest impact on rates over the 12-month period, as both results represented a major surprise to investment markets. At the end of the reporting period, the factors that were impacting Treasury yields included geopolitical developments and anticipated tax and stimulus bills from Washington. Day-to-day economic releases such as payroll and inflation reports, as well as unemployment claims, have had less of an impact than the macroeconomic factors mentioned above.
Market risk may affect a single issuer, sector of the economy, industry or the market as a whole. The U.S. government may be unable or unwilling to honor its financial obligations. Securities issued or guaranteed by federal agencies and U.S. government-sponsored instrumentalities may or may not be backed by the full faith and credit of the U.S. government. A rise in interest rates may result in a price decline of fixed-income instruments held by the Fund, negatively impacting its performance and NAV. Falling rates may result in the Fund investing in lower yielding debt instruments, lowering the Fund’s income and yield. These risks may be heightened for longer maturity and duration securities. The Fund’s net value will generally decline when the performance of its targeted index declines. See the Fund’s prospectus for more information on these and other risks.
The views expressed in this report reflect the current views of the respective parties. These views are not guarantees of future performance and involve certain risks, uncertainties and assumptions that are difficult to predict, so actual outcomes and results may differ significantly from the views expressed. These views are subject to change at any time based upon economic, market or other conditions and the respective parties disclaim any responsibility to update such views. These
Columbia U.S. Treasury Index Fund | Annual Report 2017
| 5 |
Manager Discussion of Fund Performance (continued)
views may not be relied on as investment advice and, because investment decisions for a Columbia fund are based on numerous factors, may not be relied on as an indication of trading intent on behalf of any particular Columbia fund. References to specific securities should not be construed as a recommendation or investment advice.
| 6 | Columbia U.S. Treasury Index Fund | Annual Report 2017 |
Understanding Your Fund’s Expenses
(Unaudited)
As an investor, you incur two types of costs. There are transaction costs, which generally include sales charges on purchases and may include redemption fees. There are also ongoing costs, which generally include management fees, distribution and/or service fees, and other fund expenses. The following information is intended to help you understand your ongoing costs (in dollars) of investing in the Fund and to help you compare these costs with the ongoing costs of investing in other mutual funds.
Analyzing your Fund’s expenses
To illustrate these ongoing costs, we have provided examples and calculated the expenses paid by investors in each share class of the Fund during the period. The actual and hypothetical information in the table is based on an initial investment of $1,000 at the beginning of the period indicated and held for the entire period. Expense information is calculated two ways and each method provides you with different information. The amount listed in the “Actual” column is calculated using the Fund’s actual operating expenses and total return for the period. You may use the Actual information, together with the amount invested, to estimate the expenses that you paid over the period. Simply divide your account value by $1,000 (for example, an $8,600 account value divided by $1,000 = 8.6), then multiply the results by the expenses paid during the period under the “Actual” column. The amount listed in the “Hypothetical” column assumes a 5% annual rate of return before expenses (which is not the Fund’s actual return) and then applies the Fund’s actual expense ratio for the period to the hypothetical return. You should not use the hypothetical account values and expenses to estimate either your actual account balance at the end of the period or the expenses you paid during the period. See “Compare with other funds” below for details on how to use the hypothetical data.
Compare with other funds
Since all mutual funds are required to include the same hypothetical calculations about expenses in shareholder reports, you can use this information to compare the ongoing cost of investing in the Fund with other funds. To do so, compare the hypothetical example with the 5% hypothetical examples that appear in the shareholder reports of other funds. As you compare hypothetical examples of other funds, it is important to note that hypothetical examples are meant to highlight the ongoing costs of investing in a fund only and do not reflect any transaction costs, such as sales charges, or redemption or exchange fees. Therefore, the hypothetical calculations are useful in comparing ongoing costs only, and will not help you determine the relative total costs of owning different funds. If transaction costs were included in these calculations, your costs would be higher.
| November 1, 2016 — April 30, 2017 |
| | Account value at the
beginning of the
period ($) | Account value at the
end of the
period ($) | Expenses paid during
the period ($) | Fund’s annualized
expense ratio (%) |
| | Actual | Hypothetical | Actual | Hypothetical | Actual | Hypothetical | Actual |
| Class A | 1,000.00 | 1,000.00 | 984.50 | 1,022.80 | 1.70 | 1.74 | 0.35 |
| Class B | 1,000.00 | 1,000.00 | 980.90 | 1,019.13 | 5.34 | 5.45 | 1.10 |
| Class C | 1,000.00 | 1,000.00 | 981.20 | 1,019.37 | 5.10 | 5.20 | 1.05 |
| Class R5 | 1,000.00 | 1,000.00 | 985.30 | 1,023.54 | 0.97 | 0.99 | 0.20 |
| Class T (formerly Class W) | 1,000.00 | 1,000.00 | 984.90 | 1,022.31 | 2.19 | 2.23 | 0.45 |
| Class Y | 1,000.00 | 1,000.00 | 1,012.40 (a) | 1,023.54 | 0.31 (a) | 0.99 | 0.20 (a) |
| Class Z | 1,000.00 | 1,000.00 | 985.30 | 1,023.54 | 0.97 | 0.99 | 0.20 |
| (a) | Based on operations from March 1, 2017 (commencement of operations) through the stated period end. |
Expenses paid during the period are equal to the annualized expense ratio for each class as indicated above, multiplied by the average account value over the period and then multiplied by the number of days in the Fund’s most recent fiscal half year and divided by 365.
Expenses do not include fees and expenses incurred indirectly by the Fund from its investment in underlying funds, including affiliated and non-affiliated pooled investment vehicles, such as mutual funds and exchange-traded funds.
Had Columbia Management Investment Advisers, LLC and/or certain of its affiliates not waived/reimbursed certain fees and expenses, account value at the end of the period would have been reduced.
Columbia U.S. Treasury Index Fund | Annual Report 2017
| 7 |
Portfolio of Investments
April 30, 2017
(Percentages represent value of investments compared to net assets)
| U.S. Treasury Obligations 99.2% |
| Issuer | Coupon
Rate | | Principal
Amount ($) | Value ($) |
| U.S. Treasury |
| 04/15/18 | 0.750% | | 12,889,000 | 12,842,680 |
| 05/15/18 | 1.000% | | 5,460,000 | 5,451,471 |
| 07/15/18 | 0.875% | | 16,495,000 | 16,438,298 |
| 08/15/18 | 1.000% | | 5,820,000 | 5,806,359 |
| 08/31/18 | 0.750% | | 10,986,000 | 10,920,765 |
| 08/31/18 | 1.500% | | 17,179,000 | 17,246,771 |
| 09/15/18 | 1.000% | | 5,550,000 | 5,533,739 |
| 10/31/18 | 0.750% | | 13,868,000 | 13,772,117 |
| 11/15/18 | 1.250% | | 5,435,000 | 5,437,548 |
| 11/30/18 | 1.250% | | 1,430,000 | 1,430,615 |
| 12/15/18 | 1.250% | | 9,275,000 | 9,277,898 |
| 02/15/19 | 0.750% | | 18,636,000 | 18,471,481 |
| 04/15/19 | 0.875% | | 7,721,000 | 7,662,189 |
| 04/30/19 | 1.625% | | 6,930,000 | 6,977,644 |
| 07/31/19 | 0.875% | | 10,986,000 | 10,880,436 |
| 07/31/19 | 1.625% | | 9,443,000 | 9,507,921 |
| 08/15/19 | 0.750% | | 6,993,000 | 6,901,490 |
| 09/30/19 | 1.750% | | 6,250,000 | 6,310,550 |
| 10/31/19 | 1.500% | | 7,500,000 | 7,526,370 |
| 01/31/20 | 1.250% | | 11,535,000 | 11,484,085 |
| 02/29/20 | 1.250% | | 9,015,000 | 8,970,628 |
| 02/29/20 | 1.375% | | 10,753,000 | 10,736,198 |
| 03/31/20 | 1.125% | | 14,028,000 | 13,902,520 |
| 03/31/20 | 1.375% | | 9,586,000 | 9,565,031 |
| 04/30/20 | 1.375% | | 5,675,000 | 5,659,926 |
| 05/31/20 | 1.500% | | 2,255,000 | 2,255,705 |
| 07/31/20 | 1.625% | | 4,545,000 | 4,559,203 |
| 08/15/20 | 2.625% | | 5,175,000 | 5,355,520 |
| 08/15/20 | 8.750% | | 8,400,000 | 10,339,879 |
| 08/31/20 | 1.375% | | 2,655,000 | 2,640,066 |
| 08/31/20 | 2.125% | | 1,000,000 | 1,018,477 |
| 09/30/20 | 1.375% | | 16,225,000 | 16,118,523 |
| 09/30/20 | 2.000% | | 2,400,000 | 2,434,687 |
| 10/31/20 | 1.375% | | 4,195,000 | 4,164,848 |
| 10/31/20 | 1.750% | | 2,285,000 | 2,297,586 |
| 11/30/20 | 1.625% | | 6,670,000 | 6,674,169 |
| 11/30/20 | 2.000% | | 4,845,000 | 4,911,241 |
| 12/31/20 | 1.750% | | 1,375,000 | 1,381,016 |
| 01/31/21 | 1.375% | | 4,395,000 | 4,352,423 |
| 02/28/21 | 1.125% | | 31,292,000 | 30,674,703 |
| 03/31/21 | 1.250% | | 8,594,000 | 8,457,033 |
| 03/31/21 | 2.250% | | 1,500,000 | 1,532,871 |
| 05/15/21 | 3.125% | | 2,205,000 | 2,327,739 |
| 07/31/21 | 2.250% | | 2,300,000 | 2,348,965 |
| 08/31/21 | 1.125% | | 11,200,000 | 10,911,253 |
| 08/31/21 | 2.000% | | 2,650,000 | 2,678,053 |
| 09/30/21 | 2.125% | | 3,025,000 | 3,071,676 |
| 11/30/21 | 1.875% | | 10,229,000 | 10,272,555 |
| 12/31/21 | 2.125% | | 3,550,000 | 3,602,696 |
| 01/31/22 | 1.500% | | 7,550,000 | 7,446,187 |
| 02/15/22 | 2.000% | | 3,000,000 | 3,029,532 |
| 02/28/22 | 1.750% | | 12,241,000 | 12,202,747 |
| 03/31/22 | 1.750% | | 5,679,000 | 5,658,147 |
| 04/30/22 | 1.750% | | 2,710,000 | 2,698,991 |
| 05/31/22 | 1.875% | | 5,857,000 | 5,868,210 |
| 06/30/22 | 2.125% | | 4,189,000 | 4,243,654 |
| U.S. Treasury Obligations (continued) |
| Issuer | Coupon
Rate | | Principal
Amount ($) | Value ($) |
| 07/31/22 | 2.000% | | 2,630,000 | 2,646,540 |
| 08/15/22 | 1.625% | | 3,725,000 | 3,675,819 |
| 08/31/22 | 1.875% | | 2,070,000 | 2,068,868 |
| 09/30/22 | 1.750% | | 8,163,000 | 8,098,267 |
| 10/31/22 | 1.875% | | 1,725,000 | 1,721,091 |
| 11/30/22 | 2.000% | | 2,000,000 | 2,007,266 |
| 12/31/22 | 2.125% | | 1,000,000 | 1,009,609 |
| 01/31/23 | 1.750% | | 3,340,000 | 3,301,904 |
| 02/28/23 | 1.500% | | 10,389,000 | 10,120,351 |
| 03/31/23 | 1.500% | | 7,475,000 | 7,274,109 |
| 05/15/23 | 1.750% | | 10,140,000 | 9,995,424 |
| 08/15/23 | 2.500% | | 8,850,000 | 9,098,216 |
| 08/31/23 | 1.375% | | 11,948,000 | 11,477,547 |
| 10/31/23 | 1.625% | | 5,862,000 | 5,711,786 |
| 11/15/23 | 2.750% | | 3,075,000 | 3,207,129 |
| 02/15/24 | 2.750% | | 3,580,000 | 3,732,569 |
| 03/31/24 | 2.125% | | 2,223,000 | 2,227,515 |
| 05/15/24 | 2.500% | | 3,886,000 | 3,987,704 |
| 08/15/24 | 2.375% | | 8,691,000 | 8,835,627 |
| 11/15/24 | 2.250% | | 10,014,000 | 10,081,284 |
| 02/15/25 | 2.000% | | 8,063,000 | 7,959,374 |
| 05/15/25 | 2.125% | | 6,600,000 | 6,559,522 |
| 08/15/25 | 2.000% | | 9,688,000 | 9,522,248 |
| 11/15/25 | 2.250% | | 4,000,000 | 4,001,720 |
| 02/15/26 | 1.625% | | 13,110,000 | 12,450,403 |
| 02/15/26 | 6.000% | | 3,290,000 | 4,283,810 |
| 08/15/26 | 1.500% | | 14,437,000 | 13,500,847 |
| 11/15/26 | 2.000% | | 6,264,000 | 6,111,804 |
| 11/15/28 | 5.250% | | 550,000 | 709,242 |
| 02/15/29 | 5.250% | | 1,800,000 | 2,329,875 |
| 05/15/30 | 6.250% | | 300,000 | 429,141 |
| 02/15/31 | 5.375% | | 1,250,000 | 1,685,938 |
| 02/15/36 | 4.500% | | 1,655,000 | 2,122,731 |
| 02/15/39 | 3.500% | | 8,239,000 | 9,189,056 |
| 11/15/39 | 4.375% | | 2,197,000 | 2,761,611 |
| 05/15/40 | 4.375% | | 2,173,000 | 2,731,954 |
| 11/15/40 | 4.250% | | 1,250,000 | 1,545,166 |
| 05/15/41 | 4.375% | | 4,591,000 | 5,787,350 |
| 08/15/41 | 3.750% | | 1,900,000 | 2,183,294 |
| 02/15/43 | 3.125% | | 12,253,000 | 12,663,672 |
| 05/15/43 | 2.875% | | 2,250,000 | 2,220,820 |
| 08/15/43 | 3.625% | | 2,570,000 | 2,897,374 |
| 11/15/43 | 3.750% | | 3,000,000 | 3,456,327 |
| 02/15/44 | 3.625% | | 2,500,000 | 2,821,778 |
| 05/15/44 | 3.375% | | 2,950,000 | 3,190,378 |
| 08/15/44 | 3.125% | | 3,062,000 | 3,164,507 |
| 11/15/44 | 3.000% | | 11,434,000 | 11,537,169 |
| 02/15/45 | 2.500% | | 11,981,000 | 10,917,686 |
| 05/15/45 | 3.000% | | 3,400,000 | 3,427,360 |
| 08/15/45 | 2.875% | | 5,095,000 | 5,008,624 |
| 11/15/45 | 3.000% | | 2,500,000 | 2,518,360 |
| 02/15/46 | 2.500% | | 6,250,000 | 5,680,419 |
| 08/15/46 | 2.250% | | 6,423,000 | 5,513,747 |
| 11/15/46 | 2.875% | | 3,575,000 | 3,513,835 |
Total U.S. Treasury Obligations
(Cost $710,815,839) | 708,918,852 |
The accompanying Notes to Financial Statements are an integral part of this statement.
| 8 | Columbia U.S. Treasury Index Fund | Annual Report 2017 |
Portfolio of Investments (continued)
April 30, 2017
| Money Market Funds 0.7% |
| | Shares | Value ($) |
| Columbia Short-Term Cash Fund, 0.869%(a),(b) | 4,962,263 | 4,962,263 |
Total Money Market Funds
(Cost $4,962,174) | 4,962,263 |
Total Investments
(Cost: $715,778,013) | 713,881,115 |
| Other Assets & Liabilities, Net | | 993,340 |
| Net Assets | 714,874,455 |
Notes to Portfolio of Investments
| (a) | The rate shown is the seven-day current annualized yield at April 30, 2017. |
| (b) | As defined in the Investment Company Act of 1940, an affiliated company is one in which the Fund owns 5% or more of the company’s outstanding voting securities, or a company which is under common ownership or control with the Fund. Holdings and transactions in these affiliated companies during the year ended April 30, 2017 are as follows: |
| Issuer | Beginning
shares | Shares
purchased | Shares
sold | Ending
shares | Realized gain
(loss) ($) | Dividends —
affiliated
issuers($) | Value ($) |
| Columbia Short-Term Cash Fund, 0.869% | 1,441,192 | 214,353,172 | (210,832,101) | 4,962,263 | 602 | 20,526 | 4,962,263 |
Fair value measurements
The Fund categorizes its fair value measurements according to a three-level hierarchy that maximizes the use of observable inputs and minimizes the use of unobservable inputs by prioritizing that the most observable input be used when available. Observable inputs are those that market participants would use in pricing an investment based on market data obtained from sources independent of the reporting entity. Unobservable inputs are those that reflect the Fund’s assumptions about the information market participants would use in pricing an investment. An investment’s level within the fair value hierarchy is based on the lowest level of any input that is deemed significant to the asset’s or liability’s fair value measurement. The input levels are not necessarily an indication of the risk or liquidity associated with investments at that level. For example, certain U.S. government securities are generally high quality and liquid, however, they are reflected as Level 2 because the inputs used to determine fair value may not always be quoted prices in an active market.
Fair value inputs are summarized in the three broad levels listed below:
| • | Level 1 – Valuations based on quoted prices for investments in active markets that the Fund has the ability to access at the measurement date (including NAV for open-end mutual funds). Valuation adjustments are not applied to Level 1 investments. |
| • | Level 2 – Valuations based on other significant observable inputs (including quoted prices for similar securities, interest rates, prepayment speeds, credit risks, etc.). |
| • | Level 3 – Valuations based on significant unobservable inputs (including the Fund’s own assumptions and judgment in determining the fair value of investments). |
Inputs that are used in determining fair value of an investment may include price information, credit data, volatility statistics, and other factors. These inputs can be either observable or unobservable. The availability of observable inputs can vary between investments, and is affected by various factors such as the type of investment, and the volume and level of activity for that investment or similar investments in the marketplace. The inputs will be considered by the Investment Manager, along with any other relevant factors in the calculation of an investment’s fair value. The Fund uses prices and inputs that are current as of the measurement date, which may include periods of market dislocations. During these periods, the availability of prices and inputs may be reduced for many investments. This condition could cause an investment to be reclassified between the various levels within the hierarchy.
Certain investments that have been measured at fair value using the net asset value (NAV) per share (or its equivalent) are not categorized in the fair value hierarchy. The fair value amounts presented in the table are intended to reconcile the fair value hierarchy to the amounts presented in the Portfolio of Investments. The Columbia Short-Term Cash Fund seeks to provide shareholders with maximum current income consistent with liquidity and stability of principal. Columbia Short-Term Cash Fund prices its shares with a floating NAV and no longer seeks to maintain a stable NAV.
Investments falling into the Level 3 category are primarily supported by quoted prices from brokers and dealers participating in the market for those investments. However, these may be classified as Level 3 investments due to lack of market transparency and corroboration to support these quoted prices. Additionally, valuation models may be used as the pricing source for any remaining investments classified as Level 3. These models may rely on one or more significant unobservable inputs and/or significant assumptions by the Investment Manager. Inputs used in valuations may include, but are not limited to, financial statement analysis, capital account balances, discount rates and estimated cash flows, and comparable company data.
Under the direction of the Fund’s Board of Trustees (the Board), the Investment Manager’s Valuation Committee (the Committee) is responsible for overseeing the valuation procedures approved by the Board. The Committee consists of voting and non-voting members from various groups within the Investment Manager’s organization, including operations and accounting, trading and investments, compliance, risk management and legal.
The Committee meets at least monthly to review and approve valuation matters, which may include a description of specific valuation determinations, data regarding pricing information received from approved pricing vendors and brokers and the results of Board-approved valuation control policies and procedures (the Policies). The Policies address, among other things, instances when market quotations are or are not readily available, including recommendations of third party pricing vendors and a determination of appropriate pricing methodologies; events that require specific valuation determinations and assessment of fair value techniques; securities with a potential for stale pricing, including those that are illiquid, restricted, or in default; and the effectiveness of third party pricing vendors, including periodic reviews of vendors. The Committee meets more frequently, as needed, to discuss
The accompanying Notes to Financial Statements are an integral part of this statement.
Columbia U.S. Treasury Index Fund | Annual Report 2017
| 9 |
Portfolio of Investments (continued)
April 30, 2017
Fair value measurements (continued)
additional valuation matters, which may include the need to review back-testing results, review time-sensitive information or approve related valuation actions. The Committee reports to the Board, with members of the Committee meeting with the Board at each of its regularly scheduled meetings to discuss valuation matters and actions during the period, similar to those described earlier.
For investments categorized as Level 3, the Committee monitors information similar to that described above, which may include: (i) data specific to the issuer or comparable issuers, (ii) general market or specific sector news and (iii) quoted prices and specific or similar security transactions. The Committee considers this data and any changes from prior periods in order to assess the reasonableness of observable and unobservable inputs, any assumptions or internal models used to value those securities and changes in fair value. This data is also used to corroborate, when available, information received from approved pricing vendors and brokers. Various factors impact the frequency of monitoring this information (which may occur as often as daily). However, the Committee may determine that changes to inputs, assumptions and models are not required as a result of the monitoring procedures performed.
The following table is a summary of the inputs used to value the Fund’s investments at April 30, 2017:
| | Level 1
quoted prices
in active
markets for
identical
assets ($) | Level 2
other
significant
observable
inputs ($) | Level 3
significant
unobservable
inputs ($) | Investments
measured at
net asset
value ($) | Total ($) |
| Investments | | | | | |
| U.S. Treasury Obligations | 708,918,852 | — | — | — | 708,918,852 |
| Money Market Funds | — | — | — | 4,962,263 | 4,962,263 |
| Total Investments | 708,918,852 | — | — | 4,962,263 | 713,881,115 |
See the Portfolio of Investments for all investment classifications not indicated in the table.
There were no transfers of financial assets between levels during the period.
The accompanying Notes to Financial Statements are an integral part of this statement.
| 10 | Columbia U.S. Treasury Index Fund | Annual Report 2017 |
Statement of Assets and Liabilities
April 30, 2017
| Assets | |
| Investments, at cost | |
| Unaffiliated issuers, at cost | $710,815,839 |
| Affiliated issuers, at cost | 4,962,174 |
| Total investments, at cost | 715,778,013 |
| Investments, at value | |
| Unaffiliated issuers, at value | 708,918,852 |
| Affiliated issuers, at value | 4,962,263 |
| Total investments, at value | 713,881,115 |
| Receivable for: | |
| Investments sold | 5,220,305 |
| Capital shares sold | 1,275,703 |
| Dividends | 4,160 |
| Interest | 3,438,811 |
| Expense reimbursement due from Investment Manager | 3,984 |
| Trustees’ deferred compensation plan | 52,209 |
| Other assets | 2,185 |
| Total assets | 723,878,472 |
| Liabilities | |
| Due to custodian | 117,208 |
| Payable for: | |
| Investments purchased | 7,516,372 |
| Capital shares purchased | 445,335 |
| Distributions to shareholders | 864,377 |
| Management services fees | 7,821 |
| Distribution and/or service fees | 369 |
| Other expenses | 326 |
| Trustees’ deferred compensation plan | 52,209 |
| Total liabilities | 9,004,017 |
| Net assets applicable to outstanding capital stock | $714,874,455 |
| Represented by | |
| Paid in capital | 719,550,985 |
| Excess of distributions over net investment income | (242,778) |
| Accumulated net realized loss | (2,536,854) |
| Unrealized appreciation (depreciation) on: | |
| Investments - unaffiliated issuers | (1,896,987) |
| Investments - affiliated issuers | 89 |
| Total - representing net assets applicable to outstanding capital stock | $714,874,455 |
The accompanying Notes to Financial Statements are an integral part of this statement.
Columbia U.S. Treasury Index Fund | Annual Report 2017
| 11 |
Statement of Assets and Liabilities (continued)
April 30, 2017
| Class A | |
| Net assets | $48,312,286 |
| Shares outstanding | 4,368,036 |
| Net asset value per share | $11.06 |
| Class B | |
| Net assets | $11,535 |
| Shares outstanding | 1,043 |
| Net asset value per share | $11.06 |
| Class C | |
| Net assets | $6,937,906 |
| Shares outstanding | 627,273 |
| Net asset value per share | $11.06 |
| Class R5 | |
| Net assets | $24,839,451 |
| Shares outstanding | 2,249,893 |
| Net asset value per share | $11.04 |
| Class T(a) | |
| Net assets | $1,912,828 |
| Shares outstanding | 173,009 |
| Net asset value per share | $11.06 |
| Maximum offering price per share(b) | $11.34 |
| Class Y | |
| Net assets | $252,340,960 |
| Shares outstanding | 22,674,847 |
| Net asset value per share | $11.13 |
| Class Z | |
| Net assets | $380,519,489 |
| Shares outstanding | 34,398,682 |
| Net asset value per share | $11.06 |
| (a) | Effective March 27, 2017, Class W shares were renamed Class T shares. |
| (b) | The maximum offering price per share is calculated by dividing the net asset value per share by 1.0 minus the maximum sales charge of 2.50% for Class T. |
The accompanying Notes to Financial Statements are an integral part of this statement.
| 12 | Columbia U.S. Treasury Index Fund | Annual Report 2017 |
Statement of Operations
Year Ended April 30, 2017
| Net investment income | |
| Income: | |
| Dividends — affiliated issuers | $20,526 |
| Interest | 12,845,111 |
| Total income | 12,865,637 |
| Expenses: | |
| Management services fees | 3,182,138 |
| Distribution and/or service fees | |
| Class A | 120,819 |
| Class B | 4,469 |
| Class C | 94,536 |
| Class T(a) | 358,943 |
| Compensation of board members | 32,377 |
| Other | 5,623 |
| Total expenses | 3,798,905 |
| Fees waived or expenses reimbursed by Investment Manager and its affiliates | (1,625,963) |
| Fees waived by distributor | |
| Class A | (48,380) |
| Class B | (448) |
| Class C | (14,205) |
| Expense reduction | (580) |
| Total net expenses | 2,109,329 |
| Net investment income | 10,756,308 |
| Realized and unrealized gain (loss) — net | |
| Net realized gain (loss) on: | |
| Investments — unaffiliated issuers | (589,165) |
| Investments — affiliated issuers | 602 |
| Net realized loss | (588,563) |
| Net change in unrealized appreciation (depreciation) on: | |
| Investments — unaffiliated issuers | (18,664,287) |
| Investments — affiliated issuers | 89 |
| Net change in unrealized appreciation (depreciation) | (18,664,198) |
| Net realized and unrealized loss | (19,252,761) |
| Net decrease in net assets resulting from operations | $(8,496,453) |
| (a) | Effective March 27, 2017, Class W shares were renamed Class T shares. |
The accompanying Notes to Financial Statements are an integral part of this statement.
Columbia U.S. Treasury Index Fund | Annual Report 2017
| 13 |
Statement of Changes in Net Assets
| | Year Ended
April 30, 2017 (a) | Year Ended
April 30, 2016 |
| Operations | | |
| Net investment income | $10,756,308 | $6,802,905 |
| Net realized gain (loss) | (588,563) | 1,207,986 |
| Net change in unrealized appreciation (depreciation) | (18,664,198) | 7,666,863 |
| Net increase (decrease) in net assets resulting from operations | (8,496,453) | 15,677,754 |
| Distributions to shareholders | | |
| Net investment income | | |
| Class A | (614,613) | (419,707) |
| Class B | (2,183) | (5,083) |
| Class C | (53,021) | (49,117) |
| Class I(b) | (3,359,934) | (1,578,525) |
| Class R5 | (252,968) | (46,260) |
| Class T(c) | (1,639,877) | (1,537,937) |
| Class Y | (389,283) | — |
| Class Z | (4,463,607) | (3,286,714) |
| Net realized gains | | |
| Class A | (142,080) | (162,218) |
| Class B | (1,298) | (3,942) |
| Class C | (30,129) | (38,698) |
| Class I(b) | (728,815) | (469,920) |
| Class R5 | (70,784) | (15,825) |
| Class T(c) | (509,041) | (373,381) |
| Class Z | (886,366) | (1,071,971) |
| Total distributions to shareholders | (13,143,999) | (9,059,298) |
| Increase in net assets from capital stock activity | 4,458,877 | 292,974,152 |
| Total increase (decrease) in net assets | (17,181,575) | 299,592,608 |
| Net assets at beginning of year | 732,056,030 | 432,463,422 |
| Net assets at end of year | $714,874,455 | $732,056,030 |
| Undistributed (excess of distributions over) net investment income | $(242,778) | $176,307 |
| (a) | Class Y shares are based on operations from March 1, 2017 (commencement of operations) through the stated period end. |
| (b) | Effective March 27, 2017, Class I shares were redeemed or exchanged for Class Y shares. |
| (c) | Effective March 27, 2017, Class W shares were renamed Class T shares. |
The accompanying Notes to Financial Statements are an integral part of this statement.
| 14 | Columbia U.S. Treasury Index Fund | Annual Report 2017 |
Statement of Changes in Net Assets (continued)
| | Year Ended | Year Ended |
| | April 30, 2017 (a) | April 30, 2016 |
| | Shares | Dollars ($) | Shares | Dollars ($) |
| Capital stock activity |
| Class A | | | | |
| Subscriptions (b) | 3,863,235 | 43,355,098 | 5,031,370 | 56,443,621 |
| Distributions reinvested | 44,549 | 498,648 | 39,518 | 442,365 |
| Redemptions | (3,234,468) | (36,102,518) | (4,207,867) | (47,017,172) |
| Net increase | 673,316 | 7,751,228 | 863,021 | 9,868,814 |
| Class B | | | | |
| Subscriptions | 49 | 554 | 3,599 | 40,427 |
| Distributions reinvested | 243 | 2,709 | 563 | 6,286 |
| Redemptions (b) | (62,848) | (698,957) | (46,565) | (523,946) |
| Net decrease | (62,556) | (695,694) | (42,403) | (477,233) |
| Class C | | | | |
| Subscriptions | 220,702 | 2,508,461 | 470,430 | 5,288,219 |
| Distributions reinvested | 7,299 | 81,345 | 7,706 | 86,076 |
| Redemptions | (473,184) | (5,240,743) | (237,289) | (2,666,588) |
| Net increase (decrease) | (245,183) | (2,650,937) | 240,847 | 2,707,707 |
| Class I(c) | | | | |
| Subscriptions | 11,378,487 | 128,340,323 | 10,826,689 | 120,565,663 |
| Distributions reinvested | 341,612 | 3,830,880 | 182,619 | 2,048,243 |
| Redemptions | (27,220,089) | (300,370,806) | (1,475,657) | (16,587,694) |
| Net increase (decrease) | (15,499,990) | (168,199,603) | 9,533,651 | 106,026,212 |
| Class R5 | | | | |
| Subscriptions | 2,424,536 | 27,644,692 | 298,452 | 3,340,022 |
| Distributions reinvested | 4,975 | 55,477 | 3,070 | 34,345 |
| Redemptions | (524,698) | (5,828,543) | (187,355) | (2,100,080) |
| Net increase | 1,904,813 | 21,871,626 | 114,167 | 1,274,287 |
| Class T(d) | | | | |
| Subscriptions | 1,205,525 | 13,703,764 | 18,119,536 | 202,280,449 |
| Distributions reinvested | 191,167 | 2,148,760 | 170,398 | 1,911,141 |
| Redemptions | (21,101,986) | (233,576,324) | (5,055,156) | (57,152,634) |
| Net increase (decrease) | (19,705,294) | (217,723,800) | 13,234,778 | 147,038,956 |
| Class Y(c) | | | | |
| Subscriptions | 23,401,826 | 259,058,736 | — | — |
| Distributions reinvested | 35,010 | 389,258 | — | — |
| Redemptions | (761,989) | (8,469,233) | — | — |
| Net increase | 22,674,847 | 250,978,761 | — | — |
| Class Z | | | | |
| Subscriptions | 16,430,198 | 183,419,304 | 11,149,410 | 125,689,191 |
| Distributions reinvested | 391,515 | 4,377,733 | 285,516 | 3,198,038 |
| Redemptions | (6,644,450) | (74,669,741) | (9,151,215) | (102,351,820) |
| Net increase | 10,177,263 | 113,127,296 | 2,283,711 | 26,535,409 |
| Total net increase (decrease) | (82,784) | 4,458,877 | 26,227,772 | 292,974,152 |
| (a) | Class Y shares are based on operations from March 1, 2017 (commencement of operations) through the stated period end. |
| (b) | Includes conversions of Class B shares to Class A shares, if any. |
| (c) | Effective March 27, 2017, Class I shares were redeemed or exchanged for Class Y shares. |
| (d) | Effective March 27, 2017, Class W shares were renamed Class T shares. |
The accompanying Notes to Financial Statements are an integral part of this statement.
Columbia U.S. Treasury Index Fund | Annual Report 2017
| 15 |
The following table is intended to help you understand the Fund’s financial performance. Certain information reflects financial results for a single share of a class held for the periods shown. Per share net investment income (loss) amounts are calculated based on average shares outstanding during the period. Total return assumes reinvestment of all dividends and distributions, if any. Total return does not reflect payment of sales charges, if any. Total return and portfolio turnover are not annualized for periods of less than one year. The portfolio turnover rate is calculated without regard to purchase and sales transactions of short-term instruments and certain derivatives, if any. If such transactions were included, the Fund’s portfolio turnover rate may be higher.
| Year ended | Net asset value,
beginning of
period | Net
investment
income | Net
realized
and
unrealized
gain (loss) | Total from
investment
operations | Distributions
from net
investment
income | Distributions
from net
realized
gains |
| Class A |
| 4/30/2017 | $11.34 | 0.14 | (0.25) | (0.11) | (0.14) | (0.03) |
| 4/30/2016 | $11.28 | 0.14 | 0.12 | 0.26 | (0.14) | (0.06) |
| 4/30/2015 | $11.03 | 0.15 | 0.26 | 0.41 | (0.15) | (0.01) |
| 4/30/2014 | $11.52 | 0.14 | (0.36) | (0.22) | (0.15) | (0.12) |
| 4/30/2013 | $11.74 | 0.13 | 0.11 | 0.24 | (0.13) | (0.33) |
| Class B |
| 4/30/2017 | $11.34 | 0.06 | (0.25) | (0.19) | (0.06) | (0.03) |
| 4/30/2016 | $11.28 | 0.06 | 0.12 | 0.18 | (0.06) | (0.06) |
| 4/30/2015 | $11.02 | 0.06 | 0.27 | 0.33 | (0.06) | (0.01) |
| 4/30/2014 | $11.52 | 0.05 | (0.37) | (0.32) | (0.06) | (0.12) |
| 4/30/2013 | $11.74 | 0.05 | 0.10 | 0.15 | (0.04) | (0.33) |
| Class C |
| 4/30/2017 | $11.34 | 0.06 | (0.24) | (0.18) | (0.07) | (0.03) |
| 4/30/2016 | $11.28 | 0.07 | 0.12 | 0.19 | (0.07) | (0.06) |
| 4/30/2015 | $11.02 | 0.07 | 0.27 | 0.34 | (0.07) | (0.01) |
| 4/30/2014 | $11.52 | 0.07 | (0.37) | (0.30) | (0.08) | (0.12) |
| 4/30/2013 | $11.74 | 0.06 | 0.11 | 0.17 | (0.06) | (0.33) |
| Class R5 |
| 4/30/2017 | $11.32 | 0.16 | (0.25) | (0.09) | (0.16) | (0.03) |
| 4/30/2016 | $11.26 | 0.16 | 0.12 | 0.28 | (0.16) | (0.06) |
| 4/30/2015 | $11.01 | 0.17 | 0.26 | 0.43 | (0.17) | (0.01) |
| 4/30/2014 | $11.51 | 0.17 | (0.38) | (0.21) | (0.17) | (0.12) |
| 4/30/2013 (d) | $11.68 | 0.08 | (0.04) (e) | 0.04 | (0.08) | (0.13) |
The accompanying Notes to Financial Statements are an integral part of this statement.
| 16 | Columbia U.S. Treasury Index Fund | Annual Report 2017 |
Total
distributions to
shareholders | Net
asset
value,
end of
period | Total
return | Total gross
expense
ratio to
average
net assets(a) | Total net
expense
ratio to
average
net assets(a),(b) | Net investment
income
ratio to
average
net assets | Portfolio
turnover | Net
assets,
end of
period
(000’s) |
| |
| (0.17) | $11.06 | (0.94%) | 0.65% | 0.35% (c) | 1.27% | 50% | $48,312 |
| (0.20) | $11.34 | 2.38% | 0.66% | 0.35% (c) | 1.30% | 91% | $41,893 |
| (0.16) | $11.28 | 3.70% | 0.66% | 0.38% (c) | 1.33% | 65% | $31,946 |
| (0.27) | $11.03 | (1.92%) | 0.66% | 0.45% (c) | 1.24% | 76% | $22,163 |
| (0.46) | $11.52 | 2.06% | 0.66% | 0.45% (c) | 1.15% | 99% | $28,129 |
| |
| (0.09) | $11.06 | (1.68%) | 1.40% | 1.10% (c) | 0.49% | 50% | $12 |
| (0.12) | $11.34 | 1.62% | 1.41% | 1.10% (c) | 0.54% | 91% | $721 |
| (0.07) | $11.28 | 3.02% | 1.41% | 1.13% (c) | 0.58% | 65% | $1,196 |
| (0.18) | $11.02 | (2.74%) | 1.41% | 1.20% (c) | 0.49% | 76% | $1,489 |
| (0.37) | $11.52 | 1.30% | 1.40% | 1.20% (c) | 0.40% | 99% | $2,162 |
| |
| (0.10) | $11.06 | (1.63%) | 1.40% | 1.05% (c) | 0.56% | 50% | $6,938 |
| (0.13) | $11.34 | 1.67% | 1.41% | 1.05% (c) | 0.59% | 91% | $9,892 |
| (0.08) | $11.28 | 3.11% | 1.41% | 1.05% (c) | 0.66% | 65% | $7,124 |
| (0.20) | $11.02 | (2.59%) | 1.41% | 1.05% (c) | 0.64% | 76% | $6,417 |
| (0.39) | $11.52 | 1.45% | 1.41% | 1.05% (c) | 0.55% | 99% | $10,111 |
| |
| (0.19) | $11.04 | (0.80%) | 0.41% | 0.20% | 1.45% | 50% | $24,839 |
| (0.22) | $11.32 | 2.54% | 0.41% | 0.20% | 1.45% | 91% | $3,906 |
| (0.18) | $11.26 | 3.89% | 0.41% | 0.20% | 1.50% | 65% | $2,600 |
| (0.29) | $11.01 | (1.76%) | 0.41% | 0.20% | 1.52% | 76% | $1,431 |
| (0.21) | $11.51 | 0.31% | 0.45% (f) | 0.20% (f) | 1.41% (f) | 99% | $2 |
Columbia U.S. Treasury Index Fund | Annual Report 2017
| 17 |
Financial Highlights (continued)
| Year ended | Net asset value,
beginning of
period | Net
investment
income | Net
realized
and
unrealized
gain (loss) | Total from
investment
operations | Distributions
from net
investment
income | Distributions
from net
realized
gains |
| Class T(g) |
| 4/30/2017 | $11.33 | 0.13 | (0.24) | (0.11) | (0.13) | (0.03) |
| 4/30/2016 | $11.27 | 0.13 | 0.12 | 0.25 | (0.13) | (0.06) |
| 4/30/2015 | $11.02 | 0.13 | 0.27 | 0.40 | (0.14) | (0.01) |
| 4/30/2014 | $11.52 | 0.14 | (0.37) | (0.23) | (0.15) | (0.12) |
| 4/30/2013 (h) | $11.90 | 0.11 | (0.05) (e) | 0.06 | (0.11) | (0.33) |
| Class Y |
| 4/30/2017 (i) | $11.02 | 0.03 | 0.11 (e) | 0.14 | (0.03) | — |
| Class Z |
| 4/30/2017 | $11.34 | 0.16 | (0.25) | (0.09) | (0.16) | (0.03) |
| 4/30/2016 | $11.28 | 0.16 | 0.12 | 0.28 | (0.16) | (0.06) |
| 4/30/2015 | $11.02 | 0.17 | 0.27 | 0.44 | (0.17) | (0.01) |
| 4/30/2014 | $11.52 | 0.17 | (0.38) | (0.21) | (0.17) | (0.12) |
| 4/30/2013 | $11.74 | 0.16 | 0.11 | 0.27 | (0.16) | (0.33) |
| Notes to Financial Highlights |
| (a) | In addition to the fees and expenses that the Fund bears directly, the Fund indirectly bears a pro rata share of the fees and expenses of any other funds in which it invests. Such indirect expenses are not included in the Fund’s reported expense ratios. |
| (b) | Total net expenses include the impact of certain fee waivers/expense reimbursements made by the Investment Manager and certain of its affiliates, if applicable. |
| (c) | The benefits derived from expense reductions had an impact of less than 0.01%. |
| (d) | Class R5 shares commenced operations on November 8, 2012. Per share data and total return reflect activity from that date. |
| (e) | Calculation of the net gain (loss) per share (both realized and unrealized) does not correlate to the aggregate realized and unrealized gain (loss) presented in the Statement of Operations due to the timing of subscriptions and redemptions of Fund shares in relation to fluctuations in the market value of the portfolio. |
| (f) | Annualized. |
| (g) | Effective March 27, 2017, Class W shares were renamed Class T shares. |
| (h) | Class T shares commenced operations on June 18, 2012. Per share data and total return reflect activity from that date. |
| (i) | Class Y shares commenced operations on March 1, 2017. Per share data and total return reflect activity from that date. |
The accompanying Notes to Financial Statements are an integral part of this statement.
| 18 | Columbia U.S. Treasury Index Fund | Annual Report 2017 |
Total
distributions to
shareholders | Net
asset
value,
end of
period | Total
return | Total gross
expense
ratio to
average
net assets(a) | Total net
expense
ratio to
average
net assets(a),(b) | Net investment
income
ratio to
average
net assets | Portfolio
turnover | Net
assets,
end of
period
(000’s) |
| |
| (0.16) | $11.06 | (0.95%) | 0.65% | 0.45% (c) | 1.15% | 50% | $1,913 |
| (0.19) | $11.33 | 2.28% | 0.65% | 0.45% (c) | 1.17% | 91% | $225,255 |
| (0.15) | $11.27 | 3.63% | 0.65% | 0.45% (c) | 1.20% | 65% | $74,873 |
| (0.27) | $11.02 | (2.00%) | 0.66% | 0.45% (c) | 1.24% | 76% | $12,167 |
| (0.44) | $11.52 | 0.52% | 0.65% (f) | 0.45% (f) | 1.10% (f) | 99% | $29,171 |
| |
| (0.03) | $11.13 | 1.24% | 0.40% (f) | 0.20% (f) | 1.52% (f) | 50% | $252,341 |
| |
| (0.19) | $11.06 | (0.79%) | 0.40% | 0.20% (c) | 1.42% | 50% | $380,519 |
| (0.22) | $11.34 | 2.54% | 0.41% | 0.20% (c) | 1.44% | 91% | $274,641 |
| (0.18) | $11.28 | 3.98% | 0.41% | 0.20% (c) | 1.51% | 65% | $247,434 |
| (0.29) | $11.02 | (1.76%) | 0.41% | 0.20% (c) | 1.49% | 76% | $194,297 |
| (0.49) | $11.52 | 2.31% | 0.41% | 0.20% (c) | 1.40% | 99% | $227,687 |
Columbia U.S. Treasury Index Fund | Annual Report 2017
| 19 |
Notes to Financial Statements
April 30, 2017
Note 1. Organization
Columbia U.S. Treasury Index Fund (the Fund), a series of Columbia Funds Series Trust I (the Trust), is a diversified fund. The Trust is registered under the Investment Company Act of 1940, as amended (the 1940 Act), as an open-end management investment company organized as a Massachusetts business trust.
Fund shares
The Trust may issue an unlimited number of shares (without par value). Although all share classes generally have identical voting, dividend and liquidation rights, each share class votes separately when required by the Trust’s organizational documents or by law. Different share classes pay different distribution amounts to the extent the expenses of such share classes differ, and distributions in liquidation will be proportional to the net asset value of each share class. Each share class has its own expense and sales charge structure. The Fund offers each of the share classes identified below.
Class A shares are not subject to any front-end sales charge or contingent deferred sales charge (CDSC).
The Fund no longer accepts investments by new or existing investors in the Fund’s Class B shares, except in connection with the reinvestment of any dividend and/or capital gain distributions in Class B shares of the Fund and exchanges by existing Class B shareholders of certain other funds within the Columbia Family of Funds. Class B shares are typically subject to a maximum CDSC of 5.00% based upon the holding period after purchase. However, the Fund’s current Class B investors, having held their shares for the requisite time period, are no longer subject to a CDSC upon redemption of their shares. Effective on or about July 17, 2017, Class B shares will automatically convert to Class A shares and the Fund will no longer accept investments by new or existing investors in Class B shares.
Class C shares are subject to a 1.00% CDSC on shares redeemed within 12 months after purchase.
Effective March 27, 2017, Class I shares of the Fund are no longer offered for sale. Class I shares, when available, were not subject to sales charges or distribution and service (12b-1) fees, and were made available only to the Columbia Family of Funds. On March 27, 2017, Class I shares were redeemed or exchanged for Class Y shares of the Fund in a tax free transaction that had no impact on the fees and expenses paid by shareholders.
Class R5 shares are not subject to sales charges and are generally available only to investors purchasing through authorized investment professionals and omnibus retirement plans.
Class T shares are subject to a maximum front-end sales charge of 2.50% per transaction and must be purchased through financial intermediaries that, by written agreement with Columbia Management Investment Distributors, Inc., are specifically authorized to sell Class T shares. Prior to March 27, 2017, Class T shares were known as Class W shares, were not subject to sales charges, and were generally available only to investors purchasing through authorized investment programs managed by investment professionals, including discretionary managed accounts.
Class Y shares are not subject to sales charges or distribution and service (12b-1) fees, and are available to institutional and certain other investors as described in the Fund’s prospectus. Class Y shares commenced operations on March 1, 2017. On March 27, 2017, Class I shares were redeemed or exchanged for Class Y shares of the Fund in a tax free transaction that had no impact on the fees and expenses paid by shareholders. Class I shares of the Fund are no longer offered for sale.
Class Z shares are not subject to sales charges and are generally available only to eligible investors, which are subject to different investment minimums as described in the Fund’s prospectus.
Note 2. Summary of significant accounting policies
Basis of preparation
The Fund is an investment company that applies the accounting and reporting guidance in the Financial Accounting Standards Board (FASB) Accounting Standards Codification Topic 946, Financial Services - Investment Companies (ASC 946). The financial statements are prepared in accordance with U.S. generally accepted accounting principles (GAAP), which
| 20 | Columbia U.S. Treasury Index Fund | Annual Report 2017 |
Notes to Financial Statements (continued)
April 30, 2017
requires management to make certain estimates and assumptions that affect the reported amounts of assets and liabilities, the disclosure of contingent assets and liabilities at the date of the financial statements and the reported amounts of income and expenses during the reporting period. Actual results could differ from those estimates.
The following is a summary of significant accounting policies followed by the Fund in the preparation of its financial statements.
Security valuation
Debt securities generally are valued by pricing services approved by the Board of Trustees based upon market transactions for normal, institutional-size trading units of similar securities. The services may use various pricing techniques that take into account, as applicable, factors such as yield, quality, coupon rate, maturity, type of issue, trading characteristics and other data, as well as approved independent broker-dealer quotes. Debt securities for which quotations are not readily available or not believed to be reflective of market value may also be valued based upon a bid quote from an approved independent broker-dealer. Debt securities maturing in 60 days or less are valued primarily at amortized cost value, unless this method results in a valuation that management believes does not approximate market value.
Investments in open-end investment companies, including money market funds, are valued at their latest net asset value.
Investments for which market quotations are not readily available, or that have quotations which management believes are not reflective of market value or reliable, are valued at fair value as determined in good faith under procedures approved by and under the general supervision of the Board of Trustees. If a security or class of securities (such as foreign securities) is valued at fair value, such value is likely to be different from the quoted or published price for the security.
The determination of fair value often requires significant judgment. To determine fair value, management may use assumptions including but not limited to future cash flows and estimated risk premiums. Multiple inputs from various sources may be used to determine fair value.
GAAP requires disclosure regarding the inputs and valuation techniques used to measure fair value and any changes in valuation inputs or techniques. In addition, investments shall be disclosed by major category. This information is disclosed following the Fund’s Portfolio of Investments.
Security transactions
Security transactions are accounted for on the trade date. Cost is determined and gains (losses) are based upon the specific identification method for both financial statement and federal income tax purposes.
Income recognition
Interest income is recorded on an accrual basis. Market premiums and discounts, including original issue discounts, are amortized and accreted, respectively, over the expected life of the security on all debt securities, unless otherwise noted.
The Fund may place a debt security on non-accrual status and reduce related interest income when it becomes probable that the interest will not be collected and the amount of uncollectible interest can be reasonably estimated. A defaulted debt security is removed from non-accrual status when the issuer resumes interest payments or when collectibility of interest is reasonably assured.
Dividend income is recorded on the ex-dividend date.
Expenses
General expenses of the Trust are allocated to the Fund and other funds of the Trust based upon relative net assets or other expense allocation methodologies determined by the nature of the expense. Expenses directly attributable to the Fund are charged to the Fund. Expenses directly attributable to a specific class of shares are charged to that share class.
Columbia U.S. Treasury Index Fund | Annual Report 2017
| 21 |
Notes to Financial Statements (continued)
April 30, 2017
Determination of class net asset value
All income, expenses (other than class-specific expenses, which are charged to that share class, as shown in the Statement of Operations) and realized and unrealized gains (losses) are allocated to each class of the Fund on a daily basis, based on the relative net assets of each class, for purposes of determining the net asset value of each class.
Federal income tax status
The Fund intends to qualify each year as a regulated investment company under Subchapter M of the Internal Revenue Code, as amended, and will distribute substantially all of its taxable income (including net short-term capital gains), if any, for its tax year, and as such will not be subject to federal income taxes. In addition, the Fund intends to distribute in each calendar year substantially all of its net investment income, capital gains and certain other amounts, if any, such that the Fund should not be subject to federal excise tax. Therefore, no federal income or excise tax provision is recorded.
Distributions to shareholders
Distributions from net investment income, if any, are declared daily and paid monthly. Net realized capital gains, if any, are distributed at least annually. Income distributions and capital gain distributions are determined in accordance with federal income tax regulations, which may differ from GAAP.
Guarantees and indemnifications
Under the Trust’s organizational documents and, in some cases, by contract, its officers and trustees are indemnified against certain liabilities arising out of the performance of their duties to the Trust or its funds. In addition, certain of the Fund’s contracts with its service providers contain general indemnification clauses. The Fund’s maximum exposure under these arrangements is unknown since the amount of any future claims that may be made against the Fund cannot be determined, and the Fund has no historical basis for predicting the likelihood of any such claims.
Investment company reporting modernization
In October 2016, the U.S. Securities and Exchange Commission adopted new rules and forms, and amendments to certain current rules and forms, to modernize reporting and disclosure of information by registered investment companies. The amendments to Regulation S-X will require standardized, enhanced disclosure about derivatives in investment company financial statements, and will also change the rules governing the form and content of such financial statements. The amendments to Regulation S-X take effect on August 1, 2017. At this time, management is assessing the anticipated impact of these regulatory developments.
Note 3. Fees and other transactions with affiliates
Management services fees
The Fund entered into a Management Agreement with Columbia Management Investment Advisers, LLC (the Investment Manager), a wholly-owned subsidiary of Ameriprise Financial, Inc. (Ameriprise Financial). Under the Management Agreement, the Investment Manager provides the Fund with investment research and advice, as well as administrative and accounting services. The management services fee is an annual fee that is equal to 0.40% of the Fund’s average daily net assets.
The Investment Manager, from the management services fee it receives from the Fund, pays all operating expenses of the Fund, with the exception of brokerage fees and commissions, taxes, interest, fees and expenses of Trustees who are not officers, directors or employees of the Investment Manager or its affiliates, distribution and/or shareholder servicing and plan administration fees and any extraordinary non-recurring expenses that may arise, including litigation fees.
Compensation of board members
Members of the Board of Trustees, who are not officers or employees of the Investment Manager or Ameriprise Financial, are compensated for their services to the Fund as disclosed in the Statement of Operations. These members of the Board of Trustees may participate in a Deferred Compensation Plan (the Plan) which may be terminated at any time. Obligations of the Plan will be paid solely out of the Fund’s assets, and all amounts payable under the Plan constitute a general unsecured obligation of the Fund.
| 22 | Columbia U.S. Treasury Index Fund | Annual Report 2017 |
Notes to Financial Statements (continued)
April 30, 2017
Compensation of Chief Compliance Officer
The Board of Trustees has appointed a Chief Compliance Officer to the Fund in accordance with federal securities regulations. A portion of the Chief Compliance Officer’s total compensation is allocated to the Fund, along with other affiliated funds governed by the Board of Trustees, based on relative net assets. The total amount allocated to all affiliated funds governed by the Board of Trustees will not exceed $40,000 annually. The expenses of the Chief Compliance Officer allocated to the Fund are payable by the Investment Manager.
Transfer agency fees
Under a Transfer and Dividend Disbursing Agent Agreement, Columbia Management Investment Services Corp. (the Transfer Agent), an affiliate of the Investment Manager and a wholly-owned subsidiary of Ameriprise Financial, is responsible for providing transfer agency services to the Fund. The Transfer Agent has contracted with Boston Financial Data Services (BFDS) to serve as sub-transfer agent.
The transfer agency fees are payable by the Investment Manager. The Transfer Agent pays the fees of BFDS for services as sub-transfer agent and BFDS is not entitled to reimbursement for such fees from the Fund. The Transfer Agent also receives compensation from the Investment Manager for various shareholder services and reimbursements for certain out-of-pocket expenses.
An annual minimum account balance fee of $20 may apply to certain accounts with a value below the applicable share class’s initial minimum investment requirements to reduce the impact of small accounts on transfer agency fees. These minimum account balance fees are remitted to the Fund and recorded as part of expense reductions in the Statement of Operations. For the year ended April 30, 2017, these minimum account balance fees reduced total expenses of the Fund by $580.
Distribution and service fees
The Fund has an agreement with Columbia Management Investment Distributors, Inc. (the Distributor), an affiliate of the Investment Manager and a wholly-owned subsidiary of Ameriprise Financial, for distribution and shareholder services. The Board of Trustees has approved, and the Fund has adopted, distribution and shareholder service plans (the Plans) applicable to certain share classes, which set the distribution and service fees for the Fund. These fees are calculated daily and are intended to compensate the Distributor and/or eligible selling and/or servicing agents for selling shares of the Fund and providing services to investors.
Under the Plans, the Fund pays a monthly service fee to the Distributor at the maximum annual rate of 0.25% of the average daily net assets attributable to Class A, Class B, Class C and Class T shares of the Fund. Also under the Plans, the Fund pays a monthly distribution fee to the Distributor at the maximum annual rates of 0.75%, 0.75% and 0.25% of the average daily net assets attributable to Class B, Class C and Class T shares of the Fund, respectively.
Although the Fund may pay a distribution fee up to 0.25% of the Fund’s average daily net assets attributable to Class T shares and a service fee of up to 0.25% of the Fund’s average daily net assets attributable to Class T shares, the aggregate fee shall not exceed 0.25% of the Fund’s average daily net assets attributable to Class T shares.
The Distributor has voluntarily agreed to waive a portion of the service fee for Class A, Class B and Class C shares so that the service fee does not exceed 0.15% annually of the average daily net assets attributable to each such share class. This arrangement may be modified or terminated by the Distributor at any time.
The Distributor has voluntarily agreed to waive a portion of the distribution fee for Class C shares so that the distribution fee does not exceed 0.70% annually of the average daily net assets attributable to Class C shares. This arrangement may be modified or terminated by the Distributor at any time.
Columbia U.S. Treasury Index Fund | Annual Report 2017
| 23 |
Notes to Financial Statements (continued)
April 30, 2017
Sales charges (unaudited)
Sales charges, including front-end charges and CDSCs, received by the Distributor for distributing Fund shares for the year ended April 30, 2017, if any, are listed below:
| | Amount ($) |
| Class A | 13,325 |
| Class C | 1,135 |
Expenses waived/reimbursed by the Investment Manager and its affiliates
The Investment Manager and certain of its affiliates have contractually agreed to waive fees and/or reimburse expenses (excluding certain fees and expenses described below) for the period disclosed below, unless sooner terminated at the sole discretion of the Board of Trustees, so that the Fund’s net operating expenses, after giving effect to fees waived/expenses reimbursed and any balance credits and/or overdraft charges from the Fund’s custodian, do not exceed the following annual rates as a percentage of the class’ average daily net assets:
| | Fee rates contractual
through
August 31, 2017 |
| Class A | 0.450% |
| Class B | 1.200 |
| Class C | 1.200 |
| Class R5 | 0.200 |
| Class T | 0.450 |
| Class Y | 0.200* |
| Class Z | 0.200 |
| *Expense cap rate is contractual from March 1, 2017 (the commencement of operations of Class Y shares) through August 31, 2017. | |
Under the agreement governing these fee waivers and/or expense reimbursement arrangements, the following fees and expenses are excluded from the waiver/reimbursement commitment, and therefore will be paid by the Fund, if applicable: taxes (including foreign transaction taxes), expenses associated with investments in affiliated and non-affiliated pooled investment vehicles (including mutual funds and exchange-traded funds), transaction costs and brokerage commissions, costs related to any securities lending program, dividend and interest expenses associated with securities sold short, inverse floater program fees and expenses, transaction charges and interest on borrowed money, interest, infrequent and/or unusual expenses and any other expenses the exclusion of which is specifically approved by the Board of Trustees. This agreement may be modified or amended only with approval from the Investment Manager, certain of its affiliates and the Fund. Any fees waived and/or expenses reimbursed under the expense reimbursement arrangements described above are not recoverable by the Investment Manager or its affiliates in future periods. Class A, Class B and Class C distribution and service fees waived by the Distributor, as discussed above, are in addition to the waiver/reimbursement commitment under the agreement.
Note 4. Federal tax information
The timing and character of income and capital gain distributions are determined in accordance with income tax regulations, which may differ from GAAP because of temporary or permanent book to tax differences.
At April 30, 2017, these differences are primarily due to differing treatment for deferral/reversal of wash sale losses, post-October capital losses, trustees’ deferred compensation, distributions, principal and/or interest from fixed income securities and distribution reclassifications. To the extent these differences are permanent, reclassifications are made among the components of the Fund’s net assets in the Statement of Assets and Liabilities. Temporary differences do not require reclassifications.
In the Statement of Assets and Liabilities the following reclassifications were made:
| 24 | Columbia U.S. Treasury Index Fund | Annual Report 2017 |
Notes to Financial Statements (continued)
April 30, 2017
Excess of distributions
over net investment
income ($) | Accumulated
net realized
(loss) ($) | Paid in
capital ($) |
| (399,907) | 399,908 | (1) |
Net investment income (loss) and net realized gains (losses), as disclosed in the Statement of Operations, and net assets were not affected by this reclassification.
The tax character of distributions paid during the years indicated was as follows:
| April 30, 2017 | April 30, 2016 |
Ordinary
income ($) | Long-term
capital gains ($) | Total ($) | Ordinary
income (S) | Long-term
capital gains ($) | Total ($) |
| 11,973,448 | 1,170,551 | 13,143,999 | 6,923,343 | 2,135,955 | 9,059,298 |
Short-term capital gain distributions, if any, are considered ordinary income distributions for tax purposes.
At April 30, 2017, the components of distributable earnings on a tax basis were as follows:
Undistributed
ordinary income ($) | Undistributed
long-term
capital gains ($) | Capital loss
carryforwards ($) | Net unrealized
(depreciation) ($) |
| 579,333 | — | — | (2,972,794) |
At April 30, 2017, the cost of investments for federal income tax purposes along with the aggregate gross unrealized appreciation and depreciation based on that cost was:
Federal
tax cost ($) | Gross unrealized
appreciation ($) | Gross unrealized
(depreciation) ($) | Net unrealized
(depreciation) ($) |
| 716,853,909 | 3,838,149 | (6,810,943) | (2,972,794) |
Under current tax rules, regulated investment companies can elect to treat certain late-year ordinary losses incurred and post-October capital losses (capital losses realized after October 31) as arising on the first day of the following taxable year. As of April 30, 2017, the Fund elected to treat the following late-year ordinary losses and post-October capital losses as arising on May 1, 2017.
Late year
ordinary losses ($) | Post-October
capital losses ($) |
| — | 1,460,958 |
Management of the Fund has concluded that there are no significant uncertain tax positions in the Fund that would require recognition in the financial statements. However, management’s conclusion may be subject to review and adjustment at a later date based on factors including, but not limited to, new tax laws, regulations, and administrative interpretations (including relevant court decisions). Generally, the Fund’s federal tax returns for the prior three fiscal years remain subject to examination by the Internal Revenue Service.
Note 5. Portfolio information
The cost of purchases and proceeds from sales of securities, excluding short-term investments and derivatives, if any, aggregated to $393,903,289 and $389,975,963, respectively, for the year ended April 30, 2017, of which $393,903,289 and $389,975,963, respectively, were U.S. government securities. The amount of purchase and sale activity impacts the portfolio turnover rate reported in the Financial Highlights.
Note 6. Affiliated money market fund
The Fund invests in Columbia Short-Term Cash Fund, an affiliated money market fund established for the exclusive use by the Fund and other affiliated funds (the Affiliated MMF). The income earned by the Fund from such investments is included as Dividends - affiliated issuers in the Statement of Operations. As an investing fund, the Fund indirectly bears its proportionate
Columbia U.S. Treasury Index Fund | Annual Report 2017
| 25 |
Notes to Financial Statements (continued)
April 30, 2017
share of the expenses of the Affiliated MMF. Effective October 1, 2016, the Affiliated MMF prices its shares with a floating net asset value (NAV) and no longer seeks to maintain a stable NAV. In addition, the Board of Trustees of the Affiliated MMF may impose a fee on redemptions (sometimes referred to as a liquidity fee) or temporarily suspend redemptions (sometimes referred to as imposing a redemption gate) in the event its liquidity falls below regulatory limits.
Note 7. Line of credit
The Fund has access to a revolving credit facility with a syndicate of banks led by Citibank, N.A., HSBC Bank USA, N.A. and JPMorgan Chase Bank, N.A. whereby the Fund may borrow for the temporary funding of shareholder redemptions or for other temporary or emergency purposes. The credit facility agreement, which is a collective agreement between the Fund and certain other funds managed by the Investment Manager, severally and not jointly, permits collective borrowings up to $1 billion. Interest is charged to each participating fund based on its borrowings at a rate equal to the higher of (i) the overnight federal funds rate plus 1.00% or (ii) the one-month LIBOR rate plus 1.00%. Each borrowing under the credit facility matures no later than 60 days after the date of borrowing. The Fund also pays a commitment fee equal to its pro rata share of the amount of the credit facility at a rate of 0.15% per annum. The commitment fee is included in other expenses in the Statement of Operations.
The Fund had no borrowings during the year ended April 30, 2017.
Note 8. Significant risks
Credit risk
Credit risk is the risk that the value of debt securities in the Fund’s portfolio may decline because the issuer may default and fail to pay interest or repay principal when due. Rating agencies assign credit ratings to debt securities to indicate their credit risk. Lower rated or unrated debt securities held by the Fund may present increased credit risk as compared to higher-rated debt securities.
Interest rate risk
Interest rate risk is the risk of losses attributable to changes in interest rates. In general, if prevailing interest rates rise, the values of debt securities tend to fall, and if interest rates fall, the values of debt securities tend to rise. Actions by governments and central banking authorities can result in increases in interest rates. Increasing interest rates may negatively affect the value of debt securities held by the Fund, resulting in a negative impact on the Fund’s performance and net asset value per share. In general, the longer the maturity or duration of a debt security, the greater its sensitivity to changes in interest rates.
Shareholder concentration risk
At April 30, 2017, one unaffiliated shareholder of record owned 11.6% of the outstanding shares of the Fund in one or more accounts. The Fund has no knowledge about whether any portion of those shares was owned beneficially. Affiliated shareholders of record owned 71.9% of the outstanding shares of the Fund in one or more accounts. Subscription and redemption activity by concentrated accounts may have a significant effect on the operations of the Fund. In the case of a large redemption, the Fund may be forced to sell investments at inopportune times, including its liquid or more liquid positions, resulting in Fund losses and the Fund holding a higher percentage of less liquid or illiquid securities. Large redemptions could result in decreased economies of scale and increased operating expenses for non-redeeming Fund shareholders.
Note 9. Subsequent events
Management has evaluated the events and transactions that have occurred through the date the financial statements were issued. Other than as noted in Note 1 above, there were no items requiring adjustment of the financial statements or additional disclosure.
| 26 | Columbia U.S. Treasury Index Fund | Annual Report 2017 |
Notes to Financial Statements (continued)
April 30, 2017
Note 10. Information regarding pending and settled legal proceedings
Ameriprise Financial and certain of its affiliates have historically been involved in a number of legal, arbitration and regulatory proceedings, including routine litigation, class actions, and governmental actions, concerning matters arising in connection with the conduct of their business activities. Ameriprise Financial believes that the Funds are not currently the subject of, and that neither Ameriprise Financial nor any of its affiliates are the subject of, any pending legal, arbitration or regulatory proceedings that are likely to have a material adverse effect on the Funds or the ability of Ameriprise Financial or its affiliates to perform under their contracts with the Funds. Ameriprise Financial is required to make quarterly (10-Q), annual (10-K) and, as necessary, 8-K filings with the Securities and Exchange Commission (SEC) on legal and regulatory matters that relate to Ameriprise Financial and its affiliates. Copies of these filings may be obtained by accessing the SEC website at www.sec.gov.
There can be no assurance that these matters, or the adverse publicity associated with them, will not result in increased fund redemptions, reduced sale of fund shares or other adverse consequences to the Funds. Further, although we believe proceedings are not likely to have a material adverse effect on the Funds or the ability of Ameriprise Financial or its affiliates to perform under their contracts with the Funds, these proceedings are subject to uncertainties and, as such, we are unable to estimate the possible loss or range of loss that may result. An adverse outcome in one or more of these proceedings could result in adverse judgments, settlements, fines, penalties or other relief that could have a material adverse effect on the consolidated financial condition or results of operations of Ameriprise Financial.
Columbia U.S. Treasury Index Fund | Annual Report 2017
| 27 |
Report of Independent Registered Public Accounting Firm
To the Trustees of Columbia Funds Series Trust I and the Shareholders of Columbia U.S. Treasury Index Fund
In our opinion, the accompanying statement of assets and liabilities, including the portfolio of investments, and the related statements of operations and of changes in net assets and the financial highlights present fairly, in all material respects, the financial position of Columbia U.S. Treasury Index Fund (the “Fund”, a series of Columbia Funds Series Trust I) as of April 30, 2017, the results of its operations for the year then ended, the changes in its net assets for each of the two years in the period then ended and the financial highlights for each of the five years in the period then ended, in conformity with accounting principles generally accepted in the United States of America. These financial statements and financial highlights (hereafter referred to as “financial statements”) are the responsibility of the Fund’s management. Our responsibility is to express an opinion on these financial statements based on our audits. We conducted our audits of these financial statements in accordance with the standards of the Public Company Accounting Oversight Board (United States). Those standards require that we plan and perform the audit to obtain reasonable assurance about whether the financial statements are free of material misstatement. An audit includes examining, on a test basis, evidence supporting the amounts and disclosures in the financial statements, assessing the accounting principles used and significant estimates made by management, and evaluating the overall financial statement presentation. We believe that our audits, which included confirmation of securities as of April 30, 2017 by correspondence with the custodian, brokers and transfer agent, provide a reasonable basis for our opinion.
PricewaterhouseCoopers LLP
Minneapolis, MN
June 21, 2017
| 28 | Columbia U.S. Treasury Index Fund | Annual Report 2017 |
Federal Income Tax Information
(Unaudited)
The Fund hereby designates the following tax attributes for the fiscal year ended April 30, 2017. Shareholders will be notified in early 2018 of the amounts for use in preparing 2017 income tax returns.
Capital
gain
dividend | |
| $405,945 | |
Capital gain dividend. The Fund designates as a capital gain dividend the amount reflected above, or if subsequently determined to be different, the net capital gain of such fiscal period.
Columbia U.S. Treasury Index Fund | Annual Report 2017
| 29 |
Shareholders elect the Board that oversees the Fund’s operations. The Board appoints officers who are responsible for day-to-day business decisions based on policies set by the Board. The following table provides basic biographical information about the Fund’s Trustees, including their principal occupations during the past five years, although specific titles for individuals may have varied over the period. The year set forth beneath Length of Service in the table below is the year in which the Trustee was first appointed or elected as Trustee to any Fund currently in the Columbia Funds Complex or a predecessor thereof. Under current Board policy, members serve terms of indefinite duration.
Independent trustees
| Name, address, year of birth | Position held with the Trust and length of service | Principal occupation(s) during the past five years and other relevant professional experience | Number of Funds in the Columbia Fund Complex overseen | Other directorships held by Trustee during the past five years |
Janet Langford Carrig
c/o Columbia Management
Investment Advisers, LLC
225 Franklin Street
Mail Drop BX32 05228
Boston, MA 02110
1957 | Trustee
1996 | Senior Vice President, General Counsel and Corporate Secretary, ConocoPhillips (independent energy company) since September 2007 | 57 | None |
Douglas A. Hacker
c/o Columbia Management
Investment Advisers, LLC
225 Franklin Street
Mail Drop BX32 05228
Boston, MA 02110
1955 | Trustee and Chairman of the Board
1996 | Independent business executive since May 2006; Executive Vice President — Strategy of United Airlines from December 2002 to May 2006; President of UAL Loyalty Services (airline marketing company) from September 2001 to December 2002; Executive Vice President and Chief Financial Officer of United Airlines from July 1999 to September 2001 | 57 | Spartan Nash Company, (food distributor); Nash Finch Company (food distributor) from 2005 to 2013; Aircastle Limited (aircraft leasing); SeaCube Container Leasing Ltd. (container leasing) from 2010 to 2013; and Travelport Worldwide Limited (travel information technology) |
Nancy T. Lukitsh
c/o Columbia Management
Investment Advisers, LLC
225 Franklin Street
Mail Drop BX32 05228
Boston, MA 02110
1956 | Trustee
2011 | Senior Vice President, Partner and Director of Marketing, Wellington Management Company, LLP (investment adviser) from 1997 to 2010; Chair, Wellington Management Portfolios (commingled non-U.S. investment pools) from 2007 to 2010; Director, Wellington Trust Company, NA and other Wellington affiliates from 1997 to 2010 | 57 | None |
David M. Moffett
c/o Columbia Management
Investment Advisers, LLC
225 Franklin Street
Mail Drop BX32 05228
Boston, MA 02110
1952 | Trustee
2011 | Retired. Consultant to Bridgewater and Associates | 57 | Director, CSX Corporation; Genworth Financial, Inc. (financial and insurance products and services); Paypal Holdings Inc. (payment and data processing services); Trustee, University of Oklahoma Foundation; former Director, eBay Inc. (online trading community), 2007-2015; and former Director, CIT Bank, CIT Group Inc. (commercial and consumer finance), 2010-2016 |
| 30 | Columbia U.S. Treasury Index Fund | Annual Report 2017 |
TRUSTEES AND OFFICERS (continued)
Independent trustees (continued)
| Name, address, year of birth | Position held with the Trust and length of service | Principal occupation(s) during the past five years and other relevant professional experience | Number of Funds in the Columbia Fund Complex overseen | Other directorships held by Trustee during the past five years |
Charles R. Nelson
c/o Columbia Management
Investment Advisers, LLC
225 Franklin Street
Mail Drop BX32 05228
Boston, MA 02110
1942 | Trustee
1981 | Retired. Professor Emeritus, University of Washington since 2011; Professor of Economics, University of Washington from 1976 to 2011; Ford and Louisa Van Voorhis Professor of Political Economy, University of Washington from 1993 to 2011; Adjunct Professor of Statistics, University of Washington from 1980 to 2011; Associate Editor, Journal of Money, Credit and Banking from September 1993 to 2008; consultant on econometric and statistical matters | 57 | None |
John J. Neuhauser
c/o Columbia Management
Investment Advisers, LLC
225 Franklin Street
Mail Drop BX32 05228
Boston, MA 02110
1943 | Trustee
1984 | President, Saint Michael’s College since August 2007; Director or Trustee of several non-profit organizations, including University of Vermont Medical Center; Academic Vice President and Dean of Faculties, Boston College from August 1999 to October 2005; University Professor, Boston College from November 2005 to August 2007 | 57 | Liberty All-Star Equity Fund and Liberty All- Star Growth Fund (closed-end funds) |
Patrick J. Simpson
c/o Columbia Management
Investment Advisers, LLC
225 Franklin Street
Mail Drop BX32 05228
Boston, MA 02110
1944 | Trustee
2000 | Of Counsel, Perkins Coie LLP (law firm) since 2015; Partner, Perkins Coie LLP from 1988 to 2014 | 57 | None |
Anne-Lee Verville
c/o Columbia Management
Investment Advisers, LLC
225 Franklin Street
Mail Drop BX32 05228
Boston, MA 02110
1945 | Trustee
1998 | Retired. General Manager, Global Education Industry from 1994 to 1997, President – Application Systems Division from 1991 to 1994, Chief Financial Officer – US Marketing & Services from 1988 to 1991, and Chief Information Officer from 1987 to 1988, IBM Corporation (computer and technology) | 57 | Enesco Group, Inc. (producer of giftware and home and garden decor products) from 2001 to 2006 |
Columbia U.S. Treasury Index Fund | Annual Report 2017
| 31 |
TRUSTEES AND OFFICERS (continued)
Consultants to the Independent Trustees*
| Name, address, year of birth | Position held with the Trust and length of service | Principal occupation(s) during the past five years and other relevant professional experience | Number of Funds in the Columbia Funds complex overseen | Other directorships held by Trustee during the past five years |
J. Kevin Connaughton
c/o Columbia
Management Investment
Advisers, LLC,
225 Franklin Street
Mail Drop BX32 05228,
Boston, MA 02110
1964 | Independent Trustee Consultant
2016 | Independent Trustee Consultant, Columbia Funds since March 2016; Managing Director and General Manager of Mutual Fund Products, Columbia Management Investment Advisers, LLC from May 2010 to February 2015; President, Columbia Funds from 2009 to 2015; and senior officer of Columbia Funds and affiliated funds from 2003 to 2015 | 57 | Board of Governors, Gateway Healthcare since January 2016; Trustee, New Century Portfolios since March 2015; and Director, The Autism Project since March 2015 |
Natalie A. Trunow
c/o Columbia
Management Investment
Advisers, LLC,
225 Franklin Street
Mail Drop BX32 05228,
Boston, MA 02110
1967 | Independent Trustee Consultant
2016 | Independent Trustee Consultant, Columbia Funds since September 2016; Chief Executive Officer, Millennial Partners (investment consulting services to institutions) since January 2016; Director of Investments, Casey Family Programs from April 2016 to September 2016; Senior Vice President and Chief Investment Officer, Calvert Investments from August 2008 to January 2016; Section Head and Portfolio Manager, General Motors Asset Management from June 1997 to August 2008 | 57 | Healthcare Services for Children with Special Needs |
| * | J. Kevin Connaughton was appointed consultant to the Independent Trustees effective March 1, 2016. Natalie A. Trunow was appointed consultant to the Independent Trustees effective September 1, 2016. Shareholders of the Funds are expected to be asked to elect each of Mr. Connaughton and Ms. Trunow as a Trustee at a future shareholder meeting. |
Interested trustee affiliated with Investment Manager*
| Name, address, year of birth | Position held with the Trust and length of service | Principal occupation(s) during the past five years and other relevant professional experience | Number of Funds in the Columbia Funds Complex overseen | Other directorships held by Trustee during the past five years |
William F. Truscott
c/o Columbia Management
Investment Advisers, LLC
225 Franklin Street
Boston, MA 02110
1960 | Trustee
2012 | Chairman of the Board and President, Columbia Management Investment Advisers, LLC since May 2010 and February 2012, respectively; Chief Executive Officer, Global Asset Management, Ameriprise Financial, Inc. since September 2012 (previously Chief Executive Officer, U.S. Asset Management & President, Annuities, May 2010-September 2012); Director and Chief Executive Officer, Columbia Management Investment Distributors, Inc. since May 2010 and February 2012, respectively;Chairman of the Board and Chief Executive Officer, RiverSource Distributors, Inc. since 2006; Director, Threadneedle Asset Management Holdings, SARL since 2014; President and Chief Executive Officer, Ameriprise Certificate Company, 2006-August 2012 | 183 | Chairman of the Board, Columbia Management Investment Advisers, LLC since May 2010; Director, Columbia Management Investment Distributors, Inc. since May 2010; former Director, Ameriprise Certificate Company, 2006 - January 2013 |
| * | Interested person (as defined under the 1940 Act) by reason of being an officer, director, security holder and/or employee of the Investment Manager or Ameriprise Financial. |
The Statement of Additional Information has additional information about the Fund’s Board members and is available,
without charge, upon request by calling 800.345.6611; contacting your financial intermediary; or visiting
investor.columbiathreadneedleus.com.
| 32 | Columbia U.S. Treasury Index Fund | Annual Report 2017 |
TRUSTEES AND OFFICERS (continued)
The Board has appointed officers who are responsible for day-to-day business decisions based on policies it has established. The officers serve at the pleasure of the Board. The following table provides basic information about the Officers of the Fund, including principal occupations during the past five years, although their specific titles may have varied over the period. In addition to Mr. Truscott, who is Senior Vice President, the Fund’s other officers are:
Fund officers
Name,
address and
year of birth | Position and year
first appointed to
position for any Fund
in the Columbia
Funds complex or a
predecessor thereof | Principal occupation(s) during past five years |
Christopher O. Petersen
5228 Ameriprise
Financial Center
Minneapolis, MN 55474
Born 1970 | President and Principal Executive Officer (2015) | Vice President and Lead Chief Counsel, Ameriprise Financial, Inc. since January 2015 (previously, Vice President and Chief Counsel, January 2010 - December 2014; officer of Columbia Funds and affiliated funds since 2007. |
Michael G. Clarke
225 Franklin Street
Boston, MA 02110
Born 1969 | Treasurer (2011), Chief Financial Officer (2009) and Chief Accounting Officer (2015) | Vice President — Mutual Fund Administration, Columbia Management Investment Advisers, LLC, since May 2010; senior officer of Columbia Funds and affiliated funds since 2002. |
Paul B. Goucher
100 Park Avenue
New York, NY 10017
Born 1968 | Senior Vice President (2011) and Assistant Secretary (2008) | Senior Vice President and Assistant General Counsel, Ameriprise Financial, Inc. since January 2017 (previously Vice President and Lead Chief Counsel, November 2008 - January 2017 and January 2013 - January 2017, respectively; and Chief Counsel, January 2010 - January 2013); Vice President, Chief Legal Officer and Assistant Secretary, Columbia Management Investment Advisers, LLC since May 2010. |
Thomas P. McGuire
225 Franklin Street
Boston, MA 02110
Born 1972 | Senior Vice President and Chief Compliance Officer (2012) | Vice President — Asset Management Compliance, Ameriprise Financial, Inc., since May 2010; Chief Compliance Officer, Ameriprise Certificate Company since September 2010. |
Colin Moore
225 Franklin Street
Boston, MA 02110
Born 1958 | Senior Vice President (2010) | Executive Vice President and Global Chief Investment Officer, Ameriprise Financial, Inc., since July 2013; Executive Vice President and Global Chief Investment Officer, Columbia Management Investment Advisers, LLC since July 2013 (previously Director and Global Chief Investment Officer, 2010 - 2013). |
Michael E. DeFao
225 Franklin Street
Boston, MA 02110
Born 1968 | Vice President (2011) and Assistant Secretary (2010) | Vice President and Chief Counsel, Ameriprise Financial, Inc. since May 2010. |
Amy Johnson
5228 Ameriprise
Financial Center
Minneapolis, MN 55474
Born 1965 | Vice President (2006) | Managing Director and Global Head of Operations, Columbia Management Investment Advisers, LLC since April 2016 (previously Managing Director and Chief Operating Officer, 2010 - 2016). |
Lyn Kephart-Strong
5228 Ameriprise
Financial Center
Minneapolis, MN 55474
Born 1960 | Vice President (2015) | President, Columbia Management Investment Services Corp. since October 2014; Vice President & Resolution Officer, Ameriprise Trust Company since August 2009. |
Ryan C. Larrenaga
225 Franklin Street
Boston, MA 02110
Born 1970 | Senior Vice President (2017), Chief Legal Officer (2017) and Secretary (2015) | Vice President and Group Counsel, Ameriprise Financial, Inc. since August 2011; officer of Columbia Funds and affiliated funds since 2005. |
Columbia U.S. Treasury Index Fund | Annual Report 2017
| 33 |
The Fund mails one shareholder report to each shareholder address. If you would like more than one report, please call shareholder services at 800.345.6611 and additional reports will be sent to you.
Proxy voting policies and procedures
The policy of the Board of Trustees is to vote the proxies of the companies in which the Fund holds investments consistent with the procedures as stated in the Statement of Additional Information (SAI). You may obtain a copy of the SAI without charge by calling 800.345.6611; contacting your financial intermediary; visiting investor.columbiathreadneedleus.com; or searching the website of the Securities and Exchange Commission (SEC) at sec.gov. Information regarding how the Fund voted proxies relating to portfolio securities is filed with the SEC by August 31st for the most recent 12-month period ending June 30th of that year, and is available without charge by visiting investor.columbiathreadneedleus.com, or searching the website of the SEC at sec.gov.
Quarterly schedule of investments
The Fund files a complete schedule of portfolio holdings with the SEC for the first and third quarters of each fiscal year on Form N-Q. The Fund’s Form N-Q is available on the SEC’s website at sec.gov and may be reviewed and copied at the SEC’s Public Reference Room in Washington, D.C. Information on the operation of the Public Reference Room may be obtained by calling 800.SEC.0330. The Fund’s complete schedule of portfolio holdings, as filed on Form N-Q, can also be obtained without charge, upon request, by calling 800.345.6611.
Additional Fund information
For more information about the Fund, please visit investor.columbiathreadneedleus.com or call 800.345.6611. Customer Service Representatives are available to answer your questions Monday through Friday from 8 a.m. to 7 p.m. Eastern time.
Fund investment manager
Columbia Management Investment Advisers, LLC
225 Franklin Street
Boston, MA 02110
Fund distributor
Columbia Management Investment Distributors, Inc.
225 Franklin Street
Boston, MA 02110
Fund transfer agent
Columbia Management Investment Services Corp.
P.O. Box 8081
Boston, MA 02266-8081
| 34 | Columbia U.S. Treasury Index Fund | Annual Report 2017 |
[THIS PAGE INTENTIONALLY LEFT BLANK]
[THIS PAGE INTENTIONALLY LEFT BLANK]
[THIS PAGE INTENTIONALLY LEFT BLANK]
Columbia U.S. Treasury Index Fund
P.O. Box 8081
Boston, MA 02266-8081
Please read and consider the investment objectives, risks, charges and expenses for any fund carefully before investing. For a prospectus and summary prospectus, which contains this and other important information about the Fund, go to
investor.columbiathreadneedleus.com. The Fund is distributed by Columbia Management Investment Distributors, Inc., member FINRA, and managed by Columbia Management Investment Advisers, LLC.
Columbia Threadneedle Investments (Columbia Threadneedle) is the global brand name of the Columbia and Threadneedle group of companies. All rights reserved. Columbia Management Investment Distributors, Inc., 225 Franklin Street, Boston, MA 02110-2804
© 2017 Columbia Management Investment Advisers, LLC.
investor.columbiathreadneedleus.com
Item 2. Code of Ethics.
| | (a) | The registrant has adopted a code of ethics that applies to the registrant’s principal executive officer, principal financial officer, principal accounting officer or controller, or persons performing similar functions, regardless of whether these individuals are employed by the registrant or a third party. |
| | (b) | During the period covered by this report, there were not any amendments to a provision of the code of ethics adopted in 2(a) above. |
| | (c) | During the period covered by this report, there were no waivers, including any implicit waivers, from a provision of the code of ethics described in 2(a) above that relates to one or more of the items set forth in paragraph (b) of this item’s instructions. |
Item 3. Audit Committee Financial Expert.
The registrant’s Board of Trustees has determined that Douglas A. Hacker, David M. Moffett and Anne-Lee Verville, each of whom are members of the registrant’s Board of Trustees and Audit Committee, each qualify as an audit committee financial expert. Mr. Hacker, Mr. Moffett and Ms. Verville are each independent trustees, as defined in paragraph (a)(2) of this item’s instructions.
Item 4. Principal Accountant Fees and Services.
Fee information below is disclosed for the three series of the registrant whose reports to stockholders are included in this annual filing.
(a) Audit Fees. Aggregate Audit Fees billed by the principal accountant for professional services rendered during the fiscal years ended April 30, 2017 and April 30, 2016 are approximately as follows:
| | | | | | |
| 2017 | | | 2016 | |
| $ | 242,800 | | | $ | 154,500 | |
Audit Fees include amounts related to the audit of the registrant’s annual financial statements or services that are normally provided by the accountant in connection with statutory and regulatory filings or engagements for those fiscal years.
(b) Audit-Related Fees. Aggregate Audit-Related Fees billed to the registrant by the principal accountant for professional services rendered during the fiscal years ended April 30, 2017 and April 30, 2016 are approximately as follows:
Audit-Related Fees include amounts for assurance and related services by the principal accountant that are reasonably related to the performance of the audit of the registrant’s financial statements and are not reported in Audit Fees above. In fiscal years 2017 and 2016, Audit-Related Fees consist of agreed-upon procedures performed for semi-annual shareholder reports. Fiscal year 2017 also includes agreed-upon procedures related to issuance of consents and review of Form N-1A.
During the fiscal years ended April 30, 2017 and April 30, 2016, there were no Audit-Related Fees billed by the registrant’s principal accountant to the registrant’s investment adviser (not including any sub-adviser whose role is primarily portfolio management and is subcontracted with or overseen by another investment adviser) and any entity controlling, controlled by, or under common control with the adviser that provides ongoing services to the registrant for an engagement that related directly to the operations and financial reporting of the registrant.
(c) Tax Fees. Aggregate Tax Fees billed by the principal accountant to the registrant for professional services rendered during the fiscal years ended April 30, 2017 and April 30, 2016 are approximately as follows:
| | | | | | |
| 2017 | | | 2016 | |
| $ | 39,900 | | | $ | 33,100 | |
Tax Fees include amounts for the review of annual tax returns, the review of required shareholder distribution calculations and typically include amounts for professional services by the principal accountant for tax compliance, tax advice and tax planning. Fiscal year 2017 and 2016 also include Tax Fees for foreign tax filings.
During the fiscal years ended April 30, 2017 and April 30, 2016, there were no Tax Fees billed by the registrant’s principal accountant to the registrant’s investment adviser (not including any sub-adviser whose role is primarily portfolio management and is subcontracted with or overseen by another investment adviser) and any entity controlling, controlled by, or under common control with the adviser that provides ongoing services to the registrant for an engagement that related directly to the operations and financial reporting of the registrant.
(d) All Other Fees. Aggregate All Other Fees billed by the principal accountant to the registrant for professional services rendered during the fiscal years ended April 30, 2017 and April 30, 2016 are approximately as follows:
All Other Fees include amounts for products and services provided by the principal accountant, other than the services reported in paragraphs (a) through (c) above.
Aggregate All Other Fees billed by the registrant’s principal accountant to the registrant’s investment adviser (not including any sub-adviser whose role is primarily portfolio management and is subcontracted with or overseen by another investment adviser) and any entity controlling, controlled by, or under common control with the adviser that provides ongoing services to the registrant for an engagement that related directly to the operations and financial reporting of the registrant during the fiscal years ended April 30, 2017 and April 30, 2016 are approximately as follows:
| | | | | | |
| 2017 | | | 2016 | |
| $ | 232,500 | | | $ | 335,000 | |
In fiscal years 2017 and 2016, All Other Fees primarily consists of fees billed for internal control examinations of the registrant’s transfer agent and investment adviser.
(e)(1) Audit Committee Pre-Approval Policies and Procedures
The registrant’s Audit Committee is required to pre-approve the engagement of the registrant’s independent auditors to provide audit and non-audit services to the registrant and non-audit services to its investment adviser (excluding any sub-adviser whose role is primarily portfolio management and is sub-contracted or overseen by another investment adviser (the “Adviser”) or any entity controlling, controlled by or under common control with the Adviser that provides ongoing services to the Fund (a “Control Affiliate”) if the engagement relates directly to the operations and financial reporting of the registrant.
The Audit Committee has adopted a Policy for Engagement of Independent Auditors for Audit and Non-Audit Services (the “Policy”). The Policy sets forth the understanding of the Audit Committee regarding the engagement of the registrant’s independent accountants to provide (i) audit and permissible audit-related, tax and other services to the registrant (“Fund Services”); (ii) non-audit services to the registrant’s Adviser and any Control Affiliates, that relates directly to the operations and financial reporting of a Fund (“Fund-related Adviser Services”); and (iii) certain other audit and non-audit services to the registrant’s Adviser and its Control Affiliates. A service will require specific pre-approval by the Audit Committee if it is to be provided by the Fund’s independent auditor; provided, however, that pre-approval of non-audit services to the Fund, the Adviser or Control Affiliates may be waived if certain de minimis requirements set forth in the SEC’s rules are met.
Under the Policy, the Audit Committee may delegate pre-approval authority to any pre-designated member or members who are independent board members. The member(s) to whom such authority is delegated must report, for informational purposes only, any pre-approval decisions to the Audit Committee at its next regular meeting. The Audit Committee’s responsibilities with respect to the pre-approval of services performed by the independent auditor may not be delegated to management.
On an annual basis, at a regularly scheduled Audit Committee meeting, the Fund’s Treasurer or other Fund officer shall submit to the Audit Committee a schedule of the types of Fund Services and Fund-related Adviser Services that are subject to specific pre-approval. This schedule will provide a description of each type of service that is subject to specific pre-approval, along with total projected fees for each service. The pre-approval will generally cover a one-year period. The Audit Committee will review and approve the types of services and the projected fees for the next one-year period and may add to, or subtract from, the list of pre-approved services from time to time, based on subsequent determinations. This specific approval acknowledges that the Audit Committee is in agreement with the specific types of services that the independent auditor will be permitted to perform and the projected fees for each service.
The Fund’s Treasurer or other Fund officer shall report to the Audit Committee at each of its regular meetings regarding all Fund Services or Fund-related Adviser Services provided since the last such report was rendered, including a description of the services, by category, with forecasted fees for the annual reporting period, proposed changes requiring specific pre-approval and a description of services provided by the independent auditor, by category, with actual fees during the current reporting period.
*****
(e)(2) 100% of the services performed for items (b) through (d) above during 2017 and 2016 were pre-approved by the registrant’s Audit Committee.
(f) Not applicable.
(g) The aggregate non-audit fees billed by the registrant’s accountant for services rendered to the registrant, and rendered to the registrant’s investment adviser (not including any sub-adviser whose role is primarily portfolio management and is subcontracted with or overseen by another investment adviser), and any entity controlling, controlled by, or under common control with the adviser that provides ongoing services to the registrant during the fiscal years ended April 30, 2017 and April 30, 2016 are approximately as follows:
| | | | | | |
| 2017 | | | 2016 | |
| $ | 281,700 | | | $ | 370,500 | |
(h) The registrant’s Audit Committee of the Board of Directors has considered whether the provision of non-audit services that were rendered to the registrant’s adviser (not including any sub-adviser whose role is primarily portfolio management and is subcontracted with or overseen by another investment adviser), and any entity controlling, controlled by, or under common control with the investment adviser that provides ongoing services to the registrant that were not pre-approved pursuant to paragraph (c)(7)(ii) of Rule 2-01 of Regulation S-X, is compatible with maintaining the principal accountant’s independence.
Item 5. Audit Committee of Listed Registrants.
Not applicable.
Item 6. Investments
| | (a) | The registrant’s “Schedule I – Investments in securities of unaffiliated issuers” (as set forth in 17 CFR 210.12-12) is included in Item 1 of this Form N-CSR. |
Item 7. Disclosure of Proxy Voting Policies and Procedures for Closed-End Management Investment Companies.
Not applicable.
Item 8. Portfolio Managers of Closed-End Management Investment Companies.
Not applicable.
Item 9. Purchases of Equity Securities by Closed-End Management Investment Company and Affiliated Purchasers.
Not applicable.
Item 10. Submission of Matters to a Vote of Security Holders.
There were no material changes to the procedures by which shareholders may recommend nominees to the registrant’s board of directors.
Item 11. Controls and Procedures.
| | (a) | The registrant’s principal executive officer and principal financial officer, based on their evaluation of the registrant’s disclosure controls and procedures as of a date within 90 days of the filing of this report, have concluded that such controls and procedures are adequately designed to ensure that material information required to be disclosed by the registrant in Form N-CSR is accumulated and communicated to the registrant’s management, including the principal executive officer and principal financial officer, or persons performing similar functions, as appropriate to allow timely decisions regarding required disclosure. |
| | (b) | There was no change in the registrant’s internal control over financial reporting that occurred during the registrant’s second fiscal quarter of the period covered by this report that has materially affected, or is reasonably likely to materially affect, the registrant’s internal control over financial reporting. |
Item 12. Exhibits.
(a)(1) Code of ethics required to be disclosed under Item 2 of Form N-CSR attached hereto as Exhibit 99.CODE ETH.
(a)(2) Certifications pursuant to Rule 30a-2(a) under the Investment Company Act of 1940 (17 CFR 270.30a-2(a)) attached hereto as Exhibit 99.CERT.
(a)(3) Not applicable.
(b) Certification pursuant to Rule 30a-2(b) under the Investment Company Act of 1940 (17 CFR 270.30a-2(b)) attached hereto as Exhibit 99.906CERT.
SIGNATURES
Pursuant to the requirements of the Securities Exchange Act of 1934 and the Investment Company Act of 1940, the registrant has duly caused this report to be signed on its behalf by the undersigned, thereunto duly authorized.
| | | | |
| (registrant) | | Columbia Funds Series Trust I | | |
| | | | | | |
| | By (Signature and Title) | | /s/ Christopher O. Petersen | | |
| | | | Christopher O. Petersen, President and Principal Executive Officer | | |
Pursuant to the requirements of the Securities Exchange Act of 1934 and the Investment Company Act of 1940, this report has been signed below by the following persons on behalf of the registrant and in the capacities and on the dates indicated.
| | | | | | |
| | By (Signature and Title) | | /s/ Christopher O. Petersen | | |
| | | | Christopher O. Petersen, President and Principal Executive Officer | | |
| | | | | | |
| | By (Signature and Title) | | /s/ Michael G. Clarke | | |
| | | | Michael G. Clarke, Treasurer and Chief Financial Officer | | |