UNITED STATES
SECURITIES AND EXCHANGE COMMISSION
Washington, D.C. 20549
FORM N-CSR
CERTIFIED SHAREHOLDER REPORT OF REGISTERED
MANAGEMENT INVESTMENT COMPANIES
Investment Company Act file number 811-04367
Columbia Funds Series Trust I
(Exact name of registrant as specified in charter)
225 Franklin Street
Boston, Massachusetts 02110
(Address of principal executive offices) (Zip code)
Ryan Larrenaga
c/o Columbia Management Investment Advisers, LLC
225 Franklin Street
Boston, MA 02110
(Name and address of agent for service)
Registrant’s telephone number, including area code: (800) 345-6611
Date of fiscal year end: August 31
Date of reporting period: August 31, 2017
Form N-CSR is to be used by management investment companies to file reports with the Commission not later than 10 days after the transmission to stockholders of any report that is required to be transmitted to stockholders under Rule 30e-1 under the Investment Company Act of 1940 (17 CFR 270.30e-1). The Commission may use the information provided on Form N-CSR in its regulatory, disclosure review, inspection, and policymaking roles.
A registrant is required to disclose the information specified by Form N-CSR, and the Commission will make this information public. A registrant is not required to respond to the collection of information contained in Form N-CSR unless the Form displays a currently valid Office of Management and Budget (“OMB”) control number. Please direct comments concerning the accuracy of the information collection burden estimate and any suggestions for reducing the burden to Secretary, Securities and Exchange Commission, 450 Fifth Street, NW, Washington, DC 20549-0609. The OMB has reviewed this collection of information under the clearance requirements of 44 U.S.C. § 3507.
Item 1. Reports to Stockholders.

Annual Report
August 31, 2017
Columbia Contrarian Core Fund
Not FDIC Insured • No bank guarantee • May lose value
Dear Shareholders,
The current outlook for financial markets is clouded by two primary concerns: the high valuation of equities and the direction of interest rates. Following the U.S. presidential election, U.S. equities rallied based on the assumption that the new administration’s policies would stimulate growth quickly. Unfortunately it’s unclear whether those measures will get passed, much less passed quickly. In fixed income, uncertainty stems from the possibility that interest rates won’t rise as rapidly as expected if the administration’s proposed growth policies are not implemented.
Given this uncertainty, investors value a consistent approach more than ever. Investors want strong, repeatable risk-adjusted returns. Consistency — not surprises. As a leading global asset manager, we believe our consistent, collaborative investment approach enables us to deliver the dependable experience your portfolio demands. So, how do we strive to deliver a consistent investment experience?
Better insights
Your portfolio benefits from the investment insights uncovered by our talented investment teams around the world.
Better decisions
Our collaborative, interactive environment enables our investment teams to construct portfolios that take advantage of the best investment ideas.
Better outcomes
We aim to deliver a consistent experience, which means fewer surprises, dependable insights, and products designed to do the thing you want.
Whether you’re trying to save money to help your children go to college or for your own retirement, it’s the consistency of the return that is most essential. People who chase higher returns are usually also the first to sell when that investment goes through a bad patch. We try to combat this behavioral tendency by offering strategies that aim for a more consistent return. Our goal is for investors to panic less during periods of volatility, which can have a significant effect on their long-term results.
Nothing is more important to us than making sure those who have entrusted us to protect and grow their assets can do what matters most to them: build a nest egg, leave a legacy, and live confidently — now and throughout retirement. It’s why our talented professionals around the world work together to uncover uncommon opportunities and why our process encourages challenge and debate around our most compelling ideas to ensure better informed investment decisions, which hopefully lead to better outcomes for you.
Your success is our priority. Talk to your financial advisor about how working with Columbia Threadneedle Investments may help you position your portfolio for consistent, sustainable outcomes, no matter the market conditions.
Sincerely,
Christopher O. Petersen
President, Columbia Funds
Investors should consider the investment objectives, risks, charges and expenses of a mutual fund carefully before investing. For a free prospectus and summary prospectus, which contains this and other important information about a fund, visit investor.columbiathreadneedleus.com. The prospectus should be read carefully before investing.
Columbia Funds are distributed by Columbia Management Investment Distributors, Inc., member FINRA, and managed by Columbia Management Investment Advisers, LLC.
© 2017 Columbia Management Investment Advisers, LLC. All rights reserved.
Columbia Contrarian Core Fund | Annual Report 2017
Columbia Contrarian Core Fund | Annual Report 2017
Investment objective
Columbia Contrarian Core Fund (the Fund) seeks total return, consisting of long-term capital appreciation and current income.
Portfolio management
Guy Pope, CFA
Manager
Managed Fund since 2005
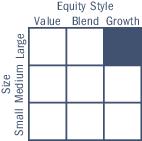
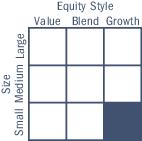
Morningstar style boxTM
The Morningstar Style Box is based on a fund’s portfolio holdings. For equity funds, the vertical axis shows the market capitalization of the stocks owned, and the horizontal axis shows investment style (value, blend, or growth). Information shown is based on the most recent data provided by Morningstar.
© 2017 Morningstar, Inc. All rights reserved. The Morningstar information contained herein: (1) is proprietary to Morningstar and/or its content providers; (2) may not be copied or distributed; and (3) is not warranted to be accurate, complete or timely. Neither Morningstar nor its content providers are responsible for any damages or losses arising from any use of this information.
| Average annual total returns (%) (for the period ended August 31, 2017) |
| | | Inception | 1 Year | 5 Years | 10 Years |
| Class A | Excluding sales charges | 11/01/98 | 15.61 | 14.85 | 9.35 |
| | Including sales charges | | 8.96 | 13.50 | 8.70 |
| Class C | Excluding sales charges | 12/09/02 | 14.80 | 14.00 | 8.53 |
| | Including sales charges | | 13.80 | 14.00 | 8.53 |
| Class K* | 03/07/11 | 15.78 | 15.00 | 9.48 |
| Class R* | 09/27/10 | 15.34 | 14.58 | 9.09 |
| Class R4* | 11/08/12 | 15.91 | 15.15 | 9.62 |
| Class R5* | 11/08/12 | 16.05 | 15.28 | 9.69 |
| Class T* | Excluding sales charges | 09/27/10 | 15.62 | 14.84 | 9.35 |
| | Including sales charges | | 12.73 | 14.27 | 9.07 |
| Class V | Excluding sales charges | 02/12/93 | 15.61 | 14.83 | 9.31 |
| | Including sales charges | | 8.95 | 13.47 | 8.66 |
| Class Y* | 11/08/12 | 16.14 | 15.35 | 9.72 |
| Class Z | 12/14/92 | 15.95 | 15.14 | 9.62 |
| Russell 1000 Index | | 16.16 | 14.37 | 7.73 |
Returns for Class A and Class V shares are shown with and without the maximum initial sales charge of 5.75%. Returns for Class C shares are shown with and without the 1.00% contingent deferred sales charge for the first year only. Returns for Class T shares are shown with and without the maximum initial sales charge of 2.50% per transaction. Prior to March 27, 2017, Class T shares were known as Class W shares and were not subject to sales charges. The Fund’s other share classes are not subject to sales charges and have limited eligibility. Please see the Fund’s prospectus for details. Performance for different share classes will vary based on differences in sales charges and fees associated with each share class. All results shown assume reinvestment of distributions during the period. Returns do not reflect the deduction of taxes that a shareholder may pay on Fund distributions or on the redemption of Fund shares. Performance results reflect the effect of any fee waivers or reimbursements of Fund expenses by Columbia Management Investment Advisers, LLC and/or any of its affiliates. Absent these fee waivers or expense reimbursement arrangements, performance results would have been lower.
The performance information shown represents past performance and is not a guarantee of future results. The investment return and principal value of your investment will fluctuate so that your shares, when redeemed, may be worth more or less than their original cost. Current performance may be lower or higher than the performance information shown. You may obtain performance information current to the most recent month-end by contacting your financial intermediary, visiting investor.columbiathreadneedleus.com or calling 800.345.6611.
| * | The returns shown for periods prior to the share class inception date (including returns for the Life of the Fund, if shown, which are since Fund inception) include the returns of the Fund’s oldest share class. These returns are adjusted to reflect any higher class-related operating expenses of the newer share classes, as applicable. Please visit investor.columbiathreadneedleus.com/investment-products/mutual-funds/appended-performance for more information. |
The Russell 1000 Index tracks the performance of 1,000 of the largest U.S. companies, based on market capitalization.
Indices are not available for investment, are not professionally managed and do not reflect sales charges, fees, brokerage commissions, taxes or other expenses of investing. Securities in the Fund may not match those in an index.
| 2 | Columbia Contrarian Core Fund | Annual Report 2017 |
Fund at a Glance (continued)
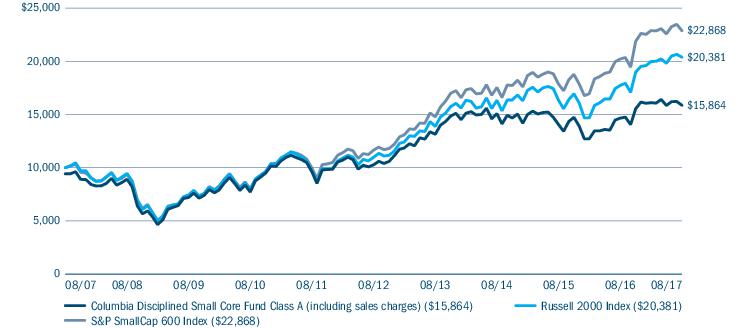
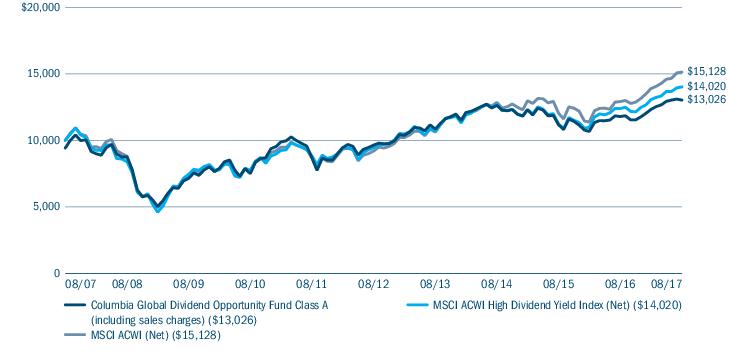
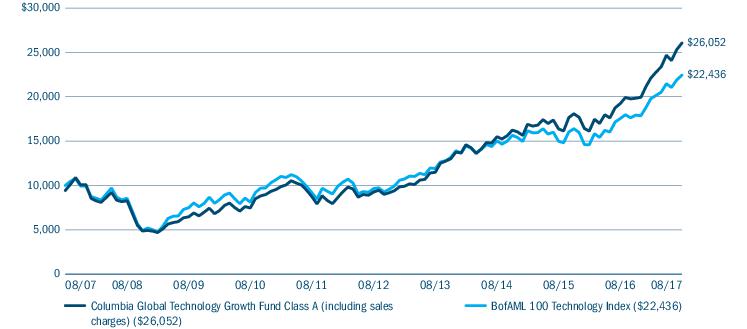
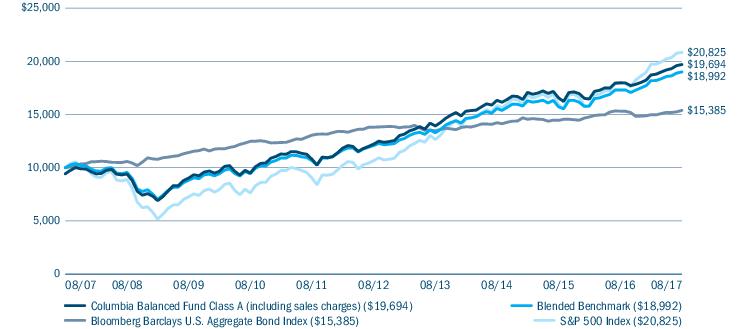
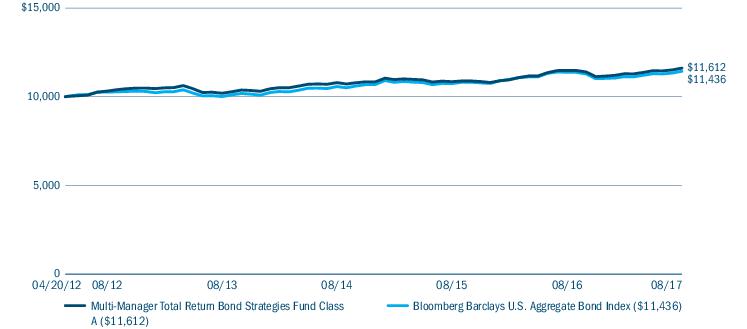
Performance of a hypothetical $10,000 investment (August 31, 2007 — August 31, 2017)
The chart above shows the change in value of a hypothetical $10,000 investment in Class A shares of Columbia Contrarian Core Fund during the stated time period, and does not reflect the deduction of taxes that a shareholder may pay on Fund distributions or on the redemption of Fund shares.
| Top 10 holdings (%) (at August 31, 2017) |
| Apple, Inc. | 4.8 |
| Berkshire Hathaway, Inc., Class B | 3.3 |
| JPMorgan Chase & Co. | 3.2 |
| Microsoft Corp. | 3.2 |
| Citigroup, Inc. | 3.2 |
| Philip Morris International, Inc. | 3.0 |
| Facebook, Inc., Class A | 2.8 |
| Johnson & Johnson | 2.7 |
| Comcast Corp., Class A | 2.6 |
| Honeywell International, Inc. | 2.4 |
Percentages indicated are based upon total investments (excluding Money Market Funds).
For further detail about these holdings, please refer to the section entitled “Portfolio of Investments.”
Fund holdings are as of the date given, are subject to change at any time, and are not recommendations to buy or sell any security.
| Portfolio breakdown (%) (at August 31, 2017) |
| Common Stocks | 96.1 |
| Money Market Funds | 3.9 |
| Total | 100.0 |
Percentages indicated are based upon total investments. The Fund’s portfolio composition is subject to change.
| Equity sector breakdown (%) (at August 31, 2017) |
| Consumer Discretionary | 11.7 |
| Consumer Staples | 6.9 |
| Energy | 6.8 |
| Financials | 17.8 |
| Health Care | 17.8 |
| Industrials | 7.8 |
| Information Technology | 23.9 |
| Materials | 1.8 |
| Real Estate | 1.6 |
| Telecommunication Services | 2.6 |
| Utilities | 1.3 |
| Total | 100.0 |
Percentages indicated are based upon total equity investments. The Fund’s portfolio composition is subject to change.
Columbia Contrarian Core Fund | Annual Report 2017
| 3 |
Manager Discussion of Fund Performance
For the 12-month period that ended August 31, 2017, the Fund’s Class A shares returned 15.61% excluding sales charges. The Fund’s benchmark, the Russell 1000 Index, returned 16.16% for the same time period. In a sharply rising market, cash had a negative impact on performance. Cash, which the benchmark does not hold, and management fees, which the benchmark does not incur, generally accounted for the Fund’s modest shortfall relative to the benchmark.
U.S. equity markets delivered solid gains
Global events, political uncertainty and mixed economic data were enough to keep investors off balance early in the 12-month period, as financial markets moved sharply in reaction to each significant change on the world stage. However, the end of a contentious U.S. presidential contest in November 2016 eliminated a key element of uncertainty, and the U.S. equity markets moved solidly higher through the end of the period. Global growth picked up early in 2017. Positive U.S. economic data, steady job growth, rising corporate earnings and accelerated manufacturing activity further bolstered investor confidence.
The Federal Reserve (the Fed) raised the target range of its benchmark short-term interest rate three times during the period, bringing it to between 1.00% and 1.25% in June 2017. The Fed signaled that it was prepared to raise rates more aggressively on the heels of strong job gains and progress towards its 2.0% inflation target, creating expectations that the June rate hike may not be the last during the calendar year.
Against this backdrop, the U.S. equity markets moved solidly higher during the period. The S&P 500 Index rose 16.23%, with dividends reinvested. Small cap stocks outperformed large and mid-cap stocks.
Contributors and detractors
During the period, stock selection was particularly strong in the information technology, financials and materials sectors. Within information technology, Activision, a leading electronic gaming company, and Apple were top performers for the Fund. Activision continued to benefit from the migration to digital, and Apple rose on expectations for the iPhone 8 and 10 (or X). Within financials, Morgan Stanley, Citigroup and JPMorgan all benefited from expectations of a slightly more lenient regulatory environment under the new administration and the impact of rising interest rates, which are helpful to financial companies. After years of building capital on their balance sheets, these companies increased the amount of capital returned to shareholders, and the acceleration of capital return was met with investor approval. In the materials sector, Sherwin Williams was a big winner for the Fund. The company’s core paint business did well in a favorable environment for housing. The acquisition of competitor Valspar proved to be accretive to the overall company and helped give earnings an extra boost.
Elsewhere in the portfolio, the consumer discretionary sector yielded many stocks with returns in excess of 20% for the period, including Royal Caribbean, McDonalds, Marriott, Comcast and Expedia. Royal Caribbean rebounded after a challenging 2016, during which concerns about the Zika virus and about excess capacity in China weighed on industry prospects. However, the outlook got stronger going into the winter months of 2016-2017, pricing firmed up and Royal Caribbean was the beneficiary of this turnaround. Investors responded favorably to good execution by McDonalds management. Marriott benefited as the merger with Starwood has gone smoothly so far. Comcast and Expedia were two other solid holdings during the period. Health care was another area where the Fund found opportunities -- Vertex and Anthem, in particular. Vertex outperformed based on favorable data showing the potential for expanded market opportunity for its cystic fibrosis treatment. Anthem benefited as health maintenance organizations got a boost as uncertainty created by merger and acquisition activity receded and from a perception that the new administration’s policies would be good for the industry.
Industrials, telecommunication services and health care were the biggest sector detractors from relative Fund results for the period. In the industrials sector, Dun & Bradstreet and Nielsen Holdings were major laggards. With Dun & Bradstreet, we were anticipating an organic growth turnaround, which failed to materialize. Nielsen’s revenues were hurt as big consumer staples customers pulled back on their spending. In the telecommunication services sector, fundamental trends hurt Verizon and AT&T, making it difficult to increase top line growth. Elsewhere in the portfolio, Michael’s lost ground on weaker same-store sales as retailers continued to struggle against online competition and a tough retail environment. Kroger was hurt by increased competition in food retailing and concerns about the impact of Amazon’s purchase of Whole Foods. We eliminated both Michael’s and Kroger from the portfolio.
| 4 | Columbia Contrarian Core Fund | Annual Report 2017 |
Manager Discussion of Fund Performance (continued)
Managing through a challenging year
The Fund’s solid results for the 12-month period had two different phases. The first four months were dominated by the U.S. presidential election. It was a period of underperformance for the Fund, as investors rapidly rotated into and out of stocks that they viewed as beneficiaries of the new administration and its policies. However, we did not get carried away with these trends, many of which turned out to be transitory, at least in the short term. In fact, we took advantage of selloffs to add to names such as Phillip Morris International, where our conviction was strong, and added new positions based on our contrarian approach. As a result, the Fund enjoyed a significant comeback in 2017 and ended the period with performance in line with its benchmark. We stayed with our core contrarian philosophy in constructing the portfolio and managing it from day to day, and we believe this discipline served our shareholders well.
Market risk may affect a single issuer, sector of the economy, industry or the market as a whole. Foreign investments subject the Fund to risks, including political, economic, market, social and others within a particular country, as well as to currency instabilities and less stringent financial and accounting standards generally applicable to U.S. issuers. Growth securities, at times, may not perform as well as value securities or the stock market in general and may be out of favor with investors. Value securities may be unprofitable if the market fails to recognize their intrinsic worth or the portfolio manager misgauged that worth. The Fund may invest significantly in issuers within a particular sector, which may be negatively affected by market, economic or other conditions, making the Fund more vulnerable to unfavorable developments in the sector. See the Fund’s prospectus for more information on these and other risks.
The views expressed in this report reflect the current views of the respective parties. These views are not guarantees of future performance and involve certain risks, uncertainties and assumptions that are difficult to predict, so actual outcomes and results may differ significantly from the views expressed. These views are subject to change at any time based upon economic, market or other conditions and the respective parties disclaim any responsibility to update such views. These views may not be relied on as investment advice and, because investment decisions for a Columbia fund are based on numerous factors, may not be relied on as an indication of trading intent on behalf of any particular Columbia fund. References to specific securities should not be construed as a recommendation or investment advice.
Columbia Contrarian Core Fund | Annual Report 2017
| 5 |
Understanding Your Fund’s Expenses
(Unaudited)
As an investor, you incur two types of costs. There are transaction costs, which generally include sales charges on purchases and may include redemption fees. There are also ongoing costs, which generally include management fees, distribution and/or service fees, and other fund expenses. The following information is intended to help you understand your ongoing costs (in dollars) of investing in the Fund and to help you compare these costs with the ongoing costs of investing in other mutual funds.
Analyzing your Fund’s expenses
To illustrate these ongoing costs, we have provided examples and calculated the expenses paid by investors in each share class of the Fund during the period. The actual and hypothetical information in the table is based on an initial investment of $1,000 at the beginning of the period indicated and held for the entire period. Expense information is calculated two ways and each method provides you with different information. The amount listed in the “Actual” column is calculated using the Fund’s actual operating expenses and total return for the period. You may use the Actual information, together with the amount invested, to estimate the expenses that you paid over the period. Simply divide your account value by $1,000 (for example, an $8,600 account value divided by $1,000 = 8.6), then multiply the results by the expenses paid during the period under the “Actual” column. The amount listed in the “Hypothetical” column assumes a 5% annual rate of return before expenses (which is not the Fund’s actual return) and then applies the Fund’s actual expense ratio for the period to the hypothetical return. You should not use the hypothetical account values and expenses to estimate either your actual account balance at the end of the period or the expenses you paid during the period. See “Compare with other funds” below for details on how to use the hypothetical data.
Compare with other funds
Since all mutual funds are required to include the same hypothetical calculations about expenses in shareholder reports, you can use this information to compare the ongoing cost of investing in the Fund with other funds. To do so, compare the hypothetical example with the 5% hypothetical examples that appear in the shareholder reports of other funds. As you compare hypothetical examples of other funds, it is important to note that hypothetical examples are meant to highlight the ongoing costs of investing in a fund only and do not reflect any transaction costs, such as sales charges, or redemption or exchange fees. Therefore, the hypothetical calculations are useful in comparing ongoing costs only, and will not help you determine the relative total costs of owning different funds. If transaction costs were included in these calculations, your costs would be higher.
| March 1, 2017 — August 31, 2017 |
| | Account value at the
beginning of the
period ($) | Account value at the
end of the
period ($) | Expenses paid during
the period ($) | Fund’s annualized
expense ratio (%) |
| | Actual | Hypothetical | Actual | Hypothetical | Actual | Hypothetical | Actual |
| Class A | 1,000.00 | 1,000.00 | 1,073.10 | 1,019.96 | 5.43 | 5.30 | 1.04 |
| Class C | 1,000.00 | 1,000.00 | 1,069.00 | 1,016.18 | 9.33 | 9.10 | 1.79 |
| Class K | 1,000.00 | 1,000.00 | 1,073.40 | 1,020.47 | 4.91 | 4.79 | 0.94 |
| Class R | 1,000.00 | 1,000.00 | 1,071.70 | 1,018.70 | 6.74 | 6.56 | 1.29 |
| Class R4 | 1,000.00 | 1,000.00 | 1,074.30 | 1,021.22 | 4.13 | 4.02 | 0.79 |
| Class R5 | 1,000.00 | 1,000.00 | 1,074.80 | 1,021.73 | 3.61 | 3.52 | 0.69 |
| Class T (formerly Class W) | 1,000.00 | 1,000.00 | 1,072.60 | 1,020.06 | 5.33 | 5.19 | 1.02 |
| Class V (formerly Class T) | 1,000.00 | 1,000.00 | 1,072.90 | 1,019.96 | 5.43 | 5.30 | 1.04 |
| Class Y | 1,000.00 | 1,000.00 | 1,075.20 | 1,021.93 | 3.40 | 3.31 | 0.65 |
| Class Z | 1,000.00 | 1,000.00 | 1,074.20 | 1,021.22 | 4.13 | 4.02 | 0.79 |
Expenses paid during the period are equal to the annualized expense ratio for each class as indicated above, multiplied by the average account value over the period and then multiplied by the number of days in the Fund’s most recent fiscal half year and divided by 365.
Expenses do not include fees and expenses incurred indirectly by the Fund from its investment in underlying funds, including affiliated and non-affiliated pooled investment vehicles, such as mutual funds and exchange-traded funds.
| 6 | Columbia Contrarian Core Fund | Annual Report 2017 |
Portfolio of Investments
August 31, 2017
(Percentages represent value of investments compared to net assets)
| Common Stocks 96.2% |
| Issuer | Shares | Value ($) |
| Consumer Discretionary 11.3% |
| Hotels, Restaurants & Leisure 2.6% |
| Marriott International, Inc., Class A | 252,663 | 26,170,834 |
| McDonald’s Corp. | 775,400 | 124,040,738 |
| Royal Caribbean Cruises Ltd. | 238,855 | 29,727,893 |
| Starbucks Corp. | 1,848,350 | 101,400,481 |
| Total | | 281,339,946 |
| Household Durables 0.4% |
| Newell Brands, Inc. | 1,027,705 | 49,617,597 |
| Internet & Direct Marketing Retail 0.6% |
| Expedia, Inc. | 148,140 | 21,978,050 |
| Liberty Interactive Corp., Class A(a) | 1,971,945 | 43,619,424 |
| Total | | 65,597,474 |
| Media 2.9% |
| Comcast Corp., Class A | 6,631,916 | 269,322,109 |
| Walt Disney Co. (The) | 419,230 | 42,426,076 |
| Total | | 311,748,185 |
| Multiline Retail 0.7% |
| Dollar General Corp. | 1,024,045 | 74,304,705 |
| Specialty Retail 2.1% |
| AutoZone, Inc.(a) | 55,221 | 29,180,985 |
| Lowe’s Companies, Inc. | 2,672,269 | 197,453,957 |
| Total | | 226,634,942 |
| Textiles, Apparel & Luxury Goods 2.0% |
| Coach, Inc. | 2,477,920 | 103,329,264 |
| PVH Corp. | 926,953 | 116,694,113 |
| Total | | 220,023,377 |
| Total Consumer Discretionary | 1,229,266,226 |
| Consumer Staples 6.6% |
| Beverages 1.5% |
| PepsiCo, Inc. | 1,436,875 | 166,289,544 |
| Food & Staples Retailing 1.3% |
| CVS Health Corp. | 527,081 | 40,764,444 |
| SYSCO Corp. | 1,993,565 | 105,001,069 |
| Total | | 145,765,513 |
| Food Products 0.9% |
| Kellogg Co. | 1,484,275 | 97,160,642 |
| Common Stocks (continued) |
| Issuer | Shares | Value ($) |
| Tobacco 2.9% |
| Philip Morris International, Inc. | 2,693,225 | 314,918,799 |
| Total Consumer Staples | 724,134,498 |
| Energy 6.5% |
| Energy Equipment & Services 0.9% |
| Halliburton Co. | 2,638,154 | 102,808,861 |
| Oil, Gas & Consumable Fuels 5.6% |
| Canadian Natural Resources Ltd. | 4,356,664 | 134,272,384 |
| Chevron Corp. | 1,567,713 | 168,717,273 |
| EOG Resources, Inc. | 1,167,828 | 99,253,702 |
| Exxon Mobil Corp. | 2,717,235 | 207,406,548 |
| Total | | 609,649,907 |
| Total Energy | 712,458,768 |
| Financials 17.1% |
| Banks 8.3% |
| Citigroup, Inc. | 4,866,786 | 331,087,452 |
| JPMorgan Chase & Co. | 3,677,188 | 334,219,617 |
| Wells Fargo & Co. | 4,599,458 | 234,894,320 |
| Total | | 900,201,389 |
| Capital Markets 4.4% |
| Bank of New York Mellon Corp. (The) | 4,426,431 | 231,413,813 |
| BlackRock, Inc. | 64,267 | 26,928,516 |
| Invesco Ltd. | 724,859 | 23,760,878 |
| Morgan Stanley | 3,500,285 | 159,262,967 |
| S&P Global, Inc. | 283,050 | 43,683,106 |
| Total | | 485,049,280 |
| Diversified Financial Services 3.2% |
| Berkshire Hathaway, Inc., Class B(a) | 1,911,413 | 346,271,579 |
| Insurance 1.2% |
| Aon PLC | 945,650 | 131,596,654 |
| Total Financials | 1,863,118,902 |
The accompanying Notes to Financial Statements are an integral part of this statement.
Columbia Contrarian Core Fund | Annual Report 2017
| 7 |
Portfolio of Investments (continued)
August 31, 2017
| Common Stocks (continued) |
| Issuer | Shares | Value ($) |
| Health Care 17.1% |
| Biotechnology 4.0% |
| Alexion Pharmaceuticals, Inc.(a) | 375,310 | 53,447,897 |
| Biogen, Inc.(a) | 557,285 | 176,414,140 |
| Celgene Corp.(a) | 1,282,541 | 178,183,421 |
| Vertex Pharmaceuticals, Inc.(a) | 206,221 | 33,106,719 |
| Total | | 441,152,177 |
| Health Care Equipment & Supplies 2.7% |
| Abbott Laboratories | 2,448,709 | 124,737,237 |
| Medtronic PLC | 1,357,392 | 109,432,943 |
| Zimmer Biomet Holdings, Inc. | 507,310 | 57,970,314 |
| Total | | 292,140,494 |
| Health Care Providers & Services 4.0% |
| Anthem, Inc. | 664,445 | 130,257,798 |
| Cardinal Health, Inc. | 1,947,483 | 131,377,203 |
| CIGNA Corp. | 944,720 | 171,995,723 |
| Total | | 433,630,724 |
| Pharmaceuticals 6.4% |
| Allergan PLC | 579,640 | 133,015,787 |
| Bristol-Myers Squibb Co. | 1,358,115 | 82,138,795 |
| Johnson & Johnson | 2,170,111 | 287,257,593 |
| Pfizer, Inc. | 5,846,200 | 198,303,104 |
| Total | | 700,715,279 |
| Total Health Care | 1,867,638,674 |
| Industrials 7.5% |
| Air Freight & Logistics 2.2% |
| FedEx Corp. | 1,138,931 | 244,164,028 |
| Building Products 0.8% |
| Johnson Controls International PLC | 2,095,718 | 82,969,475 |
| Electrical Equipment 0.7% |
| Eaton Corp. PLC | 1,087,251 | 78,021,132 |
| Industrial Conglomerates 3.3% |
| General Electric Co. | 4,113,055 | 100,975,500 |
| Honeywell International, Inc. | 1,823,624 | 252,152,491 |
| Total | | 353,127,991 |
| Common Stocks (continued) |
| Issuer | Shares | Value ($) |
| Professional Services 0.5% |
| Nielsen Holdings PLC | 1,500,535 | 58,295,785 |
| Total Industrials | 816,578,411 |
| Information Technology 23.0% |
| Communications Equipment 1.5% |
| Cisco Systems, Inc. | 4,401,440 | 141,770,383 |
| Palo Alto Networks, Inc.(a) | 123,935 | 16,444,935 |
| Total | | 158,215,318 |
| Internet Software & Services 6.3% |
| Alphabet, Inc., Class A(a) | 156,518 | 149,512,254 |
| Alphabet, Inc., Class C(a) | 258,077 | 242,419,468 |
| Facebook, Inc., Class A(a) | 1,733,375 | 298,088,499 |
| Total | | 690,020,221 |
| IT Services 3.9% |
| Fidelity National Information Services, Inc. | 1,377,510 | 127,998,229 |
| FleetCor Technologies, Inc.(a) | 101,974 | 14,660,802 |
| MasterCard, Inc., Class A | 1,558,114 | 207,696,596 |
| Total System Services, Inc. | 1,011,000 | 69,880,320 |
| Total | | 420,235,947 |
| Semiconductors & Semiconductor Equipment 2.1% |
| Broadcom Ltd. | 846,955 | 213,491,947 |
| MACOM Technology Solutions Holdings, Inc.(a) | 383,742 | 17,475,611 |
| Total | | 230,967,558 |
| Software 4.6% |
| Activision Blizzard, Inc. | 2,150,885 | 141,012,021 |
| Electronic Arts, Inc.(a) | 230,211 | 27,970,636 |
| Microsoft Corp. | 4,453,597 | 332,995,448 |
| Total | | 501,978,105 |
| Technology Hardware, Storage & Peripherals 4.6% |
| Apple, Inc. | 3,041,051 | 498,732,364 |
| Total Information Technology | 2,500,149,513 |
| Materials 1.8% |
| Chemicals 1.0% |
| Sherwin-Williams Co. (The) | 323,854 | 109,873,946 |
The accompanying Notes to Financial Statements are an integral part of this statement.
| 8 | Columbia Contrarian Core Fund | Annual Report 2017 |
Portfolio of Investments (continued)
August 31, 2017
| Common Stocks (continued) |
| Issuer | Shares | Value ($) |
| Containers & Packaging 0.8% |
| Ball Corp. | 717,450 | 28,690,826 |
| Sealed Air Corp. | 1,174,540 | 52,126,085 |
| Total | | 80,816,911 |
| Total Materials | 190,690,857 |
| Real Estate 1.5% |
| Equity Real Estate Investment Trusts (REITS) 1.5% |
| American Tower Corp. | 1,140,022 | 168,780,257 |
| Total Real Estate | 168,780,257 |
| Telecommunication Services 2.5% |
| Diversified Telecommunication Services 2.5% |
| AT&T, Inc. | 4,870,100 | 182,433,946 |
| Verizon Communications, Inc. | 1,764,608 | 84,648,246 |
| Total | | 267,082,192 |
| Total Telecommunication Services | 267,082,192 |
| Utilities 1.3% |
| Electric Utilities 1.3% |
| Edison International | 452,117 | 36,250,741 |
| Southern Co. (The) | 2,161,365 | 104,307,475 |
| Total | | 140,558,216 |
| Total Utilities | 140,558,216 |
Total Common Stocks
(Cost $7,538,845,241) | 10,480,456,514 |
|
| Money Market Funds 3.9% |
| | Shares | Value ($) |
| Columbia Short-Term Cash Fund, 1.146%(b),(c) | 424,293,769 | 424,293,769 |
Total Money Market Funds
(Cost $424,274,369) | 424,293,769 |
Total Investments
(Cost: $7,963,119,610) | 10,904,750,283 |
| Other Assets & Liabilities, Net | | (12,487,795) |
| Net Assets | 10,892,262,488 |
Notes to Portfolio of Investments
| (a) | Non-income producing investment. |
| (b) | The rate shown is the seven-day current annualized yield at August 31, 2017. |
| (c) | As defined in the Investment Company Act of 1940, an affiliated company is one in which the Fund owns 5% or more of the company’s outstanding voting securities, or a company which is under common ownership or control with the Fund. Holdings and transactions in these affiliated companies during the year ended August 31, 2017 are as follows: |
| Issuer | Beginning
shares | Shares
purchased | Shares
sold | Ending
shares | Realized gain
(loss) ($) | Net change in
unrealized
appreciation
(depreciation) ($) | Dividends —
affiliated
issuers($) | Value ($) |
| Columbia Short-Term Cash Fund, 1.146% | 305,769,244 | 2,154,536,319 | (2,036,011,794) | 424,293,769 | (26,117) | 19,400 | 2,120,968 | 424,293,769 |
Fair value measurements
The Fund categorizes its fair value measurements according to a three-level hierarchy that maximizes the use of observable inputs and minimizes the use of unobservable inputs by prioritizing that the most observable input be used when available. Observable inputs are those that market participants would use in pricing an investment based on market data obtained from sources independent of the reporting entity. Unobservable inputs are those that reflect the Fund’s assumptions about the information market participants would use in
The accompanying Notes to Financial Statements are an integral part of this statement.
Columbia Contrarian Core Fund | Annual Report 2017
| 9 |
Portfolio of Investments (continued)
August 31, 2017
Fair value measurements (continued)
pricing an investment. An investment’s level within the fair value hierarchy is based on the lowest level of any input that is deemed significant to the asset’s or liability’s fair value measurement. The input levels are not necessarily an indication of the risk or liquidity associated with investments at that level. For example, certain U.S. government securities are generally high quality and liquid, however, they are reflected as Level 2 because the inputs used to determine fair value may not always be quoted prices in an active market.
Fair value inputs are summarized in the three broad levels listed below:
| • | Level 1 – Valuations based on quoted prices for investments in active markets that the Fund has the ability to access at the measurement date. Valuation adjustments are not applied to Level 1 investments. |
| • | Level 2 – Valuations based on other significant observable inputs (including quoted prices for similar securities, interest rates, prepayment speeds, credit risks, etc.). |
| • | Level 3 – Valuations based on significant unobservable inputs (including the Fund’s own assumptions and judgment in determining the fair value of investments). |
Inputs that are used in determining fair value of an investment may include price information, credit data, volatility statistics, and other factors. These inputs can be either observable or unobservable. The availability of observable inputs can vary between investments, and is affected by various factors such as the type of investment, and the volume and level of activity for that investment or similar investments in the marketplace. The inputs will be considered by the Investment Manager, along with any other relevant factors in the calculation of an investment’s fair value. The Fund uses prices and inputs that are current as of the measurement date, which may include periods of market dislocations. During these periods, the availability of prices and inputs may be reduced for many investments. This condition could cause an investment to be reclassified between the various levels within the hierarchy.
Certain investments that have been measured at fair value using the net asset value (NAV) per share (or its equivalent) are not categorized in the fair value hierarchy. The fair value amounts presented in the table are intended to reconcile the fair value hierarchy to the amounts presented in the Portfolio of Investments. The Columbia Short-Term Cash Fund seeks to provide shareholders with maximum current income consistent with liquidity and stability of principal. Columbia Short-Term Cash Fund prices its shares with a floating NAV and no longer seeks to maintain a stable NAV.
Investments falling into the Level 3 category are primarily supported by quoted prices from brokers and dealers participating in the market for those investments. However, these may be classified as Level 3 investments due to lack of market transparency and corroboration to support these quoted prices. Additionally, valuation models may be used as the pricing source for any remaining investments classified as Level 3. These models may rely on one or more significant unobservable inputs and/or significant assumptions by the Investment Manager. Inputs used in valuations may include, but are not limited to, financial statement analysis, capital account balances, discount rates and estimated cash flows, and comparable company data.
Under the direction of the Fund’s Board of Trustees (the Board), the Investment Manager’s Valuation Committee (the Committee) is responsible for overseeing the valuation procedures approved by the Board. The Committee consists of voting and non-voting members from various groups within the Investment Manager’s organization, including operations and accounting, trading and investments, compliance, risk management and legal.
The Committee meets at least monthly to review and approve valuation matters, which may include a description of specific valuation determinations, data regarding pricing information received from approved pricing vendors and brokers and the results of Board-approved valuation control policies and procedures (the Policies). The Policies address, among other things, instances when market quotations are or are not readily available, including recommendations of third party pricing vendors and a determination of appropriate pricing methodologies; events that require specific valuation determinations and assessment of fair value techniques; securities with a potential for stale pricing, including those that are illiquid, restricted, or in default; and the effectiveness of third party pricing vendors, including periodic reviews of vendors. The Committee meets more frequently, as needed, to discuss additional valuation matters, which may include the need to review back-testing results, review time-sensitive information or approve related valuation actions. The Committee reports to the Board, with members of the Committee meeting with the Board at each of its regularly scheduled meetings to discuss valuation matters and actions during the period, similar to those described earlier.
For investments categorized as Level 3, the Committee monitors information similar to that described above, which may include: (i) data specific to the issuer or comparable issuers, (ii) general market or specific sector news and (iii) quoted prices and specific or similar security transactions. The Committee considers this data and any changes from prior periods in order to assess the reasonableness of observable and unobservable inputs, any assumptions or internal models used to value those securities and changes in fair value. This data is also used to corroborate, when available, information received from approved pricing vendors and brokers. Various factors impact the frequency of monitoring this information (which may occur as often as daily). However, the Committee may determine that changes to inputs, assumptions and models are not required as a result of the monitoring procedures performed.
The following table is a summary of the inputs used to value the Fund’s investments at August 31, 2017:
| | Level 1
quoted prices
in active
markets for
identical
assets ($) | Level 2
other
significant
observable
inputs ($) | Level 3
significant
unobservable
inputs ($) | Investments
measured at
net asset
value ($) | Total ($) |
| Investments | | | | | |
| Common Stocks | | | | | |
| Consumer Discretionary | 1,229,266,226 | — | — | — | 1,229,266,226 |
| Consumer Staples | 724,134,498 | — | — | — | 724,134,498 |
| Energy | 712,458,768 | — | — | — | 712,458,768 |
| Financials | 1,863,118,902 | — | — | — | 1,863,118,902 |
| Health Care | 1,867,638,674 | — | — | — | 1,867,638,674 |
| Industrials | 816,578,411 | — | — | — | 816,578,411 |
| Information Technology | 2,500,149,513 | — | — | — | 2,500,149,513 |
| Materials | 190,690,857 | — | — | — | 190,690,857 |
| Real Estate | 168,780,257 | — | — | — | 168,780,257 |
The accompanying Notes to Financial Statements are an integral part of this statement.
| 10 | Columbia Contrarian Core Fund | Annual Report 2017 |
Portfolio of Investments (continued)
August 31, 2017
Fair value measurements (continued)
| | Level 1
quoted prices
in active
markets for
identical
assets ($) | Level 2
other
significant
observable
inputs ($) | Level 3
significant
unobservable
inputs ($) | Investments
measured at
net asset
value ($) | Total ($) |
| Telecommunication Services | 267,082,192 | — | — | — | 267,082,192 |
| Utilities | 140,558,216 | — | — | — | 140,558,216 |
| Total Common Stocks | 10,480,456,514 | — | — | — | 10,480,456,514 |
| Money Market Funds | — | — | — | 424,293,769 | 424,293,769 |
| Total Investments | 10,480,456,514 | — | — | 424,293,769 | 10,904,750,283 |
See the Portfolio of Investments for all investment classifications not indicated in the table.
There were no transfers of financial assets between levels during the period.
The accompanying Notes to Financial Statements are an integral part of this statement.
Columbia Contrarian Core Fund | Annual Report 2017
| 11 |
Statement of Assets and Liabilities
August 31, 2017
| Assets | |
| Investments in unaffiliated issuers, at cost | $7,538,845,241 |
| Investments in affiliated issuers, at cost | 424,274,369 |
| Investments in unaffiliated issuers, at value | 10,480,456,514 |
| Investments in affiliated issuers, at value | 424,293,769 |
| Receivable for: | |
| Investments sold | 30,694,547 |
| Capital shares sold | 11,082,672 |
| Dividends | 18,674,608 |
| Foreign tax reclaims | 81,149 |
| Prepaid expenses | 72,942 |
| Trustees’ deferred compensation plan | 406,825 |
| Total assets | 10,965,763,026 |
| Liabilities | |
| Payable for: | |
| Investments purchased | 62,541,659 |
| Capital shares purchased | 8,487,147 |
| Management services fees | 181,085 |
| Distribution and/or service fees | 36,460 |
| Transfer agent fees | 1,539,163 |
| Plan administration fees | 1,441 |
| Compensation of board members | 2,880 |
| Compensation of chief compliance officer | 732 |
| Other expenses | 303,146 |
| Trustees’ deferred compensation plan | 406,825 |
| Total liabilities | 73,500,538 |
| Net assets applicable to outstanding capital stock | $10,892,262,488 |
| Represented by | |
| Paid in capital | 7,503,609,394 |
| Undistributed net investment income | 64,041,928 |
| Accumulated net realized gain | 382,980,493 |
| Unrealized appreciation (depreciation) on: | |
| Investments - unaffiliated issuers | 2,941,611,273 |
| Investments - affiliated issuers | 19,400 |
| Total - representing net assets applicable to outstanding capital stock | $10,892,262,488 |
The accompanying Notes to Financial Statements are an integral part of this statement.
| 12 | Columbia Contrarian Core Fund | Annual Report 2017 |
Statement of Assets and Liabilities (continued)
August 31, 2017
| Class A | |
| Net assets | $1,941,061,841 |
| Shares outstanding | 76,378,059 |
| Net asset value per share | $25.41 |
| Maximum offering price per share(a) | $26.96 |
| Class C | |
| Net assets | $748,147,943 |
| Shares outstanding | 32,406,315 |
| Net asset value per share | $23.09 |
| Class K | |
| Net assets | $6,282,641 |
| Shares outstanding | 245,584 |
| Net asset value per share | $25.58 |
| Class R | |
| Net assets | $132,392,329 |
| Shares outstanding | 5,210,921 |
| Net asset value per share | $25.41 |
| Class R4 | |
| Net assets | $596,703,706 |
| Shares outstanding | 22,932,510 |
| Net asset value per share | $26.02 |
| Class R5 | |
| Net assets | $779,002,230 |
| Shares outstanding | 29,947,267 |
| Net asset value per share | $26.01 |
| Class T(b) | |
| Net assets | $1,356,520 |
| Shares outstanding | 53,383 |
| Net asset value per share | $25.41 |
| Maximum offering price per share(c) | $26.06 |
| Class V(d) | |
| Net assets | $154,392,300 |
| Shares outstanding | 6,131,216 |
| Net asset value per share | $25.18 |
| Maximum offering price per share(e) | $26.72 |
| Class Y | |
| Net assets | $1,574,824,274 |
| Shares outstanding | 60,510,665 |
| Net asset value per share | $26.03 |
| Class Z | |
| Net assets | $4,958,098,704 |
| Shares outstanding | 193,592,317 |
| Net asset value per share | $25.61 |
| (a) | The maximum offering price per share is calculated by dividing the net asset value per share by 1.0 minus the maximum sales charge of 5.75% for Class A. |
| (b) | Prior to March 27, 2017, Class T shares were known as Class W shares. |
| (c) | The maximum offering price per share is calculated by dividing the net asset value per share by 1.0 minus the maximum sales charge of 2.50% for Class T. |
| (d) | Prior to January 24, 2017, Class V shares were known as Class T shares. |
| (e) | The maximum offering price per share is calculated by dividing the net asset value per share by 1.0 minus the maximum sales charge of 5.75% for Class V. |
The accompanying Notes to Financial Statements are an integral part of this statement.
Columbia Contrarian Core Fund | Annual Report 2017
| 13 |
Statement of Operations
Year Ended August 31, 2017
| Net investment income | |
| Income: | |
| Dividends — unaffiliated issuers | $188,454,539 |
| Dividends — affiliated issuers | 2,120,968 |
| Foreign taxes withheld | (363,863) |
| Total income | 190,211,644 |
| Expenses: | |
| Management services fees | 62,449,221 |
| Distribution and/or service fees | |
| Class A | 6,061,118 |
| Class B(a) | 38,763 |
| Class C | 7,086,541 |
| Class R | 569,474 |
| Class T(b) | 165,466 |
| Class V(c) | 371,584 |
| Transfer agent fees | |
| Class A | 3,967,584 |
| Class B(a) | 6,356 |
| Class C | 1,157,567 |
| Class I(d) | 7,946 |
| Class K | 3,168 |
| Class R | 185,891 |
| Class R4 | 757,184 |
| Class R5 | 376,866 |
| Class T(b) | 109,790 |
| Class V(c) | 242,878 |
| Class Y | 47,788 |
| Class Z | 7,884,001 |
| Plan administration fees | |
| Class K | 13,931 |
| Compensation of board members | 202,340 |
| Custodian fees | 63,445 |
| Printing and postage fees | 595,248 |
| Registration fees | 621,673 |
| Audit fees | 38,115 |
| Legal fees | 296,879 |
| Compensation of chief compliance officer | 4,444 |
| Other | 238,288 |
| Total expenses | 93,563,549 |
| Expense reduction | (14,065) |
| Total net expenses | 93,549,484 |
| Net investment income | 96,662,160 |
| Realized and unrealized gain (loss) — net | |
| Net realized gain (loss) on: | |
| Investments — unaffiliated issuers | 476,663,247 |
| Investments — affiliated issuers | (26,117) |
| Foreign currency translations | 8,644 |
| Net realized gain | 476,645,774 |
| Net change in unrealized appreciation (depreciation) on: | |
| Investments — unaffiliated issuers | 930,021,745 |
| Investments — affiliated issuers | 19,400 |
| Foreign currency translations | 2 |
| Net change in unrealized appreciation (depreciation) | 930,041,147 |
| Net realized and unrealized gain | 1,406,686,921 |
| Net increase in net assets resulting from operations | $1,503,349,081 |
The accompanying Notes to Financial Statements are an integral part of this statement.
| 14 | Columbia Contrarian Core Fund | Annual Report 2017 |
Statement of Operations (continued)
Year Ended August 31, 2017
| (a) | Effective July 17, 2017, Class B shares were automatically converted to Class A shares. |
| (b) | Prior to March 27, 2017, Class T shares were known as Class W shares. |
| (c) | Prior to January 24, 2017, Class V shares were known as Class T shares. |
| (d) | Effective March 27, 2017, Class I shares were redeemed or exchanged for Class Y shares. |
The accompanying Notes to Financial Statements are an integral part of this statement.
Columbia Contrarian Core Fund | Annual Report 2017
| 15 |
Statement of Changes in Net Assets
| | Year Ended
August 31, 2017 | Year Ended
August 31, 2016 |
| Operations | | |
| Net investment income | $96,662,160 | $62,122,462 |
| Net realized gain | 476,645,774 | 8,905,471 |
| Net change in unrealized appreciation (depreciation) | 930,041,147 | 815,597,430 |
| Net increase in net assets resulting from operations | 1,503,349,081 | 886,625,363 |
| Distributions to shareholders | | |
| Net investment income | | |
| Class A | (19,193,883) | (61,603,501) |
| Class B(a) | — | (169,643) |
| Class C | (1) | (9,230,922) |
| Class I(b) | (3,453,777) | (11,959,112) |
| Class K | (40,230) | (3,093) |
| Class R | (451,640) | (1,343,578) |
| Class R4 | (3,562,542) | (7,021,383) |
| Class R5 | (5,967,141) | (11,778,388) |
| Class T(c) | (843,456) | (1,414,819) |
| Class V(d) | (968,097) | (3,614,625) |
| Class Y | (3,854,161) | (1,957,696) |
| Class Z | (38,846,630) | (65,021,880) |
| Net realized gains | | |
| Class A | (21,919,791) | (71,377,749) |
| Class B(a) | (42,890) | (281,084) |
| Class C | (5,729,742) | (15,383,736) |
| Class I(b) | (2,474,135) | (11,792,193) |
| Class K | (39,271) | (3,406) |
| Class R | (797,594) | (1,730,183) |
| Class R4 | (3,005,305) | (7,412,136) |
| Class R5 | (4,473,015) | (11,842,976) |
| Class T(c) | (958,481) | (1,639,301) |
| Class V(d) | (1,115,823) | (4,210,566) |
| Class Y | (2,760,953) | (1,934,742) |
| Class Z | (32,770,414) | (68,474,886) |
| Total distributions to shareholders | (153,268,972) | (371,201,598) |
| Increase (decrease) in net assets from capital stock activity | (392,465,869) | 3,228,540,706 |
| Total increase in net assets | 957,614,240 | 3,743,964,471 |
| Net assets at beginning of year | 9,934,648,248 | 6,190,683,777 |
| Net assets at end of year | $10,892,262,488 | $9,934,648,248 |
| Undistributed net investment income | $64,041,928 | $45,532,775 |
| (a) | Effective July 17, 2017, Class B shares were automatically converted to Class A shares. |
| (b) | Effective March 27, 2017, Class I shares were redeemed or exchanged for Class Y shares. |
| (c) | Prior to March 27, 2017, Class T shares were known as Class W shares. |
| (d) | Prior to January 24, 2017, Class V shares were known as Class T shares. |
The accompanying Notes to Financial Statements are an integral part of this statement.
| 16 | Columbia Contrarian Core Fund | Annual Report 2017 |
Statement of Changes in Net Assets (continued)
| | Year Ended | Year Ended |
| | August 31, 2017 | August 31, 2016 |
| | Shares | Dollars ($) | Shares | Dollars ($) |
| Capital stock activity |
| Class A(a) | | | | |
| Subscriptions (b) | 24,532,402 | 567,339,209 | 48,128,391 | 1,017,079,358 |
| Fund reorganization | — | — | 2,911,441 | 60,325,156 |
| Distributions reinvested | 1,703,138 | 38,796,444 | 6,161,108 | 126,980,438 |
| Redemptions | (78,222,523) | (1,845,678,165) | (36,847,943) | (778,168,494) |
| Net increase (decrease) | (51,986,983) | (1,239,542,512) | 20,352,997 | 426,216,458 |
| Class B(a) | | | | |
| Subscriptions | 10,229 | 211,772 | 45,719 | 884,791 |
| Distributions reinvested | 2,033 | 42,206 | 23,557 | 443,344 |
| Redemptions (b) | (309,670) | (6,756,778) | (264,258) | (5,049,400) |
| Net decrease | (297,408) | (6,502,800) | (194,982) | (3,721,265) |
| Class C | | | | |
| Subscriptions | 8,279,732 | 176,276,614 | 14,095,386 | 272,495,550 |
| Fund reorganization | — | — | 1,127,343 | 21,281,992 |
| Distributions reinvested | 237,660 | 4,945,710 | 1,091,134 | 20,578,795 |
| Redemptions | (9,109,741) | (195,062,192) | (4,401,923) | (85,094,434) |
| Net increase (decrease) | (592,349) | (13,839,868) | 11,911,940 | 229,261,903 |
| Class I(c) | | | | |
| Subscriptions | 619,606 | 13,527,383 | 4,361,594 | 90,879,128 |
| Fund reorganization | — | — | 94 | 1,955 |
| Distributions reinvested | 258,970 | 5,927,821 | 1,147,398 | 23,751,142 |
| Redemptions | (16,890,162) | (398,885,486) | (9,376,151) | (201,335,473) |
| Net decrease | (16,011,586) | (379,430,282) | (3,867,065) | (86,703,248) |
| Class K | | | | |
| Subscriptions | 18,689 | 455,856 | 248,597 | 5,280,131 |
| Distributions reinvested | 3,468 | 79,454 | 306 | 6,336 |
| Redemptions | (13,564) | (307,763) | (17,292) | (383,527) |
| Net increase | 8,593 | 227,547 | 231,611 | 4,902,940 |
| Class R | | | | |
| Subscriptions | 2,442,785 | 57,295,465 | 2,493,106 | 52,783,290 |
| Fund reorganization | — | — | 348,131 | 7,216,396 |
| Distributions reinvested | 40,077 | 914,165 | 102,297 | 2,112,434 |
| Redemptions | (1,605,994) | (37,805,368) | (963,209) | (20,257,607) |
| Net increase | 876,868 | 20,404,262 | 1,980,325 | 41,854,513 |
| Class R4 | | | | |
| Subscriptions | 10,776,230 | 260,548,555 | 8,232,471 | 177,759,473 |
| Fund reorganization | — | — | 364,058 | 7,717,423 |
| Distributions reinvested | 279,486 | 6,506,429 | 682,566 | 14,368,022 |
| Redemptions | (4,694,624) | (112,458,762) | (3,193,911) | (69,241,659) |
| Net increase | 6,361,092 | 154,596,222 | 6,085,184 | 130,603,259 |
| Class R5 | | | | |
| Subscriptions | 11,090,361 | 270,140,698 | 19,032,190 | 414,631,025 |
| Fund reorganization | — | — | 926,239 | 19,625,841 |
| Distributions reinvested | 448,671 | 10,436,073 | 1,117,699 | 23,505,208 |
| Redemptions | (9,119,270) | (216,839,757) | (9,009,812) | (190,228,689) |
| Net increase | 2,419,762 | 63,737,014 | 12,066,316 | 267,533,385 |
| Class T(d) | | | | |
| Subscriptions | 1,447,862 | 32,641,606 | 9,044,630 | 190,637,528 |
| Fund reorganization | — | — | 95 | 1,963 |
| Distributions reinvested | 79,099 | 1,801,867 | 148,179 | 3,053,977 |
| Redemptions | (11,365,827) | (257,363,851) | (4,860,868) | (105,635,402) |
| Net increase (decrease) | (9,838,866) | (222,920,378) | 4,332,036 | 88,058,066 |
The accompanying Notes to Financial Statements are an integral part of this statement.
Columbia Contrarian Core Fund | Annual Report 2017
| 17 |
Statement of Changes in Net Assets (continued)
| | Year Ended | Year Ended |
| | August 31, 2017 | August 31, 2016 |
| | Shares | Dollars ($) | Shares | Dollars ($) |
| Class V(e) | | | | |
| Subscriptions | 49,241 | 1,134,243 | 110,941 | 2,272,788 |
| Distributions reinvested | 64,778 | 1,462,036 | 266,648 | 5,444,949 |
| Redemptions | (633,299) | (14,654,904) | (524,066) | (11,080,577) |
| Net decrease | (519,280) | (12,058,625) | (146,477) | (3,362,840) |
| Class Y(c) | | | | |
| Subscriptions | 49,850,577 | 1,240,699,466 | 12,749,816 | 268,717,492 |
| Fund reorganization | — | — | 65,725 | 1,392,855 |
| Distributions reinvested | 271,473 | 6,314,467 | 132,077 | 2,777,583 |
| Redemptions | (4,056,941) | (98,611,716) | (950,699) | (20,822,683) |
| Net increase | 46,065,109 | 1,148,402,217 | 11,996,919 | 252,065,247 |
| Class Z | | | | |
| Subscriptions | 85,852,060 | 2,044,682,517 | 56,743,145 | 1,206,996,663 |
| Fund reorganization | — | — | 59,654,609 | 1,245,149,414 |
| Distributions reinvested | 2,284,114 | 52,351,890 | 4,076,451 | 84,504,832 |
| Redemptions | (83,135,098) | (2,002,573,073) | (30,828,122) | (654,818,621) |
| Net increase | 5,001,076 | 94,461,334 | 89,646,083 | 1,881,832,288 |
| Total net increase (decrease) | (18,513,972) | (392,465,869) | 154,394,887 | 3,228,540,706 |
| (a) | Effective July 17, 2017, Class B shares were automatically converted to Class A shares. |
| (b) | Includes conversions of Class B shares to Class A shares, if any. |
| (c) | Effective March 27, 2017, Class I shares were redeemed or exchanged for Class Y shares. |
| (d) | Prior to March 27, 2017, Class T shares were known as Class W shares. |
| (e) | Prior to January 24, 2017, Class V shares were known as Class T shares. |
The accompanying Notes to Financial Statements are an integral part of this statement.
| 18 | Columbia Contrarian Core Fund | Annual Report 2017 |
[THIS PAGE INTENTIONALLY LEFT BLANK]
Columbia Contrarian Core Fund | Annual Report 2017
| 19 |
The following table is intended to help you understand the Fund’s financial performance. Certain information reflects financial results for a single share of a class held for the periods shown. Per share net investment income (loss) amounts are calculated based on average shares outstanding during the period. Total return assumes reinvestment of all dividends and distributions, if any. Total return does not reflect payment of sales charges, if any. Total return and portfolio turnover are not annualized for periods of less than one year. The portfolio turnover rate is calculated without regard to purchase and sales transactions of short-term instruments and certain derivatives, if any. If such transactions were included, the Fund’s portfolio turnover rate may be higher.
| Year ended | Net asset value,
beginning of
period | Net
investment
income
(loss) | Net
realized
and
unrealized
gain (loss) | Total from
investment
operations | Distributions
from net
investment
income | Distributions
from net
realized
gains |
| Class A |
| 8/31/2017 | $22.29 | 0.19 | 3.25 | 3.44 | (0.15) | (0.17) |
| 8/31/2016 | $21.27 | 0.15 | 2.05 | 2.20 | (0.55) | (0.63) |
| 8/31/2015 | $22.37 | 0.65 (d) | (0.23) | 0.42 | (0.10) | (1.42) |
| 8/31/2014 | $19.15 | 0.14 | 4.32 | 4.46 | (0.11) | (1.13) |
| 8/31/2013 | $15.68 | 0.13 | 3.48 | 3.61 | (0.12) | (0.02) |
| Class C |
| 8/31/2017 | $20.28 | 0.01 | 2.97 | 2.98 | (0.00) (e) | (0.17) |
| 8/31/2016 | $19.43 | (0.00) (e) | 1.86 | 1.86 | (0.38) | (0.63) |
| 8/31/2015 | $20.62 | 0.50 (d) | (0.27) | 0.23 | — | (1.42) |
| 8/31/2014 | $17.77 | (0.01) | 3.99 | 3.98 | — | (1.13) |
| 8/31/2013 | $14.55 | (0.00) (e) | 3.25 | 3.25 | (0.01) | (0.02) |
| Class K |
| 8/31/2017 | $22.43 | 0.22 | 3.28 | 3.50 | (0.18) | (0.17) |
| 8/31/2016 | $21.40 | 0.23 | 2.01 | 2.24 | (0.58) | (0.63) |
| 8/31/2015 | $22.50 | 0.61 (d) | (0.16) | 0.45 | (0.13) | (1.42) |
| 8/31/2014 | $19.26 | 0.17 | 4.33 | 4.50 | (0.13) | (1.13) |
| 8/31/2013 | $15.77 | 0.15 | 3.51 | 3.66 | (0.15) | (0.02) |
| Class R |
| 8/31/2017 | $22.29 | 0.14 | 3.25 | 3.39 | (0.10) | (0.17) |
| 8/31/2016 | $21.26 | 0.10 | 2.05 | 2.15 | (0.49) | (0.63) |
| 8/31/2015 | $22.37 | 0.65 (d) | (0.29) | 0.36 | (0.05) | (1.42) |
| 8/31/2014 | $19.15 | 0.09 | 4.32 | 4.41 | (0.06) | (1.13) |
| 8/31/2013 | $15.68 | 0.08 | 3.49 | 3.57 | (0.08) | (0.02) |
| Class R4 |
| 8/31/2017 | $22.81 | 0.26 | 3.33 | 3.59 | (0.21) | (0.17) |
| 8/31/2016 | $21.74 | 0.21 | 2.09 | 2.30 | (0.60) | (0.63) |
| 8/31/2015 | $22.83 | 0.80 (d) | (0.32) | 0.48 | (0.15) | (1.42) |
| 8/31/2014 | $19.52 | 0.20 | 4.40 | 4.60 | (0.16) | (1.13) |
| 8/31/2013 (f) | $15.84 | 0.16 | 3.70 | 3.86 | (0.16) | (0.02) |
The accompanying Notes to Financial Statements are an integral part of this statement.
| 20 | Columbia Contrarian Core Fund | Annual Report 2017 |
Total
distributions to
shareholders | Net
asset
value,
end of
period | Total
return | Total gross
expense
ratio to
average
net assets(a) | Total net
expense
ratio to
average
net assets(a),(b) | Net investment
income (loss)
ratio to
average
net assets | Portfolio
turnover | Net
assets,
end of
period
(000’s) |
| |
| (0.32) | $25.41 | 15.61% | 1.04% | 1.04% (c) | 0.82% | 52% | $1,941,062 |
| (1.18) | $22.29 | 10.79% | 1.07% | 1.07% (c) | 0.72% | 47% | $2,860,806 |
| (1.52) | $21.27 | 1.99% | 1.09% | 1.09% (c) | 2.93% | 60% | $2,297,176 |
| (1.24) | $22.37 | 24.15% | 1.11% | 1.11% (c) | 0.69% | 65% | $1,659,841 |
| (0.14) | $19.15 | 23.23% | 1.15% | 1.14% (c) | 0.73% | 47% | $913,212 |
| |
| (0.17) | $23.09 | 14.80% | 1.79% | 1.79% (c) | 0.07% | 52% | $748,148 |
| (1.01) | $20.28 | 9.98% | 1.83% | 1.83% (c) | (0.02%) | 47% | $669,226 |
| (1.42) | $19.43 | 1.17% | 1.85% | 1.85% (c) | 2.46% | 60% | $409,798 |
| (1.13) | $20.62 | 23.22% | 1.86% | 1.86% (c) | (0.06%) | 65% | $222,834 |
| (0.03) | $17.77 | 22.36% | 1.90% | 1.89% (c) | (0.02%) | 47% | $115,940 |
| |
| (0.35) | $25.58 | 15.78% | 0.94% | 0.94% | 0.92% | 52% | $6,283 |
| (1.21) | $22.43 | 10.92% | 0.95% | 0.95% | 1.08% | 47% | $5,317 |
| (1.55) | $21.40 | 2.12% | 0.96% | 0.96% | 2.73% | 60% | $115 |
| (1.26) | $22.50 | 24.27% | 0.97% | 0.97% | 0.81% | 65% | $113 |
| (0.17) | $19.26 | 23.40% | 1.00% | 1.00% | 0.87% | 47% | $144 |
| |
| (0.27) | $25.41 | 15.34% | 1.29% | 1.29% (c) | 0.57% | 52% | $132,392 |
| (1.12) | $22.29 | 10.55% | 1.32% | 1.32% (c) | 0.49% | 47% | $96,586 |
| (1.47) | $21.26 | 1.69% | 1.34% | 1.34% (c) | 2.93% | 60% | $50,048 |
| (1.19) | $22.37 | 23.86% | 1.36% | 1.36% (c) | 0.44% | 65% | $30,291 |
| (0.10) | $19.15 | 22.93% | 1.39% | 1.39% (c) | 0.46% | 47% | $13,102 |
| |
| (0.38) | $26.02 | 15.91% | 0.80% | 0.80% (c) | 1.07% | 52% | $596,704 |
| (1.23) | $22.81 | 11.07% | 0.82% | 0.82% (c) | 0.99% | 47% | $377,946 |
| (1.57) | $21.74 | 2.25% | 0.85% | 0.85% (c) | 3.53% | 60% | $227,941 |
| (1.29) | $22.83 | 24.44% | 0.86% | 0.86% (c) | 0.94% | 65% | $105,458 |
| (0.18) | $19.52 | 24.61% | 0.89% (g) | 0.89% (c),(g) | 1.04% (g) | 47% | $46,212 |
Columbia Contrarian Core Fund | Annual Report 2017
| 21 |
Financial Highlights (continued)
| Year ended | Net asset value,
beginning of
period | Net
investment
income
(loss) | Net
realized
and
unrealized
gain (loss) | Total from
investment
operations | Distributions
from net
investment
income | Distributions
from net
realized
gains |
| Class R5 |
| 8/31/2017 | $22.80 | 0.28 | 3.33 | 3.61 | (0.23) | (0.17) |
| 8/31/2016 | $21.73 | 0.24 | 2.09 | 2.33 | (0.63) | (0.63) |
| 8/31/2015 | $22.83 | 0.78 (d) | (0.28) | 0.50 | (0.18) | (1.42) |
| 8/31/2014 | $19.52 | 0.23 | 4.39 | 4.62 | (0.18) | (1.13) |
| 8/31/2013 (h) | $15.84 | 0.15 | 3.73 | 3.88 | (0.18) | (0.02) |
| Class T(i) |
| 8/31/2017 | $22.29 | 0.17 | 3.27 | 3.44 | (0.15) | (0.17) |
| 8/31/2016 | $21.27 | 0.15 | 2.05 | 2.20 | (0.55) | (0.63) |
| 8/31/2015 | $22.38 | 0.50 (d) | (0.09) | 0.41 | (0.10) | (1.42) |
| 8/31/2014 | $19.16 | 0.14 | 4.32 | 4.46 | (0.11) | (1.13) |
| 8/31/2013 | $15.69 | 0.13 | 3.48 | 3.61 | (0.12) | (0.02) |
| Class V(j) |
| 8/31/2017 | $22.09 | 0.19 | 3.22 | 3.41 | (0.15) | (0.17) |
| 8/31/2016 | $21.08 | 0.15 | 2.04 | 2.19 | (0.55) | (0.63) |
| 8/31/2015 | $22.19 | 0.55 (d) | (0.15) | 0.40 | (0.09) | (1.42) |
| 8/31/2014 | $19.01 | 0.13 | 4.28 | 4.41 | (0.10) | (1.13) |
| 8/31/2013 | $15.56 | 0.12 | 3.47 | 3.59 | (0.12) | (0.02) |
| Class Y |
| 8/31/2017 | $22.81 | 0.30 | 3.33 | 3.63 | (0.24) | (0.17) |
| 8/31/2016 | $21.75 | 0.27 | 2.06 | 2.33 | (0.64) | (0.63) |
| 8/31/2015 | $22.84 | 1.19 (d) | (0.67) | 0.52 | (0.19) | (1.42) |
| 8/31/2014 | $19.52 | 0.24 | 4.40 | 4.64 | (0.19) | (1.13) |
| 8/31/2013 (k) | $15.84 | 0.24 | 3.64 | 3.88 | (0.18) | (0.02) |
| Class Z |
| 8/31/2017 | $22.45 | 0.25 | 3.29 | 3.54 | (0.21) | (0.17) |
| 8/31/2016 | $21.42 | 0.21 | 2.05 | 2.26 | (0.60) | (0.63) |
| 8/31/2015 | $22.52 | 0.66 (d) | (0.18) | 0.48 | (0.16) | (1.42) |
| 8/31/2014 | $19.27 | 0.19 | 4.35 | 4.54 | (0.16) | (1.13) |
| 8/31/2013 | $15.78 | 0.17 | 3.50 | 3.67 | (0.16) | (0.02) |
| Notes to Financial Highlights |
| (a) | In addition to the fees and expenses that the Fund bears directly, the Fund indirectly bears a pro rata share of the fees and expenses of any other funds in which it invests. Such indirect expenses are not included in the Fund’s reported expense ratios. |
| (b) | Total net expenses include the impact of certain fee waivers/expense reimbursements made by the Investment Manager and certain of its affiliates, if applicable. |
| (c) | The benefits derived from expense reductions had an impact of less than 0.01%. |
| (d) | Net investment income per share includes special dividends. The per share effect of these dividends amounted to: |
| Year ended | Class A | Class C | Class K | Class R | Class R4 | Class R5 | Class T | Class V | Class Y | Class Z |
| 08/31/2015 | $ 0.54 | $ 0.55 | $ 0.47 | $ 0.60 | $ 0.63 | $ 0.58 | $ 0.40 | $ 0.45 | $ 0.96 | $ 0.50 |
| (e) | Rounds to zero. |
| (f) | Class R4 shares commenced operations on November 8, 2012. Per share data and total return reflect activity from that date. |
| (g) | Annualized. |
| (h) | Class R5 shares commenced operations on November 8, 2012. Per share data and total return reflect activity from that date. |
| (i) | Prior to March 27, 2017, Class T shares were known as Class W shares. |
| (j) | Prior to January 24, 2017, Class V shares were known as Class T shares. |
| (k) | Class Y shares commenced operations on November 8, 2012. Per share data and total return reflect activity from that date. |
The accompanying Notes to Financial Statements are an integral part of this statement.
| 22 | Columbia Contrarian Core Fund | Annual Report 2017 |
Total
distributions to
shareholders | Net
asset
value,
end of
period | Total
return | Total gross
expense
ratio to
average
net assets(a) | Total net
expense
ratio to
average
net assets(a),(b) | Net investment
income (loss)
ratio to
average
net assets | Portfolio
turnover | Net
assets,
end of
period
(000’s) |
| |
| (0.40) | $26.01 | 16.05% | 0.69% | 0.69% | 1.17% | 52% | $779,002 |
| (1.26) | $22.80 | 11.22% | 0.70% | 0.70% | 1.12% | 47% | $627,659 |
| (1.60) | $21.73 | 2.34% | 0.71% | 0.71% | 3.45% | 60% | $336,043 |
| (1.31) | $22.83 | 24.60% | 0.73% | 0.73% | 1.08% | 65% | $209,498 |
| (0.20) | $19.52 | 24.75% | 0.75% (g) | 0.75% (g) | 1.01% (g) | 47% | $68,709 |
| |
| (0.32) | $25.41 | 15.62% | 1.04% | 1.04% (c) | 0.74% | 52% | $1,357 |
| (1.18) | $22.29 | 10.79% | 1.07% | 1.07% (c) | 0.71% | 47% | $220,502 |
| (1.52) | $21.27 | 1.95% | 1.09% | 1.09% (c) | 2.26% | 60% | $118,262 |
| (1.24) | $22.38 | 24.15% | 1.10% | 1.10% (c) | 0.67% | 65% | $124,021 |
| (0.14) | $19.16 | 23.21% | 1.14% | 1.14% (c) | 0.73% | 47% | $254,377 |
| |
| (0.32) | $25.18 | 15.61% | 1.04% | 1.04% (c) | 0.82% | 52% | $154,392 |
| (1.18) | $22.09 | 10.83% | 1.08% | 1.08% (c) | 0.71% | 47% | $146,879 |
| (1.51) | $21.08 | 1.92% | 1.11% | 1.11% (c) | 2.49% | 60% | $143,304 |
| (1.23) | $22.19 | 24.06% | 1.16% | 1.16% (c) | 0.63% | 65% | $151,430 |
| (0.14) | $19.01 | 23.22% | 1.20% | 1.19% (c) | 0.68% | 47% | $131,732 |
| |
| (0.41) | $26.03 | 16.14% | 0.65% | 0.65% | 1.23% | 52% | $1,574,824 |
| (1.27) | $22.81 | 11.22% | 0.65% | 0.65% | 1.23% | 47% | $329,514 |
| (1.61) | $21.75 | 2.44% | 0.66% | 0.66% | 5.26% | 60% | $53,246 |
| (1.32) | $22.84 | 24.71% | 0.68% | 0.68% | 1.12% | 65% | $2,514 |
| (0.20) | $19.52 | 24.79% | 0.72% (g) | 0.72% (g) | 1.60% (g) | 47% | $79 |
| |
| (0.38) | $25.61 | 15.95% | 0.80% | 0.80% (c) | 1.07% | 52% | $4,958,099 |
| (1.23) | $22.45 | 11.05% | 0.82% | 0.82% (c) | 0.99% | 47% | $4,234,639 |
| (1.58) | $21.42 | 2.24% | 0.84% | 0.84% (c) | 2.97% | 60% | $2,119,278 |
| (1.29) | $22.52 | 24.45% | 0.86% | 0.86% (c) | 0.93% | 65% | $1,831,114 |
| (0.18) | $19.27 | 23.50% | 0.90% | 0.89% (c) | 0.98% | 47% | $1,315,874 |
Columbia Contrarian Core Fund | Annual Report 2017
| 23 |
Notes to Financial Statements
August 31, 2017
Note 1. Organization
Columbia Contrarian Core Fund (the Fund), a series of Columbia Funds Series Trust I (the Trust), is a diversified fund. The Trust is registered under the Investment Company Act of 1940, as amended (the 1940 Act), as an open-end management investment company organized as a Massachusetts business trust.
Fund shares
The Trust may issue an unlimited number of shares (without par value). Although all share classes generally have identical voting, dividend and liquidation rights, each share class votes separately when required by the Trust’s organizational documents or by law. Different share classes pay different distribution amounts to the extent the expenses of such share classes differ, and distributions in liquidation will be proportional to the net asset value of each share class. Each share class has its own expense and sales charge structure. The Fund offers each of the share classes identified below.
Class A shares are subject to a maximum front-end sales charge of 5.75% based on the initial investment amount. Class A shares purchased without an initial sales charge in accounts aggregating $1 million to $50 million at the time of purchase are subject to a contingent deferred sales charge (CDSC) if the shares are sold within 18 months after purchase, charged as follows: 1.00% CDSC if redeemed within 12 months after purchase, and 0.50% CDSC if redeemed more than 12, but less than 18, months after purchase.
Class B shares of the Fund are no longer offered for sale. When available, Class B shares were subject to a maximum CDSC of 5.00% based upon the holding period after purchase. Effective July 17, 2017, Class B shares were automatically converted to Class A shares without a CDSC. On August 4, 2017, the capital owned by Columbia Management Investment Advisers, LLC in Class B shares was redeemed without a CDSC.
Class C shares are subject to a 1.00% CDSC on shares redeemed within 12 months after purchase.
The Fund no longer accepts investments by new or existing investors in Class I shares. Class I shares, when available, were not subject to sales charges, and were made available only to the Columbia Family of Funds. On March 27, 2017, Class I shares were redeemed or exchanged for Class Y shares of the Fund in a tax free transaction that had no impact on the fees and expenses paid by shareholders.
Class K shares are not subject to sales charges; however, this share class is closed to new investors.
Class R shares are not subject to sales charges and are generally available only to certain retirement plans and other investors as described in the Fund’s prospectus.
Class R4 shares are not subject to sales charges and are generally available only to omnibus retirement plans and certain investors as described in the Fund’s prospectus. Effective November 1, 2017, Class R4 shares will be renamed Advisor Class shares.
Class R5 shares are not subject to sales charges and are generally available only to investors purchasing through authorized investment professionals and omnibus retirement plans as described in the Fund’s prospectus. Effective November 1, 2017, Class R5 shares will be renamed Institutional 2 Class shares.
Class T shares are subject to a maximum front-end sales charge of 2.50% per transaction and must be purchased through financial intermediaries that, by written agreement with Columbia Management Investment Distributors, Inc., are specifically authorized to sell Class T shares. Prior to March 27, 2017, Class T shares were known as Class W shares, were not subject to sales charges, and were generally available only to investors purchasing through authorized investment programs managed by investment professionals, including discretionary managed accounts.
Class V shares are subject to a maximum front-end sales charge of 5.75% based on the investment amount. Class V shares purchased without an initial sales charge in accounts aggregating $1 million to $50 million at the time of purchase are subject to a CDSC if the shares are sold within 18 months after purchase, charged as follows: 1.00% CDSC if redeemed within 12 months after purchase, and 0.50% CDSC if redeemed more than 12, but less than 18, months after purchase.
| 24 | Columbia Contrarian Core Fund | Annual Report 2017 |
Notes to Financial Statements (continued)
August 31, 2017
Class V shares are available only to investors who received (and who have continuously held) Class V shares in connection with previous fund reorganizations. Prior to January 24, 2017, Class V shares were known as Class T shares. Class V shares have no relation to, or connection with, the Fund’s current Class T shares.
Class Y shares are not subject to sales charges and are available to institutional and certain other investors as described in the Fund’s prospectus. Effective November 1, 2017, Class Y shares will be renamed Institutional 3 Class shares.
Class Z shares are not subject to sales charges and are generally available only to eligible investors, which are subject to different investment minimums as described in the Fund’s prospectus. Effective November 1, 2017, Class Z shares will be renamed Institutional Class shares.
Note 2. Summary of significant accounting policies
Basis of preparation
The Fund is an investment company that applies the accounting and reporting guidance in the Financial Accounting Standards Board (FASB) Accounting Standards Codification Topic 946, Financial Services - Investment Companies (ASC 946). The financial statements are prepared in accordance with U.S. generally accepted accounting principles (GAAP), which requires management to make certain estimates and assumptions that affect the reported amounts of assets and liabilities, the disclosure of contingent assets and liabilities at the date of the financial statements and the reported amounts of income and expenses during the reporting period. Actual results could differ from those estimates.
The following is a summary of significant accounting policies followed by the Fund in the preparation of its financial statements.
Security valuation
All equity securities are valued at the close of business of the New York Stock Exchange. Equity securities are valued at the last quoted sales price on the principal exchange or market on which they trade, except for securities traded on the NASDAQ Stock Market, which are valued at the NASDAQ official close price. Unlisted securities or listed securities for which there were no sales during the day are valued at the mean of the latest quoted bid and ask prices on such exchanges or markets.
Foreign equity securities are valued based on the closing price on the foreign exchange in which such securities are primarily traded. If any foreign equity security closing prices are not readily available, the securities are valued at the mean of the latest quoted bid and ask prices on such exchanges or markets. Foreign currency exchange rates are generally determined at 4:00 p.m. Eastern (U.S.) time. Many securities markets and exchanges outside the U.S. close prior to the close of the New York Stock Exchange; therefore, the closing prices for securities in such markets or on such exchanges may not fully reflect events that occur after such close but before the close of the New York Stock Exchange. In those situations, foreign securities will be fair valued pursuant to a policy adopted by the Board of Trustees, including, if available, utilizing a third party pricing service to determine these fair values. The third party pricing service takes into account multiple factors, including, but not limited to, movements in the U.S. securities markets, certain depositary receipts, futures contracts and foreign exchange rates that have occurred subsequent to the close of the foreign exchange or market, to determine a good faith estimate that reasonably reflects the current market conditions as of the close of the New York Stock Exchange. The fair value of a security is likely to be different from the quoted or published price, if available.
Investments in open-end investment companies, including money market funds, are valued at their latest net asset value.
Investments for which market quotations are not readily available, or that have quotations which management believes are not reflective of market value or reliable, are valued at fair value as determined in good faith under procedures approved by and under the general supervision of the Board of Trustees. If a security or class of securities (such as foreign securities) is valued at fair value, such value is likely to be different from the quoted or published price for the security.
The determination of fair value often requires significant judgment. To determine fair value, management may use assumptions including but not limited to future cash flows and estimated risk premiums. Multiple inputs from various sources may be used to determine fair value.
Columbia Contrarian Core Fund | Annual Report 2017
| 25 |
Notes to Financial Statements (continued)
August 31, 2017
GAAP requires disclosure regarding the inputs and valuation techniques used to measure fair value and any changes in valuation inputs or techniques. In addition, investments shall be disclosed by major category. This information is disclosed following the Fund’s Portfolio of Investments.
Foreign currency transactions and translations
The values of all assets and liabilities denominated in foreign currencies are generally translated into U.S. dollars at exchange rates determined at the close of regular trading on the New York Stock Exchange. Net realized and unrealized gains (losses) on foreign currency transactions and translations include gains (losses) arising from the fluctuation in exchange rates between trade and settlement dates on securities transactions, gains (losses) arising from the disposition of foreign currency and currency gains (losses) between the accrual and payment dates on dividends, interest income and foreign withholding taxes.
For financial statement purposes, the Fund does not distinguish that portion of gains (losses) on investments which is due to changes in foreign exchange rates from that which is due to changes in market prices of the investments. Such fluctuations are included with the net realized and unrealized gains (losses) on investments in the Statement of Operations.
Security transactions
Security transactions are accounted for on the trade date. Cost is determined and gains (losses) are based upon the specific identification method for both financial statement and federal income tax purposes.
Income recognition
Corporate actions and dividend income are generally recorded net of any non-reclaimable tax withholdings, on the ex-dividend date or upon receipt of ex-dividend notification in the case of certain foreign securities.
The Fund may receive distributions from holdings in equity securities, business development companies (BDCs), exchange-traded funds (ETFs), limited partnerships (LPs), other regulated investment companies (RICs), and real estate investment trusts (REITs), which report information on the tax character of their distributions annually. These distributions are allocated to dividend income, capital gain and return of capital based on actual information reported. Return of capital is recorded as a reduction of the cost basis of securities held. If the Fund no longer owns the applicable securities, return of capital is recorded as a realized gain. With respect to REITs, to the extent actual information has not yet been reported, estimates for return of capital are made by the Fund’s management. Management’s estimates are subsequently adjusted when the actual character of the distributions is disclosed by the REITs, which could result in a proportionate change in return of capital to shareholders.
Awards from class action litigation are recorded as a reduction of cost basis if the Fund still owns the applicable securities on the payment date. If the Fund no longer owns the applicable securities, the proceeds are recorded as realized gains.
Expenses
General expenses of the Trust are allocated to the Fund and other funds of the Trust based upon relative net assets or other expense allocation methodologies determined by the nature of the expense. Expenses directly attributable to the Fund are charged to the Fund. Expenses directly attributable to a specific class of shares are charged to that share class.
Determination of class net asset value
All income, expenses (other than class-specific expenses, which are charged to that share class, as shown in the Statement of Operations) and realized and unrealized gains (losses) are allocated to each class of the Fund on a daily basis, based on the relative net assets of each class, for purposes of determining the net asset value of each class.
| 26 | Columbia Contrarian Core Fund | Annual Report 2017 |
Notes to Financial Statements (continued)
August 31, 2017
Federal income tax status
The Fund intends to qualify each year as a regulated investment company under Subchapter M of the Internal Revenue Code, as amended, and will distribute substantially all of its taxable income (including net short-term capital gains) and capital gains, if any, for its tax year, and as such will not be subject to federal income taxes. In addition, the Fund intends to distribute in each calendar year substantially all of its net investment income, capital gains and certain other amounts, if any, such that the Fund should not be subject to federal excise tax. Therefore, no federal income or excise tax provision is recorded.
Foreign taxes
The Fund may be subject to foreign taxes on income, gains on investments or currency repatriation, a portion of which may be recoverable. The Fund will accrue such taxes and recoveries, as applicable, based upon its current interpretation of tax rules and regulations that exist in the markets in which it invests.
Realized gains in certain countries may be subject to foreign taxes at the Fund level, based on statutory rates. The Fund accrues for such foreign taxes on realized and unrealized gains at the appropriate rate for each jurisdiction, as applicable. The amount, if any, is disclosed as a liability on the Statement of Assets and Liabilities.
Distributions to shareholders
Distributions from net investment income, if any, are declared and paid annually. Net realized capital gains, if any, are distributed along with the income distribution. Income distributions and capital gain distributions are determined in accordance with federal income tax regulations, which may differ from GAAP.
Guarantees and indemnifications
Under the Trust’s organizational documents and, in some cases, by contract, its officers and trustees are indemnified against certain liabilities arising out of the performance of their duties to the Trust or its funds. In addition, certain of the Fund’s contracts with its service providers contain general indemnification clauses. The Fund’s maximum exposure under these arrangements is unknown since the amount of any future claims that may be made against the Fund cannot be determined, and the Fund has no historical basis for predicting the likelihood of any such claims.
Recent accounting pronouncement
Accounting Standards Update 2017-08 Premium Amortization on Purchased Callable Debt Securities
In March 2017, the Financial Accounting Standards Board issued Accounting Standards Update (ASU) No. 2017-08 Premium Amortization on Purchased Callable Debt Securities. ASU No. 2017-08 updates the accounting standards to shorten the amortization period for certain purchased callable debt securities, held at a premium, to be amortized to the earliest call date. The update applies to securities with explicit, noncontingent call features that are callable at fixed prices and on preset dates. The standard is effective for annual periods beginning after December 15, 2018 and interim periods within those fiscal years. At this time, management is evaluating the implication of this guidance and the impact it will have on the financial statement amounts and footnote disclosures, if any.
Note 3. Fees and other transactions with affiliates
Management services fees
The Fund has entered into a Management Agreement with Columbia Management Investment Advisers, LLC (the Investment Manager), a wholly-owned subsidiary of Ameriprise Financial, Inc. (Ameriprise Financial). Under the Management Agreement, the Investment Manager provides the Fund with investment research and advice, as well as administrative and accounting services. The management services fee is an annual fee that is equal to a percentage of the Fund’s daily net assets that declines from 0.77% to 0.57% as the Fund’s net assets increase. The effective management services fee rate for the year ended August 31, 2017 was 0.61% of the Fund’s average daily net assets.
Columbia Contrarian Core Fund | Annual Report 2017
| 27 |
Notes to Financial Statements (continued)
August 31, 2017
Compensation of board members
Members of the Board of Trustees, who are not officers or employees of the Investment Manager or Ameriprise Financial, are compensated for their services to the Fund as disclosed in the Statement of Operations. These members of the Board of Trustees may participate in a Deferred Compensation Plan (the Plan) which may be terminated at any time. Obligations of the Plan will be paid solely out of the Fund’s assets, and all amounts payable under the Plan constitute a general unsecured obligation of the Fund.
Compensation of Chief Compliance Officer
The Board of Trustees has appointed a Chief Compliance Officer to the Fund in accordance with federal securities regulations. A portion of the Chief Compliance Officer’s total compensation is allocated to the Fund, along with other affiliated funds governed by the Board of Trustees, based on relative net assets. The total amount allocated to all affiliated funds governed by the Board of Trustees will not exceed $40,000 annually.
Transfer agency fees
Under a Transfer and Dividend Disbursing Agent Agreement, Columbia Management Investment Services Corp. (the Transfer Agent), an affiliate of the Investment Manager and a wholly-owned subsidiary of Ameriprise Financial, is responsible for providing transfer agency services to the Fund. The Transfer Agent has contracted with Boston Financial Data Services (BFDS) to serve as sub-transfer agent. The Transfer Agent pays the fees of BFDS for services as sub-transfer agent and BFDS is not entitled to reimbursement for such fees from the Fund (with the exception of out-of-pocket fees).
The Fund pays the Transfer Agent a monthly transfer agency fee based on the number or the average value of accounts, depending on the type of account. In addition, prior to October 1, 2016, the Transfer Agent also received sub-transfer agency fees based on a percentage of the average aggregate value of the Fund’s shares maintained in omnibus accounts (other than omnibus accounts for which American Enterprise Investment Services Inc. is the broker of record or accounts where the beneficial shareholder is a customer of Ameriprise Financial Services, Inc., for which the Transfer Agent receives a per account fee). Effective October 1, 2016, the Fund pays the Transfer Agent a fee for shareholder services based on the number of accounts or on a percentage of the average aggregate value of the Fund’s shares maintained in omnibus accounts up to the lesser of the amount charged by the financial intermediary or a cap established by the Board of Trustees from time to time.
The Transfer Agent also receives compensation from the Fund for various shareholder services and reimbursements for certain out-of-pocket fees. Effective August 1, 2017, total transfer agency fees for Class K, Class R5 and Class Y shares are subject to an annual limitation of not more than 0.07%, 0.07% and 0.02%, respectively, of the average daily net assets attributable to each share class. From January 1, 2017 to July 31, 2017, these limitations were 0.075% for Class K and Class R5 shares and 0.025% for Class I and Class Y shares; and prior to January 1, 2017, the limitation was 0.05% for Class K and Class R5 shares and Class I and Class Y shares did not pay transfer agency fees.
For the year ended August 31, 2017, the Fund’s effective transfer agency fee rates as a percentage of average daily net assets of each class were as follows:
| | Effective rate (%) |
| Class A | 0.16 |
| Class B | 0.15 (a),(b) |
| Class C | 0.16 |
| Class I | 0.00 (b),(c) |
| Class K | 0.06 |
| Class R | 0.16 |
| Class R4 | 0.16 |
| Class R5 | 0.06 |
| Class T | 0.17 |
| Class V | 0.16 |
| Class Y | 0.01 |
| Class Z | 0.16 |
| 28 | Columbia Contrarian Core Fund | Annual Report 2017 |
Notes to Financial Statements (continued)
August 31, 2017
| (a) | Effective July 17, 2017, Class B shares were automatically converted to Class A shares. |
| (b) | Unannualized. |
| (c) | Effective March 27, 2017, Class I shares were redeemed or exchanged for Class Y shares. |
An annual minimum account balance fee of $20 may apply to certain accounts with a value below the applicable share class’s initial minimum investment requirements to reduce the impact of small accounts on transfer agency fees. These minimum account balance fees are remitted to the Fund and recorded as part of expense reductions in the Statement of Operations. For the year ended August 31, 2017, these minimum account balance fees reduced total expenses of the Fund by $14,065.
Plan administration fees
Under a Plan Administration Services Agreement with the Transfer Agent, the Fund pays an annual fee at a rate of 0.25% of the Fund’s average daily net assets attributable to Class K shares for the provision of various administrative, recordkeeping, communication and educational services.
Distribution and service fees
The Fund has entered into an agreement with Columbia Management Investment Distributors, Inc. (the Distributor), an affiliate of the Investment Manager and a wholly-owned subsidiary of Ameriprise Financial, for distribution and shareholder services. The Board of Trustees has approved, and the Fund has adopted, distribution and shareholder service plans (the Plans) applicable to certain share classes, which set the distribution and service fees for the Fund. These fees are calculated daily and are intended to compensate the Distributor and/or eligible selling and/or servicing agents for selling shares of the Fund and providing services to investors.
Under the Plans, the Fund pays a monthly service fee to the Distributor at the maximum annual rate of 0.25% of the average daily net assets attributable to Class A, Class B, Class C and Class T shares of the Fund. Also under the Plans, the Fund pays a monthly distribution fee to the Distributor at the maximum annual rates of 0.10%, 0.75%, 0.75%, 0.50% and 0.25% of the average daily net assets attributable to Class A, Class B, Class C, Class R and Class T shares of the Fund, respectively. As a result of all Class B shares of the Fund being redeemed or converted to Class A shares, August 4, 2017 was the last day the Fund paid a service fee or distribution fee for Class B shares.
Although the Fund may pay distribution and service fees up to a maximum annual rate of 0.35% of the Fund’s average daily net assets attributable to Class A shares (comprised of up to 0.10% for distribution services and up to 0.25% for shareholder liaison services), the Fund currently limits such fees to an aggregate fee of not more than 0.25% of the Fund’s average daily net assets attributable to Class A shares.
Although the Fund may pay a distribution fee up to 0.25% of the Fund’s average daily net assets attributable to Class T shares and a service fee of up to 0.25% of the Fund’s average daily net assets attributable to Class T shares, the aggregate fee shall not exceed 0.25% of the Fund’s average daily net assets attributable to Class T shares.
Shareholder services fees
The Fund has adopted a shareholder services plan that permits it to pay for certain services provided to Class V shareholders by their selling and/or servicing agents. The Fund may pay shareholder servicing fees up to an aggregate annual rate of 0.50% of the Fund’s average daily net assets attributable to Class V shares (comprised of up to 0.25% for shareholder liaison services and up to 0.25% for administrative support services). These fees are currently limited to an aggregate annual rate of not more than 0.25% of the Fund’s average daily net assets attributable to Class V shares.
Columbia Contrarian Core Fund | Annual Report 2017
| 29 |
Notes to Financial Statements (continued)
August 31, 2017
Sales charges (unaudited)
Sales charges, including front-end charges and CDSCs, received by the Distributor for distributing Fund shares for the year ended August 31, 2017, if any, are listed below:
| | Amount ($) |
| Class A | 3,866,422 |
| Class B | 1,158 |
| Class C | 89,124 |
| Class V | 9,201 |
Expenses waived/reimbursed by the Investment Manager and its affiliates
The Investment Manager and certain of its affiliates have contractually agreed to waive fees and/or reimburse expenses (excluding certain fees and expenses described below) for the period(s) disclosed below, unless sooner terminated at the sole discretion of the Board of Trustees, so that the Fund’s net operating expenses, after giving effect to fees waived/expenses reimbursed and any balance credits and/or overdraft charges from the Fund’s custodian, do not exceed the following annual rate(s) as a percentage of the class’ average daily net assets:
| | January 1, 2017
through
December 31, 2017 | Prior to
January 1, 2017 |
| Class A | 1.17% | 1.19% |
| Class C | 1.92 | 1.94 |
| Class K | 1.115 | 1.11 |
| Class R | 1.42 | 1.44 |
| Class R4 | 0.92 | 0.94 |
| Class R5 | 0.865 | 0.86 |
| Class T | 1.17 | 1.19 |
| Class V | 1.17 | 1.19 |
| Class Y | 0.815 | 0.81 |
| Class Z | 0.92 | 0.94 |
Under the agreement governing these fee waivers and/or expense reimbursement arrangements, the following fees and expenses are excluded from the waiver/reimbursement commitment, and therefore will be paid by the Fund, if applicable: taxes (including foreign transaction taxes), expenses associated with investments in affiliated and non-affiliated pooled investment vehicles (including mutual funds and exchange-traded funds), transaction costs and brokerage commissions, costs related to any securities lending program, dividend expenses associated with securities sold short, inverse floater program fees and expenses, transaction charges and interest on borrowed money, interest, infrequent and/or unusual expenses and any other expenses the exclusion of which is specifically approved by the Board of Trustees. This agreement may be modified or amended only with approval from the Investment Manager, certain of its affiliates and the Fund. Any fees waived and/or expenses reimbursed under the expense reimbursement arrangements described above are not recoverable by the Investment Manager or its affiliates in future periods.
Note 4. Federal tax information
The timing and character of income and capital gain distributions are determined in accordance with income tax regulations, which may differ from GAAP because of temporary or permanent book to tax differences.
At August 31, 2017, these differences are primarily due to differing treatment for deferral/reversal of wash sale losses, re-characterization of distributions for investments, trustees’ deferred compensation and foreign currency transactions. To the extent these differences are permanent, reclassifications are made among the components of the Fund’s net assets in the Statement of Assets and Liabilities. Temporary differences do not require reclassifications.
In the Statement of Assets and Liabilities the following reclassifications were made:
| 30 | Columbia Contrarian Core Fund | Annual Report 2017 |
Notes to Financial Statements (continued)
August 31, 2017
Undistributed net
investment
income ($) | Accumulated
net realized
gain ($) | Paid in
capital ($) |
| (971,449) | 971,449 | — |
Net investment income (loss) and net realized gains (losses), as disclosed in the Statement of Operations, and net assets were not affected by this reclassification.
The tax character of distributions paid during the years indicated was as follows:
| August 31, 2017 | August 31, 2016 |
Ordinary
income ($) | Long-term
capital gains ($) | Total ($) | Ordinary
income ($) | Long-term
capital gains ($) | Total ($) |
| 85,458,988 | 67,809,984 | 153,268,972 | 175,118,640 | 196,082,958 | 371,201,598 |
Short-term capital gain distributions, if any, are considered ordinary income distributions for tax purposes.
At August 31, 2017, the components of distributable earnings on a tax basis were as follows:
Undistributed
ordinary income ($) | Undistributed
long-term
capital gains ($) | Capital loss
carryforwards ($) | Net unrealized
appreciation ($) |
| 96,412,519 | 392,781,500 | — | 2,899,865,900 |
At August 31, 2017, the cost of all investments for federal income tax purposes along with the aggregate gross unrealized appreciation and depreciation based on that cost was:
Federal
tax cost ($) | Gross unrealized
appreciation ($) | Gross unrealized
(depreciation) ($) | Net unrealized
appreciation ($) |
| 8,004,884,383 | 2,993,589,622 | (93,723,722) | 2,899,865,900 |
Tax cost of investments and unrealized appreciation/(depreciation) may also include timing differences that do not constitute adjustments to tax basis.
Management of the Fund has concluded that there are no significant uncertain tax positions in the Fund that would require recognition in the financial statements. However, management’s conclusion may be subject to review and adjustment at a later date based on factors including, but not limited to, new tax laws, regulations, and administrative interpretations (including relevant court decisions). Generally, the Fund’s federal tax returns for the prior three fiscal years remain subject to examination by the Internal Revenue Service.
Note 5. Portfolio information
The cost of purchases and proceeds from sales of securities, excluding short-term investments and derivatives, if any, aggregated to $5,136,056,010 and $5,635,376,526, respectively, for the year ended August 31, 2017. The amount of purchase and sale activity impacts the portfolio turnover rate reported in the Financial Highlights.
Note 6. Affiliated money market fund
The Fund invests in Columbia Short-Term Cash Fund, an affiliated money market fund established for the exclusive use by the Fund and other affiliated funds (the Affiliated MMF). The income earned by the Fund from such investments is included as Dividends - affiliated issuers in the Statement of Operations. As an investing fund, the Fund indirectly bears its proportionate share of the expenses of the Affiliated MMF. Effective October 1, 2016, the Affiliated MMF prices its shares with a floating net asset value (NAV) and no longer seeks to maintain a stable NAV. In addition, the Board of Trustees of the Affiliated MMF may impose a fee on redemptions (sometimes referred to as a liquidity fee) or temporarily suspend redemptions (sometimes referred to as imposing a redemption gate) in the event its liquidity falls below regulatory limits.
Columbia Contrarian Core Fund | Annual Report 2017
| 31 |
Notes to Financial Statements (continued)
August 31, 2017
Note 7. Line of credit
The Fund has access to a revolving credit facility with a syndicate of banks led by Citibank, N.A., HSBC Bank USA, N.A. and JPMorgan Chase Bank, N.A. whereby the Fund may borrow for the temporary funding of shareholder redemptions or for other temporary or emergency purposes. The credit facility, which is a collective agreement between the Fund and certain other funds managed by the Investment Manager, severally and not jointly, permits collective borrowings up to $1 billion. Interest is charged to each participating fund based on its borrowings at a rate equal to the higher of (i) the overnight federal funds rate plus 1.00% or (ii) the one-month LIBOR rate plus 1.00%. Each borrowing under the credit facility matures no later than 60 days after the date of borrowing. The Fund also pays a commitment fee equal to its pro rata share of the amount of the credit facility at a rate of 0.15% per annum. The commitment fee is included in other expenses in the Statement of Operations.
The Fund had no borrowings during the year ended August 31, 2017.
Note 8. Fund reorganization
At the close of business on June 24, 2016, the Fund acquired the assets and assumed the identified liabilities of Columbia Value and Restructuring Fund, a series of Columbia Funds Series Trust I (the Acquired Fund). The reorganization was completed after shareholders of the Acquired Fund approved a plan of reorganization at a meeting held on June 13, 2016. The purpose of the transaction was to combine two funds managed by the Investment Manager with comparable investment objectives and strategies.
The aggregate net assets of the Fund immediately before the reorganization were $7,568,007,669 and the combined net assets immediately after the reorganization were $8,930,720,664.
The reorganization was accomplished by a tax-free exchange of 35,751,821 shares of the Acquired Fund valued at $1,362,712,995 (including $305,892,225 of unrealized appreciation).
In exchange for the Acquired Fund’s shares, the Fund issued the following number of shares:
| | Shares |
| Class A | 2,911,441 |
| Class C | 1,127,343 |
| Class I | 94 |
| Class R | 348,131 |
| Class R4 | 364,058 |
| Class R5 | 926,239 |
| Class W | 95 |
| Class Y | 65,725 |
| Class Z | 59,654,609 |
For financial reporting purposes, net assets received and shares issued by the Fund were recorded at fair value; however, the Acquired Fund’s cost of investments was carried forward.
The financial statements reflect the operations of the Fund for the period prior to the reorganization and the combined fund for the period subsequent to the reorganization. Because the combined investment portfolios have been managed as a single integrated portfolio since the reorganization was completed, it is not practicable to separate the amounts of revenue and earnings of the Acquired Fund that have been included in the combined Fund’s Statement of Operations since the reorganization was completed.
Assuming the reorganization had been completed on September 1, 2015, the Fund’s pro-forma net investment income, net gain on investments, net change in unrealized appreciation and net increase in net assets from operations for the year ended August 31, 2016 would have been approximately $72.9 million, $93.4 million, $770.0 million and $936.3 million, respectively.
| 32 | Columbia Contrarian Core Fund | Annual Report 2017 |
Notes to Financial Statements (continued)
August 31, 2017
Note 9. Significant risks
Shareholder concentration risk
At August 31, 2017, two unaffiliated shareholders of record owned 27.3% of the outstanding shares of the Fund in one or more accounts. The Fund has no knowledge about whether any portion of those shares was owned beneficially. Affiliated shareholders of record owned 23.3% of the outstanding shares of the Fund in one or more accounts. Subscription and redemption activity by concentrated accounts may have a significant effect on the operations of the Fund. In the case of a large redemption, the Fund may be forced to sell investments at inopportune times, including its liquid positions, which may result in Fund losses and the Fund holding a higher percentage of less liquid positions. Large redemptions could result in decreased economies of scale and increased operating expenses for non-redeeming Fund shareholders.
Technology and technology-related investment risk
The Fund may be more susceptible to the particular risks that may affect companies in the information technology sector, as well as other technology-related sectors (collectively, the technology sectors) than if it were invested in a wider variety of companies in unrelated sectors. Companies in the technology sectors are subject to certain risks, including the risk that new services, equipment or technologies will not be accepted by consumers and businesses or will become rapidly obsolete. Performance of such companies may be affected by factors including obtaining and protecting patents (or the failure to do so) and significant competitive pressures, including aggressive pricing of their products or services, new market entrants, competition for market share and short product cycles due to an accelerated rate of technological developments. Such competitive pressures may lead to limited earnings and/or falling profit margins. As a result, the value of their securities may fall or fail to rise. In addition, many technology sector companies have limited operating histories and prices of these companies’ securities historically have been more volatile than other securities, especially over the short term.
Note 10. Subsequent events
Management has evaluated the events and transactions that have occurred through the date the financial statements were issued. Other than as noted in Note 1 above, there were no items requiring adjustment of the financial statements or additional disclosure.
Note 11. Information regarding pending and settled legal proceedings
Ameriprise Financial and certain of its affiliates have historically been involved in a number of legal, arbitration and regulatory proceedings, including routine litigation, class actions, and governmental actions, concerning matters arising in connection with the conduct of their business activities. Ameriprise Financial believes that the Fund is not currently the subject of, and that neither Ameriprise Financial nor any of its affiliates are the subject of, any pending legal, arbitration or regulatory proceedings that are likely to have a material adverse effect on the Fund or the ability of Ameriprise Financial or its affiliates to perform under their contracts with the Fund. Ameriprise Financial is required to make quarterly (10-Q), annual (10-K) and, as necessary, 8-K filings with the Securities and Exchange Commission (SEC) on legal and regulatory matters that relate to Ameriprise Financial and its affiliates. Copies of these filings may be obtained by accessing the SEC website at www.sec.gov.
There can be no assurance that these matters, or the adverse publicity associated with them, will not result in increased Fund redemptions, reduced sale of Fund shares or other adverse consequences to the Fund. Further, although we believe proceedings are not likely to have a material adverse effect on the Fund or the ability of Ameriprise Financial or its affiliates to perform under their contracts with the Fund, these proceedings are subject to uncertainties and, as such, we are unable to estimate the possible loss or range of loss that may result. An adverse outcome in one or more of these proceedings could result in adverse judgments, settlements, fines, penalties or other relief that could have a material adverse effect on the consolidated financial condition or results of operations of Ameriprise Financial.
Columbia Contrarian Core Fund | Annual Report 2017
| 33 |
Report of Independent Registered Public Accounting Firm
To the Trustees of Columbia Funds Series Trust I and the Shareholders of Columbia Contrarian Core Fund
In our opinion, the accompanying statement of assets and liabilities, including the portfolio of investments, and the related statements of operations and of changes in net assets and the financial highlights present fairly, in all material respects, the financial position of Columbia Contrarian Core Fund (the “Fund”, a series of Columbia Funds Series Trust I) as of August 31, 2017, the results of its operations for the year then ended, the changes in its net assets for each of the two years in the period then ended and the financial highlights for each of the five years in the period then ended, in conformity with accounting principles generally accepted in the United States of America. These financial statements and financial highlights (hereafter referred to as “financial statements”) are the responsibility of the Fund’s management. Our responsibility is to express an opinion on these financial statements based on our audits. We conducted our audits of these financial statements in accordance with the standards of the Public Company Accounting Oversight Board (United States). Those standards require that we plan and perform the audit to obtain reasonable assurance about whether the financial statements are free of material misstatement. An audit includes examining, on a test basis, evidence supporting the amounts and disclosures in the financial statements, assessing the accounting principles used and significant estimates made by management, and evaluating the overall financial statement presentation. We believe that our audits, which included confirmation of securities as of August 31, 2017 by correspondence with the custodian, brokers and transfer agent provide a reasonable basis for our opinion.
/s/ PricewaterhouseCoopers LLP
Minneapolis, MN
October 20, 2017
| 34 | Columbia Contrarian Core Fund | Annual Report 2017 |
Federal Income Tax Information
(Unaudited)
The Fund hereby designates the following tax attributes for the fiscal year ended August 31, 2017. Shareholders will be notified in early 2018 of the amounts for use in preparing 2017 income tax returns.
Qualified
dividend
income | Dividends
received
deduction | Capital
gain
dividend |
| 100.00% | 100.00% | $450,745,737 |
Qualified dividend income. For taxable, non-corporate shareholders, the percentage of ordinary income distributed during the fiscal year that represents qualified dividend income subject to reduced tax rates.
Dividends received deduction. The percentage of ordinary income distributed during the fiscal year that qualifies for the corporate dividends received deduction.
Capital gain dividend. The Fund designates as a capital gain dividend the amount reflected above, or if subsequently determined to be different, the net capital gain of such fiscal period.
Columbia Contrarian Core Fund | Annual Report 2017
| 35 |
Shareholders elect the Board that oversees the Fund’s operations. The Board appoints officers who are responsible for day-to-day business decisions based on policies set by the Board. The following table provides basic biographical information about the Fund’s Trustees, including their principal occupations during the past five years, although specific titles for individuals may have varied over the period. The year set forth beneath Length of Service in the table below is the year in which the Trustee was first appointed or elected as Trustee to any Fund currently in the Columbia Funds Complex or a predecessor thereof. Under current Board policy, members serve terms of indefinite duration.
Independent trustees
| Name, address, year of birth | Position held with the Trust and length of service | Principal occupation(s) during the past five years and other relevant professional experience | Number of Funds in the Columbia Fund Complex overseen | Other directorships held by Trustee during the past five years |
Janet Langford Carrig
c/o Columbia Management
Investment Advisers, LLC
225 Franklin Street
Mail Drop BX32 05228
Boston, MA 02110
1957 | Trustee
1996 | Senior Vice President, General Counsel and Corporate Secretary, ConocoPhillips (independent energy company) since September 2007 | 57 | None |
Douglas A. Hacker
c/o Columbia Management
Investment Advisers, LLC
225 Franklin Street
Mail Drop BX32 05228
Boston, MA 02110
1955 | Trustee and Chairman of the Board
1996 | Independent business executive since May 2006; Executive Vice President — Strategy of United Airlines from December 2002 to May 2006; President of UAL Loyalty Services (airline marketing company) from September 2001 to December 2002; Executive Vice President and Chief Financial Officer of United Airlines from July 1999 to September 2001 | 57 | Spartan Nash Company, (food distributor); Nash Finch Company (food distributor) from 2005 to 2013; Aircastle Limited (aircraft leasing); SeaCube Container Leasing Ltd. (container leasing) from 2010 to 2013; and Travelport Worldwide Limited (travel information technology) |
Nancy T. Lukitsh
c/o Columbia Management
Investment Advisers, LLC
225 Franklin Street
Mail Drop BX32 05228
Boston, MA 02110
1956 | Trustee
2011 | Senior Vice President, Partner and Director of Marketing, Wellington Management Company, LLP (investment adviser) from 1997 to 2010; Chair, Wellington Management Portfolios (commingled non-U.S. investment pools) from 2007 to 2010; Director, Wellington Trust Company, NA and other Wellington affiliates from 1997 to 2010 | 57 | None |
David M. Moffett
c/o Columbia Management
Investment Advisers, LLC
225 Franklin Street
Mail Drop BX32 05228
Boston, MA 02110
1952 | Trustee
2011 | Retired. Consultant to Bridgewater and Associates | 57 | Director, CSX Corporation; Genworth Financial, Inc. (financial and insurance products and services); PayPal Holdings Inc. (payment and data processing services); Trustee, University of Oklahoma Foundation; former Director, eBay Inc. (online trading community), 2007-2015; and former Director, CIT Bank, CIT Group Inc. (commercial and consumer finance), 2010-2016 |
| 36 | Columbia Contrarian Core Fund | Annual Report 2017 |
TRUSTEES AND OFFICERS (continued)
Independent trustees (continued)
| Name, address, year of birth | Position held with the Trust and length of service | Principal occupation(s) during the past five years and other relevant professional experience | Number of Funds in the Columbia Fund Complex overseen | Other directorships held by Trustee during the past five years |
Charles R. Nelson
c/o Columbia Management
Investment Advisers, LLC
225 Franklin Street
Mail Drop BX32 05228
Boston, MA 02110
1942 | Trustee
1981 | Retired. Professor Emeritus, University of Washington since 2011; Professor of Economics, University of Washington from 1976 to 2011; Ford and Louisa Van Voorhis Professor of Political Economy, University of Washington from 1993 to 2011; Adjunct Professor of Statistics, University of Washington from 1980 to 2011; Associate Editor, Journal of Money, Credit and Banking from September 1993 to 2008; consultant on econometric and statistical matters | 57 | None |
John J. Neuhauser
c/o Columbia Management
Investment Advisers, LLC
225 Franklin Street
Mail Drop BX32 05228
Boston, MA 02110
1943 | Trustee
1984 | President, Saint Michael’s College since August 2007; Director or Trustee of several non-profit organizations, including University of Vermont Medical Center; Academic Vice President and Dean of Faculties, Boston College from August 1999 to October 2005; University Professor, Boston College from November 2005 to August 2007 | 57 | Liberty All-Star Equity Fund and Liberty All- Star Growth Fund (closed-end funds) |
Patrick J. Simpson
c/o Columbia Management
Investment Advisers, LLC
225 Franklin Street
Mail Drop BX32 05228
Boston, MA 02110
1944 | Trustee
2000 | Of Counsel, Perkins Coie LLP (law firm) since 2015; Partner, Perkins Coie LLP from 1988 to 2014 | 57 | None |
Anne-Lee Verville
c/o Columbia Management
Investment Advisers, LLC
225 Franklin Street
Mail Drop BX32 05228
Boston, MA 02110
1945 | Trustee
1998 | Retired. General Manager, Global Education Industry from 1994 to 1997, President – Application Systems Division from 1991 to 1994, Chief Financial Officer – US Marketing & Services from 1988 to 1991, and Chief Information Officer from 1987 to 1988, IBM Corporation (computer and technology) | 57 | Enesco Group, Inc. (producer of giftware and home and garden decor products) from 2001 to 2006 |
Columbia Contrarian Core Fund | Annual Report 2017
| 37 |
TRUSTEES AND OFFICERS (continued)
Consultants to the Independent Trustees*
| Name, address, year of birth | Position held with the Trust and length of service | Principal occupation(s) during the past five years and other relevant professional experience | Number of Funds in the Columbia Funds complex overseen | Other directorships held by Trustee during the past five years |
J. Kevin Connaughton
c/o Columbia
Management Investment
Advisers, LLC,
225 Franklin Street
Mail Drop BX32 05228,
Boston, MA 02110
1964 | Independent Trustee Consultant
2016 | Independent Trustee Consultant, Columbia Funds since March 2016; Managing Director and General Manager of Mutual Fund Products, Columbia Management Investment Advisers, LLC from May 2010 to February 2015; President, Columbia Funds from 2009 to 2015; and senior officer of Columbia Funds and affiliated funds from 2003 to 2015 | 57 | Board of Governors, Gateway Healthcare since January 2016; Trustee, New Century Portfolios since March 2015; and Director, The Autism Project since March 2015 |
Natalie A. Trunow
c/o Columbia
Management Investment
Advisers, LLC,
225 Franklin Street
Mail Drop BX32 05228,
Boston, MA 02110
1967 | Independent Trustee Consultant
2016 | Independent Trustee Consultant, Columbia Funds since September 2016; Chief Executive Officer, Millennial Partners (investment consulting services to institutions) since January 2016; Director of Investments, Casey Family Programs from April 2016 to September 2016; Senior Vice President and Chief Investment Officer, Calvert Investments from August 2008 to January 2016; Section Head and Portfolio Manager, General Motors Asset Management from June 1997 to August 2008 | 57 | Healthcare Services for Children with Special Needs |
| * | J. Kevin Connaughton was appointed consultant to the Independent Trustees effective March 1, 2016. Natalie A. Trunow was appointed consultant to the Independent Trustees effective September 1, 2016. Shareholders of the Funds are expected to be asked to elect each of Mr. Connaughton and Ms. Trunow as a Trustee at a future shareholder meeting. |
Interested trustee affiliated with Investment Manager*
| Name, address, year of birth | Position held with the Trust and length of service | Principal occupation(s) during the past five years and other relevant professional experience | Number of Funds in the Columbia Funds Complex overseen | Other directorships held by Trustee during the past five years |
William F. Truscott
c/o Columbia Management
Investment Advisers, LLC
225 Franklin Street
Boston, MA 02110
1960 | Trustee
2012 | Chairman of the Board and President, Columbia Management Investment Advisers, LLC since May 2010 and February 2012, respectively; Chief Executive Officer, Global Asset Management, Ameriprise Financial, Inc. since September 2012 (previously Chief Executive Officer, U.S. Asset Management & President, Annuities, May 2010-September 2012); Director and Chief Executive Officer, Columbia Management Investment Distributors, Inc. since May 2010 and February 2012, respectively; Chairman of the Board and Chief Executive Officer, RiverSource Distributors, Inc. since 2006; Director, Threadneedle Asset Management Holdings, SARL since 2014; President and Chief Executive Officer, Ameriprise Certificate Company, 2006-August 2012 | 179 | Chairman of the Board, Columbia Management Investment Advisers, LLC since May 2010; Director, Columbia Management Investment Distributors, Inc. since May 2010; former Director, Ameriprise Certificate Company, 2006 - January 2013 |
| * | Interested person (as defined under the 1940 Act) by reason of being an officer, director, security holder and/or employee of the Investment Manager or Ameriprise Financial. |
The Statement of Additional Information has additional information about the Fund’s Board members and is available,
without charge, upon request by calling 800.345.6611, contacting your financial intermediary or visiting
investor.columbiathreadneedleus.com.
| 38 | Columbia Contrarian Core Fund | Annual Report 2017 |
TRUSTEES AND OFFICERS (continued)
The Board has appointed officers who are responsible for day-to-day business decisions based on policies it has established. The officers serve at the pleasure of the Board. The following table provides basic information about the Officers of the Fund, including principal occupations during the past five years, although their specific titles may have varied over the period. In addition to Mr. Truscott, who is Senior Vice President, the Fund’s other officers are:
Fund officers
Name,
address and
year of birth | Position and year
first appointed to
position for any Fund
in the Columbia
Funds complex or a
predecessor thereof | Principal occupation(s) during past five years |
Christopher O. Petersen
5228 Ameriprise
Financial Center
Minneapolis, MN 55474
Born 1970 | President and Principal Executive Officer (2015) | Vice President and Lead Chief Counsel, Ameriprise Financial, Inc. since January 2015 (previously, Vice President and Chief Counsel, January 2010 - December 2014; officer of Columbia Funds and affiliated funds since 2007. |
Michael G. Clarke
225 Franklin Street
Boston, MA 02110
Born 1969 | Treasurer (2011), Chief Financial Officer (2009) and Chief Accounting Officer (2015) | Vice President — Mutual Fund Administration, Columbia Management Investment Advisers, LLC, since May 2010; senior officer of Columbia Funds and affiliated funds since 2002. |
Paul B. Goucher
100 Park Avenue
New York, NY 10017
Born 1968 | Senior Vice President (2011) and Assistant Secretary (2008) | Senior Vice President and Assistant General Counsel, Ameriprise Financial, Inc. since January 2017 (previously Vice President and Lead Chief Counsel, November 2008 - January 2017 and January 2013 - January 2017, respectively; and Chief Counsel, January 2010 - January 2013); Vice President, Chief Legal Officer and Assistant Secretary, Columbia Management Investment Advisers, LLC since May 2010. |
Thomas P. McGuire
225 Franklin Street
Boston, MA 02110
Born 1972 | Senior Vice President and Chief Compliance Officer (2012) | Vice President — Asset Management Compliance, Ameriprise Financial, Inc., since May 2010; Chief Compliance Officer, Ameriprise Certificate Company since September 2010. |
Colin Moore
225 Franklin Street
Boston, MA 02110
Born 1958 | Senior Vice President (2010) | Executive Vice President and Global Chief Investment Officer, Ameriprise Financial, Inc., since July 2013; Executive Vice President and Global Chief Investment Officer, Columbia Management Investment Advisers, LLC since July 2013 (previously Director and Global Chief Investment Officer, 2010 - 2013). |
Ryan C. Larrenaga
225 Franklin Street
Boston, MA 02110
Born 1970 | Senior Vice President (2017), Chief Legal Officer (2017) and Secretary (2015) | Vice President and Group Counsel, Ameriprise Financial, Inc. since August 2011; officer of Columbia Funds and affiliated funds since 2005. |
Michael E. DeFao
225 Franklin Street
Boston, MA 02110
Born 1968 | Vice President (2011) and Assistant Secretary (2010) | Vice President and Chief Counsel, Ameriprise Financial, Inc. since May 2010. |
Amy Johnson
5228 Ameriprise
Financial Center
Minneapolis, MN 55474
Born 1965 | Vice President (2006) | Managing Director and Global Head of Operations, Columbia Management Investment Advisers, LLC since April 2016 (previously Managing Director and Chief Operating Officer, 2010 - 2016). |
Lyn Kephart-Strong
5228 Ameriprise
Financial Center
Minneapolis, MN 55474
Born 1960 | Vice President (2015) | President, Columbia Management Investment Services Corp. since October 2014; Vice President & Resolution Officer, Ameriprise Trust Company since August 2009. |
Columbia Contrarian Core Fund | Annual Report 2017
| 39 |
Board Consideration and Approval of Management
Agreement
On June 14, 2017, the Board of Trustees (the Board) and the Trustees who are not interested persons (as defined in the Investment Company Act of 1940) (the Independent Trustees) of Columbia Funds Series Trust I (the Trust) unanimously approved the continuation of the Management Agreement (the Management Agreement) with Columbia Management Investment Advisers, LLC (the Investment Manager) with respect to Columbia Contrarian Core Fund (the Fund), a series of the Trust. As detailed below, the Board’s Advisory Fees and Expenses Committee (the Committee) and the Board met on multiple occasions to review and discuss, both among themselves and with the management team of the Investment Manager, materials provided by the Investment Manager and others before determining to approve the continuation of the Management Agreement.
In connection with their deliberations regarding the continuation of the Management Agreement, the Committee and the Board evaluated materials requested from the Investment Manager regarding the Fund and the Management Agreement, and discussed these materials with representatives of the Investment Manager at Committee meetings held on March 27, 2017, April 26, 2017 and June 13, 2017 and at Board meetings held on March 28, 2017 and June 14, 2017. In addition, the Board considers matters bearing on the Management Agreement at most of its other meetings throughout the year and meets regularly with senior management of the Trust and the Investment Manager. Through the Board’s Investment Oversight Committees, Trustees also meet with selected portfolio managers of the funds the Trustees oversee and other investment personnel at various times throughout the year. The Committee and the Board also consulted with its independent fee consultant, Fund counsel and the Independent Trustees’ independent legal counsel, who advised on various matters with respect to the Committee’s and the Board’s considerations and otherwise assisted the Committee and the Board in their deliberations. On June 13, 2017, the Committee recommended that the Board approve the continuation of the Management Agreement. On June 14, 2017, the Board, including the Independent Trustees, voting separately, unanimously approved the continuation of the Management Agreement for the Fund.
The Committee and the Board considered all information that they, their legal counsel or the Investment Manager believed reasonably necessary to evaluate and to determine whether to recommend for approval or approve the continuation of the Management Agreement. The information and factors considered by the Committee and the Board in recommending for approval or approving the continuation of the Management Agreement for the Fund included the following:
| • | Information on the investment performance of the Fund relative to the performance of a group of mutual funds determined to be comparable to the Fund by an independent third-party data provider, as well as performance relative to benchmarks; |
| • | Information on the Fund’s management fees and total expenses, including information comparing the Fund’s expenses to those of a group of comparable mutual funds, as determined by the independent third-party data provider; |
| • | The Investment Manager’s agreement to contractually limit or cap total operating expenses for the Fund through December 31, 2018 so that total operating expenses (excluding certain fees and expenses, such as transaction costs and certain other investment related expenses, interest, taxes, acquired fund fees and expenses, and infrequent and/or unusual expenses) would not exceed a specified annual rate, as a percentage of the Fund’s net assets; |
| • | The terms and conditions of the Management Agreement; |
| • | The current and proposed terms and conditions of other agreements and arrangements with affiliates of the Investment Manager relating to the operations of the Fund, including agreements with respect to the provision of distribution, transfer agency and shareholder services to the Fund; |
| • | Descriptions of various functions performed by the Investment Manager under the Management Agreement, including portfolio management and portfolio trading practices; |
| • | Information regarding the management fees of similarly-managed portfolios of other clients of the Investment Manager, including institutional separate accounts; |
| • | Information regarding the reputation, regulatory history and resources of the Investment Manager, including information regarding senior management, portfolio managers and other personnel; |
| 40 | Columbia Contrarian Core Fund | Annual Report 2017 |
Board Consideration and Approval of Management
Agreement (continued)
| • | Information regarding the capabilities of the Investment Manager with respect to compliance monitoring services, including an assessment of the Investment Manager’s compliance system by the Fund’s Chief Compliance Officer; and |
| • | The profitability to the Investment Manager and its affiliates from their relationships with the Fund. |
Nature, extent and quality of services provided under the Management Agreement
The Committee and the Board considered the nature, extent and quality of services provided to the Fund by the Investment Manager and its affiliates under the Management Agreement and under separate agreements for the provision of transfer agency and shareholder services, and the resources dedicated to the Fund and the other Columbia Funds by the Investment Manager and its affiliates. The Committee and the Board considered, among other things, the Investment Manager’s ability to attract, motivate and retain highly qualified research, advisory and supervisory investment professionals (including compensation programs for personnel involved in fund management, reputation and other attributes), the portfolio management services provided by those investment professionals, and the quality of the Investment Manager’s investment research capabilities and trade execution services. The Committee and the Board also considered the potential benefits to shareholders of investing in a mutual fund that is part of a fund complex offering exposure to a variety of asset classes and investment disciplines and providing a variety of fund and shareholder services.
The Committee and the Board also considered the professional experience and qualifications of the senior personnel of the Investment Manager, which included consideration of the Investment Manager’s experience with similarly-structured funds. The Committee and the Board noted the compliance programs of and the compliance-related resources provided to the Fund by the Investment Manager and its affiliates, and considered the Investment Manager’s ability to provide administrative services to the Fund and coordinate the activities of the Fund’s other service providers. After reviewing these and related factors, the Committee and the Board concluded, within the context of their overall conclusions, that the nature, extent and quality of the services provided to the Fund under the Management Agreement supported the continuation of the Management Agreement.
Investment performance
The Committee and the Board reviewed information about the performance of the Fund over various time periods, including performance information relative to benchmarks and information that compared the performance of the Fund to the performance of a group of comparable mutual funds as determined by the independent third-party data provider, and data provided by the independent fee consultant. The Committee and the Board also reviewed a description of the third party’s methodology for identifying the Fund’s peer groups for purposes of performance and expense comparisons. Although the Fund’s performance lagged that of a relevant peer group for certain (although not necessarily all) periods, the Committee and the Board concluded that other factors relevant to performance were sufficient, in light of other considerations, to warrant continuation of the Management Agreement. Those factors included one or more of the following: (i) that the Fund’s performance, although lagging in certain recent periods, was stronger over the longer term; (ii) that the underperformance was attributable, to a significant extent, to investment decisions that were reasonable and consistent with the Fund’s investment strategy and policies and that the Fund was performing within a reasonable range of expectations, given those investment decisions, market conditions and the Fund’s investment strategy; (iii) that the Fund’s performance was competitive when compared to other relevant performance benchmarks or peer groups; and (iv) that the Investment Manager had taken or was taking steps designed to help improve the Fund’s investment performance, including, but not limited to, replacing portfolio managers, enhancing the resources supporting the portfolio managers, or modifying investment strategies.
The Committee and the Board noted that, through December 31, 2016, the Fund’s performance was in the seventy-second, twenty-sixth and tenth percentile (where the best performance would be in the first percentile) of its category selected by the independent third-party data provider for the purposes of performance comparisons for the one-, three- and five-year periods, respectively.
The Committee and the Board also considered the Investment Manager’s performance and reputation generally, the Investment Manager’s historical responsiveness to Board concerns about performance, and the Investment Manager’s willingness to take steps intended to improve performance. After reviewing these and related factors, the Committee and the Board concluded, within the context of their overall conclusions, that the performance of the Fund and the Investment Manager was sufficient, in light of other considerations, to warrant the continuation of the Management Agreement.
Columbia Contrarian Core Fund | Annual Report 2017
| 41 |
Board Consideration and Approval of Management
Agreement (continued)
Investment management fee rates and other expenses
The Committee and the Board considered the management fees charged to the Fund under the Management Agreement as well as the total expenses incurred by the Fund. In assessing the reasonableness of the fees under the Management Agreement, the Committee and the Board considered, among other information, the Fund’s total expense ratio as a percentage of average daily net assets. The Committee and the Board considered data provided by the independent third-party data provider and the independent fee consultant. The Committee and the Board noted that, as of December 31, 2016, the Fund’s actual management fee and net total expense ratio are both ranked in the third quintile (where the lowest fees and expenses would be in the first quintile) against the Fund’s expense universe as determined by the independent third-party data provider for purposes of expense comparison. The Committee and the Board also took into account the fee waiver and expense limitation arrangements agreed to by the Investment Manager, as noted above.
The Committee and the Board also received and considered information about the management fees charged by the Investment Manager to institutional separate accounts. In considering the fees charged to those accounts, the Committee and the Board took into account, among other things, the Investment Manager’s representations about the differences between managing mutual funds as compared to other types of accounts, including differences in the services provided, differences in the risk profile of such business for the Investment Manager and the additional resources required to manage mutual funds effectively. The Committee and the Board also received and considered information about the fees charged by the Investment Manager for sub-advisory services it provides to comparable unaffiliated funds. In evaluating the Fund’s management fees, the Committee and the Board also took into account the demands, complexity and quality of the investment management of the Fund.
After reviewing these and related factors, the Committee and the Board concluded, within the context of their overall conclusions, that the management fee rates and expenses of the Fund, in light of other considerations, warranted the continuation of the Management Agreement.
Costs of services provided and profitability
The Committee and the Board also took note of the costs the Investment Manager and its affiliates incur in connection with the services provided and the profitability to the Investment Manager and its affiliates from their relationships with the Fund.
The Committee and the Board also considered the compensation directly or indirectly received by the Investment Manager’s affiliates in connection with their relationships with the Fund. The Committee and the Board reviewed information provided by management as to the profitability to the Investment Manager and its affiliates of their relationships with the Fund, information about the allocation of expenses used to calculate profitability, and comparisons of profitability levels realized in 2016 to profitability levels realized in 2015. When reviewing profitability, the Committee and the Board also considered court cases in which adviser profitability was an issue in whole or in part, the performance of similarly managed funds, the performance of the Fund, and the expense ratio of the Fund. In addition, the Committee and the Board considered information provided by the Investment Manager regarding the Investment Manager’s financial condition and comparing its profitability to that of other asset management firms that are, or are subsidiaries of, publicly traded companies. In this regard, the Committee and the Board also considered data provided by the independent fee consultant.
After reviewing these and related factors, the Committee and the Board concluded, within the context of their overall conclusions, that the costs of services provided and the profitability to the Investment Manager and its affiliates from their relationships with the Fund supported the continuation of the Management Agreement.
Economies of scale
The Committee and the Board considered the potential existence of economies of scale in the provision by the Investment Manager of services to the Fund, to groups of related funds, and to the Investment Manager’s investment advisory clients as a whole, and whether those economies of scale were shared with the Fund through breakpoints in investment management fees or other means, such as expense limitation arrangements and additional investments by the Investment Manager in investment, trading, compliance and other resources. The Committee and the Board noted that the management fee schedules for the Fund contained breakpoints that would reduce the fee rate on assets above specified threshold levels.
| 42 | Columbia Contrarian Core Fund | Annual Report 2017 |
Board Consideration and Approval of Management
Agreement (continued)
In considering these matters, the Committee and the Board also considered the costs of the services provided and the profitability to the Investment Manager and its affiliates from their relationships with the Fund, as discussed above. After reviewing these and related factors, the Committee and the Board concluded, within the context of their overall conclusions, that the extent to which any economies of scale were expected to be shared with the Fund supported the continuation of the Management Agreement.
Other benefits to the Investment Manager
The Committee and the Board received and considered information regarding “fall-out” or ancillary benefits received by the Investment Manager and its affiliates as a result of their relationships with the Fund, such as the engagement of the Investment Manager’s affiliates to provide distribution, transfer agency and shareholder services to the Fund. In this regard, among other matters, the Committee and the Board considered that the Fund’s distributor retains a portion of the distribution fees from the Fund and receives a portion of the sales charges on sales or redemptions of certain classes of shares of the Fund. The Committee and the Board also considered the benefits of research made available to the Investment Manager by reason of brokerage commissions generated by the Fund’s securities transactions, and reviewed information about the Investment Manager’s practices with respect to allocating portfolio transactions for brokerage and research services. The Committee and the Board recognized that the Investment Manager’s profitability would be somewhat lower without these benefits.
Conclusion
The Committee and the Board reviewed all of the above considerations in reaching their decisions to recommend or approve the continuation of the Management Agreement. In their deliberations, the Trustees did not identify any particular information that was all-important or controlling, and individual Trustees may have attributed different weights to the various factors. Based on their evaluation of all factors that they deemed to be material, including those factors described above, and assisted by the advice of independent legal counsel, the Board, including the Independent Trustees, voting separately, unanimously approved the continuation of the Management Agreement.
Columbia Contrarian Core Fund | Annual Report 2017
| 43 |
The Fund mails one shareholder report to each shareholder address. If you would like more than one report, please call shareholder services at 800.345.6611 and additional reports will be sent to you.
Proxy voting policies and procedures
The policy of the Board of Trustees is to vote the proxies of the companies in which the Fund holds investments consistent with the procedures as stated in the Statement of Additional Information (SAI). You may obtain a copy of the SAI without charge by calling 800.345.6611; contacting your financial intermediary; visiting investor.columbiathreadneedleus.com; or searching the website of the Securities and Exchange Commission (SEC) at sec.gov. Information regarding how the Fund voted proxies relating to portfolio securities is filed with the SEC by August 31st for the most recent 12-month period ending June 30th of that year, and is available without charge by visiting investor.columbiathreadneedleus.com, or searching the website of the SEC at sec.gov.
Quarterly schedule of investments
The Fund files a complete schedule of portfolio holdings with the SEC for the first and third quarters of each fiscal year on Form N-Q. The Fund’s Form N-Q is available on the SEC’s website at sec.gov and may be reviewed and copied at the SEC’s Public Reference Room in Washington, D.C. Information on the operation of the Public Reference Room may be obtained by calling 800.SEC.0330. The Fund’s complete schedule of portfolio holdings, as filed on Form N-Q, can also be obtained without charge, upon request, by calling 800.345.6611.
Additional Fund information
For more information about the Fund, please visit investor.columbiathreadneedleus.com or call 800.345.6611. Customer Service Representatives are available to answer your questions Monday through Friday from 8 a.m. to 7 p.m. Eastern time.
Fund investment manager
Columbia Management Investment Advisers, LLC
225 Franklin Street
Boston, MA 02110
Fund distributor
Columbia Management Investment Distributors, Inc.
225 Franklin Street
Boston, MA 02110
Fund transfer agent
Columbia Management Investment Services Corp.
P.O. Box 8081
Boston, MA 02266-8081
| 44 | Columbia Contrarian Core Fund | Annual Report 2017 |
[THIS PAGE INTENTIONALLY LEFT BLANK]
Columbia Contrarian Core Fund
P.O. Box 8081
Boston, MA 02266-8081
Please read and consider the investment objectives, risks, charges and expenses for any fund carefully before investing. For a prospectus and summary prospectus, which contains this and other important information about the Fund, go to
investor.columbiathreadneedleus.com. The Fund is distributed by Columbia Management Investment Distributors, Inc., member FINRA, and managed by Columbia Management Investment Advisers, LLC.
Columbia Threadneedle Investments (Columbia Threadneedle) is the global brand name of the Columbia and Threadneedle group of companies. All rights reserved. Columbia Management Investment Distributors, Inc., 225 Franklin Street, Boston, MA 02110-2804
© 2017 Columbia Management Investment Advisers, LLC.
investor.columbiathreadneedleus.com

Annual Report
August 31, 2017
Columbia Emerging Markets Fund
Not FDIC Insured • No bank guarantee • May lose value
Dear Shareholders,
The current outlook for financial markets is clouded by two primary concerns: the high valuation of equities and the direction of interest rates. Following the U.S. presidential election, U.S. equities rallied based on the assumption that the new administration’s policies would stimulate growth quickly. Unfortunately it’s unclear whether those measures will get passed, much less passed quickly. In fixed income, uncertainty stems from the possibility that interest rates won’t rise as rapidly as expected if the administration’s proposed growth policies are not implemented.
Given this uncertainty, investors value a consistent approach more than ever. Investors want strong, repeatable risk-adjusted returns. Consistency — not surprises. As a leading global asset manager, we believe our consistent, collaborative investment approach enables us to deliver the dependable experience your portfolio demands. So, how do we strive to deliver a consistent investment experience?
Better insights
Your portfolio benefits from the investment insights uncovered by our talented investment teams around the world.
Better decisions
Our collaborative, interactive environment enables our investment teams to construct portfolios that take advantage of the best investment ideas.
Better outcomes
We aim to deliver a consistent experience, which means fewer surprises, dependable insights, and products designed to do the thing you want.
Whether you’re trying to save money to help your children go to college or for your own retirement, it’s the consistency of the return that is most essential. People who chase higher returns are usually also the first to sell when that investment goes through a bad patch. We try to combat this behavioral tendency by offering strategies that aim for a more consistent return. Our goal is for investors to panic less during periods of volatility, which can have a significant effect on their long-term results.
Nothing is more important to us than making sure those who have entrusted us to protect and grow their assets can do what matters most to them: build a nest egg, leave a legacy, and live confidently — now and throughout retirement. It’s why our talented professionals around the world work together to uncover uncommon opportunities and why our process encourages challenge and debate around our most compelling ideas to ensure better informed investment decisions, which hopefully lead to better outcomes for you.
Your success is our priority. Talk to your financial advisor about how working with Columbia Threadneedle Investments may help you position your portfolio for consistent, sustainable outcomes, no matter the market conditions.
Sincerely,
Christopher O. Petersen
President, Columbia Funds
Investors should consider the investment objectives, risks, charges and expenses of a mutual fund carefully before investing. For a free prospectus and summary prospectus, which contains this and other important information about a fund, visit investor.columbiathreadneedleus.com. The prospectus should be read carefully before investing.
Columbia Funds are distributed by Columbia Management Investment Distributors, Inc., member FINRA, and managed by Columbia Management Investment Advisers, LLC.
© 2017 Columbia Management Investment Advisers, LLC. All rights reserved.
Columbia Emerging Markets Fund | Annual Report 2017
Columbia Emerging Markets Fund | Annual Report 2017
Investment objective
Columbia Emerging Markets Fund (the Fund) seeks long-term capital appreciation.
Portfolio management
Dara White, CFA
Lead manager
Managed Fund since 2008
Robert Cameron
Co-manager
Managed Fund since 2008
Jasmine (Weili) Huang, CFA, CPA (U.S. and China), CFM
Co-manager
Managed Fund since 2008
Young Kim
Co-manager
Managed Fund since 2015
Perry Vickery, CFA
Co-manager
Managed Fund since January 2017
Morningstar style boxTM
The Morningstar Style Box is based on a fund’s portfolio holdings. For equity funds, the vertical axis shows the market capitalization of the stocks owned, and the horizontal axis shows investment style (value, blend, or growth). Information shown is based on the most recent data provided by Morningstar.
© 2017 Morningstar, Inc. All rights reserved. The Morningstar information contained herein: (1) is proprietary to Morningstar and/or its content providers; (2) may not be copied or distributed; and (3) is not warranted to be accurate, complete or timely. Neither Morningstar nor its content providers are responsible for any damages or losses arising from any use of this information.
| Average annual total returns (%) (for the period ended August 31, 2017) |
| | | Inception | 1 Year | 5 Years | 10 Years |
| Class A* | Excluding sales charges | 09/28/07 | 26.33 | 6.93 | 2.36 |
| | Including sales charges | | 19.06 | 5.68 | 1.76 |
| Class C* | Excluding sales charges | 09/28/07 | 25.37 | 6.14 | 1.59 |
| | Including sales charges | | 24.37 | 6.14 | 1.59 |
| Class K* | 02/28/13 | 26.49 | 7.12 | 2.51 |
| Class R* | 09/27/10 | 26.09 | 6.67 | 2.10 |
| Class R4* | 03/19/13 | 26.63 | 7.21 | 2.60 |
| Class R5* | 11/08/12 | 26.88 | 7.37 | 2.68 |
| Class T* | Excluding sales charges | 09/27/10 | 26.23 | 6.93 | 2.33 |
| | Including sales charges | | 23.02 | 6.40 | 2.08 |
| Class Y* | 11/08/12 | 26.84 | 7.43 | 2.71 |
| Class Z | 01/02/98 | 26.71 | 7.22 | 2.61 |
| MSCI Emerging Markets Index (Net) | | 24.53 | 5.30 | 2.43 |
| MSCI EAFE Index (Net) | | 17.64 | 8.48 | 1.62 |
Returns for Class A shares are shown with and without the maximum initial sales charge of 5.75%. Returns for Class C shares are shown with and without the 1.00% contingent deferred sales charge for the first year only. Returns for Class T shares are shown with and without the maximum initial sales charge of 2.50% per transaction. Prior to March 27, 2017, Class T shares were known as Class W shares and were not subject to sales charges. The Fund’s other share classes are not subject to sales charges and have limited eligibility. Please see the Fund’s prospectus for details. Performance for different share classes will vary based on differences in sales charges and fees associated with each share class. All results shown assume reinvestment of distributions during the period. Returns do not reflect the deduction of taxes that a shareholder may pay on Fund distributions or on the redemption of Fund shares. Performance results reflect the effect of any fee waivers or reimbursements of Fund expenses by Columbia Management Investment Advisers, LLC and/or any of its affiliates. Absent these fee waivers or expense reimbursement arrangements, performance results would have been lower.
The performance information shown represents past performance and is not a guarantee of future results. The investment return and principal value of your investment will fluctuate so that your shares, when redeemed, may be worth more or less than their original cost. Current performance may be lower or higher than the performance information shown. You may obtain performance information current to the most recent month-end by contacting your financial intermediary, visiting investor.columbiathreadneedleus.com or calling 800.345.6611.
| * | The returns shown for periods prior to the share class inception date (including returns for the Life of the Fund, if shown, which are since Fund inception) include the returns of the Fund’s oldest share class. These returns are adjusted to reflect any higher class-related operating expenses of the newer share classes, as applicable. Please visit investor.columbiathreadneedleus.com/investment-products/mutual-funds/appended-performance for more information. |
The MSCI Emerging Markets Index (Net) is a free float-adjusted market capitalization index that is designed to measure equity market performance of emerging markets.
The MSCI EAFE Index (Net) is a free float-adjusted market capitalization index that is designed to measure the equity market performance of developed markets, excluding the U.S. and Canada. The index is compiled from a composite of securities markets of Europe, Australasia and the Far East and is widely recognized by investors in foreign markets as the measurement index for portfolios of non-North American securities.
Indices are not available for investment, are not professionally managed and do not reflect sales charges, fees, brokerage commissions, taxes (except the MSCI Emerging Markets Index (Net) and the MSCI EAFE Index (Net), which reflect reinvested dividends net of withholding taxes) or other expenses of investing. Securities in the Fund may not match those in an index.
| 2 | Columbia Emerging Markets Fund | Annual Report 2017 |
Fund at a Glance (continued)
Performance of a hypothetical $10,000 investment (August 31, 2007 — August 31, 2017)
The chart above shows the change in value of a hypothetical $10,000 investment in Class A shares of Columbia Emerging Markets Fund during the stated time period, and does not reflect the deduction of taxes that a shareholder may pay on Fund distributions or on the redemption of Fund shares.
| Top 10 holdings (%) (at August 31, 2017) |
| Alibaba Group Holding Ltd., ADR (China) | 6.6 |
| Tencent Holdings Ltd. (China) | 5.1 |
| Samsung Electronics Co., Ltd. (South Korea) | 5.0 |
| Naspers Ltd., Class N (South Africa) | 4.2 |
| Taiwan Semiconductor Manufacturing Co., Ltd. (Taiwan) | 3.5 |
| SK Hynix, Inc. (South Korea) | 2.5 |
| Industrial & Commercial Bank of China Ltd., Class H (China) | 2.3 |
| Ping An Insurance Group Co. of China Ltd., Class H (China) | 2.2 |
| Sberbank of Russia PJSC, ADR (Russian Federation) | 1.9 |
| X5 Retail Group NV GDR, Registered Shares (Russian Federation) | 1.9 |
Percentages indicated are based upon total investments (excluding Money Market Funds).
For further detail about these holdings, please refer to the section entitled “Portfolio of Investments.”
Fund holdings are as of the date given, are subject to change at any time, and are not recommendations to buy or sell any security.
| Equity sector breakdown (%) (at August 31, 2017) |
| Consumer Discretionary | 12.0 |
| Consumer Staples | 6.7 |
| Energy | 5.7 |
| Financials | 25.1 |
| Health Care | 4.6 |
| Industrials | 4.5 |
| Information Technology | 34.7 |
| Materials | 3.5 |
| Real Estate | 0.6 |
| Telecommunication Services | 1.7 |
| Utilities | 0.9 |
| Total | 100.0 |
Percentages indicated are based upon total equity investments. The Fund’s portfolio composition is subject to change.
Columbia Emerging Markets Fund | Annual Report 2017
| 3 |
Fund at a Glance (continued)
| Country breakdown (%) (at August 31, 2017) |
| Argentina | 0.8 |
| Brazil | 6.5 |
| Canada | 1.0 |
| China | 26.6 |
| Hong Kong | 2.0 |
| India | 9.8 |
| Indonesia | 5.5 |
| Kenya | 0.3 |
| Mexico | 2.1 |
| Peru | 1.1 |
| Philippines | 0.8 |
| Poland | 1.2 |
| Russian Federation | 7.8 |
| South Africa | 6.2 |
| South Korea | 13.0 |
| Taiwan | 8.2 |
| Thailand | 3.6 |
| United Kingdom | 0.4 |
| United States | 3.1 |
| Total | 100.0 |
Country breakdown is based primarily on issuer’s place of organization/incorporation. Percentages indicated are based upon total investments. The Fund’s portfolio composition is subject to change.
| 4 | Columbia Emerging Markets Fund | Annual Report 2017 |
Manager Discussion of Fund Performance
During the 12-months ended August 31, 2017, Class A shares of the Fund returned 26.33%, excluding sales charges. During the same time period, the Fund’s benchmark, the MSCI Emerging Markets Index (Net), returned 24.53% and the MSCI EAFE Index (Net), a measure of more developed foreign markets, returned 17.64%. Stock selection drove the Fund’s outperformance of the benchmark during the period.
Market overview
After beginning the period on a down note due to the unexpected result of the U.S. elections, emerging market equities recovered to close with a strong gain. The asset class was aided by a backdrop of accelerating global growth and a stabilization of commodity prices. Stocks gained an added boost from the recovery in China’s economy, highlighted by strength in the Purchasing Managers’ Index, lower inflation, a stable currency and the improving health of the banking system. Not least, the falling U.S. dollar aided returns for U.S.-based investors.
Rising profits for emerging-market companies provided further fuel for the rally. Corporate earnings were stagnant in the interval from 2012 to 2016, and analysts’ original estimates declined throughout each calendar year as it became apparent that companies would fail to meet expectations. In contrast, earnings estimates rose steadily in 2017, and emerging market corporations were on track for profit growth of 20% for the full year as of August 31. The recovery in company fundamentals, together with improving economic conditions, led to hearty investment inflows and propelled the benchmark to a sizeable gain for the period.
Contributors and detractors
Our stock selection process worked well and helped the Fund exceed the return of its benchmark. Our positioning in China made the largest contribution to performance, led by the internet giants Tencent Holdings and Alibaba Group Holdings. Both companies have capitalized on the expansion of e-commerce in the country and delivered robust growth that has exceeded expectations. The rally in Chinese internet stocks also led to a strong return for the South African media company Naspers, which has a significant ownership stake in Tencent. Our allocation to Chinese financial stocks, including Ping An Insurance Company of China, was a further contributor to relative performance. We added to the portfolio’s weighting in the sector in the early part of the period when prices were depressed due to concerns about unprofitable loans. This issue has since faded as structural reforms in the country have led to an improving outlook regarding non-performing loans, leading to hearty relative performance across the sector.
Outside of China, the Fund was helped by its favorable stock selection in India and Russia, as well as its underweights in Malaysia and Taiwan. In Russia, the Fund benefited from its positions in Sberbank of Russia and X5 Retail Group NV. We originally purchased Sberbank over a year ago when the stock was at depressed levels, and it has since recovered as its return on equity has more than doubled. The food retailer X5 also rallied as it executed well, beat earnings expectations and continued to take market share from weaker players in the industry.
The Fund’s positions in the information technology sector were helpful to performance. Technology stocks rallied in the latter half of the period as worries about protectionist trade policies in the United States proved to be exaggerated during that time. In addition to benefiting from the gains in Tencent, Alibaba and Naspers, the Fund’s results were aided by its investments in SK Hynix, a flash memory producer that has capitalized on industry consolidation, and Universal Display Corp. a U.S.-based developer of organic light-emitting diode technologies that counts Samsung among its primary customers. Health care was a further area of strength for the Fund, thanks in part to a position in Fleury, a Brazilian medical diagnostics company that reported improved earnings and increased profit margins.
On the negative side, we lost some ground through overweight positions in Indonesia and the Philippines, as well as an underweight position in Turkey. Stock selection in Mexico also weighed on results, as a position in the low-cost airline Concesionaria Vuela Compañía de Aviación SAB de CV lagged early in the period due to concerns about rising competition, possible shifts in U.S. policy and weakness in the peso. We have since sold the stock from the portfolio. Other detractors of note included the Brazilian energy stock Petroleo Brasileiro SA (“Petrobras”) and Dish TV India.
Columbia Emerging Markets Fund | Annual Report 2017
| 5 |
Manager Discussion of Fund Performance (continued)
Portfolio positioning
There was still a great deal of uncertainty on the geopolitical front as the period drew to a close, especially as it related to developments in North Korea and the direction of government policy in the United States. The interest-rate outlook represented a further source of worry for investors, as both the United States and Europe appeared on track for tighter policies. However, we would note that the economic fundamentals in the emerging markets have improved considerably since the last interest-rate scare in 2013. Emerging market companies have strengthened their balance sheets significantly in this time, as gauged by debt-to-equity ratios. We believe that there is less of a threat from rising rates today compared to the past, but news on this front nonetheless retains its capacity to disrupt short-term performance.
The ongoing uncertainty has translated to valuations that in our view do not reflect the improvements in economic growth and corporate profits. Even after its recent rally, the benchmark finished August with a price-to-earnings ratio of approximately 13 (based on 2017 estimates) and a price-to-book value of 1.6, both of which were on the low end of the historical range for non-crisis periods. We believe the disparity between stronger fundamentals and attractive valuations provides a positive backdrop for our active, bottom-up approach to investing in the emerging markets.
Market risk may affect a single issuer, sector of the economy, industry or the market as a whole. International investing involves certain risks and volatility due to potential political, economic or currency instabilities and different financial and accounting standards. Risks are enhanced for emerging market issuers. Investments in small- and mid-cap companies involve risks and volatility greater than investments in larger, more established companies. Value securities may be unprofitable if the market fails to recognize their intrinsic worth or the portfolio manager misgauged that worth. Growth securities, at times, may not perform as well as value securities or the stock market in general and may be out of favor with investors. Certain issuer events, including initial public offerings, business consolidation or restructuring, may present heightened risks to securities from the high degree of uncertainty associated with such events. See the Fund’s prospectus for more information on these and other risks.
The views expressed in this report reflect the current views of the respective parties. These views are not guarantees of future performance and involve certain risks, uncertainties and assumptions that are difficult to predict, so actual outcomes and results may differ significantly from the views expressed. These views are subject to change at any time based upon economic, market or other conditions and the respective parties disclaim any responsibility to update such views. These views may not be relied on as investment advice and, because investment decisions for a Columbia fund are based on numerous factors, may not be relied on as an indication of trading intent on behalf of any particular Columbia fund. References to specific securities should not be construed as a recommendation or investment advice.
| 6 | Columbia Emerging Markets Fund | Annual Report 2017 |
Understanding Your Fund’s Expenses
(Unaudited)
As an investor, you incur two types of costs. There are transaction costs, which generally include sales charges on purchases and may include redemption fees. There are also ongoing costs, which generally include management fees, distribution and/or service fees, and other fund expenses. The following information is intended to help you understand your ongoing costs (in dollars) of investing in the Fund and to help you compare these costs with the ongoing costs of investing in other mutual funds.
Analyzing your Fund’s expenses
To illustrate these ongoing costs, we have provided examples and calculated the expenses paid by investors in each share class of the Fund during the period. The actual and hypothetical information in the table is based on an initial investment of $1,000 at the beginning of the period indicated and held for the entire period. Expense information is calculated two ways and each method provides you with different information. The amount listed in the “Actual” column is calculated using the Fund’s actual operating expenses and total return for the period. You may use the Actual information, together with the amount invested, to estimate the expenses that you paid over the period. Simply divide your account value by $1,000 (for example, an $8,600 account value divided by $1,000 = 8.6), then multiply the results by the expenses paid during the period under the “Actual” column. The amount listed in the “Hypothetical” column assumes a 5% annual rate of return before expenses (which is not the Fund’s actual return) and then applies the Fund’s actual expense ratio for the period to the hypothetical return. You should not use the hypothetical account values and expenses to estimate either your actual account balance at the end of the period or the expenses you paid during the period. See “Compare with other funds” below for details on how to use the hypothetical data.
Compare with other funds
Since all mutual funds are required to include the same hypothetical calculations about expenses in shareholder reports, you can use this information to compare the ongoing cost of investing in the Fund with other funds. To do so, compare the hypothetical example with the 5% hypothetical examples that appear in the shareholder reports of other funds. As you compare hypothetical examples of other funds, it is important to note that hypothetical examples are meant to highlight the ongoing costs of investing in a fund only and do not reflect any transaction costs, such as sales charges, or redemption or exchange fees. Therefore, the hypothetical calculations are useful in comparing ongoing costs only, and will not help you determine the relative total costs of owning different funds. If transaction costs were included in these calculations, your costs would be higher.
| March 1, 2017 — August 31, 2017 |
| | Account value at the
beginning of the
period ($) | Account value at the
end of the
period ($) | Expenses paid during
the period ($) | Fund’s annualized
expense ratio (%) |
| | Actual | Hypothetical | Actual | Hypothetical | Actual | Hypothetical | Actual |
| Class A | 1,000.00 | 1,000.00 | 1,250.70 | 1,017.09 | 9.13 | 8.19 | 1.61 |
| Class C | 1,000.00 | 1,000.00 | 1,247.10 | 1,013.31 | 13.37 | 11.98 | 2.36 |
| Class K | 1,000.00 | 1,000.00 | 1,252.50 | 1,017.74 | 8.40 | 7.53 | 1.48 |
| Class R | 1,000.00 | 1,000.00 | 1,250.80 | 1,015.83 | 10.55 | 9.45 | 1.86 |
| Class R4 | 1,000.00 | 1,000.00 | 1,252.70 | 1,018.35 | 7.72 | 6.92 | 1.36 |
| Class R5 | 1,000.00 | 1,000.00 | 1,253.90 | 1,019.00 | 6.99 | 6.26 | 1.23 |
| Class T (formerly Class W) | 1,000.00 | 1,000.00 | 1,251.00 | 1,017.09 | 9.13 | 8.19 | 1.61 |
| Class Y | 1,000.00 | 1,000.00 | 1,253.60 | 1,019.21 | 6.76 | 6.06 | 1.19 |
| Class Z | 1,000.00 | 1,000.00 | 1,253.40 | 1,018.35 | 7.72 | 6.92 | 1.36 |
Expenses paid during the period are equal to the annualized expense ratio for each class as indicated above, multiplied by the average account value over the period and then multiplied by the number of days in the Fund’s most recent fiscal half year and divided by 365.
Expenses do not include fees and expenses incurred indirectly by the Fund from its investment in underlying funds, including affiliated and non-affiliated pooled investment vehicles, such as mutual funds and exchange-traded funds.
Had Columbia Management Investment Advisers, LLC and/or certain of its affiliates not waived/reimbursed certain fees and expenses, account value at the end of the period would have been reduced.
Columbia Emerging Markets Fund | Annual Report 2017
| 7 |
Portfolio of Investments
August 31, 2017
(Percentages represent value of investments compared to net assets)
| Common Stocks 97.4% |
| Issuer | Shares | Value ($) |
| Argentina 0.8% |
| Banco Macro SA, ADR | 54,718 | 5,680,276 |
| MercadoLibre, Inc. | 18,899 | 4,884,824 |
| Total | 10,565,100 |
| Brazil 6.5% |
| AES Tiete Energia SA | 726,378 | 3,232,859 |
| B3 SA - Brasil Bolsa Balcao | 1,057,500 | 7,417,634 |
| BB Seguridade Participacoes SA | 611,500 | 5,361,564 |
| Embraer SA, ADR | 207,576 | 4,711,975 |
| Fleury SA | 1,388,800 | 14,021,019 |
| Hypermarcas SA | 630,100 | 5,884,950 |
| Itaú Unibanco Holding SA, ADR | 1,923,570 | 24,563,989 |
| Localiza Rent a Car | 234,700 | 4,409,409 |
| Petroleo Brasileiro SA, ADR(a) | 1,665,403 | 14,955,319 |
| Raia Drogasil SA | 146,900 | 3,224,208 |
| Total | 87,782,926 |
| Canada 1.0% |
| First Quantum Minerals Ltd. | 582,981 | 7,026,117 |
| Parex Resources(a) | 670,433 | 6,909,688 |
| Total | 13,935,805 |
| China 26.6% |
| AAC Technologies Holdings, Inc. | 472,500 | 8,646,955 |
| Alibaba Group Holding Ltd., ADR(a) | 514,762 | 88,405,226 |
| Baidu, Inc., ADR(a) | 83,539 | 19,051,069 |
| China Animal Healthcare Ltd.(a),(b),(c) | 6,354,000 | 1 |
| China Biologic Products Holdings, Inc.(a) | 109,241 | 10,650,998 |
| China Merchants Bank Co., Ltd., Class H | 4,967,500 | 18,779,878 |
| China Petroleum & Chemical Corp., Class H | 9,550,000 | 7,310,770 |
| CSPC Pharmaceutical Group Ltd. | 3,626,000 | 5,666,278 |
| Ctrip.com International Ltd., ADR(a) | 278,050 | 14,305,672 |
| Industrial & Commercial Bank of China Ltd., Class H | 40,498,000 | 30,433,144 |
| JD.com, Inc., ADR(a) | 99,036 | 4,150,599 |
| Kingdee International Software Group Co., Ltd.(a) | 11,672,000 | 4,977,912 |
| NetEase, Inc., ADR | 45,716 | 12,610,301 |
| New Oriental Education & Technology Group, Inc., ADR | 58,516 | 4,783,683 |
| Nexteer Automotive Group Ltd. | 5,020,000 | 8,336,049 |
| Ping An Insurance Group Co. of China Ltd., Class H | 3,699,500 | 29,465,901 |
| Common Stocks (continued) |
| Issuer | Shares | Value ($) |
| Tencent Holdings Ltd. | 1,615,900 | 67,996,547 |
| Wuliangye Yibin Co., Ltd. | 2,441,798 | 20,551,075 |
| Wuxi Biologics Cayman, Inc.(a) | 1,137,000 | 5,608,178 |
| Total | 361,730,236 |
| Hong Kong 2.0% |
| AIA Group Ltd. | 1,690,800 | 13,022,207 |
| Galaxy Entertainment Group Ltd. | 520,000 | 3,276,478 |
| Techtronic Industries Co., Ltd. | 2,087,000 | 10,813,481 |
| Total | 27,112,166 |
| India 9.8% |
| Adani Ports & Special Economic Zone | 1,012,920 | 6,232,429 |
| Bajaj Finance Ltd. | 200,062 | 5,587,145 |
| Bharat Petroleum Corp., Ltd. | 2,036,508 | 16,869,624 |
| Bharti Infratel Ltd. | 1,041,278 | 6,117,970 |
| Ceat Ltd. | 374,193 | 10,003,379 |
| Dish TV India Ltd.(a) | 5,470,886 | 6,820,724 |
| Eicher Motors Ltd. | 32,807 | 16,160,003 |
| HDFC Bank Ltd., ADR | 102,121 | 9,949,649 |
| Indraprastha Gas Ltd. | 427,483 | 8,538,741 |
| IndusInd Bank Ltd. | 204,395 | 5,303,633 |
| Natco Pharma Ltd. | 388,871 | 4,375,514 |
| Petronet LNG Ltd. | 2,350,156 | 8,359,867 |
| Tejas Networks Ltd.(a) | 1,940,376 | 10,575,108 |
| UPL Ltd. | 1,031,963 | 13,393,233 |
| Zee Entertainment Enterprises Ltd. | 564,620 | 4,597,907 |
| Total | 132,884,926 |
| Indonesia 5.5% |
| PT Ace Hardware Indonesia Tbk | 82,598,300 | 6,748,025 |
| PT Astra International Tbk | 14,108,800 | 8,340,308 |
| PT Bank Central Asia Tbk | 9,657,000 | 13,718,124 |
| PT Bank Rakyat Indonesia Persero Tbk | 18,467,800 | 20,995,105 |
| PT Nippon Indosari Corpindo Tbk | 60,910,900 | 5,569,727 |
| PT Pakuwon Jati Tbk | 165,424,500 | 8,328,613 |
| PT Sumber Alfaria Trijaya Tbk | 77,727,500 | 3,961,528 |
| PT Telekomunikasi Indonesia Persero Tbk | 19,666,600 | 6,937,552 |
| Total | 74,598,982 |
| Kenya 0.3% |
| Safaricom Ltd. | 16,918,200 | 4,194,595 |
The accompanying Notes to Financial Statements are an integral part of this statement.
| 8 | Columbia Emerging Markets Fund | Annual Report 2017 |
Portfolio of Investments (continued)
August 31, 2017
| Common Stocks (continued) |
| Issuer | Shares | Value ($) |
| Mexico 2.1% |
| Controladora Vuela Cia de Aviacion SAB de CV, ADR(a) | 640,163 | 8,072,455 |
| Gentera SAB de CV | 6,325,800 | 9,743,839 |
| Grupo Financiero Banorte SAB de CV, Class O | 1,644,800 | 11,223,379 |
| Total | 29,039,673 |
| Peru 1.1% |
| Credicorp Ltd. | 74,258 | 15,062,493 |
| Philippines 0.8% |
| GT Capital Holdings, Inc. | 101,860 | 2,225,513 |
| Robinsons Retail Holdings, Inc. | 1,452,570 | 2,576,133 |
| Security Bank Corp. | 1,196,600 | 5,850,904 |
| Total | 10,652,550 |
| Poland 1.2% |
| Dino Polska SA(a) | 450,769 | 7,452,795 |
| KRUK SA | 97,765 | 9,344,035 |
| Total | 16,796,830 |
| Russian Federation 7.9% |
| Aeroflot PJSC | 2,429,900 | 8,034,735 |
| Detsky Mir PJSC | 3,393,890 | 5,845,179 |
| Lukoil PJSC, ADR | 206,526 | 10,385,160 |
| Magnit PJSC | 29,475 | 5,487,975 |
| Mail.ru Group Ltd., GDR(a),(d) | 220,792 | 6,555,315 |
| Mobile Telesystems PJSC, ADR | 542,209 | 5,416,668 |
| Sberbank of Russia PJSC, ADR | 1,891,211 | 25,815,030 |
| X5 Retail Group NV GDR, Registered Shares(a) | 618,827 | 25,248,142 |
| Yandex NV, Class A(a) | 458,812 | 13,768,948 |
| Total | 106,557,152 |
| South Africa 6.2% |
| Aspen Pharmacare Holdings Ltd. | 145,967 | 3,252,987 |
| AVI Ltd. | 1,333,662 | 10,127,988 |
| Clicks Group Ltd. | 449,964 | 5,146,893 |
| FirstRand Ltd. | 2,263,320 | 9,661,356 |
| Naspers Ltd., Class N | 248,274 | 56,128,866 |
| Total | 84,318,090 |
| Common Stocks (continued) |
| Issuer | Shares | Value ($) |
| South Korea 12.2% |
| KB Financial Group, Inc. | 291,210 | 14,327,123 |
| LIG Nex1 Co., Ltd. | 51,272 | 3,792,200 |
| Lotte Chemical Corp. | 18,274 | 6,494,296 |
| NAVER Corp. | 12,384 | 8,306,449 |
| Osstem Implant Co., Ltd.(a) | 105,213 | 6,686,162 |
| POSCO | 46,056 | 13,998,319 |
| Samsung Electronics Co., Ltd. | 32,528 | 66,959,258 |
| SK Hynix, Inc. | 554,920 | 33,877,550 |
| SK Innovation Co., Ltd. | 66,124 | 11,093,301 |
| Total | 165,534,658 |
| Taiwan 8.2% |
| Cathay Financial Holding Co., Ltd. | 3,144,000 | 5,147,157 |
| Elite Material Co., Ltd. | 2,530,000 | 12,788,411 |
| eMemory Technology, Inc. | 438,000 | 6,061,322 |
| Hon Hai Precision Industry Co., Ltd. | 1,698,000 | 6,630,779 |
| Largan Precision Co., Ltd. | 46,000 | 8,922,060 |
| MediaTek, Inc. | 792,000 | 7,122,172 |
| Silergy Corp. | 168,000 | 3,755,769 |
| Taiwan Paiho., Ltd. | 2,101,000 | 8,828,060 |
| Taiwan Semiconductor Manufacturing Co., Ltd. | 6,443,048 | 46,373,837 |
| Voltronic Power Technology Corp. | 297,153 | 5,363,134 |
| Total | 110,992,701 |
| Thailand 3.6% |
| Kasikornbank PCL, Foreign Registered Shares | 1,298,000 | 8,262,363 |
| Krungthai Card PCL, Foreign Registered Shares | 1,215,100 | 4,359,495 |
| Mega Lifesciences PCL, Foreign Registered Shares | 5,504,500 | 5,189,220 |
| Muangthai Leasing PCL, Foreign Registered Shares | 8,697,000 | 8,914,949 |
| PTG Energy PCL, Foreign Registered Shares | 11,090,819 | 7,023,692 |
| Siam Commercial Bank PCL (The), Foreign Registered Shares | 2,146,400 | 9,745,388 |
| Srisawad Corp., PCL, Foreign Registered Shares | 3,502,850 | 5,410,409 |
| Total | 48,905,516 |
| United Kingdom 0.4% |
| Randgold Resources Ltd. | 50,550 | 5,170,469 |
The accompanying Notes to Financial Statements are an integral part of this statement.
Columbia Emerging Markets Fund | Annual Report 2017
| 9 |
Portfolio of Investments (continued)
August 31, 2017
| Common Stocks (continued) |
| Issuer | Shares | Value ($) |
| United States 1.2% |
| Atento SA(a) | 331,721 | 3,947,480 |
| Luxoft Holding, Inc.(a) | 93,435 | 4,732,483 |
| Universal Display Corp. | 64,276 | 8,169,479 |
| Total | 16,849,442 |
Total Common Stocks
(Cost $855,961,919) | 1,322,684,310 |
| Preferred Stocks 0.8% |
| Issuer | Coupon
Rate | Shares | Value ($) |
| South Korea 0.8% |
| Samsung Electronics Co., Ltd. | — | 6,800 | 11,384,368 |
Total Preferred Stocks
(Cost $6,967,013) | 11,384,368 |
| Money Market Funds 1.9% |
| | Shares | Value ($) |
| Columbia Short-Term Cash Fund, 1.146%(e),(f) | 25,505,768 | 25,505,768 |
Total Money Market Funds
(Cost $25,505,636) | 25,505,768 |
Total Investments
(Cost $888,434,568) | 1,359,574,446 |
| Other Assets & Liabilities, Net | | (1,181,764) |
| Net Assets | $1,358,392,682 |
Notes to Portfolio of Investments
| (a) | Non-income producing investment. |
| (b) | Represents fair value as determined in good faith under procedures approved by the Board of Trustees. At August 31, 2017, the value of these securities amounted to $1, which represents less than 0.01% of net assets. |
| (c) | Valuation based on significant unobservable inputs. |
| (d) | Represents privately placed and other securities and instruments exempt from SEC registration (collectively, private placements), such as Section 4(a)(2) and Rule 144A eligible securities, which are often sold only to qualified institutional buyers. The Fund may invest in private placements determined to be liquid as well as those determined to be illiquid. Private placements may be determined to be liquid under guidelines established by the Fund’s Board of Trustees. At August 31, 2017, the value of these securities amounted to $6,555,315, which represents 0.48% of net assets. |
| (e) | The rate shown is the seven-day current annualized yield at August 31, 2017. |
| (f) | As defined in the Investment Company Act of 1940, an affiliated company is one in which the Fund owns 5% or more of the company’s outstanding voting securities, or a company which is under common ownership or control with the Fund. Holdings and transactions in these affiliated companies during the year ended August 31, 2017 are as follows: |
| Issuer | Beginning
shares | Shares
purchased | Shares
sold | Ending
shares | Realized gain
(loss) ($) | Net change in
unrealized
appreciation
(depreciation) ($) | Dividends —
affiliated
issuers($) | Value ($) |
| Columbia Short-Term Cash Fund, 1.146% | 20,788,666 | 449,388,133 | (444,671,031) | 25,505,768 | 298 | 132 | 91,031 | 25,505,768 |
Abbreviation Legend
| ADR | American Depositary Receipt |
| GDR | Global Depositary Receipt |
Fair value measurements
The Fund categorizes its fair value measurements according to a three-level hierarchy that maximizes the use of observable inputs and minimizes the use of unobservable inputs by prioritizing that the most observable input be used when available. Observable inputs are those that market participants would use in pricing an investment based on market data obtained from sources independent of the reporting entity. Unobservable inputs are those that reflect the Fund’s assumptions about the information market participants would use in pricing an investment. An investment’s level within the fair value hierarchy is based on the lowest level of any input that is deemed significant to the asset’s or liability’s fair value measurement. The input levels are not necessarily an indication of the risk or liquidity associated with investments at that level. For example, certain U.S. government securities are generally high quality and liquid, however, they are reflected as Level 2 because the inputs used to determine fair value may not always be quoted prices in an active market.
Fair value inputs are summarized in the three broad levels listed below:
| • | Level 1 – Valuations based on quoted prices for investments in active markets that the Fund has the ability to access at the measurement date. Valuation adjustments are not applied to Level 1 investments. |
The accompanying Notes to Financial Statements are an integral part of this statement.
| 10 | Columbia Emerging Markets Fund | Annual Report 2017 |
Portfolio of Investments (continued)
August 31, 2017
Fair value measurements (continued)
| • | Level 2 – Valuations based on other significant observable inputs (including quoted prices for similar securities, interest rates, prepayment speeds, credit risks, etc.). |
| • | Level 3 – Valuations based on significant unobservable inputs (including the Fund’s own assumptions and judgment in determining the fair value of investments). |
Inputs that are used in determining fair value of an investment may include price information, credit data, volatility statistics, and other factors. These inputs can be either observable or unobservable. The availability of observable inputs can vary between investments, and is affected by various factors such as the type of investment, and the volume and level of activity for that investment or similar investments in the marketplace. The inputs will be considered by the Investment Manager, along with any other relevant factors in the calculation of an investment’s fair value. The Fund uses prices and inputs that are current as of the measurement date, which may include periods of market dislocations. During these periods, the availability of prices and inputs may be reduced for many investments. This condition could cause an investment to be reclassified between the various levels within the hierarchy.
Foreign equity securities actively traded in markets where there is a significant delay in the local close relative to the New York Stock Exchange are classified as Level 2. The values of these securities may include an adjustment to reflect the impact of significant market movements following the close of local trading, as described in Note 2 to the financial statements – Security valuation.
Certain investments that have been measured at fair value using the net asset value (NAV) per share (or its equivalent) are not categorized in the fair value hierarchy. The fair value amounts presented in the table are intended to reconcile the fair value hierarchy to the amounts presented in the Portfolio of Investments. The Columbia Short-Term Cash Fund seeks to provide shareholders with maximum current income consistent with liquidity and stability of principal. Columbia Short-Term Cash Fund prices its shares with a floating NAV and no longer seeks to maintain a stable NAV.
Investments falling into the Level 3 category are primarily supported by quoted prices from brokers and dealers participating in the market for those investments. However, these may be classified as Level 3 investments due to lack of market transparency and corroboration to support these quoted prices. Additionally, valuation models may be used as the pricing source for any remaining investments classified as Level 3. These models may rely on one or more significant unobservable inputs and/or significant assumptions by the Investment Manager. Inputs used in valuations may include, but are not limited to, financial statement analysis, capital account balances, discount rates and estimated cash flows, and comparable company data.
Under the direction of the Fund’s Board of Trustees (the Board), the Investment Manager’s Valuation Committee (the Committee) is responsible for overseeing the valuation procedures approved by the Board. The Committee consists of voting and non-voting members from various groups within the Investment Manager’s organization, including operations and accounting, trading and investments, compliance, risk management and legal.
The Committee meets at least monthly to review and approve valuation matters, which may include a description of specific valuation determinations, data regarding pricing information received from approved pricing vendors and brokers and the results of Board-approved valuation control policies and procedures (the Policies). The Policies address, among other things, instances when market quotations are or are not readily available, including recommendations of third party pricing vendors and a determination of appropriate pricing methodologies; events that require specific valuation determinations and assessment of fair value techniques; securities with a potential for stale pricing, including those that are illiquid, restricted, or in default; and the effectiveness of third party pricing vendors, including periodic reviews of vendors. The Committee meets more frequently, as needed, to discuss additional valuation matters, which may include the need to review back-testing results, review time-sensitive information or approve related valuation actions. The Committee reports to the Board, with members of the Committee meeting with the Board at each of its regularly scheduled meetings to discuss valuation matters and actions during the period, similar to those described earlier.
For investments categorized as Level 3, the Committee monitors information similar to that described above, which may include: (i) data specific to the issuer or comparable issuers, (ii) general market or specific sector news and (iii) quoted prices and specific or similar security transactions. The Committee considers this data and any changes from prior periods in order to assess the reasonableness of observable and unobservable inputs, any assumptions or internal models used to value those securities and changes in fair value. This data is also used to corroborate, when available, information received from approved pricing vendors and brokers. Various factors impact the frequency of monitoring this information (which may occur as often as daily). However, the Committee may determine that changes to inputs, assumptions and models are not required as a result of the monitoring procedures performed.
The following table is a summary of the inputs used to value the Fund’s investments at August 31, 2017:
| | Level 1
quoted prices
in active
markets for
identical
assets ($) | Level 2
other
significant
observable
inputs ($) | Level 3
significant
unobservable
inputs ($) | Investments
measured at
net asset
value ($) | Total ($) |
| Investments | | | | | |
| Common Stocks | | | | | |
| Argentina | 10,565,100 | — | — | — | 10,565,100 |
| Brazil | 87,782,926 | — | — | — | 87,782,926 |
| Canada | 13,935,805 | — | — | — | 13,935,805 |
| China | 153,957,548 | 207,772,687 | 1 | — | 361,730,236 |
| Hong Kong | — | 27,112,166 | — | — | 27,112,166 |
| India | 9,949,649 | 122,935,277 | — | — | 132,884,926 |
| Indonesia | — | 74,598,982 | — | — | 74,598,982 |
| Kenya | — | 4,194,595 | — | — | 4,194,595 |
| Mexico | 29,039,673 | — | — | — | 29,039,673 |
| Peru | 15,062,493 | — | — | — | 15,062,493 |
| Philippines | — | 10,652,550 | — | — | 10,652,550 |
| Poland | — | 16,796,830 | — | — | 16,796,830 |
| Russian Federation | 29,570,776 | 76,986,376 | — | — | 106,557,152 |
| South Africa | — | 84,318,090 | — | — | 84,318,090 |
The accompanying Notes to Financial Statements are an integral part of this statement.
Columbia Emerging Markets Fund | Annual Report 2017
| 11 |
Portfolio of Investments (continued)
August 31, 2017
Fair value measurements (continued)
| | Level 1
quoted prices
in active
markets for
identical
assets ($) | Level 2
other
significant
observable
inputs ($) | Level 3
significant
unobservable
inputs ($) | Investments
measured at
net asset
value ($) | Total ($) |
| South Korea | — | 165,534,658 | — | — | 165,534,658 |
| Taiwan | — | 110,992,701 | — | — | 110,992,701 |
| Thailand | — | 48,905,516 | — | — | 48,905,516 |
| United Kingdom | — | 5,170,469 | — | — | 5,170,469 |
| United States | 16,849,442 | — | — | — | 16,849,442 |
| Total Common Stocks | 366,713,412 | 955,970,897 | 1 | — | 1,322,684,310 |
| Preferred Stocks | | | | | |
| South Korea | — | 11,384,368 | — | — | 11,384,368 |
| Total Preferred Stocks | — | 11,384,368 | — | — | 11,384,368 |
| Money Market Funds | — | — | — | 25,505,768 | 25,505,768 |
| Total Investments | 366,713,412 | 967,355,265 | 1 | 25,505,768 | 1,359,574,446 |
See the Portfolio of Investments for all investment classifications not indicated in the table.
The Fund’s assets assigned to the Level 2 input category are generally valued using the market approach, in which a security’s value is determined through reference to prices and information from market transactions for similar or identical assets. These assets include certain foreign securities for which a third party statistical pricing service may be employed for purposes of fair market valuation. The model utilized by such third party statistical pricing service takes into account a security’s correlation to available market data including, but not limited to, intraday index, ADR, and exchange-traded fund movements.
There were no transfers of financial assets between levels during the period.
The Fund does not hold any significant investments (greater than one percent of net assets) categorized as Level 3.
The Fund’s assets assigned to the Level 3 category are valued utilizing the valuation technique deemed the most appropriate in the circumstances. Certain common stocks classified as Level 3 securities are valued using the market approach. To determine fair value for these securities, management considered various factors which may have included, but were not limited to, the halt price of the security, discount rates observed in the market for similar assets as well as the movement in certain foreign or domestic market indices. Significant increases (decreases) to any of these inputs would result in a significantly lower (higher) fair value measurement. Generally, a change in observable yields on comparable securities would result in a directionally similar change to discount rates.
The accompanying Notes to Financial Statements are an integral part of this statement.
| 12 | Columbia Emerging Markets Fund | Annual Report 2017 |
Statement of Assets and Liabilities
August 31, 2017
| Assets | |
| Investments in unaffiliated issuers, at cost | $862,928,932 |
| Investments in affiliated issuers, at cost | 25,505,636 |
| Investments in unaffiliated issuers, at value | 1,334,068,678 |
| Investments in affiliated issuers, at value | 25,505,768 |
| Receivable for: | |
| Investments sold | 1,682,246 |
| Capital shares sold | 1,011,300 |
| Dividends | 880,213 |
| Foreign tax reclaims | 233 |
| Prepaid expenses | 8,867 |
| Trustees’ deferred compensation plan | 60,252 |
| Total assets | 1,363,217,557 |
| Liabilities | |
| Due to custodian | 1 |
| Payable for: | |
| Capital shares purchased | 1,595,525 |
| Foreign capital gains taxes deferred | 2,658,984 |
| Management services fees | 37,752 |
| Distribution and/or service fees | 2,697 |
| Transfer agent fees | 186,844 |
| Plan administration fees | 21 |
| Compensation of board members | 4,020 |
| Compensation of chief compliance officer | 90 |
| Other expenses | 278,689 |
| Trustees’ deferred compensation plan | 60,252 |
| Total liabilities | 4,824,875 |
| Net assets applicable to outstanding capital stock | $1,358,392,682 |
| Represented by | |
| Paid in capital | 962,773,657 |
| Undistributed net investment income | 2,699,247 |
| Accumulated net realized loss | (75,563,462) |
| Unrealized appreciation (depreciation) on: | |
| Investments - unaffiliated issuers | 471,139,746 |
| Investments - affiliated issuers | 132 |
| Foreign currency translations | 2,346 |
| Foreign capital gains tax | (2,658,984) |
| Total - representing net assets applicable to outstanding capital stock | $1,358,392,682 |
The accompanying Notes to Financial Statements are an integral part of this statement.
Columbia Emerging Markets Fund | Annual Report 2017
| 13 |
Statement of Assets and Liabilities (continued)
August 31, 2017
| Class A | |
| Net assets | $270,816,062 |
| Shares outstanding | 21,456,863 |
| Net asset value per share | $12.62 |
| Maximum offering price per share(a) | $13.39 |
| Class C | |
| Net assets | $24,615,920 |
| Shares outstanding | 2,057,781 |
| Net asset value per share | $11.96 |
| Class K | |
| Net assets | $94,917 |
| Shares outstanding | 7,475 |
| Net asset value per share | $12.70 |
| Class R | |
| Net assets | $12,174,931 |
| Shares outstanding | 976,516 |
| Net asset value per share | $12.47 |
| Class R4 | |
| Net assets | $21,298,029 |
| Shares outstanding | 1,658,404 |
| Net asset value per share | $12.84 |
| Class R5 | |
| Net assets | $123,363,995 |
| Shares outstanding | 9,606,853 |
| Net asset value per share | $12.84 |
| Class T(b) | |
| Net assets | $237,133 |
| Shares outstanding | 18,800 |
| Net asset value per share | $12.61 |
| Maximum offering price per share(c) | $12.93 |
| Class Y | |
| Net assets | $726,291,118 |
| Shares outstanding | 56,314,381 |
| Net asset value per share | $12.90 |
| Class Z | |
| Net assets | $179,500,577 |
| Shares outstanding | 14,072,589 |
| Net asset value per share | $12.76 |
| (a) | The maximum offering price per share is calculated by dividing the net asset value per share by 1.0 minus the maximum sales charge of 5.75% for Class A. |
| (b) | Prior to March 27, 2017, Class T shares were known as Class W shares. |
| (c) | The maximum offering price per share is calculated by dividing the net asset value per share by 1.0 minus the maximum sales charge of 2.50% for Class T. |
The accompanying Notes to Financial Statements are an integral part of this statement.
| 14 | Columbia Emerging Markets Fund | Annual Report 2017 |
Statement of Operations
Year Ended August 31, 2017
| Net investment income | |
| Income: | |
| Dividends — unaffiliated issuers | $24,899,001 |
| Dividends — affiliated issuers | 91,031 |
| Interest | 501 |
| Foreign taxes withheld | (2,577,102) |
| Total income | 22,413,431 |
| Expenses: | |
| Management services fees | 13,852,430 |
| Distribution and/or service fees | |
| Class A | 615,340 |
| Class B(a) | 9,260 |
| Class C | 193,689 |
| Class R | 50,187 |
| Class T(b) | 90,096 |
| Transfer agent fees | |
| Class A | 568,246 |
| Class B(a) | 2,203 |
| Class C | 44,470 |
| Class I(c) | 5,871 |
| Class K | 46 |
| Class R | 23,093 |
| Class R4 | 8,718 |
| Class R5 | 64,876 |
| Class T(b) | 86,645 |
| Class Y | 14,026 |
| Class Z | 1,361,366 |
| Plan administration fees | |
| Class K | 200 |
| Compensation of board members | 40,741 |
| Custodian fees | 536,575 |
| Printing and postage fees | 139,397 |
| Registration fees | 168,517 |
| Audit fees | 66,002 |
| Legal fees | 37,087 |
| Line of credit interest expense | 1,893 |
| Compensation of chief compliance officer | 568 |
| Other | 250,159 |
| Total expenses | 18,231,701 |
| Fees waived or expenses reimbursed by Investment Manager and its affiliates | (277,910) |
| Fees waived by transfer agent | |
| Class I(c) | (5,862) |
| Class K | (6) |
| Class R5 | (8,782) |
| Class Y | (14,026) |
| Expense reduction | (1,702) |
| Total net expenses | 17,923,413 |
| Net investment income | 4,490,018 |
The accompanying Notes to Financial Statements are an integral part of this statement.
Columbia Emerging Markets Fund | Annual Report 2017
| 15 |
Statement of Operations (continued)
Year Ended August 31, 2017
| Realized and unrealized gain (loss) — net | |
| Net realized gain (loss) on: | |
| Investments — unaffiliated issuers | $70,874,273 |
| Investments — affiliated issuers | 298 |
| Foreign currency translations | (201,382) |
| Net realized gain | 70,673,189 |
| Net change in unrealized appreciation (depreciation) on: | |
| Investments — unaffiliated issuers | 223,544,967 |
| Investments — affiliated issuers | 132 |
| Foreign currency translations | 11,075 |
| Foreign capital gains tax | (412,302) |
| Net change in unrealized appreciation (depreciation) | 223,143,872 |
| Net realized and unrealized gain | 293,817,061 |
| Net increase in net assets resulting from operations | $298,307,079 |
| (a) | Effective July 17, 2017, Class B shares were automatically converted to Class A shares. |
| (b) | Prior to March 27, 2017, Class T shares were known as Class W shares. |
| (c) | Effective March 27, 2017, Class I shares were redeemed or exchanged for Class Y shares. |
The accompanying Notes to Financial Statements are an integral part of this statement.
| 16 | Columbia Emerging Markets Fund | Annual Report 2017 |
Statement of Changes in Net Assets
| | Year Ended
August 31, 2017 | Year Ended
August 31, 2016 |
| Operations | | |
| Net investment income | $4,490,018 | $909,435 |
| Net realized gain (loss) | 70,673,189 | (71,964,621) |
| Net change in unrealized appreciation (depreciation) | 223,143,872 | 230,903,013 |
| Net increase in net assets resulting from operations | 298,307,079 | 159,847,827 |
| Decrease in net assets from capital stock activity | (260,416,367) | (23,495,888) |
| Total increase in net assets | 37,890,712 | 136,351,939 |
| Net assets at beginning of year | 1,320,501,970 | 1,184,150,031 |
| Net assets at end of year | $1,358,392,682 | $1,320,501,970 |
| Undistributed (excess of distributions over) net investment income | $2,699,247 | $(683,147) |
The accompanying Notes to Financial Statements are an integral part of this statement.
Columbia Emerging Markets Fund | Annual Report 2017
| 17 |
Statement of Changes in Net Assets (continued)
| | Year Ended | Year Ended |
| | August 31, 2017 | August 31, 2016 |
| | Shares | Dollars ($) | Shares | Dollars ($) |
| Capital stock activity |
| Class A(a) | | | | |
| Subscriptions (b) | 6,289,768 | 66,175,683 | 3,327,630 | 29,799,138 |
| Redemptions | (9,269,294) | (96,912,694) | (6,077,207) | (54,460,832) |
| Net decrease | (2,979,526) | (30,737,011) | (2,749,577) | (24,661,694) |
| Class B(a) | | | | |
| Subscriptions | 7,435 | 71,954 | 5,032 | 44,437 |
| Redemptions (b) | (155,284) | (1,635,407) | (165,213) | (1,395,472) |
| Net decrease | (147,849) | (1,563,453) | (160,181) | (1,351,035) |
| Class C | | | | |
| Subscriptions | 669,621 | 7,026,834 | 347,938 | 3,012,329 |
| Redemptions | (647,396) | (6,447,932) | (733,050) | (6,243,801) |
| Net increase (decrease) | 22,225 | 578,902 | (385,112) | (3,231,472) |
| Class I(c) | | | | |
| Subscriptions | 3,869,395 | 36,628,202 | 8,846,505 | 81,000,588 |
| Redemptions | (24,274,504) | (259,099,630) | (3,042,209) | (27,612,401) |
| Net increase (decrease) | (20,405,109) | (222,471,428) | 5,804,296 | 53,388,187 |
| Class K | | | | |
| Redemptions | (384) | (3,772) | (2,985) | (25,916) |
| Net decrease | (384) | (3,772) | (2,985) | (25,916) |
| Class R | | | | |
| Subscriptions | 455,142 | 4,770,503 | 481,326 | 4,262,363 |
| Redemptions | (457,479) | (4,715,585) | (304,670) | (2,682,379) |
| Net increase (decrease) | (2,337) | 54,918 | 176,656 | 1,579,984 |
| Class R4 | | | | |
| Subscriptions | 1,521,419 | 18,672,721 | 86,478 | 794,913 |
| Redemptions | (80,480) | (899,818) | (74,407) | (686,169) |
| Net increase | 1,440,939 | 17,772,903 | 12,071 | 108,744 |
| Class R5 | | | | |
| Subscriptions | 2,419,008 | 25,924,957 | 11,363,469 | 101,539,595 |
| Redemptions | (3,978,331) | (43,538,318) | (2,177,212) | (19,945,951) |
| Net increase (decrease) | (1,559,323) | (17,613,361) | 9,186,257 | 81,593,644 |
| Class T(d) | | | | |
| Subscriptions | 4,686,354 | 46,837,502 | 5,749,024 | 53,044,085 |
| Redemptions | (10,152,614) | (101,560,216) | (270,509) | (2,678,741) |
| Net increase (decrease) | (5,466,260) | (54,722,714) | 5,478,515 | 50,365,344 |
| Class Y(c) | | | | |
| Subscriptions | 58,448,526 | 687,607,797 | 2,219,755 | 19,740,788 |
| Redemptions | (4,308,072) | (49,918,845) | (646,966) | (5,849,048) |
| Net increase | 54,140,454 | 637,688,952 | 1,572,789 | 13,891,740 |
| Class Z | | | | |
| Subscriptions | 14,602,588 | 151,153,173 | 19,741,973 | 177,835,783 |
| Redemptions | (64,764,300) | (740,553,476) | (41,608,748) | (372,989,197) |
| Net decrease | (50,161,712) | (589,400,303) | (21,866,775) | (195,153,414) |
| Total net decrease | (25,118,882) | (260,416,367) | (2,934,046) | (23,495,888) |
| (a) | Effective July 17, 2017, Class B shares were automatically converted to Class A shares. |
| (b) | Includes conversions of Class B shares to Class A shares, if any. |
| (c) | Effective March 27, 2017, Class I shares were redeemed or exchanged for Class Y shares. |
| (d) | Prior to March 27, 2017, Class T shares were known as Class W shares. |
The accompanying Notes to Financial Statements are an integral part of this statement.
| 18 | Columbia Emerging Markets Fund | Annual Report 2017 |
[THIS PAGE INTENTIONALLY LEFT BLANK]
Columbia Emerging Markets Fund | Annual Report 2017
| 19 |
The following table is intended to help you understand the Fund’s financial performance. Certain information reflects financial results for a single share of a class held for the periods shown. Per share net investment income (loss) amounts are calculated based on average shares outstanding during the period. Total return assumes reinvestment of all dividends and distributions, if any. Total return does not reflect payment of sales charges, if any. Total return and portfolio turnover are not annualized for periods of less than one year. The portfolio turnover rate is calculated without regard to purchase and sales transactions of short-term instruments and certain derivatives, if any. If such transactions were included, the Fund’s portfolio turnover rate may be higher.
| Year ended | Net asset value,
beginning of
period | Net
investment
income
(loss) | Net
realized
and
unrealized
gain (loss) | Total from
investment
operations | Distributions
from net
investment
income |
| Class A(c) |
| 8/31/2017 | $9.99 | 0.01 | 2.62 | 2.63 | — |
| 8/31/2016 | $8.79 | (0.01) | 1.21 | 1.20 | — |
| 8/31/2015 | $10.94 | (0.01) | (2.14) | (2.15) | (0.00) (f) |
| 8/31/2014 | $9.13 | (0.01) | 1.84 | 1.83 | (0.02) |
| 8/31/2013 | $9.08 | 0.14 | (0.05) | 0.09 | (0.04) |
| Class C |
| 8/31/2017 | $9.54 | (0.06) | 2.48 | 2.42 | — |
| 8/31/2016 | $8.45 | (0.08) | 1.17 | 1.09 | — |
| 8/31/2015 | $10.60 | (0.08) | (2.07) | (2.15) | — |
| 8/31/2014 | $8.90 | (0.08) | 1.78 | 1.70 | — |
| 8/31/2013 | $8.89 | 0.05 | (0.03) | 0.02 | (0.01) |
| Class K |
| 8/31/2017 | $10.04 | 0.03 | 2.63 | 2.66 | — |
| 8/31/2016 | $8.82 | (0.01) | 1.23 | 1.22 | — |
| 8/31/2015 | $10.98 | (0.01) | (2.13) | (2.14) | (0.02) |
| 8/31/2014 | $9.17 | (0.00) (f) | 1.85 | 1.85 | (0.04) |
| 8/31/2013 (g) | $10.44 | 0.11 | (1.38) | (1.27) | — |
| Class R |
| 8/31/2017 | $9.89 | (0.01) | 2.59 | 2.58 | — |
| 8/31/2016 | $8.72 | (0.03) | 1.20 | 1.17 | — |
| 8/31/2015 | $10.89 | (0.03) | (2.14) | (2.17) | — |
| 8/31/2014 | $9.09 | (0.03) | 1.83 | 1.80 | — |
| 8/31/2013 | $9.06 | 0.11 | (0.05) | 0.06 | (0.03) |
| Class R4 |
| 8/31/2017 | $10.14 | 0.07 | 2.63 | 2.70 | — |
| 8/31/2016 | $8.90 | 0.01 | 1.23 | 1.24 | — |
| 8/31/2015 | $11.08 | 0.09 | (2.24) | (2.15) | (0.03) |
| 8/31/2014 | $9.24 | 0.04 | 1.84 | 1.88 | (0.04) |
| 8/31/2013 (i) | $10.42 | 0.06 | (1.24) | (1.18) | — |
The accompanying Notes to Financial Statements are an integral part of this statement.
| 20 | Columbia Emerging Markets Fund | Annual Report 2017 |
Total
distributions to
shareholders | Net
asset
value,
end of
period | Total
return | Total gross
expense
ratio to
average
net assets(a) | Total net
expense
ratio to
average
net assets(a),(b) | Net investment
income (loss)
ratio to
average
net assets | Portfolio
turnover | Net
assets,
end of
period
(000’s) |
| |
| — | $12.62 | 26.33% | 1.65% (d) | 1.62% (d),(e) | 0.14% | 51% | $270,816 |
| — | $9.99 | 13.65% | 1.67% (d) | 1.67% (d),(e) | (0.16%) | 81% | $244,190 |
| (0.00) (f) | $8.79 | (19.65%) | 1.62% (d) | 1.62% (d),(e) | (0.07%) | 76% | $238,932 |
| (0.02) | $10.94 | 20.01% | 1.67% (d) | 1.67% (d),(e) | (0.07%) | 80% | $314,231 |
| (0.04) | $9.13 | 0.98% | 1.76% | 1.75% (e) | 1.42% | 81% | $300,601 |
| |
| — | $11.96 | 25.37% | 2.40% (d) | 2.37% (d),(e) | (0.57%) | 51% | $24,616 |
| — | $9.54 | 12.90% | 2.42% (d) | 2.42% (d),(e) | (0.92%) | 81% | $19,419 |
| — | $8.45 | (20.28%) | 2.37% (d) | 2.37% (d),(e) | (0.83%) | 76% | $20,462 |
| — | $10.60 | 19.10% | 2.42% (d) | 2.42% (d),(e) | (0.81%) | 80% | $27,126 |
| (0.01) | $8.90 | 0.26% | 2.53% | 2.50% (e) | 0.49% | 81% | $23,756 |
| |
| — | $12.70 | 26.49% | 1.47% (d) | 1.47% (d) | 0.31% | 51% | $95 |
| — | $10.04 | 13.83% | 1.52% (d) | 1.52% (d) | (0.07%) | 81% | $79 |
| (0.02) | $8.82 | (19.50%) | 1.44% (d) | 1.44% (d) | (0.06%) | 76% | $96 |
| (0.04) | $10.98 | 20.21% | 1.47% (d) | 1.47% (d) | (0.04%) | 80% | $206 |
| — | $9.17 | (12.16%) | 1.51% (h) | 1.51% (h) | 2.21% (h) | 81% | $506 |
| |
| — | $12.47 | 26.09% | 1.90% (d) | 1.87% (d),(e) | (0.08%) | 51% | $12,175 |
| — | $9.89 | 13.42% | 1.92% (d) | 1.92% (d),(e) | (0.37%) | 81% | $9,683 |
| — | $8.72 | (19.93%) | 1.87% (d) | 1.87% (d),(e) | (0.30%) | 76% | $6,997 |
| — | $10.89 | 19.80% | 1.91% (d) | 1.91% (d),(e) | (0.26%) | 80% | $8,237 |
| (0.03) | $9.09 | 0.67% | 2.02% | 2.00% (e) | 1.09% | 81% | $5,863 |
| |
| — | $12.84 | 26.63% | 1.41% (d) | 1.37% (d),(e) | 0.68% | 51% | $21,298 |
| — | $10.14 | 13.93% | 1.42% (d) | 1.42% (d),(e) | 0.13% | 81% | $2,205 |
| (0.03) | $8.90 | (19.45%) | 1.39% (d) | 1.39% (d),(e) | 0.91% | 76% | $1,827 |
| (0.04) | $11.08 | 20.36% | 1.41% (d) | 1.41% (d),(e) | 0.35% | 80% | $301 |
| — | $9.24 | (11.32%) | 1.54% (h) | 1.53% (e),(h) | 1.31% (h) | 81% | $37 |
Columbia Emerging Markets Fund | Annual Report 2017
| 21 |
Financial Highlights (continued)
| Year ended | Net asset value,
beginning of
period | Net
investment
income
(loss) | Net
realized
and
unrealized
gain (loss) | Total from
investment
operations | Distributions
from net
investment
income |
| Class R5 |
| 8/31/2017 | $10.12 | 0.06 | 2.66 | 2.72 | — |
| 8/31/2016 | $8.87 | 0.05 | 1.20 | 1.25 | — |
| 8/31/2015 | $11.05 | 0.11 | (2.24) | (2.13) | (0.05) |
| 8/31/2014 | $9.22 | 0.05 | 1.84 | 1.89 | (0.06) |
| 8/31/2013 (j) | $9.72 | 0.13 | (0.57) | (0.44) | (0.06) |
| Class T(k) |
| 8/31/2017 | $9.99 | (0.05) | 2.67 | 2.62 | — |
| 8/31/2016 | $8.78 | (0.02) | 1.23 | 1.21 | — |
| 8/31/2015 | $10.94 | (0.02) | (2.14) | (2.16) | (0.00) (f) |
| 8/31/2014 | $9.13 | (0.07) | 1.89 | 1.82 | (0.01) |
| 8/31/2013 | $9.07 | 0.02 | 0.08 (l) | 0.10 | (0.04) |
| Class Y(m) |
| 8/31/2017 | $10.17 | 0.10 | 2.63 | 2.73 | — |
| 8/31/2016 | $8.90 | 0.05 | 1.22 | 1.27 | — |
| 8/31/2015 | $11.09 | 0.05 | (2.19) | (2.14) | (0.05) |
| 8/31/2014 | $9.24 | 0.06 | 1.85 | 1.91 | (0.06) |
| 8/31/2013 (n) | $9.74 | 0.09 | (0.53) | (0.44) | (0.06) |
| Class Z |
| 8/31/2017 | $10.07 | 0.04 | 2.65 | 2.69 | — |
| 8/31/2016 | $8.84 | 0.01 | 1.22 | 1.23 | — |
| 8/31/2015 | $11.00 | 0.02 | (2.15) | (2.13) | (0.03) |
| 8/31/2014 | $9.18 | 0.03 | 1.83 | 1.86 | (0.04) |
| 8/31/2013 | $9.11 | 0.09 | 0.03 (l) | 0.12 | (0.05) |
| Notes to Financial Highlights |
| (a) | In addition to the fees and expenses that the Fund bears directly, the Fund indirectly bears a pro rata share of the fees and expenses of any other funds in which it invests. Such indirect expenses are not included in the Fund’s reported expense ratios. |
| (b) | Total net expenses include the impact of certain fee waivers/expense reimbursements made by the Investment Manager and certain of its affiliates, if applicable. |
| (c) | Effective July 17, 2017, Class B shares were automatically converted to Class A shares. |
| (d) | Ratios include line of credit interest expense which is less than 0.01%. |
| (e) | The benefits derived from expense reductions had an impact of less than 0.01%. |
| (f) | Rounds to zero. |
| (g) | Class K shares commenced operations on February 28, 2013. Per share data and total return reflect activity from that date. |
| (h) | Annualized. |
| (i) | Class R4 shares commenced operations on March 19, 2013. Per share data and total return reflect activity from that date. |
| (j) | Class R5 shares commenced operations on November 8, 2012. Per share data and total return reflect activity from that date. |
| (k) | Prior to March 27, 2017, Class T shares were known as Class W shares. |
| (l) | Calculation of the net gain (loss) per share (both realized and unrealized) does not correlate to the aggregate realized and unrealized gain (loss) presented in the Statement of Operations due to the timing of subscriptions and redemptions of Fund shares in relation to fluctuations in the market value of the portfolio. |
| (m) | Effective March 27, 2017, Class I shares were redeemed or exchanged for Class Y shares. |
| (n) | Class Y shares commenced operations on November 8, 2012. Per share data and total return reflect activity from that date. |
The accompanying Notes to Financial Statements are an integral part of this statement.
| 22 | Columbia Emerging Markets Fund | Annual Report 2017 |
Total
distributions to
shareholders | Net
asset
value,
end of
period | Total
return | Total gross
expense
ratio to
average
net assets(a) | Total net
expense
ratio to
average
net assets(a),(b) | Net investment
income (loss)
ratio to
average
net assets | Portfolio
turnover | Net
assets,
end of
period
(000’s) |
| |
| — | $12.84 | 26.88% | 1.22% (d) | 1.22% (d) | 0.57% | 51% | $123,364 |
| — | $10.12 | 14.09% | 1.26% (d) | 1.26% (d) | 0.54% | 81% | $113,041 |
| (0.05) | $8.87 | (19.35%) | 1.21% (d) | 1.21% (d) | 1.08% | 76% | $17,559 |
| (0.06) | $11.05 | 20.58% | 1.22% (d) | 1.22% (d) | 0.46% | 80% | $3,087 |
| (0.06) | $9.22 | (4.60%) | 1.32% (h) | 1.29% (h) | 1.65% (h) | 81% | $1,381 |
| |
| — | $12.61 | 26.23% | 1.65% (d) | 1.63% (d),(e) | (0.50%) | 51% | $237 |
| — | $9.99 | 13.78% | 1.67% (d) | 1.67% (d),(e) | (0.24%) | 81% | $54,785 |
| (0.00) (f) | $8.78 | (19.74%) | 1.62% (d) | 1.62% (d),(e) | (0.15%) | 76% | $57 |
| (0.01) | $10.94 | 19.98% | 1.67% (d) | 1.67% (d),(e) | (0.68%) | 80% | $133 |
| (0.04) | $9.13 | 1.09% | 1.91% | 1.77% (e) | 0.25% | 81% | $31,426 |
| |
| — | $12.90 | 26.84% | 1.19% (d) | 1.19% (d) | 0.86% | 51% | $726,291 |
| — | $10.17 | 14.27% | 1.20% (d) | 1.20% (d) | 0.58% | 81% | $22,104 |
| (0.05) | $8.90 | (19.34%) | 1.15% (d) | 1.15% (d) | 0.46% | 76% | $5,351 |
| (0.06) | $11.09 | 20.73% | 1.19% (d) | 1.19% (d) | 0.56% | 80% | $4,148 |
| (0.06) | $9.24 | (4.57%) | 1.31% (h) | 1.31% (h) | 1.16% (h) | 81% | $465 |
| |
| — | $12.76 | 26.71% | 1.40% (d) | 1.37% (d),(e) | 0.39% | 51% | $179,501 |
| — | $10.07 | 13.91% | 1.42% (d) | 1.42% (d),(e) | 0.07% | 81% | $647,011 |
| (0.03) | $8.84 | (19.41%) | 1.37% (d) | 1.37% (d),(e) | 0.18% | 76% | $760,839 |
| (0.04) | $11.00 | 20.28% | 1.41% (d) | 1.41% (d),(e) | 0.25% | 80% | $1,060,340 |
| (0.05) | $9.18 | 1.29% | 1.60% | 1.52% (e) | 0.94% | 81% | $646,228 |
Columbia Emerging Markets Fund | Annual Report 2017
| 23 |
Notes to Financial Statements
August 31, 2017
Note 1. Organization
Columbia Emerging Markets Fund (the Fund), a series of Columbia Funds Series Trust I (the Trust), is a diversified fund. The Trust is registered under the Investment Company Act of 1940, as amended (the 1940 Act), as an open-end management investment company organized as a Massachusetts business trust.
Fund shares
The Trust may issue an unlimited number of shares (without par value). Although all share classes generally have identical voting, dividend and liquidation rights, each share class votes separately when required by the Trust’s organizational documents or by law. Different share classes pay different distribution amounts to the extent the expenses of such share classes differ, and distributions in liquidation will be proportional to the net asset value of each share class. Each share class has its own expense and sales charge structure. The Fund offers each of the share classes identified below.
Class A shares are subject to a maximum front-end sales charge of 5.75% based on the initial investment amount. Class A shares purchased without an initial sales charge in accounts aggregating $1 million to $50 million at the time of purchase are subject to a contingent deferred sales charge (CDSC) if the shares are sold within 18 months after purchase, charged as follows: 1.00% CDSC if redeemed within 12 months after purchase, and 0.50% CDSC if redeemed more than 12, but less than 18, months after purchase.
Class B shares of the Fund are no longer offered for sale. When available, Class B shares were subject to a maximum CDSC of 5.00% based upon the holding period after purchase. Effective July 17, 2017, Class B shares were automatically converted to Class A shares without a CDSC. On August 4, 2017, the capital owned by Columbia Management Investment Advisers, LLC in Class B shares was redeemed without a CDSC.
Class C shares are subject to a 1.00% CDSC on shares redeemed within 12 months after purchase.
The Fund no longer accepts investments by new or existing investors in Class I shares. Class I shares, when available, were not subject to sales charges, and were made available only to the Columbia Family of Funds. On March 27, 2017, Class I shares were redeemed or exchanged for Class Y shares of the Fund in a tax free transaction that had no impact on the fees and expenses paid by shareholders.
Class K shares are not subject to sales charges; however, this share class is closed to new investors.
Class R shares are not subject to sales charges and are generally available only to certain retirement plans and other investors as described in the Fund’s prospectus.
Class R4 shares are not subject to sales charges and are generally available only to omnibus retirement plans and certain investors as described in the Fund’s prospectus. Effective November 1, 2017, Class R4 shares will be renamed Advisor Class shares.
Class R5 shares are not subject to sales charges and are generally available only to investors purchasing through authorized investment professionals and omnibus retirement plans as described in the Fund’s prospectus. Effective November 1, 2017, Class R5 shares will be renamed Institutional 2 Class shares.
Class T shares are subject to a maximum front-end sales charge of 2.50% per transaction and must be purchased through financial intermediaries that, by written agreement with Columbia Management Investment Distributors, Inc., are specifically authorized to sell Class T shares. Prior to March 27, 2017, Class T shares were known as Class W shares, were not subject to sales charges, and were generally available only to investors purchasing through authorized investment programs managed by investment professionals, including discretionary managed accounts.
Class Y shares are not subject to sales charges and are available to institutional and certain other investors as described in the Fund’s prospectus. Effective November 1, 2017, Class Y shares will be renamed Institutional 3 Class shares.
Class Z shares are not subject to sales charges and are generally available only to eligible investors, which are subject to different investment minimums as described in the Fund’s prospectus. Effective November 1, 2017, Class Z shares will be renamed Institutional Class shares.
| 24 | Columbia Emerging Markets Fund | Annual Report 2017 |
Notes to Financial Statements (continued)
August 31, 2017
Note 2. Summary of significant accounting policies
Basis of preparation
The Fund is an investment company that applies the accounting and reporting guidance in the Financial Accounting Standards Board (FASB) Accounting Standards Codification Topic 946, Financial Services - Investment Companies (ASC 946). The financial statements are prepared in accordance with U.S. generally accepted accounting principles (GAAP), which requires management to make certain estimates and assumptions that affect the reported amounts of assets and liabilities, the disclosure of contingent assets and liabilities at the date of the financial statements and the reported amounts of income and expenses during the reporting period. Actual results could differ from those estimates.
The following is a summary of significant accounting policies followed by the Fund in the preparation of its financial statements.
Security valuation
All equity securities are valued at the close of business of the New York Stock Exchange. Equity securities are valued at the last quoted sales price on the principal exchange or market on which they trade, except for securities traded on the NASDAQ Stock Market, which are valued at the NASDAQ official close price. Unlisted securities or listed securities for which there were no sales during the day are valued at the mean of the latest quoted bid and ask prices on such exchanges or markets.
Foreign equity securities are valued based on the closing price on the foreign exchange in which such securities are primarily traded. If any foreign equity security closing prices are not readily available, the securities are valued at the mean of the latest quoted bid and ask prices on such exchanges or markets. Foreign currency exchange rates are generally determined at 4:00 p.m. Eastern (U.S.) time. Many securities markets and exchanges outside the U.S. close prior to the close of the New York Stock Exchange; therefore, the closing prices for securities in such markets or on such exchanges may not fully reflect events that occur after such close but before the close of the New York Stock Exchange. In those situations, foreign securities will be fair valued pursuant to a policy adopted by the Board of Trustees, including, if available, utilizing a third party pricing service to determine these fair values. The third party pricing service takes into account multiple factors, including, but not limited to, movements in the U.S. securities markets, certain depositary receipts, futures contracts and foreign exchange rates that have occurred subsequent to the close of the foreign exchange or market, to determine a good faith estimate that reasonably reflects the current market conditions as of the close of the New York Stock Exchange. The fair value of a security is likely to be different from the quoted or published price, if available.
Investments in open-end investment companies, including money market funds, are valued at their latest net asset value.
Investments for which market quotations are not readily available, or that have quotations which management believes are not reflective of market value or reliable, are valued at fair value as determined in good faith under procedures approved by and under the general supervision of the Board of Trustees. If a security or class of securities (such as foreign securities) is valued at fair value, such value is likely to be different from the quoted or published price for the security.
The determination of fair value often requires significant judgment. To determine fair value, management may use assumptions including but not limited to future cash flows and estimated risk premiums. Multiple inputs from various sources may be used to determine fair value.
GAAP requires disclosure regarding the inputs and valuation techniques used to measure fair value and any changes in valuation inputs or techniques. In addition, investments shall be disclosed by major category. This information is disclosed following the Fund’s Portfolio of Investments.
Foreign currency transactions and translations
The values of all assets and liabilities denominated in foreign currencies are generally translated into U.S. dollars at exchange rates determined at the close of regular trading on the New York Stock Exchange. Net realized and unrealized gains (losses) on foreign currency transactions and translations include gains (losses) arising from the fluctuation in exchange
Columbia Emerging Markets Fund | Annual Report 2017
| 25 |
Notes to Financial Statements (continued)
August 31, 2017
rates between trade and settlement dates on securities transactions, gains (losses) arising from the disposition of foreign currency and currency gains (losses) between the accrual and payment dates on dividends, interest income and foreign withholding taxes.
For financial statement purposes, the Fund does not distinguish that portion of gains (losses) on investments which is due to changes in foreign exchange rates from that which is due to changes in market prices of the investments. Such fluctuations are included with the net realized and unrealized gains (losses) on investments in the Statement of Operations.
Security transactions
Security transactions are accounted for on the trade date. Cost is determined and gains (losses) are based upon the specific identification method for both financial statement and federal income tax purposes.
Income recognition
Corporate actions and dividend income are generally recorded net of any non-reclaimable tax withholdings, on the ex-dividend date or upon receipt of ex-dividend notification in the case of certain foreign securities.
The Fund may receive distributions from holdings in equity securities, business development companies (BDCs), exchange-traded funds (ETFs), limited partnerships (LPs), other regulated investment companies (RICs), and real estate investment trusts (REITs), which report information on the tax character of their distributions annually. These distributions are allocated to dividend income, capital gain and return of capital based on actual information reported. Return of capital is recorded as a reduction of the cost basis of securities held. If the Fund no longer owns the applicable securities, return of capital is recorded as a realized gain. With respect to REITs, to the extent actual information has not yet been reported, estimates for return of capital are made by the Fund’s management. Management’s estimates are subsequently adjusted when the actual character of the distributions is disclosed by the REITs, which could result in a proportionate change in return of capital to shareholders.
Awards from class action litigation are recorded as a reduction of cost basis if the Fund still owns the applicable securities on the payment date. If the Fund no longer owns the applicable securities, the proceeds are recorded as realized gains.
Expenses
General expenses of the Trust are allocated to the Fund and other funds of the Trust based upon relative net assets or other expense allocation methodologies determined by the nature of the expense. Expenses directly attributable to the Fund are charged to the Fund. Expenses directly attributable to a specific class of shares are charged to that share class.
Determination of class net asset value
All income, expenses (other than class-specific expenses, which are charged to that share class, as shown in the Statement of Operations) and realized and unrealized gains (losses) are allocated to each class of the Fund on a daily basis, based on the relative net assets of each class, for purposes of determining the net asset value of each class.
Federal income tax status
The Fund intends to qualify each year as a regulated investment company under Subchapter M of the Internal Revenue Code, as amended, and will distribute substantially all of its taxable income (including net short-term capital gains) and capital gains, if any, for its tax year, and as such will not be subject to federal income taxes. In addition, the Fund intends to distribute in each calendar year substantially all of its net investment income, capital gains and certain other amounts, if any, such that the Fund should not be subject to federal excise tax. Therefore, no federal income or excise tax provision is recorded.
Foreign taxes
The Fund may be subject to foreign taxes on income, gains on investments or currency repatriation, a portion of which may be recoverable. The Fund will accrue such taxes and recoveries, as applicable, based upon its current interpretation of tax rules and regulations that exist in the markets in which it invests.
| 26 | Columbia Emerging Markets Fund | Annual Report 2017 |
Notes to Financial Statements (continued)
August 31, 2017
Realized gains in certain countries may be subject to foreign taxes at the Fund level, based on statutory rates. The Fund accrues for such foreign taxes on realized and unrealized gains at the appropriate rate for each jurisdiction, as applicable. The amount, if any, is disclosed as a liability on the Statement of Assets and Liabilities.
Distributions to shareholders
Distributions from net investment income, if any, are declared and paid annually. Net realized capital gains, if any, are distributed along with the income distribution. Income distributions and capital gain distributions are determined in accordance with federal income tax regulations, which may differ from GAAP.
Guarantees and indemnifications
Under the Trust’s organizational documents and, in some cases, by contract, its officers and trustees are indemnified against certain liabilities arising out of the performance of their duties to the Trust or its funds. In addition, certain of the Fund’s contracts with its service providers contain general indemnification clauses. The Fund’s maximum exposure under these arrangements is unknown since the amount of any future claims that may be made against the Fund cannot be determined, and the Fund has no historical basis for predicting the likelihood of any such claims.
Recent accounting pronouncement
Accounting Standards Update 2017-08 Premium Amortization on Purchased Callable Debt Securities
In March 2017, the Financial Accounting Standards Board issued Accounting Standards Update (ASU) No. 2017-08 Premium Amortization on Purchased Callable Debt Securities. ASU No. 2017-08 updates the accounting standards to shorten the amortization period for certain purchased callable debt securities, held at a premium, to be amortized to the earliest call date. The update applies to securities with explicit, noncontingent call features that are callable at fixed prices and on preset dates. The standard is effective for annual periods beginning after December 15, 2018 and interim periods within those fiscal years. At this time, management is evaluating the implication of this guidance and the impact it will have on the financial statement amounts and footnote disclosures, if any.
Note 3. Fees and other transactions with affiliates
Management services fees
The Fund has entered into a Management Agreement with Columbia Management Investment Advisers, LLC (the Investment Manager), a wholly-owned subsidiary of Ameriprise Financial, Inc. (Ameriprise Financial). Under the Management Agreement, the Investment Manager provides the Fund with investment research and advice, as well as administrative and accounting services. The management services fee is an annual fee that is equal to a percentage of the Fund’s daily net assets that declines from 1.10% to 0.70% as the Fund’s net assets increase. Prior to July 1, 2017, the management services fee was an annual fee that was equal to a percentage of the Fund’s daily net assets that declined from 1.18% to 0.72% as the Fund’s net assets increased. The effective management services fee rate for the year ended August 31, 2017 was 1.08% of the Fund’s average daily net assets.
Compensation of board members
Members of the Board of Trustees, who are not officers or employees of the Investment Manager or Ameriprise Financial, are compensated for their services to the Fund as disclosed in the Statement of Operations. These members of the Board of Trustees may participate in a Deferred Compensation Plan (the Plan) which may be terminated at any time. Obligations of the Plan will be paid solely out of the Fund’s assets, and all amounts payable under the Plan constitute a general unsecured obligation of the Fund.
Compensation of Chief Compliance Officer
The Board of Trustees has appointed a Chief Compliance Officer to the Fund in accordance with federal securities regulations. A portion of the Chief Compliance Officer’s total compensation is allocated to the Fund, along with other affiliated funds governed by the Board of Trustees, based on relative net assets. The total amount allocated to all affiliated funds governed by the Board of Trustees will not exceed $40,000 annually.
Columbia Emerging Markets Fund | Annual Report 2017
| 27 |
Notes to Financial Statements (continued)
August 31, 2017
Transfer agency fees
Under a Transfer and Dividend Disbursing Agent Agreement, Columbia Management Investment Services Corp. (the Transfer Agent), an affiliate of the Investment Manager and a wholly-owned subsidiary of Ameriprise Financial, is responsible for providing transfer agency services to the Fund. The Transfer Agent has contracted with Boston Financial Data Services (BFDS) to serve as sub-transfer agent. The Transfer Agent pays the fees of BFDS for services as sub-transfer agent and BFDS is not entitled to reimbursement for such fees from the Fund (with the exception of out-of-pocket fees).
The Fund pays the Transfer Agent a monthly transfer agency fee based on the number or the average value of accounts, depending on the type of account. In addition, prior to October 1, 2016, the Transfer Agent also received sub-transfer agency fees based on a percentage of the average aggregate value of the Fund’s shares maintained in omnibus accounts (other than omnibus accounts for which American Enterprise Investment Services Inc. is the broker of record or accounts where the beneficial shareholder is a customer of Ameriprise Financial Services, Inc., for which the Transfer Agent receives a per account fee). Effective October 1, 2016, the Fund pays the Transfer Agent a fee for shareholder services based on the number of accounts or on a percentage of the average aggregate value of the Fund’s shares maintained in omnibus accounts up to the lesser of the amount charged by the financial intermediary or a cap established by the Board of Trustees from time to time.
The Transfer Agent also receives compensation from the Fund for various shareholder services and reimbursements for certain out-of-pocket fees. Effective August 1, 2017, total transfer agency fees for Class K, Class R5 and Class Y shares are subject to an annual limitation of not more than 0.07%, 0.07% and 0.02%, respectively, of the average daily net assets attributable to each share class. From January 1, 2017 to July 31, 2017, these limitations were 0.075% for Class K and Class R5 shares and 0.025% for Class I and Class Y shares; and prior to January 1, 2017, the limitation was 0.05% for Class K and Class R5 shares and Class I and Class Y shares did not pay transfer agency fees. In addition, effective January 1, 2017 through December 31, 2017, Class I and Class Y shares are subject to a contractual transfer agency fee annual limitation of not more than 0.00% and Class K and Class R5 shares are subject to a contractual transfer agency fee annual limitation of not more than 0.05% of the average daily net assets attributable to each share class.
For the year ended August 31, 2017, the Fund’s effective transfer agency fee rates as a percentage of average daily net assets of each class were as follows:
| | Effective rate (%) |
| Class A | 0.23 |
| Class B | 0.22 (a),(b) |
| Class C | 0.23 |
| Class I | 0.00 (b),(c) |
| Class K | 0.05 |
| Class R | 0.23 |
| Class R4 | 0.22 |
| Class R5 | 0.05 |
| Class T | 0.24 |
| Class Y | 0.00 |
| Class Z | 0.23 |
| (a) | Effective July 17, 2017, Class B shares were automatically converted to Class A shares. |
| (b) | Unannualized. |
| (c) | Effective March 27, 2017, Class I shares were redeemed or exchanged for Class Y shares. |
The Fund and certain other associated investment companies have severally, but not jointly, guaranteed the performance and observance of all the terms and conditions of a lease entered into by Seligman Data Corp. (SDC), the former transfer agent, including the payment of rent by SDC (the Guaranty). SDC was the legacy Seligman funds’ former transfer agent.
The lease and the Guaranty expire in January 2019. At August 31, 2017, the Fund’s total potential future obligation over the life of the Guaranty is $22,308. The liability remaining at August 31, 2017 for non-recurring charges associated with the lease amounted to $11,499 and is recorded as a part of the payable for other expenses in the Statement of Assets and Liabilities.
| 28 | Columbia Emerging Markets Fund | Annual Report 2017 |
Notes to Financial Statements (continued)
August 31, 2017
An annual minimum account balance fee of $20 may apply to certain accounts with a value below the applicable share class’s initial minimum investment requirements to reduce the impact of small accounts on transfer agency fees. These minimum account balance fees are remitted to the Fund and recorded as part of expense reductions in the Statement of Operations. For the year ended August 31, 2017, these minimum account balance fees reduced total expenses of the Fund by $1,702.
Plan administration fees
Under a Plan Administration Services Agreement with the Transfer Agent, the Fund pays an annual fee at a rate of 0.25% of the Fund’s average daily net assets attributable to Class K shares for the provision of various administrative, recordkeeping, communication and educational services.
Distribution and service fees
The Fund has entered into an agreement with Columbia Management Investment Distributors, Inc. (the Distributor), an affiliate of the Investment Manager and a wholly-owned subsidiary of Ameriprise Financial, for distribution and shareholder services. The Board of Trustees has approved, and the Fund has adopted, distribution and shareholder service plans (the Plans) applicable to certain share classes, which set the distribution and service fees for the Fund. These fees are calculated daily and are intended to compensate the Distributor and/or eligible selling and/or servicing agents for selling shares of the Fund and providing services to investors.
Under the Plans, the Fund pays a monthly service fee to the Distributor at the maximum annual rate of 0.25% of the average daily net assets attributable to Class A, Class B, Class C and Class T shares of the Fund. Also under the Plans, the Fund pays a monthly distribution fee to the Distributor at the maximum annual rates of 0.75%, 0.75%, 0.50% and 0.25% of the average daily net assets attributable to Class B, Class C, Class R and Class T shares of the Fund, respectively. As a result of all Class B shares of the Fund being redeemed or converted to Class A shares, August 4, 2017 was the last day the Fund paid a service fee or distribution fee for Class B shares.
Although the Fund may pay a distribution fee up to 0.25% of the Fund’s average daily net assets attributable to Class T shares and a service fee of up to 0.25% of the Fund’s average daily net assets attributable to Class T shares, the aggregate fee shall not exceed 0.25% of the Fund’s average daily net assets attributable to Class T shares.
Sales charges (unaudited)
Sales charges, including front-end charges and CDSCs, received by the Distributor for distributing Fund shares for the year ended August 31, 2017, if any, are listed below:
| | Amount ($) |
| Class A | 223,406 |
| Class C | 528 |
Columbia Emerging Markets Fund | Annual Report 2017
| 29 |
Notes to Financial Statements (continued)
August 31, 2017
Expenses waived/reimbursed by the Investment Manager and its affiliates
The Investment Manager and certain of its affiliates have contractually agreed to waive fees and/or reimburse expenses (excluding certain fees and expenses described below) for the period(s) disclosed below, unless sooner terminated at the sole discretion of the Board of Trustees, so that the Fund’s net operating expenses, after giving effect to fees waived/expenses reimbursed and any balance credits and/or overdraft charges from the Fund’s custodian, do not exceed the following annual rate(s) as a percentage of the class’ average daily net assets:
| | January 1, 2017
through
December 31, 2017 | Prior to
January 1, 2017 |
| Class A | 1.61% | 1.75% |
| Class C | 2.36 | 2.50 |
| Class K | 1.515 | 1.62 |
| Class R | 1.86 | 2.00 |
| Class R4 | 1.36 | 1.50 |
| Class R5 | 1.265 | 1.37 |
| Class T | 1.61 | 1.75 |
| Class Y | 1.215 | 1.32 |
| Class Z | 1.36 | 1.50 |
Under the agreement governing these fee waivers and/or expense reimbursement arrangements, the following fees and expenses are excluded from the waiver/reimbursement commitment, and therefore will be paid by the Fund, if applicable: taxes (including foreign transaction taxes), expenses associated with investments in affiliated and non-affiliated pooled investment vehicles (including mutual funds and exchange-traded funds), transaction costs and brokerage commissions, costs related to any securities lending program, dividend expenses associated with securities sold short, inverse floater program fees and expenses, transaction charges and interest on borrowed money, interest, infrequent and/or unusual expenses and any other expenses the exclusion of which is specifically approved by the Board of Trustees. This agreement may be modified or amended only with approval from the Investment Manager, certain of its affiliates and the Fund. Reflected in the contractual cap commitment, effective January 1, 2017 through December 31, 2017, is the Transfer Agent’s contractual agreement to limit total transfer agency fees to an annual rate of not more than 0.00% for Class Y and 0.05% for Class K and R5 of the average daily net assets attributable to each share class, unless sooner terminated at the sole discretion of the Board of Trustees. Any fees waived and/or expenses reimbursed under the expense reimbursement arrangements described above are not recoverable by the Investment Manager or its affiliates in future periods.
Note 4. Federal tax information
The timing and character of income and capital gain distributions are determined in accordance with income tax regulations, which may differ from GAAP because of temporary or permanent book to tax differences.
At August 31, 2017, these differences are primarily due to differing treatment for deferral/reversal of wash sale losses, passive foreign investment company (PFIC) holdings, capital loss carryforwards, trustees’ deferred compensation, foreign currency transactions and foreign capital gains tax. To the extent these differences are permanent, reclassifications are made among the components of the Fund’s net assets in the Statement of Assets and Liabilities. Temporary differences do not require reclassifications.
In the Statement of Assets and Liabilities the following reclassifications were made:
Undistributed net
investment
income ($) | Accumulated
net realized
(loss) ($) | Paid in
capital ($) |
| (1,107,624) | 1,107,624 | — |
Net investment income (loss) and net realized gains (losses), as disclosed in the Statement of Operations, and net assets were not affected by this reclassification.
| 30 | Columbia Emerging Markets Fund | Annual Report 2017 |
Notes to Financial Statements (continued)
August 31, 2017
For the years ended August 31, 2017 and August 31, 2016, there were no distributions.
At August 31, 2017, the components of distributable earnings on a tax basis were as follows:
Undistributed
ordinary income ($) | Undistributed
long-term
capital gains ($) | Capital loss
carryforwards ($) | Net unrealized
appreciation ($) |
| 5,262,111 | — | (74,781,273) | 467,858,395 |
At August 31, 2017, the cost of all investments for federal income tax purposes along with the aggregate gross unrealized appreciation and depreciation based on that cost was:
Federal
tax cost ($) | Gross unrealized
appreciation ($) | Gross unrealized
(depreciation) ($) | Net unrealized
appreciation ($) |
| 891,716,051 | 480,534,591 | (12,676,196) | 467,858,395 |
Tax cost of investments and unrealized appreciation/(depreciation) may also include timing differences that do not constitute adjustments to tax basis.
The following capital loss carryforwards, determined at August 31, 2017, may be available to reduce taxable income arising from future net realized gains on investments, if any, to the extent permitted by the Internal Revenue Code. Capital loss carryforwards with no expiration are required to be utilized prior to any capital losses which carry an expiration date. As a result of this ordering rule, capital loss carryforwards which carry an expiration date may be more likely to expire unused. In addition, for the year ended August 31, 2017, capital loss carryforwards utilized, expired unused and permanently lost, if any, were as follows:
| 2018 ($) | 2019 ($) | No expiration
short-term ($) | No expiration
long-term ($) | Total ($) | Utilized ($) | Expired ($) | Permanently
lost ($) |
| — | — | 74,781,273 | — | 74,781,273 | 71,372,217 | — | — |
Management of the Fund has concluded that there are no significant uncertain tax positions in the Fund that would require recognition in the financial statements. However, management’s conclusion may be subject to review and adjustment at a later date based on factors including, but not limited to, new tax laws, regulations, and administrative interpretations (including relevant court decisions). Generally, the Fund’s federal tax returns for the prior three fiscal years remain subject to examination by the Internal Revenue Service.
Note 5. Portfolio information
The cost of purchases and proceeds from sales of securities, excluding short-term investments and derivatives, if any, aggregated to $649,234,649 and $913,781,131, respectively, for the year ended August 31, 2017. The amount of purchase and sale activity impacts the portfolio turnover rate reported in the Financial Highlights.
Note 6. Affiliated money market fund
The Fund invests in Columbia Short-Term Cash Fund, an affiliated money market fund established for the exclusive use by the Fund and other affiliated funds (the Affiliated MMF). The income earned by the Fund from such investments is included as Dividends - affiliated issuers in the Statement of Operations. As an investing fund, the Fund indirectly bears its proportionate share of the expenses of the Affiliated MMF. Effective October 1, 2016, the Affiliated MMF prices its shares with a floating net asset value (NAV) and no longer seeks to maintain a stable NAV. In addition, the Board of Trustees of the Affiliated MMF may impose a fee on redemptions (sometimes referred to as a liquidity fee) or temporarily suspend redemptions (sometimes referred to as imposing a redemption gate) in the event its liquidity falls below regulatory limits.
Note 7. Line of credit
The Fund has access to a revolving credit facility with a syndicate of banks led by Citibank, N.A., HSBC Bank USA, N.A. and JPMorgan Chase Bank, N.A. whereby the Fund may borrow for the temporary funding of shareholder redemptions or for other temporary or emergency purposes. The credit facility, which is a collective agreement between the Fund and certain other
Columbia Emerging Markets Fund | Annual Report 2017
| 31 |
Notes to Financial Statements (continued)
August 31, 2017
funds managed by the Investment Manager, severally and not jointly, permits collective borrowings up to $1 billion. Interest is charged to each participating fund based on its borrowings at a rate equal to the higher of (i) the overnight federal funds rate plus 1.00% or (ii) the one-month LIBOR rate plus 1.00%. Each borrowing under the credit facility matures no later than 60 days after the date of borrowing. The Fund also pays a commitment fee equal to its pro rata share of the amount of the credit facility at a rate of 0.15% per annum. The commitment fee is included in other expenses in the Statement of Operations.
For the year ended August 31, 2017, the average daily loan balance outstanding on days when borrowing existed was $4,814,286 at a weighted average interest rate of 2.13%. Interest expense incurred by the Fund is recorded as a line of credit interest expense in the Statement of Operations.
Note 8. Significant risks
Financial sector risk
The Fund may be more susceptible to the particular risks that may affect companies in the financial services sector than if it were invested in a wider variety of companies in unrelated sectors. Companies in the financial services sector are subject to certain risks, including the risk of regulatory change, decreased liquidity in credit markets and unstable interest rates. Such companies may have concentrated portfolios, such as a high level of loans to real estate developers, which makes them vulnerable to economic conditions that affect that industry. Performance of such companies may be affected by competitive pressures and exposure to investments or agreements that, under certain circumstances, may lead to losses (e.g., subprime loans). Companies in the financial services sector are subject to extensive governmental regulation that may limit the amount and types of loans and other financial commitments they can make, and interest rates and fees that they may charge. In addition, profitability of such companies is largely dependent upon the availability and the cost of capital.
Foreign securities and emerging market countries risk
Investing in foreign securities may include certain risks and considerations not typically associated with investing in U.S. securities, such as fluctuating currency values and changing local and regional economic, political and social conditions, which may result in greater market volatility. In addition, certain foreign securities may not be as liquid as U.S. securities. Investing in emerging markets may accentuate these risks. These countries are also more likely to experience high levels of inflation, deflation or currency devaluation which could hurt their economies and securities markets. To the extent that the Fund concentrates its investment exposure to any one or a few specific countries, the Fund will be particularly susceptible to the various conditions, events or other factors impacting those countries and may, therefore, have a greater risk than that of a fund which is more geographically diversified.
Shareholder concentration risk
At August 31, 2017, one unaffiliated shareholder of record owned 34.5% of the outstanding shares of the Fund in one or more accounts. The Fund has no knowledge about whether any portion of those shares was owned beneficially. Affiliated shareholders of record owned 37.1% of the outstanding shares of the Fund in one or more accounts. Subscription and redemption activity by concentrated accounts may have a significant effect on the operations of the Fund. In the case of a large redemption, the Fund may be forced to sell investments at inopportune times, including its liquid positions, which may result in Fund losses and the Fund holding a higher percentage of less liquid positions. Large redemptions could result in decreased economies of scale and increased operating expenses for non-redeeming Fund shareholders.
Technology and technology-related investment risk
The Fund may be more susceptible to the particular risks that may affect companies in the information technology sector, as well as other technology-related sectors (collectively, the technology sectors) than if it were invested in a wider variety of companies in unrelated sectors. Companies in the technology sectors are subject to certain risks, including the risk that new services, equipment or technologies will not be accepted by consumers and businesses or will become rapidly obsolete. Performance of such companies may be affected by factors including obtaining and protecting patents (or the failure to do so) and significant competitive pressures, including aggressive pricing of their products or services, new market entrants, competition for market share and short product cycles due to an accelerated rate of technological developments. Such
| 32 | Columbia Emerging Markets Fund | Annual Report 2017 |
Notes to Financial Statements (continued)
August 31, 2017
competitive pressures may lead to limited earnings and/or falling profit margins. As a result, the value of their securities may fall or fail to rise. In addition, many technology sector companies have limited operating histories and prices of these companies’ securities historically have been more volatile than other securities, especially over the short term.
Note 9. Subsequent events
Management has evaluated the events and transactions that have occurred through the date the financial statements were issued. Other than as noted in Note 1 above, there were no items requiring adjustment of the financial statements or additional disclosure.
Note 10. Information regarding pending and settled legal proceedings
Ameriprise Financial and certain of its affiliates have historically been involved in a number of legal, arbitration and regulatory proceedings, including routine litigation, class actions, and governmental actions, concerning matters arising in connection with the conduct of their business activities. Ameriprise Financial believes that the Fund is not currently the subject of, and that neither Ameriprise Financial nor any of its affiliates are the subject of, any pending legal, arbitration or regulatory proceedings that are likely to have a material adverse effect on the Fund or the ability of Ameriprise Financial or its affiliates to perform under their contracts with the Fund. Ameriprise Financial is required to make quarterly (10-Q), annual (10-K) and, as necessary, 8-K filings with the Securities and Exchange Commission (SEC) on legal and regulatory matters that relate to Ameriprise Financial and its affiliates. Copies of these filings may be obtained by accessing the SEC website at www.sec.gov.
There can be no assurance that these matters, or the adverse publicity associated with them, will not result in increased Fund redemptions, reduced sale of Fund shares or other adverse consequences to the Fund. Further, although we believe proceedings are not likely to have a material adverse effect on the Fund or the ability of Ameriprise Financial or its affiliates to perform under their contracts with the Fund, these proceedings are subject to uncertainties and, as such, we are unable to estimate the possible loss or range of loss that may result. An adverse outcome in one or more of these proceedings could result in adverse judgments, settlements, fines, penalties or other relief that could have a material adverse effect on the consolidated financial condition or results of operations of Ameriprise Financial.
Columbia Emerging Markets Fund | Annual Report 2017
| 33 |
Report of Independent Registered Public Accounting Firm
To the Trustees of Columbia Funds Series Trust I and the Shareholders of Columbia Emerging Markets Fund
In our opinion, the accompanying statement of assets and liabilities, including the portfolio of investments, and the related statements of operations and of changes in net assets and the financial highlights present fairly, in all material respects, the financial position of Columbia Emerging Markets Fund (the “Fund”, a series of Columbia Funds Series Trust I) as of August 31, 2017, the results of its operations for the year then ended, the changes in its net assets for each of the two years in the period then ended and the financial highlights for each of the five years in the period then ended, in conformity with accounting principles generally accepted in the United States of America. These financial statements and financial highlights (hereafter referred to as “financial statements”) are the responsibility of the Fund’s management. Our responsibility is to express an opinion on these financial statements based on our audits. We conducted our audits of these financial statements in accordance with the standards of the Public Company Accounting Oversight Board (United States). Those standards require that we plan and perform the audit to obtain reasonable assurance about whether the financial statements are free of material misstatement. An audit includes examining, on a test basis, evidence supporting the amounts and disclosures in the financial statements, assessing the accounting principles used and significant estimates made by management, and evaluating the overall financial statement presentation. We believe that our audits, which included confirmation of securities as of August 31, 2017 by correspondence with the custodian, brokers, agent banks, and transfer agent provide a reasonable basis for our opinion.
/s/ PricewaterhouseCoopers LLP
Minneapolis, MN
October 20, 2017
| 34 | Columbia Emerging Markets Fund | Annual Report 2017 |
Federal Income Tax Information
(Unaudited)
The Fund hereby designates the following tax attributes for the fiscal year ended August 31, 2017. Shareholders will be notified in early 2018 of the amounts for use in preparing 2017 income tax returns.
Foreign
taxes paid | Foreign
taxes paid
per share | Foreign
source
income | Foreign
source
income per
share |
| $3,483,344 | $0.03 | $24,881,840 | $0.23 |
Foreign taxes. The Fund makes the election to pass through to shareholders the foreign taxes paid. Eligible shareholders may claim a foreign tax credit. These taxes, and the corresponding foreign source income, are provided.
Columbia Emerging Markets Fund | Annual Report 2017
| 35 |
Shareholders elect the Board that oversees the Fund’s operations. The Board appoints officers who are responsible for day-to-day business decisions based on policies set by the Board. The following table provides basic biographical information about the Fund’s Trustees, including their principal occupations during the past five years, although specific titles for individuals may have varied over the period. The year set forth beneath Length of Service in the table below is the year in which the Trustee was first appointed or elected as Trustee to any Fund currently in the Columbia Funds Complex or a predecessor thereof. Under current Board policy, members serve terms of indefinite duration.
Independent trustees
| Name, address, year of birth | Position held with the Trust and length of service | Principal occupation(s) during the past five years and other relevant professional experience | Number of Funds in the Columbia Fund Complex overseen | Other directorships held by Trustee during the past five years |
Janet Langford Carrig
c/o Columbia Management
Investment Advisers, LLC
225 Franklin Street
Mail Drop BX32 05228
Boston, MA 02110
1957 | Trustee
1996 | Senior Vice President, General Counsel and Corporate Secretary, ConocoPhillips (independent energy company) since September 2007 | 57 | None |
Douglas A. Hacker
c/o Columbia Management
Investment Advisers, LLC
225 Franklin Street
Mail Drop BX32 05228
Boston, MA 02110
1955 | Trustee and Chairman of the Board
1996 | Independent business executive since May 2006; Executive Vice President — Strategy of United Airlines from December 2002 to May 2006; President of UAL Loyalty Services (airline marketing company) from September 2001 to December 2002; Executive Vice President and Chief Financial Officer of United Airlines from July 1999 to September 2001 | 57 | Spartan Nash Company, (food distributor); Nash Finch Company (food distributor) from 2005 to 2013; Aircastle Limited (aircraft leasing); SeaCube Container Leasing Ltd. (container leasing) from 2010 to 2013; and Travelport Worldwide Limited (travel information technology) |
Nancy T. Lukitsh
c/o Columbia Management
Investment Advisers, LLC
225 Franklin Street
Mail Drop BX32 05228
Boston, MA 02110
1956 | Trustee
2011 | Senior Vice President, Partner and Director of Marketing, Wellington Management Company, LLP (investment adviser) from 1997 to 2010; Chair, Wellington Management Portfolios (commingled non-U.S. investment pools) from 2007 to 2010; Director, Wellington Trust Company, NA and other Wellington affiliates from 1997 to 2010 | 57 | None |
David M. Moffett
c/o Columbia Management
Investment Advisers, LLC
225 Franklin Street
Mail Drop BX32 05228
Boston, MA 02110
1952 | Trustee
2011 | Retired. Consultant to Bridgewater and Associates | 57 | Director, CSX Corporation; Genworth Financial, Inc. (financial and insurance products and services); PayPal Holdings Inc. (payment and data processing services); Trustee, University of Oklahoma Foundation; former Director, eBay Inc. (online trading community), 2007-2015; and former Director, CIT Bank, CIT Group Inc. (commercial and consumer finance), 2010-2016 |
| 36 | Columbia Emerging Markets Fund | Annual Report 2017 |
TRUSTEES AND OFFICERS (continued)
Independent trustees (continued)
| Name, address, year of birth | Position held with the Trust and length of service | Principal occupation(s) during the past five years and other relevant professional experience | Number of Funds in the Columbia Fund Complex overseen | Other directorships held by Trustee during the past five years |
Charles R. Nelson
c/o Columbia Management
Investment Advisers, LLC
225 Franklin Street
Mail Drop BX32 05228
Boston, MA 02110
1942 | Trustee
1981 | Retired. Professor Emeritus, University of Washington since 2011; Professor of Economics, University of Washington from 1976 to 2011; Ford and Louisa Van Voorhis Professor of Political Economy, University of Washington from 1993 to 2011; Adjunct Professor of Statistics, University of Washington from 1980 to 2011; Associate Editor, Journal of Money, Credit and Banking from September 1993 to 2008; consultant on econometric and statistical matters | 57 | None |
John J. Neuhauser
c/o Columbia Management
Investment Advisers, LLC
225 Franklin Street
Mail Drop BX32 05228
Boston, MA 02110
1943 | Trustee
1984 | President, Saint Michael’s College since August 2007; Director or Trustee of several non-profit organizations, including University of Vermont Medical Center; Academic Vice President and Dean of Faculties, Boston College from August 1999 to October 2005; University Professor, Boston College from November 2005 to August 2007 | 57 | Liberty All-Star Equity Fund and Liberty All- Star Growth Fund (closed-end funds) |
Patrick J. Simpson
c/o Columbia Management
Investment Advisers, LLC
225 Franklin Street
Mail Drop BX32 05228
Boston, MA 02110
1944 | Trustee
2000 | Of Counsel, Perkins Coie LLP (law firm) since 2015; Partner, Perkins Coie LLP from 1988 to 2014 | 57 | None |
Anne-Lee Verville
c/o Columbia Management
Investment Advisers, LLC
225 Franklin Street
Mail Drop BX32 05228
Boston, MA 02110
1945 | Trustee
1998 | Retired. General Manager, Global Education Industry from 1994 to 1997, President – Application Systems Division from 1991 to 1994, Chief Financial Officer – US Marketing & Services from 1988 to 1991, and Chief Information Officer from 1987 to 1988, IBM Corporation (computer and technology) | 57 | Enesco Group, Inc. (producer of giftware and home and garden decor products) from 2001 to 2006 |
Columbia Emerging Markets Fund | Annual Report 2017
| 37 |
TRUSTEES AND OFFICERS (continued)
Consultants to the Independent Trustees*
| Name, address, year of birth | Position held with the Trust and length of service | Principal occupation(s) during the past five years and other relevant professional experience | Number of Funds in the Columbia Funds complex overseen | Other directorships held by Trustee during the past five years |
J. Kevin Connaughton
c/o Columbia
Management Investment
Advisers, LLC,
225 Franklin Street
Mail Drop BX32 05228,
Boston, MA 02110
1964 | Independent Trustee Consultant
2016 | Independent Trustee Consultant, Columbia Funds since March 2016; Managing Director and General Manager of Mutual Fund Products, Columbia Management Investment Advisers, LLC from May 2010 to February 2015; President, Columbia Funds from 2009 to 2015; and senior officer of Columbia Funds and affiliated funds from 2003 to 2015 | 57 | Board of Governors, Gateway Healthcare since January 2016; Trustee, New Century Portfolios since March 2015; and Director, The Autism Project since March 2015 |
Natalie A. Trunow
c/o Columbia
Management Investment
Advisers, LLC,
225 Franklin Street
Mail Drop BX32 05228,
Boston, MA 02110
1967 | Independent Trustee Consultant
2016 | Independent Trustee Consultant, Columbia Funds since September 2016; Chief Executive Officer, Millennial Partners (investment consulting services to institutions) since January 2016; Director of Investments, Casey Family Programs from April 2016 to September 2016; Senior Vice President and Chief Investment Officer, Calvert Investments from August 2008 to January 2016; Section Head and Portfolio Manager, General Motors Asset Management from June 1997 to August 2008 | 57 | Healthcare Services for Children with Special Needs |
| * | J. Kevin Connaughton was appointed consultant to the Independent Trustees effective March 1, 2016. Natalie A. Trunow was appointed consultant to the Independent Trustees effective September 1, 2016. Shareholders of the Funds are expected to be asked to elect each of Mr. Connaughton and Ms. Trunow as a Trustee at a future shareholder meeting. |
Interested trustee affiliated with Investment Manager*
| Name, address, year of birth | Position held with the Trust and length of service | Principal occupation(s) during the past five years and other relevant professional experience | Number of Funds in the Columbia Funds Complex overseen | Other directorships held by Trustee during the past five years |
William F. Truscott
c/o Columbia Management
Investment Advisers, LLC
225 Franklin Street
Boston, MA 02110
1960 | Trustee
2012 | Chairman of the Board and President, Columbia Management Investment Advisers, LLC since May 2010 and February 2012, respectively; Chief Executive Officer, Global Asset Management, Ameriprise Financial, Inc. since September 2012 (previously Chief Executive Officer, U.S. Asset Management & President, Annuities, May 2010-September 2012); Director and Chief Executive Officer, Columbia Management Investment Distributors, Inc. since May 2010 and February 2012, respectively; Chairman of the Board and Chief Executive Officer, RiverSource Distributors, Inc. since 2006; Director, Threadneedle Asset Management Holdings, SARL since 2014; President and Chief Executive Officer, Ameriprise Certificate Company, 2006-August 2012 | 179 | Chairman of the Board, Columbia Management Investment Advisers, LLC since May 2010; Director, Columbia Management Investment Distributors, Inc. since May 2010; former Director, Ameriprise Certificate Company, 2006 - January 2013 |
| * | Interested person (as defined under the 1940 Act) by reason of being an officer, director, security holder and/or employee of the Investment Manager or Ameriprise Financial. |
The Statement of Additional Information has additional information about the Fund’s Board members and is available,
without charge, upon request by calling 800.345.6611, contacting your financial intermediary or visiting
investor.columbiathreadneedleus.com.
| 38 | Columbia Emerging Markets Fund | Annual Report 2017 |
TRUSTEES AND OFFICERS (continued)
The Board has appointed officers who are responsible for day-to-day business decisions based on policies it has established. The officers serve at the pleasure of the Board. The following table provides basic information about the Officers of the Fund, including principal occupations during the past five years, although their specific titles may have varied over the period. In addition to Mr. Truscott, who is Senior Vice President, the Fund’s other officers are:
Fund officers
Name,
address and
year of birth | Position and year
first appointed to
position for any Fund
in the Columbia
Funds complex or a
predecessor thereof | Principal occupation(s) during past five years |
Christopher O. Petersen
5228 Ameriprise
Financial Center
Minneapolis, MN 55474
Born 1970 | President and Principal Executive Officer (2015) | Vice President and Lead Chief Counsel, Ameriprise Financial, Inc. since January 2015 (previously, Vice President and Chief Counsel, January 2010 - December 2014; officer of Columbia Funds and affiliated funds since 2007. |
Michael G. Clarke
225 Franklin Street
Boston, MA 02110
Born 1969 | Treasurer (2011), Chief Financial Officer (2009) and Chief Accounting Officer (2015) | Vice President — Mutual Fund Administration, Columbia Management Investment Advisers, LLC, since May 2010; senior officer of Columbia Funds and affiliated funds since 2002. |
Paul B. Goucher
100 Park Avenue
New York, NY 10017
Born 1968 | Senior Vice President (2011) and Assistant Secretary (2008) | Senior Vice President and Assistant General Counsel, Ameriprise Financial, Inc. since January 2017 (previously Vice President and Lead Chief Counsel, November 2008 - January 2017 and January 2013 - January 2017, respectively; and Chief Counsel, January 2010 - January 2013); Vice President, Chief Legal Officer and Assistant Secretary, Columbia Management Investment Advisers, LLC since May 2010. |
Thomas P. McGuire
225 Franklin Street
Boston, MA 02110
Born 1972 | Senior Vice President and Chief Compliance Officer (2012) | Vice President — Asset Management Compliance, Ameriprise Financial, Inc., since May 2010; Chief Compliance Officer, Ameriprise Certificate Company since September 2010. |
Colin Moore
225 Franklin Street
Boston, MA 02110
Born 1958 | Senior Vice President (2010) | Executive Vice President and Global Chief Investment Officer, Ameriprise Financial, Inc., since July 2013; Executive Vice President and Global Chief Investment Officer, Columbia Management Investment Advisers, LLC since July 2013 (previously Director and Global Chief Investment Officer, 2010 - 2013). |
Ryan C. Larrenaga
225 Franklin Street
Boston, MA 02110
Born 1970 | Senior Vice President (2017), Chief Legal Officer (2017) and Secretary (2015) | Vice President and Group Counsel, Ameriprise Financial, Inc. since August 2011; officer of Columbia Funds and affiliated funds since 2005. |
Michael E. DeFao
225 Franklin Street
Boston, MA 02110
Born 1968 | Vice President (2011) and Assistant Secretary (2010) | Vice President and Chief Counsel, Ameriprise Financial, Inc. since May 2010. |
Amy Johnson
5228 Ameriprise
Financial Center
Minneapolis, MN 55474
Born 1965 | Vice President (2006) | Managing Director and Global Head of Operations, Columbia Management Investment Advisers, LLC since April 2016 (previously Managing Director and Chief Operating Officer, 2010 - 2016). |
Lyn Kephart-Strong
5228 Ameriprise
Financial Center
Minneapolis, MN 55474
Born 1960 | Vice President (2015) | President, Columbia Management Investment Services Corp. since October 2014; Vice President & Resolution Officer, Ameriprise Trust Company since August 2009. |
Columbia Emerging Markets Fund | Annual Report 2017
| 39 |
Board Consideration and Approval of Management
Agreement
On June 14, 2017, the Board of Trustees (the Board) and the Trustees who are not interested persons (as defined in the Investment Company Act of 1940) (the Independent Trustees) of Columbia Funds Series Trust I (the Trust) unanimously approved the continuation of the Management Agreement (the Management Agreement) with Columbia Management Investment Advisers, LLC (the Investment Manager) with respect to Columbia Emerging Markets Fund (the Fund), a series of the Trust. As detailed below, the Board’s Advisory Fees and Expenses Committee (the Committee) and the Board met on multiple occasions to review and discuss, both among themselves and with the management team of the Investment Manager, materials provided by the Investment Manager and others before determining to approve the continuation of the Management Agreement.
In connection with their deliberations regarding the continuation of the Management Agreement, the Committee and the Board evaluated materials requested from the Investment Manager regarding the Fund and the Management Agreement, and discussed these materials with representatives of the Investment Manager at Committee meetings held on March 27, 2017, April 26, 2017 and June 13, 2017 and at Board meetings held on March 28, 2017 and June 14, 2017. In addition, the Board considers matters bearing on the Management Agreement at most of its other meetings throughout the year and meets regularly with senior management of the Trust and the Investment Manager. Through the Board’s Investment Oversight Committees, Trustees also meet with selected portfolio managers of the funds the Trustees oversee and other investment personnel at various times throughout the year. The Committee and the Board also consulted with its independent fee consultant, Fund counsel and the Independent Trustees’ independent legal counsel, who advised on various matters with respect to the Committee’s and the Board’s considerations and otherwise assisted the Committee and the Board in their deliberations. On June 13, 2017, the Committee recommended that the Board approve the continuation of the Management Agreement. On June 14, 2017, the Board, including the Independent Trustees, voting separately, unanimously approved the continuation of the Management Agreement for the Fund.
The Committee and the Board considered all information that they, their legal counsel or the Investment Manager believed reasonably necessary to evaluate and to determine whether to recommend for approval or approve the continuation of the Management Agreement. The information and factors considered by the Committee and the Board in recommending for approval or approving the continuation of the Management Agreement for the Fund included the following:
| • | Information on the investment performance of the Fund relative to the performance of a group of mutual funds determined to be comparable to the Fund by an independent third-party data provider, as well as performance relative to benchmarks; |
| • | Information on the Fund’s management fees and total expenses, including information comparing the Fund’s expenses to those of a group of comparable mutual funds, as determined by the independent third-party data provider; |
| • | The Investment Manager’s agreement to contractually limit or cap total operating expenses for the Fund through December 31, 2018 so that total operating expenses (excluding certain fees and expenses, such as transaction costs and certain other investment related expenses, interest, taxes, acquired fund fees and expenses, and infrequent and/or unusual expenses) would not exceed a specified annual rate, as a percentage of the Fund’s net assets; |
| • | The terms and conditions of the Management Agreement; |
| • | The current and proposed terms and conditions of other agreements and arrangements with affiliates of the Investment Manager relating to the operations of the Fund, including agreements with respect to the provision of distribution, transfer agency and shareholder services to the Fund; |
| • | Descriptions of various functions performed by the Investment Manager under the Management Agreement, including portfolio management and portfolio trading practices; |
| • | Information regarding the management fees of similarly-managed portfolios of other clients of the Investment Manager, including institutional separate accounts; |
| • | Information regarding the reputation, regulatory history and resources of the Investment Manager, including information regarding senior management, portfolio managers and other personnel; |
| 40 | Columbia Emerging Markets Fund | Annual Report 2017 |
Board Consideration and Approval of Management
Agreement (continued)
| • | Information regarding the capabilities of the Investment Manager with respect to compliance monitoring services, including an assessment of the Investment Manager’s compliance system by the Fund’s Chief Compliance Officer; and |
| • | The profitability to the Investment Manager and its affiliates from their relationships with the Fund. |
Nature, extent and quality of services provided under the Management Agreement
The Committee and the Board considered the nature, extent and quality of services provided to the Fund by the Investment Manager and its affiliates under the Management Agreement and under separate agreements for the provision of transfer agency and shareholder services, and the resources dedicated to the Fund and the other Columbia Funds by the Investment Manager and its affiliates. The Committee and the Board considered, among other things, the Investment Manager’s ability to attract, motivate and retain highly qualified research, advisory and supervisory investment professionals (including compensation programs for personnel involved in fund management, reputation and other attributes), the portfolio management services provided by those investment professionals, and the quality of the Investment Manager’s investment research capabilities and trade execution services. The Committee and the Board also considered the potential benefits to shareholders of investing in a mutual fund that is part of a fund complex offering exposure to a variety of asset classes and investment disciplines and providing a variety of fund and shareholder services.
The Committee and the Board also considered the professional experience and qualifications of the senior personnel of the Investment Manager, which included consideration of the Investment Manager’s experience with similarly-structured funds. The Committee and the Board noted the compliance programs of and the compliance-related resources provided to the Fund by the Investment Manager and its affiliates, and considered the Investment Manager’s ability to provide administrative services to the Fund and coordinate the activities of the Fund’s other service providers. After reviewing these and related factors, the Committee and the Board concluded, within the context of their overall conclusions, that the nature, extent and quality of the services provided to the Fund under the Management Agreement supported the continuation of the Management Agreement.
Investment performance
The Committee and the Board reviewed information about the performance of the Fund over various time periods, including performance information relative to benchmarks and information that compared the performance of the Fund to the performance of a group of comparable mutual funds as determined by the independent third-party data provider, and data provided by the independent fee consultant. The Committee and the Board also reviewed a description of the third party’s methodology for identifying the Fund’s peer groups for purposes of performance and expense comparisons. Although the Fund’s performance lagged that of a relevant peer group for certain (although not necessarily all) periods, the Committee and the Board concluded that other factors relevant to performance were sufficient, in light of other considerations, to warrant continuation of the Management Agreement. Those factors included one or more of the following: (i) that the Fund’s performance, although lagging in certain recent periods, was stronger over the longer term; (ii) that the underperformance was attributable, to a significant extent, to investment decisions that were reasonable and consistent with the Fund’s investment strategy and policies and that the Fund was performing within a reasonable range of expectations, given those investment decisions, market conditions and the Fund’s investment strategy; (iii) that the Fund’s performance was competitive when compared to other relevant performance benchmarks or peer groups; and (iv) that the Investment Manager had taken or was taking steps designed to help improve the Fund’s investment performance, including, but not limited to, replacing portfolio managers, enhancing the resources supporting the portfolio managers, or modifying investment strategies.
The Committee and the Board noted that, through December 31, 2016, the Fund’s performance was in the seventy-first, fifty-third and forty-third percentile (where the best performance would be in the first percentile) of its category selected by the independent third-party data provider for the purposes of performance comparisons for the one-, three- and five-year periods, respectively.
The Committee and the Board also considered the Investment Manager’s performance and reputation generally, the Investment Manager’s historical responsiveness to Board concerns about performance, and the Investment Manager’s willingness to take steps intended to improve performance. After reviewing these and related factors, the Committee and the Board concluded, within the context of their overall conclusions, that the performance of the Fund and the Investment Manager was sufficient, in light of other considerations, to warrant the continuation of the Management Agreement.
Columbia Emerging Markets Fund | Annual Report 2017
| 41 |
Board Consideration and Approval of Management
Agreement (continued)
Investment management fee rates and other expenses
The Committee and the Board considered the management fees charged to the Fund under the Management Agreement as well as the total expenses incurred by the Fund. In assessing the reasonableness of the fees under the Management Agreement, the Committee and the Board considered, among other information, the Fund’s total expense ratio as a percentage of average daily net assets. The Committee and the Board considered data provided by the independent third-party data provider and the independent fee consultant. The Committee and the Board noted that, as of December 31, 2016, the Fund’s actual management fee and net total expense ratio are ranked in the fifth and third quintiles, respectively, (where the lowest fees and expenses would be in the first quintile) against the Fund’s expense universe as determined by the independent third-party data provider for purposes of expense comparison. The Committee and the Board also took into account the fee waiver and expense limitation arrangements agreed to by the Investment Manager, as noted above.
The Committee and the Board also received and considered information about the management fees charged by the Investment Manager to institutional separate accounts. In considering the fees charged to those accounts, the Committee and the Board took into account, among other things, the Investment Manager’s representations about the differences between managing mutual funds as compared to other types of accounts, including differences in the services provided, differences in the risk profile of such business for the Investment Manager and the additional resources required to manage mutual funds effectively. The Committee and the Board also received and considered information about the fees charged by the Investment Manager for sub-advisory services it provides to comparable unaffiliated funds. In evaluating the Fund’s management fees, the Committee and the Board also took into account the demands, complexity and quality of the investment management of the Fund.
After reviewing these and related factors, the Committee and the Board concluded, within the context of their overall conclusions, that the management fee rates and expenses of the Fund, in light of other considerations, warranted the continuation of the Management Agreement.
Costs of services provided and profitability
The Committee and the Board also took note of the costs the Investment Manager and its affiliates incur in connection with the services provided and the profitability to the Investment Manager and its affiliates from their relationships with the Fund.
The Committee and the Board also considered the compensation directly or indirectly received by the Investment Manager’s affiliates in connection with their relationships with the Fund. The Committee and the Board reviewed information provided by management as to the profitability to the Investment Manager and its affiliates of their relationships with the Fund, information about the allocation of expenses used to calculate profitability, and comparisons of profitability levels realized in 2016 to profitability levels realized in 2015. When reviewing profitability, the Committee and the Board also considered court cases in which adviser profitability was an issue in whole or in part, the performance of similarly managed funds, the performance of the Fund, and the expense ratio of the Fund. In addition, the Committee and the Board considered information provided by the Investment Manager regarding the Investment Manager’s financial condition and comparing its profitability to that of other asset management firms that are, or are subsidiaries of, publicly traded companies. In this regard, the Committee and the Board also considered data provided by the independent fee consultant.
After reviewing these and related factors, the Committee and the Board concluded, within the context of their overall conclusions, that the costs of services provided and the profitability to the Investment Manager and its affiliates from their relationships with the Fund supported the continuation of the Management Agreement.
Economies of scale
The Committee and the Board considered the potential existence of economies of scale in the provision by the Investment Manager of services to the Fund, to groups of related funds, and to the Investment Manager’s investment advisory clients as a whole, and whether those economies of scale were shared with the Fund through breakpoints in investment management fees or other means, such as expense limitation arrangements and additional investments by the Investment Manager in investment, trading, compliance and other resources. The Committee and the Board noted that the management fee schedules for the Fund contained breakpoints that would reduce the fee rate on assets above specified threshold levels.
| 42 | Columbia Emerging Markets Fund | Annual Report 2017 |
Board Consideration and Approval of Management
Agreement (continued)
In considering these matters, the Committee and the Board also considered the costs of the services provided and the profitability to the Investment Manager and its affiliates from their relationships with the Fund, as discussed above. After reviewing these and related factors, the Committee and the Board concluded, within the context of their overall conclusions, that the extent to which any economies of scale were expected to be shared with the Fund supported the continuation of the Management Agreement.
Other benefits to the Investment Manager
The Committee and the Board received and considered information regarding “fall-out” or ancillary benefits received by the Investment Manager and its affiliates as a result of their relationships with the Fund, such as the engagement of the Investment Manager’s affiliates to provide distribution, transfer agency and shareholder services to the Fund. In this regard, among other matters, the Committee and the Board considered that the Fund’s distributor retains a portion of the distribution fees from the Fund and receives a portion of the sales charges on sales or redemptions of certain classes of shares of the Fund. The Committee and the Board also considered the benefits of research made available to the Investment Manager by reason of brokerage commissions generated by the Fund’s securities transactions, and reviewed information about the Investment Manager’s practices with respect to allocating portfolio transactions for brokerage and research services. The Committee and the Board recognized that the Investment Manager’s profitability would be somewhat lower without these benefits.
Conclusion
The Committee and the Board reviewed all of the above considerations in reaching their decisions to recommend or approve the continuation of the Management Agreement. In their deliberations, the Trustees did not identify any particular information that was all-important or controlling, and individual Trustees may have attributed different weights to the various factors. Based on their evaluation of all factors that they deemed to be material, including those factors described above, and assisted by the advice of independent legal counsel, the Board, including the Independent Trustees, voting separately, unanimously approved the continuation of the Management Agreement.
Columbia Emerging Markets Fund | Annual Report 2017
| 43 |
The Fund mails one shareholder report to each shareholder address. If you would like more than one report, please call shareholder services at 800.345.6611 and additional reports will be sent to you.
Proxy voting policies and procedures
The policy of the Board of Trustees is to vote the proxies of the companies in which the Fund holds investments consistent with the procedures as stated in the Statement of Additional Information (SAI). You may obtain a copy of the SAI without charge by calling 800.345.6611; contacting your financial intermediary; visiting investor.columbiathreadneedleus.com; or searching the website of the Securities and Exchange Commission (SEC) at sec.gov. Information regarding how the Fund voted proxies relating to portfolio securities is filed with the SEC by August 31st for the most recent 12-month period ending June 30th of that year, and is available without charge by visiting investor.columbiathreadneedleus.com, or searching the website of the SEC at sec.gov.
Quarterly schedule of investments
The Fund files a complete schedule of portfolio holdings with the SEC for the first and third quarters of each fiscal year on Form N-Q. The Fund’s Form N-Q is available on the SEC’s website at sec.gov and may be reviewed and copied at the SEC’s Public Reference Room in Washington, D.C. Information on the operation of the Public Reference Room may be obtained by calling 800.SEC.0330. The Fund’s complete schedule of portfolio holdings, as filed on Form N-Q, can also be obtained without charge, upon request, by calling 800.345.6611.
Additional Fund information
For more information about the Fund, please visit investor.columbiathreadneedleus.com or call 800.345.6611. Customer Service Representatives are available to answer your questions Monday through Friday from 8 a.m. to 7 p.m. Eastern time.
Fund investment manager
Columbia Management Investment Advisers, LLC
225 Franklin Street
Boston, MA 02110
Fund distributor
Columbia Management Investment Distributors, Inc.
225 Franklin Street
Boston, MA 02110
Fund transfer agent
Columbia Management Investment Services Corp.
P.O. Box 8081
Boston, MA 02266-8081
| 44 | Columbia Emerging Markets Fund | Annual Report 2017 |
[THIS PAGE INTENTIONALLY LEFT BLANK]
Columbia Emerging Markets Fund
P.O. Box 8081
Boston, MA 02266-8081
Please read and consider the investment objectives, risks, charges and expenses for any fund carefully before investing. For a prospectus and summary prospectus, which contains this and other important information about the Fund, go to
investor.columbiathreadneedleus.com. The Fund is distributed by Columbia Management Investment Distributors, Inc., member FINRA, and managed by Columbia Management Investment Advisers, LLC.
Columbia Threadneedle Investments (Columbia Threadneedle) is the global brand name of the Columbia and Threadneedle group of companies. All rights reserved. Columbia Management Investment Distributors, Inc., 225 Franklin Street, Boston, MA 02110-2804
© 2017 Columbia Management Investment Advisers, LLC.
investor.columbiathreadneedleus.com

Annual Report
August 31, 2017
Columbia Greater China Fund
Not FDIC Insured • No bank guarantee • May lose value
Dear Shareholders,
The current outlook for financial markets is clouded by two primary concerns: the high valuation of equities and the direction of interest rates. Following the U.S. presidential election, U.S. equities rallied based on the assumption that the new administration’s policies would stimulate growth quickly. Unfortunately it’s unclear whether those measures will get passed, much less passed quickly. In fixed income, uncertainty stems from the possibility that interest rates won’t rise as rapidly as expected if the administration’s proposed growth policies are not implemented.
Given this uncertainty, investors value a consistent approach more than ever. Investors want strong, repeatable risk-adjusted returns. Consistency — not surprises. As a leading global asset manager, we believe our consistent, collaborative investment approach enables us to deliver the dependable experience your portfolio demands. So, how do we strive to deliver a consistent investment experience?
Better insights
Your portfolio benefits from the investment insights uncovered by our talented investment teams around the world.
Better decisions
Our collaborative, interactive environment enables our investment teams to construct portfolios that take advantage of the best investment ideas.
Better outcomes
We aim to deliver a consistent experience, which means fewer surprises, dependable insights, and products designed to do the thing you want.
Whether you’re trying to save money to help your children go to college or for your own retirement, it’s the consistency of the return that is most essential. People who chase higher returns are usually also the first to sell when that investment goes through a bad patch. We try to combat this behavioral tendency by offering strategies that aim for a more consistent return. Our goal is for investors to panic less during periods of volatility, which can have a significant effect on their long-term results.
Nothing is more important to us than making sure those who have entrusted us to protect and grow their assets can do what matters most to them: build a nest egg, leave a legacy, and live confidently — now and throughout retirement. It’s why our talented professionals around the world work together to uncover uncommon opportunities and why our process encourages challenge and debate around our most compelling ideas to ensure better informed investment decisions, which hopefully lead to better outcomes for you.
Your success is our priority. Talk to your financial advisor about how working with Columbia Threadneedle Investments may help you position your portfolio for consistent, sustainable outcomes, no matter the market conditions.
Sincerely,
Christopher O. Petersen
President, Columbia Funds
Investors should consider the investment objectives, risks, charges and expenses of a mutual fund carefully before investing. For a free prospectus and summary prospectus, which contains this and other important information about a fund, visit investor.columbiathreadneedleus.com. The prospectus should be read carefully before investing.
Columbia Funds are distributed by Columbia Management Investment Distributors, Inc., member FINRA, and managed by Columbia Management Investment Advisers, LLC.
© 2017 Columbia Management Investment Advisers, LLC. All rights reserved.
Columbia Greater China Fund | Annual Report 2017
Columbia Greater China Fund | Annual Report 2017
Investment objective
Columbia Greater China Fund (the Fund) seeks long-term capital appreciation.
Portfolio management
Jasmine (Weili) Huang CFA, CPA (U.S. and China). CFM
Manager
Managed Fund since 2005
Morningstar style boxTM
The Morningstar Style Box is based on a fund’s portfolio holdings. For equity funds, the vertical axis shows the market capitalization of the stocks owned, and the horizontal axis shows investment style (value, blend, or growth). Information shown is based on the most recent data provided by Morningstar.
© 2017 Morningstar, Inc. All rights reserved. The Morningstar information contained herein: (1) is proprietary to Morningstar and/or its content providers; (2) may not be copied or distributed; and (3) is not warranted to be accurate, complete or timely. Neither Morningstar nor its content providers are responsible for any damages or losses arising from any use of this information.
| Average annual total returns (%) (for the period ended August 31, 2017) |
| | | Inception | 1 Year | 5 Years | 10 Years |
| Class A | Excluding sales charges | 05/16/97 | 29.74 | 13.12 | 4.07 |
| | Including sales charges | | 22.28 | 11.78 | 3.45 |
| Class C | Excluding sales charges | 05/16/97 | 28.74 | 12.27 | 3.29 |
| | Including sales charges | | 27.74 | 12.27 | 3.29 |
| Class R4* | 03/19/13 | 30.05 | 13.36 | 4.18 |
| Class R5* | 11/08/12 | 30.21 | 13.54 | 4.26 |
| Class T* | Excluding sales charges | 06/18/12 | 29.69 | 13.13 | 4.08 |
| | Including sales charges | | 26.45 | 12.56 | 3.81 |
| Class Y* | 03/01/17 | 29.99 | 13.16 | 4.09 |
| Class Z | 05/16/97 | 30.07 | 13.40 | 4.33 |
| MSCI China Index (Net) | | 35.00 | 12.14 | 3.60 |
| Hang Seng Index | | 20.65 | 7.31 | 1.51 |
Returns for Class A shares are shown with and without the maximum initial sales charge of 5.75%. Returns for Class C shares are shown with and without the 1.00% contingent deferred sales charge for the first year only. Returns for Class T shares are shown with and without the maximum initial sales charge of 2.50% per transaction. Prior to March 27, Class T shares were known as Class W shares and were not subject to sales charges. The Fund’s other share classes are not subject to sales charges and have limited eligibility. Please see the Fund’s prospectus for details. Performance for different share classes will vary based on differences in sales charges and fees associated with each share class. All results shown assume reinvestment of distributions during the period. Returns do not reflect the deduction of taxes that a shareholder may pay on Fund distributions or on the redemption of Fund shares. Performance results reflect the effect of any fee waivers or reimbursements of Fund expenses by Columbia Management Investment Advisers, LLC and/or any of its affiliates. Absent these fee waivers or expense reimbursement arrangements, performance results would have been lower.
The performance information shown represents past performance and is not a guarantee of future results. The investment return and principal value of your investment will fluctuate so that your shares, when redeemed, may be worth more or less than their original cost. Current performance may be lower or higher than the performance information shown. You may obtain performance information current to the most recent month-end by contacting your financial intermediary, visiting investor.columbiathreadneedleus.com or calling 800.345.6611.
| * | The returns shown for periods prior to the share class inception date (including returns for the Life of the Fund, if shown, which are since Fund inception) include the returns of the Fund’s oldest share class. Since the Fund launched more than one share class at its inception, Class A shares were used. These returns are adjusted to reflect any higher class-related operating expenses of the newer share classes, as applicable. Please visit investor.columbiathreadneedleus.com/investment-products/mutual-funds/appended-performance for more information. |
The MSCI China Index (Net) is designed to broadly and fairly represent the full diversity of business activities in China. This index aims to capture 85% of the free float adjusted market capitalization in each industry group.
The Hang Seng Index tracks the performance of approximately 70% of the total market capitalization of the stock exchange of Hong Kong.
Indices are not available for investment, are not professionally managed and do not reflect sales charges, fees, brokerage commissions, taxes (except the MSCI China Index (Net) which reflects reinvested dividends net of withholding taxes) or other expenses of investing. Securities in the Fund may not match those in an index.
| 2 | Columbia Greater China Fund | Annual Report 2017 |
Fund at a Glance (continued)
Performance of a hypothetical $10,000 investment (August 31, 2007 — August 31, 2017)
The chart above shows the change in value of a hypothetical $10,000 investment in Class A shares of Columbia Greater China Fund during the stated time period, and does not reflect the deduction of taxes that a shareholder may pay on Fund distributions or on the redemption of Fund shares.
| Top 10 holdings (%) (at August 31, 2017) |
| Tencent Holdings Ltd. | 19.7 |
| Alibaba Group Holding Ltd., ADR | 12.6 |
| China Construction Bank Corp., Class H | 5.6 |
| Ping An Insurance Group Co. of China Ltd., Class H | 5.4 |
| Bank of China Ltd., Class H | 3.4 |
| Industrial & Commercial Bank of China Ltd., Class H | 3.3 |
| NetEase, Inc., ADR | 3.3 |
| CNOOC Ltd. | 3.2 |
| JD.com, Inc., ADR | 3.2 |
| CSPC Pharmaceutical Group Ltd. | 2.9 |
Percentages indicated are based upon total investments (excluding Money Market Funds).
For further detail about these holdings, please refer to the section entitled “Portfolio of Investments.”
Fund holdings are as of the date given, are subject to change at any time, and are not recommendations to buy or sell any security.
| Equity sector breakdown (%) (at August 31, 2017) |
| Consumer Discretionary | 15.6 |
| Consumer Staples | 4.1 |
| Energy | 4.6 |
| Financials | 22.8 |
| Health Care | 7.6 |
| Industrials | 3.1 |
| Information Technology | 39.4 |
| Materials | 0.4 |
| Real Estate | 0.9 |
| Telecommunication Services | 0.9 |
| Utilities | 0.6 |
| Total | 100.0 |
Percentages indicated are based upon total equity investments. The Fund’s portfolio composition is subject to change.
Columbia Greater China Fund | Annual Report 2017
| 3 |
Fund at a Glance (continued)
| Country breakdown (%) (at August 31, 2017) |
| China | 92.1 |
| Hong Kong | 4.6 |
| Taiwan | 0.6 |
| United States(a) | 2.7 |
| Total | 100.0 |
| (a) | Includes investments in Money Market Funds. |
Country breakdown is based primarily on issuer’s place of organization/incorporation. Percentages indicated are based upon total investments. The Fund’s portfolio composition is subject to change.
| 4 | Columbia Greater China Fund | Annual Report 2017 |
Manager Discussion of Fund Performance
For the 12-month period that ended August 31, 2017, the Fund’s Class A shares returned 29.74% excluding sales charges. During the same time period, the Fund trailed the performance of its benchmark, the MSCI China Index (Net), which returned 35.00% and exceeded that of the Hang Seng Index, which returned 20.65%. Underweight exposure to the telecommunication services and industrials sectors added to the Fund’s performance relative to the benchmark, as did an overweight to consumer discretionary. An overweight to health care and an underweight to real estate constrained returns.
Chinese equity market benefited from improved macroeconomic backdrop
The 12 months ended August 31, 2017 saw Chinese equities supported by an improving macroeconomic backdrop. The broad-based recovery in China over the period was fostered in large part by policy measures. These included the maintenance of a relaxed monetary stance on the part of the People’s Bank of China, stepped-up government spending on infrastructure projects, and an easing of property market controls in urban markets. Reflecting the improved demand environment, in September of 2016 the Chinese producer price index (PPI) inched into positive territory for the first time in over four years, and the PPI moved sharply higher in succeeding months.
More broadly, the Chinese government continued to move to cut excess capacity and improve productivity by directing the consolidation of state-owned enterprises (SOEs) within overbuilt sectors. In addition, government-mandated operating periods have been utilized to help reduce supply and support commodity prices. Finally, corporations have done their part by reducing capital expenditures. The result for SOEs has been strengthened cash flow and a recovery in profits. Moreover, with SOEs accounting for roughly 60% of outstanding Chinese non-performing bank loans, the improved profitability has led to an easing of systemic concerns and a firming in bank stock prices.
In addition to benefiting from supportive policies and improving fundamentals, Chinese stocks have benefited from a softening in the U.S. dollar which drove increased fund flows into emerging markets. Sentiment with respect to the China market has been boosted by increasing adoption of the Stock Connect program which enables on-shore Chinese investors to trade stocks listed in Hong Kong, and the announcement that the Chinese domestic market will be incorporated into the MSCI indices widely utilized by investors.
Cyclical sectors led performance
Performance in the Chinese market was led during the period by cyclical sectors including information technology, real estate and consumer discretionary. Conversely, the more defensive telecommunication services and consumer staples sectors lagged the broader market, along with the energy sector which was hampered by a softening in crude oil prices.
The Fund’s sector allocations in aggregate detracted modestly from returns versus the benchmark. Underweights to telecommunication services and industrials added to relative performance, as did an overweight to consumer discretionary. On the downside, an overweight to health care and an underweight to real estate constrained returns. Stock selection in aggregate also detracted slightly from performance relative to the benchmark. Stock selection was positive within financials, healthcare, and consumer staples, and lagged within information technology and industrials.
With respect to individual stocks, positive contributors to relative performance included New Oriental Education and Technology Group, the leading provider in China of K-12 tutoring services. The company has benefited from the secular trend in China towards investment in education, experiencing strong growth and margin improvement. A position in Tencent, one of the world’s largest internet companies, was another significant contributor, as the company continued to beat earnings expectations. Tencent encompasses the world’s largest gaming company, and its other services include e-commerce, social media, online advertising, cloud computing and mobile payments. Shares of CSPC Pharmaceutical Group Limited also outperformed in the period. Sales of CSPC’s drug offerings have seen strong growth despite a challenging regulatory climate, and we believe the company has a promising pipeline of drugs in the approval process. Finally, the Fund’s underweight exposure to China Mobile aided performance relative to the benchmark. Growth in telecommunication services has slowed as penetration of smartphones has increased. In addition, the sector is subject to domestic regulatory pressure, with respect to both pricing and the government’s desire to step up investment in a next generation network in order to support the broader Chinese economy.
Columbia Greater China Fund | Annual Report 2017
| 5 |
Manager Discussion of Fund Performance (continued)
On the downside, shares of Zhuzhou CRRC Times Electric, a manufacturer of components for high-speed trains and subways, declined on concern over delays in the government tendering process for high speed trains. The delay in seeking bids was caused by a change in the head regulator responsible for overseeing the process, as well as by pending changes to railway technical standards. The tendering process has re-started, and we believe Zhuzhou continues to have an opportunity to gain market share through industry consolidation. Another leading detractor was CNOOC Limited, China’s largest producer of offshore crude oil and natural gas. CNOOC saw its shares decline as the price of oil faltered in the period. The Fund’s positioning with respect to shares of online marketplace 58.com also constrained performance. We sold the stock as it declined on an earnings miss which raised concerns around the company’s ability to effectively integrate a recent acquisition, only to see the shares rebound. Finally, China Biologic Products, a blood plasma-based pharmaceutical company, saw its results and share price decline. Pricing pressure in the company’s primary plasma segment increased in the period due to the entry of international competitors and a one-time spike in supply caused by medical reform measures that led small distributors to dump their inventory. We expect the company’s results to recover within a few quarters, but trimmed the position given the reduced visibility on earnings.
Fund positioning focused on secular growth ideas
China continues to engineer a transition to a more balanced economy, moving away from investment in areas with excess capacity and towards service industries. At the same time, the government is seeking to maintain annual growth in the 6.5% to 7% range. While we believe that the Chinese economy may ultimately see overall growth stabilize at somewhat more modest levels, we continue to invest in China on the basis of long-term, secular growth ideas, while looking to hold well-run companies executing against these opportunities. Many of the most attractive opportunities in our view are driven by the ongoing process of Chinese consumers upgrading their lifestyles. Areas of the Chinese economy that we view as having considerable room for further penetration include health care, travel & leisure, information technology and the internet. Based on rising corporate profitability and our reduced concerns around non-performing loans and systemic risk, we moved from a significant underweight to a closer to neutral stance with respect to financials over the Fund’s recently concluded fiscal period. The Fund remains underweight the energy and materials sectors.
Market risk may affect a single issuer, sector of the economy, industry or the market as a whole. International investing involves certain risks and volatility due to potential political, economic or currency instabilities and different financial and accounting standards. Risks are enhanced for emerging market issuers. Concentration in the Greater China region, where issuers tend to be less developed than U.S. issuers, presents increased risk of loss than a fund that does not concentrate its investments. Investments in small- and mid-cap companies involve risks and volatility greater than investments in larger, more established companies. As a non-diversified fund, fewer investments could have a greater affect on performance. See the Fund’s prospectus for more information on these and other risks.
The views expressed in this report reflect the current views of the respective parties. These views are not guarantees of future performance and involve certain risks, uncertainties and assumptions that are difficult to predict, so actual outcomes and results may differ significantly from the views expressed. These views are subject to change at any time based upon economic, market or other conditions and the respective parties disclaim any responsibility to update such views. These views may not be relied on as investment advice and, because investment decisions for a Columbia fund are based on numerous factors, may not be relied on as an indication of trading intent on behalf of any particular Columbia fund. References to specific securities should not be construed as a recommendation or investment advice.
| 6 | Columbia Greater China Fund | Annual Report 2017 |
Understanding Your Fund’s Expenses
(Unaudited)
As an investor, you incur two types of costs. There are transaction costs, which generally include sales charges on purchases and may include redemption fees. There are also ongoing costs, which generally include management fees, distribution and/or service fees, and other fund expenses. The following information is intended to help you understand your ongoing costs (in dollars) of investing in the Fund and to help you compare these costs with the ongoing costs of investing in other mutual funds.
Analyzing your Fund’s expenses
To illustrate these ongoing costs, we have provided examples and calculated the expenses paid by investors in each share class of the Fund during the period. The actual and hypothetical information in the table is based on an initial investment of $1,000 at the beginning of the period indicated and held for the entire period. Expense information is calculated two ways and each method provides you with different information. The amount listed in the “Actual” column is calculated using the Fund’s actual operating expenses and total return for the period. You may use the Actual information, together with the amount invested, to estimate the expenses that you paid over the period. Simply divide your account value by $1,000 (for example, an $8,600 account value divided by $1,000 = 8.6), then multiply the results by the expenses paid during the period under the “Actual” column. The amount listed in the “Hypothetical” column assumes a 5% annual rate of return before expenses (which is not the Fund’s actual return) and then applies the Fund’s actual expense ratio for the period to the hypothetical return. You should not use the hypothetical account values and expenses to estimate either your actual account balance at the end of the period or the expenses you paid during the period. See “Compare with other funds” below for details on how to use the hypothetical data.
Compare with other funds
Since all mutual funds are required to include the same hypothetical calculations about expenses in shareholder reports, you can use this information to compare the ongoing cost of investing in the Fund with other funds. To do so, compare the hypothetical example with the 5% hypothetical examples that appear in the shareholder reports of other funds. As you compare hypothetical examples of other funds, it is important to note that hypothetical examples are meant to highlight the ongoing costs of investing in a fund only and do not reflect any transaction costs, such as sales charges, or redemption or exchange fees. Therefore, the hypothetical calculations are useful in comparing ongoing costs only, and will not help you determine the relative total costs of owning different funds. If transaction costs were included in these calculations, your costs would be higher.
| March 1, 2017 — August 31, 2017 |
| | Account value at the
beginning of the
period ($) | Account value at the
end of the
period ($) | Expenses paid during
the period ($) | Fund’s annualized
expense ratio (%) |
| | Actual | Hypothetical | Actual | Hypothetical | Actual | Hypothetical | Actual |
| Class A | 1,000.00 | 1,000.00 | 1,289.70 | 1,017.04 | 9.35 | 8.24 | 1.62 |
| Class C | 1,000.00 | 1,000.00 | 1,284.70 | 1,013.31 | 13.59 | 11.98 | 2.36 |
| Class R4 | 1,000.00 | 1,000.00 | 1,291.50 | 1,018.35 | 7.86 | 6.92 | 1.36 |
| Class R5 | 1,000.00 | 1,000.00 | 1,292.10 | 1,018.80 | 7.34 | 6.46 | 1.27 |
| Class T (formerly Class W) | 1,000.00 | 1,000.00 | 1,289.50 | 1,016.94 | 9.46 | 8.34 | 1.64 |
| Class Y | 1,000.00 | 1,000.00 | 1,279.20 | 1,019.06 | 6.93 | 6.21 | 1.22 |
| Class Z | 1,000.00 | 1,000.00 | 1,291.50 | 1,018.35 | 7.86 | 6.92 | 1.36 |
Expenses paid during the period are equal to the annualized expense ratio for each class as indicated above, multiplied by the average account value over the period and then multiplied by the number of days in the Fund’s most recent fiscal half year and divided by 365.
Expenses do not include fees and expenses incurred indirectly by the Fund from its investment in underlying funds, including affiliated and non-affiliated pooled investment vehicles, such as mutual funds and exchange-traded funds.
Columbia Greater China Fund | Annual Report 2017
| 7 |
Portfolio of Investments
August 31, 2017
(Percentages represent value of investments compared to net assets)
| Common Stocks 98.8% |
| Issuer | Shares | Value ($) |
| Consumer Discretionary 15.5% |
| Auto Components 2.1% |
| Minth Group Ltd. | 284,000 | 1,309,709 |
| Nexteer Automotive Group Ltd. | 819,000 | 1,360,005 |
| Total | | 2,669,714 |
| Automobiles 1.0% |
| Brilliance China Automotive Holdings Ltd. | 484,000 | 1,254,753 |
| Diversified Consumer Services 2.4% |
| New Oriental Education & Technology Group, Inc., ADR | 36,890 | 3,015,757 |
| Hotels, Restaurants & Leisure 1.5% |
| Yum China Holdings, Inc.(a) | 51,370 | 1,816,443 |
| Internet & Direct Marketing Retail 5.0% |
| Ctrip.com International Ltd., ADR(a) | 44,579 | 2,293,590 |
| JD.com, Inc., ADR(a) | 93,208 | 3,906,347 |
| Total | | 6,199,937 |
| Textiles, Apparel & Luxury Goods 3.5% |
| Samsonite International SA | 403,200 | 1,657,937 |
| Shenzhou International Group Holdings Ltd. | 336,000 | 2,700,509 |
| Total | | 4,358,446 |
| Total Consumer Discretionary | 19,315,050 |
| Consumer Staples 4.1% |
| Beverages 3.3% |
| China Resources Beer Holdings Co., Ltd. | 344,000 | 863,908 |
| Kweichow Moutai Co., Ltd., Class A | 5,200 | 387,394 |
| Wuliangye Yibin Co., Ltd. | 341,607 | 2,875,091 |
| Total | | 4,126,393 |
| Food Products 0.8% |
| WH Group Ltd. | 922,000 | 966,390 |
| Total Consumer Staples | 5,092,783 |
| Energy 4.5% |
| Oil, Gas & Consumable Fuels 4.5% |
| China Petroleum & Chemical Corp., Class H | 2,308,000 | 1,766,833 |
| CNOOC Ltd. | 3,241,500 | 3,912,624 |
| Total | | 5,679,457 |
| Total Energy | 5,679,457 |
| Common Stocks (continued) |
| Issuer | Shares | Value ($) |
| Financials 22.5% |
| Banks 13.4% |
| Bank of China Ltd., Class H | 8,050,000 | 4,254,268 |
| China Construction Bank Corp., Class H | 7,803,340 | 6,865,426 |
| China Merchants Bank Co., Ltd., Class H | 377,500 | 1,427,157 |
| Industrial & Commercial Bank of China Ltd., Class H | 5,505,000 | 4,136,858 |
| Total | | 16,683,709 |
| Insurance 9.1% |
| AIA Group Ltd. | 384,000 | 2,957,492 |
| China Life Insurance Co., Ltd., Class H | 553,000 | 1,780,519 |
| Ping An Insurance Group Co. of China Ltd., Class H | 836,500 | 6,662,583 |
| Total | | 11,400,594 |
| Total Financials | 28,084,303 |
| Health Care 7.5% |
| Biotechnology 0.8% |
| China Biologic Products Holdings, Inc.(a) | 9,776 | 953,160 |
| Life Sciences Tools & Services 0.7% |
| Wuxi Biologics Cayman, Inc.(a) | 179,500 | 885,372 |
| Pharmaceuticals 6.0% |
| China Animal Healthcare Ltd.(a),(b),(c) | 1,050,000 | 0 |
| China Medical System Holdings Ltd. | 1,497,000 | 2,763,519 |
| CSPC Pharmaceutical Group Ltd. | 2,286,000 | 3,572,287 |
| Sino Biopharmaceutical Ltd. | 1,394,000 | 1,225,750 |
| Total | | 7,561,556 |
| Total Health Care | 9,400,088 |
| Industrials 3.0% |
| Electrical Equipment 3.0% |
| Voltronic Power Technology Corp. | 45,150 | 814,885 |
| Zhuzhou CRRC Times Electric Co., Ltd., Class H | 567,500 | 2,977,493 |
| Total | | 3,792,378 |
| Total Industrials | 3,792,378 |
| Information Technology 38.9% |
| Electronic Equipment, Instruments & Components 0.9% |
| AAC Technologies Holdings, Inc. | 60,500 | 1,107,176 |
The accompanying Notes to Financial Statements are an integral part of this statement.
| 8 | Columbia Greater China Fund | Annual Report 2017 |
Portfolio of Investments (continued)
August 31, 2017
| Common Stocks (continued) |
| Issuer | Shares | Value ($) |
| Internet Software & Services 37.7% |
| Alibaba Group Holding Ltd., ADR(a) | 90,530 | 15,547,622 |
| Baidu, Inc., ADR(a) | 13,992 | 3,190,876 |
| NetEase, Inc., ADR | 14,867 | 4,100,913 |
| Tencent Holdings Ltd. | 577,100 | 24,284,180 |
| Total | | 47,123,591 |
| Software 0.3% |
| Kingdee International Software Group Co., Ltd.(a) | 980,000 | 417,954 |
| Total Information Technology | 48,648,721 |
| Materials 0.4% |
| Construction Materials 0.4% |
| China Resources Cement Holdings Ltd. | 794,000 | 437,361 |
| Total Materials | 437,361 |
| Real Estate 0.9% |
| Real Estate Management & Development 0.9% |
| China Resources Land Ltd. | 360,000 | 1,128,611 |
| Total Real Estate | 1,128,611 |
| Telecommunication Services 0.9% |
| Wireless Telecommunication Services 0.9% |
| China Mobile Ltd. | 108,500 | 1,151,487 |
| Total Telecommunication Services | 1,151,487 |
| Common Stocks (continued) |
| Issuer | Shares | Value ($) |
| Utilities 0.6% |
| Gas Utilities 0.6% |
| ENN Energy Holdings Ltd. | 116,000 | 748,632 |
| Total Utilities | 748,632 |
Total Common Stocks
(Cost $62,899,192) | 123,478,871 |
|
| Money Market Funds 1.2% |
| | Shares | Value ($) |
| Columbia Short-Term Cash Fund, 1.146%(d),(e) | 1,531,860 | 1,531,860 |
Total Money Market Funds
(Cost $1,531,845) | 1,531,860 |
Total Investments
(Cost: $64,431,037) | 125,010,731 |
| Other Assets & Liabilities, Net | | 46,457 |
| Net Assets | 125,057,188 |
Notes to Portfolio of Investments
| (a) | Non-income producing investment. |
| (b) | Represents fair value as determined in good faith under procedures approved by the Board of Trustees. At August 31, 2017, the value of these securities amounted to $0, which represents less than 0.01% of net assets. |
| (c) | Valuation based on significant unobservable inputs. |
| (d) | The rate shown is the seven-day current annualized yield at August 31, 2017. |
| (e) | As defined in the Investment Company Act of 1940, an affiliated company is one in which the Fund owns 5% or more of the company’s outstanding voting securities, or a company which is under common ownership or control with the Fund. Holdings and transactions in these affiliated companies during the year ended August 31, 2017 are as follows: |
| Issuer | Beginning
shares | Shares
purchased | Shares
sold | Ending
shares | Realized gain
(loss) ($) | Net change in
unrealized
appreciation
(depreciation) ($) | Dividends —
affiliated
issuers($) | Value ($) |
| Columbia Short-Term Cash Fund, 1.146% | 1,608,809 | 36,143,579 | (36,220,528) | 1,531,860 | (116) | 15 | 14,832 | 1,531,860 |
Abbreviation Legend
| ADR | American Depositary Receipt |
The accompanying Notes to Financial Statements are an integral part of this statement.
Columbia Greater China Fund | Annual Report 2017
| 9 |
Portfolio of Investments (continued)
August 31, 2017
Fair value measurements
The Fund categorizes its fair value measurements according to a three-level hierarchy that maximizes the use of observable inputs and minimizes the use of unobservable inputs by prioritizing that the most observable input be used when available. Observable inputs are those that market participants would use in pricing an investment based on market data obtained from sources independent of the reporting entity. Unobservable inputs are those that reflect the Fund’s assumptions about the information market participants would use in pricing an investment. An investment’s level within the fair value hierarchy is based on the lowest level of any input that is deemed significant to the asset’s or liability’s fair value measurement. The input levels are not necessarily an indication of the risk or liquidity associated with investments at that level. For example, certain U.S. government securities are generally high quality and liquid, however, they are reflected as Level 2 because the inputs used to determine fair value may not always be quoted prices in an active market.
Fair value inputs are summarized in the three broad levels listed below:
| • | Level 1 – Valuations based on quoted prices for investments in active markets that the Fund has the ability to access at the measurement date. Valuation adjustments are not applied to Level 1 investments. |
| • | Level 2 – Valuations based on other significant observable inputs (including quoted prices for similar securities, interest rates, prepayment speeds, credit risks, etc.). |
| • | Level 3 – Valuations based on significant unobservable inputs (including the Fund’s own assumptions and judgment in determining the fair value of investments). |
Inputs that are used in determining fair value of an investment may include price information, credit data, volatility statistics, and other factors. These inputs can be either observable or unobservable. The availability of observable inputs can vary between investments, and is affected by various factors such as the type of investment, and the volume and level of activity for that investment or similar investments in the marketplace. The inputs will be considered by the Investment Manager, along with any other relevant factors in the calculation of an investment’s fair value. The Fund uses prices and inputs that are current as of the measurement date, which may include periods of market dislocations. During these periods, the availability of prices and inputs may be reduced for many investments. This condition could cause an investment to be reclassified between the various levels within the hierarchy.
Foreign equity securities actively traded in markets where there is a significant delay in the local close relative to the New York Stock Exchange are classified as Level 2. The values of these securities may include an adjustment to reflect the impact of significant market movements following the close of local trading, as described in Note 2 to the financial statements – Security valuation.
Certain investments that have been measured at fair value using the net asset value (NAV) per share (or its equivalent) are not categorized in the fair value hierarchy. The fair value amounts presented in the table are intended to reconcile the fair value hierarchy to the amounts presented in the Portfolio of Investments. The Columbia Short-Term Cash Fund seeks to provide shareholders with maximum current income consistent with liquidity and stability of principal. Columbia Short-Term Cash Fund prices its shares with a floating NAV and no longer seeks to maintain a stable NAV.
Investments falling into the Level 3 category are primarily supported by quoted prices from brokers and dealers participating in the market for those investments. However, these may be classified as Level 3 investments due to lack of market transparency and corroboration to support these quoted prices. Additionally, valuation models may be used as the pricing source for any remaining investments classified as Level 3. These models may rely on one or more significant unobservable inputs and/or significant assumptions by the Investment Manager. Inputs used in valuations may include, but are not limited to, financial statement analysis, capital account balances, discount rates and estimated cash flows, and comparable company data.
Under the direction of the Fund’s Board of Trustees (the Board), the Investment Manager’s Valuation Committee (the Committee) is responsible for overseeing the valuation procedures approved by the Board. The Committee consists of voting and non-voting members from various groups within the Investment Manager’s organization, including operations and accounting, trading and investments, compliance, risk management and legal.
The Committee meets at least monthly to review and approve valuation matters, which may include a description of specific valuation determinations, data regarding pricing information received from approved pricing vendors and brokers and the results of Board-approved valuation control policies and procedures (the Policies). The Policies address, among other things, instances when market quotations are or are not readily available, including recommendations of third party pricing vendors and a determination of appropriate pricing methodologies; events that require specific valuation determinations and assessment of fair value techniques; securities with a potential for stale pricing, including those that are illiquid, restricted, or in default; and the effectiveness of third party pricing vendors, including periodic reviews of vendors. The Committee meets more frequently, as needed, to discuss additional valuation matters, which may include the need to review back-testing results, review time-sensitive information or approve related valuation actions. The Committee reports to the Board, with members of the Committee meeting with the Board at each of its regularly scheduled meetings to discuss valuation matters and actions during the period, similar to those described earlier.
For investments categorized as Level 3, the Committee monitors information similar to that described above, which may include: (i) data specific to the issuer or comparable issuers, (ii) general market or specific sector news and (iii) quoted prices and specific or similar security transactions. The Committee considers this data and any changes from prior periods in order to assess the reasonableness of observable and unobservable inputs, any assumptions or internal models used to value those securities and changes in fair value. This data is also used to corroborate, when available, information received from approved pricing vendors and brokers. Various factors impact the frequency of monitoring this information (which may occur as often as daily). However, the Committee may determine that changes to inputs, assumptions and models are not required as a result of the monitoring procedures performed.
The following table is a summary of the inputs used to value the Fund’s investments at August 31, 2017:
| | Level 1
quoted prices
in active
markets for
identical
assets ($) | Level 2
other
significant
observable
inputs ($) | Level 3
significant
unobservable
inputs ($) | Investments
measured at
net asset
value ($) | Total ($) |
| Investments | | | | | |
| Common Stocks | | | | | |
| Consumer Discretionary | 11,032,137 | 8,282,913 | — | — | 19,315,050 |
| Consumer Staples | — | 5,092,783 | — | — | 5,092,783 |
| Energy | — | 5,679,457 | — | — | 5,679,457 |
| Financials | — | 28,084,303 | — | — | 28,084,303 |
| Health Care | 953,160 | 8,446,928 | 0* | — | 9,400,088 |
The accompanying Notes to Financial Statements are an integral part of this statement.
| 10 | Columbia Greater China Fund | Annual Report 2017 |
Portfolio of Investments (continued)
August 31, 2017
Fair value measurements (continued)
| | Level 1
quoted prices
in active
markets for
identical
assets ($) | Level 2
other
significant
observable
inputs ($) | Level 3
significant
unobservable
inputs ($) | Investments
measured at
net asset
value ($) | Total ($) |
| Industrials | — | 3,792,378 | — | — | 3,792,378 |
| Information Technology | 22,839,411 | 25,809,310 | — | — | 48,648,721 |
| Materials | — | 437,361 | — | — | 437,361 |
| Real Estate | — | 1,128,611 | — | — | 1,128,611 |
| Telecommunication Services | — | 1,151,487 | — | — | 1,151,487 |
| Utilities | — | 748,632 | — | — | 748,632 |
| Total Common Stocks | 34,824,708 | 88,654,163 | 0* | — | 123,478,871 |
| Money Market Funds | — | — | — | 1,531,860 | 1,531,860 |
| Total Investments | 34,824,708 | 88,654,163 | 0* | 1,531,860 | 125,010,731 |
See the Portfolio of Investments for all investment classifications not indicated in the table.
The Fund’s assets assigned to the Level 2 input category are generally valued using the market approach, in which a security’s value is determined through reference to prices and information from market transactions for similar or identical assets. These assets include certain foreign securities for which a third party statistical pricing service may be employed for purposes of fair market valuation. The model utilized by such third party statistical pricing service takes into account a security’s correlation to available market data including, but not limited to, intraday index, ADR, and exchange-traded fund movements.
There were no transfers of financial assets between levels during the period.
The Fund does not hold any significant investments (greater than one percent of net assets) categorized as Level 3.
The Fund’s assets assigned to the Level 3 category are valued utilizing the valuation technique deemed the most appropriate in the circumstances. Certain common stocks classified as Level 3 securities are valued using the market approach. To determine fair value for these securities, management considered various factors which may have included, but were not limited to, the halt price of the security, discount rates observed in the market for similar assets as well as the movement in certain foreign or domestic market indices. Significant increases (decreases) to any of these inputs would result in a significantly lower (higher) fair value measurement. Generally, a change in observable yields on comparable securities would result in a directionally similar change to discount rates.
The accompanying Notes to Financial Statements are an integral part of this statement.
Columbia Greater China Fund | Annual Report 2017
| 11 |
Statement of Assets and Liabilities
August 31, 2017
| Assets | |
| Investments in unaffiliated issuers, at cost | $62,899,192 |
| Investments in affiliated issuers, at cost | 1,531,845 |
| Investments in unaffiliated issuers, at value | 123,478,871 |
| Investments in affiliated issuers, at value | 1,531,860 |
| Receivable for: | |
| Capital shares sold | 76,426 |
| Dividends | 92,771 |
| Prepaid expenses | 796 |
| Trustees’ deferred compensation plan | 46,975 |
| Other assets | 9,104 |
| Total assets | 125,236,803 |
| Liabilities | |
| Payable for: | |
| Capital shares purchased | 62,996 |
| Management services fees | 3,253 |
| Distribution and/or service fees | 718 |
| Transfer agent fees | 18,158 |
| Compensation of board members | 440 |
| Compensation of chief compliance officer | 8 |
| Audit fees | 33,659 |
| Other expenses | 13,408 |
| Trustees’ deferred compensation plan | 46,975 |
| Total liabilities | 179,615 |
| Net assets applicable to outstanding capital stock | $125,057,188 |
| Represented by | |
| Paid in capital | 66,317,797 |
| Undistributed net investment income | 171,799 |
| Accumulated net realized loss | (2,012,099) |
| Unrealized appreciation (depreciation) on: | |
| Investments - unaffiliated issuers | 60,579,679 |
| Investments - affiliated issuers | 15 |
| Foreign currency translations | (3) |
| Total - representing net assets applicable to outstanding capital stock | $125,057,188 |
The accompanying Notes to Financial Statements are an integral part of this statement.
| 12 | Columbia Greater China Fund | Annual Report 2017 |
Statement of Assets and Liabilities (continued)
August 31, 2017
| Class A | |
| Net assets | $68,323,494 |
| Shares outstanding | 1,496,114 |
| Net asset value per share | $45.67 |
| Maximum offering price per share(a) | $48.46 |
| Class C | |
| Net assets | $9,129,535 |
| Shares outstanding | 216,121 |
| Net asset value per share | $42.24 |
| Class R4 | |
| Net assets | $3,220,257 |
| Shares outstanding | 63,920 |
| Net asset value per share | $50.38 |
| Class R5 | |
| Net assets | $899,782 |
| Shares outstanding | 17,812 |
| Net asset value per share | $50.52 |
| Class T(b) | |
| Net assets | $2,619 |
| Shares outstanding | 57 |
| Net asset value per share(c) | $45.65 |
| Maximum offering price per share(d) | $46.82 |
| Class Y | |
| Net assets | $5,112,454 |
| Shares outstanding | 103,808 |
| Net asset value per share | $49.25 |
| Class Z | |
| Net assets | $38,369,047 |
| Shares outstanding | 775,278 |
| Net asset value per share | $49.49 |
| (a) | The maximum offering price per share is calculated by dividing the net asset value per share by 1.0 minus the maximum sales charge of 5.75% for Class A. |
| (b) | Prior to March 27, 2017, Class T shares were known as Class W shares. |
| (c) | Net asset value per share rounds to this amount due to fractional shares outstanding. |
| (d) | The maximum offering price per share is calculated by dividing the net asset value per share by 1.0 minus the maximum sales charge of 2.50% for Class T. |
The accompanying Notes to Financial Statements are an integral part of this statement.
Columbia Greater China Fund | Annual Report 2017
| 13 |
Statement of Operations
Year Ended August 31, 2017
| Net investment income | |
| Income: | |
| Dividends — unaffiliated issuers | $2,000,911 |
| Dividends — affiliated issuers | 14,832 |
| Foreign taxes withheld | (132,883) |
| Total income | 1,882,860 |
| Expenses: | |
| Management services fees | 1,044,824 |
| Distribution and/or service fees | |
| Class A | 143,698 |
| Class B(a) | 1,860 |
| Class C | 95,013 |
| Class T(b) | 5 |
| Transfer agent fees | |
| Class A | 99,563 |
| Class B(a) | 334 |
| Class C | 16,541 |
| Class R4 | 6,198 |
| Class R5 | 564 |
| Class T(b) | 5 |
| Class Y(c) | 28 |
| Class Z | 66,242 |
| Compensation of board members | 19,985 |
| Custodian fees | 19,632 |
| Printing and postage fees | 31,572 |
| Registration fees | 111,014 |
| Audit fees | 40,188 |
| Legal fees | 3,138 |
| Compensation of chief compliance officer | 47 |
| Other | (32,860) |
| Total expenses | 1,667,591 |
| Expense reduction | (531) |
| Total net expenses | 1,667,060 |
| Net investment income | 215,800 |
| Realized and unrealized gain (loss) — net | |
| Net realized gain (loss) on: | |
| Investments — unaffiliated issuers | 5,429,257 |
| Investments — affiliated issuers | (116) |
| Foreign currency translations | (5,881) |
| Net realized gain | 5,423,260 |
| Net change in unrealized appreciation (depreciation) on: | |
| Investments — unaffiliated issuers | 23,069,596 |
| Investments — affiliated issuers | 15 |
| Foreign currency translations | (169) |
| Net change in unrealized appreciation (depreciation) | 23,069,442 |
| Net realized and unrealized gain | 28,492,702 |
| Net increase in net assets resulting from operations | $28,708,502 |
| (a) | Effective July 17, 2017, Class B shares were automatically converted to Class A shares. |
| (b) | Prior to March 27, 2017, Class T shares were known as Class W shares. |
| (c) | Class Y shares are based on operations from March 1, 2017 (commencement of operations) through the stated period end. |
The accompanying Notes to Financial Statements are an integral part of this statement.
| 14 | Columbia Greater China Fund | Annual Report 2017 |
Statement of Changes in Net Assets
| | Year Ended
August 31, 2017 (a) | Year Ended
August 31, 2016 |
| Operations | | |
| Net investment income (loss) | $215,800 | $(6,368) |
| Net realized gain (loss) | 5,423,260 | (6,774,151) |
| Net change in unrealized appreciation (depreciation) | 23,069,442 | 17,962,703 |
| Net increase in net assets resulting from operations | 28,708,502 | 11,182,184 |
| Distributions to shareholders | | |
| Net investment income | | |
| Class A | — | (129,280) |
| Class I(b) | — | (13) |
| Class R4 | — | (12,734) |
| Class R5 | — | (2,445) |
| Class T(c) | — | (3) |
| Class Z | — | (179,057) |
| Net realized gains | | |
| Class A | — | (4,109,275) |
| Class B(d) | — | (33,820) |
| Class C | — | (619,852) |
| Class I(b) | — | (92) |
| Class R4 | — | (129,155) |
| Class R5 | — | (18,676) |
| Class T(c) | — | (97) |
| Class Z | — | (1,912,576) |
| Total distributions to shareholders | — | (7,147,075) |
| Decrease in net assets from capital stock activity | (18,016,589) | (18,042,120) |
| Total increase (decrease) in net assets | 10,691,913 | (14,007,011) |
| Net assets at beginning of year | 114,365,275 | 128,372,286 |
| Net assets at end of year | $125,057,188 | $114,365,275 |
| Undistributed (excess of distributions over) net investment income | $171,799 | $(38,122) |
| (a) | Class Y shares are based on operations from March 1, 2017 (commencement of operations) through the stated period end. |
| (b) | Effective March 27, 2017, Class I shares were redeemed or exchanged for Class Y shares. |
| (c) | Prior to March 27, 2017, Class T shares were known as Class W shares. |
| (d) | Effective July 17, 2017, Class B shares were automatically converted to Class A shares. |
The accompanying Notes to Financial Statements are an integral part of this statement.
Columbia Greater China Fund | Annual Report 2017
| 15 |
Statement of Changes in Net Assets (continued)
| | Year Ended | Year Ended |
| | August 31, 2017 (a) | August 31, 2016 |
| | Shares | Dollars ($) | Shares | Dollars ($) |
| Capital stock activity |
| Class A(b) | | | | |
| Subscriptions (c) | 203,068 | 7,926,928 | 1,162,940 | 40,055,708 |
| Distributions reinvested | — | — | 113,880 | 3,924,304 |
| Redemptions | (365,483) | (13,326,272) | (1,516,992) | (48,801,828) |
| Net decrease | (162,415) | (5,399,344) | (240,172) | (4,821,816) |
| Class B(b) | | | | |
| Subscriptions | — | — | 118 | 3,723 |
| Distributions reinvested | — | — | 951 | 29,925 |
| Redemptions (c) | (10,038) | (338,805) | (24,495) | (755,480) |
| Net decrease | (10,038) | (338,805) | (23,426) | (721,832) |
| Class C | | | | |
| Subscriptions | 6,032 | 216,566 | 20,453 | 658,210 |
| Distributions reinvested | — | — | 14,385 | 464,493 |
| Redemptions | (123,717) | (4,311,208) | (87,101) | (2,680,999) |
| Net decrease | (117,685) | (4,094,642) | (52,263) | (1,558,296) |
| Class I(d) | | | | |
| Redemptions | (54) | (2,196) | — | — |
| Net decrease | (54) | (2,196) | — | — |
| Class R4 | | | | |
| Subscriptions | 18,167 | 756,460 | 38,371 | 1,396,288 |
| Distributions reinvested | — | — | 3,738 | 141,536 |
| Redemptions | (45,415) | (2,025,325) | (18,634) | (666,692) |
| Net increase (decrease) | (27,248) | (1,268,865) | 23,475 | 871,132 |
| Class R5 | | | | |
| Subscriptions | 11,303 | 467,972 | 15,229 | 527,355 |
| Distributions reinvested | — | — | 555 | 21,018 |
| Redemptions | (16,140) | (676,446) | (5,110) | (180,424) |
| Net increase (decrease) | (4,837) | (208,474) | 10,674 | 367,949 |
| Class Y(d) | | | | |
| Subscriptions | 105,498 | 4,999,018 | — | — |
| Redemptions | (1,690) | (82,974) | — | — |
| Net increase | 103,808 | 4,916,044 | — | — |
| Class Z | | | | |
| Subscriptions | 274,905 | 11,344,693 | 329,125 | 11,375,179 |
| Distributions reinvested | — | — | 22,368 | 831,859 |
| Redemptions | (558,474) | (22,965,000) | (658,591) | (24,386,295) |
| Net decrease | (283,569) | (11,620,307) | (307,098) | (12,179,257) |
| Total net decrease | (502,038) | (18,016,589) | (588,810) | (18,042,120) |
| (a) | Class Y shares are based on operations from March 1, 2017 (commencement of operations) through the stated period end. |
| (b) | Effective July 17, 2017, Class B shares were automatically converted to Class A shares. |
| (c) | Includes conversions of Class B shares to Class A shares, if any. |
| (d) | Effective March 27, 2017, Class I shares were redeemed or exchanged for Class Y shares. |
The accompanying Notes to Financial Statements are an integral part of this statement.
| 16 | Columbia Greater China Fund | Annual Report 2017 |
[THIS PAGE INTENTIONALLY LEFT BLANK]
Columbia Greater China Fund | Annual Report 2017
| 17 |
The following table is intended to help you understand the Fund’s financial performance. Certain information reflects financial results for a single share of a class held for the periods shown. Per share net investment income (loss) amounts are calculated based on average shares outstanding during the period. Total return assumes reinvestment of all dividends and distributions, if any. Total return does not reflect payment of sales charges, if any. Total return and portfolio turnover are not annualized for periods of less than one year. The portfolio turnover rate is calculated without regard to purchase and sales transactions of short-term instruments and certain derivatives, if any. If such transactions were included, the Fund’s portfolio turnover rate may be higher.
| Year ended | Net asset value,
beginning of
period | Net
investment
income
(loss) | Net
realized
and
unrealized
gain (loss) | Increase
from payment
by affiliate | Total from
investment
operations | Distributions
from net
investment
income | Distributions
from net
realized
gains |
| Class A |
| 8/31/2017 | $35.20 | 0.06 | 10.41 | — | 10.47 | — | — |
| 8/31/2016 | $33.33 | (0.04) | 3.66 | — | 3.62 | (0.05) | (1.70) |
| 8/31/2015 | $45.93 | 0.02 | (3.87) | 0.15 | (3.70) | (0.30) | (8.60) |
| 8/31/2014 | $48.80 | 0.33 | 8.97 | — | 9.30 | (0.81) | (11.36) |
| 8/31/2013 | $42.08 | 0.44 | 6.81 | — | 7.25 | (0.53) | — |
| Class C |
| 8/31/2017 | $32.81 | (0.24) | 9.67 | — | 9.43 | — | — |
| 8/31/2016 | $31.35 | (0.22) | 3.38 | — | 3.16 | — | (1.70) |
| 8/31/2015 | $43.71 | (0.28) | (3.62) | 0.14 | (3.76) | — | (8.60) |
| 8/31/2014 | $46.94 | (0.02) | 8.60 | — | 8.58 | (0.45) | (11.36) |
| 8/31/2013 | $40.51 | 0.07 | 6.55 | — | 6.62 | (0.19) | — |
| Class R4 |
| 8/31/2017 | $38.74 | 0.18 | 11.46 | — | 11.64 | — | — |
| 8/31/2016 | $36.53 | 0.11 | 3.96 | — | 4.07 | (0.16) | (1.70) |
| 8/31/2015 | $49.47 | 1.09 | (5.18) | 0.16 | (3.93) | (0.41) | (8.60) |
| 8/31/2014 | $51.71 | (0.01) | 10.04 | — | 10.03 | (0.91) | (11.36) |
| 8/31/2013 (g) | $49.17 | 0.88 | 1.66 | — | 2.54 | — | — |
| Class R5 |
| 8/31/2017 | $38.80 | 0.22 | 11.50 | — | 11.72 | — | — |
| 8/31/2016 | $36.58 | 0.24 | 3.90 | — | 4.14 | (0.22) | (1.70) |
| 8/31/2015 | $49.52 | 0.52 | (4.54) | 0.16 | (3.86) | (0.48) | (8.60) |
| 8/31/2014 | $51.76 | 0.73 | 9.38 | — | 10.11 | (0.99) | (11.36) |
| 8/31/2013 (i) | $48.84 | 0.63 | 2.97 | — | 3.60 | (0.68) | — |
| Class T(j) |
| 8/31/2017 | $35.20 | 0.07 | 10.38 | — | 10.45 | — | — |
| 8/31/2016 | $33.33 | 0.01 | 3.61 | — | 3.62 | (0.05) | (1.70) |
| 8/31/2015 | $45.95 | 0.01 | (3.86) | 0.15 | (3.70) | (0.32) | (8.60) |
| 8/31/2014 | $48.82 | 0.36 | 8.96 | — | 9.32 | (0.83) | (11.36) |
| 8/31/2013 | $42.10 | 0.51 | 6.77 | — | 7.28 | (0.56) | — |
The accompanying Notes to Financial Statements are an integral part of this statement.
| 18 | Columbia Greater China Fund | Annual Report 2017 |
Total
distributions to
shareholders | Net
asset
value,
end of
period | Total
return | Total gross
expense
ratio to
average
net assets(a) | Total net
expense
ratio to
average
net assets(a),(b) | Net investment
income (loss)
ratio to
average
net assets | Portfolio
turnover | Net
assets,
end of
period
(000’s) |
| |
| — | $45.67 | 29.74% | 1.55% (c) | 1.55% (c),(d) | 0.17% | 35% | $68,323 |
| (1.75) | $35.20 | 10.97% | 1.60% (e) | 1.60% (d),(e) | (0.11%) | 39% | $58,385 |
| (8.90) | $33.33 | (9.49%) (f) | 1.56% (e) | 1.56% (d),(e) | 0.04% | 74% | $63,284 |
| (12.17) | $45.93 | 21.22% | 1.57% (e) | 1.57% (d),(e) | 0.73% | 61% | $97,302 |
| (0.53) | $48.80 | 17.24% | 1.54% | 1.54% (d) | 0.94% | 39% | $78,119 |
| |
| — | $42.24 | 28.74% | 2.29% (c) | 2.29% (c),(d) | (0.70%) | 35% | $9,130 |
| (1.70) | $32.81 | 10.15% | 2.36% (e) | 2.36% (d),(e) | (0.71%) | 39% | $10,952 |
| (8.60) | $31.35 | (10.16%) (f) | 2.32% (e) | 2.32% (d),(e) | (0.71%) | 74% | $12,103 |
| (11.81) | $43.71 | 20.32% | 2.32% (e) | 2.32% (d),(e) | (0.05%) | 61% | $15,851 |
| (0.19) | $46.94 | 16.33% | 2.29% | 2.29% (d) | 0.15% | 39% | $17,056 |
| |
| — | $50.38 | 30.05% | 1.30% (c) | 1.30% (c),(d) | 0.43% | 35% | $3,220 |
| (1.86) | $38.74 | 11.27% | 1.36% (e) | 1.36% (d),(e) | 0.30% | 39% | $3,532 |
| (9.01) | $36.53 | (9.26%) (f) | 1.29% (e) | 1.29% (d),(e) | 2.47% | 74% | $2,473 |
| (12.27) | $49.47 | 21.50% | 1.33% (e) | 1.33% (d),(e) | (0.03%) | 61% | $8 |
| — | $51.71 | 5.17% | 1.32% (h) | 1.32% (d),(h) | 4.00% (h) | 39% | $12 |
| |
| — | $50.52 | 30.21% | 1.18% (c) | 1.18% (c) | 0.54% | 35% | $900 |
| (1.92) | $38.80 | 11.44% | 1.21% (e) | 1.21% (e) | 0.66% | 39% | $879 |
| (9.08) | $36.58 | (9.11%) (f) | 1.16% (e) | 1.16% (e) | 1.17% | 74% | $438 |
| (12.35) | $49.52 | 21.67% | 1.19% (e) | 1.19% (e) | 1.58% | 61% | $117 |
| (0.68) | $51.76 | 7.40% | 1.16% (h) | 1.16% (h) | 1.53% (h) | 39% | $3 |
| |
| — | $45.65 | 29.69% | 1.56% (c) | 1.56% (c),(d) | 0.18% | 35% | $3 |
| (1.75) | $35.20 | 10.97% | 1.60% (e) | 1.60% (d),(e) | 0.06% | 39% | $2 |
| (8.92) | $33.33 | (9.48%) (f) | 1.56% (e) | 1.56% (d),(e) | 0.01% | 74% | $2 |
| (12.19) | $45.95 | 21.27% | 1.52% (e) | 1.52% (d),(e) | 0.78% | 61% | $3 |
| (0.56) | $48.82 | 17.30% | 1.49% | 1.49% (d) | 1.07% | 39% | $3 |
Columbia Greater China Fund | Annual Report 2017
| 19 |
Financial Highlights (continued)
| Year ended | Net asset value,
beginning of
period | Net
investment
income
(loss) | Net
realized
and
unrealized
gain (loss) | Increase
from payment
by affiliate | Total from
investment
operations | Distributions
from net
investment
income | Distributions
from net
realized
gains |
| Class Y |
| 8/31/2017 (k) | $38.50 | 0.22 | 10.53 | — | 10.75 | — | — |
| Class Z |
| 8/31/2017 | $38.05 | 0.17 | 11.27 | — | 11.44 | — | — |
| 8/31/2016 | $35.91 | 0.12 | 3.87 | — | 3.99 | (0.15) | (1.70) |
| 8/31/2015 | $48.78 | 0.38 | (4.39) | 0.16 | (3.85) | (0.42) | (8.60) |
| 8/31/2014 | $51.16 | 0.46 | 9.45 | — | 9.91 | (0.93) | (11.36) |
| 8/31/2013 | $44.08 | 0.59 | 7.13 | — | 7.72 | (0.64) | — |
| Notes to Financial Highlights |
| (a) | In addition to the fees and expenses that the Fund bears directly, the Fund indirectly bears a pro rata share of the fees and expenses of any other funds in which it invests. Such indirect expenses are not included in the Fund’s reported expense ratios. |
| (b) | Total net expenses include the impact of certain fee waivers/expense reimbursements made by the Investment Manager and certain of its affiliates, if applicable. |
| (c) | Expenses have been reduced due to a reimbursement of expenses overbilled by a third party. If the reimbursement had been excluded, the expense ratios would have been higher by the percentages shown for each class in the table below. All fee waivers and expense reimbursements by the Investment Manager and its affiliates were applied before giving effect to this third party reimbursement. |
| | Class A | Class C | Class R4 | Class R5 | Class T | Class Z |
| 08/31/2017 | 0.06 % | 0.06 % | 0.05 % | 0.06 % | 0.05 % | 0.06 % |
| (d) | The benefits derived from expense reductions had an impact of less than 0.01%. |
| (e) | Ratios include line of credit interest expense which is less than 0.01%. |
| (f) | The Fund received a payment from an affiliate. Had the Fund not received this payment, the total return would have been lower by 0.33%. |
| (g) | Class R4 shares commenced operations on March 19, 2013. Per share data and total return reflect activity from that date. |
| (h) | Annualized. |
| (i) | Class R5 shares commenced operations on November 8, 2012. Per share data and total return reflect activity from that date. |
| (j) | Prior to March 27, 2017, Class T shares were known as Class W shares. |
| (k) | Class Y shares commenced operations on March 1, 2017. Per share data and total return reflect activity from that date. |
The accompanying Notes to Financial Statements are an integral part of this statement.
| 20 | Columbia Greater China Fund | Annual Report 2017 |
Total
distributions to
shareholders | Net
asset
value,
end of
period | Total
return | Total gross
expense
ratio to
average
net assets(a) | Total net
expense
ratio to
average
net assets(a),(b) | Net investment
income (loss)
ratio to
average
net assets | Portfolio
turnover | Net
assets,
end of
period
(000’s) |
| |
| — | $49.25 | 27.92% | 1.22% (h) | 1.22% (h) | 1.45% (h) | 35% | $5,112 |
| |
| — | $49.49 | 30.07% | 1.29% (c) | 1.29% (c),(d) | 0.43% | 35% | $38,369 |
| (1.85) | $38.05 | 11.24% | 1.35% (e) | 1.35% (d),(e) | 0.34% | 39% | $40,293 |
| (9.02) | $35.91 | (9.24%) (f) | 1.31% (e) | 1.31% (d),(e) | 0.86% | 74% | $49,047 |
| (12.29) | $48.78 | 21.49% | 1.32% (e) | 1.32% (d),(e) | 0.96% | 61% | $29,730 |
| (0.64) | $51.16 | 17.54% | 1.29% | 1.29% (d) | 1.18% | 39% | $28,948 |
Columbia Greater China Fund | Annual Report 2017
| 21 |
Notes to Financial Statements
August 31, 2017
Note 1. Organization
Columbia Greater China Fund (the Fund), a series of Columbia Funds Series Trust I (the Trust), is a non-diversified fund. The Trust is registered under the Investment Company Act of 1940, as amended (the 1940 Act), as an open-end management investment company organized as a Massachusetts business trust.
Fund shares
The Trust may issue an unlimited number of shares (without par value). Although all share classes generally have identical voting, dividend and liquidation rights, each share class votes separately when required by the Trust’s organizational documents or by law. Different share classes pay different distribution amounts to the extent the expenses of such share classes differ, and distributions in liquidation will be proportional to the net asset value of each share class. Each share class has its own expense and sales charge structure. The Fund offers each of the share classes identified below.
Class A shares are subject to a maximum front-end sales charge of 5.75% based on the initial investment amount. Class A shares purchased without an initial sales charge in accounts aggregating $1 million to $50 million at the time of purchase are subject to a contingent deferred sales charge (CDSC) if the shares are sold within 18 months after purchase, charged as follows: 1.00% CDSC if redeemed within 12 months after purchase, and 0.50% CDSC if redeemed more than 12, but less than 18, months after purchase.
Class B shares of the Fund are no longer offered for sale. When available, Class B shares were subject to a maximum CDSC of 5.00% based upon the holding period after purchase. Effective July 17, 2017, Class B shares were automatically converted to Class A shares without a CDSC. On August 4, 2017, the capital owned by Columbia Management Investment Advisers, LLC in Class B shares was redeemed without a CDSC.
Class C shares are subject to a 1.00% CDSC on shares redeemed within 12 months after purchase.
The Fund no longer accepts investments by new or existing investors in Class I shares. Class I shares, when available, were not subject to sales charges, and were made available only to the Columbia Family of Funds. On March 27, 2017, Class I shares were redeemed or exchanged for Class Y shares of the Fund in a tax free transaction that had no impact on the fees and expenses paid by shareholders.
Class R4 shares are not subject to sales charges and are generally available only to omnibus retirement plans and certain investors as described in the Fund’s prospectus. Effective November 1, 2017, Class R4 shares will be renamed Advisor Class shares.
Class R5 shares are not subject to sales charges and are generally available only to investors purchasing through authorized investment professionals and omnibus retirement plans as described in the Fund’s prospectus. Effective November 1, 2017, Class R5 shares will be renamed Institutional 2 Class shares.
Class T shares are subject to a maximum front-end sales charge of 2.50% per transaction and must be purchased through financial intermediaries that, by written agreement with Columbia Management Investment Distributors, Inc., are specifically authorized to sell Class T shares. Prior to March 27, 2017, Class T shares were known as Class W shares, were not subject to sales charges, and were generally available only to investors purchasing through authorized investment programs managed by investment professionals, including discretionary managed accounts.
Class Y shares are not subject to sales charges and are available to institutional and certain other investors as described in the Fund’s prospectus. Class Y shares commenced operations on March 1, 2017. Effective November 1, 2017, Class Y shares will be renamed Institutional 3 Class shares.
Class Z shares are not subject to sales charges and are generally available only to eligible investors, which are subject to different investment minimums as described in the Fund’s prospectus. Effective November 1, 2017, Class Z shares will be renamed Institutional Class shares.
| 22 | Columbia Greater China Fund | Annual Report 2017 |
Notes to Financial Statements (continued)
August 31, 2017
Note 2. Summary of significant accounting policies
Basis of preparation
The Fund is an investment company that applies the accounting and reporting guidance in the Financial Accounting Standards Board (FASB) Accounting Standards Codification Topic 946, Financial Services - Investment Companies (ASC 946). The financial statements are prepared in accordance with U.S. generally accepted accounting principles (GAAP), which requires management to make certain estimates and assumptions that affect the reported amounts of assets and liabilities, the disclosure of contingent assets and liabilities at the date of the financial statements and the reported amounts of income and expenses during the reporting period. Actual results could differ from those estimates. The Fund received a reimbursement for expenses overbilled by a third party. Such reimbursement is included as an offset to other expenses on the Statement of Operations. All fee waivers and expense reimbursements by Columbia Management Investment Advisers, LLC and its affiliates were applied before giving effect to the third party reimbursement.
The following is a summary of significant accounting policies followed by the Fund in the preparation of its financial statements.
Security valuation
All equity securities are valued at the close of business of the New York Stock Exchange. Equity securities are valued at the last quoted sales price on the principal exchange or market on which they trade, except for securities traded on the NASDAQ Stock Market, which are valued at the NASDAQ official close price. Unlisted securities or listed securities for which there were no sales during the day are valued at the mean of the latest quoted bid and ask prices on such exchanges or markets.
Foreign equity securities are valued based on the closing price on the foreign exchange in which such securities are primarily traded. If any foreign equity security closing prices are not readily available, the securities are valued at the mean of the latest quoted bid and ask prices on such exchanges or markets. Foreign currency exchange rates are generally determined at 4:00 p.m. Eastern (U.S.) time. Many securities markets and exchanges outside the U.S. close prior to the close of the New York Stock Exchange; therefore, the closing prices for securities in such markets or on such exchanges may not fully reflect events that occur after such close but before the close of the New York Stock Exchange. In those situations, foreign securities will be fair valued pursuant to a policy adopted by the Board of Trustees, including, if available, utilizing a third party pricing service to determine these fair values. The third party pricing service takes into account multiple factors, including, but not limited to, movements in the U.S. securities markets, certain depositary receipts, futures contracts and foreign exchange rates that have occurred subsequent to the close of the foreign exchange or market, to determine a good faith estimate that reasonably reflects the current market conditions as of the close of the New York Stock Exchange. The fair value of a security is likely to be different from the quoted or published price, if available.
Investments in open-end investment companies, including money market funds, are valued at their latest net asset value.
Investments for which market quotations are not readily available, or that have quotations which management believes are not reflective of market value or reliable, are valued at fair value as determined in good faith under procedures approved by and under the general supervision of the Board of Trustees. If a security or class of securities (such as foreign securities) is valued at fair value, such value is likely to be different from the quoted or published price for the security.
The determination of fair value often requires significant judgment. To determine fair value, management may use assumptions including but not limited to future cash flows and estimated risk premiums. Multiple inputs from various sources may be used to determine fair value.
GAAP requires disclosure regarding the inputs and valuation techniques used to measure fair value and any changes in valuation inputs or techniques. In addition, investments shall be disclosed by major category. This information is disclosed following the Fund’s Portfolio of Investments.
Columbia Greater China Fund | Annual Report 2017
| 23 |
Notes to Financial Statements (continued)
August 31, 2017
Foreign currency transactions and translations
The values of all assets and liabilities denominated in foreign currencies are generally translated into U.S. dollars at exchange rates determined at the close of regular trading on the New York Stock Exchange. Net realized and unrealized gains (losses) on foreign currency transactions and translations include gains (losses) arising from the fluctuation in exchange rates between trade and settlement dates on securities transactions, gains (losses) arising from the disposition of foreign currency and currency gains (losses) between the accrual and payment dates on dividends, interest income and foreign withholding taxes.
For financial statement purposes, the Fund does not distinguish that portion of gains (losses) on investments which is due to changes in foreign exchange rates from that which is due to changes in market prices of the investments. Such fluctuations are included with the net realized and unrealized gains (losses) on investments in the Statement of Operations.
Security transactions
Security transactions are accounted for on the trade date. Cost is determined and gains (losses) are based upon the specific identification method for both financial statement and federal income tax purposes.
Income recognition
Corporate actions and dividend income are generally recorded net of any non-reclaimable tax withholdings, on the ex-dividend date or upon receipt of ex-dividend notification in the case of certain foreign securities.
Awards from class action litigation are recorded as a reduction of cost basis if the Fund still owns the applicable securities on the payment date. If the Fund no longer owns the applicable securities, the proceeds are recorded as realized gains.
Expenses
General expenses of the Trust are allocated to the Fund and other funds of the Trust based upon relative net assets or other expense allocation methodologies determined by the nature of the expense. Expenses directly attributable to the Fund are charged to the Fund. Expenses directly attributable to a specific class of shares are charged to that share class.
Determination of class net asset value
All income, expenses (other than class-specific expenses, which are charged to that share class, as shown in the Statement of Operations) and realized and unrealized gains (losses) are allocated to each class of the Fund on a daily basis, based on the relative net assets of each class, for purposes of determining the net asset value of each class.
Federal income tax status
The Fund intends to qualify each year as a regulated investment company under Subchapter M of the Internal Revenue Code, as amended, and will distribute substantially all of its taxable income (including net short-term capital gains) and capital gains, if any, for its tax year, and as such will not be subject to federal income taxes. In addition, the Fund intends to distribute in each calendar year substantially all of its net investment income, capital gains and certain other amounts, if any, such that the Fund should not be subject to federal excise tax. Therefore, no federal income or excise tax provision is recorded.
Foreign taxes
The Fund may be subject to foreign taxes on income, gains on investments or currency repatriation, a portion of which may be recoverable. The Fund will accrue such taxes and recoveries, as applicable, based upon its current interpretation of tax rules and regulations that exist in the markets in which it invests.
Realized gains in certain countries may be subject to foreign taxes at the Fund level, based on statutory rates. The Fund accrues for such foreign taxes on realized and unrealized gains at the appropriate rate for each jurisdiction, as applicable. The amount, if any, is disclosed as a liability on the Statement of Assets and Liabilities.
| 24 | Columbia Greater China Fund | Annual Report 2017 |
Notes to Financial Statements (continued)
August 31, 2017
Distributions to shareholders
Distributions from net investment income, if any, are declared and paid annually. Net realized capital gains, if any, are distributed along with the income distribution. Income distributions and capital gain distributions are determined in accordance with federal income tax regulations, which may differ from GAAP.
Guarantees and indemnifications
Under the Trust’s organizational documents and, in some cases, by contract, its officers and trustees are indemnified against certain liabilities arising out of the performance of their duties to the Trust or its funds. In addition, certain of the Fund’s contracts with its service providers contain general indemnification clauses. The Fund’s maximum exposure under these arrangements is unknown since the amount of any future claims that may be made against the Fund cannot be determined, and the Fund has no historical basis for predicting the likelihood of any such claims.
Recent accounting pronouncement
Accounting Standards Update 2017-08 Premium Amortization on Purchased Callable Debt Securities
In March 2017, the Financial Accounting Standards Board issued Accounting Standards Update (ASU) No. 2017-08 Premium Amortization on Purchased Callable Debt Securities. ASU No. 2017-08 updates the accounting standards to shorten the amortization period for certain purchased callable debt securities, held at a premium, to be amortized to the earliest call date. The update applies to securities with explicit, noncontingent call features that are callable at fixed prices and on preset dates. The standard is effective for annual periods beginning after December 15, 2018 and interim periods within those fiscal years. At this time, management is evaluating the implication of this guidance and the impact it will have on the financial statement amounts and footnote disclosures, if any.
Note 3. Fees and other transactions with affiliates
Management services fees
The Fund has entered into a Management Agreement with Columbia Management Investment Advisers, LLC (the Investment Manager), a wholly-owned subsidiary of Ameriprise Financial, Inc. (Ameriprise Financial). Under the Management Agreement, the Investment Manager provides the Fund with investment research and advice, as well as administrative and accounting services. The management services fee is an annual fee that is equal to a percentage of the Fund’s daily net assets that declines from 0.95% to 0.72% as the Fund’s net assets increase. The effective management services fee rate for the year ended August 31, 2017 was 0.95% of the Fund’s average daily net assets.
Compensation of board members
Members of the Board of Trustees, who are not officers or employees of the Investment Manager or Ameriprise Financial, are compensated for their services to the Fund as disclosed in the Statement of Operations. These members of the Board of Trustees may participate in a Deferred Compensation Plan (the Plan) which may be terminated at any time. Obligations of the Plan will be paid solely out of the Fund’s assets, and all amounts payable under the Plan constitute a general unsecured obligation of the Fund.
Compensation of Chief Compliance Officer
The Board of Trustees has appointed a Chief Compliance Officer to the Fund in accordance with federal securities regulations. A portion of the Chief Compliance Officer’s total compensation is allocated to the Fund, along with other affiliated funds governed by the Board of Trustees, based on relative net assets. The total amount allocated to all affiliated funds governed by the Board of Trustees will not exceed $40,000 annually.
Columbia Greater China Fund | Annual Report 2017
| 25 |
Notes to Financial Statements (continued)
August 31, 2017
Transfer agency fees
Under a Transfer and Dividend Disbursing Agent Agreement, Columbia Management Investment Services Corp. (the Transfer Agent), an affiliate of the Investment Manager and a wholly-owned subsidiary of Ameriprise Financial, is responsible for providing transfer agency services to the Fund. The Transfer Agent has contracted with Boston Financial Data Services (BFDS) to serve as sub-transfer agent. The Transfer Agent pays the fees of BFDS for services as sub-transfer agent and BFDS is not entitled to reimbursement for such fees from the Fund (with the exception of out-of-pocket fees).
The Fund pays the Transfer Agent a monthly transfer agency fee based on the number or the average value of accounts, depending on the type of account. In addition, prior to October 1, 2016, the Transfer Agent also received sub-transfer agency fees based on a percentage of the average aggregate value of the Fund’s shares maintained in omnibus accounts (other than omnibus accounts for which American Enterprise Investment Services Inc. is the broker of record or accounts where the beneficial shareholder is a customer of Ameriprise Financial Services, Inc., for which the Transfer Agent receives a per account fee). Effective October 1, 2016, the Fund pays the Transfer Agent a fee for shareholder services based on the number of accounts or on a percentage of the average aggregate value of the Fund’s shares maintained in omnibus accounts up to the lesser of the amount charged by the financial intermediary or a cap established by the Board of Trustees from time to time.
The Transfer Agent also receives compensation from the Fund for various shareholder services and reimbursements for certain out-of-pocket fees. Effective August 1, 2017, total transfer agency fees for Class R5 and Class Y shares are subject to an annual limitation of not more than 0.07% and 0.02%, respectively, of the average daily net assets attributable to each share class. From January 1, 2017 to July 31, 2017, these limitations were 0.075% for Class R5 shares and 0.025% for Class I and Class Y shares; and prior to January 1, 2017, the limitation was 0.05% for Class R5 shares and Class I shares did not pay transfer agency fees.
For the year ended August 31, 2017, the Fund’s effective transfer agency fee rates as a percentage of average daily net assets of each class were as follows:
| | Effective rate (%) |
| Class A | 0.17 |
| Class B | 0.17 (a),(b) |
| Class C | 0.17 |
| Class R4 | 0.17 |
| Class R5 | 0.07 |
| Class T | 0.19 |
| Class Y | 0.02 (c) |
| Class Z | 0.17 |
| (a) | Effective July 17, 2017, Class B shares were automatically converted to Class A shares. |
| (b) | Unannualized. |
| (c) | Annualized. |
An annual minimum account balance fee of $20 may apply to certain accounts with a value below the applicable share class’s initial minimum investment requirements to reduce the impact of small accounts on transfer agency fees. These minimum account balance fees are remitted to the Fund and recorded as part of expense reductions in the Statement of Operations. For the year ended August 31, 2017, these minimum account balance fees reduced total expenses of the Fund by $531.
Distribution and service fees
The Fund has entered into an agreement with Columbia Management Investment Distributors, Inc. (the Distributor), an affiliate of the Investment Manager and a wholly-owned subsidiary of Ameriprise Financial, for distribution and shareholder services. The Board of Trustees has approved, and the Fund has adopted, distribution and shareholder service plans (the Plans) applicable to certain share classes, which set the distribution and service fees for the Fund. These fees are calculated daily and are intended to compensate the Distributor and/or eligible selling and/or servicing agents for selling shares of the Fund and providing services to investors.
| 26 | Columbia Greater China Fund | Annual Report 2017 |
Notes to Financial Statements (continued)
August 31, 2017
Under the Plans, the Fund pays a monthly service fee to the Distributor at the maximum annual rate of 0.25% of the average daily net assets attributable to Class A, Class B, Class C and Class T shares of the Fund. Also under the Plans, the Fund pays a monthly distribution fee to the Distributor at the maximum annual rates of 0.75%, 0.75% and 0.25% of the average daily net assets attributable to Class B, Class C and Class T shares of the Fund, respectively. As a result of all Class B shares of the Fund being redeemed or converted to Class A shares, August 4, 2017 was the last day the Fund paid a service fee or distribution fee for Class B shares.
Although the Fund may pay a distribution fee up to 0.25% of the Fund’s average daily net assets attributable to Class T shares and a service fee of up to 0.25% of the Fund’s average daily net assets attributable to Class T shares, the aggregate fee shall not exceed 0.25% of the Fund’s average daily net assets attributable to Class T shares.
Sales charges (unaudited)
Sales charges, including front-end charges and CDSCs, received by the Distributor for distributing Fund shares for the year ended August 31, 2017, if any, are listed below:
| | Amount ($) |
| Class A | 28,552 |
| Class C | 874 |
Expenses waived/reimbursed by the Investment Manager and its affiliates
The Investment Manager and certain of its affiliates have contractually agreed to waive fees and/or reimburse expenses (excluding certain fees and expenses described below) for the period(s) disclosed below, unless sooner terminated at the sole discretion of the Board of Trustees, so that the Fund’s net operating expenses, after giving effect to fees waived/expenses reimbursed and any balance credits and/or overdraft charges from the Fund’s custodian, do not exceed the following annual rate(s) as a percentage of the class’ average daily net assets:
| | July 1, 2017
through
June 30, 2018 | Prior to
July 1, 2017 |
| Class A | 1.86% | 1.78% |
| Class C | 2.61 | 2.53 |
| Class R4 | 1.61 | 1.53 |
| Class R5 | 1.525 | 1.42 |
| Class T | 1.86 | 1.78 |
| Class Y | 1.475* | — |
| Class Z | 1.61 | 1.53 |
*Expense cap rate is contractual from March 1, 2017 (the commencement of operations of Class Y shares) through June 30, 2018.
Under the agreement governing these fee waivers and/or expense reimbursement arrangements, the following fees and expenses are excluded from the waiver/reimbursement commitment, and therefore will be paid by the Fund, if applicable: taxes (including foreign transaction taxes), expenses associated with investments in affiliated and non-affiliated pooled investment vehicles (including mutual funds and exchange-traded funds), transaction costs and brokerage commissions, costs related to any securities lending program, dividend expenses associated with securities sold short, inverse floater program fees and expenses, transaction charges and interest on borrowed money, interest, infrequent and/or unusual expenses and any other expenses the exclusion of which is specifically approved by the Board of Trustees. This agreement may be modified or amended only with approval from the Investment Manager, certain of its affiliates and the Fund. Any fees waived and/or expenses reimbursed under the expense reimbursement arrangements described above are not recoverable by the Investment Manager or its affiliates in future periods.
Note 4. Federal tax information
The timing and character of income and capital gain distributions are determined in accordance with income tax regulations, which may differ from GAAP because of temporary or permanent book to tax differences.
Columbia Greater China Fund | Annual Report 2017
| 27 |
Notes to Financial Statements (continued)
August 31, 2017
At August 31, 2017, these differences are primarily due to differing treatment for deferral/reversal of wash sale losses, capital loss carryforwards, trustees’ deferred compensation and foreign currency transactions. To the extent these differences are permanent, reclassifications are made among the components of the Fund’s net assets in the Statement of Assets and Liabilities. Temporary differences do not require reclassifications.
In the Statement of Assets and Liabilities the following reclassifications were made:
Undistributed net
investment
income ($) | Accumulated
net realized
(loss) ($) | Paid in
capital ($) |
| (5,879) | 5,879 | — |
Net investment income (loss) and net realized gains (losses), as disclosed in the Statement of Operations, and net assets were not affected by this reclassification.
The tax character of distributions paid during the years indicated was as follows:
| August 31, 2017 | August 31, 2016 |
Ordinary
income ($) | Long-term
capital gains ($) | Total ($) | Ordinary
income ($) | Long-term
capital gains ($) | Total ($) |
| — | — | — | 339,510 | 6,807,565 | 7,147,075 |
Short-term capital gain distributions, if any, are considered ordinary income distributions for tax purposes.
At August 31, 2017, the components of distributable earnings on a tax basis were as follows:
Undistributed
ordinary income ($) | Undistributed
long-term
capital gains ($) | Capital loss
carryforwards ($) | Net unrealized
appreciation ($) |
| 218,775 | — | (1,802,252) | 60,369,847 |
At August 31, 2017, the cost of all investments for federal income tax purposes along with the aggregate gross unrealized appreciation and depreciation based on that cost was:
Federal
tax cost ($) | Gross unrealized
appreciation ($) | Gross unrealized
(depreciation) ($) | Net unrealized
appreciation ($) |
| 64,640,884 | 61,172,024 | (802,177) | 60,369,847 |
Tax cost of investments and unrealized appreciation/(depreciation) may also include timing differences that do not constitute adjustments to tax basis.
The following capital loss carryforwards, determined at August 31, 2017, may be available to reduce taxable income arising from future net realized gains on investments, if any, to the extent permitted by the Internal Revenue Code. Capital loss carryforwards with no expiration are required to be utilized prior to any capital losses which carry an expiration date. As a result of this ordering rule, capital loss carryforwards which carry an expiration date may be more likely to expire unused. In addition, for the year ended August 31, 2017, capital loss carryforwards utilized, expired unused and permanently lost, if any, were as follows:
| 2018 ($) | 2019 ($) | No expiration
short-term ($) | No expiration
long-term ($) | Total ($) | Utilized ($) | Expired ($) | Permanently
lost ($) |
| — | — | 1,802,252 | — | 1,802,252 | 1,051,696 | — | — |
Management of the Fund has concluded that there are no significant uncertain tax positions in the Fund that would require recognition in the financial statements. However, management’s conclusion may be subject to review and adjustment at a later date based on factors including, but not limited to, new tax laws, regulations, and administrative interpretations (including relevant court decisions). Generally, the Fund’s federal tax returns for the prior three fiscal years remain subject to examination by the Internal Revenue Service.
| 28 | Columbia Greater China Fund | Annual Report 2017 |
Notes to Financial Statements (continued)
August 31, 2017
Note 5. Portfolio information
The cost of purchases and proceeds from sales of securities, excluding short-term investments and derivatives, if any, aggregated to $38,191,638 and $54,798,390, respectively, for the year ended August 31, 2017. The amount of purchase and sale activity impacts the portfolio turnover rate reported in the Financial Highlights.
Note 6. Affiliated money market fund
The Fund invests in Columbia Short-Term Cash Fund, an affiliated money market fund established for the exclusive use by the Fund and other affiliated funds (the Affiliated MMF). The income earned by the Fund from such investments is included as Dividends - affiliated issuers in the Statement of Operations. As an investing fund, the Fund indirectly bears its proportionate share of the expenses of the Affiliated MMF. Effective October 1, 2016, the Affiliated MMF prices its shares with a floating net asset value (NAV) and no longer seeks to maintain a stable NAV. In addition, the Board of Trustees of the Affiliated MMF may impose a fee on redemptions (sometimes referred to as a liquidity fee) or temporarily suspend redemptions (sometimes referred to as imposing a redemption gate) in the event its liquidity falls below regulatory limits.
Note 7. Line of credit
The Fund has access to a revolving credit facility with a syndicate of banks led by Citibank, N.A., HSBC Bank USA, N.A. and JPMorgan Chase Bank, N.A. whereby the Fund may borrow for the temporary funding of shareholder redemptions or for other temporary or emergency purposes. The credit facility, which is a collective agreement between the Fund and certain other funds managed by the Investment Manager, severally and not jointly, permits collective borrowings up to $1 billion. Interest is charged to each participating fund based on its borrowings at a rate equal to the higher of (i) the overnight federal funds rate plus 1.00% or (ii) the one-month LIBOR rate plus 1.00%. Each borrowing under the credit facility matures no later than 60 days after the date of borrowing. The Fund also pays a commitment fee equal to its pro rata share of the amount of the credit facility at a rate of 0.15% per annum. The commitment fee is included in other expenses in the Statement of Operations.
The Fund had no borrowings during the year ended August 31, 2017.
Note 8. Significant risks
Financial sector risk
The Fund may be more susceptible to the particular risks that may affect companies in the financial services sector than if it were invested in a wider variety of companies in unrelated sectors. Companies in the financial services sector are subject to certain risks, including the risk of regulatory change, decreased liquidity in credit markets and unstable interest rates. Such companies may have concentrated portfolios, such as a high level of loans to real estate developers, which makes them vulnerable to economic conditions that affect that industry. Performance of such companies may be affected by competitive pressures and exposure to investments or agreements that, under certain circumstances, may lead to losses (e.g., subprime loans). Companies in the financial services sector are subject to extensive governmental regulation that may limit the amount and types of loans and other financial commitments they can make, and interest rates and fees that they may charge. In addition, profitability of such companies is largely dependent upon the availability and the cost of capital.
Foreign securities and emerging market countries risk
Investing in foreign securities may include certain risks and considerations not typically associated with investing in U.S. securities, such as fluctuating currency values and changing local and regional economic, political and social conditions, which may result in greater market volatility. In addition, certain foreign securities may not be as liquid as U.S. securities. Investing in emerging markets may accentuate these risks. These countries are also more likely to experience high levels of inflation, deflation or currency devaluation which could hurt their economies and securities markets. To the extent that the Fund concentrates its investment exposure to any one or a few specific countries, the Fund will be particularly susceptible to the various conditions, events or other factors impacting those countries and may, therefore, have a greater risk than that of a fund which is more geographically diversified.
Columbia Greater China Fund | Annual Report 2017
| 29 |
Notes to Financial Statements (continued)
August 31, 2017
Geographic concentration risk
The Fund may be particularly susceptible to economic, political, regulatory or other events or conditions affecting issuers and countries within the specific geographic regions in which the Fund invests. Currency devaluations could occur in countries that have not yet experienced currency devaluation to date, or could continue to occur in countries that have already experienced such devaluations. The Fund’s NAV may be more volatile than the NAV of a more geographically diversified fund.
Non-diversification risk
A non-diversified fund is permitted to invest a greater percentage of its total assets in fewer issuers than a diversified fund. The Fund may, therefore, have a greater risk of loss from a few issuers than a similar fund that invests more broadly.
Shareholder concentration risk
At August 31, 2017, two unaffiliated shareholders of record owned 29.1% of the outstanding shares of the Fund in one or more accounts. The Fund has no knowledge about whether any portion of those shares was owned beneficially. Subscription and redemption activity by concentrated accounts may have a significant effect on the operations of the Fund. In the case of a large redemption, the Fund may be forced to sell investments at inopportune times, including its liquid positions, which may result in Fund losses and the Fund holding a higher percentage of less liquid positions. Large redemptions could result in decreased economies of scale and increased operating expenses for non-redeeming Fund shareholders.
Technology and technology-related investment risk
The Fund may be more susceptible to the particular risks that may affect companies in the information technology sector, as well as other technology-related sectors (collectively, the technology sectors) than if it were invested in a wider variety of companies in unrelated sectors. Companies in the technology sectors are subject to certain risks, including the risk that new services, equipment or technologies will not be accepted by consumers and businesses or will become rapidly obsolete. Performance of such companies may be affected by factors including obtaining and protecting patents (or the failure to do so) and significant competitive pressures, including aggressive pricing of their products or services, new market entrants, competition for market share and short product cycles due to an accelerated rate of technological developments. Such competitive pressures may lead to limited earnings and/or falling profit margins. As a result, the value of their securities may fall or fail to rise. In addition, many technology sector companies have limited operating histories and prices of these companies’ securities historically have been more volatile than other securities, especially over the short term.
Note 9. Subsequent events
Management has evaluated the events and transactions that have occurred through the date the financial statements were issued. Other than as noted in Note 1 above, there were no items requiring adjustment of the financial statements or additional disclosure.
Note 10. Information regarding pending and settled legal proceedings
Ameriprise Financial and certain of its affiliates have historically been involved in a number of legal, arbitration and regulatory proceedings, including routine litigation, class actions, and governmental actions, concerning matters arising in connection with the conduct of their business activities. Ameriprise Financial believes that the Fund is not currently the subject of, and that neither Ameriprise Financial nor any of its affiliates are the subject of, any pending legal, arbitration or regulatory proceedings that are likely to have a material adverse effect on the Fund or the ability of Ameriprise Financial or its affiliates to perform under their contracts with the Fund. Ameriprise Financial is required to make quarterly (10-Q), annual (10-K) and, as necessary, 8-K filings with the Securities and Exchange Commission (SEC) on legal and regulatory matters that relate to Ameriprise Financial and its affiliates. Copies of these filings may be obtained by accessing the SEC website at www.sec.gov.
There can be no assurance that these matters, or the adverse publicity associated with them, will not result in increased Fund redemptions, reduced sale of Fund shares or other adverse consequences to the Fund. Further, although we believe proceedings are not likely to have a material adverse effect on the Fund or the ability of Ameriprise Financial or its affiliates to perform under their contracts with the Fund, these proceedings are subject to uncertainties and, as such, we are unable to
| 30 | Columbia Greater China Fund | Annual Report 2017 |
Notes to Financial Statements (continued)
August 31, 2017
estimate the possible loss or range of loss that may result. An adverse outcome in one or more of these proceedings could result in adverse judgments, settlements, fines, penalties or other relief that could have a material adverse effect on the consolidated financial condition or results of operations of Ameriprise Financial.
Columbia Greater China Fund | Annual Report 2017
| 31 |
Report of Independent Registered Public Accounting Firm
To the Trustees of Columbia Funds Series Trust I and the Shareholders of Columbia Greater China Fund
In our opinion, the accompanying statement of assets and liabilities, including the portfolio of investments, and the related statements of operations and of changes in net assets and the financial highlights present fairly, in all material respects, the financial position of Columbia Greater China Fund (the “Fund”, a series of Columbia Funds Series Trust I) as of August 31, 2017, the results of its operations for the year then ended, the changes in its net assets for each of the two years in the period then ended and the financial highlights for each of the five years in the period then ended, in conformity with accounting principles generally accepted in the United States of America. These financial statements and financial highlights (hereafter referred to as “financial statements”) are the responsibility of the Fund’s management. Our responsibility is to express an opinion on these financial statements based on our audits. We conducted our audits of these financial statements in accordance with the standards of the Public Company Accounting Oversight Board (United States). Those standards require that we plan and perform the audit to obtain reasonable assurance about whether the financial statements are free of material misstatement. An audit includes examining, on a test basis, evidence supporting the amounts and disclosures in the financial statements, assessing the accounting principles used and significant estimates made by management, and evaluating the overall financial statement presentation. We believe that our audits, which included confirmation of securities as of August 31, 2017 by correspondence with the custodian and transfer agent provide a reasonable basis for our opinion.
/s/ PricewaterhouseCoopers LLP
Minneapolis, MN
October 20, 2017
| 32 | Columbia Greater China Fund | Annual Report 2017 |
Federal Income Tax Information
(Unaudited)
The Fund hereby designates the following tax attributes for the fiscal year ended August 31, 2017. Shareholders will be notified in early 2018 of the amounts for use in preparing 2017 income tax returns.
Foreign
taxes paid | Foreign
taxes paid
per share | Foreign
source
income | Foreign
source
income per
share |
| $132,882 | $0.05 | $2,000,911 | $0.75 |
Foreign taxes. The Fund makes the election to pass through to shareholders the foreign taxes paid. Eligible shareholders may claim a foreign tax credit. These taxes, and the corresponding foreign source income, are provided.
Columbia Greater China Fund | Annual Report 2017
| 33 |
Shareholders elect the Board that oversees the Fund’s operations. The Board appoints officers who are responsible for day-to-day business decisions based on policies set by the Board. The following table provides basic biographical information about the Fund’s Trustees, including their principal occupations during the past five years, although specific titles for individuals may have varied over the period. The year set forth beneath Length of Service in the table below is the year in which the Trustee was first appointed or elected as Trustee to any Fund currently in the Columbia Funds Complex or a predecessor thereof. Under current Board policy, members serve terms of indefinite duration.
Independent trustees
| Name, address, year of birth | Position held with the Trust and length of service | Principal occupation(s) during the past five years and other relevant professional experience | Number of Funds in the Columbia Fund Complex overseen | Other directorships held by Trustee during the past five years |
Janet Langford Carrig
c/o Columbia Management
Investment Advisers, LLC
225 Franklin Street
Mail Drop BX32 05228
Boston, MA 02110
1957 | Trustee
1996 | Senior Vice President, General Counsel and Corporate Secretary, ConocoPhillips (independent energy company) since September 2007 | 57 | None |
Douglas A. Hacker
c/o Columbia Management
Investment Advisers, LLC
225 Franklin Street
Mail Drop BX32 05228
Boston, MA 02110
1955 | Trustee and Chairman of the Board
1996 | Independent business executive since May 2006; Executive Vice President — Strategy of United Airlines from December 2002 to May 2006; President of UAL Loyalty Services (airline marketing company) from September 2001 to December 2002; Executive Vice President and Chief Financial Officer of United Airlines from July 1999 to September 2001 | 57 | Spartan Nash Company, (food distributor); Nash Finch Company (food distributor) from 2005 to 2013; Aircastle Limited (aircraft leasing); SeaCube Container Leasing Ltd. (container leasing) from 2010 to 2013; and Travelport Worldwide Limited (travel information technology) |
Nancy T. Lukitsh
c/o Columbia Management
Investment Advisers, LLC
225 Franklin Street
Mail Drop BX32 05228
Boston, MA 02110
1956 | Trustee
2011 | Senior Vice President, Partner and Director of Marketing, Wellington Management Company, LLP (investment adviser) from 1997 to 2010; Chair, Wellington Management Portfolios (commingled non-U.S. investment pools) from 2007 to 2010; Director, Wellington Trust Company, NA and other Wellington affiliates from 1997 to 2010 | 57 | None |
David M. Moffett
c/o Columbia Management
Investment Advisers, LLC
225 Franklin Street
Mail Drop BX32 05228
Boston, MA 02110
1952 | Trustee
2011 | Retired. Consultant to Bridgewater and Associates | 57 | Director, CSX Corporation; Genworth Financial, Inc. (financial and insurance products and services); PayPal Holdings Inc. (payment and data processing services); Trustee, University of Oklahoma Foundation; former Director, eBay Inc. (online trading community), 2007-2015; and former Director, CIT Bank, CIT Group Inc. (commercial and consumer finance), 2010-2016 |
| 34 | Columbia Greater China Fund | Annual Report 2017 |
TRUSTEES AND OFFICERS (continued)
Independent trustees (continued)
| Name, address, year of birth | Position held with the Trust and length of service | Principal occupation(s) during the past five years and other relevant professional experience | Number of Funds in the Columbia Fund Complex overseen | Other directorships held by Trustee during the past five years |
Charles R. Nelson
c/o Columbia Management
Investment Advisers, LLC
225 Franklin Street
Mail Drop BX32 05228
Boston, MA 02110
1942 | Trustee
1981 | Retired. Professor Emeritus, University of Washington since 2011; Professor of Economics, University of Washington from 1976 to 2011; Ford and Louisa Van Voorhis Professor of Political Economy, University of Washington from 1993 to 2011; Adjunct Professor of Statistics, University of Washington from 1980 to 2011; Associate Editor, Journal of Money, Credit and Banking from September 1993 to 2008; consultant on econometric and statistical matters | 57 | None |
John J. Neuhauser
c/o Columbia Management
Investment Advisers, LLC
225 Franklin Street
Mail Drop BX32 05228
Boston, MA 02110
1943 | Trustee
1984 | President, Saint Michael’s College since August 2007; Director or Trustee of several non-profit organizations, including University of Vermont Medical Center; Academic Vice President and Dean of Faculties, Boston College from August 1999 to October 2005; University Professor, Boston College from November 2005 to August 2007 | 57 | Liberty All-Star Equity Fund and Liberty All- Star Growth Fund (closed-end funds) |
Patrick J. Simpson
c/o Columbia Management
Investment Advisers, LLC
225 Franklin Street
Mail Drop BX32 05228
Boston, MA 02110
1944 | Trustee
2000 | Of Counsel, Perkins Coie LLP (law firm) since 2015; Partner, Perkins Coie LLP from 1988 to 2014 | 57 | None |
Anne-Lee Verville
c/o Columbia Management
Investment Advisers, LLC
225 Franklin Street
Mail Drop BX32 05228
Boston, MA 02110
1945 | Trustee
1998 | Retired. General Manager, Global Education Industry from 1994 to 1997, President – Application Systems Division from 1991 to 1994, Chief Financial Officer – US Marketing & Services from 1988 to 1991, and Chief Information Officer from 1987 to 1988, IBM Corporation (computer and technology) | 57 | Enesco Group, Inc. (producer of giftware and home and garden decor products) from 2001 to 2006 |
Columbia Greater China Fund | Annual Report 2017
| 35 |
TRUSTEES AND OFFICERS (continued)
Consultants to the Independent Trustees*
| Name, address, year of birth | Position held with the Trust and length of service | Principal occupation(s) during the past five years and other relevant professional experience | Number of Funds in the Columbia Funds complex overseen | Other directorships held by Trustee during the past five years |
J. Kevin Connaughton
c/o Columbia
Management Investment
Advisers, LLC,
225 Franklin Street
Mail Drop BX32 05228,
Boston, MA 02110
1964 | Independent Trustee Consultant
2016 | Independent Trustee Consultant, Columbia Funds since March 2016; Managing Director and General Manager of Mutual Fund Products, Columbia Management Investment Advisers, LLC from May 2010 to February 2015; President, Columbia Funds from 2009 to 2015; and senior officer of Columbia Funds and affiliated funds from 2003 to 2015 | 57 | Board of Governors, Gateway Healthcare since January 2016; Trustee, New Century Portfolios since March 2015; and Director, The Autism Project since March 2015 |
Natalie A. Trunow
c/o Columbia
Management Investment
Advisers, LLC,
225 Franklin Street
Mail Drop BX32 05228,
Boston, MA 02110
1967 | Independent Trustee Consultant
2016 | Independent Trustee Consultant, Columbia Funds since September 2016; Chief Executive Officer, Millennial Partners (investment consulting services to institutions) since January 2016; Director of Investments, Casey Family Programs from April 2016 to September 2016; Senior Vice President and Chief Investment Officer, Calvert Investments from August 2008 to January 2016; Section Head and Portfolio Manager, General Motors Asset Management from June 1997 to August 2008 | 57 | Healthcare Services for Children with Special Needs |
| * | J. Kevin Connaughton was appointed consultant to the Independent Trustees effective March 1, 2016. Natalie A. Trunow was appointed consultant to the Independent Trustees effective September 1, 2016. Shareholders of the Funds are expected to be asked to elect each of Mr. Connaughton and Ms. Trunow as a Trustee at a future shareholder meeting. |
Interested trustee affiliated with Investment Manager*
| Name, address, year of birth | Position held with the Trust and length of service | Principal occupation(s) during the past five years and other relevant professional experience | Number of Funds in the Columbia Funds Complex overseen | Other directorships held by Trustee during the past five years |
William F. Truscott
c/o Columbia Management
Investment Advisers, LLC
225 Franklin Street
Boston, MA 02110
1960 | Trustee
2012 | Chairman of the Board and President, Columbia Management Investment Advisers, LLC since May 2010 and February 2012, respectively; Chief Executive Officer, Global Asset Management, Ameriprise Financial, Inc. since September 2012 (previously Chief Executive Officer, U.S. Asset Management & President, Annuities, May 2010-September 2012); Director and Chief Executive Officer, Columbia Management Investment Distributors, Inc. since May 2010 and February 2012, respectively; Chairman of the Board and Chief Executive Officer, RiverSource Distributors, Inc. since 2006; Director, Threadneedle Asset Management Holdings, SARL since 2014; President and Chief Executive Officer, Ameriprise Certificate Company, 2006-August 2012 | 179 | Chairman of the Board, Columbia Management Investment Advisers, LLC since May 2010; Director, Columbia Management Investment Distributors, Inc. since May 2010; former Director, Ameriprise Certificate Company, 2006 - January 2013 |
| * | Interested person (as defined under the 1940 Act) by reason of being an officer, director, security holder and/or employee of the Investment Manager or Ameriprise Financial. |
The Statement of Additional Information has additional information about the Fund’s Board members and is available,
without charge, upon request by calling 800.345.6611, contacting your financial intermediary or visiting
investor.columbiathreadneedleus.com.
| 36 | Columbia Greater China Fund | Annual Report 2017 |
TRUSTEES AND OFFICERS (continued)
The Board has appointed officers who are responsible for day-to-day business decisions based on policies it has established. The officers serve at the pleasure of the Board. The following table provides basic information about the Officers of the Fund, including principal occupations during the past five years, although their specific titles may have varied over the period. In addition to Mr. Truscott, who is Senior Vice President, the Fund’s other officers are:
Fund officers
Name,
address and
year of birth | Position and year
first appointed to
position for any Fund
in the Columbia
Funds complex or a
predecessor thereof | Principal occupation(s) during past five years |
Christopher O. Petersen
5228 Ameriprise
Financial Center
Minneapolis, MN 55474
Born 1970 | President and Principal Executive Officer (2015) | Vice President and Lead Chief Counsel, Ameriprise Financial, Inc. since January 2015 (previously, Vice President and Chief Counsel, January 2010 - December 2014; officer of Columbia Funds and affiliated funds since 2007. |
Michael G. Clarke
225 Franklin Street
Boston, MA 02110
Born 1969 | Treasurer (2011), Chief Financial Officer (2009) and Chief Accounting Officer (2015) | Vice President — Mutual Fund Administration, Columbia Management Investment Advisers, LLC, since May 2010; senior officer of Columbia Funds and affiliated funds since 2002. |
Paul B. Goucher
100 Park Avenue
New York, NY 10017
Born 1968 | Senior Vice President (2011) and Assistant Secretary (2008) | Senior Vice President and Assistant General Counsel, Ameriprise Financial, Inc. since January 2017 (previously Vice President and Lead Chief Counsel, November 2008 - January 2017 and January 2013 - January 2017, respectively; and Chief Counsel, January 2010 - January 2013); Vice President, Chief Legal Officer and Assistant Secretary, Columbia Management Investment Advisers, LLC since May 2010. |
Thomas P. McGuire
225 Franklin Street
Boston, MA 02110
Born 1972 | Senior Vice President and Chief Compliance Officer (2012) | Vice President — Asset Management Compliance, Ameriprise Financial, Inc., since May 2010; Chief Compliance Officer, Ameriprise Certificate Company since September 2010. |
Colin Moore
225 Franklin Street
Boston, MA 02110
Born 1958 | Senior Vice President (2010) | Executive Vice President and Global Chief Investment Officer, Ameriprise Financial, Inc., since July 2013; Executive Vice President and Global Chief Investment Officer, Columbia Management Investment Advisers, LLC since July 2013 (previously Director and Global Chief Investment Officer, 2010 - 2013). |
Ryan C. Larrenaga
225 Franklin Street
Boston, MA 02110
Born 1970 | Senior Vice President (2017), Chief Legal Officer (2017) and Secretary (2015) | Vice President and Group Counsel, Ameriprise Financial, Inc. since August 2011; officer of Columbia Funds and affiliated funds since 2005. |
Michael E. DeFao
225 Franklin Street
Boston, MA 02110
Born 1968 | Vice President (2011) and Assistant Secretary (2010) | Vice President and Chief Counsel, Ameriprise Financial, Inc. since May 2010. |
Amy Johnson
5228 Ameriprise
Financial Center
Minneapolis, MN 55474
Born 1965 | Vice President (2006) | Managing Director and Global Head of Operations, Columbia Management Investment Advisers, LLC since April 2016 (previously Managing Director and Chief Operating Officer, 2010 - 2016). |
Lyn Kephart-Strong
5228 Ameriprise
Financial Center
Minneapolis, MN 55474
Born 1960 | Vice President (2015) | President, Columbia Management Investment Services Corp. since October 2014; Vice President & Resolution Officer, Ameriprise Trust Company since August 2009. |
Columbia Greater China Fund | Annual Report 2017
| 37 |
Board Consideration and Approval of Management
Agreement
On June 14, 2017, the Board of Trustees (the Board) and the Trustees who are not interested persons (as defined in the Investment Company Act of 1940) (the Independent Trustees) of Columbia Funds Series Trust I (the Trust) unanimously approved the continuation of the Management Agreement (the Management Agreement) with Columbia Management Investment Advisers, LLC (the Investment Manager) with respect to Columbia Greater China Fund (the Fund), a series of the Trust. As detailed below, the Board’s Advisory Fees and Expenses Committee (the Committee) and the Board met on multiple occasions to review and discuss, both among themselves and with the management team of the Investment Manager, materials provided by the Investment Manager and others before determining to approve the continuation of the Management Agreement.
In connection with their deliberations regarding the continuation of the Management Agreement, the Committee and the Board evaluated materials requested from the Investment Manager regarding the Fund and the Management Agreement, and discussed these materials with representatives of the Investment Manager at Committee meetings held on March 27, 2017, April 26, 2017 and June 13, 2017 and at Board meetings held on March 28, 2017 and June 14, 2017. In addition, the Board considers matters bearing on the Management Agreement at most of its other meetings throughout the year and meets regularly with senior management of the Trust and the Investment Manager. Through the Board’s Investment Oversight Committees, Trustees also meet with selected portfolio managers of the funds the Trustees oversee and other investment personnel at various times throughout the year. The Committee and the Board also consulted with its independent fee consultant, Fund counsel and the Independent Trustees’ independent legal counsel, who advised on various matters with respect to the Committee’s and the Board’s considerations and otherwise assisted the Committee and the Board in their deliberations. On June 13, 2017, the Committee recommended that the Board approve the continuation of the Management Agreement. On June 14, 2017, the Board, including the Independent Trustees, voting separately, unanimously approved the continuation of the Management Agreement for the Fund.
The Committee and the Board considered all information that they, their legal counsel or the Investment Manager believed reasonably necessary to evaluate and to determine whether to recommend for approval or approve the continuation of the Management Agreement. The information and factors considered by the Committee and the Board in recommending for approval or approving the continuation of the Management Agreement for the Fund included the following:
| • | Information on the investment performance of the Fund relative to the performance of a group of mutual funds determined to be comparable to the Fund by an independent third-party data provider, as well as performance relative to benchmarks; |
| • | Information on the Fund’s management fees and total expenses, including information comparing the Fund’s expenses to those of a group of comparable mutual funds, as determined by the independent third-party data provider; |
| • | The Investment Manager’s agreement to contractually limit or cap total operating expenses for the Fund through December 31, 2018 so that total operating expenses (excluding certain fees and expenses, such as transaction costs and certain other investment related expenses, interest, taxes, acquired fund fees and expenses, and infrequent and/or unusual expenses) would not exceed a specified annual rate, as a percentage of the Fund’s net assets; |
| • | The terms and conditions of the Management Agreement; |
| • | The current and proposed terms and conditions of other agreements and arrangements with affiliates of the Investment Manager relating to the operations of the Fund, including agreements with respect to the provision of distribution, transfer agency and shareholder services to the Fund; |
| • | Descriptions of various functions performed by the Investment Manager under the Management Agreement, including portfolio management and portfolio trading practices; |
| • | Information regarding the management fees of similarly-managed portfolios of other clients of the Investment Manager, including institutional separate accounts; |
| • | Information regarding the reputation, regulatory history and resources of the Investment Manager, including information regarding senior management, portfolio managers and other personnel; |
| 38 | Columbia Greater China Fund | Annual Report 2017 |
Board Consideration and Approval of Management
Agreement (continued)
| • | Information regarding the capabilities of the Investment Manager with respect to compliance monitoring services, including an assessment of the Investment Manager’s compliance system by the Fund’s Chief Compliance Officer; and |
| • | The profitability to the Investment Manager and its affiliates from their relationships with the Fund. |
Nature, extent and quality of services provided under the Management Agreement
The Committee and the Board considered the nature, extent and quality of services provided to the Fund by the Investment Manager and its affiliates under the Management Agreement and under separate agreements for the provision of transfer agency and shareholder services, and the resources dedicated to the Fund and the other Columbia Funds by the Investment Manager and its affiliates. The Committee and the Board considered, among other things, the Investment Manager’s ability to attract, motivate and retain highly qualified research, advisory and supervisory investment professionals (including compensation programs for personnel involved in fund management, reputation and other attributes), the portfolio management services provided by those investment professionals, and the quality of the Investment Manager’s investment research capabilities and trade execution services. The Committee and the Board also considered the potential benefits to shareholders of investing in a mutual fund that is part of a fund complex offering exposure to a variety of asset classes and investment disciplines and providing a variety of fund and shareholder services.
The Committee and the Board also considered the professional experience and qualifications of the senior personnel of the Investment Manager, which included consideration of the Investment Manager’s experience with similarly-structured funds. The Committee and the Board noted the compliance programs of and the compliance-related resources provided to the Fund by the Investment Manager and its affiliates, and considered the Investment Manager’s ability to provide administrative services to the Fund and coordinate the activities of the Fund’s other service providers. After reviewing these and related factors, the Committee and the Board concluded, within the context of their overall conclusions, that the nature, extent and quality of the services provided to the Fund under the Management Agreement supported the continuation of the Management Agreement.
Investment performance
The Committee and the Board reviewed information about the performance of the Fund over various time periods, including performance information relative to benchmarks and information that compared the performance of the Fund to the performance of a group of comparable mutual funds as determined by the independent third-party data provider, and data provided by the independent fee consultant. The Committee and the Board also reviewed a description of the third party’s methodology for identifying the Fund’s peer groups for purposes of performance and expense comparisons. Although the Fund’s performance lagged that of a relevant peer group for certain (although not necessarily all) periods, the Committee and the Board concluded that other factors relevant to performance were sufficient, in light of other considerations, to warrant continuation of the Management Agreement. Those factors included one or more of the following: (i) that the Fund’s performance, although lagging in certain recent periods, was stronger over the longer term; (ii) that the underperformance was attributable, to a significant extent, to investment decisions that were reasonable and consistent with the Fund’s investment strategy and policies and that the Fund was performing within a reasonable range of expectations, given those investment decisions, market conditions and the Fund’s investment strategy; (iii) that the Fund’s performance was competitive when compared to other relevant performance benchmarks or peer groups; and (iv) that the Investment Manager had taken or was taking steps designed to help improve the Fund’s investment performance, including, but not limited to, replacing portfolio managers, enhancing the resources supporting the portfolio managers, or modifying investment strategies.
The Committee and the Board noted that, through December 31, 2016, the Fund’s performance was in the ninety-fourth, fortieth and fifty-fourth percentile (where the best performance would be in the first percentile) of its category selected by the independent third-party data provider for the purposes of performance comparisons for the one-, three- and five-year periods, respectively.
The Committee and the Board also considered the Investment Manager’s performance and reputation generally, the Investment Manager’s historical responsiveness to Board concerns about performance, and the Investment Manager’s willingness to take steps intended to improve performance. After reviewing these and related factors, the Committee and the Board concluded, within the context of their overall conclusions, that the performance of the Fund and the Investment Manager was sufficient, in light of other considerations, to warrant the continuation of the Management Agreement.
Columbia Greater China Fund | Annual Report 2017
| 39 |
Board Consideration and Approval of Management
Agreement (continued)
Investment management fee rates and other expenses
The Committee and the Board considered the management fees charged to the Fund under the Management Agreement as well as the total expenses incurred by the Fund. In assessing the reasonableness of the fees under the Management Agreement, the Committee and the Board considered, among other information, the Fund’s total expense ratio as a percentage of average daily net assets. The Committee and the Board considered data provided by the independent third-party data provider and the independent fee consultant. The Committee and the Board noted that, as of December 31, 2016, the Fund’s actual management fee and net total expense ratio are ranked in the third and first quintiles, respectively, (where the lowest fees and expenses would be in the first quintile) against the Fund’s expense universe as determined by the independent third-party data provider for purposes of expense comparison. The Committee and the Board also took into account the fee waiver and expense limitation arrangements agreed to by the Investment Manager, as noted above.
The Committee and the Board also received and considered information about the management fees charged by the Investment Manager to institutional separate accounts. In considering the fees charged to those accounts, the Committee and the Board took into account, among other things, the Investment Manager’s representations about the differences between managing mutual funds as compared to other types of accounts, including differences in the services provided, differences in the risk profile of such business for the Investment Manager and the additional resources required to manage mutual funds effectively. The Committee and the Board also received and considered information about the fees charged by the Investment Manager for sub-advisory services it provides to comparable unaffiliated funds. In evaluating the Fund’s management fees, the Committee and the Board also took into account the demands, complexity and quality of the investment management of the Fund.
After reviewing these and related factors, the Committee and the Board concluded, within the context of their overall conclusions, that the management fee rates and expenses of the Fund, in light of other considerations, warranted the continuation of the Management Agreement.
Costs of services provided and profitability
The Committee and the Board also took note of the costs the Investment Manager and its affiliates incur in connection with the services provided and the profitability to the Investment Manager and its affiliates from their relationships with the Fund.
The Committee and the Board also considered the compensation directly or indirectly received by the Investment Manager’s affiliates in connection with their relationships with the Fund. The Committee and the Board reviewed information provided by management as to the profitability to the Investment Manager and its affiliates of their relationships with the Fund, information about the allocation of expenses used to calculate profitability, and comparisons of profitability levels realized in 2016 to profitability levels realized in 2015. When reviewing profitability, the Committee and the Board also considered court cases in which adviser profitability was an issue in whole or in part, the performance of similarly managed funds, the performance of the Fund, and the expense ratio of the Fund. In addition, the Committee and the Board considered information provided by the Investment Manager regarding the Investment Manager’s financial condition and comparing its profitability to that of other asset management firms that are, or are subsidiaries of, publicly traded companies. In this regard, the Committee and the Board also considered data provided by the independent fee consultant.
After reviewing these and related factors, the Committee and the Board concluded, within the context of their overall conclusions, that the costs of services provided and the profitability to the Investment Manager and its affiliates from their relationships with the Fund supported the continuation of the Management Agreement.
Economies of scale
The Committee and the Board considered the potential existence of economies of scale in the provision by the Investment Manager of services to the Fund, to groups of related funds, and to the Investment Manager’s investment advisory clients as a whole, and whether those economies of scale were shared with the Fund through breakpoints in investment management fees or other means, such as expense limitation arrangements and additional investments by the Investment Manager in investment, trading, compliance and other resources. The Committee and the Board noted that the management fee schedules for the Fund contained breakpoints that would reduce the fee rate on assets above specified threshold levels.
| 40 | Columbia Greater China Fund | Annual Report 2017 |
Board Consideration and Approval of Management
Agreement (continued)
In considering these matters, the Committee and the Board also considered the costs of the services provided and the profitability to the Investment Manager and its affiliates from their relationships with the Fund, as discussed above. After reviewing these and related factors, the Committee and the Board concluded, within the context of their overall conclusions, that the extent to which any economies of scale were expected to be shared with the Fund supported the continuation of the Management Agreement.
Other benefits to the Investment Manager
The Committee and the Board received and considered information regarding “fall-out” or ancillary benefits received by the Investment Manager and its affiliates as a result of their relationships with the Fund, such as the engagement of the Investment Manager’s affiliates to provide distribution, transfer agency and shareholder services to the Fund. In this regard, among other matters, the Committee and the Board considered that the Fund’s distributor retains a portion of the distribution fees from the Fund and receives a portion of the sales charges on sales or redemptions of certain classes of shares of the Fund. The Committee and the Board also considered the benefits of research made available to the Investment Manager by reason of brokerage commissions generated by the Fund’s securities transactions, and reviewed information about the Investment Manager’s practices with respect to allocating portfolio transactions for brokerage and research services. The Committee and the Board recognized that the Investment Manager’s profitability would be somewhat lower without these benefits.
Conclusion
The Committee and the Board reviewed all of the above considerations in reaching their decisions to recommend or approve the continuation of the Management Agreement. In their deliberations, the Trustees did not identify any particular information that was all-important or controlling, and individual Trustees may have attributed different weights to the various factors. Based on their evaluation of all factors that they deemed to be material, including those factors described above, and assisted by the advice of independent legal counsel, the Board, including the Independent Trustees, voting separately, unanimously approved the continuation of the Management Agreement.
Columbia Greater China Fund | Annual Report 2017
| 41 |
The Fund mails one shareholder report to each shareholder address. If you would like more than one report, please call shareholder services at 800.345.6611 and additional reports will be sent to you.
Proxy voting policies and procedures
The policy of the Board of Trustees is to vote the proxies of the companies in which the Fund holds investments consistent with the procedures as stated in the Statement of Additional Information (SAI). You may obtain a copy of the SAI without charge by calling 800.345.6611; contacting your financial intermediary; visiting investor.columbiathreadneedleus.com; or searching the website of the Securities and Exchange Commission (SEC) at sec.gov. Information regarding how the Fund voted proxies relating to portfolio securities is filed with the SEC by August 31st for the most recent 12-month period ending June 30th of that year, and is available without charge by visiting investor.columbiathreadneedleus.com, or searching the website of the SEC at sec.gov.
Quarterly schedule of investments
The Fund files a complete schedule of portfolio holdings with the SEC for the first and third quarters of each fiscal year on Form N-Q. The Fund’s Form N-Q is available on the SEC’s website at sec.gov and may be reviewed and copied at the SEC’s Public Reference Room in Washington, D.C. Information on the operation of the Public Reference Room may be obtained by calling 800.SEC.0330. The Fund’s complete schedule of portfolio holdings, as filed on Form N-Q, can also be obtained without charge, upon request, by calling 800.345.6611.
Additional Fund information
For more information about the Fund, please visit investor.columbiathreadneedleus.com or call 800.345.6611. Customer Service Representatives are available to answer your questions Monday through Friday from 8 a.m. to 7 p.m. Eastern time.
Fund investment manager
Columbia Management Investment Advisers, LLC
225 Franklin Street
Boston, MA 02110
Fund distributor
Columbia Management Investment Distributors, Inc.
225 Franklin Street
Boston, MA 02110
Fund transfer agent
Columbia Management Investment Services Corp.
P.O. Box 8081
Boston, MA 02266-8081
| 42 | Columbia Greater China Fund | Annual Report 2017 |
[THIS PAGE INTENTIONALLY LEFT BLANK]
[THIS PAGE INTENTIONALLY LEFT BLANK]
[THIS PAGE INTENTIONALLY LEFT BLANK]
Columbia Greater China Fund
P.O. Box 8081
Boston, MA 02266-8081
Please read and consider the investment objectives, risks, charges and expenses for any fund carefully before investing. For a prospectus and summary prospectus, which contains this and other important information about the Fund, go to
investor.columbiathreadneedleus.com. The Fund is distributed by Columbia Management Investment Distributors, Inc., member FINRA, and managed by Columbia Management Investment Advisers, LLC.
Columbia Threadneedle Investments (Columbia Threadneedle) is the global brand name of the Columbia and Threadneedle group of companies. All rights reserved. Columbia Management Investment Distributors, Inc., 225 Franklin Street, Boston, MA 02110-2804
© 2017 Columbia Management Investment Advisers, LLC.
investor.columbiathreadneedleus.com

Annual Report
August 31, 2017
Columbia Mid Cap Growth Fund
Not FDIC Insured • No bank guarantee • May lose value
Dear Shareholders,
The current outlook for financial markets is clouded by two primary concerns: the high valuation of equities and the direction of interest rates. Following the U.S. presidential election, U.S. equities rallied based on the assumption that the new administration’s policies would stimulate growth quickly. Unfortunately it’s unclear whether those measures will get passed, much less passed quickly. In fixed income, uncertainty stems from the possibility that interest rates won’t rise as rapidly as expected if the administration’s proposed growth policies are not implemented.
Given this uncertainty, investors value a consistent approach more than ever. Investors want strong, repeatable risk-adjusted returns. Consistency — not surprises. As a leading global asset manager, we believe our consistent, collaborative investment approach enables us to deliver the dependable experience your portfolio demands. So, how do we strive to deliver a consistent investment experience?
Better insights
Your portfolio benefits from the investment insights uncovered by our talented investment teams around the world.
Better decisions
Our collaborative, interactive environment enables our investment teams to construct portfolios that take advantage of the best investment ideas.
Better outcomes
We aim to deliver a consistent experience, which means fewer surprises, dependable insights, and products designed to do the thing you want.
Whether you’re trying to save money to help your children go to college or for your own retirement, it’s the consistency of the return that is most essential. People who chase higher returns are usually also the first to sell when that investment goes through a bad patch. We try to combat this behavioral tendency by offering strategies that aim for a more consistent return. Our goal is for investors to panic less during periods of volatility, which can have a significant effect on their long-term results.
Nothing is more important to us than making sure those who have entrusted us to protect and grow their assets can do what matters most to them: build a nest egg, leave a legacy, and live confidently — now and throughout retirement. It’s why our talented professionals around the world work together to uncover uncommon opportunities and why our process encourages challenge and debate around our most compelling ideas to ensure better informed investment decisions, which hopefully lead to better outcomes for you.
Your success is our priority. Talk to your financial advisor about how working with Columbia Threadneedle Investments may help you position your portfolio for consistent, sustainable outcomes, no matter the market conditions.
Sincerely,
Christopher O. Petersen
President, Columbia Funds
Investors should consider the investment objectives, risks, charges and expenses of a mutual fund carefully before investing. For a free prospectus and summary prospectus, which contains this and other important information about a fund, visit investor.columbiathreadneedleus.com. The prospectus should be read carefully before investing.
Columbia Funds are distributed by Columbia Management Investment Distributors, Inc., member FINRA, and managed by Columbia Management Investment Advisers, LLC.
© 2017 Columbia Management Investment Advisers, LLC. All rights reserved.
Columbia Mid Cap Growth Fund | Annual Report 2017
Columbia Mid Cap Growth Fund | Annual Report 2017
Investment objective
Columbia Mid Cap Growth Fund (the Fund) seeks significant capital appreciation by investing, under normal market conditions, at least 80% of its net assets (plus any borrowings for investment purposes) in stocks of companies with a market capitalization, at the time of initial purchase, equal to or less than the largest stock in the Russell Midcap Index.
Portfolio management
George Myers, CFA
Lead manager
Managed Fund since 2006
Brian Neigut
Co-manager
Managed Fund since 2007
William Chamberlain, CFA
Co-manager
Managed Fund since 2013
Morningstar style boxTM
The Morningstar Style Box is based on a fund’s portfolio holdings. For equity funds, the vertical axis shows the market capitalization of the stocks owned, and the horizontal axis shows investment style (value, blend, or growth). Information shown is based on the most recent data provided by Morningstar.
© 2017 Morningstar, Inc. All rights reserved. The Morningstar information contained herein: (1) is proprietary to Morningstar and/or its content providers; (2) may not be copied or distributed; and (3) is not warranted to be accurate, complete or timely. Neither Morningstar nor its content providers are responsible for any damages or losses arising from any use of this information.
| Average annual total returns (%) (for the period ended August 31, 2017) |
| | | Inception | 1 Year | 5 Years | 10 Years |
| Class A | Excluding sales charges | 11/01/02 | 13.97 | 11.32 | 7.25 |
| | Including sales charges | | 7.42 | 10.01 | 6.62 |
| Class C | Excluding sales charges | 10/13/03 | 13.12 | 10.48 | 6.45 |
| | Including sales charges | | 12.12 | 10.48 | 6.45 |
| Class K* | 02/28/13 | 14.12 | 11.46 | 7.40 |
| Class R | 01/23/06 | 13.71 | 11.04 | 6.99 |
| Class R4* | 11/08/12 | 14.24 | 11.57 | 7.51 |
| Class R5* | 03/07/11 | 14.40 | 11.72 | 7.61 |
| Class T* | Excluding sales charges | 09/27/10 | 14.01 | 11.32 | 7.26 |
| | Including sales charges | | 11.18 | 10.75 | 6.99 |
| Class V | Excluding sales charges | 11/01/02 | 13.97 | 11.29 | 7.21 |
| | Including sales charges | | 7.40 | 9.98 | 6.58 |
| Class Y* | 07/15/09 | 14.45 | 11.80 | 7.65 |
| Class Z | 11/20/85 | 14.29 | 11.60 | 7.52 |
| Russell Midcap Growth Index | | 14.52 | 13.99 | 8.32 |
| Russell Midcap Index | | 12.44 | 14.11 | 8.14 |
Returns for Class A and Class V shares are shown with and without the maximum initial sales charge of 5.75%. Returns for Class C shares are shown with and without the 1.00% contingent deferred sales charge for the first year only. Returns for Class T shares are shown with and without the maximum initial sales charge of 2.50% per transaction. Prior to March 27, 2017, Class T shares were known as Class W shares and were not subject to sales charges. The Fund’s other share classes are not subject to sales charges and have limited eligibility. Please see the Fund’s prospectus for details. Performance for different share classes will vary based on differences in sales charges and fees associated with each share class. All results shown assume reinvestment of distributions during the period. Returns do not reflect the deduction of taxes that a shareholder may pay on Fund distributions or on the redemption of Fund shares. Performance results reflect the effect of any fee waivers or reimbursements of Fund expenses by Columbia Management Investment Advisers, LLC and/or any of its affiliates. Absent these fee waivers or expense reimbursement arrangements, performance results would have been lower.
The performance information shown represents past performance and is not a guarantee of future results. The investment return and principal value of your investment will fluctuate so that your shares, when redeemed, may be worth more or less than their original cost. Current performance may be lower or higher than the performance information shown. You may obtain performance information current to the most recent month-end by contacting your financial intermediary, visiting investor.columbiathreadneedleus.com or calling 800.345.6611.
| * | The returns shown for periods prior to the share class inception date (including returns for the Life of the Fund, if shown, which are since Fund inception) include the returns of the Fund’s oldest share class. These returns are adjusted to reflect any higher class-related operating expenses of the newer share classes, as applicable. Please visit investor.columbiathreadneedleus.com/investment-products/mutual-funds/appended-performance for more information. |
The Russell Midcap Growth Index, an unmanaged index, measures the performance of those Russell Midcap Index companies with higher price-to-book ratios and forecasted growth values.
The Russell Midcap Index, an unmanaged index, measures the performance of the 800 smallest companies in the Russell 1000 Index, which represents approximately 25% of the total market capitalization or the Russell 1000 Index.
Indices are not available for investment, are not professionally managed and do not reflect sales charges, fees, brokerage commissions, taxes or other expenses of investing. Securities in the Fund may not match those in an index.
| 2 | Columbia Mid Cap Growth Fund | Annual Report 2017 |
Fund at a Glance (continued)
Performance of a hypothetical $10,000 investment (August 31, 2007 — August 31, 2017)
The chart above shows the change in value of a hypothetical $10,000 investment in Class A shares of Columbia Mid Cap Growth Fund during the stated time period, and does not reflect the deduction of taxes that a shareholder may pay on Fund distributions or on the redemption of Fund shares.
| Top 10 holdings (%) (at August 31, 2017) |
| Lam Research Corp. | 1.7 |
| Total System Services, Inc. | 1.6 |
| Henry Schein, Inc. | 1.6 |
| FleetCor Technologies, Inc. | 1.5 |
| Martin Marietta Materials, Inc. | 1.5 |
| Microchip Technology, Inc. | 1.4 |
| Concho Resources, Inc. | 1.4 |
| Electronic Arts, Inc. | 1.4 |
| Delphi Automotive PLC | 1.4 |
| Ross Stores, Inc. | 1.4 |
Percentages indicated are based upon total investments (excluding Money Market Funds).
For further detail about these holdings, please refer to the section entitled “Portfolio of Investments.”
Fund holdings are as of the date given, are subject to change at any time, and are not recommendations to buy or sell any security.
| Portfolio breakdown (%) (at August 31, 2017) |
| Common Stocks | 96.6 |
| Money Market Funds | 3.4 |
| Total | 100.0 |
Percentages indicated are based upon total investments. The Fund’s portfolio composition is subject to change.
| Equity sector breakdown (%) (at August 31, 2017) |
| Consumer Discretionary | 17.1 |
| Consumer Staples | 2.4 |
| Energy | 2.8 |
| Financials | 5.9 |
| Health Care | 16.0 |
| Industrials | 16.4 |
| Information Technology | 28.6 |
| Materials | 7.5 |
| Real Estate | 3.3 |
| Total | 100.0 |
Percentages indicated are based upon total equity investments. The Fund’s portfolio composition is subject to change.
Columbia Mid Cap Growth Fund | Annual Report 2017
| 3 |
Manager Discussion of Fund Performance
For the 12-month period that ended August 31, 2017, the Fund’s Class A shares returned 13.97% excluding sales charges. During the same time period, the Fund modestly underperformed its benchmark, the Russell Midcap Growth Index, which returned 14.52%, and outperformed the broader-based Russell Midcap Index, which returned 12.44%. Stock selection in energy, financials and health care detracted from relative results, while stock selection in consumer discretionary and industrials and an underweight in the consumer discretionary sector were top contributors to relative returns.
U.S. equity markets delivered solid gains
Global events, political uncertainty and mixed economic data were enough to keep investors off balance early in the 12-month period, as financial markets moved sharply in reaction to each significant change on the world stage. However, the end of a contentious U.S. presidential contest in November 2016 eliminated a key element of uncertainty, and the U.S. equity markets moved solidly higher through the end of the period. Global growth picked up early in 2017. Positive U.S. economic data, steady job growth, rising corporate earnings and accelerated manufacturing activity further bolstered investor confidence.
The Federal Reserve (the Fed) raised the target range of its benchmark short-term interest rate three times during the period, bringing it to between 1.00% and 1.25% in June 2017. The Fed signaled that it was prepared to raise rates more aggressively on the heels of strong job gains and progress towards its 2.0% inflation target, creating expectations that the June rate hike may not be the last during the calendar year.
Against this backdrop, the U.S. equity markets moved solidly higher during the period. The S&P 500 Index rose 16.23%, with dividends reinvested. Small cap stocks outperformed large- and mid-cap stocks.
Contributors and detractors
Stock selection in the consumer discretionary and industrials sectors contributed most to performance relative to the Russell Mid Cap Growth Index, as did an underweight in the consumer discretionary sector. The top individual contributor to portfolio results was Lam Research, a leading supplier of wafer fabrication equipment (WFE) and services to the global semiconductor industry. Lam Research’s equipment is critical in the production of the small, complex chips used in cell phones, computers, and entertainment gadgets. Lam’s share price rose throughout the period with consistent “beat and raises” each quarter. We like Lam Research and the WFE sector because we believe it has potential as a sustainable, long-term business, driven by continued growth in content and a broadening out of applications, such as for artificial intelligence. Skyworks Solutions was also a top performing stock in the portfolio for the period. The specialty semiconductor manufacturer reported revenue and earnings that were ahead of expectations. Skyworks Solutions’ management also reported progress in diversifying its customer base away from its dependence on Apple. We trimmed the Fund’s position size on the strength of the stock price move.
Spirit AeroSystems, a manufacturer and designer of commercial airplanes and systems, was another top contributor. The company continued to implement an aggressive cost-cutting plan and cut a new deal with Boeing that was well received by the marketplace.
Stock selection in energy, financials and health care detracted from relative results. However, the top individual detractor from Fund performance was Foot Locker, a footwear retailer in the consumer discretionary sector. The company faced industry headwinds plaguing the retail industry, in general, as well as falling short of the lower-than-expected earnings guidance it had pre-announced. Foot Locker had been able to maintain share in a declining athletic industry given its superior brand and product curation, but the athletic footwear environment is shifting more dramatically than we had anticipated. With a faster cadence of style changes, brands are limiting capacity of top selling products. Even though Foot Locker does not play at the low-end retail marketplace, the over-distribution in that channel has had a detrimental effect on pricing. We sold the stock before the end of the period. O’Reilly Automotive, an auto parts retailer and distributor, was another significant disappointment, as earnings fell short of expectations. Sales and traffic declined for the company and the broader auto industry, and fears heightened that Amazon was stealing market share. O’Reilly continued to gain share with “mom & pop” garages with a key focus on service and convenience. We expect the recent softness in the industry to reaccelerate as weather patterns normalize and the company benefits from deferred repair and maintenance in both “Do-It-Yourself” and “Do-It-For-Me” markets. Nonetheless, we trimmed the Fund’s position size for risk management purposes.
| 4 | Columbia Mid Cap Growth Fund | Annual Report 2017 |
Manager Discussion of Fund Performance (continued)
Fund strategy
Our fundamental research process tends to favor higher quality companies with favorable growth prospects and strong management teams. We seek to identify stocks with networking effects, high switching costs, strong brands, disruptive innovation and/or a digital “first-to-scale” advantage. Our general strategy is to keep the Fund’s sector weights in line with those of the benchmark. Typically, any sector overweights or underweights are more of a reflection of our bottom-up analysis rather than a top-down call on one sector versus another. As a result, Fund performance is largely driven by individual stock selection.
Market risk may affect a single issuer, sector of the economy, industry or the market as a whole. Growth securities, at times, may not perform as well as value securities or the stock market in general and may be out of favor with investors. Foreign investments subject the fund to risks, including political, economic, market, social and others within a particular country, as well as to currency instabilities and less stringent financial and accounting standards generally applicable to U.S. issuers. Investments in mid-cap companies involve risks and volatility greater than investments in larger, more established companies. The Fund may invest significantly in issuers within a particular sector, which may be negatively affected by market, economic or other conditions, making the Fund more vulnerable to unfavorable developments in the sector. See the Fund’s prospectus for more information on these and other risks.
The views expressed in this report reflect the current views of the respective parties. These views are not guarantees of future performance and involve certain risks, uncertainties and assumptions that are difficult to predict, so actual outcomes and results may differ significantly from the views expressed. These views are subject to change at any time based upon economic, market or other conditions and the respective parties disclaim any responsibility to update such views. These views may not be relied on as investment advice and, because investment decisions for a Columbia fund are based on numerous factors, may not be relied on as an indication of trading intent on behalf of any particular Columbia fund. References to specific securities should not be construed as a recommendation or investment advice.
Columbia Mid Cap Growth Fund | Annual Report 2017
| 5 |
Understanding Your Fund’s Expenses
(Unaudited)
As an investor, you incur two types of costs. There are transaction costs, which generally include sales charges on purchases and may include redemption fees. There are also ongoing costs, which generally include management fees, distribution and/or service fees, and other fund expenses. The following information is intended to help you understand your ongoing costs (in dollars) of investing in the Fund and to help you compare these costs with the ongoing costs of investing in other mutual funds.
Analyzing your Fund’s expenses
To illustrate these ongoing costs, we have provided examples and calculated the expenses paid by investors in each share class of the Fund during the period. The actual and hypothetical information in the table is based on an initial investment of $1,000 at the beginning of the period indicated and held for the entire period. Expense information is calculated two ways and each method provides you with different information. The amount listed in the “Actual” column is calculated using the Fund’s actual operating expenses and total return for the period. You may use the Actual information, together with the amount invested, to estimate the expenses that you paid over the period. Simply divide your account value by $1,000 (for example, an $8,600 account value divided by $1,000 = 8.6), then multiply the results by the expenses paid during the period under the “Actual” column. The amount listed in the “Hypothetical” column assumes a 5% annual rate of return before expenses (which is not the Fund’s actual return) and then applies the Fund’s actual expense ratio for the period to the hypothetical return. You should not use the hypothetical account values and expenses to estimate either your actual account balance at the end of the period or the expenses you paid during the period. See “Compare with other funds” below for details on how to use the hypothetical data.
Compare with other funds
Since all mutual funds are required to include the same hypothetical calculations about expenses in shareholder reports, you can use this information to compare the ongoing cost of investing in the Fund with other funds. To do so, compare the hypothetical example with the 5% hypothetical examples that appear in the shareholder reports of other funds. As you compare hypothetical examples of other funds, it is important to note that hypothetical examples are meant to highlight the ongoing costs of investing in a fund only and do not reflect any transaction costs, such as sales charges, or redemption or exchange fees. Therefore, the hypothetical calculations are useful in comparing ongoing costs only, and will not help you determine the relative total costs of owning different funds. If transaction costs were included in these calculations, your costs would be higher.
| March 1, 2017 — August 31, 2017 |
| | Account value at the
beginning of the
period ($) | Account value at the
end of the
period ($) | Expenses paid during
the period ($) | Fund’s annualized
expense ratio (%) |
| | Actual | Hypothetical | Actual | Hypothetical | Actual | Hypothetical | Actual |
| Class A | 1,000.00 | 1,000.00 | 1,057.80 | 1,019.21 | 6.17 | 6.06 | 1.19 |
| Class C | 1,000.00 | 1,000.00 | 1,053.80 | 1,015.43 | 10.04 | 9.86 | 1.94 |
| Class K | 1,000.00 | 1,000.00 | 1,058.50 | 1,019.71 | 5.66 | 5.55 | 1.09 |
| Class R | 1,000.00 | 1,000.00 | 1,056.60 | 1,017.95 | 7.46 | 7.32 | 1.44 |
| Class R4 | 1,000.00 | 1,000.00 | 1,059.00 | 1,020.47 | 4.88 | 4.79 | 0.94 |
| Class R5 | 1,000.00 | 1,000.00 | 1,059.80 | 1,020.92 | 4.41 | 4.33 | 0.85 |
| Class T (formerly Class W) | 1,000.00 | 1,000.00 | 1,058.20 | 1,019.21 | 6.17 | 6.06 | 1.19 |
| Class V (formerly Class T) | 1,000.00 | 1,000.00 | 1,058.00 | 1,019.21 | 6.17 | 6.06 | 1.19 |
| Class Y | 1,000.00 | 1,000.00 | 1,060.10 | 1,021.17 | 4.15 | 4.08 | 0.80 |
| Class Z | 1,000.00 | 1,000.00 | 1,059.40 | 1,020.47 | 4.88 | 4.79 | 0.94 |
Expenses paid during the period are equal to the annualized expense ratio for each class as indicated above, multiplied by the average account value over the period and then multiplied by the number of days in the Fund’s most recent fiscal half year and divided by 365.
Expenses do not include fees and expenses incurred indirectly by the Fund from its investment in underlying funds, including affiliated and non-affiliated pooled investment vehicles, such as mutual funds and exchange-traded funds.
| 6 | Columbia Mid Cap Growth Fund | Annual Report 2017 |
Portfolio of Investments
August 31, 2017
(Percentages represent value of investments compared to net assets)
| Common Stocks 97.1% |
| Issuer | Shares | Value ($) |
| Consumer Discretionary 16.7% |
| Auto Components 1.3% |
| Delphi Automotive PLC | 251,663 | 24,260,313 |
| Automobiles 0.8% |
| Thor Industries, Inc. | 137,070 | 14,891,285 |
| Diversified Consumer Services 0.6% |
| Service Corp. International | 325,620 | 11,507,411 |
| Hotels, Restaurants & Leisure 4.7% |
| Aramark | 337,430 | 13,730,027 |
| Domino’s Pizza, Inc. | 70,160 | 12,787,362 |
| Extended Stay America, Inc. | 506,250 | 9,917,437 |
| Hilton Worldwide Holdings, Inc. | 177,590 | 11,424,365 |
| Six Flags Entertainment Corp. | 219,754 | 11,991,976 |
| Vail Resorts, Inc. | 56,730 | 12,931,603 |
| Yum China Holdings, Inc.(a) | 336,590 | 11,901,822 |
| Total | | 84,684,592 |
| Household Durables 2.3% |
| D.R. Horton, Inc. | 566,860 | 20,491,989 |
| Mohawk Industries, Inc.(a) | 81,720 | 20,684,966 |
| Total | | 41,176,955 |
| Internet & Direct Marketing Retail 1.7% |
| Expedia, Inc. | 145,070 | 21,522,585 |
| Liberty Interactive Corp., Class A(a) | 448,880 | 9,929,226 |
| Total | | 31,451,811 |
| Media 0.9% |
| Interpublic Group of Companies, Inc. (The) | 825,400 | 16,623,556 |
| Multiline Retail 0.9% |
| Dollar General Corp. | 231,430 | 16,792,561 |
| Specialty Retail 3.0% |
| Burlington Stores, Inc.(a) | 64,070 | 5,582,419 |
| O’Reilly Automotive, Inc.(a) | 88,630 | 17,383,002 |
| Ross Stores, Inc. | 410,990 | 24,022,365 |
| Ulta Beauty, Inc.(a) | 29,590 | 6,539,686 |
| Total | | 53,527,472 |
| Textiles, Apparel & Luxury Goods 0.5% |
| PVH Corp. | 73,930 | 9,307,048 |
| Total Consumer Discretionary | 304,223,004 |
| Common Stocks (continued) |
| Issuer | Shares | Value ($) |
| Consumer Staples 2.3% |
| Food & Staples Retailing 0.7% |
| SYSCO Corp. | 257,530 | 13,564,105 |
| Food Products 1.6% |
| Blue Buffalo Pet Products, Inc.(a) | 550,048 | 14,169,237 |
| Lamb Weston Holdings, Inc. | 324,150 | 14,742,342 |
| Total | | 28,911,579 |
| Total Consumer Staples | 42,475,684 |
| Energy 2.7% |
| Energy Equipment & Services 0.7% |
| Patterson-UTI Energy, Inc. | 741,330 | 11,839,040 |
| Oil, Gas & Consumable Fuels 2.0% |
| Concho Resources, Inc.(a) | 227,177 | 25,209,832 |
| ONEOK, Inc. | 220,320 | 11,932,531 |
| Total | | 37,142,363 |
| Total Energy | 48,981,403 |
| Financials 5.7% |
| Banks 1.4% |
| Citizens Financial Group, Inc. | 311,571 | 10,322,347 |
| East West Bancorp, Inc. | 188,430 | 10,433,369 |
| Signature Bank(a) | 41,457 | 5,320,592 |
| Total | | 26,076,308 |
| Capital Markets 2.4% |
| MarketAxess Holdings, Inc. | 48,260 | 9,311,767 |
| S&P Global, Inc. | 142,300 | 21,961,159 |
| TD Ameritrade Holding Corp. | 293,140 | 12,698,825 |
| Total | | 43,971,751 |
| Consumer Finance 0.9% |
| Ally Financial, Inc. | 338,410 | 7,648,066 |
| SLM Corp.(a) | 915,070 | 9,306,262 |
| Total | | 16,954,328 |
| Insurance 1.0% |
| Progressive Corp. (The) | 371,540 | 17,269,179 |
| Total Financials | 104,271,566 |
The accompanying Notes to Financial Statements are an integral part of this statement.
Columbia Mid Cap Growth Fund | Annual Report 2017
| 7 |
Portfolio of Investments (continued)
August 31, 2017
| Common Stocks (continued) |
| Issuer | Shares | Value ($) |
| Health Care 15.6% |
| Biotechnology 3.3% |
| ACADIA Pharmaceuticals, Inc.(a) | 141,540 | 5,040,239 |
| Alexion Pharmaceuticals, Inc.(a) | 40,070 | 5,706,369 |
| BioMarin Pharmaceutical, Inc.(a) | 174,476 | 15,735,990 |
| Incyte Corp.(a) | 103,793 | 14,262,196 |
| Intercept Pharmaceuticals, Inc.(a) | 56,850 | 6,629,279 |
| Juno Therapeutics, Inc.(a) | 99,400 | 4,102,238 |
| Loxo Oncology, Inc.(a) | 23,652 | 1,972,577 |
| TESARO, Inc.(a) | 58,260 | 7,523,696 |
| Total | | 60,972,584 |
| Health Care Equipment & Supplies 6.4% |
| ABIOMED, Inc.(a) | 52,510 | 7,918,508 |
| Align Technology, Inc.(a) | 42,090 | 7,438,987 |
| Cooper Companies, Inc. (The) | 54,800 | 13,745,484 |
| Dentsply Sirona, Inc. | 167,320 | 9,465,292 |
| Edwards Lifesciences Corp.(a) | 200,680 | 22,809,289 |
| IDEXX Laboratories, Inc.(a) | 87,640 | 13,621,885 |
| Teleflex, Inc. | 72,530 | 15,358,227 |
| West Pharmaceutical Services, Inc. | 170,870 | 14,872,525 |
| Zimmer Biomet Holdings, Inc. | 94,100 | 10,752,807 |
| Total | | 115,983,004 |
| Health Care Providers & Services 2.2% |
| Henry Schein, Inc.(a) | 161,418 | 28,035,078 |
| WellCare Health Plans, Inc.(a) | 64,520 | 11,270,354 |
| Total | | 39,305,432 |
| Health Care Technology 0.6% |
| Veeva Systems Inc., Class A(a) | 179,520 | 10,681,440 |
| Life Sciences Tools & Services 2.7% |
| Agilent Technologies, Inc. | 261,970 | 16,954,699 |
| Illumina, Inc.(a) | 88,530 | 18,100,844 |
| Mettler-Toledo International, Inc.(a) | 24,260 | 14,679,483 |
| Total | | 49,735,026 |
| Pharmaceuticals 0.4% |
| Jazz Pharmaceuticals PLC(a) | 50,800 | 7,587,488 |
| Total Health Care | 284,264,974 |
| Common Stocks (continued) |
| Issuer | Shares | Value ($) |
| Industrials 15.9% |
| Aerospace & Defense 2.3% |
| L3 Technologies, Inc. | 65,800 | 11,941,384 |
| Spirit AeroSystems Holdings, Inc., Class A | 280,290 | 20,881,605 |
| Textron, Inc. | 185,250 | 9,093,922 |
| Total | | 41,916,911 |
| Airlines 1.1% |
| Alaska Air Group, Inc. | 275,080 | 20,537,473 |
| Building Products 1.3% |
| AO Smith Corp. | 183,240 | 10,204,636 |
| Lennox International, Inc. | 77,426 | 12,831,811 |
| Total | | 23,036,447 |
| Commercial Services & Supplies 0.7% |
| KAR Auction Services, Inc. | 292,580 | 13,192,432 |
| Electrical Equipment 1.8% |
| AMETEK, Inc. | 255,403 | 16,154,240 |
| Rockwell Automation, Inc. | 99,663 | 16,350,712 |
| Total | | 32,504,952 |
| Industrial Conglomerates 0.9% |
| Roper Technologies, Inc. | 73,290 | 16,905,071 |
| Machinery 5.1% |
| Cummins, Inc. | 69,360 | 11,054,597 |
| Fortive Corp. | 200,930 | 13,054,422 |
| IDEX Corp. | 104,120 | 12,242,430 |
| Ingersoll-Rand PLC | 245,600 | 20,971,784 |
| Snap-On, Inc. | 151,830 | 22,405,553 |
| Xylem, Inc. | 213,750 | 13,267,462 |
| Total | | 92,996,248 |
| Professional Services 1.7% |
| Equifax, Inc. | 93,080 | 13,261,108 |
| IHS Markit Ltd.(a) | 391,000 | 18,314,440 |
| Total | | 31,575,548 |
| Trading Companies & Distributors 1.0% |
| United Rentals, Inc.(a) | 150,270 | 17,740,876 |
| Total Industrials | 290,405,958 |
The accompanying Notes to Financial Statements are an integral part of this statement.
| 8 | Columbia Mid Cap Growth Fund | Annual Report 2017 |
Portfolio of Investments (continued)
August 31, 2017
| Common Stocks (continued) |
| Issuer | Shares | Value ($) |
| Information Technology 27.8% |
| Communications Equipment 1.0% |
| Palo Alto Networks, Inc.(a) | 136,390 | 18,097,589 |
| Electronic Equipment, Instruments & Components 1.6% |
| Amphenol Corp., Class A | 194,207 | 15,719,114 |
| Coherent, Inc.(a) | 56,940 | 13,285,241 |
| Total | | 29,004,355 |
| Internet Software & Services 2.3% |
| CoStar Group, Inc.(a) | 39,529 | 11,329,802 |
| GoDaddy, Inc., Class A(a) | 337,128 | 15,110,077 |
| LogMeIn, Inc. | 135,870 | 15,543,528 |
| Total | | 41,983,407 |
| IT Services 10.1% |
| Booz Allen Hamilton Holdings Corp. | 281,340 | 9,596,507 |
| DXC Technology Co. | 277,380 | 23,577,300 |
| Fidelity National Information Services, Inc. | 245,414 | 22,803,869 |
| Fiserv, Inc.(a) | 193,650 | 23,956,441 |
| FleetCor Technologies, Inc.(a) | 188,596 | 27,114,447 |
| Gartner, Inc.(a) | 117,880 | 14,215,149 |
| Global Payments, Inc. | 192,610 | 18,392,329 |
| Total System Services, Inc. | 420,480 | 29,063,578 |
| Vantiv, Inc., Class A(a) | 213,540 | 15,095,143 |
| Total | | 183,814,763 |
| Semiconductors & Semiconductor Equipment 5.5% |
| Lam Research Corp. | 184,300 | 30,590,114 |
| MACOM Technology Solutions Holdings, Inc.(a) | 379,165 | 17,267,174 |
| Microchip Technology, Inc. | 293,230 | 25,452,364 |
| ON Semiconductor Corp.(a) | 413,620 | 7,064,629 |
| Skyworks Solutions, Inc. | 73,611 | 7,755,655 |
| Xilinx, Inc. | 191,380 | 12,642,563 |
| Total | | 100,772,499 |
| Software 7.3% |
| Autodesk, Inc.(a) | 189,410 | 21,679,869 |
| Electronic Arts, Inc.(a) | 205,150 | 24,925,725 |
| Ellie Mae, Inc.(a) | 85,523 | 7,096,699 |
| Fortinet, Inc.(a) | 343,310 | 13,114,442 |
| PTC, Inc.(a) | 212,660 | 11,908,960 |
| Red Hat, Inc.(a) | 208,182 | 22,379,565 |
| Common Stocks (continued) |
| Issuer | Shares | Value ($) |
| ServiceNow, Inc.(a) | 111,498 | 12,954,953 |
| Tableau Software, Inc., Class A(a) | 137,830 | 9,989,918 |
| Workday, Inc., Class A(a) | 83,070 | 9,111,948 |
| Total | | 133,162,079 |
| Total Information Technology | 506,834,692 |
| Materials 7.2% |
| Chemicals 2.6% |
| Air Products & Chemicals, Inc. | 63,400 | 9,216,458 |
| Eastman Chemical Co. | 112,780 | 9,721,636 |
| Sherwin-Williams Co. (The) | 26,785 | 9,087,347 |
| Westlake Chemical Corp. | 264,159 | 20,316,469 |
| Total | | 48,341,910 |
| Construction Materials 1.7% |
| Eagle Materials, Inc. | 54,588 | 5,308,683 |
| Martin Marietta Materials, Inc. | 121,980 | 25,858,540 |
| Total | | 31,167,223 |
| Containers & Packaging 2.9% |
| Berry Global Group, Inc.(a) | 338,780 | 19,052,987 |
| International Paper Co. | 398,500 | 21,467,195 |
| WestRock Co. | 219,872 | 12,512,916 |
| Total | | 53,033,098 |
| Total Materials | 132,542,231 |
| Real Estate 3.2% |
| Equity Real Estate Investment Trusts (REITS) 3.2% |
| CyrusOne, Inc. | 202,480 | 12,762,314 |
| Equinix, Inc. | 43,190 | 20,230,628 |
| Equity LifeStyle Properties, Inc. | 107,670 | 9,598,781 |
| SBA Communications Corp.(a) | 109,470 | 16,809,118 |
| Total | | 59,400,841 |
| Total Real Estate | 59,400,841 |
Total Common Stocks
(Cost $1,421,152,155) | 1,773,400,353 |
|
The accompanying Notes to Financial Statements are an integral part of this statement.
Columbia Mid Cap Growth Fund | Annual Report 2017
| 9 |
Portfolio of Investments (continued)
August 31, 2017
| Money Market Funds 3.4% |
| | Shares | Value ($) |
| Columbia Short-Term Cash Fund, 1.146%(b),(c) | 61,629,467 | 61,629,467 |
Total Money Market Funds
(Cost $61,625,757) | 61,629,467 |
Total Investments
(Cost: $1,482,777,912) | 1,835,029,820 |
| Other Assets & Liabilities, Net | | (9,324,550) |
| Net Assets | 1,825,705,270 |
Notes to Portfolio of Investments
| (a) | Non-income producing investment. |
| (b) | The rate shown is the seven-day current annualized yield at August 31, 2017. |
| (c) | As defined in the Investment Company Act of 1940, an affiliated company is one in which the Fund owns 5% or more of the company’s outstanding voting securities, or a company which is under common ownership or control with the Fund. Holdings and transactions in these affiliated companies during the year ended August 31, 2017 are as follows: |
| Issuer | Beginning
shares | Shares
purchased | Shares
sold | Ending
shares | Realized gain
(loss) ($) | Net change in
unrealized
appreciation
(depreciation) ($) | Dividends —
affiliated
issuers($) | Value ($) |
| Columbia Short-Term Cash Fund, 1.146% | 66,357,000 | 781,601,718 | (786,329,251) | 61,629,467 | (1,957) | 3,710 | 450,958 | 61,629,467 |
Fair value measurements
The Fund categorizes its fair value measurements according to a three-level hierarchy that maximizes the use of observable inputs and minimizes the use of unobservable inputs by prioritizing that the most observable input be used when available. Observable inputs are those that market participants would use in pricing an investment based on market data obtained from sources independent of the reporting entity. Unobservable inputs are those that reflect the Fund’s assumptions about the information market participants would use in pricing an investment. An investment’s level within the fair value hierarchy is based on the lowest level of any input that is deemed significant to the asset’s or liability’s fair value measurement. The input levels are not necessarily an indication of the risk or liquidity associated with investments at that level. For example, certain U.S. government securities are generally high quality and liquid, however, they are reflected as Level 2 because the inputs used to determine fair value may not always be quoted prices in an active market.
Fair value inputs are summarized in the three broad levels listed below:
| • | Level 1 – Valuations based on quoted prices for investments in active markets that the Fund has the ability to access at the measurement date. Valuation adjustments are not applied to Level 1 investments. |
| • | Level 2 – Valuations based on other significant observable inputs (including quoted prices for similar securities, interest rates, prepayment speeds, credit risks, etc.). |
| • | Level 3 – Valuations based on significant unobservable inputs (including the Fund’s own assumptions and judgment in determining the fair value of investments). |
Inputs that are used in determining fair value of an investment may include price information, credit data, volatility statistics, and other factors. These inputs can be either observable or unobservable. The availability of observable inputs can vary between investments, and is affected by various factors such as the type of investment, and the volume and level of activity for that investment or similar investments in the marketplace. The inputs will be considered by the Investment Manager, along with any other relevant factors in the calculation of an investment’s fair value. The Fund uses prices and inputs that are current as of the measurement date, which may include periods of market dislocations. During these periods, the availability of prices and inputs may be reduced for many investments. This condition could cause an investment to be reclassified between the various levels within the hierarchy.
Certain investments that have been measured at fair value using the net asset value (NAV) per share (or its equivalent) are not categorized in the fair value hierarchy. The fair value amounts presented in the table are intended to reconcile the fair value hierarchy to the amounts presented in the Portfolio of Investments. The Columbia Short-Term Cash Fund seeks to provide shareholders with maximum current income consistent with liquidity and stability of principal. Columbia Short-Term Cash Fund prices its shares with a floating NAV and no longer seeks to maintain a stable NAV.
Investments falling into the Level 3 category are primarily supported by quoted prices from brokers and dealers participating in the market for those investments. However, these may be classified as Level 3 investments due to lack of market transparency and corroboration to support these quoted prices. Additionally, valuation models may be used as the pricing source for any remaining investments classified as Level 3. These models may rely on one or more significant unobservable inputs and/or significant assumptions by the Investment Manager. Inputs used in valuations may include, but are not limited to, financial statement analysis, capital account balances, discount rates and estimated cash flows, and comparable company data.
Under the direction of the Fund’s Board of Trustees (the Board), the Investment Manager’s Valuation Committee (the Committee) is responsible for overseeing the valuation procedures approved by the Board. The Committee consists of voting and non-voting members from various groups within the Investment Manager’s organization, including operations and accounting, trading and investments, compliance, risk management and legal.
The Committee meets at least monthly to review and approve valuation matters, which may include a description of specific valuation determinations, data regarding pricing information received from approved pricing vendors and brokers and the results of Board-approved valuation control policies and procedures (the Policies). The Policies address, among other things, instances when market quotations are or are not readily available, including recommendations of third party pricing vendors and a determination of appropriate pricing methodologies; events that require specific valuation determinations and assessment of fair value techniques; securities with a potential for stale pricing, including those that are illiquid, restricted, or in default; and the effectiveness of third party pricing vendors, including periodic reviews of vendors. The Committee meets more frequently, as needed, to discuss
The accompanying Notes to Financial Statements are an integral part of this statement.
| 10 | Columbia Mid Cap Growth Fund | Annual Report 2017 |
Portfolio of Investments (continued)
August 31, 2017
Fair value measurements (continued)
additional valuation matters, which may include the need to review back-testing results, review time-sensitive information or approve related valuation actions. The Committee reports to the Board, with members of the Committee meeting with the Board at each of its regularly scheduled meetings to discuss valuation matters and actions during the period, similar to those described earlier.
For investments categorized as Level 3, the Committee monitors information similar to that described above, which may include: (i) data specific to the issuer or comparable issuers, (ii) general market or specific sector news and (iii) quoted prices and specific or similar security transactions. The Committee considers this data and any changes from prior periods in order to assess the reasonableness of observable and unobservable inputs, any assumptions or internal models used to value those securities and changes in fair value. This data is also used to corroborate, when available, information received from approved pricing vendors and brokers. Various factors impact the frequency of monitoring this information (which may occur as often as daily). However, the Committee may determine that changes to inputs, assumptions and models are not required as a result of the monitoring procedures performed.
The following table is a summary of the inputs used to value the Fund’s investments at August 31, 2017:
| | Level 1
quoted prices
in active
markets for
identical
assets ($) | Level 2
other
significant
observable
inputs ($) | Level 3
significant
unobservable
inputs ($) | Investments
measured at
net asset
value ($) | Total ($) |
| Investments | | | | | |
| Common Stocks | | | | | |
| Consumer Discretionary | 304,223,004 | — | — | — | 304,223,004 |
| Consumer Staples | 42,475,684 | — | — | — | 42,475,684 |
| Energy | 48,981,403 | — | — | — | 48,981,403 |
| Financials | 104,271,566 | — | — | — | 104,271,566 |
| Health Care | 284,264,974 | — | — | — | 284,264,974 |
| Industrials | 290,405,958 | — | — | — | 290,405,958 |
| Information Technology | 506,834,692 | — | — | — | 506,834,692 |
| Materials | 132,542,231 | — | — | — | 132,542,231 |
| Real Estate | 59,400,841 | — | — | — | 59,400,841 |
| Total Common Stocks | 1,773,400,353 | — | — | — | 1,773,400,353 |
| Money Market Funds | — | — | — | 61,629,467 | 61,629,467 |
| Total Investments | 1,773,400,353 | — | — | 61,629,467 | 1,835,029,820 |
See the Portfolio of Investments for all investment classifications not indicated in the table.
There were no transfers of financial assets between levels during the period.
The accompanying Notes to Financial Statements are an integral part of this statement.
Columbia Mid Cap Growth Fund | Annual Report 2017
| 11 |
Statement of Assets and Liabilities
August 31, 2017
| Assets | |
| Investments in unaffiliated issuers, at cost | $1,421,152,155 |
| Investments in affiliated issuers, at cost | 61,625,757 |
| Investments in unaffiliated issuers, at value | 1,773,400,353 |
| Investments in affiliated issuers, at value | 61,629,467 |
| Receivable for: | |
| Investments sold | 41,225,261 |
| Capital shares sold | 359,344 |
| Dividends | 1,619,233 |
| Prepaid expenses | 12,736 |
| Trustees’ deferred compensation plan | 132,612 |
| Other assets | 2,199 |
| Total assets | 1,878,381,205 |
| Liabilities | |
| Payable for: | |
| Investments purchased | 50,551,959 |
| Capital shares purchased | 1,513,731 |
| Management services fees | 37,375 |
| Distribution and/or service fees | 7,150 |
| Transfer agent fees | 239,811 |
| Plan administration fees | 89 |
| Compensation of board members | 58,132 |
| Compensation of chief compliance officer | 129 |
| Other expenses | 134,947 |
| Trustees’ deferred compensation plan | 132,612 |
| Total liabilities | 52,675,935 |
| Net assets applicable to outstanding capital stock | $1,825,705,270 |
| Represented by | |
| Paid in capital | 1,290,718,230 |
| Excess of distributions over net investment income | (189,914) |
| Accumulated net realized gain | 182,925,046 |
| Unrealized appreciation (depreciation) on: | |
| Investments - unaffiliated issuers | 352,248,198 |
| Investments - affiliated issuers | 3,710 |
| Total - representing net assets applicable to outstanding capital stock | $1,825,705,270 |
The accompanying Notes to Financial Statements are an integral part of this statement.
| 12 | Columbia Mid Cap Growth Fund | Annual Report 2017 |
Statement of Assets and Liabilities (continued)
August 31, 2017
| Class A | |
| Net assets | $834,347,184 |
| Shares outstanding | 31,011,456 |
| Net asset value per share | $26.90 |
| Maximum offering price per share(a) | $28.54 |
| Class C | |
| Net assets | $41,030,257 |
| Shares outstanding | 1,790,678 |
| Net asset value per share | $22.91 |
| Class K | |
| Net assets | $390,650 |
| Shares outstanding | 13,745 |
| Net asset value per share | $28.42 |
| Class R | |
| Net assets | $15,333,408 |
| Shares outstanding | 591,392 |
| Net asset value per share | $25.93 |
| Class R4 | |
| Net assets | $35,472,726 |
| Shares outstanding | 1,212,181 |
| Net asset value per share | $29.26 |
| Class R5 | |
| Net assets | $51,117,610 |
| Shares outstanding | 1,779,514 |
| Net asset value per share | $28.73 |
| Class T(b) | |
| Net assets | $131,896 |
| Shares outstanding | 4,902 |
| Net asset value per share | $26.91 |
| Maximum offering price per share(c) | $27.60 |
| Class V(d) | |
| Net assets | $22,418,990 |
| Shares outstanding | 836,158 |
| Net asset value per share | $26.81 |
| Maximum offering price per share(e) | $28.45 |
| Class Y | |
| Net assets | $145,596,939 |
| Shares outstanding | 5,066,774 |
| Net asset value per share | $28.74 |
| Class Z | |
| Net assets | $679,865,610 |
| Shares outstanding | 23,840,215 |
| Net asset value per share | $28.52 |
| (a) | The maximum offering price per share is calculated by dividing the net asset value per share by 1.0 minus the maximum sales charge of 5.75% for Class A. |
| (b) | Prior to March 27, 2017, Class T shares were known as Class W shares. |
| (c) | The maximum offering price per share is calculated by dividing the net asset value per share by 1.0 minus the maximum sales charge of 2.50% for Class T. |
| (d) | Prior to January 24, 2017, Class V shares were known as Class T shares. |
| (e) | The maximum offering price per share is calculated by dividing the net asset value per share by 1.0 minus the maximum sales charge of 5.75% for Class V. |
The accompanying Notes to Financial Statements are an integral part of this statement.
Columbia Mid Cap Growth Fund | Annual Report 2017
| 13 |
Statement of Operations
Year Ended August 31, 2017
| Net investment income | |
| Income: | |
| Dividends — unaffiliated issuers | $14,551,039 |
| Dividends — affiliated issuers | 450,958 |
| Total income | 15,001,997 |
| Expenses: | |
| Management services fees | 13,635,837 |
| Distribution and/or service fees | |
| Class A | 2,117,819 |
| Class B(a) | 26,264 |
| Class C | 437,457 |
| Class R | 77,454 |
| Class T(b) | 340 |
| Class V(c) | 54,239 |
| Transfer agent fees | |
| Class A | 1,367,041 |
| Class B(a) | 4,318 |
| Class C | 70,657 |
| Class K | 238 |
| Class R | 25,007 |
| Class R4 | 48,084 |
| Class R5 | 23,839 |
| Class T(b) | 219 |
| Class V(c) | 34,980 |
| Class Y | 1,303 |
| Class Z | 1,280,779 |
| Plan administration fees | |
| Class K | 1,046 |
| Compensation of board members | 55,147 |
| Custodian fees | 14,541 |
| Printing and postage fees | 167,292 |
| Registration fees | 173,443 |
| Audit fees | 38,065 |
| Legal fees | 51,967 |
| Compensation of chief compliance officer | 786 |
| Other | 41,607 |
| Total expenses | 19,749,769 |
| Expense reduction | (6,086) |
| Total net expenses | 19,743,683 |
| Net investment loss | (4,741,686) |
| Realized and unrealized gain (loss) — net | |
| Net realized gain (loss) on: | |
| Investments — unaffiliated issuers | 248,834,152 |
| Investments — affiliated issuers | (1,957) |
| Net realized gain | 248,832,195 |
| Net change in unrealized appreciation (depreciation) on: | |
| Investments — unaffiliated issuers | (5,873,156) |
| Investments — affiliated issuers | 3,710 |
| Net change in unrealized appreciation (depreciation) | (5,869,446) |
| Net realized and unrealized gain | 242,962,749 |
| Net increase in net assets resulting from operations | $238,221,063 |
| (a) | Effective July 17, 2017, Class B shares were automatically converted to Class A shares. |
| (b) | Prior to March 27, 2017, Class T shares were known as Class W shares. |
| (c) | Prior to January 24, 2017, Class V shares were known as Class T shares. |
The accompanying Notes to Financial Statements are an integral part of this statement.
| 14 | Columbia Mid Cap Growth Fund | Annual Report 2017 |
Statement of Changes in Net Assets
| | Year Ended
August 31, 2017 | Year Ended
August 31, 2016 |
| Operations | | |
| Net investment loss | $(4,741,686) | $(2,500,471) |
| Net realized gain | 248,832,195 | 94,407,333 |
| Net change in unrealized appreciation (depreciation) | (5,869,446) | (39,380,404) |
| Net increase in net assets resulting from operations | 238,221,063 | 52,526,458 |
| Distributions to shareholders | | |
| Net investment income | | |
| Class A | — | (8,258,128) |
| Class B(a) | — | (7,102) |
| Class C | — | (52,349) |
| Class I(b) | — | (35) |
| Class K | — | (4,691) |
| Class R | — | (118,953) |
| Class R4 | — | (301,659) |
| Class R5 | — | (446,456) |
| Class T(c) | — | (1,679) |
| Class V(d) | — | (195,429) |
| Class Y | — | (33) |
| Class Z | — | (10,100,198) |
| Net realized gains | | |
| Class A | (51,052,445) | (134,277,745) |
| Class B(a) | (234,465) | (1,121,198) |
| Class C | (3,005,402) | (8,264,319) |
| Class I(b) | (140) | (372) |
| Class K | (23,438) | (66,547) |
| Class R | (992,962) | (2,752,903) |
| Class R4 | (1,505,690) | (3,732,458) |
| Class R5 | (2,113,734) | (5,020,124) |
| Class T(c) | (8,430) | (27,238) |
| Class V(d) | (1,277,842) | (3,208,605) |
| Class Y | (532,420) | (350) |
| Class Z | (45,262,358) | (126,068,524) |
| Total distributions to shareholders | (106,009,326) | (304,027,095) |
| Increase (decrease) in net assets from capital stock activity | (158,772,541) | 49,797,626 |
| Total decrease in net assets | (26,560,804) | (201,703,011) |
| Net assets at beginning of year | 1,852,266,074 | 2,053,969,085 |
| Net assets at end of year | $1,825,705,270 | $1,852,266,074 |
| Excess of distributions over net investment income | $(189,914) | $(846,361) |
| (a) | Effective July 17, 2017, Class B shares were automatically converted to Class A shares. |
| (b) | Effective March 27, 2017, Class I shares were redeemed or exchanged for Class Y shares. |
| (c) | Prior to March 27, 2017, Class T shares were known as Class W shares. |
| (d) | Prior to January 24, 2017, Class V shares were known as Class T shares. |
The accompanying Notes to Financial Statements are an integral part of this statement.
Columbia Mid Cap Growth Fund | Annual Report 2017
| 15 |
Statement of Changes in Net Assets (continued)
| | Year Ended | Year Ended |
| | August 31, 2017 | August 31, 2016 |
| | Shares | Dollars ($) | Shares | Dollars ($) |
| Capital stock activity |
| Class A(a) | | | | |
| Subscriptions (b) | 1,238,395 | 31,436,677 | 2,269,018 | 56,974,135 |
| Distributions reinvested | 2,037,154 | 49,136,143 | 5,398,498 | 134,314,628 |
| Redemptions | (7,341,268) | (185,811,380) | (5,661,350) | (141,817,080) |
| Net increase (decrease) | (4,065,719) | (105,238,560) | 2,006,166 | 49,471,683 |
| Class B(a) | | | | |
| Subscriptions | 1,163 | 24,774 | 7,908 | 186,059 |
| Distributions reinvested | 11,199 | 229,921 | 50,234 | 1,081,033 |
| Redemptions (b) | (207,015) | (4,555,905) | (172,161) | (3,718,483) |
| Net decrease | (194,653) | (4,301,210) | (114,019) | (2,451,391) |
| Class C | | | | |
| Subscriptions | 120,211 | 2,583,102 | 310,462 | 6,814,802 |
| Distributions reinvested | 132,604 | 2,739,607 | 343,555 | 7,434,524 |
| Redemptions | (598,109) | (13,048,978) | (564,728) | (12,322,494) |
| Net increase (decrease) | (345,294) | (7,726,269) | 89,289 | 1,926,832 |
| Class I(c) | | | | |
| Redemptions | (90) | (2,430) | — | — |
| Net decrease | (90) | (2,430) | — | — |
| Class K | | | | |
| Subscriptions | 1,669 | 44,525 | 3,390 | 93,306 |
| Distributions reinvested | 916 | 23,311 | 2,709 | 70,871 |
| Redemptions | (6,980) | (187,437) | (3,143) | (79,452) |
| Net increase (decrease) | (4,395) | (119,601) | 2,956 | 84,725 |
| Class R | | | | |
| Subscriptions | 133,432 | 3,252,287 | 236,600 | 5,771,044 |
| Distributions reinvested | 26,856 | 625,485 | 82,209 | 1,982,060 |
| Redemptions | (260,876) | (6,288,941) | (307,036) | (7,533,492) |
| Net increase (decrease) | (100,588) | (2,411,169) | 11,773 | 219,612 |
| Class R4 | | | | |
| Subscriptions | 528,018 | 14,715,600 | 275,809 | 7,720,675 |
| Distributions reinvested | 57,486 | 1,505,564 | 150,289 | 4,033,752 |
| Redemptions | (366,983) | (10,088,658) | (309,946) | (8,228,638) |
| Net increase | 218,521 | 6,132,506 | 116,152 | 3,525,789 |
| Class R5 | | | | |
| Subscriptions | 567,777 | 15,465,198 | 300,745 | 7,737,711 |
| Distributions reinvested | 82,274 | 2,113,610 | 207,604 | 5,466,222 |
| Redemptions | (258,617) | (6,954,015) | (364,944) | (9,649,821) |
| Net increase | 391,434 | 10,624,793 | 143,405 | 3,554,112 |
| Class T(d) | | | | |
| Distributions reinvested | 344 | 8,307 | 1,148 | 28,562 |
| Redemptions | (1,264) | (31,549) | (2,333) | (57,883) |
| Net decrease | (920) | (23,242) | (1,185) | (29,321) |
| Class V(e) | | | | |
| Subscriptions | 9,109 | 222,930 | 18,522 | 457,861 |
| Distributions reinvested | 45,154 | 1,085,510 | 116,269 | 2,883,462 |
| Redemptions | (71,597) | (1,805,454) | (70,902) | (1,793,042) |
| Net increase (decrease) | (17,334) | (497,014) | 63,889 | 1,548,281 |
| Class Y(c) | | | | |
| Subscriptions | 4,960,722 | 137,909,531 | 233,023 | 6,019,422 |
| Distributions reinvested | 20,720 | 532,288 | — | — |
| Redemptions | (135,059) | (3,688,740) | (12,717) | (333,740) |
| Net increase | 4,846,383 | 134,753,079 | 220,306 | 5,685,682 |
The accompanying Notes to Financial Statements are an integral part of this statement.
| 16 | Columbia Mid Cap Growth Fund | Annual Report 2017 |
Statement of Changes in Net Assets (continued)
| | Year Ended | Year Ended |
| | August 31, 2017 | August 31, 2016 |
| | Shares | Dollars ($) | Shares | Dollars ($) |
| Class Z | | | | |
| Subscriptions | 1,879,325 | 50,526,264 | 1,719,278 | 45,182,224 |
| Distributions reinvested | 1,335,272 | 34,076,146 | 3,643,504 | 95,423,366 |
| Redemptions | (10,095,051) | (274,565,834) | (5,899,479) | (154,343,968) |
| Net decrease | (6,880,454) | (189,963,424) | (536,697) | (13,738,378) |
| Total net increase (decrease) | (6,153,109) | (158,772,541) | 2,002,035 | 49,797,626 |
| (a) | Effective July 17, 2017, Class B shares were automatically converted to Class A shares. |
| (b) | Includes conversions of Class B shares to Class A shares, if any. |
| (c) | Effective March 27, 2017, Class I shares were redeemed or exchanged for Class Y shares. |
| (d) | Prior to March 27, 2017, Class T shares were known as Class W shares. |
| (e) | Prior to January 24, 2017, Class V shares were known as Class T shares. |
The accompanying Notes to Financial Statements are an integral part of this statement.
Columbia Mid Cap Growth Fund | Annual Report 2017
| 17 |
The following table is intended to help you understand the Fund’s financial performance. Certain information reflects financial results for a single share of a class held for the periods shown. Per share net investment income (loss) amounts are calculated based on average shares outstanding during the period. Total return assumes reinvestment of all dividends and distributions, if any. Total return does not reflect payment of sales charges, if any. Total return and portfolio turnover are not annualized for periods of less than one year. The portfolio turnover rate is calculated without regard to purchase and sales transactions of short-term instruments and certain derivatives, if any. If such transactions were included, the Fund’s portfolio turnover rate may be higher.
| Year ended | Net asset value,
beginning of
period | Net
investment
income
(loss) | Net
realized
and
unrealized
gain (loss) | Total from
investment
operations | Distributions
from net
investment
income | Distributions
from net
realized
gains |
| Class A |
| 8/31/2017 | $25.09 | (0.09) | 3.42 | 3.33 | — | (1.52) |
| 8/31/2016 | $28.69 | (0.06) | 0.84 | 0.78 | (0.26) | (4.12) |
| 8/31/2015 | $32.14 | 0.25 (d) | 1.29 | 1.54 | — | (4.99) |
| 8/31/2014 | $29.89 | (0.13) | 5.45 | 5.32 | — | (3.07) |
| 8/31/2013 | $26.41 | (0.11) | 4.36 | 4.25 | — | (0.77) |
| Class C |
| 8/31/2017 | $21.70 | (0.24) | 2.93 | 2.69 | — | (1.48) |
| 8/31/2016 | $25.34 | (0.21) | 0.72 | 0.51 | (0.03) | (4.12) |
| 8/31/2015 | $28.99 | 0.03 (d) | 1.15 | 1.18 | — | (4.83) |
| 8/31/2014 | $27.30 | (0.33) | 4.95 | 4.62 | — | (2.93) |
| 8/31/2013 | $24.37 | (0.26) | 3.96 | 3.70 | — | (0.77) |
| Class K |
| 8/31/2017 | $26.40 | (0.07) | 3.62 | 3.55 | — | (1.53) |
| 8/31/2016 | $29.97 | (0.03) | 0.87 | 0.84 | (0.29) | (4.12) |
| 8/31/2015 | $33.35 | 0.33 (d) | 1.31 | 1.64 | — | (5.02) |
| 8/31/2014 | $30.89 | (0.08) | 5.64 | 5.56 | — | (3.10) |
| 8/31/2013 (e) | $28.08 | (0.06) | 2.87 | 2.81 | — | — |
| Class R |
| 8/31/2017 | $24.27 | (0.15) | 3.31 | 3.16 | — | (1.50) |
| 8/31/2016 | $27.88 | (0.12) | 0.81 | 0.69 | (0.18) | (4.12) |
| 8/31/2015 | $31.39 | 0.15 (d) | 1.28 | 1.43 | — | (4.94) |
| 8/31/2014 | $29.28 | (0.20) | 5.33 | 5.13 | — | (3.02) |
| 8/31/2013 | $25.96 | (0.14) | 4.23 | 4.09 | — | (0.77) |
| Class R4 |
| 8/31/2017 | $27.12 | (0.03) | 3.71 | 3.68 | — | (1.54) |
| 8/31/2016 | $30.67 | 0.00 (g) | 0.91 | 0.91 | (0.34) | (4.12) |
| 8/31/2015 | $33.99 | 1.93 (d) | (0.21) (h) | 1.72 | — | (5.04) |
| 8/31/2014 | $31.42 | (0.03) | 5.72 | 5.69 | — | (3.12) |
| 8/31/2013 (i) | $26.58 | (0.09) | 5.70 | 5.61 | — | (0.77) |
| Class R5 |
| 8/31/2017 | $26.63 | (0.00) (g) | 3.65 | 3.65 | — | (1.55) |
| 8/31/2016 | $30.20 | 0.04 | 0.88 | 0.92 | (0.37) | (4.12) |
| 8/31/2015 | $33.54 | 0.40 (d) | 1.33 | 1.73 | — | (5.07) |
| 8/31/2014 | $31.03 | 0.03 | 5.63 | 5.66 | — | (3.15) |
| 8/31/2013 | $27.31 | (0.04) | 4.53 | 4.49 | — | (0.77) |
The accompanying Notes to Financial Statements are an integral part of this statement.
| 18 | Columbia Mid Cap Growth Fund | Annual Report 2017 |
Total
distributions to
shareholders | Net
asset
value,
end of
period | Total
return | Total gross
expense
ratio to
average
net assets(a) | Total net
expense
ratio to
average
net assets(a),(b) | Net investment
income (loss)
ratio to
average
net assets | Portfolio
turnover | Net
assets,
end of
period
(000’s) |
| |
| (1.52) | $26.90 | 13.97% | 1.19% | 1.19% (c) | (0.37%) | 119% | $834,347 |
| (4.38) | $25.09 | 2.83% | 1.19% | 1.19% (c) | (0.23%) | 130% | $880,155 |
| (4.99) | $28.69 | 5.33% | 1.19% | 1.19% (c) | 0.83% | 101% | $948,826 |
| (3.07) | $32.14 | 18.77% | 1.19% | 1.19% (c) | (0.42%) | 100% | $995,730 |
| (0.77) | $29.89 | 16.60% | 1.20% | 1.20% (c) | (0.40%) | 109% | $986,482 |
| |
| (1.48) | $22.91 | 13.12% | 1.94% | 1.94% (c) | (1.12%) | 119% | $41,030 |
| (4.15) | $21.70 | 2.05% | 1.94% | 1.94% (c) | (0.98%) | 130% | $46,355 |
| (4.83) | $25.34 | 4.56% | 1.94% | 1.94% (c) | 0.11% | 101% | $51,859 |
| (2.93) | $28.99 | 17.84% | 1.94% | 1.94% (c) | (1.17%) | 100% | $52,845 |
| (0.77) | $27.30 | 15.71% | 1.96% | 1.96% (c) | (1.04%) | 109% | $52,284 |
| |
| (1.53) | $28.42 | 14.12% | 1.09% | 1.09% | (0.25%) | 119% | $391 |
| (4.41) | $26.40 | 2.95% | 1.08% | 1.08% | (0.12%) | 130% | $479 |
| (5.02) | $29.97 | 5.45% | 1.07% | 1.07% | 1.07% | 101% | $455 |
| (3.10) | $33.35 | 18.95% | 1.05% | 1.05% | (0.26%) | 100% | $383 |
| — | $30.89 | 10.01% | 1.05% (f) | 1.05% (f) | (0.42%) (f) | 109% | $396 |
| |
| (1.50) | $25.93 | 13.71% | 1.44% | 1.44% (c) | (0.62%) | 119% | $15,333 |
| (4.30) | $24.27 | 2.58% | 1.44% | 1.44% (c) | (0.48%) | 130% | $16,796 |
| (4.94) | $27.88 | 5.06% | 1.44% | 1.44% (c) | 0.52% | 101% | $18,965 |
| (3.02) | $31.39 | 18.47% | 1.44% | 1.44% (c) | (0.67%) | 100% | $24,965 |
| (0.77) | $29.28 | 16.27% | 1.46% | 1.46% (c) | (0.53%) | 109% | $27,574 |
| |
| (1.54) | $29.26 | 14.24% | 0.94% | 0.94% (c) | (0.11%) | 119% | $35,473 |
| (4.46) | $27.12 | 3.10% | 0.94% | 0.94% (c) | 0.02% | 130% | $26,945 |
| (5.04) | $30.67 | 5.61% | 0.93% | 0.93% (c) | 6.10% | 101% | $26,912 |
| (3.12) | $33.99 | 19.05% | 0.94% | 0.94% (c) | (0.08%) | 100% | $373 |
| (0.77) | $31.42 | 21.61% | 1.08% (f) | 0.96% (c),(f) | (0.41%) (f) | 109% | $30 |
| |
| (1.55) | $28.73 | 14.40% | 0.84% | 0.84% | (0.01%) | 119% | $51,118 |
| (4.49) | $26.63 | 3.21% | 0.83% | 0.83% | 0.14% | 130% | $36,964 |
| (5.07) | $30.20 | 5.72% | 0.82% | 0.82% | 1.28% | 101% | $37,589 |
| (3.15) | $33.54 | 19.21% | 0.81% | 0.81% | 0.09% | 100% | $31,305 |
| (0.77) | $31.03 | 16.94% | 0.81% | 0.81% | (0.14%) | 109% | $3,847 |
Columbia Mid Cap Growth Fund | Annual Report 2017
| 19 |
Financial Highlights (continued)
| Year ended | Net asset value,
beginning of
period | Net
investment
income
(loss) | Net
realized
and
unrealized
gain (loss) | Total from
investment
operations | Distributions
from net
investment
income | Distributions
from net
realized
gains |
| Class T(j) |
| 8/31/2017 | $25.09 | (0.09) | 3.43 | 3.34 | — | (1.52) |
| 8/31/2016 | $28.69 | (0.06) | 0.84 | 0.78 | (0.26) | (4.12) |
| 8/31/2015 | $32.15 | 0.21 (d) | 1.33 | 1.54 | — | (5.00) |
| 8/31/2014 | $29.91 | (0.23) | 5.54 | 5.31 | — | (3.07) |
| 8/31/2013 | $26.43 | (0.08) | 4.33 | 4.25 | — | (0.77) |
| Class V(k) |
| 8/31/2017 | $25.01 | (0.09) | 3.41 | 3.32 | — | (1.52) |
| 8/31/2016 | $28.61 | (0.06) | 0.83 | 0.77 | (0.25) | (4.12) |
| 8/31/2015 | $32.05 | 0.24 (d) | 1.30 | 1.54 | — | (4.98) |
| 8/31/2014 | $29.82 | (0.14) | 5.43 | 5.29 | — | (3.06) |
| 8/31/2013 | $26.37 | (0.09) | 4.31 | 4.22 | — | (0.77) |
| Class Y |
| 8/31/2017 | $26.63 | 0.03 | 3.63 | 3.66 | — | (1.55) |
| 8/31/2016 | $30.21 | 0.03 | 0.91 | 0.94 | (0.40) | (4.12) |
| 8/31/2015 | $33.53 | 0.05 (d) | 1.71 | 1.76 | — | (5.08) |
| 8/31/2014 | $31.01 | 0.01 | 5.66 | 5.67 | — | (3.15) |
| 8/31/2013 | $27.26 | 0.07 | 4.45 | 4.52 | — | (0.77) |
| Class Z |
| 8/31/2017 | $26.46 | (0.03) | 3.63 | 3.60 | — | (1.54) |
| 8/31/2016 | $30.03 | 0.01 | 0.87 | 0.88 | (0.33) | (4.12) |
| 8/31/2015 | $33.39 | 0.32 (d) | 1.36 | 1.68 | — | (5.04) |
| 8/31/2014 | $30.91 | (0.06) | 5.66 | 5.60 | — | (3.12) |
| 8/31/2013 | $27.23 | (0.00) (g) | 4.45 | 4.45 | — | (0.77) |
| Notes to Financial Highlights |
| (a) | In addition to the fees and expenses that the Fund bears directly, the Fund indirectly bears a pro rata share of the fees and expenses of any other funds in which it invests. Such indirect expenses are not included in the Fund’s reported expense ratios. |
| (b) | Total net expenses include the impact of certain fee waivers/expense reimbursements made by the Investment Manager and certain of its affiliates, if applicable. |
| (c) | The benefits derived from expense reductions had an impact of less than 0.01%. |
| (d) | Net investment income per share includes special dividends. The per share effect of these dividends amounted to: |
| Year ended | Class A | Class C | Class K | Class R | Class R4 | Class R5 | Class V | Class W | Class Y | Class Z |
| 08/31/2015 | $ 0.35 | $ 0.32 | $ 0.40 | $ 0.32 | $ 2.00 | $ 0.39 | $ 0.34 | $ 0.31 | $ 0.04 | $ 0.34 |
| (e) | Class K shares commenced operations on February 28, 2013. Per share data and total return reflect activity from that date. |
| (f) | Annualized. |
| (g) | Rounds to zero. |
| (h) | Calculation of the net gain (loss) per share (both realized and unrealized) does not correlate to the aggregate realized and unrealized gain (loss) presented in the Statement of Operations due to the timing of subscriptions and redemptions of Fund shares in relation to fluctuations in the market value of the portfolio. |
| (i) | Class R4 shares commenced operations on November 8, 2012. Per share data and total return reflect activity from that date. |
| (j) | Prior to March 27, 2017, Class T shares were known as Class W shares. |
| (k) | Prior to January 24, 2017, Class V shares were known as Class T shares. |
The accompanying Notes to Financial Statements are an integral part of this statement.
| 20 | Columbia Mid Cap Growth Fund | Annual Report 2017 |
Total
distributions to
shareholders | Net
asset
value,
end of
period | Total
return | Total gross
expense
ratio to
average
net assets(a) | Total net
expense
ratio to
average
net assets(a),(b) | Net investment
income (loss)
ratio to
average
net assets | Portfolio
turnover | Net
assets,
end of
period
(000’s) |
| |
| (1.52) | $26.91 | 14.01% | 1.19% | 1.19% (c) | (0.37%) | 119% | $132 |
| (4.38) | $25.09 | 2.83% | 1.19% | 1.19% (c) | (0.24%) | 130% | $146 |
| (5.00) | $28.69 | 5.32% | 1.19% | 1.19% (c) | 0.71% | 101% | $201 |
| (3.07) | $32.15 | 18.71% | 1.14% | 1.14% (c) | (0.69%) | 100% | $284 |
| (0.77) | $29.91 | 16.59% | 1.21% | 1.21% (c) | (0.28%) | 109% | $104,752 |
| |
| (1.52) | $26.81 | 13.97% | 1.19% | 1.19% (c) | (0.36%) | 119% | $22,419 |
| (4.37) | $25.01 | 2.83% | 1.19% | 1.19% (c) | (0.23%) | 130% | $21,346 |
| (4.98) | $28.61 | 5.34% | 1.20% | 1.20% (c) | 0.80% | 101% | $22,590 |
| (3.06) | $32.05 | 18.69% | 1.24% | 1.24% (c) | (0.47%) | 100% | $23,951 |
| (0.77) | $29.82 | 16.51% | 1.26% | 1.26% (c) | (0.32%) | 109% | $22,027 |
| |
| (1.55) | $28.74 | 14.45% | 0.79% | 0.79% | 0.11% | 119% | $145,597 |
| (4.52) | $26.63 | 3.27% | 0.79% | 0.79% | 0.13% | 130% | $5,869 |
| (5.08) | $30.21 | 5.83% | 0.73% | 0.73% | 0.15% | 101% | $3 |
| (3.15) | $33.53 | 19.24% | 0.75% | 0.75% | 0.02% | 100% | $250 |
| (0.77) | $31.01 | 17.09% | 0.83% | 0.83% | 0.26% | 109% | $229 |
| |
| (1.54) | $28.52 | 14.29% | 0.94% | 0.94% (c) | (0.12%) | 119% | $679,866 |
| (4.45) | $26.46 | 3.09% | 0.94% | 0.94% (c) | 0.02% | 130% | $813,009 |
| (5.04) | $30.03 | 5.58% | 0.94% | 0.94% (c) | 1.01% | 101% | $938,781 |
| (3.12) | $33.39 | 19.07% | 0.94% | 0.94% (c) | (0.17%) | 100% | $1,149,098 |
| (0.77) | $30.91 | 16.84% | 0.96% | 0.96% (c) | (0.01%) | 109% | $1,196,953 |
Columbia Mid Cap Growth Fund | Annual Report 2017
| 21 |
Notes to Financial Statements
August 31, 2017
Note 1. Organization
Columbia Mid Cap Growth Fund (the Fund), a series of Columbia Funds Series Trust I (the Trust), is a diversified fund. The Trust is registered under the Investment Company Act of 1940, as amended (the 1940 Act), as an open-end management investment company organized as a Massachusetts business trust.
Fund shares
The Trust may issue an unlimited number of shares (without par value). Although all share classes generally have identical voting, dividend and liquidation rights, each share class votes separately when required by the Trust’s organizational documents or by law. Different share classes pay different distribution amounts to the extent the expenses of such share classes differ, and distributions in liquidation will be proportional to the net asset value of each share class. Each share class has its own expense and sales charge structure. The Fund offers each of the share classes identified below.
Class A shares are subject to a maximum front-end sales charge of 5.75% based on the initial investment amount. Class A shares purchased without an initial sales charge in accounts aggregating $1 million to $50 million at the time of purchase are subject to a contingent deferred sales charge (CDSC) if the shares are sold within 18 months after purchase, charged as follows: 1.00% CDSC if redeemed within 12 months after purchase, and 0.50% CDSC if redeemed more than 12, but less than 18, months after purchase.
Class B shares of the Fund are no longer offered for sale. When available, Class B shares were subject to a maximum CDSC of 5.00% based upon the holding period after purchase. Effective July 17, 2017, Class B shares were automatically converted to Class A shares without a CDSC. On August 4, 2017, the capital owned by Columbia Management Investment Advisers, LLC in Class B shares was redeemed without a CDSC.
Class C shares are subject to a 1.00% CDSC on shares redeemed within 12 months after purchase.
The Fund no longer accepts investments by new or existing investors in Class I shares. Class I shares, when available, were not subject to sales charges, and were made available only to the Columbia Family of Funds. On March 27, 2017, Class I shares were redeemed or exchanged for Class Y shares of the Fund in a tax free transaction that had no impact on the fees and expenses paid by shareholders.
Class K shares are not subject to sales charges; however, this share class is closed to new investors.
Class R shares are not subject to sales charges and are generally available only to certain retirement plans and other investors as described in the Fund’s prospectus.
Class R4 shares are not subject to sales charges and are generally available only to omnibus retirement plans and certain investors as described in the Fund’s prospectus. Effective November 1, 2017, Class R4 shares will be renamed Advisor Class shares.
Class R5 shares are not subject to sales charges and are generally available only to investors purchasing through authorized investment professionals and omnibus retirement plans as described in the Fund’s prospectus. Effective November 1, 2017, Class R5 shares will be renamed Institutional 2 Class shares.
Class T shares are subject to a maximum front-end sales charge of 2.50% per transaction and must be purchased through financial intermediaries that, by written agreement with Columbia Management Investment Distributors, Inc., are specifically authorized to sell Class T shares. Prior to March 27, 2017, Class T shares were known as Class W shares, were not subject to sales charges, and were generally available only to investors purchasing through authorized investment programs managed by investment professionals, including discretionary managed accounts.
Class V shares are subject to a maximum front-end sales charge of 5.75% based on the investment amount. Class V shares purchased without an initial sales charge in accounts aggregating $1 million to $50 million at the time of purchase are subject to a CDSC if the shares are sold within 18 months after purchase, charged as follows: 1.00% CDSC if redeemed within 12 months after purchase, and 0.50% CDSC if redeemed more than 12, but less than 18, months after purchase.
| 22 | Columbia Mid Cap Growth Fund | Annual Report 2017 |
Notes to Financial Statements (continued)
August 31, 2017
Class V shares are available only to investors who received (and who have continuously held) Class V shares in connection with previous fund reorganizations. Prior to January 24, 2017, Class V shares were known as Class T shares. Class V shares have no relation to, or connection with, the Fund’s current Class T shares.
Class Y shares are not subject to sales charges and are available to institutional and certain other investors as described in the Fund’s prospectus. Effective November 1, 2017, Class Y shares will be renamed Institutional 3 Class shares.
Class Z shares are not subject to sales charges and are generally available only to eligible investors, which are subject to different investment minimums as described in the Fund’s prospectus. Effective November 1, 2017, Class Z shares will be renamed Institutional Class shares.
Note 2. Summary of significant accounting policies
Basis of preparation
The Fund is an investment company that applies the accounting and reporting guidance in the Financial Accounting Standards Board (FASB) Accounting Standards Codification Topic 946, Financial Services - Investment Companies (ASC 946). The financial statements are prepared in accordance with U.S. generally accepted accounting principles (GAAP), which requires management to make certain estimates and assumptions that affect the reported amounts of assets and liabilities, the disclosure of contingent assets and liabilities at the date of the financial statements and the reported amounts of income and expenses during the reporting period. Actual results could differ from those estimates.
The following is a summary of significant accounting policies followed by the Fund in the preparation of its financial statements.
Security valuation
All equity securities are valued at the close of business of the New York Stock Exchange. Equity securities are valued at the last quoted sales price on the principal exchange or market on which they trade, except for securities traded on the NASDAQ Stock Market, which are valued at the NASDAQ official close price. Unlisted securities or listed securities for which there were no sales during the day are valued at the mean of the latest quoted bid and ask prices on such exchanges or markets.
Foreign equity securities are valued based on the closing price on the foreign exchange in which such securities are primarily traded. If any foreign equity security closing prices are not readily available, the securities are valued at the mean of the latest quoted bid and ask prices on such exchanges or markets. Foreign currency exchange rates are generally determined at 4:00 p.m. Eastern (U.S.) time. Many securities markets and exchanges outside the U.S. close prior to the close of the New York Stock Exchange; therefore, the closing prices for securities in such markets or on such exchanges may not fully reflect events that occur after such close but before the close of the New York Stock Exchange. In those situations, foreign securities will be fair valued pursuant to a policy adopted by the Board of Trustees, including, if available, utilizing a third party pricing service to determine these fair values. The third party pricing service takes into account multiple factors, including, but not limited to, movements in the U.S. securities markets, certain depositary receipts, futures contracts and foreign exchange rates that have occurred subsequent to the close of the foreign exchange or market, to determine a good faith estimate that reasonably reflects the current market conditions as of the close of the New York Stock Exchange. The fair value of a security is likely to be different from the quoted or published price, if available.
Investments in open-end investment companies, including money market funds, are valued at their latest net asset value.
Investments for which market quotations are not readily available, or that have quotations which management believes are not reflective of market value or reliable, are valued at fair value as determined in good faith under procedures approved by and under the general supervision of the Board of Trustees. If a security or class of securities (such as foreign securities) is valued at fair value, such value is likely to be different from the quoted or published price for the security.
The determination of fair value often requires significant judgment. To determine fair value, management may use assumptions including but not limited to future cash flows and estimated risk premiums. Multiple inputs from various sources may be used to determine fair value.
Columbia Mid Cap Growth Fund | Annual Report 2017
| 23 |
Notes to Financial Statements (continued)
August 31, 2017
GAAP requires disclosure regarding the inputs and valuation techniques used to measure fair value and any changes in valuation inputs or techniques. In addition, investments shall be disclosed by major category. This information is disclosed following the Fund’s Portfolio of Investments.
Security transactions
Security transactions are accounted for on the trade date. Cost is determined and gains (losses) are based upon the specific identification method for both financial statement and federal income tax purposes.
Income recognition
Corporate actions and dividend income are generally recorded net of any non-reclaimable tax withholdings, on the ex-dividend date or upon receipt of ex-dividend notification in the case of certain foreign securities.
The Fund may receive distributions from holdings in equity securities, business development companies (BDCs), exchange-traded funds (ETFs), limited partnerships (LPs), other regulated investment companies (RICs), and real estate investment trusts (REITs), which report information on the tax character of their distributions annually. These distributions are allocated to dividend income, capital gain and return of capital based on actual information reported. Return of capital is recorded as a reduction of the cost basis of securities held. If the Fund no longer owns the applicable securities, return of capital is recorded as a realized gain. With respect to REITs, to the extent actual information has not yet been reported, estimates for return of capital are made by the Fund’s management. Management’s estimates are subsequently adjusted when the actual character of the distributions is disclosed by the REITs, which could result in a proportionate change in return of capital to shareholders.
Awards from class action litigation are recorded as a reduction of cost basis if the Fund still owns the applicable securities on the payment date. If the Fund no longer owns the applicable securities, the proceeds are recorded as realized gains.
Expenses
General expenses of the Trust are allocated to the Fund and other funds of the Trust based upon relative net assets or other expense allocation methodologies determined by the nature of the expense. Expenses directly attributable to the Fund are charged to the Fund. Expenses directly attributable to a specific class of shares are charged to that share class.
Determination of class net asset value
All income, expenses (other than class-specific expenses, which are charged to that share class, as shown in the Statement of Operations) and realized and unrealized gains (losses) are allocated to each class of the Fund on a daily basis, based on the relative net assets of each class, for purposes of determining the net asset value of each class.
Federal income tax status
The Fund intends to qualify each year as a regulated investment company under Subchapter M of the Internal Revenue Code, as amended, and will distribute substantially all of its taxable income (including net short-term capital gains) and capital gains, if any, for its tax year, and as such will not be subject to federal income taxes. In addition, the Fund intends to distribute in each calendar year substantially all of its net investment income, capital gains and certain other amounts, if any, such that the Fund should not be subject to federal excise tax. Therefore, no federal income or excise tax provision is recorded.
Distributions to shareholders
Distributions from net investment income, if any, are declared and paid annually. Net realized capital gains, if any, are distributed along with the income distribution. Income distributions and capital gain distributions are determined in accordance with federal income tax regulations, which may differ from GAAP.
| 24 | Columbia Mid Cap Growth Fund | Annual Report 2017 |
Notes to Financial Statements (continued)
August 31, 2017
Guarantees and indemnifications
Under the Trust’s organizational documents and, in some cases, by contract, its officers and trustees are indemnified against certain liabilities arising out of the performance of their duties to the Trust or its funds. In addition, certain of the Fund’s contracts with its service providers contain general indemnification clauses. The Fund’s maximum exposure under these arrangements is unknown since the amount of any future claims that may be made against the Fund cannot be determined, and the Fund has no historical basis for predicting the likelihood of any such claims.
Recent accounting pronouncement
Accounting Standards Update 2017-08 Premium Amortization on Purchased Callable Debt Securities
In March 2017, the Financial Accounting Standards Board issued Accounting Standards Update (ASU) No. 2017-08 Premium Amortization on Purchased Callable Debt Securities. ASU No. 2017-08 updates the accounting standards to shorten the amortization period for certain purchased callable debt securities, held at a premium, to be amortized to the earliest call date. The update applies to securities with explicit, noncontingent call features that are callable at fixed prices and on preset dates. The standard is effective for annual periods beginning after December 15, 2018 and interim periods within those fiscal years. At this time, management is evaluating the implication of this guidance and the impact it will have on the financial statement amounts and footnote disclosures, if any.
Note 3. Fees and other transactions with affiliates
Management services fees
The Fund has entered into a Management Agreement with Columbia Management Investment Advisers, LLC (the Investment Manager), a wholly-owned subsidiary of Ameriprise Financial, Inc. (Ameriprise Financial). Under the Management Agreement, the Investment Manager provides the Fund with investment research and advice, as well as administrative and accounting services. The management services fee is an annual fee that is equal to a percentage of the Fund’s daily net assets that declines from 0.82% to 0.65% as the Fund’s net assets increase. The effective management services fee rate for the year ended August 31, 2017 was 0.75% of the Fund’s average daily net assets.
Compensation of board members
Members of the Board of Trustees, who are not officers or employees of the Investment Manager or Ameriprise Financial, are compensated for their services to the Fund as disclosed in the Statement of Operations. These members of the Board of Trustees may participate in a Deferred Compensation Plan (the Plan) which may be terminated at any time. Obligations of the Plan will be paid solely out of the Fund’s assets, and all amounts payable under the Plan constitute a general unsecured obligation of the Fund.
Compensation of Chief Compliance Officer
The Board of Trustees has appointed a Chief Compliance Officer to the Fund in accordance with federal securities regulations. A portion of the Chief Compliance Officer’s total compensation is allocated to the Fund, along with other affiliated funds governed by the Board of Trustees, based on relative net assets. The total amount allocated to all affiliated funds governed by the Board of Trustees will not exceed $40,000 annually.
Transfer agency fees
Under a Transfer and Dividend Disbursing Agent Agreement, Columbia Management Investment Services Corp. (the Transfer Agent), an affiliate of the Investment Manager and a wholly-owned subsidiary of Ameriprise Financial, is responsible for providing transfer agency services to the Fund. The Transfer Agent has contracted with Boston Financial Data Services (BFDS) to serve as sub-transfer agent. The Transfer Agent pays the fees of BFDS for services as sub-transfer agent and BFDS is not entitled to reimbursement for such fees from the Fund (with the exception of out-of-pocket fees).
The Fund pays the Transfer Agent a monthly transfer agency fee based on the number or the average value of accounts, depending on the type of account. In addition, prior to October 1, 2016, the Transfer Agent also received sub-transfer agency fees based on a percentage of the average aggregate value of the Fund’s shares maintained in omnibus accounts (other than omnibus accounts for which American Enterprise Investment Services Inc. is the broker of record or accounts where the
Columbia Mid Cap Growth Fund | Annual Report 2017
| 25 |
Notes to Financial Statements (continued)
August 31, 2017
beneficial shareholder is a customer of Ameriprise Financial Services, Inc., for which the Transfer Agent receives a per account fee). Effective October 1, 2016, the Fund pays the Transfer Agent a fee for shareholder services based on the number of accounts or on a percentage of the average aggregate value of the Fund’s shares maintained in omnibus accounts up to the lesser of the amount charged by the financial intermediary or a cap established by the Board of Trustees from time to time.
The Transfer Agent also receives compensation from the Fund for various shareholder services and reimbursements for certain out-of-pocket fees. Effective August 1, 2017, total transfer agency fees for Class K, Class R5 and Class Y shares are subject to an annual limitation of not more than 0.07%, 0.07% and 0.02%, respectively, of the average daily net assets attributable to each share class. From January 1, 2017 to July 31, 2017, these limitations were 0.075% for Class K and Class R5 shares and 0.025% for Class I and Class Y shares; and prior to January 1, 2017, the limitation was 0.05% for Class K and Class R5 shares and Class I and Class Y shares did not pay transfer agency fees.
For the year ended August 31, 2017, the Fund’s effective transfer agency fee rates as a percentage of average daily net assets of each class were as follows:
| | Effective rate (%) |
| Class A | 0.16 |
| Class B | 0.15 (a),(b) |
| Class C | 0.16 |
| Class K | 0.06 |
| Class R | 0.16 |
| Class R4 | 0.16 |
| Class R5 | 0.06 |
| Class T | 0.16 |
| Class V | 0.16 |
| Class Y | 0.01 |
| Class Z | 0.16 |
| (a) | Effective July 17, 2017, Class B shares were automatically converted to Class A shares. |
| (b) | Unannualized. |
The Fund and certain other associated investment companies have severally, but not jointly, guaranteed the performance and observance of all the terms and conditions of a lease entered into by Seligman Data Corp. (SDC), the former transfer agent, including the payment of rent by SDC (the Guaranty). SDC was the legacy Seligman funds’ former transfer agent.
The lease and the Guaranty expire in January 2019. At August 31, 2017, the Fund’s total potential future obligation over the life of the Guaranty is $57,993. The liability remaining at August 31, 2017 for non-recurring charges associated with the lease amounted to $29,889 and is recorded as a part of the payable for other expenses in the Statement of Assets and Liabilities. SDC is owned by six associated investment companies, including the Fund. The Fund’s ownership interest in SDC at August 31, 2017 is recorded as a part of other assets in the Statement of Assets and Liabilities at a cost of $2,199, which approximates the fair value of the ownership interest.
An annual minimum account balance fee of $20 may apply to certain accounts with a value below the applicable share class’s initial minimum investment requirements to reduce the impact of small accounts on transfer agency fees. These minimum account balance fees are remitted to the Fund and recorded as part of expense reductions in the Statement of Operations. For the year ended August 31, 2017, these minimum account balance fees reduced total expenses of the Fund by $6,086.
Plan administration fees
Under a Plan Administration Services Agreement with the Transfer Agent, the Fund pays an annual fee at a rate of 0.25% of the Fund’s average daily net assets attributable to Class K shares for the provision of various administrative, recordkeeping, communication and educational services.
| 26 | Columbia Mid Cap Growth Fund | Annual Report 2017 |
Notes to Financial Statements (continued)
August 31, 2017
Distribution and service fees
The Fund has entered into an agreement with Columbia Management Investment Distributors, Inc. (the Distributor), an affiliate of the Investment Manager and a wholly-owned subsidiary of Ameriprise Financial, for distribution and shareholder services. The Board of Trustees has approved, and the Fund has adopted, distribution and shareholder service plans (the Plans) applicable to certain share classes, which set the distribution and service fees for the Fund. These fees are calculated daily and are intended to compensate the Distributor and/or eligible selling and/or servicing agents for selling shares of the Fund and providing services to investors.
Under the Plans, the Fund pays a monthly service fee to the Distributor at the maximum annual rate of 0.25% of the average daily net assets attributable to Class A, Class B, Class C and Class T shares of the Fund. Also under the Plans, the Fund pays a monthly distribution fee to the Distributor at the maximum annual rates of 0.10%, 0.75%, 0.75%, 0.50% and 0.25% of the average daily net assets attributable to Class A, Class B, Class C, Class R and Class T shares of the Fund, respectively. As a result of all Class B shares of the Fund being redeemed or converted to Class A shares, August 4, 2017 was the last day the Fund paid a service fee or distribution fee for Class B shares.
Although the Fund may pay distribution and service fees up to a maximum annual rate of 0.35% of the Fund’s average daily net assets attributable to Class A shares (comprised of up to 0.10% for distribution services and up to 0.25% for shareholder liaison services), the Fund currently limits such fees to an aggregate fee of not more than 0.25% of the Fund’s average daily net assets attributable to Class A shares.
Although the Fund may pay a distribution fee up to 0.25% of the Fund’s average daily net assets attributable to Class T shares and a service fee of up to 0.25% of the Fund’s average daily net assets attributable to Class T shares, the aggregate fee shall not exceed 0.25% of the Fund’s average daily net assets attributable to Class T shares.
Shareholder services fees
The Fund has adopted a shareholder services plan that permits it to pay for certain services provided to Class V shareholders by their selling and/or servicing agents. The Fund may pay shareholder servicing fees up to an aggregate annual rate of 0.50% of the Fund’s average daily net assets attributable to Class V shares (comprised of up to 0.25% for shareholder liaison services and up to 0.25% for administrative support services). These fees are currently limited to an aggregate annual rate of not more than 0.25% of the Fund’s average daily net assets attributable to Class V shares.
Sales charges (unaudited)
Sales charges, including front-end charges and CDSCs, received by the Distributor for distributing Fund shares for the year ended August 31, 2017, if any, are listed below:
| | Amount ($) |
| Class A | 216,837 |
| Class B | 2 |
| Class C | 766 |
| Class V | 193 |
Columbia Mid Cap Growth Fund | Annual Report 2017
| 27 |
Notes to Financial Statements (continued)
August 31, 2017
Expenses waived/reimbursed by the Investment Manager and its affiliates
The Investment Manager and certain of its affiliates have contractually agreed to waive fees and/or reimburse expenses (excluding certain fees and expenses described below) for the period(s) disclosed below, unless sooner terminated at the sole discretion of the Board of Trustees, so that the Fund’s net operating expenses, after giving effect to fees waived/expenses reimbursed and any balance credits and/or overdraft charges from the Fund’s custodian, do not exceed the following annual rate(s) as a percentage of the class’ average daily net assets:
| | January 1, 2017
through
December 31, 2017 | Prior to
January 1, 2017 |
| Class A | 1.30% | 1.25% |
| Class C | 2.05 | 2.00 |
| Class K | 1.245 | 1.18 |
| Class R | 1.55 | 1.50 |
| Class R4 | 1.05 | 1.00 |
| Class R5 | 0.995 | 0.93 |
| Class T | 1.30 | 1.25 |
| Class V | 1.30 | 1.25 |
| Class Y | 0.945 | 0.88 |
| Class Z | 1.05 | 1.00 |
Under the agreement governing these fee waivers and/or expense reimbursement arrangements, the following fees and expenses are excluded from the waiver/reimbursement commitment, and therefore will be paid by the Fund, if applicable: taxes (including foreign transaction taxes), expenses associated with investments in affiliated and non-affiliated pooled investment vehicles (including mutual funds and exchange-traded funds), transaction costs and brokerage commissions, costs related to any securities lending program, dividend expenses associated with securities sold short, inverse floater program fees and expenses, transaction charges and interest on borrowed money, interest, infrequent and/or unusual expenses and any other expenses the exclusion of which is specifically approved by the Board of Trustees. This agreement may be modified or amended only with approval from the Investment Manager, certain of its affiliates and the Fund. Any fees waived and/or expenses reimbursed under the expense reimbursement arrangements described above are not recoverable by the Investment Manager or its affiliates in future periods.
Note 4. Federal tax information
The timing and character of income and capital gain distributions are determined in accordance with income tax regulations, which may differ from GAAP because of temporary or permanent book to tax differences.
At August 31, 2017, these differences are primarily due to differing treatment for deferral/reversal of wash sale losses, re-characterization of distributions for investments, trustees’ deferred compensation and net operating loss reclassification. To the extent these differences are permanent, reclassifications are made among the components of the Fund’s net assets in the Statement of Assets and Liabilities. Temporary differences do not require reclassifications.
In the Statement of Assets and Liabilities the following reclassifications were made:
Excess of distributions
over net investment
income ($) | Accumulated
net realized
gain ($) | Paid in
capital ($) |
| 5,398,133 | (5,398,133) | — |
Net investment income (loss) and net realized gains (losses), as disclosed in the Statement of Operations, and net assets were not affected by this reclassification.
| 28 | Columbia Mid Cap Growth Fund | Annual Report 2017 |
Notes to Financial Statements (continued)
August 31, 2017
| August 31, 2017 | August 31, 2016 |
Ordinary
income ($) | Long-term
capital gains ($) | Total ($) | Ordinary
income ($) | Long-term
capital gains ($) | Total ($) |
| 3,597,769 | 102,411,557 | 106,009,326 | 19,042,210 | 284,984,885 | 304,027,095 |
Short-term capital gain distributions, if any, are considered ordinary income distributions for tax purposes.
At August 31, 2017, the components of distributable earnings on a tax basis were as follows:
Undistributed
ordinary income ($) | Undistributed
long-term
capital gains ($) | Capital loss
carryforwards ($) | Net unrealized
appreciation ($) |
| 48,188,357 | 143,253,857 | — | 343,734,740 |
At August 31, 2017, the cost of all investments for federal income tax purposes along with the aggregate gross unrealized appreciation and depreciation based on that cost was:
Federal
tax cost ($) | Gross unrealized
appreciation ($) | Gross unrealized
(depreciation) ($) | Net unrealized
appreciation ($) |
| 1,491,295,080 | 357,598,271 | (13,863,531) | 343,734,740 |
Tax cost of investments and unrealized appreciation/(depreciation) may also include timing differences that do not constitute adjustments to tax basis.
Management of the Fund has concluded that there are no significant uncertain tax positions in the Fund that would require recognition in the financial statements. However, management’s conclusion may be subject to review and adjustment at a later date based on factors including, but not limited to, new tax laws, regulations, and administrative interpretations (including relevant court decisions). Generally, the Fund’s federal tax returns for the prior three fiscal years remain subject to examination by the Internal Revenue Service.
Note 5. Portfolio information
The cost of purchases and proceeds from sales of securities, excluding short-term investments and derivatives, if any, aggregated to $2,079,655,693 and $2,336,960,498, respectively, for the year ended August 31, 2017. The amount of purchase and sale activity impacts the portfolio turnover rate reported in the Financial Highlights.
Note 6. Affiliated money market fund
The Fund invests in Columbia Short-Term Cash Fund, an affiliated money market fund established for the exclusive use by the Fund and other affiliated funds (the Affiliated MMF). The income earned by the Fund from such investments is included as Dividends - affiliated issuers in the Statement of Operations. As an investing fund, the Fund indirectly bears its proportionate share of the expenses of the Affiliated MMF. Effective October 1, 2016, the Affiliated MMF prices its shares with a floating net asset value (NAV) and no longer seeks to maintain a stable NAV. In addition, the Board of Trustees of the Affiliated MMF may impose a fee on redemptions (sometimes referred to as a liquidity fee) or temporarily suspend redemptions (sometimes referred to as imposing a redemption gate) in the event its liquidity falls below regulatory limits.
Note 7. Line of credit
The Fund has access to a revolving credit facility with a syndicate of banks led by Citibank, N.A., HSBC Bank USA, N.A. and JPMorgan Chase Bank, N.A. whereby the Fund may borrow for the temporary funding of shareholder redemptions or for other temporary or emergency purposes. The credit facility, which is a collective agreement between the Fund and certain other funds managed by the Investment Manager, severally and not jointly, permits collective borrowings up to $1 billion. Interest is charged to each participating fund based on its borrowings at a rate equal to the higher of (i) the overnight federal funds rate plus 1.00% or (ii) the one-month LIBOR rate plus 1.00%. Each borrowing under the credit facility matures no later than 60 days after the date of borrowing. The Fund also pays a commitment fee equal to its pro rata share of the amount of the credit facility at a rate of 0.15% per annum. The commitment fee is included in other expenses in the Statement of Operations.
Columbia Mid Cap Growth Fund | Annual Report 2017
| 29 |
Notes to Financial Statements (continued)
August 31, 2017
The Fund had no borrowings during the year ended August 31, 2017.
Note 8. Significant risks
Shareholder concentration risk
At August 31, 2017, one unaffiliated shareholder of record owned 10.4% of the outstanding shares of the Fund in one or more accounts. The Fund has no knowledge about whether any portion of those shares was owned beneficially. Affiliated shareholders of record owned 32.2% of the outstanding shares of the Fund in one or more accounts. Subscription and redemption activity by concentrated accounts may have a significant effect on the operations of the Fund. In the case of a large redemption, the Fund may be forced to sell investments at inopportune times, including its liquid positions, which may result in Fund losses and the Fund holding a higher percentage of less liquid positions. Large redemptions could result in decreased economies of scale and increased operating expenses for non-redeeming Fund shareholders.
Technology and technology-related investment risk
The Fund may be more susceptible to the particular risks that may affect companies in the information technology sector, as well as other technology-related sectors (collectively, the technology sectors) than if it were invested in a wider variety of companies in unrelated sectors. Companies in the technology sectors are subject to certain risks, including the risk that new services, equipment or technologies will not be accepted by consumers and businesses or will become rapidly obsolete. Performance of such companies may be affected by factors including obtaining and protecting patents (or the failure to do so) and significant competitive pressures, including aggressive pricing of their products or services, new market entrants, competition for market share and short product cycles due to an accelerated rate of technological developments. Such competitive pressures may lead to limited earnings and/or falling profit margins. As a result, the value of their securities may fall or fail to rise. In addition, many technology sector companies have limited operating histories and prices of these companies’ securities historically have been more volatile than other securities, especially over the short term.
Note 9. Subsequent events
Management has evaluated the events and transactions that have occurred through the date the financial statements were issued. Other than as noted in Note 1 above, there were no items requiring adjustment of the financial statements or additional disclosure.
Note 10. Information regarding pending and settled legal proceedings
Ameriprise Financial and certain of its affiliates have historically been involved in a number of legal, arbitration and regulatory proceedings, including routine litigation, class actions, and governmental actions, concerning matters arising in connection with the conduct of their business activities. Ameriprise Financial believes that the Fund is not currently the subject of, and that neither Ameriprise Financial nor any of its affiliates are the subject of, any pending legal, arbitration or regulatory proceedings that are likely to have a material adverse effect on the Fund or the ability of Ameriprise Financial or its affiliates to perform under their contracts with the Fund. Ameriprise Financial is required to make quarterly (10-Q), annual (10-K) and, as necessary, 8-K filings with the Securities and Exchange Commission (SEC) on legal and regulatory matters that relate to Ameriprise Financial and its affiliates. Copies of these filings may be obtained by accessing the SEC website at www.sec.gov.
There can be no assurance that these matters, or the adverse publicity associated with them, will not result in increased Fund redemptions, reduced sale of Fund shares or other adverse consequences to the Fund. Further, although we believe proceedings are not likely to have a material adverse effect on the Fund or the ability of Ameriprise Financial or its affiliates to perform under their contracts with the Fund, these proceedings are subject to uncertainties and, as such, we are unable to estimate the possible loss or range of loss that may result. An adverse outcome in one or more of these proceedings could result in adverse judgments, settlements, fines, penalties or other relief that could have a material adverse effect on the consolidated financial condition or results of operations of Ameriprise Financial.
| 30 | Columbia Mid Cap Growth Fund | Annual Report 2017 |
Report of Independent Registered Public Accounting Firm
To the Trustees of Columbia Funds Series Trust I and the Shareholders of Columbia Mid Cap Growth Fund
In our opinion, the accompanying statement of assets and liabilities, including the portfolio of investments, and the related statements of operations and of changes in net assets and the financial highlights present fairly, in all material respects, the financial position of Columbia Mid Cap Growth Fund (the “Fund”, a series of Columbia Funds Series Trust I) as of August 31, 2017, the results of its operations for the year then ended, the changes in its net assets for each of the two years in the period then ended and the financial highlights for each of the five years in the period then ended, in conformity with accounting principles generally accepted in the United States of America. These financial statements and financial highlights (hereafter referred to as “financial statements”) are the responsibility of the Fund’s management. Our responsibility is to express an opinion on these financial statements based on our audits. We conducted our audits of these financial statements in accordance with the standards of the Public Company Accounting Oversight Board (United States). Those standards require that we plan and perform the audit to obtain reasonable assurance about whether the financial statements are free of material misstatement. An audit includes examining, on a test basis, evidence supporting the amounts and disclosures in the financial statements, assessing the accounting principles used and significant estimates made by management, and evaluating the overall financial statement presentation. We believe that our audits, which included confirmation of securities as of August 31, 2017 by correspondence with the custodian, brokers and transfer agent, provide a reasonable basis for our opinion.
/s/ PricewaterhouseCoopers LLP
Minneapolis, MN
October 20, 2017
Columbia Mid Cap Growth Fund | Annual Report 2017
| 31 |
Federal Income Tax Information
(Unaudited)
The Fund hereby designates the following tax attributes for the fiscal year ended August 31, 2017. Shareholders will be notified in early 2018 of the amounts for use in preparing 2017 income tax returns.
Qualified
dividend
income | Dividends
received
deduction | Capital
gain
dividend |
| 24.52% | 23.83% | $185,931,794 |
Qualified dividend income. For taxable, non-corporate shareholders, the percentage of ordinary income distributed during the fiscal year that represents qualified dividend income subject to reduced tax rates.
Dividends received deduction. The percentage of ordinary income distributed during the fiscal year that qualifies for the corporate dividends received deduction.
Capital gain dividend. The Fund designates as a capital gain dividend the amount reflected above, or if subsequently determined to be different, the net capital gain of such fiscal period.
| 32 | Columbia Mid Cap Growth Fund | Annual Report 2017 |
Shareholders elect the Board that oversees the Fund’s operations. The Board appoints officers who are responsible for day-to-day business decisions based on policies set by the Board. The following table provides basic biographical information about the Fund’s Trustees, including their principal occupations during the past five years, although specific titles for individuals may have varied over the period. The year set forth beneath Length of Service in the table below is the year in which the Trustee was first appointed or elected as Trustee to any Fund currently in the Columbia Funds Complex or a predecessor thereof. Under current Board policy, members serve terms of indefinite duration.
Independent trustees
| Name, address, year of birth | Position held with the Trust and length of service | Principal occupation(s) during the past five years and other relevant professional experience | Number of Funds in the Columbia Fund Complex overseen | Other directorships held by Trustee during the past five years |
Janet Langford Carrig
c/o Columbia Management
Investment Advisers, LLC
225 Franklin Street
Mail Drop BX32 05228
Boston, MA 02110
1957 | Trustee
1996 | Senior Vice President, General Counsel and Corporate Secretary, ConocoPhillips (independent energy company) since September 2007 | 57 | None |
Douglas A. Hacker
c/o Columbia Management
Investment Advisers, LLC
225 Franklin Street
Mail Drop BX32 05228
Boston, MA 02110
1955 | Trustee and Chairman of the Board
1996 | Independent business executive since May 2006; Executive Vice President — Strategy of United Airlines from December 2002 to May 2006; President of UAL Loyalty Services (airline marketing company) from September 2001 to December 2002; Executive Vice President and Chief Financial Officer of United Airlines from July 1999 to September 2001 | 57 | Spartan Nash Company, (food distributor); Nash Finch Company (food distributor) from 2005 to 2013; Aircastle Limited (aircraft leasing); SeaCube Container Leasing Ltd. (container leasing) from 2010 to 2013; and Travelport Worldwide Limited (travel information technology) |
Nancy T. Lukitsh
c/o Columbia Management
Investment Advisers, LLC
225 Franklin Street
Mail Drop BX32 05228
Boston, MA 02110
1956 | Trustee
2011 | Senior Vice President, Partner and Director of Marketing, Wellington Management Company, LLP (investment adviser) from 1997 to 2010; Chair, Wellington Management Portfolios (commingled non-U.S. investment pools) from 2007 to 2010; Director, Wellington Trust Company, NA and other Wellington affiliates from 1997 to 2010 | 57 | None |
David M. Moffett
c/o Columbia Management
Investment Advisers, LLC
225 Franklin Street
Mail Drop BX32 05228
Boston, MA 02110
1952 | Trustee
2011 | Retired. Consultant to Bridgewater and Associates | 57 | Director, CSX Corporation; Genworth Financial, Inc. (financial and insurance products and services); PayPal Holdings Inc. (payment and data processing services); Trustee, University of Oklahoma Foundation; former Director, eBay Inc. (online trading community), 2007-2015; and former Director, CIT Bank, CIT Group Inc. (commercial and consumer finance), 2010-2016 |
Columbia Mid Cap Growth Fund | Annual Report 2017
| 33 |
TRUSTEES AND OFFICERS (continued)
Independent trustees (continued)
| Name, address, year of birth | Position held with the Trust and length of service | Principal occupation(s) during the past five years and other relevant professional experience | Number of Funds in the Columbia Fund Complex overseen | Other directorships held by Trustee during the past five years |
Charles R. Nelson
c/o Columbia Management
Investment Advisers, LLC
225 Franklin Street
Mail Drop BX32 05228
Boston, MA 02110
1942 | Trustee
1981 | Retired. Professor Emeritus, University of Washington since 2011; Professor of Economics, University of Washington from 1976 to 2011; Ford and Louisa Van Voorhis Professor of Political Economy, University of Washington from 1993 to 2011; Adjunct Professor of Statistics, University of Washington from 1980 to 2011; Associate Editor, Journal of Money, Credit and Banking from September 1993 to 2008; consultant on econometric and statistical matters | 57 | None |
John J. Neuhauser
c/o Columbia Management
Investment Advisers, LLC
225 Franklin Street
Mail Drop BX32 05228
Boston, MA 02110
1943 | Trustee
1984 | President, Saint Michael’s College since August 2007; Director or Trustee of several non-profit organizations, including University of Vermont Medical Center; Academic Vice President and Dean of Faculties, Boston College from August 1999 to October 2005; University Professor, Boston College from November 2005 to August 2007 | 57 | Liberty All-Star Equity Fund and Liberty All- Star Growth Fund (closed-end funds) |
Patrick J. Simpson
c/o Columbia Management
Investment Advisers, LLC
225 Franklin Street
Mail Drop BX32 05228
Boston, MA 02110
1944 | Trustee
2000 | Of Counsel, Perkins Coie LLP (law firm) since 2015; Partner, Perkins Coie LLP from 1988 to 2014 | 57 | None |
Anne-Lee Verville
c/o Columbia Management
Investment Advisers, LLC
225 Franklin Street
Mail Drop BX32 05228
Boston, MA 02110
1945 | Trustee
1998 | Retired. General Manager, Global Education Industry from 1994 to 1997, President – Application Systems Division from 1991 to 1994, Chief Financial Officer – US Marketing & Services from 1988 to 1991, and Chief Information Officer from 1987 to 1988, IBM Corporation (computer and technology) | 57 | Enesco Group, Inc. (producer of giftware and home and garden decor products) from 2001 to 2006 |
| 34 | Columbia Mid Cap Growth Fund | Annual Report 2017 |
TRUSTEES AND OFFICERS (continued)
Consultants to the Independent Trustees*
| Name, address, year of birth | Position held with the Trust and length of service | Principal occupation(s) during the past five years and other relevant professional experience | Number of Funds in the Columbia Funds complex overseen | Other directorships held by Trustee during the past five years |
J. Kevin Connaughton
c/o Columbia
Management Investment
Advisers, LLC,
225 Franklin Street
Mail Drop BX32 05228,
Boston, MA 02110
1964 | Independent Trustee Consultant
2016 | Independent Trustee Consultant, Columbia Funds since March 2016; Managing Director and General Manager of Mutual Fund Products, Columbia Management Investment Advisers, LLC from May 2010 to February 2015; President, Columbia Funds from 2009 to 2015; and senior officer of Columbia Funds and affiliated funds from 2003 to 2015 | 57 | Board of Governors, Gateway Healthcare since January 2016; Trustee, New Century Portfolios since March 2015; and Director, The Autism Project since March 2015 |
Natalie A. Trunow
c/o Columbia
Management Investment
Advisers, LLC,
225 Franklin Street
Mail Drop BX32 05228,
Boston, MA 02110
1967 | Independent Trustee Consultant
2016 | Independent Trustee Consultant, Columbia Funds since September 2016; Chief Executive Officer, Millennial Partners (investment consulting services to institutions) since January 2016; Director of Investments, Casey Family Programs from April 2016 to September 2016; Senior Vice President and Chief Investment Officer, Calvert Investments from August 2008 to January 2016; Section Head and Portfolio Manager, General Motors Asset Management from June 1997 to August 2008 | 57 | Healthcare Services for Children with Special Needs |
| * | J. Kevin Connaughton was appointed consultant to the Independent Trustees effective March 1, 2016. Natalie A. Trunow was appointed consultant to the Independent Trustees effective September 1, 2016. Shareholders of the Funds are expected to be asked to elect each of Mr. Connaughton and Ms. Trunow as a Trustee at a future shareholder meeting. |
Interested trustee affiliated with Investment Manager*
| Name, address, year of birth | Position held with the Trust and length of service | Principal occupation(s) during the past five years and other relevant professional experience | Number of Funds in the Columbia Funds Complex overseen | Other directorships held by Trustee during the past five years |
William F. Truscott
c/o Columbia Management
Investment Advisers, LLC
225 Franklin Street
Boston, MA 02110
1960 | Trustee
2012 | Chairman of the Board and President, Columbia Management Investment Advisers, LLC since May 2010 and February 2012, respectively; Chief Executive Officer, Global Asset Management, Ameriprise Financial, Inc. since September 2012 (previously Chief Executive Officer, U.S. Asset Management & President, Annuities, May 2010-September 2012); Director and Chief Executive Officer, Columbia Management Investment Distributors, Inc. since May 2010 and February 2012, respectively; Chairman of the Board and Chief Executive Officer, RiverSource Distributors, Inc. since 2006; Director, Threadneedle Asset Management Holdings, SARL since 2014; President and Chief Executive Officer, Ameriprise Certificate Company, 2006-August 2012 | 179 | Chairman of the Board, Columbia Management Investment Advisers, LLC since May 2010; Director, Columbia Management Investment Distributors, Inc. since May 2010; former Director, Ameriprise Certificate Company, 2006 - January 2013 |
| * | Interested person (as defined under the 1940 Act) by reason of being an officer, director, security holder and/or employee of the Investment Manager or Ameriprise Financial. |
The Statement of Additional Information has additional information about the Fund’s Board members and is available,
without charge, upon request by calling 800.345.6611, contacting your financial intermediary or visiting
investor.columbiathreadneedleus.com.
Columbia Mid Cap Growth Fund | Annual Report 2017
| 35 |
TRUSTEES AND OFFICERS (continued)
The Board has appointed officers who are responsible for day-to-day business decisions based on policies it has established. The officers serve at the pleasure of the Board. The following table provides basic information about the Officers of the Fund, including principal occupations during the past five years, although their specific titles may have varied over the period. In addition to Mr. Truscott, who is Senior Vice President, the Fund’s other officers are:
Fund officers
Name,
address and
year of birth | Position and year
first appointed to
position for any Fund
in the Columbia
Funds complex or a
predecessor thereof | Principal occupation(s) during past five years |
Christopher O. Petersen
5228 Ameriprise
Financial Center
Minneapolis, MN 55474
Born 1970 | President and Principal Executive Officer (2015) | Vice President and Lead Chief Counsel, Ameriprise Financial, Inc. since January 2015 (previously, Vice President and Chief Counsel, January 2010 - December 2014; officer of Columbia Funds and affiliated funds since 2007. |
Michael G. Clarke
225 Franklin Street
Boston, MA 02110
Born 1969 | Treasurer (2011), Chief Financial Officer (2009) and Chief Accounting Officer (2015) | Vice President — Mutual Fund Administration, Columbia Management Investment Advisers, LLC, since May 2010; senior officer of Columbia Funds and affiliated funds since 2002. |
Paul B. Goucher
100 Park Avenue
New York, NY 10017
Born 1968 | Senior Vice President (2011) and Assistant Secretary (2008) | Senior Vice President and Assistant General Counsel, Ameriprise Financial, Inc. since January 2017 (previously Vice President and Lead Chief Counsel, November 2008 - January 2017 and January 2013 - January 2017, respectively; and Chief Counsel, January 2010 - January 2013); Vice President, Chief Legal Officer and Assistant Secretary, Columbia Management Investment Advisers, LLC since May 2010. |
Thomas P. McGuire
225 Franklin Street
Boston, MA 02110
Born 1972 | Senior Vice President and Chief Compliance Officer (2012) | Vice President — Asset Management Compliance, Ameriprise Financial, Inc., since May 2010; Chief Compliance Officer, Ameriprise Certificate Company since September 2010. |
Colin Moore
225 Franklin Street
Boston, MA 02110
Born 1958 | Senior Vice President (2010) | Executive Vice President and Global Chief Investment Officer, Ameriprise Financial, Inc., since July 2013; Executive Vice President and Global Chief Investment Officer, Columbia Management Investment Advisers, LLC since July 2013 (previously Director and Global Chief Investment Officer, 2010 - 2013). |
Ryan C. Larrenaga
225 Franklin Street
Boston, MA 02110
Born 1970 | Senior Vice President (2017), Chief Legal Officer (2017) and Secretary (2015) | Vice President and Group Counsel, Ameriprise Financial, Inc. since August 2011; officer of Columbia Funds and affiliated funds since 2005. |
Michael E. DeFao
225 Franklin Street
Boston, MA 02110
Born 1968 | Vice President (2011) and Assistant Secretary (2010) | Vice President and Chief Counsel, Ameriprise Financial, Inc. since May 2010. |
Amy Johnson
5228 Ameriprise
Financial Center
Minneapolis, MN 55474
Born 1965 | Vice President (2006) | Managing Director and Global Head of Operations, Columbia Management Investment Advisers, LLC since April 2016 (previously Managing Director and Chief Operating Officer, 2010 - 2016). |
Lyn Kephart-Strong
5228 Ameriprise
Financial Center
Minneapolis, MN 55474
Born 1960 | Vice President (2015) | President, Columbia Management Investment Services Corp. since October 2014; Vice President & Resolution Officer, Ameriprise Trust Company since August 2009. |
| 36 | Columbia Mid Cap Growth Fund | Annual Report 2017 |
Board Consideration and Approval of Management
Agreement
On June 14, 2017, the Board of Trustees (the Board) and the Trustees who are not interested persons (as defined in the Investment Company Act of 1940) (the Independent Trustees) of Columbia Funds Series Trust I (the Trust) unanimously approved the continuation of the Management Agreement (the Management Agreement) with Columbia Management Investment Advisers, LLC (the Investment Manager) with respect to Columbia Mid Cap Growth Fund (the Fund), a series of the Trust. As detailed below, the Board’s Advisory Fees and Expenses Committee (the Committee) and the Board met on multiple occasions to review and discuss, both among themselves and with the management team of the Investment Manager, materials provided by the Investment Manager and others before determining to approve the continuation of the Management Agreement.
In connection with their deliberations regarding the continuation of the Management Agreement, the Committee and the Board evaluated materials requested from the Investment Manager regarding the Fund and the Management Agreement, and discussed these materials with representatives of the Investment Manager at Committee meetings held on March 27, 2017, April 26, 2017 and June 13, 2017 and at Board meetings held on March 28, 2017 and June 14, 2017. In addition, the Board considers matters bearing on the Management Agreement at most of its other meetings throughout the year and meets regularly with senior management of the Trust and the Investment Manager. Through the Board’s Investment Oversight Committees, Trustees also meet with selected portfolio managers of the funds the Trustees oversee and other investment personnel at various times throughout the year. The Committee and the Board also consulted with its independent fee consultant, Fund counsel and the Independent Trustees’ independent legal counsel, who advised on various matters with respect to the Committee’s and the Board’s considerations and otherwise assisted the Committee and the Board in their deliberations. On June 13, 2017, the Committee recommended that the Board approve the continuation of the Management Agreement. On June 14, 2017, the Board, including the Independent Trustees, voting separately, unanimously approved the continuation of the Management Agreement for the Fund.
The Committee and the Board considered all information that they, their legal counsel or the Investment Manager believed reasonably necessary to evaluate and to determine whether to recommend for approval or approve the continuation of the Management Agreement. The information and factors considered by the Committee and the Board in recommending for approval or approving the continuation of the Management Agreement for the Fund included the following:
| • | Information on the investment performance of the Fund relative to the performance of a group of mutual funds determined to be comparable to the Fund by an independent third-party data provider, as well as performance relative to benchmarks; |
| • | Information on the Fund’s management fees and total expenses, including information comparing the Fund’s expenses to those of a group of comparable mutual funds, as determined by the independent third-party data provider; |
| • | The Investment Manager’s agreement to contractually limit or cap total operating expenses for the Fund through December 31, 2018 so that total operating expenses (excluding certain fees and expenses, such as transaction costs and certain other investment related expenses, interest, taxes, acquired fund fees and expenses, and infrequent and/or unusual expenses) would not exceed a specified annual rate, as a percentage of the Fund’s net assets; |
| • | The terms and conditions of the Management Agreement; |
| • | The current and proposed terms and conditions of other agreements and arrangements with affiliates of the Investment Manager relating to the operations of the Fund, including agreements with respect to the provision of distribution, transfer agency and shareholder services to the Fund; |
| • | Descriptions of various functions performed by the Investment Manager under the Management Agreement, including portfolio management and portfolio trading practices; |
| • | Information regarding the management fees of similarly-managed portfolios of other clients of the Investment Manager, including institutional separate accounts; |
| • | Information regarding the reputation, regulatory history and resources of the Investment Manager, including information regarding senior management, portfolio managers and other personnel; |
Columbia Mid Cap Growth Fund | Annual Report 2017
| 37 |
Board Consideration and Approval of Management
Agreement (continued)
| • | Information regarding the capabilities of the Investment Manager with respect to compliance monitoring services, including an assessment of the Investment Manager’s compliance system by the Fund’s Chief Compliance Officer; and |
| • | The profitability to the Investment Manager and its affiliates from their relationships with the Fund. |
Nature, extent and quality of services provided under the Management Agreement
The Committee and the Board considered the nature, extent and quality of services provided to the Fund by the Investment Manager and its affiliates under the Management Agreement and under separate agreements for the provision of transfer agency and shareholder services, and the resources dedicated to the Fund and the other Columbia Funds by the Investment Manager and its affiliates. The Committee and the Board considered, among other things, the Investment Manager’s ability to attract, motivate and retain highly qualified research, advisory and supervisory investment professionals (including compensation programs for personnel involved in fund management, reputation and other attributes), the portfolio management services provided by those investment professionals, and the quality of the Investment Manager’s investment research capabilities and trade execution services. The Committee and the Board also considered the potential benefits to shareholders of investing in a mutual fund that is part of a fund complex offering exposure to a variety of asset classes and investment disciplines and providing a variety of fund and shareholder services.
The Committee and the Board also considered the professional experience and qualifications of the senior personnel of the Investment Manager, which included consideration of the Investment Manager’s experience with similarly-structured funds. The Committee and the Board noted the compliance programs of and the compliance-related resources provided to the Fund by the Investment Manager and its affiliates, and considered the Investment Manager’s ability to provide administrative services to the Fund and coordinate the activities of the Fund’s other service providers. After reviewing these and related factors, the Committee and the Board concluded, within the context of their overall conclusions, that the nature, extent and quality of the services provided to the Fund under the Management Agreement supported the continuation of the Management Agreement.
Investment performance
The Committee and the Board reviewed information about the performance of the Fund over various time periods, including performance information relative to benchmarks and information that compared the performance of the Fund to the performance of a group of comparable mutual funds as determined by the independent third-party data provider, and data provided by the independent fee consultant. The Committee and the Board also reviewed a description of the third party’s methodology for identifying the Fund’s peer groups for purposes of performance and expense comparisons. Although the Fund’s performance lagged that of a relevant peer group for certain (although not necessarily all) periods, the Committee and the Board concluded that other factors relevant to performance were sufficient, in light of other considerations, to warrant continuation of the Management Agreement. Those factors included one or more of the following: (i) that the Fund’s performance, although lagging in certain recent periods, was stronger over the longer term; (ii) that the underperformance was attributable, to a significant extent, to investment decisions that were reasonable and consistent with the Fund’s investment strategy and policies and that the Fund was performing within a reasonable range of expectations, given those investment decisions, market conditions and the Fund’s investment strategy; (iii) that the Fund’s performance was competitive when compared to other relevant performance benchmarks or peer groups; and (iv) that the Investment Manager had taken or was taking steps designed to help improve the Fund’s investment performance, including, but not limited to, replacing portfolio managers, enhancing the resources supporting the portfolio managers, or modifying investment strategies.
The Committee and the Board noted that, through December 31, 2016, the Fund’s performance was in the eighty-eighth, thirtieth and seventy-seventh percentile (where the best performance would be in the first percentile) of its category selected by the independent third-party data provider for the purposes of performance comparisons for the one-, three- and five-year periods, respectively.
The Committee and the Board also considered the Investment Manager’s performance and reputation generally, the Investment Manager’s historical responsiveness to Board concerns about performance, and the Investment Manager’s willingness to take steps intended to improve performance. After reviewing these and related factors, the Committee and the Board concluded, within the context of their overall conclusions, that the performance of the Fund and the Investment Manager was sufficient, in light of other considerations, to warrant the continuation of the Management Agreement.
| 38 | Columbia Mid Cap Growth Fund | Annual Report 2017 |
Board Consideration and Approval of Management
Agreement (continued)
Investment management fee rates and other expenses
The Committee and the Board considered the management fees charged to the Fund under the Management Agreement as well as the total expenses incurred by the Fund. In assessing the reasonableness of the fees under the Management Agreement, the Committee and the Board considered, among other information, the Fund’s total expense ratio as a percentage of average daily net assets. The Committee and the Board considered data provided by the independent third-party data provider and the independent fee consultant. The Committee and the Board noted that, as of December 31, 2016, the Fund’s actual management fee and net total expense ratio are ranked in the third and second quintiles, respectively, (where the lowest fees and expenses would be in the first quintile) against the Fund’s expense universe as determined by the independent third-party data provider for purposes of expense comparison. The Committee and the Board also took into account the fee waiver and expense limitation arrangements agreed to by the Investment Manager, as noted above.
The Committee and the Board also received and considered information about the management fees charged by the Investment Manager to institutional separate accounts. In considering the fees charged to those accounts, the Committee and the Board took into account, among other things, the Investment Manager’s representations about the differences between managing mutual funds as compared to other types of accounts, including differences in the services provided, differences in the risk profile of such business for the Investment Manager and the additional resources required to manage mutual funds effectively. The Committee and the Board also received and considered information about the fees charged by the Investment Manager for sub-advisory services it provides to comparable unaffiliated funds. In evaluating the Fund’s management fees, the Committee and the Board also took into account the demands, complexity and quality of the investment management of the Fund.
After reviewing these and related factors, the Committee and the Board concluded, within the context of their overall conclusions, that the management fee rates and expenses of the Fund, in light of other considerations, warranted the continuation of the Management Agreement.
Costs of services provided and profitability
The Committee and the Board also took note of the costs the Investment Manager and its affiliates incur in connection with the services provided and the profitability to the Investment Manager and its affiliates from their relationships with the Fund.
The Committee and the Board also considered the compensation directly or indirectly received by the Investment Manager’s affiliates in connection with their relationships with the Fund. The Committee and the Board reviewed information provided by management as to the profitability to the Investment Manager and its affiliates of their relationships with the Fund, information about the allocation of expenses used to calculate profitability, and comparisons of profitability levels realized in 2016 to profitability levels realized in 2015. When reviewing profitability, the Committee and the Board also considered court cases in which adviser profitability was an issue in whole or in part, the performance of similarly managed funds, the performance of the Fund, and the expense ratio of the Fund. In addition, the Committee and the Board considered information provided by the Investment Manager regarding the Investment Manager’s financial condition and comparing its profitability to that of other asset management firms that are, or are subsidiaries of, publicly traded companies. In this regard, the Committee and the Board also considered data provided by the independent fee consultant.
After reviewing these and related factors, the Committee and the Board concluded, within the context of their overall conclusions, that the costs of services provided and the profitability to the Investment Manager and its affiliates from their relationships with the Fund supported the continuation of the Management Agreement.
Economies of scale
The Committee and the Board considered the potential existence of economies of scale in the provision by the Investment Manager of services to the Fund, to groups of related funds, and to the Investment Manager’s investment advisory clients as a whole, and whether those economies of scale were shared with the Fund through breakpoints in investment management fees or other means, such as expense limitation arrangements and additional investments by the Investment Manager in investment, trading, compliance and other resources. The Committee and the Board noted that the management fee schedules for the Fund contained breakpoints that would reduce the fee rate on assets above specified threshold levels.
Columbia Mid Cap Growth Fund | Annual Report 2017
| 39 |
Board Consideration and Approval of Management
Agreement (continued)
In considering these matters, the Committee and the Board also considered the costs of the services provided and the profitability to the Investment Manager and its affiliates from their relationships with the Fund, as discussed above. After reviewing these and related factors, the Committee and the Board concluded, within the context of their overall conclusions, that the extent to which any economies of scale were expected to be shared with the Fund supported the continuation of the Management Agreement.
Other benefits to the Investment Manager
The Committee and the Board received and considered information regarding “fall-out” or ancillary benefits received by the Investment Manager and its affiliates as a result of their relationships with the Fund, such as the engagement of the Investment Manager’s affiliates to provide distribution, transfer agency and shareholder services to the Fund. In this regard, among other matters, the Committee and the Board considered that the Fund’s distributor retains a portion of the distribution fees from the Fund and receives a portion of the sales charges on sales or redemptions of certain classes of shares of the Fund. The Committee and the Board also considered the benefits of research made available to the Investment Manager by reason of brokerage commissions generated by the Fund’s securities transactions, and reviewed information about the Investment Manager’s practices with respect to allocating portfolio transactions for brokerage and research services. The Committee and the Board recognized that the Investment Manager’s profitability would be somewhat lower without these benefits.
Conclusion
The Committee and the Board reviewed all of the above considerations in reaching their decisions to recommend or approve the continuation of the Management Agreement. In their deliberations, the Trustees did not identify any particular information that was all-important or controlling, and individual Trustees may have attributed different weights to the various factors. Based on their evaluation of all factors that they deemed to be material, including those factors described above, and assisted by the advice of independent legal counsel, the Board, including the Independent Trustees, voting separately, unanimously approved the continuation of the Management Agreement.
| 40 | Columbia Mid Cap Growth Fund | Annual Report 2017 |
The Fund mails one shareholder report to each shareholder address. If you would like more than one report, please call shareholder services at 800.345.6611 and additional reports will be sent to you.
Proxy voting policies and procedures
The policy of the Board of Trustees is to vote the proxies of the companies in which the Fund holds investments consistent with the procedures as stated in the Statement of Additional Information (SAI). You may obtain a copy of the SAI without charge by calling 800.345.6611; contacting your financial intermediary; visiting investor.columbiathreadneedleus.com; or searching the website of the Securities and Exchange Commission (SEC) at sec.gov. Information regarding how the Fund voted proxies relating to portfolio securities is filed with the SEC by August 31st for the most recent 12-month period ending June 30th of that year, and is available without charge by visiting investor.columbiathreadneedleus.com, or searching the website of the SEC at sec.gov.
Quarterly schedule of investments
The Fund files a complete schedule of portfolio holdings with the SEC for the first and third quarters of each fiscal year on Form N-Q. The Fund’s Form N-Q is available on the SEC’s website at sec.gov and may be reviewed and copied at the SEC’s Public Reference Room in Washington, D.C. Information on the operation of the Public Reference Room may be obtained by calling 800.SEC.0330. The Fund’s complete schedule of portfolio holdings, as filed on Form N-Q, can also be obtained without charge, upon request, by calling 800.345.6611.
Additional Fund information
For more information about the Fund, please visit investor.columbiathreadneedleus.com or call 800.345.6611. Customer Service Representatives are available to answer your questions Monday through Friday from 8 a.m. to 7 p.m. Eastern time.
Fund investment manager
Columbia Management Investment Advisers, LLC
225 Franklin Street
Boston, MA 02110
Fund distributor
Columbia Management Investment Distributors, Inc.
225 Franklin Street
Boston, MA 02110
Fund transfer agent
Columbia Management Investment Services Corp.
P.O. Box 8081
Boston, MA 02266-8081
Columbia Mid Cap Growth Fund | Annual Report 2017
| 41 |
Columbia Mid Cap Growth Fund
P.O. Box 8081
Boston, MA 02266-8081
Please read and consider the investment objectives, risks, charges and expenses for any fund carefully before investing. For a prospectus and summary prospectus, which contains this and other important information about the Fund, go to
investor.columbiathreadneedleus.com. The Fund is distributed by Columbia Management Investment Distributors, Inc., member FINRA, and managed by Columbia Management Investment Advisers, LLC.
Columbia Threadneedle Investments (Columbia Threadneedle) is the global brand name of the Columbia and Threadneedle group of companies. All rights reserved. Columbia Management Investment Distributors, Inc., 225 Franklin Street, Boston, MA 02110-2804
© 2017 Columbia Management Investment Advisers, LLC.
investor.columbiathreadneedleus.com

Annual Report
August 31, 2017
Columbia Disciplined Small Core Fund
Not FDIC Insured • No bank guarantee • May lose value
Dear Shareholders,
The current outlook for financial markets is clouded by two primary concerns: the high valuation of equities and the direction of interest rates. Following the U.S. presidential election, U.S. equities rallied based on the assumption that the new administration’s policies would stimulate growth quickly. Unfortunately it’s unclear whether those measures will get passed, much less passed quickly. In fixed income, uncertainty stems from the possibility that interest rates won’t rise as rapidly as expected if the administration’s proposed growth policies are not implemented.
Given this uncertainty, investors value a consistent approach more than ever. Investors want strong, repeatable risk-adjusted returns. Consistency — not surprises. As a leading global asset manager, we believe our consistent, collaborative investment approach enables us to deliver the dependable experience your portfolio demands. So, how do we strive to deliver a consistent investment experience?
Better insights
Your portfolio benefits from the investment insights uncovered by our talented investment teams around the world.
Better decisions
Our collaborative, interactive environment enables our investment teams to construct portfolios that take advantage of the best investment ideas.
Better outcomes
We aim to deliver a consistent experience, which means fewer surprises, dependable insights, and products designed to do the thing you want.
Whether you’re trying to save money to help your children go to college or for your own retirement, it’s the consistency of the return that is most essential. People who chase higher returns are usually also the first to sell when that investment goes through a bad patch. We try to combat this behavioral tendency by offering strategies that aim for a more consistent return. Our goal is for investors to panic less during periods of volatility, which can have a significant effect on their long-term results.
Nothing is more important to us than making sure those who have entrusted us to protect and grow their assets can do what matters most to them: build a nest egg, leave a legacy, and live confidently — now and throughout retirement. It’s why our talented professionals around the world work together to uncover uncommon opportunities and why our process encourages challenge and debate around our most compelling ideas to ensure better informed investment decisions, which hopefully lead to better outcomes for you.
Your success is our priority. Talk to your financial advisor about how working with Columbia Threadneedle Investments may help you position your portfolio for consistent, sustainable outcomes, no matter the market conditions.
Sincerely,
Christopher O. Petersen
President, Columbia Funds
Investors should consider the investment objectives, risks, charges and expenses of a mutual fund carefully before investing. For a free prospectus and summary prospectus, which contains this and other important information about a fund, visit investor.columbiathreadneedleus.com. The prospectus should be read carefully before investing.
Columbia Funds are distributed by Columbia Management Investment Distributors, Inc., member FINRA, and managed by Columbia Management Investment Advisers, LLC.
© 2017 Columbia Management Investment Advisers, LLC. All rights reserved.
Columbia Disciplined Small Core Fund | Annual Report 2017
Columbia Disciplined Small Core Fund | Annual Report 2017
Investment objective
Columbia Disciplined Small Core Fund (the Fund) seeks long-term capital appreciation.
Portfolio management
Brian Condon, CFA
Co-manager
Managed Fund since 2016
Peter Albanese
Co-manager
Managed Fund since January 2017
Morningstar style boxTM
The Morningstar Style Box is based on a fund’s portfolio holdings. For equity funds, the vertical axis shows the market capitalization of the stocks owned, and the horizontal axis shows investment style (value, blend, or growth). Information shown is based on the most recent data provided by Morningstar.
© 2017 Morningstar, Inc. All rights reserved. The Morningstar information contained herein: (1) is proprietary to Morningstar and/or its content providers; (2) may not be copied or distributed; and (3) is not warranted to be accurate, complete or timely. Neither Morningstar nor its content providers are responsible for any damages or losses arising from any use of this information.
| Average annual total returns (%) (for the period ended August 31, 2017) |
| | | Inception | 1 Year | 5 Years | 10 Years |
| Class A | Excluding sales charges | 11/01/98 | 8.22 | 9.08 | 5.34 |
| | Including sales charges | | 2.00 | 7.79 | 4.72 |
| Class C | Excluding sales charges | 11/18/02 | 7.34 | 8.26 | 4.56 |
| | Including sales charges | | 6.75 | 8.26 | 4.56 |
| Class R4* | 11/08/12 | 8.30 | 9.32 | 5.60 |
| Class R5* | 11/08/12 | 8.47 | 9.49 | 5.68 |
| Class T* | Excluding sales charges | 09/27/10 | 8.09 | 9.06 | 5.34 |
| | Including sales charges | | 5.42 | 8.50 | 5.07 |
| Class V | Excluding sales charges | 02/12/93 | 8.12 | 9.03 | 5.30 |
| | Including sales charges | | 1.87 | 7.75 | 4.67 |
| Class Y* | 11/08/12 | 8.57 | 9.54 | 5.70 |
| Class Z | 12/14/92 | 8.34 | 9.33 | 5.60 |
| Russell 2000 Index | | 14.91 | 13.15 | 7.38 |
| S&P SmallCap 600 Index | | 13.11 | 14.42 | 8.62 |
Returns for Class A shares and Class V shares are shown with and without the maximum initial sales charge of 5.75%. Returns for Class C shares are shown with and without the 1.00% contingent deferred sales charge for the first year only. Returns for Class T shares are shown with and without the maximum initial sales charge of 2.50% per transaction. Prior to March 27, 2017, Class T shares were known as Class W shares and were not subject to sales charges. The Fund’s other share classes are not subject to sales charges and have limited eligibility. Please see the Fund’s prospectus for details. Performance for different share classes will vary based on differences in sales charges and fees associated with each share class. All results shown assume reinvestment of distributions during the period. Returns do not reflect the deduction of taxes that a shareholder may pay on Fund distributions or on the redemption of Fund shares. Performance results reflect the effect of any fee waivers or reimbursements of Fund expenses by Columbia Management Investment Advisers, LLC and/or any of its affiliates. Absent these fee waivers or expense reimbursement arrangements, performance results would have been lower.
The performance information shown represents past performance and is not a guarantee of future results. The investment return and principal value of your investment will fluctuate so that your shares, when redeemed, may be worth more or less than their original cost. Current performance may be lower or higher than the performance information shown. You may obtain performance information current to the most recent month-end by contacting your financial intermediary, visiting investor.columbiathreadneedleus.com or calling 800.345.6611.
| * | The returns shown for periods prior to the share class inception date (including returns for the Life of the Fund, if shown, which are since Fund inception) include the returns of the Fund’s oldest share class. These returns are adjusted to reflect any higher class-related operating expenses of the newer share classes, as applicable. Please visit investor.columbiathreadneedleus.com/investment-products/mutual-funds/appended-performance for more information. |
The Russell 2000 Index measures the performance of the small-cap segment of the U.S. equity universe. The Russell 2000 is a subset of the Russell 3000 Index representing approximately 10% of the total market capitalization of that index. It includes the securities of approximately 2,000 of the smallest companies in the Russell 3000 Index based on a combination of their market capitalization and current index membership.
The S&P SmallCap 600 Index tracks the performance of 600 domestic companies traded on major stock exchanges. The S&P SmallCap 600 is heavily weighted with the stocks of companies with small market capitalizations.
Indices are not available for investment, are not professionally managed and do not reflect sales charges, fees, brokerage commissions, taxes or other expenses of investing. Securities in the Fund may not match those in an index.
| 2 | Columbia Disciplined Small Core Fund | Annual Report 2017 |
Fund at a Glance (continued)
Performance of a hypothetical $10,000 investment (August 31, 2007 — August 31, 2017)
The chart above shows the change in value of a hypothetical $10,000 investment in Class A shares of Columbia Disciplined Small Core Fund during the stated time period, and does not reflect the deduction of taxes that a shareholder may pay on Fund distributions or on the redemption of Fund shares.
| Top 10 holdings (%) (at August 31, 2017) |
| Aspen Technology, Inc. | 0.8 |
| Curtiss-Wright Corp. | 0.8 |
| Entegris, Inc. | 0.8 |
| MGIC Investment Corp. | 0.8 |
| Tech Data Corp. | 0.8 |
| INC Research Holdings, Inc. Class A | 0.8 |
| Sanderson Farms, Inc. | 0.8 |
| Pra Health Sciences, Inc. | 0.7 |
| Portland General Electric Co. | 0.7 |
| Essent Group Ltd. | 0.7 |
Percentages indicated are based upon total investments (excluding Money Market Funds).
For further detail about these holdings, please refer to the section entitled “Portfolio of Investments.”
Fund holdings are as of the date given, are subject to change at any time, and are not recommendations to buy or sell any security.
| Portfolio breakdown (%) (at August 31, 2017) |
| Common Stocks | 99.1 |
| Money Market Funds | 0.9 |
| Total | 100.0 |
Percentages indicated are based upon total investments. The Fund’s portfolio composition is subject to change.
| Equity sector breakdown (%) (at August 31, 2017) |
| Consumer Discretionary | 11.8 |
| Consumer Staples | 2.9 |
| Energy | 3.6 |
| Financials | 17.7 |
| Health Care | 16.2 |
| Industrials | 14.5 |
| Information Technology | 17.3 |
| Materials | 4.7 |
| Real Estate | 7.1 |
| Telecommunication Services | 0.5 |
| Utilities | 3.7 |
| Total | 100.0 |
Percentages indicated are based upon total equity investments. The Fund’s portfolio composition is subject to change.
Columbia Disciplined Small Core Fund | Annual Report 2017
| 3 |
Manager Discussion of Fund Performance
For the 12-month period that ended August 31, 2017, the Fund’s Class A shares returned 8.22% excluding sales charges. By comparison, the Fund’s benchmarks, the Russell 2000 Index and S&P SmallCap 600 Index, posted returns of 14.91% and 13.11%, respectively. Stock selection, particularly in the industrials sector was the primary detractor from Fund results relative to the Russell benchmark.
U.S. equity markets delivered solid gains
Global events, political uncertainty and mixed economic data were enough to keep investors off balance early in the 12-month period, as financial markets moved sharply in reaction to each significant change on the world stage. However, the end of a contentious U.S. presidential contest in November 2016 eliminated a key element of uncertainty, and the U.S. equity markets moved solidly higher through the end of the period. Global growth picked up early in 2017. Positive U.S. economic data, steady job growth, rising corporate earnings and accelerated manufacturing activity further bolstered investor confidence.
The Federal Reserve (Fed) raised the target range of its benchmark short-term interest rate three times during the period, bringing it to between 1.00% and 1.25% in June 2017. The Fed signaled that it was prepared to raise rates more aggressively on the heels of strong job gains and progress towards its 2.0% inflation target, creating expectations that the June rate hike may not be the last during the calendar year.
Against this backdrop, the U.S. equity markets moved solidly higher during the period. The S&P 500 Index rose 16.23%, with dividends reinvested. Small cap stocks outperformed large and mid-cap stocks.
Our approach to stock selection
We divide the metrics for our stock selection model into three broad categories: 1) valuation — fundamental measures such as earnings and cash flow relative to market values, 2) catalyst — price momentum and business momentum and 3) quality — quality of earnings and financial strength. We then rank the securities within a sector/industry from one (most attractive) to five (least attractive) based upon the metrics within these categories. Strategy parameters dictate that sector weights be kept within +/- 0.5% of the benchmark.
Contributors and detractors
Catalyst models delivered positive performance for the period, as companies demonstrating strong business momentum and positive investor sentiment were in favor. The strategy modestly benefited from sector allocation during the period. The top contributing stocks for the period were General Communication and Aerie Pharmaceuticals. The acquisition of General Communication, a wireless telephone and Internet provider, by Liberty Interactive was well received by the market place. During the period, Aerie Pharmaceuticals, focused on the development of therapies for eye diseases, announced positive safety results for Roclatan, a drug in development and testing for the treatment of glaucoma. By contrast, the market did not reward the Fund’s quality and valuation models. Valuation models were the worst performers, as investors showed a clear preference for growth-oriented names. Quality models underperformed as well. Stock selection was particularly weak in the industrials sector, with heath care and consumer discretionary sectors detracting as well. Stock selection was positive for the period in the telecommunications service, materials and utilities sectors.
Seadrill and Francesca’s Holdings were the Fund’s weakest performers for period. Seadrill, an offshore drilling company, sold off as investors grew concerned over the capital structure of the firm and its ability to right-size its balance sheet. Francesca’s Holdings, a retail shopping company, was hurt as investors shunned the retail sector on concerns over the continued impact of Amazon on retail operators.
Fund strategy
Our strategy is based on individual quantitative stock selection. Consequently, we do not rely on macroeconomic scenarios or market outlooks to make security selections. We do not try to predict when equities, as an asset class, may perform well or when they may perform poorly. Instead, we keep the fund substantially invested at all times. Regardless of the economic environment, we seek to identify stocks that we believe have the potential to outperform within each market sector. We also seek to minimize sector weight differences between the Fund and its investment benchmarks. We favor stocks of companies
| 4 | Columbia Disciplined Small Core Fund | Annual Report 2017 |
Manager Discussion of Fund Performance (continued)
with attractive valuations relative to their peers, strong business and market momentum and good quality of earnings and financial strength. Over the long term, we have found that stocks with these characteristics have tended to outperform their peers in various macroeconomic conditions.
Market risk may affect a single issuer, sector of the economy, industry or the market as a whole. Foreign investments subject the Fund to risks, including political, economic, market, social and others within a particular country, as well as to currency instabilities and less stringent financial and accounting standards generally applicable to U.S. issuers. Investments in small-cap companies involve risks and volatility greater than investments in larger, more established companies. The Fund may invest significantly in issuers within a particular sector, which may be negatively affected by market, economic or other conditions, making the Fund more vulnerable to unfavorable developments in the sector. Investments selected using quantitative methods may perform differently from the market as a whole and may not enable the Fund to achieve its objective. See the Fund’s prospectus for more information on these and other risks.
The views expressed in this report reflect the current views of the respective parties. These views are not guarantees of future performance and involve certain risks, uncertainties and assumptions that are difficult to predict, so actual outcomes and results may differ significantly from the views expressed. These views are subject to change at any time based upon economic, market or other conditions and the respective parties disclaim any responsibility to update such views. These views may not be relied on as investment advice and, because investment decisions for a Columbia fund are based on numerous factors, may not be relied on as an indication of trading intent on behalf of any particular Columbia fund. References to specific securities should not be construed as a recommendation or investment advice.
Columbia Disciplined Small Core Fund | Annual Report 2017
| 5 |
Understanding Your Fund’s Expenses
(Unaudited)
As an investor, you incur two types of costs. There are transaction costs, which generally include sales charges on purchases and may include redemption fees. There are also ongoing costs, which generally include management fees, distribution and/or service fees, and other fund expenses. The following information is intended to help you understand your ongoing costs (in dollars) of investing in the Fund and to help you compare these costs with the ongoing costs of investing in other mutual funds.
Analyzing your Fund’s expenses
To illustrate these ongoing costs, we have provided examples and calculated the expenses paid by investors in each share class of the Fund during the period. The actual and hypothetical information in the table is based on an initial investment of $1,000 at the beginning of the period indicated and held for the entire period. Expense information is calculated two ways and each method provides you with different information. The amount listed in the “Actual” column is calculated using the Fund’s actual operating expenses and total return for the period. You may use the Actual information, together with the amount invested, to estimate the expenses that you paid over the period. Simply divide your account value by $1,000 (for example, an $8,600 account value divided by $1,000 = 8.6), then multiply the results by the expenses paid during the period under the “Actual” column. The amount listed in the “Hypothetical” column assumes a 5% annual rate of return before expenses (which is not the Fund’s actual return) and then applies the Fund’s actual expense ratio for the period to the hypothetical return. You should not use the hypothetical account values and expenses to estimate either your actual account balance at the end of the period or the expenses you paid during the period. See “Compare with other funds” below for details on how to use the hypothetical data.
Compare with other funds
Since all mutual funds are required to include the same hypothetical calculations about expenses in shareholder reports, you can use this information to compare the ongoing cost of investing in the Fund with other funds. To do so, compare the hypothetical example with the 5% hypothetical examples that appear in the shareholder reports of other funds. As you compare hypothetical examples of other funds, it is important to note that hypothetical examples are meant to highlight the ongoing costs of investing in a fund only and do not reflect any transaction costs, such as sales charges, or redemption or exchange fees. Therefore, the hypothetical calculations are useful in comparing ongoing costs only, and will not help you determine the relative total costs of owning different funds. If transaction costs were included in these calculations, your costs would be higher.
| March 1, 2017 — August 31, 2017 |
| | Account value at the
beginning of the
period ($) | Account value at the
end of the
period ($) | Expenses paid during
the period ($) | Fund’s annualized
expense ratio (%) |
| | Actual | Hypothetical | Actual | Hypothetical | Actual | Hypothetical | Actual |
| Class A | 1,000.00 | 1,000.00 | 984.80 | 1,018.25 | 6.90 | 7.02 | 1.38 |
| Class C | 1,000.00 | 1,000.00 | 981.20 | 1,014.47 | 10.64 | 10.82 | 2.13 |
| Class R4 | 1,000.00 | 1,000.00 | 984.40 | 1,019.51 | 5.65 | 5.75 | 1.13 |
| Class R5 | 1,000.00 | 1,000.00 | 985.60 | 1,020.01 | 5.15 | 5.24 | 1.03 |
| Class T (formerly Class W) | 1,000.00 | 1,000.00 | 983.70 | 1,018.25 | 6.90 | 7.02 | 1.38 |
| Class V (formerly Class T) | 1,000.00 | 1,000.00 | 982.80 | 1,018.25 | 6.90 | 7.02 | 1.38 |
| Class Y | 1,000.00 | 1,000.00 | 985.70 | 1,020.27 | 4.90 | 4.99 | 0.98 |
| Class Z | 1,000.00 | 1,000.00 | 985.20 | 1,019.51 | 5.65 | 5.75 | 1.13 |
Expenses paid during the period are equal to the annualized expense ratio for each class as indicated above, multiplied by the average account value over the period and then multiplied by the number of days in the Fund’s most recent fiscal half year and divided by 365.
Expenses do not include fees and expenses incurred indirectly by the Fund from its investment in underlying funds, including affiliated and non-affiliated pooled investment vehicles, such as mutual funds and exchange-traded funds.
Had Columbia Management Investment Advisers, LLC and/or certain of its affiliates not waived/reimbursed certain fees and expenses, account value at the end of the period would have been reduced.
| 6 | Columbia Disciplined Small Core Fund | Annual Report 2017 |
Portfolio of Investments
August 31, 2017
(Percentages represent value of investments compared to net assets)
| Common Stocks 99.1% |
| Issuer | Shares | Value ($) |
| Consumer Discretionary 11.6% |
| Auto Components 1.1% |
| Cooper-Standard Holding, Inc.(a) | 4,300 | 432,494 |
| Dorman Products, Inc.(a) | 9,800 | 650,916 |
| LCI Industries | 10,500 | 1,037,400 |
| Superior Industries International, Inc. | 10,000 | 146,500 |
| Total | | 2,267,310 |
| Diversified Consumer Services 1.3% |
| Adtalem Global Education, Inc. | 9,900 | 338,580 |
| Capella Education Co. | 13,925 | 937,849 |
| Sotheby’s (a) | 21,400 | 960,218 |
| Weight Watchers International, Inc.(a) | 10,200 | 477,462 |
| Total | | 2,714,109 |
| Hotels, Restaurants & Leisure 2.4% |
| Bloomin’ Brands, Inc. | 42,600 | 724,626 |
| Brinker International, Inc. | 11,400 | 355,908 |
| Cheesecake Factory, Inc. (The) | 14,300 | 592,449 |
| Cracker Barrel Old Country Store, Inc. | 7,650 | 1,137,249 |
| Papa John’s International, Inc. | 13,700 | 1,024,623 |
| Ruth’s Hospitality Group, Inc. | 60,000 | 1,173,000 |
| Total | | 5,007,855 |
| Household Durables 1.1% |
| Helen of Troy Ltd.(a) | 1,600 | 144,480 |
| La-Z-Boy, Inc. | 42,600 | 1,016,010 |
| Taylor Morrison Home Corp., Class A(a) | 52,900 | 1,069,638 |
| Zagg, Inc.(a) | 16,100 | 202,860 |
| Total | | 2,432,988 |
| Internet & Direct Marketing Retail 0.8% |
| Nutrisystem, Inc. | 12,400 | 673,320 |
| PetMed Express, Inc. | 25,800 | 935,766 |
| Total | | 1,609,086 |
| Media 1.6% |
| Gannett Co., Inc. | 129,000 | 1,095,210 |
| New York Times Co. (The), Class A | 24,400 | 455,060 |
| Scholastic Corp. | 13,700 | 540,191 |
| Time, Inc. | 97,200 | 1,278,180 |
| Total | | 3,368,641 |
| Common Stocks (continued) |
| Issuer | Shares | Value ($) |
| Multiline Retail 0.5% |
| Big Lots, Inc. | 24,300 | 1,156,680 |
| Specialty Retail 2.1% |
| Aaron’s, Inc. | 34,000 | 1,505,180 |
| Big 5 Sporting Goods Corp. | 66,100 | 505,665 |
| Buckle, Inc. (The) | 8,400 | 118,860 |
| Children’s Place, Inc. (The) | 5,925 | 628,939 |
| Francesca’s Holdings Corp.(a) | 144,400 | 1,048,344 |
| Pier 1 Imports, Inc. | 71,000 | 297,490 |
| Select Comfort Corp.(a) | 4,700 | 138,791 |
| Tilly’s, Inc. | 14,700 | 161,847 |
| Total | | 4,405,116 |
| Textiles, Apparel & Luxury Goods 0.7% |
| Movado Group, Inc. | 50,200 | 1,393,050 |
| Total Consumer Discretionary | 24,354,835 |
| Consumer Staples 2.9% |
| Food & Staples Retailing 0.3% |
| SpartanNash Co. | 5,700 | 140,448 |
| SUPERVALU, Inc.(a) | 24,600 | 491,754 |
| Total | | 632,202 |
| Food Products 2.0% |
| Dean Foods Co. | 64,000 | 704,000 |
| Fresh Del Monte Produce, Inc. | 21,300 | 1,000,887 |
| John B. Sanfilippo & Son, Inc. | 15,600 | 968,136 |
| Sanderson Farms, Inc. | 10,600 | 1,563,712 |
| Total | | 4,236,735 |
| Household Products 0.2% |
| Central Garden & Pet Co., Class A(a) | 9,800 | 334,082 |
| Personal Products 0.4% |
| Medifast, Inc. | 3,500 | 198,170 |
| Usana Health Sciences, Inc.(a) | 10,180 | 602,656 |
| Total | | 800,826 |
| Total Consumer Staples | 6,003,845 |
The accompanying Notes to Financial Statements are an integral part of this statement.
Columbia Disciplined Small Core Fund | Annual Report 2017
| 7 |
Portfolio of Investments (continued)
August 31, 2017
| Common Stocks (continued) |
| Issuer | Shares | Value ($) |
| Energy 3.5% |
| Energy Equipment & Services 1.9% |
| Archrock, Inc. | 104,900 | 1,069,980 |
| Atwood Oceanics, Inc.(a) | 25,600 | 168,192 |
| Exterran Corp.(a) | 44,800 | 1,242,752 |
| McDermott International, Inc.(a) | 55,500 | 340,770 |
| Rowan Companies PLC, Class A(a) | 113,100 | 1,102,725 |
| Total | | 3,924,419 |
| Oil, Gas & Consumable Fuels 1.6% |
| International Seaways, Inc.(a) | 40,900 | 754,196 |
| Pacific Ethanol, Inc.(a) | 25,100 | 125,500 |
| Peabody Energy Corp.(a) | 13,200 | 382,800 |
| REX American Resources Corp.(a) | 13,300 | 1,152,046 |
| Ultra Petroleum Corp.(a) | 136,100 | 1,060,219 |
| Total | | 3,474,761 |
| Total Energy | 7,399,180 |
| Financials 17.6% |
| Banks 8.3% |
| Banco Latinoamericano de Comercio Exterior SA, Class E | 13,900 | 374,744 |
| Cathay General Bancorp | 36,100 | 1,273,247 |
| Centerstate Banks, Inc. | 10,600 | 259,382 |
| Central Pacific Financial Corp. | 33,170 | 961,930 |
| Customers Bancorp, Inc.(a) | 40,850 | 1,151,153 |
| Enterprise Financial Services Corp. | 20,600 | 786,920 |
| First BanCorp(a) | 68,600 | 389,648 |
| First Citizens BancShares Inc., Class A | 4,000 | 1,362,040 |
| First Merchants Corp. | 20,900 | 820,743 |
| Fulton Financial Corp. | 15,700 | 273,965 |
| Hancock Holding Co. | 31,700 | 1,393,215 |
| Hilltop Holdings, Inc. | 18,500 | 437,895 |
| International Bancshares Corp. | 38,600 | 1,387,670 |
| Preferred Bank/Los Angeles | 16,700 | 898,460 |
| S&T Bancorp, Inc. | 15,300 | 549,882 |
| Sandy Spring Bancorp, Inc. | 28,400 | 1,095,388 |
| Sterling Bancorp | 19,500 | 437,775 |
| United Community Banks, Inc. | 45,100 | 1,177,561 |
| Common Stocks (continued) |
| Issuer | Shares | Value ($) |
| Valley National Bancorp | 66,500 | 744,135 |
| Wintrust Financial Corp. | 20,600 | 1,499,886 |
| Total | | 17,275,639 |
| Capital Markets 1.5% |
| Arlington Asset Investment Corp., Class A | 87,400 | 1,129,208 |
| Piper Jaffray Companies | 16,400 | 909,380 |
| Virtus Investment Partners, Inc. | 9,200 | 975,200 |
| Total | | 3,013,788 |
| Consumer Finance 0.6% |
| Nelnet, Inc., Class A | 26,850 | 1,273,495 |
| Insurance 2.0% |
| American Equity Investment Life Holding Co. | 41,500 | 1,152,040 |
| CNO Financial Group, Inc. | 62,600 | 1,399,110 |
| HCI Group, Inc. | 6,600 | 257,334 |
| Heritage Insurance Holdings, Inc. | 30,300 | 344,814 |
| Universal Insurance Holdings, Inc. | 51,800 | 1,111,110 |
| Total | | 4,264,408 |
| Mortgage Real Estate Investment Trusts (REITS) 1.3% |
| AG Mortgage Investment Trust, Inc. | 16,600 | 319,882 |
| ARMOUR Residential REIT, Inc. | 42,300 | 1,117,143 |
| Invesco Mortgage Capital, Inc. | 31,200 | 529,776 |
| MTGE Investment Corp. | 43,500 | 835,200 |
| Total | | 2,802,001 |
| Thrifts & Mortgage Finance 3.9% |
| Essent Group Ltd.(a) | 39,100 | 1,528,028 |
| Federal Agricultural Mortgage Corp. | 16,500 | 1,123,980 |
| Flagstar Bancorp, Inc.(a) | 35,650 | 1,170,033 |
| MGIC Investment Corp.(a) | 143,000 | 1,637,350 |
| Walker & Dunlop, Inc.(a) | 26,400 | 1,272,216 |
| Washington Federal, Inc. | 45,300 | 1,415,625 |
| Total | | 8,147,232 |
| Total Financials | 36,776,563 |
| Health Care 16.0% |
| Biotechnology 5.4% |
| Alder Biopharmaceuticals, Inc.(a) | 68,261 | 668,958 |
| Axovant Sciences Ltd.(a) | 16,100 | 322,000 |
| bluebird bio, Inc.(a) | 6,790 | 847,731 |
| Blueprint Medicines Corp.(a) | 7,900 | 428,338 |
The accompanying Notes to Financial Statements are an integral part of this statement.
| 8 | Columbia Disciplined Small Core Fund | Annual Report 2017 |
Portfolio of Investments (continued)
August 31, 2017
| Common Stocks (continued) |
| Issuer | Shares | Value ($) |
| Clovis Oncology, Inc.(a) | 7,400 | 562,918 |
| Dynavax Technologies Corp.(a) | 37,290 | 669,356 |
| Eagle Pharmaceuticals, Inc.(a) | 2,700 | 147,312 |
| Ignyta, Inc.(a) | 31,200 | 358,800 |
| Immunomedics, Inc.(a) | 28,300 | 357,712 |
| Jounce Therapeutics, Inc.(a) | 26,713 | 453,854 |
| Keryx Biopharmaceuticals, Inc.(a) | 90,655 | 653,623 |
| Kite Pharma, Inc.(a) | 1,905 | 339,071 |
| Loxo Oncology, Inc.(a) | 7,500 | 625,500 |
| Ovid Therapeutics, Inc.(a) | 64,918 | 611,528 |
| Puma Biotechnology, Inc.(a) | 13,595 | 1,257,537 |
| Ra Pharmaceuticals, Inc.(a) | 20,236 | 303,742 |
| Sage Therapeutics, Inc.(a) | 8,630 | 709,817 |
| Spark Therapeutics, Inc.(a) | 14,635 | 1,204,900 |
| TESARO, Inc.(a) | 6,425 | 829,724 |
| Total | | 11,352,421 |
| Health Care Equipment & Supplies 4.2% |
| Analogic Corp. | 16,315 | 1,167,338 |
| Angiodynamics, Inc.(a) | 70,900 | 1,207,427 |
| CONMED Corp. | 3,600 | 178,560 |
| Haemonetics Corp.(a) | 22,600 | 972,252 |
| Halyard Health, Inc.(a) | 24,800 | 1,123,192 |
| Integer Holdings Corp.(a) | 25,600 | 1,176,320 |
| Lantheus Holdings, Inc.(a) | 67,704 | 1,184,820 |
| Masimo Corp.(a) | 17,550 | 1,480,869 |
| Orthofix International NV(a) | 7,350 | 361,694 |
| Total | | 8,852,472 |
| Health Care Providers & Services 2.9% |
| AMN Healthcare Services, Inc.(a) | 34,500 | 1,288,575 |
| Chemed Corp. | 1,200 | 236,748 |
| Diplomat Pharmacy, Inc.(a) | 5,000 | 83,750 |
| Kindred Healthcare, Inc. | 34,100 | 276,210 |
| LHC Group, Inc.(a) | 10,900 | 711,225 |
| Molina Healthcare, Inc.(a) | 18,375 | 1,176,000 |
| Providence Service Corp. (The)(a) | 21,700 | 1,124,711 |
| Triple-S Management Corp., Class B(a) | 44,850 | 1,108,243 |
| Total | | 6,005,462 |
| Common Stocks (continued) |
| Issuer | Shares | Value ($) |
| Life Sciences Tools & Services 1.5% |
| INC Research Holdings, Inc. Class A(a) | 26,825 | 1,574,628 |
| Pra Health Sciences, Inc.(a) | 19,950 | 1,544,130 |
| Total | | 3,118,758 |
| Pharmaceuticals 2.0% |
| Aerie Pharmaceuticals, Inc.(a) | 15,710 | 900,968 |
| Corcept Therapeutics, Inc.(a) | 48,200 | 803,494 |
| Pacira Pharmaceuticals, Inc.(a) | 17,200 | 655,320 |
| Phibro Animal Health Corp., Class A | 30,400 | 1,079,200 |
| Supernus Pharmaceuticals, Inc.(a) | 15,255 | 698,679 |
| Total | | 4,137,661 |
| Total Health Care | 33,466,774 |
| Industrials 14.4% |
| Aerospace & Defense 1.0% |
| Curtiss-Wright Corp. | 17,200 | 1,665,304 |
| Moog, Inc., Class A(a) | 6,300 | 483,588 |
| Total | | 2,148,892 |
| Air Freight & Logistics 0.2% |
| Forward Air Corp. | 6,500 | 337,805 |
| Airlines 0.6% |
| Hawaiian Holdings, Inc.(a) | 29,700 | 1,272,645 |
| Building Products 1.1% |
| Caesarstone Ltd.(a) | 32,500 | 941,687 |
| Continental Building Product(a) | 55,400 | 1,348,990 |
| Total | | 2,290,677 |
| Commercial Services & Supplies 2.1% |
| ACCO Brands Corp.(a) | 99,100 | 1,085,145 |
| Brady Corp., Class A | 13,200 | 440,220 |
| Essendant, Inc. | 68,000 | 806,480 |
| MSA Safety, Inc. | 18,000 | 1,311,480 |
| Quad/Graphics, Inc. | 26,500 | 505,090 |
| SP Plus Corp.(a) | 6,200 | 228,780 |
| Total | | 4,377,195 |
The accompanying Notes to Financial Statements are an integral part of this statement.
Columbia Disciplined Small Core Fund | Annual Report 2017
| 9 |
Portfolio of Investments (continued)
August 31, 2017
| Common Stocks (continued) |
| Issuer | Shares | Value ($) |
| Construction & Engineering 1.7% |
| Argan, Inc. | 19,600 | 1,241,660 |
| EMCOR Group, Inc. | 21,800 | 1,439,672 |
| Primoris Services Corp. | 28,600 | 818,246 |
| Total | | 3,499,578 |
| Electrical Equipment 1.7% |
| Atkore International Group, Inc.(a) | 50,200 | 836,332 |
| EnerSys | 19,720 | 1,264,052 |
| Generac Holdings, Inc.(a) | 36,400 | 1,469,832 |
| Total | | 3,570,216 |
| Machinery 3.1% |
| Alamo Group, Inc. | 12,700 | 1,165,352 |
| Astec Industries, Inc. | 13,400 | 665,712 |
| Global Brass & Copper Holdings, Inc. | 40,000 | 1,194,000 |
| Harsco Corp.(a) | 39,300 | 672,030 |
| Hillenbrand, Inc. | 7,800 | 278,850 |
| Kadant, Inc. | 8,200 | 712,170 |
| Mueller Industries, Inc. | 15,950 | 475,789 |
| Wabash National Corp. | 60,921 | 1,280,559 |
| Total | | 6,444,462 |
| Professional Services 1.0% |
| RPX Corp.(a) | 94,900 | 1,239,394 |
| TrueBlue, Inc.(a) | 45,800 | 936,610 |
| Total | | 2,176,004 |
| Road & Rail 1.0% |
| ArcBest Corp. | 49,600 | 1,473,120 |
| Saia, Inc.(a) | 11,800 | 667,290 |
| Total | | 2,140,410 |
| Trading Companies & Distributors 0.9% |
| Applied Industrial Technologies, Inc. | 24,430 | 1,392,510 |
| DXP Enterprises, Inc.(a) | 7,700 | 208,593 |
| Rush Enterprises, Inc., Class A(a) | 6,100 | 250,039 |
| Total | | 1,851,142 |
| Total Industrials | 30,109,026 |
| Common Stocks (continued) |
| Issuer | Shares | Value ($) |
| Information Technology 17.1% |
| Communications Equipment 0.6% |
| ADTRAN, Inc. | 13,600 | 300,560 |
| Netscout Systems, Inc.(a) | 27,400 | 897,350 |
| Total | | 1,197,910 |
| Electronic Equipment, Instruments & Components 5.4% |
| Anixter International, Inc.(a) | 17,200 | 1,269,360 |
| Benchmark Electronics, Inc.(a) | 43,501 | 1,413,783 |
| ePlus, Inc.(a) | 3,900 | 326,430 |
| KEMET Corp.(a) | 20,800 | 497,328 |
| Methode Electronics, Inc. | 32,000 | 1,308,800 |
| Rogers Corp.(a) | 4,200 | 497,910 |
| Sanmina Corp.(a) | 38,585 | 1,445,008 |
| Scansource, Inc.(a) | 32,700 | 1,283,475 |
| Tech Data Corp.(a) | 14,800 | 1,632,292 |
| TTM Technologies, Inc.(a) | 4,900 | 69,776 |
| Vishay Intertechnology, Inc. | 84,100 | 1,488,570 |
| Total | | 11,232,732 |
| Internet Software & Services 1.0% |
| j2 Global, Inc. | 19,325 | 1,454,786 |
| New Relic, Inc.(a) | 4,800 | 229,920 |
| Shutterstock, Inc.(a) | 7,000 | 235,060 |
| WebMD Health Corp.(a) | 3,400 | 225,896 |
| Total | | 2,145,662 |
| IT Services 3.8% |
| Convergys Corp. | 36,600 | 860,100 |
| Everi Holdings, Inc.(a) | 17,300 | 133,383 |
| EVERTEC, Inc. | 70,300 | 1,293,520 |
| MAXIMUS, Inc. | 23,800 | 1,446,564 |
| Perficient, Inc.(a) | 22,200 | 406,260 |
| Science Applications International Corp. | 18,800 | 1,388,944 |
| TeleTech Holdings, Inc. | 24,200 | 960,740 |
| Travelport Worldwide Ltd. | 89,500 | 1,355,030 |
| Unisys Corp.(a) | 17,400 | 134,850 |
| Total | | 7,979,391 |
The accompanying Notes to Financial Statements are an integral part of this statement.
| 10 | Columbia Disciplined Small Core Fund | Annual Report 2017 |
Portfolio of Investments (continued)
August 31, 2017
| Common Stocks (continued) |
| Issuer | Shares | Value ($) |
| Semiconductors & Semiconductor Equipment 3.2% |
| Amkor Technology, Inc.(a) | 115,600 | 1,014,968 |
| Diodes, Inc.(a) | 48,000 | 1,350,720 |
| Entegris, Inc.(a) | 64,500 | 1,641,525 |
| Formfactor, Inc.(a) | 10,500 | 158,550 |
| IXYS Corp.(a) | 17,500 | 402,500 |
| Rudolph Technologies, Inc.(a) | 33,600 | 745,920 |
| Semtech Corp.(a) | 5,400 | 203,040 |
| Xcerra Corp.(a) | 116,242 | 1,141,496 |
| Total | | 6,658,719 |
| Software 3.1% |
| Aspen Technology, Inc.(a) | 27,150 | 1,717,238 |
| Barracuda Networks, Inc.(a) | 52,100 | 1,261,341 |
| CommVault Systems, Inc.(a) | 24,100 | 1,471,305 |
| Imperva, Inc.(a) | 6,900 | 308,085 |
| Progress Software Corp. | 42,600 | 1,430,508 |
| VASCO Data Security International, Inc.(a) | 28,700 | 360,185 |
| Total | | 6,548,662 |
| Total Information Technology | 35,763,076 |
| Materials 4.7% |
| Chemicals 2.5% |
| Ferro Corp.(a) | 6,300 | 121,401 |
| Innospec, Inc. | 20,675 | 1,147,463 |
| KMG Chemicals, Inc. | 11,500 | 552,230 |
| Koppers Holdings, Inc.(a) | 11,100 | 435,120 |
| Quaker Chemical Corp. | 2,500 | 348,050 |
| Rayonier Advanced Materials, Inc. | 78,700 | 1,079,764 |
| Trinseo SA | 21,850 | 1,461,765 |
| Total | | 5,145,793 |
| Containers & Packaging 0.7% |
| Greif, Inc., Class A | 23,800 | 1,438,710 |
| Metals & Mining 1.5% |
| Materion Corp. | 32,450 | 1,239,590 |
| Schnitzer Steel Industries, Inc., Class A | 46,900 | 1,261,610 |
| Warrior Met Coal, Inc. | 26,900 | 734,101 |
| Total | | 3,235,301 |
| Total Materials | 9,819,804 |
| Common Stocks (continued) |
| Issuer | Shares | Value ($) |
| Real Estate 7.1% |
| Equity Real Estate Investment Trusts (REITS) 7.1% |
| Ashford Hospitality Prime, Inc. | 60,900 | 585,858 |
| CorEnergy Infrastructure Trust, Inc. | 34,806 | 1,135,720 |
| DiamondRock Hospitality Co. | 61,300 | 673,687 |
| Getty Realty Corp. | 6,700 | 184,652 |
| Lexington Realty Trust | 142,600 | 1,406,036 |
| NorthStar Realty Europe Corp. | 21,900 | 272,217 |
| PS Business Parks, Inc. | 11,030 | 1,490,263 |
| Ryman Hospitality Properties, Inc. | 24,000 | 1,426,080 |
| Sabra Health Care REIT, Inc. | 53,400 | 1,166,790 |
| Select Income REIT | 54,100 | 1,255,661 |
| Summit Hotel Properties, Inc. | 76,157 | 1,130,170 |
| Sunstone Hotel Investors, Inc. | 91,500 | 1,445,700 |
| Tier REIT, Inc. | 14,100 | 259,581 |
| Washington Prime Group, Inc. | 130,400 | 1,088,840 |
| Xenia Hotels & Resorts, Inc. | 64,100 | 1,279,436 |
| Total | | 14,800,691 |
| Total Real Estate | 14,800,691 |
| Telecommunication Services 0.5% |
| Diversified Telecommunication Services 0.4% |
| ATN International, Inc. | 4,400 | 266,508 |
| Consolidated Communications Holdings, Inc. | 28,400 | 523,980 |
| Total | | 790,488 |
| Wireless Telecommunication Services 0.1% |
| Boingo Wireless, Inc.(a) | 14,300 | 294,437 |
| Total Telecommunication Services | 1,084,925 |
| Utilities 3.7% |
| Electric Utilities 1.4% |
| Allete, Inc. | 8,800 | 680,504 |
| El Paso Electric Co. | 5,800 | 322,190 |
| IDACORP, Inc. | 2,300 | 204,654 |
| PNM Resources, Inc. | 3,500 | 148,400 |
| Portland General Electric Co. | 32,250 | 1,532,197 |
| Total | | 2,887,945 |
The accompanying Notes to Financial Statements are an integral part of this statement.
Columbia Disciplined Small Core Fund | Annual Report 2017
| 11 |
Portfolio of Investments (continued)
August 31, 2017
| Common Stocks (continued) |
| Issuer | Shares | Value ($) |
| Gas Utilities 1.4% |
| Chesapeake Utilities Corp. | 15,975 | 1,269,214 |
| New Jersey Resources Corp. | 13,000 | 567,450 |
| Southwest Gas Corp. | 14,275 | 1,135,148 |
| Total | | 2,971,812 |
| Independent Power and Renewable Electricity Producers 0.4% |
| Ormat Technologies, Inc. | 15,600 | 896,064 |
| Water Utilities 0.5% |
| SJW Corp. | 18,000 | 999,000 |
| Total Utilities | 7,754,821 |
Total Common Stocks
(Cost $183,159,176) | 207,333,540 |
|
| Money Market Funds 0.9% |
| | Shares | Value ($) |
| Columbia Short-Term Cash Fund, 1.146%(b),(c) | 1,952,238 | 1,952,238 |
Total Money Market Funds
(Cost $1,952,189) | 1,952,238 |
Total Investments
(Cost: $185,111,365) | 209,285,778 |
| Other Assets & Liabilities, Net | | (43,073) |
| Net Assets | 209,242,705 |
At August 31, 2017, securities and/or cash totaling $137,350 were pledged as collateral.
Investments in derivatives
| Long futures contracts |
| Description | Number of
contracts | Expiration
date | Trading
currency | Notional
amount | Value/Unrealized
appreciation ($) | Value/Unrealized
depreciation ($) |
| Russell 2000 Mini | 13 | 09/2017 | USD | 912,860 | 5,398 | — |
| Russell 2000 Mini | 28 | 09/2017 | USD | 1,966,160 | — | (35,577) |
| Total | | | | | 5,398 | (35,577) |
Notes to Portfolio of Investments
| (a) | Non-income producing investment. |
| (b) | The rate shown is the seven-day current annualized yield at August 31, 2017. |
| (c) | As defined in the Investment Company Act of 1940, an affiliated company is one in which the Fund owns 5% or more of the company’s outstanding voting securities, or a company which is under common ownership or control with the Fund. Holdings and transactions in these affiliated companies during the year ended August 31, 2017 are as follows: |
| Issuer | Beginning
shares | Shares
purchased | Shares
sold | Ending
shares | Realized gain
(loss) ($) | Net change in
unrealized
appreciation
(depreciation) ($) | Dividends —
affiliated
issuers($) | Value ($) |
| Columbia Short-Term Cash Fund, 1.146% | 4,822,294 | 72,927,930 | (75,797,986) | 1,952,238 | (315) | 49 | 37,422 | 1,952,238 |
Currency Legend
Fair value measurements
The Fund categorizes its fair value measurements according to a three-level hierarchy that maximizes the use of observable inputs and minimizes the use of unobservable inputs by prioritizing that the most observable input be used when available. Observable inputs are those that market participants would use in pricing an investment based on market data obtained from sources independent of the reporting entity. Unobservable inputs are those that reflect the Fund’s assumptions about the information market participants would use in pricing an investment. An investment’s level within the fair value hierarchy is based on the lowest level of any input that is deemed significant to the asset’s or liability’s fair value measurement. The input levels are not necessarily an indication of the risk or liquidity associated with investments at that level. For example, certain U.S. government securities are generally high quality and liquid, however, they are reflected as Level 2 because the inputs used to determine fair value may not always be quoted prices in an active market.
The accompanying Notes to Financial Statements are an integral part of this statement.
| 12 | Columbia Disciplined Small Core Fund | Annual Report 2017 |
Portfolio of Investments (continued)
August 31, 2017
Fair value measurements (continued)
Fair value inputs are summarized in the three broad levels listed below:
| • | Level 1 – Valuations based on quoted prices for investments in active markets that the Fund has the ability to access at the measurement date. Valuation adjustments are not applied to Level 1 investments. |
| • | Level 2 – Valuations based on other significant observable inputs (including quoted prices for similar securities, interest rates, prepayment speeds, credit risks, etc.). |
| • | Level 3 – Valuations based on significant unobservable inputs (including the Fund’s own assumptions and judgment in determining the fair value of investments). |
Inputs that are used in determining fair value of an investment may include price information, credit data, volatility statistics, and other factors. These inputs can be either observable or unobservable. The availability of observable inputs can vary between investments, and is affected by various factors such as the type of investment, and the volume and level of activity for that investment or similar investments in the marketplace. The inputs will be considered by the Investment Manager, along with any other relevant factors in the calculation of an investment’s fair value. The Fund uses prices and inputs that are current as of the measurement date, which may include periods of market dislocations. During these periods, the availability of prices and inputs may be reduced for many investments. This condition could cause an investment to be reclassified between the various levels within the hierarchy.
Certain investments that have been measured at fair value using the net asset value (NAV) per share (or its equivalent) are not categorized in the fair value hierarchy. The fair value amounts presented in the table are intended to reconcile the fair value hierarchy to the amounts presented in the Portfolio of Investments. The Columbia Short-Term Cash Fund seeks to provide shareholders with maximum current income consistent with liquidity and stability of principal. Columbia Short-Term Cash Fund prices its shares with a floating NAV and no longer seeks to maintain a stable NAV.
Investments falling into the Level 3 category are primarily supported by quoted prices from brokers and dealers participating in the market for those investments. However, these may be classified as Level 3 investments due to lack of market transparency and corroboration to support these quoted prices. Additionally, valuation models may be used as the pricing source for any remaining investments classified as Level 3. These models may rely on one or more significant unobservable inputs and/or significant assumptions by the Investment Manager. Inputs used in valuations may include, but are not limited to, financial statement analysis, capital account balances, discount rates and estimated cash flows, and comparable company data.
Under the direction of the Fund’s Board of Trustees (the Board), the Investment Manager’s Valuation Committee (the Committee) is responsible for overseeing the valuation procedures approved by the Board. The Committee consists of voting and non-voting members from various groups within the Investment Manager’s organization, including operations and accounting, trading and investments, compliance, risk management and legal.
The Committee meets at least monthly to review and approve valuation matters, which may include a description of specific valuation determinations, data regarding pricing information received from approved pricing vendors and brokers and the results of Board-approved valuation control policies and procedures (the Policies). The Policies address, among other things, instances when market quotations are or are not readily available, including recommendations of third party pricing vendors and a determination of appropriate pricing methodologies; events that require specific valuation determinations and assessment of fair value techniques; securities with a potential for stale pricing, including those that are illiquid, restricted, or in default; and the effectiveness of third party pricing vendors, including periodic reviews of vendors. The Committee meets more frequently, as needed, to discuss additional valuation matters, which may include the need to review back-testing results, review time-sensitive information or approve related valuation actions. The Committee reports to the Board, with members of the Committee meeting with the Board at each of its regularly scheduled meetings to discuss valuation matters and actions during the period, similar to those described earlier.
For investments categorized as Level 3, the Committee monitors information similar to that described above, which may include: (i) data specific to the issuer or comparable issuers, (ii) general market or specific sector news and (iii) quoted prices and specific or similar security transactions. The Committee considers this data and any changes from prior periods in order to assess the reasonableness of observable and unobservable inputs, any assumptions or internal models used to value those securities and changes in fair value. This data is also used to corroborate, when available, information received from approved pricing vendors and brokers. Various factors impact the frequency of monitoring this information (which may occur as often as daily). However, the Committee may determine that changes to inputs, assumptions and models are not required as a result of the monitoring procedures performed.
The following table is a summary of the inputs used to value the Fund’s investments at August 31, 2017:
| | Level 1
quoted prices
in active
markets for
identical
assets ($) | Level 2
other
significant
observable
inputs ($) | Level 3
significant
unobservable
inputs ($) | Investments
measured at
net asset
value ($) | Total ($) |
| Investments | | | | | |
| Common Stocks | | | | | |
| Consumer Discretionary | 24,354,835 | — | — | — | 24,354,835 |
| Consumer Staples | 6,003,845 | — | — | — | 6,003,845 |
| Energy | 7,399,180 | — | — | — | 7,399,180 |
| Financials | 36,776,563 | — | — | — | 36,776,563 |
| Health Care | 33,466,774 | — | — | — | 33,466,774 |
| Industrials | 30,109,026 | — | — | — | 30,109,026 |
| Information Technology | 35,763,076 | — | — | — | 35,763,076 |
| Materials | 9,819,804 | — | — | — | 9,819,804 |
| Real Estate | 14,800,691 | — | — | — | 14,800,691 |
The accompanying Notes to Financial Statements are an integral part of this statement.
Columbia Disciplined Small Core Fund | Annual Report 2017
| 13 |
Portfolio of Investments (continued)
August 31, 2017
Fair value measurements (continued)
| | Level 1
quoted prices
in active
markets for
identical
assets ($) | Level 2
other
significant
observable
inputs ($) | Level 3
significant
unobservable
inputs ($) | Investments
measured at
net asset
value ($) | Total ($) |
| Telecommunication Services | 1,084,925 | — | — | — | 1,084,925 |
| Utilities | 7,754,821 | — | — | — | 7,754,821 |
| Total Common Stocks | 207,333,540 | — | — | — | 207,333,540 |
| Money Market Funds | — | — | — | 1,952,238 | 1,952,238 |
| Total Investments | 207,333,540 | — | — | 1,952,238 | 209,285,778 |
| Derivatives | | | | | |
| Asset | | | | | |
| Futures Contracts | 5,398 | — | — | — | 5,398 |
| Liability | | | | | |
| Futures Contracts | (35,577) | — | — | — | (35,577) |
| Total | 207,303,361 | — | — | 1,952,238 | 209,255,599 |
See the Portfolio of Investments for all investment classifications not indicated in the table.
Derivative instruments are valued at unrealized appreciation (depreciation).
There were no transfers of financial assets between levels during the period.
The accompanying Notes to Financial Statements are an integral part of this statement.
| 14 | Columbia Disciplined Small Core Fund | Annual Report 2017 |
Statement of Assets and Liabilities
August 31, 2017
| Assets | |
| Investments in unaffiliated issuers, at cost | $183,159,176 |
| Investments in affiliated issuers, at cost | 1,952,189 |
| Investments in unaffiliated issuers, at value | 207,333,540 |
| Investments in affiliated issuers, at value | 1,952,238 |
| Margin deposits on: | |
| Futures contracts | 137,350 |
| Receivable for: | |
| Investments sold | 1,126,191 |
| Capital shares sold | 14,932 |
| Dividends | 185,757 |
| Variation margin for futures contracts | 27,675 |
| Expense reimbursement due from Investment Manager | 73 |
| Prepaid expenses | 1,539 |
| Trustees’ deferred compensation plan | 94,578 |
| Total assets | 210,873,873 |
| Liabilities | |
| Due to custodian | 50 |
| Payable for: | |
| Investments purchased | 1,145,687 |
| Capital shares purchased | 305,762 |
| Management services fees | 4,841 |
| Distribution and/or service fees | 987 |
| Transfer agent fees | 31,820 |
| Compensation of board members | 454 |
| Compensation of chief compliance officer | 16 |
| Other expenses | 46,973 |
| Trustees’ deferred compensation plan | 94,578 |
| Total liabilities | 1,631,168 |
| Net assets applicable to outstanding capital stock | $209,242,705 |
| Represented by | |
| Paid in capital | 151,237,549 |
| Undistributed net investment income | 8,382 |
| Accumulated net realized gain | 33,852,540 |
| Unrealized appreciation (depreciation) on: | |
| Investments - unaffiliated issuers | 24,174,364 |
| Investments - affiliated issuers | 49 |
| Futures contracts | (30,179) |
| Total - representing net assets applicable to outstanding capital stock | $209,242,705 |
The accompanying Notes to Financial Statements are an integral part of this statement.
Columbia Disciplined Small Core Fund | Annual Report 2017
| 15 |
Statement of Assets and Liabilities (continued)
August 31, 2017
| Class A | |
| Net assets | $48,138,400 |
| Shares outstanding | 5,699,782 |
| Net asset value per share | $8.45 |
| Maximum offering price per share(a) | $8.97 |
| Class C | |
| Net assets | $10,530,444 |
| Shares outstanding | 2,021,669 |
| Net asset value per share | $5.21 |
| Class R4 | |
| Net assets | $667,440 |
| Shares outstanding | 70,301 |
| Net asset value per share | $9.49 |
| Class R5 | |
| Net assets | $2,751,252 |
| Shares outstanding | 287,699 |
| Net asset value per share | $9.56 |
| Class T(b) | |
| Net assets | $142,874 |
| Shares outstanding | 16,920 |
| Net asset value per share | $8.44 |
| Maximum offering price per share(c) | $8.66 |
| Class V(d) | |
| Net assets | $54,908,156 |
| Shares outstanding | 6,851,693 |
| Net asset value per share | $8.01 |
| Maximum offering price per share(e) | $8.50 |
| Class Y | |
| Net assets | $48,688,716 |
| Shares outstanding | 5,042,061 |
| Net asset value per share | $9.66 |
| Class Z | |
| Net assets | $43,415,423 |
| Shares outstanding | 4,666,731 |
| Net asset value per share | $9.30 |
| (a) | The maximum offering price per share is calculated by dividing the net asset value per share by 1.0 minus the maximum sales charge of 5.75% for Class A. |
| (b) | Prior to March 27, 2017, Class T shares were known as Class W shares. |
| (c) | The maximum offering price per share is calculated by dividing the net asset value per share by 1.0 minus the maximum sales charge of 2.50% for Class T. |
| (d) | Prior to January 24, 2017, Class V shares were known as Class T shares. |
| (e) | The maximum offering price per share is calculated by dividing the net asset value per share by 1.0 minus the maximum sales charge of 5.75% for Class V. |
The accompanying Notes to Financial Statements are an integral part of this statement.
| 16 | Columbia Disciplined Small Core Fund | Annual Report 2017 |
Statement of Operations
Year Ended August 31, 2017
| Net investment income | |
| Income: | |
| Dividends — unaffiliated issuers | $3,943,819 |
| Dividends — affiliated issuers | 37,422 |
| Interest | 1,361 |
| Total income | 3,982,602 |
| Expenses: | |
| Management services fees | 2,120,260 |
| Distribution and/or service fees | |
| Class A | 154,484 |
| Class B(a) | 1,060 |
| Class C | 130,463 |
| Class T(b) | 459 |
| Class V(c) | 146,821 |
| Transfer agent fees | |
| Class A | 123,803 |
| Class B(a) | 215 |
| Class C | 26,142 |
| Class I(d) | 1,223 |
| Class R4 | 2,984 |
| Class R5 | 1,731 |
| Class T(b) | 368 |
| Class V(c) | 117,561 |
| Class Y | 2,441 |
| Class Z | 107,300 |
| Compensation of board members | 22,252 |
| Custodian fees | 16,331 |
| Printing and postage fees | 50,997 |
| Registration fees | 133,700 |
| Audit fees | 33,740 |
| Legal fees | 6,957 |
| Compensation of chief compliance officer | 106 |
| Other | 5,330 |
| Total expenses | 3,206,728 |
| Fees waived or expenses reimbursed by Investment Manager and its affiliates | (104,936) |
| Fees waived by transfer agent | |
| Class I(d) | (1,221) |
| Class R5 | (278) |
| Class Y | (2,441) |
| Expense reduction | (1,680) |
| Total net expenses | 3,096,172 |
| Net investment income | 886,430 |
| Realized and unrealized gain (loss) — net | |
| Net realized gain (loss) on: | |
| Investments — unaffiliated issuers | 37,373,322 |
| Investments — affiliated issuers | (315) |
| Futures contracts | 1,196,060 |
| Net realized gain | 38,569,067 |
| Net change in unrealized appreciation (depreciation) on: | |
| Investments — unaffiliated issuers | (17,022,458) |
| Investments — affiliated issuers | 49 |
| Futures contracts | (319,063) |
| Net change in unrealized appreciation (depreciation) | (17,341,472) |
| Net realized and unrealized gain | 21,227,595 |
| Net increase in net assets resulting from operations | $22,114,025 |
The accompanying Notes to Financial Statements are an integral part of this statement.
Columbia Disciplined Small Core Fund | Annual Report 2017
| 17 |
Statement of Operations (continued)
Year Ended August 31, 2017
| (a) | Effective July 17, 2017, Class B shares were automatically converted to Class A shares. |
| (b) | Prior to March 27, 2017, Class T shares were known as Class W shares. |
| (c) | Prior to January 24, 2017, Class V shares were known as Class T shares. |
| (d) | Effective March 27, 2017, Class I shares were redeemed or exchanged for Class Y shares. |
The accompanying Notes to Financial Statements are an integral part of this statement.
| 18 | Columbia Disciplined Small Core Fund | Annual Report 2017 |
Statement of Changes in Net Assets
| | Year Ended
August 31, 2017 | Year Ended
August 31, 2016 |
| Operations | | |
| Net investment income | $886,430 | $460,519 |
| Net realized gain | 38,569,067 | 101,643,329 |
| Net change in unrealized appreciation (depreciation) | (17,341,472) | (94,554,179) |
| Net increase in net assets resulting from operations | 22,114,025 | 7,549,669 |
| Distributions to shareholders | | |
| Net investment income | | |
| Class A | (173,000) | (42,433) |
| Class I(a) | (274,529) | (97,723) |
| Class R4 | (9,829) | (6,447) |
| Class R5 | (14,276) | (16,055) |
| Class T(b) | (503) | (98) |
| Class V(c) | (144,072) | (22,349) |
| Class Y | (36,572) | (8,228) |
| Class Z | (261,063) | (197,294) |
| Net realized gains | | |
| Class A | (25,795,429) | (41,007,362) |
| Class B(d) | (81,231) | (117,350) |
| Class C | (6,630,145) | (8,161,786) |
| Class I(a) | (15,779,743) | (17,649,677) |
| Class R4 | (743,122) | (1,795,378) |
| Class R5 | (886,918) | (3,070,456) |
| Class T(b) | (75,007) | (95,357) |
| Class V(c) | (21,482,049) | (21,646,956) |
| Class Y | (2,102,102) | (1,486,132) |
| Class Z | (19,737,710) | (54,942,603) |
| Total distributions to shareholders | (94,227,300) | (150,363,684) |
| Increase (decrease) in net assets from capital stock activity | 8,949,070 | (127,856,394) |
| Total decrease in net assets | (63,164,205) | (270,670,409) |
| Net assets at beginning of year | 272,406,910 | 543,077,319 |
| Net assets at end of year | $209,242,705 | $272,406,910 |
| Undistributed net investment income | $8,382 | $34,621 |
| (a) | Effective March 27, 2017, Class I shares were redeemed or exchanged for Class Y shares. |
| (b) | Prior to March 27, 2017, Class T shares were known as Class W shares. |
| (c) | Prior to January 24, 2017, Class V shares were known as Class T shares. |
| (d) | Effective July 17, 2017, Class B shares were automatically converted to Class A shares. |
The accompanying Notes to Financial Statements are an integral part of this statement.
Columbia Disciplined Small Core Fund | Annual Report 2017
| 19 |
Statement of Changes in Net Assets (continued)
| | Year Ended | Year Ended |
| | August 31, 2017 | August 31, 2016 |
| | Shares | Dollars ($) | Shares | Dollars ($) |
| Capital stock activity |
| Class A(a) | | | | |
| Subscriptions (b) | 1,395,615 | 13,466,068 | 1,934,628 | 25,392,156 |
| Distributions reinvested | 2,570,210 | 21,641,165 | 2,803,173 | 32,656,967 |
| Redemptions | (4,567,051) | (41,417,051) | (6,661,023) | (81,658,515) |
| Net decrease | (601,226) | (6,309,818) | (1,923,222) | (23,609,392) |
| Class B(a) | | | | |
| Subscriptions | 1,583 | 8,231 | 1,204 | 10,534 |
| Distributions reinvested | 13,901 | 72,284 | 12,117 | 106,020 |
| Redemptions (b) | (36,701) | (205,142) | (14,753) | (128,703) |
| Net decrease | (21,217) | (124,627) | (1,432) | (12,149) |
| Class C | | | | |
| Subscriptions | 301,372 | 1,668,145 | 326,960 | 2,898,107 |
| Distributions reinvested | 1,083,432 | 5,655,516 | 766,645 | 6,723,479 |
| Redemptions | (1,134,058) | (6,899,588) | (946,397) | (8,788,360) |
| Net increase | 250,746 | 424,073 | 147,208 | 833,226 |
| Class I(c) | | | | |
| Subscriptions | 76,704 | 755,431 | 128,810 | 1,611,892 |
| Distributions reinvested | 1,707,843 | 16,053,727 | 1,415,208 | 17,746,703 |
| Redemptions | (5,737,203) | (55,036,426) | (766,234) | (9,005,922) |
| Net increase (decrease) | (3,952,656) | (38,227,268) | 777,784 | 10,352,673 |
| Class R4 | | | | |
| Subscriptions | 48,626 | 496,792 | 64,675 | 865,322 |
| Distributions reinvested | 79,677 | 752,951 | 123,477 | 1,554,576 |
| Redemptions | (286,796) | (3,010,875) | (306,694) | (3,972,825) |
| Net decrease | (158,493) | (1,761,132) | (118,542) | (1,552,927) |
| Class R5 | | | | |
| Subscriptions | 261,636 | 2,593,182 | 103,468 | 1,514,306 |
| Distributions reinvested | 94,763 | 901,194 | 244,186 | 3,086,511 |
| Redemptions | (292,523) | (2,896,262) | (856,763) | (11,712,420) |
| Net increase (decrease) | 63,876 | 598,114 | (509,109) | (7,111,603) |
| Class T(d) | | | | |
| Distributions reinvested | 8,903 | 74,960 | 8,133 | 94,747 |
| Redemptions | (10,820) | (96,299) | (7,581) | (88,866) |
| Net increase (decrease) | (1,917) | (21,339) | 552 | 5,881 |
| Class V(e) | | | | |
| Subscriptions | 686,076 | 5,495,087 | 481,678 | 5,434,670 |
| Distributions reinvested | 1,935,736 | 15,466,654 | 1,347,343 | 15,171,084 |
| Redemptions | (1,033,029) | (9,280,706) | (557,218) | (6,439,026) |
| Net increase | 1,588,783 | 11,681,035 | 1,271,803 | 14,166,728 |
| Class Y(c) | | | | |
| Subscriptions | 5,089,953 | 48,792,250 | 451,574 | 6,356,601 |
| Distributions reinvested | 222,723 | 2,138,140 | 117,428 | 1,493,679 |
| Redemptions | (791,106) | (7,979,352) | (218,761) | (2,941,917) |
| Net increase | 4,521,570 | 42,951,038 | 350,241 | 4,908,363 |
| Class Z | | | | |
| Subscriptions | 2,467,312 | 25,523,795 | 1,531,872 | 19,340,619 |
| Distributions reinvested | 1,446,011 | 13,390,059 | 1,858,542 | 23,064,501 |
| Redemptions | (3,919,368) | (39,174,860) | (12,422,033) | (168,242,314) |
| Net decrease | (6,045) | (261,006) | (9,031,619) | (125,837,194) |
| Total net increase (decrease) | 1,683,421 | 8,949,070 | (9,036,336) | (127,856,394) |
The accompanying Notes to Financial Statements are an integral part of this statement.
| 20 | Columbia Disciplined Small Core Fund | Annual Report 2017 |
Statement of Changes in Net Assets (continued)
| (a) | Effective July 17, 2017, Class B shares were automatically converted to Class A shares. |
| (b) | Includes conversions of Class B shares to Class A shares, if any. |
| (c) | Effective March 27, 2017, Class I shares were redeemed or exchanged for Class Y shares. |
| (d) | Prior to March 27, 2017, Class T shares were known as Class W shares. |
| (e) | Prior to January 24, 2017, Class V shares were known as Class T shares. |
The accompanying Notes to Financial Statements are an integral part of this statement.
Columbia Disciplined Small Core Fund | Annual Report 2017
| 21 |
The following table is intended to help you understand the Fund’s financial performance. Certain information reflects financial results for a single share of a class held for the periods shown. Per share net investment income (loss) amounts are calculated based on average shares outstanding during the period. Total return assumes reinvestment of all dividends and distributions, if any. Total return does not reflect payment of sales charges, if any. Total return and portfolio turnover are not annualized for periods of less than one year. The portfolio turnover rate is calculated without regard to purchase and sales transactions of short-term instruments and certain derivatives, if any. If such transactions were included, the Fund’s portfolio turnover rate may be higher.
| Year ended | Net asset value,
beginning of
period | Net
investment
income
(loss) | Net
realized
and
unrealized
gain (loss) | Total from
investment
operations | Distributions
from net
investment
income | Distributions
from net
realized
gains |
| Class A |
| 8/31/2017 | $11.81 | 0.02 | 0.94 | 0.96 | (0.03) | (4.29) |
| 8/31/2016 | $16.72 | 0.00 (e) | 0.65 | 0.65 | (0.01) | (5.55) |
| 8/31/2015 | $19.57 | (0.06) | (1.21) | (1.27) | (0.01) | (1.57) |
| 8/31/2014 | $18.57 | (0.06) | 2.73 | 2.67 | (0.01) | (1.66) |
| 8/31/2013 | $15.05 | (0.01) | 4.08 | 4.07 | (0.06) | (0.49) |
| Class C |
| 8/31/2017 | $8.84 | (0.03) | 0.69 | 0.66 | — | (4.29) |
| 8/31/2016 | $13.93 | (0.07) | 0.53 | 0.46 | — | (5.55) |
| 8/31/2015 | $16.68 | (0.17) | (1.01) | (1.18) | — | (1.57) |
| 8/31/2014 | $16.15 | (0.18) | 2.37 | 2.19 | — | (1.66) |
| 8/31/2013 | $13.20 | (0.10) | 3.54 | 3.44 | — | (0.49) |
| Class R4 |
| 8/31/2017 | $12.79 | 0.05 | 0.99 | 1.04 | (0.05) | (4.29) |
| 8/31/2016 | $17.63 | 0.03 | 0.70 | 0.73 | (0.02) | (5.55) |
| 8/31/2015 | $20.51 | (0.02) | (1.26) | (1.28) | (0.03) | (1.57) |
| 8/31/2014 | $19.37 | (0.02) | 2.86 | 2.84 | (0.04) | (1.66) |
| 8/31/2013 (g) | $15.57 | (0.05) | 4.45 | 4.40 | (0.11) | (0.49) |
| Class R5 |
| 8/31/2017 | $12.85 | 0.06 | 1.01 | 1.07 | (0.07) | (4.29) |
| 8/31/2016 | $17.68 | 0.05 | 0.70 | 0.75 | (0.03) | (5.55) |
| 8/31/2015 | $20.55 | 0.02 | (1.28) | (1.26) | (0.04) | (1.57) |
| 8/31/2014 | $19.38 | 0.02 | 2.87 | 2.89 | (0.06) | (1.66) |
| 8/31/2013 (i) | $15.57 | (0.05) | 4.47 | 4.42 | (0.12) | (0.49) |
| Class T(j) |
| 8/31/2017 | $11.81 | 0.02 | 0.93 | 0.95 | (0.03) | (4.29) |
| 8/31/2016 | $16.72 | 0.00 (e) | 0.65 | 0.65 | (0.01) | (5.55) |
| 8/31/2015 | $19.57 | (0.09) | (1.18) | (1.27) | (0.01) | (1.57) |
| 8/31/2014 | $18.57 | (0.06) | 2.73 | 2.67 | (0.01) | (1.66) |
| 8/31/2013 | $15.05 | 0.01 | 4.06 | 4.07 | (0.06) | (0.49) |
The accompanying Notes to Financial Statements are an integral part of this statement.
| 22 | Columbia Disciplined Small Core Fund | Annual Report 2017 |
Total
distributions to
shareholders | Net
asset
value,
end of
period | Total
return | Total gross
expense
ratio to
average
net assets(a) | Total net
expense
ratio to
average
net assets(a),(b) | Net investment
income (loss)
ratio to
average
net assets | Portfolio
turnover | Net
assets,
end of
period
(000’s) |
| |
| (4.32) | $8.45 | 8.22% | 1.42% (c) | 1.37% (c),(d) | 0.26% | 87% | $48,138 |
| (5.56) | $11.81 | 4.32% | 1.39% | 1.38% (d) | 0.01% | 112% | $74,434 |
| (1.58) | $16.72 | (6.81%) | 1.36% | 1.36% (d) | (0.35%) | 23% | $137,486 |
| (1.67) | $19.57 | 14.73% | 1.35% (f) | 1.35% (d),(f) | (0.32%) | 19% | $418,814 |
| (0.55) | $18.57 | 27.93% | 1.37% (f) | 1.36% (d),(f) | (0.07%) | 34% | $399,232 |
| |
| (4.29) | $5.21 | 7.34% | 2.17% (c) | 2.12% (c),(d) | (0.49%) | 87% | $10,530 |
| (5.55) | $8.84 | 3.62% | 2.14% | 2.13% (d) | (0.73%) | 112% | $15,654 |
| (1.57) | $13.93 | (7.53%) | 2.11% | 2.11% (d) | (1.09%) | 23% | $22,625 |
| (1.66) | $16.68 | 13.90% | 2.10% (f) | 2.10% (d),(f) | (1.06%) | 19% | $31,035 |
| (0.49) | $16.15 | 26.95% | 2.11% (f) | 2.11% (d),(f) | (0.71%) | 34% | $29,769 |
| |
| (4.34) | $9.49 | 8.30% | 1.16% (c) | 1.12% (c),(d) | 0.47% | 87% | $667 |
| (5.57) | $12.79 | 4.64% | 1.14% | 1.13% (d) | 0.26% | 112% | $2,926 |
| (1.60) | $17.63 | (6.56%) | 1.11% | 1.11% (d) | (0.09%) | 23% | $6,123 |
| (1.70) | $20.51 | 15.02% | 1.10% (f) | 1.10% (d),(f) | (0.09%) | 19% | $7,124 |
| (0.60) | $19.37 | 29.18% | 1.12% (f),(h) | 1.12% (d),(f),(h) | (0.31%) (h) | 34% | $903 |
| |
| (4.36) | $9.56 | 8.47% | 1.04% (c) | 1.02% (c) | 0.57% | 87% | $2,751 |
| (5.58) | $12.85 | 4.76% | 0.98% | 0.98% | 0.35% | 112% | $2,876 |
| (1.61) | $17.68 | (6.43%) | 0.93% | 0.93% | 0.10% | 23% | $12,955 |
| (1.72) | $20.55 | 15.30% | 0.90% (f) | 0.90% (f) | 0.11% | 19% | $27,726 |
| (0.61) | $19.38 | 29.36% | 0.94% (f),(h) | 0.94% (f),(h) | (0.32%) (h) | 34% | $16,704 |
| |
| (4.32) | $8.44 | 8.09% | 1.42% (c) | 1.37% (c),(d) | 0.26% | 87% | $143 |
| (5.56) | $11.81 | 4.32% | 1.39% | 1.38% (d) | 0.02% | 112% | $223 |
| (1.58) | $16.72 | (6.80%) | 1.30% | 1.30% (d) | (0.44%) | 23% | $306 |
| (1.67) | $19.57 | 14.73% | 1.35% (f) | 1.35% (d),(f) | (0.32%) | 19% | $69,033 |
| (0.55) | $18.57 | 27.93% | 1.36% (f) | 1.36% (d),(f) | 0.05% | 34% | $60,353 |
Columbia Disciplined Small Core Fund | Annual Report 2017
| 23 |
Financial Highlights (continued)
| Year ended | Net asset value,
beginning of
period | Net
investment
income
(loss) | Net
realized
and
unrealized
gain (loss) | Total from
investment
operations | Distributions
from net
investment
income | Distributions
from net
realized
gains |
| Class V(k) |
| 8/31/2017 | $11.41 | 0.02 | 0.90 | 0.92 | (0.03) | (4.29) |
| 8/31/2016 | $16.33 | 0.00 (e) | 0.64 | 0.64 | (0.01) | (5.55) |
| 8/31/2015 | $19.16 | (0.06) | (1.19) | (1.25) | (0.01) | (1.57) |
| 8/31/2014 | $18.21 | (0.07) | 2.68 | 2.61 | (0.00) (e) | (1.66) |
| 8/31/2013 | $14.77 | (0.00) (e) | 3.99 | 3.99 | (0.06) | (0.49) |
| Class Y |
| 8/31/2017 | $12.94 | 0.06 | 1.02 | 1.08 | (0.07) | (4.29) |
| 8/31/2016 | $17.76 | 0.06 | 0.70 | 0.76 | (0.03) | (5.55) |
| 8/31/2015 | $20.63 | 0.03 | (1.29) | (1.26) | (0.04) | (1.57) |
| 8/31/2014 | $19.45 | 0.03 | 2.88 | 2.91 | (0.07) | (1.66) |
| 8/31/2013 (l) | $15.63 | 0.02 | 4.42 | 4.44 | (0.13) | (0.49) |
| Class Z |
| 8/31/2017 | $12.61 | 0.05 | 0.98 | 1.03 | (0.05) | (4.29) |
| 8/31/2016 | $17.46 | 0.03 | 0.69 | 0.72 | (0.02) | (5.55) |
| 8/31/2015 | $20.33 | (0.02) | (1.25) | (1.27) | (0.03) | (1.57) |
| 8/31/2014 | $19.21 | (0.01) | 2.83 | 2.82 | (0.04) | (1.66) |
| 8/31/2013 | $15.56 | 0.05 | 4.19 | 4.24 | (0.10) | (0.49) |
| Notes to Financial Highlights |
| (a) | In addition to the fees and expenses that the Fund bears directly, the Fund indirectly bears a pro rata share of the fees and expenses of any other funds in which it invests. Such indirect expenses are not included in the Fund’s reported expense ratios. |
| (b) | Total net expenses include the impact of certain fee waivers/expense reimbursements made by the Investment Manager and certain of its affiliates, if applicable. |
| (c) | Expenses have been reduced due to a reimbursement of expenses overbilled by a third party. If the reimbursement had been excluded, the expense ratios would have been higher by the percentages shown for each class in the table below. All fee waivers and expense reimbursements by the Investment Manager and its affiliates were applied before giving effect to this third party reimbursement. |
| | Class A | Class C | Class R4 | Class R5 | Class T | Class V | Class Z |
| 08/31/2017 | 0.01 % | 0.01 % | 0.01 % | 0.01 % | 0.01 % | 0.01 % | 0.01 % |
| (d) | The benefits derived from expense reductions had an impact of less than 0.01%. |
| (e) | Rounds to zero. |
| (f) | Ratios include line of credit interest expense which is less than 0.01%. |
| (g) | Class R4 shares commenced operations on November 8, 2012. Per share data and total return reflect activity from that date. |
| (h) | Annualized. |
| (i) | Class R5 shares commenced operations on November 8, 2012. Per share data and total return reflect activity from that date. |
| (j) | Prior to March 27, 2017, Class T shares were known as Class W shares. |
| (k) | Prior to January 24, 2017, Class V shares were known as Class T shares. |
| (l) | Class Y shares commenced operations on November 8, 2012. Per share data and total return reflect activity from that date. |
The accompanying Notes to Financial Statements are an integral part of this statement.
| 24 | Columbia Disciplined Small Core Fund | Annual Report 2017 |
Total
distributions to
shareholders | Net
asset
value,
end of
period | Total
return | Total gross
expense
ratio to
average
net assets(a) | Total net
expense
ratio to
average
net assets(a),(b) | Net investment
income (loss)
ratio to
average
net assets | Portfolio
turnover | Net
assets,
end of
period
(000’s) |
| |
| (4.32) | $8.01 | 8.12% | 1.43% (c) | 1.37% (c),(d) | 0.25% | 87% | $54,908 |
| (5.56) | $11.41 | 4.35% | 1.39% | 1.38% (d) | 0.03% | 112% | $60,071 |
| (1.58) | $16.33 | (6.87%) | 1.38% | 1.38% (d) | (0.36%) | 23% | $65,184 |
| (1.66) | $19.16 | 14.71% | 1.40% (f) | 1.40% (d),(f) | (0.36%) | 19% | $78,860 |
| (0.55) | $18.21 | 27.86% | 1.41% (f) | 1.41% (d),(f) | (0.01%) | 34% | $76,011 |
| |
| (4.36) | $9.66 | 8.57% | 1.00% | 0.98% | 0.57% | 87% | $48,689 |
| (5.58) | $12.94 | 4.83% | 0.94% | 0.94% | 0.49% | 112% | $6,736 |
| (1.61) | $17.76 | (6.39%) | 0.88% | 0.88% | 0.17% | 23% | $3,024 |
| (1.73) | $20.63 | 15.33% | 0.87% (f) | 0.87% (f) | 0.16% | 19% | $14,600 |
| (0.62) | $19.45 | 29.37% | 0.88% (f),(h) | 0.88% (f),(h) | 0.07% (h) | 34% | $11,301 |
| |
| (4.34) | $9.30 | 8.34% | 1.18% (c) | 1.12% (c),(d) | 0.50% | 87% | $43,415 |
| (5.57) | $12.61 | 4.64% | 1.14% | 1.13% (d) | 0.22% | 112% | $58,911 |
| (1.60) | $17.46 | (6.56%) | 1.11% | 1.11% (d) | (0.09%) | 23% | $239,255 |
| (1.70) | $20.33 | 15.04% | 1.10% (f) | 1.10% (d),(f) | (0.06%) | 19% | $466,376 |
| (0.59) | $19.21 | 28.17% | 1.11% (f) | 1.11% (d),(f) | 0.30% | 34% | $481,061 |
Columbia Disciplined Small Core Fund | Annual Report 2017
| 25 |
Notes to Financial Statements
August 31, 2017
Note 1. Organization
Columbia Disciplined Small Core Fund (the Fund), a series of Columbia Funds Series Trust I (the Trust), is a diversified fund. The Trust is registered under the Investment Company Act of 1940, as amended (the 1940 Act), as an open-end management investment company organized as a Massachusetts business trust.
Fund shares
The Trust may issue an unlimited number of shares (without par value). Although all share classes generally have identical voting, dividend and liquidation rights, each share class votes separately when required by the Trust’s organizational documents or by law. Different share classes pay different distribution amounts to the extent the expenses of such share classes differ, and distributions in liquidation will be proportional to the net asset value of each share class. Each share class has its own expense and sales charge structure. The Fund offers each of the share classes identified below.
Class A shares are subject to a maximum front-end sales charge of 5.75% based on the initial investment amount. Class A shares purchased without an initial sales charge in accounts aggregating $1 million to $50 million at the time of purchase are subject to a contingent deferred sales charge (CDSC) if the shares are sold within 18 months after purchase, charged as follows: 1.00% CDSC if redeemed within 12 months after purchase, and 0.50% CDSC if redeemed more than 12, but less than 18, months after purchase.
Class B shares of the Fund are no longer offered for sale. When available, Class B shares were subject to a maximum CDSC of 5.00% based upon the holding period after purchase. Effective July 17, 2017, Class B shares were automatically converted to Class A shares without a CDSC. On August 4, 2017, the capital owned by Columbia Management Investment Advisers, LLC in Class B shares was redeemed without a CDSC.
Class C shares are subject to a 1.00% CDSC on shares redeemed within 12 months after purchase.
The Fund no longer accepts investments by new or existing investors in Class I shares. Class I shares, when available, were not subject to sales charges, and were made available only to the Columbia Family of Funds. On March 27, 2017, Class I shares were redeemed or exchanged for Class Y shares of the Fund in a tax free transaction that had no impact on the fees and expenses paid by shareholders.
Class R4 shares are not subject to sales charges and are generally available only to omnibus retirement plans and certain investors as described in the Fund’s prospectus. Effective November 1, 2017, Class R4 shares will be renamed Advisor Class shares.
Class R5 shares are not subject to sales charges and are generally available only to investors purchasing through authorized investment professionals and omnibus retirement plans as described in the Fund’s prospectus. Effective November 1, 2017, Class R5 shares will be renamed Institutional 2 Class shares.
Class T shares are subject to a maximum front-end sales charge of 2.50% per transaction and must be purchased through financial intermediaries that, by written agreement with Columbia Management Investment Distributors, Inc., are specifically authorized to sell Class T shares. Prior to March 27, 2017, Class T shares were known as Class W shares, were not subject to sales charges, and were generally available only to investors purchasing through authorized investment programs managed by investment professionals, including discretionary managed accounts.
Class V shares are subject to a maximum front-end sales charge of 5.75% based on the investment amount. Class V shares purchased without an initial sales charge in accounts aggregating $1 million to $50 million at the time of purchase are subject to a CDSC if the shares are sold within 18 months after purchase, charged as follows: 1.00% CDSC if redeemed within 12 months after purchase, and 0.50% CDSC if redeemed more than 12, but less than 18, months after purchase. Class V shares are available only to investors who received (and who have continuously held) Class V shares in connection with previous fund reorganizations. Prior to January 24, 2017, Class V shares were known as Class T shares. Class V shares have no relation to, or connection with, the Fund’s current Class T shares.
Class Y shares are not subject to sales charges and are available to institutional and certain other investors as described in the Fund’s prospectus. Effective November 1, 2017, Class Y shares will be renamed Institutional 3 Class shares.
| 26 | Columbia Disciplined Small Core Fund | Annual Report 2017 |
Notes to Financial Statements (continued)
August 31, 2017
Class Z shares are not subject to sales charges and are generally available only to eligible investors, which are subject to different investment minimums as described in the Fund’s prospectus. Effective November 1, 2017, Class Z shares will be renamed Institutional Class shares.
Note 2. Summary of significant accounting policies
Basis of preparation
The Fund is an investment company that applies the accounting and reporting guidance in the Financial Accounting Standards Board (FASB) Accounting Standards Codification Topic 946, Financial Services - Investment Companies (ASC 946). The financial statements are prepared in accordance with U.S. generally accepted accounting principles (GAAP), which requires management to make certain estimates and assumptions that affect the reported amounts of assets and liabilities, the disclosure of contingent assets and liabilities at the date of the financial statements and the reported amounts of income and expenses during the reporting period. Actual results could differ from those estimates.
The following is a summary of significant accounting policies followed by the Fund in the preparation of its financial statements.
Security valuation
All equity securities are valued at the close of business of the New York Stock Exchange. Equity securities are valued at the last quoted sales price on the principal exchange or market on which they trade, except for securities traded on the NASDAQ Stock Market, which are valued at the NASDAQ official close price. Unlisted securities or listed securities for which there were no sales during the day are valued at the mean of the latest quoted bid and ask prices on such exchanges or markets.
Foreign equity securities are valued based on the closing price on the foreign exchange in which such securities are primarily traded. If any foreign equity security closing prices are not readily available, the securities are valued at the mean of the latest quoted bid and ask prices on such exchanges or markets. Foreign currency exchange rates are generally determined at 4:00 p.m. Eastern (U.S.) time. Many securities markets and exchanges outside the U.S. close prior to the close of the New York Stock Exchange; therefore, the closing prices for securities in such markets or on such exchanges may not fully reflect events that occur after such close but before the close of the New York Stock Exchange. In those situations, foreign securities will be fair valued pursuant to a policy adopted by the Board of Trustees, including, if available, utilizing a third party pricing service to determine these fair values. The third party pricing service takes into account multiple factors, including, but not limited to, movements in the U.S. securities markets, certain depositary receipts, futures contracts and foreign exchange rates that have occurred subsequent to the close of the foreign exchange or market, to determine a good faith estimate that reasonably reflects the current market conditions as of the close of the New York Stock Exchange. The fair value of a security is likely to be different from the quoted or published price, if available.
Investments in open-end investment companies, including money market funds, are valued at their latest net asset value.
Futures and options on futures contracts are valued based upon the settlement price at the close of regular trading on their principal exchanges or, in the absence of transactions, at the mean of the latest quoted bid and ask prices.
Investments for which market quotations are not readily available, or that have quotations which management believes are not reflective of market value or reliable, are valued at fair value as determined in good faith under procedures approved by and under the general supervision of the Board of Trustees. If a security or class of securities (such as foreign securities) is valued at fair value, such value is likely to be different from the quoted or published price for the security.
The determination of fair value often requires significant judgment. To determine fair value, management may use assumptions including but not limited to future cash flows and estimated risk premiums. Multiple inputs from various sources may be used to determine fair value.
GAAP requires disclosure regarding the inputs and valuation techniques used to measure fair value and any changes in valuation inputs or techniques. In addition, investments shall be disclosed by major category. This information is disclosed following the Fund’s Portfolio of Investments.
Columbia Disciplined Small Core Fund | Annual Report 2017
| 27 |
Notes to Financial Statements (continued)
August 31, 2017
Derivative instruments
The Fund invests in certain derivative instruments, as detailed below, to meet its investment objectives. Derivatives are instruments whose values depend on, or are derived from, in whole or in part, the value of one or more securities, currencies, commodities, indices, or other assets or instruments. Derivatives may be used to increase investment flexibility (including to maintain cash reserves while maintaining desired exposure to certain assets), for risk management (hedging) purposes, to facilitate trading, to reduce transaction costs and to pursue higher investment returns. The Fund may also use derivative instruments to mitigate certain investment risks, such as foreign currency exchange rate risk, interest rate risk and credit risk. Derivatives may involve various risks, including the potential inability of the counterparty to fulfill its obligations under the terms of the contract, the potential for an illiquid secondary market (making it difficult for the Fund to sell or terminate, including at favorable prices) and the potential for market movements which may expose the Fund to gains or losses in excess of the amount shown in the Statement of Assets and Liabilities. The notional amounts of derivative instruments, if applicable, are not recorded in the financial statements.
A derivative instrument may suffer a marked-to-market loss if the value of the contract decreases due to an unfavorable change in the market rates or values of the underlying instrument. Losses can also occur if the counterparty does not perform its obligations under the contract. The Fund’s risk of loss from counterparty credit risk on over-the-counter derivatives is generally limited to the aggregate unrealized gain netted against any collateral held by the Fund and the amount of any variation margin held by the counterparty, plus any replacement costs or related amounts. With exchange-traded or centrally cleared derivatives, there is reduced counterparty credit risk to the Fund since the clearinghouse or central counterparty (CCP) provides some protection in the case of clearing member default. The clearinghouse or CCP stands between the buyer and the seller of the contract; therefore, additional counterparty credit risk is failure of the clearinghouse or CCP. However, credit risk still exists in exchange-traded or centrally cleared derivatives with respect to initial and variation margin that is held in a broker’s customer account. While brokers are required to segregate customer margin from their own assets, in the event that a broker becomes insolvent or goes into bankruptcy and at that time there is a shortfall in the aggregate amount of margin held by the broker for all its clients, U.S. bankruptcy laws will typically allocate that shortfall on a pro-rata basis across all the broker’s customers (including the Fund), potentially resulting in losses to the Fund.
In order to better define its contractual rights and to secure rights that will help the Fund mitigate its counterparty risk, the Fund may enter into an International Swaps and Derivatives Association, Inc. Master Agreement (ISDA Master Agreement) or similar agreement with its derivatives contract counterparties. An ISDA Master Agreement is an agreement between the Fund and a counterparty that governs over-the-counter derivatives and typically contains, among other things, collateral posting terms and netting provisions in the event of a default and/or termination event. Under an ISDA Master Agreement, the Fund may, under certain circumstances, offset with the counterparty certain derivative instrument’s payables and/or receivables with collateral held and/or posted and create one single net payment. The provisions of the ISDA Master Agreement typically permit a single net payment in the event of default (close-out netting), including the bankruptcy or insolvency of the counterparty. Note, however, that bankruptcy or insolvency laws of a particular jurisdiction may impose restrictions on or prohibitions against the right of offset or netting in bankruptcy, insolvency or other events.
Collateral (margin) requirements differ by type of derivative. Margin requirements are established by the clearinghouse or CCP for exchange-traded and centrally cleared derivatives. Brokers can ask for margin in excess of the minimum in certain circumstances. Collateral terms are contract specific for over-the-counter derivatives. For over-the-counter derivatives traded under an ISDA Master Agreement, the collateral requirements are typically calculated by netting the marked-to-market amount for each transaction under such agreement and comparing that amount to the value of any variation margin currently pledged by the Fund and/or the counterparty. Generally, the amount of collateral due from or to a party has to exceed a minimum transfer amount threshold (e.g., $250,000) before a transfer has to be made. To the extent amounts due to the Fund from its counterparties are not fully collateralized, contractually or otherwise, the Fund bears the risk of loss from counterparty nonperformance. The Fund attempts to mitigate counterparty risk by only entering into agreements with counterparties that it believes have the financial resources to honor their obligations and by monitoring the financial stability of those counterparties.
Certain ISDA Master Agreements allow counterparties of over-the-counter derivatives transactions to terminate derivatives contracts prior to maturity in the event the Fund’s net asset value declines by a stated percentage over a specified time period or if the Fund fails to meet certain terms of the ISDA Master Agreement, which would cause the Fund to accelerate
| 28 | Columbia Disciplined Small Core Fund | Annual Report 2017 |
Notes to Financial Statements (continued)
August 31, 2017
payment of any net liability owed to the counterparty. The Fund also has termination rights if the counterparty fails to meet certain terms of the ISDA Master Agreement. In addition to considering counterparty credit risk, the Fund would consider terminating the derivatives contracts based on whether termination would result in a net liability owed from the counterparty.
For financial reporting purposes, the Fund does not offset derivative assets and derivative liabilities that are subject to netting arrangements in the Statement of Assets and Liabilities.
Futures contracts
Futures contracts are exchange-traded and represent commitments for the future purchase or sale of an asset at a specified price on a specified date. The Fund bought and sold futures contracts to maintain appropriate equity market exposure while keeping sufficient cash to accommodate daily redemptions. These instruments may be used for other purposes in future periods. Upon entering into futures contracts, the Fund bears risks that it may not achieve the anticipated benefits of the futures contracts and may realize a loss. Additional risks include counterparty credit risk, the possibility of an illiquid market, and that a change in the value of the contract or option may not correlate with changes in the value of the underlying asset.
Upon entering into a futures contract, the Fund deposits cash or securities with the broker, known as a futures commission merchant (FCM), in an amount sufficient to meet the initial margin requirement. The initial margin deposit must be maintained at an established level over the life of the contract. Cash deposited as initial margin is recorded in the Statement of Assets and Liabilities as margin deposits. Securities deposited as initial margin are designated in the Portfolio of Investments. Subsequent payments (variation margin) are made or received by the Fund each day. The variation margin payments are equal to the daily change in the contract value and are recorded as variation margin receivable or payable and are offset in unrealized gains or losses. The Fund recognizes a realized gain or loss when the contract is closed or expires. Futures contracts involve, to varying degrees, risk of loss in excess of the variation margin disclosed in the Statement of Assets and Liabilities.
Effects of derivative transactions in the financial statements
The following tables are intended to provide additional information about the effect of derivatives on the financial statements of the Fund, including: the fair value of derivatives by risk category and the location of those fair values in the Statement of Assets and Liabilities; and the impact of derivative transactions over the period in the Statement of Operations, including realized and unrealized gains (losses). The derivative instrument schedules following the Portfolio of Investments present additional information regarding derivative instruments outstanding at the end of the period, if any.
The following table is a summary of the fair value of derivative instruments (not considered to be hedging instruments for accounting disclosure purposes) at August 31, 2017:
| | Asset derivatives | |
Risk exposure
category | Statement
of assets and liabilities
location | Fair value ($) |
| Equity risk | Net assets — unrealized appreciation on futures contracts | 5,398* |
| | Liability derivatives | |
Risk exposure
category | Statement
of assets and liabilities
location | Fair value ($) |
| Equity risk | Net assets — unrealized depreciation on futures contracts | 35,577* |
| * | Includes cumulative appreciation (depreciation) as reported in the tables following the Portfolio of Investments. Only the current day’s variation margin is reported in receivables or payables in the Statement of Assets and Liabilities. |
Columbia Disciplined Small Core Fund | Annual Report 2017
| 29 |
Notes to Financial Statements (continued)
August 31, 2017
The following table indicates the effect of derivative instruments (not considered to be hedging instruments for accounting disclosure purposes) in the Statement of Operations for the year ended August 31, 2017:
| Amount of realized gain (loss) on derivatives recognized in income |
| Risk exposure category | Futures
contracts
($) |
| Equity risk | 1,196,060 |
| |
| Change in unrealized appreciation (depreciation) on derivatives recognized in income |
| Risk exposure category | Futures
contracts
($) |
| Equity risk | (319,063) |
The following table is a summary of the average outstanding volume by derivative instrument for the year ended August 31, 2017:
| Derivative instrument | Average notional
amounts ($)* |
| Futures contracts — long | 7,234,715 |
| * | Based on the ending quarterly outstanding amounts for the year ended August 31, 2017. |
Security transactions
Security transactions are accounted for on the trade date. Cost is determined and gains (losses) are based upon the specific identification method for both financial statement and federal income tax purposes.
Income recognition
Corporate actions and dividend income are generally recorded net of any non-reclaimable tax withholdings, on the ex-dividend date or upon receipt of ex-dividend notification in the case of certain foreign securities.
The Fund may receive distributions from holdings in equity securities, business development companies (BDCs), exchange-traded funds (ETFs), limited partnerships (LPs), other regulated investment companies (RICs), and real estate investment trusts (REITs), which report information on the tax character of their distributions annually. These distributions are allocated to dividend income, capital gain and return of capital based on actual information reported. Return of capital is recorded as a reduction of the cost basis of securities held. If the Fund no longer owns the applicable securities, return of capital is recorded as a realized gain. With respect to REITs, to the extent actual information has not yet been reported, estimates for return of capital are made by the Fund’s management. Management’s estimates are subsequently adjusted when the actual character of the distributions is disclosed by the REITs, which could result in a proportionate change in return of capital to shareholders.
Awards from class action litigation are recorded as a reduction of cost basis if the Fund still owns the applicable securities on the payment date. If the Fund no longer owns the applicable securities, the proceeds are recorded as realized gains.
Expenses
General expenses of the Trust are allocated to the Fund and other funds of the Trust based upon relative net assets or other expense allocation methodologies determined by the nature of the expense. Expenses directly attributable to the Fund are charged to the Fund. Expenses directly attributable to a specific class of shares are charged to that share class.
Determination of class net asset value
All income, expenses (other than class-specific expenses, which are charged to that share class, as shown in the Statement of Operations) and realized and unrealized gains (losses) are allocated to each class of the Fund on a daily basis, based on the relative net assets of each class, for purposes of determining the net asset value of each class.
| 30 | Columbia Disciplined Small Core Fund | Annual Report 2017 |
Notes to Financial Statements (continued)
August 31, 2017
Federal income tax status
The Fund intends to qualify each year as a regulated investment company under Subchapter M of the Internal Revenue Code, as amended, and will distribute substantially all of its taxable income (including net short-term capital gains) and capital gains, if any, for its tax year, and as such will not be subject to federal income taxes. In addition, the Fund intends to distribute in each calendar year substantially all of its net investment income, capital gains and certain other amounts, if any, such that the Fund should not be subject to federal excise tax. Therefore, no federal income or excise tax provision is recorded.
Distributions to shareholders
Distributions from net investment income, if any, are declared and paid annually. Net realized capital gains, if any, are distributed along with the income distribution. Income distributions and capital gain distributions are determined in accordance with federal income tax regulations, which may differ from GAAP.
Guarantees and indemnifications
Under the Trust’s organizational documents and, in some cases, by contract, its officers and trustees are indemnified against certain liabilities arising out of the performance of their duties to the Trust or its funds. In addition, certain of the Fund’s contracts with its service providers contain general indemnification clauses. The Fund’s maximum exposure under these arrangements is unknown since the amount of any future claims that may be made against the Fund cannot be determined, and the Fund has no historical basis for predicting the likelihood of any such claims.
Recent accounting pronouncement
Accounting Standards Update 2017-08 Premium Amortization on Purchased Callable Debt Securities
In March 2017, the Financial Accounting Standards Board issued Accounting Standards Update (ASU) No. 2017-08 Premium Amortization on Purchased Callable Debt Securities. ASU No. 2017-08 updates the accounting standards to shorten the amortization period for certain purchased callable debt securities, held at a premium, to be amortized to the earliest call date. The update applies to securities with explicit, noncontingent call features that are callable at fixed prices and on preset dates. The standard is effective for annual periods beginning after December 15, 2018 and interim periods within those fiscal years. At this time, management is evaluating the implication of this guidance and the impact it will have on the financial statement amounts and footnote disclosures, if any.
Note 3. Fees and other transactions with affiliates
Management services fees
The Fund has entered into a Management Agreement with Columbia Management Investment Advisers, LLC (the Investment Manager), a wholly-owned subsidiary of Ameriprise Financial, Inc. (Ameriprise Financial). Under the Management Agreement, the Investment Manager provides the Fund with investment research and advice, as well as administrative and accounting services. The management services fee is an annual fee that is equal to a percentage of the Fund’s daily net assets that declines from 0.85% to 0.73% as the Fund’s net assets increase. Prior to July 1, 2017, the management services fee was an annual fee that was equal to a percentage of the Fund’s daily net assets that declined from 0.87% to 0.75% as the Fund’s net assets increased. The effective management services fee rate for the year ended August 31, 2017 was 0.87% of the Fund’s average daily net assets.
Compensation of board members
Members of the Board of Trustees, who are not officers or employees of the Investment Manager or Ameriprise Financial, are compensated for their services to the Fund as disclosed in the Statement of Operations. These members of the Board of Trustees may participate in a Deferred Compensation Plan (the Plan) which may be terminated at any time. Obligations of the Plan will be paid solely out of the Fund’s assets, and all amounts payable under the Plan constitute a general unsecured obligation of the Fund.
Columbia Disciplined Small Core Fund | Annual Report 2017
| 31 |
Notes to Financial Statements (continued)
August 31, 2017
Compensation of Chief Compliance Officer
The Board of Trustees has appointed a Chief Compliance Officer to the Fund in accordance with federal securities regulations. A portion of the Chief Compliance Officer’s total compensation is allocated to the Fund, along with other affiliated funds governed by the Board of Trustees, based on relative net assets. The total amount allocated to all affiliated funds governed by the Board of Trustees will not exceed $40,000 annually.
Transfer agency fees
Under a Transfer and Dividend Disbursing Agent Agreement, Columbia Management Investment Services Corp. (the Transfer Agent), an affiliate of the Investment Manager and a wholly-owned subsidiary of Ameriprise Financial, is responsible for providing transfer agency services to the Fund. The Transfer Agent has contracted with Boston Financial Data Services (BFDS) to serve as sub-transfer agent. The Transfer Agent pays the fees of BFDS for services as sub-transfer agent and BFDS is not entitled to reimbursement for such fees from the Fund (with the exception of out-of-pocket fees).
The Fund pays the Transfer Agent a monthly transfer agency fee based on the number or the average value of accounts, depending on the type of account. In addition, prior to October 1, 2016, the Transfer Agent also received sub-transfer agency fees based on a percentage of the average aggregate value of the Fund’s shares maintained in omnibus accounts (other than omnibus accounts for which American Enterprise Investment Services Inc. is the broker of record or accounts where the beneficial shareholder is a customer of Ameriprise Financial Services, Inc., for which the Transfer Agent receives a per account fee). Effective October 1, 2016, the Fund pays the Transfer Agent a fee for shareholder services based on the number of accounts or on a percentage of the average aggregate value of the Fund’s shares maintained in omnibus accounts up to the lesser of the amount charged by the financial intermediary or a cap established by the Board of Trustees from time to time.
The Transfer Agent also receives compensation from the Fund for various shareholder services and reimbursements for certain out-of-pocket fees. Effective August 1, 2017, total transfer agency fees for Class R5 and Class Y shares are subject to an annual limitation of not more than 0.07% and 0.02%, respectively, of the average daily net assets attributable to each share class. From January 1, 2017 to July 31, 2017, these limitations were 0.075% for Class R5 shares and 0.025% for Class I and Class Y shares; and prior to January 1, 2017, the limitation was 0.05% for Class R5 shares and Class I and Class Y shares did not pay transfer agency fees. In addition, effective January 1, 2017 through December 31, 2017, Class I and Class Y shares are subject to a contractual transfer agency fee limitation of not more than 0.00% and Class R5 shares are subject to a contractual transfer agency fee annual limitation of not more than 0.05% of the average annual daily net assets attributable to Class R5.
For the year ended August 31, 2017, the Fund’s effective transfer agency fee rates as a percentage of average daily net assets of each class were as follows:
| | Effective rate (%) |
| Class A | 0.20 |
| Class B | 0.19 (a),(b) |
| Class C | 0.20 |
| Class I | 0.00 (b),(c) |
| Class R4 | 0.20 |
| Class R5 | 0.05 |
| Class T | 0.20 |
| Class V | 0.20 |
| Class Y | 0.00 |
| Class Z | 0.20 |
| (a) | Effective July 17, 2017, Class B shares were automatically converted to Class A shares. |
| (b) | Unannualized. |
| (c) | Effective March 27, 2017, Class I shares were redeemed or exchanged for Class Y shares. |
| 32 | Columbia Disciplined Small Core Fund | Annual Report 2017 |
Notes to Financial Statements (continued)
August 31, 2017
An annual minimum account balance fee of $20 may apply to certain accounts with a value below the applicable share class’s initial minimum investment requirements to reduce the impact of small accounts on transfer agency fees. These minimum account balance fees are remitted to the Fund and recorded as part of expense reductions in the Statement of Operations. For the year ended August 31, 2017, these minimum account balance fees reduced total expenses of the Fund by $1,680.
Distribution and service fees
The Fund has entered into an agreement with Columbia Management Investment Distributors, Inc. (the Distributor), an affiliate of the Investment Manager and a wholly-owned subsidiary of Ameriprise Financial, for distribution and shareholder services. The Board of Trustees has approved, and the Fund has adopted, distribution and shareholder service plans (the Plans) applicable to certain share classes, which set the distribution and service fees for the Fund. These fees are calculated daily and are intended to compensate the Distributor and/or eligible selling and/or servicing agents for selling shares of the Fund and providing services to investors.
Under the Plans, the Fund pays a monthly service fee to the Distributor at the maximum annual rate of 0.25% of the average daily net assets attributable to Class A, Class B, Class C and Class T shares of the Fund. Also under the Plans, the Fund pays a monthly distribution fee to the Distributor at the maximum annual rates of 0.10%, 0.75%, 0.75% and 0.25% of the average daily net assets attributable to Class A, Class B, Class C and Class T shares of the Fund, respectively. As a result of all Class B shares of the Fund being redeemed or converted to Class A shares, August 4, 2017 was the last day the Fund paid a service fee or distribution fee for Class B shares.
Although the Fund may pay distribution and service fees up to a maximum annual rate of 0.35% of the Fund’s average daily net assets attributable to Class A shares (comprised of up to 0.10% for distribution services and up to 0.25% for shareholder liaison services), the Fund currently limits such fees to an aggregate fee of not more than 0.25% of the Fund’s average daily net assets attributable to Class A shares.
Although the Fund may pay a distribution fee up to 0.25% of the Fund’s average daily net assets attributable to Class T shares and a service fee of up to 0.25% of the Fund’s average daily net assets attributable to Class T shares, the aggregate fee shall not exceed 0.25% of the Fund’s average daily net assets attributable to Class T shares.
Shareholder services fees
The Fund has adopted a shareholder services plan that permits it to pay for certain services provided to Class V shareholders by their selling and/or servicing agents. The Fund may pay shareholder servicing fees up to an aggregate annual rate of 0.50% of the Fund’s average daily net assets attributable to Class V shares (comprised of up to 0.25% for shareholder liaison services and up to 0.25% for administrative support services). These fees are currently limited to an aggregate annual rate of not more than 0.25% of the Fund’s average daily net assets attributable to Class V shares.
Sales charges (unaudited)
Sales charges, including front-end charges and CDSCs, received by the Distributor for distributing Fund shares for the year ended August 31, 2017, if any, are listed below:
| | Amount ($) |
| Class A | 18,436 |
| Class C | 987 |
| Class V | 6,433 |
Columbia Disciplined Small Core Fund | Annual Report 2017
| 33 |
Notes to Financial Statements (continued)
August 31, 2017
Expenses waived/reimbursed by the Investment Manager and its affiliates
The Investment Manager and certain of its affiliates have contractually agreed to waive fees and/or reimburse expenses (excluding certain fees and expenses described below) for the period(s) disclosed below, unless sooner terminated at the sole discretion of the Board of Trustees, so that the Fund’s net operating expenses, after giving effect to fees waived/expenses reimbursed and any balance credits and/or overdraft charges from the Fund’s custodian, do not exceed the following annual rate(s) as a percentage of the class’ average daily net assets:
| | January 1, 2017
through
December 31, 2017 | Prior to
January 1, 2017 |
| Class A | 1.38% | 1.38% |
| Class C | 2.13 | 2.13 |
| Class R4 | 1.13 | 1.13 |
| Class R5 | 1.055 | 1.03 |
| Class T | 1.38 | 1.38 |
| Class V | 1.38 | 1.38 |
| Class Y | 1.005 | 0.98 |
| Class Z | 1.13 | 1.13 |
Under the agreement governing these fee waivers and/or expense reimbursement arrangements, the following fees and expenses are excluded from the waiver/reimbursement commitment, and therefore will be paid by the Fund, if applicable: taxes (including foreign transaction taxes), expenses associated with investments in affiliated and non-affiliated pooled investment vehicles (including mutual funds and exchange-traded funds), transaction costs and brokerage commissions, costs related to any securities lending program, dividend expenses associated with securities sold short, inverse floater program fees and expenses, transaction charges and interest on borrowed money, interest, infrequent and/or unusual expenses and any other expenses the exclusion of which is specifically approved by the Board of Trustees. This agreement may be modified or amended only with approval from the Investment Manager, certain of its affiliates and the Fund. Reflected in the contractual cap commitment, effective January 1, 2017 through December 31, 2017, is the Transfer Agent’s contractual agreement to limit total transfer agency fees to an annual rate of not more than 0.00% for Class Y and 0.05% for Class R5 of the average daily net assets attributable to each share class, unless sooner terminated at the sole discretion of the Board of Trustees. Any fees waived and/or expenses reimbursed under the expense reimbursement arrangements described above are not recoverable by the Investment Manager or its affiliates in future periods.
Note 4. Federal tax information
The timing and character of income and capital gain distributions are determined in accordance with income tax regulations, which may differ from GAAP because of temporary or permanent book to tax differences.
At August 31, 2017, these differences are primarily due to differing treatment for deferral/reversal of wash sale losses, re-characterization of distributions for investments, derivative investments and trustees’ deferred compensation. To the extent these differences are permanent, reclassifications are made among the components of the Fund’s net assets in the Statement of Assets and Liabilities. Temporary differences do not require reclassifications.
In the Statement of Assets and Liabilities the following reclassifications were made:
Undistributed net
investment
income ($) | Accumulated
net realized
gain ($) | Paid in
capital ($) |
| 1,175 | (1,175) | — |
Net investment income (loss) and net realized gains (losses), as disclosed in the Statement of Operations, and net assets were not affected by this reclassification.
| 34 | Columbia Disciplined Small Core Fund | Annual Report 2017 |
Notes to Financial Statements (continued)
August 31, 2017
The tax character of distributions paid during the years indicated was as follows:
| August 31, 2017 | August 31, 2016 |
Ordinary
income ($) | Long-term
capital gains ($) | Total ($) | Ordinary
income ($) | Long-term
capital gains ($) | Total ($) |
| 7,196,619 | 87,030,681 | 94,227,300 | 598,422 | 149,765,262 | 150,363,684 |
Short-term capital gain distributions, if any, are considered ordinary income distributions for tax purposes.
At August 31, 2017, the components of distributable earnings on a tax basis were as follows:
Undistributed
ordinary income ($) | Undistributed
long-term
capital gains ($) | Capital loss
carryforwards ($) | Net unrealized
appreciation ($) |
| 10,046,556 | 24,573,727 | — | 23,479,451 |
At August 31, 2017, the cost of all investments for federal income tax purposes along with the aggregate gross unrealized appreciation and depreciation based on that cost was:
Federal
tax cost ($) | Gross unrealized
appreciation ($) | Gross unrealized
(depreciation) ($) | Net unrealized
appreciation ($) |
| 185,776,148 | 34,150,475 | (10,671,024) | 23,479,451 |
Tax cost of investments and unrealized appreciation/(depreciation) may also include timing differences that do not constitute adjustments to tax basis.
Management of the Fund has concluded that there are no significant uncertain tax positions in the Fund that would require recognition in the financial statements. However, management’s conclusion may be subject to review and adjustment at a later date based on factors including, but not limited to, new tax laws, regulations, and administrative interpretations (including relevant court decisions). Generally, the Fund’s federal tax returns for the prior three fiscal years remain subject to examination by the Internal Revenue Service.
Note 5. Portfolio information
The cost of purchases and proceeds from sales of securities, excluding short-term investments and derivatives, if any, aggregated to $207,353,127 and $280,482,222, respectively, for the year ended August 31, 2017. The amount of purchase and sale activity impacts the portfolio turnover rate reported in the Financial Highlights.
Note 6. Affiliated money market fund
The Fund invests in Columbia Short-Term Cash Fund, an affiliated money market fund established for the exclusive use by the Fund and other affiliated funds (the Affiliated MMF). The income earned by the Fund from such investments is included as Dividends - affiliated issuers in the Statement of Operations. As an investing fund, the Fund indirectly bears its proportionate share of the expenses of the Affiliated MMF. Effective October 1, 2016, the Affiliated MMF prices its shares with a floating net asset value (NAV) and no longer seeks to maintain a stable NAV. In addition, the Board of Trustees of the Affiliated MMF may impose a fee on redemptions (sometimes referred to as a liquidity fee) or temporarily suspend redemptions (sometimes referred to as imposing a redemption gate) in the event its liquidity falls below regulatory limits.
Note 7. Line of credit
The Fund has access to a revolving credit facility with a syndicate of banks led by Citibank, N.A., HSBC Bank USA, N.A. and JPMorgan Chase Bank, N.A. whereby the Fund may borrow for the temporary funding of shareholder redemptions or for other temporary or emergency purposes. The credit facility, which is a collective agreement between the Fund and certain other funds managed by the Investment Manager, severally and not jointly, permits collective borrowings up to $1 billion. Interest is charged to each participating fund based on its borrowings at a rate equal to the higher of (i) the overnight federal funds rate
Columbia Disciplined Small Core Fund | Annual Report 2017
| 35 |
Notes to Financial Statements (continued)
August 31, 2017
plus 1.00% or (ii) the one-month LIBOR rate plus 1.00%. Each borrowing under the credit facility matures no later than 60 days after the date of borrowing. The Fund also pays a commitment fee equal to its pro rata share of the amount of the credit facility at a rate of 0.15% per annum. The commitment fee is included in other expenses in the Statement of Operations.
The Fund had no borrowings during the year ended August 31, 2017.
Note 8. Significant risks
Shareholder concentration risk
At August 31, 2017, one unaffiliated shareholder of record owned 18.5% of the outstanding shares of the Fund in one or more accounts. The Fund has no knowledge about whether any portion of those shares was owned beneficially. Affiliated shareholders of record owned 30.4% of the outstanding shares of the Fund in one or more accounts. Subscription and redemption activity by concentrated accounts may have a significant effect on the operations of the Fund. In the case of a large redemption, the Fund may be forced to sell investments at inopportune times, including its liquid positions, which may result in Fund losses and the Fund holding a higher percentage of less liquid positions. Large redemptions could result in decreased economies of scale and increased operating expenses for non-redeeming Fund shareholders.
Note 9. Subsequent events
Management has evaluated the events and transactions that have occurred through the date the financial statements were issued. Other than as noted in Note 1 above, there were no items requiring adjustment of the financial statements or additional disclosure.
Note 10. Information regarding pending and settled legal proceedings
Ameriprise Financial and certain of its affiliates have historically been involved in a number of legal, arbitration and regulatory proceedings, including routine litigation, class actions, and governmental actions, concerning matters arising in connection with the conduct of their business activities. Ameriprise Financial believes that the Fund is not currently the subject of, and that neither Ameriprise Financial nor any of its affiliates are the subject of, any pending legal, arbitration or regulatory proceedings that are likely to have a material adverse effect on the Fund or the ability of Ameriprise Financial or its affiliates to perform under their contracts with the Fund. Ameriprise Financial is required to make quarterly (10-Q), annual (10-K) and, as necessary, 8-K filings with the Securities and Exchange Commission (SEC) on legal and regulatory matters that relate to Ameriprise Financial and its affiliates. Copies of these filings may be obtained by accessing the SEC website at www.sec.gov.
There can be no assurance that these matters, or the adverse publicity associated with them, will not result in increased Fund redemptions, reduced sale of Fund shares or other adverse consequences to the Fund. Further, although we believe proceedings are not likely to have a material adverse effect on the Fund or the ability of Ameriprise Financial or its affiliates to perform under their contracts with the Fund, these proceedings are subject to uncertainties and, as such, we are unable to estimate the possible loss or range of loss that may result. An adverse outcome in one or more of these proceedings could result in adverse judgments, settlements, fines, penalties or other relief that could have a material adverse effect on the consolidated financial condition or results of operations of Ameriprise Financial.
| 36 | Columbia Disciplined Small Core Fund | Annual Report 2017 |
Report of Independent Registered Public Accounting Firm
To the Trustees of Columbia Funds Series Trust I and the Shareholders of Columbia Disciplined Small Core Fund
In our opinion, the accompanying statement of assets and liabilities, including the portfolio of investments, and the related statements of operations and of changes in net assets and the financial highlights present fairly, in all material respects, the financial position of Columbia Disciplined Small Core Fund (the “Fund”, a series of Columbia Funds Series Trust I) as of August 31, 2017, the results of its operations for the year then ended, the changes in its net assets for each of the two years in the period then ended and the financial highlights for each of the five years in the period then ended, in conformity with accounting principles generally accepted in the United States of America. These financial statements and financial highlights (hereafter referred to as “financial statements”) are the responsibility of the Fund’s management. Our responsibility is to express an opinion on these financial statements based on our audits. We conducted our audits of these financial statements in accordance with the standards of the Public Company Accounting Oversight Board (United States). Those standards require that we plan and perform the audit to obtain reasonable assurance about whether the financial statements are free of material misstatement. An audit includes examining, on a test basis, evidence supporting the amounts and disclosures in the financial statements, assessing the accounting principles used and significant estimates made by management, and evaluating the overall financial statement presentation. We believe that our audits, which included confirmation of securities as of August 31, 2017 by correspondence with the custodian, brokers and transfer agent provide a reasonable basis for our opinion.
/s/ PricewaterhouseCoopers LLP
Minneapolis, MN
October 20, 2017
Columbia Disciplined Small Core Fund | Annual Report 2017
| 37 |
Federal Income Tax Information
(Unaudited)
The Fund hereby designates the following tax attributes for the fiscal year ended August 31, 2017. Shareholders will be notified in early 2018 of the amounts for use in preparing 2017 income tax returns.
Qualified
dividend
income | Dividends
received
deduction | Capital
gain
dividend |
| 51.85% | 55.12% | $27,208,932 |
Qualified dividend income. For taxable, non-corporate shareholders, the percentage of ordinary income distributed during the fiscal year that represents qualified dividend income subject to reduced tax rates.
Dividends received deduction. The percentage of ordinary income distributed during the fiscal year that qualifies for the corporate dividends received deduction.
Capital gain dividend. The Fund designates as a capital gain dividend the amount reflected above, or if subsequently determined to be different, the net capital gain of such fiscal period.
| 38 | Columbia Disciplined Small Core Fund | Annual Report 2017 |
Shareholders elect the Board that oversees the Fund’s operations. The Board appoints officers who are responsible for day-to-day business decisions based on policies set by the Board. The following table provides basic biographical information about the Fund’s Trustees, including their principal occupations during the past five years, although specific titles for individuals may have varied over the period. The year set forth beneath Length of Service in the table below is the year in which the Trustee was first appointed or elected as Trustee to any Fund currently in the Columbia Funds Complex or a predecessor thereof. Under current Board policy, members serve terms of indefinite duration.
Independent trustees
| Name, address, year of birth | Position held with the Trust and length of service | Principal occupation(s) during the past five years and other relevant professional experience | Number of Funds in the Columbia Fund Complex overseen | Other directorships held by Trustee during the past five years |
Janet Langford Carrig
c/o Columbia Management
Investment Advisers, LLC
225 Franklin Street
Mail Drop BX32 05228
Boston, MA 02110
1957 | Trustee
1996 | Senior Vice President, General Counsel and Corporate Secretary, ConocoPhillips (independent energy company) since September 2007 | 57 | None |
Douglas A. Hacker
c/o Columbia Management
Investment Advisers, LLC
225 Franklin Street
Mail Drop BX32 05228
Boston, MA 02110
1955 | Trustee and Chairman of the Board
1996 | Independent business executive since May 2006; Executive Vice President — Strategy of United Airlines from December 2002 to May 2006; President of UAL Loyalty Services (airline marketing company) from September 2001 to December 2002; Executive Vice President and Chief Financial Officer of United Airlines from July 1999 to September 2001 | 57 | Spartan Nash Company, (food distributor); Nash Finch Company (food distributor) from 2005 to 2013; Aircastle Limited (aircraft leasing); SeaCube Container Leasing Ltd. (container leasing) from 2010 to 2013; and Travelport Worldwide Limited (travel information technology) |
Nancy T. Lukitsh
c/o Columbia Management
Investment Advisers, LLC
225 Franklin Street
Mail Drop BX32 05228
Boston, MA 02110
1956 | Trustee
2011 | Senior Vice President, Partner and Director of Marketing, Wellington Management Company, LLP (investment adviser) from 1997 to 2010; Chair, Wellington Management Portfolios (commingled non-U.S. investment pools) from 2007 to 2010; Director, Wellington Trust Company, NA and other Wellington affiliates from 1997 to 2010 | 57 | None |
David M. Moffett
c/o Columbia Management
Investment Advisers, LLC
225 Franklin Street
Mail Drop BX32 05228
Boston, MA 02110
1952 | Trustee
2011 | Retired. Consultant to Bridgewater and Associates | 57 | Director, CSX Corporation; Genworth Financial, Inc. (financial and insurance products and services); PayPal Holdings Inc. (payment and data processing services); Trustee, University of Oklahoma Foundation; former Director, eBay Inc. (online trading community), 2007-2015; and former Director, CIT Bank, CIT Group Inc. (commercial and consumer finance), 2010-2016 |
Columbia Disciplined Small Core Fund | Annual Report 2017
| 39 |
TRUSTEES AND OFFICERS (continued)
Independent trustees (continued)
| Name, address, year of birth | Position held with the Trust and length of service | Principal occupation(s) during the past five years and other relevant professional experience | Number of Funds in the Columbia Fund Complex overseen | Other directorships held by Trustee during the past five years |
Charles R. Nelson
c/o Columbia Management
Investment Advisers, LLC
225 Franklin Street
Mail Drop BX32 05228
Boston, MA 02110
1942 | Trustee
1981 | Retired. Professor Emeritus, University of Washington since 2011; Professor of Economics, University of Washington from 1976 to 2011; Ford and Louisa Van Voorhis Professor of Political Economy, University of Washington from 1993 to 2011; Adjunct Professor of Statistics, University of Washington from 1980 to 2011; Associate Editor, Journal of Money, Credit and Banking from September 1993 to 2008; consultant on econometric and statistical matters | 57 | None |
John J. Neuhauser
c/o Columbia Management
Investment Advisers, LLC
225 Franklin Street
Mail Drop BX32 05228
Boston, MA 02110
1943 | Trustee
1984 | President, Saint Michael’s College since August 2007; Director or Trustee of several non-profit organizations, including University of Vermont Medical Center; Academic Vice President and Dean of Faculties, Boston College from August 1999 to October 2005; University Professor, Boston College from November 2005 to August 2007 | 57 | Liberty All-Star Equity Fund and Liberty All- Star Growth Fund (closed-end funds) |
Patrick J. Simpson
c/o Columbia Management
Investment Advisers, LLC
225 Franklin Street
Mail Drop BX32 05228
Boston, MA 02110
1944 | Trustee
2000 | Of Counsel, Perkins Coie LLP (law firm) since 2015; Partner, Perkins Coie LLP from 1988 to 2014 | 57 | None |
Anne-Lee Verville
c/o Columbia Management
Investment Advisers, LLC
225 Franklin Street
Mail Drop BX32 05228
Boston, MA 02110
1945 | Trustee
1998 | Retired. General Manager, Global Education Industry from 1994 to 1997, President – Application Systems Division from 1991 to 1994, Chief Financial Officer – US Marketing & Services from 1988 to 1991, and Chief Information Officer from 1987 to 1988, IBM Corporation (computer and technology) | 57 | Enesco Group, Inc. (producer of giftware and home and garden decor products) from 2001 to 2006 |
| 40 | Columbia Disciplined Small Core Fund | Annual Report 2017 |
TRUSTEES AND OFFICERS (continued)
Consultants to the Independent Trustees*
| Name, address, year of birth | Position held with the Trust and length of service | Principal occupation(s) during the past five years and other relevant professional experience | Number of Funds in the Columbia Funds complex overseen | Other directorships held by Trustee during the past five years |
J. Kevin Connaughton
c/o Columbia
Management Investment
Advisers, LLC,
225 Franklin Street
Mail Drop BX32 05228,
Boston, MA 02110
1964 | Independent Trustee Consultant
2016 | Independent Trustee Consultant, Columbia Funds since March 2016; Managing Director and General Manager of Mutual Fund Products, Columbia Management Investment Advisers, LLC from May 2010 to February 2015; President, Columbia Funds from 2009 to 2015; and senior officer of Columbia Funds and affiliated funds from 2003 to 2015 | 57 | Board of Governors, Gateway Healthcare since January 2016; Trustee, New Century Portfolios since March 2015; and Director, The Autism Project since March 2015 |
Natalie A. Trunow
c/o Columbia
Management Investment
Advisers, LLC,
225 Franklin Street
Mail Drop BX32 05228,
Boston, MA 02110
1967 | Independent Trustee Consultant
2016 | Independent Trustee Consultant, Columbia Funds since September 2016; Chief Executive Officer, Millennial Partners (investment consulting services to institutions) since January 2016; Director of Investments, Casey Family Programs from April 2016 to September 2016; Senior Vice President and Chief Investment Officer, Calvert Investments from August 2008 to January 2016; Section Head and Portfolio Manager, General Motors Asset Management from June 1997 to August 2008 | 57 | Healthcare Services for Children with Special Needs |
| * | J. Kevin Connaughton was appointed consultant to the Independent Trustees effective March 1, 2016. Natalie A. Trunow was appointed consultant to the Independent Trustees effective September 1, 2016. Shareholders of the Funds are expected to be asked to elect each of Mr. Connaughton and Ms. Trunow as a Trustee at a future shareholder meeting. |
Interested trustee affiliated with Investment Manager*
| Name, address, year of birth | Position held with the Trust and length of service | Principal occupation(s) during the past five years and other relevant professional experience | Number of Funds in the Columbia Funds Complex overseen | Other directorships held by Trustee during the past five years |
William F. Truscott
c/o Columbia Management
Investment Advisers, LLC
225 Franklin Street
Boston, MA 02110
1960 | Trustee
2012 | Chairman of the Board and President, Columbia Management Investment Advisers, LLC since May 2010 and February 2012, respectively; Chief Executive Officer, Global Asset Management, Ameriprise Financial, Inc. since September 2012 (previously Chief Executive Officer, U.S. Asset Management & President, Annuities, May 2010-September 2012); Director and Chief Executive Officer, Columbia Management Investment Distributors, Inc. since May 2010 and February 2012, respectively; Chairman of the Board and Chief Executive Officer, RiverSource Distributors, Inc. since 2006; Director, Threadneedle Asset Management Holdings, SARL since 2014; President and Chief Executive Officer, Ameriprise Certificate Company, 2006-August 2012 | 179 | Chairman of the Board, Columbia Management Investment Advisers, LLC since May 2010; Director, Columbia Management Investment Distributors, Inc. since May 2010; former Director, Ameriprise Certificate Company, 2006 - January 2013 |
| * | Interested person (as defined under the 1940 Act) by reason of being an officer, director, security holder and/or employee of the Investment Manager or Ameriprise Financial. |
The Statement of Additional Information has additional information about the Fund’s Board members and is available,
without charge, upon request by calling 800.345.6611, contacting your financial intermediary or visiting
investor.columbiathreadneedleus.com.
Columbia Disciplined Small Core Fund | Annual Report 2017
| 41 |
TRUSTEES AND OFFICERS (continued)
The Board has appointed officers who are responsible for day-to-day business decisions based on policies it has established. The officers serve at the pleasure of the Board. The following table provides basic information about the Officers of the Fund, including principal occupations during the past five years, although their specific titles may have varied over the period. In addition to Mr. Truscott, who is Senior Vice President, the Fund’s other officers are:
Fund officers
Name,
address and
year of birth | Position and year
first appointed to
position for any Fund
in the Columbia
Funds complex or a
predecessor thereof | Principal occupation(s) during past five years |
Christopher O. Petersen
5228 Ameriprise
Financial Center
Minneapolis, MN 55474
Born 1970 | President and Principal Executive Officer (2015) | Vice President and Lead Chief Counsel, Ameriprise Financial, Inc. since January 2015 (previously, Vice President and Chief Counsel, January 2010 - December 2014; officer of Columbia Funds and affiliated funds since 2007. |
Michael G. Clarke
225 Franklin Street
Boston, MA 02110
Born 1969 | Treasurer (2011), Chief Financial Officer (2009) and Chief Accounting Officer (2015) | Vice President — Mutual Fund Administration, Columbia Management Investment Advisers, LLC, since May 2010; senior officer of Columbia Funds and affiliated funds since 2002. |
Paul B. Goucher
100 Park Avenue
New York, NY 10017
Born 1968 | Senior Vice President (2011) and Assistant Secretary (2008) | Senior Vice President and Assistant General Counsel, Ameriprise Financial, Inc. since January 2017 (previously Vice President and Lead Chief Counsel, November 2008 - January 2017 and January 2013 - January 2017, respectively; and Chief Counsel, January 2010 - January 2013); Vice President, Chief Legal Officer and Assistant Secretary, Columbia Management Investment Advisers, LLC since May 2010. |
Thomas P. McGuire
225 Franklin Street
Boston, MA 02110
Born 1972 | Senior Vice President and Chief Compliance Officer (2012) | Vice President — Asset Management Compliance, Ameriprise Financial, Inc., since May 2010; Chief Compliance Officer, Ameriprise Certificate Company since September 2010. |
Colin Moore
225 Franklin Street
Boston, MA 02110
Born 1958 | Senior Vice President (2010) | Executive Vice President and Global Chief Investment Officer, Ameriprise Financial, Inc., since July 2013; Executive Vice President and Global Chief Investment Officer, Columbia Management Investment Advisers, LLC since July 2013 (previously Director and Global Chief Investment Officer, 2010 - 2013). |
Ryan C. Larrenaga
225 Franklin Street
Boston, MA 02110
Born 1970 | Senior Vice President (2017), Chief Legal Officer (2017) and Secretary (2015) | Vice President and Group Counsel, Ameriprise Financial, Inc. since August 2011; officer of Columbia Funds and affiliated funds since 2005. |
Michael E. DeFao
225 Franklin Street
Boston, MA 02110
Born 1968 | Vice President (2011) and Assistant Secretary (2010) | Vice President and Chief Counsel, Ameriprise Financial, Inc. since May 2010. |
Amy Johnson
5228 Ameriprise
Financial Center
Minneapolis, MN 55474
Born 1965 | Vice President (2006) | Managing Director and Global Head of Operations, Columbia Management Investment Advisers, LLC since April 2016 (previously Managing Director and Chief Operating Officer, 2010 - 2016). |
Lyn Kephart-Strong
5228 Ameriprise
Financial Center
Minneapolis, MN 55474
Born 1960 | Vice President (2015) | President, Columbia Management Investment Services Corp. since October 2014; Vice President & Resolution Officer, Ameriprise Trust Company since August 2009. |
| 42 | Columbia Disciplined Small Core Fund | Annual Report 2017 |
Board Consideration and Approval of Management
Agreement
On June 14, 2017, the Board of Trustees (the Board) and the Trustees who are not interested persons (as defined in the Investment Company Act of 1940) (the Independent Trustees) of Columbia Funds Series Trust I (the Trust) unanimously approved the continuation of the Management Agreement (the Management Agreement) with Columbia Management Investment Advisers, LLC (the Investment Manager) with respect to Columbia Disciplined Small Core Fund (the Fund), a series of the Trust. As detailed below, the Board’s Advisory Fees and Expenses Committee (the Committee) and the Board met on multiple occasions to review and discuss, both among themselves and with the management team of the Investment Manager, materials provided by the Investment Manager and others before determining to approve the continuation of the Management Agreement.
In connection with their deliberations regarding the continuation of the Management Agreement, the Committee and the Board evaluated materials requested from the Investment Manager regarding the Fund and the Management Agreement, and discussed these materials with representatives of the Investment Manager at Committee meetings held on March 27, 2017, April 26, 2017 and June 13, 2017 and at Board meetings held on March 28, 2017 and June 14, 2017. In addition, the Board considers matters bearing on the Management Agreement at most of its other meetings throughout the year and meets regularly with senior management of the Trust and the Investment Manager. Through the Board’s Investment Oversight Committees, Trustees also meet with selected portfolio managers of the funds the Trustees oversee and other investment personnel at various times throughout the year. The Committee and the Board also consulted with its independent fee consultant, Fund counsel and the Independent Trustees’ independent legal counsel, who advised on various matters with respect to the Committee’s and the Board’s considerations and otherwise assisted the Committee and the Board in their deliberations. On June 13, 2017, the Committee recommended that the Board approve the continuation of the Management Agreement. On June 14, 2017, the Board, including the Independent Trustees, voting separately, unanimously approved the continuation of the Management Agreement for the Fund.
The Committee and the Board considered all information that they, their legal counsel or the Investment Manager believed reasonably necessary to evaluate and to determine whether to recommend for approval or approve the continuation of the Management Agreement. The information and factors considered by the Committee and the Board in recommending for approval or approving the continuation of the Management Agreement for the Fund included the following:
| • | Information on the investment performance of the Fund relative to the performance of a group of mutual funds determined to be comparable to the Fund by an independent third-party data provider, as well as performance relative to benchmarks; |
| • | Information on the Fund’s management fees and total expenses, including information comparing the Fund’s expenses to those of a group of comparable mutual funds, as determined by the independent third-party data provider; |
| • | The Investment Manager’s agreement to contractually limit or cap total operating expenses for the Fund through December 31, 2018 so that total operating expenses (excluding certain fees and expenses, such as transaction costs and certain other investment related expenses, interest, taxes, acquired fund fees and expenses, and infrequent and/or unusual expenses) would not exceed a specified annual rate, as a percentage of the Fund’s net assets; |
| • | The terms and conditions of the Management Agreement; |
| • | The current and proposed terms and conditions of other agreements and arrangements with affiliates of the Investment Manager relating to the operations of the Fund, including agreements with respect to the provision of distribution, transfer agency and shareholder services to the Fund; |
| • | Descriptions of various functions performed by the Investment Manager under the Management Agreement, including portfolio management and portfolio trading practices; |
| • | Information regarding the management fees of similarly-managed portfolios of other clients of the Investment Manager, including institutional separate accounts; |
| • | Information regarding the reputation, regulatory history and resources of the Investment Manager, including information regarding senior management, portfolio managers and other personnel; |
Columbia Disciplined Small Core Fund | Annual Report 2017
| 43 |
Board Consideration and Approval of Management
Agreement (continued)
| • | Information regarding the capabilities of the Investment Manager with respect to compliance monitoring services, including an assessment of the Investment Manager’s compliance system by the Fund’s Chief Compliance Officer; and |
| • | The profitability to the Investment Manager and its affiliates from their relationships with the Fund. |
Nature, extent and quality of services provided under the Management Agreement
The Committee and the Board considered the nature, extent and quality of services provided to the Fund by the Investment Manager and its affiliates under the Management Agreement and under separate agreements for the provision of transfer agency and shareholder services, and the resources dedicated to the Fund and the other Columbia Funds by the Investment Manager and its affiliates. The Committee and the Board considered, among other things, the Investment Manager’s ability to attract, motivate and retain highly qualified research, advisory and supervisory investment professionals (including compensation programs for personnel involved in fund management, reputation and other attributes), the portfolio management services provided by those investment professionals, and the quality of the Investment Manager’s investment research capabilities and trade execution services. The Committee and the Board also considered the potential benefits to shareholders of investing in a mutual fund that is part of a fund complex offering exposure to a variety of asset classes and investment disciplines and providing a variety of fund and shareholder services.
The Committee and the Board also considered the professional experience and qualifications of the senior personnel of the Investment Manager, which included consideration of the Investment Manager’s experience with similarly-structured funds. The Committee and the Board noted the compliance programs of and the compliance-related resources provided to the Fund by the Investment Manager and its affiliates, and considered the Investment Manager’s ability to provide administrative services to the Fund and coordinate the activities of the Fund’s other service providers. After reviewing these and related factors, the Committee and the Board concluded, within the context of their overall conclusions, that the nature, extent and quality of the services provided to the Fund under the Management Agreement supported the continuation of the Management Agreement.
Investment performance
The Committee and the Board reviewed information about the performance of the Fund over various time periods, including performance information relative to benchmarks and information that compared the performance of the Fund to the performance of a group of comparable mutual funds as determined by the independent third-party data provider, and data provided by the independent fee consultant. The Committee and the Board also reviewed a description of the third party’s methodology for identifying the Fund’s peer groups for purposes of performance and expense comparisons. Although the Fund’s performance lagged that of a relevant peer group for certain (although not necessarily all) periods, the Committee and the Board concluded that other factors relevant to performance were sufficient, in light of other considerations, to warrant continuation of the Management Agreement. Those factors included one or more of the following: (i) that the Fund’s performance, although lagging in certain recent periods, was stronger over the longer term; (ii) that the underperformance was attributable, to a significant extent, to investment decisions that were reasonable and consistent with the Fund’s investment strategy and policies and that the Fund was performing within a reasonable range of expectations, given those investment decisions, market conditions and the Fund’s investment strategy; (iii) that the Fund’s performance was competitive when compared to other relevant performance benchmarks or peer groups; and (iv) that the Investment Manager had taken or was taking steps designed to help improve the Fund’s investment performance, including, but not limited to, replacing portfolio managers, enhancing the resources supporting the portfolio managers, or modifying investment strategies.
The Committee and the Board noted that, through December 31, 2016, the Fund’s performance was in the seventy-eighth, eighty-ninth and eighty-eighth percentile (where the best performance would be in the first percentile) of its category selected by the independent third-party data provider for the purposes of performance comparisons for the one-, three- and five-year periods, respectively.
The Committee and the Board also considered the Investment Manager’s performance and reputation generally, the Investment Manager’s historical responsiveness to Board concerns about performance, and the Investment Manager’s willingness to take steps intended to improve performance. After reviewing these and related factors, the Committee and the Board concluded, within the context of their overall conclusions, that the performance of the Fund and the Investment Manager was sufficient, in light of other considerations, to warrant the continuation of the Management Agreement.
| 44 | Columbia Disciplined Small Core Fund | Annual Report 2017 |
Board Consideration and Approval of Management
Agreement (continued)
Investment management fee rates and other expenses
The Committee and the Board considered the management fees charged to the Fund under the Management Agreement as well as the total expenses incurred by the Fund. In assessing the reasonableness of the fees under the Management Agreement, the Committee and the Board considered, among other information, the Fund’s total expense ratio as a percentage of average daily net assets. The Committee and the Board considered data provided by the independent third-party data provider and the independent fee consultant. The Committee and the Board noted that, as of December 31, 2016, the Fund’s actual management fee and net total expense ratio are ranked in the fourth and third quintiles, respectively, (where the lowest fees and expenses would be in the first quintile) against the Fund’s expense universe as determined by the independent third-party data provider for purposes of expense comparison. The Committee and the Board also took into account the fee waiver and expense limitation arrangements agreed to by the Investment Manager, as noted above.
The Committee and the Board also received and considered information about the management fees charged by the Investment Manager to institutional separate accounts. In considering the fees charged to those accounts, the Committee and the Board took into account, among other things, the Investment Manager’s representations about the differences between managing mutual funds as compared to other types of accounts, including differences in the services provided, differences in the risk profile of such business for the Investment Manager and the additional resources required to manage mutual funds effectively. The Committee and the Board also received and considered information about the fees charged by the Investment Manager for sub-advisory services it provides to comparable unaffiliated funds. In evaluating the Fund’s management fees, the Committee and the Board also took into account the demands, complexity and quality of the investment management of the Fund.
After reviewing these and related factors, the Committee and the Board concluded, within the context of their overall conclusions, that the management fee rates and expenses of the Fund, in light of other considerations, warranted the continuation of the Management Agreement.
Costs of services provided and profitability
The Committee and the Board also took note of the costs the Investment Manager and its affiliates incur in connection with the services provided and the profitability to the Investment Manager and its affiliates from their relationships with the Fund.
The Committee and the Board also considered the compensation directly or indirectly received by the Investment Manager’s affiliates in connection with their relationships with the Fund. The Committee and the Board reviewed information provided by management as to the profitability to the Investment Manager and its affiliates of their relationships with the Fund, information about the allocation of expenses used to calculate profitability, and comparisons of profitability levels realized in 2016 to profitability levels realized in 2015. When reviewing profitability, the Committee and the Board also considered court cases in which adviser profitability was an issue in whole or in part, the performance of similarly managed funds, the performance of the Fund, and the expense ratio of the Fund. In addition, the Committee and the Board considered information provided by the Investment Manager regarding the Investment Manager’s financial condition and comparing its profitability to that of other asset management firms that are, or are subsidiaries of, publicly traded companies. In this regard, the Committee and the Board also considered data provided by the independent fee consultant.
After reviewing these and related factors, the Committee and the Board concluded, within the context of their overall conclusions, that the costs of services provided and the profitability to the Investment Manager and its affiliates from their relationships with the Fund supported the continuation of the Management Agreement.
Economies of scale
The Committee and the Board considered the potential existence of economies of scale in the provision by the Investment Manager of services to the Fund, to groups of related funds, and to the Investment Manager’s investment advisory clients as a whole, and whether those economies of scale were shared with the Fund through breakpoints in investment management fees or other means, such as expense limitation arrangements and additional investments by the Investment Manager in investment, trading, compliance and other resources. The Committee and the Board noted that the management fee schedules for the Fund contained breakpoints that would reduce the fee rate on assets above specified threshold levels.
Columbia Disciplined Small Core Fund | Annual Report 2017
| 45 |
Board Consideration and Approval of Management
Agreement (continued)
In considering these matters, the Committee and the Board also considered the costs of the services provided and the profitability to the Investment Manager and its affiliates from their relationships with the Fund, as discussed above. After reviewing these and related factors, the Committee and the Board concluded, within the context of their overall conclusions, that the extent to which any economies of scale were expected to be shared with the Fund supported the continuation of the Management Agreement.
Other benefits to the Investment Manager
The Committee and the Board received and considered information regarding “fall-out” or ancillary benefits received by the Investment Manager and its affiliates as a result of their relationships with the Fund, such as the engagement of the Investment Manager’s affiliates to provide distribution, transfer agency and shareholder services to the Fund. In this regard, among other matters, the Committee and the Board considered that the Fund’s distributor retains a portion of the distribution fees from the Fund and receives a portion of the sales charges on sales or redemptions of certain classes of shares of the Fund. The Committee and the Board also considered the benefits of research made available to the Investment Manager by reason of brokerage commissions generated by the Fund’s securities transactions, and reviewed information about the Investment Manager’s practices with respect to allocating portfolio transactions for brokerage and research services. The Committee and the Board recognized that the Investment Manager’s profitability would be somewhat lower without these benefits.
Conclusion
The Committee and the Board reviewed all of the above considerations in reaching their decisions to recommend or approve the continuation of the Management Agreement. In their deliberations, the Trustees did not identify any particular information that was all-important or controlling, and individual Trustees may have attributed different weights to the various factors. Based on their evaluation of all factors that they deemed to be material, including those factors described above, and assisted by the advice of independent legal counsel, the Board, including the Independent Trustees, voting separately, unanimously approved the continuation of the Management Agreement.
| 46 | Columbia Disciplined Small Core Fund | Annual Report 2017 |
The Fund mails one shareholder report to each shareholder address. If you would like more than one report, please call shareholder services at 800.345.6611 and additional reports will be sent to you.
Proxy voting policies and procedures
The policy of the Board of Trustees is to vote the proxies of the companies in which the Fund holds investments consistent with the procedures as stated in the Statement of Additional Information (SAI). You may obtain a copy of the SAI without charge by calling 800.345.6611; contacting your financial intermediary; visiting investor.columbiathreadneedleus.com; or searching the website of the Securities and Exchange Commission (SEC) at sec.gov. Information regarding how the Fund voted proxies relating to portfolio securities is filed with the SEC by August 31st for the most recent 12-month period ending June 30th of that year, and is available without charge by visiting investor.columbiathreadneedleus.com, or searching the website of the SEC at sec.gov.
Quarterly schedule of investments
The Fund files a complete schedule of portfolio holdings with the SEC for the first and third quarters of each fiscal year on Form N-Q. The Fund’s Form N-Q is available on the SEC’s website at sec.gov and may be reviewed and copied at the SEC’s Public Reference Room in Washington, D.C. Information on the operation of the Public Reference Room may be obtained by calling 800.SEC.0330. The Fund’s complete schedule of portfolio holdings, as filed on Form N-Q, can also be obtained without charge, upon request, by calling 800.345.6611.
Additional Fund information
For more information about the Fund, please visit investor.columbiathreadneedleus.com or call 800.345.6611. Customer Service Representatives are available to answer your questions Monday through Friday from 8 a.m. to 7 p.m. Eastern time.
Fund investment manager
Columbia Management Investment Advisers, LLC
225 Franklin Street
Boston, MA 02110
Fund distributor
Columbia Management Investment Distributors, Inc.
225 Franklin Street
Boston, MA 02110
Fund transfer agent
Columbia Management Investment Services Corp.
P.O. Box 8081
Boston, MA 02266-8081
Columbia Disciplined Small Core Fund | Annual Report 2017
| 47 |
[THIS PAGE INTENTIONALLY LEFT BLANK]
[THIS PAGE INTENTIONALLY LEFT BLANK]
Columbia Disciplined Small Core Fund
P.O. Box 8081
Boston, MA 02266-8081
Please read and consider the investment objectives, risks, charges and expenses for any fund carefully before investing. For a prospectus and summary prospectus, which contains this and other important information about the Fund, go to
investor.columbiathreadneedleus.com. The Fund is distributed by Columbia Management Investment Distributors, Inc., member FINRA, and managed by Columbia Management Investment Advisers, LLC.
Columbia Threadneedle Investments (Columbia Threadneedle) is the global brand name of the Columbia and Threadneedle group of companies. All rights reserved. Columbia Management Investment Distributors, Inc., 225 Franklin Street, Boston, MA 02110-2804
© 2017 Columbia Management Investment Advisers, LLC.
investor.columbiathreadneedleus.com

Annual Report
August 31, 2017
Columbia Small Cap Growth Fund I
Not FDIC Insured • No bank guarantee • May lose value
Dear Shareholders,
The current outlook for financial markets is clouded by two primary concerns: the high valuation of equities and the direction of interest rates. Following the U.S. presidential election, U.S. equities rallied based on the assumption that the new administration’s policies would stimulate growth quickly. Unfortunately it’s unclear whether those measures will get passed, much less passed quickly. In fixed income, uncertainty stems from the possibility that interest rates won’t rise as rapidly as expected if the administration’s proposed growth policies are not implemented.
Given this uncertainty, investors value a consistent approach more than ever. Investors want strong, repeatable risk-adjusted returns. Consistency — not surprises. As a leading global asset manager, we believe our consistent, collaborative investment approach enables us to deliver the dependable experience your portfolio demands. So, how do we strive to deliver a consistent investment experience?
Better insights
Your portfolio benefits from the investment insights uncovered by our talented investment teams around the world.
Better decisions
Our collaborative, interactive environment enables our investment teams to construct portfolios that take advantage of the best investment ideas.
Better outcomes
We aim to deliver a consistent experience, which means fewer surprises, dependable insights, and products designed to do the thing you want.
Whether you’re trying to save money to help your children go to college or for your own retirement, it’s the consistency of the return that is most essential. People who chase higher returns are usually also the first to sell when that investment goes through a bad patch. We try to combat this behavioral tendency by offering strategies that aim for a more consistent return. Our goal is for investors to panic less during periods of volatility, which can have a significant effect on their long-term results.
Nothing is more important to us than making sure those who have entrusted us to protect and grow their assets can do what matters most to them: build a nest egg, leave a legacy, and live confidently — now and throughout retirement. It’s why our talented professionals around the world work together to uncover uncommon opportunities and why our process encourages challenge and debate around our most compelling ideas to ensure better informed investment decisions, which hopefully lead to better outcomes for you.
Your success is our priority. Talk to your financial advisor about how working with Columbia Threadneedle Investments may help you position your portfolio for consistent, sustainable outcomes, no matter the market conditions.
Sincerely,
Christopher O. Petersen
President, Columbia Funds
Investors should consider the investment objectives, risks, charges and expenses of a mutual fund carefully before investing. For a free prospectus and summary prospectus, which contains this and other important information about a fund, visit investor.columbiathreadneedleus.com. The prospectus should be read carefully before investing.
Columbia Funds are distributed by Columbia Management Investment Distributors, Inc., member FINRA, and managed by Columbia Management Investment Advisers, LLC.
© 2017 Columbia Management Investment Advisers, LLC. All rights reserved.
Columbia Small Cap Growth Fund I | Annual Report 2017
Columbia Small Cap Growth Fund I | Annual Report 2017
Investment objective
Columbia Small Cap Growth Fund I (the Fund) seeks capital appreciation by investing, under normal market conditions, at least 80% of its net assets (plus any borrowings for investment purposes) in stocks of companies with a market capitalization, at the time of initial purchase, equal to or less than the largest stock in the Standard & Poor’s (S&P) SmallCap 600® Index.
Portfolio management
Daniel Cole, CFA
Co-manager
Managed Fund since 2015
Wayne Collette, CFA
Co-manager
Managed Fund since 2006
Lawrence Lin, CFA
Co-manager
Managed Fund since 2007
Morningstar style boxTM
The Morningstar Style Box is based on a fund’s portfolio holdings. For equity funds, the vertical axis shows the market capitalization of the stocks owned, and the horizontal axis shows investment style (value, blend, or growth). Information shown is based on the most recent data provided by Morningstar.
© 2017 Morningstar, Inc. All rights reserved. The Morningstar information contained herein: (1) is proprietary to Morningstar and/or its content providers; (2) may not be copied or distributed; and (3) is not warranted to be accurate, complete or timely. Neither Morningstar nor its content providers are responsible for any damages or losses arising from any use of this information.
| Average annual total returns (%) (for the period ended August 31, 2017) |
| | | Inception | 1 Year | 5 Years | 10 Years |
| Class A | Excluding sales charges | 11/01/05 | 22.42 | 12.75 | 7.73 |
| | Including sales charges | | 15.42 | 11.42 | 7.09 |
| Class C | Excluding sales charges | 11/01/05 | 21.48 | 11.91 | 6.92 |
| | Including sales charges | | 20.48 | 11.91 | 6.92 |
| Class K* | 02/28/13 | 22.54 | 12.91 | 7.87 |
| Class R* | 09/27/10 | 22.10 | 12.47 | 7.46 |
| Class R4* | 11/08/12 | 22.68 | 13.04 | 8.00 |
| Class R5* | 02/28/13 | 22.87 | 13.24 | 8.09 |
| Class Y* | 07/15/09 | 22.96 | 13.24 | 8.15 |
| Class Z | 10/01/96 | 22.72 | 13.03 | 8.00 |
| Russell 2000 Growth Index | | 16.39 | 13.75 | 8.21 |
| Russell 2000 Index | | 14.91 | 13.15 | 7.38 |
Returns for Class A shares are shown with and without the maximum initial sales charge of 5.75%. Returns for Class C shares are shown with and without the 1.00% contingent deferred sales charge for the first year only. The Fund’s other share classes are not subject to sales charges and have limited eligibility. Please see the Fund’s prospectus for details. Performance for different share classes will vary based on differences in sales charges and fees associated with each share class. All results shown assume reinvestment of distributions during the period. Returns do not reflect the deduction of taxes that a shareholder may pay on Fund distributions or on the redemption of Fund shares. Performance results reflect the effect of any fee waivers or reimbursements of Fund expenses by Columbia Management Investment Advisers, LLC and/or any of its affiliates. Absent these fee waivers or expense reimbursement arrangements, performance results would have been lower.
The performance information shown represents past performance and is not a guarantee of future results. The investment return and principal value of your investment will fluctuate so that your shares, when redeemed, may be worth more or less than their original cost. Current performance may be lower or higher than the performance information shown. You may obtain performance information current to the most recent month-end by contacting your financial intermediary, visiting investor.columbiathreadneedleus.com or calling 800.345.6611.
| * | The returns shown for periods prior to the share class inception date (including returns for the Life of the Fund, if shown, which are since Fund inception) include the returns of the Fund’s oldest share class. These returns are adjusted to reflect any higher class-related operating expenses of the newer share classes, as applicable. Please visit investor.columbiathreadneedleus.com/investment-products/mutual-funds/appended-performance for more information. |
The Russell 2000 Growth Index, an unmanaged index, measures the performance of those Russell 2000 Index companies with higher price-to-book ratios and higher forecasted growth values.
The Russell 2000 Index measures the performance of the small-cap segment of the U.S. equity universe. The Russell 2000 is a subset of the Russell 3000 Index representing approximately 10% of the total market capitalization of that index. It includes approximately 2,000 of the smallest securities based on a combination of their market cap and current index membership.
Indices are not available for investment, are not professionally managed and do not reflect sales charges, fees, brokerage commissions, taxes or other expenses of investing. Securities in the Fund may not match those in an index.
| 2 | Columbia Small Cap Growth Fund I | Annual Report 2017 |
Fund at a Glance (continued)
Performance of a hypothetical $10,000 investment (August 31, 2007 — August 31, 2017)
The chart above shows the change in value of a hypothetical $10,000 investment in Class A shares of Columbia Small Cap Growth Fund I during the stated time period, and does not reflect the deduction of taxes that a shareholder may pay on Fund distributions or on the redemption of Fund shares.
| Top 10 holdings (%) (at August 31, 2017) |
| Six Flags Entertainment Corp. | 2.7 |
| LendingTree, Inc. | 2.7 |
| Paycom Software, Inc. | 2.6 |
| Veeva Systems Inc., Class A | 2.4 |
| Coherent, Inc. | 2.3 |
| Fair Isaac Corp. | 2.1 |
| Wageworks, Inc. | 2.0 |
| Blackbaud, Inc. | 2.0 |
| Coresite Realty Corp. | 2.0 |
| Liberty Expedia Holdings, Inc., Class A | 1.9 |
Percentages indicated are based upon total investments (excluding Money Market Funds).
For further detail about these holdings, please refer to the section entitled “Portfolio of Investments.”
Fund holdings are as of the date given, are subject to change at any time, and are not recommendations to buy or sell any security.
| Portfolio breakdown (%) (at August 31, 2017) |
| Common Stocks | 96.1 |
| Money Market Funds | 3.9 |
| Total | 100.0 |
Percentages indicated are based upon total investments. The Fund’s portfolio composition is subject to change.
| Equity sector breakdown (%) (at August 31, 2017) |
| Consumer Discretionary | 18.4 |
| Consumer Staples | 1.2 |
| Energy | 1.5 |
| Financials | 7.0 |
| Health Care | 23.5 |
| Industrials | 15.9 |
| Information Technology | 25.8 |
| Materials | 2.6 |
| Real Estate | 4.1 |
| Total | 100.0 |
Percentages indicated are based upon total equity investments. The Fund’s portfolio composition is subject to change.
Columbia Small Cap Growth Fund I | Annual Report 2017
| 3 |
Manager Discussion of Fund Performance
For the 12-month period that ended August 31, 2017, the Fund’s Class A shares returned 22.42% excluding sales charges. During the same time period, the Fund outperformed its benchmark, the Russell 2000 Growth, which returned 16.39%, and the broader-based Russell 2000 Index, which returned 14.91%. Timely additions to economically-sensitive stocks late in 2016 bolstered overall returns. Many of these stocks quickly appreciated in value, meeting or exceeding our estimates of fair value, and we harvested gains in many instances. Biotechnology holdings also made a significant contribution to Fund results. However, the bulk of the Fund’s outperformance was generated by core holdings, companies with one or more of the core competitive advantages that we seek, which we currently believe are in the sweet spot of their profit life cycle.
U.S. equity markets delivered solid gains
Global events, political uncertainty and mixed economic data were enough to keep investors off balance early in the 12-month period, as financial markets moved sharply in reaction to each significant change on the world stage. However, the end of a contentious U.S. presidential contest in November 2016 eliminated a key element of uncertainty, and the U.S. equity markets moved solidly higher through the end of the period. Global growth picked up early in 2017. Positive U.S. economic data, steady job growth, rising corporate earnings and accelerated manufacturing activity further strengthened investor confidence.
The Federal Reserve (the Fed) raised the target range of its benchmark short-term interest rate three times during the period, bringing it to between 1.00% and 1.25% in June 2017. The Fed signaled that it was prepared to raise rates more aggressively on the heels of strong job gains and progress towards its 2.0% inflation target, creating expectations that the June rate hike may not be the last during the calendar year.
Against this backdrop, the U.S. equity markets moved solidly higher during the period. The S&P 500 Index rose 16.23%, with dividends reinvested. Small cap stocks outperformed large- and mid-cap stocks.
Fund strategy
Our fundamental research process favors higher quality companies with histories of earning more than their cost of capital, sustainable growth prospects and strong management teams. We seek to identify stocks with one or more of the core competitive advantages that we have categorized. We closely monitor the overall risk characteristics of the strategy versus its benchmark and seek to manage the risk profile within predefined limits around sector over/underweights and other key risk exposures relative to the benchmark. Typically, any sector over- or underweights are more of a reflection of our bottom-up analysis rather than a top-down call on one sector versus another. As a result, Fund performance is largely driven by individual stock selection. However, we do occasionally take over/underweight positions in a sub-sector or industry group that we believe has the potential to aid performance.
Biotechnology a key fund position
With support from research analysts in our central research department, the Fund’s performance was aided by its biotechnology holdings. We currently believe the outlook for biotech is strong, driven by robust innovation. One clear example of this potential is the anticipated approval of the first gene therapy in the United States aimed at treating a rare form of blindness through an injection behind the eye to improve functional vision. The biotech industry has also made great strides in oncology and continues to innovate with therapies that help individual immune systems attack and kill cancer cells in patients once thought to have little hope of a cure. Two current portfolio holdings which are pioneers in these innovative spaces are Bluebird Bio and Spark Therapeutics. While the potential exists for significant future profits through life saving drugs and therapies, most of these companies are not yet profitable. Therefore, risk management is essential when investing in biotech companies, and we believe the Fund owns a well-diversified basket of potential block busters.
Other contributors and detractors
The Fund’s top contributors were technology-related holdings. Veeva Systems, which pioneered cloud-based software for the sales and marketing functions of companies specifically in the life sciences industry, gained significant ground. The company has demonstrated the ability to expand its total addressable markets by building on its core competencies and innovating with new products and services. Of late, Veeva Systems has developed a cloud enterprise content management platform called Vault and a suite of applications for areas such as clinical trial management and the management of quality processes and content. This latest application has the potential to extend Veeva’s reach beyond the life sciences industry, raising our
| 4 | Columbia Small Cap Growth Fund I | Annual Report 2017 |
Manager Discussion of Fund Performance (continued)
estimate of the company’s long-term profit potential. Paycom Software also contributed strongly to the Fund’s results. Paycom offers payroll management software to small and mid-sized businesses that don’t need many of the services offered by larger payroll providers. The simplicity of Paycom’s offerings has allowed the company to create a lower cost sales and support structure, which has led to both expanded market share and a solidly profitable business model. We see the potential for added growth and continue to hold the stock. The year’s biggest contributor was Shopify, an end-to-end solution provider for small and medium eCommerce merchants. Shopify’s cloud-based platform does 80% of the functions needed by small businesses to create and operate a virtual storefront, including inventory management, payment processing, and shipping. The company’s focus on affordability and ease of use have allowed them to displace more expensive competitors. A network of developers that create additional services have helped fulfill the remaining 20% of functions required by their customers. We took profits and sold the stock as it exceeded our estimate of fair value and grew well beyond the Fund’s market capitalization parameters.
In a year of few disappointments, Ellie Mae, a leading provider of software solutions and services for the residential mortgage industry, was a notable detractor from performance. After an unanticipated drop-off in mortgage refinance applications caused disruption across the industry, Ellie Mae lowered revenue and earnings estimates and the stock pulled back. However, we continue to believe in the company’s long-term prospects because it lowers origination costs and reduces time to close for mortgage origination customers. By streamlining steps that have historically been siloed from the beginning of the application process to the final approval, Ellie Mae has gained market share and incumbency: Once the company’s software is integrated into a customer’s core processes, the value of adding more and more of its tools often becomes compelling. We believe Ellie Mae’s digital first-to-scale advantage offers expansion potential, and we added to the Fund’s position on the most recent pullback.
Investments in the oil service industry also detracted from Fund results during the period. Most if not all of these stocks are in the Fund’s special situations bucket, because they lack industry and business model characteristics that we believe are conducive to long-term value creation. We maintain this bucket, typically accounting for zero to 15% of the portfolio, for the opportunity it offers to invest in companies that we believe provide excellent risk/reward potential and for the diversification and balance they may provide to the overall portfolio. However, this year our timing was wrong. The U.S. shale boom, powered by technological innovation that has outpaced expectations for most in the marketplace, is changing the way investors think about business values in this sector of the economy, and oil service companies have been hurt by this shift.
At period end
At the end of the 12-month period, the Fund was heavily weighted toward companies that we judge to be in the sweet spot of their profit life cycles, with one or more of the core competitive advantages we seek. The dollar-weighted market cap of the Fund overall is slightly higher than normal, primarily the result of the success of key holdings that have grown in size. As always, we plan to harvest gains when a stock reaches or exceeds our estimate of fair value.
Market risk may affect a single issuer, sector of the economy, industry or the market as a whole. Foreign investments subject the Fund to risks, including political, economic, market, social and others within a particular country, as well as to currency instabilities and less stringent financial and accounting standards generally applicable to U.S. issuers. Investments in small-cap companies involve risks and volatility greater than investments in larger, more established companies. Growth securities, at times, may not perform as well as value securities or the stock market in general and may be out of favor with investors. The Fund may invest significantly in issuers within a particular sector, which may be negatively affected by market, economic or other conditions, making the Fund more vulnerable to unfavorable developments in the sector. See the Fund’s prospectus for more information on these and other risks.
The views expressed in this report reflect the current views of the respective parties. These views are not guarantees of future performance and involve certain risks, uncertainties and assumptions that are difficult to predict, so actual outcomes and results may differ significantly from the views expressed. These views are subject to change at any time based upon economic, market or other conditions and the respective parties disclaim any responsibility to update such views. These views may not be relied on as investment advice and, because investment decisions for a Columbia fund are based on numerous factors, may not be relied on as an indication of trading intent on behalf of any particular Columbia fund. References to specific securities should not be construed as a recommendation or investment advice.
Columbia Small Cap Growth Fund I | Annual Report 2017
| 5 |
Understanding Your Fund’s Expenses
(Unaudited)
As an investor, you incur two types of costs. There are transaction costs, which generally include sales charges on purchases and may include redemption fees. There are also ongoing costs, which generally include management fees, distribution and/or service fees, and other fund expenses. The following information is intended to help you understand your ongoing costs (in dollars) of investing in the Fund and to help you compare these costs with the ongoing costs of investing in other mutual funds.
Analyzing your Fund’s expenses
To illustrate these ongoing costs, we have provided examples and calculated the expenses paid by investors in each share class of the Fund during the period. The actual and hypothetical information in the table is based on an initial investment of $1,000 at the beginning of the period indicated and held for the entire period. Expense information is calculated two ways and each method provides you with different information. The amount listed in the “Actual” column is calculated using the Fund’s actual operating expenses and total return for the period. You may use the Actual information, together with the amount invested, to estimate the expenses that you paid over the period. Simply divide your account value by $1,000 (for example, an $8,600 account value divided by $1,000 = 8.6), then multiply the results by the expenses paid during the period under the “Actual” column. The amount listed in the “Hypothetical” column assumes a 5% annual rate of return before expenses (which is not the Fund’s actual return) and then applies the Fund’s actual expense ratio for the period to the hypothetical return. You should not use the hypothetical account values and expenses to estimate either your actual account balance at the end of the period or the expenses you paid during the period. See “Compare with other funds” below for details on how to use the hypothetical data.
Compare with other funds
Since all mutual funds are required to include the same hypothetical calculations about expenses in shareholder reports, you can use this information to compare the ongoing cost of investing in the Fund with other funds. To do so, compare the hypothetical example with the 5% hypothetical examples that appear in the shareholder reports of other funds. As you compare hypothetical examples of other funds, it is important to note that hypothetical examples are meant to highlight the ongoing costs of investing in a fund only and do not reflect any transaction costs, such as sales charges, or redemption or exchange fees. Therefore, the hypothetical calculations are useful in comparing ongoing costs only, and will not help you determine the relative total costs of owning different funds. If transaction costs were included in these calculations, your costs would be higher.
| March 1, 2017 — August 31, 2017 |
| | Account value at the
beginning of the
period ($) | Account value at the
end of the
period ($) | Expenses paid during
the period ($) | Fund’s annualized
expense ratio (%) |
| | Actual | Hypothetical | Actual | Hypothetical | Actual | Hypothetical | Actual |
| Class A | 1,000.00 | 1,000.00 | 1,100.70 | 1,018.40 | 7.15 | 6.87 | 1.35 |
| Class C | 1,000.00 | 1,000.00 | 1,096.60 | 1,014.62 | 11.10 | 10.66 | 2.10 |
| Class K | 1,000.00 | 1,000.00 | 1,101.20 | 1,018.90 | 6.62 | 6.36 | 1.25 |
| Class R | 1,000.00 | 1,000.00 | 1,099.00 | 1,017.14 | 8.47 | 8.13 | 1.60 |
| Class R4 | 1,000.00 | 1,000.00 | 1,101.50 | 1,019.66 | 5.83 | 5.60 | 1.10 |
| Class R5 | 1,000.00 | 1,000.00 | 1,102.30 | 1,020.11 | 5.35 | 5.14 | 1.01 |
| Class Y | 1,000.00 | 1,000.00 | 1,103.10 | 1,020.42 | 5.04 | 4.84 | 0.95 |
| Class Z | 1,000.00 | 1,000.00 | 1,101.60 | 1,019.66 | 5.83 | 5.60 | 1.10 |
Expenses paid during the period are equal to the annualized expense ratio for each class as indicated above, multiplied by the average account value over the period and then multiplied by the number of days in the Fund’s most recent fiscal half year and divided by 365.
Expenses do not include fees and expenses incurred indirectly by the Fund from its investment in underlying funds, including affiliated and non-affiliated pooled investment vehicles, such as mutual funds and exchange-traded funds.
Had Columbia Management Investment Advisers, LLC and/or certain of its affiliates not waived/reimbursed certain fees and expenses, account value at the end of the period would have been reduced.
| 6 | Columbia Small Cap Growth Fund I | Annual Report 2017 |
Portfolio of Investments
August 31, 2017
(Percentages represent value of investments compared to net assets)
| Common Stocks 98.7% |
| Issuer | Shares | Value ($) |
| Consumer Discretionary 18.2% |
| Auto Components 1.2% |
| LCI Industries | 54,200 | 5,354,960 |
| Hotels, Restaurants & Leisure 6.7% |
| Extended Stay America, Inc. | 200,137 | 3,920,684 |
| Hilton Grand Vacations, Inc.(a) | 144,000 | 5,220,000 |
| Papa John’s International, Inc. | 36,996 | 2,766,931 |
| Six Flags Entertainment Corp. | 214,638 | 11,712,795 |
| Wingstop, Inc. | 167,709 | 5,435,449 |
| Total | | 29,055,859 |
| Household Durables 0.8% |
| TopBuild Corp.(a) | 56,400 | 3,347,340 |
| Internet & Direct Marketing Retail 3.0% |
| Liberty Expedia Holdings, Inc., Class A(a) | 152,200 | 8,323,818 |
| Nutrisystem, Inc. | 44,800 | 2,432,640 |
| TripAdvisor, Inc.(a) | 54,300 | 2,320,239 |
| Total | | 13,076,697 |
| Media 1.4% |
| Lions Gate Entertainment Corp., Class B(a) | 91,220 | 2,560,545 |
| Nexstar Broadcasting Group, Inc., Class A | 60,290 | 3,629,458 |
| Total | | 6,190,003 |
| Multiline Retail 1.7% |
| Ollie’s Bargain Outlet Holdings, Inc.(a) | 176,400 | 7,382,340 |
| Specialty Retail 3.4% |
| Camping World Holdings, Inc., Class A | 143,500 | 5,273,625 |
| Floor & Decor Holdings, Inc.(a) | 74,369 | 2,672,822 |
| Michaels Companies, Inc. (The)(a) | 164,700 | 3,697,515 |
| Party City Holdco, Inc.(a) | 210,900 | 2,942,055 |
| Total | | 14,586,017 |
| Total Consumer Discretionary | 78,993,216 |
| Consumer Staples 1.1% |
| Beverages 0.4% |
| Coca-Cola Bottling Co. Consolidated | 8,200 | 1,751,438 |
| Household Products 0.7% |
| Central Garden & Pet Co.(a) | 90,400 | 3,186,600 |
| Total Consumer Staples | 4,938,038 |
| Common Stocks (continued) |
| Issuer | Shares | Value ($) |
| Energy 1.5% |
| Energy Equipment & Services 0.9% |
| Matrix Service Co.(a) | 198,400 | 2,351,040 |
| NCS Multistage Holdings, Inc.(a) | 74,692 | 1,475,914 |
| Total | | 3,826,954 |
| Oil, Gas & Consumable Fuels 0.6% |
| RSP Permian, Inc.(a) | 86,700 | 2,720,646 |
| Total Energy | 6,547,600 |
| Financials 6.9% |
| Banks 1.9% |
| Home Bancshares, Inc. | 353,700 | 8,244,747 |
| Capital Markets 1.5% |
| MarketAxess Holdings, Inc. | 24,000 | 4,630,800 |
| Pzena Investment Management, Inc., Class A | 175,953 | 1,741,935 |
| Total | | 6,372,735 |
| Thrifts & Mortgage Finance 3.5% |
| LendingTree, Inc.(a) | 50,700 | 11,709,165 |
| WSFS Financial Corp. | 81,500 | 3,643,050 |
| Total | | 15,352,215 |
| Total Financials | 29,969,697 |
| Health Care 23.1% |
| Biotechnology 7.0% |
| ACADIA Pharmaceuticals, Inc.(a) | 39,886 | 1,420,340 |
| Alder Biopharmaceuticals, Inc.(a) | 172,202 | 1,687,579 |
| Axovant Sciences Ltd.(a) | 27,248 | 544,960 |
| bluebird bio, Inc.(a) | 27,422 | 3,423,637 |
| Blueprint Medicines Corp.(a) | 19,800 | 1,073,556 |
| Clovis Oncology, Inc.(a) | 27,100 | 2,061,497 |
| Dynavax Technologies Corp.(a) | 74,977 | 1,345,837 |
| Insmed, Inc.(a) | 42,600 | 529,092 |
| Intercept Pharmaceuticals, Inc.(a) | 8,500 | 991,185 |
| Jounce Therapeutics, Inc.(a) | 68,203 | 1,158,769 |
| Keryx Biopharmaceuticals, Inc.(a) | 223,071 | 1,608,342 |
| Loxo Oncology, Inc.(a) | 22,200 | 1,851,480 |
| NewLink Genetics Corp.(a) | 93,800 | 761,656 |
| OncoMed Pharmaceuticals, Inc.(a) | 232,200 | 1,154,034 |
| Ovid Therapeutics, Inc.(a) | 35,921 | 338,376 |
| Puma Biotechnology, Inc.(a) | 29,200 | 2,701,000 |
The accompanying Notes to Financial Statements are an integral part of this statement.
Columbia Small Cap Growth Fund I | Annual Report 2017
| 7 |
Portfolio of Investments (continued)
August 31, 2017
| Common Stocks (continued) |
| Issuer | Shares | Value ($) |
| Ra Pharmaceuticals, Inc.(a) | 36,444 | 547,024 |
| Sage Therapeutics, Inc.(a) | 14,800 | 1,217,300 |
| Spark Therapeutics, Inc.(a) | 27,390 | 2,255,019 |
| TESARO, Inc.(a) | 22,348 | 2,886,021 |
| vTv Therapeutics, Inc., Class A(a) | 162,223 | 880,871 |
| Total | | 30,437,575 |
| Health Care Equipment & Supplies 5.3% |
| ABIOMED, Inc.(a) | 21,761 | 3,281,559 |
| Cantel Medical Corp. | 55,000 | 4,468,750 |
| Neogen Corp.(a) | 111,200 | 7,661,680 |
| West Pharmaceutical Services, Inc. | 88,000 | 7,659,520 |
| Total | | 23,071,509 |
| Health Care Providers & Services 3.2% |
| BioTelemetry, Inc.(a) | 87,800 | 3,261,770 |
| Chemed Corp. | 20,583 | 4,060,820 |
| Tivity Health, Inc.(a) | 167,100 | 6,550,320 |
| Total | | 13,872,910 |
| Health Care Technology 2.8% |
| HealthStream, Inc.(a) | 74,300 | 1,745,307 |
| Veeva Systems Inc., Class A(a) | 173,300 | 10,311,350 |
| Total | | 12,056,657 |
| Life Sciences Tools & Services 2.0% |
| INC Research Holdings, Inc. Class A(a) | 73,000 | 4,285,100 |
| Pra Health Sciences, Inc.(a) | 55,800 | 4,318,920 |
| Total | | 8,604,020 |
| Pharmaceuticals 2.8% |
| Aerie Pharmaceuticals, Inc.(a) | 33,593 | 1,926,559 |
| GW Pharmaceuticals PLC, ADR(a) | 7,900 | 835,978 |
| Medicines Co. (The)(a) | 31,000 | 1,137,390 |
| Pacira Pharmaceuticals, Inc.(a) | 64,000 | 2,438,400 |
| Prestige Brands Holdings, Inc.(a) | 98,300 | 4,984,793 |
| Supernus Pharmaceuticals, Inc.(a) | 23,600 | 1,080,880 |
| Total | | 12,404,000 |
| Total Health Care | 100,446,671 |
| Industrials 15.7% |
| Aerospace & Defense 1.1% |
| Teledyne Technologies, Inc.(a) | 31,222 | 4,685,173 |
| Common Stocks (continued) |
| Issuer | Shares | Value ($) |
| Airlines 0.6% |
| Copa Holdings SA, Class A | 21,400 | 2,655,098 |
| Building Products 0.9% |
| Continental Building Product(a) | 71,300 | 1,736,155 |
| Trex Co., Inc.(a) | 28,300 | 2,150,800 |
| Total | | 3,886,955 |
| Commercial Services & Supplies 2.8% |
| ARC Document Solutions, Inc.(a) | 522,389 | 1,844,033 |
| Casella Waste Systems, Inc., Class A(a) | 123,300 | 2,072,673 |
| Deluxe Corp. | 57,000 | 3,952,950 |
| Heritage-Crystal Clean, Inc.(a) | 223,570 | 4,359,615 |
| Total | | 12,229,271 |
| Electrical Equipment 0.6% |
| Generac Holdings, Inc.(a) | 66,676 | 2,692,377 |
| Machinery 4.2% |
| Mueller Water Products, Inc., Class A | 224,800 | 2,695,352 |
| Proto Labs, Inc.(a) | 54,200 | 3,891,560 |
| Sun Hydraulics Corp. | 157,000 | 7,521,870 |
| Terex Corp. | 102,700 | 3,959,085 |
| Total | | 18,067,867 |
| Professional Services 2.0% |
| Wageworks, Inc.(a) | 147,200 | 8,677,440 |
| Road & Rail 1.1% |
| Landstar System, Inc. | 24,100 | 2,249,735 |
| Saia, Inc.(a) | 43,800 | 2,476,890 |
| Total | | 4,726,625 |
| Trading Companies & Distributors 2.4% |
| DXP Enterprises, Inc.(a) | 113,800 | 3,082,842 |
| Watsco, Inc. | 49,500 | 7,294,320 |
| Total | | 10,377,162 |
| Total Industrials | 67,997,968 |
| Information Technology 25.5% |
| Communications Equipment 1.1% |
| Lumentum Holdings, Inc.(a) | 85,100 | 4,837,935 |
| Electronic Equipment, Instruments & Components 2.3% |
| Coherent, Inc.(a) | 42,600 | 9,939,432 |
The accompanying Notes to Financial Statements are an integral part of this statement.
| 8 | Columbia Small Cap Growth Fund I | Annual Report 2017 |
Portfolio of Investments (continued)
August 31, 2017
| Common Stocks (continued) |
| Issuer | Shares | Value ($) |
| Internet Software & Services 4.6% |
| Five9, Inc.(a) | 146,300 | 3,145,450 |
| Match Group, Inc.(a) | 357,535 | 7,776,386 |
| MINDBODY, Inc., Class A(a) | 83,900 | 1,984,235 |
| TrueCar, Inc.(a) | 252,900 | 4,286,655 |
| Wix.com Ltd.(a) | 46,200 | 3,007,620 |
| Total | | 20,200,346 |
| IT Services 1.9% |
| EPAM Systems, Inc.(a) | 48,329 | 3,930,598 |
| Euronet Worldwide, Inc.(a) | 43,502 | 4,274,941 |
| Total | | 8,205,539 |
| Semiconductors & Semiconductor Equipment 3.3% |
| MKS Instruments, Inc. | 78,800 | 6,489,180 |
| Nanometrics, Inc.(a) | 134,800 | 3,476,492 |
| Silicon Laboratories, Inc.(a) | 55,800 | 4,235,220 |
| Total | | 14,200,892 |
| Software 12.3% |
| Blackbaud, Inc. | 100,500 | 8,483,205 |
| Callidus Software, Inc.(a) | 170,300 | 4,385,225 |
| CyberArk Software Ltd.(a) | 51,658 | 2,066,837 |
| Ellie Mae, Inc.(a) | 99,000 | 8,215,020 |
| Everbridge, Inc.(a) | 183,100 | 4,242,427 |
| Fair Isaac Corp. | 65,100 | 9,163,476 |
| Paycom Software, Inc.(a) | 150,813 | 11,252,158 |
| PROS Holdings, Inc.(a) | 76,500 | 2,015,010 |
| RealPage, Inc.(a) | 78,100 | 3,366,110 |
| Total | | 53,189,468 |
| Total Information Technology | 110,573,612 |
| Common Stocks (continued) |
| Issuer | Shares | Value ($) |
| Materials 2.6% |
| Chemicals 1.0% |
| Ingevity Corp.(a) | 67,100 | 4,225,287 |
| Construction Materials 1.2% |
| Summit Materials, Inc., Class A(a) | 107,800 | 3,184,412 |
| US Concrete, Inc.(a) | 27,100 | 2,169,355 |
| Total | | 5,353,767 |
| Paper & Forest Products 0.4% |
| Neenah Paper, Inc. | 20,700 | 1,599,075 |
| Total Materials | 11,178,129 |
| Real Estate 4.1% |
| Equity Real Estate Investment Trusts (REITS) 4.1% |
| Coresite Realty Corp. | 71,300 | 8,467,588 |
| DuPont Fabros Technology, Inc. | 70,000 | 4,505,200 |
| STORE Capital Corp. | 184,004 | 4,670,022 |
| Total | | 17,642,810 |
| Total Real Estate | 17,642,810 |
Total Common Stocks
(Cost $370,153,613) | 428,287,741 |
|
| Money Market Funds 4.0% |
| | Shares | Value ($) |
| Columbia Short-Term Cash Fund, 1.146%(b),(c) | 17,335,056 | 17,335,056 |
Total Money Market Funds
(Cost $17,334,979) | 17,335,056 |
Total Investments
(Cost: $387,488,592) | 445,622,797 |
| Other Assets & Liabilities, Net | | (11,756,867) |
| Net Assets | 433,865,930 |
Notes to Portfolio of Investments
| (a) | Non-income producing investment. |
| (b) | The rate shown is the seven-day current annualized yield at August 31, 2017. |
| (c) | As defined in the Investment Company Act of 1940, an affiliated company is one in which the Fund owns 5% or more of the company’s outstanding voting securities, or a company which is under common ownership or control with the Fund. Holdings and transactions in these affiliated companies during the year ended August 31, 2017 are as follows: |
| Issuer | Beginning
shares | Shares
purchased | Shares
sold | Ending
shares | Realized gain
(loss) ($) | Net change in
unrealized
appreciation
(depreciation) ($) | Dividends —
affiliated
issuers($) | Value ($) |
| Columbia Short-Term Cash Fund, 1.146% | 15,636,168 | 254,701,884 | (253,002,996) | 17,335,056 | 843 | 77 | 66,028 | 17,335,056 |
The accompanying Notes to Financial Statements are an integral part of this statement.
Columbia Small Cap Growth Fund I | Annual Report 2017
| 9 |
Portfolio of Investments (continued)
August 31, 2017
Abbreviation Legend
| ADR | American Depositary Receipt |
Fair value measurements
The Fund categorizes its fair value measurements according to a three-level hierarchy that maximizes the use of observable inputs and minimizes the use of unobservable inputs by prioritizing that the most observable input be used when available. Observable inputs are those that market participants would use in pricing an investment based on market data obtained from sources independent of the reporting entity. Unobservable inputs are those that reflect the Fund’s assumptions about the information market participants would use in pricing an investment. An investment’s level within the fair value hierarchy is based on the lowest level of any input that is deemed significant to the asset’s or liability’s fair value measurement. The input levels are not necessarily an indication of the risk or liquidity associated with investments at that level. For example, certain U.S. government securities are generally high quality and liquid, however, they are reflected as Level 2 because the inputs used to determine fair value may not always be quoted prices in an active market.
Fair value inputs are summarized in the three broad levels listed below:
| • | Level 1 – Valuations based on quoted prices for investments in active markets that the Fund has the ability to access at the measurement date. Valuation adjustments are not applied to Level 1 investments. |
| • | Level 2 – Valuations based on other significant observable inputs (including quoted prices for similar securities, interest rates, prepayment speeds, credit risks, etc.). |
| • | Level 3 – Valuations based on significant unobservable inputs (including the Fund’s own assumptions and judgment in determining the fair value of investments). |
Inputs that are used in determining fair value of an investment may include price information, credit data, volatility statistics, and other factors. These inputs can be either observable or unobservable. The availability of observable inputs can vary between investments, and is affected by various factors such as the type of investment, and the volume and level of activity for that investment or similar investments in the marketplace. The inputs will be considered by the Investment Manager, along with any other relevant factors in the calculation of an investment’s fair value. The Fund uses prices and inputs that are current as of the measurement date, which may include periods of market dislocations. During these periods, the availability of prices and inputs may be reduced for many investments. This condition could cause an investment to be reclassified between the various levels within the hierarchy.
Certain investments that have been measured at fair value using the net asset value (NAV) per share (or its equivalent) are not categorized in the fair value hierarchy. The fair value amounts presented in the table are intended to reconcile the fair value hierarchy to the amounts presented in the Portfolio of Investments. The Columbia Short-Term Cash Fund seeks to provide shareholders with maximum current income consistent with liquidity and stability of principal. Columbia Short-Term Cash Fund prices its shares with a floating NAV and no longer seeks to maintain a stable NAV.
Investments falling into the Level 3 category are primarily supported by quoted prices from brokers and dealers participating in the market for those investments. However, these may be classified as Level 3 investments due to lack of market transparency and corroboration to support these quoted prices. Additionally, valuation models may be used as the pricing source for any remaining investments classified as Level 3. These models may rely on one or more significant unobservable inputs and/or significant assumptions by the Investment Manager. Inputs used in valuations may include, but are not limited to, financial statement analysis, capital account balances, discount rates and estimated cash flows, and comparable company data.
Under the direction of the Fund’s Board of Trustees (the Board), the Investment Manager’s Valuation Committee (the Committee) is responsible for overseeing the valuation procedures approved by the Board. The Committee consists of voting and non-voting members from various groups within the Investment Manager’s organization, including operations and accounting, trading and investments, compliance, risk management and legal.
The Committee meets at least monthly to review and approve valuation matters, which may include a description of specific valuation determinations, data regarding pricing information received from approved pricing vendors and brokers and the results of Board-approved valuation control policies and procedures (the Policies). The Policies address, among other things, instances when market quotations are or are not readily available, including recommendations of third party pricing vendors and a determination of appropriate pricing methodologies; events that require specific valuation determinations and assessment of fair value techniques; securities with a potential for stale pricing, including those that are illiquid, restricted, or in default; and the effectiveness of third party pricing vendors, including periodic reviews of vendors. The Committee meets more frequently, as needed, to discuss additional valuation matters, which may include the need to review back-testing results, review time-sensitive information or approve related valuation actions. The Committee reports to the Board, with members of the Committee meeting with the Board at each of its regularly scheduled meetings to discuss valuation matters and actions during the period, similar to those described earlier.
For investments categorized as Level 3, the Committee monitors information similar to that described above, which may include: (i) data specific to the issuer or comparable issuers, (ii) general market or specific sector news and (iii) quoted prices and specific or similar security transactions. The Committee considers this data and any changes from prior periods in order to assess the reasonableness of observable and unobservable inputs, any assumptions or internal models used to value those securities and changes in fair value. This data is also used to corroborate, when available, information received from approved pricing vendors and brokers. Various factors impact the frequency of monitoring this information (which may occur as often as daily). However, the Committee may determine that changes to inputs, assumptions and models are not required as a result of the monitoring procedures performed.
The following table is a summary of the inputs used to value the Fund’s investments at August 31, 2017:
| | Level 1
quoted prices
in active
markets for
identical
assets ($) | Level 2
other
significant
observable
inputs ($) | Level 3
significant
unobservable
inputs ($) | Investments
measured at
net asset
value ($) | Total ($) |
| Investments | | | | | |
| Common Stocks | | | | | |
| Consumer Discretionary | 78,993,216 | — | — | — | 78,993,216 |
| Consumer Staples | 4,938,038 | — | — | — | 4,938,038 |
| Energy | 6,547,600 | — | — | — | 6,547,600 |
| Financials | 29,969,697 | — | — | — | 29,969,697 |
The accompanying Notes to Financial Statements are an integral part of this statement.
| 10 | Columbia Small Cap Growth Fund I | Annual Report 2017 |
Portfolio of Investments (continued)
August 31, 2017
Fair value measurements (continued)
| | Level 1
quoted prices
in active
markets for
identical
assets ($) | Level 2
other
significant
observable
inputs ($) | Level 3
significant
unobservable
inputs ($) | Investments
measured at
net asset
value ($) | Total ($) |
| Health Care | 100,446,671 | — | — | — | 100,446,671 |
| Industrials | 67,997,968 | — | — | — | 67,997,968 |
| Information Technology | 110,573,612 | — | — | — | 110,573,612 |
| Materials | 11,178,129 | — | — | — | 11,178,129 |
| Real Estate | 17,642,810 | — | — | — | 17,642,810 |
| Total Common Stocks | 428,287,741 | — | — | — | 428,287,741 |
| Money Market Funds | — | — | — | 17,335,056 | 17,335,056 |
| Total Investments | 428,287,741 | — | — | 17,335,056 | 445,622,797 |
See the Portfolio of Investments for all investment classifications not indicated in the table.
There were no transfers of financial assets between levels during the period.
The accompanying Notes to Financial Statements are an integral part of this statement.
Columbia Small Cap Growth Fund I | Annual Report 2017
| 11 |
Statement of Assets and Liabilities
August 31, 2017
| Assets | |
| Investments in unaffiliated issuers, at cost | $370,153,613 |
| Investments in affiliated issuers, at cost | 17,334,979 |
| Investments in unaffiliated issuers, at value | 428,287,741 |
| Investments in affiliated issuers, at value | 17,335,056 |
| Receivable for: | |
| Investments sold | 5,780,943 |
| Capital shares sold | 222,619 |
| Regulatory settlements (Note 6) | 2,181,933 |
| Dividends | 285,067 |
| Expense reimbursement due from Investment Manager | 204 |
| Prepaid expenses | 2,916 |
| Trustees’ deferred compensation plan | 92,252 |
| Total assets | 454,188,731 |
| Liabilities | |
| Payable for: | |
| Investments purchased | 19,700,118 |
| Capital shares purchased | 379,280 |
| Management services fees | 10,229 |
| Distribution and/or service fees | 1,632 |
| Transfer agent fees | 49,575 |
| Plan administration fees | 11 |
| Compensation of board members | 29,854 |
| Compensation of chief compliance officer | 30 |
| Other expenses | 59,820 |
| Trustees’ deferred compensation plan | 92,252 |
| Total liabilities | 20,322,801 |
| Net assets applicable to outstanding capital stock | $433,865,930 |
| Represented by | |
| Paid in capital | 322,961,594 |
| Excess of distributions over net investment income | (121,599) |
| Accumulated net realized gain | 52,891,730 |
| Unrealized appreciation (depreciation) on: | |
| Investments - unaffiliated issuers | 58,134,128 |
| Investments - affiliated issuers | 77 |
| Total - representing net assets applicable to outstanding capital stock | $433,865,930 |
The accompanying Notes to Financial Statements are an integral part of this statement.
| 12 | Columbia Small Cap Growth Fund I | Annual Report 2017 |
Statement of Assets and Liabilities (continued)
August 31, 2017
| Class A | |
| Net assets | $189,019,456 |
| Shares outstanding | 9,711,642 |
| Net asset value per share | $19.46 |
| Maximum offering price per share(a) | $20.65 |
| Class C | |
| Net assets | $12,280,775 |
| Shares outstanding | 751,119 |
| Net asset value per share | $16.35 |
| Class K | |
| Net assets | $48,820 |
| Shares outstanding | 2,401 |
| Net asset value per share(b) | $20.34 |
| Class R | |
| Net assets | $1,387,048 |
| Shares outstanding | 72,614 |
| Net asset value per share | $19.10 |
| Class R4 | |
| Net assets | $1,734,480 |
| Shares outstanding | 81,124 |
| Net asset value per share | $21.38 |
| Class R5 | |
| Net assets | $15,478,008 |
| Shares outstanding | 748,462 |
| Net asset value per share | $20.68 |
| Class Y | |
| Net assets | $54,573,754 |
| Shares outstanding | 2,614,743 |
| Net asset value per share | $20.87 |
| Class Z | |
| Net assets | $159,343,589 |
| Shares outstanding | 7,775,941 |
| Net asset value per share | $20.49 |
| (a) | The maximum offering price per share is calculated by dividing the net asset value per share by 1.0 minus the maximum sales charge of 5.75% for Class A. |
| (b) | Net asset value per share rounds to this amount due to fractional shares outstanding. |
The accompanying Notes to Financial Statements are an integral part of this statement.
Columbia Small Cap Growth Fund I | Annual Report 2017
| 13 |
Statement of Operations
Year Ended August 31, 2017
| Net investment income | |
| Income: | |
| Dividends — unaffiliated issuers | $2,387,526 |
| Dividends — affiliated issuers | 66,028 |
| Foreign taxes withheld | (2,519) |
| Total income | 2,451,035 |
| Expenses: | |
| Management services fees | 3,547,326 |
| Distribution and/or service fees | |
| Class A | 444,679 |
| Class B(a) | 3,408 |
| Class C | 129,421 |
| Class R | 7,051 |
| Transfer agent fees | |
| Class A | 366,967 |
| Class B(a) | 716 |
| Class C | 26,735 |
| Class I(b) | 879 |
| Class K | 26 |
| Class R | 2,909 |
| Class R4 | 3,721 |
| Class R5 | 8,728 |
| Class Y | 2,428 |
| Class Z | 313,271 |
| Plan administration fees | |
| Class K | 110 |
| Compensation of board members | 26,766 |
| Custodian fees | 11,774 |
| Printing and postage fees | 61,518 |
| Registration fees | 144,621 |
| Audit fees | 39,190 |
| Legal fees | 11,687 |
| Compensation of chief compliance officer | 176 |
| Other | (18,848) |
| Total expenses | 5,135,259 |
| Fees waived or expenses reimbursed by Investment Manager and its affiliates | (186,196) |
| Expense reduction | (7,628) |
| Total net expenses | 4,941,435 |
| Net investment loss | (2,490,400) |
| Realized and unrealized gain (loss) — net | |
| Net realized gain (loss) on: | |
| Investments — unaffiliated issuers | 63,979,088 |
| Investments — affiliated issuers | 843 |
| Foreign currency translations | (6,076) |
| Net realized gain | 63,973,855 |
| Net change in unrealized appreciation (depreciation) on: | |
| Investments — unaffiliated issuers | 21,727,732 |
| Investments — affiliated issuers | 77 |
| Net change in unrealized appreciation (depreciation) | 21,727,809 |
| Net realized and unrealized gain | 85,701,664 |
| Net increase in net assets resulting from operations | $83,211,264 |
| (a) | Effective July 17, 2017, Class B shares were automatically converted to Class A shares. |
| (b) | Effective March 27, 2017, Class I shares were redeemed or exchanged for Class Y shares. |
The accompanying Notes to Financial Statements are an integral part of this statement.
| 14 | Columbia Small Cap Growth Fund I | Annual Report 2017 |
Statement of Changes in Net Assets
| | Year Ended
August 31, 2017 | Year Ended
August 31, 2016 |
| Operations | | |
| Net investment loss | $(2,490,400) | $(2,084,470) |
| Net realized gain | 63,973,855 | 42,104,386 |
| Net change in unrealized appreciation (depreciation) | 21,727,809 | (30,307,187) |
| Net increase in net assets resulting from operations | 83,211,264 | 9,712,729 |
| Distributions to shareholders | | |
| Net realized gains | | |
| Class A | (14,427,569) | (72,930,525) |
| Class B(a) | (44,363) | (535,408) |
| Class C | (1,163,801) | (6,640,363) |
| Class I(b) | (2,897,417) | (17,350,522) |
| Class K | (3,329) | (15,137) |
| Class R | (114,255) | (633,899) |
| Class R4 | (102,953) | (24,586) |
| Class R5 | (1,024,280) | (4,433,879) |
| Class Y | (878,940) | (1,637,722) |
| Class Z | (11,918,433) | (72,031,076) |
| Total distributions to shareholders | (32,575,340) | (176,233,117) |
| Increase (decrease) in net assets from capital stock activity | (21,467,841) | 67,977,819 |
| Total increase (decrease) in net assets | 29,168,083 | (98,542,569) |
| Net assets at beginning of year | 404,697,847 | 503,240,416 |
| Net assets at end of year | $433,865,930 | $404,697,847 |
| Excess of distributions over net investment income | $(121,599) | $(269,002) |
| (a) | Effective July 17, 2017, Class B shares were automatically converted to Class A shares. |
| (b) | Effective March 27, 2017, Class I shares were redeemed or exchanged for Class Y shares. |
The accompanying Notes to Financial Statements are an integral part of this statement.
Columbia Small Cap Growth Fund I | Annual Report 2017
| 15 |
Statement of Changes in Net Assets (continued)
| | Year Ended | Year Ended |
| | August 31, 2017 | August 31, 2016 |
| | Shares | Dollars ($) | Shares | Dollars ($) |
| Capital stock activity |
| Class A(a) | | | | |
| Subscriptions (b) | 811,805 | 14,645,816 | 925,241 | 16,390,137 |
| Distributions reinvested | 729,371 | 12,326,375 | 3,749,664 | 61,831,964 |
| Redemptions | (1,902,417) | (33,806,184) | (2,043,290) | (37,190,673) |
| Net increase (decrease) | (361,241) | (6,833,993) | 2,631,615 | 41,031,428 |
| Class B(a) | | | | |
| Subscriptions | 346 | 5,073 | 994 | 14,049 |
| Distributions reinvested | 3,059 | 43,649 | 36,088 | 509,928 |
| Redemptions (b) | (43,256) | (659,312) | (58,247) | (877,652) |
| Net decrease | (39,851) | (610,590) | (21,165) | (353,675) |
| Class C | | | | |
| Subscriptions | 100,035 | 1,497,300 | 122,960 | 1,757,444 |
| Distributions reinvested | 69,775 | 995,689 | 388,145 | 5,484,490 |
| Redemptions | (313,530) | (4,765,688) | (292,268) | (4,333,207) |
| Net increase (decrease) | (143,720) | (2,272,699) | 218,837 | 2,908,727 |
| Class I(c) | | | | |
| Subscriptions | 43,255 | 822,084 | 878,398 | 12,836,923 |
| Distributions reinvested | 160,073 | 2,897,317 | 988,033 | 17,349,866 |
| Redemptions | (2,259,882) | (42,472,598) | (1,535,272) | (26,500,342) |
| Net increase (decrease) | (2,056,554) | (38,753,197) | 331,159 | 3,686,447 |
| Class K | | | | |
| Distributions reinvested | 183 | 3,222 | 840 | 14,414 |
| Redemptions | — | — | (104) | (1,727) |
| Net increase | 183 | 3,222 | 736 | 12,687 |
| Class R | | | | |
| Subscriptions | 17,930 | 317,936 | 17,461 | 294,244 |
| Distributions reinvested | 6,697 | 111,302 | 38,002 | 617,158 |
| Redemptions | (31,788) | (565,314) | (38,889) | (648,742) |
| Net increase (decrease) | (7,161) | (136,076) | 16,574 | 262,660 |
| Class R4 | | | | |
| Subscriptions | 303,976 | 6,141,909 | 74,301 | 1,321,381 |
| Distributions reinvested | 5,550 | 102,842 | 1,328 | 23,840 |
| Redemptions | (296,444) | (6,073,632) | (9,993) | (168,286) |
| Net increase | 13,082 | 171,119 | 65,636 | 1,176,935 |
| Class R5 | | | | |
| Subscriptions | 204,966 | 3,869,035 | 106,776 | 2,080,423 |
| Distributions reinvested | 57,184 | 1,024,165 | 254,923 | 4,433,117 |
| Redemptions | (153,897) | (2,943,144) | (148,110) | (2,712,836) |
| Net increase | 108,253 | 1,950,056 | 213,589 | 3,800,704 |
| Class Y(c) | | | | |
| Subscriptions | 2,499,742 | 47,382,582 | 218,139 | 4,024,602 |
| Distributions reinvested | 48,634 | 878,821 | 93,379 | 1,636,936 |
| Redemptions | (289,616) | (5,596,085) | (90,892) | (1,509,786) |
| Net increase | 2,258,760 | 42,665,318 | 220,626 | 4,151,752 |
| Class Z | | | | |
| Subscriptions | 1,181,510 | 22,327,660 | 763,065 | 14,208,749 |
| Distributions reinvested | 645,571 | 11,465,341 | 3,817,872 | 65,896,476 |
| Redemptions | (2,756,842) | (51,444,002) | (3,592,004) | (68,805,071) |
| Net increase (decrease) | (929,761) | (17,651,001) | 988,933 | 11,300,154 |
| Total net increase (decrease) | (1,158,010) | (21,467,841) | 4,666,540 | 67,977,819 |
The accompanying Notes to Financial Statements are an integral part of this statement.
| 16 | Columbia Small Cap Growth Fund I | Annual Report 2017 |
Statement of Changes in Net Assets (continued)
| (a) | Effective July 17, 2017, Class B shares were automatically converted to Class A shares. |
| (b) | Includes conversions of Class B shares to Class A shares, if any. |
| (c) | Effective March 27, 2017, Class I shares were redeemed or exchanged for Class Y shares. |
The accompanying Notes to Financial Statements are an integral part of this statement.
Columbia Small Cap Growth Fund I | Annual Report 2017
| 17 |
The following table is intended to help you understand the Fund’s financial performance. Certain information reflects financial results for a single share of a class held for the periods shown. Per share net investment income (loss) amounts are calculated based on average shares outstanding during the period. Total return assumes reinvestment of all dividends and distributions, if any. Total return does not reflect payment of sales charges, if any. Total return and portfolio turnover are not annualized for periods of less than one year. The portfolio turnover rate is calculated without regard to purchase and sales transactions of short-term instruments and certain derivatives, if any. If such transactions were included, the Fund’s portfolio turnover rate may be higher.
| Year ended | Net asset value,
beginning of
period | Net
investment
income
(loss) | Net
realized
and
unrealized
gain | Total from
investment
operations | Distributions
from net
realized
gains |
| Class A |
| 8/31/2017 | $17.29 | (0.13) | 3.78 | 3.65 | (1.48) |
| 8/31/2016 | $27.22 | (0.11) (e) | 0.40 | 0.29 | (10.22) |
| 8/31/2015 | $29.40 | (0.27) | 3.09 | 2.82 | (5.11) |
| 8/31/2014 | $33.32 | (0.28) | 1.71 | 1.43 | (5.35) |
| 8/31/2013 | $29.55 | (0.23) | 6.90 | 6.67 | (2.90) |
| Class C |
| 8/31/2017 | $14.74 | (0.23) | 3.20 | 2.97 | (1.36) |
| 8/31/2016 | $24.87 | (0.21) (e) | 0.30 | 0.09 | (10.22) |
| 8/31/2015 | $27.47 | (0.44) | 2.85 | 2.41 | (5.11) |
| 8/31/2014 | $31.44 | (0.49) | 1.62 | 1.13 | (5.10) |
| 8/31/2013 | $28.19 | (0.41) | 6.51 | 6.10 | (2.85) |
| Class K |
| 8/31/2017 | $18.01 | (0.12) | 3.95 | 3.83 | (1.50) |
| 8/31/2016 | $27.89 | (0.09) (e) | 0.43 | 0.34 | (10.22) |
| 8/31/2015 | $29.95 | (0.23) | 3.16 | 2.93 | (5.11) |
| 8/31/2014 | $33.85 | (0.24) | 1.74 | 1.50 | (5.40) |
| 8/31/2013 (h) | $29.28 | (0.11) | 4.68 | 4.57 | — |
| Class R |
| 8/31/2017 | $17.00 | (0.17) | 3.71 | 3.54 | (1.44) |
| 8/31/2016 | $26.99 | (0.16) (e) | 0.39 | 0.23 | (10.22) |
| 8/31/2015 | $29.25 | (0.33) | 3.07 | 2.74 | (5.11) |
| 8/31/2014 | $33.18 | (0.36) | 1.70 | 1.34 | (5.27) |
| 8/31/2013 | $29.47 | (0.35) | 6.93 | 6.58 | (2.87) |
| Class R4 |
| 8/31/2017 | $18.86 | (0.09) | 4.13 | 4.04 | (1.52) |
| 8/31/2016 | $28.69 | (0.03) (e) | 0.42 | 0.39 | (10.22) |
| 8/31/2015 | $30.64 | (0.20) | 3.24 | 3.04 | (5.11) |
| 8/31/2014 | $34.52 | (0.23) | 1.78 | 1.55 | (5.43) |
| 8/31/2013 (j) | $29.37 | (0.18) | 8.25 | 8.07 | (2.92) |
| Class R5 |
| 8/31/2017 | $18.28 | (0.07) | 4.01 | 3.94 | (1.54) |
| 8/31/2016 | $28.11 | (0.04) (e) | 0.43 | 0.39 | (10.22) |
| 8/31/2015 | $30.09 | (0.16) | 3.17 | 3.01 | (5.11) |
| 8/31/2014 | $33.90 | (0.14) | 1.80 | 1.66 | (5.48) |
| 8/31/2013 (l) | $29.28 | (0.07) | 4.69 | 4.62 | — |
The accompanying Notes to Financial Statements are an integral part of this statement.
| 18 | Columbia Small Cap Growth Fund I | Annual Report 2017 |
Total
distributions to
shareholders | Reimbursement
from affiliate | Proceeds from
regulatory
settlements | Net
asset
value,
end of
period | Total
return | Total gross
expense
ratio to
average
net assets(a) | Total net
expense
ratio to
average
net assets(a),(b) | Net investment
income (loss)
ratio to
average
net assets | Portfolio
turnover | Net
assets,
end of
period
(000’s) |
| |
| (1.48) | — | — | $19.46 | 22.42% | 1.39% (c) | 1.34% (c),(d) | (0.74%) | 174% | $189,019 |
| (10.22) | — | — | $17.29 | 2.88% | 1.41% (f) | 1.36% (d),(f) | (0.62%) | 142% | $174,183 |
| (5.11) | — | 0.11 | $27.22 | 11.87% (g) | 1.36% | 1.36% (d) | (0.98%) | 117% | $202,566 |
| (5.35) | — | — | $29.40 | 3.35% | 1.30% (f) | 1.30% (d),(f) | (0.88%) | 148% | $216,670 |
| (2.90) | — | — | $33.32 | 25.12% | 1.31% | 1.31% (d) | (0.74%) | 104% | $254,055 |
| |
| (1.36) | — | — | $16.35 | 21.48% | 2.14% (c) | 2.09% (c),(d) | (1.49%) | 174% | $12,281 |
| (10.22) | — | — | $14.74 | 2.12% | 2.16% (f) | 2.12% (d),(f) | (1.37%) | 142% | $13,187 |
| (5.11) | — | 0.10 | $24.87 | 11.07% (g) | 2.11% | 2.11% (d) | (1.72%) | 117% | $16,810 |
| (5.10) | — | — | $27.47 | 2.57% | 2.05% (f) | 2.05% (d),(f) | (1.63%) | 148% | $18,762 |
| (2.85) | — | — | $31.44 | 24.20% | 2.06% | 2.06% (d) | (1.42%) | 104% | $22,685 |
| |
| (1.50) | — | — | $20.34 | 22.54% | 1.25% (c) | 1.24% (c) | (0.64%) | 174% | $49 |
| (10.22) | — | — | $18.01 | 3.02% | 1.24% (f) | 1.24% (f) | (0.48%) | 142% | $40 |
| (5.11) | — | 0.12 | $27.89 | 12.08% (g) | 1.21% | 1.21% | (0.83%) | 117% | $41 |
| (5.40) | — | — | $29.95 | 3.51% | 1.16% (f) | 1.16% (f) | (0.74%) | 148% | $37 |
| — | — | — | $33.85 | 15.61% | 1.16% (i) | 1.16% (i) | (0.68%) (i) | 104% | $48 |
| |
| (1.44) | — | — | $19.10 | 22.10% | 1.64% (c) | 1.59% (c),(d) | (0.99%) | 174% | $1,387 |
| (10.22) | — | — | $17.00 | 2.61% | 1.66% (f) | 1.62% (d),(f) | (0.88%) | 142% | $1,356 |
| (5.11) | — | 0.11 | $26.99 | 11.63% (g) | 1.61% | 1.61% (d) | (1.22%) | 117% | $1,706 |
| (5.27) | — | — | $29.25 | 3.08% | 1.55% (f) | 1.55% (d),(f) | (1.13%) | 148% | $2,500 |
| (2.87) | — | — | $33.18 | 24.85% | 1.56% | 1.56% (d) | (1.11%) | 104% | $3,650 |
| |
| (1.52) | — | — | $21.38 | 22.68% | 1.12% (c) | 1.09% (c),(d) | (0.46%) | 174% | $1,734 |
| (10.22) | — | — | $18.86 | 3.15% | 1.16% (f) | 1.10% (d),(f) | (0.16%) | 142% | $1,283 |
| (5.11) | — | 0.12 | $28.69 | 12.18% (g) | 1.10% | 1.10% (d) | (0.68%) | 117% | $69 |
| (5.43) | — | — | $30.64 | 3.59% | 1.04% (f) | 1.04% (d),(f) | (0.67%) | 148% | $167 |
| (2.92) | — | — | $34.52 | 30.11% | 1.09% (i) | 1.09% (d),(i) | (0.67%) (i) | 104% | $818 |
| |
| (1.54) | — | — | $20.68 | 22.87% | 1.00% (c) | 0.99% (c) | (0.39%) | 174% | $15,478 |
| (10.22) | — | — | $18.28 | 3.24% | 0.99% (f) | 0.99% (f) | (0.23%) | 142% | $11,704 |
| (5.11) | — | 0.12 | $28.11 | 12.33% (g) | 0.96% | 0.96% | (0.58%) | 117% | $11,990 |
| (5.48) | 0.01 | — | $30.09 | 4.07% (k) | 0.91% (f) | 0.91% (f) | (0.46%) | 148% | $721 |
| — | — | — | $33.90 | 15.78% | 0.93% (i) | 0.93% (i) | (0.41%) (i) | 104% | $1,145 |
Columbia Small Cap Growth Fund I | Annual Report 2017
| 19 |
Financial Highlights (continued)
| Year ended | Net asset value,
beginning of
period | Net
investment
income
(loss) | Net
realized
and
unrealized
gain | Total from
investment
operations | Distributions
from net
realized
gains |
| Class Y |
| 8/31/2017 | $18.43 | (0.07) | 4.06 | 3.99 | (1.55) |
| 8/31/2016 | $28.24 | (0.03) (e) | 0.44 | 0.41 | (10.22) |
| 8/31/2015 | $30.19 | (0.14) | 3.18 | 3.04 | (5.11) |
| 8/31/2014 | $34.09 | (0.14) | 1.73 | 1.59 | (5.49) |
| 8/31/2013 | $30.08 | (0.04) | 6.99 | 6.95 | (2.94) |
| Class Z |
| 8/31/2017 | $18.13 | (0.09) | 3.97 | 3.88 | (1.52) |
| 8/31/2016 | $27.98 | (0.07) (e) | 0.44 | 0.37 | (10.22) |
| 8/31/2015 | $30.01 | (0.20) | 3.16 | 2.96 | (5.11) |
| 8/31/2014 | $33.91 | (0.21) | 1.74 | 1.53 | (5.43) |
| 8/31/2013 | $29.98 | (0.10) | 6.95 | 6.85 | (2.92) |
| Notes to Financial Highlights |
| (a) | In addition to the fees and expenses that the Fund bears directly, the Fund indirectly bears a pro rata share of the fees and expenses of any other funds in which it invests. Such indirect expenses are not included in the Fund’s reported expense ratios. |
| (b) | Total net expenses include the impact of certain fee waivers/expense reimbursements made by the Investment Manager and certain of its affiliates, if applicable. |
| (c) | Expenses have been reduced due to a reimbursement of expenses overbilled by a third party. If the reimbursement had been excluded, the expense ratios would have been higher by the percentages shown for each class in the table below. All fee waivers and expense reimbursements by the Investment Manager and its affiliates were applied before giving effect to this third party reimbursement. |
| | Class A | Class C | Class K | Class R | Class R4 | Class R5 | Class Z |
| 08/31/2017 | 0.01 % | 0.01 % | 0.01 % | 0.01 % | 0.01 % | 0.01 % | 0.01 % |
| (d) | The benefits derived from expense reductions had an impact of less than 0.01%. |
| (e) | Net investment income per share includes special dividends. The per share effect of these dividends amounted to: |
| Year ended | Class A | Class C | Class I | Class K | Class R | Class R4 | Class R5 | Class Y | Class Z |
| 08/31/2016 | $ 0.04 | $ 0.03 | $ 0.04 | $ 0.04 | $ 0.04 | $ 0.07 | $ 0.05 | $ 0.05 | $ 0.04 |
| (f) | Ratios include line of credit interest expense which is less than 0.01%. |
| (g) | The Fund received proceeds from regulatory settlements. Had the Fund not received these proceeds, the total return would have been lower by 0.39%. |
| (h) | Class K shares commenced operations on February 28, 2013. Per share data and total return reflect activity from that date. |
| (i) | Annualized. |
| (j) | Class R4 shares commenced operations on November 8, 2012. Per share data and total return reflect activity from that date. |
| (k) | The Fund received a payment from an affiliate. Had the Fund not received this payment, the total return would have been lower by 0.05%. |
| (l) | Class R5 shares commenced operations on February 28, 2013. Per share data and total return reflect activity from that date. |
The accompanying Notes to Financial Statements are an integral part of this statement.
| 20 | Columbia Small Cap Growth Fund I | Annual Report 2017 |
Total
distributions to
shareholders | Reimbursement
from affiliate | Proceeds from
regulatory
settlements | Net
asset
value,
end of
period | Total
return | Total gross
expense
ratio to
average
net assets(a) | Total net
expense
ratio to
average
net assets(a),(b) | Net investment
income (loss)
ratio to
average
net assets | Portfolio
turnover | Net
assets,
end of
period
(000’s) |
| |
| (1.55) | — | — | $20.87 | 22.96% | 0.96% (c) | 0.94% (c) | (0.38%) | 174% | $54,574 |
| (10.22) | — | — | $18.43 | 3.30% | 0.94% (f) | 0.94% (f) | (0.14%) | 142% | $6,562 |
| (5.11) | — | 0.12 | $28.24 | 12.38% (g) | 0.90% | 0.90% | (0.50%) | 117% | $3,823 |
| (5.49) | — | — | $30.19 | 3.78% | 0.86% (f) | 0.86% (f) | (0.43%) | 148% | $4,491 |
| (2.94) | — | — | $34.09 | 25.70% | 0.87% | 0.87% | (0.14%) | 104% | $14,817 |
| |
| (1.52) | — | — | $20.49 | 22.72% | 1.14% (c) | 1.09% (c),(d) | (0.49%) | 174% | $159,344 |
| (10.22) | — | — | $18.13 | 3.15% | 1.15% (f) | 1.12% (d),(f) | (0.38%) | 142% | $157,826 |
| (5.11) | — | 0.12 | $27.98 | 12.16% (g) | 1.11% | 1.11% (d) | (0.69%) | 117% | $215,938 |
| (5.43) | — | — | $30.01 | 3.61% | 1.05% (f) | 1.05% (d),(f) | (0.64%) | 148% | $693,432 |
| (2.92) | — | — | $33.91 | 25.42% | 1.07% | 1.06% (d) | (0.34%) | 104% | $1,002,689 |
Columbia Small Cap Growth Fund I | Annual Report 2017
| 21 |
Notes to Financial Statements
August 31, 2017
Note 1. Organization
Columbia Small Cap Growth Fund I (the Fund), a series of Columbia Funds Series Trust I (the Trust), is a diversified fund. The Trust is registered under the Investment Company Act of 1940, as amended (the 1940 Act), as an open-end management investment company organized as a Massachusetts business trust.
Fund shares
The Trust may issue an unlimited number of shares (without par value). Although all share classes generally have identical voting, dividend and liquidation rights, each share class votes separately when required by the Trust’s organizational documents or by law. Different share classes pay different distribution amounts to the extent the expenses of such share classes differ, and distributions in liquidation will be proportional to the net asset value of each share class. Each share class has its own expense and sales charge structure. The Fund offers each of the share classes identified below.
Class A shares are subject to a maximum front-end sales charge of 5.75% based on the initial investment amount. Class A shares purchased without an initial sales charge in accounts aggregating $1 million to $50 million at the time of purchase are subject to a contingent deferred sales charge (CDSC) if the shares are sold within 18 months after purchase, charged as follows: 1.00% CDSC if redeemed within 12 months after purchase, and 0.50% CDSC if redeemed more than 12, but less than 18, months after purchase.
Class B shares of the Fund are no longer offered for sale. When available, Class B shares were subject to a maximum CDSC of 5.00% based upon the holding period after purchase. Effective July 17, 2017, Class B shares were automatically converted to Class A shares without a CDSC. On August 4, 2017, the capital owned by Columbia Management Investment Advisers, LLC in Class B shares was redeemed without a CDSC.
Class C shares are subject to a 1.00% CDSC on shares redeemed within 12 months after purchase.
The Fund no longer accepts investments by new or existing investors in Class I shares. Class I shares, when available, were not subject to sales charges, and were made available only to the Columbia Family of Funds. On March 27, 2017, Class I shares were redeemed or exchanged for Class Y shares of the Fund in a tax free transaction that had no impact on the fees and expenses paid by shareholders.
Class K shares are not subject to sales charges; however, this share class is closed to new investors.
Class R shares are not subject to sales charges and are generally available only to certain retirement plans and other investors as described in the Fund’s prospectus.
Class R4 shares are not subject to sales charges and are generally available only to omnibus retirement plans and certain investors as described in the Fund’s prospectus. Effective November 1, 2017, Class R4 shares will be renamed Advisor Class shares.
Class R5 shares are not subject to sales charges and are generally available only to investors purchasing through authorized investment professionals and omnibus retirement plans as described in the Fund’s prospectus. Effective November 1, 2017, Class R5 shares will be renamed Institutional 2 Class shares.
Class Y shares are not subject to sales charges and are available to institutional and certain other investors as described in the Fund’s prospectus. Effective November 1, 2017, Class Y shares will be renamed Institutional 3 Class shares.
Class Z shares are not subject to sales charges and are generally available only to eligible investors, which are subject to different investment minimums as described in the Fund’s prospectus. Effective November 1, 2017, Class Z shares will be renamed Institutional Class shares.
| 22 | Columbia Small Cap Growth Fund I | Annual Report 2017 |
Notes to Financial Statements (continued)
August 31, 2017
Note 2. Summary of significant accounting policies
Basis of preparation
The Fund is an investment company that applies the accounting and reporting guidance in the Financial Accounting Standards Board (FASB) Accounting Standards Codification Topic 946, Financial Services - Investment Companies (ASC 946). The financial statements are prepared in accordance with U.S. generally accepted accounting principles (GAAP), which requires management to make certain estimates and assumptions that affect the reported amounts of assets and liabilities, the disclosure of contingent assets and liabilities at the date of the financial statements and the reported amounts of income and expenses during the reporting period. Actual results could differ from those estimates. The Fund received a reimbursement for expenses overbilled by a third party. Such reimbursement is included as an offset to other expenses on the Statement of Operations. All fee waivers and expense reimbursements by Columbia Management Investment Advisers, LLC and its affiliates were applied before giving effect to the third party reimbursement.
The following is a summary of significant accounting policies followed by the Fund in the preparation of its financial statements.
Security valuation
All equity securities are valued at the close of business of the New York Stock Exchange. Equity securities are valued at the last quoted sales price on the principal exchange or market on which they trade, except for securities traded on the NASDAQ Stock Market, which are valued at the NASDAQ official close price. Unlisted securities or listed securities for which there were no sales during the day are valued at the mean of the latest quoted bid and ask prices on such exchanges or markets.
Foreign equity securities are valued based on the closing price on the foreign exchange in which such securities are primarily traded. If any foreign equity security closing prices are not readily available, the securities are valued at the mean of the latest quoted bid and ask prices on such exchanges or markets. Foreign currency exchange rates are generally determined at 4:00 p.m. Eastern (U.S.) time. Many securities markets and exchanges outside the U.S. close prior to the close of the New York Stock Exchange; therefore, the closing prices for securities in such markets or on such exchanges may not fully reflect events that occur after such close but before the close of the New York Stock Exchange. In those situations, foreign securities will be fair valued pursuant to a policy adopted by the Board of Trustees, including, if available, utilizing a third party pricing service to determine these fair values. The third party pricing service takes into account multiple factors, including, but not limited to, movements in the U.S. securities markets, certain depositary receipts, futures contracts and foreign exchange rates that have occurred subsequent to the close of the foreign exchange or market, to determine a good faith estimate that reasonably reflects the current market conditions as of the close of the New York Stock Exchange. The fair value of a security is likely to be different from the quoted or published price, if available.
Investments in open-end investment companies, including money market funds, are valued at their latest net asset value.
Investments for which market quotations are not readily available, or that have quotations which management believes are not reflective of market value or reliable, are valued at fair value as determined in good faith under procedures approved by and under the general supervision of the Board of Trustees. If a security or class of securities (such as foreign securities) is valued at fair value, such value is likely to be different from the quoted or published price for the security.
The determination of fair value often requires significant judgment. To determine fair value, management may use assumptions including but not limited to future cash flows and estimated risk premiums. Multiple inputs from various sources may be used to determine fair value.
GAAP requires disclosure regarding the inputs and valuation techniques used to measure fair value and any changes in valuation inputs or techniques. In addition, investments shall be disclosed by major category. This information is disclosed following the Fund’s Portfolio of Investments.
Columbia Small Cap Growth Fund I | Annual Report 2017
| 23 |
Notes to Financial Statements (continued)
August 31, 2017
Foreign currency transactions and translations
The values of all assets and liabilities denominated in foreign currencies are generally translated into U.S. dollars at exchange rates determined at the close of regular trading on the New York Stock Exchange. Net realized and unrealized gains (losses) on foreign currency transactions and translations include gains (losses) arising from the fluctuation in exchange rates between trade and settlement dates on securities transactions, gains (losses) arising from the disposition of foreign currency and currency gains (losses) between the accrual and payment dates on dividends, interest income and foreign withholding taxes.
For financial statement purposes, the Fund does not distinguish that portion of gains (losses) on investments which is due to changes in foreign exchange rates from that which is due to changes in market prices of the investments. Such fluctuations are included with the net realized and unrealized gains (losses) on investments in the Statement of Operations.
Security transactions
Security transactions are accounted for on the trade date. Cost is determined and gains (losses) are based upon the specific identification method for both financial statement and federal income tax purposes.
Income recognition
Corporate actions and dividend income are generally recorded net of any non-reclaimable tax withholdings, on the ex-dividend date or upon receipt of ex-dividend notification in the case of certain foreign securities.
The Fund may receive distributions from holdings in equity securities, business development companies (BDCs), exchange-traded funds (ETFs), limited partnerships (LPs), other regulated investment companies (RICs), and real estate investment trusts (REITs), which report information on the tax character of their distributions annually. These distributions are allocated to dividend income, capital gain and return of capital based on actual information reported. Return of capital is recorded as a reduction of the cost basis of securities held. If the Fund no longer owns the applicable securities, return of capital is recorded as a realized gain. With respect to REITs, to the extent actual information has not yet been reported, estimates for return of capital are made by the Fund’s management. Management’s estimates are subsequently adjusted when the actual character of the distributions is disclosed by the REITs, which could result in a proportionate change in return of capital to shareholders.
Awards from class action litigation are recorded as a reduction of cost basis if the Fund still owns the applicable securities on the payment date. If the Fund no longer owns the applicable securities, the proceeds are recorded as realized gains.
Expenses
General expenses of the Trust are allocated to the Fund and other funds of the Trust based upon relative net assets or other expense allocation methodologies determined by the nature of the expense. Expenses directly attributable to the Fund are charged to the Fund. Expenses directly attributable to a specific class of shares are charged to that share class.
Determination of class net asset value
All income, expenses (other than class-specific expenses, which are charged to that share class, as shown in the Statement of Operations) and realized and unrealized gains (losses) are allocated to each class of the Fund on a daily basis, based on the relative net assets of each class, for purposes of determining the net asset value of each class.
Federal income tax status
The Fund intends to qualify each year as a regulated investment company under Subchapter M of the Internal Revenue Code, as amended, and will distribute substantially all of its taxable income (including net short-term capital gains) and capital gains, if any, for its tax year, and as such will not be subject to federal income taxes. In addition, the Fund intends to distribute in each calendar year substantially all of its net investment income, capital gains and certain other amounts, if any, such that the Fund should not be subject to federal excise tax. Therefore, no federal income or excise tax provision is recorded.
| 24 | Columbia Small Cap Growth Fund I | Annual Report 2017 |
Notes to Financial Statements (continued)
August 31, 2017
Foreign taxes
The Fund may be subject to foreign taxes on income, gains on investments or currency repatriation, a portion of which may be recoverable. The Fund will accrue such taxes and recoveries, as applicable, based upon its current interpretation of tax rules and regulations that exist in the markets in which it invests.
Realized gains in certain countries may be subject to foreign taxes at the Fund level, based on statutory rates. The Fund accrues for such foreign taxes on realized and unrealized gains at the appropriate rate for each jurisdiction, as applicable. The amount, if any, is disclosed as a liability on the Statement of Assets and Liabilities.
Distributions to shareholders
Distributions from net investment income, if any, are declared and paid annually. Net realized capital gains, if any, are distributed along with the income distribution. Income distributions and capital gain distributions are determined in accordance with federal income tax regulations, which may differ from GAAP.
Guarantees and indemnifications
Under the Trust’s organizational documents and, in some cases, by contract, its officers and trustees are indemnified against certain liabilities arising out of the performance of their duties to the Trust or its funds. In addition, certain of the Fund’s contracts with its service providers contain general indemnification clauses. The Fund’s maximum exposure under these arrangements is unknown since the amount of any future claims that may be made against the Fund cannot be determined, and the Fund has no historical basis for predicting the likelihood of any such claims.
Recent accounting pronouncement
Accounting Standards Update 2017-08 Premium Amortization on Purchased Callable Debt Securities
In March 2017, the Financial Accounting Standards Board issued Accounting Standards Update (ASU) No. 2017-08 Premium Amortization on Purchased Callable Debt Securities. ASU No. 2017-08 updates the accounting standards to shorten the amortization period for certain purchased callable debt securities, held at a premium, to be amortized to the earliest call date. The update applies to securities with explicit, noncontingent call features that are callable at fixed prices and on preset dates. The standard is effective for annual periods beginning after December 15, 2018 and interim periods within those fiscal years. At this time, management is evaluating the implication of this guidance and the impact it will have on the financial statement amounts and footnote disclosures, if any.
Note 3. Fees and other transactions with affiliates
Management services fees
The Fund has entered into a Management Agreement with Columbia Management Investment Advisers, LLC (the Investment Manager), a wholly-owned subsidiary of Ameriprise Financial, Inc. (Ameriprise Financial). Under the Management Agreement, the Investment Manager provides the Fund with investment research and advice, as well as administrative and accounting services. The management services fee is an annual fee that is equal to a percentage of the Fund’s daily net assets that declines from 0.87% to 0.75% as the Fund’s net assets increase. The effective management services fee rate for the year ended August 31, 2017 was 0.87% of the Fund’s average daily net assets.
Compensation of board members
Members of the Board of Trustees, who are not officers or employees of the Investment Manager or Ameriprise Financial, are compensated for their services to the Fund as disclosed in the Statement of Operations. These members of the Board of Trustees may participate in a Deferred Compensation Plan (the Plan) which may be terminated at any time. Obligations of the Plan will be paid solely out of the Fund’s assets, and all amounts payable under the Plan constitute a general unsecured obligation of the Fund.
Columbia Small Cap Growth Fund I | Annual Report 2017
| 25 |
Notes to Financial Statements (continued)
August 31, 2017
Compensation of Chief Compliance Officer
The Board of Trustees has appointed a Chief Compliance Officer to the Fund in accordance with federal securities regulations. A portion of the Chief Compliance Officer’s total compensation is allocated to the Fund, along with other affiliated funds governed by the Board of Trustees, based on relative net assets. The total amount allocated to all affiliated funds governed by the Board of Trustees will not exceed $40,000 annually.
Transfer agency fees
Under a Transfer and Dividend Disbursing Agent Agreement, Columbia Management Investment Services Corp. (the Transfer Agent), an affiliate of the Investment Manager and a wholly-owned subsidiary of Ameriprise Financial, is responsible for providing transfer agency services to the Fund. The Transfer Agent has contracted with Boston Financial Data Services (BFDS) to serve as sub-transfer agent. The Transfer Agent pays the fees of BFDS for services as sub-transfer agent and BFDS is not entitled to reimbursement for such fees from the Fund (with the exception of out-of-pocket fees).
The Fund pays the Transfer Agent a monthly transfer agency fee based on the number or the average value of accounts, depending on the type of account. In addition, prior to October 1, 2016, the Transfer Agent also received sub-transfer agency fees based on a percentage of the average aggregate value of the Fund’s shares maintained in omnibus accounts (other than omnibus accounts for which American Enterprise Investment Services Inc. is the broker of record or accounts where the beneficial shareholder is a customer of Ameriprise Financial Services, Inc., for which the Transfer Agent receives a per account fee). Effective October 1, 2016, the Fund pays the Transfer Agent a fee for shareholder services based on the number of accounts or on a percentage of the average aggregate value of the Fund’s shares maintained in omnibus accounts up to the lesser of the amount charged by the financial intermediary or a cap established by the Board of Trustees from time to time.
The Transfer Agent also receives compensation from the Fund for various shareholder services and reimbursements for certain out-of-pocket fees. Effective August 1, 2017, total transfer agency fees for Class K, Class R5 and Class Y shares are subject to an annual limitation of not more than 0.07%, 0.07% and 0.02%, respectively, of the average daily net assets attributable to each share class. From January 1, 2017 to July 31, 2017, these limitations were 0.075% for Class K and Class R5 shares and 0.025% for Class I and Class Y shares; and prior to January 1, 2017, the limitation was 0.05% for Class K and Class R5 shares and Class I and Class Y shares did not pay transfer agency fees.
For the year ended August 31, 2017, the Fund’s effective transfer agency fee rates as a percentage of average daily net assets of each class were as follows:
| | Effective rate (%) |
| Class A | 0.21 |
| Class B | 0.19 (a),(b) |
| Class C | 0.21 |
| Class I | 0.00 (b),(c) |
| Class K | 0.06 |
| Class R | 0.21 |
| Class R4 | 0.20 |
| Class R5 | 0.06 |
| Class Y | 0.01 |
| Class Z | 0.21 |
| (a) | Effective July 17, 2017, Class B shares were automatically converted to Class A shares. |
| (b) | Unannualized. |
| (c) | Effective March 27, 2017, Class I shares were redeemed or exchanged for Class Y shares. |
The Fund and certain other associated investment companies have severally, but not jointly, guaranteed the performance and observance of all the terms and conditions of a lease entered into by Seligman Data Corp. (SDC), the former transfer agent, including the payment of rent by SDC (the Guaranty). SDC was the legacy Seligman funds’ former transfer agent.
| 26 | Columbia Small Cap Growth Fund I | Annual Report 2017 |
Notes to Financial Statements (continued)
August 31, 2017
The lease and the Guaranty expire in January 2019. At August 31, 2017, the Fund’s total potential future obligation over the life of the Guaranty is $9,541. The liability remaining at August 31, 2017 for non-recurring charges associated with the lease amounted to $6,504 and is recorded as a part of the payable for other expenses in the Statement of Assets and Liabilities.
An annual minimum account balance fee of $20 may apply to certain accounts with a value below the applicable share class’s initial minimum investment requirements to reduce the impact of small accounts on transfer agency fees. These minimum account balance fees are remitted to the Fund and recorded as part of expense reductions in the Statement of Operations. For the year ended August 31, 2017, these minimum account balance fees reduced total expenses of the Fund by $7,628.
Plan administration fees
Under a Plan Administration Services Agreement with the Transfer Agent, the Fund pays an annual fee at a rate of 0.25% of the Fund’s average daily net assets attributable to Class K shares for the provision of various administrative, recordkeeping, communication and educational services.
Distribution and service fees
The Fund has entered into an agreement with Columbia Management Investment Distributors, Inc. (the Distributor), an affiliate of the Investment Manager and a wholly-owned subsidiary of Ameriprise Financial, for distribution and shareholder services. The Board of Trustees has approved, and the Fund has adopted, distribution and shareholder service plans (the Plans) applicable to certain share classes, which set the distribution and service fees for the Fund. These fees are calculated daily and are intended to compensate the Distributor and/or eligible selling and/or servicing agents for selling shares of the Fund and providing services to investors.
Under the Plans, the Fund pays a monthly service fee to the Distributor at the maximum annual rate of 0.25% of the average daily net assets attributable to Class A, Class B and Class C shares of the Fund. Also under the Plans, the Fund pays a monthly distribution fee to the Distributor at the maximum annual rates of 0.10%, 0.75%, 0.75% and 0.50% of the average daily net assets attributable to Class A, Class B, Class C and Class R shares of the Fund, respectively. As a result of all Class B shares of the Fund being redeemed or converted to Class A shares, August 4, 2017 was the last day the Fund paid a service fee or distribution fee for Class B shares.
Although the Fund may pay distribution and service fees up to a maximum annual rate of 0.35% of the Fund’s average daily net assets attributable to Class A shares (comprised of up to 0.10% for distribution services and up to 0.25% for shareholder liaison services), the Fund currently limits such fees to an aggregate fee of not more than 0.25% of the Fund’s average daily net assets attributable to Class A shares.
Sales charges (unaudited)
Sales charges, including front-end charges and CDSCs, received by the Distributor for distributing Fund shares for the year ended August 31, 2017, if any, are listed below:
| | Amount ($) |
| Class A | 65,677 |
| Class B | 29 |
| Class C | 485 |
Columbia Small Cap Growth Fund I | Annual Report 2017
| 27 |
Notes to Financial Statements (continued)
August 31, 2017
Expenses waived/reimbursed by the Investment Manager and its affiliates
The Investment Manager and certain of its affiliates have contractually agreed to waive fees and/or reimburse expenses (excluding certain fees and expenses described below) for the period(s) disclosed below, unless sooner terminated at the sole discretion of the Board of Trustees, so that the Fund’s net operating expenses, after giving effect to fees waived/expenses reimbursed and any balance credits and/or overdraft charges from the Fund’s custodian, do not exceed the following annual rate(s) as a percentage of the class’ average daily net assets:
| | January 1, 2017
through
December 31, 2017 | Prior to
January 1, 2017 |
| Class A | 1.35% | 1.35% |
| Class C | 2.10 | 2.10 |
| Class K | 1.265 | 1.24 |
| Class R | 1.60 | 1.60 |
| Class R4 | 1.10 | 1.10 |
| Class R5 | 1.015 | 0.99 |
| Class Y | 0.965 | 0.94 |
| Class Z | 1.10 | 1.10 |
Under the agreement governing these fee waivers and/or expense reimbursement arrangements, the following fees and expenses are excluded from the waiver/reimbursement commitment, and therefore will be paid by the Fund, if applicable: taxes (including foreign transaction taxes), expenses associated with investments in affiliated and non-affiliated pooled investment vehicles (including mutual funds and exchange-traded funds), transaction costs and brokerage commissions, costs related to any securities lending program, dividend expenses associated with securities sold short, inverse floater program fees and expenses, transaction charges and interest on borrowed money, interest, infrequent and/or unusual expenses and any other expenses the exclusion of which is specifically approved by the Board of Trustees. This agreement may be modified or amended only with approval from the Investment Manager, certain of its affiliates and the Fund. In addition to the contractual agreement, the Investment Manager and certain of its affiliates have voluntarily agreed to waive fees and/or reimburse Fund expenses (excluding certain fees and expenses described above) so that Fund level expenses (expenses directly attributable to the Fund and not to a specific share class) are waived proportionately across all share classes, but the Fund’s net operating expenses shall not exceed the contractual annual rates listed in the table above. This arrangement may be revised or discontinued at any time. Any fees waived and/or expenses reimbursed under the expense reimbursement arrangements described above are not recoverable by the Investment Manager or its affiliates in future periods.
Note 4. Federal tax information
The timing and character of income and capital gain distributions are determined in accordance with income tax regulations, which may differ from GAAP because of temporary or permanent book to tax differences.
At August 31, 2017, these differences are primarily due to differing treatment for deferral/reversal of wash sale losses, re-characterization of distributions for investments, trustees’ deferred compensation, foreign currency transactions and net operating loss reclassification. To the extent these differences are permanent, reclassifications are made among the components of the Fund’s net assets in the Statement of Assets and Liabilities. Temporary differences do not require reclassifications.
In the Statement of Assets and Liabilities the following reclassifications were made:
Excess of distributions
over net investment
income ($) | Accumulated
net realized
gain ($) | Paid in
capital ($) |
| 2,637,803 | (2,637,777) | (26) |
Net investment income (loss) and net realized gains (losses), as disclosed in the Statement of Operations, and net assets were not affected by this reclassification.
| 28 | Columbia Small Cap Growth Fund I | Annual Report 2017 |
Notes to Financial Statements (continued)
August 31, 2017
The tax character of distributions paid during the years indicated was as follows:
| August 31, 2017 | August 31, 2016 |
Ordinary
income ($) | Long-term
capital gains ($) | Total ($) | Ordinary
income ($) | Long-term
capital gains ($) | Total ($) |
| 4,084,543 | 28,490,797 | 32,575,340 | 27,509,416 | 148,723,701 | 176,233,117 |
Short-term capital gain distributions, if any, are considered ordinary income distributions for tax purposes.
At August 31, 2017, the components of distributable earnings on a tax basis were as follows:
Undistributed
ordinary income ($) | Undistributed
long-term
capital gains ($) | Capital loss
carryforwards ($) | Net unrealized
appreciation ($) |
| 39,137,994 | 14,604,806 | — | 57,283,135 |
At August 31, 2017, the cost of all investments for federal income tax purposes along with the aggregate gross unrealized appreciation and depreciation based on that cost was:
Federal
tax cost ($) | Gross unrealized
appreciation ($) | Gross unrealized
(depreciation) ($) | Net unrealized
appreciation ($) |
| 388,339,662 | 68,608,109 | (11,324,974) | 57,283,135 |
Tax cost of investments and unrealized appreciation/(depreciation) may also include timing differences that do not constitute adjustments to tax basis.
Management of the Fund has concluded that there are no significant uncertain tax positions in the Fund that would require recognition in the financial statements. However, management’s conclusion may be subject to review and adjustment at a later date based on factors including, but not limited to, new tax laws, regulations, and administrative interpretations (including relevant court decisions). Generally, the Fund’s federal tax returns for the prior three fiscal years remain subject to examination by the Internal Revenue Service.
Note 5. Portfolio information
The cost of purchases and proceeds from sales of securities, excluding short-term investments and derivatives, if any, aggregated to $695,050,947 and $744,917,132, respectively, for the year ended August 31, 2017. The amount of purchase and sale activity impacts the portfolio turnover rate reported in the Financial Highlights.
Note 6. Regulatory settlements
During the year end August 31, 2015, the Fund recorded a receivable of $2,181,933 as a result of a regulatory settlement proceeding brought by the Securities and Exchange Commission against a third party relating to market timing and/or late trading of mutual funds. This amount represented the Fund’s portion of the proceeds from the settlement (neither the Fund nor the Investment Manager were a party to the proceeding) and is disclosed as a receivable on the Statement of Assets and Liabilities.
Note 7. Affiliated money market fund
The Fund invests in Columbia Short-Term Cash Fund, an affiliated money market fund established for the exclusive use by the Fund and other affiliated funds (the Affiliated MMF). The income earned by the Fund from such investments is included as Dividends - affiliated issuers in the Statement of Operations. As an investing fund, the Fund indirectly bears its proportionate share of the expenses of the Affiliated MMF. Effective October 1, 2016, the Affiliated MMF prices its shares with a floating net asset value (NAV) and no longer seeks to maintain a stable NAV. In addition, the Board of Trustees of the Affiliated MMF may impose a fee on redemptions (sometimes referred to as a liquidity fee) or temporarily suspend redemptions (sometimes referred to as imposing a redemption gate) in the event its liquidity falls below regulatory limits.
Columbia Small Cap Growth Fund I | Annual Report 2017
| 29 |
Notes to Financial Statements (continued)
August 31, 2017
Note 8. Line of credit
The Fund has access to a revolving credit facility with a syndicate of banks led by Citibank, N.A., HSBC Bank USA, N.A. and JPMorgan Chase Bank, N.A. whereby the Fund may borrow for the temporary funding of shareholder redemptions or for other temporary or emergency purposes. The credit facility, which is a collective agreement between the Fund and certain other funds managed by the Investment Manager, severally and not jointly, permits collective borrowings up to $1 billion. Interest is charged to each participating fund based on its borrowings at a rate equal to the higher of (i) the overnight federal funds rate plus 1.00% or (ii) the one-month LIBOR rate plus 1.00%. Each borrowing under the credit facility matures no later than 60 days after the date of borrowing. The Fund also pays a commitment fee equal to its pro rata share of the amount of the credit facility at a rate of 0.15% per annum. The commitment fee is included in other expenses in the Statement of Operations.
The Fund had no borrowings during the year ended August 31, 2017.
Note 9. Significant risks
Health care sector risk
The Fund may be more susceptible to the particular risks that may affect companies in the health care sector than if it were invested in a wider variety of companies in unrelated sectors. Companies in the health care sector are subject to certain risks, including restrictions on government reimbursement for medical expenses, government approval of medical products and services, competitive pricing pressures, and the rising cost of medical products and services (especially for companies dependent upon a relatively limited number of products or services). Performance of such companies may be affected by factors including, government regulation, obtaining and protecting patents (or the failure to do so), product liability and other similar litigation as well as product obsolescence.
Shareholder concentration risk
At August 31, 2017, affiliated shareholders of record owned 19.1% of the outstanding shares of the Fund in one or more accounts. Subscription and redemption activity by concentrated accounts may have a significant effect on the operations of the Fund. In the case of a large redemption, the Fund may be forced to sell investments at inopportune times, including its liquid positions, which may result in Fund losses and the Fund holding a higher percentage of less liquid positions. Large redemptions could result in decreased economies of scale and increased operating expenses for non-redeeming Fund shareholders.
Technology and Technology-related Investment Risk
The Fund may be more susceptible to the particular risks that may affect companies in the information technology sector, as well as other technology-related sectors (collectively, the technology sectors) than if it were invested in a wider variety of companies in unrelated sectors. Companies in the technology sectors are subject to certain risks, including the risk that new services, equipment or technologies will not be accepted by consumers and businesses or will become rapidly obsolete. Performance of such companies may be affected by factors including obtaining and protecting patents (or the failure to do so) and significant competitive pressures, including aggressive pricing of their products or services, new market entrants, competition for market share and short product cycles due to an accelerated rate of technological developments. Such competitive pressures may lead to limited earnings and/or falling profit margins. As a result, the value of their securities may fall or fail to rise. In addition, many technology sector companies have limited operating histories and prices of these companies’ securities historically have been more volatile than other securities, especially over the short term.
Note 10. Subsequent events
Management has evaluated the events and transactions that have occurred through the date the financial statements were issued. Other than as noted in Note 1 above, there were no items requiring adjustment of the financial statements or additional disclosure.
| 30 | Columbia Small Cap Growth Fund I | Annual Report 2017 |
Notes to Financial Statements (continued)
August 31, 2017
Note 11. Information regarding pending and settled legal proceedings
Ameriprise Financial and certain of its affiliates have historically been involved in a number of legal, arbitration and regulatory proceedings, including routine litigation, class actions, and governmental actions, concerning matters arising in connection with the conduct of their business activities. Ameriprise Financial believes that the Fund is not currently the subject of, and that neither Ameriprise Financial nor any of its affiliates are the subject of, any pending legal, arbitration or regulatory proceedings that are likely to have a material adverse effect on the Fund or the ability of Ameriprise Financial or its affiliates to perform under their contracts with the Fund. Ameriprise Financial is required to make quarterly (10-Q), annual (10-K) and, as necessary, 8-K filings with the Securities and Exchange Commission (SEC) on legal and regulatory matters that relate to Ameriprise Financial and its affiliates. Copies of these filings may be obtained by accessing the SEC website at www.sec.gov.
There can be no assurance that these matters, or the adverse publicity associated with them, will not result in increased Fund redemptions, reduced sale of Fund shares or other adverse consequences to the Fund. Further, although we believe proceedings are not likely to have a material adverse effect on the Fund or the ability of Ameriprise Financial or its affiliates to perform under their contracts with the Fund, these proceedings are subject to uncertainties and, as such, we are unable to estimate the possible loss or range of loss that may result. An adverse outcome in one or more of these proceedings could result in adverse judgments, settlements, fines, penalties or other relief that could have a material adverse effect on the consolidated financial condition or results of operations of Ameriprise Financial.
Columbia Small Cap Growth Fund I | Annual Report 2017
| 31 |
Report of Independent Registered Public Accounting Firm
To the Trustees of Columbia Funds Series Trust I and the Shareholders of Columbia Small Cap Growth Fund I
In our opinion, the accompanying statement of assets and liabilities, including the portfolio of investments, and the related statements of operations and of changes in net assets and the financial highlights present fairly, in all material respects, the financial position of Columbia Small Cap Growth Fund I (the “Fund”, a series of Columbia Funds Series Trust I) as of August 31, 2017, the results of its operations for the year then ended, the changes in its net assets for each of the two years in the period then ended and the financial highlights for each of the five years in the period then ended, in conformity with accounting principles generally accepted in the United States of America. These financial statements and financial highlights (hereafter referred to as “financial statements”) are the responsibility of the Fund’s management. Our responsibility is to express an opinion on these financial statements based on our audits. We conducted our audits of these financial statements in accordance with the standards of the Public Company Accounting Oversight Board (United States). Those standards require that we plan and perform the audit to obtain reasonable assurance about whether the financial statements are free of material misstatement. An audit includes examining, on a test basis, evidence supporting the amounts and disclosures in the financial statements, assessing the accounting principles used and significant estimates made by management, and evaluating the overall financial statement presentation. We believe that our audits, which included confirmation of securities as of August 31, 2017 by correspondence with the custodian, brokers and transfer agent provide a reasonable basis for our opinion.
/s/ PricewaterhouseCoopers LLP
Minneapolis, MN
October 20, 2017
| 32 | Columbia Small Cap Growth Fund I | Annual Report 2017 |
Federal Income Tax Information
(Unaudited)
The Fund hereby designates the following tax attributes for the fiscal year ended August 31, 2017. Shareholders will be notified in early 2018 of the amounts for use in preparing 2017 income tax returns.
Qualified
dividend
income | Dividends
received
deduction | Capital
gain
dividend |
| 61.17% | 59.14% | $21,373,553 |
Qualified dividend income. For taxable, non-corporate shareholders, the percentage of ordinary income distributed during the fiscal year that represents qualified dividend income subject to reduced tax rates.
Dividends received deduction. The percentage of ordinary income distributed during the fiscal year that qualifies for the corporate dividends received deduction.
Capital gain dividend. The Fund designates as a capital gain dividend the amount reflected above, or if subsequently determined to be different, the net capital gain of such fiscal period.
Columbia Small Cap Growth Fund I | Annual Report 2017
| 33 |
Shareholders elect the Board that oversees the Fund’s operations. The Board appoints officers who are responsible for day-to-day business decisions based on policies set by the Board. The following table provides basic biographical information about the Fund’s Trustees, including their principal occupations during the past five years, although specific titles for individuals may have varied over the period. The year set forth beneath Length of Service in the table below is the year in which the Trustee was first appointed or elected as Trustee to any Fund currently in the Columbia Funds Complex or a predecessor thereof. Under current Board policy, members serve terms of indefinite duration.
Independent trustees
| Name, address, year of birth | Position held with the Trust and length of service | Principal occupation(s) during the past five years and other relevant professional experience | Number of Funds in the Columbia Fund Complex overseen | Other directorships held by Trustee during the past five years |
Janet Langford Carrig
c/o Columbia Management
Investment Advisers, LLC
225 Franklin Street
Mail Drop BX32 05228
Boston, MA 02110
1957 | Trustee
1996 | Senior Vice President, General Counsel and Corporate Secretary, ConocoPhillips (independent energy company) since September 2007 | 57 | None |
Douglas A. Hacker
c/o Columbia Management
Investment Advisers, LLC
225 Franklin Street
Mail Drop BX32 05228
Boston, MA 02110
1955 | Trustee and Chairman of the Board
1996 | Independent business executive since May 2006; Executive Vice President — Strategy of United Airlines from December 2002 to May 2006; President of UAL Loyalty Services (airline marketing company) from September 2001 to December 2002; Executive Vice President and Chief Financial Officer of United Airlines from July 1999 to September 2001 | 57 | Spartan Nash Company, (food distributor); Nash Finch Company (food distributor) from 2005 to 2013; Aircastle Limited (aircraft leasing); SeaCube Container Leasing Ltd. (container leasing) from 2010 to 2013; and Travelport Worldwide Limited (travel information technology) |
Nancy T. Lukitsh
c/o Columbia Management
Investment Advisers, LLC
225 Franklin Street
Mail Drop BX32 05228
Boston, MA 02110
1956 | Trustee
2011 | Senior Vice President, Partner and Director of Marketing, Wellington Management Company, LLP (investment adviser) from 1997 to 2010; Chair, Wellington Management Portfolios (commingled non-U.S. investment pools) from 2007 to 2010; Director, Wellington Trust Company, NA and other Wellington affiliates from 1997 to 2010 | 57 | None |
David M. Moffett
c/o Columbia Management
Investment Advisers, LLC
225 Franklin Street
Mail Drop BX32 05228
Boston, MA 02110
1952 | Trustee
2011 | Retired. Consultant to Bridgewater and Associates | 57 | Director, CSX Corporation; Genworth Financial, Inc. (financial and insurance products and services); PayPal Holdings Inc. (payment and data processing services); Trustee, University of Oklahoma Foundation; former Director, eBay Inc. (online trading community), 2007-2015; and former Director, CIT Bank, CIT Group Inc. (commercial and consumer finance), 2010-2016 |
| 34 | Columbia Small Cap Growth Fund I | Annual Report 2017 |
TRUSTEES AND OFFICERS (continued)
Independent trustees (continued)
| Name, address, year of birth | Position held with the Trust and length of service | Principal occupation(s) during the past five years and other relevant professional experience | Number of Funds in the Columbia Fund Complex overseen | Other directorships held by Trustee during the past five years |
Charles R. Nelson
c/o Columbia Management
Investment Advisers, LLC
225 Franklin Street
Mail Drop BX32 05228
Boston, MA 02110
1942 | Trustee
1981 | Retired. Professor Emeritus, University of Washington since 2011; Professor of Economics, University of Washington from 1976 to 2011; Ford and Louisa Van Voorhis Professor of Political Economy, University of Washington from 1993 to 2011; Adjunct Professor of Statistics, University of Washington from 1980 to 2011; Associate Editor, Journal of Money, Credit and Banking from September 1993 to 2008; consultant on econometric and statistical matters | 57 | None |
John J. Neuhauser
c/o Columbia Management
Investment Advisers, LLC
225 Franklin Street
Mail Drop BX32 05228
Boston, MA 02110
1943 | Trustee
1984 | President, Saint Michael’s College since August 2007; Director or Trustee of several non-profit organizations, including University of Vermont Medical Center; Academic Vice President and Dean of Faculties, Boston College from August 1999 to October 2005; University Professor, Boston College from November 2005 to August 2007 | 57 | Liberty All-Star Equity Fund and Liberty All- Star Growth Fund (closed-end funds) |
Patrick J. Simpson
c/o Columbia Management
Investment Advisers, LLC
225 Franklin Street
Mail Drop BX32 05228
Boston, MA 02110
1944 | Trustee
2000 | Of Counsel, Perkins Coie LLP (law firm) since 2015; Partner, Perkins Coie LLP from 1988 to 2014 | 57 | None |
Anne-Lee Verville
c/o Columbia Management
Investment Advisers, LLC
225 Franklin Street
Mail Drop BX32 05228
Boston, MA 02110
1945 | Trustee
1998 | Retired. General Manager, Global Education Industry from 1994 to 1997, President – Application Systems Division from 1991 to 1994, Chief Financial Officer – US Marketing & Services from 1988 to 1991, and Chief Information Officer from 1987 to 1988, IBM Corporation (computer and technology) | 57 | Enesco Group, Inc. (producer of giftware and home and garden decor products) from 2001 to 2006 |
Columbia Small Cap Growth Fund I | Annual Report 2017
| 35 |
TRUSTEES AND OFFICERS (continued)
Consultants to the Independent Trustees*
| Name, address, year of birth | Position held with the Trust and length of service | Principal occupation(s) during the past five years and other relevant professional experience | Number of Funds in the Columbia Funds complex overseen | Other directorships held by Trustee during the past five years |
J. Kevin Connaughton
c/o Columbia
Management Investment
Advisers, LLC,
225 Franklin Street
Mail Drop BX32 05228,
Boston, MA 02110
1964 | Independent Trustee Consultant
2016 | Independent Trustee Consultant, Columbia Funds since March 2016; Managing Director and General Manager of Mutual Fund Products, Columbia Management Investment Advisers, LLC from May 2010 to February 2015; President, Columbia Funds from 2009 to 2015; and senior officer of Columbia Funds and affiliated funds from 2003 to 2015 | 57 | Board of Governors, Gateway Healthcare since January 2016; Trustee, New Century Portfolios since March 2015; and Director, The Autism Project since March 2015 |
Natalie A. Trunow
c/o Columbia
Management Investment
Advisers, LLC,
225 Franklin Street
Mail Drop BX32 05228,
Boston, MA 02110
1967 | Independent Trustee Consultant
2016 | Independent Trustee Consultant, Columbia Funds since September 2016; Chief Executive Officer, Millennial Partners (investment consulting services to institutions) since January 2016; Director of Investments, Casey Family Programs from April 2016 to September 2016; Senior Vice President and Chief Investment Officer, Calvert Investments from August 2008 to January 2016; Section Head and Portfolio Manager, General Motors Asset Management from June 1997 to August 2008 | 57 | Healthcare Services for Children with Special Needs |
| * | J. Kevin Connaughton was appointed consultant to the Independent Trustees effective March 1, 2016. Natalie A. Trunow was appointed consultant to the Independent Trustees effective September 1, 2016. Shareholders of the Funds are expected to be asked to elect each of Mr. Connaughton and Ms. Trunow as a Trustee at a future shareholder meeting. |
Interested trustee affiliated with Investment Manager*
| Name, address, year of birth | Position held with the Trust and length of service | Principal occupation(s) during the past five years and other relevant professional experience | Number of Funds in the Columbia Funds Complex overseen | Other directorships held by Trustee during the past five years |
William F. Truscott
c/o Columbia Management
Investment Advisers, LLC
225 Franklin Street
Boston, MA 02110
1960 | Trustee
2012 | Chairman of the Board and President, Columbia Management Investment Advisers, LLC since May 2010 and February 2012, respectively; Chief Executive Officer, Global Asset Management, Ameriprise Financial, Inc. since September 2012 (previously Chief Executive Officer, U.S. Asset Management & President, Annuities, May 2010-September 2012); Director and Chief Executive Officer, Columbia Management Investment Distributors, Inc. since May 2010 and February 2012, respectively; Chairman of the Board and Chief Executive Officer, RiverSource Distributors, Inc. since 2006; Director, Threadneedle Asset Management Holdings, SARL since 2014; President and Chief Executive Officer, Ameriprise Certificate Company, 2006-August 2012 | 179 | Chairman of the Board, Columbia Management Investment Advisers, LLC since May 2010; Director, Columbia Management Investment Distributors, Inc. since May 2010; former Director, Ameriprise Certificate Company, 2006 - January 2013 |
| * | Interested person (as defined under the 1940 Act) by reason of being an officer, director, security holder and/or employee of the Investment Manager or Ameriprise Financial. |
The Statement of Additional Information has additional information about the Fund’s Board members and is available,
without charge, upon request by calling 800.345.6611, contacting your financial intermediary or visiting
investor.columbiathreadneedleus.com.
| 36 | Columbia Small Cap Growth Fund I | Annual Report 2017 |
TRUSTEES AND OFFICERS (continued)
The Board has appointed officers who are responsible for day-to-day business decisions based on policies it has established. The officers serve at the pleasure of the Board. The following table provides basic information about the Officers of the Fund, including principal occupations during the past five years, although their specific titles may have varied over the period. In addition to Mr. Truscott, who is Senior Vice President, the Fund’s other officers are:
Fund officers
Name,
address and
year of birth | Position and year
first appointed to
position for any Fund
in the Columbia
Funds complex or a
predecessor thereof | Principal occupation(s) during past five years |
Christopher O. Petersen
5228 Ameriprise
Financial Center
Minneapolis, MN 55474
Born 1970 | President and Principal Executive Officer (2015) | Vice President and Lead Chief Counsel, Ameriprise Financial, Inc. since January 2015 (previously, Vice President and Chief Counsel, January 2010 - December 2014; officer of Columbia Funds and affiliated funds since 2007. |
Michael G. Clarke
225 Franklin Street
Boston, MA 02110
Born 1969 | Treasurer (2011), Chief Financial Officer (2009) and Chief Accounting Officer (2015) | Vice President — Mutual Fund Administration, Columbia Management Investment Advisers, LLC, since May 2010; senior officer of Columbia Funds and affiliated funds since 2002. |
Paul B. Goucher
100 Park Avenue
New York, NY 10017
Born 1968 | Senior Vice President (2011) and Assistant Secretary (2008) | Senior Vice President and Assistant General Counsel, Ameriprise Financial, Inc. since January 2017 (previously Vice President and Lead Chief Counsel, November 2008 - January 2017 and January 2013 - January 2017, respectively; and Chief Counsel, January 2010 - January 2013); Vice President, Chief Legal Officer and Assistant Secretary, Columbia Management Investment Advisers, LLC since May 2010. |
Thomas P. McGuire
225 Franklin Street
Boston, MA 02110
Born 1972 | Senior Vice President and Chief Compliance Officer (2012) | Vice President — Asset Management Compliance, Ameriprise Financial, Inc., since May 2010; Chief Compliance Officer, Ameriprise Certificate Company since September 2010. |
Colin Moore
225 Franklin Street
Boston, MA 02110
Born 1958 | Senior Vice President (2010) | Executive Vice President and Global Chief Investment Officer, Ameriprise Financial, Inc., since July 2013; Executive Vice President and Global Chief Investment Officer, Columbia Management Investment Advisers, LLC since July 2013 (previously Director and Global Chief Investment Officer, 2010 - 2013). |
Ryan C. Larrenaga
225 Franklin Street
Boston, MA 02110
Born 1970 | Senior Vice President (2017), Chief Legal Officer (2017) and Secretary (2015) | Vice President and Group Counsel, Ameriprise Financial, Inc. since August 2011; officer of Columbia Funds and affiliated funds since 2005. |
Michael E. DeFao
225 Franklin Street
Boston, MA 02110
Born 1968 | Vice President (2011) and Assistant Secretary (2010) | Vice President and Chief Counsel, Ameriprise Financial, Inc. since May 2010. |
Amy Johnson
5228 Ameriprise
Financial Center
Minneapolis, MN 55474
Born 1965 | Vice President (2006) | Managing Director and Global Head of Operations, Columbia Management Investment Advisers, LLC since April 2016 (previously Managing Director and Chief Operating Officer, 2010 - 2016). |
Lyn Kephart-Strong
5228 Ameriprise
Financial Center
Minneapolis, MN 55474
Born 1960 | Vice President (2015) | President, Columbia Management Investment Services Corp. since October 2014; Vice President & Resolution Officer, Ameriprise Trust Company since August 2009. |
Columbia Small Cap Growth Fund I | Annual Report 2017
| 37 |
Board Consideration and Approval of Management
Agreement
On June 14, 2017, the Board of Trustees (the Board) and the Trustees who are not interested persons (as defined in the Investment Company Act of 1940) (the Independent Trustees) of Columbia Funds Series Trust I (the Trust) unanimously approved the continuation of the Management Agreement (the Management Agreement) with Columbia Management Investment Advisers, LLC (the Investment Manager) with respect to Columbia Small Cap Growth Fund I (the Fund), a series of the Trust. As detailed below, the Board’s Advisory Fees and Expenses Committee (the Committee) and the Board met on multiple occasions to review and discuss, both among themselves and with the management team of the Investment Manager, materials provided by the Investment Manager and others before determining to approve the continuation of the Management Agreement.
In connection with their deliberations regarding the continuation of the Management Agreement, the Committee and the Board evaluated materials requested from the Investment Manager regarding the Fund and the Management Agreement, and discussed these materials with representatives of the Investment Manager at Committee meetings held on March 27, 2017, April 26, 2017 and June 13, 2017 and at Board meetings held on March 28, 2017 and June 14, 2017. In addition, the Board considers matters bearing on the Management Agreement at most of its other meetings throughout the year and meets regularly with senior management of the Trust and the Investment Manager. Through the Board’s Investment Oversight Committees, Trustees also meet with selected portfolio managers of the funds the Trustees oversee and other investment personnel at various times throughout the year. The Committee and the Board also consulted with its independent fee consultant, Fund counsel and the Independent Trustees’ independent legal counsel, who advised on various matters with respect to the Committee’s and the Board’s considerations and otherwise assisted the Committee and the Board in their deliberations. On June 13, 2017, the Committee recommended that the Board approve the continuation of the Management Agreement. On June 14, 2017, the Board, including the Independent Trustees, voting separately, unanimously approved the continuation of the Management Agreement for the Fund.
The Committee and the Board considered all information that they, their legal counsel or the Investment Manager believed reasonably necessary to evaluate and to determine whether to recommend for approval or approve the continuation of the Management Agreement. The information and factors considered by the Committee and the Board in recommending for approval or approving the continuation of the Management Agreement for the Fund included the following:
| • | Information on the investment performance of the Fund relative to the performance of a group of mutual funds determined to be comparable to the Fund by an independent third-party data provider, as well as performance relative to benchmarks; |
| • | Information on the Fund’s management fees and total expenses, including information comparing the Fund’s expenses to those of a group of comparable mutual funds, as determined by the independent third-party data provider; |
| • | The Investment Manager’s agreement to contractually limit or cap total operating expenses for the Fund through December 31, 2018 so that total operating expenses (excluding certain fees and expenses, such as transaction costs and certain other investment related expenses, interest, taxes, acquired fund fees and expenses, and infrequent and/or unusual expenses) would not exceed a specified annual rate, as a percentage of the Fund’s net assets; |
| • | The terms and conditions of the Management Agreement; |
| • | The current and proposed terms and conditions of other agreements and arrangements with affiliates of the Investment Manager relating to the operations of the Fund, including agreements with respect to the provision of distribution, transfer agency and shareholder services to the Fund; |
| • | Descriptions of various functions performed by the Investment Manager under the Management Agreement, including portfolio management and portfolio trading practices; |
| • | Information regarding the management fees of similarly-managed portfolios of other clients of the Investment Manager, including institutional separate accounts; |
| • | Information regarding the reputation, regulatory history and resources of the Investment Manager, including information regarding senior management, portfolio managers and other personnel; |
| 38 | Columbia Small Cap Growth Fund I | Annual Report 2017 |
Board Consideration and Approval of Management
Agreement (continued)
| • | Information regarding the capabilities of the Investment Manager with respect to compliance monitoring services, including an assessment of the Investment Manager’s compliance system by the Fund’s Chief Compliance Officer; and |
| • | The profitability to the Investment Manager and its affiliates from their relationships with the Fund. |
Nature, extent and quality of services provided under the Management Agreement
The Committee and the Board considered the nature, extent and quality of services provided to the Fund by the Investment Manager and its affiliates under the Management Agreement and under separate agreements for the provision of transfer agency and shareholder services, and the resources dedicated to the Fund and the other Columbia Funds by the Investment Manager and its affiliates. The Committee and the Board considered, among other things, the Investment Manager’s ability to attract, motivate and retain highly qualified research, advisory and supervisory investment professionals (including compensation programs for personnel involved in fund management, reputation and other attributes), the portfolio management services provided by those investment professionals, and the quality of the Investment Manager’s investment research capabilities and trade execution services. The Committee and the Board also considered the potential benefits to shareholders of investing in a mutual fund that is part of a fund complex offering exposure to a variety of asset classes and investment disciplines and providing a variety of fund and shareholder services.
The Committee and the Board also considered the professional experience and qualifications of the senior personnel of the Investment Manager, which included consideration of the Investment Manager’s experience with similarly-structured funds. The Committee and the Board noted the compliance programs of and the compliance-related resources provided to the Fund by the Investment Manager and its affiliates, and considered the Investment Manager’s ability to provide administrative services to the Fund and coordinate the activities of the Fund’s other service providers. After reviewing these and related factors, the Committee and the Board concluded, within the context of their overall conclusions, that the nature, extent and quality of the services provided to the Fund under the Management Agreement supported the continuation of the Management Agreement.
Investment performance
The Committee and the Board reviewed information about the performance of the Fund over various time periods, including performance information relative to benchmarks and information that compared the performance of the Fund to the performance of a group of comparable mutual funds as determined by the independent third-party data provider, and data provided by the independent fee consultant. The Committee and the Board also reviewed a description of the third party’s methodology for identifying the Fund’s peer groups for purposes of performance and expense comparisons. Although the Fund’s performance lagged that of a relevant peer group for certain (although not necessarily all) periods, the Committee and the Board concluded that other factors relevant to performance were sufficient, in light of other considerations, to warrant continuation of the Management Agreement. Those factors included one or more of the following: (i) that the Fund’s performance, although lagging in certain recent periods, was stronger over the longer term; (ii) that the underperformance was attributable, to a significant extent, to investment decisions that were reasonable and consistent with the Fund’s investment strategy and policies and that the Fund was performing within a reasonable range of expectations, given those investment decisions, market conditions and the Fund’s investment strategy; (iii) that the Fund’s performance was competitive when compared to other relevant performance benchmarks or peer groups; and (iv) that the Investment Manager had taken or was taking steps designed to help improve the Fund’s investment performance, including, but not limited to, replacing portfolio managers, enhancing the resources supporting the portfolio managers, or modifying investment strategies.
The Committee and the Board noted that, through December 31, 2016, the Fund’s performance was in the twenty-seventh, fifty-third and sixty-fifth percentile (where the best performance would be in the first percentile) of its category selected by the independent third-party data provider for the purposes of performance comparisons for the one-, three- and five-year periods, respectively.
The Committee and the Board also considered the Investment Manager’s performance and reputation generally, the Investment Manager’s historical responsiveness to Board concerns about performance, and the Investment Manager’s willingness to take steps intended to improve performance. After reviewing these and related factors, the Committee and the Board concluded, within the context of their overall conclusions, that the performance of the Fund and the Investment Manager was sufficient, in light of other considerations, to warrant the continuation of the Management Agreement.
Columbia Small Cap Growth Fund I | Annual Report 2017
| 39 |
Board Consideration and Approval of Management
Agreement (continued)
Investment management fee rates and other expenses
The Committee and the Board considered the management fees charged to the Fund under the Management Agreement as well as the total expenses incurred by the Fund. In assessing the reasonableness of the fees under the Management Agreement, the Committee and the Board considered, among other information, the Fund’s total expense ratio as a percentage of average daily net assets. The Committee and the Board considered data provided by the independent third-party data provider and the independent fee consultant. The Committee and the Board noted that, as of December 31, 2016, the Fund’s actual management fee and net total expense ratio are both ranked in the third quintile (where the lowest fees and expenses would be in the first quintile) against the Fund’s expense universe as determined by the independent third-party data provider for purposes of expense comparison. The Committee and the Board also took into account the fee waiver and expense limitation arrangements agreed to by the Investment Manager, as noted above.
The Committee and the Board also received and considered information about the management fees charged by the Investment Manager to institutional separate accounts. In considering the fees charged to those accounts, the Committee and the Board took into account, among other things, the Investment Manager’s representations about the differences between managing mutual funds as compared to other types of accounts, including differences in the services provided, differences in the risk profile of such business for the Investment Manager and the additional resources required to manage mutual funds effectively. The Committee and the Board also received and considered information about the fees charged by the Investment Manager for sub-advisory services it provides to comparable unaffiliated funds. In evaluating the Fund’s management fees, the Committee and the Board also took into account the demands, complexity and quality of the investment management of the Fund.
After reviewing these and related factors, the Committee and the Board concluded, within the context of their overall conclusions, that the management fee rates and expenses of the Fund, in light of other considerations, warranted the continuation of the Management Agreement.
Costs of services provided and profitability
The Committee and the Board also took note of the costs the Investment Manager and its affiliates incur in connection with the services provided and the profitability to the Investment Manager and its affiliates from their relationships with the Fund.
The Committee and the Board also considered the compensation directly or indirectly received by the Investment Manager’s affiliates in connection with their relationships with the Fund. The Committee and the Board reviewed information provided by management as to the profitability to the Investment Manager and its affiliates of their relationships with the Fund, information about the allocation of expenses used to calculate profitability, and comparisons of profitability levels realized in 2016 to profitability levels realized in 2015. When reviewing profitability, the Committee and the Board also considered court cases in which adviser profitability was an issue in whole or in part, the performance of similarly managed funds, the performance of the Fund, and the expense ratio of the Fund. In addition, the Committee and the Board considered information provided by the Investment Manager regarding the Investment Manager’s financial condition and comparing its profitability to that of other asset management firms that are, or are subsidiaries of, publicly traded companies. In this regard, the Committee and the Board also considered data provided by the independent fee consultant.
After reviewing these and related factors, the Committee and the Board concluded, within the context of their overall conclusions, that the costs of services provided and the profitability to the Investment Manager and its affiliates from their relationships with the Fund supported the continuation of the Management Agreement.
Economies of scale
The Committee and the Board considered the potential existence of economies of scale in the provision by the Investment Manager of services to the Fund, to groups of related funds, and to the Investment Manager’s investment advisory clients as a whole, and whether those economies of scale were shared with the Fund through breakpoints in investment management fees or other means, such as expense limitation arrangements and additional investments by the Investment Manager in investment, trading, compliance and other resources. The Committee and the Board noted that the management fee schedules for the Fund contained breakpoints that would reduce the fee rate on assets above specified threshold levels.
| 40 | Columbia Small Cap Growth Fund I | Annual Report 2017 |
Board Consideration and Approval of Management
Agreement (continued)
In considering these matters, the Committee and the Board also considered the costs of the services provided and the profitability to the Investment Manager and its affiliates from their relationships with the Fund, as discussed above. After reviewing these and related factors, the Committee and the Board concluded, within the context of their overall conclusions, that the extent to which any economies of scale were expected to be shared with the Fund supported the continuation of the Management Agreement.
Other benefits to the Investment Manager
The Committee and the Board received and considered information regarding “fall-out” or ancillary benefits received by the Investment Manager and its affiliates as a result of their relationships with the Fund, such as the engagement of the Investment Manager’s affiliates to provide distribution, transfer agency and shareholder services to the Fund. In this regard, among other matters, the Committee and the Board considered that the Fund’s distributor retains a portion of the distribution fees from the Fund and receives a portion of the sales charges on sales or redemptions of certain classes of shares of the Fund. The Committee and the Board also considered the benefits of research made available to the Investment Manager by reason of brokerage commissions generated by the Fund’s securities transactions, and reviewed information about the Investment Manager’s practices with respect to allocating portfolio transactions for brokerage and research services. The Committee and the Board recognized that the Investment Manager’s profitability would be somewhat lower without these benefits.
Conclusion
The Committee and the Board reviewed all of the above considerations in reaching their decisions to recommend or approve the continuation of the Management Agreement. In their deliberations, the Trustees did not identify any particular information that was all-important or controlling, and individual Trustees may have attributed different weights to the various factors. Based on their evaluation of all factors that they deemed to be material, including those factors described above, and assisted by the advice of independent legal counsel, the Board, including the Independent Trustees, voting separately, unanimously approved the continuation of the Management Agreement.
Columbia Small Cap Growth Fund I | Annual Report 2017
| 41 |
The Fund mails one shareholder report to each shareholder address. If you would like more than one report, please call shareholder services at 800.345.6611 and additional reports will be sent to you.
Proxy voting policies and procedures
The policy of the Board of Trustees is to vote the proxies of the companies in which the Fund holds investments consistent with the procedures as stated in the Statement of Additional Information (SAI). You may obtain a copy of the SAI without charge by calling 800.345.6611; contacting your financial intermediary; visiting investor.columbiathreadneedleus.com; or searching the website of the Securities and Exchange Commission (SEC) at sec.gov. Information regarding how the Fund voted proxies relating to portfolio securities is filed with the SEC by August 31st for the most recent 12-month period ending June 30th of that year, and is available without charge by visiting investor.columbiathreadneedleus.com, or searching the website of the SEC at sec.gov.
Quarterly schedule of investments
The Fund files a complete schedule of portfolio holdings with the SEC for the first and third quarters of each fiscal year on Form N-Q. The Fund’s Form N-Q is available on the SEC’s website at sec.gov and may be reviewed and copied at the SEC’s Public Reference Room in Washington, D.C. Information on the operation of the Public Reference Room may be obtained by calling 800.SEC.0330. The Fund’s complete schedule of portfolio holdings, as filed on Form N-Q, can also be obtained without charge, upon request, by calling 800.345.6611.
Additional Fund information
For more information about the Fund, please visit investor.columbiathreadneedleus.com or call 800.345.6611. Customer Service Representatives are available to answer your questions Monday through Friday from 8 a.m. to 7 p.m. Eastern time.
Fund investment manager
Columbia Management Investment Advisers, LLC
225 Franklin Street
Boston, MA 02110
Fund distributor
Columbia Management Investment Distributors, Inc.
225 Franklin Street
Boston, MA 02110
Fund transfer agent
Columbia Management Investment Services Corp.
P.O. Box 8081
Boston, MA 02266-8081
| 42 | Columbia Small Cap Growth Fund I | Annual Report 2017 |
[THIS PAGE INTENTIONALLY LEFT BLANK]
[THIS PAGE INTENTIONALLY LEFT BLANK]
[THIS PAGE INTENTIONALLY LEFT BLANK]
Columbia Small Cap Growth Fund I
P.O. Box 8081
Boston, MA 02266-8081
Please read and consider the investment objectives, risks, charges and expenses for any fund carefully before investing. For a prospectus and summary prospectus, which contains this and other important information about the Fund, go to
investor.columbiathreadneedleus.com. The Fund is distributed by Columbia Management Investment Distributors, Inc., member FINRA, and managed by Columbia Management Investment Advisers, LLC.
Columbia Threadneedle Investments (Columbia Threadneedle) is the global brand name of the Columbia and Threadneedle group of companies. All rights reserved. Columbia Management Investment Distributors, Inc., 225 Franklin Street, Boston, MA 02110-2804
© 2017 Columbia Management Investment Advisers, LLC.
investor.columbiathreadneedleus.com

Annual Report
August 31, 2017
Columbia Global Dividend Opportunity Fund
Not FDIC Insured • No bank guarantee • May lose value
Dear Shareholders,
The current outlook for financial markets is clouded by two primary concerns: the high valuation of equities and the direction of interest rates. Following the U.S. presidential election, U.S. equities rallied based on the assumption that the new administration’s policies would stimulate growth quickly. Unfortunately it’s unclear whether those measures will get passed, much less passed quickly. In fixed income, uncertainty stems from the possibility that interest rates won’t rise as rapidly as expected if the administration’s proposed growth policies are not implemented.
Given this uncertainty, investors value a consistent approach more than ever. Investors want strong, repeatable risk-adjusted returns. Consistency — not surprises. As a leading global asset manager, we believe our consistent, collaborative investment approach enables us to deliver the dependable experience your portfolio demands. So, how do we strive to deliver a consistent investment experience?
Better insights
Your portfolio benefits from the investment insights uncovered by our talented investment teams around the world.
Better decisions
Our collaborative, interactive environment enables our investment teams to construct portfolios that take advantage of the best investment ideas.
Better outcomes
We aim to deliver a consistent experience, which means fewer surprises, dependable insights, and products designed to do the thing you want.
Whether you’re trying to save money to help your children go to college or for your own retirement, it’s the consistency of the return that is most essential. People who chase higher returns are usually also the first to sell when that investment goes through a bad patch. We try to combat this behavioral tendency by offering strategies that aim for a more consistent return. Our goal is for investors to panic less during periods of volatility, which can have a significant effect on their long-term results.
Nothing is more important to us than making sure those who have entrusted us to protect and grow their assets can do what matters most to them: build a nest egg, leave a legacy, and live confidently — now and throughout retirement. It’s why our talented professionals around the world work together to uncover uncommon opportunities and why our process encourages challenge and debate around our most compelling ideas to ensure better informed investment decisions, which hopefully lead to better outcomes for you.
Your success is our priority. Talk to your financial advisor about how working with Columbia Threadneedle Investments may help you position your portfolio for consistent, sustainable outcomes, no matter the market conditions.
Sincerely,
Christopher O. Petersen
President, Columbia Funds
Investors should consider the investment objectives, risks, charges and expenses of a mutual fund carefully before investing. For a free prospectus and summary prospectus, which contains this and other important information about a fund, visit investor.columbiathreadneedleus.com. The prospectus should be read carefully before investing.
Columbia Funds are distributed by Columbia Management Investment Distributors, Inc., member FINRA, and managed by Columbia Management Investment Advisers, LLC.
© 2017 Columbia Management Investment Advisers, LLC. All rights reserved.
Columbia Global Dividend Opportunity Fund | Annual Report 2017
Columbia Global Dividend Opportunity Fund | Annual Report 2017
Investment objective
Columbia Global Dividend Opportunity Fund (the Fund) seeks total return, consisting of current income and capital appreciation.
Portfolio management
Jonathan Crown
Manager
Managed Fund since 2016
Morningstar style boxTM
The Morningstar Style Box is based on a fund’s portfolio holdings. For equity funds, the vertical axis shows the market capitalization of the stocks owned, and the horizontal axis shows investment style (value, blend, or growth). Information shown is based on the most recent data provided by Morningstar.
© 2017 Morningstar, Inc. All rights reserved. The Morningstar information contained herein: (1) is proprietary to Morningstar and/or its content providers; (2) may not be copied or distributed; and (3) is not warranted to be accurate, complete or timely. Neither Morningstar nor its content providers are responsible for any damages or losses arising from any use of this information.
| Average annual total returns (%) (for the period ended August 31, 2017) |
| | | Inception | 1 Year | 5 Years | 10 Years |
| Class A | Excluding sales charges | 11/01/02 | 10.48 | 6.20 | 3.29 |
| | Including sales charges | | 4.13 | 4.94 | 2.68 |
| Class C | Excluding sales charges | 10/13/03 | 9.60 | 5.42 | 2.52 |
| | Including sales charges | | 8.60 | 5.42 | 2.52 |
| Class R* | 09/27/10 | 10.16 | 5.94 | 3.03 |
| Class R4* | 03/19/13 | 10.73 | 6.47 | 3.55 |
| Class R5* | 01/08/14 | 10.92 | 6.60 | 3.61 |
| Class T* | Excluding sales charges | 09/27/10 | 10.42 | 6.24 | 3.34 |
| | Including sales charges | | 7.65 | 5.70 | 3.08 |
| Class Y* | 07/15/09 | 10.95 | 6.70 | 3.71 |
| Class Z | 11/09/00 | 10.72 | 6.46 | 3.55 |
| MSCI ACWI High Dividend Yield Index (Net) | | 13.20 | 8.22 | 3.44 |
| MSCI ACWI (Net) | | 17.11 | 10.46 | 4.23 |
Returns for Class A shares are shown with and without the maximum initial sales charge of 5.75%. Returns for Class C shares are shown with and without the 1.00% contingent deferred sales charge for the first year only. Returns for Class T shares are shown with and without the maximum initial sales charge of 2.50% per transaction. Prior to March 27, 2017, Class T shares were known as Class W shares and were not subject to sales charges. The Fund’s other share classes are not subject to sales charges and have limited eligibility. Please see the Fund’s prospectus for details. Performance for different share classes will vary based on differences in sales charges and fees associated with each share class. All results shown assume reinvestment of distributions during the period. Returns do not reflect the deduction of taxes that a shareholder may pay on Fund distributions or on the redemption of Fund shares. Performance results reflect the effect of any fee waivers or reimbursements of Fund expenses by Columbia Management Investment Advisers, LLC and/or any of its affiliates. Absent these fee waivers or expense reimbursement arrangements, performance results would have been lower.
The performance information shown represents past performance and is not a guarantee of future results. The investment return and principal value of your investment will fluctuate so that your shares, when redeemed, may be worth more or less than their original cost. Current performance may be lower or higher than the performance information shown. You may obtain performance information current to the most recent month-end by contacting your financial intermediary, visiting investor.columbiathreadneedleus.com or calling 800.345.6611.
| * | The returns shown for periods prior to the share class inception date (including returns for the Life of the Fund, if shown, which are since Fund inception) include the returns of the Fund’s oldest share class. These returns are adjusted to reflect any higher class-related operating expenses of the newer share classes, as applicable. Please visit investor.columbiathreadneedleus.com/investment-products/mutual-funds/appended-performance for more information. |
The MSCI ACWI High Dividend Yield Index (Net) includes large and mid-cap stocks across 23 developed market countries. The index is designed to reflect the performance of equities selected from the MSCI World Index with higher than average dividend yields that are both sustainable and persistent.
The MSCI ACWI (Net) is a free float-adjusted market capitalization weighted index that is designed to measure the equity market performance of developed and emerging markets. The index consists of 45 country indices comprising 24 developed and 21 emerging market country indices.
Indices are not available for investment, are not professionally managed and do not reflect sales charges, fees, brokerage commissions, taxes (except the MSCI ACWI High Dividend Yield Index (Net) and the MSCI ACWI (Net) which reflects reinvested dividends net of withholding taxes) or other expenses of investing. Securities in the Fund may not match those in an index.
| 2 | Columbia Global Dividend Opportunity Fund | Annual Report 2017 |
Fund at a Glance (continued)
Performance of a hypothetical $10,000 investment (August 31, 2007 — August 31, 2017)
The chart above shows the change in value of a hypothetical $10,000 investment in Class A shares of Columbia Global Dividend Opportunity Fund during the stated time period, and does not reflect the deduction of taxes that a shareholder may pay on Fund distributions or on the redemption of Fund shares.
| Top 10 holdings (%) (at August 31, 2017) |
| Deutsche Telekom AG, Registered Shares (Germany) | 2.8 |
| British American Tobacco PLC (United Kingdom) | 2.6 |
| Pfizer, Inc. (United States) | 2.5 |
| Unilever NV-CVA (Netherlands) | 2.4 |
| Cisco Systems, Inc. (United States) | 2.3 |
| UBS AG (Switzerland) | 2.3 |
| Coca-Cola Co. (The) (United States) | 2.3 |
| Manulife Financial Corp. (Canada) | 2.2 |
| Taiwan Semiconductor Manufacturing Co., Ltd. (Taiwan) | 2.2 |
| Royal Dutch Shell PLC, Class A (United Kingdom) | 1.9 |
Percentages indicated are based upon total investments (excluding Money Market Funds).
For further detail about these holdings, please refer to the section entitled “Portfolio of Investments.”
Fund holdings are as of the date given, are subject to change at any time, and are not recommendations to buy or sell any security.
| Equity sector breakdown (%) (at August 31, 2017) |
| Consumer Discretionary | 10.1 |
| Consumer Staples | 13.5 |
| Energy | 8.3 |
| Financials | 19.5 |
| Health Care | 10.7 |
| Industrials | 6.4 |
| Information Technology | 11.6 |
| Materials | 9.9 |
| Real Estate | 1.7 |
| Telecommunication Services | 5.8 |
| Utilities | 2.5 |
| Total | 100.0 |
Percentages indicated are based upon total equity investments. The Fund’s portfolio composition is subject to change.
Columbia Global Dividend Opportunity Fund | Annual Report 2017
| 3 |
Fund at a Glance (continued)
| Country breakdown (%) (at August 31, 2017) |
| Australia | 5.1 |
| Brazil | 2.5 |
| Canada | 5.4 |
| Denmark | 1.1 |
| Finland | 0.9 |
| France | 1.6 |
| Germany | 5.7 |
| Hong Kong | 2.0 |
| Isle of Man | 0.8 |
| Japan | 4.0 |
| Mexico | 1.3 |
| Netherlands | 3.6 |
| South Africa | 0.4 |
| Spain | 0.9 |
| Switzerland | 4.8 |
| Taiwan | 3.0 |
| Thailand | 1.0 |
| United Kingdom | 13.2 |
| United States(a) | 42.7 |
| Total | 100.0 |
| (a) | Includes investments in Money Market Funds. |
Country breakdown is based primarily on issuer’s place of organization/incorporation. Percentages indicated are based upon total investments. The Fund’s portfolio composition is subject to change.
| 4 | Columbia Global Dividend Opportunity Fund | Annual Report 2017 |
Manager Discussion of Fund Performance
For the 12-month period that ended August 31, 2017, the Fund’s Class A shares returned 10.48% excluding sales charges. The Fund underperformed its benchmark, the MSCI ACWI High Dividend Yield Index, which returned 13.20%, and the broader-based MSCI All Country World Index (Net), which returned 17.11%, for the same time period. While generating solid double-digit absolute returns, the Fund’s results relative to the benchmark were hurt by stock selection and country allocation overall. During the period, sector allocation had a modestly positive effect.
Global equity markets gained but dividend-paying stocks lagged
Global equity markets moved higher during the period, led by low dividend-paying technology companies. High dividend-paying stocks generally underperformed the benchmark. In our view, the primary factor influencing the global equity markets during the period was shifting investor sentiment toward the U.S. political scene. Immediately following the surprise results of the U.S. elections in November 2016, global equity markets saw a sharp rally in interest rate-sensitive sectors and in highly economically-sensitive cyclical sectors. This rally waned in the first quarter of 2017 when it became clear the new Administration would struggle with its plans for health care reform and likely its subsequent policy agenda.
Within the benchmark, several of the emerging markets performed best, including Turkey, the Philippines, Hungary and Poland. Several other emerging markets were among the weakest performers during the period, including Pakistan, Israel, New Zealand and Mexico. The U.S. posted double-digit positive absolute returns but lagged the benchmark. From a sector perspective, financials, materials, real estate and industrials were the best performers in the benchmark during the period. Conversely, telecommunication services, energy, consumer staples and information technology lagged the benchmark most during the period.
High dividend focus and stock selection overall hampered results most
Two primary factors can explain the Fund’s relative underperformance during the period. First, the Fund has a premium dividend yield, even compared to the benchmark, so it has been more exposed to the style headwind that high dividend-paying stocks faced during the period. Second, while stock selection has historically been a strength of our investment strategy, some negative idiosyncratic events were seen during the period.
From a sector perspective, stock selection was most weak in the industrials, consumer discretionary and utilities sectors. Having an underweight allocation to industrials, which outpaced the benchmark during the period, also detracted. From a country perspective, stock selection in the U.S. and Japan detracted most. Having an underweight to France also hurt. France’s equity market performed well, as the election of moderate Emmanuel Macron boosted expectations of reform and of greater stability in the eurozone following an earlier rise of populist politicians.
Among the individual holdings that detracted most from relative results during the period were U.S. specialty retailer L Brands, U.S. theater chain operator Regal Entertainment and U.S. oil and gas exploration and production company Occidental Petroleum. L Brand’s turnaround has taken longer than had been widely anticipated, and investor concerns about declining U.S. mall traffic further weighed on investor sentiment. Regal Entertainment underperformed the benchmark on weaker box office returns and investor concerns about long-term competition from Netflix. Occidental Petroleum struggled, as oil prices declined.
Information technology and consumer staples positioning supported Fund results
Stock selection in the information technology sector supported the Fund’s results most during the period. Both stock selection and having an underweight to consumer staples and stock selection in telecommunication services also added value. From a country perspective, stock selection in the U.K. and allocation positioning in Switzerland and the Netherlands were most beneficial to Fund results.
During the period, U.S. tobacco company Reynolds American was the biggest contributor to Fund results. The company saw its stock price spike as news broke that British American Tobacco, which already owned 42% of Reynolds American, made a proposal to acquire the remaining 58% of the company at a premium. U.K.-based consumer goods company Unilever was also a top contributor, outperforming its peers. A takeover approach for the firm acted as a catalyst for Unilever’s management to focus on improving margin in the business. Taiwan Semiconductor also performed particularly well. Indeed, strong performance by several of the Fund’s semiconductor company holdings boosted relative results. These semiconductor
Columbia Global Dividend Opportunity Fund | Annual Report 2017
| 5 |
Manager Discussion of Fund Performance (continued)
companies generally benefited from secular growth in cloud computing, automotive electronics and the Internet of Things. (The Internet of Things is the inter-networking of physical devices, connected or smart devices, buildings and other items — embedded with electronics, software, sensors, actuators and network connectivity that enable these objects to collect and exchange data.)
Portfolio changes
We focus on what we call our “quality income” stock selection strategy, seeking companies with a 3% or greater dividend yield; earnings and dividend growth of 5% or more; and a strong balance sheet that supports sustainable dividends. In implementing this bottom-up selection strategy, the Fund’s allocation to financials increased relative to the benchmark. Among the most significant purchases for the Fund were Canadian insurance company Manulife Financial, U.S. bank PacWest Bancorp and French bank BNP Paribas. Since the European Central Bank is further behind the U.S. Fed in terms of raising interest rates, we saw more upside in European and emerging market banks for the near term. Consequently, we sold the Fund’s position in JPMorgan Chase. Other sales were driven by mergers and acquisitions, such as our sale of Reynolds American, and by taking profits in companies whose share price was nearing our price targets, including Six Flags Entertainment and Crown Castle. From a country perspective, we increased the Fund’s exposure to Switzerland, France, Germany, Denmark and Thailand and reduced its exposure to the U.S., Mexico and Norway relative to the benchmark.
At the end of the period, the Fund was most overweight in the consumer discretionary, financials and materials sectors and most underweight in the consumer staples and utilities sectors relative to the benchmark. By country, the Fund was most overweight in the U.K., Australia and Germany and was most underweight in the U.S., Japan and China relative to the benchmark.
Market risk may affect a single issuer, sector of the economy, industry or the market as a whole. International investing involves certain risks and volatility due to potential political, economic or currency instabilities and different financial and accounting standards. Risks are enhanced for emerging market issuers. Value securities may be unprofitable if the market fails to recognize their intrinsic worth or the portfolio manager misgauged that worth. See the Fund’s prospectus for more information on these and other risks.
The views expressed in this report reflect the current views of the respective parties. These views are not guarantees of future performance and involve certain risks, uncertainties and assumptions that are difficult to predict, so actual outcomes and results may differ significantly from the views expressed. These views are subject to change at any time based upon economic, market or other conditions and the respective parties disclaim any responsibility to update such views. These views may not be relied on as investment advice and, because investment decisions for a Columbia fund are based on numerous factors, may not be relied on as an indication of trading intent on behalf of any particular Columbia fund. References to specific securities should not be construed as a recommendation or investment advice.
| 6 | Columbia Global Dividend Opportunity Fund | Annual Report 2017 |
Understanding Your Fund’s Expenses
(Unaudited)
As an investor, you incur two types of costs. There are transaction costs, which generally include sales charges on purchases and may include redemption fees. There are also ongoing costs, which generally include management fees, distribution and/or service fees, and other fund expenses. The following information is intended to help you understand your ongoing costs (in dollars) of investing in the Fund and to help you compare these costs with the ongoing costs of investing in other mutual funds.
Analyzing your Fund’s expenses
To illustrate these ongoing costs, we have provided examples and calculated the expenses paid by investors in each share class of the Fund during the period. The actual and hypothetical information in the table is based on an initial investment of $1,000 at the beginning of the period indicated and held for the entire period. Expense information is calculated two ways and each method provides you with different information. The amount listed in the “Actual” column is calculated using the Fund’s actual operating expenses and total return for the period. You may use the Actual information, together with the amount invested, to estimate the expenses that you paid over the period. Simply divide your account value by $1,000 (for example, an $8,600 account value divided by $1,000 = 8.6), then multiply the results by the expenses paid during the period under the “Actual” column. The amount listed in the “Hypothetical” column assumes a 5% annual rate of return before expenses (which is not the Fund’s actual return) and then applies the Fund’s actual expense ratio for the period to the hypothetical return. You should not use the hypothetical account values and expenses to estimate either your actual account balance at the end of the period or the expenses you paid during the period. See “Compare with other funds” below for details on how to use the hypothetical data.
Compare with other funds
Since all mutual funds are required to include the same hypothetical calculations about expenses in shareholder reports, you can use this information to compare the ongoing cost of investing in the Fund with other funds. To do so, compare the hypothetical example with the 5% hypothetical examples that appear in the shareholder reports of other funds. As you compare hypothetical examples of other funds, it is important to note that hypothetical examples are meant to highlight the ongoing costs of investing in a fund only and do not reflect any transaction costs, such as sales charges, or redemption or exchange fees. Therefore, the hypothetical calculations are useful in comparing ongoing costs only, and will not help you determine the relative total costs of owning different funds. If transaction costs were included in these calculations, your costs would be higher.
| March 1, 2017 — August 31, 2017 |
| | Account value at the
beginning of the
period ($) | Account value at the
end of the
period ($) | Expenses paid during
the period ($) | Fund’s annualized
expense ratio (%) |
| | Actual | Hypothetical | Actual | Hypothetical | Actual | Hypothetical | Actual |
| Class A | 1,000.00 | 1,000.00 | 1,057.30 | 1,018.65 | 6.74 | 6.61 | 1.30 |
| Class C | 1,000.00 | 1,000.00 | 1,053.30 | 1,014.87 | 10.61 | 10.41 | 2.05 |
| Class R | 1,000.00 | 1,000.00 | 1,056.10 | 1,017.39 | 8.03 | 7.88 | 1.55 |
| Class R4 | 1,000.00 | 1,000.00 | 1,058.70 | 1,019.91 | 5.45 | 5.35 | 1.05 |
| Class R5 | 1,000.00 | 1,000.00 | 1,059.30 | 1,020.57 | 4.78 | 4.69 | 0.92 |
| Class T (formerly Class W) | 1,000.00 | 1,000.00 | 1,057.30 | 1,018.65 | 6.74 | 6.61 | 1.30 |
| Class Y | 1,000.00 | 1,000.00 | 1,059.40 | 1,020.92 | 4.41 | 4.33 | 0.85 |
| Class Z | 1,000.00 | 1,000.00 | 1,058.40 | 1,019.91 | 5.45 | 5.35 | 1.05 |
Expenses paid during the period are equal to the annualized expense ratio for each class as indicated above, multiplied by the average account value over the period and then multiplied by the number of days in the Fund’s most recent fiscal half year and divided by 365.
Expenses do not include fees and expenses incurred indirectly by the Fund from its investment in underlying funds, including affiliated and non-affiliated pooled investment vehicles, such as mutual funds and exchange-traded funds.
Had Columbia Management Investment Advisers, LLC and/or certain of its affiliates not waived/reimbursed certain fees and expenses, account value at the end of the period would have been reduced.
Columbia Global Dividend Opportunity Fund | Annual Report 2017
| 7 |
Portfolio of Investments
August 31, 2017
(Percentages represent value of investments compared to net assets)
| Common Stocks 96.9% |
| Issuer | Shares | Value ($) |
| Australia 5.1% |
| Amcor Ltd. | 599,449 | 7,699,483 |
| DuluxGroup Ltd. | 1,223,300 | 6,476,664 |
| Goodman Group | 953,883 | 6,303,368 |
| Sydney Airport | 1,641,229 | 9,667,163 |
| Total | 30,146,678 |
| Brazil 2.4% |
| Ambev SA | 1,453,500 | 9,188,700 |
| Kroton Educacional SA | 924,400 | 5,268,274 |
| Total | 14,456,974 |
| Canada 5.3% |
| Agrium, Inc. | 66,664 | 6,535,739 |
| Manulife Financial Corp. | 663,217 | 13,027,998 |
| Suncor Energy, Inc. | 88,479 | 2,772,519 |
| TransCanada Corp. | 185,160 | 9,402,199 |
| Total | 31,738,455 |
| Denmark 1.1% |
| Novo Nordisk A/S, Class B | 141,889 | 6,768,137 |
| Finland 0.9% |
| Sampo OYJ, Class A | 96,810 | 5,110,075 |
| France 1.6% |
| BNP Paribas SA | 123,181 | 9,371,820 |
| Germany 5.7% |
| Axel Springer SE | 94,749 | 5,865,289 |
| BASF SE | 86,175 | 8,347,511 |
| Deutsche Telekom AG, Registered Shares | 905,001 | 16,332,763 |
| Drillisch AG | 46,084 | 3,175,888 |
| Total | 33,721,451 |
| Hong Kong 2.0% |
| BOC Hong Kong Holdings Ltd. | 605,500 | 3,093,506 |
| HKT Trust & HKT Ltd. | 6,801,000 | 8,777,446 |
| Total | 11,870,952 |
| Isle of Man 0.8% |
| GVC Holdings PLC | 455,342 | 4,595,608 |
| Common Stocks (continued) |
| Issuer | Shares | Value ($) |
| Japan 4.0% |
| Bridgestone Corp. | 211,900 | 9,090,490 |
| Daiwa Securities Group, Inc. | 1,174,000 | 6,421,791 |
| Japan Hotel REIT Investment Corp. | 5,243 | 3,611,234 |
| Tokyo Electron Ltd. | 32,400 | 4,563,166 |
| Total | 23,686,681 |
| Mexico 1.3% |
| Wal-Mart de Mexico SAB de CV, Class V | 3,141,100 | 7,642,258 |
| Netherlands 3.6% |
| LyondellBasell Industries NV, Class A | 80,911 | 7,329,727 |
| Unilever NV-CVA | 232,896 | 13,865,333 |
| Total | 21,195,060 |
| South Africa 0.4% |
| SPAR Group Ltd. (The) | 191,072 | 2,483,000 |
| Spain 0.9% |
| Ferrovial SA | 233,223 | 5,315,427 |
| Switzerland 4.8% |
| Givaudan SA | 2,190 | 4,476,146 |
| Novartis AG, ADR | 120,430 | 10,151,044 |
| UBS AG | 832,972 | 13,724,342 |
| Total | 28,351,532 |
| Taiwan 2.9% |
| Advanced Semiconductor Engineering, Inc. | 3,809,030 | 4,610,683 |
| Taiwan Semiconductor Manufacturing Co., Ltd. | 1,798,000 | 12,941,105 |
| Total | 17,551,788 |
| Thailand 1.0% |
| Siam Commercial Bank PCL (The), Foreign Registered Shares | 1,339,700 | 6,082,695 |
| United Kingdom 13.2% |
| AstraZeneca PLC | 153,020 | 8,985,289 |
| BAE Systems PLC | 724,758 | 5,693,399 |
| British American Tobacco PLC | 241,389 | 15,079,497 |
| BT Group PLC | 1,575,357 | 5,959,522 |
| GlaxoSmithKline PLC | 294,286 | 5,835,603 |
| HSBC Holdings PLC, ADR | 91,701 | 4,438,328 |
| Legal & General Group PLC | 1,272,213 | 4,280,549 |
| Moneysupermarket.com Group PLC | 1,028,943 | 4,251,033 |
| Rio Tinto PLC | 164,194 | 7,954,545 |
The accompanying Notes to Financial Statements are an integral part of this statement.
| 8 | Columbia Global Dividend Opportunity Fund | Annual Report 2017 |
Portfolio of Investments (continued)
August 31, 2017
| Common Stocks (continued) |
| Issuer | Shares | Value ($) |
| Royal Dutch Shell PLC, Class A | 414,516 | 11,400,952 |
| St. James’s Place PLC | 286,186 | 4,266,876 |
| Total | 78,145,593 |
| United States 39.9% |
| AbbVie, Inc. | 100,204 | 7,545,361 |
| AES Corp. (The) | 639,797 | 7,063,359 |
| Altria Group, Inc. | 145,836 | 9,246,002 |
| Ares Capital Corp. | 384,925 | 6,181,896 |
| Cisco Systems, Inc. | 426,395 | 13,734,183 |
| CME Group, Inc. | 61,901 | 7,787,146 |
| Coca-Cola Co. (The) | 294,311 | 13,405,866 |
| Cypress Semiconductor Corp. | 525,941 | 7,200,132 |
| Dow Chemical Co. (The) | 137,322 | 9,152,511 |
| General Electric Co. | 444,216 | 10,905,503 |
| General Motors Co. | 311,337 | 11,376,254 |
| L Brands, Inc. | 196,949 | 7,133,493 |
| Las Vegas Sands Corp. | 153,638 | 9,557,820 |
| Maxim Integrated Products, Inc. | 179,414 | 8,371,457 |
| Merck & Co., Inc. | 141,974 | 9,066,460 |
| Occidental Petroleum Corp. | 146,933 | 8,771,900 |
| PacWest Bancorp | 184,035 | 8,309,180 |
| Paychex, Inc. | 146,661 | 8,364,077 |
| Pfizer, Inc. | 424,685 | 14,405,315 |
| PG&E Corp. | 106,417 | 7,489,629 |
| Philip Morris International, Inc. | 71,938 | 8,411,710 |
| Common Stocks (continued) |
| Issuer | Shares | Value ($) |
| QUALCOMM, Inc. | 80,490 | 4,207,212 |
| Regal Entertainment Group, Class A | 419,822 | 6,200,771 |
| Starwood Property Trust, Inc. | 388,895 | 8,637,358 |
| Valero Energy Corp. | 111,158 | 7,569,860 |
| Watsco, Inc. | 42,195 | 6,217,855 |
| Wells Fargo & Co. | 209,044 | 10,675,877 |
| Total | 236,988,187 |
Total Common Stocks
(Cost $524,322,791) | 575,222,371 |
|
| Limited Partnerships 2.1% |
| | |
| United States 2.1% |
| Blackstone Group LP (The) | 91,209 | 2,985,271 |
| Enterprise Products Partners LP | 351,999 | 9,176,614 |
| Total | 12,161,885 |
Total Limited Partnerships
(Cost $9,964,054) | 12,161,885 |
|
| Money Market Funds 0.5% |
| | Shares | Value ($) |
| Columbia Short-Term Cash Fund, 1.146%(a),(b) | 3,215,484 | 3,215,484 |
Total Money Market Funds
(Cost $3,215,403) | 3,215,484 |
Total Investments
(Cost $537,502,248) | 590,599,740 |
| Other Assets & Liabilities, Net | | 3,007,732 |
| Net Assets | $593,607,472 |
Notes to Portfolio of Investments
| (a) | The rate shown is the seven-day current annualized yield at August 31, 2017. |
| (b) | As defined in the Investment Company Act of 1940, an affiliated company is one in which the Fund owns 5% or more of the company’s outstanding voting securities, or a company which is under common ownership or control with the Fund. Holdings and transactions in these affiliated companies during the year ended August 31, 2017 are as follows: |
| Issuer | Beginning
shares | Shares
purchased | Shares
sold | Ending
shares | Realized gain
(loss) ($) | Net change in
unrealized
appreciation
(depreciation) ($) | Dividends —
affiliated
issuers($) | Value ($) |
| Columbia Short-Term Cash Fund, 1.146% | 3,530,146 | 117,676,901 | (117,991,563) | 3,215,484 | 1,203 | 81 | 41,031 | 3,215,484 |
Abbreviation Legend
| ADR | American Depositary Receipt |
The accompanying Notes to Financial Statements are an integral part of this statement.
Columbia Global Dividend Opportunity Fund | Annual Report 2017
| 9 |
Portfolio of Investments (continued)
August 31, 2017
Fair value measurements
The Fund categorizes its fair value measurements according to a three-level hierarchy that maximizes the use of observable inputs and minimizes the use of unobservable inputs by prioritizing that the most observable input be used when available. Observable inputs are those that market participants would use in pricing an investment based on market data obtained from sources independent of the reporting entity. Unobservable inputs are those that reflect the Fund’s assumptions about the information market participants would use in pricing an investment. An investment’s level within the fair value hierarchy is based on the lowest level of any input that is deemed significant to the asset’s or liability’s fair value measurement. The input levels are not necessarily an indication of the risk or liquidity associated with investments at that level. For example, certain U.S. government securities are generally high quality and liquid, however, they are reflected as Level 2 because the inputs used to determine fair value may not always be quoted prices in an active market.
Fair value inputs are summarized in the three broad levels listed below:
| • | Level 1 – Valuations based on quoted prices for investments in active markets that the Fund has the ability to access at the measurement date. Valuation adjustments are not applied to Level 1 investments. |
| • | Level 2 – Valuations based on other significant observable inputs (including quoted prices for similar securities, interest rates, prepayment speeds, credit risks, etc.). |
| • | Level 3 – Valuations based on significant unobservable inputs (including the Fund’s own assumptions and judgment in determining the fair value of investments). |
Inputs that are used in determining fair value of an investment may include price information, credit data, volatility statistics, and other factors. These inputs can be either observable or unobservable. The availability of observable inputs can vary between investments, and is affected by various factors such as the type of investment, and the volume and level of activity for that investment or similar investments in the marketplace. The inputs will be considered by the Investment Manager, along with any other relevant factors in the calculation of an investment’s fair value. The Fund uses prices and inputs that are current as of the measurement date, which may include periods of market dislocations. During these periods, the availability of prices and inputs may be reduced for many investments. This condition could cause an investment to be reclassified between the various levels within the hierarchy.
Foreign equity securities actively traded in markets where there is a significant delay in the local close relative to the New York Stock Exchange are classified as Level 2. The values of these securities may include an adjustment to reflect the impact of significant market movements following the close of local trading, as described in Note 2 to the financial statements – Security valuation.
Certain investments that have been measured at fair value using the net asset value (NAV) per share (or its equivalent) are not categorized in the fair value hierarchy. The fair value amounts presented in the table are intended to reconcile the fair value hierarchy to the amounts presented in the Portfolio of Investments. The Columbia Short-Term Cash Fund seeks to provide shareholders with maximum current income consistent with liquidity and stability of principal. Columbia Short-Term Cash Fund prices its shares with a floating NAV and no longer seeks to maintain a stable NAV.
Investments falling into the Level 3 category are primarily supported by quoted prices from brokers and dealers participating in the market for those investments. However, these may be classified as Level 3 investments due to lack of market transparency and corroboration to support these quoted prices. Additionally, valuation models may be used as the pricing source for any remaining investments classified as Level 3. These models may rely on one or more significant unobservable inputs and/or significant assumptions by the Investment Manager. Inputs used in valuations may include, but are not limited to, financial statement analysis, capital account balances, discount rates and estimated cash flows, and comparable company data.
Under the direction of the Fund’s Board of Trustees (the Board), the Investment Manager’s Valuation Committee (the Committee) is responsible for overseeing the valuation procedures approved by the Board. The Committee consists of voting and non-voting members from various groups within the Investment Manager’s organization, including operations and accounting, trading and investments, compliance, risk management and legal.
The Committee meets at least monthly to review and approve valuation matters, which may include a description of specific valuation determinations, data regarding pricing information received from approved pricing vendors and brokers and the results of Board-approved valuation control policies and procedures (the Policies). The Policies address, among other things, instances when market quotations are or are not readily available, including recommendations of third party pricing vendors and a determination of appropriate pricing methodologies; events that require specific valuation determinations and assessment of fair value techniques; securities with a potential for stale pricing, including those that are illiquid, restricted, or in default; and the effectiveness of third party pricing vendors, including periodic reviews of vendors. The Committee meets more frequently, as needed, to discuss additional valuation matters, which may include the need to review back-testing results, review time-sensitive information or approve related valuation actions. The Committee reports to the Board, with members of the Committee meeting with the Board at each of its regularly scheduled meetings to discuss valuation matters and actions during the period, similar to those described earlier.
For investments categorized as Level 3, the Committee monitors information similar to that described above, which may include: (i) data specific to the issuer or comparable issuers, (ii) general market or specific sector news and (iii) quoted prices and specific or similar security transactions. The Committee considers this data and any changes from prior periods in order to assess the reasonableness of observable and unobservable inputs, any assumptions or internal models used to value those securities and changes in fair value. This data is also used to corroborate, when available, information received from approved pricing vendors and brokers. Various factors impact the frequency of monitoring this information (which may occur as often as daily). However, the Committee may determine that changes to inputs, assumptions and models are not required as a result of the monitoring procedures performed.
The following table is a summary of the inputs used to value the Fund’s investments at August 31, 2017:
| | Level 1
quoted prices
in active
markets for
identical
assets ($) | Level 2
other
significant
observable
inputs ($) | Level 3
significant
unobservable
inputs ($) | Investments
measured at
net asset
value ($) | Total ($) |
| Investments | | | | | |
| Common Stocks | | | | | |
| Australia | — | 30,146,678 | — | — | 30,146,678 |
| Brazil | 14,456,974 | — | — | — | 14,456,974 |
| Canada | 31,738,455 | — | — | — | 31,738,455 |
| Denmark | — | 6,768,137 | — | — | 6,768,137 |
| Finland | — | 5,110,075 | — | — | 5,110,075 |
The accompanying Notes to Financial Statements are an integral part of this statement.
| 10 | Columbia Global Dividend Opportunity Fund | Annual Report 2017 |
Portfolio of Investments (continued)
August 31, 2017
Fair value measurements (continued)
| | Level 1
quoted prices
in active
markets for
identical
assets ($) | Level 2
other
significant
observable
inputs ($) | Level 3
significant
unobservable
inputs ($) | Investments
measured at
net asset
value ($) | Total ($) |
| France | — | 9,371,820 | — | — | 9,371,820 |
| Germany | — | 33,721,451 | — | — | 33,721,451 |
| Hong Kong | — | 11,870,952 | — | — | 11,870,952 |
| Isle of Man | — | 4,595,608 | — | — | 4,595,608 |
| Japan | — | 23,686,681 | — | — | 23,686,681 |
| Mexico | 7,642,258 | — | — | — | 7,642,258 |
| Netherlands | 7,329,727 | 13,865,333 | — | — | 21,195,060 |
| South Africa | — | 2,483,000 | — | — | 2,483,000 |
| Spain | — | 5,315,427 | — | — | 5,315,427 |
| Switzerland | 10,151,044 | 18,200,488 | — | — | 28,351,532 |
| Taiwan | — | 17,551,788 | — | — | 17,551,788 |
| Thailand | — | 6,082,695 | — | — | 6,082,695 |
| United Kingdom | 4,438,328 | 73,707,265 | — | — | 78,145,593 |
| United States | 236,988,187 | — | — | — | 236,988,187 |
| Total Common Stocks | 312,744,973 | 262,477,398 | — | — | 575,222,371 |
| Limited Partnerships | | | | | |
| United States | 12,161,885 | — | — | — | 12,161,885 |
| Total Limited Partnerships | 12,161,885 | — | — | — | 12,161,885 |
| Money Market Funds | — | — | — | 3,215,484 | 3,215,484 |
| Total Investments | 324,906,858 | 262,477,398 | — | 3,215,484 | 590,599,740 |
See the Portfolio of Investments for all investment classifications not indicated in the table.
The Fund’s assets assigned to the Level 2 input category are generally valued using the market approach, in which a security’s value is determined through reference to prices and information from market transactions for similar or identical assets. These assets include certain foreign securities for which a third party statistical pricing service may be employed for purposes of fair market valuation. The model utilized by such third party statistical pricing service takes into account a security’s correlation to available market data including, but not limited to, intraday index, ADR, and exchange-traded fund movements.
There were no transfers of financial assets between levels during the period.
The accompanying Notes to Financial Statements are an integral part of this statement.
Columbia Global Dividend Opportunity Fund | Annual Report 2017
| 11 |
Statement of Assets and Liabilities
August 31, 2017
| Assets | |
| Investments in unaffiliated issuers, at cost | $534,286,845 |
| Investments in affiliated issuers, at cost | 3,215,403 |
| Investments in unaffiliated issuers, at value | 587,384,256 |
| Investments in affiliated issuers, at value | 3,215,484 |
| Receivable for: | |
| Capital shares sold | 82,147 |
| Dividends | 2,552,439 |
| Foreign tax reclaims | 787,658 |
| Expense reimbursement due from Investment Manager | 2,618 |
| Prepaid expenses | 4,235 |
| Trustees’ deferred compensation plan | 152,961 |
| Total assets | 594,181,798 |
| Liabilities | |
| Due to custodian | 50 |
| Foreign currency (identified cost $6,495) | 6,504 |
| Payable for: | |
| Capital shares purchased | 250,077 |
| Management services fees | 12,308 |
| Distribution and/or service fees | 917 |
| Transfer agent fees | 57,266 |
| Compensation of board members | 549 |
| Compensation of chief compliance officer | 43 |
| Audit fees | 32,112 |
| Printing and postage fees | 35,739 |
| Other expenses | 25,800 |
| Trustees’ deferred compensation plan | 152,961 |
| Total liabilities | 574,326 |
| Net assets applicable to outstanding capital stock | $593,607,472 |
| Represented by | |
| Paid in capital | 552,726,353 |
| Undistributed net investment income | 5,828,077 |
| Accumulated net realized loss | (18,069,367) |
| Unrealized appreciation (depreciation) on: | |
| Investments - unaffiliated issuers | 53,097,411 |
| Investments - affiliated issuers | 81 |
| Foreign currency translations | 24,917 |
| Total - representing net assets applicable to outstanding capital stock | $593,607,472 |
The accompanying Notes to Financial Statements are an integral part of this statement.
| 12 | Columbia Global Dividend Opportunity Fund | Annual Report 2017 |
Statement of Assets and Liabilities (continued)
August 31, 2017
| Class A | |
| Net assets | $100,145,571 |
| Shares outstanding | 5,491,381 |
| Net asset value per share | $18.24 |
| Maximum offering price per share(a) | $19.35 |
| Class C | |
| Net assets | $7,794,868 |
| Shares outstanding | 455,859 |
| Net asset value per share | $17.10 |
| Class R | |
| Net assets | $1,753,369 |
| Shares outstanding | 96,279 |
| Net asset value per share | $18.21 |
| Class R4 | |
| Net assets | $982,675 |
| Shares outstanding | 53,446 |
| Net asset value per share | $18.39 |
| Class R5 | |
| Net assets | $506,265 |
| Shares outstanding | 27,728 |
| Net asset value per share | $18.26 |
| Class T(b) | |
| Net assets | $2,166 |
| Shares outstanding | 119 |
| Net asset value per share(c) | $18.23 |
| Maximum offering price per share(d) | $18.70 |
| Class Y | |
| Net assets | $64,718,028 |
| Shares outstanding | 3,538,181 |
| Net asset value per share | $18.29 |
| Class Z | |
| Net assets | $417,704,530 |
| Shares outstanding | 22,824,702 |
| Net asset value per share | $18.30 |
| (a) | The maximum offering price per share is calculated by dividing the net asset value per share by 1.0 minus the maximum sales charge of 5.75% for Class A. |
| (b) | Prior to March 27, 2017, Class T shares were known as Class W shares. |
| (c) | Net asset value per share rounds to this amount due to fractional shares outstanding. |
| (d) | The maximum offering price per share is calculated by dividing the net asset value per share by 1.0 minus the maximum sales charge of 2.50% for Class T. |
The accompanying Notes to Financial Statements are an integral part of this statement.
Columbia Global Dividend Opportunity Fund | Annual Report 2017
| 13 |
Statement of Operations
Year Ended August 31, 2017
| Net investment income | |
| Income: | |
| Dividends — unaffiliated issuers | $25,908,428 |
| Dividends — affiliated issuers | 41,031 |
| Foreign taxes withheld | (1,399,960) |
| Total income | 24,549,499 |
| Expenses: | |
| Management services fees | 4,563,064 |
| Distribution and/or service fees | |
| Class A | 259,598 |
| Class B(a) | 2,133 |
| Class C | 90,701 |
| Class R | 8,339 |
| Class T(b) | 5 |
| Transfer agent fees | |
| Class A | 387,818 |
| Class B(a) | 793 |
| Class C | 33,841 |
| Class I(c) | 1,523 |
| Class R | 6,233 |
| Class R4 | 3,424 |
| Class R5 | 150 |
| Class T(b) | 9 |
| Class Y | 2,866 |
| Class Z | 1,564,798 |
| Compensation of board members | 28,842 |
| Custodian fees | 66,095 |
| Printing and postage fees | 106,046 |
| Registration fees | 126,828 |
| Audit fees | 89,961 |
| Legal fees | 17,123 |
| Compensation of chief compliance officer | 259 |
| Other | (5,752) |
| Total expenses | 7,354,697 |
| Fees waived or expenses reimbursed by Investment Manager and its affiliates | (803,209) |
| Expense reduction | (95,614) |
| Total net expenses | 6,455,874 |
| Net investment income | 18,093,625 |
| Realized and unrealized gain (loss) — net | |
| Net realized gain (loss) on: | |
| Investments — unaffiliated issuers | 34,500,778 |
| Investments — affiliated issuers | 1,203 |
| Foreign currency translations | (152,376) |
| Net realized gain | 34,349,605 |
| Net change in unrealized appreciation (depreciation) on: | |
| Investments — unaffiliated issuers | 7,963,426 |
| Investments — affiliated issuers | 81 |
| Foreign currency translations | 95,146 |
| Net change in unrealized appreciation (depreciation) | 8,058,653 |
| Net realized and unrealized gain | 42,408,258 |
| Net increase in net assets resulting from operations | $60,501,883 |
| (a) | Effective July 17, 2017, Class B shares were automatically converted to Class A shares. |
| (b) | Prior to March 27, 2017, Class T shares were known as Class W shares. |
| (c) | Effective March 27, 2017, Class I shares were redeemed or exchanged for Class Y shares. |
The accompanying Notes to Financial Statements are an integral part of this statement.
| 14 | Columbia Global Dividend Opportunity Fund | Annual Report 2017 |
Statement of Changes in Net Assets
| | Year Ended
August 31, 2017 | Year Ended
August 31, 2016 |
| Operations | | |
| Net investment income | $18,093,625 | $20,166,493 |
| Net realized gain (loss) | 34,349,605 | (47,770,015) |
| Net change in unrealized appreciation (depreciation) | 8,058,653 | 61,698,517 |
| Net increase in net assets resulting from operations | 60,501,883 | 34,094,995 |
| Distributions to shareholders | | |
| Net investment income | | |
| Class A | (3,367,879) | (2,760,277) |
| Class B(a) | (6,842) | (12,616) |
| Class C | (242,563) | (203,081) |
| Class I(b) | (1,846,811) | (3,087,123) |
| Class R | (48,830) | (15,886) |
| Class R4 | (31,047) | (22,308) |
| Class R5 | (6,666) | (5,088) |
| Class T(c) | (66) | (49) |
| Class Y | (493,167) | (27,920) |
| Class Z | (14,451,472) | (11,794,283) |
| Total distributions to shareholders | (20,495,343) | (17,928,631) |
| Decrease in net assets from capital stock activity | (57,880,107) | (121,113,055) |
| Total decrease in net assets | (17,873,567) | (104,946,691) |
| Net assets at beginning of year | 611,481,039 | 716,427,730 |
| Net assets at end of year | $593,607,472 | $611,481,039 |
| Undistributed net investment income | $5,828,077 | $6,818,024 |
| (a) | Effective July 17, 2017, Class B shares were automatically converted to Class A shares. |
| (b) | Effective March 27, 2017, Class I shares were redeemed or exchanged for Class Y shares. |
| (c) | Prior to March 27, 2017, Class T shares were known as Class W shares. |
The accompanying Notes to Financial Statements are an integral part of this statement.
Columbia Global Dividend Opportunity Fund | Annual Report 2017
| 15 |
Statement of Changes in Net Assets (continued)
| | Year Ended | Year Ended |
| | August 31, 2017 | August 31, 2016 |
| | Shares | Dollars ($) | Shares | Dollars ($) |
| Capital stock activity |
| Class A(a) | | | | |
| Subscriptions (b) | 383,622 | 6,674,576 | 359,723 | 5,838,796 |
| Distributions reinvested | 178,845 | 3,077,201 | 153,513 | 2,516,352 |
| Redemptions | (1,461,049) | (25,361,994) | (1,266,643) | (20,848,210) |
| Net decrease | (898,582) | (15,610,217) | (753,407) | (12,493,062) |
| Class B(a) | | | | |
| Subscriptions | 145 | 2,300 | 1,197 | 18,578 |
| Distributions reinvested | 281 | 4,478 | 660 | 10,128 |
| Redemptions (b) | (26,432) | (434,120) | (33,747) | (518,894) |
| Net decrease | (26,006) | (427,342) | (31,890) | (490,188) |
| Class C | | | | |
| Subscriptions | 28,136 | 457,468 | 53,046 | 829,648 |
| Distributions reinvested | 13,274 | 213,959 | 11,479 | 177,024 |
| Redemptions | (220,080) | (3,632,823) | (229,311) | (3,552,260) |
| Net decrease | (178,670) | (2,961,396) | (164,786) | (2,545,588) |
| Class I(c) | | | | |
| Subscriptions | 29,770 | 520,370 | 344,892 | 5,843,327 |
| Distributions reinvested | 108,438 | 1,846,748 | 188,823 | 3,087,064 |
| Redemptions | (3,877,313) | (68,144,985) | (4,297,960) | (69,696,516) |
| Net decrease | (3,739,105) | (65,777,867) | (3,764,245) | (60,766,125) |
| Class R | | | | |
| Subscriptions | 9,050 | 153,485 | 66,643 | 1,108,036 |
| Distributions reinvested | 2,838 | 48,830 | 969 | 15,886 |
| Redemptions | (5,629) | (96,811) | (18,189) | (301,460) |
| Net increase | 6,259 | 105,504 | 49,423 | 822,462 |
| Class R4 | | | | |
| Subscriptions | 4,462 | 78,747 | 9,258 | 151,589 |
| Distributions reinvested | 1,782 | 30,973 | 1,347 | 22,253 |
| Redemptions | (2,437) | (43,463) | (7,810) | (130,760) |
| Net increase | 3,807 | 66,257 | 2,795 | 43,082 |
| Class R5 | | | | |
| Subscriptions | 39,205 | 708,839 | 1,093 | 17,773 |
| Distributions reinvested | 376 | 6,590 | 307 | 5,030 |
| Redemptions | (22,084) | (391,834) | (1,911) | (31,000) |
| Net increase (decrease) | 17,497 | 323,595 | (511) | (8,197) |
| Class Y(c) | | | | |
| Subscriptions | 3,643,091 | 64,299,248 | 9,073 | 147,843 |
| Distributions reinvested | 27,158 | 493,090 | 1,701 | 27,861 |
| Redemptions | (178,282) | (3,223,791) | (33,741) | (542,217) |
| Net increase (decrease) | 3,491,967 | 61,568,547 | (22,967) | (366,513) |
| Class Z | | | | |
| Subscriptions | 649,068 | 11,381,207 | 544,371 | 8,986,622 |
| Distributions reinvested | 813,794 | 14,064,856 | 698,717 | 11,483,331 |
| Redemptions | (3,459,107) | (60,613,251) | (3,972,622) | (65,778,879) |
| Net decrease | (1,996,245) | (35,167,188) | (2,729,534) | (45,308,926) |
| Total net decrease | (3,319,078) | (57,880,107) | (7,415,122) | (121,113,055) |
| (a) | Effective July 17, 2017, Class B shares were automatically converted to Class A shares. |
| (b) | Includes conversions of Class B shares to Class A shares, if any. |
| (c) | Effective March 27, 2017, Class I shares were redeemed or exchanged for Class Y shares. |
The accompanying Notes to Financial Statements are an integral part of this statement.
| 16 | Columbia Global Dividend Opportunity Fund | Annual Report 2017 |
[THIS PAGE INTENTIONALLY LEFT BLANK]
Columbia Global Dividend Opportunity Fund | Annual Report 2017
| 17 |
The following table is intended to help you understand the Fund’s financial performance. Certain information reflects financial results for a single share of a class held for the periods shown. Per share net investment income (loss) amounts are calculated based on average shares outstanding during the period. Total return assumes reinvestment of all dividends and distributions, if any. Total return does not reflect payment of sales charges, if any. Total return and portfolio turnover are not annualized for periods of less than one year. The portfolio turnover rate is calculated without regard to purchase and sales transactions of short-term instruments and certain derivatives, if any. If such transactions were included, the Fund’s portfolio turnover rate may be higher.
| Year ended | Net asset value,
beginning of
period | Net
investment
income | Net
realized
and
unrealized
gain (loss) | Total from
investment
operations | Distributions
from net
investment
income | Distributions
from net
realized
gains |
| Class A |
| 8/31/2017 | $17.05 | 0.49 | 1.26 | 1.75 | (0.56) | — |
| 8/31/2016 | $16.56 | 0.47 | 0.42 | 0.89 | (0.40) | — |
| 8/31/2015 | $21.63 | 0.58 | (2.93) | (2.35) | (0.70) | (2.02) |
| 8/31/2014 | $19.85 | 0.61 | 2.53 | 3.14 | (0.54) | (0.82) |
| 8/31/2013 | $19.59 | 0.51 | 1.74 | 2.25 | (0.68) | (1.31) |
| Class C |
| 8/31/2017 | $16.02 | 0.33 | 1.18 | 1.51 | (0.43) | — |
| 8/31/2016 | $15.56 | 0.32 | 0.42 | 0.74 | (0.28) | — |
| 8/31/2015 | $20.49 | 0.41 | (2.77) | (2.36) | (0.55) | (2.02) |
| 8/31/2014 | $18.86 | 0.43 | 2.41 | 2.84 | (0.39) | (0.82) |
| 8/31/2013 | $18.63 | 0.35 | 1.66 | 2.01 | (0.47) | (1.31) |
| Class R |
| 8/31/2017 | $17.03 | 0.45 | 1.24 | 1.69 | (0.51) | — |
| 8/31/2016 | $16.53 | 0.42 | 0.44 | 0.86 | (0.36) | — |
| 8/31/2015 | $21.61 | 0.53 | (2.94) | (2.41) | (0.65) | (2.02) |
| 8/31/2014 | $19.83 | 0.57 | 2.52 | 3.09 | (0.49) | (0.82) |
| 8/31/2013 | $19.54 | 0.46 | 1.75 | 2.21 | (0.61) | (1.31) |
| Class R4 |
| 8/31/2017 | $17.19 | 0.54 | 1.26 | 1.80 | (0.60) | — |
| 8/31/2016 | $16.69 | 0.52 | 0.43 | 0.95 | (0.45) | — |
| 8/31/2015 | $21.78 | 0.67 | (2.99) | (2.32) | (0.75) | (2.02) |
| 8/31/2014 | $19.97 | 0.76 | 2.46 | 3.22 | (0.59) | (0.82) |
| 8/31/2013 (e) | $19.69 | 0.25 | 0.33 | 0.58 | (0.30) | — |
| Class R5 |
| 8/31/2017 | $17.07 | 0.60 | 1.22 | 1.82 | (0.63) | — |
| 8/31/2016 | $16.58 | 0.54 | 0.42 | 0.96 | (0.47) | — |
| 8/31/2015 | $21.66 | 0.64 | (2.92) | (2.28) | (0.78) | (2.02) |
| 8/31/2014 (g) | $20.57 | 0.39 | 1.01 | 1.40 | (0.31) | — |
| Class T(h) |
| 8/31/2017 | $17.05 | 0.49 | 1.25 | 1.74 | (0.56) | — |
| 8/31/2016 | $16.56 | 0.47 | 0.43 | 0.90 | (0.41) | — |
| 8/31/2015 | $21.62 | 0.60 | (2.93) | (2.33) | (0.71) | (2.02) |
| 8/31/2014 | $19.83 | 0.61 | 2.55 | 3.16 | (0.55) | (0.82) |
| 8/31/2013 | $19.57 | 0.51 | 1.74 | 2.25 | (0.68) | (1.31) |
The accompanying Notes to Financial Statements are an integral part of this statement.
| 18 | Columbia Global Dividend Opportunity Fund | Annual Report 2017 |
Total
distributions to
shareholders | Net
asset
value,
end of
period | Total
return | Total gross
expense
ratio to
average
net assets(a) | Total net
expense
ratio to
average
net assets(a),(b) | Net investment
income
ratio to
average
net assets | Portfolio
turnover | Net
assets,
end of
period
(000’s) |
| |
| (0.56) | $18.24 | 10.48% | 1.46% (c) | 1.29% (c),(d) | 2.79% | 43% | $100,146 |
| (0.40) | $17.05 | 5.51% | 1.45% | 1.30% (d) | 2.85% | 115% | $108,978 |
| (2.72) | $16.56 | (11.49%) | 1.38% | 1.31% (d) | 3.05% | 63% | $118,275 |
| (1.36) | $21.63 | 16.40% | 1.27% | 1.25% (d) | 2.92% | 75% | $152,674 |
| (1.99) | $19.85 | 12.48% | 1.34% | 1.26% (d) | 2.59% | 60% | $140,796 |
| |
| (0.43) | $17.10 | 9.60% | 2.20% (c) | 2.04% (c),(d) | 2.03% | 43% | $7,795 |
| (0.28) | $16.02 | 4.82% | 2.20% | 2.05% (d) | 2.07% | 115% | $10,164 |
| (2.57) | $15.56 | (12.18%) | 2.13% | 2.06% (d) | 2.30% | 63% | $12,440 |
| (1.21) | $20.49 | 15.55% | 2.02% | 2.00% (d) | 2.17% | 75% | $16,136 |
| (1.78) | $18.86 | 11.66% | 2.09% | 2.01% (d) | 1.84% | 60% | $13,439 |
| |
| (0.51) | $18.21 | 10.16% | 1.71% (c) | 1.54% (c),(d) | 2.57% | 43% | $1,753 |
| (0.36) | $17.03 | 5.32% | 1.70% | 1.55% (d) | 2.57% | 115% | $1,533 |
| (2.67) | $16.53 | (11.78%) | 1.62% | 1.55% (d) | 2.77% | 63% | $671 |
| (1.31) | $21.61 | 16.13% | 1.52% | 1.50% (d) | 2.72% | 75% | $1,280 |
| (1.92) | $19.83 | 12.25% | 1.59% | 1.51% (d) | 2.33% | 60% | $1,297 |
| |
| (0.60) | $18.39 | 10.73% | 1.21% (c) | 1.04% (c),(d) | 3.08% | 43% | $983 |
| (0.45) | $17.19 | 5.80% | 1.20% | 1.05% (d) | 3.12% | 115% | $853 |
| (2.77) | $16.69 | (11.27%) | 1.16% | 1.04% (d) | 3.68% | 63% | $782 |
| (1.41) | $21.78 | 16.74% | 1.03% | 0.99% (d) | 3.56% | 75% | $113 |
| (0.30) | $19.97 | 3.02% | 1.07% (f) | 1.01% (d),(f) | 2.78% (f) | 60% | $29 |
| |
| (0.63) | $18.26 | 10.92% | 0.91% | 0.91% | 3.37% | 43% | $506 |
| (0.47) | $17.07 | 5.96% | 0.88% | 0.88% | 3.26% | 115% | $175 |
| (2.80) | $16.58 | (11.13%) | 0.87% | 0.87% | 3.52% | 63% | $178 |
| (0.31) | $21.66 | 6.85% | 0.88% (f) | 0.88% (f) | 2.98% (f) | 75% | $33 |
| |
| (0.56) | $18.23 | 10.42% | 1.46% (c) | 1.29% (c),(d) | 2.82% | 43% | $2 |
| (0.41) | $17.05 | 5.59% | 1.45% | 1.30% (d) | 2.86% | 115% | $2 |
| (2.73) | $16.56 | (11.41%) | 1.38% | 1.31% (d) | 3.04% | 63% | $2 |
| (1.37) | $21.62 | 16.50% | 1.28% | 1.26% (d) | 2.85% | 75% | $3 |
| (1.99) | $19.83 | 12.48% | 1.33% | 1.26% (d) | 2.60% | 60% | $3 |
Columbia Global Dividend Opportunity Fund | Annual Report 2017
| 19 |
Financial Highlights (continued)
| Year ended | Net asset value,
beginning of
period | Net
investment
income | Net
realized
and
unrealized
gain (loss) | Total from
investment
operations | Distributions
from net
investment
income | Distributions
from net
realized
gains |
| Class Y |
| 8/31/2017 | $17.10 | 0.68 | 1.15 | 1.83 | (0.64) | — |
| 8/31/2016 | $16.60 | 0.53 | 0.45 | 0.98 | (0.48) | — |
| 8/31/2015 | $21.68 | 0.70 | (2.96) | (2.26) | (0.80) | (2.02) |
| 8/31/2014 | $19.89 | 0.72 | 2.54 | 3.26 | (0.65) | (0.82) |
| 8/31/2013 | $19.65 | 0.59 | 1.74 | 2.33 | (0.78) | (1.31) |
| Class Z |
| 8/31/2017 | $17.11 | 0.54 | 1.25 | 1.79 | (0.60) | — |
| 8/31/2016 | $16.61 | 0.51 | 0.43 | 0.94 | (0.44) | — |
| 8/31/2015 | $21.69 | 0.63 | (2.94) | (2.31) | (0.75) | (2.02) |
| 8/31/2014 | $19.90 | 0.67 | 2.53 | 3.20 | (0.59) | (0.82) |
| 8/31/2013 | $19.66 | 0.56 | 1.75 | 2.31 | (0.76) | (1.31) |
| Notes to Financial Highlights |
| (a) | In addition to the fees and expenses that the Fund bears directly, the Fund indirectly bears a pro rata share of the fees and expenses of any other funds in which it invests. Such indirect expenses are not included in the Fund’s reported expense ratios. |
| (b) | Total net expenses include the impact of certain fee waivers/expense reimbursements made by the Investment Manager and certain of its affiliates, if applicable. |
| (c) | Expenses have been reduced due to a reimbursement of expenses overbilled by a third party. If the reimbursement had been excluded, the expense ratios would have been higher by the percentages shown for each class in the table below. All fee waivers and expense reimbursements by the Investment Manager and its affiliates were applied before giving effect to this third party reimbursement. |
| | Class A | Class C | Class R | Class R4 | Class T | Class Z |
| 08/31/2017 | 0.01 % | 0.01 % | 0.01 % | 0.01 % | 0.01 % | 0.01 % |
| (d) | The benefits derived from expense reductions had an impact of: |
| Class | 8/31/2017 | 8/31/2016 | 8/31/2015 | 8/31/2014 | 8/31/2013 |
| Class A | 0.02% | 0.01% | 0.01% | 0.02% | 0.03% |
| Class C | 0.02% | 0.01% | 0.01% | 0.02% | 0.03% |
| Class R | 0.02% | 0.01% | 0.01% | 0.02% | 0.03% |
| Class R4 | 0.02% | 0.01% | 0.02% | 0.03% | 0.05% |
| Class T | 0.02% | 0.01% | 0.01% | 0.02% | 0.03% |
| Class Z | 0.02% | 0.01% | 0.01% | 0.02% | 0.03% |
| (e) | Class R4 shares commenced operations on March 19, 2013. Per share data and total return reflect activity from that date. |
| (f) | Annualized. |
| (g) | Class R5 shares commenced operations on January 8, 2014. Per share data and total return reflect activity from that date. |
| (h) | Prior to March 27, 2017, Class T shares were known as Class W shares. |
The accompanying Notes to Financial Statements are an integral part of this statement.
| 20 | Columbia Global Dividend Opportunity Fund | Annual Report 2017 |
Total
distributions to
shareholders | Net
asset
value,
end of
period | Total
return | Total gross
expense
ratio to
average
net assets(a) | Total net
expense
ratio to
average
net assets(a),(b) | Net investment
income
ratio to
average
net assets | Portfolio
turnover | Net
assets,
end of
period
(000’s) |
| |
| (0.64) | $18.29 | 10.95% | 0.85% | 0.85% | 3.77% | 43% | $64,718 |
| (0.48) | $17.10 | 6.07% | 0.83% | 0.83% | 3.23% | 115% | $790 |
| (2.82) | $16.60 | (11.04%) | 0.82% | 0.82% | 3.89% | 63% | $1,149 |
| (1.47) | $21.68 | 17.00% | 0.81% | 0.81% | 3.33% | 75% | $3 |
| (2.09) | $19.89 | 12.93% | 0.96% | 0.88% | 2.97% | 60% | $3 |
| |
| (0.60) | $18.30 | 10.72% | 1.21% (c) | 1.04% (c),(d) | 3.06% | 43% | $417,705 |
| (0.44) | $17.11 | 5.82% | 1.20% | 1.05% (d) | 3.10% | 115% | $424,724 |
| (2.77) | $16.61 | (11.28%) | 1.13% | 1.06% (d) | 3.30% | 63% | $457,640 |
| (1.41) | $21.69 | 16.70% | 1.02% | 1.00% (d) | 3.16% | 75% | $592,910 |
| (2.07) | $19.90 | 12.76% | 1.09% | 1.01% (d) | 2.84% | 60% | $562,394 |
Columbia Global Dividend Opportunity Fund | Annual Report 2017
| 21 |
Notes to Financial Statements
August 31, 2017
Note 1. Organization
Columbia Global Dividend Opportunity Fund (the Fund), a series of Columbia Funds Series Trust I (the Trust), is a diversified fund. The Trust is registered under the Investment Company Act of 1940, as amended (the 1940 Act), as an open-end management investment company organized as a Massachusetts business trust.
Fund shares
The Trust may issue an unlimited number of shares (without par value). Although all share classes generally have identical voting, dividend and liquidation rights, each share class votes separately when required by the Trust’s organizational documents or by law. Different share classes pay different distribution amounts to the extent the expenses of such share classes differ, and distributions in liquidation will be proportional to the net asset value of each share class. Each share class has its own expense and sales charge structure. The Fund offers each of the share classes identified below.
Class A shares are subject to a maximum front-end sales charge of 5.75% based on the initial investment amount. Class A shares purchased without an initial sales charge in accounts aggregating $1 million to $50 million at the time of purchase are subject to a contingent deferred sales charge (CDSC) if the shares are sold within 18 months after purchase, charged as follows: 1.00% CDSC if redeemed within 12 months after purchase, and 0.50% CDSC if redeemed more than 12, but less than 18, months after purchase.
Class B shares of the Fund are no longer offered for sale. When available, Class B shares were subject to a maximum CDSC of 5.00% based upon the holding period after purchase. Effective July 17, 2017, Class B shares were automatically converted to Class A shares without a CDSC. On August 4, 2017, the capital owned by Columbia Management Investment Advisers, LLC in Class B shares was redeemed without a CDSC.
Class C shares are subject to a 1.00% CDSC on shares redeemed within 12 months after purchase.
The Fund no longer accepts investments by new or existing investors in Class I shares. Class I shares, when available, were not subject to sales charges, and were made available only to the Columbia Family of Funds. On March 27, 2017, Class I shares were redeemed or exchanged for Class Y shares of the Fund in a tax free transaction that had no impact on the fees and expenses paid by shareholders.
Class R shares are not subject to sales charges and are generally available only to certain retirement plans and other investors as described in the Fund’s prospectus.
Class R4 shares are not subject to sales charges and are generally available only to omnibus retirement plans and certain investors as described in the Fund’s prospectus. Effective November 1, 2017, Class R4 shares will be renamed Advisor Class shares.
Class R5 shares are not subject to sales charges and are generally available only to investors purchasing through authorized investment professionals and omnibus retirement plans as described in the Fund’s prospectus. Effective November 1, 2017, Class R5 shares will be renamed Institutional 2 Class shares.
Class T shares are subject to a maximum front-end sales charge of 2.50% per transaction and must be purchased through financial intermediaries that, by written agreement with Columbia Management Investment Distributors, Inc., are specifically authorized to sell Class T shares. Prior to March 27, 2017, Class T shares were known as Class W shares, were not subject to sales charges, and were generally available only to investors purchasing through authorized investment programs managed by investment professionals, including discretionary managed accounts.
Class Y shares are not subject to sales charges and are available to institutional and certain other investors as described in the Fund’s prospectus. Effective November 1, 2017, Class Y shares will be renamed Institutional 3 Class shares.
Class Z shares are not subject to sales charges and are generally available only to eligible investors, which are subject to different investment minimums as described in the Fund’s prospectus. Effective November 1, 2017, Class Z shares will be renamed Institutional Class shares.
| 22 | Columbia Global Dividend Opportunity Fund | Annual Report 2017 |
Notes to Financial Statements (continued)
August 31, 2017
Note 2. Summary of significant accounting policies
Basis of preparation
The Fund is an investment company that applies the accounting and reporting guidance in the Financial Accounting Standards Board (FASB) Accounting Standards Codification Topic 946, Financial Services - Investment Companies (ASC 946). The financial statements are prepared in accordance with U.S. generally accepted accounting principles (GAAP), which requires management to make certain estimates and assumptions that affect the reported amounts of assets and liabilities, the disclosure of contingent assets and liabilities at the date of the financial statements and the reported amounts of income and expenses during the reporting period. Actual results could differ from those estimates. The Fund received a reimbursement for expenses overbilled by a third party. Such reimbursement is included as an offset to other expenses on the Statement of Operations. All fee waivers and expense reimbursements by Columbia Management Investment Advisers, LLC and its affiliates were applied before giving effect to the third party reimbursement.
The following is a summary of significant accounting policies followed by the Fund in the preparation of its financial statements.
Security valuation
All equity securities are valued at the close of business of the New York Stock Exchange. Equity securities are valued at the last quoted sales price on the principal exchange or market on which they trade, except for securities traded on the NASDAQ Stock Market, which are valued at the NASDAQ official close price. Unlisted securities or listed securities for which there were no sales during the day are valued at the mean of the latest quoted bid and ask prices on such exchanges or markets.
Foreign equity securities are valued based on the closing price on the foreign exchange in which such securities are primarily traded. If any foreign equity security closing prices are not readily available, the securities are valued at the mean of the latest quoted bid and ask prices on such exchanges or markets. Foreign currency exchange rates are generally determined at 4:00 p.m. Eastern (U.S.) time. Many securities markets and exchanges outside the U.S. close prior to the close of the New York Stock Exchange; therefore, the closing prices for securities in such markets or on such exchanges may not fully reflect events that occur after such close but before the close of the New York Stock Exchange. In those situations, foreign securities will be fair valued pursuant to a policy adopted by the Board of Trustees, including, if available, utilizing a third party pricing service to determine these fair values. The third party pricing service takes into account multiple factors, including, but not limited to, movements in the U.S. securities markets, certain depositary receipts, futures contracts and foreign exchange rates that have occurred subsequent to the close of the foreign exchange or market, to determine a good faith estimate that reasonably reflects the current market conditions as of the close of the New York Stock Exchange. The fair value of a security is likely to be different from the quoted or published price, if available.
Investments in open-end investment companies, including money market funds, are valued at their latest net asset value.
Investments for which market quotations are not readily available, or that have quotations which management believes are not reflective of market value or reliable, are valued at fair value as determined in good faith under procedures approved by and under the general supervision of the Board of Trustees. If a security or class of securities (such as foreign securities) is valued at fair value, such value is likely to be different from the quoted or published price for the security.
The determination of fair value often requires significant judgment. To determine fair value, management may use assumptions including but not limited to future cash flows and estimated risk premiums. Multiple inputs from various sources may be used to determine fair value.
GAAP requires disclosure regarding the inputs and valuation techniques used to measure fair value and any changes in valuation inputs or techniques. In addition, investments shall be disclosed by major category. This information is disclosed following the Fund’s Portfolio of Investments.
Columbia Global Dividend Opportunity Fund | Annual Report 2017
| 23 |
Notes to Financial Statements (continued)
August 31, 2017
Foreign currency transactions and translations
The values of all assets and liabilities denominated in foreign currencies are generally translated into U.S. dollars at exchange rates determined at the close of regular trading on the New York Stock Exchange. Net realized and unrealized gains (losses) on foreign currency transactions and translations include gains (losses) arising from the fluctuation in exchange rates between trade and settlement dates on securities transactions, gains (losses) arising from the disposition of foreign currency and currency gains (losses) between the accrual and payment dates on dividends, interest income and foreign withholding taxes.
For financial statement purposes, the Fund does not distinguish that portion of gains (losses) on investments which is due to changes in foreign exchange rates from that which is due to changes in market prices of the investments. Such fluctuations are included with the net realized and unrealized gains (losses) on investments in the Statement of Operations.
Security transactions
Security transactions are accounted for on the trade date. Cost is determined and gains (losses) are based upon the specific identification method for both financial statement and federal income tax purposes.
Income recognition
Corporate actions and dividend income are generally recorded net of any non-reclaimable tax withholdings, on the ex-dividend date or upon receipt of ex-dividend notification in the case of certain foreign securities.
The Fund may receive distributions from holdings in equity securities, business development companies (BDCs), exchange-traded funds (ETFs), limited partnerships (LPs), other regulated investment companies (RICs), and real estate investment trusts (REITs), which report information on the tax character of their distributions annually. These distributions are allocated to dividend income, capital gain and return of capital based on actual information reported. Return of capital is recorded as a reduction of the cost basis of securities held. If the Fund no longer owns the applicable securities, return of capital is recorded as a realized gain. With respect to REITs, to the extent actual information has not yet been reported, estimates for return of capital are made by the Fund’s management. Management’s estimates are subsequently adjusted when the actual character of the distributions is disclosed by the REITs, which could result in a proportionate change in return of capital to shareholders.
Awards from class action litigation are recorded as a reduction of cost basis if the Fund still owns the applicable securities on the payment date. If the Fund no longer owns the applicable securities, the proceeds are recorded as realized gains.
Expenses
General expenses of the Trust are allocated to the Fund and other funds of the Trust based upon relative net assets or other expense allocation methodologies determined by the nature of the expense. Expenses directly attributable to the Fund are charged to the Fund. Expenses directly attributable to a specific class of shares are charged to that share class.
Determination of class net asset value
All income, expenses (other than class-specific expenses, which are charged to that share class, as shown in the Statement of Operations) and realized and unrealized gains (losses) are allocated to each class of the Fund on a daily basis, based on the relative net assets of each class, for purposes of determining the net asset value of each class.
Federal income tax status
The Fund intends to qualify each year as a regulated investment company under Subchapter M of the Internal Revenue Code, as amended, and will distribute substantially all of its taxable income (including net short-term capital gains) and capital gains, if any, for its tax year, and as such will not be subject to federal income taxes. In addition, the Fund intends to distribute in each calendar year substantially all of its net investment income, capital gains and certain other amounts, if any, such that the Fund should not be subject to federal excise tax. Therefore, no federal income or excise tax provision is recorded.
| 24 | Columbia Global Dividend Opportunity Fund | Annual Report 2017 |
Notes to Financial Statements (continued)
August 31, 2017
Foreign taxes
The Fund may be subject to foreign taxes on income, gains on investments or currency repatriation, a portion of which may be recoverable. The Fund will accrue such taxes and recoveries, as applicable, based upon its current interpretation of tax rules and regulations that exist in the markets in which it invests.
Realized gains in certain countries may be subject to foreign taxes at the Fund level, based on statutory rates. The Fund accrues for such foreign taxes on realized and unrealized gains at the appropriate rate for each jurisdiction, as applicable. The amount, if any, is disclosed as a liability on the Statement of Assets and Liabilities.
Distributions to shareholders
Distributions from net investment income, if any, are declared and paid each calendar quarter. Net realized capital gains, if any, are distributed at least annually. Income distributions and capital gain distributions are determined in accordance with federal income tax regulations, which may differ from GAAP.
Guarantees and indemnifications
Under the Trust’s organizational documents and, in some cases, by contract, its officers and trustees are indemnified against certain liabilities arising out of the performance of their duties to the Trust or its funds. In addition, certain of the Fund’s contracts with its service providers contain general indemnification clauses. The Fund’s maximum exposure under these arrangements is unknown since the amount of any future claims that may be made against the Fund cannot be determined, and the Fund has no historical basis for predicting the likelihood of any such claims.
Recent accounting pronouncement
Accounting Standards Update 2017-08 Premium Amortization on Purchased Callable Debt Securities
In March 2017, the Financial Accounting Standards Board issued Accounting Standards Update (ASU) No. 2017-08 Premium Amortization on Purchased Callable Debt Securities. ASU No. 2017-08 updates the accounting standards to shorten the amortization period for certain purchased callable debt securities, held at a premium, to be amortized to the earliest call date. The update applies to securities with explicit, noncontingent call features that are callable at fixed prices and on preset dates. The standard is effective for annual periods beginning after December 15, 2018 and interim periods within those fiscal years. At this time, management is evaluating the implication of this guidance and the impact it will have on the financial statement amounts and footnote disclosures, if any.
Note 3. Fees and other transactions with affiliates
Management services fees
The Fund has entered into a Management Agreement with Columbia Management Investment Advisers, LLC (the Investment Manager), a wholly-owned subsidiary of Ameriprise Financial, Inc. (Ameriprise Financial). Under the Management Agreement, the Investment Manager provides the Fund with investment research and advice, as well as administrative and accounting services. The management services fee is an annual fee that is equal to a percentage of the Fund’s daily net assets that declines from 0.77% to 0.57% as the Fund’s net assets increase. The effective management services fee rate for the year ended August 31, 2017 was 0.76% of the Fund’s average daily net assets.
Participating Affiliates
The Investment Manager and its investment advisory affiliates (Participating Affiliates) around the world may coordinate in providing services to their clients. From time to time the Investment Manager (or any affiliated investment subadviser to the Fund, as the case may be) may engage its Participating Affiliates to provide a variety of services such as investment research, investment monitoring, trading and discretionary investment management (including portfolio management) to certain accounts managed by the Investment Manager, including the Fund. These Participating Affiliates will provide services to the Investment Manager (or any affiliated investment subadviser to the Fund as the case may be) either pursuant to subadvisory agreements, personnel-sharing agreements or similar inter-company arrangements and the Fund will pay no additional fees and expenses as a result of any such arrangements.
Columbia Global Dividend Opportunity Fund | Annual Report 2017
| 25 |
Notes to Financial Statements (continued)
August 31, 2017
These Participating Affiliates, like the Investment Manager, are direct or indirect subsidiaries of Ameriprise Financial and are registered with appropriate respective regulators in their home jurisdictions and, where required, the Securities and Exchange Commission and the Commodity Futures Trading Commission in the United States.
Pursuant to some of these arrangements, certain employees of these Participating Affiliates may serve as "associated persons" of the Investment Manager and, in this capacity, subject to the oversight and supervision of the Investment Manager and consistent with the investment objectives, policies and limitations set forth in the Fund’s prospectus and Statement of Additional Information (SAI), may provide such services to the Fund on behalf of the Investment Manager.
Compensation of board members
Members of the Board of Trustees, who are not officers or employees of the Investment Manager or Ameriprise Financial, are compensated for their services to the Fund as disclosed in the Statement of Operations. These members of the Board of Trustees may participate in a Deferred Compensation Plan (the Plan) which may be terminated at any time. Obligations of the Plan will be paid solely out of the Fund’s assets, and all amounts payable under the Plan constitute a general unsecured obligation of the Fund.
Compensation of Chief Compliance Officer
The Board of Trustees has appointed a Chief Compliance Officer to the Fund in accordance with federal securities regulations. A portion of the Chief Compliance Officer’s total compensation is allocated to the Fund, along with other affiliated funds governed by the Board of Trustees, based on relative net assets. The total amount allocated to all affiliated funds governed by the Board of Trustees will not exceed $40,000 annually.
Transfer agency fees
Under a Transfer and Dividend Disbursing Agent Agreement, Columbia Management Investment Services Corp. (the Transfer Agent), an affiliate of the Investment Manager and a wholly-owned subsidiary of Ameriprise Financial, is responsible for providing transfer agency services to the Fund. The Transfer Agent has contracted with Boston Financial Data Services (BFDS) to serve as sub-transfer agent. The Transfer Agent pays the fees of BFDS for services as sub-transfer agent and BFDS is not entitled to reimbursement for such fees from the Fund (with the exception of out-of-pocket fees).
The Fund pays the Transfer Agent a monthly transfer agency fee based on the number or the average value of accounts, depending on the type of account. In addition, prior to October 1, 2016, the Transfer Agent also received sub-transfer agency fees based on a percentage of the average aggregate value of the Fund’s shares maintained in omnibus accounts (other than omnibus accounts for which American Enterprise Investment Services Inc. is the broker of record or accounts where the beneficial shareholder is a customer of Ameriprise Financial Services, Inc., for which the Transfer Agent receives a per account fee). Effective October 1, 2016, the Fund pays the Transfer Agent a fee for shareholder services based on the number of accounts or on a percentage of the average aggregate value of the Fund’s shares maintained in omnibus accounts up to the lesser of the amount charged by the financial intermediary or a cap established by the Board of Trustees from time to time.
The Transfer Agent also receives compensation from the Fund for various shareholder services and reimbursements for certain out-of-pocket fees. Effective August 1, 2017, total transfer agency fees for Class R5 and Class Y shares are subject to an annual limitation of not more than 0.07% and 0.02%, respectively, of the average daily net assets attributable to each share class. From January 1, 2017 to July 31, 2017, these limitations were 0.075% for Class R5 shares and 0.025% for Class I and Class Y shares; and prior to January 1, 2017, the limitation was 0.05% for Class R5 shares and Class I and Class Y shares did not pay transfer agency fees.
| 26 | Columbia Global Dividend Opportunity Fund | Annual Report 2017 |
Notes to Financial Statements (continued)
August 31, 2017
For the year ended August 31, 2017, the Fund’s effective transfer agency fee rates as a percentage of average daily net assets of each class were as follows:
| | Effective rate (%) |
| Class A | 0.37 |
| Class B | 0.34 (a),(b) |
| Class C | 0.37 |
| Class I | 0.00 (b),(c) |
| Class R | 0.37 |
| Class R4 | 0.37 |
| Class R5 | 0.07 |
| Class T | 0.37 |
| Class Y | 0.01 |
| Class Z | 0.37 |
| (a) | Effective July 17, 2017, Class B shares were automatically converted to Class A shares. |
| (b) | Unannualized. |
| (c) | Effective March 27, 2017, Class I shares were redeemed or exchanged for Class Y shares. |
An annual minimum account balance fee of $20 may apply to certain accounts with a value below the applicable share class’s initial minimum investment requirements to reduce the impact of small accounts on transfer agency fees. These minimum account balance fees are remitted to the Fund and recorded as part of expense reductions in the Statement of Operations. For the year ended August 31, 2017, these minimum account balance fees reduced total expenses of the Fund by $95,614.
Distribution and service fees
The Fund has entered into an agreement with Columbia Management Investment Distributors, Inc. (the Distributor), an affiliate of the Investment Manager and a wholly-owned subsidiary of Ameriprise Financial, for distribution and shareholder services. The Board of Trustees has approved, and the Fund has adopted, distribution and shareholder service plans (the Plans) applicable to certain share classes, which set the distribution and service fees for the Fund. These fees are calculated daily and are intended to compensate the Distributor and/or eligible selling and/or servicing agents for selling shares of the Fund and providing services to investors.
Under the Plans, the Fund pays a monthly service fee to the Distributor at the maximum annual rate of 0.25% of the average daily net assets attributable to Class A, Class B, Class C and Class T shares of the Fund. Also under the Plans, the Fund pays a monthly distribution fee to the Distributor at the maximum annual rates of 0.75%, 0.75%, 0.50% and 0.25% of the average daily net assets attributable to Class B, Class C, Class R and Class T shares of the Fund, respectively. As a result of all Class B shares of the Fund being redeemed or converted to Class A shares, August 4, 2017 was the last day the Fund paid a service fee or distribution fee for Class B shares.
Although the Fund may pay a distribution fee up to 0.25% of the Fund’s average daily net assets attributable to Class T shares and a service fee of up to 0.25% of the Fund’s average daily net assets attributable to Class T shares, the aggregate fee shall not exceed 0.25% of the Fund’s average daily net assets attributable to Class T shares.
Sales charges (unaudited)
Sales charges, including front-end charges and CDSCs, received by the Distributor for distributing Fund shares for the year ended August 31, 2017, if any, are listed below:
| | Amount ($) |
| Class A | 35,586 |
| Class C | 192 |
Columbia Global Dividend Opportunity Fund | Annual Report 2017
| 27 |
Notes to Financial Statements (continued)
August 31, 2017
Expenses waived/reimbursed by the Investment Manager and its affiliates
The Investment Manager and certain of its affiliates have contractually agreed to waive fees and/or reimburse expenses (excluding certain fees and expenses described below) for the period(s) disclosed below, unless sooner terminated at the sole discretion of the Board of Trustees, so that the Fund’s net operating expenses, after giving effect to fees waived/expenses reimbursed and any balance credits and/or overdraft charges from the Fund’s custodian, do not exceed the following annual rate(s) as a percentage of the class’ average daily net assets:
| | January 1, 2017
through
December 31, 2017 | Prior to
January 1, 2017 |
| Class A | 1.30% | 1.30% |
| Class C | 2.05 | 2.05 |
| Class R | 1.55 | 1.55 |
| Class R4 | 1.05 | 1.05 |
| Class R5 | 0.925 | 0.90 |
| Class T | 1.30 | 1.30 |
| Class Y | 0.875 | 0.85 |
| Class Z | 1.05 | 1.05 |
Under the agreement governing these fee waivers and/or expense reimbursement arrangements, the following fees and expenses are excluded from the waiver/reimbursement commitment, and therefore will be paid by the Fund, if applicable: taxes (including foreign transaction taxes), expenses associated with investments in affiliated and non-affiliated pooled investment vehicles (including mutual funds and exchange-traded funds), transaction costs and brokerage commissions, costs related to any securities lending program, dividend expenses associated with securities sold short, inverse floater program fees and expenses, transaction charges and interest on borrowed money, interest, infrequent and/or unusual expenses and any other expenses the exclusion of which is specifically approved by the Board of Trustees. This agreement may be modified or amended only with approval from the Investment Manager, certain of its affiliates and the Fund. Any fees waived and/or expenses reimbursed under the expense reimbursement arrangements described above are not recoverable by the Investment Manager or its affiliates in future periods.
Note 4. Federal tax information
The timing and character of income and capital gain distributions are determined in accordance with income tax regulations, which may differ from GAAP because of temporary or permanent book to tax differences.
At August 31, 2017, these differences are primarily due to differing treatment for deferral/reversal of wash sale losses, passive foreign investment company (PFIC) holdings, re-characterization of distributions for investments, capital loss carryforwards, trustees’ deferred compensation, foreign currency transactions and investments in partnerships. To the extent these differences are permanent, reclassifications are made among the components of the Fund’s net assets in the Statement of Assets and Liabilities. Temporary differences do not require reclassifications.
In the Statement of Assets and Liabilities the following reclassifications were made:
Undistributed net
investment
income ($) | Accumulated
net realized
(loss) ($) | Paid in
capital ($) |
| 1,411,771 | 7,120,434 | (8,532,205) |
Net investment income (loss) and net realized gains (losses), as disclosed in the Statement of Operations, and net assets were not affected by this reclassification.
| 28 | Columbia Global Dividend Opportunity Fund | Annual Report 2017 |
Notes to Financial Statements (continued)
August 31, 2017
The tax character of distributions paid during the years indicated was as follows:
| August 31, 2017 | August 31, 2016 |
Ordinary
income ($) | Long-term
capital gains ($) | Total ($) | Ordinary
income ($) | Long-term
capital gains ($) | Total ($) |
| 20,495,343 | — | 20,495,343 | 17,928,631 | — | 17,928,631 |
Short-term capital gain distributions, if any, are considered ordinary income distributions for tax purposes.
At August 31, 2017, the components of distributable earnings on a tax basis were as follows:
Undistributed
ordinary income ($) | Undistributed
long-term
capital gains ($) | Capital loss
carryforwards ($) | Net unrealized
appreciation ($) |
| 7,158,665 | — | (17,051,810) | 50,902,308 |
At August 31, 2017, the cost of all investments for federal income tax purposes along with the aggregate gross unrealized appreciation and depreciation based on that cost was:
Federal
tax cost ($) | Gross unrealized
appreciation ($) | Gross unrealized
(depreciation) ($) | Net unrealized
appreciation ($) |
| 539,697,432 | 76,852,894 | (25,950,586) | 50,902,308 |
Tax cost of investments and unrealized appreciation/(depreciation) may also include timing differences that do not constitute adjustments to tax basis.
The following capital loss carryforwards, determined at August 31, 2017, may be available to reduce taxable income arising from future net realized gains on investments, if any, to the extent permitted by the Internal Revenue Code. Capital loss carryforwards with no expiration are required to be utilized prior to any capital losses which carry an expiration date. As a result of this ordering rule, capital loss carryforwards which carry an expiration date may be more likely to expire unused. In addition, for the year ended August 31, 2017, capital loss carryforwards utilized, expired unused and permanently lost, if any, were as follows:
| 2018 ($) | 2019 ($) | No expiration
short-term ($) | No expiration
long-term ($) | Total ($) | Utilized ($) | Expired ($) | Permanently
lost ($) |
| — | — | 17,051,810 | — | 17,051,810 | — | 8,531,694 | — |
Management of the Fund has concluded that there are no significant uncertain tax positions in the Fund that would require recognition in the financial statements. However, management’s conclusion may be subject to review and adjustment at a later date based on factors including, but not limited to, new tax laws, regulations, and administrative interpretations (including relevant court decisions). Generally, the Fund’s federal tax returns for the prior three fiscal years remain subject to examination by the Internal Revenue Service.
Note 5. Portfolio information
The cost of purchases and proceeds from sales of securities, excluding short-term investments and derivatives, if any, aggregated to $257,252,997 and $314,174,308, respectively, for the year ended August 31, 2017. The amount of purchase and sale activity impacts the portfolio turnover rate reported in the Financial Highlights.
Note 6. Affiliated money market fund
The Fund invests in Columbia Short-Term Cash Fund, an affiliated money market fund established for the exclusive use by the Fund and other affiliated funds (the Affiliated MMF). The income earned by the Fund from such investments is included as Dividends - affiliated issuers in the Statement of Operations. As an investing fund, the Fund indirectly bears its proportionate share of the expenses of the Affiliated MMF. Effective October 1, 2016, the Affiliated MMF prices its shares with a floating net
Columbia Global Dividend Opportunity Fund | Annual Report 2017
| 29 |
Notes to Financial Statements (continued)
August 31, 2017
asset value (NAV) and no longer seeks to maintain a stable NAV. In addition, the Board of Trustees of the Affiliated MMF may impose a fee on redemptions (sometimes referred to as a liquidity fee) or temporarily suspend redemptions (sometimes referred to as imposing a redemption gate) in the event its liquidity falls below regulatory limits.
Note 7. Line of credit
The Fund has access to a revolving credit facility with a syndicate of banks led by Citibank, N.A., HSBC Bank USA, N.A. and JPMorgan Chase Bank, N.A. whereby the Fund may borrow for the temporary funding of shareholder redemptions or for other temporary or emergency purposes. The credit facility, which is a collective agreement between the Fund and certain other funds managed by the Investment Manager, severally and not jointly, permits collective borrowings up to $1 billion. Interest is charged to each participating fund based on its borrowings at a rate equal to the higher of (i) the overnight federal funds rate plus 1.00% or (ii) the one-month LIBOR rate plus 1.00%. Each borrowing under the credit facility matures no later than 60 days after the date of borrowing. The Fund also pays a commitment fee equal to its pro rata share of the amount of the credit facility at a rate of 0.15% per annum. The commitment fee is included in other expenses in the Statement of Operations.
The Fund had no borrowings during the year ended August 31, 2017.
Note 8. Significant risks
Foreign securities and emerging market countries risk
Investing in foreign securities may include certain risks and considerations not typically associated with investing in U.S. securities, such as fluctuating currency values and changing local and regional economic, political and social conditions, which may result in greater market volatility. In addition, certain foreign securities may not be as liquid as U.S. securities. Investing in emerging markets may accentuate these risks. These countries are also more likely to experience high levels of inflation, deflation or currency devaluation which could hurt their economies and securities markets. To the extent that the Fund concentrates its investment exposure to any one or a few specific countries, the Fund will be particularly susceptible to the various conditions, events or other factors impacting those countries and may, therefore, have a greater risk than that of a fund which is more geographically diversified.
Shareholder concentration risk
At August 31, 2017, affiliated shareholders of record owned 12.4% of the outstanding shares of the Fund in one or more accounts. Subscription and redemption activity by concentrated accounts may have a significant effect on the operations of the Fund. In the case of a large redemption, the Fund may be forced to sell investments at inopportune times, including its liquid positions, which may result in Fund losses and the Fund holding a higher percentage of less liquid positions. Large redemptions could result in decreased economies of scale and increased operating expenses for non-redeeming Fund shareholders.
Note 9. Subsequent events
Management has evaluated the events and transactions that have occurred through the date the financial statements were issued. Other than as noted in Note 1 above, there were no items requiring adjustment of the financial statements or additional disclosure.
Note 10. Information regarding pending and settled legal proceedings
Ameriprise Financial and certain of its affiliates have historically been involved in a number of legal, arbitration and regulatory proceedings, including routine litigation, class actions, and governmental actions, concerning matters arising in connection with the conduct of their business activities. Ameriprise Financial believes that the Fund is not currently the subject of, and that neither Ameriprise Financial nor any of its affiliates are the subject of, any pending legal, arbitration or regulatory proceedings that are likely to have a material adverse effect on the Fund or the ability of Ameriprise Financial or its affiliates to perform under their contracts with the Fund. Ameriprise Financial is required to make quarterly (10-Q), annual (10-K) and, as necessary, 8-K filings with the Securities and Exchange Commission (SEC) on legal and regulatory matters that relate to Ameriprise Financial and its affiliates. Copies of these filings may be obtained by accessing the SEC website at www.sec.gov.
| 30 | Columbia Global Dividend Opportunity Fund | Annual Report 2017 |
Notes to Financial Statements (continued)
August 31, 2017
There can be no assurance that these matters, or the adverse publicity associated with them, will not result in increased Fund redemptions, reduced sale of Fund shares or other adverse consequences to the Fund. Further, although we believe proceedings are not likely to have a material adverse effect on the Fund or the ability of Ameriprise Financial or its affiliates to perform under their contracts with the Fund, these proceedings are subject to uncertainties and, as such, we are unable to estimate the possible loss or range of loss that may result. An adverse outcome in one or more of these proceedings could result in adverse judgments, settlements, fines, penalties or other relief that could have a material adverse effect on the consolidated financial condition or results of operations of Ameriprise Financial.
Columbia Global Dividend Opportunity Fund | Annual Report 2017
| 31 |
Report of Independent Registered Public Accounting Firm
To the Trustees of Columbia Funds Series Trust I and the Shareholders of Columbia Global Dividend Opportunity Fund
In our opinion, the accompanying statement of assets and liabilities, including the portfolio of investments, and the related statements of operations and of changes in net assets and the financial highlights present fairly, in all material respects, the financial position of Columbia Global Dividend Opportunity Fund (the “Fund”, a series of Columbia Funds Series Trust I) as of August 31, 2017, the results of its operations for the year then ended, the changes in its net assets for each of the two years in the period then ended and the financial highlights for each of the five years in the period then ended, in conformity with accounting principles generally accepted in the United States of America. These financial statements and financial highlights (hereafter referred to as “financial statements”) are the responsibility of the Fund’s management. Our responsibility is to express an opinion on these financial statements based on our audits. We conducted our audits of these financial statements in accordance with the standards of the Public Company Accounting Oversight Board (United States). Those standards require that we plan and perform the audit to obtain reasonable assurance about whether the financial statements are free of material misstatement. An audit includes examining, on a test basis, evidence supporting the amounts and disclosures in the financial statements, assessing the accounting principles used and significant estimates made by management, and evaluating the overall financial statement presentation. We believe that our audits, which included confirmation of securities as of August 31, 2017 by correspondence with the custodian and transfer agent provide a reasonable basis for our opinion.
/s/ PricewaterhouseCoopers LLP
Minneapolis, MN
October 20, 2017
| 32 | Columbia Global Dividend Opportunity Fund | Annual Report 2017 |
Federal Income Tax Information
(Unaudited)
The Fund hereby designates the following tax attributes for the fiscal year ended August 31, 2017. Shareholders will be notified in early 2018 of the amounts for use in preparing 2017 income tax returns.
Qualified
dividend
income | Dividends
received
deduction | Foreign
taxes paid | Foreign
taxes paid
per share |
| 97.79% | 42.86% | $1,266,864 | $0.04 |
Qualified dividend income. For taxable, non-corporate shareholders, the percentage of ordinary income distributed during the fiscal year that represents qualified dividend income subject to reduced tax rates.
Dividends received deduction. The percentage of ordinary income distributed during the fiscal year that qualifies for the corporate dividends received deduction.
Foreign taxes. The Fund makes the election to pass through to shareholders the foreign taxes paid. Eligible shareholders may claim a foreign tax credit. These taxes, and the corresponding foreign source income, are provided.
Columbia Global Dividend Opportunity Fund | Annual Report 2017
| 33 |
Shareholders elect the Board that oversees the Fund’s operations. The Board appoints officers who are responsible for day-to-day business decisions based on policies set by the Board. The following table provides basic biographical information about the Fund’s Trustees, including their principal occupations during the past five years, although specific titles for individuals may have varied over the period. The year set forth beneath Length of Service in the table below is the year in which the Trustee was first appointed or elected as Trustee to any Fund currently in the Columbia Funds Complex or a predecessor thereof. Under current Board policy, members serve terms of indefinite duration.
Independent trustees
| Name, address, year of birth | Position held with the Trust and length of service | Principal occupation(s) during the past five years and other relevant professional experience | Number of Funds in the Columbia Fund Complex overseen | Other directorships held by Trustee during the past five years |
Janet Langford Carrig
c/o Columbia Management
Investment Advisers, LLC
225 Franklin Street
Mail Drop BX32 05228
Boston, MA 02110
1957 | Trustee
1996 | Senior Vice President, General Counsel and Corporate Secretary, ConocoPhillips (independent energy company) since September 2007 | 57 | None |
Douglas A. Hacker
c/o Columbia Management
Investment Advisers, LLC
225 Franklin Street
Mail Drop BX32 05228
Boston, MA 02110
1955 | Trustee and Chairman of the Board
1996 | Independent business executive since May 2006; Executive Vice President — Strategy of United Airlines from December 2002 to May 2006; President of UAL Loyalty Services (airline marketing company) from September 2001 to December 2002; Executive Vice President and Chief Financial Officer of United Airlines from July 1999 to September 2001 | 57 | Spartan Nash Company, (food distributor); Nash Finch Company (food distributor) from 2005 to 2013; Aircastle Limited (aircraft leasing); SeaCube Container Leasing Ltd. (container leasing) from 2010 to 2013; and Travelport Worldwide Limited (travel information technology) |
Nancy T. Lukitsh
c/o Columbia Management
Investment Advisers, LLC
225 Franklin Street
Mail Drop BX32 05228
Boston, MA 02110
1956 | Trustee
2011 | Senior Vice President, Partner and Director of Marketing, Wellington Management Company, LLP (investment adviser) from 1997 to 2010; Chair, Wellington Management Portfolios (commingled non-U.S. investment pools) from 2007 to 2010; Director, Wellington Trust Company, NA and other Wellington affiliates from 1997 to 2010 | 57 | None |
David M. Moffett
c/o Columbia Management
Investment Advisers, LLC
225 Franklin Street
Mail Drop BX32 05228
Boston, MA 02110
1952 | Trustee
2011 | Retired. Consultant to Bridgewater and Associates | 57 | Director, CSX Corporation; Genworth Financial, Inc. (financial and insurance products and services); PayPal Holdings Inc. (payment and data processing services); Trustee, University of Oklahoma Foundation; former Director, eBay Inc. (online trading community), 2007-2015; and former Director, CIT Bank, CIT Group Inc. (commercial and consumer finance), 2010-2016 |
| 34 | Columbia Global Dividend Opportunity Fund | Annual Report 2017 |
TRUSTEES AND OFFICERS (continued)
Independent trustees (continued)
| Name, address, year of birth | Position held with the Trust and length of service | Principal occupation(s) during the past five years and other relevant professional experience | Number of Funds in the Columbia Fund Complex overseen | Other directorships held by Trustee during the past five years |
Charles R. Nelson
c/o Columbia Management
Investment Advisers, LLC
225 Franklin Street
Mail Drop BX32 05228
Boston, MA 02110
1942 | Trustee
1981 | Retired. Professor Emeritus, University of Washington since 2011; Professor of Economics, University of Washington from 1976 to 2011; Ford and Louisa Van Voorhis Professor of Political Economy, University of Washington from 1993 to 2011; Adjunct Professor of Statistics, University of Washington from 1980 to 2011; Associate Editor, Journal of Money, Credit and Banking from September 1993 to 2008; consultant on econometric and statistical matters | 57 | None |
John J. Neuhauser
c/o Columbia Management
Investment Advisers, LLC
225 Franklin Street
Mail Drop BX32 05228
Boston, MA 02110
1943 | Trustee
1984 | President, Saint Michael’s College since August 2007; Director or Trustee of several non-profit organizations, including University of Vermont Medical Center; Academic Vice President and Dean of Faculties, Boston College from August 1999 to October 2005; University Professor, Boston College from November 2005 to August 2007 | 57 | Liberty All-Star Equity Fund and Liberty All- Star Growth Fund (closed-end funds) |
Patrick J. Simpson
c/o Columbia Management
Investment Advisers, LLC
225 Franklin Street
Mail Drop BX32 05228
Boston, MA 02110
1944 | Trustee
2000 | Of Counsel, Perkins Coie LLP (law firm) since 2015; Partner, Perkins Coie LLP from 1988 to 2014 | 57 | None |
Anne-Lee Verville
c/o Columbia Management
Investment Advisers, LLC
225 Franklin Street
Mail Drop BX32 05228
Boston, MA 02110
1945 | Trustee
1998 | Retired. General Manager, Global Education Industry from 1994 to 1997, President – Application Systems Division from 1991 to 1994, Chief Financial Officer – US Marketing & Services from 1988 to 1991, and Chief Information Officer from 1987 to 1988, IBM Corporation (computer and technology) | 57 | Enesco Group, Inc. (producer of giftware and home and garden decor products) from 2001 to 2006 |
Columbia Global Dividend Opportunity Fund | Annual Report 2017
| 35 |
TRUSTEES AND OFFICERS (continued)
Consultants to the Independent Trustees*
| Name, address, year of birth | Position held with the Trust and length of service | Principal occupation(s) during the past five years and other relevant professional experience | Number of Funds in the Columbia Funds complex overseen | Other directorships held by Trustee during the past five years |
J. Kevin Connaughton
c/o Columbia
Management Investment
Advisers, LLC,
225 Franklin Street
Mail Drop BX32 05228,
Boston, MA 02110
1964 | Independent Trustee Consultant
2016 | Independent Trustee Consultant, Columbia Funds since March 2016; Managing Director and General Manager of Mutual Fund Products, Columbia Management Investment Advisers, LLC from May 2010 to February 2015; President, Columbia Funds from 2009 to 2015; and senior officer of Columbia Funds and affiliated funds from 2003 to 2015 | 57 | Board of Governors, Gateway Healthcare since January 2016; Trustee, New Century Portfolios since March 2015; and Director, The Autism Project since March 2015 |
Natalie A. Trunow
c/o Columbia
Management Investment
Advisers, LLC,
225 Franklin Street
Mail Drop BX32 05228,
Boston, MA 02110
1967 | Independent Trustee Consultant
2016 | Independent Trustee Consultant, Columbia Funds since September 2016; Chief Executive Officer, Millennial Partners (investment consulting services to institutions) since January 2016; Director of Investments, Casey Family Programs from April 2016 to September 2016; Senior Vice President and Chief Investment Officer, Calvert Investments from August 2008 to January 2016; Section Head and Portfolio Manager, General Motors Asset Management from June 1997 to August 2008 | 57 | Healthcare Services for Children with Special Needs |
| * | J. Kevin Connaughton was appointed consultant to the Independent Trustees effective March 1, 2016. Natalie A. Trunow was appointed consultant to the Independent Trustees effective September 1, 2016. Shareholders of the Funds are expected to be asked to elect each of Mr. Connaughton and Ms. Trunow as a Trustee at a future shareholder meeting. |
Interested trustee affiliated with Investment Manager*
| Name, address, year of birth | Position held with the Trust and length of service | Principal occupation(s) during the past five years and other relevant professional experience | Number of Funds in the Columbia Funds Complex overseen | Other directorships held by Trustee during the past five years |
William F. Truscott
c/o Columbia Management
Investment Advisers, LLC
225 Franklin Street
Boston, MA 02110
1960 | Trustee
2012 | Chairman of the Board and President, Columbia Management Investment Advisers, LLC since May 2010 and February 2012, respectively; Chief Executive Officer, Global Asset Management, Ameriprise Financial, Inc. since September 2012 (previously Chief Executive Officer, U.S. Asset Management & President, Annuities, May 2010-September 2012); Director and Chief Executive Officer, Columbia Management Investment Distributors, Inc. since May 2010 and February 2012, respectively; Chairman of the Board and Chief Executive Officer, RiverSource Distributors, Inc. since 2006; Director, Threadneedle Asset Management Holdings, SARL since 2014; President and Chief Executive Officer, Ameriprise Certificate Company, 2006-August 2012 | 179 | Chairman of the Board, Columbia Management Investment Advisers, LLC since May 2010; Director, Columbia Management Investment Distributors, Inc. since May 2010; former Director, Ameriprise Certificate Company, 2006 - January 2013 |
| * | Interested person (as defined under the 1940 Act) by reason of being an officer, director, security holder and/or employee of the Investment Manager or Ameriprise Financial. |
The Statement of Additional Information has additional information about the Fund’s Board members and is available,
without charge, upon request by calling 800.345.6611, contacting your financial intermediary or visiting
investor.columbiathreadneedleus.com.
| 36 | Columbia Global Dividend Opportunity Fund | Annual Report 2017 |
TRUSTEES AND OFFICERS (continued)
The Board has appointed officers who are responsible for day-to-day business decisions based on policies it has established. The officers serve at the pleasure of the Board. The following table provides basic information about the Officers of the Fund, including principal occupations during the past five years, although their specific titles may have varied over the period. In addition to Mr. Truscott, who is Senior Vice President, the Fund’s other officers are:
Fund officers
Name,
address and
year of birth | Position and year
first appointed to
position for any Fund
in the Columbia
Funds complex or a
predecessor thereof | Principal occupation(s) during past five years |
Christopher O. Petersen
5228 Ameriprise
Financial Center
Minneapolis, MN 55474
Born 1970 | President and Principal Executive Officer (2015) | Vice President and Lead Chief Counsel, Ameriprise Financial, Inc. since January 2015 (previously, Vice President and Chief Counsel, January 2010 - December 2014; officer of Columbia Funds and affiliated funds since 2007. |
Michael G. Clarke
225 Franklin Street
Boston, MA 02110
Born 1969 | Treasurer (2011), Chief Financial Officer (2009) and Chief Accounting Officer (2015) | Vice President — Mutual Fund Administration, Columbia Management Investment Advisers, LLC, since May 2010; senior officer of Columbia Funds and affiliated funds since 2002. |
Paul B. Goucher
100 Park Avenue
New York, NY 10017
Born 1968 | Senior Vice President (2011) and Assistant Secretary (2008) | Senior Vice President and Assistant General Counsel, Ameriprise Financial, Inc. since January 2017 (previously Vice President and Lead Chief Counsel, November 2008 - January 2017 and January 2013 - January 2017, respectively; and Chief Counsel, January 2010 - January 2013); Vice President, Chief Legal Officer and Assistant Secretary, Columbia Management Investment Advisers, LLC since May 2010. |
Thomas P. McGuire
225 Franklin Street
Boston, MA 02110
Born 1972 | Senior Vice President and Chief Compliance Officer (2012) | Vice President — Asset Management Compliance, Ameriprise Financial, Inc., since May 2010; Chief Compliance Officer, Ameriprise Certificate Company since September 2010. |
Colin Moore
225 Franklin Street
Boston, MA 02110
Born 1958 | Senior Vice President (2010) | Executive Vice President and Global Chief Investment Officer, Ameriprise Financial, Inc., since July 2013; Executive Vice President and Global Chief Investment Officer, Columbia Management Investment Advisers, LLC since July 2013 (previously Director and Global Chief Investment Officer, 2010 - 2013). |
Ryan C. Larrenaga
225 Franklin Street
Boston, MA 02110
Born 1970 | Senior Vice President (2017), Chief Legal Officer (2017) and Secretary (2015) | Vice President and Group Counsel, Ameriprise Financial, Inc. since August 2011; officer of Columbia Funds and affiliated funds since 2005. |
Michael E. DeFao
225 Franklin Street
Boston, MA 02110
Born 1968 | Vice President (2011) and Assistant Secretary (2010) | Vice President and Chief Counsel, Ameriprise Financial, Inc. since May 2010. |
Amy Johnson
5228 Ameriprise
Financial Center
Minneapolis, MN 55474
Born 1965 | Vice President (2006) | Managing Director and Global Head of Operations, Columbia Management Investment Advisers, LLC since April 2016 (previously Managing Director and Chief Operating Officer, 2010 - 2016). |
Lyn Kephart-Strong
5228 Ameriprise
Financial Center
Minneapolis, MN 55474
Born 1960 | Vice President (2015) | President, Columbia Management Investment Services Corp. since October 2014; Vice President & Resolution Officer, Ameriprise Trust Company since August 2009. |
Columbia Global Dividend Opportunity Fund | Annual Report 2017
| 37 |
Board Consideration and Approval of Management
Agreement
On June 14, 2017, the Board of Trustees (the Board) and the Trustees who are not interested persons (as defined in the Investment Company Act of 1940) (the Independent Trustees) of Columbia Funds Series Trust I (the Trust) unanimously approved the continuation of the Management Agreement (the Management Agreement) with Columbia Management Investment Advisers, LLC (the Investment Manager) with respect to Columbia Global Dividend Opportunity Fund (the Fund), a series of the Trust. As detailed below, the Board’s Advisory Fees and Expenses Committee (the Committee) and the Board met on multiple occasions to review and discuss, both among themselves and with the management team of the Investment Manager, materials provided by the Investment Manager and others before determining to approve the continuation of the Management Agreement.
In connection with their deliberations regarding the continuation of the Management Agreement, the Committee and the Board evaluated materials requested from the Investment Manager regarding the Fund and the Management Agreement, and discussed these materials with representatives of the Investment Manager at Committee meetings held on March 27, 2017, April 26, 2017 and June 13, 2017 and at Board meetings held on March 28, 2017 and June 14, 2017. In addition, the Board considers matters bearing on the Management Agreement at most of its other meetings throughout the year and meets regularly with senior management of the Trust and the Investment Manager. Through the Board’s Investment Oversight Committees, Trustees also meet with selected portfolio managers of the funds the Trustees oversee and other investment personnel at various times throughout the year. The Committee and the Board also consulted with its independent fee consultant, Fund counsel and the Independent Trustees’ independent legal counsel, who advised on various matters with respect to the Committee’s and the Board’s considerations and otherwise assisted the Committee and the Board in their deliberations. On June 13, 2017, the Committee recommended that the Board approve the continuation of the Management Agreement. On June 14, 2017, the Board, including the Independent Trustees, voting separately, unanimously approved the continuation of the Management Agreement for the Fund.
The Committee and the Board considered all information that they, their legal counsel or the Investment Manager believed reasonably necessary to evaluate and to determine whether to recommend for approval or approve the continuation of the Management Agreement. The information and factors considered by the Committee and the Board in recommending for approval or approving the continuation of the Management Agreement for the Fund included the following:
| • | Information on the investment performance of the Fund relative to the performance of a group of mutual funds determined to be comparable to the Fund by an independent third-party data provider, as well as performance relative to benchmarks; |
| • | Information on the Fund’s management fees and total expenses, including information comparing the Fund’s expenses to those of a group of comparable mutual funds, as determined by the independent third-party data provider; |
| • | The Investment Manager’s agreement to contractually limit or cap total operating expenses for the Fund through December 31, 2018 so that total operating expenses (excluding certain fees and expenses, such as transaction costs and certain other investment related expenses, interest, taxes, acquired fund fees and expenses, and infrequent and/or unusual expenses) would not exceed a specified annual rate, as a percentage of the Fund’s net assets; |
| • | The terms and conditions of the Management Agreement; |
| • | The current and proposed terms and conditions of other agreements and arrangements with affiliates of the Investment Manager relating to the operations of the Fund, including agreements with respect to the provision of distribution, transfer agency and shareholder services to the Fund; |
| • | Descriptions of various functions performed by the Investment Manager under the Management Agreement, including portfolio management and portfolio trading practices; |
| • | Information regarding the management fees of similarly-managed portfolios of other clients of the Investment Manager, including institutional separate accounts; |
| • | Information regarding the reputation, regulatory history and resources of the Investment Manager, including information regarding senior management, portfolio managers and other personnel; |
| 38 | Columbia Global Dividend Opportunity Fund | Annual Report 2017 |
Board Consideration and Approval of Management
Agreement (continued)
| • | Information regarding the capabilities of the Investment Manager with respect to compliance monitoring services, including an assessment of the Investment Manager’s compliance system by the Fund’s Chief Compliance Officer; and |
| • | The profitability to the Investment Manager and its affiliates from their relationships with the Fund. |
Nature, extent and quality of services provided under the Management Agreement
The Committee and the Board considered the nature, extent and quality of services provided to the Fund by the Investment Manager and its affiliates under the Management Agreement and under separate agreements for the provision of transfer agency and shareholder services, and the resources dedicated to the Fund and the other Columbia Funds by the Investment Manager and its affiliates. The Committee and the Board considered, among other things, the Investment Manager’s ability to attract, motivate and retain highly qualified research, advisory and supervisory investment professionals (including compensation programs for personnel involved in fund management, reputation and other attributes), the portfolio management services provided by those investment professionals, and the quality of the Investment Manager’s investment research capabilities and trade execution services. The Committee and the Board also considered the potential benefits to shareholders of investing in a mutual fund that is part of a fund complex offering exposure to a variety of asset classes and investment disciplines and providing a variety of fund and shareholder services.
The Committee and the Board also considered the professional experience and qualifications of the senior personnel of the Investment Manager, which included consideration of the Investment Manager’s experience with similarly-structured funds. The Committee and the Board noted the compliance programs of and the compliance-related resources provided to the Fund by the Investment Manager and its affiliates, and considered the Investment Manager’s ability to provide administrative services to the Fund and coordinate the activities of the Fund’s other service providers. After reviewing these and related factors, the Committee and the Board concluded, within the context of their overall conclusions, that the nature, extent and quality of the services provided to the Fund under the Management Agreement supported the continuation of the Management Agreement.
Investment performance
The Committee and the Board reviewed information about the performance of the Fund over various time periods, including performance information relative to benchmarks and information that compared the performance of the Fund to the performance of a group of comparable mutual funds as determined by the independent third-party data provider, and data provided by the independent fee consultant. The Committee and the Board also reviewed a description of the third party’s methodology for identifying the Fund’s peer groups for purposes of performance and expense comparisons. Although the Fund’s performance lagged that of a relevant peer group for certain (although not necessarily all) periods, the Committee and the Board concluded that other factors relevant to performance were sufficient, in light of other considerations, to warrant continuation of the Management Agreement. Those factors included one or more of the following: (i) that the Fund’s performance, although lagging in certain recent periods, was stronger over the longer term; (ii) that the underperformance was attributable, to a significant extent, to investment decisions that were reasonable and consistent with the Fund’s investment strategy and policies and that the Fund was performing within a reasonable range of expectations, given those investment decisions, market conditions and the Fund’s investment strategy; (iii) that the Fund’s performance was competitive when compared to other relevant performance benchmarks or peer groups; and (iv) that the Investment Manager had taken or was taking steps designed to help improve the Fund’s investment performance, including, but not limited to, replacing portfolio managers, enhancing the resources supporting the portfolio managers, or modifying investment strategies.
The Committee and the Board noted that, through December 31, 2016, the Fund’s performance was in the sixty-fourth, eighty-fourth and eighty-fifth percentile (where the best performance would be in the first percentile) of its category selected by the independent third-party data provider for the purposes of performance comparisons for the one-, three- and five-year periods, respectively.
The Committee and the Board also considered the Investment Manager’s performance and reputation generally, the Investment Manager’s historical responsiveness to Board concerns about performance, and the Investment Manager’s willingness to take steps intended to improve performance. After reviewing these and related factors, the Committee and the Board concluded, within the context of their overall conclusions, that the performance of the Fund and the Investment Manager was sufficient, in light of other considerations, to warrant the continuation of the Management Agreement.
Columbia Global Dividend Opportunity Fund | Annual Report 2017
| 39 |
Board Consideration and Approval of Management
Agreement (continued)
Investment management fee rates and other expenses
The Committee and the Board considered the management fees charged to the Fund under the Management Agreement as well as the total expenses incurred by the Fund. In assessing the reasonableness of the fees under the Management Agreement, the Committee and the Board considered, among other information, the Fund’s total expense ratio as a percentage of average daily net assets. The Committee and the Board considered data provided by the independent third-party data provider and the independent fee consultant. The Committee and the Board noted that, as of December 31, 2016, the Fund’s actual management fee and net total expense ratio are ranked in the second and fifth quintiles, respectively, (where the lowest fees and expenses would be in the first quintile) against the Fund’s expense universe as determined by the independent third-party data provider for purposes of expense comparison. The Committee and the Board also took into account the fee waiver and expense limitation arrangements agreed to by the Investment Manager, as noted above.
The Committee and the Board also received and considered information about the management fees charged by the Investment Manager to institutional separate accounts. In considering the fees charged to those accounts, the Committee and the Board took into account, among other things, the Investment Manager’s representations about the differences between managing mutual funds as compared to other types of accounts, including differences in the services provided, differences in the risk profile of such business for the Investment Manager and the additional resources required to manage mutual funds effectively. The Committee and the Board also received and considered information about the fees charged by the Investment Manager for sub-advisory services it provides to comparable unaffiliated funds. In evaluating the Fund’s management fees, the Committee and the Board also took into account the demands, complexity and quality of the investment management of the Fund.
After reviewing these and related factors, the Committee and the Board concluded, within the context of their overall conclusions, that the management fee rates and expenses of the Fund, in light of other considerations, warranted the continuation of the Management Agreement.
Costs of services provided and profitability
The Committee and the Board also took note of the costs the Investment Manager and its affiliates incur in connection with the services provided and the profitability to the Investment Manager and its affiliates from their relationships with the Fund.
The Committee and the Board also considered the compensation directly or indirectly received by the Investment Manager’s affiliates in connection with their relationships with the Fund. The Committee and the Board reviewed information provided by management as to the profitability to the Investment Manager and its affiliates of their relationships with the Fund, information about the allocation of expenses used to calculate profitability, and comparisons of profitability levels realized in 2016 to profitability levels realized in 2015. When reviewing profitability, the Committee and the Board also considered court cases in which adviser profitability was an issue in whole or in part, the performance of similarly managed funds, the performance of the Fund, and the expense ratio of the Fund. In addition, the Committee and the Board considered information provided by the Investment Manager regarding the Investment Manager’s financial condition and comparing its profitability to that of other asset management firms that are, or are subsidiaries of, publicly traded companies. In this regard, the Committee and the Board also considered data provided by the independent fee consultant.
After reviewing these and related factors, the Committee and the Board concluded, within the context of their overall conclusions, that the costs of services provided and the profitability to the Investment Manager and its affiliates from their relationships with the Fund supported the continuation of the Management Agreement.
Economies of scale
The Committee and the Board considered the potential existence of economies of scale in the provision by the Investment Manager of services to the Fund, to groups of related funds, and to the Investment Manager’s investment advisory clients as a whole, and whether those economies of scale were shared with the Fund through breakpoints in investment management fees or other means, such as expense limitation arrangements and additional investments by the Investment Manager in investment, trading, compliance and other resources. The Committee and the Board noted that the management fee schedules for the Fund contained breakpoints that would reduce the fee rate on assets above specified threshold levels.
| 40 | Columbia Global Dividend Opportunity Fund | Annual Report 2017 |
Board Consideration and Approval of Management
Agreement (continued)
In considering these matters, the Committee and the Board also considered the costs of the services provided and the profitability to the Investment Manager and its affiliates from their relationships with the Fund, as discussed above. After reviewing these and related factors, the Committee and the Board concluded, within the context of their overall conclusions, that the extent to which any economies of scale were expected to be shared with the Fund supported the continuation of the Management Agreement.
Other benefits to the Investment Manager
The Committee and the Board received and considered information regarding “fall-out” or ancillary benefits received by the Investment Manager and its affiliates as a result of their relationships with the Fund, such as the engagement of the Investment Manager’s affiliates to provide distribution, transfer agency and shareholder services to the Fund. In this regard, among other matters, the Committee and the Board considered that the Fund’s distributor retains a portion of the distribution fees from the Fund and receives a portion of the sales charges on sales or redemptions of certain classes of shares of the Fund. The Committee and the Board also considered the benefits of research made available to the Investment Manager by reason of brokerage commissions generated by the Fund’s securities transactions, and reviewed information about the Investment Manager’s practices with respect to allocating portfolio transactions for brokerage and research services. The Committee and the Board recognized that the Investment Manager’s profitability would be somewhat lower without these benefits.
Conclusion
The Committee and the Board reviewed all of the above considerations in reaching their decisions to recommend or approve the continuation of the Management Agreement. In their deliberations, the Trustees did not identify any particular information that was all-important or controlling, and individual Trustees may have attributed different weights to the various factors. Based on their evaluation of all factors that they deemed to be material, including those factors described above, and assisted by the advice of independent legal counsel, the Board, including the Independent Trustees, voting separately, unanimously approved the continuation of the Management Agreement.
Columbia Global Dividend Opportunity Fund | Annual Report 2017
| 41 |
The Fund mails one shareholder report to each shareholder address. If you would like more than one report, please call shareholder services at 800.345.6611 and additional reports will be sent to you.
Proxy voting policies and procedures
The policy of the Board of Trustees is to vote the proxies of the companies in which the Fund holds investments consistent with the procedures as stated in the Statement of Additional Information (SAI). You may obtain a copy of the SAI without charge by calling 800.345.6611; contacting your financial intermediary; visiting investor.columbiathreadneedleus.com; or searching the website of the Securities and Exchange Commission (SEC) at sec.gov. Information regarding how the Fund voted proxies relating to portfolio securities is filed with the SEC by August 31st for the most recent 12-month period ending June 30th of that year, and is available without charge by visiting investor.columbiathreadneedleus.com, or searching the website of the SEC at sec.gov.
Quarterly schedule of investments
The Fund files a complete schedule of portfolio holdings with the SEC for the first and third quarters of each fiscal year on Form N-Q. The Fund’s Form N-Q is available on the SEC’s website at sec.gov and may be reviewed and copied at the SEC’s Public Reference Room in Washington, D.C. Information on the operation of the Public Reference Room may be obtained by calling 800.SEC.0330. The Fund’s complete schedule of portfolio holdings, as filed on Form N-Q, can also be obtained without charge, upon request, by calling 800.345.6611.
Additional Fund information
For more information about the Fund, please visit investor.columbiathreadneedleus.com or call 800.345.6611. Customer Service Representatives are available to answer your questions Monday through Friday from 8 a.m. to 7 p.m. Eastern time.
Fund investment manager
Columbia Management Investment Advisers, LLC
225 Franklin Street
Boston, MA 02110
Fund distributor
Columbia Management Investment Distributors, Inc.
225 Franklin Street
Boston, MA 02110
Fund transfer agent
Columbia Management Investment Services Corp.
P.O. Box 8081
Boston, MA 02266-8081
| 42 | Columbia Global Dividend Opportunity Fund | Annual Report 2017 |
[THIS PAGE INTENTIONALLY LEFT BLANK]
[THIS PAGE INTENTIONALLY LEFT BLANK]
[THIS PAGE INTENTIONALLY LEFT BLANK]
Columbia Global Dividend Opportunity Fund
P.O. Box 8081
Boston, MA 02266-8081
Please read and consider the investment objectives, risks, charges and expenses for any fund carefully before investing. For a prospectus and summary prospectus, which contains this and other important information about the Fund, go to
investor.columbiathreadneedleus.com. The Fund is distributed by Columbia Management Investment Distributors, Inc., member FINRA, and managed by Columbia Management Investment Advisers, LLC.
Columbia Threadneedle Investments (Columbia Threadneedle) is the global brand name of the Columbia and Threadneedle group of companies. All rights reserved. Columbia Management Investment Distributors, Inc., 225 Franklin Street, Boston, MA 02110-2804
© 2017 Columbia Management Investment Advisers, LLC.
investor.columbiathreadneedleus.com

Annual Report
August 31, 2017
Columbia Global Technology Growth Fund
Not FDIC Insured • No bank guarantee • May lose value
Dear Shareholders,
The current outlook for financial markets is clouded by two primary concerns: the high valuation of equities and the direction of interest rates. Following the U.S. presidential election, U.S. equities rallied based on the assumption that the new administration’s policies would stimulate growth quickly. Unfortunately it’s unclear whether those measures will get passed, much less passed quickly. In fixed income, uncertainty stems from the possibility that interest rates won’t rise as rapidly as expected if the administration’s proposed growth policies are not implemented.
Given this uncertainty, investors value a consistent approach more than ever. Investors want strong, repeatable risk-adjusted returns. Consistency — not surprises. As a leading global asset manager, we believe our consistent, collaborative investment approach enables us to deliver the dependable experience your portfolio demands. So, how do we strive to deliver a consistent investment experience?
Better insights
Your portfolio benefits from the investment insights uncovered by our talented investment teams around the world.
Better decisions
Our collaborative, interactive environment enables our investment teams to construct portfolios that take advantage of the best investment ideas.
Better outcomes
We aim to deliver a consistent experience, which means fewer surprises, dependable insights, and products designed to do the thing you want.
Whether you’re trying to save money to help your children go to college or for your own retirement, it’s the consistency of the return that is most essential. People who chase higher returns are usually also the first to sell when that investment goes through a bad patch. We try to combat this behavioral tendency by offering strategies that aim for a more consistent return. Our goal is for investors to panic less during periods of volatility, which can have a significant effect on their long-term results.
Nothing is more important to us than making sure those who have entrusted us to protect and grow their assets can do what matters most to them: build a nest egg, leave a legacy, and live confidently — now and throughout retirement. It’s why our talented professionals around the world work together to uncover uncommon opportunities and why our process encourages challenge and debate around our most compelling ideas to ensure better informed investment decisions, which hopefully lead to better outcomes for you.
Your success is our priority. Talk to your financial advisor about how working with Columbia Threadneedle Investments may help you position your portfolio for consistent, sustainable outcomes, no matter the market conditions.
Sincerely,
Christopher O. Petersen
President, Columbia Funds
Investors should consider the investment objectives, risks, charges and expenses of a mutual fund carefully before investing. For a free prospectus and summary prospectus, which contains this and other important information about a fund, visit investor.columbiathreadneedleus.com. The prospectus should be read carefully before investing.
Columbia Funds are distributed by Columbia Management Investment Distributors, Inc., member FINRA, and managed by Columbia Management Investment Advisers, LLC.
© 2017 Columbia Management Investment Advisers, LLC. All rights reserved.
Columbia Global Technology Growth Fund | Annual Report 2017
Columbia Global Technology Growth Fund | Annual Report 2017
Investment objective
Columbia Global Technology Growth Fund (the Fund) seeks capital appreciation by investing, under normal market conditions, at least 80% of its total net assets (plus any borrowings for investment purposes) in stocks of technology companies that may benefit from technological improvements, advancements or developments.
Portfolio management
Rahul Narang
Manager
Managed Fund since 2012
Morningstar style boxTM
The Morningstar Style Box is based on a fund’s portfolio holdings. For equity funds, the vertical axis shows the market capitalization of the stocks owned, and the horizontal axis shows investment style (value, blend, or growth). Information shown is based on the most recent data provided by Morningstar.
© 2017 Morningstar, Inc. All rights reserved. The Morningstar information contained herein: (1) is proprietary to Morningstar and/or its content providers; (2) may not be copied or distributed; and (3) is not warranted to be accurate, complete or timely. Neither Morningstar nor its content providers are responsible for any damages or losses arising from any use of this information.
| Average annual total returns (%) (for the period ended August 31, 2017) |
| | | Inception | 1 Year | 5 Years | 10 Years |
| Class A | Excluding sales charges | 11/01/02 | 35.41 | 22.98 | 10.70 |
| | Including sales charges | | 27.64 | 21.54 | 10.05 |
| Class C | Excluding sales charges | 10/13/03 | 34.39 | 22.06 | 9.87 |
| | Including sales charges | | 33.39 | 22.06 | 9.87 |
| Class R4* | 11/08/12 | 35.77 | 23.30 | 10.97 |
| Class R5* | 11/08/12 | 35.84 | 23.45 | 11.04 |
| Class Y* | 03/01/16 | 35.96 | 23.35 | 11.00 |
| Class Z | 11/09/00 | 35.75 | 23.29 | 10.97 |
| BofAML 100 Technology Index | | 27.87 | 18.39 | 8.42 |
Returns for Class A shares are shown with and without the maximum initial sales charge of 5.75%. Returns for Class C shares are shown with and without the 1.00% contingent deferred sales charge for the first year only. The Fund’s other share classes are not subject to sales charges and have limited eligibility. Please see the Fund’s prospectus for details. Performance for different share classes will vary based on differences in sales charges and fees associated with each share class. All results shown assume reinvestment of distributions during the period. Returns do not reflect the deduction of taxes that a shareholder may pay on Fund distributions or on the redemption of Fund shares. Performance results reflect the effect of any fee waivers or reimbursements of Fund expenses by Columbia Management Investment Advisers, LLC and/or any of its affiliates. Absent these fee waivers or expense reimbursement arrangements, performance results would have been lower.
The performance information shown represents past performance and is not a guarantee of future results. The investment return and principal value of your investment will fluctuate so that your shares, when redeemed, may be worth more or less than their original cost. Current performance may be lower or higher than the performance information shown. You may obtain performance information current to the most recent month-end by contacting your financial intermediary, visiting investor.columbiathreadneedleus.com or calling 800.345.6611.
| * | The returns shown for periods prior to the share class inception date (including returns for the Life of the Fund, if shown, which are since Fund inception) include the returns of the Fund’s oldest share class. These returns are adjusted to reflect any higher class-related operating expenses of the newer share classes, as applicable. Please visit investor.columbiathreadneedleus.com/investment-products/mutual-funds/appended-performance for more information. |
The Bank of America Merrill Lynch (BofAML) 100 Technology Index is an unmanaged equally weighted index of 100 leading technology stocks.
Indices are not available for investment, are not professionally managed and do not reflect sales charges, fees, brokerage commissions, taxes or other expenses of investing. Securities in the Fund may not match those in an index.
| 2 | Columbia Global Technology Growth Fund | Annual Report 2017 |
Fund at a Glance (continued)
Performance of a hypothetical $10,000 investment (August 31, 2007 — August 31, 2017)
The chart above shows the change in value of a hypothetical $10,000 investment in Class A shares of Columbia Global Technology Growth Fund during the stated time period, and does not reflect the deduction of taxes that a shareholder may pay on Fund distributions or on the redemption of Fund shares.
| Top 10 holdings (%) (at August 31, 2017) |
| Apple, Inc. (United States) | 5.3 |
| Alphabet, Inc., Class A (United States) | 4.9 |
| Facebook, Inc., Class A (United States) | 4.0 |
| Amazon.com, Inc. (United States) | 3.5 |
| Microsoft Corp. (United States) | 3.3 |
| Lam Research Corp. (United States) | 3.0 |
| Broadcom Ltd. (Singapore) | 2.9 |
| Visa, Inc., Class A (United States) | 2.5 |
| Alibaba Group Holding Ltd., ADR (China) | 2.2 |
| Micron Technology, Inc. (United States) | 2.1 |
Percentages indicated are based upon total investments (excluding Money Market Funds).
For further detail about these holdings, please refer to the section entitled “Portfolio of Investments.”
Fund holdings are as of the date given, are subject to change at any time, and are not recommendations to buy or sell any security.
| Equity sector breakdown (%) (at August 31, 2017) |
| Consumer Discretionary | 6.9 |
| Health Care | 0.2 |
| Industrials | 0.5 |
| Information Technology | 91.4 |
| Real Estate | 1.0 |
| Total | 100.0 |
Percentages indicated are based upon total equity investments. The Fund’s portfolio composition is subject to change.
| Country breakdown (%) (at August 31, 2017) |
| China | 5.2 |
| Finland | 0.3 |
| Guernsey | 0.7 |
| Israel | 1.3 |
| Japan | 0.9 |
| Netherlands | 2.6 |
| Singapore | 3.3 |
| South Africa | 0.2 |
| South Korea | 1.2 |
| Switzerland | 1.3 |
| Taiwan | 1.5 |
| United States(a) | 81.5 |
| Total | 100.0 |
| (a) | Includes investments in Money Market Funds. |
Country breakdown is based primarily on issuer’s place of organization/incorporation. Percentages indicated are based upon total investments. The Fund’s portfolio composition is subject to change.
The Fund may use place of organization/incorporation or other factors in determining whether an issuer is domestic (U.S.) or foreign for purposes of its investment policies. At August 31, 2017, the Fund invested at least 40% of its net assets in foreign companies in accordance with its principal investment strategy.
Columbia Global Technology Growth Fund | Annual Report 2017
| 3 |
Manager Discussion of Fund Performance
For the 12-month period that ended August 31, 2017, the Fund’s Class A shares returned 35.41% excluding sales charges. The Fund outperformed its benchmark, the BofA Merrill Lynch 100 Technology Index, which returned 27.87%. Stock selection and allocation decisions figured into the Fund’s significant performance advantage over its benchmark.
Global equity markets delivered solid gains
World events, political uncertainty and mixed economic data were enough to keep investors off balance early in the 12-month period, as financial markets moved sharply in reaction to each significant change on the world stage. However, the end of a contentious U.S. presidential contest in November 2016 eliminated one key element of uncertainty, and a pickup in global growth early in 2017 further bolstered investor confidence.
While central banks outside the United States generally maintained supportive monetary policies, the U.S. Federal Reserve (Fed) raised the target range of its benchmark short-term interest rate three times during the period, bringing it to between 1.00% and 1.25% in June 2017. The Fed signaled that it was prepared to raise rates more aggressively on the heels of strong job gains and progress towards its 2.0% inflation target, creating expectations that the June rate hike may not be the last during the calendar year.
Against this backdrop, we increased the Fund’s global exposure. We continued to find companies with strong business models headquartered outside the United States. We added to the Fund’s position in Tencent, based in China, and established a new position in South Korean conglomerate Samsung, in addition to other names that fit the Fund’s rigorous criteria.
Contributors and detractors
In the technology hardware segment, an overweight combined with prudent stock selection drove the Fund’s outperformance. A sizeable position in Apple made a substantial contribution to the Fund’s return for the period. Shares of the technology giant rose as the market anticipated the launch of new versions of its flagship iPhone — the iPhone 8 and iPhone X. Incremental cash returns in light of tax reform rhetoric from the new administration gave investors even more to cheer about, as Apple continued to grow its service business at a healthy clip. Core holding Microsoft was a standout performer in the systems software segment, as the company continued its transition to becoming a major cloud and subscription revenue power house while controlling expenses. Stock selection and an overweight in the semiconductors segment also aided relative results. Memory chipmaker Micron Technology was a significant contributor. Micron’s earnings expanded off a cyclical low as the company benefited from reduced component costs for its products. Shares of NVIDIA more than doubled over the one-year period, as investors came to understand that the company has claimed its stake as the industry standard for building artificial intelligence (AI) applications. NVIDIA makes semiconductor chips for high growth applications, including data centers, autonomous driving and gaming. The company’s expertise in machine learning applications drove several quarters of above-consensus revenue and earnings growth. An underweight in IT services also aided relative results, as the industry’s performance lagged the technology sector overall. Stock selection in IT services produced better results for the Fund than the benchmark.
Despite a period of strong gains and solid outperformance, the year was not without its challenges. Sabre, which provides technology solutions for the travel industry, suffered from execution issues and macro-related weakness during the year. Softening air traffic volumes combined with a cyber security incident resulted in weak margins and a declining earnings outlook. Shares of cybersecurity disruptor Palo Alto Networks fell as the company modified its go-to market strategy as a result of reduced productivity from its salesforce. We sold the stock. Shares of semiconductor player Qualcomm fell sharply during the year, as the company came under legal scrutiny related to ownership of its intellectual property assets. Competing companies alleged that royalties paid for Qualcomm’s underlying technology were unfair.
Our investment process
In constructing the Fund’s portfolio, we seek to invest in companies with sustainable competitive advantages, high barriers to entry and scale and strong returns on assets and earnings, regardless of market capitalization or geographic location. We look for innovative firms with excellent management teams. We gravitate to “moat” type businesses which could come in the form of cost advantage, high switching costs, strong intellectual property, durable brand, global scale, pricing power, network effects and a durable platform. (A "moat" is the competitive advantage a company has over other businesses in its industry.
| 4 | Columbia Global Technology Growth Fund | Annual Report 2017 |
Manager Discussion of Fund Performance (continued)
The wider the moat, the larger and most sustainable the competitive advantage over other firms.) Facebook, Alphabet, Visa and Apple are all examples of companies that have created substantial moats. We avoid businesses in secular decline and with weak balance sheets. Technology is typically thought of as a growth sector. However, the Fund includes both growth and value stocks because we believe a balanced approach is appropriate.
Current holdings reflect our confidence in the broadening reach of technology. In 2017, technology companies made up 40% of the world’s top 20 companies, and 100% of the top five, measured by market cap. We believe AI has the potential to be one of the largest drivers of technology spending over the next decade. Computing power is very important, but we believe that algorithms are the “secret sauce.” AI technologies are key components of speech recognition, search, connected home devices (such as Alexa), self-driving cars and many other applications. In an industry as seemingly mundane as financial payments, we see China at the forefront of innovation with Tencent and Alibaba. The Fund’s overweight in semiconductors recognizes the sector’s reduced reliance on the personal computer market and its expansion into smart phones, automobiles, appliances and more. The Fund remained overweight in the internet sector, as global leaders continued to scale, innovate and drive user engagement.
Market risk may affect a single issuer, sector of the economy, industry or the market as a whole. The products of technology companies may be subject to severe competition and rapid obsolescence, and technology stocks may be subject to greater price fluctuations. Growth securities, at times, may not perform as well as value securities or the stock market in general and may be out of favor with investors. Foreign investments subject the Fund to risks, including political, economic, market, social and others within a particular country, as well as to currency instabilities and less stringent financial and accounting standards generally applicable to U.S. issuers. Risks are enhanced for emerging market issuers. See the Fund’s prospectus for more information on these and other risks.
The views expressed in this report reflect the current views of the respective parties. These views are not guarantees of future performance and involve certain risks, uncertainties and assumptions that are difficult to predict, so actual outcomes and results may differ significantly from the views expressed. These views are subject to change at any time based upon economic, market or other conditions and the respective parties disclaim any responsibility to update such views. These views may not be relied on as investment advice and, because investment decisions for a Columbia fund are based on numerous factors, may not be relied on as an indication of trading intent on behalf of any particular Columbia fund. References to specific securities should not be construed as a recommendation or investment advice.
Columbia Global Technology Growth Fund | Annual Report 2017
| 5 |
Understanding Your Fund’s Expenses
(Unaudited)
As an investor, you incur two types of costs. There are transaction costs, which generally include sales charges on purchases and may include redemption fees. There are also ongoing costs, which generally include management fees, distribution and/or service fees, and other fund expenses. The following information is intended to help you understand your ongoing costs (in dollars) of investing in the Fund and to help you compare these costs with the ongoing costs of investing in other mutual funds.
Analyzing your Fund’s expenses
To illustrate these ongoing costs, we have provided examples and calculated the expenses paid by investors in each share class of the Fund during the period. The actual and hypothetical information in the table is based on an initial investment of $1,000 at the beginning of the period indicated and held for the entire period. Expense information is calculated two ways and each method provides you with different information. The amount listed in the “Actual” column is calculated using the Fund’s actual operating expenses and total return for the period. You may use the Actual information, together with the amount invested, to estimate the expenses that you paid over the period. Simply divide your account value by $1,000 (for example, an $8,600 account value divided by $1,000 = 8.6), then multiply the results by the expenses paid during the period under the “Actual” column. The amount listed in the “Hypothetical” column assumes a 5% annual rate of return before expenses (which is not the Fund’s actual return) and then applies the Fund’s actual expense ratio for the period to the hypothetical return. You should not use the hypothetical account values and expenses to estimate either your actual account balance at the end of the period or the expenses you paid during the period. See “Compare with other funds” below for details on how to use the hypothetical data.
Compare with other funds
Since all mutual funds are required to include the same hypothetical calculations about expenses in shareholder reports, you can use this information to compare the ongoing cost of investing in the Fund with other funds. To do so, compare the hypothetical example with the 5% hypothetical examples that appear in the shareholder reports of other funds. As you compare hypothetical examples of other funds, it is important to note that hypothetical examples are meant to highlight the ongoing costs of investing in a fund only and do not reflect any transaction costs, such as sales charges, or redemption or exchange fees. Therefore, the hypothetical calculations are useful in comparing ongoing costs only, and will not help you determine the relative total costs of owning different funds. If transaction costs were included in these calculations, your costs would be higher.
| March 1, 2017 — August 31, 2017 |
| | Account value at the
beginning of the
period ($) | Account value at the
end of the
period ($) | Expenses paid during
the period ($) | Fund’s annualized
expense ratio (%) |
| | Actual | Hypothetical | Actual | Hypothetical | Actual | Hypothetical | Actual |
| Class A | 1,000.00 | 1,000.00 | 1,178.50 | 1,018.60 | 7.19 | 6.67 | 1.31 |
| Class C | 1,000.00 | 1,000.00 | 1,174.00 | 1,014.82 | 11.29 | 10.46 | 2.06 |
| Class R4 | 1,000.00 | 1,000.00 | 1,180.30 | 1,019.86 | 5.83 | 5.40 | 1.06 |
| Class R5 | 1,000.00 | 1,000.00 | 1,180.40 | 1,020.27 | 5.39 | 4.99 | 0.98 |
| Class Y | 1,000.00 | 1,000.00 | 1,180.80 | 1,020.52 | 5.11 | 4.74 | 0.93 |
| Class Z | 1,000.00 | 1,000.00 | 1,180.10 | 1,019.86 | 5.82 | 5.40 | 1.06 |
Expenses paid during the period are equal to the annualized expense ratio for each class as indicated above, multiplied by the average account value over the period and then multiplied by the number of days in the Fund’s most recent fiscal half year and divided by 365.
Expenses do not include fees and expenses incurred indirectly by the Fund from its investment in underlying funds, including affiliated and non-affiliated pooled investment vehicles, such as mutual funds and exchange-traded funds.
| 6 | Columbia Global Technology Growth Fund | Annual Report 2017 |
Portfolio of Investments
August 31, 2017
(Percentages represent value of investments compared to net assets)
| Common Stocks 98.0% |
| Issuer | Shares | Value ($) |
| China 5.2% |
| Alibaba Group Holding Ltd., ADR(a) | 100,948 | 17,336,810 |
| Baidu, Inc., ADR(a) | 24,524 | 5,592,698 |
| Ctrip.com International Ltd., ADR(a) | 51,266 | 2,637,636 |
| NetEase, Inc., ADR | 13,122 | 3,619,572 |
| Tencent Holdings Ltd. | 223,000 | 9,383,768 |
| Weibo Corp., ADR(a) | 40,902 | 4,135,192 |
| Total | 42,705,676 |
| Finland 0.3% |
| Nokia OYJ, ADR | 413,933 | 2,558,106 |
| Guernsey 0.7% |
| Amdocs Ltd. | 81,485 | 5,279,413 |
| Israel 1.3% |
| Check Point Software Technologies Ltd.(a) | 52,955 | 5,924,076 |
| CyberArk Software Ltd.(a) | 44,575 | 1,783,446 |
| Orbotech Ltd.(a) | 65,342 | 2,596,691 |
| Total | 10,304,213 |
| Japan 0.9% |
| Keyence Corp. | 8,300 | 4,327,269 |
| Renesas Electronics Corp.(a) | 307,100 | 3,092,086 |
| Total | 7,419,355 |
| Netherlands 2.6% |
| ASML Holding NV | 44,793 | 7,001,594 |
| NXP Semiconductors NV(a) | 72,283 | 8,165,087 |
| STMicroelectronics NV, Registered Shares | 372,211 | 6,491,360 |
| Total | 21,658,041 |
| Singapore 3.3% |
| Broadcom Ltd. | 91,609 | 23,091,881 |
| Flex Ltd.(a) | 241,645 | 3,931,564 |
| Total | 27,023,445 |
| South Africa 0.2% |
| MiX Telematics Ltd., ADR | 196,462 | 1,903,717 |
| South Korea 1.2% |
| Samsung Electronics Co., Ltd. | 4,575 | 9,417,689 |
| Switzerland 1.3% |
| Landis+Gyr Group AG(a) | 28,879 | 2,227,021 |
| TE Connectivity Ltd. | 59,833 | 4,762,707 |
| Common Stocks (continued) |
| Issuer | Shares | Value ($) |
| VAT Group AG | 29,385 | 3,759,883 |
| Total | 10,749,611 |
| Taiwan 1.5% |
| FIT Hon Teng Ltd.(a) | 2,980,000 | 2,547,513 |
| Taiwan Semiconductor Manufacturing Co., Ltd., ADR | 273,026 | 10,093,771 |
| Total | 12,641,284 |
| United States 79.5% |
| Accenture PLC, Class A | 51,531 | 6,738,194 |
| Activision Blizzard, Inc. | 186,277 | 12,212,320 |
| Adobe Systems, Inc.(a) | 61,083 | 9,477,638 |
| Advanced Micro Devices, Inc.(a) | 210,636 | 2,738,268 |
| Akamai Technologies, Inc.(a) | 50,517 | 2,381,877 |
| Alphabet, Inc., Class A(a) | 41,242 | 39,396,008 |
| Amazon.com, Inc.(a) | 28,863 | 28,303,058 |
| Amphenol Corp., Class A | 92,432 | 7,481,446 |
| Analog Devices, Inc. | 61,852 | 5,175,157 |
| ANSYS, Inc.(a) | 13,007 | 1,675,562 |
| Apple, Inc. | 259,746 | 42,598,344 |
| Applied Materials, Inc. | 284,874 | 12,853,515 |
| Applied Optoelectronics, Inc.(a) | 12,266 | 725,166 |
| Autodesk, Inc.(a) | 53,067 | 6,074,049 |
| Automatic Data Processing, Inc. | 27,090 | 2,884,272 |
| Blackhawk Network Holdings, Inc.(a) | 4,472 | 200,346 |
| CA, Inc. | 42,454 | 1,408,624 |
| Cavium, Inc.(a) | 39,843 | 2,522,460 |
| CDW Corp. | 69,480 | 4,406,422 |
| Cisco Systems, Inc. | 277,176 | 8,927,839 |
| Citrix Systems, Inc.(a) | 33,868 | 2,648,816 |
| Cognizant Technology Solutions Corp., Class A | 73,685 | 5,214,687 |
| Coherent, Inc.(a) | 9,241 | 2,156,110 |
| Comcast Corp., Class A | 191,476 | 7,775,840 |
| Corning, Inc. | 107,417 | 3,089,313 |
| DXC Technology Co. | 59,945 | 5,095,325 |
| eBay, Inc.(a) | 124,992 | 4,515,961 |
| Electronic Arts, Inc.(a) | 69,067 | 8,391,640 |
| Electronics for Imaging, Inc.(a) | 92,434 | 3,286,953 |
| Equinix, Inc. | 8,241 | 3,860,167 |
| Expedia, Inc. | 27,588 | 4,092,956 |
| Facebook, Inc., Class A(a) | 184,863 | 31,790,890 |
The accompanying Notes to Financial Statements are an integral part of this statement.
Columbia Global Technology Growth Fund | Annual Report 2017
| 7 |
Portfolio of Investments (continued)
August 31, 2017
| Common Stocks (continued) |
| Issuer | Shares | Value ($) |
| Fidelity National Information Services, Inc. | 61,327 | 5,698,505 |
| Fiserv, Inc.(a) | 45,872 | 5,674,825 |
| FleetCor Technologies, Inc.(a) | 28,831 | 4,145,033 |
| Gartner, Inc.(a) | 34,314 | 4,137,925 |
| Global Payments, Inc. | 7,094 | 677,406 |
| Guidewire Software, Inc.(a) | 44,111 | 3,339,644 |
| Harris Corp. | 50,785 | 6,241,476 |
| HP, Inc. | 356,930 | 6,810,224 |
| Ichor Holdings Ltd.(a) | 210,000 | 4,804,800 |
| Intel Corp. | 181,859 | 6,377,795 |
| International Business Machines Corp. | 13,523 | 1,934,195 |
| Intuit, Inc. | 49,444 | 6,993,854 |
| Juniper Networks, Inc. | 73,491 | 2,037,905 |
| KLA-Tencor Corp. | 54,550 | 5,110,790 |
| Lam Research Corp. | 143,178 | 23,764,684 |
| Lattice Semiconductor Corp.(a) | 228,462 | 1,290,810 |
| Leidos Holdings, Inc. | 34,964 | 2,039,100 |
| Lumentum Holdings, Inc.(a) | 13,440 | 764,064 |
| Marvell Technology Group Ltd. | 118,670 | 2,125,380 |
| MasterCard, Inc., Class A | 60,149 | 8,017,862 |
| Maxim Integrated Products, Inc. | 174,514 | 8,142,823 |
| Microchip Technology, Inc. | 113,626 | 9,862,737 |
| Micron Technology, Inc.(a) | 536,780 | 17,160,857 |
| Microsemi Corp.(a) | 61,750 | 3,110,965 |
| Microsoft Corp. | 357,412 | 26,723,695 |
| Motorola Solutions, Inc. | 63,280 | 5,576,234 |
| NetApp, Inc. | 72,947 | 2,820,131 |
| Netflix, Inc.(a) | 27,896 | 4,873,710 |
| Nuance Communications, Inc.(a) | 223,368 | 3,589,524 |
| NVIDIA Corp. | 97,593 | 16,536,158 |
| Oracle Corp. | 195,798 | 9,854,513 |
| PayPal Holdings, Inc.(a) | 110,848 | 6,837,105 |
| Power Integrations, Inc. | 26,552 | 1,934,313 |
| Priceline Group, Inc. (The)(a) | 4,093 | 7,580,563 |
| PTC, Inc.(a) | 27,067 | 1,515,752 |
| QUALCOMM, Inc. | 64,629 | 3,378,158 |
| Red Hat, Inc.(a) | 47,713 | 5,129,148 |
| Redfin Corp.(a) | 47,846 | 1,066,487 |
| Common Stocks (continued) |
| Issuer | Shares | Value ($) |
| Sabre Corp. | 121,266 | 2,236,145 |
| Salesforce.com, Inc.(a) | 118,913 | 11,355,002 |
| SBA Communications Corp.(a) | 20,703 | 3,178,946 |
| Seagate Technology PLC | 37,115 | 1,170,236 |
| ServiceNow, Inc.(a) | 48,199 | 5,600,242 |
| Silicon Laboratories, Inc.(a) | 39,930 | 3,030,687 |
| Skyworks Solutions, Inc. | 54,791 | 5,772,780 |
| SMART Global Holdings, Inc.(a) | 153,736 | 3,054,734 |
| Splunk, Inc.(a) | 38,657 | 2,593,498 |
| Symantec Corp. | 111,970 | 3,356,861 |
| Synopsys, Inc.(a) | 143,076 | 11,506,172 |
| Tableau Software, Inc., Class A(a) | 37,130 | 2,691,182 |
| Texas Instruments, Inc. | 104,813 | 8,680,613 |
| Total System Services, Inc. | 120,807 | 8,350,180 |
| Trimble Navigation Ltd.(a) | 63,049 | 2,438,735 |
| Universal Display Corp. | 16,540 | 2,102,234 |
| Vantiv, Inc., Class A(a) | 40,582 | 2,868,742 |
| Veeva Systems Inc., Class A(a) | 35,756 | 2,127,482 |
| VeriSign, Inc.(a) | 47,894 | 4,969,003 |
| Visa, Inc., Class A | 192,670 | 19,945,198 |
| VMware, Inc., Class A(a) | 39,887 | 4,311,785 |
| Western Digital Corp. | 116,756 | 10,306,052 |
| Workday, Inc., Class A(a) | 26,186 | 2,872,342 |
| Xilinx, Inc. | 97,591 | 6,446,861 |
| Zendesk, Inc.(a) | 81,226 | 2,225,592 |
| Total | 650,969,677 |
Total Common Stocks
(Cost $503,055,119) | 802,630,227 |
|
| Money Market Funds 2.2% |
| | Shares | Value ($) |
| Columbia Short-Term Cash Fund, 1.146%(b),(c) | 17,826,930 | 17,826,930 |
Total Money Market Funds
(Cost $17,825,879) | 17,826,930 |
Total Investments
(Cost $520,880,998) | 820,457,157 |
| Other Assets & Liabilities, Net | | (1,405,030) |
| Net Assets | $819,052,127 |
The accompanying Notes to Financial Statements are an integral part of this statement.
| 8 | Columbia Global Technology Growth Fund | Annual Report 2017 |
Portfolio of Investments (continued)
August 31, 2017
Notes to Portfolio of Investments
| (a) | Non-income producing investment. |
| (b) | The rate shown is the seven-day current annualized yield at August 31, 2017. |
| (c) | As defined in the Investment Company Act of 1940, an affiliated company is one in which the Fund owns 5% or more of the company’s outstanding voting securities, or a company which is under common ownership or control with the Fund. Holdings and transactions in these affiliated companies during the year ended August 31, 2017 are as follows: |
| Issuer | Beginning
shares | Shares
purchased | Shares
sold | Ending
shares | Realized gain
(loss) ($) | Net change in
unrealized
appreciation
(depreciation) ($) | Dividends —
affiliated
issuers($) | Value ($) |
| Columbia Short-Term Cash Fund, 1.146% | 6,995,170 | 163,255,902 | (152,424,142) | 17,826,930 | (584) | 1,051 | 78,460 | 17,826,930 |
Abbreviation Legend
| ADR | American Depositary Receipt |
Fair value measurements
The Fund categorizes its fair value measurements according to a three-level hierarchy that maximizes the use of observable inputs and minimizes the use of unobservable inputs by prioritizing that the most observable input be used when available. Observable inputs are those that market participants would use in pricing an investment based on market data obtained from sources independent of the reporting entity. Unobservable inputs are those that reflect the Fund’s assumptions about the information market participants would use in pricing an investment. An investment’s level within the fair value hierarchy is based on the lowest level of any input that is deemed significant to the asset’s or liability’s fair value measurement. The input levels are not necessarily an indication of the risk or liquidity associated with investments at that level. For example, certain U.S. government securities are generally high quality and liquid, however, they are reflected as Level 2 because the inputs used to determine fair value may not always be quoted prices in an active market.
Fair value inputs are summarized in the three broad levels listed below:
| • | Level 1 – Valuations based on quoted prices for investments in active markets that the Fund has the ability to access at the measurement date. Valuation adjustments are not applied to Level 1 investments. |
| • | Level 2 – Valuations based on other significant observable inputs (including quoted prices for similar securities, interest rates, prepayment speeds, credit risks, etc.). |
| • | Level 3 – Valuations based on significant unobservable inputs (including the Fund’s own assumptions and judgment in determining the fair value of investments). |
Inputs that are used in determining fair value of an investment may include price information, credit data, volatility statistics, and other factors. These inputs can be either observable or unobservable. The availability of observable inputs can vary between investments, and is affected by various factors such as the type of investment, and the volume and level of activity for that investment or similar investments in the marketplace. The inputs will be considered by the Investment Manager, along with any other relevant factors in the calculation of an investment’s fair value. The Fund uses prices and inputs that are current as of the measurement date, which may include periods of market dislocations. During these periods, the availability of prices and inputs may be reduced for many investments. This condition could cause an investment to be reclassified between the various levels within the hierarchy.
Foreign equity securities actively traded in markets where there is a significant delay in the local close relative to the New York Stock Exchange are classified as Level 2. The values of these securities may include an adjustment to reflect the impact of significant market movements following the close of local trading, as described in Note 2 to the financial statements – Security valuation.
Certain investments that have been measured at fair value using the net asset value (NAV) per share (or its equivalent) are not categorized in the fair value hierarchy. The fair value amounts presented in the table are intended to reconcile the fair value hierarchy to the amounts presented in the Portfolio of Investments. The Columbia Short-Term Cash Fund seeks to provide shareholders with maximum current income consistent with liquidity and stability of principal. Columbia Short-Term Cash Fund prices its shares with a floating NAV and no longer seeks to maintain a stable NAV.
Investments falling into the Level 3 category are primarily supported by quoted prices from brokers and dealers participating in the market for those investments. However, these may be classified as Level 3 investments due to lack of market transparency and corroboration to support these quoted prices. Additionally, valuation models may be used as the pricing source for any remaining investments classified as Level 3. These models may rely on one or more significant unobservable inputs and/or significant assumptions by the Investment Manager. Inputs used in valuations may include, but are not limited to, financial statement analysis, capital account balances, discount rates and estimated cash flows, and comparable company data.
Under the direction of the Fund’s Board of Trustees (the Board), the Investment Manager’s Valuation Committee (the Committee) is responsible for overseeing the valuation procedures approved by the Board. The Committee consists of voting and non-voting members from various groups within the Investment Manager’s organization, including operations and accounting, trading and investments, compliance, risk management and legal.
The Committee meets at least monthly to review and approve valuation matters, which may include a description of specific valuation determinations, data regarding pricing information received from approved pricing vendors and brokers and the results of Board-approved valuation control policies and procedures (the Policies). The Policies address, among other things, instances when market quotations are or are not readily available, including recommendations of third party pricing vendors and a determination of appropriate pricing methodologies; events that require specific valuation determinations and assessment of fair value techniques; securities with a potential for stale pricing, including those that are illiquid, restricted, or in default; and the effectiveness of third party pricing vendors, including periodic reviews of vendors. The Committee meets more frequently, as needed, to discuss additional valuation matters, which may include the need to review back-testing results, review time-sensitive information or approve related valuation actions. The Committee reports to the Board, with members of the Committee meeting with the Board at each of its regularly scheduled meetings to discuss valuation matters and actions during the period, similar to those described earlier.
The accompanying Notes to Financial Statements are an integral part of this statement.
Columbia Global Technology Growth Fund | Annual Report 2017
| 9 |
Portfolio of Investments (continued)
August 31, 2017
Fair value measurements (continued)
For investments categorized as Level 3, the Committee monitors information similar to that described above, which may include: (i) data specific to the issuer or comparable issuers, (ii) general market or specific sector news and (iii) quoted prices and specific or similar security transactions. The Committee considers this data and any changes from prior periods in order to assess the reasonableness of observable and unobservable inputs, any assumptions or internal models used to value those securities and changes in fair value. This data is also used to corroborate, when available, information received from approved pricing vendors and brokers. Various factors impact the frequency of monitoring this information (which may occur as often as daily). However, the Committee may determine that changes to inputs, assumptions and models are not required as a result of the monitoring procedures performed.
The following table is a summary of the inputs used to value the Fund’s investments at August 31, 2017:
| | Level 1
quoted prices
in active
markets for
identical
assets ($) | Level 2
other
significant
observable
inputs ($) | Level 3
significant
unobservable
inputs ($) | Investments
measured at
net asset
value ($) | Total ($) |
| Investments | | | | | |
| Common Stocks | | | | | |
| China | 33,321,908 | 9,383,768 | — | — | 42,705,676 |
| Finland | 2,558,106 | — | — | — | 2,558,106 |
| Guernsey | 5,279,413 | — | — | — | 5,279,413 |
| Israel | 10,304,213 | — | — | — | 10,304,213 |
| Japan | — | 7,419,355 | — | — | 7,419,355 |
| Netherlands | 21,658,041 | — | — | — | 21,658,041 |
| Singapore | 27,023,445 | — | — | — | 27,023,445 |
| South Africa | 1,903,717 | — | — | — | 1,903,717 |
| South Korea | — | 9,417,689 | — | — | 9,417,689 |
| Switzerland | 4,762,707 | 5,986,904 | — | — | 10,749,611 |
| Taiwan | 10,093,771 | 2,547,513 | — | — | 12,641,284 |
| United States | 650,969,677 | — | — | — | 650,969,677 |
| Total Common Stocks | 767,874,998 | 34,755,229 | — | — | 802,630,227 |
| Money Market Funds | — | — | — | 17,826,930 | 17,826,930 |
| Total Investments | 767,874,998 | 34,755,229 | — | 17,826,930 | 820,457,157 |
See the Portfolio of Investments for all investment classifications not indicated in the table.
The Fund’s assets assigned to the Level 2 input category are generally valued using the market approach, in which a security’s value is determined through reference to prices and information from market transactions for similar or identical assets. These assets include certain foreign securities for which a third party statistical pricing service may be employed for purposes of fair market valuation. The model utilized by such third party statistical pricing service takes into account a security’s correlation to available market data including, but not limited to, intraday index, ADR, and exchange-traded fund movements.
There were no transfers of financial assets between levels during the period.
The accompanying Notes to Financial Statements are an integral part of this statement.
| 10 | Columbia Global Technology Growth Fund | Annual Report 2017 |
Statement of Assets and Liabilities
August 31, 2017
| Assets | |
| Investments in unaffiliated issuers, at cost | $503,055,119 |
| Investments in affiliated issuers, at cost | 17,825,879 |
| Investments in unaffiliated issuers, at value | 802,630,227 |
| Investments in affiliated issuers, at value | 17,826,930 |
| Receivable for: | |
| Capital shares sold | 2,368,657 |
| Dividends | 581,074 |
| Foreign tax reclaims | 1,050 |
| Prepaid expenses | 5,166 |
| Trustees’ deferred compensation plan | 45,722 |
| Total assets | 823,458,826 |
| Liabilities | |
| Payable for: | |
| Investments purchased | 3,768,122 |
| Capital shares purchased | 403,060 |
| Management services fees | 18,918 |
| Distribution and/or service fees | 4,044 |
| Transfer agent fees | 110,493 |
| Compensation of board members | 609 |
| Compensation of chief compliance officer | 50 |
| Other expenses | 55,681 |
| Trustees’ deferred compensation plan | 45,722 |
| Total liabilities | 4,406,699 |
| Net assets applicable to outstanding capital stock | $819,052,127 |
| Represented by | |
| Paid in capital | 497,316,840 |
| Excess of distributions over net investment income | (348,695) |
| Accumulated net realized gain | 22,507,828 |
| Unrealized appreciation (depreciation) on: | |
| Investments - unaffiliated issuers | 299,575,108 |
| Investments - affiliated issuers | 1,051 |
| Foreign currency translations | (5) |
| Total - representing net assets applicable to outstanding capital stock | $819,052,127 |
The accompanying Notes to Financial Statements are an integral part of this statement.
Columbia Global Technology Growth Fund | Annual Report 2017
| 11 |
Statement of Assets and Liabilities (continued)
August 31, 2017
| Class A | |
| Net assets | $228,598,093 |
| Shares outstanding | 7,995,639 |
| Net asset value per share | $28.59 |
| Maximum offering price per share(a) | $30.33 |
| Class C | |
| Net assets | $92,157,828 |
| Shares outstanding | 3,575,014 |
| Net asset value per share | $25.78 |
| Class R4 | |
| Net assets | $13,628,612 |
| Shares outstanding | 453,575 |
| Net asset value per share | $30.05 |
| Class R5 | |
| Net assets | $45,747,485 |
| Shares outstanding | 1,513,217 |
| Net asset value per share | $30.23 |
| Class Y | |
| Net assets | $40,898,786 |
| Shares outstanding | 1,349,486 |
| Net asset value per share | $30.31 |
| Class Z | |
| Net assets | $398,021,323 |
| Shares outstanding | 13,411,945 |
| Net asset value per share | $29.68 |
| (a) | The maximum offering price per share is calculated by dividing the net asset value per share by 1.0 minus the maximum sales charge of 5.75% for Class A. |
The accompanying Notes to Financial Statements are an integral part of this statement.
| 12 | Columbia Global Technology Growth Fund | Annual Report 2017 |
Statement of Operations
Year Ended August 31, 2017
| Net investment income | |
| Income: | |
| Dividends — unaffiliated issuers | $6,288,985 |
| Dividends — affiliated issuers | 78,460 |
| Foreign taxes withheld | (95,489) |
| Total income | 6,271,956 |
| Expenses: | |
| Management services fees | 5,448,440 |
| Distribution and/or service fees | |
| Class A | 469,830 |
| Class B(a) | 1,229 |
| Class C | 753,103 |
| Transfer agent fees | |
| Class A | 281,412 |
| Class B(a) | 192 |
| Class C | 112,440 |
| Class I(b) | 868 |
| Class R4 | 13,823 |
| Class R5 | 16,491 |
| Class Y | 1,786 |
| Class Z | 442,688 |
| Compensation of board members | 28,685 |
| Custodian fees | 17,353 |
| Printing and postage fees | 57,409 |
| Registration fees | 188,278 |
| Audit fees | 34,635 |
| Legal fees | 18,179 |
| Compensation of chief compliance officer | 269 |
| Other | 32,064 |
| Total expenses | 7,919,174 |
| Expense reduction | (240) |
| Total net expenses | 7,918,934 |
| Net investment loss | (1,646,978) |
| Realized and unrealized gain (loss) — net | |
| Net realized gain (loss) on: | |
| Investments — unaffiliated issuers | 30,314,540 |
| Investments — affiliated issuers | (584) |
| Foreign currency translations | (32,610) |
| Net realized gain | 30,281,346 |
| Net change in unrealized appreciation (depreciation) on: | |
| Investments — unaffiliated issuers | 166,604,508 |
| Investments — affiliated issuers | 1,051 |
| Foreign currency translations | (180) |
| Net change in unrealized appreciation (depreciation) | 166,605,379 |
| Net realized and unrealized gain | 196,886,725 |
| Net increase in net assets resulting from operations | $195,239,747 |
| (a) | Effective July 17, 2017, Class B shares were automatically converted to Class A shares. |
| (b) | Effective March 27, 2017, Class I shares were redeemed or exchanged for Class Y shares. |
The accompanying Notes to Financial Statements are an integral part of this statement.
Columbia Global Technology Growth Fund | Annual Report 2017
| 13 |
Statement of Changes in Net Assets
| | Year Ended
August 31, 2017 | Year Ended
August 31, 2016 (a) |
| Operations | | |
| Net investment loss | $(1,646,978) | $(593,007) |
| Net realized gain (loss) | 30,281,346 | (2,740,650) |
| Net change in unrealized appreciation (depreciation) | 166,605,379 | 76,882,766 |
| Net increase in net assets resulting from operations | 195,239,747 | 73,549,109 |
| Distributions to shareholders | | |
| Net realized gains | | |
| Class A | (643,027) | (2,872,767) |
| Class B(b) | (563) | (16,243) |
| Class C | (265,622) | (988,151) |
| Class I(c) | (113,336) | (1,050,912) |
| Class R4 | (20,824) | (208,970) |
| Class R5 | (74,428) | (246,859) |
| Class Y | (2,578) | — |
| Class Z | (848,799) | (3,498,455) |
| Total distributions to shareholders | (1,969,177) | (8,882,357) |
| Increase in net assets from capital stock activity | 102,667,496 | 70,263,003 |
| Total increase in net assets | 295,938,066 | 134,929,755 |
| Net assets at beginning of year | 523,114,061 | 388,184,306 |
| Net assets at end of year | $819,052,127 | $523,114,061 |
| Excess of distributions over net investment income | $(348,695) | $(764,523) |
| (a) | Class Y shares are based on operations from March 1, 2016 (commencement of operations) through the stated period end. |
| (b) | Effective July 17, 2017, Class B shares were automatically converted to Class A shares. |
| (c) | Effective March 27, 2017, Class I shares were redeemed or exchanged for Class Y shares. |
The accompanying Notes to Financial Statements are an integral part of this statement.
| 14 | Columbia Global Technology Growth Fund | Annual Report 2017 |
Statement of Changes in Net Assets (continued)
| | Year Ended | Year Ended |
| | August 31, 2017 | August 31, 2016 (a) |
| | Shares | Dollars ($) | Shares | Dollars ($) |
| Capital stock activity |
| Class A(b) | | | | |
| Subscriptions (c) | 4,781,457 | 117,817,284 | 4,374,319 | 84,281,813 |
| Distributions reinvested | 27,330 | 602,083 | 141,756 | 2,725,965 |
| Redemptions | (4,612,271) | (112,251,153) | (3,854,626) | (72,302,813) |
| Net increase | 196,516 | 6,168,214 | 661,449 | 14,704,965 |
| Class B(b) | | | | |
| Subscriptions | 492 | 10,853 | 1,102 | 20,075 |
| Distributions reinvested | 25 | 507 | 876 | 15,360 |
| Redemptions (c) | (14,679) | (313,385) | (56,400) | (968,447) |
| Net decrease | (14,162) | (302,025) | (54,422) | (933,012) |
| Class C | | | | |
| Subscriptions | 1,439,245 | 31,749,242 | 1,315,029 | 23,084,042 |
| Distributions reinvested | 9,956 | 198,819 | 38,728 | 680,449 |
| Redemptions | (1,025,474) | (22,909,928) | (557,277) | (9,704,458) |
| Net increase | 423,727 | 9,038,133 | 796,480 | 14,060,033 |
| Class I(d) | | | | |
| Subscriptions | 10,072 | 264,513 | 2,141,999 | 42,521,533 |
| Distributions reinvested | 4,723 | 113,296 | 50,419 | 1,050,737 |
| Redemptions | (1,609,322) | (42,630,505) | (2,221,606) | (47,579,454) |
| Net decrease | (1,594,527) | (42,252,696) | (29,188) | (4,007,184) |
| Class R4 | | | | |
| Subscriptions | 605,381 | 15,111,546 | 421,575 | 8,571,397 |
| Distributions reinvested | 901 | 20,824 | 10,386 | 208,970 |
| Redemptions | (478,457) | (11,118,179) | (541,184) | (10,580,589) |
| Net increase (decrease) | 127,825 | 4,014,191 | (109,223) | (1,800,222) |
| Class R5 | | | | |
| Subscriptions | 1,007,560 | 26,885,189 | 601,554 | 12,306,139 |
| Distributions reinvested | 3,202 | 74,416 | 12,212 | 246,806 |
| Redemptions | (325,770) | (8,461,255) | (302,939) | (5,861,084) |
| Net increase | 684,992 | 18,498,350 | 310,827 | 6,691,861 |
| Class Y(d) | | | | |
| Subscriptions | 1,487,235 | 39,172,350 | 33,561 | 723,994 |
| Distributions reinvested | 110 | 2,568 | — | — |
| Redemptions | (168,042) | (4,793,685) | (3,378) | (72,930) |
| Net increase | 1,319,303 | 34,381,233 | 30,183 | 651,064 |
| Class Z | | | | |
| Subscriptions | 6,898,209 | 174,382,444 | 5,624,845 | 112,031,032 |
| Distributions reinvested | 21,544 | 491,843 | 123,140 | 2,446,794 |
| Redemptions | (4,162,793) | (101,752,191) | (3,838,360) | (73,582,328) |
| Net increase | 2,756,960 | 73,122,096 | 1,909,625 | 40,895,498 |
| Total net increase | 3,900,634 | 102,667,496 | 3,515,731 | 70,263,003 |
| (a) | Class Y shares are based on operations from March 1, 2016 (commencement of operations) through the stated period end. |
| (b) | Effective July 17, 2017, Class B shares were automatically converted to Class A shares. |
| (c) | Includes conversions of Class B shares to Class A shares, if any. |
| (d) | Effective March 27, 2017, Class I shares were redeemed or exchanged for Class Y shares. |
The accompanying Notes to Financial Statements are an integral part of this statement.
Columbia Global Technology Growth Fund | Annual Report 2017
| 15 |
The following table is intended to help you understand the Fund’s financial performance. Certain information reflects financial results for a single share of a class held for the periods shown. Per share net investment income (loss) amounts are calculated based on average shares outstanding during the period. Total return assumes reinvestment of all dividends and distributions, if any. Total return does not reflect payment of sales charges, if any. Total return and portfolio turnover are not annualized for periods of less than one year. The portfolio turnover rate is calculated without regard to purchase and sales transactions of short-term instruments and certain derivatives, if any. If such transactions were included, the Fund’s portfolio turnover rate may be higher.
| Year ended | Net asset value,
beginning of
period | Net
investment
income
(loss) | Net
realized
and
unrealized
gain | Total from
investment
operations | Distributions
from net
investment
income | Distributions
from net
realized
gains |
| Class A |
| 8/31/2017 | $21.19 | (0.08) | 7.56 | 7.48 | — | (0.08) |
| 8/31/2016 | $18.36 | (0.04) | 3.22 | 3.18 | — | (0.35) |
| 8/31/2015 | $18.18 | (0.07) | 1.10 | 1.03 | (0.09) | (0.76) |
| 8/31/2014 | $13.47 | (0.09) | 4.80 | 4.71 | — | — |
| 8/31/2013 | $10.87 | (0.04) | 2.64 | 2.60 | — | — |
| Class C |
| 8/31/2017 | $19.26 | (0.24) | 6.84 | 6.60 | — | (0.08) |
| 8/31/2016 | $16.84 | (0.17) | 2.94 | 2.77 | — | (0.35) |
| 8/31/2015 | $16.82 | (0.20) | 1.02 | 0.82 | (0.04) | (0.76) |
| 8/31/2014 | $12.55 | (0.20) | 4.47 | 4.27 | — | — |
| 8/31/2013 | $10.21 | (0.12) | 2.46 | 2.34 | — | — |
The accompanying Notes to Financial Statements are an integral part of this statement.
| 16 | Columbia Global Technology Growth Fund | Annual Report 2017 |
Total
distributions to
shareholders | Net
asset
value,
end of
period | Total
return | Total gross
expense
ratio to
average
net assets(a) | Total net
expense
ratio to
average
net assets(a),(b) | Net investment
income (loss)
ratio to
average
net assets | Portfolio
turnover | Net
assets,
end of
period
(000’s) |
| |
| (0.08) | $28.59 | 35.41% | 1.32% | 1.32% (c) | (0.33%) | 40% | $228,598 |
| (0.35) | $21.19 | 17.52% | 1.36% | 1.36% (c) | (0.21%) | 55% | $165,271 |
| (0.85) | $18.36 | 5.70% | 1.40% | 1.40% (c) | (0.37%) | 60% | $131,079 |
| — | $18.18 | 34.97% | 1.42% | 1.42% (c) | (0.55%) | 68% | $83,656 |
| — | $13.47 | 23.92% | 1.49% | 1.46% (c) | (0.36%) | 135% | $53,711 |
| |
| (0.08) | $25.78 | 34.39% | 2.07% | 2.07% (c) | (1.08%) | 40% | $92,158 |
| (0.35) | $19.26 | 16.65% | 2.12% | 2.12% (c) | (0.97%) | 55% | $60,684 |
| (0.80) | $16.84 | 4.91% | 2.15% | 2.15% (c) | (1.13%) | 60% | $39,660 |
| — | $16.82 | 34.02% | 2.17% | 2.17% (c) | (1.31%) | 68% | $21,775 |
| — | $12.55 | 22.92% | 2.23% | 2.21% (c) | (1.11%) | 135% | $16,791 |
Columbia Global Technology Growth Fund | Annual Report 2017
| 17 |
Financial Highlights (continued)
| Year ended | Net asset value,
beginning of
period | Net
investment
income
(loss) | Net
realized
and
unrealized
gain | Total from
investment
operations | Distributions
from net
investment
income | Distributions
from net
realized
gains |
| Class R4 |
| 8/31/2017 | $22.21 | (0.02) | 7.94 | 7.92 | — | (0.08) |
| 8/31/2016 | $19.19 | 0.01 | 3.36 | 3.37 | — | (0.35) |
| 8/31/2015 | $18.92 | (0.04) | 1.17 | 1.13 | (0.10) | (0.76) |
| 8/31/2014 | $13.99 | (0.06) | 4.99 | 4.93 | — | — |
| 8/31/2013 (d) | $10.73 | (0.03) | 3.29 | 3.26 | — | — |
| Class R5 |
| 8/31/2017 | $22.33 | 0.01 | 7.97 | 7.98 | — | (0.08) |
| 8/31/2016 | $19.26 | 0.03 | 3.39 | 3.42 | — | (0.35) |
| 8/31/2015 | $18.98 | (0.01) | 1.16 | 1.15 | (0.11) | (0.76) |
| 8/31/2014 | $14.00 | (0.01) | 4.99 | 4.98 | — | — |
| 8/31/2013 (f) | $10.73 | 0.00 (g) | 3.27 | 3.27 | — | — |
| Class Y |
| 8/31/2017 | $22.37 | 0.03 | 7.99 | 8.02 | — | (0.08) |
| 8/31/2016 (h) | $19.26 | 0.04 | 3.07 | 3.11 | — | — |
| Class Z |
| 8/31/2017 | $21.94 | (0.02) | 7.84 | 7.82 | — | (0.08) |
| 8/31/2016 | $18.95 | 0.01 | 3.33 | 3.34 | — | (0.35) |
| 8/31/2015 | $18.70 | (0.02) | 1.13 | 1.11 | (0.10) | (0.76) |
| 8/31/2014 | $13.82 | (0.05) | 4.93 | 4.88 | — | — |
| 8/31/2013 | $11.13 | (0.01) | 2.70 | 2.69 | — | — |
| Notes to Financial Highlights |
| (a) | In addition to the fees and expenses that the Fund bears directly, the Fund indirectly bears a pro rata share of the fees and expenses of any other funds in which it invests. Such indirect expenses are not included in the Fund’s reported expense ratios. |
| (b) | Total net expenses include the impact of certain fee waivers/expense reimbursements made by the Investment Manager and certain of its affiliates, if applicable. |
| (c) | The benefits derived from expense reductions had an impact of less than 0.01%. |
| (d) | Class R4 shares commenced operations on November 8, 2012. Per share data and total return reflect activity from that date. |
| (e) | Annualized. |
| (f) | Class R5 shares commenced operations on November 8, 2012. Per share data and total return reflect activity from that date. |
| (g) | Rounds to zero. |
| (h) | Class Y shares commenced operations on March 1, 2016. Per share data and total return reflect activity from that date. |
The accompanying Notes to Financial Statements are an integral part of this statement.
| 18 | Columbia Global Technology Growth Fund | Annual Report 2017 |
Total
distributions to
shareholders | Net
asset
value,
end of
period | Total
return | Total gross
expense
ratio to
average
net assets(a) | Total net
expense
ratio to
average
net assets(a),(b) | Net investment
income (loss)
ratio to
average
net assets | Portfolio
turnover | Net
assets,
end of
period
(000’s) |
| |
| (0.08) | $30.05 | 35.77% | 1.07% | 1.07% (c) | (0.06%) | 40% | $13,629 |
| (0.35) | $22.21 | 17.76% | 1.11% | 1.11% (c) | 0.07% | 55% | $7,235 |
| (0.86) | $19.19 | 6.04% | 1.15% | 1.15% (c) | (0.23%) | 60% | $8,345 |
| — | $18.92 | 35.24% | 1.16% | 1.16% (c) | (0.37%) | 68% | $836 |
| — | $13.99 | 30.38% | 1.22% (e) | 1.22% (c),(e) | (0.28%) (e) | 135% | $177 |
| |
| (0.08) | $30.23 | 35.84% | 0.98% | 0.98% | 0.02% | 40% | $45,747 |
| (0.35) | $22.33 | 17.95% | 0.98% | 0.98% | 0.16% | 55% | $18,492 |
| (0.87) | $19.26 | 6.13% | 1.00% | 1.00% | (0.05%) | 60% | $9,964 |
| — | $18.98 | 35.57% | 1.03% | 1.03% | (0.09%) | 68% | $3,168 |
| — | $14.00 | 30.48% | 1.08% (e) | 1.08% (e) | (0.08%) (e) | 135% | $203 |
| |
| (0.08) | $30.31 | 35.96% | 0.93% | 0.93% | 0.10% | 40% | $40,899 |
| — | $22.37 | 16.15% | 0.94% (e) | 0.94% (e) | 0.33% (e) | 55% | $675 |
| |
| (0.08) | $29.68 | 35.75% | 1.07% | 1.07% (c) | (0.08%) | 40% | $398,021 |
| (0.35) | $21.94 | 17.82% | 1.11% | 1.11% (c) | 0.04% | 55% | $233,750 |
| (0.86) | $18.95 | 6.00% | 1.15% | 1.15% (c) | (0.11%) | 60% | $165,748 |
| — | $18.70 | 35.31% | 1.17% | 1.17% (c) | (0.30%) | 68% | $111,506 |
| — | $13.82 | 24.17% | 1.24% | 1.21% (c) | (0.12%) | 135% | $77,279 |
Columbia Global Technology Growth Fund | Annual Report 2017
| 19 |
Notes to Financial Statements
August 31, 2017
Note 1. Organization
Columbia Global Technology Growth Fund (the Fund), a series of Columbia Funds Series Trust I (the Trust), is a diversified fund. The Trust is registered under the Investment Company Act of 1940, as amended (the 1940 Act), as an open-end management investment company organized as a Massachusetts business trust.
Fund shares
The Trust may issue an unlimited number of shares (without par value). Although all share classes generally have identical voting, dividend and liquidation rights, each share class votes separately when required by the Trust’s organizational documents or by law. Different share classes pay different distribution amounts to the extent the expenses of such share classes differ, and distributions in liquidation will be proportional to the net asset value of each share class. Each share class has its own expense and sales charge structure. The Fund offers each of the share classes identified below.
Class A shares are subject to a maximum front-end sales charge of 5.75% based on the initial investment amount. Class A shares purchased without an initial sales charge in accounts aggregating $1 million to $50 million at the time of purchase are subject to a contingent deferred sales charge (CDSC) if the shares are sold within 18 months after purchase, charged as follows: 1.00% CDSC if redeemed within 12 months after purchase, and 0.50% CDSC if redeemed more than 12, but less than 18, months after purchase.
Class B shares of the Fund are no longer offered for sale. When available, Class B shares were subject to a maximum CDSC of 5.00% based upon the holding period after purchase. Effective July 17, 2017, Class B shares were automatically converted to Class A shares without a CDSC. On August 4, 2017, the capital owned by Columbia Management Investment Advisers, LLC in Class B shares was redeemed without a CDSC.
Class C shares are subject to a 1.00% CDSC on shares redeemed within 12 months after purchase.
The Fund no longer accepts investments by new or existing investors in Class I shares. Class I shares, when available, were not subject to sales charges, and were made available only to the Columbia Family of Funds. On March 27, 2017, Class I shares were redeemed or exchanged for Class Y shares of the Fund in a tax free transaction that had no impact on the fees and expenses paid by shareholders.
Class R4 shares are not subject to sales charges and are generally available only to omnibus retirement plans and certain investors as described in the Fund’s prospectus. Effective November 1, 2017, Class R4 shares will be renamed Advisor Class shares.
Class R5 shares are not subject to sales charges and are generally available only to investors purchasing through authorized investment professionals and omnibus retirement plans as described in the Fund’s prospectus. Effective November 1, 2017, Class R5 shares will be renamed Institutional 2 Class shares.
Class Y shares are not subject to sales charges and are available to institutional and certain other investors as described in the Fund’s prospectus. Effective November 1, 2017, Class Y shares will be renamed Institutional 3 Class shares.
Class Z shares are not subject to sales charges and are generally available only to eligible investors, which are subject to different investment minimums as described in the Fund’s prospectus. Effective November 1, 2017, Class Z shares will be renamed Institutional Class shares.
Note 2. Summary of significant accounting policies
Basis of preparation
The Fund is an investment company that applies the accounting and reporting guidance in the Financial Accounting Standards Board (FASB) Accounting Standards Codification Topic 946, Financial Services - Investment Companies (ASC 946). The financial statements are prepared in accordance with U.S. generally accepted accounting principles (GAAP), which requires management to make certain estimates and assumptions that affect the reported amounts of assets and liabilities, the disclosure of contingent assets and liabilities at the date of the financial statements and the reported amounts of income and expenses during the reporting period. Actual results could differ from those estimates.
| 20 | Columbia Global Technology Growth Fund | Annual Report 2017 |
Notes to Financial Statements (continued)
August 31, 2017
The following is a summary of significant accounting policies followed by the Fund in the preparation of its financial statements.
Security valuation
All equity securities are valued at the close of business of the New York Stock Exchange. Equity securities are valued at the last quoted sales price on the principal exchange or market on which they trade, except for securities traded on the NASDAQ Stock Market, which are valued at the NASDAQ official close price. Unlisted securities or listed securities for which there were no sales during the day are valued at the mean of the latest quoted bid and ask prices on such exchanges or markets.
Foreign equity securities are valued based on the closing price on the foreign exchange in which such securities are primarily traded. If any foreign equity security closing prices are not readily available, the securities are valued at the mean of the latest quoted bid and ask prices on such exchanges or markets. Foreign currency exchange rates are generally determined at 4:00 p.m. Eastern (U.S.) time. Many securities markets and exchanges outside the U.S. close prior to the close of the New York Stock Exchange; therefore, the closing prices for securities in such markets or on such exchanges may not fully reflect events that occur after such close but before the close of the New York Stock Exchange. In those situations, foreign securities will be fair valued pursuant to a policy adopted by the Board of Trustees, including, if available, utilizing a third party pricing service to determine these fair values. The third party pricing service takes into account multiple factors, including, but not limited to, movements in the U.S. securities markets, certain depositary receipts, futures contracts and foreign exchange rates that have occurred subsequent to the close of the foreign exchange or market, to determine a good faith estimate that reasonably reflects the current market conditions as of the close of the New York Stock Exchange. The fair value of a security is likely to be different from the quoted or published price, if available.
Investments in open-end investment companies, including money market funds, are valued at their latest net asset value.
Investments for which market quotations are not readily available, or that have quotations which management believes are not reflective of market value or reliable, are valued at fair value as determined in good faith under procedures approved by and under the general supervision of the Board of Trustees. If a security or class of securities (such as foreign securities) is valued at fair value, such value is likely to be different from the quoted or published price for the security.
The determination of fair value often requires significant judgment. To determine fair value, management may use assumptions including but not limited to future cash flows and estimated risk premiums. Multiple inputs from various sources may be used to determine fair value.
GAAP requires disclosure regarding the inputs and valuation techniques used to measure fair value and any changes in valuation inputs or techniques. In addition, investments shall be disclosed by major category. This information is disclosed following the Fund’s Portfolio of Investments.
Foreign currency transactions and translations
The values of all assets and liabilities denominated in foreign currencies are generally translated into U.S. dollars at exchange rates determined at the close of regular trading on the New York Stock Exchange. Net realized and unrealized gains (losses) on foreign currency transactions and translations include gains (losses) arising from the fluctuation in exchange rates between trade and settlement dates on securities transactions, gains (losses) arising from the disposition of foreign currency and currency gains (losses) between the accrual and payment dates on dividends, interest income and foreign withholding taxes.
For financial statement purposes, the Fund does not distinguish that portion of gains (losses) on investments which is due to changes in foreign exchange rates from that which is due to changes in market prices of the investments. Such fluctuations are included with the net realized and unrealized gains (losses) on investments in the Statement of Operations.
Security transactions
Security transactions are accounted for on the trade date. Cost is determined and gains (losses) are based upon the specific identification method for both financial statement and federal income tax purposes.
Columbia Global Technology Growth Fund | Annual Report 2017
| 21 |
Notes to Financial Statements (continued)
August 31, 2017
Income recognition
Corporate actions and dividend income are generally recorded net of any non-reclaimable tax withholdings, on the ex-dividend date or upon receipt of ex-dividend notification in the case of certain foreign securities.
The Fund may receive distributions from holdings in equity securities, business development companies (BDCs), exchange-traded funds (ETFs), limited partnerships (LPs), other regulated investment companies (RICs), and real estate investment trusts (REITs), which report information on the tax character of their distributions annually. These distributions are allocated to dividend income, capital gain and return of capital based on actual information reported. Return of capital is recorded as a reduction of the cost basis of securities held. If the Fund no longer owns the applicable securities, return of capital is recorded as a realized gain. With respect to REITs, to the extent actual information has not yet been reported, estimates for return of capital are made by the Fund’s management. Management’s estimates are subsequently adjusted when the actual character of the distributions is disclosed by the REITs, which could result in a proportionate change in return of capital to shareholders.
Awards from class action litigation are recorded as a reduction of cost basis if the Fund still owns the applicable securities on the payment date. If the Fund no longer owns the applicable securities, the proceeds are recorded as realized gains.
Expenses
General expenses of the Trust are allocated to the Fund and other funds of the Trust based upon relative net assets or other expense allocation methodologies determined by the nature of the expense. Expenses directly attributable to the Fund are charged to the Fund. Expenses directly attributable to a specific class of shares are charged to that share class.
Determination of class net asset value
All income, expenses (other than class-specific expenses, which are charged to that share class, as shown in the Statement of Operations) and realized and unrealized gains (losses) are allocated to each class of the Fund on a daily basis, based on the relative net assets of each class, for purposes of determining the net asset value of each class.
Federal income tax status
The Fund intends to qualify each year as a regulated investment company under Subchapter M of the Internal Revenue Code, as amended, and will distribute substantially all of its taxable income (including net short-term capital gains) and capital gains, if any, for its tax year, and as such will not be subject to federal income taxes. In addition, the Fund intends to distribute in each calendar year substantially all of its net investment income, capital gains and certain other amounts, if any, such that the Fund should not be subject to federal excise tax. Therefore, no federal income or excise tax provision is recorded.
Foreign taxes
The Fund may be subject to foreign taxes on income, gains on investments or currency repatriation, a portion of which may be recoverable. The Fund will accrue such taxes and recoveries, as applicable, based upon its current interpretation of tax rules and regulations that exist in the markets in which it invests.
Realized gains in certain countries may be subject to foreign taxes at the Fund level, based on statutory rates. The Fund accrues for such foreign taxes on realized and unrealized gains at the appropriate rate for each jurisdiction, as applicable. The amount, if any, is disclosed as a liability on the Statement of Assets and Liabilities.
Distributions to shareholders
Distributions from net investment income, if any, are declared and paid annually. Net realized capital gains, if any, are distributed along with the income distribution. Income distributions and capital gain distributions are determined in accordance with federal income tax regulations, which may differ from GAAP.
| 22 | Columbia Global Technology Growth Fund | Annual Report 2017 |
Notes to Financial Statements (continued)
August 31, 2017
Guarantees and indemnifications
Under the Trust’s organizational documents and, in some cases, by contract, its officers and trustees are indemnified against certain liabilities arising out of the performance of their duties to the Trust or its funds. In addition, certain of the Fund’s contracts with its service providers contain general indemnification clauses. The Fund’s maximum exposure under these arrangements is unknown since the amount of any future claims that may be made against the Fund cannot be determined, and the Fund has no historical basis for predicting the likelihood of any such claims.
Recent accounting pronouncement
Accounting Standards Update 2017-08 Premium Amortization on Purchased Callable Debt Securities
In March 2017, the Financial Accounting Standards Board issued Accounting Standards Update (ASU) No. 2017-08 Premium Amortization on Purchased Callable Debt Securities. ASU No. 2017-08 updates the accounting standards to shorten the amortization period for certain purchased callable debt securities, held at a premium, to be amortized to the earliest call date. The update applies to securities with explicit, noncontingent call features that are callable at fixed prices and on preset dates. The standard is effective for annual periods beginning after December 15, 2018 and interim periods within those fiscal years. At this time, management is evaluating the implication of this guidance and the impact it will have on the financial statement amounts and footnote disclosures, if any.
Note 3. Fees and other transactions with affiliates
Management services fees
The Fund has entered into a Management Agreement with Columbia Management Investment Advisers, LLC (the Investment Manager), a wholly-owned subsidiary of Ameriprise Financial, Inc. (Ameriprise Financial). Under the Management Agreement, the Investment Manager provides the Fund with investment research and advice, as well as administrative and accounting services. The management services fee is an annual fee that is equal to a percentage of the Fund’s daily net assets that declines from 0.87% to 0.77% as the Fund’s net assets increase. The effective management services fee rate for the year ended August 31, 2017 was 0.86% of the Fund’s average daily net assets.
Compensation of board members
Members of the Board of Trustees, who are not officers or employees of the Investment Manager or Ameriprise Financial, are compensated for their services to the Fund as disclosed in the Statement of Operations. These members of the Board of Trustees may participate in a Deferred Compensation Plan (the Plan) which may be terminated at any time. Obligations of the Plan will be paid solely out of the Fund’s assets, and all amounts payable under the Plan constitute a general unsecured obligation of the Fund.
Compensation of Chief Compliance Officer
The Board of Trustees has appointed a Chief Compliance Officer to the Fund in accordance with federal securities regulations. A portion of the Chief Compliance Officer’s total compensation is allocated to the Fund, along with other affiliated funds governed by the Board of Trustees, based on relative net assets. The total amount allocated to all affiliated funds governed by the Board of Trustees will not exceed $40,000 annually.
Transfer agency fees
Under a Transfer and Dividend Disbursing Agent Agreement, Columbia Management Investment Services Corp. (the Transfer Agent), an affiliate of the Investment Manager and a wholly-owned subsidiary of Ameriprise Financial, is responsible for providing transfer agency services to the Fund. The Transfer Agent has contracted with Boston Financial Data Services (BFDS) to serve as sub-transfer agent. The Transfer Agent pays the fees of BFDS for services as sub-transfer agent and BFDS is not entitled to reimbursement for such fees from the Fund (with the exception of out-of-pocket fees).
The Fund pays the Transfer Agent a monthly transfer agency fee based on the number or the average value of accounts, depending on the type of account. In addition, prior to October 1, 2016, the Transfer Agent also received sub-transfer agency fees based on a percentage of the average aggregate value of the Fund’s shares maintained in omnibus accounts (other than omnibus accounts for which American Enterprise Investment Services Inc. is the broker of record or accounts where the
Columbia Global Technology Growth Fund | Annual Report 2017
| 23 |
Notes to Financial Statements (continued)
August 31, 2017
beneficial shareholder is a customer of Ameriprise Financial Services, Inc., for which the Transfer Agent receives a per account fee). Effective October 1, 2016, the Fund pays the Transfer Agent a fee for shareholder services based on the number of accounts or on a percentage of the average aggregate value of the Fund’s shares maintained in omnibus accounts up to the lesser of the amount charged by the financial intermediary or a cap established by the Board of Trustees from time to time.
The Transfer Agent also receives compensation from the Fund for various shareholder services and reimbursements for certain out-of-pocket fees. Effective August 1, 2017, total transfer agency fees for Class R5 and Class Y shares are subject to an annual limitation of not more than 0.07% and 0.02%, respectively, of the average daily net assets attributable to each share class. From January 1, 2017 to July 31, 2017, these limitations were 0.075% for Class R5 shares and 0.025% for Class I and Class Y shares; and prior to January 1, 2017, the limitation was 0.05% for Class R5 shares and Class I and Class Y shares did not pay transfer agency fees.
For the year ended August 31, 2017, the Fund’s effective transfer agency fee rates as a percentage of average daily net assets of each class were as follows:
| | Effective rate (%) |
| Class A | 0.15 |
| Class B | 0.14 (a),(b) |
| Class C | 0.15 |
| Class I | 0.00 (b),(c) |
| Class R4 | 0.15 |
| Class R5 | 0.06 |
| Class Y | 0.01 |
| Class Z | 0.15 |
| (a) | Effective July 17, 2017, Class B shares were automatically converted to Class A shares. |
| (b) | Unannualized. |
| (c) | Effective March 27, 2017, Class I shares were redeemed or exchanged for Class Y shares. |
An annual minimum account balance fee of $20 may apply to certain accounts with a value below the applicable share class’s initial minimum investment requirements to reduce the impact of small accounts on transfer agency fees. These minimum account balance fees are remitted to the Fund and recorded as part of expense reductions in the Statement of Operations. For the year ended August 31, 2017, these minimum account balance fees reduced total expenses of the Fund by $240.
Distribution and service fees
The Fund has entered into an agreement with Columbia Management Investment Distributors, Inc. (the Distributor), an affiliate of the Investment Manager and a wholly-owned subsidiary of Ameriprise Financial, for distribution and shareholder services. The Board of Trustees has approved, and the Fund has adopted, distribution and shareholder service plans (the Plans) applicable to certain share classes, which set the distribution and service fees for the Fund. These fees are calculated daily and are intended to compensate the Distributor and/or eligible selling and/or servicing agents for selling shares of the Fund and providing services to investors.
Under the Plans, the Fund pays a monthly service fee to the Distributor at the maximum annual rate of 0.25% of the average daily net assets attributable to Class A, Class B and Class C shares of the Fund. Also under the Plans, the Fund pays a monthly distribution fee to the Distributor at the maximum annual rates of 0.10%, 0.75% and 0.75% of the average daily net assets attributable to Class A, Class B and Class C shares of the Fund, respectively. As a result of all Class B shares of the Fund being redeemed or converted to Class A shares, August 4, 2017 was the last day the Fund paid a service fee or distribution fee for Class B shares.
Although the Fund may pay distribution and service fees up to a maximum annual rate of 0.35% of the Fund’s average daily net assets attributable to Class A shares (comprised of up to 0.10% for distribution services and up to 0.25% for shareholder liaison services), the Fund currently limits such fees to an aggregate fee of not more than 0.25% of the Fund’s average daily net assets attributable to Class A shares.
| 24 | Columbia Global Technology Growth Fund | Annual Report 2017 |
Notes to Financial Statements (continued)
August 31, 2017
Sales charges (unaudited)
Sales charges, including front-end charges and CDSCs, received by the Distributor for distributing Fund shares for the year ended August 31, 2017, if any, are listed below:
| | Amount ($) |
| Class A | 869,579 |
| Class B | 209 |
| Class C | 9,328 |
Expenses waived/reimbursed by the Investment Manager and its affiliates
The Investment Manager and certain of its affiliates have contractually agreed to waive fees and/or reimburse expenses (excluding certain fees and expenses described below) for the period(s) disclosed below, unless sooner terminated at the sole discretion of the Board of Trustees, so that the Fund’s net operating expenses, after giving effect to fees waived/expenses reimbursed and any balance credits and/or overdraft charges from the Fund’s custodian, do not exceed the following annual rate(s) as a percentage of the class’ average daily net assets:
| | January 1, 2017
through
December 31, 2017 | Prior to
January 1, 2017 |
| Class A | 1.45 | 1.50 |
| Class C | 2.20 | 2.25 |
| Class R4 | 1.20 | 1.25 |
| Class R5 | 1.155 | 1.16 |
| Class Y | 1.105 | 1.11 |
| Class Z | 1.20 | 1.25 |
Under the agreement governing these fee waivers and/or expense reimbursement arrangements, the following fees and expenses are excluded from the waiver/reimbursement commitment, and therefore will be paid by the Fund, if applicable: taxes (including foreign transaction taxes), expenses associated with investments in affiliated and non-affiliated pooled investment vehicles (including mutual funds and exchange-traded funds), transaction costs and brokerage commissions, costs related to any securities lending program, dividend expenses associated with securities sold short, inverse floater program fees and expenses, transaction charges and interest on borrowed money, interest, infrequent and/or unusual expenses and any other expenses the exclusion of which is specifically approved by the Board of Trustees. This agreement may be modified or amended only with approval from the Investment Manager, certain of its affiliates and the Fund. Any fees waived and/or expenses reimbursed under the expense reimbursement arrangements described above are not recoverable by the Investment Manager or its affiliates in future periods.
Note 4. Federal tax information
The timing and character of income and capital gain distributions are determined in accordance with income tax regulations, which may differ from GAAP because of temporary or permanent book to tax differences.
At August 31, 2017, these differences are primarily due to differing treatment for deferral/reversal of wash sale losses, passive foreign investment company (PFIC) holdings, late-year ordinary losses, trustees’ deferred compensation, foreign currency transactions and net operating loss reclassification. To the extent these differences are permanent, reclassifications are made among the components of the Fund’s net assets in the Statement of Assets and Liabilities. Temporary differences do not require reclassifications.
In the Statement of Assets and Liabilities the following reclassifications were made:
Excess of distributions
over net investment
income ($) | Accumulated
net realized
gain ($) | Paid in
capital ($) |
| 2,062,806 | (2,062,806) | — |
Columbia Global Technology Growth Fund | Annual Report 2017
| 25 |
Notes to Financial Statements (continued)
August 31, 2017
Net investment income (loss) and net realized gains (losses), as disclosed in the Statement of Operations, and net assets were not affected by this reclassification.
The tax character of distributions paid during the years indicated was as follows:
| August 31, 2017 | August 31, 2016 |
Ordinary
income ($) | Long-term
capital gains ($) | Total ($) | Ordinary
income ($) | Long-term
capital gains ($) | Total ($) |
| — | 1,969,177 | 1,969,177 | 126,451 | 8,755,906 | 8,882,357 |
Short-term capital gain distributions, if any, are considered ordinary income distributions for tax purposes.
At August 31, 2017, the components of distributable earnings on a tax basis were as follows:
Undistributed
ordinary income ($) | Undistributed
long-term
capital gains ($) | Capital loss
carryforwards ($) | Net unrealized
appreciation ($) |
| — | 24,615,129 | — | 297,468,858 |
At August 31, 2017, the cost of all investments for federal income tax purposes along with the aggregate gross unrealized appreciation and depreciation based on that cost was:
Federal
tax cost ($) | Gross unrealized
appreciation ($) | Gross unrealized
(depreciation) ($) | Net unrealized
appreciation ($) |
| 522,988,299 | 300,287,418 | (2,818,560) | 297,468,858 |
Tax cost of investments and unrealized appreciation/(depreciation) may also include timing differences that do not constitute adjustments to tax basis.
Under current tax rules, regulated investment companies can elect to treat certain late-year ordinary losses incurred and post-October capital losses (capital losses realized after October 31) as arising on the first day of the following taxable year. As of August 31, 2017, the Fund will elect to treat the following late-year ordinary losses and post-October capital losses as arising on September 1, 2017.
Late year
ordinary losses ($) | Post-October
capital losses ($) |
| 302,973 | — |
Management of the Fund has concluded that there are no significant uncertain tax positions in the Fund that would require recognition in the financial statements. However, management’s conclusion may be subject to review and adjustment at a later date based on factors including, but not limited to, new tax laws, regulations, and administrative interpretations (including relevant court decisions). Generally, the Fund’s federal tax returns for the prior three fiscal years remain subject to examination by the Internal Revenue Service.
Note 5. Portfolio information
The cost of purchases and proceeds from sales of securities, excluding short-term investments and derivatives, if any, aggregated to $341,611,849 and $252,007,090, respectively, for the year ended August 31, 2017. The amount of purchase and sale activity impacts the portfolio turnover rate reported in the Financial Highlights.
Note 6. Affiliated money market fund
The Fund invests in Columbia Short-Term Cash Fund, an affiliated money market fund established for the exclusive use by the Fund and other affiliated funds (the Affiliated MMF). The income earned by the Fund from such investments is included as Dividends - affiliated issuers in the Statement of Operations. As an investing fund, the Fund indirectly bears its proportionate share of the expenses of the Affiliated MMF. Effective October 1, 2016, the Affiliated MMF prices its shares with a floating net
| 26 | Columbia Global Technology Growth Fund | Annual Report 2017 |
Notes to Financial Statements (continued)
August 31, 2017
asset value (NAV) and no longer seeks to maintain a stable NAV. In addition, the Board of Trustees of the Affiliated MMF may impose a fee on redemptions (sometimes referred to as a liquidity fee) or temporarily suspend redemptions (sometimes referred to as imposing a redemption gate) in the event its liquidity falls below regulatory limits.
Note 7. Line of credit
The Fund has access to a revolving credit facility with a syndicate of banks led by Citibank, N.A., HSBC Bank USA, N.A. and JPMorgan Chase Bank, N.A. whereby the Fund may borrow for the temporary funding of shareholder redemptions or for other temporary or emergency purposes. The credit facility, which is a collective agreement between the Fund and certain other funds managed by the Investment Manager, severally and not jointly, permits collective borrowings up to $1 billion. Interest is charged to each participating fund based on its borrowings at a rate equal to the higher of (i) the overnight federal funds rate plus 1.00% or (ii) the one-month LIBOR rate plus 1.00%. Each borrowing under the credit facility matures no later than 60 days after the date of borrowing. The Fund also pays a commitment fee equal to its pro rata share of the amount of the credit facility at a rate of 0.15% per annum. The commitment fee is included in other expenses in the Statement of Operations.
The Fund had no borrowings during the year ended August 31, 2017.
Note 8. Significant risks
Foreign securities and emerging market countries risk
Investing in foreign securities may include certain risks and considerations not typically associated with investing in U.S. securities, such as fluctuating currency values and changing local and regional economic, political and social conditions, which may result in greater market volatility. In addition, certain foreign securities may not be as liquid as U.S. securities. Investing in emerging markets may accentuate these risks. These countries are also more likely to experience high levels of inflation, deflation or currency devaluation which could hurt their economies and securities markets. To the extent that the Fund concentrates its investment exposure to any one or a few specific countries, the Fund will be particularly susceptible to the various conditions, events or other factors impacting those countries and may, therefore, have a greater risk than that of a fund which is more geographically diversified.
Shareholder concentration risk
At August 31, 2017, unaffiliated shareholders of record owned 30.0% of the outstanding shares of the Fund in one or more accounts. The Fund has no knowledge about whether any portion of those shares was owned beneficially. Affiliated shareholders of record owned 19.9% of the outstanding shares of the Fund in one or more accounts. Subscription and redemption activity by concentrated accounts may have a significant effect on the operations of the Fund. In the case of a large redemption, the Fund may be forced to sell investments at inopportune times, including its liquid positions, which may result in Fund losses and the Fund holding a higher percentage of less liquid positions. Large redemptions could result in decreased economies of scale and increased operating expenses for non-redeeming Fund shareholders.
Technology and technology-related investment risk
The Fund may be more susceptible to the particular risks that may affect companies in the information technology sector, as well as other technology-related sectors (collectively, the technology sectors) than if it were invested in a wider variety of companies in unrelated sectors. Companies in the technology sectors are subject to certain risks, including the risk that new services, equipment or technologies will not be accepted by consumers and businesses or will become rapidly obsolete. Performance of such companies may be affected by factors including obtaining and protecting patents (or the failure to do so) and significant competitive pressures, including aggressive pricing of their products or services, new market entrants, competition for market share and short product cycles due to an accelerated rate of technological developments. Such competitive pressures may lead to limited earnings and/or falling profit margins. As a result, the value of their securities may fall or fail to rise. In addition, many technology sector companies have limited operating histories and prices of these companies’ securities historically have been more volatile than other securities, especially over the short term.
Columbia Global Technology Growth Fund | Annual Report 2017
| 27 |
Notes to Financial Statements (continued)
August 31, 2017
Note 9. Subsequent events
Management has evaluated the events and transactions that have occurred through the date the financial statements were issued. Other than as noted in Note 1 above, there were no items requiring adjustment of the financial statements or additional disclosure.
Note 10. Information regarding pending and settled legal proceedings
Ameriprise Financial and certain of its affiliates have historically been involved in a number of legal, arbitration and regulatory proceedings, including routine litigation, class actions, and governmental actions, concerning matters arising in connection with the conduct of their business activities. Ameriprise Financial believes that the Fund is not currently the subject of, and that neither Ameriprise Financial nor any of its affiliates are the subject of, any pending legal, arbitration or regulatory proceedings that are likely to have a material adverse effect on the Fund or the ability of Ameriprise Financial or its affiliates to perform under their contracts with the Fund. Ameriprise Financial is required to make quarterly (10-Q), annual (10-K) and, as necessary, 8-K filings with the Securities and Exchange Commission (SEC) on legal and regulatory matters that relate to Ameriprise Financial and its affiliates. Copies of these filings may be obtained by accessing the SEC website at www.sec.gov.
There can be no assurance that these matters, or the adverse publicity associated with them, will not result in increased Fund redemptions, reduced sale of Fund shares or other adverse consequences to the Fund. Further, although we believe proceedings are not likely to have a material adverse effect on the Fund or the ability of Ameriprise Financial or its affiliates to perform under their contracts with the Fund, these proceedings are subject to uncertainties and, as such, we are unable to estimate the possible loss or range of loss that may result. An adverse outcome in one or more of these proceedings could result in adverse judgments, settlements, fines, penalties or other relief that could have a material adverse effect on the consolidated financial condition or results of operations of Ameriprise Financial.
| 28 | Columbia Global Technology Growth Fund | Annual Report 2017 |
Report of Independent Registered Public Accounting Firm
To the Trustees of Columbia Funds Series Trust I and the Shareholders of Columbia Global Technology Growth Fund
In our opinion, the accompanying statement of assets and liabilities, including the portfolio of investments, and the related statements of operations and of changes in net assets and the financial highlights present fairly, in all material respects, the financial position of Columbia Global Technology Growth Fund (the “Fund”, a series of Columbia Funds Series Trust I) as of August 31, 2017, the results of its operations for the year then ended, the changes in its net assets for each of the two years in the period then ended and the financial highlights for each of the five years in the period then ended, in conformity with accounting principles generally accepted in the United States of America. These financial statements and financial highlights (hereafter referred to as “financial statements”) are the responsibility of the Fund’s management. Our responsibility is to express an opinion on these financial statements based on our audits. We conducted our audits of these financial statements in accordance with the standards of the Public Company Accounting Oversight Board (United States). Those standards require that we plan and perform the audit to obtain reasonable assurance about whether the financial statements are free of material misstatement. An audit includes examining, on a test basis, evidence supporting the amounts and disclosures in the financial statements, assessing the accounting principles used and significant estimates made by management, and evaluating the overall financial statement presentation. We believe that our audits, which included confirmation of securities as of August 31, 2017 by correspondence with the custodian, brokers and transfer agent provide a reasonable basis for our opinion.
/s/PricewaterhouseCoopers LLP
Minneapolis, MN
October 20, 2017
Columbia Global Technology Growth Fund | Annual Report 2017
| 29 |
Federal Income Tax Information
(Unaudited)
The Fund hereby designates the following tax attributes for the fiscal year ended August 31, 2017. Shareholders will be notified in early 2018 of the amounts for use in preparing 2017 income tax returns.
Capital
gain
dividend | |
| $27,913,521 | |
Capital gain dividend. The Fund designates as a capital gain dividend the amount reflected above, or if subsequently determined to be different, the net capital gain of such fiscal period.
| 30 | Columbia Global Technology Growth Fund | Annual Report 2017 |
Shareholders elect the Board that oversees the Fund’s operations. The Board appoints officers who are responsible for day-to-day business decisions based on policies set by the Board. The following table provides basic biographical information about the Fund’s Trustees, including their principal occupations during the past five years, although specific titles for individuals may have varied over the period. The year set forth beneath Length of Service in the table below is the year in which the Trustee was first appointed or elected as Trustee to any Fund currently in the Columbia Funds Complex or a predecessor thereof. Under current Board policy, members serve terms of indefinite duration.
Independent trustees
| Name, address, year of birth | Position held with the Trust and length of service | Principal occupation(s) during the past five years and other relevant professional experience | Number of Funds in the Columbia Fund Complex overseen | Other directorships held by Trustee during the past five years |
Janet Langford Carrig
c/o Columbia Management
Investment Advisers, LLC
225 Franklin Street
Mail Drop BX32 05228
Boston, MA 02110
1957 | Trustee
1996 | Senior Vice President, General Counsel and Corporate Secretary, ConocoPhillips (independent energy company) since September 2007 | 57 | None |
Douglas A. Hacker
c/o Columbia Management
Investment Advisers, LLC
225 Franklin Street
Mail Drop BX32 05228
Boston, MA 02110
1955 | Trustee and Chairman of the Board
1996 | Independent business executive since May 2006; Executive Vice President — Strategy of United Airlines from December 2002 to May 2006; President of UAL Loyalty Services (airline marketing company) from September 2001 to December 2002; Executive Vice President and Chief Financial Officer of United Airlines from July 1999 to September 2001 | 57 | Spartan Nash Company, (food distributor); Nash Finch Company (food distributor) from 2005 to 2013; Aircastle Limited (aircraft leasing); SeaCube Container Leasing Ltd. (container leasing) from 2010 to 2013; and Travelport Worldwide Limited (travel information technology) |
Nancy T. Lukitsh
c/o Columbia Management
Investment Advisers, LLC
225 Franklin Street
Mail Drop BX32 05228
Boston, MA 02110
1956 | Trustee
2011 | Senior Vice President, Partner and Director of Marketing, Wellington Management Company, LLP (investment adviser) from 1997 to 2010; Chair, Wellington Management Portfolios (commingled non-U.S. investment pools) from 2007 to 2010; Director, Wellington Trust Company, NA and other Wellington affiliates from 1997 to 2010 | 57 | None |
David M. Moffett
c/o Columbia Management
Investment Advisers, LLC
225 Franklin Street
Mail Drop BX32 05228
Boston, MA 02110
1952 | Trustee
2011 | Retired. Consultant to Bridgewater and Associates | 57 | Director, CSX Corporation; Genworth Financial, Inc. (financial and insurance products and services); PayPal Holdings Inc. (payment and data processing services); Trustee, University of Oklahoma Foundation; former Director, eBay Inc. (online trading community), 2007-2015; and former Director, CIT Bank, CIT Group Inc. (commercial and consumer finance), 2010-2016 |
Columbia Global Technology Growth Fund | Annual Report 2017
| 31 |
TRUSTEES AND OFFICERS (continued)
Independent trustees (continued)
| Name, address, year of birth | Position held with the Trust and length of service | Principal occupation(s) during the past five years and other relevant professional experience | Number of Funds in the Columbia Fund Complex overseen | Other directorships held by Trustee during the past five years |
Charles R. Nelson
c/o Columbia Management
Investment Advisers, LLC
225 Franklin Street
Mail Drop BX32 05228
Boston, MA 02110
1942 | Trustee
1981 | Retired. Professor Emeritus, University of Washington since 2011; Professor of Economics, University of Washington from 1976 to 2011; Ford and Louisa Van Voorhis Professor of Political Economy, University of Washington from 1993 to 2011; Adjunct Professor of Statistics, University of Washington from 1980 to 2011; Associate Editor, Journal of Money, Credit and Banking from September 1993 to 2008; consultant on econometric and statistical matters | 57 | None |
John J. Neuhauser
c/o Columbia Management
Investment Advisers, LLC
225 Franklin Street
Mail Drop BX32 05228
Boston, MA 02110
1943 | Trustee
1984 | President, Saint Michael’s College since August 2007; Director or Trustee of several non-profit organizations, including University of Vermont Medical Center; Academic Vice President and Dean of Faculties, Boston College from August 1999 to October 2005; University Professor, Boston College from November 2005 to August 2007 | 57 | Liberty All-Star Equity Fund and Liberty All- Star Growth Fund (closed-end funds) |
Patrick J. Simpson
c/o Columbia Management
Investment Advisers, LLC
225 Franklin Street
Mail Drop BX32 05228
Boston, MA 02110
1944 | Trustee
2000 | Of Counsel, Perkins Coie LLP (law firm) since 2015; Partner, Perkins Coie LLP from 1988 to 2014 | 57 | None |
Anne-Lee Verville
c/o Columbia Management
Investment Advisers, LLC
225 Franklin Street
Mail Drop BX32 05228
Boston, MA 02110
1945 | Trustee
1998 | Retired. General Manager, Global Education Industry from 1994 to 1997, President – Application Systems Division from 1991 to 1994, Chief Financial Officer – US Marketing & Services from 1988 to 1991, and Chief Information Officer from 1987 to 1988, IBM Corporation (computer and technology) | 57 | Enesco Group, Inc. (producer of giftware and home and garden decor products) from 2001 to 2006 |
| 32 | Columbia Global Technology Growth Fund | Annual Report 2017 |
TRUSTEES AND OFFICERS (continued)
Consultants to the Independent Trustees*
| Name, address, year of birth | Position held with the Trust and length of service | Principal occupation(s) during the past five years and other relevant professional experience | Number of Funds in the Columbia Funds complex overseen | Other directorships held by Trustee during the past five years |
J. Kevin Connaughton
c/o Columbia
Management Investment
Advisers, LLC,
225 Franklin Street
Mail Drop BX32 05228,
Boston, MA 02110
1964 | Independent Trustee Consultant
2016 | Independent Trustee Consultant, Columbia Funds since March 2016; Managing Director and General Manager of Mutual Fund Products, Columbia Management Investment Advisers, LLC from May 2010 to February 2015; President, Columbia Funds from 2009 to 2015; and senior officer of Columbia Funds and affiliated funds from 2003 to 2015 | 57 | Board of Governors, Gateway Healthcare since January 2016; Trustee, New Century Portfolios since March 2015; and Director, The Autism Project since March 2015 |
Natalie A. Trunow
c/o Columbia
Management Investment
Advisers, LLC,
225 Franklin Street
Mail Drop BX32 05228,
Boston, MA 02110
1967 | Independent Trustee Consultant
2016 | Independent Trustee Consultant, Columbia Funds since September 2016; Chief Executive Officer, Millennial Partners (investment consulting services to institutions) since January 2016; Director of Investments, Casey Family Programs from April 2016 to September 2016; Senior Vice President and Chief Investment Officer, Calvert Investments from August 2008 to January 2016; Section Head and Portfolio Manager, General Motors Asset Management from June 1997 to August 2008 | 57 | Healthcare Services for Children with Special Needs |
| * | J. Kevin Connaughton was appointed consultant to the Independent Trustees effective March 1, 2016. Natalie A. Trunow was appointed consultant to the Independent Trustees effective September 1, 2016. Shareholders of the Funds are expected to be asked to elect each of Mr. Connaughton and Ms. Trunow as a Trustee at a future shareholder meeting. |
Interested trustee affiliated with Investment Manager*
| Name, address, year of birth | Position held with the Trust and length of service | Principal occupation(s) during the past five years and other relevant professional experience | Number of Funds in the Columbia Funds Complex overseen | Other directorships held by Trustee during the past five years |
William F. Truscott
c/o Columbia Management
Investment Advisers, LLC
225 Franklin Street
Boston, MA 02110
1960 | Trustee
2012 | Chairman of the Board and President, Columbia Management Investment Advisers, LLC since May 2010 and February 2012, respectively; Chief Executive Officer, Global Asset Management, Ameriprise Financial, Inc. since September 2012 (previously Chief Executive Officer, U.S. Asset Management & President, Annuities, May 2010-September 2012); Director and Chief Executive Officer, Columbia Management Investment Distributors, Inc. since May 2010 and February 2012, respectively; Chairman of the Board and Chief Executive Officer, RiverSource Distributors, Inc. since 2006; Director, Threadneedle Asset Management Holdings, SARL since 2014; President and Chief Executive Officer, Ameriprise Certificate Company, 2006-August 2012 | 179 | Chairman of the Board, Columbia Management Investment Advisers, LLC since May 2010; Director, Columbia Management Investment Distributors, Inc. since May 2010; former Director, Ameriprise Certificate Company, 2006 - January 2013 |
| * | Interested person (as defined under the 1940 Act) by reason of being an officer, director, security holder and/or employee of the Investment Manager or Ameriprise Financial. |
The Statement of Additional Information has additional information about the Fund’s Board members and is available,
without charge, upon request by calling 800.345.6611, contacting your financial intermediary or visiting
investor.columbiathreadneedleus.com.
Columbia Global Technology Growth Fund | Annual Report 2017
| 33 |
TRUSTEES AND OFFICERS (continued)
The Board has appointed officers who are responsible for day-to-day business decisions based on policies it has established. The officers serve at the pleasure of the Board. The following table provides basic information about the Officers of the Fund, including principal occupations during the past five years, although their specific titles may have varied over the period. In addition to Mr. Truscott, who is Senior Vice President, the Fund’s other officers are:
Fund officers
Name,
address and
year of birth | Position and year
first appointed to
position for any Fund
in the Columbia
Funds complex or a
predecessor thereof | Principal occupation(s) during past five years |
Christopher O. Petersen
5228 Ameriprise
Financial Center
Minneapolis, MN 55474
Born 1970 | President and Principal Executive Officer (2015) | Vice President and Lead Chief Counsel, Ameriprise Financial, Inc. since January 2015 (previously, Vice President and Chief Counsel, January 2010 - December 2014; officer of Columbia Funds and affiliated funds since 2007. |
Michael G. Clarke
225 Franklin Street
Boston, MA 02110
Born 1969 | Treasurer (2011), Chief Financial Officer (2009) and Chief Accounting Officer (2015) | Vice President — Mutual Fund Administration, Columbia Management Investment Advisers, LLC, since May 2010; senior officer of Columbia Funds and affiliated funds since 2002. |
Paul B. Goucher
100 Park Avenue
New York, NY 10017
Born 1968 | Senior Vice President (2011) and Assistant Secretary (2008) | Senior Vice President and Assistant General Counsel, Ameriprise Financial, Inc. since January 2017 (previously Vice President and Lead Chief Counsel, November 2008 - January 2017 and January 2013 - January 2017, respectively; and Chief Counsel, January 2010 - January 2013); Vice President, Chief Legal Officer and Assistant Secretary, Columbia Management Investment Advisers, LLC since May 2010. |
Thomas P. McGuire
225 Franklin Street
Boston, MA 02110
Born 1972 | Senior Vice President and Chief Compliance Officer (2012) | Vice President — Asset Management Compliance, Ameriprise Financial, Inc., since May 2010; Chief Compliance Officer, Ameriprise Certificate Company since September 2010. |
Colin Moore
225 Franklin Street
Boston, MA 02110
Born 1958 | Senior Vice President (2010) | Executive Vice President and Global Chief Investment Officer, Ameriprise Financial, Inc., since July 2013; Executive Vice President and Global Chief Investment Officer, Columbia Management Investment Advisers, LLC since July 2013 (previously Director and Global Chief Investment Officer, 2010 - 2013). |
Ryan C. Larrenaga
225 Franklin Street
Boston, MA 02110
Born 1970 | Senior Vice President (2017), Chief Legal Officer (2017) and Secretary (2015) | Vice President and Group Counsel, Ameriprise Financial, Inc. since August 2011; officer of Columbia Funds and affiliated funds since 2005. |
Michael E. DeFao
225 Franklin Street
Boston, MA 02110
Born 1968 | Vice President (2011) and Assistant Secretary (2010) | Vice President and Chief Counsel, Ameriprise Financial, Inc. since May 2010. |
Amy Johnson
5228 Ameriprise
Financial Center
Minneapolis, MN 55474
Born 1965 | Vice President (2006) | Managing Director and Global Head of Operations, Columbia Management Investment Advisers, LLC since April 2016 (previously Managing Director and Chief Operating Officer, 2010 - 2016). |
Lyn Kephart-Strong
5228 Ameriprise
Financial Center
Minneapolis, MN 55474
Born 1960 | Vice President (2015) | President, Columbia Management Investment Services Corp. since October 2014; Vice President & Resolution Officer, Ameriprise Trust Company since August 2009. |
| 34 | Columbia Global Technology Growth Fund | Annual Report 2017 |
Board Consideration and Approval of Management
Agreement
On June 14, 2017, the Board of Trustees (the Board) and the Trustees who are not interested persons (as defined in the Investment Company Act of 1940) (the Independent Trustees) of Columbia Funds Series Trust I (the Trust) unanimously approved the continuation of the Management Agreement (the Management Agreement) with Columbia Management Investment Advisers, LLC (the Investment Manager) with respect to Columbia Global Technology Growth Fund (the Fund), a series of the Trust. As detailed below, the Board’s Advisory Fees and Expenses Committee (the Committee) and the Board met on multiple occasions to review and discuss, both among themselves and with the management team of the Investment Manager, materials provided by the Investment Manager and others before determining to approve the continuation of the Management Agreement.
In connection with their deliberations regarding the continuation of the Management Agreement, the Committee and the Board evaluated materials requested from the Investment Manager regarding the Fund and the Management Agreement, and discussed these materials with representatives of the Investment Manager at Committee meetings held on March 27, 2017, April 26, 2017 and June 13, 2017 and at Board meetings held on March 28, 2017 and June 14, 2017. In addition, the Board considers matters bearing on the Management Agreement at most of its other meetings throughout the year and meets regularly with senior management of the Trust and the Investment Manager. Through the Board’s Investment Oversight Committees, Trustees also meet with selected portfolio managers of the funds the Trustees oversee and other investment personnel at various times throughout the year. The Committee and the Board also consulted with its independent fee consultant, Fund counsel and the Independent Trustees’ independent legal counsel, who advised on various matters with respect to the Committee’s and the Board’s considerations and otherwise assisted the Committee and the Board in their deliberations. On June 13, 2017, the Committee recommended that the Board approve the continuation of the Management Agreement. On June 14, 2017, the Board, including the Independent Trustees, voting separately, unanimously approved the continuation of the Management Agreement for the Fund.
The Committee and the Board considered all information that they, their legal counsel or the Investment Manager believed reasonably necessary to evaluate and to determine whether to recommend for approval or approve the continuation of the Management Agreement. The information and factors considered by the Committee and the Board in recommending for approval or approving the continuation of the Management Agreement for the Fund included the following:
| • | Information on the investment performance of the Fund relative to the performance of a group of mutual funds determined to be comparable to the Fund by an independent third-party data provider, as well as performance relative to benchmarks; |
| • | Information on the Fund’s management fees and total expenses, including information comparing the Fund’s expenses to those of a group of comparable mutual funds, as determined by the independent third-party data provider; |
| • | The Investment Manager’s agreement to contractually limit or cap total operating expenses for the Fund through December 31, 2018 so that total operating expenses (excluding certain fees and expenses, such as transaction costs and certain other investment related expenses, interest, taxes, acquired fund fees and expenses, and infrequent and/or unusual expenses) would not exceed a specified annual rate, as a percentage of the Fund’s net assets; |
| • | The terms and conditions of the Management Agreement; |
| • | The current and proposed terms and conditions of other agreements and arrangements with affiliates of the Investment Manager relating to the operations of the Fund, including agreements with respect to the provision of distribution, transfer agency and shareholder services to the Fund; |
| • | Descriptions of various functions performed by the Investment Manager under the Management Agreement, including portfolio management and portfolio trading practices; |
| • | Information regarding the management fees of similarly-managed portfolios of other clients of the Investment Manager, including institutional separate accounts; |
| • | Information regarding the reputation, regulatory history and resources of the Investment Manager, including information regarding senior management, portfolio managers and other personnel; |
Columbia Global Technology Growth Fund | Annual Report 2017
| 35 |
Board Consideration and Approval of Management
Agreement (continued)
| • | Information regarding the capabilities of the Investment Manager with respect to compliance monitoring services, including an assessment of the Investment Manager’s compliance system by the Fund’s Chief Compliance Officer; and |
| • | The profitability to the Investment Manager and its affiliates from their relationships with the Fund. |
Nature, extent and quality of services provided under the Management Agreement
The Committee and the Board considered the nature, extent and quality of services provided to the Fund by the Investment Manager and its affiliates under the Management Agreement and under separate agreements for the provision of transfer agency and shareholder services, and the resources dedicated to the Fund and the other Columbia Funds by the Investment Manager and its affiliates. The Committee and the Board considered, among other things, the Investment Manager’s ability to attract, motivate and retain highly qualified research, advisory and supervisory investment professionals (including compensation programs for personnel involved in fund management, reputation and other attributes), the portfolio management services provided by those investment professionals, and the quality of the Investment Manager’s investment research capabilities and trade execution services. The Committee and the Board also considered the potential benefits to shareholders of investing in a mutual fund that is part of a fund complex offering exposure to a variety of asset classes and investment disciplines and providing a variety of fund and shareholder services.
The Committee and the Board also considered the professional experience and qualifications of the senior personnel of the Investment Manager, which included consideration of the Investment Manager’s experience with similarly-structured funds. The Committee and the Board noted the compliance programs of and the compliance-related resources provided to the Fund by the Investment Manager and its affiliates, and considered the Investment Manager’s ability to provide administrative services to the Fund and coordinate the activities of the Fund’s other service providers. After reviewing these and related factors, the Committee and the Board concluded, within the context of their overall conclusions, that the nature, extent and quality of the services provided to the Fund under the Management Agreement supported the continuation of the Management Agreement.
Investment performance
The Committee and the Board reviewed information about the performance of the Fund over various time periods, including performance information relative to benchmarks and information that compared the performance of the Fund to the performance of a group of comparable mutual funds as determined by the independent third-party data provider, and data provided by the independent fee consultant. The Committee and the Board also reviewed a description of the third party’s methodology for identifying the Fund’s peer groups for purposes of performance and expense comparisons.
The Committee and the Board noted that, through December 31, 2016, the Fund’s performance was in the thirty-third, eighteenth and eleventh percentile (where the best performance would be in the first percentile) of its category selected by the independent third-party data provider for the purposes of performance comparisons for the one-, three- and five-year periods, respectively.
The Committee and the Board also considered the Investment Manager’s performance and reputation generally, the Investment Manager’s historical responsiveness to Board concerns about performance, and the Investment Manager’s willingness to take steps intended to improve performance. After reviewing these and related factors, the Committee and the Board concluded, within the context of their overall conclusions, that the performance of the Fund and the Investment Manager was sufficient, in light of other considerations, to warrant the continuation of the Management Agreement.
Investment management fee rates and other expenses
The Committee and the Board considered the management fees charged to the Fund under the Management Agreement as well as the total expenses incurred by the Fund. In assessing the reasonableness of the fees under the Management Agreement, the Committee and the Board considered, among other information, the Fund’s total expense ratio as a percentage of average daily net assets. The Committee and the Board considered data provided by the independent third-party data provider and the independent fee consultant. The Committee and the Board noted that, as of December 31, 2016, the Fund’s actual management fee and net total expense ratio are ranked in the fourth and third quintiles, respectively,
| 36 | Columbia Global Technology Growth Fund | Annual Report 2017 |
Board Consideration and Approval of Management
Agreement (continued)
(where the lowest fees and expenses would be in the first quintile) against the Fund’s expense universe as determined by the independent third-party data provider for purposes of expense comparison. The Committee and the Board also took into account the fee waiver and expense limitation arrangements agreed to by the Investment Manager, as noted above.
The Committee and the Board also received and considered information about the management fees charged by the Investment Manager to institutional separate accounts. In considering the fees charged to those accounts, the Committee and the Board took into account, among other things, the Investment Manager’s representations about the differences between managing mutual funds as compared to other types of accounts, including differences in the services provided, differences in the risk profile of such business for the Investment Manager and the additional resources required to manage mutual funds effectively. The Committee and the Board also received and considered information about the fees charged by the Investment Manager for sub-advisory services it provides to comparable unaffiliated funds. In evaluating the Fund’s management fees, the Committee and the Board also took into account the demands, complexity and quality of the investment management of the Fund.
After reviewing these and related factors, the Committee and the Board concluded, within the context of their overall conclusions, that the management fee rates and expenses of the Fund, in light of other considerations, warranted the continuation of the Management Agreement.
Costs of services provided and profitability
The Committee and the Board also took note of the costs the Investment Manager and its affiliates incur in connection with the services provided and the profitability to the Investment Manager and its affiliates from their relationships with the Fund.
The Committee and the Board also considered the compensation directly or indirectly received by the Investment Manager’s affiliates in connection with their relationships with the Fund. The Committee and the Board reviewed information provided by management as to the profitability to the Investment Manager and its affiliates of their relationships with the Fund, information about the allocation of expenses used to calculate profitability, and comparisons of profitability levels realized in 2016 to profitability levels realized in 2015. When reviewing profitability, the Committee and the Board also considered court cases in which adviser profitability was an issue in whole or in part, the performance of similarly managed funds, the performance of the Fund, and the expense ratio of the Fund. In addition, the Committee and the Board considered information provided by the Investment Manager regarding the Investment Manager’s financial condition and comparing its profitability to that of other asset management firms that are, or are subsidiaries of, publicly traded companies. In this regard, the Committee and the Board also considered data provided by the independent fee consultant.
After reviewing these and related factors, the Committee and the Board concluded, within the context of their overall conclusions, that the costs of services provided and the profitability to the Investment Manager and its affiliates from their relationships with the Fund supported the continuation of the Management Agreement.
Economies of scale
The Committee and the Board considered the potential existence of economies of scale in the provision by the Investment Manager of services to the Fund, to groups of related funds, and to the Investment Manager’s investment advisory clients as a whole, and whether those economies of scale were shared with the Fund through breakpoints in investment management fees or other means, such as expense limitation arrangements and additional investments by the Investment Manager in investment, trading, compliance and other resources. The Committee and the Board noted that the management fee schedules for the Fund contained breakpoints that would reduce the fee rate on assets above specified threshold levels.
In considering these matters, the Committee and the Board also considered the costs of the services provided and the profitability to the Investment Manager and its affiliates from their relationships with the Fund, as discussed above. After reviewing these and related factors, the Committee and the Board concluded, within the context of their overall conclusions, that the extent to which any economies of scale were expected to be shared with the Fund supported the continuation of the Management Agreement.
Columbia Global Technology Growth Fund | Annual Report 2017
| 37 |
Board Consideration and Approval of Management
Agreement (continued)
Other benefits to the Investment Manager
The Committee and the Board received and considered information regarding “fall-out” or ancillary benefits received by the Investment Manager and its affiliates as a result of their relationships with the Fund, such as the engagement of the Investment Manager’s affiliates to provide distribution, transfer agency and shareholder services to the Fund. In this regard, among other matters, the Committee and the Board considered that the Fund’s distributor retains a portion of the distribution fees from the Fund and receives a portion of the sales charges on sales or redemptions of certain classes of shares of the Fund. The Committee and the Board also considered the benefits of research made available to the Investment Manager by reason of brokerage commissions generated by the Fund’s securities transactions, and reviewed information about the Investment Manager’s practices with respect to allocating portfolio transactions for brokerage and research services. The Committee and the Board recognized that the Investment Manager’s profitability would be somewhat lower without these benefits.
Conclusion
The Committee and the Board reviewed all of the above considerations in reaching their decisions to recommend or approve the continuation of the Management Agreement. In their deliberations, the Trustees did not identify any particular information that was all-important or controlling, and individual Trustees may have attributed different weights to the various factors. Based on their evaluation of all factors that they deemed to be material, including those factors described above, and assisted by the advice of independent legal counsel, the Board, including the Independent Trustees, voting separately, unanimously approved the continuation of the Management Agreement.
| 38 | Columbia Global Technology Growth Fund | Annual Report 2017 |
The Fund mails one shareholder report to each shareholder address. If you would like more than one report, please call shareholder services at 800.345.6611 and additional reports will be sent to you.
Proxy voting policies and procedures
The policy of the Board of Trustees is to vote the proxies of the companies in which the Fund holds investments consistent with the procedures as stated in the Statement of Additional Information (SAI). You may obtain a copy of the SAI without charge by calling 800.345.6611; contacting your financial intermediary; visiting investor.columbiathreadneedleus.com; or searching the website of the Securities and Exchange Commission (SEC) at sec.gov. Information regarding how the Fund voted proxies relating to portfolio securities is filed with the SEC by August 31st for the most recent 12-month period ending June 30th of that year, and is available without charge by visiting investor.columbiathreadneedleus.com, or searching the website of the SEC at sec.gov.
Quarterly schedule of investments
The Fund files a complete schedule of portfolio holdings with the SEC for the first and third quarters of each fiscal year on Form N-Q. The Fund’s Form N-Q is available on the SEC’s website at sec.gov and may be reviewed and copied at the SEC’s Public Reference Room in Washington, D.C. Information on the operation of the Public Reference Room may be obtained by calling 800.SEC.0330. The Fund’s complete schedule of portfolio holdings, as filed on Form N-Q, can also be obtained without charge, upon request, by calling 800.345.6611.
Additional Fund information
For more information about the Fund, please visit investor.columbiathreadneedleus.com or call 800.345.6611. Customer Service Representatives are available to answer your questions Monday through Friday from 8 a.m. to 7 p.m. Eastern time.
Fund investment manager
Columbia Management Investment Advisers, LLC
225 Franklin Street
Boston, MA 02110
Fund distributor
Columbia Management Investment Distributors, Inc.
225 Franklin Street
Boston, MA 02110
Fund transfer agent
Columbia Management Investment Services Corp.
P.O. Box 8081
Boston, MA 02266-8081
Columbia Global Technology Growth Fund | Annual Report 2017
| 39 |
[THIS PAGE INTENTIONALLY LEFT BLANK]
[THIS PAGE INTENTIONALLY LEFT BLANK]
Columbia Global Technology Growth Fund
P.O. Box 8081
Boston, MA 02266-8081
Please read and consider the investment objectives, risks, charges and expenses for any fund carefully before investing. For a prospectus and summary prospectus, which contains this and other important information about the Fund, go to
investor.columbiathreadneedleus.com. The Fund is distributed by Columbia Management Investment Distributors, Inc., member FINRA, and managed by Columbia Management Investment Advisers, LLC.
Columbia Threadneedle Investments (Columbia Threadneedle) is the global brand name of the Columbia and Threadneedle group of companies. All rights reserved. Columbia Management Investment Distributors, Inc., 225 Franklin Street, Boston, MA 02110-2804
© 2017 Columbia Management Investment Advisers, LLC.
investor.columbiathreadneedleus.com

Annual Report
August 31, 2017
Not FDIC Insured • No bank guarantee • May lose value
Dear Shareholders,
The current outlook for financial markets is clouded by two primary concerns: the high valuation of equities and the direction of interest rates. Following the U.S. presidential election, U.S. equities rallied based on the assumption that the new administration’s policies would stimulate growth quickly. Unfortunately it’s unclear whether those measures will get passed, much less passed quickly. In fixed income, uncertainty stems from the possibility that interest rates won’t rise as rapidly as expected if the administration’s proposed growth policies are not implemented.
Given this uncertainty, investors value a consistent approach more than ever. Investors want strong, repeatable risk-adjusted returns. Consistency — not surprises. As a leading global asset manager, we believe our consistent, collaborative investment approach enables us to deliver the dependable experience your portfolio demands. So, how do we strive to deliver a consistent investment experience?
Better insights
Your portfolio benefits from the investment insights uncovered by our talented investment teams around the world.
Better decisions
Our collaborative, interactive environment enables our investment teams to construct portfolios that take advantage of the best investment ideas.
Better outcomes
We aim to deliver a consistent experience, which means fewer surprises, dependable insights, and products designed to do the thing you want.
Whether you’re trying to save money to help your children go to college or for your own retirement, it’s the consistency of the return that is most essential. People who chase higher returns are usually also the first to sell when that investment goes through a bad patch. We try to combat this behavioral tendency by offering strategies that aim for a more consistent return. Our goal is for investors to panic less during periods of volatility, which can have a significant effect on their long-term results.
Nothing is more important to us than making sure those who have entrusted us to protect and grow their assets can do what matters most to them: build a nest egg, leave a legacy, and live confidently — now and throughout retirement. It’s why our talented professionals around the world work together to uncover uncommon opportunities and why our process encourages challenge and debate around our most compelling ideas to ensure better informed investment decisions, which hopefully lead to better outcomes for you.
Your success is our priority. Talk to your financial advisor about how working with Columbia Threadneedle Investments may help you position your portfolio for consistent, sustainable outcomes, no matter the market conditions.
Sincerely,
Christopher O. Petersen
President, Columbia Funds
Investors should consider the investment objectives, risks, charges and expenses of a mutual fund carefully before investing. For a free prospectus and summary prospectus, which contains this and other important information about a fund, visit investor.columbiathreadneedleus.com. The prospectus should be read carefully before investing.
Columbia Funds are distributed by Columbia Management Investment Distributors, Inc., member FINRA, and managed by Columbia Management Investment Advisers, LLC.
© 2017 Columbia Management Investment Advisers, LLC. All rights reserved.
Columbia Balanced Fund | Annual Report 2017
Columbia Balanced Fund | Annual Report 2017
Investment objective
Columbia Balanced Fund (the Fund) seeks high total return by investing in common stocks and debt securities.
Portfolio management
Guy Pope, CFA
Co-lead manager
Managed Fund since 1997
Leonard Aplet, CFA
Co-lead manager
Managed Fund since 1991
Brian Lavin, CFA
Co-manager
Managed Fund since 2010
Gregory Liechty
Co-manager
Managed Fund since 2011
Ronald Stahl, CFA
Co-manager
Managed Fund since 2005
| Average annual total returns (%) (for the period ended August 31, 2017) |
| | | Inception | 1 Year | 5 Years | 10 Years |
| Class A | Excluding sales charges | 11/01/02 | 9.54 | 10.02 | 7.65 |
| | Including sales charges | | 3.24 | 8.73 | 7.01 |
| Class C | Excluding sales charges | 10/13/03 | 8.71 | 9.21 | 6.84 |
| | Including sales charges | | 7.71 | 9.21 | 6.84 |
| Class K* | 03/07/11 | 9.62 | 10.13 | 7.71 |
| Class R* | 09/27/10 | 9.27 | 9.77 | 7.38 |
| Class R4* | 11/08/12 | 9.82 | 10.31 | 7.92 |
| Class R5* | 03/07/11 | 9.91 | 10.42 | 7.98 |
| Class T* | Excluding sales charges | 04/03/17 | 9.61 | 10.06 | 7.68 |
| | Including sales charges | | 6.87 | 9.51 | 7.41 |
| Class Y* | 11/08/12 | 9.96 | 10.47 | 7.99 |
| Class Z | 10/01/91 | 9.83 | 10.30 | 7.91 |
| Blended Benchmark | | 9.74 | 9.46 | 6.62 |
| S&P 500 Index | | 16.23 | 14.34 | 7.61 |
| Bloomberg Barclays U.S. Aggregate Bond Index | | 0.49 | 2.19 | 4.40 |
Returns for Class A shares are shown with and without the maximum initial sales charge of 5.75%. Returns for Class C shares are shown with and without the 1.00% contingent deferred sales charge for the first year only. Returns for Class T shares are shown with and without the maximum initial sales charge of 2.50% per transaction. The Fund’s other share classes are not subject to sales charges and have limited eligibility. Please see the Fund’s prospectus for details. Performance for different share classes will vary based on differences in sales charges and fees associated with each share class. All results shown assume reinvestment of distributions during the period. Returns do not reflect the deduction of taxes that a shareholder may pay on Fund distributions or on the redemption of Fund shares. Performance results reflect the effect of any fee waivers or reimbursements of Fund expenses by Columbia Management Investment Advisers, LLC and/or any of its affiliates. Absent these fee waivers or expense reimbursement arrangements, performance results would have been lower.
The performance information shown represents past performance and is not a guarantee of future results. The investment return and principal value of your investment will fluctuate so that your shares, when redeemed, may be worth more or less than their original cost. Current performance may be lower or higher than the performance information shown. You may obtain performance information current to the most recent month-end by contacting your financial intermediary, visiting investor.columbiathreadneedleus.com or calling 800.345.6611.
| * | The returns shown for periods prior to the share class inception date (including returns for the Life of the Fund, if shown, which are since Fund inception) include the returns of the Fund’s oldest share class. These returns are adjusted to reflect any higher class-related operating expenses of the newer share classes, as applicable. Please visit investor.columbiathreadneedleus.com/investment-products/mutual-funds/appended-performance for more information. |
The Blended Benchmark is a weighted custom composite consisting of 60% S&P 500 Index and 40% Bloomberg Barclays U.S. Aggregate Bond Index.
The S&P 500 Index, an unmanaged index, measures the performance of 500 widely held, large-capitalization U.S. stocks and is frequently used as a general measure of market performance.
The Bloomberg Barclays U.S. Aggregate Bond Index is a broad-based benchmark that measures the investment-grade, U.S. dollar-denominated, fixed-rate taxable bond market, including Treasuries, government-related and corporate securities, mortgage-backed securities (agency fixed-rate and hybrid adjustable-rate mortgage passthroughs), asset-backed securities, and commercial mortgage-backed securities.
Indices are not available for investment, are not professionally managed and do not reflect sales charges, fees, brokerage commissions, taxes or other expenses of investing. Securities in the Fund may not match those in an index.
| 2 | Columbia Balanced Fund | Annual Report 2017 |
Fund at a Glance (continued)
Performance of a hypothetical $10,000 investment (August 31, 2007 — August 31, 2017)
The chart above shows the change in value of a hypothetical $10,000 investment in Class A shares of Columbia Balanced Fund during the stated time period, and does not reflect the deduction of taxes that a shareholder may pay on Fund distributions or on the redemption of Fund shares.
| Top 10 holdings (%) (at August 31, 2017) |
| Apple, Inc. | 3.1 |
| Berkshire Hathaway, Inc., Class B | 2.1 |
| JPMorgan Chase & Co. | 2.0 |
| Microsoft Corp. | 2.0 |
| Citigroup, Inc. | 2.0 |
| Philip Morris International, Inc. | 1.9 |
| Facebook, Inc., Class A | 1.8 |
| Johnson & Johnson | 1.8 |
| Comcast Corp., Class A | 1.7 |
| Honeywell International, Inc. | 1.5 |
Percentages indicated are based upon total investments (excluding Money Market Funds).
For further detail about these holdings, please refer to the section entitled “Portfolio of Investments.”
Fund holdings are as of the date given, are subject to change at any time, and are not recommendations to buy or sell any security.
| Portfolio breakdown (%) (at August 31, 2017) |
| Asset-Backed Securities — Non-Agency | 3.3 |
| Commercial Mortgage-Backed Securities - Agency | 1.7 |
| Commercial Mortgage-Backed Securities - Non-Agency | 2.4 |
| Common Stocks | 59.5 |
| Corporate Bonds & Notes | 11.8 |
| Foreign Government Obligations | 0.4 |
| Inflation-Indexed Bonds | 0.6 |
| Money Market Funds | 7.3 |
| Residential Mortgage-Backed Securities - Agency | 7.9 |
| Residential Mortgage-Backed Securities - Non-Agency | 1.5 |
| Senior Loans | 0.0 (a) |
| U.S. Government & Agency Obligations | 1.3 |
| U.S. Treasury Obligations | 2.3 |
| Total | 100.0 |
Percentages indicated are based upon total investments. The Fund’s portfolio composition is subject to change.
Columbia Balanced Fund | Annual Report 2017
| 3 |
Fund at a Glance (continued)
| Equity sector breakdown (%) (at August 31, 2017) |
| Consumer Discretionary | 11.7 |
| Consumer Staples | 6.9 |
| Energy | 6.8 |
| Financials | 17.8 |
| Health Care | 17.8 |
| Industrials | 7.8 |
| Information Technology | 23.9 |
| Materials | 1.8 |
| Real Estate | 1.6 |
| Telecommunication Services | 2.6 |
| Utilities | 1.3 |
| Total | 100.0 |
Percentages indicated are based upon total equity investments. The Fund’s portfolio composition is subject to change.
| 4 | Columbia Balanced Fund | Annual Report 2017 |
Manager Discussion of Fund Performance
For the 12-month period that ended August 31, 2017, the Fund’s Class A shares returned 9.54% excluding sales charges. The Fund’s Blended Benchmark returned 9.74% for the same time period. During the same 12-month period, the Fund’s equity benchmark, the S&P 500 Index, returned 16.23%, while the Fund’s fixed-income benchmark, the Bloomberg Barclays U.S. Aggregate Bond Index, returned 0.49%. An overweight in stocks benefited overall results, as stocks outperformed bonds. The equity portion of the Fund performed generally in line with the equity benchmark while the fixed-income portion outperformed the fixed-income benchmark.
U.S. financial markets delivered gains
Global events, political uncertainty and mixed economic data were enough to keep investors off balance early in the 12-month period, as financial markets moved sharply in reaction to each significant change on the world stage. However, the end of a contentious U.S. presidential contest in November 2016 eliminated a key element of uncertainty, and the U.S. equity markets moved solidly higher through the end of the period. Bonds eked out modest gains as interest rates rose. Rates and bond prices move in opposite directions. Global growth picked up early in 2017. Positive U.S. economic data, steady job growth, rising corporate earnings and accelerated manufacturing activity further bolstered investor confidence.
The Federal Reserve (the Fed) raised the target range of its benchmark short-term interest rate three times during the period, bringing it to between 1.00% and 1.25% in June 2017. The Fed signaled that it was prepared to raise rates more aggressively on the heels of strong job gains and progress towards its 2.0% inflation target, creating expectations that the June rate hike may not be the last during the calendar year.
Against this backdrop, the S&P 500 Index rose 16.23%, with dividends reinvested. The Bloomberg Barclays U.S. Aggregate Bond Index returned 0.49%. Most non-Treasury sectors produce positive results, as yield spreads in credit and structured bond sectors tightened relative to similar-duration Treasuries.
Equity portfolio delivered solid return
During the period, stock selection was particularly strong in the information technology, financials and materials sectors. Within information technology, Activision, a leading electronic gaming company, and Apple were top performers for the Fund. Activision continued to benefit from the migration to digital, and Apple rose on expectations for the iPhone 8 and 10 (or X). Within financials, Morgan Stanley, Citigroup and JPMorgan all benefited from expectations of a slightly more lenient regulatory environment under the new administration and the impact of rising interest rates, which are helpful to financial companies. In the materials sector, Sherwin Williams was a big winner for the Fund. The company’s core paint business did well in a favorable environment for housing. The acquisition of competitor Valspar proved to be accretive to the overall company and helped give earnings an extra boost. Elsewhere in the portfolio, the consumer discretionary sector yielded many stocks with returns in excess of 20% for the period, including Royal Caribbean, McDonalds, Marriott, Comcast and Expedia. Royal Caribbean rebounded after a challenging 2016. Pricing firmed up in 2017 and Royal Caribbean was the beneficiary of this turnaround. Investors responded favorably to good execution by McDonalds’ management. Marriott benefited as the merger with Starwood has gone smoothly so far. Comcast and Expedia were two other solid holdings during the period. In health care, Vertex outperformed based on favorable data for its cystic fibrosis treatment. Anthem benefited as health maintenance organizations got a boost as uncertainty created by merger and acquisition activity receded and a perception that the new administration’s policies would be good for the industry.
Industrials, telecommunication services and health care were the biggest sector detractors from relative Fund results for the period. In the industrials sector, Dun & Bradstreet and Nielsen Holdings were major laggards. With Dun & Bradstreet, we were banking on an organic growth turnaround, which failed to materialize. Nielsen’s revenues were hurt as big consumer staples customers pulled back on their spending. In the telecomm sector, fundamental trends hurt Verizon and AT&T. Elsewhere in the portfolio, Michael’s lost ground on weaker same-store sales, as retailers continued to struggle against online competition and a tough retail environment. Kroger was hurt by increased competition in food retailing. We eliminated both Michael’s and Kroger from the portfolio.
Columbia Balanced Fund | Annual Report 2017
| 5 |
Manager Discussion of Fund Performance (continued)
Fixed income outperformed its benchmark
Duration positioning and an emphasis on non-Treasury bonds drove the performance advantage of the Fund’s fixed-income portfolio relative to its fixed-income benchmark. The Fund’s duration was shorter than the benchmark, which benefited performance as interest rates rose for all maturities. Corporate bonds outperformed similar-duration Treasuries by 3.09 percentage points, as measured by the Bloomberg Barclays Credit Index. Within the corporate market, the Fund’s exposure to the basic industry, energy and insurance subsectors were particularly positive, as these segments were the best performers. An overweight in BBB rated bonds also aided results, as BBB outperformed A and AA credit. The Fund’s small allocation to the high-yield sector was also a benefit, as lower quality corporate notes outperformed higher quality.
A strategic underweight in GNMA mortgages versus the benchmark was an additional plus for performance, as it was the only spread sector that lagged for the period. (The spread is the yield difference between any given bond sector and similar duration Treasuries.) The Fund’s exposure to asset-backed securities (ABS) and commercial mortgage-backed securities (CMBS) also aided performance, as both sectors did better than Treasuries. Within CMBS, the Fund remained overweight in agency and non-agency bonds because we find both segments attractive. ABS was one of the Fund’s largest overweights relative to the benchmark, and we continue to find relative value there, particularly in auto-backed securities.
During the period, we shifted the Fund’s securitized positioning very slightly. We modestly reduced exposure to mortgages and CMBS and increased the allocation to ABS. We also increased the Fund’s allocation to agency securities, focusing on floating rate notes.
At period end
The Fund’s solid results from its equity portfolio had two different phases for the 12-month period. The first four months were a period of underperformance, as the U.S. presidential race created uncertainty before the election and investors rapidly rotated into and out of stocks that they viewed as beneficiaries of the new administration and its policies after the election. However, we did not get carried away with these trends, many of which turned out to be transitory, and the Fund enjoyed a significant comeback in the last eight months of the period. We stayed with our core contrarian philosophy in constructing the portfolio and managing it from day to day, and we believe this discipline served our shareholders well.
Within the Fund’s fixed-income portfolio, we maintained a duration that was shorter than the benchmark. Because the Fed has indicated that the timing of interest rate hikes and the reduction of its balance sheet will remain data-dependent, we continue to watch inflation expectations, employment and global economic growth, global fiscal and monetary policies and the commodity market. At the close of the reporting period, risk premiums remained reasonably attractive in most sectors, although not as attractive as they were at the beginning.
Relative to the benchmark, the Fund remained underweight in U.S. government securities. We believe that ABS and CMBS continue to offer attractive spreads. Within the CMBS market we preferred seasoned, AAA, super senior paper, as well as short GNMA government-backed project loan tranches. Within the corporate sector, the Fund remained overweight in the banking, insurance, communications and electric utility industries.
Market risk may affect a single issuer, sector of the economy, industry or the market as a whole. There are risks associated with fixed-income investments, including credit risk, interest rate risk, and prepayment and extension risk. In general, bond prices rise when interest rates fall and vice versa. This effect is usually more pronounced for longer term securities. A rise in interest rates may result in a price decline of fixed-income instruments held by the Fund, negatively impacting its performance and NAV. Falling rates may result in the Fund investing in lower yielding debt instruments, lowering the Fund’s income and yield. These risks may be heightened for longer maturity and duration securities. Foreign investments subject the Fund to risks, including political, economic, market, social and others within a particular country, as well as to currency instabilities and less stringent financial and accounting standards generally applicable to U.S. issuers. Investing in derivatives is a specialized activity that involves special risks that subject the Fund to significant loss potential, including when used as leverage, and may result in greater fluctuation in Fund value. See the Fund’s prospectus for more information on these and other risks.
The views expressed in this report reflect the current views of the respective parties. These views are not guarantees of future performance and involve certain risks, uncertainties and assumptions that are difficult to predict, so actual outcomes and results may differ significantly from the views expressed. These views are subject to change at any time based upon economic, market or other conditions and the respective parties disclaim any responsibility to
| 6 | Columbia Balanced Fund | Annual Report 2017 |
Manager Discussion of Fund Performance (continued)
update such views. These views may not be relied on as investment advice and, because investment decisions for a Columbia fund are based on numerous factors, may not be relied on as an indication of trading intent on behalf of any particular Columbia fund. References to specific securities should not be construed as a recommendation or investment advice.
Columbia Balanced Fund | Annual Report 2017
| 7 |
Understanding Your Fund’s Expenses
(Unaudited)
As an investor, you incur two types of costs. There are transaction costs, which generally include sales charges on purchases and may include redemption fees. There are also ongoing costs, which generally include management fees, distribution and/or service fees, and other fund expenses. The following information is intended to help you understand your ongoing costs (in dollars) of investing in the Fund and to help you compare these costs with the ongoing costs of investing in other mutual funds.
Analyzing your Fund’s expenses
To illustrate these ongoing costs, we have provided examples and calculated the expenses paid by investors in each share class of the Fund during the period. The actual and hypothetical information in the table is based on an initial investment of $1,000 at the beginning of the period indicated and held for the entire period. Expense information is calculated two ways and each method provides you with different information. The amount listed in the “Actual” column is calculated using the Fund’s actual operating expenses and total return for the period. You may use the Actual information, together with the amount invested, to estimate the expenses that you paid over the period. Simply divide your account value by $1,000 (for example, an $8,600 account value divided by $1,000 = 8.6), then multiply the results by the expenses paid during the period under the “Actual” column. The amount listed in the “Hypothetical” column assumes a 5% annual rate of return before expenses (which is not the Fund’s actual return) and then applies the Fund’s actual expense ratio for the period to the hypothetical return. You should not use the hypothetical account values and expenses to estimate either your actual account balance at the end of the period or the expenses you paid during the period. See “Compare with other funds” below for details on how to use the hypothetical data.
Compare with other funds
Since all mutual funds are required to include the same hypothetical calculations about expenses in shareholder reports, you can use this information to compare the ongoing cost of investing in the Fund with other funds. To do so, compare the hypothetical example with the 5% hypothetical examples that appear in the shareholder reports of other funds. As you compare hypothetical examples of other funds, it is important to note that hypothetical examples are meant to highlight the ongoing costs of investing in a fund only and do not reflect any transaction costs, such as sales charges, or redemption or exchange fees. Therefore, the hypothetical calculations are useful in comparing ongoing costs only, and will not help you determine the relative total costs of owning different funds. If transaction costs were included in these calculations, your costs would be higher.
| March 1, 2017 — August 31, 2017 |
| | Account value at the
beginning of the
period ($) | Account value at the
end of the
period ($) | Expenses paid during
the period ($) | Fund’s annualized
expense ratio (%) |
| | Actual | Hypothetical | Actual | Hypothetical | Actual | Hypothetical | Actual |
| Class A | 1,000.00 | 1,000.00 | 1,052.80 | 1,020.32 | 5.02 | 4.94 | 0.97 |
| Class C | 1,000.00 | 1,000.00 | 1,048.90 | 1,016.53 | 8.88 | 8.74 | 1.72 |
| Class K | 1,000.00 | 1,000.00 | 1,053.30 | 1,020.62 | 4.71 | 4.63 | 0.91 |
| Class R | 1,000.00 | 1,000.00 | 1,051.60 | 1,019.06 | 6.31 | 6.21 | 1.22 |
| Class R4 | 1,000.00 | 1,000.00 | 1,054.20 | 1,021.58 | 3.73 | 3.67 | 0.72 |
| Class R5 | 1,000.00 | 1,000.00 | 1,054.50 | 1,021.88 | 3.42 | 3.36 | 0.66 |
| Class T | 1,000.00 | 1,000.00 | 1,048.40 (a) | 1,020.32 | 4.06 (a) | 4.94 | 0.97 (a) |
| Class Y | 1,000.00 | 1,000.00 | 1,054.80 | 1,022.13 | 3.16 | 3.11 | 0.61 |
| Class Z | 1,000.00 | 1,000.00 | 1,054.20 | 1,021.58 | 3.73 | 3.67 | 0.72 |
(a) Based on operations from April 3, 2017 (commencement of operations) through the stated period end.
Expenses paid during the period are equal to the annualized expense ratio for each class as indicated above, multiplied by the average account value over the period and then multiplied by the number of days in the Fund’s most recent fiscal half year and divided by 365.
Expenses do not include fees and expenses incurred indirectly by the Fund from its investment in underlying funds, including affiliated and non-affiliated pooled investment vehicles, such as mutual funds and exchange-traded funds.
| 8 | Columbia Balanced Fund | Annual Report 2017 |
Portfolio of Investments
August 31, 2017
(Percentages represent value of investments compared to net assets)
| Asset-Backed Securities — Non-Agency 3.3% |
| Issuer | Coupon
Rate | | Principal
Amount ($) | Value ($) |
| Ally Master Owner Trust |
| Series 2012-5 Class A |
| 09/15/2019 | 1.540% | | 8,035,000 | 8,035,116 |
| American Credit Acceptance Receivables Trust(a) |
| Series 2016-1A Class A |
| 05/12/2020 | 2.370% | | 143,930 | 143,959 |
| Series 2016-3 Class A |
| 11/12/2020 | 1.700% | | 1,878,902 | 1,876,768 |
| Series 2016-4 Class A |
| 06/12/2020 | 1.500% | | 4,257,100 | 4,252,551 |
| ARI Fleet Lease Trust(a) |
| Series 2015-A Class A2 |
| 11/15/2018 | 1.110% | | 294,049 | 293,692 |
| Avis Budget Rental Car Funding AESOP LLC(a) |
| Series 2013-1A Class A |
| 09/20/2019 | 1.920% | | 100,000 | 99,992 |
| Series 2016-2A Class A |
| 11/20/2022 | 2.720% | | 4,100,000 | 4,120,958 |
| BMW Vehicle Lease Trust |
| Series 2016-2 Class A2 |
| 01/22/2019 | 1.230% | | 1,647,845 | 1,646,517 |
| CarFinance Capital Auto Trust(a) |
| Series 2015-1A Class A |
| 06/15/2021 | 1.750% | | 412,962 | 412,690 |
| CCG Receivables Trust(a) |
| Series 2015-1 Class A2 |
| 11/14/2018 | 1.460% | | 1,399,034 | 1,397,592 |
| Chesapeake Funding II LLC(a) |
| Series 2016-1A Class A1 |
| 03/15/2028 | 2.110% | | 3,552,860 | 3,561,300 |
| Series 2016-2A Class A1 |
| 06/15/2028 | 1.880% | | 5,183,060 | 5,186,913 |
| Series 2017-3A Class A1 |
| 08/15/2029 | 1.910% | | 4,000,000 | 4,002,294 |
| Chrysler Capital Auto Receivables Trust(a) |
| Series 2016-BA Class A3 |
| 07/15/2021 | 1.640% | | 11,200,000 | 11,189,340 |
| Conn’s Receivables Funding LLC(a) |
| Series 2016-B Class A |
| 10/15/2018 | 3.730% | | 760,712 | 761,106 |
| Diamond Resorts Owner Trust(a) |
| Series 2013-2 Class A |
| 05/20/2026 | 2.270% | | 287,561 | 286,407 |
| DT Auto Owner Trust(a) |
| Series 2016-4A Class A |
| 11/15/2019 | 1.440% | | 2,371,496 | 2,370,609 |
| Exeter Automobile Receivables Trust(a) |
| Series 2015-2A Class A |
| 11/15/2019 | 1.540% | | 125,258 | 125,250 |
| Asset-Backed Securities — Non-Agency (continued) |
| Issuer | Coupon
Rate | | Principal
Amount ($) | Value ($) |
| Series 2015-3A Class A |
| 03/16/2020 | 2.000% | | 444,266 | 444,312 |
| Series 2016-1A Class A |
| 07/15/2020 | 2.350% | | 873,751 | 873,592 |
| Series 2016-3A Class A |
| 11/16/2020 | 1.840% | | 1,891,682 | 1,887,120 |
| Ford Credit Auto Owner Trust(a) |
| Series 2017-1 Class A |
| 08/15/2028 | 2.620% | | 15,400,000 | 15,704,929 |
| Ford Credit Floorplan Master Owner Trust |
| Series 2015-1 Class A1 |
| 01/15/2020 | 1.420% | | 9,250,000 | 9,247,648 |
| Ford Credit Floorplan Master Owner Trust A |
| Series 2016-5 Class 1A |
| 11/15/2021 | 1.950% | | 7,800,000 | 7,834,400 |
| Series 2017-1 Class A1 |
| 05/15/2022 | 2.070% | | 10,000,000 | 10,059,074 |
| GM Financial Automobile Leasing Trust |
| Series 2016-3 Class A3 |
| 12/20/2019 | 1.610% | | 2,500,000 | 2,495,228 |
| Series 2017-2 Class A3 |
| 09/21/2020 | 2.020% | | 4,450,000 | 4,449,853 |
| GMF Floorplan Owner Revolving Trust(a) |
| Series 2017-1 Class A1 |
| 01/18/2022 | 2.220% | | 5,120,000 | 5,163,261 |
| Hertz Fleet Lease Funding LP(a),(b) |
| Series 2014-1 Class A |
1-month USD LIBOR + 0.400%
04/10/2028 | 1.631% | | 96,001 | 96,002 |
| Hertz Vehicle Financing LLC(a) |
| Series 2016-3A Class A |
| 07/25/2020 | 2.270% | | 14,055,000 | 13,979,352 |
| Hilton Grand Vacations Trust(a) |
| Series 2013-A Class A |
| 01/25/2026 | 2.280% | | 580,710 | 579,831 |
| Series 2014-AA Class A |
| 11/25/2026 | 1.770% | | 988,839 | 979,178 |
| Hyundai Auto Lease Securitization Trust(a) |
| Series 2017-A Class A2A |
| 07/15/2019 | 1.560% | | 2,300,000 | 2,299,332 |
| Hyundai Floorplan Master Owner Trust(a) |
| Series 2016-1A Class A2 |
| 03/15/2021 | 1.810% | | 5,500,000 | 5,508,306 |
| John Deere Owner Trust |
| Series 2017-B Class A3 |
| 10/15/2021 | 1.820% | | 4,120,000 | 4,135,069 |
| Kubota Credit Owner Trust(a) |
| Series 2016-1A Class A3 |
| 07/15/2020 | 1.500% | | 3,525,000 | 3,510,780 |
The accompanying Notes to Financial Statements are an integral part of this statement.
Columbia Balanced Fund | Annual Report 2017
| 9 |
Portfolio of Investments (continued)
August 31, 2017
| Asset-Backed Securities — Non-Agency (continued) |
| Issuer | Coupon
Rate | | Principal
Amount ($) | Value ($) |
| MVW Owner Trust(a) |
| Series 2015-1A Class A |
| 12/20/2032 | 2.520% | | 2,289,467 | 2,274,889 |
| Series 2016-1A Class A |
| 12/20/2033 | 2.250% | | 4,032,876 | 3,997,624 |
| Navitas Equipment Receivables LLC(a) |
| Series 2016-1 Class A2 |
| 06/15/2021 | 2.200% | | 3,374,505 | 3,375,842 |
| New York City Tax Lien Trust(a) |
| Series 2016-A Class A |
| 11/10/2029 | 1.470% | | 857,775 | 853,040 |
| Series 2017-A Class A |
| 11/10/2030 | 1.870% | | 5,200,000 | 5,200,000 |
| Nissan Auto Lease Trust |
| Series 2017-A Class A3 |
| 04/15/2020 | 1.910% | | 3,850,000 | 3,851,418 |
| OneMain Direct Auto Receivables Trust(a) |
| Series 2016-1A Class A |
| 01/15/2021 | 2.040% | | 616,428 | 617,049 |
| PFS Tax Lien Trust(a) |
| Series 2014-1 Class NOTE |
| 05/15/2029 | 1.440% | | 131,967 | 131,631 |
| Santander Drive Auto Receivables Trust |
| Series 2016-3 Class A2 |
| 11/15/2019 | 1.340% | | 2,834,328 | 2,832,937 |
| Sierra Receivables Funding Co., LLC(a) |
| Series 2017-1A Class A |
| 03/20/2034 | 2.910% | | 3,886,999 | 3,942,276 |
| Sierra Timeshare Receivables Funding LLC(a) |
| Series 2016-3A Class A |
| 10/20/2033 | 2.430% | | 4,536,376 | 4,479,841 |
| SLM Private Education Loan Trust(a) |
| Series 2012-A Class A2 |
| 01/17/2045 | 3.830% | | 4,256,010 | 4,330,139 |
| SLM Student Loan Trust(b) |
| Series 2005-4 Class A3 |
3-month USD LIBOR + 0.120%
01/25/2027 | 1.434% | | 10,181,663 | 10,133,209 |
| Series 2006-5 Class A5 |
3-month USD LIBOR + 0.110%
01/25/2027 | 1.424% | | 3,487,750 | 3,481,485 |
| SMART ABS Trust |
| Series 2015-1US Class A3A |
| 09/14/2018 | 1.500% | | 483,367 | 483,138 |
| SMB Private Education Loan Trust(a),(b) |
| Series 2015-B Class A1 |
1-month USD LIBOR + 0.700%
02/15/2023 | 1.926% | | 116,637 | 116,641 |
| Asset-Backed Securities — Non-Agency (continued) |
| Issuer | Coupon
Rate | | Principal
Amount ($) | Value ($) |
| SoFi Consumer Loan Program LLC(a) |
| Series 2017-4 Class A |
| 05/26/2026 | 2.500% | | 5,777,591 | 5,791,211 |
| TAL Advantage V LLC(a) |
| Series 2014-2A Class A1 |
| 05/20/2039 | 1.700% | | 306,834 | 306,338 |
| Verizon Owner Trust(a) |
| Series 2016-1A Class A |
| 01/20/2021 | 1.420% | | 17,855,000 | 17,799,067 |
| Series 2016-2A Class A |
| 05/20/2021 | 1.680% | | 11,540,000 | 11,536,193 |
| Series 2017-1A Class A |
| 09/20/2021 | 2.060% | | 5,150,000 | 5,183,290 |
| Series 2017-2A Class A |
| 12/20/2021 | 1.920% | | 2,925,000 | 2,933,230 |
| Westlake Automobile Receivables Trust(a) |
| Series 2016-3A Class A2 |
| 10/15/2019 | 1.420% | | 4,149,742 | 4,146,227 |
Total Asset-Backed Securities — Non-Agency
(Cost $236,311,268) | 236,807,036 |
|
| Commercial Mortgage-Backed Securities - Agency 1.7% |
| | | | |
| Federal National Mortgage Association |
| Series 2006-M2 Class A2A |
| 10/25/2032 | 5.271% | | 1,498,573 | 1,596,250 |
| Government National Mortgage Association(b),(c) |
| CMO Series 2015-71 Class DA |
| 09/16/2049 | 2.161% | | 7,504,808 | 7,460,314 |
| Government National Mortgage Association |
| Series 2012-111 Class AC |
| 04/16/2047 | 2.211% | | 26,457 | 26,435 |
| Series 2012-25 Class A |
| 11/16/2042 | 2.575% | | 1,422,591 | 1,427,609 |
| Series 2012-45 Class A |
| 03/16/2040 | 2.830% | | 132,444 | 132,707 |
| Series 2012-55 Class A |
| 08/16/2033 | 1.704% | | 354,675 | 353,978 |
| Series 2012-58 Class A |
| 01/16/2040 | 2.500% | | 614,589 | 616,053 |
| Series 2013-105 Class A |
| 02/16/2037 | 1.705% | | 4,213,038 | 4,166,333 |
| Series 2013-118 Class AB |
| 06/16/2036 | 2.000% | | 2,032,206 | 2,027,198 |
| Series 2013-12 Class A |
| 10/16/2042 | 1.410% | | 4,287,104 | 4,203,121 |
| Series 2013-126 Class AB |
| 04/16/2038 | 1.540% | | 6,073,332 | 6,005,481 |
The accompanying Notes to Financial Statements are an integral part of this statement.
| 10 | Columbia Balanced Fund | Annual Report 2017 |
Portfolio of Investments (continued)
August 31, 2017
| Commercial Mortgage-Backed Securities - Agency (continued) |
| Issuer | Coupon
Rate | | Principal
Amount ($) | Value ($) |
| Series 2013-138 Class A |
| 08/16/2035 | 2.150% | | 4,564,481 | 4,565,027 |
| Series 2013-146 Class AH |
| 08/16/2040 | 2.000% | | 1,695,441 | 1,687,191 |
| Series 2013-17 Class AH |
| 10/16/2043 | 1.558% | | 1,157,339 | 1,133,456 |
| Series 2013-179 Class A |
| 07/16/2037 | 1.800% | | 2,027,798 | 2,019,202 |
| Series 2013-194 Class AB |
| 05/16/2038 | 2.250% | | 1,254,117 | 1,250,066 |
| Series 2013-2 Class AB |
| 12/16/2042 | 1.600% | | 760,148 | 754,419 |
| Series 2013-30 Class A |
| 05/16/2042 | 1.500% | | 2,220,553 | 2,180,858 |
| Series 2013-32 Class AB |
| 01/16/2042 | 1.900% | | 2,353,415 | 2,324,666 |
| Series 2013-33 Class A |
| 07/16/2038 | 1.061% | | 3,525,744 | 3,448,044 |
| Series 2013-40 Class A |
| 10/16/2041 | 1.511% | | 1,246,334 | 1,226,591 |
| Series 2013-50 Class AH |
| 06/16/2039 | 2.100% | | 1,399,578 | 1,394,717 |
| Series 2013-57 Class A |
| 06/16/2037 | 1.350% | | 3,546,526 | 3,478,057 |
| Series 2013-61 Class A |
| 01/16/2043 | 1.450% | | 1,558,046 | 1,518,533 |
| Series 2013-73 Class AE |
| 01/16/2039 | 1.350% | | 6,195,353 | 6,097,340 |
| Series 2013-78 Class AB |
| 07/16/2039 | 1.624% | | 1,616,081 | 1,590,437 |
| Series 2014-103 Class AB |
| 06/16/2053 | 1.742% | | 2,042,984 | 2,060,301 |
| Series 2014-109 Class A |
| 01/16/2046 | 2.325% | | 4,175,620 | 4,173,408 |
| Series 2014-135 Class AD |
| 08/16/2045 | 2.400% | | 3,054,262 | 3,064,482 |
| Series 2014-138 Class A |
| 01/16/2044 | 2.700% | | 1,260,163 | 1,267,446 |
| Series 2014-148 Class A |
| 11/16/2043 | 2.650% | | 1,930,806 | 1,943,287 |
| Series 2014-169 Class A |
| 11/16/2042 | 2.600% | | 1,609,875 | 1,617,391 |
| Series 2014-24 Class BA |
| 07/16/2038 | 2.100% | | 2,186,307 | 2,180,271 |
| Series 2014-33 Class A |
| 08/16/2039 | 2.300% | | 979,657 | 977,971 |
| Commercial Mortgage-Backed Securities - Agency (continued) |
| Issuer | Coupon
Rate | | Principal
Amount ($) | Value ($) |
| Series 2014-64 Class A |
| 02/16/2045 | 2.200% | | 1,607,835 | 1,605,863 |
| Series 2014-67 Class AE |
| 05/16/2039 | 2.150% | | 643,287 | 650,805 |
| Series 2015-109 Class A |
| 02/16/2040 | 2.528% | | 7,052,643 | 7,070,887 |
| Series 2015-21 Class A |
| 11/16/2042 | 2.600% | | 3,704,589 | 3,721,095 |
| Series 2015-33 Class AH |
| 02/16/2045 | 2.650% | | 1,005,093 | 1,010,168 |
| Series 2015-5 Class KA |
| 11/16/2039 | 2.500% | | 4,143,925 | 4,141,833 |
| Series 2015-78 Class A |
| 06/16/2040 | 2.918% | | 4,253,891 | 4,290,006 |
| Series 2015-85 Class AF |
| 05/16/2044 | 2.400% | | 5,166,617 | 5,180,517 |
| Series 2015-98 Class AE |
| 04/16/2041 | 2.100% | | 2,863,359 | 2,847,648 |
| Series 2016-39 Class AG |
| 01/16/2043 | 2.300% | | 7,463,027 | 7,446,329 |
Total Commercial Mortgage-Backed Securities - Agency
(Cost $119,314,828) | 117,933,791 |
|
| Commercial Mortgage-Backed Securities - Non-Agency 2.4% |
| | | | |
| American Homes 4 Rent(a) |
| Series 2015-SFR1 Class A |
| 04/17/2052 | 3.467% | | 3,518,092 | 3,695,746 |
| American Homes 4 Rent Trust(a) |
| Series 2014-SFR2 Class A |
| 10/17/2036 | 3.786% | | 2,889,814 | 3,088,902 |
| Series 2014-SFR3 Class A |
| 12/17/2036 | 3.678% | | 3,385,310 | 3,597,975 |
| Series 2015-SFR2 Class A |
| 10/17/2045 | 3.732% | | 2,640,332 | 2,820,421 |
| Americold 2010 LLC Trust(a) |
| Series 2010-ARTA Class A1 |
| 01/14/2029 | 3.847% | | 179,330 | 184,603 |
| CFCRE Commercial Mortgage Trust |
| Series 2016-C4 Class A1 |
| 05/10/2058 | 1.501% | | 2,599,122 | 2,583,362 |
| CGGS Commercial Mortgage Trust(a) |
| Series 2016-RNDA Class AFX |
| 02/10/2033 | 2.757% | | 9,719,394 | 9,767,629 |
| Colony Multifamily Mortgage Trust(a) |
| Series 2014-1 Class A |
| 04/20/2050 | 2.543% | | 1,719,300 | 1,710,014 |
The accompanying Notes to Financial Statements are an integral part of this statement.
Columbia Balanced Fund | Annual Report 2017
| 11 |
Portfolio of Investments (continued)
August 31, 2017
| Commercial Mortgage-Backed Securities - Non-Agency (continued) |
| Issuer | Coupon
Rate | | Principal
Amount ($) | Value ($) |
| Commercial Mortgage Pass-Through Certificates |
| Series 2014-CR14 Class A2 |
| 02/10/2047 | 3.147% | | 10,105,000 | 10,265,015 |
| Commercial Mortgage Trust |
| Series 2012-LC4 Class A3 |
| 12/10/2044 | 3.069% | | 9,646,805 | 9,791,423 |
| Series 2013-CR6 Class A2 |
| 03/10/2046 | 2.122% | | 12,746,276 | 12,761,372 |
| Series 2013-CR8 Class A5 |
| 06/10/2046 | 3.612% | | 10,380,000 | 11,014,373 |
| Series 2013-CR9 Class A2 |
| 07/10/2045 | 3.055% | | 4,260,146 | 4,288,378 |
| Series 2013-LC13 Class A2 |
| 08/10/2046 | 3.009% | | 9,300,000 | 9,415,233 |
| Series 2014-CR18 Class A2 |
| 07/15/2047 | 2.924% | | 3,100,000 | 3,160,943 |
| Series 2015-CR23 Class A2 |
| 05/10/2048 | 2.852% | | 4,250,000 | 4,350,433 |
| CSAIL Commercial Mortgage Trust |
| Series 2016-C5 Class A1 |
| 11/15/2048 | 1.747% | | 2,721,955 | 2,714,072 |
| DBUBS Mortgage Trust(a) |
| Series 2011-LC1A Class A3 |
| 11/10/2046 | 5.002% | | 150,000 | 161,643 |
| General Electric Capital Assurance Co.(a) |
| Series 2003-1 Class A5 |
| 05/12/2035 | 5.743% | | 106,784 | 109,528 |
| GS Mortgage Securities Trust(a) |
| Series 2011-GC3 Class A4 |
| 03/10/2044 | 4.753% | | 12,277,890 | 13,135,686 |
| JPMBB Commercial Mortgage Securities Trust |
| Series 2013-C14 Class ASB |
| 08/15/2046 | 3.761% | | 4,700,000 | 4,956,266 |
| Series 2014-C19 Class A2 |
| 04/15/2047 | 3.046% | | 4,000,000 | 4,078,490 |
| JPMorgan Chase Commercial Mortgage Securities Trust(a) |
| Series 2009-IWST Class A2 |
| 12/05/2027 | 5.633% | | 300,000 | 319,777 |
| Series 2010-CNTR Class A2 |
| 08/05/2032 | 4.311% | | 450,000 | 471,548 |
| Series 2011-C3 Class A4 |
| 02/15/2046 | 4.717% | | 450,000 | 482,397 |
| LB-UBS Commercial Mortgage Trust |
| Series 2007-C7 Class A3 |
| 09/15/2045 | 5.866% | | 1,068,231 | 1,071,427 |
| Morgan Stanley Capital I Trust(a) |
| Series 2011-C1 Class A4 |
| 09/15/2047 | 5.033% | | 300,000 | 324,945 |
| Commercial Mortgage-Backed Securities - Non-Agency (continued) |
| Issuer | Coupon
Rate | | Principal
Amount ($) | Value ($) |
| Morgan Stanley Capital I Trust |
| Series 2016-BNK2 Class A2 |
| 11/15/2049 | 2.454% | | 5,625,000 | 5,672,303 |
| UBS-Barclays Commercial Mortgage Trust |
| Series 2012-C4 Class A2 |
| 12/10/2045 | 1.712% | | 4,570,083 | 4,568,712 |
| Series 2012-C4 Class A5 |
| 12/10/2045 | 2.850% | | 17,050,000 | 17,404,326 |
| Series 2013-C5 Class A3 |
| 03/10/2046 | 2.920% | | 2,000,000 | 2,046,503 |
| Series 2013-C5 Class A4 |
| 03/10/2046 | 3.185% | | 10,651,000 | 11,034,965 |
| WF-RBS Commercial Mortgage Trust |
| Series 2012-C9 Class A3 |
| 11/15/2045 | 2.870% | | 10,457,000 | 10,715,791 |
Total Commercial Mortgage-Backed Securities - Non-Agency
(Cost $171,140,703) | 171,764,201 |
| Common Stocks 59.8% |
| Issuer | Shares | Value ($) |
| Consumer Discretionary 7.0% |
| Hotels, Restaurants & Leisure 1.6% |
| Marriott International, Inc., Class A | 101,930 | 10,557,909 |
| McDonald’s Corp. | 315,415 | 50,456,937 |
| Royal Caribbean Cruises Ltd. | 96,700 | 12,035,282 |
| Starbucks Corp. | 751,410 | 41,222,353 |
| Total | | 114,272,481 |
| Household Durables 0.3% |
| Newell Brands, Inc. | 418,370 | 20,198,904 |
| Internet & Direct Marketing Retail 0.4% |
| Expedia, Inc. | 60,255 | 8,939,432 |
| Liberty Interactive Corp., Class A(d) | 803,265 | 17,768,222 |
| Total | | 26,707,654 |
| Media 1.8% |
| Comcast Corp., Class A | 2,696,772 | 109,515,911 |
| Walt Disney Co. (The) | 170,985 | 17,303,682 |
| Total | | 126,819,593 |
| Multiline Retail 0.4% |
| Dollar General Corp. | 417,435 | 30,289,084 |
The accompanying Notes to Financial Statements are an integral part of this statement.
| 12 | Columbia Balanced Fund | Annual Report 2017 |
Portfolio of Investments (continued)
August 31, 2017
| Common Stocks (continued) |
| Issuer | Shares | Value ($) |
| Specialty Retail 1.3% |
| AutoZone, Inc.(d) | 22,522 | 11,901,526 |
| Lowe’s Companies, Inc. | 1,085,022 | 80,172,275 |
| Total | | 92,073,801 |
| Textiles, Apparel & Luxury Goods 1.2% |
| Coach, Inc. | 1,009,680 | 42,103,656 |
| PVH Corp. | 377,171 | 47,482,057 |
| Total | | 89,585,713 |
| Total Consumer Discretionary | 499,947,230 |
| Consumer Staples 4.1% |
| Beverages 0.9% |
| PepsiCo, Inc. | 583,973 | 67,583,195 |
| Food & Staples Retailing 0.8% |
| CVS Health Corp. | 214,151 | 16,562,439 |
| SYSCO Corp. | 814,660 | 42,908,142 |
| Total | | 59,470,581 |
| Food Products 0.6% |
| Kellogg Co. | 603,735 | 39,520,493 |
| Tobacco 1.8% |
| Philip Morris International, Inc. | 1,097,820 | 128,368,093 |
| Total Consumer Staples | 294,942,362 |
| Energy 4.1% |
| Energy Equipment & Services 0.6% |
| Halliburton Co. | 1,070,354 | 41,711,695 |
| Oil, Gas & Consumable Fuels 3.5% |
| Canadian Natural Resources Ltd. | 1,772,124 | 54,616,862 |
| Chevron Corp. | 636,936 | 68,547,052 |
| EOG Resources, Inc. | 475,109 | 40,379,514 |
| Exxon Mobil Corp. | 1,106,335 | 84,446,551 |
| Total | | 247,989,979 |
| Total Energy | 289,701,674 |
| Financials 10.6% |
| Banks 5.1% |
| Citigroup, Inc. | 1,977,177 | 134,507,351 |
| JPMorgan Chase & Co. | 1,492,473 | 135,650,871 |
| Wells Fargo & Co. | 1,874,906 | 95,751,450 |
| Total | | 365,909,672 |
| Common Stocks (continued) |
| Issuer | Shares | Value ($) |
| Capital Markets 2.8% |
| Bank of New York Mellon Corp. (The) | 1,798,341 | 94,017,267 |
| BlackRock, Inc. | 26,085 | 10,929,876 |
| Invesco Ltd. | 295,124 | 9,674,165 |
| Morgan Stanley | 1,419,875 | 64,604,313 |
| S&P Global, Inc. | 113,885 | 17,575,872 |
| Total | | 196,801,493 |
| Diversified Financial Services 2.0% |
| Berkshire Hathaway, Inc., Class B(d) | 779,290 | 141,176,176 |
| Insurance 0.7% |
| Aon PLC | 385,427 | 53,636,021 |
| Total Financials | 757,523,362 |
| Health Care 10.7% |
| Biotechnology 2.5% |
| Alexion Pharmaceuticals, Inc.(d) | 152,385 | 21,701,148 |
| Biogen, Inc.(d) | 227,165 | 71,911,352 |
| Celgene Corp.(d) | 520,877 | 72,365,442 |
| Vertex Pharmaceuticals, Inc.(d) | 83,895 | 13,468,503 |
| Total | | 179,446,445 |
| Health Care Equipment & Supplies 1.7% |
| Abbott Laboratories | 996,286 | 50,750,809 |
| Medtronic PLC | 553,883 | 44,654,047 |
| Zimmer Biomet Holdings, Inc. | 206,815 | 23,632,750 |
| Total | | 119,037,606 |
| Health Care Providers & Services 2.5% |
| Anthem, Inc. | 270,025 | 52,935,701 |
| Cardinal Health, Inc. | 794,926 | 53,625,708 |
| CIGNA Corp. | 383,834 | 69,880,818 |
| Total | | 176,442,227 |
| Pharmaceuticals 4.0% |
| Allergan PLC | 236,300 | 54,226,124 |
| Bristol-Myers Squibb Co. | 553,665 | 33,485,659 |
| Johnson & Johnson | 882,070 | 116,759,606 |
| Pfizer, Inc. | 2,386,315 | 80,943,805 |
| Total | | 285,415,194 |
| Total Health Care | 760,341,472 |
The accompanying Notes to Financial Statements are an integral part of this statement.
Columbia Balanced Fund | Annual Report 2017
| 13 |
Portfolio of Investments (continued)
August 31, 2017
| Common Stocks (continued) |
| Issuer | Shares | Value ($) |
| Industrials 4.6% |
| Air Freight & Logistics 1.4% |
| FedEx Corp. | 463,267 | 99,315,179 |
| Building Products 0.5% |
| Johnson Controls International PLC | 849,207 | 33,620,105 |
| Electrical Equipment 0.4% |
| Eaton Corp. PLC | 442,518 | 31,755,092 |
| Industrial Conglomerates 2.0% |
| General Electric Co. | 1,666,260 | 40,906,683 |
| Honeywell International, Inc. | 742,748 | 102,699,766 |
| Total | | 143,606,449 |
| Professional Services 0.3% |
| Nielsen Holdings PLC | 608,845 | 23,653,628 |
| Total Industrials | 331,950,453 |
| Information Technology 14.3% |
| Communications Equipment 0.9% |
| Cisco Systems, Inc. | 1,796,005 | 57,849,321 |
| Palo Alto Networks, Inc.(d) | 50,545 | 6,706,816 |
| Total | | 64,556,137 |
| Internet Software & Services 3.9% |
| Alphabet, Inc., Class A(d) | 62,939 | 60,121,851 |
| Alphabet, Inc., Class C(d) | 105,258 | 98,871,997 |
| Facebook, Inc., Class A(d) | 706,955 | 121,575,051 |
| Total | | 280,568,899 |
| IT Services 2.4% |
| Fidelity National Information Services, Inc. | 560,080 | 52,042,634 |
| FleetCor Technologies, Inc.(d) | 41,473 | 5,962,573 |
| MasterCard, Inc., Class A | 633,274 | 84,415,424 |
| Total System Services, Inc. | 411,490 | 28,442,189 |
| Total | | 170,862,820 |
| Semiconductors & Semiconductor Equipment 1.3% |
| Broadcom Ltd. | 345,445 | 87,076,321 |
| MACOM Technology Solutions Holdings, Inc.(d) | 156,526 | 7,128,194 |
| Total | | 94,204,515 |
| Common Stocks (continued) |
| Issuer | Shares | Value ($) |
| Software 2.9% |
| Activision Blizzard, Inc. | 871,560 | 57,139,474 |
| Electronic Arts, Inc.(d) | 94,072 | 11,429,748 |
| Microsoft Corp. | 1,811,394 | 135,437,929 |
| Total | | 204,007,151 |
| Technology Hardware, Storage & Peripherals 2.9% |
| Apple, Inc. | 1,236,260 | 202,746,640 |
| Total Information Technology | 1,016,946,162 |
| Materials 1.1% |
| Chemicals 0.6% |
| Sherwin-Williams Co. (The) | 132,028 | 44,793,140 |
| Containers & Packaging 0.5% |
| Ball Corp. | 291,215 | 11,645,688 |
| Sealed Air Corp. | 477,415 | 21,187,677 |
| Total | | 32,833,365 |
| Total Materials | 77,626,505 |
| Real Estate 1.0% |
| Equity Real Estate Investment Trusts (REITS) 1.0% |
| American Tower Corp. | 464,973 | 68,839,253 |
| Total Real Estate | 68,839,253 |
| Telecommunication Services 1.5% |
| Diversified Telecommunication Services 1.5% |
| AT&T, Inc. | 1,980,550 | 74,191,403 |
| Verizon Communications, Inc. | 721,104 | 34,591,359 |
| Total | | 108,782,762 |
| Total Telecommunication Services | 108,782,762 |
| Utilities 0.8% |
| Electric Utilities 0.8% |
| Edison International | 183,951 | 14,749,191 |
| Southern Co. (The) | 883,235 | 42,624,921 |
| Total | | 57,374,112 |
| Total Utilities | 57,374,112 |
Total Common Stocks
(Cost $3,227,599,732) | 4,263,975,347 |
The accompanying Notes to Financial Statements are an integral part of this statement.
| 14 | Columbia Balanced Fund | Annual Report 2017 |
Portfolio of Investments (continued)
August 31, 2017
| Corporate Bonds & Notes 11.9% |
| Issuer | Coupon
Rate | | Principal
Amount ($) | Value ($) |
| Aerospace & Defense 0.3% |
| BAE Systems Holdings, Inc.(a) |
| 10/07/2024 | 3.800% | | 5,548,000 | 5,853,745 |
| Bombardier, Inc.(a) |
| 12/01/2021 | 8.750% | | 161,000 | 182,905 |
| L3 Technologies, Inc. |
| 12/15/2026 | 3.850% | | 5,500,000 | 5,745,086 |
| Lockheed Martin Corp. |
| 05/15/2036 | 4.500% | | 7,350,000 | 8,150,525 |
| TransDigm, Inc. |
| 05/15/2025 | 6.500% | | 675,000 | 694,817 |
| 06/15/2026 | 6.375% | | 13,000 | 13,372 |
| Total | 20,640,450 |
| Automotive 0.1% |
| Ford Motor Co. |
| 12/08/2026 | 4.346% | | 8,640,000 | 8,944,543 |
| Gates Global LLC/Co.(a) |
| 07/15/2022 | 6.000% | | 390,000 | 400,189 |
| IHO Verwaltungs GmbH PIK(a) |
| 09/15/2026 | 4.750% | | 348,000 | 349,854 |
| Total | 9,694,586 |
| Banking 2.3% |
| Ally Financial, Inc. |
| 05/19/2022 | 4.625% | | 153,000 | 159,273 |
| Bank of America Corp. |
| 01/24/2022 | 5.700% | | 11,450,000 | 12,954,324 |
| Bank of New York Mellon Corp. (The) |
| 05/15/2024 | 3.400% | | 6,000,000 | 6,258,150 |
| Barclays Bank PLC |
| 05/15/2024 | 3.750% | | 4,500,000 | 4,728,285 |
| BB&T Corp.(b) |
3-month USD LIBOR + 0.530%
05/01/2019 | 1.841% | | 6,625,000 | 6,650,546 |
| Capital One Financial Corp. |
| 03/09/2027 | 3.750% | | 8,675,000 | 8,801,551 |
| Citigroup, Inc. |
| 10/21/2026 | 3.200% | | 11,675,000 | 11,550,253 |
| Credit Suisse AG |
| 09/09/2024 | 3.625% | | 4,500,000 | 4,715,001 |
| Discover Financial Services |
| 02/09/2027 | 4.100% | | 6,500,000 | 6,655,272 |
| Fifth Third Bancorp |
| 03/15/2022 | 3.500% | | 5,775,000 | 6,034,684 |
| Goldman Sachs Group, Inc. (The) |
| 07/08/2024 | 3.850% | | 12,000,000 | 12,580,248 |
| Corporate Bonds & Notes (continued) |
| Issuer | Coupon
Rate | | Principal
Amount ($) | Value ($) |
| HSBC Holdings PLC |
| 05/25/2026 | 3.900% | | 8,265,000 | 8,668,555 |
| Huntington National Bank (The) |
| 08/07/2022 | 2.500% | | 6,000,000 | 6,000,084 |
| ING Bank NV(a),(b) |
3-month USD LIBOR + 1.130%
03/22/2019 | 2.417% | | 7,300,000 | 7,395,769 |
| JPMorgan Chase & Co. |
| 08/15/2021 | 4.350% | | 12,375,000 | 13,340,497 |
| Morgan Stanley |
| 01/20/2027 | 3.625% | | 8,000,000 | 8,185,696 |
| PNC Bank NA |
| Subordinated |
| 01/30/2023 | 2.950% | | 4,300,000 | 4,385,321 |
| Regions Financial Corp. |
| 08/14/2022 | 2.750% | | 7,000,000 | 7,045,759 |
| State Street Corp. |
| 11/20/2023 | 3.700% | | 5,000,000 | 5,379,390 |
| Toronto-Dominion Bank (The) |
| 07/02/2019 | 2.125% | | 5,270,000 | 5,311,169 |
| U.S. Bancorp |
| Subordinated |
| 04/27/2026 | 3.100% | | 5,400,000 | 5,430,456 |
| Wells Fargo & Co. |
| Subordinated |
| 02/13/2023 | 3.450% | | 10,000,000 | 10,296,490 |
| Total | 162,526,773 |
| Brokerage/Asset Managers/Exchanges 0.0% |
| NFP Corp.(a) |
| 07/15/2025 | 6.875% | | 180,000 | 182,967 |
| VFH Parent LLC/Orchestra Co-Issuer, Inc.(a) |
| 06/15/2022 | 6.750% | | 62,000 | 64,324 |
| Total | 247,291 |
| Building Materials 0.0% |
| American Builders & Contractors Supply Co., Inc.(a) |
| 12/15/2023 | 5.750% | | 359,000 | 379,270 |
| Beacon Roofing Supply, Inc. |
| 10/01/2023 | 6.375% | | 323,000 | 342,205 |
| CD&R Waterworks Merger Sub LLC(a) |
| 08/15/2025 | 6.125% | | 78,000 | 79,537 |
| HD Supply, Inc.(a) |
| 04/15/2024 | 5.750% | | 129,000 | 138,398 |
| US Concrete, Inc. |
| 06/01/2024 | 6.375% | | 152,000 | 163,897 |
| Total | 1,103,307 |
The accompanying Notes to Financial Statements are an integral part of this statement.
Columbia Balanced Fund | Annual Report 2017
| 15 |
Portfolio of Investments (continued)
August 31, 2017
| Corporate Bonds & Notes (continued) |
| Issuer | Coupon
Rate | | Principal
Amount ($) | Value ($) |
| Cable and Satellite 0.3% |
| Altice US Finance I Corp.(a) |
| 05/15/2026 | 5.500% | | 527,000 | 556,947 |
| CCO Holdings LLC/Capital Corp.(a) |
| 04/01/2024 | 5.875% | | 166,000 | 176,643 |
| 05/01/2025 | 5.375% | | 262,000 | 273,190 |
| 02/15/2026 | 5.750% | | 434,000 | 459,304 |
| 05/01/2027 | 5.875% | | 70,000 | 74,230 |
| Cequel Communications Holdings I LLC/Capital Corp.(a) |
| 07/15/2025 | 7.750% | | 195,000 | 215,376 |
| CSC Holdings LLC |
| 06/01/2024 | 5.250% | | 485,000 | 496,924 |
| CSC Holdings LLC(a) |
| 10/15/2025 | 6.625% | | 208,000 | 227,653 |
| 10/15/2025 | 10.875% | | 225,000 | 276,699 |
| DISH DBS Corp. |
| 11/15/2024 | 5.875% | | 431,000 | 464,590 |
| 07/01/2026 | 7.750% | | 469,000 | 551,320 |
| NBCUniversal Media LLC |
| 04/01/2041 | 5.950% | | 4,450,000 | 5,668,112 |
| Sirius XM Radio, Inc.(a) |
| 04/15/2025 | 5.375% | | 184,000 | 194,398 |
| 07/15/2026 | 5.375% | | 221,000 | 231,966 |
| 08/01/2027 | 5.000% | | 231,000 | 237,271 |
| Sky PLC(a) |
| 09/16/2024 | 3.750% | | 6,485,000 | 6,710,224 |
| Time Warner Cable LLC |
| 05/01/2037 | 6.550% | | 4,060,000 | 4,689,134 |
| Unitymedia Hessen GmbH & Co. KG NRW(a) |
| 01/15/2025 | 5.000% | | 527,000 | 554,136 |
| Videotron Ltd. |
| 07/15/2022 | 5.000% | | 293,000 | 314,310 |
| Virgin Media Finance PLC(a) |
| 01/15/2025 | 5.750% | | 519,000 | 535,149 |
| Ziggo Secured Finance BV(a) |
| 01/15/2027 | 5.500% | | 505,000 | 520,735 |
| Total | 23,428,311 |
| Chemicals 0.3% |
| Angus Chemical Co.(a) |
| 02/15/2023 | 8.750% | | 109,000 | 111,361 |
| Atotech USA, Inc.(a) |
| 02/01/2025 | 6.250% | | 335,000 | 342,957 |
| Axalta Coating Systems LLC(a) |
| 08/15/2024 | 4.875% | | 267,000 | 272,897 |
| Celanese U.S. Holdings LLC |
| 11/15/2022 | 4.625% | | 6,000,000 | 6,531,342 |
| Corporate Bonds & Notes (continued) |
| Issuer | Coupon
Rate | | Principal
Amount ($) | Value ($) |
| Chemours Co. (The) |
| 05/15/2025 | 7.000% | | 259,000 | 285,704 |
| 05/15/2027 | 5.375% | | 61,000 | 63,566 |
| Dow Chemical Co. (The) |
| 11/01/2029 | 7.375% | | 1,103,000 | 1,489,764 |
| Eastman Chemical Co. |
| 01/15/2020 | 2.700% | | 5,000,000 | 5,072,195 |
| Eco Services Operations LLC/Finance Corp.(a) |
| 11/01/2022 | 8.500% | | 161,000 | 168,915 |
| INEOS Group Holdings SA(a) |
| 08/01/2024 | 5.625% | | 202,000 | 208,086 |
| Koppers, Inc.(a) |
| 02/15/2025 | 6.000% | | 84,000 | 89,122 |
| LYB International Finance BV |
| 03/15/2044 | 4.875% | | 6,000,000 | 6,510,744 |
| Platform Specialty Products Corp.(a) |
| 05/01/2021 | 10.375% | | 138,000 | 151,164 |
| 02/01/2022 | 6.500% | | 276,000 | 286,454 |
| PQ Corp.(a) |
| 11/15/2022 | 6.750% | | 278,000 | 300,826 |
| Venator Finance SARL/Materials LLC(a) |
| 07/15/2025 | 5.750% | | 42,000 | 42,949 |
| WR Grace & Co.(a) |
| 10/01/2021 | 5.125% | | 173,000 | 187,729 |
| Total | 22,115,775 |
| Construction Machinery 0.2% |
| Ashtead Capital, Inc.(a) |
| 08/15/2027 | 4.375% | | 260,000 | 265,249 |
| Caterpillar Financial Services Corp. |
| 06/01/2022 | 2.850% | | 5,000,000 | 5,125,960 |
| H&E Equipment Services, Inc.(a) |
| 09/01/2025 | 5.625% | | 68,000 | 70,197 |
| John Deere Capital Corp. |
| 03/10/2020 | 2.050% | | 5,175,000 | 5,210,713 |
| Ritchie Bros. Auctioneers, Inc.(a) |
| 01/15/2025 | 5.375% | | 260,000 | 269,158 |
| United Rentals North America, Inc. |
| 07/15/2025 | 5.500% | | 63,000 | 67,397 |
| 09/15/2026 | 5.875% | | 465,000 | 506,671 |
| 01/15/2028 | 4.875% | | 140,000 | 141,212 |
| Total | 11,656,557 |
| Consumer Cyclical Services 0.1% |
| Amazon.com, Inc.(a) |
| 08/22/2024 | 2.800% | | 7,000,000 | 7,102,620 |
The accompanying Notes to Financial Statements are an integral part of this statement.
| 16 | Columbia Balanced Fund | Annual Report 2017 |
Portfolio of Investments (continued)
August 31, 2017
| Corporate Bonds & Notes (continued) |
| Issuer | Coupon
Rate | | Principal
Amount ($) | Value ($) |
| APX Group, Inc. |
| 12/01/2020 | 8.750% | | 157,000 | 161,576 |
| 12/01/2022 | 7.875% | | 586,000 | 636,625 |
| APX Group, Inc.(a) |
| 09/01/2023 | 7.625% | | 306,000 | 310,099 |
| Interval Acquisition Corp. |
| 04/15/2023 | 5.625% | | 304,000 | 314,170 |
| Total | 8,525,090 |
| Consumer Products 0.1% |
| Prestige Brands, Inc.(a) |
| 03/01/2024 | 6.375% | | 356,000 | 381,078 |
| Procter & Gamble Co. (The) |
| 08/11/2027 | 2.850% | | 5,675,000 | 5,755,040 |
| Scotts Miracle-Gro Co. (The) |
| 10/15/2023 | 6.000% | | 345,000 | 370,412 |
| Spectrum Brands, Inc. |
| 12/15/2024 | 6.125% | | 174,000 | 186,378 |
| 07/15/2025 | 5.750% | | 155,000 | 165,090 |
| Springs Industries, Inc. |
| 06/01/2021 | 6.250% | | 194,000 | 199,995 |
| Tempur Sealy International, Inc. |
| 10/15/2023 | 5.625% | | 93,000 | 96,887 |
| Valvoline, Inc.(a) |
| 07/15/2024 | 5.500% | | 328,000 | 348,380 |
| 08/15/2025 | 4.375% | | 151,000 | 152,603 |
| Total | 7,655,863 |
| Diversified Manufacturing 0.0% |
| Entegris, Inc.(a) |
| 04/01/2022 | 6.000% | | 180,000 | 187,838 |
| SPX FLOW, Inc.(a) |
| 08/15/2026 | 5.875% | | 133,000 | 139,130 |
| WESCO Distribution, Inc. |
| 06/15/2024 | 5.375% | | 171,000 | 178,774 |
| Zekelman Industries, Inc.(a) |
| 06/15/2023 | 9.875% | | 109,000 | 122,287 |
| Total | 628,029 |
| Electric 1.1% |
| AES Corp. |
| 09/01/2027 | 5.125% | | 195,000 | 198,245 |
| AES Corp. (The) |
| 07/01/2021 | 7.375% | | 169,000 | 191,548 |
| Arizona Public Service Co. |
| 04/01/2042 | 4.500% | | 1,925,000 | 2,138,384 |
| Berkshire Hathaway Energy Co. |
| 02/01/2025 | 3.500% | | 1,950,000 | 2,030,352 |
| Corporate Bonds & Notes (continued) |
| Issuer | Coupon
Rate | | Principal
Amount ($) | Value ($) |
| Calpine Corp. |
| 01/15/2025 | 5.750% | | 189,000 | 173,900 |
| CMS Energy Corp. |
| 03/01/2024 | 3.875% | | 5,576,000 | 5,913,655 |
| Consolidated Edison Co. of New York, Inc. |
| 12/01/2045 | 4.500% | | 2,500,000 | 2,822,852 |
| Dominion Energy, Inc. |
| 10/01/2025 | 3.900% | | 4,000,000 | 4,232,792 |
| DTE Energy Co. |
| 04/15/2033 | 6.375% | | 2,275,000 | 2,902,343 |
| Dynegy, Inc. |
| 11/01/2024 | 7.625% | | 146,000 | 150,622 |
| Dynegy, Inc.(a) |
| 01/30/2026 | 8.125% | | 55,000 | 56,702 |
| Emera US Finance LP |
| 06/15/2026 | 3.550% | | 6,400,000 | 6,520,141 |
| Indiana Michigan Power Co. |
| 03/15/2037 | 6.050% | | 3,255,000 | 4,145,861 |
| Nevada Power Co. |
| 08/01/2018 | 6.500% | | 900,000 | 939,188 |
| NextEra Energy Capital Holdings, Inc. |
| 06/15/2023 | 3.625% | | 5,070,000 | 5,294,510 |
| NRG Energy, Inc. |
| 05/01/2024 | 6.250% | | 35,000 | 36,307 |
| 05/15/2026 | 7.250% | | 127,000 | 136,638 |
| 01/15/2027 | 6.625% | | 103,000 | 108,422 |
| NRG Yield Operating LLC |
| 08/15/2024 | 5.375% | | 540,000 | 564,630 |
| 09/15/2026 | 5.000% | | 91,000 | 93,104 |
| Pacific Gas & Electric Co. |
| 03/01/2037 | 5.800% | | 4,306,000 | 5,585,700 |
| PacifiCorp |
| 07/01/2025 | 3.350% | | 1,821,000 | 1,889,440 |
| Pattern Energy Group, Inc.(a) |
| 02/01/2024 | 5.875% | | 330,000 | 345,336 |
| PPL Capital Funding, Inc. |
| 06/01/2023 | 3.400% | | 5,645,000 | 5,859,008 |
| Progress Energy, Inc. |
| 03/01/2031 | 7.750% | | 2,983,000 | 4,281,923 |
| Public Service Co. of Colorado |
| 05/15/2025 | 2.900% | | 3,650,000 | 3,660,260 |
| Southern California Edison Co. |
| 09/01/2040 | 4.500% | | 1,775,000 | 2,020,161 |
| Southern Co. (The) |
| 07/01/2046 | 4.400% | | 7,425,000 | 7,728,259 |
The accompanying Notes to Financial Statements are an integral part of this statement.
Columbia Balanced Fund |��Annual Report 2017
| 17 |
Portfolio of Investments (continued)
August 31, 2017
| Corporate Bonds & Notes (continued) |
| Issuer | Coupon
Rate | | Principal
Amount ($) | Value ($) |
| WEC Energy Group, Inc. |
| 06/15/2025 | 3.550% | | 5,575,000 | 5,806,418 |
| Total | 75,826,701 |
| Finance Companies 0.2% |
| Aircastle Ltd. |
| 02/15/2022 | 5.500% | | 129,000 | 140,577 |
| GE Capital International Funding Co. Unlimited Co. |
| 11/15/2020 | 2.342% | | 9,475,000 | 9,581,442 |
| iStar, Inc. |
| 04/01/2022 | 6.000% | | 159,000 | 163,431 |
| Navient Corp. |
| 01/25/2023 | 5.500% | | 426,000 | 430,390 |
| 10/25/2024 | 5.875% | | 37,000 | 37,418 |
| OneMain Financial Holdings LLC(a) |
| 12/15/2021 | 7.250% | | 399,000 | 417,736 |
| Park Aerospace Holdings Ltd.(a) |
| 08/15/2022 | 5.250% | | 102,000 | 106,217 |
| Provident Funding Associates LP/Finance Corp.(a) |
| 06/15/2025 | 6.375% | | 147,000 | 152,526 |
| Quicken Loans, Inc.(a) |
| 05/01/2025 | 5.750% | | 272,000 | 284,298 |
| Total | 11,314,035 |
| Food and Beverage 0.6% |
| Anheuser-Busch InBev Worldwide, Inc. |
| 01/15/2042 | 4.950% | | 11,310,000 | 12,848,669 |
| B&G Foods, Inc. |
| 04/01/2025 | 5.250% | | 307,000 | 314,912 |
| Chobani LLC/Finance Corp., Inc.(a) |
| 04/15/2025 | 7.500% | | 219,000 | 238,761 |
| ConAgra Foods, Inc. |
| 01/25/2023 | 3.200% | | 4,500,000 | 4,616,230 |
| Constellation Brands, Inc. |
| 11/15/2024 | 4.750% | | 2,430,000 | 2,693,196 |
| Diageo Investment Corp. |
| 05/11/2022 | 2.875% | | 4,226,000 | 4,356,651 |
| FAGE International SA/USA Dairy Industry, Inc.(a) |
| 08/15/2026 | 5.625% | | 127,000 | 129,732 |
| Kraft Heinz Foods Co. |
| 07/15/2022 | 3.500% | | 5,020,000 | 5,206,132 |
| Lamb Weston Holdings, Inc.(a) |
| 11/01/2026 | 4.875% | | 339,000 | 351,682 |
| Molson Coors Brewing Co. |
| 05/01/2042 | 5.000% | | 4,000,000 | 4,441,508 |
| PepsiCo, Inc. |
| 03/05/2022 | 2.750% | | 3,245,000 | 3,354,791 |
| Corporate Bonds & Notes (continued) |
| Issuer | Coupon
Rate | | Principal
Amount ($) | Value ($) |
| Pinnacle Foods Finance LLC/Corp. |
| 01/15/2024 | 5.875% | | 125,000 | 133,299 |
| Post Holdings, Inc.(a) |
| 08/15/2026 | 5.000% | | 469,000 | 469,236 |
| 03/01/2027 | 5.750% | | 431,000 | 448,042 |
| Total | 39,602,841 |
| Gaming 0.0% |
| Boyd Gaming Corp. |
| 05/15/2023 | 6.875% | | 49,000 | 52,752 |
| 04/01/2026 | 6.375% | | 255,000 | 277,943 |
| Eldorado Resorts, Inc. |
| 04/01/2025 | 6.000% | | 96,000 | 101,720 |
| GLP Capital LP/Financing II, Inc. |
| 04/15/2026 | 5.375% | | 26,000 | 28,239 |
| International Game Technology PLC(a) |
| 02/15/2025 | 6.500% | | 394,000 | 441,882 |
| Jack Ohio Finance LLC/1 Corp.(a) |
| 11/15/2021 | 6.750% | | 204,000 | 212,600 |
| MGM Resorts International |
| 03/15/2023 | 6.000% | | 312,000 | 344,545 |
| 09/01/2026 | 4.625% | | 220,000 | 224,036 |
| Penn National Gaming, Inc.(a) |
| 01/15/2027 | 5.625% | | 150,000 | 155,813 |
| Rivers Pittsburgh Borrower LP/Finance Corp.(a) |
| 08/15/2021 | 6.125% | | 49,000 | 49,710 |
| Scientific Games International, Inc.(a) |
| 01/01/2022 | 7.000% | | 313,000 | 333,710 |
| Scientific Games International, Inc. |
| 12/01/2022 | 10.000% | | 320,000 | 355,000 |
| Seminole Tribe of Florida, Inc.(a) |
| 10/01/2020 | 6.535% | | 1,000 | 1,010 |
| Tunica-Biloxi Gaming Authority(a),(e) |
| 11/15/2016 | 0.000% | | 25,000 | 9,500 |
| Wynn Las Vegas LLC/Capital Corp.(a) |
| 05/15/2027 | 5.250% | | 140,000 | 141,291 |
| Total | 2,729,751 |
| Health Care 0.4% |
| Acadia Healthcare Co., Inc. |
| 03/01/2024 | 6.500% | | 249,000 | 268,146 |
| Amsurg Corp. |
| 07/15/2022 | 5.625% | | 258,000 | 269,788 |
| Becton Dickinson and Co. |
| 03/01/2023 | 3.300% | | 5,700,000 | 5,817,072 |
| Cardinal Health, Inc. |
| 06/15/2024 | 3.079% | | 5,240,000 | 5,317,149 |
The accompanying Notes to Financial Statements are an integral part of this statement.
| 18 | Columbia Balanced Fund | Annual Report 2017 |
Portfolio of Investments (continued)
August 31, 2017
| Corporate Bonds & Notes (continued) |
| Issuer | Coupon
Rate | | Principal
Amount ($) | Value ($) |
| Change Healthcare Holdings LLC/Finance, Inc.(a) |
| 03/01/2025 | 5.750% | | 269,000 | 276,713 |
| CHS/Community Health Systems, Inc. |
| 02/01/2022 | 6.875% | | 238,000 | 197,491 |
| 03/31/2023 | 6.250% | | 368,000 | 371,104 |
| Covidien International Finance SA |
| 06/15/2022 | 3.200% | | 4,298,000 | 4,473,255 |
| DaVita, Inc. |
| 08/15/2022 | 5.750% | | 286,000 | 295,247 |
| 05/01/2025 | 5.000% | | 140,000 | 142,052 |
| Envision Healthcare Corp.(a) |
| 12/01/2024 | 6.250% | | 30,000 | 32,295 |
| Express Scripts Holding Co. |
| 02/25/2026 | 4.500% | | 5,590,000 | 6,022,085 |
| HCA, Inc. |
| 03/15/2024 | 5.000% | | 441,000 | 469,388 |
| 02/01/2025 | 5.375% | | 229,000 | 241,663 |
| 04/15/2025 | 5.250% | | 228,000 | 245,843 |
| 02/15/2027 | 4.500% | | 217,000 | 220,941 |
| Hill-Rom Holdings, Inc.(a) |
| 02/15/2025 | 5.000% | | 206,000 | 210,659 |
| McKesson Corp. |
| 12/15/2022 | 2.700% | | 4,000,000 | 4,037,092 |
| MEDNAX, Inc.(a) |
| 12/01/2023 | 5.250% | | 341,000 | 354,857 |
| MPH Acquisition Holdings LLC(a) |
| 06/01/2024 | 7.125% | | 395,000 | 424,752 |
| PAREXEL International Corp.(a) |
| 09/01/2025 | 6.375% | | 60,000 | 59,977 |
| Quintiles IMS, Inc.(a) |
| 05/15/2023 | 4.875% | | 108,000 | 112,288 |
| 10/15/2026 | 5.000% | | 110,000 | 115,189 |
| SP Finco LLC(a) |
| 07/01/2025 | 6.750% | | 184,000 | 173,265 |
| Sterigenics-Nordion Holdings LLC(a) |
| 05/15/2023 | 6.500% | | 263,000 | 271,666 |
| Team Health Holdings, Inc.(a) |
| 02/01/2025 | 6.375% | | 184,000 | 177,507 |
| Tenet Healthcare Corp.(a) |
| 01/01/2022 | 7.500% | | 29,000 | 31,316 |
| 07/15/2024 | 4.625% | | 288,000 | 288,417 |
| 05/01/2025 | 5.125% | | 174,000 | 175,007 |
| 08/01/2025 | 7.000% | | 172,000 | 168,706 |
| Tenet Healthcare Corp. |
| 06/15/2023 | 6.750% | | 174,000 | 172,945 |
| Total | 31,433,875 |
| Corporate Bonds & Notes (continued) |
| Issuer | Coupon
Rate | | Principal
Amount ($) | Value ($) |
| Healthcare Insurance 0.2% |
| Aetna, Inc. |
| 06/15/2023 | 2.800% | | 6,355,000 | 6,445,699 |
| Anthem, Inc. |
| 08/15/2021 | 3.700% | | 3,185,000 | 3,337,921 |
| Centene Corp. |
| 02/15/2024 | 6.125% | | 279,000 | 300,305 |
| 01/15/2025 | 4.750% | | 189,000 | 196,905 |
| Molina Healthcare, Inc.(a) |
| 06/15/2025 | 4.875% | | 92,000 | 90,331 |
| UnitedHealth Group, Inc. |
| 01/15/2027 | 3.450% | | 6,500,000 | 6,775,203 |
| WellCare Health Plans, Inc. |
| 04/01/2025 | 5.250% | | 299,000 | 312,998 |
| Total | 17,459,362 |
| Home Construction 0.0% |
| CalAtlantic Group, Inc. |
| 12/15/2021 | 6.250% | | 36,000 | 39,727 |
| 11/15/2024 | 5.875% | | 295,000 | 320,234 |
| Lennar Corp. |
| 04/30/2024 | 4.500% | | 173,000 | 178,689 |
| Meritage Homes Corp. |
| 04/01/2022 | 7.000% | | 233,000 | 264,355 |
| Taylor Morrison Communities, Inc./Holdings II(a) |
| 04/15/2021 | 5.250% | | 121,000 | 123,980 |
| 03/01/2024 | 5.625% | | 151,000 | 159,342 |
| Total | 1,086,327 |
| Independent Energy 0.4% |
| Anadarko Petroleum Corp. |
| 09/15/2036 | 6.450% | | 5,205,000 | 6,083,047 |
| Callon Petroleum Co. |
| 10/01/2024 | 6.125% | | 115,000 | 117,011 |
| 10/01/2024 | 6.125% | | 68,000 | 70,121 |
| Canadian Natural Resources Ltd. |
| 04/15/2024 | 3.800% | | 7,200,000 | 7,391,390 |
| Carrizo Oil & Gas, Inc. |
| 04/15/2023 | 6.250% | | 224,000 | 217,519 |
| Continental Resources, Inc. |
| 06/01/2024 | 3.800% | | 155,000 | 144,654 |
| CrownRock LP/Finance, Inc.(a) |
| 02/15/2023 | 7.750% | | 327,000 | 345,816 |
| Diamondback Energy, Inc. |
| 05/31/2025 | 5.375% | | 610,000 | 627,638 |
| Extraction Oil & Gas, Inc.(a) |
| 05/15/2024 | 7.375% | | 117,000 | 117,585 |
The accompanying Notes to Financial Statements are an integral part of this statement.
Columbia Balanced Fund | Annual Report 2017
| 19 |
Portfolio of Investments (continued)
August 31, 2017
| Corporate Bonds & Notes (continued) |
| Issuer | Coupon
Rate | | Principal
Amount ($) | Value ($) |
| Extraction Oil & Gas, Inc./Finance Corp.(a) |
| 07/15/2021 | 7.875% | | 143,000 | 147,545 |
| Halcon Resources Corp.(a) |
| 02/15/2025 | 6.750% | | 108,000 | 108,678 |
| Laredo Petroleum, Inc. |
| 03/15/2023 | 6.250% | | 440,000 | 449,723 |
| Noble Energy, Inc. |
| 03/01/2041 | 6.000% | | 4,000,000 | 4,486,420 |
| Parsley Energy LLC/Finance Corp.(a) |
| 01/15/2025 | 5.375% | | 453,000 | 454,769 |
| 08/15/2025 | 5.250% | | 266,000 | 266,104 |
| PDC Energy, Inc.(a) |
| 09/15/2024 | 6.125% | | 410,000 | 420,570 |
| RSP Permian, Inc.(a) |
| 01/15/2025 | 5.250% | | 449,000 | 450,919 |
| SM Energy Co. |
| 06/01/2025 | 5.625% | | 138,000 | 125,374 |
| 09/15/2026 | 6.750% | | 236,000 | 222,757 |
| Woodside Finance Ltd.(a) |
| 03/05/2025 | 3.650% | | 6,500,000 | 6,577,252 |
| WPX Energy, Inc. |
| 01/15/2022 | 6.000% | | 418,000 | 429,986 |
| 09/15/2024 | 5.250% | | 95,000 | 93,350 |
| Total | 29,348,228 |
| Integrated Energy 0.3% |
| BP Capital Markets PLC |
| 02/10/2024 | 3.814% | | 7,000,000 | 7,445,487 |
| Cenovus Energy, Inc.(a) |
| 04/15/2027 | 4.250% | | 8,405,000 | 8,135,048 |
| Suncor Energy, Inc. |
| 12/01/2024 | 3.600% | | 5,000,000 | 5,162,980 |
| Total | 20,743,515 |
| Leisure 0.0% |
| Cedar Fair LP/Canada’s Wonderland Co./Magnum Management Corp./Millenium Operations LLC(a) |
| 04/15/2027 | 5.375% | | 187,000 | 196,390 |
| Live Nation Entertainment, Inc.(a) |
| 11/01/2024 | 4.875% | | 132,000 | 134,689 |
| LTF Merger Sub, Inc.(a) |
| 06/15/2023 | 8.500% | | 123,000 | 130,586 |
| Total | 461,665 |
| Life Insurance 0.6% |
| American International Group, Inc. |
| 02/15/2024 | 4.125% | | 7,250,000 | 7,761,959 |
| Corporate Bonds & Notes (continued) |
| Issuer | Coupon
Rate | | Principal
Amount ($) | Value ($) |
| Brighthouse Financial, Inc.(a) |
| 06/22/2027 | 3.700% | | 6,290,000 | 6,224,225 |
| Five Corners Funding Trust(a) |
| 11/15/2023 | 4.419% | | 7,000,000 | 7,640,703 |
| MetLife Global Funding I(a) |
| 12/18/2026 | 3.450% | | 4,750,000 | 4,959,166 |
| Peachtree Corners Funding Trust(a) |
| 02/15/2025 | 3.976% | | 6,500,000 | 6,697,327 |
| Principal Financial Group, Inc. |
| 05/15/2025 | 3.400% | | 7,000,000 | 7,233,996 |
| Total | 40,517,376 |
| Lodging 0.0% |
| Hilton Domestic Operating Co., Inc. |
| 09/01/2024 | 4.250% | | 270,000 | 275,454 |
| Media and Entertainment 0.4% |
| 21st Century Fox America, Inc. |
| 03/15/2033 | 6.550% | | 4,256,000 | 5,431,601 |
| AMC Networks, Inc. |
| 04/01/2024 | 5.000% | | 108,000 | 111,443 |
| Match Group, Inc. |
| 06/01/2024 | 6.375% | | 187,000 | 203,416 |
| MDC Partners, Inc.(a) |
| 05/01/2024 | 6.500% | | 201,000 | 200,730 |
| Netflix, Inc.(a) |
| 11/15/2026 | 4.375% | | 700,000 | 682,535 |
| Nielsen Luxembourg SARL(a) |
| 02/01/2025 | 5.000% | | 324,000 | 333,912 |
| Outfront Media Capital LLC/Corp. |
| 03/15/2025 | 5.875% | | 441,000 | 459,526 |
| RELX Capital, Inc. |
| 10/15/2022 | 3.125% | | 3,000,000 | 3,062,247 |
| Scripps Networks Interactive, Inc. |
| 11/15/2024 | 3.900% | | 5,000,000 | 5,175,160 |
| Thomson Reuters Corp. |
| 05/23/2043 | 4.500% | | 4,300,000 | 4,460,368 |
| Time Warner, Inc. |
| 01/15/2026 | 3.875% | | 7,110,000 | 7,256,246 |
| Univision Communications, Inc.(a) |
| 02/15/2025 | 5.125% | | 178,000 | 178,654 |
| Total | 27,555,838 |
| Metals and Mining 0.1% |
| Big River Steel LLC/Finance Corp.(a) |
| 09/01/2025 | 7.250% | | 154,000 | 161,086 |
The accompanying Notes to Financial Statements are an integral part of this statement.
| 20 | Columbia Balanced Fund | Annual Report 2017 |
Portfolio of Investments (continued)
August 31, 2017
| Corporate Bonds & Notes (continued) |
| Issuer | Coupon
Rate | | Principal
Amount ($) | Value ($) |
| Constellium NV(a) |
| 05/15/2024 | 5.750% | | 401,000 | 408,168 |
| Freeport-McMoRan, Inc. |
| 11/14/2024 | 4.550% | | 444,000 | 443,651 |
| Grinding Media, Inc./Moly-Cop AltaSteel Ltd.(a) |
| 12/15/2023 | 7.375% | | 253,000 | 272,739 |
| HudBay Minerals, Inc.(a) |
| 01/15/2025 | 7.625% | | 244,000 | 268,631 |
| Novelis Corp.(a) |
| 08/15/2024 | 6.250% | | 84,000 | 88,515 |
| 09/30/2026 | 5.875% | | 391,000 | 406,281 |
| Teck Resources Ltd.(a) |
| 06/01/2024 | 8.500% | | 144,000 | 166,551 |
| Teck Resources Ltd. |
| 07/15/2041 | 6.250% | | 494,000 | 543,278 |
| Vale Overseas Ltd. |
| 01/11/2022 | 4.375% | | 5,510,000 | 5,811,761 |
| Total | 8,570,661 |
| Midstream 0.6% |
| Andeavor Logistics LP/Tesoro Finance Corp. |
| 05/01/2024 | 6.375% | | 179,000 | 193,989 |
| 01/15/2025 | 5.250% | | 418,000 | 443,691 |
| Delek Logistics Partners LP(a) |
| 05/15/2025 | 6.750% | | 178,000 | 179,316 |
| Energy Transfer Equity LP |
| 06/01/2027 | 5.500% | | 681,000 | 725,987 |
| Enterprise Products Operating LLC |
| 02/01/2041 | 5.950% | | 4,830,000 | 5,827,429 |
| Holly Energy Partners LP/Finance Corp.(a) |
| 08/01/2024 | 6.000% | | 330,000 | 342,397 |
| Kinder Morgan Energy Partners LP |
| 03/01/2044 | 5.500% | | 7,000,000 | 7,281,652 |
| MPLX LP |
| 03/01/2027 | 4.125% | | 5,500,000 | 5,590,161 |
| NGPL PipeCo LLC(a) |
| 08/15/2022 | 4.375% | | 64,000 | 65,785 |
| 08/15/2027 | 4.875% | | 78,000 | 80,492 |
| NuStar Logistics LP |
| 04/28/2027 | 5.625% | | 192,000 | 203,795 |
| Plains All American Pipeline LP/Finance Corp. |
| 01/15/2037 | 6.650% | | 5,700,000 | 6,390,179 |
| Southern Natural Gas Co. LLC(a) |
| 03/15/2047 | 4.800% | | 3,650,000 | 3,958,494 |
| Tallgrass Energy Partners LP/Finance Corp.(a) |
| 09/15/2024 | 5.500% | | 67,000 | 67,725 |
| Corporate Bonds & Notes (continued) |
| Issuer | Coupon
Rate | | Principal
Amount ($) | Value ($) |
| Targa Resources Partners LP/Finance Corp. |
| 03/15/2024 | 6.750% | | 173,000 | 187,087 |
| Targa Resources Partners LP/Finance Corp.(a) |
| 02/01/2027 | 5.375% | | 526,000 | 543,930 |
| Williams Companies, Inc. (The) |
| 01/15/2023 | 3.700% | | 104,000 | 103,086 |
| 06/24/2024 | 4.550% | | 588,000 | 601,250 |
| Williams Partners LP |
| 03/04/2024 | 4.300% | | 7,175,000 | 7,600,944 |
| Total | 40,387,389 |
| Natural Gas 0.2% |
| NiSource Finance Corp. |
| 02/15/2044 | 4.800% | | 5,065,000 | 5,679,709 |
| Sempra Energy |
| 06/15/2027 | 3.250% | | 8,000,000 | 7,980,880 |
| Total | 13,660,589 |
| Office REIT 0.1% |
| Boston Properties LP |
| 02/01/2026 | 3.650% | | 6,000,000 | 6,201,108 |
| Oil Field Services 0.0% |
| SESI LLC(a) |
| 09/15/2024 | 7.750% | | 38,000 | 38,273 |
| Weatherford International Ltd. |
| 06/15/2023 | 8.250% | | 211,000 | 207,349 |
| Total | 245,622 |
| Other Financial Institutions 0.0% |
| Icahn Enterprises LP/Finance Corp. |
| 02/01/2022 | 6.250% | | 133,000 | 137,173 |
| Other Industry 0.0% |
| KAR Auction Services, Inc.(a) |
| 06/01/2025 | 5.125% | | 153,000 | 158,185 |
| Other REIT 0.1% |
| CyrusOne LP/Finance Corp.(a) |
| 03/15/2024 | 5.000% | | 80,000 | 83,647 |
| 03/15/2027 | 5.375% | | 80,000 | 84,494 |
| Duke Realty LP |
| 04/15/2023 | 3.625% | | 5,166,000 | 5,369,396 |
| Total | 5,537,537 |
| Packaging 0.0% |
| Ardagh Packaging Finance PLC/Holdings USA, Inc.(a) |
| 05/15/2024 | 7.250% | | 421,000 | 465,017 |
| 02/15/2025 | 6.000% | | 432,000 | 458,615 |
The accompanying Notes to Financial Statements are an integral part of this statement.
Columbia Balanced Fund | Annual Report 2017
| 21 |
Portfolio of Investments (continued)
August 31, 2017
| Corporate Bonds & Notes (continued) |
| Issuer | Coupon
Rate | | Principal
Amount ($) | Value ($) |
| Berry Plastics Corp. |
| 10/15/2022 | 6.000% | | 77,000 | 81,730 |
| 07/15/2023 | 5.125% | | 295,000 | 307,823 |
| Novolex (a) |
| 01/15/2025 | 6.875% | | 92,000 | 95,530 |
| Owens-Brockway Glass Container, Inc.(a) |
| 01/15/2025 | 5.375% | | 96,000 | 102,720 |
| Reynolds Group Issuer, Inc./LLC |
| 10/15/2020 | 5.750% | | 355,000 | 361,734 |
| Reynolds Group Issuer, Inc./LLC(a) |
| 07/15/2024 | 7.000% | | 195,000 | 208,763 |
| Total | 2,081,932 |
| Pharmaceuticals 0.4% |
| AbbVie, Inc. |
| 05/14/2021 | 2.300% | | 4,275,000 | 4,284,965 |
| Allergan Funding SCS |
| 03/15/2035 | 4.550% | | 3,275,000 | 3,520,072 |
| Amgen, Inc. |
| 03/15/2040 | 5.750% | | 2,400,000 | 2,911,615 |
| Eagle Holding Co., II LLC PIK(a) |
| 05/15/2022 | 7.625% | | 48,000 | 49,550 |
| Endo Dac/Finance LLC/Finco, Inc.(a),(b),(f) |
| 02/01/2025 | 6.000% | | 83,000 | 67,947 |
| Gilead Sciences, Inc. |
| 04/01/2024 | 3.700% | | 6,000,000 | 6,359,220 |
| Jaguar Holding Co. II/Pharmaceutical Product Development LLC(a) |
| 08/01/2023 | 6.375% | | 274,000 | 287,430 |
| Mallinckrodt International Finance SA |
| 04/15/2018 | 3.500% | | 126,000 | 126,458 |
| Roche Holdings, Inc.(a) |
| 09/30/2024 | 3.350% | | 3,500,000 | 3,669,585 |
| Shire Acquisitions Investments Ireland DAC |
| 09/23/2023 | 2.875% | | 6,000,000 | 5,966,856 |
| Valeant Pharmaceuticals International, Inc.(a) |
| 05/15/2023 | 5.875% | | 123,000 | 104,855 |
| 03/15/2024 | 7.000% | | 307,000 | 325,909 |
| 04/15/2025 | 6.125% | | 1,024,000 | 862,517 |
| Total | 28,536,979 |
| Property & Casualty 0.5% |
| Berkshire Hathaway, Inc. |
| 03/15/2023 | 2.750% | | 5,090,000 | 5,204,205 |
| Chubb Corp. (The)(b) |
| Junior Subordinated |
3-month USD LIBOR + 2.250%
04/15/2037 | 3.554% | | 5,000,000 | 4,979,990 |
| Corporate Bonds & Notes (continued) |
| Issuer | Coupon
Rate | | Principal
Amount ($) | Value ($) |
| CNA Financial Corp. |
| 03/01/2026 | 4.500% | | 5,000,000 | 5,440,545 |
| Hartford Financial Services Group, Inc. (The) |
| 04/15/2022 | 5.125% | | 4,740,000 | 5,295,196 |
| HUB International Ltd.(a) |
| 10/01/2021 | 7.875% | | 432,000 | 449,663 |
| Loews Corp. |
| 05/15/2023 | 2.625% | | 7,350,000 | 7,395,886 |
| Transatlantic Holdings, Inc. |
| 11/30/2039 | 8.000% | | 2,725,000 | 3,746,913 |
| Total | 32,512,398 |
| Railroads 0.1% |
| Burlington Northern Santa Fe LLC |
| 09/01/2024 | 3.400% | | 4,475,000 | 4,697,806 |
| CSX Corp. |
| 03/15/2044 | 4.100% | | 5,000,000 | 5,042,155 |
| Total | 9,739,961 |
| Refining 0.0% |
| Marathon Petroleum Corp. |
| 03/01/2041 | 6.500% | | 800,000 | 947,089 |
| Restaurants 0.0% |
| 1011778 BC Unlimited Liability Co./New Red Finance, Inc.(a) |
| 05/15/2024 | 4.250% | | 452,000 | 459,768 |
| 10/15/2025 | 5.000% | | 195,000 | 199,764 |
| BC ULC/New Red Finance, Inc.(a) |
| 01/15/2022 | 4.625% | | 255,000 | 260,892 |
| KFC Holding Co./Pizza Hut Holdings LLC/Taco Bell of America LLC(a) |
| 06/01/2026 | 5.250% | | 211,000 | 222,258 |
| Total | 1,142,682 |
| Retail REIT 0.2% |
| Kimco Realty Corp. |
| 06/01/2023 | 3.125% | | 6,725,000 | 6,786,762 |
| Simon Property Group LP |
| 02/01/2040 | 6.750% | | 3,000,000 | 4,110,363 |
| Total | 10,897,125 |
| Retailers 0.3% |
| Asbury Automotive Group, Inc. |
| 12/15/2024 | 6.000% | | 78,000 | 80,311 |
| CVS Health Corp. |
| 07/20/2022 | 3.500% | | 5,000,000 | 5,230,755 |
| CVS Pass-Through Trust(a) |
| 01/10/2032 | 7.507% | | 285,315 | 355,176 |
The accompanying Notes to Financial Statements are an integral part of this statement.
| 22 | Columbia Balanced Fund | Annual Report 2017 |
Portfolio of Investments (continued)
August 31, 2017
| Corporate Bonds & Notes (continued) |
| Issuer | Coupon
Rate | | Principal
Amount ($) | Value ($) |
| Hanesbrands, Inc.(a) |
| 05/15/2024 | 4.625% | | 102,000 | 106,172 |
| L Brands, Inc. |
| 11/01/2035 | 6.875% | | 186,000 | 177,913 |
| Lithia Motors, Inc.(a) |
| 08/01/2025 | 5.250% | | 33,000 | 33,650 |
| Lowe’s Companies, Inc. |
| 05/03/2027 | 3.100% | | 6,500,000 | 6,545,988 |
| Penske Automotive Group, Inc. |
| 12/01/2024 | 5.375% | | 36,000 | 36,394 |
| 05/15/2026 | 5.500% | | 64,000 | 64,536 |
| Target Corp. |
| 07/01/2024 | 3.500% | | 6,150,000 | 6,451,467 |
| Total | 19,082,362 |
| Supermarkets 0.1% |
| Kroger Co. (The) |
| 01/15/2048 | 4.650% | | 6,115,000 | 6,064,765 |
| Technology 0.5% |
| Apple, Inc. |
| 02/09/2024 | 3.000% | | 8,400,000 | 8,634,940 |
| Ascend Learning LLC(a) |
| 08/01/2025 | 6.875% | | 75,000 | 78,002 |
| Broadcom Corp./Cayman Finance Ltd.(a) |
| 01/15/2024 | 3.625% | | 6,145,000 | 6,331,458 |
| Camelot Finance SA(a) |
| 10/15/2024 | 7.875% | | 175,000 | 189,826 |
| CDK Global, Inc.(a) |
| 06/01/2027 | 4.875% | | 100,000 | 101,455 |
| Equinix, Inc. |
| 01/15/2026 | 5.875% | | 248,000 | 272,334 |
| 05/15/2027 | 5.375% | | 391,000 | 420,021 |
| First Data Corp.(a) |
| 08/15/2023 | 5.375% | | 183,000 | 192,186 |
| 12/01/2023 | 7.000% | | 548,000 | 590,275 |
| Gartner, Inc.(a) |
| 04/01/2025 | 5.125% | | 605,000 | 635,989 |
| Informatica LLC(a) |
| 07/15/2023 | 7.125% | | 163,000 | 164,141 |
| Microsoft Corp. |
| 02/06/2024 | 2.875% | | 7,000,000 | 7,197,169 |
| Oracle Corp. |
| 04/15/2038 | 6.500% | | 5,000,000 | 6,892,025 |
| PTC, Inc. |
| 05/15/2024 | 6.000% | | 257,000 | 274,941 |
| QUALCOMM, Inc. |
| 05/20/2047 | 4.300% | | 4,285,000 | 4,424,605 |
| Corporate Bonds & Notes (continued) |
| Issuer | Coupon
Rate | | Principal
Amount ($) | Value ($) |
| Qualitytech LP/Finance Corp. |
| 08/01/2022 | 5.875% | | 507,000 | 526,306 |
| Sensata Technologies UK Financing Co. PLC(a) |
| 02/15/2026 | 6.250% | | 251,000 | 274,354 |
| Solera LLC/Finance, Inc.(a) |
| 03/01/2024 | 10.500% | | 211,000 | 240,564 |
| Symantec Corp.(a) |
| 04/15/2025 | 5.000% | | 508,000 | 532,407 |
| Tempo Acquisition LLC/Finance Corp.(a) |
| 06/01/2025 | 6.750% | | 110,000 | 112,416 |
| VeriSign, Inc.(a) |
| 07/15/2027 | 4.750% | | 273,000 | 278,411 |
| Total | 38,363,825 |
| Transportation Services 0.1% |
| Avis Budget Car Rental LLC/Finance, Inc. |
| 04/01/2023 | 5.500% | | 23,000 | 23,162 |
| Avis Budget Car Rental LLC/Finance, Inc.(a) |
| 03/15/2025 | 5.250% | | 298,000 | 291,340 |
| ERAC U.S.A. Finance LLC(a) |
| 10/15/2037 | 7.000% | | 3,285,000 | 4,318,333 |
| Hertz Corp. (The)(a) |
| 06/01/2022 | 7.625% | | 179,000 | 181,470 |
| 10/15/2024 | 5.500% | | 74,000 | 63,113 |
| Total | 4,877,418 |
| Wireless 0.2% |
| Rogers Communications, Inc. |
| 11/15/2026 | 2.900% | | 7,000,000 | 6,852,797 |
| SBA Communications Corp. |
| 07/15/2022 | 4.875% | | 180,000 | 186,296 |
| 09/01/2024 | 4.875% | | 682,000 | 706,197 |
| SFR Group SA(a) |
| 05/01/2026 | 7.375% | | 601,000 | 648,638 |
| Sprint Communications, Inc.(a) |
| 03/01/2020 | 7.000% | | 497,000 | 544,248 |
| Sprint Corp. |
| 02/15/2025 | 7.625% | | 1,027,000 | 1,155,878 |
| T-Mobile USA, Inc. |
| 01/15/2026 | 6.500% | | 648,000 | 718,585 |
| Wind Acquisition Finance SA(a) |
| 04/30/2020 | 6.500% | | 111,000 | 114,978 |
| 04/23/2021 | 7.375% | | 67,000 | 69,623 |
| Total | 10,997,240 |
| Wirelines 0.5% |
| AT&T, Inc. |
| 08/15/2040 | 6.000% | | 10,500,000 | 11,891,282 |
The accompanying Notes to Financial Statements are an integral part of this statement.
Columbia Balanced Fund | Annual Report 2017
| 23 |
Portfolio of Investments (continued)
August 31, 2017
| Corporate Bonds & Notes (continued) |
| Issuer | Coupon
Rate | | Principal
Amount ($) | Value ($) |
| CenturyLink, Inc. |
| 03/15/2022 | 5.800% | | 220,000 | 218,791 |
| 04/01/2024 | 7.500% | | 309,000 | 323,620 |
| Deutsche Telekom International Finance BV(a) |
| 09/19/2023 | 2.485% | | 6,000,000 | 5,879,724 |
| Frontier Communications Corp. |
| 01/15/2023 | 7.125% | | 59,000 | 46,313 |
| 01/15/2025 | 6.875% | | 262,000 | 198,623 |
| 09/15/2025 | 11.000% | | 241,000 | 210,103 |
| Level 3 Financing, Inc. |
| 08/15/2022 | 5.375% | | 127,000 | 131,046 |
| 03/15/2026 | 5.250% | | 294,000 | 300,448 |
| Orange SA |
| 07/08/2019 | 5.375% | | 5,001,000 | 5,314,758 |
| Telecom Italia Capital SA |
| 09/30/2034 | 6.000% | | 87,000 | 96,509 |
| Telecom Italia SpA(a) |
| 05/30/2024 | 5.303% | | 163,000 | 177,129 |
| Telefonica Emisiones SAU |
| 06/20/2036 | 7.045% | | 2,800,000 | 3,693,281 |
| Verizon Communications, Inc. |
| 08/10/2033 | 4.500% | | 10,000,000 | 10,159,650 |
| Zayo Group LLC/Capital, Inc.(a) |
| 01/15/2027 | 5.750% | | 621,000 | 657,955 |
| Total | 39,299,232 |
Total Corporate Bonds & Notes
(Cost $820,787,588) | 846,018,272 |
|
| Foreign Government Obligations(g) 0.4% |
| | | | |
| Canada 0.3% |
| NOVA Chemicals Corp.(a) |
| 06/01/2024 | 4.875% | | 187,000 | 187,623 |
| Province of Ontario |
| 05/21/2020 | 1.875% | | 11,360,000 | 11,394,569 |
| Province of Quebec |
| 07/29/2020 | 3.500% | | 10,275,000 | 10,776,800 |
| Total | 22,358,992 |
| Mexico 0.1% |
| Petroleos Mexicanos(a) |
| 03/13/2027 | 6.500% | | 8,000,000 | 8,964,552 |
| United Arab Emirates 0.0% |
| DAE Funding LLC(a) |
| 08/01/2024 | 5.000% | | 142,000 | 145,161 |
Total Foreign Government Obligations
(Cost $30,508,561) | 31,468,705 |
|
| Inflation-Indexed Bonds 0.6% |
| Issuer | Coupon
Rate | | Principal
Amount ($) | Value ($) |
| United States 0.6% |
| U.S. Treasury Inflation-Indexed Bond |
| 04/15/2020 | 0.125% | | 45,501,435 | 45,741,831 |
Total Inflation-Indexed Bonds
(Cost $45,580,082) | 45,741,831 |
|
| Residential Mortgage-Backed Securities - Agency 7.9% |
| | | | |
| Federal Home Loan Mortgage Corp. |
12/01/2017-
01/01/2039 | 5.500% | | 472,730 | 517,718 |
08/01/2018-
05/01/2041 | 5.000% | | 1,255,187 | 1,371,796 |
10/01/2026-
06/01/2046 | 3.500% | | 127,789,941 | 132,651,162 |
10/01/2031-
10/01/2039 | 6.000% | | 853,444 | 961,881 |
01/01/2032-
06/01/2045 | 3.000% | | 51,064,352 | 52,041,664 |
06/01/2032-
07/01/2032 | 7.000% | | 368,678 | 424,352 |
| 03/01/2038 | 6.500% | | 8,333 | 9,678 |
05/01/2039-
06/01/2041 | 4.500% | | 4,944,209 | 5,331,342 |
12/01/2042-
12/01/2045 | 4.000% | | 61,290,445 | 64,805,331 |
| CMO Series 1614 Class MZ |
| 11/15/2023 | 6.500% | | 11,193 | 12,098 |
| Federal Home Loan Mortgage Corp.(b) |
12-month USD LIBOR + 0.000%
08/01/2036 | 3.366% | | 25,472 | 26,751 |
12-month USD LIBOR + 0.000%
12/01/2036 | 3.265% | | 2,453 | 2,562 |
| Federal Home Loan Mortgage Corp.(h) |
| 09/01/2043 | 3.500% | | 3,712,731 | 3,865,526 |
| Federal National Mortgage Association |
08/01/2018-
02/01/2038 | 5.500% | | 219,044 | 242,361 |
| 12/01/2020 | 5.000% | | 41,805 | 43,212 |
12/01/2025-
07/01/2046 | 3.500% | | 128,680,697 | 133,646,597 |
07/01/2027-
10/01/2046 | 3.000% | | 62,131,787 | 64,011,600 |
01/01/2029-
10/01/2045 | 4.000% | | 57,998,170 | 61,274,148 |
| 06/01/2031 | 7.000% | | 193,722 | 227,035 |
07/01/2032-
03/01/2037 | 6.500% | | 379,034 | 425,312 |
05/01/2040-
06/01/2044 | 4.500% | | 6,086,960 | 6,571,698 |
The accompanying Notes to Financial Statements are an integral part of this statement.
| 24 | Columbia Balanced Fund | Annual Report 2017 |
Portfolio of Investments (continued)
August 31, 2017
| Residential Mortgage-Backed Securities - Agency (continued) |
| Issuer | Coupon
Rate | | Principal
Amount ($) | Value ($) |
| Government National Mortgage Association(i) |
| 09/21/2047 | 4.000% | | 32,850,000 | 34,619,538 |
Total Residential Mortgage-Backed Securities - Agency
(Cost $561,986,660) | 563,083,362 |
|
| Residential Mortgage-Backed Securities - Non-Agency 1.5% |
| | | | |
| Angel Oak Mortgage Trust LLC(a),(b),(c) |
| CMO Series 2017-1 Class A1 |
| 01/25/2047 | 2.810% | | 3,234,247 | 3,248,070 |
| Bayview Opportunity Master Fund IVA Trust(a) |
| CMO Series 2016-SPL1 Class A |
| 04/28/2055 | 4.000% | | 3,990,618 | 4,155,506 |
| COLT Mortgage Loan Trust(a) |
| CMO Series 2016-1 Class A1 |
| 05/25/2046 | 3.000% | | 986,304 | 1,002,820 |
| COLT Mortgage Loan Trust(a),(b),(c) |
| CMO Series 2016-2 Class A1 |
| 09/25/2046 | 2.750% | | 3,018,175 | 3,065,291 |
| CMO Series 2016-3 Class A1 |
| 12/26/2046 | 2.800% | | 5,750,565 | 5,753,108 |
| CMO Series 2017-1 Class A1 |
| 05/27/2047 | 2.614% | | 5,981,505 | 6,012,195 |
| Deephaven Residential Mortgage Trust(a),(b),(c) |
| CMO Series 2017-1A Class A1 |
| 12/26/2046 | 2.725% | | 6,047,815 | 6,049,403 |
| CMO Series 2017-2A Class A1 |
| 06/25/2047 | 2.453% | | 9,024,581 | 9,023,886 |
| Equifirst Mortgage Loan Trust(b),(c) |
| CMO Series 2003-1 Class IF1 |
| 12/25/2032 | 4.010% | | 57,655 | 58,022 |
| MFA Trust(a),(b),(c) |
| CMO Series 2017-RPL1 Class A1 |
| 02/25/2057 | 2.588% | | 7,141,247 | 7,187,285 |
| Mill City Mortgage Trust(a) |
| CMO Series 2016-1 Class A1 |
| 04/25/2057 | 2.500% | | 4,112,302 | 4,132,688 |
| Series 2015-2 Class A1 |
| 09/25/2057 | 3.000% | | 2,768,582 | 2,780,182 |
| New Residential Mortgage Loan Trust(a) |
| CMO Series 2016-3A Class A1 |
| 09/25/2056 | 3.750% | | 3,174,700 | 3,250,607 |
| New Residential Mortgage Loan Trust(a),(b),(c) |
| CMO Series 2017-3A Class A1 |
| 04/25/2057 | 4.000% | | 5,012,468 | 5,251,698 |
| Springleaf Mortgage Loan Trust(a) |
| CMO Series 2013-2A Class A |
| 12/25/2065 | 1.780% | | 265,279 | 264,890 |
| CMO Series 2013-3A Class A |
| 09/25/2057 | 1.870% | | 871,511 | 871,375 |
| Residential Mortgage-Backed Securities - Non-Agency (continued) |
| Issuer | Coupon
Rate | | Principal
Amount ($) | Value ($) |
| Towd Point Mortgage Trust(a) |
| CMO Series 15-5 Class A1 |
| 05/25/2055 | 3.500% | | 3,694,433 | 3,796,122 |
| CMO Series 2015-4 Class A1 |
| 04/25/2055 | 3.500% | | 2,536,006 | 2,600,146 |
| CMO Series 2015-6 Class A1 |
| 04/25/2055 | 3.500% | | 4,138,285 | 4,259,286 |
| CMO Series 2016-1 Class A1 |
| 02/25/2055 | 3.500% | | 4,707,670 | 4,834,252 |
| CMO Series 2016-2 Class A1 |
| 08/25/2055 | 3.000% | | 6,113,925 | 6,234,420 |
| CMO Series 2016-4 Class A1 |
| 07/25/2056 | 2.250% | | 2,139,712 | 2,137,970 |
| CMO Series 2017-1 Class A1 |
| 10/25/2056 | 2.750% | | 4,277,811 | 4,324,983 |
| CMO Series 2017-4 Class A1 |
| 06/25/2057 | 2.750% | | 7,300,000 | 7,389,967 |
| Series 2016-3 Class A1 |
| 04/25/2056 | 2.250% | | 3,349,615 | 3,348,074 |
| Verus Securitization Trust(a),(b),(c) |
| CMO Series 2017-1A Class A1 |
| 01/25/2047 | 2.853% | | 3,681,819 | 3,728,185 |
Total Residential Mortgage-Backed Securities - Non-Agency
(Cost $104,246,428) | 104,760,431 |
|
| Senior Loans 0.0% |
| Borrower | Weighted
Average Coupon | | Principal
Amount ($) | Value ($) |
| Consumer Products 0.0% |
| Serta Simmons Holdings LLC(b),(j) |
| 2nd Lien Term Loan |
3-month USD LIBOR + 8.000%
11/08/2024 | 9.312% | | 303,778 | 292,958 |
| Diversified Manufacturing —% |
| Accudyne Industries Borrower SCA/LLC(b),(j),(k),(l) |
| Term Loan |
3-month USD LIBOR + 3.000%
08/18/2024 | 5.013% | | 0 | 0 |
| Technology 0.0% |
| Ancestry.com Operations, Inc.(b),(j) |
| 2nd Lien Term Loan |
3-month USD LIBOR + 8.250%
10/19/2024 | 9.490% | | 61,901 | 62,597 |
The accompanying Notes to Financial Statements are an integral part of this statement.
Columbia Balanced Fund | Annual Report 2017
| 25 |
Portfolio of Investments (continued)
August 31, 2017
| Senior Loans (continued) |
| Borrower | Weighted
Average Coupon | | Principal
Amount ($) | Value ($) |
| Ascend Learning LLC(b),(j),(m) |
| Term Loan |
3-month USD LIBOR + 3.250%
07/12/2024 | 0.000% | | 27,000 | 27,090 |
| Genesys Telecommunications Laboratories, Inc.(b),(j),(m) |
| Tranche B2 Term Loan |
3-month USD LIBOR + 3.750%
12/01/2023 | 5.007% | | 79,800 | 80,213 |
| Hyland Software, Inc.(b),(j) |
| Tranche 1 1st Lien Term Loan |
3-month USD LIBOR + 3.250%
07/01/2022 | 4.489% | | 45,168 | 45,507 |
| Information Resources, Inc.(b),(j) |
| 2nd Lien Term Loan |
3-month USD LIBOR + 8.250%
01/20/2025 | 9.486% | | 171,000 | 170,359 |
| Kronos, Inc.(b),(j) |
| 2nd Lien Term Loan |
3-month USD LIBOR + 8.250%
11/01/2024 | 9.561% | | 100,000 | 103,250 |
| Misys Ltd.(b),(j) |
| 1st Lien Term Loan |
3-month USD LIBOR + 3.500%
06/13/2024 | 4.817% | | 113,889 | 114,373 |
| 2nd Lien Term Loan |
3-month USD LIBOR + 7.250%
06/13/2025 | 8.567% | | 42,708 | 43,422 |
| Total | 646,811 |
Total Senior Loans
(Cost $937,827) | 939,769 |
|
| U.S. Government & Agency Obligations 1.3% |
| Issuer | Coupon
Rate | | Principal
Amount ($) | Value ($) |
| Federal Farm Credit Banks(b) |
1-month USD LIBOR + 0.050%
02/10/2020 | 1.281% | | 34,260,000 | 34,325,299 |
1-month USD LIBOR + 0.050%
02/21/2020 | 1.281% | | 56,590,000 | 56,677,545 |
Total U.S. Government & Agency Obligations
(Cost $90,863,391) | 91,002,844 |
|
| U.S. Treasury Obligations 2.3% |
| | | | |
| U.S. Treasury |
| 08/15/2040 | 3.875% | | 62,725,000 | 76,415,864 |
| 02/15/2045 | 2.500% | | 89,950,000 | 86,132,650 |
Total U.S. Treasury Obligations
(Cost $155,976,059) | 162,548,514 |
| Money Market Funds 7.4% |
| | Shares | Value ($) |
| Columbia Short-Term Cash Fund, 1.146%(n),(o) | 524,679,452 | 524,679,452 |
Total Money Market Funds
(Cost $524,667,700) | 524,679,452 |
Total Investments
(Cost: $6,089,920,827) | 7,160,723,555 |
| Other Assets & Liabilities, Net | | (35,855,307) |
| Net Assets | 7,124,868,248 |
At August 31, 2017, securities and/or cash totaling $793,461 were pledged as collateral.
Investments in derivatives
| Long futures contracts |
| Description | Number of
contracts | Expiration
date | Trading
currency | Notional
amount | Value/Unrealized
appreciation ($) | Value/Unrealized
depreciation ($) |
| U.S. Treasury 10-Year Note | 313 | 12/2017 | USD | 39,927,310 | 106,968 | — |
| U.S. Treasury 5-Year Note | 319 | 12/2017 | USD | 37,887,652 | 46,745 | — |
| Total | | | | | 153,713 | — |
The accompanying Notes to Financial Statements are an integral part of this statement.
| 26 | Columbia Balanced Fund | Annual Report 2017 |
Portfolio of Investments (continued)
August 31, 2017
Notes to Portfolio of Investments
| (a) | Represents privately placed and other securities and instruments exempt from SEC registration (collectively, private placements), such as Section 4(a)(2) and Rule 144A eligible securities, which are often sold only to qualified institutional buyers. The Fund may invest in private placements determined to be liquid as well as those determined to be illiquid. Private placements may be determined to be liquid under guidelines established by the Fund’s Board of Trustees. At August 31, 2017, the value of these securities amounted to $450,598,260, which represents 6.32% of net assets. |
| (b) | Variable rate security. |
| (c) | Represents a variable rate security where the coupon rate adjusts periodically using the weighted average coupon of the underlying mortgages. |
| (d) | Non-income producing investment. |
| (e) | Represents securities that have defaulted on payment of interest. The Fund has stopped accruing interest on these securities. At August 31, 2017, the value of these securities amounted to $9,500, which represents less than 0.01% of net assets. |
| (f) | Represents a step bond where the coupon rate adjusts according to a schedule for a series of periods, typically lower for an initial period and then increasing to a higher coupon rate thereafter. |
| (g) | Principal and interest may not be guaranteed by the government. |
| (h) | This security or a portion of this security has been pledged as collateral in connection with derivative contracts. |
| (i) | Represents a security purchased on a when-issued basis. |
| (j) | Senior loans have interest rates that float periodically based primarily on the London Interbank Offered Rate (“LIBOR”) and other short-term rates. The interest rate shown reflects the weighted average coupon as of August 31, 2017. The interest rate shown for senior loans purchased on a when-issued or delayed delivery basis, if any, reflects an estimated average coupon. Remaining maturities of senior loans may be less than the stated maturities shown as a result of contractual or optional prepayments by the borrower. Such prepayments cannot be predicted. |
| (k) | Represents fractional shares. |
| (l) | Negligible market value. |
| (m) | Represents a security purchased on a forward commitment basis. |
| (n) | The rate shown is the seven-day current annualized yield at August 31, 2017. |
| (o) | As defined in the Investment Company Act of 1940, an affiliated company is one in which the Fund owns 5% or more of the company’s outstanding voting securities, or a company which is under common ownership or control with the Fund. Holdings and transactions in these affiliated companies during the year ended August 31, 2017 are as follows: |
| Issuer | Beginning
shares | Shares
purchased | Shares
sold | Ending
shares | Realized gain
(loss) ($) | Net change in
unrealized
appreciation
(depreciation) ($) | Dividends —
affiliated
issuers($) | Value ($) |
| Columbia Short-Term Cash Fund, 1.146% | 393,937,921 | 2,117,953,010 | (1,987,211,479) | 524,679,452 | (8,911) | 11,752 | 3,119,115 | 524,679,452 |
Abbreviation Legend
| CMO | Collateralized Mortgage Obligation |
| PIK | Payment In Kind |
Currency Legend
Fair value measurements
The Fund categorizes its fair value measurements according to a three-level hierarchy that maximizes the use of observable inputs and minimizes the use of unobservable inputs by prioritizing that the most observable input be used when available. Observable inputs are those that market participants would use in pricing an investment based on market data obtained from sources independent of the reporting entity. Unobservable inputs are those that reflect the Fund’s assumptions about the information market participants would use in pricing an investment. An investment’s level within the fair value hierarchy is based on the lowest level of any input that is deemed significant to the asset’s or liability’s fair value measurement. The input levels are not necessarily an indication of the risk or liquidity associated with investments at that level. For example, certain U.S. government securities are generally high quality and liquid, however, they are reflected as Level 2 because the inputs used to determine fair value may not always be quoted prices in an active market.
Fair value inputs are summarized in the three broad levels listed below:
| • | Level 1 – Valuations based on quoted prices for investments in active markets that the Fund has the ability to access at the measurement date. Valuation adjustments are not applied to Level 1 investments. |
| • | Level 2 – Valuations based on other significant observable inputs (including quoted prices for similar securities, interest rates, prepayment speeds, credit risks, etc.). |
| • | Level 3 – Valuations based on significant unobservable inputs (including the Fund’s own assumptions and judgment in determining the fair value of investments). |
The accompanying Notes to Financial Statements are an integral part of this statement.
Columbia Balanced Fund | Annual Report 2017
| 27 |
Portfolio of Investments (continued)
August 31, 2017
Fair value measurements (continued)
Inputs that are used in determining fair value of an investment may include price information, credit data, volatility statistics, and other factors. These inputs can be either observable or unobservable. The availability of observable inputs can vary between investments, and is affected by various factors such as the type of investment, and the volume and level of activity for that investment or similar investments in the marketplace. The inputs will be considered by the Investment Manager, along with any other relevant factors in the calculation of an investment’s fair value. The Fund uses prices and inputs that are current as of the measurement date, which may include periods of market dislocations. During these periods, the availability of prices and inputs may be reduced for many investments. This condition could cause an investment to be reclassified between the various levels within the hierarchy.
Certain investments that have been measured at fair value using the net asset value (NAV) per share (or its equivalent) are not categorized in the fair value hierarchy. The fair value amounts presented in the table are intended to reconcile the fair value hierarchy to the amounts presented in the Portfolio of Investments. The Columbia Short-Term Cash Fund seeks to provide shareholders with maximum current income consistent with liquidity and stability of principal. Columbia Short-Term Cash Fund prices its shares with a floating NAV and no longer seeks to maintain a stable NAV.
Investments falling into the Level 3 category are primarily supported by quoted prices from brokers and dealers participating in the market for those investments. However, these may be classified as Level 3 investments due to lack of market transparency and corroboration to support these quoted prices. Additionally, valuation models may be used as the pricing source for any remaining investments classified as Level 3. These models may rely on one or more significant unobservable inputs and/or significant assumptions by the Investment Manager. Inputs used in valuations may include, but are not limited to, financial statement analysis, capital account balances, discount rates and estimated cash flows, and comparable company data.
Under the direction of the Fund’s Board of Trustees (the Board), the Investment Manager’s Valuation Committee (the Committee) is responsible for overseeing the valuation procedures approved by the Board. The Committee consists of voting and non-voting members from various groups within the Investment Manager’s organization, including operations and accounting, trading and investments, compliance, risk management and legal.
The Committee meets at least monthly to review and approve valuation matters, which may include a description of specific valuation determinations, data regarding pricing information received from approved pricing vendors and brokers and the results of Board-approved valuation control policies and procedures (the Policies). The Policies address, among other things, instances when market quotations are or are not readily available, including recommendations of third party pricing vendors and a determination of appropriate pricing methodologies; events that require specific valuation determinations and assessment of fair value techniques; securities with a potential for stale pricing, including those that are illiquid, restricted, or in default; and the effectiveness of third party pricing vendors, including periodic reviews of vendors. The Committee meets more frequently, as needed, to discuss additional valuation matters, which may include the need to review back-testing results, review time-sensitive information or approve related valuation actions. The Committee reports to the Board, with members of the Committee meeting with the Board at each of its regularly scheduled meetings to discuss valuation matters and actions during the period, similar to those described earlier.
For investments categorized as Level 3, the Committee monitors information similar to that described above, which may include: (i) data specific to the issuer or comparable issuers, (ii) general market or specific sector news and (iii) quoted prices and specific or similar security transactions. The Committee considers this data and any changes from prior periods in order to assess the reasonableness of observable and unobservable inputs, any assumptions or internal models used to value those securities and changes in fair value. This data is also used to corroborate, when available, information received from approved pricing vendors and brokers. Various factors impact the frequency of monitoring this information (which may occur as often as daily). However, the Committee may determine that changes to inputs, assumptions and models are not required as a result of the monitoring procedures performed.
The following table is a summary of the inputs used to value the Fund’s investments at August 31, 2017:
| | Level 1
quoted prices
in active
markets for
identical
assets ($) | Level 2
other
significant
observable
inputs ($) | Level 3
significant
unobservable
inputs ($) | Investments
measured at
net asset
value ($) | Total ($) |
| Investments | | | | | |
| Asset-Backed Securities — Non-Agency | — | 236,807,036 | — | — | 236,807,036 |
| Commercial Mortgage-Backed Securities - Agency | — | 117,933,791 | — | — | 117,933,791 |
| Commercial Mortgage-Backed Securities - Non-Agency | — | 171,764,201 | — | — | 171,764,201 |
| Common Stocks | | | | | |
| Consumer Discretionary | 499,947,230 | — | — | — | 499,947,230 |
| Consumer Staples | 294,942,362 | — | — | — | 294,942,362 |
| Energy | 289,701,674 | — | — | — | 289,701,674 |
| Financials | 757,523,362 | — | — | — | 757,523,362 |
| Health Care | 760,341,472 | — | — | — | 760,341,472 |
| Industrials | 331,950,453 | — | — | — | 331,950,453 |
| Information Technology | 1,016,946,162 | — | — | — | 1,016,946,162 |
| Materials | 77,626,505 | — | — | — | 77,626,505 |
| Real Estate | 68,839,253 | — | — | — | 68,839,253 |
| Telecommunication Services | 108,782,762 | — | — | — | 108,782,762 |
| Utilities | 57,374,112 | — | — | — | 57,374,112 |
| Total Common Stocks | 4,263,975,347 | — | — | — | 4,263,975,347 |
| Corporate Bonds & Notes | — | 846,018,272 | — | — | 846,018,272 |
| Foreign Government Obligations | — | 31,468,705 | — | — | 31,468,705 |
| Inflation-Indexed Bonds | — | 45,741,831 | — | — | 45,741,831 |
| Residential Mortgage-Backed Securities - Agency | — | 563,083,362 | — | — | 563,083,362 |
The accompanying Notes to Financial Statements are an integral part of this statement.
| 28 | Columbia Balanced Fund | Annual Report 2017 |
Portfolio of Investments (continued)
August 31, 2017
Fair value measurements (continued)
| | Level 1
quoted prices
in active
markets for
identical
assets ($) | Level 2
other
significant
observable
inputs ($) | Level 3
significant
unobservable
inputs ($) | Investments
measured at
net asset
value ($) | Total ($) |
| Residential Mortgage-Backed Securities - Non-Agency | — | 104,760,431 | — | — | 104,760,431 |
| Senior Loans | — | 939,769 | — | — | 939,769 |
| U.S. Government & Agency Obligations | — | 91,002,844 | — | — | 91,002,844 |
| U.S. Treasury Obligations | 162,548,514 | — | — | — | 162,548,514 |
| Money Market Funds | — | — | — | 524,679,452 | 524,679,452 |
| Total Investments | 4,426,523,861 | 2,209,520,242 | — | 524,679,452 | 7,160,723,555 |
| Derivatives | | | | | |
| Asset | | | | | |
| Futures Contracts | 153,713 | — | — | — | 153,713 |
| Total | 4,426,677,574 | 2,209,520,242 | — | 524,679,452 | 7,160,877,268 |
See the Portfolio of Investments for all investment classifications not indicated in the table.
The Fund’s assets assigned to the Level 2 input category are generally valued using the market approach, in which a security’s value is determined through reference to prices and information from market transactions for similar or identical assets.
Derivative instruments are valued at unrealized appreciation (depreciation).
There were no transfers of financial assets between Levels 1 and 2 during the period.
Financial assets were transferred from Level 3 to Level 2 as observable market inputs were utilized and management determined that there was sufficient, reliable and observable market data to value these assets as of period end.
Transfers between Levels are determined based on the fair value at the beginning of the period for security positions held throughout the period.
The following table(s) shows transfers between Levels of the fair value hierarchy:
| Transfers In | Transfers Out |
| Level 2 ($) | Level 3 ($) | Level 2 ($) | Level 3 ($) |
| 2,046,845 | — | — | 2,046,845 |
The accompanying Notes to Financial Statements are an integral part of this statement.
Columbia Balanced Fund | Annual Report 2017
| 29 |
Statement of Assets and Liabilities
August 31, 2017
| Assets | |
| Investments in unaffiliated issuers, at cost | $5,565,253,127 |
| Investments in affiliated issuers, at cost | 524,667,700 |
| Investments in unaffiliated issuers, at value | 6,636,044,103 |
| Investments in affiliated issuers, at value | 524,679,452 |
| Cash | 1,856 |
| Receivable for: | |
| Investments sold | 11,119,435 |
| Capital shares sold | 17,771,414 |
| Dividends | 7,935,517 |
| Interest | 11,677,203 |
| Foreign tax reclaims | 98,640 |
| Variation margin for futures contracts | 76,227 |
| Prepaid expenses | 47,447 |
| Trustees’ deferred compensation plan | 107,642 |
| Other assets | 12,890 |
| Total assets | 7,209,571,826 |
| Liabilities | |
| Payable for: | |
| Investments purchased | 39,568,183 |
| Investments purchased on a delayed delivery basis | 34,637,477 |
| Capital shares purchased | 9,201,108 |
| Management services fees | 112,023 |
| Distribution and/or service fees | 63,399 |
| Transfer agent fees | 748,405 |
| Plan administration fees | 122 |
| Compensation of board members | 2,024 |
| Compensation of chief compliance officer | 475 |
| Other expenses | 262,720 |
| Trustees’ deferred compensation plan | 107,642 |
| Total liabilities | 84,703,578 |
| Net assets applicable to outstanding capital stock | $7,124,868,248 |
| Represented by | |
| Paid in capital | 5,996,807,642 |
| Undistributed net investment income | 17,750,369 |
| Accumulated net realized gain | 39,353,796 |
| Unrealized appreciation (depreciation) on: | |
| Investments - unaffiliated issuers | 1,070,790,976 |
| Investments - affiliated issuers | 11,752 |
| Futures contracts | 153,713 |
| Total - representing net assets applicable to outstanding capital stock | $7,124,868,248 |
The accompanying Notes to Financial Statements are an integral part of this statement.
| 30 | Columbia Balanced Fund | Annual Report 2017 |
Statement of Assets and Liabilities (continued)
August 31, 2017
| Class A | |
| Net assets | $2,876,518,502 |
| Shares outstanding | 70,916,038 |
| Net asset value per share | $40.56 |
| Maximum offering price per share(a) | $43.03 |
| Class C | |
| Net assets | $1,536,795,538 |
| Shares outstanding | 38,017,517 |
| Net asset value per share | $40.42 |
| Class K | |
| Net assets | $468,550 |
| Shares outstanding | 11,573 |
| Net asset value per share | $40.49 |
| Class R | |
| Net assets | $136,477,778 |
| Shares outstanding | 3,365,153 |
| Net asset value per share | $40.56 |
| Class R4 | |
| Net assets | $318,025,719 |
| Shares outstanding | 7,782,277 |
| Net asset value per share | $40.87 |
| Class R5 | |
| Net assets | $312,952,194 |
| Shares outstanding | 7,721,937 |
| Net asset value per share | $40.53 |
| Class T | |
| Net assets | $2,615 |
| Shares outstanding | 64 |
| Net asset value per share(b) | $40.56 |
| Maximum offering price per share(c) | $41.60 |
| Class Y | |
| Net assets | $190,321,760 |
| Shares outstanding | 4,655,792 |
| Net asset value per share | $40.88 |
| Class Z | |
| Net assets | $1,753,305,592 |
| Shares outstanding | 43,290,037 |
| Net asset value per share | $40.50 |
| (a) | The maximum offering price per share is calculated by dividing the net asset value per share by 1.0 minus the maximum sales charge of 5.75% for Class A. |
| (b) | Net asset value per share rounds to this amount due to fractional shares outstanding. |
| (c) | The maximum offering price per share is calculated by dividing the net asset value per share by 1.0 minus the maximum sales charge of 2.50% for Class T. |
The accompanying Notes to Financial Statements are an integral part of this statement.
Columbia Balanced Fund | Annual Report 2017
| 31 |
Statement of Operations
Year Ended August 31, 2017
| Net investment income | |
| Income: | |
| Dividends — unaffiliated issuers | $72,185,498 |
| Dividends — affiliated issuers | 3,119,115 |
| Interest | 57,055,274 |
| Foreign taxes withheld | (135,029) |
| Total income | 132,224,858 |
| Expenses: | |
| Management services fees | 37,000,407 |
| Distribution and/or service fees | |
| Class A | 7,569,839 |
| Class B(a) | 40,583 |
| Class C | 14,108,132 |
| Class R | 490,083 |
| Class T(b) | 2 |
| Transfer agent fees | |
| Class A | 3,627,569 |
| Class B(a) | 4,941 |
| Class C | 1,687,858 |
| Class K | 5,397 |
| Class R | 116,784 |
| Class R4 | 191,073 |
| Class R5 | 136,239 |
| Class T(b) | 2 |
| Class Y | 13,094 |
| Class Z | 1,509,596 |
| Plan administration fees | |
| Class K | 25,495 |
| Compensation of board members | 128,367 |
| Custodian fees | 73,056 |
| Printing and postage fees | 457,574 |
| Registration fees | 501,628 |
| Audit fees | 44,896 |
| Legal fees | 183,344 |
| Compensation of chief compliance officer | 2,782 |
| Other | 49,930 |
| Total expenses | 67,968,671 |
| Expense reduction | (2,528) |
| Total net expenses | 67,966,143 |
| Net investment income | 64,258,715 |
| Realized and unrealized gain (loss) — net | |
| Net realized gain (loss) on: | |
| Investments — unaffiliated issuers | 73,507,857 |
| Investments — affiliated issuers | (8,911) |
| Foreign currency translations | 27,015 |
| Futures contracts | 247,524 |
| Net realized gain | 73,773,485 |
| Net change in unrealized appreciation (depreciation) on: | |
| Investments — unaffiliated issuers | 455,748,040 |
| Investments — affiliated issuers | 11,752 |
| Futures contracts | 298,556 |
| Net change in unrealized appreciation (depreciation) | 456,058,348 |
| Net realized and unrealized gain | 529,831,833 |
| Net increase in net assets resulting from operations | $594,090,548 |
| (a) | Effective July 17, 2017, Class B shares were automatically converted to Class A shares. |
| (b) | Class T shares are based on operations from April 3, 2017 (commencement of operations) through the stated period end. |
The accompanying Notes to Financial Statements are an integral part of this statement.
| 32 | Columbia Balanced Fund | Annual Report 2017 |
Statement of Changes in Net Assets
| | Year Ended
August 31, 2017 (a) | Year Ended
August 31, 2016 |
| Operations | | |
| Net investment income | $64,258,715 | $41,740,578 |
| Net realized gain (loss) | 73,773,485 | (1,994,599) |
| Net change in unrealized appreciation (depreciation) | 456,058,348 | 340,586,437 |
| Net increase in net assets resulting from operations | 594,090,548 | 380,332,416 |
| Distributions to shareholders | | |
| Net investment income | | |
| Class A | (31,419,357) | (35,023,138) |
| Class B(b) | (15,938) | (69,193) |
| Class C | (4,281,484) | (6,204,832) |
| Class K | (152,413) | (383,278) |
| Class R | (735,523) | (660,979) |
| Class R4 | (1,891,778) | (999,615) |
| Class R5 | (3,044,013) | (2,390,624) |
| Class T | (6) | — |
| Class Y | (2,015,122) | (1,525,806) |
| Class Z | (15,800,647) | (10,613,315) |
| Net realized gains | | |
| Class A | (10,277,146) | (40,972,070) |
| Class B(b) | (18,534) | (153,615) |
| Class C | (4,465,030) | (14,622,344) |
| Class K | (75,695) | (420,956) |
| Class R | (268,851) | (926,491) |
| Class R4 | (429,875) | (955,301) |
| Class R5 | (637,036) | (2,361,482) |
| Class Y | (444,743) | (1,330,113) |
| Class Z | (3,039,354) | (10,356,825) |
| Total distributions to shareholders | (79,012,545) | (129,969,977) |
| Increase in net assets from capital stock activity | 994,657,535 | 2,103,451,935 |
| Total increase in net assets | 1,509,735,538 | 2,353,814,374 |
| Net assets at beginning of year | 5,615,132,710 | 3,261,318,336 |
| Net assets at end of year | $7,124,868,248 | $5,615,132,710 |
| Undistributed net investment income | $17,750,369 | $13,514,962 |
| (a) | Class T shares are based on operations from April 3, 2017 (commencement of operations) through the stated period end. |
| (b) | Effective July 17, 2017, Class B shares were automatically converted to Class A shares. |
The accompanying Notes to Financial Statements are an integral part of this statement.
Columbia Balanced Fund | Annual Report 2017
| 33 |
Statement of Changes in Net Assets (continued)
| | Year Ended | Year Ended |
| | August 31, 2017 (a) | August 31, 2016 |
| | Shares | Dollars ($) | Shares | Dollars ($) |
| Capital stock activity |
| Class A(b) | | | | |
| Subscriptions (c) | 24,772,439 | 945,332,855 | 38,196,367 | 1,373,016,007 |
| Distributions reinvested | 1,045,100 | 39,678,883 | 1,999,566 | 71,224,030 |
| Redemptions | (33,774,711) | (1,309,765,943) | (13,991,552) | (504,067,901) |
| Net increase (decrease) | (7,957,172) | (324,754,205) | 26,204,381 | 940,172,136 |
| Class B(b) | | | | |
| Subscriptions | 14,471 | 541,609 | 59,327 | 2,128,664 |
| Distributions reinvested | 846 | 31,720 | 5,773 | 204,975 |
| Redemptions (c) | (185,775) | (7,216,956) | (142,320) | (5,077,895) |
| Net decrease | (170,458) | (6,643,627) | (77,220) | (2,744,256) |
| Class C | | | | |
| Subscriptions | 11,563,817 | 441,849,546 | 19,540,243 | 701,075,793 |
| Distributions reinvested | 213,858 | 8,054,282 | 532,278 | 18,919,620 |
| Redemptions | (7,571,868) | (291,220,044) | (3,419,494) | (122,654,511) |
| Net increase | 4,205,807 | 158,683,784 | 16,653,027 | 597,340,902 |
| Class K | | | | |
| Subscriptions | 38,103 | 1,428,499 | 68,707 | 2,430,168 |
| Distributions reinvested | 6,113 | 227,986 | 22,615 | 803,862 |
| Redemptions | (659,481) | (24,828,066) | (87,211) | (3,173,881) |
| Net increase (decrease) | (615,265) | (23,171,581) | 4,111 | 60,149 |
| Class R | | | | |
| Subscriptions | 2,180,027 | 84,852,665 | 1,439,975 | 51,690,440 |
| Distributions reinvested | 14,354 | 547,735 | 26,919 | 959,273 |
| Redemptions | (958,372) | (37,008,232) | (373,956) | (13,470,118) |
| Net increase | 1,236,009 | 48,392,168 | 1,092,938 | 39,179,595 |
| Class R4 | | | | |
| Subscriptions | 5,915,668 | 234,427,027 | 2,526,108 | 92,297,483 |
| Distributions reinvested | 58,826 | 2,263,044 | 51,084 | 1,833,811 |
| Redemptions | (1,156,822) | (45,169,223) | (680,087) | (24,683,149) |
| Net increase | 4,817,672 | 191,520,848 | 1,897,105 | 69,448,145 |
| Class R5 | | | | |
| Subscriptions | 4,167,519 | 160,934,986 | 4,269,929 | 153,979,342 |
| Distributions reinvested | 96,352 | 3,675,206 | 133,516 | 4,750,215 |
| Redemptions | (1,372,685) | (52,679,229) | (2,673,498) | (95,400,884) |
| Net increase | 2,891,186 | 111,930,963 | 1,729,947 | 63,328,673 |
| Class T | | | | |
| Subscriptions | 64 | 2,500 | — | — |
| Net increase | 64 | 2,500 | — | — |
| Class Y | | | | |
| Subscriptions | 2,223,648 | 86,597,736 | 1,765,549 | 63,873,858 |
| Distributions reinvested | 60,495 | 2,323,884 | 72,198 | 2,591,074 |
| Redemptions | (761,880) | (29,574,327) | (527,260) | (19,104,289) |
| Net increase | 1,522,263 | 59,347,293 | 1,310,487 | 47,360,643 |
| Class Z | | | | |
| Subscriptions | 28,546,277 | 1,101,924,164 | 13,344,310 | 479,768,783 |
| Distributions reinvested | 405,893 | 15,534,982 | 470,931 | 16,746,774 |
| Redemptions | (8,808,209) | (338,109,754) | (4,101,024) | (147,209,609) |
| Net increase | 20,143,961 | 779,349,392 | 9,714,217 | 349,305,948 |
| Total net increase | 26,074,067 | 994,657,535 | 58,528,993 | 2,103,451,935 |
The accompanying Notes to Financial Statements are an integral part of this statement.
| 34 | Columbia Balanced Fund | Annual Report 2017 |
Statement of Changes in Net Assets (continued)
| (a) | Class T shares are based on operations from April 3, 2017 (commencement of operations) through the stated period end. |
| (b) | Effective July 17, 2017, Class B shares were automatically converted to Class A shares. |
| (c) | Includes conversions of Class B shares to Class A shares, if any. |
The accompanying Notes to Financial Statements are an integral part of this statement.
Columbia Balanced Fund | Annual Report 2017
| 35 |
The following table is intended to help you understand the Fund’s financial performance. Certain information reflects financial results for a single share of a class held for the periods shown. Per share net investment income (loss) amounts are calculated based on average shares outstanding during the period. Total return assumes reinvestment of all dividends and distributions, if any. Total return does not reflect payment of sales charges, if any. Total return and portfolio turnover are not annualized for periods of less than one year. The portfolio turnover rate is calculated without regard to purchase and sales transactions of short-term instruments and certain derivatives, if any. If such transactions were included, the Fund’s portfolio turnover rate may be higher.
| Year ended | Net asset value,
beginning of
period | Net
investment
income | Net
realized
and
unrealized
gain (loss) | Total from
investment
operations | Distributions
from net
investment
income | Distributions
from net
realized
gains |
| Class A |
| 8/31/2017 | $37.54 | 0.42 | 3.12 | 3.54 | (0.40) | (0.12) |
| 8/31/2016 | $35.80 | 0.38 | 2.62 | 3.00 | (0.58) | (0.68) |
| 8/31/2015 | $37.01 | 0.75 (d) | (0.23) | 0.52 | (0.40) | (1.33) |
| 8/31/2014 | $31.83 | 0.32 | 5.16 | 5.48 | (0.30) | — |
| 8/31/2013 | $28.21 | 0.28 | 3.64 | 3.92 | (0.30) | — |
| Class C |
| 8/31/2017 | $37.42 | 0.14 | 3.10 | 3.24 | (0.12) | (0.12) |
| 8/31/2016 | $35.68 | 0.11 | 2.62 | 2.73 | (0.31) | (0.68) |
| 8/31/2015 | $36.92 | 0.56 (d) | (0.32) | 0.24 | (0.15) | (1.33) |
| 8/31/2014 | $31.75 | 0.07 | 5.14 | 5.21 | (0.05) | — |
| 8/31/2013 | $28.15 | 0.05 | 3.63 | 3.68 | (0.08) | — |
| Class K |
| 8/31/2017 | $37.48 | 0.39 | 3.18 | 3.57 | (0.44) | (0.12) |
| 8/31/2016 | $35.75 | 0.41 | 2.61 | 3.02 | (0.61) | (0.68) |
| 8/31/2015 | $36.96 | 0.69 (d) | (0.13) | 0.56 | (0.44) | (1.33) |
| 8/31/2014 | $31.80 | 0.35 | 5.15 | 5.50 | (0.34) | — |
| 8/31/2013 | $28.18 | 0.31 | 3.64 | 3.95 | (0.33) | — |
| Class R |
| 8/31/2017 | $37.54 | 0.33 | 3.12 | 3.45 | (0.31) | (0.12) |
| 8/31/2016 | $35.79 | 0.29 | 2.63 | 2.92 | (0.49) | (0.68) |
| 8/31/2015 | $37.01 | 0.73 (d) | (0.31) | 0.42 | (0.31) | (1.33) |
| 8/31/2014 | $31.82 | 0.24 | 5.15 | 5.39 | (0.21) | — |
| 8/31/2013 | $28.19 | 0.20 | 3.65 | 3.85 | (0.22) | — |
The accompanying Notes to Financial Statements are an integral part of this statement.
| 36 | Columbia Balanced Fund | Annual Report 2017 |
Total
distributions to
shareholders | Reimbursement
from affiliate | Net
asset
value,
end of
period | Total
return | Total gross
expense
ratio to
average
net assets(a) | Total net
expense
ratio to
average
net assets(a),(b) | Net investment
income
ratio to
average
net assets | Portfolio
turnover | Net
assets,
end of
period
(000’s) |
| |
| (0.52) | — | $40.56 | 9.54% | 0.97% | 0.97% (c) | 1.10% | 63% | $2,876,519 |
| (1.26) | — | $37.54 | 8.60% | 1.03% | 1.03% (c) | 1.06% | 60% | $2,960,832 |
| (1.73) | — | $35.80 | 1.38% | 1.06% | 1.06% (c) | 2.03% | 102% | $1,885,538 |
| (0.30) | — | $37.01 | 17.29% | 1.09% | 1.09% (c) | 0.94% | 109% | $1,344,071 |
| (0.30) | — | $31.83 | 13.97% | 1.14% | 1.13% (c) | 0.91% | 141% | $994,163 |
| |
| (0.24) | — | $40.42 | 8.71% | 1.72% | 1.72% (c) | 0.35% | 63% | $1,536,796 |
| (0.99) | — | $37.42 | 7.80% | 1.78% | 1.78% (c) | 0.32% | 60% | $1,265,079 |
| (1.48) | — | $35.68 | 0.63% | 1.81% | 1.81% (c) | 1.52% | 102% | $612,243 |
| (0.05) | 0.01 | $36.92 | 16.44% (e) | 1.84% | 1.84% (c) | 0.19% | 109% | $295,665 |
| (0.08) | — | $31.75 | 13.12% | 1.89% | 1.88% (c) | 0.16% | 141% | $149,581 |
| |
| (0.56) | — | $40.49 | 9.62% | 0.90% | 0.90% | 1.05% | 63% | $469 |
| (1.29) | — | $37.48 | 8.69% | 0.93% | 0.93% | 1.15% | 60% | $23,494 |
| (1.77) | — | $35.75 | 1.49% | 0.95% | 0.95% | 1.86% | 102% | $22,260 |
| (0.34) | — | $36.96 | 17.39% | 0.97% | 0.97% | 1.00% | 109% | $23,303 |
| (0.33) | — | $31.80 | 14.11% | 1.01% | 1.01% | 1.02% | 141% | $70,411 |
| |
| (0.43) | — | $40.56 | 9.27% | 1.22% | 1.22% (c) | 0.86% | 63% | $136,478 |
| (1.17) | — | $37.54 | 8.35% | 1.28% | 1.28% (c) | 0.82% | 60% | $79,917 |
| (1.64) | — | $35.79 | 1.10% | 1.31% | 1.31% (c) | 1.97% | 102% | $37,089 |
| (0.21) | 0.01 | $37.01 | 17.04% (e) | 1.34% | 1.34% (c) | 0.69% | 109% | $21,445 |
| (0.22) | — | $31.82 | 13.73% | 1.39% | 1.38% (c) | 0.64% | 141% | $13,113 |
Columbia Balanced Fund | Annual Report 2017
| 37 |
Financial Highlights (continued)
| Year ended | Net asset value,
beginning of
period | Net
investment
income | Net
realized
and
unrealized
gain (loss) | Total from
investment
operations | Distributions
from net
investment
income | Distributions
from net
realized
gains |
| Class R4 |
| 8/31/2017 | $37.82 | 0.53 | 3.14 | 3.67 | (0.50) | (0.12) |
| 8/31/2016 | $36.06 | 0.48 | 2.63 | 3.11 | (0.67) | (0.68) |
| 8/31/2015 | $37.27 | 0.88 (d) | (0.27) | 0.61 | (0.49) | (1.33) |
| 8/31/2014 | $32.03 | 0.42 | 5.18 | 5.60 | (0.38) | — |
| 8/31/2013 (f) | $28.25 | 0.29 | 3.76 | 4.05 | (0.27) | — |
| Class R5 |
| 8/31/2017 | $37.51 | 0.55 | 3.12 | 3.67 | (0.53) | (0.12) |
| 8/31/2016 | $35.78 | 0.51 | 2.60 | 3.11 | (0.70) | (0.68) |
| 8/31/2015 | $36.99 | 0.97 (d) | (0.32) | 0.65 | (0.53) | (1.33) |
| 8/31/2014 | $31.80 | 0.45 | 5.14 | 5.59 | (0.42) | — |
| 8/31/2013 | $28.17 | 0.39 | 3.64 | 4.03 | (0.40) | — |
| Class T |
| 8/31/2017 (h) | $38.78 | 0.20 | 1.68 | 1.88 | (0.10) | — |
| Class Y |
| 8/31/2017 | $37.83 | 0.57 | 3.15 | 3.72 | (0.55) | (0.12) |
| 8/31/2016 | $36.07 | 0.53 | 2.63 | 3.16 | (0.72) | (0.68) |
| 8/31/2015 | $37.28 | 1.21 (d) | (0.54) | 0.67 | (0.55) | (1.33) |
| 8/31/2014 | $32.04 | 0.47 | 5.19 | 5.66 | (0.44) | — |
| 8/31/2013 (i) | $28.25 | 0.34 | 3.75 | 4.09 | (0.30) | — |
| Class Z |
| 8/31/2017 | $37.48 | 0.53 | 3.11 | 3.64 | (0.50) | (0.12) |
| 8/31/2016 | $35.75 | 0.47 | 2.61 | 3.08 | (0.67) | (0.68) |
| 8/31/2015 | $36.96 | 0.83 (d) | (0.22) | 0.61 | (0.49) | (1.33) |
| 8/31/2014 | $31.78 | 0.41 | 5.15 | 5.56 | (0.38) | — |
| 8/31/2013 | $28.17 | 0.35 | 3.63 | 3.98 | (0.37) | — |
| Notes to Financial Highlights |
| (a) | In addition to the fees and expenses that the Fund bears directly, the Fund indirectly bears a pro rata share of the fees and expenses of any other funds in which it invests. Such indirect expenses are not included in the Fund’s reported expense ratios. |
| (b) | Total net expenses include the impact of certain fee waivers/expense reimbursements made by the Investment Manager and certain of its affiliates, if applicable. |
| (c) | The benefits derived from expense reductions had an impact of less than 0.01%. |
| (d) | Net investment income per share includes special dividends. The per share effect of these dividends amounted to: |
| Year ended | Class A | Class C | Class K | Class R | Class R4 | Class R5 | Class Y | Class Z |
| 08/31/2015 | $ 0.48 | $ 0.56 | $ 0.39 | $ 0.55 | $ 0.51 | $ 0.57 | $ 0.78 | $ 0.47 |
| (e) | The Fund received a payment from an affiliate. Had the Fund not received this payment, the total return would have been lower by 0.03%, 0.03%, 0.05%, 0.05% and 0.04% for Class C, R, R4, R5 and Y, respectively. |
| (f) | Class R4 shares commenced operations on November 8, 2012. Per share data and total return reflect activity from that date. |
| (g) | Annualized. |
| (h) | Class T shares commenced operations on April 3, 2017. Per share data and total return reflect activity from that date. |
| (i) | Class Y shares commenced operations on November 8, 2012. Per share data and total return reflect activity from that date. |
The accompanying Notes to Financial Statements are an integral part of this statement.
| 38 | Columbia Balanced Fund | Annual Report 2017 |
Total
distributions to
shareholders | Reimbursement
from affiliate | Net
asset
value,
end of
period | Total
return | Total gross
expense
ratio to
average
net assets(a) | Total net
expense
ratio to
average
net assets(a),(b) | Net investment
income
ratio to
average
net assets | Portfolio
turnover | Net
assets,
end of
period
(000’s) |
| |
| (0.62) | — | $40.87 | 9.82% | 0.72% | 0.72% (c) | 1.37% | 63% | $318,026 |
| (1.35) | — | $37.82 | 8.86% | 0.78% | 0.78% (c) | 1.33% | 60% | $112,108 |
| (1.82) | — | $36.06 | 1.62% | 0.81% | 0.81% (c) | 2.37% | 102% | $38,489 |
| (0.38) | 0.02 | $37.27 | 17.64% (e) | 0.84% | 0.84% (c) | 1.21% | 109% | $15,596 |
| (0.27) | — | $32.03 | 14.40% | 0.88% (g) | 0.88% (c),(g) | 1.14% (g) | 141% | $3,515 |
| |
| (0.65) | — | $40.53 | 9.91% | 0.66% | 0.66% | 1.42% | 63% | $312,952 |
| (1.38) | — | $37.51 | 8.96% | 0.68% | 0.68% | 1.41% | 60% | $181,221 |
| (1.86) | — | $35.78 | 1.74% | 0.70% | 0.70% | 2.63% | 102% | $110,946 |
| (0.42) | 0.02 | $36.99 | 17.76% (e) | 0.73% | 0.73% | 1.30% | 109% | $47,848 |
| (0.40) | — | $31.80 | 14.42% | 0.76% | 0.76% | 1.26% | 141% | $29,617 |
| |
| (0.10) | — | $40.56 | 4.84% | 0.97% (g) | 0.97% (c),(g) | 1.22% (g) | 63% | $3 |
| |
| (0.67) | — | $40.88 | 9.96% | 0.61% | 0.61% | 1.47% | 63% | $190,322 |
| (1.40) | — | $37.83 | 9.02% | 0.63% | 0.63% | 1.47% | 60% | $118,553 |
| (1.88) | — | $36.07 | 1.78% | 0.66% | 0.66% | 3.27% | 102% | $65,758 |
| (0.44) | 0.02 | $37.28 | 17.84% (e) | 0.68% | 0.68% | 1.35% | 109% | $17,106 |
| (0.30) | — | $32.04 | 14.54% | 0.70% (g) | 0.70% (g) | 1.34% (g) | 141% | $9,784 |
| |
| (0.62) | — | $40.50 | 9.83% | 0.72% | 0.72% (c) | 1.36% | 63% | $1,753,306 |
| (1.35) | — | $37.48 | 8.85% | 0.78% | 0.78% (c) | 1.32% | 60% | $867,554 |
| (1.82) | — | $35.75 | 1.64% | 0.81% | 0.81% (c) | 2.24% | 102% | $480,162 |
| (0.38) | — | $36.96 | 17.60% | 0.84% | 0.84% (c) | 1.18% | 109% | $364,457 |
| (0.37) | — | $31.78 | 14.24% | 0.89% | 0.88% (c) | 1.16% | 141% | $308,945 |
Columbia Balanced Fund | Annual Report 2017
| 39 |
Notes to Financial Statements
August 31, 2017
Note 1. Organization
Columbia Balanced Fund (the Fund), a series of Columbia Funds Series Trust I (the Trust), is a diversified fund. The Trust is registered under the Investment Company Act of 1940, as amended (the 1940 Act), as an open-end management investment company organized as a Massachusetts business trust.
Fund shares
The Trust may issue an unlimited number of shares (without par value). Although all share classes generally have identical voting, dividend and liquidation rights, each share class votes separately when required by the Trust’s organizational documents or by law. Different share classes pay different distribution amounts to the extent the expenses of such share classes differ, and distributions in liquidation will be proportional to the net asset value of each share class. Each share class has its own expense and sales charge structure. The Fund offers each of the share classes identified below.
Class A shares are subject to a maximum front-end sales charge of 5.75% based on the initial investment amount. Class A shares purchased without an initial sales charge in accounts aggregating $1 million to $50 million at the time of purchase are subject to a contingent deferred sales charge (CDSC) if the shares are sold within 18 months after purchase, charged as follows: 1.00% CDSC if redeemed within 12 months after purchase, and 0.50% CDSC if redeemed more than 12, but less than 18, months after purchase.
Class B shares of the Fund are no longer offered for sale. When available, Class B shares were subject to a maximum CDSC of 5.00% based upon the holding period after purchase. Effective July 17, 2017, Class B shares were automatically converted to Class A shares without a CDSC. On August 4, 2017, the capital owned by Columbia Management Investment Advisers, LLC in Class B shares was redeemed without a CDSC.
Class C shares are subject to a 1.00% CDSC on shares redeemed within 12 months after purchase.
Class K shares are not subject to sales charges; however, this share class is closed to new investors.
Class R shares are not subject to sales charges and are generally available only to certain retirement plans and other investors as described in the Fund’s prospectus.
Class R4 shares are not subject to sales charges and are generally available only to omnibus retirement plans and certain investors as described in the Fund’s prospectus. Effective November 1, 2017, Class R4 shares will be renamed Advisor Class shares.
Class R5 shares are not subject to sales charges and are generally available only to investors purchasing through authorized investment professionals and omnibus retirement plans as described in the Fund’s prospectus. Effective November 1, 2017, Class R5 shares will be renamed Institutional 2 Class shares.
Class T shares are subject to a maximum front-end sales charge of 2.50% per transaction and must be purchased through financial intermediaries that, by written agreement with Columbia Management Investment Distributors, Inc., are specifically authorized to sell Class T shares. Class T shares commenced operations on April 3, 2017.
Class Y shares are not subject to sales charges and are available to institutional and certain other investors as described in the Fund’s prospectus. Effective November 1, 2017, Class Y shares will be renamed Institutional 3 Class shares.
Class Z shares are not subject to sales charges and are generally available only to eligible investors, which are subject to different investment minimums as described in the Fund’s prospectus. Effective November 1, 2017, Class Z shares will be renamed Institutional Class shares.
| 40 | Columbia Balanced Fund | Annual Report 2017 |
Notes to Financial Statements (continued)
August 31, 2017
Note 2. Summary of significant accounting policies
Basis of preparation
The Fund is an investment company that applies the accounting and reporting guidance in the Financial Accounting Standards Board (FASB) Accounting Standards Codification Topic 946, Financial Services - Investment Companies (ASC 946). The financial statements are prepared in accordance with U.S. generally accepted accounting principles (GAAP), which requires management to make certain estimates and assumptions that affect the reported amounts of assets and liabilities, the disclosure of contingent assets and liabilities at the date of the financial statements and the reported amounts of income and expenses during the reporting period. Actual results could differ from those estimates.
The following is a summary of significant accounting policies followed by the Fund in the preparation of its financial statements.
Security valuation
All equity securities are valued at the close of business of the New York Stock Exchange. Equity securities are valued at the last quoted sales price on the principal exchange or market on which they trade, except for securities traded on the NASDAQ Stock Market, which are valued at the NASDAQ official close price. Unlisted securities or listed securities for which there were no sales during the day are valued at the mean of the latest quoted bid and ask prices on such exchanges or markets.
Debt securities generally are valued by pricing services approved by the Board of Trustees based upon market transactions for normal, institutional-size trading units of similar securities. The services may use various pricing techniques that take into account, as applicable, factors such as yield, quality, coupon rate, maturity, type of issue, trading characteristics and other data, as well as approved independent broker-dealer quotes. Debt securities for which quotations are not readily available or not believed to be reflective of market value may also be valued based upon a bid quote from an approved independent broker-dealer. Debt securities maturing in 60 days or less are valued primarily at amortized cost value, unless this method results in a valuation that management believes does not approximate market value.
Asset- and mortgage-backed securities are generally valued by pricing services, which utilize pricing models that incorporate the securities’ cash flow and loan performance data. These models also take into account available market data, including trades, market quotations, and benchmark yield curves for identical or similar securities. Factors used to identify similar securities may include, but are not limited to, issuer, collateral type, vintage, prepayment speeds, collateral performance, credit ratings, credit enhancement and expected life. Asset-backed securities for which quotations are readily available may also be valued based upon an over-the-counter or exchange bid quote from an approved independent broker-dealer.
Senior loan securities for which reliable market quotations are readily available are generally valued by pricing services at the average of the bids received.
Foreign equity securities are valued based on the closing price on the foreign exchange in which such securities are primarily traded. If any foreign equity security closing prices are not readily available, the securities are valued at the mean of the latest quoted bid and ask prices on such exchanges or markets. Foreign currency exchange rates are generally determined at 4:00 p.m. Eastern (U.S.) time. Many securities markets and exchanges outside the U.S. close prior to the close of the New York Stock Exchange; therefore, the closing prices for securities in such markets or on such exchanges may not fully reflect events that occur after such close but before the close of the New York Stock Exchange. In those situations, foreign securities will be fair valued pursuant to a policy adopted by the Board of Trustees, including, if available, utilizing a third party pricing service to determine these fair values. The third party pricing service takes into account multiple factors, including, but not limited to, movements in the U.S. securities markets, certain depositary receipts, futures contracts and foreign exchange rates that have occurred subsequent to the close of the foreign exchange or market, to determine a good faith estimate that reasonably reflects the current market conditions as of the close of the New York Stock Exchange. The fair value of a security is likely to be different from the quoted or published price, if available.
Investments in open-end investment companies, including money market funds, are valued at their latest net asset value.
Futures and options on futures contracts are valued based upon the settlement price at the close of regular trading on their principal exchanges or, in the absence of transactions, at the mean of the latest quoted bid and ask prices.
Columbia Balanced Fund | Annual Report 2017
| 41 |
Notes to Financial Statements (continued)
August 31, 2017
Investments for which market quotations are not readily available, or that have quotations which management believes are not reflective of market value or reliable, are valued at fair value as determined in good faith under procedures approved by and under the general supervision of the Board of Trustees. If a security or class of securities (such as foreign securities) is valued at fair value, such value is likely to be different from the quoted or published price for the security.
The determination of fair value often requires significant judgment. To determine fair value, management may use assumptions including but not limited to future cash flows and estimated risk premiums. Multiple inputs from various sources may be used to determine fair value.
GAAP requires disclosure regarding the inputs and valuation techniques used to measure fair value and any changes in valuation inputs or techniques. In addition, investments shall be disclosed by major category. This information is disclosed following the Fund’s Portfolio of Investments.
Foreign currency transactions and translations
The values of all assets and liabilities denominated in foreign currencies are generally translated into U.S. dollars at exchange rates determined at the close of regular trading on the New York Stock Exchange. Net realized and unrealized gains (losses) on foreign currency transactions and translations include gains (losses) arising from the fluctuation in exchange rates between trade and settlement dates on securities transactions, gains (losses) arising from the disposition of foreign currency and currency gains (losses) between the accrual and payment dates on dividends, interest income and foreign withholding taxes.
For financial statement purposes, the Fund does not distinguish that portion of gains (losses) on investments which is due to changes in foreign exchange rates from that which is due to changes in market prices of the investments. Such fluctuations are included with the net realized and unrealized gains (losses) on investments in the Statement of Operations.
Derivative instruments
The Fund invests in certain derivative instruments, as detailed below, to meet its investment objectives. Derivatives are instruments whose values depend on, or are derived from, in whole or in part, the value of one or more securities, currencies, commodities, indices, or other assets or instruments. Derivatives may be used to increase investment flexibility (including to maintain cash reserves while maintaining desired exposure to certain assets), for risk management (hedging) purposes, to facilitate trading, to reduce transaction costs and to pursue higher investment returns. The Fund may also use derivative instruments to mitigate certain investment risks, such as foreign currency exchange rate risk, interest rate risk and credit risk. Derivatives may involve various risks, including the potential inability of the counterparty to fulfill its obligations under the terms of the contract, the potential for an illiquid secondary market (making it difficult for the Fund to sell or terminate, including at favorable prices) and the potential for market movements which may expose the Fund to gains or losses in excess of the amount shown in the Statement of Assets and Liabilities. The notional amounts of derivative instruments, if applicable, are not recorded in the financial statements.
A derivative instrument may suffer a marked-to-market loss if the value of the contract decreases due to an unfavorable change in the market rates or values of the underlying instrument. Losses can also occur if the counterparty does not perform its obligations under the contract. The Fund’s risk of loss from counterparty credit risk on over-the-counter derivatives is generally limited to the aggregate unrealized gain netted against any collateral held by the Fund and the amount of any variation margin held by the counterparty, plus any replacement costs or related amounts. With exchange-traded or centrally cleared derivatives, there is reduced counterparty credit risk to the Fund since the clearinghouse or central counterparty (CCP) provides some protection in the case of clearing member default. The clearinghouse or CCP stands between the buyer and the seller of the contract; therefore, additional counterparty credit risk is failure of the clearinghouse or CCP. However, credit risk still exists in exchange-traded or centrally cleared derivatives with respect to initial and variation margin that is held in a broker’s customer account. While brokers are required to segregate customer margin from their own assets, in the event that a broker becomes insolvent or goes into bankruptcy and at that time there is a shortfall in the aggregate amount of margin held by the broker for all its clients, U.S. bankruptcy laws will typically allocate that shortfall on a pro-rata basis across all the broker’s customers (including the Fund), potentially resulting in losses to the Fund.
| 42 | Columbia Balanced Fund | Annual Report 2017 |
Notes to Financial Statements (continued)
August 31, 2017
In order to better define its contractual rights and to secure rights that will help the Fund mitigate its counterparty risk, the Fund may enter into an International Swaps and Derivatives Association, Inc. Master Agreement (ISDA Master Agreement) or similar agreement with its derivatives contract counterparties. An ISDA Master Agreement is an agreement between the Fund and a counterparty that governs over-the-counter derivatives and typically contains, among other things, collateral posting terms and netting provisions in the event of a default and/or termination event. Under an ISDA Master Agreement, the Fund may, under certain circumstances, offset with the counterparty certain derivative instrument’s payables and/or receivables with collateral held and/or posted and create one single net payment. The provisions of the ISDA Master Agreement typically permit a single net payment in the event of default (close-out netting), including the bankruptcy or insolvency of the counterparty. Note, however, that bankruptcy or insolvency laws of a particular jurisdiction may impose restrictions on or prohibitions against the right of offset or netting in bankruptcy, insolvency or other events.
Collateral (margin) requirements differ by type of derivative. Margin requirements are established by the clearinghouse or CCP for exchange-traded and centrally cleared derivatives. Brokers can ask for margin in excess of the minimum in certain circumstances. Collateral terms are contract specific for over-the-counter derivatives. For over-the-counter derivatives traded under an ISDA Master Agreement, the collateral requirements are typically calculated by netting the marked-to-market amount for each transaction under such agreement and comparing that amount to the value of any variation margin currently pledged by the Fund and/or the counterparty. Generally, the amount of collateral due from or to a party has to exceed a minimum transfer amount threshold (e.g., $250,000) before a transfer has to be made. To the extent amounts due to the Fund from its counterparties are not fully collateralized, contractually or otherwise, the Fund bears the risk of loss from counterparty nonperformance. The Fund attempts to mitigate counterparty risk by only entering into agreements with counterparties that it believes have the financial resources to honor their obligations and by monitoring the financial stability of those counterparties.
Certain ISDA Master Agreements allow counterparties of over-the-counter derivatives transactions to terminate derivatives contracts prior to maturity in the event the Fund’s net asset value declines by a stated percentage over a specified time period or if the Fund fails to meet certain terms of the ISDA Master Agreement, which would cause the Fund to accelerate payment of any net liability owed to the counterparty. The Fund also has termination rights if the counterparty fails to meet certain terms of the ISDA Master Agreement. In addition to considering counterparty credit risk, the Fund would consider terminating the derivatives contracts based on whether termination would result in a net liability owed from the counterparty.
For financial reporting purposes, the Fund does not offset derivative assets and derivative liabilities that are subject to netting arrangements in the Statement of Assets and Liabilities.
Futures contracts
Futures contracts are exchange-traded and represent commitments for the future purchase or sale of an asset at a specified price on a specified date. The Fund bought and sold futures contracts to manage the duration and yield curve exposure of the Fund versus the benchmark and to manage exposure to movements in interest rates. These instruments may be used for other purposes in future periods. Upon entering into futures contracts, the Fund bears risks that it may not achieve the anticipated benefits of the futures contracts and may realize a loss. Additional risks include counterparty credit risk, the possibility of an illiquid market, and that a change in the value of the contract or option may not correlate with changes in the value of the underlying asset.
Upon entering into a futures contract, the Fund deposits cash or securities with the broker, known as a futures commission merchant (FCM), in an amount sufficient to meet the initial margin requirement. The initial margin deposit must be maintained at an established level over the life of the contract. Cash deposited as initial margin is recorded in the Statement of Assets and Liabilities as margin deposits. Securities deposited as initial margin are designated in the Portfolio of Investments. Subsequent payments (variation margin) are made or received by the Fund each day. The variation margin payments are equal to the daily change in the contract value and are recorded as variation margin receivable or payable and are offset in unrealized gains or losses. The Fund recognizes a realized gain or loss when the contract is closed or expires. Futures contracts involve, to varying degrees, risk of loss in excess of the variation margin disclosed in the Statement of Assets and Liabilities.
Columbia Balanced Fund | Annual Report 2017
| 43 |
Notes to Financial Statements (continued)
August 31, 2017
Effects of derivative transactions in the financial statements
The following tables are intended to provide additional information about the effect of derivatives on the financial statements of the Fund, including: the fair value of derivatives by risk category and the location of those fair values in the Statement of Assets and Liabilities; and the impact of derivative transactions over the period in the Statement of Operations, including realized and unrealized gains (losses). The derivative instrument schedules following the Portfolio of Investments present additional information regarding derivative instruments outstanding at the end of the period, if any.
The following table is a summary of the fair value of derivative instruments (not considered to be hedging instruments for accounting disclosure purposes) at August 31, 2017:
| | Asset derivatives | |
Risk exposure
category | Statement
of assets and liabilities
location | Fair value ($) |
| Interest rate risk | Net assets — unrealized appreciation on futures contracts | 153,713* |
| * | Includes cumulative appreciation (depreciation) as reported in the tables following the Portfolio of Investments. Only the current day’s variation margin is reported in receivables or payables in the Statement of Assets and Liabilities. |
The following table indicates the effect of derivative instruments (not considered to be hedging instruments for accounting disclosure purposes) in the Statement of Operations for the year ended August 31, 2017:
| Amount of realized gain (loss) on derivatives recognized in income |
| Risk exposure category | Futures
contracts
($) |
| Interest rate risk | 247,524 |
| |
| Change in unrealized appreciation (depreciation) on derivatives recognized in income |
| Risk exposure category | Futures
contracts
($) |
| Interest rate risk | 298,556 |
The following table is a summary of the average outstanding volume by derivative instrument for the year ended August 31, 2017:
| Derivative instrument | Average notional
amounts ($)* |
| Futures contracts — long | 45,614,971 |
| * | Based on the ending quarterly outstanding amounts for the year ended August 31, 2017. |
Investments in senior loans
The Fund may invest in senior loan assignments. When the Fund purchases an assignment of a senior loan, the Fund typically has direct rights against the borrower; provided, however, that the Fund’s rights may be more limited than the lender from which it acquired the assignment and the Fund may be able to enforce its rights only through an administrative agent. Although certain senior loan assignments are secured by collateral, the Fund could experience delays or limitations in realizing such collateral or have its interest subordinated to other indebtedness of the obligor. In the event that the administrator or collateral agent of a loan becomes insolvent or enters into receivership or bankruptcy, the Fund may incur costs and delays in realizing payment or may suffer a loss of principal and/or interest. The risk of loss is greater for unsecured or subordinated loans. In addition, senior loan assignments are vulnerable to market, economic or other conditions or events that may reduce the demand for senior loan assignments and certain senior loan assignments which were liquid when purchased, may become illiquid.
| 44 | Columbia Balanced Fund | Annual Report 2017 |
Notes to Financial Statements (continued)
August 31, 2017
The Fund may enter into senior loan assignments where all or a portion of the loan may be unfunded. The Fund is obligated to fund these commitments at the borrower’s discretion. These commitments, if any, are generally traded and priced in the same manner as other senior loan securities and are disclosed as unfunded senior loan commitments in the Fund’s Portfolio of Investments with a corresponding payable for investments purchased. The Fund designates cash or liquid securities to cover these commitments.
Asset- and mortgage-backed securities
The Fund may invest in asset-backed and mortgage-backed securities. The maturity dates shown represent the original maturity of the underlying obligation. Actual maturity may vary based upon prepayment activity on these obligations. All, or a portion, of the obligation may be prepaid at any time because the underlying asset may be prepaid. As a result, decreasing market interest rates could result in an increased level of prepayment. An increased prepayment rate will have the effect of shortening the maturity of the security. Unless otherwise noted, the coupon rates presented are fixed rates.
Delayed delivery securities
The Fund may trade securities on other than normal settlement terms, including securities purchased or sold on a “when-issued” or "forward commitment" basis. This may increase risk to the Fund since the other party to the transaction may fail to deliver, which could cause the Fund to subsequently invest at less advantageous prices. The Fund designates cash or liquid securities in an amount equal to the delayed delivery commitment.
To be announced securities
The Fund may trade securities on a To Be Announced (TBA) basis. As with other delayed-delivery transactions, a seller agrees to issue a TBA security at a future date. However, the seller does not specify the particular securities to be delivered. Instead, the Fund agrees to accept any security that meets specified terms.
In some cases, Master Securities Forward Transaction Agreements (MSFTAs) may be used to govern transactions of certain forward-settling agency mortgage-backed securities, such as delayed-delivery and TBAs, between the Fund and counterparty. The MSFTA maintains provisions for, among other things, initiation and confirmation, payment and transfer, events of default, termination, and maintenance of collateral relating to such transactions.
Mortgage dollar roll transactions
The Fund may enter into mortgage “dollar rolls” in which the Fund sells securities for delivery in the current month and simultaneously contracts with the same counterparty to repurchase similar but not identical securities (same type, coupon and maturity) on a specified future date. During the roll period, the Fund loses the right to receive principal and interest paid on the securities sold. However, the Fund will benefit because it receives negotiated amounts in the form of reductions of the purchase price for the future purchase plus the interest earned on the cash proceeds of the securities sold until the settlement date of the forward purchase. The Fund records the incremental difference between the forward purchase and sale of each forward roll as a realized gain or loss. Unless any realized gains exceed the income, capital appreciation, and gain or loss due to mortgage prepayments that would have been realized on the securities sold as part of the mortgage dollar roll, the use of this technique will diminish the investment performance of the Fund compared to what the performance would have been without the use of mortgage dollar rolls. All cash proceeds will be invested in instruments that are permissible investments for the Fund. The Fund identifies cash or liquid securities in an amount equal to the forward purchase price.
For financial reporting and tax purposes, the Fund treats “to be announced” mortgage dollar rolls as two separate transactions, one involving the purchase of a security and a separate transaction involving a sale. These transactions may increase the Fund’s portfolio turnover rate. The Fund does not currently enter into mortgage dollar rolls that are accounted for as financing transactions.
Mortgage dollar rolls involve the risk that the market value of the securities the Fund is obligated to repurchase may decline below the repurchase price, or that the counterparty may default on its obligations.
Columbia Balanced Fund | Annual Report 2017
| 45 |
Notes to Financial Statements (continued)
August 31, 2017
Treasury inflation protected securities
The Fund may invest in treasury inflation protected securities (TIPS). The principal amount of TIPS is adjusted periodically and is increased for inflation or decreased for deflation based on a monthly published index. These adjustments are recorded as interest income in the Statement of Operations. Coupon payments are based on the adjusted principal at the time the interest is paid.
Security transactions
Security transactions are accounted for on the trade date. Cost is determined and gains (losses) are based upon the specific identification method for both financial statement and federal income tax purposes.
The trade date for senior loans purchased in the primary market is the date on which the loan is allocated. The trade date for senior loans purchased in the secondary market is the date on which the transaction is entered into.
Income recognition
Corporate actions and dividend income are generally recorded net of any non-reclaimable tax withholdings, on the ex-dividend date or upon receipt of ex-dividend notification in the case of certain foreign securities.
Interest income is recorded on an accrual basis. Market premiums and discounts, including original issue discounts, are amortized and accreted, respectively, over the expected life of the security on all debt securities, unless otherwise noted. The Fund classifies gains and losses realized on prepayments received on mortgage-backed securities as adjustments to interest income.
The Fund may place a debt security on non-accrual status and reduce related interest income when it becomes probable that the interest will not be collected and the amount of uncollectible interest can be reasonably estimated. A defaulted debt security is removed from non-accrual status when the issuer resumes interest payments or when collectibility of interest is reasonably assured.
The Fund may receive distributions from holdings in equity securities, business development companies (BDCs), exchange-traded funds (ETFs), limited partnerships (LPs), other regulated investment companies (RICs), and real estate investment trusts (REITs), which report information on the tax character of their distributions annually. These distributions are allocated to dividend income, capital gain and return of capital based on actual information reported. Return of capital is recorded as a reduction of the cost basis of securities held. If the Fund no longer owns the applicable securities, return of capital is recorded as a realized gain. With respect to REITs, to the extent actual information has not yet been reported, estimates for return of capital are made by the Fund’s management. Management’s estimates are subsequently adjusted when the actual character of the distributions is disclosed by the REITs, which could result in a proportionate change in return of capital to shareholders.
Awards from class action litigation are recorded as a reduction of cost basis if the Fund still owns the applicable securities on the payment date. If the Fund no longer owns the applicable securities, the proceeds are recorded as realized gains.
The value of additional securities received as an income payment through a payment in kind, if any, is recorded as interest income and increases the cost basis of such securities.
The Fund may receive other income from senior loans, including amendment fees, consent fees and commitment fees. These fees are recorded as income when received by the Fund. These amounts are included in Interest Income in the Statement of Operations.
Expenses
General expenses of the Trust are allocated to the Fund and other funds of the Trust based upon relative net assets or other expense allocation methodologies determined by the nature of the expense. Expenses directly attributable to the Fund are charged to the Fund. Expenses directly attributable to a specific class of shares are charged to that share class.
| 46 | Columbia Balanced Fund | Annual Report 2017 |
Notes to Financial Statements (continued)
August 31, 2017
Determination of class net asset value
All income, expenses (other than class-specific expenses, which are charged to that share class, as shown in the Statement of Operations) and realized and unrealized gains (losses) are allocated to each class of the Fund on a daily basis, based on the relative net assets of each class, for purposes of determining the net asset value of each class.
Federal income tax status
The Fund intends to qualify each year as a regulated investment company under Subchapter M of the Internal Revenue Code, as amended, and will distribute substantially all of its taxable income (including net short-term capital gains) and capital gains, if any, for its tax year, and as such will not be subject to federal income taxes. In addition, the Fund intends to distribute in each calendar year substantially all of its net investment income, capital gains and certain other amounts, if any, such that the Fund should not be subject to federal excise tax. Therefore, no federal income or excise tax provision is recorded.
Foreign taxes
The Fund may be subject to foreign taxes on income, gains on investments or currency repatriation, a portion of which may be recoverable. The Fund will accrue such taxes and recoveries, as applicable, based upon its current interpretation of tax rules and regulations that exist in the markets in which it invests.
Realized gains in certain countries may be subject to foreign taxes at the Fund level, based on statutory rates. The Fund accrues for such foreign taxes on realized and unrealized gains at the appropriate rate for each jurisdiction, as applicable. The amount, if any, is disclosed as a liability on the Statement of Assets and Liabilities.
Distributions to shareholders
Distributions from net investment income, if any, are declared and paid each calendar quarter. Net realized capital gains, if any, are distributed at least annually. Income distributions and capital gain distributions are determined in accordance with federal income tax regulations, which may differ from GAAP.
Guarantees and indemnifications
Under the Trust’s organizational documents and, in some cases, by contract, its officers and trustees are indemnified against certain liabilities arising out of the performance of their duties to the Trust or its funds. In addition, certain of the Fund’s contracts with its service providers contain general indemnification clauses. The Fund’s maximum exposure under these arrangements is unknown since the amount of any future claims that may be made against the Fund cannot be determined, and the Fund has no historical basis for predicting the likelihood of any such claims.
Recent accounting pronouncement
Accounting Standards Update 2017-08 Premium Amortization on Purchased Callable Debt Securities
In March 2017, the Financial Accounting Standards Board issued Accounting Standards Update (ASU) No. 2017-08 Premium Amortization on Purchased Callable Debt Securities. ASU No. 2017-08 updates the accounting standards to shorten the amortization period for certain purchased callable debt securities, held at a premium, to be amortized to the earliest call date. The update applies to securities with explicit, noncontingent call features that are callable at fixed prices and on preset dates. The standard is effective for annual periods beginning after December 15, 2018 and interim periods within those fiscal years. At this time, management is evaluating the implication of this guidance and the impact it will have on the financial statement amounts and footnote disclosures, if any.
Note 3. Fees and other transactions with affiliates
Management services fees
The Fund has entered into a Management Agreement with Columbia Management Investment Advisers, LLC (the Investment Manager), a wholly-owned subsidiary of Ameriprise Financial, Inc. (Ameriprise Financial). Under the Management Agreement, the Investment Manager provides the Fund with investment research and advice, as well as administrative and accounting
Columbia Balanced Fund | Annual Report 2017
| 47 |
Notes to Financial Statements (continued)
August 31, 2017
services. The management services fee is an annual fee that is equal to a percentage of the Fund’s daily net assets that declines from 0.72% to 0.52% as the Fund’s net assets increase. The effective management services fee rate for the year ended August 31, 2017 was 0.58% of the Fund’s average daily net assets.
Compensation of board members
Members of the Board of Trustees, who are not officers or employees of the Investment Manager or Ameriprise Financial, are compensated for their services to the Fund as disclosed in the Statement of Operations. These members of the Board of Trustees may participate in a Deferred Compensation Plan (the Plan) which may be terminated at any time. Obligations of the Plan will be paid solely out of the Fund’s assets, and all amounts payable under the Plan constitute a general unsecured obligation of the Fund.
Compensation of Chief Compliance Officer
The Board of Trustees has appointed a Chief Compliance Officer to the Fund in accordance with federal securities regulations. A portion of the Chief Compliance Officer’s total compensation is allocated to the Fund, along with other affiliated funds governed by the Board of Trustees, based on relative net assets. The total amount allocated to all affiliated funds governed by the Board of Trustees will not exceed $40,000 annually.
Transfer agency fees
Under a Transfer and Dividend Disbursing Agent Agreement, Columbia Management Investment Services Corp. (the Transfer Agent), an affiliate of the Investment Manager and a wholly-owned subsidiary of Ameriprise Financial, is responsible for providing transfer agency services to the Fund. The Transfer Agent has contracted with Boston Financial Data Services (BFDS) to serve as sub-transfer agent. The Transfer Agent pays the fees of BFDS for services as sub-transfer agent and BFDS is not entitled to reimbursement for such fees from the Fund (with the exception of out-of-pocket fees).
The Fund pays the Transfer Agent a monthly transfer agency fee based on the number or the average value of accounts, depending on the type of account. In addition, prior to October 1, 2016, the Transfer Agent also received sub-transfer agency fees based on a percentage of the average aggregate value of the Fund’s shares maintained in omnibus accounts (other than omnibus accounts for which American Enterprise Investment Services Inc. is the broker of record or accounts where the beneficial shareholder is a customer of Ameriprise Financial Services, Inc., for which the Transfer Agent receives a per account fee). Effective October 1, 2016, the Fund pays the Transfer Agent a fee for shareholder services based on the number of accounts or on a percentage of the average aggregate value of the Fund’s shares maintained in omnibus accounts up to the lesser of the amount charged by the financial intermediary or a cap established by the Board of Trustees from time to time.
The Transfer Agent also receives compensation from the Fund for various shareholder services and reimbursements for certain out-of-pocket fees. Effective August 1, 2017, total transfer agency fees for Class K, Class R5 and Class Y shares are subject to an annual limitation of not more than 0.07%, 0.07% and 0.02%, respectively, of the average daily net assets attributable to each share class. From January 1, 2017 to July 31, 2017, these limitations were 0.075% for Class K and Class R5 shares and 0.025% for Class Y shares; and prior to January 1, 2017, the limitation was 0.05% for Class K and Class R5 shares and Class Y shares did not pay transfer agency fees.
| 48 | Columbia Balanced Fund | Annual Report 2017 |
Notes to Financial Statements (continued)
August 31, 2017
For the year ended August 31, 2017, the Fund’s effective transfer agency fee rates as a percentage of average daily net assets of each class were as follows:
| | Effective rate (%) |
| Class A | 0.12 |
| Class B | 0.11 (a),(b) |
| Class C | 0.12 |
| Class K | 0.05 |
| Class R | 0.12 |
| Class R4 | 0.12 |
| Class R5 | 0.06 |
| Class T | 0.14 (c) |
| Class Y | 0.01 |
| Class Z | 0.12 |
| (a) | Effective July 17, 2017, Class B shares were automatically converted to Class A shares. |
| (b) | Unannualized. |
| (c) | Annualized. |
The Fund and certain other associated investment companies have severally, but not jointly, guaranteed the performance and observance of all the terms and conditions of a lease entered into by Seligman Data Corp. (SDC), the former transfer agent, including the payment of rent by SDC (the Guaranty). SDC was the legacy Seligman funds’ former transfer agent.
The lease and the Guaranty expire in January 2019. At August 31, 2017, the Fund’s total potential future obligation over the life of the Guaranty is $9,931. The liability remaining at August 31, 2017 for non-recurring charges associated with the lease amounted to $6,222 and is recorded as a part of the payable for other expenses in the Statement of Assets and Liabilities. SDC is owned by six associated investment companies, including the Fund. The Fund’s ownership interest in SDC at August 31, 2017 is recorded as a part of other assets in the Statement of Assets and Liabilities at a cost of $3,553, which approximates the fair value of the ownership interest.
An annual minimum account balance fee of $20 may apply to certain accounts with a value below the applicable share class’s initial minimum investment requirements to reduce the impact of small accounts on transfer agency fees. These minimum account balance fees are remitted to the Fund and recorded as part of expense reductions in the Statement of Operations. For the year ended August 31, 2017, these minimum account balance fees reduced total expenses of the Fund by $2,528.
Plan administration fees
Under a Plan Administration Services Agreement with the Transfer Agent, the Fund pays an annual fee at a rate of 0.25% of the Fund’s average daily net assets attributable to Class K shares for the provision of various administrative, recordkeeping, communication and educational services.
Distribution and service fees
The Fund has entered into an agreement with Columbia Management Investment Distributors, Inc. (the Distributor), an affiliate of the Investment Manager and a wholly-owned subsidiary of Ameriprise Financial, for distribution and shareholder services. The Board of Trustees has approved, and the Fund has adopted, distribution and shareholder service plans (the Plans) applicable to certain share classes, which set the distribution and service fees for the Fund. These fees are calculated daily and are intended to compensate the Distributor and/or eligible selling and/or servicing agents for selling shares of the Fund and providing services to investors.
Under the Plans, the Fund pays a monthly service fee to the Distributor at the maximum annual rate of 0.25% of the average daily net assets attributable to Class A, Class B, Class C and Class T shares of the Fund. Also under the Plans, the Fund pays a monthly distribution fee to the Distributor at the maximum annual rates of 0.10%, 0.75%, 0.75%, 0.50% and 0.25% of the average daily net assets attributable to Class A, Class B, Class C, Class R and Class T shares of the Fund, respectively. As a result of all Class B shares of the Fund being redeemed or converted to Class A shares, August 4, 2017 was the last day the Fund paid a service fee or distribution fee for Class B shares.
Columbia Balanced Fund | Annual Report 2017
| 49 |
Notes to Financial Statements (continued)
August 31, 2017
Although the Fund may pay distribution and service fees up to a maximum annual rate of 0.35% of the Fund’s average daily net assets attributable to Class A shares (comprised of up to 0.10% for distribution services and up to 0.25% for shareholder liaison services), the Fund currently limits such fees to an aggregate fee of not more than 0.25% of the Fund’s average daily net assets attributable to Class A shares.
Although the Fund may pay a distribution fee up to 0.25% of the Fund’s average daily net assets attributable to Class T shares and a service fee of up to 0.25% of the Fund’s average daily net assets attributable to Class T shares, the aggregate fee shall not exceed 0.25% of the Fund’s average daily net assets attributable to Class T shares.
Sales charges (unaudited)
Sales charges, including front-end charges and CDSCs, received by the Distributor for distributing Fund shares for the year ended August 31, 2017, if any, are listed below:
| | Amount ($) |
| Class A | 8,370,949 |
| Class B | 3,327 |
| Class C | 290,652 |
Expenses waived/reimbursed by the Investment Manager and its affiliates
The Investment Manager and certain of its affiliates have contractually agreed to waive fees and/or reimburse expenses (excluding certain fees and expenses described below) for the period(s) disclosed below, unless sooner terminated at the sole discretion of the Board of Trustees, so that the Fund’s net operating expenses, after giving effect to fees waived/expenses reimbursed and any balance credits and/or overdraft charges from the Fund’s custodian, do not exceed the following annual rate(s) as a percentage of the class’ average daily net assets:
| | January 1, 2017
through
December 31, 2017 | Prior to
January 1, 2017 |
| Class A | 1.18% | 1.20% |
| Class C | 1.93 | 1.95 |
| Class K | 1.165 | 1.14 |
| Class R | 1.43 | 1.45 |
| Class R4 | 0.93 | 0.95 |
| Class R5 | 0.915 | 0.89 |
| Class T | 1.18* | — |
| Class Y | 0.865 | 0.84 |
| Class Z | 0.93 | 0.95 |
*Expense cap rate is contractual from April 3, 2017 (the commencement of operations of Class T shares) through December 31, 2017.
Under the agreement governing these fee waivers and/or expense reimbursement arrangements, the following fees and expenses are excluded from the waiver/reimbursement commitment, and therefore will be paid by the Fund, if applicable: taxes (including foreign transaction taxes), expenses associated with investments in affiliated and non-affiliated pooled investment vehicles (including mutual funds and exchange-traded funds), transaction costs and brokerage commissions, costs related to any securities lending program, dividend expenses associated with securities sold short, inverse floater program fees and expenses, transaction charges and interest on borrowed money, interest, infrequent and/or unusual expenses and any other expenses the exclusion of which is specifically approved by the Board of Trustees. This agreement may be modified or amended only with approval from the Investment Manager, certain of its affiliates and the Fund. Any fees waived and/or expenses reimbursed under the expense reimbursement arrangements described above are not recoverable by the Investment Manager or its affiliates in future periods.
Note 4. Federal tax information
The timing and character of income and capital gain distributions are determined in accordance with income tax regulations, which may differ from GAAP because of temporary or permanent book to tax differences.
| 50 | Columbia Balanced Fund | Annual Report 2017 |
Notes to Financial Statements (continued)
August 31, 2017
At August 31, 2017, these differences are primarily due to differing treatment for deferral/reversal of wash sale losses, re-characterization of distributions for investments, derivative investments, tax straddles, trustees’ deferred compensation, principal and/or interest from fixed income securities, foreign currency transactions and distribution reclassifications. To the extent these differences are permanent, reclassifications are made among the components of the Fund’s net assets in the Statement of Assets and Liabilities. Temporary differences do not require reclassifications.
In the Statement of Assets and Liabilities the following reclassifications were made:
Undistributed net
investment
income ($) | Accumulated
net realized
gain ($) | Paid in
capital ($) |
| (667,027) | 667,027 | — |
Net investment income (loss) and net realized gains (losses), as disclosed in the Statement of Operations, and net assets were not affected by this reclassification.
The tax character of distributions paid during the years indicated was as follows:
| August 31, 2017 | August 31, 2016 |
Ordinary
income ($) | Long-term
capital gains ($) | Total ($) | Ordinary
income ($) | Long-term
capital gains ($) | Total ($) |
| 59,845,410 | 19,167,135 | 79,012,545 | 61,529,208 | 68,440,769 | 129,969,977 |
Short-term capital gain distributions, if any, are considered ordinary income distributions for tax purposes.
At August 31, 2017, the components of distributable earnings on a tax basis were as follows:
Undistributed
ordinary income ($) | Undistributed
long-term
capital gains ($) | Capital loss
carryforwards ($) | Net unrealized
appreciation ($) |
| 17,255,475 | 69,258,699 | — | 1,041,654,074 |
At August 31, 2017, the cost of all investments for federal income tax purposes along with the aggregate gross unrealized appreciation and depreciation based on that cost was:
Federal
tax cost ($) | Gross unrealized
appreciation ($) | Gross unrealized
(depreciation) ($) | Net unrealized
appreciation ($) |
| 6,119,223,194 | 1,088,319,621 | (46,665,547) | 1,041,654,074 |
Tax cost of investments and unrealized appreciation/(depreciation) may also include timing differences that do not constitute adjustments to tax basis.
Management of the Fund has concluded that there are no significant uncertain tax positions in the Fund that would require recognition in the financial statements. However, management’s conclusion may be subject to review and adjustment at a later date based on factors including, but not limited to, new tax laws, regulations, and administrative interpretations (including relevant court decisions). Generally, the Fund’s federal tax returns for the prior three fiscal years remain subject to examination by the Internal Revenue Service.
Note 5. Portfolio information
The cost of purchases and proceeds from sales of securities, excluding short-term investments and derivatives, if any, aggregated to $4,655,606,561 and $3,739,240,905, respectively, for the year ended August 31, 2017, of which $1,210,571,918 and $1,015,529,291, respectively, were U.S. government securities. The amount of purchase and sale activity impacts the portfolio turnover rate reported in the Financial Highlights.
Columbia Balanced Fund | Annual Report 2017
| 51 |
Notes to Financial Statements (continued)
August 31, 2017
Note 6. Affiliated money market fund
The Fund invests in Columbia Short-Term Cash Fund, an affiliated money market fund established for the exclusive use by the Fund and other affiliated funds (the Affiliated MMF). The income earned by the Fund from such investments is included as Dividends - affiliated issuers in the Statement of Operations. As an investing fund, the Fund indirectly bears its proportionate share of the expenses of the Affiliated MMF. Effective October 1, 2016, the Affiliated MMF prices its shares with a floating net asset value (NAV) and no longer seeks to maintain a stable NAV. In addition, the Board of Trustees of the Affiliated MMF may impose a fee on redemptions (sometimes referred to as a liquidity fee) or temporarily suspend redemptions (sometimes referred to as imposing a redemption gate) in the event its liquidity falls below regulatory limits.
Note 7. Line of credit
The Fund has access to a revolving credit facility with a syndicate of banks led by Citibank, N.A., HSBC Bank USA, N.A. and JPMorgan Chase Bank, N.A. whereby the Fund may borrow for the temporary funding of shareholder redemptions or for other temporary or emergency purposes. The credit facility, which is a collective agreement between the Fund and certain other funds managed by the Investment Manager, severally and not jointly, permits collective borrowings up to $1 billion. Interest is charged to each participating fund based on its borrowings at a rate equal to the higher of (i) the overnight federal funds rate plus 1.00% or (ii) the one-month LIBOR rate plus 1.00%. Each borrowing under the credit facility matures no later than 60 days after the date of borrowing. The Fund also pays a commitment fee equal to its pro rata share of the amount of the credit facility at a rate of 0.15% per annum. The commitment fee is included in other expenses in the Statement of Operations.
The Fund had no borrowings during the year ended August 31, 2017.
Note 8. Significant risks
Credit risk
Credit risk is the risk that the value of debt securities in the Fund’s portfolio may decline because the issuer may default and fail to pay interest or repay principal when due. Rating agencies assign credit ratings to debt securities to indicate their credit risk. Lower rated or unrated debt securities held by the Fund may present increased credit risk as compared to higher-rated debt securities.
Interest rate risk
Interest rate risk is the risk of losses attributable to changes in interest rates. In general, if prevailing interest rates rise, the values of debt securities tend to fall, and if interest rates fall, the values of debt securities tend to rise. Actions by governments and central banking authorities can result in increases in interest rates. Increasing interest rates may negatively affect the value of debt securities held by the Fund, resulting in a negative impact on the Fund’s performance and net asset value per share. In general, the longer the maturity or duration of a debt security, the greater its sensitivity to changes in interest rates.
Liquidity risk
Liquidity risk is the risk associated with a lack of marketability of investments which may make it difficult to sell the investment at a desirable time or price. Changing regulatory, market or other conditions or environments (for example, the interest rate or credit environments) may adversely affect the liquidity of the Fund’s investments. The Fund may have to accept a lower selling price for the holding, sell other investments, or forego another, more appealing investment opportunity. Generally, the less liquid the market at the time the Fund sells a portfolio investment, the greater the risk of loss or decline of value to the Fund. A less liquid market can lead to an increase in Fund redemptions, which may negatively impact Fund performance and net asset value per share, including, for example, if the Fund is forced to sell securities in a down market.
Shareholder concentration risk
At August 31, 2017, one unaffiliated shareholder of record owned 12.2% of the outstanding shares of the Fund in one or more accounts. The Fund has no knowledge about whether any portion of those shares was owned beneficially. Affiliated shareholders of record owned 37.0% of the outstanding shares of the Fund in one or more accounts. Subscription and
| 52 | Columbia Balanced Fund | Annual Report 2017 |
Notes to Financial Statements (continued)
August 31, 2017
redemption activity by concentrated accounts may have a significant effect on the operations of the Fund. In the case of a large redemption, the Fund may be forced to sell investments at inopportune times, including its liquid positions, which may result in Fund losses and the Fund holding a higher percentage of less liquid positions. Large redemptions could result in decreased economies of scale and increased operating expenses for non-redeeming Fund shareholders.
Note 9. Subsequent events
Management has evaluated the events and transactions that have occurred through the date the financial statements were issued. Other than as noted in Note 1 above, there were no items requiring adjustment of the financial statements or additional disclosure.
Note 10. Information regarding pending and settled legal proceedings
Ameriprise Financial and certain of its affiliates have historically been involved in a number of legal, arbitration and regulatory proceedings, including routine litigation, class actions, and governmental actions, concerning matters arising in connection with the conduct of their business activities. Ameriprise Financial believes that the Fund is not currently the subject of, and that neither Ameriprise Financial nor any of its affiliates are the subject of, any pending legal, arbitration or regulatory proceedings that are likely to have a material adverse effect on the Fund or the ability of Ameriprise Financial or its affiliates to perform under their contracts with the Fund. Ameriprise Financial is required to make quarterly (10-Q), annual (10-K) and, as necessary, 8-K filings with the Securities and Exchange Commission (SEC) on legal and regulatory matters that relate to Ameriprise Financial and its affiliates. Copies of these filings may be obtained by accessing the SEC website at www.sec.gov.
There can be no assurance that these matters, or the adverse publicity associated with them, will not result in increased Fund redemptions, reduced sale of Fund shares or other adverse consequences to the Fund. Further, although we believe proceedings are not likely to have a material adverse effect on the Fund or the ability of Ameriprise Financial or its affiliates to perform under their contracts with the Fund, these proceedings are subject to uncertainties and, as such, we are unable to estimate the possible loss or range of loss that may result. An adverse outcome in one or more of these proceedings could result in adverse judgments, settlements, fines, penalties or other relief that could have a material adverse effect on the consolidated financial condition or results of operations of Ameriprise Financial.
Columbia Balanced Fund | Annual Report 2017
| 53 |
Report of Independent Registered Public Accounting Firm
To the Trustees of Columbia Funds Series Trust I and the Shareholders of Columbia Balanced Fund
In our opinion, the accompanying statement of assets and liabilities, including the portfolio of investments, and the related statements of operations and of changes in net assets and the financial highlights present fairly, in all material respects, the financial position of Columbia Balanced Fund (the “Fund”, a series of Columbia Funds Series Trust I) as of August 31, 2017, the results of its operations for the year then ended, the changes in its net assets for each of the two years in the period then ended and the financial highlights for each of the five years in the period then ended, in conformity with accounting principles generally accepted in the United States of America. These financial statements and financial highlights (hereafter referred to as “financial statements”) are the responsibility of the Fund’s management. Our responsibility is to express an opinion on these financial statements based on our audits. We conducted our audits of these financial statements in accordance with the standards of the Public Company Accounting Oversight Board (United States). Those standards require that we plan and perform the audit to obtain reasonable assurance about whether the financial statements are free of material misstatement. An audit includes examining, on a test basis, evidence supporting the amounts and disclosures in the financial statements, assessing the accounting principles used and significant estimates made by management, and evaluating the overall financial statement presentation. We believe that our audits, which included confirmation of securities as of August 31, 2017 by correspondence with the custodian, brokers, agent banks and transfer agent provide a reasonable basis for our opinion.
/s/ PricewaterhouseCoopers LLP
Minneapolis, MN
October 20, 2017
| 54 | Columbia Balanced Fund | Annual Report 2017 |
Federal Income Tax Information
(Unaudited)
The Fund hereby designates the following tax attributes for the fiscal year ended August 31, 2017. Shareholders will be notified in early 2018 of the amounts for use in preparing 2017 income tax returns.
Qualified
dividend
income | Dividends
received
deduction | Capital
gain
dividend |
| 100.00% | 96.89% | $81,143,248 |
Qualified dividend income. For taxable, non-corporate shareholders, the percentage of ordinary income distributed during the fiscal year that represents qualified dividend income subject to reduced tax rates.
Dividends received deduction. The percentage of ordinary income distributed during the fiscal year that qualifies for the corporate dividends received deduction.
Capital gain dividend. The Fund designates as a capital gain dividend the amount reflected above, or if subsequently determined to be different, the net capital gain of such fiscal period.
Columbia Balanced Fund | Annual Report 2017
| 55 |
Shareholders elect the Board that oversees the Fund’s operations. The Board appoints officers who are responsible for day-to-day business decisions based on policies set by the Board. The following table provides basic biographical information about the Fund’s Trustees, including their principal occupations during the past five years, although specific titles for individuals may have varied over the period. The year set forth beneath Length of Service in the table below is the year in which the Trustee was first appointed or elected as Trustee to any Fund currently in the Columbia Funds Complex or a predecessor thereof. Under current Board policy, members serve terms of indefinite duration.
Independent trustees
| Name, address, year of birth | Position held with the Trust and length of service | Principal occupation(s) during the past five years and other relevant professional experience | Number of Funds in the Columbia Fund Complex overseen | Other directorships held by Trustee during the past five years |
Janet Langford Carrig
c/o Columbia Management
Investment Advisers, LLC
225 Franklin Street
Mail Drop BX32 05228
Boston, MA 02110
1957 | Trustee
1996 | Senior Vice President, General Counsel and Corporate Secretary, ConocoPhillips (independent energy company) since September 2007 | 57 | None |
Douglas A. Hacker
c/o Columbia Management
Investment Advisers, LLC
225 Franklin Street
Mail Drop BX32 05228
Boston, MA 02110
1955 | Trustee and Chairman of the Board
1996 | Independent business executive since May 2006; Executive Vice President — Strategy of United Airlines from December 2002 to May 2006; President of UAL Loyalty Services (airline marketing company) from September 2001 to December 2002; Executive Vice President and Chief Financial Officer of United Airlines from July 1999 to September 2001 | 57 | Spartan Nash Company, (food distributor); Nash Finch Company (food distributor) from 2005 to 2013; Aircastle Limited (aircraft leasing); SeaCube Container Leasing Ltd. (container leasing) from 2010 to 2013; and Travelport Worldwide Limited (travel information technology) |
Nancy T. Lukitsh
c/o Columbia Management
Investment Advisers, LLC
225 Franklin Street
Mail Drop BX32 05228
Boston, MA 02110
1956 | Trustee
2011 | Senior Vice President, Partner and Director of Marketing, Wellington Management Company, LLP (investment adviser) from 1997 to 2010; Chair, Wellington Management Portfolios (commingled non-U.S. investment pools) from 2007 to 2010; Director, Wellington Trust Company, NA and other Wellington affiliates from 1997 to 2010 | 57 | None |
David M. Moffett
c/o Columbia Management
Investment Advisers, LLC
225 Franklin Street
Mail Drop BX32 05228
Boston, MA 02110
1952 | Trustee
2011 | Retired. Consultant to Bridgewater and Associates | 57 | Director, CSX Corporation; Genworth Financial, Inc. (financial and insurance products and services); PayPal Holdings Inc. (payment and data processing services); Trustee, University of Oklahoma Foundation; former Director, eBay Inc. (online trading community), 2007-2015; and former Director, CIT Bank, CIT Group Inc. (commercial and consumer finance), 2010-2016 |
| 56 | Columbia Balanced Fund | Annual Report 2017 |
TRUSTEES AND OFFICERS (continued)
Independent trustees (continued)
| Name, address, year of birth | Position held with the Trust and length of service | Principal occupation(s) during the past five years and other relevant professional experience | Number of Funds in the Columbia Fund Complex overseen | Other directorships held by Trustee during the past five years |
Charles R. Nelson
c/o Columbia Management
Investment Advisers, LLC
225 Franklin Street
Mail Drop BX32 05228
Boston, MA 02110
1942 | Trustee
1981 | Retired. Professor Emeritus, University of Washington since 2011; Professor of Economics, University of Washington from 1976 to 2011; Ford and Louisa Van Voorhis Professor of Political Economy, University of Washington from 1993 to 2011; Adjunct Professor of Statistics, University of Washington from 1980 to 2011; Associate Editor, Journal of Money, Credit and Banking from September 1993 to 2008; consultant on econometric and statistical matters | 57 | None |
John J. Neuhauser
c/o Columbia Management
Investment Advisers, LLC
225 Franklin Street
Mail Drop BX32 05228
Boston, MA 02110
1943 | Trustee
1984 | President, Saint Michael’s College since August 2007; Director or Trustee of several non-profit organizations, including University of Vermont Medical Center; Academic Vice President and Dean of Faculties, Boston College from August 1999 to October 2005; University Professor, Boston College from November 2005 to August 2007 | 57 | Liberty All-Star Equity Fund and Liberty All- Star Growth Fund (closed-end funds) |
Patrick J. Simpson
c/o Columbia Management
Investment Advisers, LLC
225 Franklin Street
Mail Drop BX32 05228
Boston, MA 02110
1944 | Trustee
2000 | Of Counsel, Perkins Coie LLP (law firm) since 2015; Partner, Perkins Coie LLP from 1988 to 2014 | 57 | None |
Anne-Lee Verville
c/o Columbia Management
Investment Advisers, LLC
225 Franklin Street
Mail Drop BX32 05228
Boston, MA 02110
1945 | Trustee
1998 | Retired. General Manager, Global Education Industry from 1994 to 1997, President – Application Systems Division from 1991 to 1994, Chief Financial Officer – US Marketing & Services from 1988 to 1991, and Chief Information Officer from 1987 to 1988, IBM Corporation (computer and technology) | 57 | Enesco Group, Inc. (producer of giftware and home and garden decor products) from 2001 to 2006 |
Columbia Balanced Fund | Annual Report 2017
| 57 |
TRUSTEES AND OFFICERS (continued)
Consultants to the Independent Trustees*
| Name, address, year of birth | Position held with the Trust and length of service | Principal occupation(s) during the past five years and other relevant professional experience | Number of Funds in the Columbia Funds complex overseen | Other directorships held by Trustee during the past five years |
J. Kevin Connaughton
c/o Columbia
Management Investment
Advisers, LLC,
225 Franklin Street
Mail Drop BX32 05228,
Boston, MA 02110
1964 | Independent Trustee Consultant
2016 | Independent Trustee Consultant, Columbia Funds since March 2016; Managing Director and General Manager of Mutual Fund Products, Columbia Management Investment Advisers, LLC from May 2010 to February 2015; President, Columbia Funds from 2009 to 2015; and senior officer of Columbia Funds and affiliated funds from 2003 to 2015 | 57 | Board of Governors, Gateway Healthcare since January 2016; Trustee, New Century Portfolios since March 2015; and Director, The Autism Project since March 2015 |
Natalie A. Trunow
c/o Columbia
Management Investment
Advisers, LLC,
225 Franklin Street
Mail Drop BX32 05228,
Boston, MA 02110
1967 | Independent Trustee Consultant
2016 | Independent Trustee Consultant, Columbia Funds since September 2016; Chief Executive Officer, Millennial Partners (investment consulting services to institutions) since January 2016; Director of Investments, Casey Family Programs from April 2016 to September 2016; Senior Vice President and Chief Investment Officer, Calvert Investments from August 2008 to January 2016; Section Head and Portfolio Manager, General Motors Asset Management from June 1997 to August 2008 | 57 | Healthcare Services for Children with Special Needs |
| * | J. Kevin Connaughton was appointed consultant to the Independent Trustees effective March 1, 2016. Natalie A. Trunow was appointed consultant to the Independent Trustees effective September 1, 2016. Shareholders of the Funds are expected to be asked to elect each of Mr. Connaughton and Ms. Trunow as a Trustee at a future shareholder meeting. |
Interested trustee affiliated with Investment Manager*
| Name, address, year of birth | Position held with the Trust and length of service | Principal occupation(s) during the past five years and other relevant professional experience | Number of Funds in the Columbia Funds Complex overseen | Other directorships held by Trustee during the past five years |
William F. Truscott
c/o Columbia Management
Investment Advisers, LLC
225 Franklin Street
Boston, MA 02110
1960 | Trustee
2012 | Chairman of the Board and President, Columbia Management Investment Advisers, LLC since May 2010 and February 2012, respectively; Chief Executive Officer, Global Asset Management, Ameriprise Financial, Inc. since September 2012 (previously Chief Executive Officer, U.S. Asset Management & President, Annuities, May 2010-September 2012); Director and Chief Executive Officer, Columbia Management Investment Distributors, Inc. since May 2010 and February 2012, respectively; Chairman of the Board and Chief Executive Officer, RiverSource Distributors, Inc. since 2006; Director, Threadneedle Asset Management Holdings, SARL since 2014; President and Chief Executive Officer, Ameriprise Certificate Company, 2006-August 2012 | 179 | Chairman of the Board, Columbia Management Investment Advisers, LLC since May 2010; Director, Columbia Management Investment Distributors, Inc. since May 2010; former Director, Ameriprise Certificate Company, 2006 - January 2013 |
| * | Interested person (as defined under the 1940 Act) by reason of being an officer, director, security holder and/or employee of the Investment Manager or Ameriprise Financial. |
The Statement of Additional Information has additional information about the Fund’s Board members and is available,
without charge, upon request by calling 800.345.6611, contacting your financial intermediary or visiting
investor.columbiathreadneedleus.com.
| 58 | Columbia Balanced Fund | Annual Report 2017 |
TRUSTEES AND OFFICERS (continued)
The Board has appointed officers who are responsible for day-to-day business decisions based on policies it has established. The officers serve at the pleasure of the Board. The following table provides basic information about the Officers of the Fund, including principal occupations during the past five years, although their specific titles may have varied over the period. In addition to Mr. Truscott, who is Senior Vice President, the Fund’s other officers are:
Fund officers
Name,
address and
year of birth | Position and year
first appointed to
position for any Fund
in the Columbia
Funds complex or a
predecessor thereof | Principal occupation(s) during past five years |
Christopher O. Petersen
5228 Ameriprise
Financial Center
Minneapolis, MN 55474
Born 1970 | President and Principal Executive Officer (2015) | Vice President and Lead Chief Counsel, Ameriprise Financial, Inc. since January 2015 (previously, Vice President and Chief Counsel, January 2010 - December 2014; officer of Columbia Funds and affiliated funds since 2007. |
Michael G. Clarke
225 Franklin Street
Boston, MA 02110
Born 1969 | Treasurer (2011), Chief Financial Officer (2009) and Chief Accounting Officer (2015) | Vice President — Mutual Fund Administration, Columbia Management Investment Advisers, LLC, since May 2010; senior officer of Columbia Funds and affiliated funds since 2002. |
Paul B. Goucher
100 Park Avenue
New York, NY 10017
Born 1968 | Senior Vice President (2011) and Assistant Secretary (2008) | Senior Vice President and Assistant General Counsel, Ameriprise Financial, Inc. since January 2017 (previously Vice President and Lead Chief Counsel, November 2008 - January 2017 and January 2013 - January 2017, respectively; and Chief Counsel, January 2010 - January 2013); Vice President, Chief Legal Officer and Assistant Secretary, Columbia Management Investment Advisers, LLC since May 2010. |
Thomas P. McGuire
225 Franklin Street
Boston, MA 02110
Born 1972 | Senior Vice President and Chief Compliance Officer (2012) | Vice President — Asset Management Compliance, Ameriprise Financial, Inc., since May 2010; Chief Compliance Officer, Ameriprise Certificate Company since September 2010. |
Colin Moore
225 Franklin Street
Boston, MA 02110
Born 1958 | Senior Vice President (2010) | Executive Vice President and Global Chief Investment Officer, Ameriprise Financial, Inc., since July 2013; Executive Vice President and Global Chief Investment Officer, Columbia Management Investment Advisers, LLC since July 2013 (previously Director and Global Chief Investment Officer, 2010 - 2013). |
Ryan C. Larrenaga
225 Franklin Street
Boston, MA 02110
Born 1970 | Senior Vice President (2017), Chief Legal Officer (2017) and Secretary (2015) | Vice President and Group Counsel, Ameriprise Financial, Inc. since August 2011; officer of Columbia Funds and affiliated funds since 2005. |
Michael E. DeFao
225 Franklin Street
Boston, MA 02110
Born 1968 | Vice President (2011) and Assistant Secretary (2010) | Vice President and Chief Counsel, Ameriprise Financial, Inc. since May 2010. |
Amy Johnson
5228 Ameriprise
Financial Center
Minneapolis, MN 55474
Born 1965 | Vice President (2006) | Managing Director and Global Head of Operations, Columbia Management Investment Advisers, LLC since April 2016 (previously Managing Director and Chief Operating Officer, 2010 - 2016). |
Lyn Kephart-Strong
5228 Ameriprise
Financial Center
Minneapolis, MN 55474
Born 1960 | Vice President (2015) | President, Columbia Management Investment Services Corp. since October 2014; Vice President & Resolution Officer, Ameriprise Trust Company since August 2009. |
Columbia Balanced Fund | Annual Report 2017
| 59 |
Board Consideration and Approval of Management
Agreement
On June 14, 2017, the Board of Trustees (the Board) and the Trustees who are not interested persons (as defined in the Investment Company Act of 1940) (the Independent Trustees) of Columbia Funds Series Trust I (the Trust) unanimously approved the continuation of the Management Agreement (the Management Agreement) with Columbia Management Investment Advisers, LLC (the Investment Manager) with respect to Columbia Balanced Fund (the Fund), a series of the Trust. As detailed below, the Board’s Advisory Fees and Expenses Committee (the Committee) and the Board met on multiple occasions to review and discuss, both among themselves and with the management team of the Investment Manager, materials provided by the Investment Manager and others before determining to approve the continuation of the Management Agreement.
In connection with their deliberations regarding the continuation of the Management Agreement, the Committee and the Board evaluated materials requested from the Investment Manager regarding the Fund and the Management Agreement, and discussed these materials with representatives of the Investment Manager at Committee meetings held on March 27, 2017, April 26, 2017 and June 13, 2017 and at Board meetings held on March 28, 2017 and June 14, 2017. In addition, the Board considers matters bearing on the Management Agreement at most of its other meetings throughout the year and meets regularly with senior management of the Trust and the Investment Manager. Through the Board’s Investment Oversight Committees, Trustees also meet with selected portfolio managers of the funds the Trustees oversee and other investment personnel at various times throughout the year. The Committee and the Board also consulted with its independent fee consultant, Fund counsel and the Independent Trustees’ independent legal counsel, who advised on various matters with respect to the Committee’s and the Board’s considerations and otherwise assisted the Committee and the Board in their deliberations. On June 13, 2017, the Committee recommended that the Board approve the continuation of the Management Agreement. On June 14, 2017, the Board, including the Independent Trustees, voting separately, unanimously approved the continuation of the Management Agreement for the Fund.
The Committee and the Board considered all information that they, their legal counsel or the Investment Manager believed reasonably necessary to evaluate and to determine whether to recommend for approval or approve the continuation of the Management Agreement. The information and factors considered by the Committee and the Board in recommending for approval or approving the continuation of the Management Agreement for the Fund included the following:
| • | Information on the investment performance of the Fund relative to the performance of a group of mutual funds determined to be comparable to the Fund by an independent third-party data provider, as well as performance relative to benchmarks; |
| • | Information on the Fund’s management fees and total expenses, including information comparing the Fund’s expenses to those of a group of comparable mutual funds, as determined by the independent third-party data provider; |
| • | The Investment Manager’s agreement to contractually limit or cap total operating expenses for the Fund through December 31, 2018 so that total operating expenses (excluding certain fees and expenses, such as transaction costs and certain other investment related expenses, interest, taxes, acquired fund fees and expenses, and infrequent and/or unusual expenses) would not exceed a specified annual rate, as a percentage of the Fund’s net assets; |
| • | The terms and conditions of the Management Agreement; |
| • | The current and proposed terms and conditions of other agreements and arrangements with affiliates of the Investment Manager relating to the operations of the Fund, including agreements with respect to the provision of distribution, transfer agency and shareholder services to the Fund; |
| • | Descriptions of various functions performed by the Investment Manager under the Management Agreement, including portfolio management and portfolio trading practices; |
| • | Information regarding the management fees of similarly-managed portfolios of other clients of the Investment Manager, including institutional separate accounts; |
| • | Information regarding the reputation, regulatory history and resources of the Investment Manager, including information regarding senior management, portfolio managers and other personnel; |
| 60 | Columbia Balanced Fund | Annual Report 2017 |
Board Consideration and Approval of Management
Agreement (continued)
| • | Information regarding the capabilities of the Investment Manager with respect to compliance monitoring services, including an assessment of the Investment Manager’s compliance system by the Fund’s Chief Compliance Officer; and |
| • | The profitability to the Investment Manager and its affiliates from their relationships with the Fund. |
Nature, extent and quality of services provided under the Management Agreement
The Committee and the Board considered the nature, extent and quality of services provided to the Fund by the Investment Manager and its affiliates under the Management Agreement and under separate agreements for the provision of transfer agency and shareholder services, and the resources dedicated to the Fund and the other Columbia Funds by the Investment Manager and its affiliates. The Committee and the Board considered, among other things, the Investment Manager’s ability to attract, motivate and retain highly qualified research, advisory and supervisory investment professionals (including compensation programs for personnel involved in fund management, reputation and other attributes), the portfolio management services provided by those investment professionals, and the quality of the Investment Manager’s investment research capabilities and trade execution services. The Committee and the Board also considered the potential benefits to shareholders of investing in a mutual fund that is part of a fund complex offering exposure to a variety of asset classes and investment disciplines and providing a variety of fund and shareholder services.
The Committee and the Board also considered the professional experience and qualifications of the senior personnel of the Investment Manager, which included consideration of the Investment Manager’s experience with similarly-structured funds. The Committee and the Board noted the compliance programs of and the compliance-related resources provided to the Fund by the Investment Manager and its affiliates, and considered the Investment Manager’s ability to provide administrative services to the Fund and coordinate the activities of the Fund’s other service providers. After reviewing these and related factors, the Committee and the Board concluded, within the context of their overall conclusions, that the nature, extent and quality of the services provided to the Fund under the Management Agreement supported the continuation of the Management Agreement.
Investment performance
The Committee and the Board reviewed information about the performance of the Fund over various time periods, including performance information relative to benchmarks and information that compared the performance of the Fund to the performance of a group of comparable mutual funds as determined by the independent third-party data provider, and data provided by the independent fee consultant. The Committee and the Board also reviewed a description of the third party’s methodology for identifying the Fund’s peer groups for purposes of performance and expense comparisons. Although the Fund’s performance lagged that of a relevant peer group for certain (although not necessarily all) periods, the Committee and the Board concluded that other factors relevant to performance were sufficient, in light of other considerations, to warrant continuation of the Management Agreement. Those factors included one or more of the following: (i) that the Fund’s performance, although lagging in certain recent periods, was stronger over the longer term; (ii) that the underperformance was attributable, to a significant extent, to investment decisions that were reasonable and consistent with the Fund’s investment strategy and policies and that the Fund was performing within a reasonable range of expectations, given those investment decisions, market conditions and the Fund’s investment strategy; (iii) that the Fund’s performance was competitive when compared to other relevant performance benchmarks or peer groups; and (iv) that the Investment Manager had taken or was taking steps designed to help improve the Fund’s investment performance, including, but not limited to, replacing portfolio managers, enhancing the resources supporting the portfolio managers, or modifying investment strategies.
The Committee and the Board noted that, through December 31, 2016, the Fund’s performance was in the sixty-first, twelfth and ninth percentile (where the best performance would be in the first percentile) of its category selected by the independent third-party data provider for the purposes of performance comparisons for the one-, three- and five-year periods, respectively.
The Committee and the Board also considered the Investment Manager’s performance and reputation generally, the Investment Manager’s historical responsiveness to Board concerns about performance, and the Investment Manager’s willingness to take steps intended to improve performance. After reviewing these and related factors, the Committee and the Board concluded, within the context of their overall conclusions, that the performance of the Fund and the Investment Manager was sufficient, in light of other considerations, to warrant the continuation of the Management Agreement.
Columbia Balanced Fund | Annual Report 2017
| 61 |
Board Consideration and Approval of Management
Agreement (continued)
Investment management fee rates and other expenses
The Committee and the Board considered the management fees charged to the Fund under the Management Agreement as well as the total expenses incurred by the Fund. In assessing the reasonableness of the fees under the Management Agreement, the Committee and the Board considered, among other information, the Fund’s total expense ratio as a percentage of average daily net assets. The Committee and the Board considered data provided by the independent third-party data provider and the independent fee consultant. The Committee and the Board noted that, as of December 31, 2016, the Fund’s actual management fee and net total expense ratio are ranked in the third and second quintiles, respectively, (where the lowest fees and expenses would be in the first quintile) against the Fund’s expense universe as determined by the independent third-party data provider for purposes of expense comparison. The Committee and the Board also took into account the fee waiver and expense limitation arrangements agreed to by the Investment Manager, as noted above.
The Committee and the Board also received and considered information about the management fees charged by the Investment Manager to institutional separate accounts. In considering the fees charged to those accounts, the Committee and the Board took into account, among other things, the Investment Manager’s representations about the differences between managing mutual funds as compared to other types of accounts, including differences in the services provided, differences in the risk profile of such business for the Investment Manager and the additional resources required to manage mutual funds effectively. The Committee and the Board also received and considered information about the fees charged by the Investment Manager for sub-advisory services it provides to comparable unaffiliated funds. In evaluating the Fund’s management fees, the Committee and the Board also took into account the demands, complexity and quality of the investment management of the Fund.
After reviewing these and related factors, the Committee and the Board concluded, within the context of their overall conclusions, that the management fee rates and expenses of the Fund, in light of other considerations, warranted the continuation of the Management Agreement.
Costs of services provided and profitability
The Committee and the Board also took note of the costs the Investment Manager and its affiliates incur in connection with the services provided and the profitability to the Investment Manager and its affiliates from their relationships with the Fund.
The Committee and the Board also considered the compensation directly or indirectly received by the Investment Manager’s affiliates in connection with their relationships with the Fund. The Committee and the Board reviewed information provided by management as to the profitability to the Investment Manager and its affiliates of their relationships with the Fund, information about the allocation of expenses used to calculate profitability, and comparisons of profitability levels realized in 2016 to profitability levels realized in 2015. When reviewing profitability, the Committee and the Board also considered court cases in which adviser profitability was an issue in whole or in part, the performance of similarly managed funds, the performance of the Fund, and the expense ratio of the Fund. In addition, the Committee and the Board considered information provided by the Investment Manager regarding the Investment Manager’s financial condition and comparing its profitability to that of other asset management firms that are, or are subsidiaries of, publicly traded companies. In this regard, the Committee and the Board also considered data provided by the independent fee consultant.
After reviewing these and related factors, the Committee and the Board concluded, within the context of their overall conclusions, that the costs of services provided and the profitability to the Investment Manager and its affiliates from their relationships with the Fund supported the continuation of the Management Agreement.
Economies of scale
The Committee and the Board considered the potential existence of economies of scale in the provision by the Investment Manager of services to the Fund, to groups of related funds, and to the Investment Manager’s investment advisory clients as a whole, and whether those economies of scale were shared with the Fund through breakpoints in investment management fees or other means, such as expense limitation arrangements and additional investments by the Investment Manager in investment, trading, compliance and other resources. The Committee and the Board noted that the management fee schedules for the Fund contained breakpoints that would reduce the fee rate on assets above specified threshold levels.
| 62 | Columbia Balanced Fund | Annual Report 2017 |
Board Consideration and Approval of Management
Agreement (continued)
In considering these matters, the Committee and the Board also considered the costs of the services provided and the profitability to the Investment Manager and its affiliates from their relationships with the Fund, as discussed above. After reviewing these and related factors, the Committee and the Board concluded, within the context of their overall conclusions, that the extent to which any economies of scale were expected to be shared with the Fund supported the continuation of the Management Agreement.
Other benefits to the Investment Manager
The Committee and the Board received and considered information regarding “fall-out” or ancillary benefits received by the Investment Manager and its affiliates as a result of their relationships with the Fund, such as the engagement of the Investment Manager’s affiliates to provide distribution, transfer agency and shareholder services to the Fund. In this regard, among other matters, the Committee and the Board considered that the Fund’s distributor retains a portion of the distribution fees from the Fund and receives a portion of the sales charges on sales or redemptions of certain classes of shares of the Fund. The Committee and the Board also considered the benefits of research made available to the Investment Manager by reason of brokerage commissions generated by the Fund’s securities transactions, and reviewed information about the Investment Manager’s practices with respect to allocating portfolio transactions for brokerage and research services. The Committee and the Board recognized that the Investment Manager’s profitability would be somewhat lower without these benefits.
Conclusion
The Committee and the Board reviewed all of the above considerations in reaching their decisions to recommend or approve the continuation of the Management Agreement. In their deliberations, the Trustees did not identify any particular information that was all-important or controlling, and individual Trustees may have attributed different weights to the various factors. Based on their evaluation of all factors that they deemed to be material, including those factors described above, and assisted by the advice of independent legal counsel, the Board, including the Independent Trustees, voting separately, unanimously approved the continuation of the Management Agreement.
Columbia Balanced Fund | Annual Report 2017
| 63 |
The Fund mails one shareholder report to each shareholder address. If you would like more than one report, please call shareholder services at 800.345.6611 and additional reports will be sent to you.
Proxy voting policies and procedures
The policy of the Board of Trustees is to vote the proxies of the companies in which the Fund holds investments consistent with the procedures as stated in the Statement of Additional Information (SAI). You may obtain a copy of the SAI without charge by calling 800.345.6611; contacting your financial intermediary; visiting investor.columbiathreadneedleus.com; or searching the website of the Securities and Exchange Commission (SEC) at sec.gov. Information regarding how the Fund voted proxies relating to portfolio securities is filed with the SEC by August 31st for the most recent 12-month period ending June 30th of that year, and is available without charge by visiting investor.columbiathreadneedleus.com, or searching the website of the SEC at sec.gov.
Quarterly schedule of investments
The Fund files a complete schedule of portfolio holdings with the SEC for the first and third quarters of each fiscal year on Form N-Q. The Fund’s Form N-Q is available on the SEC’s website at sec.gov and may be reviewed and copied at the SEC’s Public Reference Room in Washington, D.C. Information on the operation of the Public Reference Room may be obtained by calling 800.SEC.0330. The Fund’s complete schedule of portfolio holdings, as filed on Form N-Q, can also be obtained without charge, upon request, by calling 800.345.6611.
Additional Fund information
For more information about the Fund, please visit investor.columbiathreadneedleus.com or call 800.345.6611. Customer Service Representatives are available to answer your questions Monday through Friday from 8 a.m. to 7 p.m. Eastern time.
Fund investment manager
Columbia Management Investment Advisers, LLC
225 Franklin Street
Boston, MA 02110
Fund distributor
Columbia Management Investment Distributors, Inc.
225 Franklin Street
Boston, MA 02110
Fund transfer agent
Columbia Management Investment Services Corp.
P.O. Box 8081
Boston, MA 02266-8081
| 64 | Columbia Balanced Fund | Annual Report 2017 |
[THIS PAGE INTENTIONALLY LEFT BLANK]
Columbia Balanced Fund
P.O. Box 8081
Boston, MA 02266-8081
Please read and consider the investment objectives, risks, charges and expenses for any fund carefully before investing. For a prospectus and summary prospectus, which contains this and other important information about the Fund, go to
investor.columbiathreadneedleus.com. The Fund is distributed by Columbia Management Investment Distributors, Inc., member FINRA, and managed by Columbia Management Investment Advisers, LLC.
Columbia Threadneedle Investments (Columbia Threadneedle) is the global brand name of the Columbia and Threadneedle group of companies. All rights reserved. Columbia Management Investment Distributors, Inc., 225 Franklin Street, Boston, MA 02110-2804
© 2017 Columbia Management Investment Advisers, LLC.
investor.columbiathreadneedleus.com

Annual Report
August 31, 2017
Multi-Manager Total Return Bond Strategies Fund
Not FDIC Insured • No bank guarantee • May lose value
Dear Shareholders,
The current outlook for financial markets is clouded by two primary concerns: the high valuation of equities and the direction of interest rates. Following the U.S. presidential election, U.S. equities rallied based on the assumption that the new administration’s policies would stimulate growth quickly. Unfortunately it’s unclear whether those measures will get passed, much less passed quickly. In fixed income, uncertainty stems from the possibility that interest rates won’t rise as rapidly as expected if the administration’s proposed growth policies are not implemented.
Given this uncertainty, investors value a consistent approach more than ever. Investors want strong, repeatable risk-adjusted returns. Consistency — not surprises. As a leading global asset manager, we believe our consistent, collaborative investment approach enables us to deliver the dependable experience your portfolio demands. So, how do we strive to deliver a consistent investment experience?
Better insights
Your portfolio benefits from the investment insights uncovered by our talented investment teams around the world.
Better decisions
Our collaborative, interactive environment enables our investment teams to construct portfolios that take advantage of the best investment ideas.
Better outcomes
We aim to deliver a consistent experience, which means fewer surprises, dependable insights, and products designed to do the thing you want.
Whether you’re trying to save money to help your children go to college or for your own retirement, it’s the consistency of the return that is most essential. People who chase higher returns are usually also the first to sell when that investment goes through a bad patch. We try to combat this behavioral tendency by offering strategies that aim for a more consistent return. Our goal is for investors to panic less during periods of volatility, which can have a significant effect on their long-term results.
Nothing is more important to us than making sure those who have entrusted us to protect and grow their assets can do what matters most to them: build a nest egg, leave a legacy, and live confidently — now and throughout retirement. It’s why our talented professionals around the world work together to uncover uncommon opportunities and why our process encourages challenge and debate around our most compelling ideas to ensure better informed investment decisions, which hopefully lead to better outcomes for you.
Your success is our priority. Talk to your financial advisor about how working with Columbia Threadneedle Investments may help you position your portfolio for consistent, sustainable outcomes, no matter the market conditions.
Sincerely,
Christopher O. Petersen
President, Columbia Funds
Investors should consider the investment objectives, risks, charges and expenses of a mutual fund carefully before investing. For a free prospectus and summary prospectus, which contains this and other important information about a fund, visit investor.columbiathreadneedleus.com. The prospectus should be read carefully before investing.
Columbia Funds are distributed by Columbia Management Investment Distributors, Inc., member FINRA, and managed by Columbia Management Investment Advisers, LLC.
© 2017 Columbia Management Investment Advisers, LLC. All rights reserved.
Multi-Manager Total Return Bond Strategies Fund | Annual Report 2017
| 2 |
| 5 |
| 10 |
| 11 |
| 72 |
| 74 |
| 75 |
| 78 |
| 80 |
| 97 |
| 98 |
| 99 |
| 103 |
| 108 |
Multi-Manager Total Return Bond Strategies Fund | Annual Report 2017
Investment objective
Multi-Manager Total Return Bond Strategies Fund (the Fund) seeks total return, consisting of capital appreciation and current income.
Portfolio management
Columbia Management Investment Advisers, LLC
Brian Lavin, CFA
Carl Pappo, CFA
Jason Callan
Loomis, Sayles & Company, L.P.
Christopher Harms
Clifton Rowe, CFA
Kurt Wagner, CFA, CIC
PGIM, Inc., the asset management arm of Prudential Financial
Michael Collins, CFA
Robert Tipp, CFA
Richard Piccirillo
Gregory Peters
TCW Investment Management Company LLC
Stephen Kane, CFA
Laird Landmann
Tad Rivelle
Bryan Whalen, CFA
| Average annual total returns (%) (for the period ended August 31, 2017) |
| | | Inception | 1 Year | 5 Years | Life |
| Class A | 04/20/12 | 1.14 | 2.39 | 2.82 |
| Class Z* | 01/03/17 | 1.32 | 2.43 | 2.86 |
| Bloomberg Barclays U.S. Aggregate Bond Index | | 0.49 | 2.19 | 2.53 |
All results shown assume reinvestment of distributions during the period. Returns do not reflect the deduction of taxes that a shareholder may pay on Fund distributions or on the redemption of Fund shares. Performance results reflect the effect of any fee waivers or reimbursements of Fund expenses by Columbia Management Investment Advisers, LLC and/or any of its affiliates. Absent these fee waivers or expense reimbursement arrangements, performance results would have been lower.
The performance information shown represents past performance and is not a guarantee of future results. The investment return and principal value of your investment will fluctuate so that your shares, when redeemed, may be worth more or less than their original cost. Current performance may be lower or higher than the performance information shown. You may obtain performance information current to the most recent month-end by contacting your financial intermediary, visiting investor.columbiathreadneedleus.com or calling 800.345.6611.
| * | The returns shown for periods prior to the share class inception date (including returns for the Life of the Fund, if shown, which are since Fund inception) include the returns of the Fund’s oldest share class. These returns are adjusted to reflect any higher class-related operating expenses of the newer share classes, as applicable. Please visit investor.columbiathreadneedleus.com/investment-products/mutual-funds/appended-performance for more information. |
The Bloomberg Barclays U.S. Aggregate Bond Index is a broad-based benchmark that measures the investment-grade, U.S. dollar-denominated, fixed-rate taxable bond market, including Treasuries, government-related and corporate securities, mortgage-backed securities (agency fixed-rate and hybrid adjustable-rate mortgage passthroughs), asset-backed securities, and commercial mortgage-backed securities.
Indices are not available for investment, are not professionally managed and do not reflect sales charges, fees, brokerage commissions, taxes or other expenses of investing. Securities in the Fund may not match those in an index.
| 2 | Multi-Manager Total Return Bond Strategies Fund | Annual Report 2017 |
Fund at a Glance (continued)
Performance of a hypothetical $10,000 investment (April 20, 2012 — August 31, 2017)
The chart above shows the change in value of a hypothetical $10,000 investment in Class A shares of Multi-Manager Total Return Bond Strategies Fund during the stated time period, and does not reflect the deduction of taxes that a shareholder may pay on Fund distributions or on the redemption of Fund shares.
| Portfolio breakdown (%) (at August 31, 2017) |
| Asset-Backed Securities — Agency | 0.7 |
| Asset-Backed Securities — Non-Agency | 12.2 |
| Commercial Mortgage-Backed Securities - Agency | 2.1 |
| Commercial Mortgage-Backed Securities - Non-Agency | 5.0 |
| Common Stocks | 0.0 (a) |
| Corporate Bonds & Notes | 31.5 |
| Fixed-Income Funds | 0.9 |
| Foreign Government Obligations | 1.6 |
| Inflation-Indexed Bonds | 0.8 |
| Money Market Funds | 3.8 |
| Municipal Bonds | 0.7 |
| Preferred Debt | 0.1 |
| Residential Mortgage-Backed Securities - Agency | 17.9 |
| Residential Mortgage-Backed Securities - Non-Agency | 3.1 |
| Senior Loans | 0.2 |
| Treasury Bills | 0.3 |
| U.S. Government & Agency Obligations | 1.5 |
| U.S. Treasury Obligations | 17.6 |
| Total | 100.0 |
Percentages indicated are based upon total investments. The Fund’s portfolio composition is subject to change.
| Quality breakdown (%) (at August 31, 2017) |
| AAA rating | 58.0 |
| AA rating | 3.8 |
| A rating | 10.1 |
| BBB rating | 18.6 |
| BB rating | 3.9 |
| B rating | 2.1 |
| CCC rating | 0.8 |
| CC rating | 0.2 |
| C rating | 0.0 (a) |
| Not rated | 2.5 |
| Total | 100.0 |
Percentages indicated are based upon total fixed income investments (excluding Money Market Funds).
Bond ratings apply to the underlying holdings of the Fund and not the Fund itself and are divided into categories ranging from highest to lowest credit quality, determined by using the middle rating of Moody’s, S&P and Fitch, after dropping the highest and lowest available ratings. When ratings are available from only two rating agencies, the lower rating is used. When a rating is available from only one rating agency, that rating is used. When a bond is not rated by any rating agency, it is designated as “Not rated.” Credit quality ratings assigned by a rating agency are subjective opinions, not statements of fact, and are subject to change, including daily. The ratings assigned by credit rating agencies are but one of the considerations that the Investment Manager and/or Fund’s subadviser incorporates into its credit analysis process, along with such other issuer-specific factors as cash flows, capital structure and leverage ratios, ability to de-leverage (repay) through free cash flow, quality of management, market positioning and access to capital, as well as such security-specific factors as the terms of the security (e.g., interest rate and time to maturity) and the amount and type of any collateral.
Multi-Manager Total Return Bond Strategies Fund | Annual Report 2017
| 3 |
Fund at a Glance (continued)
| Market exposure through derivatives investments (% of notional exposure) (at August 31, 2017)(a) |
| | Long | Short | Net |
| Fixed Income Derivative Contracts | 95.1 | (194.7) | (99.6) |
| Foreign Currency Derivative Contracts | 0.0 | (0.4) | (0.4) |
| Total Notional Market Value of Derivative Contracts | 95.1 | (195.1) | (100.0) |
(a) The Fund has market exposure (long and/or short) to fixed income and foreign currency through its investments in derivatives. The notional exposure of a financial instrument is the nominal or face amount that is used to calculate payments made on that instrument and/or changes in value for the instrument. The notional exposure is a hypothetical underlying quantity upon which payment obligations are computed. Notional exposures provide a gauge for how the Fund may behave given changes in individual markets. For a description of the Fund’s investments in derivatives, see Investments in derivatives following the Portfolio of Investments, and Note 2 to the Notes to Financial Statements.
| 4 | Multi-Manager Total Return Bond Strategies Fund | Annual Report 2017 |
Manager Discussion of Fund Performance
The Fund is currently managed by three independent money management firms and by Columbia Management Investment Advisers, LLC (CMIA), and each invests a portion of the portfolio’s assets. As of August 31, 2017, TCW Investment Management Company LLC (TCW), Loomis, Sayles & Company, L.P. (Loomis Sayles), PGIM, Inc. (PGIM), the asset management arm of Prudential Financial and CMIA managed approximately 27%, 20%, 26% and 27% of the portfolio, respectively.
For the 12-month period that ended August 31, 2017, the Fund’s Class A shares returned 1.14%. The Fund outperformed its benchmark, the Bloomberg Barclays U.S. Aggregate Bond Index, which returned 0.49% over the same time period. The Fund’s performance can be attributed primarily to sector allocation, security selection and duration positioning decisions.
Fixed-income markets posted tepid returns amid a risk-on environment
The fixed-income markets experienced several significant events during the 12-month period ended August 31, 2017. These included the aftermath of the U.K. Brexit vote, a surprise result in the U.S. presidential election, ongoing bond buying programs by the European Central Bank and Bank of England, and three Federal Reserve (Fed) interest rate hikes. As the period ended, speculation increased on who will head the Fed after Janet Yellen’s term expires in early 2018.
U.S. economic growth rebounded at the end of the period against a backdrop of above-trend growth in the rest of the major developed markets. Inflation, however, was generally weaker than expected, undershooting central bank targets. Still, real final private sector demand in the U.S. was notably robust, growing at an annualized rate of between 2.6% and 3.3% in each of the last five quarters and averaging 2.8% in the first half of 2017. Consumer spending was particularly strong, but investment spending, too, picked up as headwinds from the energy price collapse and strengthening U.S. dollar a few years ago faded. Companies in the U.S. hired at a strong pace, well above the estimated 75,000 to 100,000 needed to keep the unemployment rate unchanged. Indeed, the unemployment rate gradually ticked lower, inching down to 4.3% in July 2017. Importantly, job gains were widespread across industries. Even the retail industry, which shed jobs every month from February through May 2017, saw stable employment in the last months of the period. In our view, lean levels of business inventories, solid core durable goods orders and ongoing job gains suggested real GDP growth was on track to maintain momentum in the months ahead.
Given this market and economic backdrop, the period was a risk-on environment. Economic growth was good enough and inflation was low enough to keep central bank policies easy enough for spreads, or yield differentials between non-government bond and government bond sectors, to tighten. Additionally, while mostly tame market conditions allowed for increased supply, strong demand among investors looking for yield absorbed the supply, outweighing weaker credit fundamentals and rising geopolitical uncertainty.
The U.S. fixed-income markets, as represented by the benchmark, posted a positive but tepid return. Lower quality bonds generally outperformed higher quality bonds. High-yield corporate bonds performed particularly strongly. Within the investment-grade credit sector, financials outpaced industrials and utilities. Metals and mining, energy and life insurance were among the strongest market segments, while tobacco, telecommunications and retailers and restaurants were among the weakest market segments. Emerging market debt also generated solid returns for the period, with local exposure favored on broad weakness in the U.S. dollar. Most structured debt products, including commercial mortgage-backed securities (CMBS), asset-backed securities and non-agency mortgage-backed securities, were weaker but still positive on a total return basis during the period. The exception was agency mortgage-backed securities, which posted a negative return during the reporting period, which we believe was attributable primarily to anticipation about the Fed’s unwinding of its balance sheet, expected to begin in earnest later in 2017.
As the market interpreted modest growth, low inflation and a central bank slow to tighten monetary policy, U.S. Treasury yields rose across the spectrum of maturities during the period, with short-term rates rising more than long-term rates, thus driving a flatter yield curve, or a narrower differential in yields between longer term and shorter term yields. Shorter term yields rose with the Fed’s interest rate hikes. Longer term yields rose less with the potential of lackluster long-term economic growth and waning confidence of tax reform and fiscal policy stimulus by the current U.S. administration.
Multi-Manager Total Return Bond Strategies Fund | Annual Report 2017
| 5 |
Manager Discussion of Fund Performance (continued)
Sector allocations, security selection and duration positioning drove Fund returns
TCW: Our portion of the Fund outperformed the benchmark during the period, due in part to our defensive duration position, which was rewarded as U.S. Treasury rates rose across the yield curve, or spectrum of maturities, during the period. Performance was also supported by effective issue selection among securitized products, particularly an exposure to non-agency mortgage-backed securities backed by subprime collateral, which are not a component of the benchmark but which outpaced the benchmark during the period. These securities benefited from solid demand, relatively attractive yield levels and ongoing improvements in fundamentals, including higher home prices and lower loan-to-value ratios. Tighter spreads among government guaranteed student loan asset-backed securities, further added to performance, as rating reviews concluded with results less severe than the market had anticipated. An allocation to CMBS also boosted results amid favorable demand. Issue selection within the corporate bond sector proved beneficial overall, with industrial credits the largest driver of positive performance. Financials were also additive, with strong results from banking and REITs issues. Finally, a small position in Japanese government-issued bills, with the yen exposure fully hedged using a U.S. dollar/yen cross-currency swap, added incrementally to performance.
The primary detractor from performance was our portion of the Fund’s relative underweight position in corporate and non-corporate credit, sectors that outperformed the benchmark during the period on solid demand from investors searching for yield. In particular, a relative underweight to better performing industrial market segments, such as metals and mining, hurt relative results. Issue selection among Build America municipal bonds also dampened results, though this was offset by positive performance from general obligation municipal bonds. Further, having an allocation to U.S. Treasuries hurt performance, as rates rose during the period.
Loomis Sayles: Our portion of the Fund outperformed the benchmark. Sector allocation benefited relative results most, as our portion of the Fund remained diversified across and within sectors with a focus on securities with strong credit enhancements. Specifically, underweights to U.S. Treasuries and agency pass-through mortgages in favor of overweights to risk assets, including corporate bonds, contributed positively. Within the investment-grade corporate bond sector, an emphasis on financials and industrials particularly boosted results. From a credit quality perspective, an emphasis on BBB-rated issues helped performance, as these lower quality investment-grade securities outperformed their investment-grade counterparts, with investor appetite for yield remaining strong throughout the period. Issue selection also added value, especially among agency CMBS and asset-backed securities. Further, while we targeted a duration neutral to that of the benchmark, we did have some managed yield curve exposures, and the combined effect of duration and yield curve positioning was modest but positive.
Partially offsetting these positive contributors were overweights to asset-backed securities and agency CMBS and an underweight to government-related bonds, which detracted from performance. Issue selection among investment-grade financial sector bonds and agency pass-through mortgages also hurt performance. Having exposure to cash during a period when the benchmark gained ground also dampened relative results.
PGIM: Our portion of the Fund outperformed the benchmark, with sector allocation and security selection contributing positively to relative results, more than offsetting duration and yield curve positioning, which modestly detracted. Our portion of the Fund generally maintained a barbell position between high quality structured products and lower quality investment-grade and high-yield allocations. More specifically, overweight allocations to high-yield corporate bonds, investment-grade corporate bonds, CMBS and emerging markets debt contributed positively. Issue selection among collateralized loan obligations, interest rate swap spread wideners, emerging markets debt and non-agency mortgage-backed securities were also key positive contributors. Security selection among investment-grade and high-yield corporate bonds overall also added value, although positioning in the retailers, restaurants, and automotive market segments detracted from performance.
Duration positioning also detracted from performance. Our portion of the Fund had a longer duration than that of the benchmark, which hurt as yields rose during the period. Yield curve positioning dampened relative results as well.
CMIA: Our portion of the Fund outperformed the benchmark due in large part to effective security selection among corporate bonds. We maintained an emphasis on financial institutions lower in the capital structure. Financial services issues overall performed well, led by preferred debt. Issue selection among energy-related credits also proved beneficial. Energy credits rebounded with the recovery in oil prices and actions to strengthen their balance sheets. Overweights to high-yield and
| 6 | Multi-Manager Total Return Bond Strategies Fund | Annual Report 2017 |
Manager Discussion of Fund Performance (continued)
investment-grade credit were also additive as was exposure within the investment-grade credit sector to BBB-rated securities, which generally outperformed higher rated credit. In addition, an overweight to CMBS and underweights to U.S. Treasuries and agency mortgage-backed securities contributed positively to our portion of the Fund’s performance.
Conversely, having an underweight to the metals and mining industry and an overweight to the wirelines industry within the allocation to credit detracted from performance. Further, our bias toward higher quality dampened results, as higher quality securities lagged the market during the period. The combination of duration and yield curve positioning modestly detracted from relative results during the period.
Shifting market conditions drove portfolio changes
The Fund’s portfolio turnover rate for the 12-month period was 345%. A significant portion of the turnover was the result of rolling-maturity mortgage securities, processing of prepayments and opportunistic changes our managers made at the margin in response to valuations or market developments.
TCW: Given the ongoing aging of the credit cycle, we continued to position our portion of the Fund with an eye toward risk reduction by moving into higher quality securities up in the capital structure. In terms of sector positioning, our portion of the Fund remained underweight to corporate credits with an emphasis on financials. Among financials, we shifted our portion of the Fund to a relative overweight to banks with the addition of short duration positions and trimmed allocations to insurance companies and REITs. Among industrials, we increased our portion of the Fund’s allocation to communications and consumer non-cyclicals and trimmed exposure to energy credits on strength. In terms of duration, we moved our portion of the Fund from a position approximately six-tenths of a year shorter than that of the benchmark at the start of the period to approximately three-tenths of a year shorter than that of the benchmark at the end of the period.
At the end of the period, our portion of the Fund maintained an underweight relative to the benchmark in corporate credit, with positioning focused on U.S. financials given limited re-leveraging risk and what we view as reasonable yield premiums. A small allocation to high yield was also maintained, though the strength in the market during the period allowed the Fund to rotate into higher quality holdings that will likely, we believe, have the credit resilience to make it through the end of the credit cycle. We believe structured products continued to offer opportunities for attractive risk-adjusted returns and protection, and therefore represented an overweight versus the benchmark at the end of the period. Non-agency mortgage-backed securities remained compelling to us due to the available yield, potential for price upside and solid fundamentals. Agency mortgage-backed securities represented a relative underweight in our portion of the Fund despite being higher quality and more liquid, as yield compensation remained small historically and prepayment risk weighed on the market in the low rate environment. CMBS and asset-backed securities holdings were focused on high quality collateral in the senior most parts of the capital structure, often with government guarantees, making them, in our view, solid defensive credits.
Loomis Sayles: As spreads, or yield differentials between corporate bonds and U.S. Treasuries, tightened, we reduced the corporate beta, or volatility factor, within our portion of the Fund. Also, we added exposure to corporate holdings during the winter months of the period, as we expected spread compression on the back of the U.S. election results. Indeed, corporate spreads compressed from 135 basis points in August of 2016 to 110 basis points in August of 2017. (A basis point is 1/100th of a percentage point.) While we increased corporate bond exposure for some time, we subsequently reduced that exposure and shortened duration over the last few months of the period. Elsewhere, we maintained our portion of the Fund’s relative underweight to mortgage-backed securities but increased the position modestly.
At the end of the period, our portion of the Fund was overweight U.S. credit, asset-backed securities and CMBS and was underweight mortgage-backed securities, agency securities and U.S. Treasuries relative to the benchmark. We were targeting neutral duration and yield curve positions at the end of the period.
PGIM: During the period, modest changes were made to active duration positioning. We also increased our portion of the Fund’s exposure to U.S. Treasuries and to structured products, including CMBS, non-agency mortgage-backed securities, and collateralized loan obligations. Selling into the strength of other sectors, we reduced our portion of the Fund’s exposure to bank loans, high-yield corporate bonds and investment-grade corporate bonds.
Multi-Manager Total Return Bond Strategies Fund | Annual Report 2017
| 7 |
Manager Discussion of Fund Performance (continued)
At the end of the period, our portion of the Fund was underweight U.S. Treasuries, mortgage-backed securities, agency securities and non-U.S. government related bonds and was overweight structured products, high-yield corporate bonds, investment-grade corporate bonds and emerging markets debt relative to the benchmark. Our portion of the Fund was rather neutrally weighted relative to the benchmark in municipal bonds. Our portion of the Fund also had exposure to bank loans, which are not represented in the benchmark. As of August 31, 2017, our portion of the Fund had a duration approximately one-eighth year longer than that of the benchmark.
CMIA: In addition to modest adjustments in duration and yield curve positioning as market conditions shifted, we reduced our portion of the Fund’s allocation to credit during the period prompted by a well telegraphed direction in Fed policy and what we saw as overall rich credit valuations. The general credit quality within our portion of the Fund improved as we deemed credit valuations too tight and likely to deteriorate with rising rates.
Within the credit allocation, we decreased our portion of the Fund’s exposure to energy-related bonds. We also reduced our portion of the Fund’s allocation to high-yield securities overall during the first quarter of 2017, reflecting what we saw as less attractive valuations and a reduced return outlook compared to the prior year. We reduced exposure to longer dated subordinated securities in the banking sector as valuations relative to senior bonds reached historically compressed levels. We sold holdings in the major U.S. automotive companies Ford and General Motors, reflecting our view that the automotive cycle was hitting peak levels that may be unsustainable over the next year or two. In addition, credit spreads of these companies had reached multi-year tight levels on the back of strong operational performance and, in the case of General Motors, on upgrades from rating agencies, skewing the prospective risk/reward balance for the sector to the downside, in our view.
Notable purchases included those of several taxable and non-taxable municipal securities. These securities, including bonds issued by the state of Texas and the city of New York, had underperformed relative to U.S. Treasuries following the election of Donald Trump and the resulting heightened expectations for legislative action that could reduce the benefits of these securities to individuals. We viewed the loss of tax-exempt status for these securities as unlikely, and thus saw the underperformance of these securities as an opportunity to add high quality bonds at attractive valuations. We also increased exposure to floating rate securities to position for coming interest rate increases by the Fed. Additionally, our portion of the Fund purchased corporate securities in both the industrial and financial sectors as well as structured credit.
At the end of the period, our portion of the Fund was underweight relative to the benchmark in U.S. Treasuries, agency mortgage-backed securities and government-related securities and was overweight relative to the benchmark in investment-grade credit, high-yield credit, asset-backed securities, CMBS and other structured products, all as measured by market weight according to the benchmark.
Derivative positions in the Fund
For the 12-month period ended August 31, 2017, overall derivative usage across the entire Fund had a net negative impact on the Fund’s performance.
TCW: Our portion of the Fund held U.S. Treasury futures as a method of managing duration. The use of these futures detracted modestly from our portion of the Fund’s results during the period. We also used swap contracts to hedge currency exposure, which positively contributed to our portion of the Fund’s results during the period.
Loomis Sayles: Our portion of the Fund used U.S. Treasury futures to help manage duration relative to the benchmark. The use of these futures contributed positively, albeit modestly, to our portion of the Fund’s results during the period.
PGIM: Our portion of the Fund utilized U.S. Treasury futures and interest rate swaps to hedge interest rate risk, duration and yield curve positioning and for relative value trading. Overall, these strategies contributed positively to our portion of the Fund’s performance during the period.
CMIA: Our portion of the Fund used credit default swaps to hedge the credit exposure of individual credit issuers. Credit index swaps were predominantly used to hedge overall credit exposure and, at times, when we viewed the overall credit market to be expensive or inexpensive, as an investment vehicle. CMBS credit indices were used to express a long position. U.S. Treasury futures were used to manage duration and yield curve positioning. Overall, the use of credit default swaps did
| 8 | Multi-Manager Total Return Bond Strategies Fund | Annual Report 2017 |
Manager Discussion of Fund Performance (continued)
not have a measurable impact on our portion of the Fund’s performance; the use of credit index swaps was positive overall; and the use of CMBS credit indices and U.S. Treasury futures detracted from the total return of our portion of the Fund during the period. During August, the Fund’s risk exposure to high-yield bonds was hedged from a sector exposure standpoint. This was done to reduce out of benchmark exposure within the Fund while retaining the potential to achieve positive return contributions through security selection by continuing to hold high-yield bonds selected by the Fund’s investment managers. This hedge had a modest negative impact to performance as high-yield spreads continued to tighten during the period.
Market risk may affect a single issuer, sector of the economy, industry or the market as a whole. Mortgage- and asset-backedsecurities are affected by interest rates, financial health of issuers/originators, creditworthiness of entities providing credit enhancements and the value of underlying assets. Fixed-income securities present issuer default risk. Non-investment-grade (high-yield or junk) securities present greater price volatility and more risk to principal and income than higher rated securities. A rise in interest rates may result in a price decline of fixed-income instruments held by the Fund, negatively impacting its performance and NAV. Falling rates may result in the Fund investing in lower yielding debt instruments, lowering the Fund’s income and yield. These risks may be heightened for longer maturity and duration securities. Prepayment and extension risk exists because a loan, bond or other investment may be called, prepaid or redeemed before maturity and similar yielding investments may not be available for purchase. Investing in derivatives is a specialized activity that involves special risks that subject the Fund to significant loss potential, including when used as leverage, and may result in greater fluctuation in fund value. The Fund is managed by multiple advisers independently of one another, which may result in contradicting trades (i.e., with no net benefit to the Fund), while increasing transaction costs. Market or other (e.g.,interest rate) environments may adversely affect the liquidity of fund investments, negatively impacting their price. Generally, the less liquid the market at the time the Fund sells a holding, the greater the risk of loss or decline of value to the Fund. See the Fund’s prospectus for information on these and other risks.
The views expressed in this report reflect the current views of the respective parties. These views are not guarantees of future performance and involve certain risks, uncertainties and assumptions that are difficult to predict, so actual outcomes and results may differ significantly from the views expressed. These views are subject to change at any time based upon economic, market or other conditions and the respective parties disclaim any responsibility to update such views. These views may not be relied on as investment advice and, because investment decisions for a Columbia fund are based on numerous factors, may not be relied on as an indication of trading intent on behalf of any particular Columbia fund. References to specific securities should not be construed as a recommendation or investment advice.
Multi-Manager Total Return Bond Strategies Fund | Annual Report 2017
| 9 |
Understanding Your Fund’s Expenses
(Unaudited)
As an investor, you incur two types of costs. There are transaction costs, which may include redemption fees. There are also ongoing costs, which generally include management fees, distribution and/or service fees, and other fund expenses. The following information is intended to help you understand your ongoing costs (in dollars) of investing in the Fund and to help you compare these costs with the ongoing costs of investing in other mutual funds.
Analyzing your Fund’s expenses
To illustrate these ongoing costs, we have provided examples and calculated the expenses paid by investors in each share class of the Fund during the period. The actual and hypothetical information in the table is based on an initial investment of $1,000 at the beginning of the period indicated and held for the entire period. Expense information is calculated two ways and each method provides you with different information. The amount listed in the “Actual” column is calculated using the Fund’s actual operating expenses and total return for the period. You may use the Actual information, together with the amount invested, to estimate the expenses that you paid over the period. Simply divide your account value by $1,000 (for example, an $8,600 account value divided by $1,000 = 8.6), then multiply the results by the expenses paid during the period under the “Actual” column. The amount listed in the “Hypothetical” column assumes a 5% annual rate of return before expenses (which is not the Fund’s actual return) and then applies the Fund’s actual expense ratio for the period to the hypothetical return. You should not use the hypothetical account values and expenses to estimate either your actual account balance at the end of the period or the expenses you paid during the period. See “Compare with other funds” below for details on how to use the hypothetical data.
Compare with other funds
Since all mutual funds are required to include the same hypothetical calculations about expenses in shareholder reports, you can use this information to compare the ongoing cost of investing in the Fund with other funds. To do so, compare the hypothetical example with the 5% hypothetical examples that appear in the shareholder reports of other funds. As you compare hypothetical examples of other funds, it is important to note that hypothetical examples are meant to highlight the ongoing costs of investing in a fund only and do not reflect any transaction costs, such as redemption or exchange fees. Therefore, the hypothetical calculations are useful in comparing ongoing costs only, and will not help you determine the relative total costs of owning different funds. If transaction costs were included in these calculations, your costs would be higher.
| March 1, 2017 — August 31, 2017 |
| | Account value at the
beginning of the
period ($) | Account value at the
end of the
period ($) | Expenses paid during
the period ($) | Fund’s annualized
expense ratio (%) |
| | Actual | Hypothetical | Actual | Hypothetical | Actual | Hypothetical | Actual |
| Class A | 1,000.00 | 1,000.00 | 1,028.30 | 1,021.42 | 3.83 | 3.82 | 0.75 |
| Class Z | 1,000.00 | 1,000.00 | 1,029.80 | 1,022.53 | 2.71 | 2.70 | 0.53 |
Expenses paid during the period are equal to the annualized expense ratio for each class as indicated above, multiplied by the average account value over the period and then multiplied by the number of days in the Fund’s most recent fiscal half year and divided by 365.
Expenses do not include fees and expenses incurred indirectly by the Fund from its investment in underlying funds, including affiliated and non-affiliated pooled investment vehicles, such as mutual funds and exchange-traded funds.
Had Columbia Management Investment Advisers, LLC and/or certain of its affiliates not waived/reimbursed certain fees and expenses, account value at the end of the period would have been reduced.
The Fund is offered only through certain wrap fee programs sponsored and/or managed by Ameriprise Financial, Inc. or its affiliates. Participants in wrap fee programs pay other fees that are not included in the above table. Please refer to the wrap program documents for information about the fees charged.
| 10 | Multi-Manager Total Return Bond Strategies Fund | Annual Report 2017 |
Portfolio of Investments
August 31, 2017
(Percentages represent value of investments compared to net assets)
| Asset-Backed Securities — Agency 0.8% |
| Issuer | Coupon
Rate | | Principal
Amount ($) | Value ($) |
| United States Small Business Administration |
| Series 2012-20C Class 1 |
| 03/01/2032 | 2.510% | | 355,324 | 358,088 |
| Series 2012-20G Class 1 |
| 07/01/2032 | 2.380% | | 960,816 | 959,327 |
| Series 2012-20I Class 1 |
| 09/01/2032 | 2.200% | | 983,082 | 978,287 |
| Series 2012-20J Class 1 |
| 10/01/2032 | 2.180% | | 8,327,672 | 8,264,595 |
| Series 2012-20L Class 1 |
| 12/01/2032 | 1.930% | | 443,837 | 433,875 |
| Series 2013-20C Class 1 |
| 03/01/2033 | 2.220% | | 346,269 | 344,744 |
| Series 2013-20E Class 1 |
| 05/01/2033 | 2.070% | | 1,293,302 | 1,273,728 |
| Series 2014-20D Class 1 |
| 04/01/2034 | 3.110% | | 1,324,106 | 1,381,827 |
| Series 2014-20F Class 1 |
| 06/01/2034 | 2.990% | | 1,654,503 | 1,704,941 |
| Series 2014-20I Class 1 |
| 09/01/2034 | 2.920% | | 295,206 | 301,733 |
| Series 2015-20C Class 1 |
| 03/01/2035 | 2.720% | | 721,588 | 730,602 |
| Series 2016-20F Class 1 |
| 06/01/2036 | 2.180% | | 3,788,741 | 3,715,584 |
| Series 2016-20K Class 1 |
| 11/01/2036 | 2.570% | | 3,678,711 | 3,684,008 |
| Series 2016-20L Class 1 |
| 12/01/2036 | 2.810% | | 6,982,274 | 7,074,439 |
| Series 2017-20D Class 1 |
| 04/01/2037 | 2.840% | | 11,616,000 | 11,782,994 |
| Series 2017-20E Class 1 |
| 05/01/2037 | 2.880% | | 755,000 | 768,508 |
| Series 2017-20F Class 1 |
| 06/01/2037 | 2.810% | | 5,880,000 | 5,928,799 |
| Series 2017-20G Class 1 |
| 07/01/2037 | 2.980% | | 5,033,000 | 5,174,059 |
| Series 2017-20H Class 1 |
| 08/01/2037 | 2.750% | | 4,363,000 | 4,394,013 |
Total Asset-Backed Securities — Agency
(Cost $58,496,959) | 59,254,151 |
|
| Asset-Backed Securities — Non-Agency 12.9% |
| | | | |
| Ally Auto Receivables Trust |
| Series 2017-2 Class A2 |
| 11/15/2019 | 1.490% | | 5,000,000 | 5,001,619 |
| Asset-Backed Securities — Non-Agency (continued) |
| Issuer | Coupon
Rate | | Principal
Amount ($) | Value ($) |
| Ally Master Owner Trust(a) |
| Series 2014-5 Class A1 |
1-month USD LIBOR + 0.490%
10/15/2019 | 1.717% | | 800,000 | 800,330 |
| Ally Master Owner Trust |
| Series 2014-5 Class A2 |
| 10/15/2019 | 1.600% | | 2,000,000 | 2,000,222 |
| Series 2015-3 Class A |
| 05/15/2020 | 1.630% | | 1,400,000 | 1,400,341 |
| AmeriCredit Automobile Receivables Trust(a) |
| Series 2016-2 Class A2B |
1-month USD LIBOR + 0.700%
10/08/2019 | 1.929% | | 396,843 | 397,137 |
| AmeriCredit Automobile Receivables Trust |
| Series 2017-1 Class B |
| 02/18/2022 | 2.300% | | 730,000 | 733,249 |
| Series 2017-3 Class B |
| 06/19/2023 | 2.240% | | 585,000 | 586,548 |
| Subordinated, Series 2016-3 Class C |
| 04/08/2022 | 2.240% | | 6,430,000 | 6,408,652 |
| Subordinated, Series 2016-4 Class B |
| 12/08/2021 | 1.830% | | 6,360,000 | 6,323,392 |
| Subordinated, Series 2017-2 Class B |
| 05/18/2022 | 2.400% | | 2,280,000 | 2,298,770 |
| Anchorage Capital CLO 8 Ltd.(a),(b) |
| Series 2016-8A Class A1 |
3-month USD LIBOR + 1.650%
07/28/2028 | 2.964% | | 14,000,000 | 14,050,848 |
| Anchorage Capital CLO Ltd.(a),(b) |
| Series 2015-6A Class AR |
3-month USD LIBOR + 1.270%
07/15/2030 | 2.565% | | 11,500,000 | 11,499,873 |
| Ares XXXIX CLO Ltd.(a),(b) |
| Series 2016-39A Class A |
3-month USD LIBOR + 1.530%
07/18/2028 | 2.688% | | 14,000,000 | 14,040,390 |
| ARI Fleet Lease Trust(b) |
| Series 2017-A Class A2 |
| 04/15/2026 | 1.910% | | 1,200,000 | 1,200,064 |
| ArrowMark Colorado Holdings(a),(b) |
| Series 2017-6A Class A1 |
3-month USD LIBOR + 1.280%
07/15/2029 | 2.508% | | 2,250,000 | 2,249,980 |
| Ascentium Equipment Receivables Trust(b) |
| Series 2017-1A Class A2 |
| 07/10/2019 | 1.870% | | 1,245,000 | 1,246,002 |
| Atlas Senior Loan Fund Ltd.(a),(b) |
| Series 2017-8A Class A |
3-month USD LIBOR + 1.300%
01/16/2030 | 2.607% | | 5,250,000 | 5,255,980 |
The accompanying Notes to Financial Statements are an integral part of this statement.
Multi-Manager Total Return Bond Strategies Fund | Annual Report 2017
| 11 |
Portfolio of Investments (continued)
August 31, 2017
| Asset-Backed Securities — Non-Agency (continued) |
| Issuer | Coupon
Rate | | Principal
Amount ($) | Value ($) |
| Atlas Senior Loan Fund V Ltd.(a),(b) |
| Series 2014-1A Class AR2 |
3-month USD LIBOR + 1.260%
07/16/2029 | 2.500% | | 13,750,000 | 13,749,849 |
| Avis Budget Rental Car Funding AESOP LLC(b) |
| Series 2013-1A Class A |
| 09/20/2019 | 1.920% | | 3,170,000 | 3,169,736 |
| Series 2014-1A Class A |
| 07/20/2020 | 2.460% | | 3,140,000 | 3,148,020 |
| Series 2015-1A Class A |
| 07/20/2021 | 2.500% | | 3,600,000 | 3,613,517 |
| Series 2015-2A Class A |
| 12/20/2021 | 2.630% | | 3,125,000 | 3,137,305 |
| Series 2016-2A Class A |
| 11/20/2022 | 2.720% | | 8,600,000 | 8,643,961 |
| Babson CLO Ltd.(a),(b) |
| Series 2015-IA Class A |
3-month USD LIBOR + 1.430%
04/20/2027 | 2.737% | | 5,000,000 | 5,003,535 |
| Ballyrock CLO Ltd.(a),(b) |
| Series 2016-1A Class A |
3-month USD LIBOR + 1.590%
10/15/2028 | 2.894% | | 16,500,000 | 16,693,297 |
| Battalion CLO X Ltd.(a),(b) |
| Series 2016-10A Class A1 |
3-month USD LIBOR + 1.550%
01/24/2029 | 2.863% | | 4,750,000 | 4,791,657 |
| Benefit Street Partners CLO V Ltd.(a),(b) |
| Series 2014-VA Class AR |
3-month USD LIBOR + 1.200%
10/20/2026 | 2.507% | | 11,000,000 | 11,036,223 |
| Birchwood Park CLO Ltd.(a),(b) |
| Series 2014-1A Class AR |
3-month USD LIBOR + 1.180%
07/15/2026 | 2.484% | | 2,000,000 | 2,009,716 |
| BMW Floorplan Master Owner Trust(a),(b) |
| Series 2015-1A Class A |
1-month USD LIBOR + 0.500%
07/15/2020 | 1.726% | | 800,000 | 802,629 |
| BMW Vehicle Lease Trust |
| Series 2017-1 Class A2 |
| 07/22/2019 | 1.640% | | 5,450,000 | 5,454,861 |
| Burnham Park CLO Ltd.(a),(b) |
| Series 2016-1A Class A |
3-month USD LIBOR + 1.430%
10/20/2029 | 2.737% | | 9,500,000 | 9,573,986 |
| Cabela’s Credit Card Master Note Trust |
| Series 2015-2 Class A1 |
| 07/17/2023 | 2.250% | | 2,675,000 | 2,699,689 |
| Asset-Backed Securities — Non-Agency (continued) |
| Issuer | Coupon
Rate | | Principal
Amount ($) | Value ($) |
| California Republic Auto Receivables Trust |
| Series 2016-2 Class A3 |
| 07/15/2020 | 1.560% | | 1,980,000 | 1,978,859 |
| Series 2017-1 Class A4 |
| 06/15/2022 | 2.280% | | 4,210,000 | 4,221,686 |
| Capital Auto Receivables Asset Trust |
| Series 2015-2 Class A3 |
| 09/20/2019 | 1.730% | | 483,913 | 484,246 |
| Capital One Multi-Asset Execution Trust |
| Series 2015-A4 Class A4 |
| 05/15/2025 | 2.750% | | 5,665,000 | 5,862,045 |
| Series 2017-A3 Class A3 |
| 01/15/2025 | 2.430% | | 11,235,000 | 11,446,071 |
| Capital One Multi-Asset Execution Trust(a) |
| Series 2016-A1 |
1-month USD LIBOR + 0.450%
02/15/2022 | 1.676% | | 6,295,000 | 6,329,542 |
| Carlyle Global Market Strategies CLO Ltd.(a),(b) |
| Series 2012-4A Class AR |
3-month USD LIBOR + 1.450%
01/20/2029 | 2.757% | | 6,250,000 | 6,271,544 |
| CarMax Auto Owner Trust |
| Series 2016-3 Class A3 |
| 05/17/2021 | 1.390% | | 4,365,000 | 4,352,190 |
| Series 2016-4 Class A2 |
| 11/15/2019 | 1.210% | | 1,960,601 | 1,958,281 |
| Series 2017-2 Class A2 |
| 06/15/2020 | 1.630% | | 9,570,000 | 9,577,950 |
| Chancelight, Inc.(a),(b) |
| Series 2012-2 Class A |
1-month USD LIBOR + 0.730%
04/25/2039 | 1.721% | | 1,447,293 | 1,446,427 |
| Chase Issuance Trust(a) |
| Series 2016-A1 Class A |
1-month USD LIBOR + 0.410%
05/17/2021 | 1.636% | | 9,505,000 | 9,554,979 |
| Chase Issuance Trust |
| Series 2016-A4 Class A4 |
| 07/15/2022 | 1.490% | | 6,245,000 | 6,203,860 |
| Series 2016-A7 Class A7 |
| 09/16/2019 | 1.060% | | 5,100,000 | 5,099,568 |
| Chesapeake Funding II LLC(a),(b) |
| Series 2016-2A Class A2 |
1-month USD LIBOR + 1.000%
06/15/2028 | 2.227% | | 2,480,781 | 2,496,179 |
| Series 2017-3A Class A2 |
3-month USD LIBOR + 0.340%
08/15/2029 | 1.913% | | 4,040,000 | 4,040,003 |
The accompanying Notes to Financial Statements are an integral part of this statement.
| 12 | Multi-Manager Total Return Bond Strategies Fund | Annual Report 2017 |
Portfolio of Investments (continued)
August 31, 2017
| Asset-Backed Securities — Non-Agency (continued) |
| Issuer | Coupon
Rate | | Principal
Amount ($) | Value ($) |
| Chrysler Capital Auto Receivables Trust(b) |
| Series 2016-BA Class A2 |
| 01/15/2020 | 1.360% | | 606,665 | 606,267 |
| CIT Education Loan Trust(a),(b) |
| Series 2007-1 Class B |
3-month USD LIBOR + 0.300%
06/25/2042 | 1.596% | | 851,661 | 760,871 |
| CIT Mortgage Loan Trust(a),(b) |
| Series 2007-1 Class 1A |
1-month USD LIBOR + 1.350%
10/25/2037 | 2.584% | | 10,809,938 | 10,737,630 |
| CNH Equipment Trust |
| Series 2017-A Class A2 |
| 07/15/2020 | 1.640% | | 10,930,000 | 10,938,851 |
| Conn Funding II LP(b) |
| Series 2017-A Class A |
| 05/15/2020 | 2.730% | | 5,674,025 | 5,680,120 |
| CPS Auto Receivables Trust(b) |
| Subordinated Series 2017-C Class B |
| 07/15/2021 | 2.300% | | 1,310,000 | 1,311,083 |
| Subordinated, Series 2016-B Class B |
| 09/15/2020 | 3.180% | | 1,970,000 | 1,963,655 |
| Credit Acceptance Auto Loan Trust(b) |
| Series 2016-3A Class A |
| 04/15/2024 | 2.150% | | 2,130,000 | 2,124,071 |
| Series 2017-1A Class A |
| 10/15/2025 | 2.560% | | 685,000 | 688,193 |
| Subordinated, Series 2016-2A Class B |
| 05/15/2024 | 3.180% | | 6,300,000 | 6,362,667 |
| Dell Equipment Finance Trust(b) |
| Series 2016-1 Class A2 |
| 09/24/2018 | 1.430% | | 508,984 | 508,909 |
| Series 2017-1 Class A2 |
| 06/24/2019 | 1.860% | | 1,420,000 | 1,421,761 |
| Discover Card Execution Note Trust |
| Series 2017-A2 Class A2 |
| 07/15/2024 | 2.390% | | 12,265,000 | 12,492,892 |
| DRB Prime Student Loan Trust(b) |
| Series 2016-B Class A2 |
| 06/25/2040 | 2.890% | | 1,715,642 | 1,728,130 |
| Drive Auto Receivables Trust(b) |
| Series 2017-AA Class C |
| 01/18/2022 | 2.980% | | 1,240,000 | 1,256,685 |
| Subordinated, Series 2016-BA Class C |
| 07/15/2022 | 3.190% | | 6,755,000 | 6,835,524 |
| Subordinated, Series 2016-CA Class B |
| 11/16/2020 | 2.370% | | 2,410,000 | 2,418,501 |
| Asset-Backed Securities — Non-Agency (continued) |
| Issuer | Coupon
Rate | | Principal
Amount ($) | Value ($) |
| Dryden 33 Senior Loan Fund(a),(b) |
| Series 2014-33A Class AR |
3-month USD LIBOR + 1.430%
10/15/2028 | 2.734% | | 5,000,000 | 5,030,030 |
| Dryden XXIV Senior Loan Fund(a),(b) |
| Series 2012-24RA Class AR |
3-month USD LIBOR + 1.290%
11/15/2023 | 2.605% | | 2,172,111 | 2,175,940 |
| DT Auto Owner Trust(b) |
| Series 2017-3A Class B |
| 05/17/2021 | 2.400% | | 2,600,000 | 2,602,577 |
| Subordinated, Series 2014-1A Class D |
| 01/15/2021 | 3.980% | | 1,596,317 | 1,602,533 |
| Subordinated, Series 2016-4A Class C |
| 10/17/2022 | 2.740% | | 9,455,000 | 9,482,985 |
| Subordinated, Series 2017-1 Class C |
| 11/15/2022 | 2.700% | | 300,000 | 301,621 |
| Earnest Student Loan Program LLC(a),(b) |
| Series 2016-C Class A1 |
1-month USD LIBOR + 1.850%
10/27/2036 | 3.066% | | 890,375 | 890,373 |
| Series 2016-D Class A1 |
1-month USD LIBOR + 1.400%
01/25/2041 | 2.616% | | 765,850 | 778,251 |
| Education Loan Asset-Backed Trust I(a),(b) |
| Series 2013-1 Class A2 |
1-month USD LIBOR + 0.800%
04/26/2032 | 2.016% | | 4,650,000 | 4,575,640 |
| Educational Funding of the South, Inc.(a) |
| Series 2011-1 Class A2 |
3-month USD LIBOR + 0.650%
04/25/2035 | 1.806% | | 3,079,156 | 3,065,251 |
| EFS Volunteer No. 2 LLC(a),(b) |
| Series 2012-1 Class A2 |
1-month USD LIBOR + 1.350%
03/25/2036 | 2.566% | | 2,700,000 | 2,738,417 |
| Enterprise Fleet Financing LLC(b) |
| Series 2014-2 Class A2 |
| 03/20/2020 | 1.050% | | 116,047 | 115,998 |
| Series 2015-1 Class A2 |
| 09/20/2020 | 1.300% | | 567,601 | 567,314 |
| Series 2015-2 Class A2 |
| 02/22/2021 | 1.590% | | 1,138,558 | 1,137,813 |
| Series 2016-2 Class A2 |
| 02/22/2022 | 1.740% | | 1,378,162 | 1,377,891 |
| Exeter Automobile Receivables Trust(b) |
| Subordinated, Series 2017-2A Class B |
| 05/16/2022 | 2.820% | | 1,760,000 | 1,766,438 |
The accompanying Notes to Financial Statements are an integral part of this statement.
Multi-Manager Total Return Bond Strategies Fund | Annual Report 2017
| 13 |
Portfolio of Investments (continued)
August 31, 2017
| Asset-Backed Securities — Non-Agency (continued) |
| Issuer | Coupon
Rate | | Principal
Amount ($) | Value ($) |
| First Investors Auto Owner Trust(b) |
| Series 2017-1A Class A2 |
| 03/15/2022 | 2.200% | | 2,170,000 | 2,175,228 |
| Flagship Credit Auto Trust(b) |
| Subordinated, Series 2015-3 Class B |
| 03/15/2022 | 3.680% | | 827,000 | 828,348 |
| Subordinated, Series 2016-2 |
| 09/15/2022 | 3.840% | | 1,855,000 | 1,866,979 |
| Subordinated, Series 2016-3 Class B |
| 06/15/2021 | 2.430% | | 2,195,000 | 2,189,379 |
| Subordinated, Series 2016-4 Class B |
| 10/15/2021 | 2.410% | | 1,160,000 | 1,153,633 |
| Ford Credit Auto Owner Trust(b) |
| Series 2015-1 Class A |
| 07/15/2026 | 2.120% | | 5,574,000 | 5,618,755 |
| Series 2015-2 Class A |
| 01/15/2027 | 2.440% | | 2,655,000 | 2,695,590 |
| Series 2016-1 Class A |
| 08/15/2027 | 2.310% | | 6,960,000 | 7,036,911 |
| Series 2016-2 Class A |
| 12/15/2027 | 2.030% | | 16,140,000 | 16,093,978 |
| Series 2017-1 Class A |
| 08/15/2028 | 2.620% | | 21,650,000 | 22,078,683 |
| Ford Credit Auto Owner Trust |
| Series 2016-A Class A2A |
| 12/15/2018 | 1.120% | | 65,634 | 65,622 |
| Series 2016-B Class A3 |
| 10/15/2020 | 1.330% | | 2,115,000 | 2,110,049 |
| Ford Credit Floorplan Master Owner Trust(b) |
| Series 2013-2 Class A |
| 03/15/2022 | 2.090% | | 3,775,000 | 3,802,590 |
| Global SC Finance II SRL(b) |
| Series 2014-1A Class A2 |
| 07/17/2029 | 3.090% | | 2,652,542 | 2,599,575 |
| GM Financial Automobile Leasing Trust |
| Series 2015-3 Class A3 |
| 03/20/2019 | 1.690% | | 1,640,244 | 1,641,362 |
| Series 2016-2 Class A3 |
| 09/20/2019 | 1.620% | | 5,450,000 | 5,451,586 |
| Series 2016-3 Class A2A |
| 02/20/2019 | 1.350% | | 1,158,380 | 1,157,141 |
| GMF Floorplan Owner Revolving Trust(a),(b) |
| Series 2015-1 Class A2 |
1-month USD LIBOR + 0.500%
05/15/2020 | 1.727% | | 680,000 | 681,325 |
| Series 2016-1 Class A2 |
1-month USD LIBOR + 0.850%
05/17/2021 | 2.077% | | 1,755,000 | 1,770,101 |
| Asset-Backed Securities — Non-Agency (continued) |
| Issuer | Coupon
Rate | | Principal
Amount ($) | Value ($) |
| Goal Capital Funding Trust(a) |
| Series 2006-1 Class B |
3-month USD LIBOR + 0.450%
08/25/2042 | 1.767% | | 1,102,294 | 1,017,593 |
| Goldentree Loan Opportunities VIII Ltd.(a),(b) |
| Series 2014-8A Class AR |
3-month USD LIBOR + 1.210%
04/19/2026 | 2.516% | | 6,000,000 | 6,018,978 |
| Green Tree Agency Advance Funding Trust I(b),(c) |
| Series 2016-T1 Class AT1 |
| 10/15/2048 | 2.380% | | 2,200,000 | 2,191,442 |
| Guggenheim CLO LP(a),(b) |
| Series 2015-1A Class A1 |
3-month USD LIBOR + 1.700%
11/25/2027 | 3.017% | | 16,750,000 | 16,765,393 |
| Harley-Davidson Motorcycle Trust |
| Series 2015-1 Class A3 |
| 06/15/2020 | 1.410% | | 599,510 | 599,231 |
| Henderson Receivables LLC(b) |
| Series 2013-3A Class A |
| 01/17/2073 | 4.080% | | 2,340,607 | 2,429,798 |
| Series 2014-2A Class A |
| 01/17/2073 | 3.610% | | 2,904,492 | 2,801,423 |
| Hertz Fleet Lease Funding LP(a),(b) |
| Series 2014-1 Class A |
1-month USD LIBOR + 0.400%
04/10/2028 | 1.631% | | 154,669 | 154,670 |
| Series 2015-1 Class A |
1-month USD LIBOR + 0.570%
07/10/2029 | 1.801% | | 2,406,732 | 2,409,272 |
| Series 2016-1 Class A1 |
1-month USD LIBOR + 1.100%
04/10/2030 | 2.324% | | 4,296,609 | 4,308,376 |
| Series 2017-1 Class A1 |
1-month USD LIBOR + 0.650%
04/10/2031 | 1.881% | | 2,905,000 | 2,905,090 |
| Hertz Vehicle Financing II LP(b) |
| Series 2015-1A Class A |
| 03/25/2021 | 2.730% | | 5,500,000 | 5,498,331 |
| Series 2015-3A Class A |
| 09/25/2021 | 2.670% | | 1,390,000 | 1,384,933 |
| Hertz Vehicle Financing LLC(b) |
| Series 2016-1A Class A |
| 03/25/2020 | 2.320% | | 1,620,000 | 1,617,827 |
| Series 2016-2A Class A |
| 03/25/2022 | 2.950% | | 6,270,000 | 6,262,042 |
| Series 2016-3A Class A |
| 07/25/2020 | 2.270% | | 4,080,000 | 4,058,040 |
The accompanying Notes to Financial Statements are an integral part of this statement.
| 14 | Multi-Manager Total Return Bond Strategies Fund | Annual Report 2017 |
Portfolio of Investments (continued)
August 31, 2017
| Asset-Backed Securities — Non-Agency (continued) |
| Issuer | Coupon
Rate | | Principal
Amount ($) | Value ($) |
| Higher Education Funding I(a),(b) |
| Series 2014-1 Class A |
3-month USD LIBOR + 1.050%
05/25/2034 | 2.367% | | 3,818,318 | 3,802,683 |
| Honda Auto Receivables Owner Trust |
| Series 2015-3 Class A3 |
| 04/18/2019 | 1.270% | | 2,921,329 | 2,919,542 |
| Hyundai Auto Lease Securitization Trust(b) |
| Series 2016-C Class A2 |
| 03/15/2019 | 1.300% | | 3,466,997 | 3,463,090 |
| Series 2017-A |
| 08/17/2020 | 1.880% | | 2,235,000 | 2,242,399 |
| Hyundai Floorplan Master Owner Trust(a),(b) |
| Series 2016-1A Class A1 |
1-month USD LIBOR + 0.900%
03/15/2021 | 2.127% | | 725,000 | 729,408 |
| ICG US CLO Ltd.(a),(b) |
| Series 2014-1A Class A1 |
3-month USD LIBOR + 1.150%
04/20/2026 | 2.457% | | 13,275,000 | 13,239,197 |
| ICG US CLO Ltd.(a),(b),(c),(d) |
| Series 2017-2A Class A1 |
3-month USD LIBOR + 1.280%
10/23/2029 | 3.100% | | 1,000,000 | 1,000,000 |
| Jackson Mill CLO Ltd.(a),(b) |
| Series 2015-1A Class A |
3-month USD LIBOR + 1.540%
04/15/2027 | 2.844% | | 9,750,000 | 9,786,621 |
| Jamestown CLO IX Ltd.(a),(b) |
| Series 2016-9A Class A1B |
3-month USD LIBOR + 1.500%
10/20/2028 | 2.807% | | 18,400,000 | 18,532,406 |
| John Deere Owner Trust |
| Series 2016-A Class A2 |
| 10/15/2018 | 1.150% | | 403,323 | 403,235 |
| KKR CLO Ltd.(a),(b) |
| Series 2018 Class A |
3-month USD LIBOR + 1.270%
07/18/2030 | 2.600% | | 9,000,000 | 8,999,919 |
| Kubota Credit Owner Trust(b) |
| Series 2016-1A Class A2 |
| 04/15/2019 | 1.250% | | 917,918 | 916,719 |
| KVK CLO Ltd.(a),(b) |
| Series 2014-1A Class A1R |
3-month USD LIBOR + 1.300%
05/15/2026 | 2.339% | | 6,000,000 | 6,000,210 |
| Lendmark Funding Trust(b) |
| Series 2016-2A Class A |
| 04/21/2025 | 3.260% | | 1,100,000 | 1,107,399 |
| Asset-Backed Securities — Non-Agency (continued) |
| Issuer | Coupon
Rate | | Principal
Amount ($) | Value ($) |
| Series 2017-1A Class A |
| 01/22/2024 | 2.830% | | 1,700,000 | 1,705,172 |
| Magnetite XI Ltd.(a),(b) |
| Series 2014-11A Class A1R |
3-month USD LIBOR + 1.120%
01/18/2027 | 2.424% | | 5,000,000 | 5,005,910 |
| Mercedes-Benz Auto Lease Trust |
| Series 2016-B Class A2 |
| 01/15/2019 | 1.150% | | 860,843 | 860,226 |
| Series 2017-A Class A2A |
| 08/15/2019 | 1.530% | | 8,295,000 | 8,292,008 |
| Merlin Aviation Holdings DAC(b) |
| Series 2016-1 Class A |
| 12/15/2032 | 4.500% | | 3,163,974 | 3,206,173 |
| Mid-State Capital Corp. Trust(b) |
| Series 2006-1 Class A |
| 10/15/2040 | 5.787% | | 1,235,059 | 1,386,594 |
| Mid-State Trust VII |
| Series 7 Class A (AMBAC) |
| 10/15/2036 | 6.340% | | 1,564,193 | 1,655,280 |
| MMAF Equipment Finance LLC(b) |
| Series 2017-AA Class A2 |
| 05/18/2020 | 1.730% | | 1,090,000 | 1,089,987 |
| Mountain View CLO Ltd.(a),(b) |
| Series 2014-1A Class AR |
3-month USD LIBOR + 1.240%
10/15/2026 | 2.304% | | 6,750,000 | 6,750,101 |
| Navient Student Loan Trust(a) |
| Series 2014-2 Class A |
1-month USD LIBOR + 0.640%
03/25/2043 | 1.874% | | 6,905,854 | 6,849,664 |
| Series 2014-3 Class A |
1-month USD LIBOR + 0.620%
03/25/2083 | 1.854% | | 6,985,400 | 6,886,421 |
| Series 2014-4 Class A |
1-month USD LIBOR + 0.620%
03/25/2083 | 1.644% | | 3,145,796 | 3,100,678 |
| Series 2015-2 Class A3 |
1-month USD LIBOR + 0.570%
11/26/2040 | 1.594% | | 5,400,000 | 5,380,835 |
| Navient Student Loan Trust(a),(b) |
| Series 2017-3A Class A3 |
1-month USD LIBOR + 1.050%
07/26/2066 | 2.111% | | 4,800,000 | 4,838,377 |
| Nelnet Student Loan Trust(a),(b) |
| Series 2012-5A Class A |
1-month USD LIBOR + 0.600%
10/27/2036 | 1.816% | | 2,128,089 | 2,113,279 |
The accompanying Notes to Financial Statements are an integral part of this statement.
Multi-Manager Total Return Bond Strategies Fund | Annual Report 2017
| 15 |
Portfolio of Investments (continued)
August 31, 2017
| Asset-Backed Securities — Non-Agency (continued) |
| Issuer | Coupon
Rate | | Principal
Amount ($) | Value ($) |
| Series 2014-4A Class A2 |
1-month USD LIBOR + 0.950%
11/25/2048 | 2.166% | | 4,210,000 | 4,119,239 |
| Series 2015-1A Class A |
1-month USD LIBOR + 0.590%
04/25/2046 | 1.721% | | 7,120,174 | 7,113,719 |
| New Residential Advance Receivables Trust Advance Receivables-Backed Notes(b) |
| Series 2017-T1 Class AT1 |
| 02/15/2051 | 3.214% | | 3,060,000 | 3,078,070 |
| New York City Tax Lien Trust(b) |
| Series 2015-A Class A |
| 11/10/2028 | 1.340% | | 128,537 | 127,981 |
| Series 2016-A Class A |
| 11/10/2029 | 1.470% | | 402,445 | 400,223 |
| NextGear Floorplan Master Owner Trust(b) |
| Series 2016-1A Class A2 |
| 04/15/2021 | 2.740% | | 3,380,000 | 3,411,145 |
| Series 2016-2A Class A2 |
| 09/15/2021 | 2.190% | | 1,845,000 | 1,844,042 |
| Series 2017-1A Class A2 |
| 04/18/2022 | 2.540% | | 2,990,000 | 2,998,841 |
| Nissan Auto Lease Trust |
| Series 2016-B Class A2A |
| 12/17/2018 | 1.260% | | 1,381,021 | 1,379,969 |
| Nissan Auto Receivables Owner Trust(a) |
| Series 2015-A Class A1 |
1-month USD LIBOR + 0.400%
01/15/2020 | 1.627% | | 6,655,000 | 6,660,398 |
| Nissan Auto Receivables Owner Trust |
| Series 2016-B Class A3 |
| 01/15/2021 | 1.320% | | 2,105,000 | 2,098,437 |
| Nissan Master Owner Trust Receivables(a) |
| Series 2017-A Class A |
1-month USD LIBOR + 0.310%
04/15/2021 | 1.537% | | 8,300,000 | 8,312,928 |
| OCP CLO Ltd.(a),(b) |
| Series 2017-13A Class A1A |
3-month USD LIBOR + 1.260%
07/15/2030 | 2.561% | | 4,500,000 | 4,499,865 |
| Octagon Investment Partners 30 Ltd.(a),(b) |
| Series 2017-1A Class A1 |
3-month USD LIBOR + 1.320%
03/17/2030 | 2.355% | | 2,000,000 | 2,004,430 |
| Ocwen Master Advance Receivables Trust(b) |
| Series 2016-T1 Class AT1 |
| 08/17/2048 | 2.521% | | 4,300,000 | 4,297,574 |
| OneMain Direct Auto Receivables Trust(b) |
| Series 2016-1A Class A |
| 01/15/2021 | 2.040% | | 793,562 | 794,361 |
| Asset-Backed Securities — Non-Agency (continued) |
| Issuer | Coupon
Rate | | Principal
Amount ($) | Value ($) |
| Series 2017-1A Class B |
| 06/15/2021 | 2.880% | | 2,600,000 | 2,605,876 |
| Subordinated, Series 2016-1A Class C |
| 09/15/2021 | 4.580% | | 3,550,000 | 3,598,016 |
| OneMain Financial Issuance Trust(b) |
| Series 2015-1A Class A |
| 03/18/2026 | 3.190% | | 5,035,000 | 5,093,652 |
| Series 2015-2A Class A |
| 07/18/2025 | 2.570% | | 7,503,562 | 7,514,788 |
| Series 2016-3A Class A |
| 06/18/2031 | 3.830% | | 5,000,000 | 5,193,772 |
| OneMain Financial Issuance Trust(b),(d) |
| Subordinated Series 2017-1A Class B |
| 09/14/2032 | 2.790% | | 1,000,000 | 999,835 |
| Subordinated Series 2017-1A Class C |
| 09/14/2032 | 3.350% | | 800,000 | 799,809 |
| OZLM Funding IV Ltd.(a),(d) |
| Series 2013-4A |
| 3-month USD LIBOR + 1.250% | 2.563% | | 14,000,000 | 14,000,000 |
| Palmer Square CLO Ltd.(a),(b) |
| Series 2015-2A Class A1AR |
3-month USD LIBOR + 1.270%
07/20/2030 | 2.577% | | 10,500,000 | 10,497,700 |
| Prestige Auto Receivables Trust(b) |
| Series 2016-2A Class A3 |
| 01/15/2021 | 1.760% | | 6,300,000 | 6,273,616 |
| Regatta VII Funding Ltd.(a),(b) |
| Series 2016-1A Class A1 |
3-month USD LIBOR + 1.520%
12/20/2028 | 2.794% | | 10,000,000 | 10,023,210 |
| Santander Drive Auto Receivables Trust |
| Series 2016-3 Class B |
| 06/15/2021 | 1.890% | | 4,095,000 | 4,094,454 |
| Subordinated, Series 2016-2 Class C |
| 11/15/2021 | 2.660% | | 2,775,000 | 2,799,242 |
| Scholar Funding Trust(a),(b) |
| Series 2011-A Class A |
3-month USD LIBOR + 0.900%
10/28/2043 | 2.214% | | 791,668 | 783,109 |
| Shackleton CLO Ltd.(a),(b) |
| Series 2014-5A Class B1 |
3-month USD LIBOR + 1.140%
05/07/2026 | 2.452% | | 14,000,000 | 13,999,888 |
| Sierra Receivables Funding Co., LLC(b) |
| Series 2017-1A Class A |
| 03/20/2034 | 2.910% | | 1,534,342 | 1,556,162 |
| Sierra Timeshare Receivables Funding LLC(b) |
| Series 2016-2A Class A |
| 07/20/2033 | 2.330% | | 1,067,874 | 1,074,614 |
The accompanying Notes to Financial Statements are an integral part of this statement.
| 16 | Multi-Manager Total Return Bond Strategies Fund | Annual Report 2017 |
Portfolio of Investments (continued)
August 31, 2017
| Asset-Backed Securities — Non-Agency (continued) |
| Issuer | Coupon
Rate | | Principal
Amount ($) | Value ($) |
| S-Jets Ltd.(b),(c) |
| Series 2017-1 Class A |
| 08/15/2042 | 3.970% | | 2,335,000 | 2,335,234 |
| SLC Student Loan Trust(a) |
| Series 2006-2 Class A5 |
3-month USD LIBOR + 0.100%
09/15/2026 | 1.346% | | 3,148,865 | 3,140,507 |
| SLM Student Loan Trust(a) |
| Series 2004-8 Class B |
3-month USD LIBOR + 0.460%
01/25/2040 | 1.616% | | 555,259 | 516,891 |
| Series 2005-4 Class A3 |
3-month USD LIBOR + 0.120%
01/25/2027 | 1.434% | | 5,682,558 | 5,655,515 |
| Series 2007-6 Class B |
3-month USD LIBOR + 0.850%
04/27/2043 | 2.164% | | 829,436 | 787,717 |
| Series 2008-2 Class B |
3-month USD LIBOR + 1.200%
01/25/2083 | 2.514% | | 1,165,000 | 1,086,897 |
| Series 2008-3 Class B |
3-month USD LIBOR + 1.200%
04/26/2083 | 2.356% | | 1,165,000 | 1,092,438 |
| Series 2008-4 Class B |
3-month USD LIBOR + 1.850%
04/25/2029 | 3.006% | | 1,165,000 | 1,137,551 |
| Series 2008-5 Class B |
3-month USD LIBOR + 1.850%
07/25/2073 | 3.164% | | 1,165,000 | 1,163,602 |
| Series 2008-6 Class B |
3-month USD LIBOR + 1.850%
07/26/2083 | 3.006% | | 1,165,000 | 1,151,653 |
| Series 2008-7 Class B |
3-month USD LIBOR + 1.850%
07/26/2083 | 3.164% | | 1,165,000 | 1,154,225 |
| Series 2008-8 Class B |
3-month USD LIBOR + 2.250%
10/25/2029 | 3.406% | | 1,165,000 | 1,168,849 |
| Series 2008-9 Class B |
3-month USD LIBOR + 2.250%
10/25/2083 | 3.564% | | 1,165,000 | 1,190,320 |
| Series 2011-1 Class A2 |
1-month USD LIBOR + 1.150%
10/25/2034 | 2.174% | | 3,285,000 | 3,352,788 |
| Series 2012-7 Class A3 |
1-month USD LIBOR + 0.650%
05/26/2026 | 1.674% | | 4,000,000 | 3,960,003 |
| Series 2013-2 Class A |
1-month USD LIBOR + 0.450%
06/25/2043 | 1.474% | | 5,597,671 | 5,597,670 |
| Asset-Backed Securities — Non-Agency (continued) |
| Issuer | Coupon
Rate | | Principal
Amount ($) | Value ($) |
| SoFi Professional Loan Program LLC(b) |
| Series 2016-A |
| 12/26/2036 | 2.760% | | 3,096,465 | 3,140,670 |
| Series 2016-B Class A2B |
| 10/25/2032 | 2.740% | | 2,490,000 | 2,501,036 |
| Series 2016-C Class A2B |
| 12/27/2032 | 2.360% | | 1,405,000 | 1,405,916 |
| Series 2017-A Class A2B |
| 03/26/2040 | 2.400% | | 805,000 | 805,565 |
| Series 2017-D Class A2FX |
| 09/25/2040 | 2.650% | | 1,500,000 | 1,507,501 |
| SoFi Professional Loan Program LLC(a),(b) |
| Series 2016-D Class A1 |
1-month USD LIBOR + 0.950%
01/25/2039 | 2.166% | | 672,920 | 679,983 |
| Sound Point CLO XII Ltd.(a),(b) |
| Series 2016-2A Class A |
3-month USD LIBOR + 1.660%
10/20/2028 | 2.967% | | 15,000,000 | 15,052,635 |
| Sound Point CLO XVI Ltd.(a),(b) |
| Series 2017-2A Class A |
3-month USD LIBOR + 1.280%
07/25/2030 | 2.567% | | 6,250,000 | 6,249,669 |
| Springleaf Funding Trust(b) |
| Series 2015-AA Class A |
| 11/15/2024 | 3.160% | | 3,300,000 | 3,328,195 |
| Series 2016-AA Class A |
| 11/15/2029 | 2.900% | | 10,200,000 | 10,311,908 |
| Series 2017-AA Class A |
| 07/15/2030 | 2.680% | | 4,500,000 | 4,540,883 |
| Subordinated Series 2017-AA Class B |
| 07/15/2030 | 3.100% | | 600,000 | 602,452 |
| SPS Servicer Advance Receivables Trust(b) |
| Series 2016-T2 Class AT2 |
| 11/15/2049 | 2.750% | | 4,300,000 | 4,302,918 |
| Symphony CLO V Ltd.(a),(b) |
| Series 2007-5A Class A1 |
3-month USD LIBOR + 0.750%
01/15/2024 | 2.054% | | 1,801,213 | 1,803,148 |
| TAL Advantage V LLC(b) |
| Series 2014-2A Class A1 |
| 05/20/2039 | 1.700% | | 201,999 | 201,672 |
| TCF Auto Receivables Owner Trust(b) |
| Series 2016-PT1A Class A |
| 06/15/2022 | 1.930% | | 6,753,778 | 6,752,072 |
| THL Credit Wind River CLO Ltd.(a),(b) |
| Series 2014-1A Class AR |
3-month USD LIBOR + 1.180%
04/18/2026 | 2.338% | | 3,750,000 | 3,749,959 |
The accompanying Notes to Financial Statements are an integral part of this statement.
Multi-Manager Total Return Bond Strategies Fund | Annual Report 2017
| 17 |
Portfolio of Investments (continued)
August 31, 2017
| Asset-Backed Securities — Non-Agency (continued) |
| Issuer | Coupon
Rate | | Principal
Amount ($) | Value ($) |
| Toyota Auto Receivables Owner Trust |
| Series 2015-C Class A3 |
| 06/17/2019 | 1.340% | | 296,647 | 296,558 |
| Series 2016-B Class A3 |
| 04/15/2020 | 1.300% | | 1,395,000 | 1,392,798 |
| Toyota Auto Receivables Owner Trust(a) |
| Series 2017-B Class A2B |
1-month USD LIBOR + 0.060%
01/15/2020 | 1.287% | | 4,800,000 | 4,798,765 |
| Trinitas CLO VI Ltd.(a),(b) |
| Series 2017-6A Class A |
3-month USD LIBOR + 1.320%
07/25/2029 | 2.655% | | 6,000,000 | 5,991,444 |
| Trintas CLO Ltd.(a),(b) |
| Series 2016-5A Class A |
3-month USD LIBOR + 1.700%
10/25/2028 | 2.856% | | 16,175,000 | 16,226,582 |
| Verizon Owner Trust(b) |
| Series 2016-1A Class A |
| 01/20/2021 | 1.420% | | 845,000 | 842,353 |
| Voya Ltd.(a),(b) |
| Series 2012-4A Class A1R |
3-month USD LIBOR + 1.450%
10/15/2028 | 2.754% | | 7,000,000 | 7,016,359 |
| Series 2013-3A Class A1R |
3-month USD LIBOR + 1.050%
01/18/2026 | 2.208% | | 4,500,000 | 4,500,198 |
| VSE VOI Mortgage LLC(b) |
| Series 2016-A Class A |
| 07/20/2033 | 2.540% | | 2,705,000 | 2,699,713 |
| Wachovia Student Loan Trust(a),(b) |
| Series 2006-1 Class A6 |
3-month USD LIBOR + 0.170%
04/25/2040 | 1.326% | | 9,000,000 | 8,530,867 |
| Wellfleet CLO Ltd.(a),(b) |
| Series 2016-2A Class A1 |
3-month USD LIBOR + 1.650%
10/20/2028 | 2.507% | | 4,250,000 | 4,270,732 |
| Wells Fargo Dealer Floorplan Master Note Trust(a) |
| Series 2015-1 Class A |
1-month USD LIBOR + 0.500%
01/20/2020 | 1.731% | | 5,840,000 | 5,849,612 |
| Westcott Park CLO Ltd.(a),(b) |
| Series 2016-1A Class A |
3-month USD LIBOR + 1.530%
07/20/2028 | 2.837% | | 15,000,000 | 15,058,185 |
| Wheels SPV 2 LLC(b) |
| Series 2015-1A Class A2 |
| 04/22/2024 | 1.270% | | 362,273 | 361,962 |
| Asset-Backed Securities — Non-Agency (continued) |
| Issuer | Coupon
Rate | | Principal
Amount ($) | Value ($) |
| World Financial Network Credit Card Master Trust |
| Series 2012-D Class A |
| 04/17/2023 | 2.150% | | 2,150,000 | 2,163,685 |
| Series 2014-C Class A |
| 08/16/2021 | 1.540% | | 1,275,000 | 1,275,081 |
| Series 2015-B Class A |
| 06/17/2024 | 2.550% | | 5,030,000 | 5,103,223 |
| World Omni Auto Receivables Trust |
| Series 2016-B Class A3 |
| 02/15/2022 | 1.300% | | 5,375,000 | 5,338,046 |
| Series 2017-A Class A2A |
| 08/17/2020 | 1.500% | | 8,605,000 | 8,604,522 |
| World Omni Automobile Lease Securitization Trust |
| Series 2015-A Class A3 |
| 10/15/2018 | 1.540% | | 2,754,477 | 2,754,835 |
Total Asset-Backed Securities — Non-Agency
(Cost $973,944,373) | 978,645,024 |
|
| Commercial Mortgage-Backed Securities - Agency 2.2% |
| | | | |
| Federal Home Loan Mortgage Corp. |
| Series 20K050 Class A1 |
| 01/25/2025 | 2.802% | | 2,603,031 | 2,673,321 |
| Series K026 Class A2 |
| 11/25/2022 | 2.510% | | 2,915,000 | 2,972,814 |
| Series K027 Class A2 |
| 01/25/2023 | 2.637% | | 2,357,900 | 2,418,309 |
| Series K722 Class A2 |
| 03/25/2023 | 2.406% | | 1,700,000 | 1,725,956 |
| Series K724 Class A1 |
| 03/25/2023 | 2.776% | | 3,098,526 | 3,194,034 |
| Federal Home Loan Mortgage Corp. Multifamily Structured Pass-Through Certificates |
| CMO Series K151 Class A3 |
| 04/25/2030 | 3.511% | | 4,290,000 | 4,506,795 |
| Series 20K050 Class A2 |
| 08/25/2025 | 3.334% | | 2,440,000 | 2,591,373 |
| Series 20K720 Class A2 |
| 06/25/2022 | 2.716% | | 2,365,000 | 2,438,487 |
| Series K054 Class A2 |
| 01/25/2026 | 2.745% | | 10,000,000 | 10,169,651 |
| Series K055 Class A2 |
| 03/25/2026 | 2.673% | | 21,485,000 | 21,751,008 |
| Series K056 Class A2 |
| 05/25/2026 | 2.525% | | 6,137,000 | 6,136,634 |
| Series KP03 Class A2 |
| 07/25/2019 | 1.780% | | 554,742 | 555,441 |
The accompanying Notes to Financial Statements are an integral part of this statement.
| 18 | Multi-Manager Total Return Bond Strategies Fund | Annual Report 2017 |
Portfolio of Investments (continued)
August 31, 2017
| Commercial Mortgage-Backed Securities - Agency (continued) |
| Issuer | Coupon
Rate | | Principal
Amount ($) | Value ($) |
| Federal Home Loan Mortgage Corp. Multifamily Structured Pass-Through Certificates(a) |
| CMO Series KGRP Class A |
1-month USD LIBOR + 0.380%
04/25/2020 | 1.604% | | 9,159,064 | 9,167,378 |
| Federal National Mortgage Association |
| 07/01/2020 | 3.950% | | 3,955,000 | 4,178,676 |
| 09/01/2020 | 3.589% | | 4,391,972 | 4,598,781 |
| 10/01/2020 | 3.540% | | 3,900,000 | 4,088,068 |
| 12/01/2020 | 3.545% | | 4,544,293 | 4,755,583 |
| 12/01/2020 | 3.771% | | 5,767,679 | 6,071,528 |
| 04/01/2021 | 4.250% | | 3,730,000 | 4,011,388 |
| 04/01/2021 | 4.386% | | 3,377,675 | 3,635,307 |
| 05/01/2021 | 4.540% | | 1,776,556 | 1,922,140 |
| 06/01/2021 | 4.381% | | 5,291,448 | 5,706,718 |
| 08/01/2022 | 2.658% | | 9,143,879 | 9,428,059 |
| 06/01/2023 | 4.650% | | 2,956,830 | 3,294,942 |
| 03/01/2024 | 3.550% | | 3,143,002 | 3,377,284 |
| 03/01/2026 | 2.860% | | 4,325,000 | 4,426,772 |
| 02/01/2028 | 3.280% | | 3,030,000 | 3,176,923 |
| 05/01/2028 | 2.780% | | 2,115,000 | 2,139,045 |
| 05/01/2028 | 3.010% | | 3,164,471 | 3,255,168 |
| 11/01/2028 | 2.810% | | 1,736,000 | 1,749,775 |
| 04/01/2029 | 3.130% | | 4,346,546 | 4,496,734 |
| 04/01/2029 | 3.130% | | 4,157,566 | 4,301,223 |
| 08/01/2029 | 3.580% | | 2,133,704 | 2,287,578 |
| 03/01/2031 | 3.200% | | 2,150,000 | 2,216,783 |
| 11/01/2031 | 2.770% | | 5,570,597 | 5,591,912 |
| 08/01/2034 | 3.760% | | 2,003,827 | 2,134,941 |
| Federal National Mortgage Association(a),(e) |
| Series 2013-M6 Class 1AC |
| 02/25/2043 | 3.954% | | 5,225,000 | 5,511,254 |
| Government National Mortgage Association(a) |
| CMO Series 2013-H08 Class FA |
1-month USD LIBOR + 0.350%
03/20/2063 | 1.426% | | 760,824 | 757,505 |
Total Commercial Mortgage-Backed Securities - Agency
(Cost $165,861,241) | 167,415,288 |
|
| Commercial Mortgage-Backed Securities - Non-Agency 5.3% |
| | | | |
| 1211 Avenue of the Americas Trust(b) |
| Series 2015-1211 Class A1A2 |
| 08/10/2035 | 3.901% | | 2,130,000 | 2,286,014 |
| 225 Liberty Street Trust(b) |
| Series 2016-225L Class A |
| 02/10/2036 | 3.597% | | 2,115,000 | 2,211,844 |
| 245 Park Avenue Trust(b) |
| Series 2017-245P Class A |
| 06/05/2037 | 3.508% | | 3,085,000 | 3,229,655 |
| American Homes 4 Rent Trust(b) |
| Series 2014-SFR3 Class A |
| 12/17/2036 | 3.678% | | 761,814 | 809,671 |
| Series 2015-SFR2 Class A |
| 10/17/2045 | 3.732% | | 2,155,867 | 2,302,912 |
| Commercial Mortgage-Backed Securities - Non-Agency (continued) |
| Issuer | Coupon
Rate | | Principal
Amount ($) | Value ($) |
| Banc of America Merrill Lynch Commercial Mortgage Securities Trust(b) |
| Series 2012-PARK Class A |
| 12/10/2030 | 2.959% | | 1,685,000 | 1,734,164 |
| BBCMS Mortgage Trust(a),(b),(e) |
| Series 2016-ETC Class D |
| 08/14/2036 | 3.729% | | 2,790,000 | 2,717,692 |
| BBCMS Mortgage Trust |
| Series 2017-C1 Class A2 |
| 02/15/2050 | 3.189% | | 4,645,000 | 4,808,166 |
| BBCMS Mortgage Trust(b) |
| Subordinated, Series 2016-ETC Class A |
| 08/14/2036 | 2.937% | | 13,500,000 | 13,383,883 |
| Subordinated, Series 2016-ETC Class B |
| 08/14/2036 | 3.189% | | 900,000 | 890,594 |
| Subordinated, Series 2016-ETC Class C |
| 08/14/2036 | 3.391% | | 770,000 | 760,528 |
| BB-UBS Trust(b) |
| Series 2012-TFT Class A |
| 06/05/2030 | 2.892% | | 6,260,000 | 6,235,948 |
| CD Mortgage Trust |
| Series 2016-CD1 Class A3 |
| 08/10/2049 | 2.459% | | 17,000,000 | 16,592,238 |
| CFCRE Commercial Mortgage Trust |
| Series 2016-C4 Class A4 |
| 05/10/2058 | 3.283% | | 5,900,000 | 6,024,334 |
| CGGS Commercial Mortgage Trust(b) |
| Series 2016-RNDA Class AFX |
| 02/10/2033 | 2.757% | | 2,516,629 | 2,529,118 |
| Citigroup Commercial Mortgage Trust |
| Series 2015-GC27 Class A5 |
| 02/10/2048 | 3.137% | | 2,945,000 | 3,006,244 |
| Series 2016-C1 Class A4 |
| 05/10/2049 | 3.209% | | 8,900,000 | 9,135,412 |
| Series 2016-GC37 Class A4 |
| 04/10/2049 | 3.314% | | 8,000,000 | 8,236,874 |
| CityLine Commercial Mortgage Trust(a),(b),(e) |
| Subordinated, Series 2016-CLNE Class B |
| 11/10/2031 | 2.871% | | 3,600,000 | 3,579,966 |
| Subordinated, Series 2016-CLNE Class C |
| 11/10/2031 | 2.871% | | 1,350,000 | 1,319,361 |
| Commercial Mortgage Pass-Through Certificates(b) |
| Series 2012-LTRT Class A2 |
| 10/05/2030 | 3.400% | | 3,793,000 | 3,838,906 |
| Commercial Mortgage Trust |
| Series 2012-CR2 Class A4 |
| 08/15/2045 | 3.147% | | 7,350,000 | 7,638,745 |
| Series 2013-CR13 Class A3 |
| 11/10/2023 | 3.928% | | 5,955,000 | 6,439,866 |
The accompanying Notes to Financial Statements are an integral part of this statement.
Multi-Manager Total Return Bond Strategies Fund | Annual Report 2017
| 19 |
Portfolio of Investments (continued)
August 31, 2017
| Commercial Mortgage-Backed Securities - Non-Agency (continued) |
| Issuer | Coupon
Rate | | Principal
Amount ($) | Value ($) |
| Series 2013-CR8 Class A4 |
| 06/10/2046 | 3.334% | | 2,645,000 | 2,771,198 |
| Series 2014-UBS2 Class A5 |
| 03/10/2047 | 3.961% | | 1,165,000 | 1,251,340 |
| Series 2014-UBS4 Class A5 |
| 08/10/2047 | 3.694% | | 5,000,000 | 5,288,646 |
| Series 2014-UBS6 Class A4 |
| 12/10/2047 | 3.378% | | 3,605,000 | 3,749,252 |
| Series 2014-UBS6 Class A5 |
| 12/10/2047 | 3.644% | | 7,300,000 | 7,711,111 |
| Series 2015-CR26 Class A4 |
| 10/10/2048 | 3.630% | | 1,600,000 | 1,690,476 |
| Series 2015-DC1 Class A5 |
| 02/10/2048 | 3.350% | | 13,495,000 | 13,972,541 |
| Series 2015-LC19 Class A4 |
| 02/10/2048 | 3.183% | | 835,000 | 858,483 |
| Series 2015-PC1 Class A5 |
| 07/10/2050 | 3.902% | | 5,515,000 | 5,902,917 |
| Series 2016-COR1 Class A3 |
| 10/10/2049 | 2.826% | | 8,500,000 | 8,469,008 |
| Series 2016-DC2 Class A5 |
| 02/10/2049 | 3.765% | | 4,832,000 | 5,135,253 |
| Commercial Mortgage Trust(a),(b),(e) |
| Series 2016-667M Class C |
| 10/10/2036 | 3.284% | | 6,770,000 | 6,775,588 |
| Commercial Mortgage Trust(b) |
| Series 2016-787S Class A |
| 02/10/2036 | 3.545% | | 2,115,000 | 2,213,259 |
| Credit Suisse Mortgage Capital Trust(b) |
| Series 2014-USA Class A2 |
| 09/15/2037 | 3.953% | | 13,555,000 | 14,283,501 |
| DBUBS Mortgage Trust(b) |
| Series 2011-LC2A Class A4 |
| 07/10/2044 | 4.537% | | 12,870,000 | 13,825,157 |
| DBWF Mortgage Trust(a),(b),(e) |
| Series 2016-85T Class D |
| 12/10/2036 | 3.935% | | 2,000,000 | 2,040,180 |
| Series 2016-85T Class E |
| 12/10/2036 | 3.935% | | 2,000,000 | 1,859,000 |
| Federal Home Loan Mortgage Corp. Multifamily Structured Pass-Through Certificates(a),(e),(f) |
| CMO Series K028 Class X1 |
| 02/25/2023 | 0.442% | | 125,877,606 | 1,786,115 |
| CMO Series K055 Class X1 |
| 03/25/2026 | 1.502% | | 2,163,890 | 208,366 |
| CMO Series K057 Class X1 |
| 07/25/2026 | 1.327% | | 37,775,819 | 3,269,093 |
| Commercial Mortgage-Backed Securities - Non-Agency (continued) |
| Issuer | Coupon
Rate | | Principal
Amount ($) | Value ($) |
| CMO Series K059 Class X1 |
| 09/25/2026 | 0.437% | | 7,429,116 | 183,756 |
| CMO Series K060 Class X1 |
| 10/25/2026 | 0.201% | | 26,953,119 | 224,458 |
| CMO Series K152 Class X1 |
| 01/25/2031 | 1.097% | | 4,417,186 | 406,743 |
| CMO Series K718 Class X1 |
| 01/25/2022 | 0.766% | | 23,532,232 | 555,064 |
| General Electric Capital Assurance Co.(b) |
| Series 2003-1 Class A5 |
| 05/12/2035 | 5.743% | | 727,840 | 746,540 |
| Government National Mortgage Association(a),(e),(f) |
| CMO Series 2011-38 Class IO |
| 04/16/2053 | 0.075% | | 12,301,695 | 226,431 |
| CMO Series 2013-162 Class IO |
| 09/16/2046 | 0.944% | | 110,037,109 | 5,145,797 |
| CMO Series 2014-134 Class IA |
| 01/16/2055 | 0.658% | | 27,431,736 | 869,803 |
| CMO Series 2015-101 Class IO |
| 03/16/2052 | 0.879% | | 18,643,386 | 1,152,411 |
| CMO Series 2015-114 |
| 03/15/2057 | 0.968% | | 4,667,230 | 287,708 |
| CMO Series 2015-120 Class IO |
| 03/16/2057 | 0.912% | | 21,542,758 | 1,325,610 |
| CMO Series 2015-125 Class IO |
| 07/16/2055 | 0.806% | | 54,324,997 | 3,000,234 |
| CMO Series 2015-146 Class IC |
| 07/16/2055 | 0.865% | | 41,180,358 | 2,138,430 |
| CMO Series 2015-171 Class IO |
| 11/16/2055 | 0.893% | | 14,466,014 | 978,085 |
| CMO Series 2015-174 Class IO |
| 11/16/2055 | 0.950% | | 54,699,635 | 3,367,736 |
| CMO Series 2015-21 Class IO |
| 07/16/2056 | 1.034% | | 14,767,992 | 907,920 |
| CMO Series 2015-29 Class EI |
| 09/16/2049 | 0.765% | | 43,426,111 | 2,591,948 |
| CMO Series 2015-41 Class IO |
| 09/16/2056 | 0.756% | | 7,683,989 | 460,665 |
| CMO Series 2015-6 Class IO |
| 02/16/2051 | 0.753% | | 15,891,311 | 790,911 |
| CMO Series 2015-70 Class IO |
| 12/16/2049 | 1.069% | | 22,915,291 | 1,479,645 |
| CMO Series 2016-39 Class IO |
| 01/16/2056 | 0.854% | | 8,275,849 | 541,376 |
| Series 2014-101 Class IO |
| 04/16/2056 | 0.827% | | 52,582,110 | 2,987,163 |
The accompanying Notes to Financial Statements are an integral part of this statement.
| 20 | Multi-Manager Total Return Bond Strategies Fund | Annual Report 2017 |
Portfolio of Investments (continued)
August 31, 2017
| Commercial Mortgage-Backed Securities - Non-Agency (continued) |
| Issuer | Coupon
Rate | | Principal
Amount ($) | Value ($) |
| Series 2016-152 Class IO |
| 08/15/2058 | 0.984% | | 24,528,475 | 1,980,643 |
| Government National Mortgage Association(a),(c),(e),(f) |
| CMO Series 2015-125 Class IB |
| 01/16/2055 | 1.327% | | 66,337,447 | 4,602,160 |
| GS Mortgage Securities Trust |
| Series 2015-GC28 Class A5 |
| 02/10/2048 | 3.396% | | 13,766,500 | 14,304,862 |
| Series 2015-GC34 Class A3 |
| 10/10/2048 | 3.244% | | 15,000,000 | 15,468,239 |
| Series 2016-GS2 Class A3 |
| 05/10/2049 | 2.791% | | 4,500,000 | 4,482,294 |
| Series 2017-GS7 Class A4 |
| 08/10/2050 | 3.430% | | 2,000,000 | 2,076,209 |
| Hilton USA Trust(b) |
| Series 2016-HHV Class A |
| 11/05/2038 | 3.719% | | 2,800,000 | 2,960,050 |
| Series 2016-SFP Class A |
| 11/05/2035 | 2.828% | | 3,500,000 | 3,540,072 |
| Houston Galleria Mall Trust(b) |
| Series 2015-HGLR Class A1A2 |
| 03/05/2037 | 3.087% | | 1,700,000 | 1,708,759 |
| Hudsons Bay Simon JV Trust(b) |
| Series 2015-HB7 Class A7 |
| 08/05/2034 | 3.914% | | 2,520,000 | 2,578,847 |
| IMT Trust(b) |
| Series 2017-APTS Class AFX |
| 06/15/2034 | 3.478% | | 3,540,000 | 3,685,190 |
| Irvine Core Office Trust(b) |
| Series 2013-IRV Class A1 |
| 05/15/2048 | 2.068% | | 1,566,833 | 1,562,903 |
| JPMBB Commercial Mortgage Securities Trust |
| Series 2013-C14 Class A4 |
| 08/15/2046 | 4.133% | | 3,430,000 | 3,726,001 |
| Series 2014-C26 Class A3 |
| 01/15/2048 | 3.231% | | 360,000 | 371,591 |
| JPMDB Commercial Mortgage Securities Trust |
| Series 2016-C4 Class A2 |
| 12/15/2049 | 2.882% | | 8,500,000 | 8,565,261 |
| JPMorgan Chase Commercial Mortgage Securities Trust |
| Series 2007-C1 Class A4 |
| 02/15/2051 | 5.716% | | 2,263,649 | 2,265,652 |
| Series 2013-C13 Class A3 |
| 01/15/2046 | 3.525% | | 3,960,000 | 4,085,325 |
| Series 2013-C13 Class A4 |
| 01/15/2046 | 3.994% | | 4,795,000 | 5,175,724 |
| Commercial Mortgage-Backed Securities - Non-Agency (continued) |
| Issuer | Coupon
Rate | | Principal
Amount ($) | Value ($) |
| JPMorgan Chase Commercial Mortgage Securities Trust(b) |
| Series 2011-C3 Class A3 |
| 02/15/2046 | 4.388% | | 6,399,273 | 6,479,491 |
| JPMorgan Chase Commercial Mortgage Securities Trust(a),(b),(e),(f) |
| Series 2016-WPT Class XCP |
| 10/15/2018 | 1.198% | | 141,533,000 | 1,879,445 |
| Series 2016-WSP Class XCP |
| 02/15/2018 | 0.985% | | 150,000,000 | 680,520 |
| JPMorgan Commercial Mortgage-Backed Securities Trust(b) |
| Series 2009-RR1 Class A4B1 |
| 03/18/2051 | 1.000% | | 44,930 | 44,577 |
| LSTAR Commercial Mortgage Trust(b) |
| Series 2017-5 Class A4 |
| 03/10/2050 | 3.390% | | 800,000 | 817,549 |
| Morgan Stanley Bank of America Merrill Lynch Trust |
| Series 2013-C12 Class A4 |
| 10/15/2046 | 4.259% | | 1,885,000 | 2,063,820 |
| Series 2015-C21 Class A3 |
| 03/15/2048 | 3.077% | | 525,000 | 536,660 |
| Series 2016-C29 Class ASB |
| 05/15/2049 | 3.140% | | 1,000,000 | 1,035,353 |
| Morgan Stanley Capital I Trust(a),(e) |
| Series 2007-IQ16 Class AM |
| 12/12/2049 | 6.325% | | 2,977,979 | 3,005,048 |
| Morgan Stanley Capital I Trust(b) |
| Series 2014-150E Class A |
| 09/09/2032 | 3.912% | | 2,325,000 | 2,491,702 |
| Morgan Stanley Capital I Trust |
| Series 2016-UB11 Class A3 |
| 08/15/2049 | 2.531% | | 8,500,000 | 8,245,850 |
| OBP Depositor LLC Trust(b) |
| Series 2010-OBP Class A |
| 07/15/2045 | 4.646% | | 1,952,000 | 2,081,925 |
| Progress Residential Trust(b) |
| Series 2017-SFR1 Class A |
| 08/17/2034 | 2.768% | | 3,980,000 | 4,027,939 |
| RBS Commercial Funding, Inc., Trust(a),(b),(e) |
| Series 2013-GSP Class A |
| 01/13/2032 | 3.961% | | 2,420,000 | 2,588,113 |
| SG Commercial Mortgage Securities Trust |
| Series 2016-C5 Class A4 |
| 10/10/2048 | 3.055% | | 5,120,000 | 5,137,326 |
| UBS-Barclays Commercial Mortgage Trust |
| Series 2012-C4 Class A5 |
| 12/10/2045 | 2.850% | | 5,168,582 | 5,275,993 |
| Series 2013-C5 Class A4 |
| 03/10/2046 | 3.185% | | 5,410,000 | 5,605,029 |
| Series 2013-C6 Class A4 |
| 04/10/2046 | 3.244% | | 1,935,000 | 2,010,809 |
The accompanying Notes to Financial Statements are an integral part of this statement.
Multi-Manager Total Return Bond Strategies Fund | Annual Report 2017
| 21 |
Portfolio of Investments (continued)
August 31, 2017
| Commercial Mortgage-Backed Securities - Non-Agency (continued) |
| Issuer | Coupon
Rate | | Principal
Amount ($) | Value ($) |
| Wells Fargo Commercial Mortgage Trust(b) |
| Series 2010-C1 Class A2 |
| 11/15/2043 | 4.393% | | 1,930,000 | 2,047,569 |
| Wells Fargo Commercial Mortgage Trust(a),(b),(e) |
| Series 2013-120B Class A |
| 03/18/2028 | 2.800% | | 1,600,000 | 1,622,479 |
| Wells Fargo Commercial Mortgage Trust |
| Series 2013-LC12 Class A4 |
| 07/15/2046 | 4.218% | | 5,090,000 | 5,555,870 |
| Series 2015-LC20 Class A4 |
| 04/15/2050 | 2.925% | | 1,965,000 | 1,994,950 |
| WF-RBS Commercial Mortgage Trust(b) |
| Series 2011-C4 Class A3 |
| 06/15/2044 | 4.394% | | 4,123,844 | 4,222,051 |
| WF-RBS Commercial Mortgage Trust |
| Series 2013-C18 Class A2 |
| 12/15/2046 | 3.027% | | 1,440,000 | 1,460,336 |
| Series 2014-C24 Class A3 |
| 11/15/2047 | 3.428% | | 1,345,000 | 1,390,799 |
Total Commercial Mortgage-Backed Securities - Non-Agency
(Cost $404,258,426) | 398,582,038 |
| Common Stocks —% |
| Issuer | Shares | Value ($) |
| Energy —% |
| Oil, Gas & Consumable Fuels —% |
| Prairie Provident Resources, Inc.(c),(g) | 1,728 | 556 |
| Total Energy | 556 |
Total Common Stocks
(Cost $7,496) | 556 |
| Corporate Bonds & Notes 33.4% |
| Issuer | Coupon
Rate | | Principal
Amount ($) | Value ($) |
| Aerospace & Defense 0.1% |
| Alcoa, Inc. |
| 04/15/2021 | 5.400% | | 2,250,000 | 2,411,820 |
| Bombardier, Inc.(b) |
| 12/01/2021 | 8.750% | | 130,000 | 147,687 |
| Embraer Netherlands Finance BV |
| 06/15/2025 | 5.050% | | 1,550,000 | 1,644,369 |
| Embraer SA |
| 06/15/2022 | 5.150% | | 160,000 | 170,969 |
| L3 Technologies, Inc. |
| 10/15/2019 | 5.200% | | 2,750,000 | 2,931,338 |
| Corporate Bonds & Notes (continued) |
| Issuer | Coupon
Rate | | Principal
Amount ($) | Value ($) |
| Lockheed Martin Corp. |
| 12/15/2042 | 4.070% | | 1,690,000 | 1,745,893 |
| Textron, Inc. |
| 03/01/2024 | 4.300% | | 690,000 | 738,445 |
| 03/01/2025 | 3.875% | | 300,000 | 313,743 |
| TransDigm, Inc. |
| 05/15/2025 | 6.500% | | 262,000 | 269,692 |
| 06/15/2026 | 6.375% | | 473,000 | 486,547 |
| Total | 10,860,503 |
| Airlines 0.3% |
| American Airlines Pass-Through Trust |
| 01/15/2023 | 4.950% | | 1,488,139 | 1,592,136 |
| Continental Airlines Pass-Through Trust |
| 01/02/2018 | 6.900% | | 45,412 | 46,057 |
| 02/02/2019 | 6.545% | | 1,252,620 | 1,298,677 |
| 04/19/2022 | 5.983% | | 2,847,127 | 3,133,838 |
| Delta Air Lines Pass-Through Trust |
| 01/02/2023 | 6.718% | | 2,992,580 | 3,369,439 |
| U.S. Airways Pass-Through Trust |
| 10/01/2024 | 5.900% | | 750,559 | 846,310 |
| 06/03/2025 | 4.625% | | 3,266,821 | 3,478,543 |
| United Airlines, Inc. Pass-Through Trust |
| Series 2016-1 Class AA |
| 07/07/2028 | 3.100% | | 7,160,000 | 7,174,119 |
| Total | 20,939,119 |
| Apartment REIT 0.1% |
| AvalonBay Communities, Inc. |
| 03/15/2020 | 6.100% | | 1,865,000 | 2,051,306 |
| 09/15/2022 | 2.950% | | 4,650,000 | 4,752,440 |
| Total | 6,803,746 |
| Automotive 1.2% |
| American Honda Finance Corp.(b) |
| 10/01/2018 | 7.625% | | 2,250,000 | 2,392,249 |
| American Honda Finance Corp. |
| 02/14/2020 | 2.000% | | 2,600,000 | 2,613,780 |
| BMW US Capital LLC(b) |
| 09/15/2021 | 1.850% | | 4,895,000 | 4,838,443 |
| Daimler Finance North America LLC(b) |
| 09/03/2019 | 2.250% | | 5,895,000 | 5,925,129 |
| 03/02/2020 | 2.250% | | 1,500,000 | 1,507,179 |
| Ford Motor Co. |
| 02/01/2029 | 6.375% | | 1,165,000 | 1,377,882 |
| 01/15/2043 | 4.750% | | 2,640,000 | 2,541,198 |
| 12/08/2046 | 5.291% | | 1,415,000 | 1,453,610 |
The accompanying Notes to Financial Statements are an integral part of this statement.
| 22 | Multi-Manager Total Return Bond Strategies Fund | Annual Report 2017 |
Portfolio of Investments (continued)
August 31, 2017
| Corporate Bonds & Notes (continued) |
| Issuer | Coupon
Rate | | Principal
Amount ($) | Value ($) |
| Ford Motor Credit Co. LLC |
| 05/15/2018 | 5.000% | | 1,975,000 | 2,017,506 |
| 06/15/2018 | 2.240% | | 3,000,000 | 3,011,712 |
| 08/03/2022 | 2.979% | | 4,800,000 | 4,795,973 |
| 09/20/2022 | 4.250% | | 1,100,000 | 1,163,293 |
| Gates Global LLC/Co.(b) |
| 07/15/2022 | 6.000% | | 287,000 | 294,498 |
| General Motors Co. |
| 10/02/2018 | 3.500% | | 2,500,000 | 2,541,035 |
| 04/01/2025 | 4.000% | | 1,060,000 | 1,072,104 |
| 10/02/2043 | 6.250% | | 1,925,000 | 2,152,753 |
| 04/01/2048 | 5.400% | | 3,425,000 | 3,466,333 |
| General Motors Co.(a) |
3-month USD LIBOR + 0.800%
08/07/2020 | 2.112% | | 3,460,000 | 3,460,059 |
| General Motors Financial Co., Inc. |
| 09/25/2017 | 3.000% | | 5,000,000 | 5,003,944 |
| 04/13/2024 | 3.950% | | 6,770,000 | 6,919,691 |
| 03/01/2026 | 5.250% | | 2,345,000 | 2,554,228 |
| Goodyear Tire & Rubber Co. (The) |
| 11/15/2023 | 5.125% | | 200,000 | 208,985 |
| Hyundai Capital America(b) |
| 02/06/2019 | 2.550% | | 180,000 | 180,789 |
| 03/19/2020 | 2.600% | | 680,000 | 683,222 |
| IHO Verwaltungs GmbH PIK(b) |
| 09/15/2026 | 4.750% | | 2,925,000 | 2,940,581 |
| Lear Corp. |
| 01/15/2023 | 4.750% | | 1,667,000 | 1,723,498 |
| 03/15/2024 | 5.375% | | 1,242,000 | 1,323,870 |
| 09/15/2027 | 3.800% | | 2,190,000 | 2,195,885 |
| Magna International, Inc. |
| 06/15/2024 | 3.625% | | 1,100,000 | 1,153,979 |
| Nemak SAB de CV(b) |
| 02/28/2023 | 5.500% | | 200,000 | 206,161 |
| Nissan Motor Acceptance Corp.(b) |
| 09/12/2017 | 1.950% | | 2,500,000 | 2,500,255 |
| PACCAR Financial Corp. |
| 08/12/2019 | 1.200% | | 1,110,000 | 1,098,318 |
| 02/27/2020 | 1.950% | | 5,905,000 | 5,929,417 |
| RCI Banque SA(b) |
| 04/03/2018 | 3.500% | | 4,000,000 | 4,036,656 |
| Schaeffler Finance BV(b) |
| 05/15/2023 | 4.750% | | 6,315,000 | 6,524,494 |
| ZF North America Capital, Inc.(b) |
| 04/29/2025 | 4.750% | | 177,000 | 186,355 |
| Total | 91,995,064 |
| Corporate Bonds & Notes (continued) |
| Issuer | Coupon
Rate | | Principal
Amount ($) | Value ($) |
| Banking 10.3% |
| Ally Financial, Inc. |
| 09/10/2018 | 4.750% | | 575,000 | 588,727 |
| 03/30/2020 | 4.125% | | 50,000 | 51,419 |
| 09/30/2024 | 5.125% | | 347,000 | 373,507 |
| 03/30/2025 | 4.625% | | 150,000 | 156,379 |
| Subordinated |
| 11/20/2025 | 5.750% | | 350,000 | 377,036 |
| American Express Co. |
| 03/19/2018 | 7.000% | | 2,500,000 | 2,572,130 |
| 08/01/2022 | 2.500% | | 6,890,000 | 6,922,693 |
| American Express Credit Corp. |
| 09/22/2017 | 1.550% | | 1,950,000 | 1,950,082 |
| Banco de Credito del Peru(b) |
| 09/16/2020 | 5.375% | | 150,000 | 163,778 |
| Banco General SA(b) |
| 08/07/2027 | 4.125% | | 2,935,000 | 2,914,423 |
| Banco Internacional Del Peru SAA/Panama(b) |
| 10/07/2020 | 5.750% | | 100,000 | 109,768 |
| Banco Santander SA(b) |
| 11/09/2022 | 4.125% | | 150,000 | 157,787 |
| Bank of America Corp. |
| 09/01/2017 | 6.000% | | 3,000,000 | 3,000,336 |
| 01/11/2018 | 2.000% | | 6,500,000 | 6,508,066 |
| 04/25/2018 | 6.875% | | 13,300,000 | 13,729,324 |
| 05/01/2018 | 5.650% | | 2,000,000 | 2,049,930 |
| 07/15/2018 | 6.500% | | 3,000,000 | 3,120,435 |
| 06/01/2019 | 7.625% | | 1,500,000 | 1,643,001 |
| 10/19/2020 | 2.625% | | 2,000,000 | 2,028,042 |
| 01/11/2023 | 3.300% | | 2,000,000 | 2,056,352 |
| 01/22/2024 | 4.125% | | 3,000,000 | 3,213,513 |
| 04/19/2026 | 3.500% | | 2,000,000 | 2,040,412 |
| Subordinated |
| 01/22/2025 | 4.000% | | 795,000 | 823,783 |
| 04/21/2025 | 3.950% | | 2,500,000 | 2,578,057 |
| Bank of America Corp.(a),(h) |
| 07/21/2021 | 2.369% | | 3,085,000 | 3,093,576 |
| 04/24/2028 | 3.705% | | 8,890,000 | 9,085,216 |
| 12/31/2049 | 8.125% | | 3,795,000 | 3,923,681 |
| Junior Subordinated |
| 12/31/2049 | 6.100% | | 5,000,000 | 5,480,145 |
| 12/31/2049 | 8.000% | | 6,547,000 | 6,661,985 |
| Bank of Montreal |
| 04/09/2018 | 1.450% | | 750,000 | 749,914 |
| 07/18/2019 | 1.500% | | 2,615,000 | 2,601,407 |
| Bank of New York Mellon Corp. (The) |
| 05/15/2019 | 5.450% | | 800,000 | 848,170 |
| 05/03/2021 | 2.050% | | 2,510,000 | 2,506,812 |
| 08/16/2023 | 2.200% | | 4,180,000 | 4,123,641 |
| 09/11/2024 | 3.250% | | 1,960,000 | 2,023,688 |
The accompanying Notes to Financial Statements are an integral part of this statement.
Multi-Manager Total Return Bond Strategies Fund | Annual Report 2017
| 23 |
Portfolio of Investments (continued)
August 31, 2017
| Corporate Bonds & Notes (continued) |
| Issuer | Coupon
Rate | | Principal
Amount ($) | Value ($) |
| Bank of New York Mellon Corp. (The)(a),(h) |
| Junior Subordinated |
| 12/29/2049 | 4.500% | | 612,000 | 608,189 |
| BankBoston Capital Trust IV(a) |
| Junior Subordinated |
3-month USD LIBOR + 0.600%
06/08/2028 | 1.819% | | 665,000 | 624,957 |
| Barclays Bank PLC(a) |
USD Swap Semi 30/360 Rate + 6.705%
12/31/2049 | 8.250% | | 4,125,000 | 4,369,221 |
| Barclays PLC |
| 08/10/2021 | 3.200% | | 2,030,000 | 2,072,920 |
| 01/10/2023 | 3.684% | | 2,580,000 | 2,652,712 |
| 01/10/2028 | 4.337% | | 870,000 | 906,865 |
| Subordinated |
| 05/12/2026 | 5.200% | | 3,130,000 | 3,339,694 |
| BB&T Corp. |
| 02/01/2019 | 2.250% | | 1,600,000 | 1,612,072 |
| BBVA Bancomer SA(b) |
| Junior Subordinated |
| 04/22/2020 | 7.250% | | 200,000 | 218,730 |
| Bear Stearns Companies LLC (The) |
| 02/01/2018 | 7.250% | | 7,365,000 | 7,531,037 |
| BNP Paribas SA(b) |
| Subordinated |
| 03/13/2027 | 4.625% | | 395,000 | 420,393 |
| BNZ International Funding Ltd.(b) |
| 02/21/2020 | 2.400% | | 3,860,000 | 3,889,012 |
| Capital One Bank NA |
| 07/23/2021 | 2.950% | | 1,050,000 | 1,068,149 |
| Capital One Financial Corp. |
| 11/21/2018 | 2.150% | | 1,150,000 | 1,154,043 |
| 05/12/2020 | 2.500% | | 10,640,000 | 10,734,622 |
| Capital One NA |
| 08/17/2018 | 2.350% | | 2,610,000 | 2,622,486 |
| 01/31/2020 | 2.350% | | 3,225,000 | 3,238,171 |
| Citigroup, Inc.(a) |
3-month USD LIBOR + 1.700%
05/15/2018 | 2.882% | | 2,275,000 | 2,297,789 |
| Citigroup, Inc. |
| 09/26/2018 | 2.500% | | 6,921,000 | 6,969,959 |
| 12/07/2018 | 2.050% | | 8,000,000 | 8,025,648 |
| 08/09/2020 | 5.375% | | 10,000,000 | 10,914,290 |
| 04/25/2022 | 2.750% | | 3,530,000 | 3,556,567 |
| 05/01/2026 | 3.400% | | 6,400,000 | 6,440,390 |
| Subordinated |
| 06/10/2025 | 4.400% | | 4,250,000 | 4,492,794 |
| 08/25/2036 | 6.125% | | 981,000 | 1,221,474 |
| 05/18/2046 | 4.750% | | 2,910,000 | 3,126,949 |
| Corporate Bonds & Notes (continued) |
| Issuer | Coupon
Rate | | Principal
Amount ($) | Value ($) |
| Citigroup, Inc.(a),(h) |
| Junior Subordinated |
| 12/31/2049 | 5.800% | | 14,240,000 | 14,801,939 |
| 12/31/2049 | 5.950% | | 5,000,000 | 5,389,400 |
| Citizens Bank NA |
| 03/02/2020 | 2.250% | | 4,880,000 | 4,899,369 |
| Comerica, Inc. |
| 05/23/2019 | 2.125% | | 645,000 | 646,137 |
| Subordinated |
| 07/22/2026 | 3.800% | | 900,000 | 923,130 |
| Compass Bank |
| 09/29/2019 | 2.750% | | 1,400,000 | 1,414,930 |
| Credit Suisse Group Funding Guernsey Ltd. |
| 12/10/2020 | 3.125% | | 1,910,000 | 1,954,612 |
| 06/09/2023 | 3.800% | | 4,890,000 | 5,099,830 |
| Danske Bank A/S(b) |
| 03/02/2020 | 2.200% | | 7,000,000 | 7,034,223 |
| Deutsche Bank AG |
| 07/13/2020 | 2.700% | | 6,470,000 | 6,515,756 |
| 05/12/2021 | 3.375% | | 1,988,000 | 2,034,537 |
| Discover Bank |
| 02/21/2018 | 2.000% | | 680,000 | 681,171 |
| 08/08/2023 | 4.200% | | 4,000,000 | 4,268,084 |
| Discover Financial Services |
| 04/27/2022 | 5.200% | | 2,697,000 | 2,951,999 |
| 11/21/2022 | 3.850% | | 3,653,000 | 3,798,842 |
| Fifth Third Bancorp |
| 03/01/2019 | 2.300% | | 310,000 | 312,185 |
| 07/27/2020 | 2.875% | | 1,570,000 | 1,605,400 |
| Fifth Third Bancorp(a),(h) |
| Junior Subordinated |
| 12/31/2049 | 5.100% | | 1,759,000 | 1,783,186 |
| First Maryland Capital I(a) |
| Junior Subordinated |
3-month USD LIBOR + 1.000%
01/15/2027 | 2.304% | | 861,000 | 811,054 |
| Goldman Sachs Group, Inc. (The) |
| 01/18/2018 | 5.950% | | 4,000,000 | 4,062,080 |
| 04/01/2018 | 6.150% | | 9,782,000 | 10,024,427 |
| 07/19/2018 | 2.900% | | 2,200,000 | 2,219,822 |
| 02/15/2019 | 7.500% | | 10,635,000 | 11,477,590 |
| 09/15/2020 | 2.750% | | 6,670,000 | 6,782,003 |
| 01/24/2022 | 5.750% | | 3,800,000 | 4,288,661 |
| 07/08/2024 | 3.850% | | 3,605,000 | 3,779,316 |
| 01/23/2025 | 3.500% | | 4,375,000 | 4,457,963 |
| 01/26/2027 | 3.850% | | 5,640,000 | 5,807,305 |
| 10/21/2045 | 4.750% | | 1,700,000 | 1,896,058 |
| Subordinated |
| 10/21/2025 | 4.250% | | 2,300,000 | 2,407,980 |
| 05/22/2045 | 5.150% | | 2,100,000 | 2,389,359 |
The accompanying Notes to Financial Statements are an integral part of this statement.
| 24 | Multi-Manager Total Return Bond Strategies Fund | Annual Report 2017 |
Portfolio of Investments (continued)
August 31, 2017
| Corporate Bonds & Notes (continued) |
| Issuer | Coupon
Rate | | Principal
Amount ($) | Value ($) |
| Goldman Sachs Group, Inc. (The)(a),(h) |
| Junior Subordinated |
| 12/31/2049 | 5.700% | | 5,000,000 | 5,172,875 |
| Grupo Aval Ltd.(b) |
| 09/26/2022 | 4.750% | | 200,000 | 205,379 |
| HBOS PLC(b) |
| Subordinated |
| 05/21/2018 | 6.750% | | 5,927,000 | 6,116,777 |
| HSBC Holdings PLC(a),(h) |
| Junior Subordinated |
| 12/31/2049 | 6.000% | | 7,220,000 | 7,588,682 |
| 12/31/2049 | 6.375% | | 3,170,000 | 3,369,938 |
| 12/31/2049 | 6.375% | | 1,585,000 | 1,698,142 |
| HSBC USA, Inc. |
| 01/16/2018 | 1.625% | | 3,000,000 | 3,000,765 |
| 03/05/2020 | 2.350% | | 2,575,000 | 2,599,488 |
| Huntington Capital Trust I(a) |
| Junior Subordinated |
3-month USD LIBOR + 0.700%
02/01/2027 | 2.011% | | 1,765,000 | 1,593,066 |
| Huntington National Bank (The) |
| 04/01/2019 | 2.200% | | 1,500,000 | 1,507,065 |
| Intesa Sanpaolo SpA(b) |
| 07/14/2022 | 3.125% | | 4,800,000 | 4,811,280 |
| JPMorgan Chase & Co. |
| 01/15/2018 | 6.000% | | 11,000,000 | 11,172,315 |
| 03/01/2018 | 1.700% | | 8,380,000 | 8,384,073 |
| 04/23/2019 | 6.300% | | 5,000,000 | 5,359,100 |
| 10/15/2020 | 4.250% | | 2,000,000 | 2,130,006 |
| 01/24/2022 | 4.500% | | 1,000,000 | 1,086,870 |
| 07/15/2025 | 3.900% | | 10,300,000 | 10,919,710 |
| 10/01/2026 | 2.950% | | 1,180,000 | 1,161,545 |
| Subordinated |
| 05/01/2023 | 3.375% | | 1,000,000 | 1,026,213 |
| 09/10/2024 | 3.875% | | 5,440,000 | 5,692,857 |
| JPMorgan Chase & Co.(a),(h) |
| 03/01/2025 | 3.220% | | 8,030,000 | 8,170,292 |
| 02/01/2028 | 3.782% | | 2,540,000 | 2,631,216 |
| 05/01/2028 | 3.540% | | 4,500,000 | 4,582,692 |
| Junior Subordinated |
| 04/29/2049 | 7.900% | | 14,239,000 | 14,669,530 |
| 12/31/2049 | 5.300% | | 4,240,000 | 4,392,233 |
| 12/31/2049 | 6.100% | | 5,000,000 | 5,483,945 |
| JPMorgan Chase Bank NA |
| Subordinated |
| 10/01/2017 | 6.000% | | 2,605,000 | 2,614,364 |
| JPMorgan Chase Capital XXI(a) |
| Junior Subordinated |
3-month USD LIBOR + 0.950%
02/02/2037 | 2.261% | | 18,499,000 | 17,190,288 |
| Corporate Bonds & Notes (continued) |
| Issuer | Coupon
Rate | | Principal
Amount ($) | Value ($) |
| KeyBank NA |
| 08/22/2019 | 1.600% | | 4,835,000 | 4,811,782 |
| KeyCorp (a),(h) |
| Junior Subordinated |
| 12/31/2049 | 5.000% | | 6,463,000 | 6,696,159 |
| KeyCorp Capital I(a) |
| Junior Subordinated |
3-month USD LIBOR + 0.740%
07/01/2028 | 2.039% | | 8,592,000 | 8,001,764 |
| Lloyds Banking Group PLC |
| 01/11/2022 | 3.000% | | 6,975,000 | 7,054,731 |
| Subordinated |
| 12/10/2025 | 4.582% | | 26,095,000 | 27,538,210 |
| M&T Bank Corp. |
| 07/25/2019 | 2.250% | | 3,000,000 | 3,021,579 |
| M&T Bank Corp.(a),(h) |
| Junior Subordinated |
| 12/31/2049 | 5.125% | | 2,413,000 | 2,537,101 |
| MBNA Capital B(a) |
| Junior Subordinated |
3-month USD LIBOR + 0.800%
02/01/2027 | 2.111% | | 512,000 | 483,709 |
| Mellon Capital IV(a) |
| Junior Subordinated |
3-month USD LIBOR + 0.565%
06/29/2049 | 4.000% | | 239,000 | 216,750 |
| Merrill Lynch & Co., Inc. |
| 11/15/2018 | 6.875% | | 2,000,000 | 2,118,154 |
| Morgan Stanley |
| 12/28/2017 | 5.950% | | 2,000,000 | 2,027,466 |
| 04/01/2018 | 6.625% | | 5,000,000 | 5,139,220 |
| 05/13/2019 | 7.300% | | 6,000,000 | 6,528,780 |
| 07/23/2025 | 4.000% | | 280,000 | 295,154 |
| 07/24/2042 | 6.375% | | 4,300,000 | 5,819,044 |
| 01/22/2047 | 4.375% | | 235,000 | 248,485 |
| Subordinated |
| 11/24/2025 | 5.000% | | 4,950,000 | 5,448,153 |
| Morgan Stanley(a) |
3-month USD LIBOR + 0.800%
02/14/2020 | 1.982% | | 16,030,000 | 16,106,142 |
3-month USD LIBOR + 0.930%
07/22/2022 | 2.243% | | 4,050,000 | 4,055,646 |
| Morgan Stanley(a),(h) |
| 07/22/2038 | 3.971% | | 4,225,000 | 4,268,496 |
| Junior Subordinated |
| 12/31/2049 | 5.450% | | 5,000,000 | 5,140,440 |
| MUFG Union Bank NA |
| 09/26/2018 | 2.625% | | 1,925,000 | 1,941,901 |
| 05/06/2019 | 2.250% | | 825,000 | 828,451 |
The accompanying Notes to Financial Statements are an integral part of this statement.
Multi-Manager Total Return Bond Strategies Fund | Annual Report 2017
| 25 |
Portfolio of Investments (continued)
August 31, 2017
| Corporate Bonds & Notes (continued) |
| Issuer | Coupon
Rate | | Principal
Amount ($) | Value ($) |
| Northern Trust Corp.(a),(h) |
| Junior Subordinated |
| 05/08/2032 | 3.375% | | 2,005,000 | 2,030,476 |
| NTC Capital I(a) |
| Junior Subordinated |
3-month USD LIBOR + 0.520%
01/15/2027 | 1.824% | | 222,000 | 207,550 |
| NTC Capital II(a) |
| Junior Subordinated |
3-month USD LIBOR + 0.590%
04/15/2027 | 1.894% | | 166,000 | 154,499 |
| PNC Bank NA |
| 02/23/2018 | 1.500% | | 6,645,000 | 6,644,621 |
| 04/29/2021 | 2.150% | | 2,050,000 | 2,054,945 |
| 06/01/2025 | 3.250% | | 1,450,000 | 1,493,177 |
| Regions Financial Corp. |
| 08/14/2022 | 2.750% | | 4,840,000 | 4,871,639 |
| Royal Bank of Canada |
| 04/15/2019 | 1.625% | | 4,800,000 | 4,790,952 |
| 03/02/2020 | 2.125% | | 6,800,000 | 6,844,968 |
| Royal Bank of Scotland Group PLC(a) |
3-month USD LIBOR + 1.470%
05/15/2023 | 2.785% | | 24,333,000 | 24,448,509 |
| Santander Holdings USA, Inc.(b) |
| 03/28/2022 | 3.700% | | 6,940,000 | 7,081,736 |
| Santander Issuances SAU |
| Subordinated |
| 11/19/2025 | 5.179% | | 4,745,000 | 5,110,593 |
| Santander UK Group Holdings PLC |
| 08/05/2021 | 2.875% | | 3,425,000 | 3,452,921 |
| Santander UK Group Holdings PLC(b) |
| Subordinated |
| 09/15/2025 | 4.750% | | 5,972,000 | 6,237,097 |
| 09/15/2045 | 5.625% | | 2,628,000 | 3,035,182 |
| State Street Corp.(a),(h) |
| 05/15/2023 | 2.653% | | 3,870,000 | 3,914,548 |
| State Street Corp.(a) |
3-month USD LIBOR + 1.000%
06/15/2047 | 2.246% | | 5,735,000 | 5,238,607 |
| Sumitomo Mitsui Financial Group, Inc. |
| 07/12/2022 | 2.784% | | 3,445,000 | 3,479,402 |
| SunTrust Banks, Inc. |
| 05/01/2019 | 2.500% | | 1,770,000 | 1,788,298 |
| 01/31/2020 | 2.250% | | 5,980,000 | 6,022,021 |
| 03/03/2021 | 2.900% | | 920,000 | 940,490 |
| SunTrust Capital I(a) |
| Junior Subordinated |
3-month USD LIBOR + 0.670%
05/15/2027 | 1.990% | | 5,126,000 | 4,741,986 |
| Corporate Bonds & Notes (continued) |
| Issuer | Coupon
Rate | | Principal
Amount ($) | Value ($) |
| SunTrust Capital III(a) |
| Junior Subordinated |
3-month USD LIBOR + 0.650%
03/15/2028 | 1.896% | | 2,971,000 | 2,707,567 |
| Svenska Handelsbanken AB |
| 09/06/2019 | 1.500% | | 4,510,000 | 4,482,683 |
| 09/07/2021 | 1.875% | | 6,215,000 | 6,148,437 |
| Synchrony Financial |
| 07/23/2025 | 4.500% | | 2,135,000 | 2,243,003 |
| Synovus Financial Corp.(a),(h) |
| Subordinated |
| 12/15/2025 | 5.750% | | 5,055,000 | 5,401,753 |
| U.S. Bancorp(a),(h) |
| Junior Subordinated |
| 12/31/2049 | 5.300% | | 2,980,000 | 3,238,694 |
| U.S. Bancorp |
| Subordinated |
| 04/27/2026 | 3.100% | | 2,720,000 | 2,735,341 |
| UBS Group Funding AG(a),(b),(h) |
| 08/15/2023 | 2.859% | | 6,920,000 | 6,925,827 |
| UBS Group Funding Switzerland AG(b) |
| 03/23/2028 | 4.253% | | 2,790,000 | 2,963,990 |
| UniCredit SpA(b) |
| 04/12/2022 | 3.750% | | 3,430,000 | 3,518,607 |
| Wachovia Capital Trust II(a) |
| Junior Subordinated |
3-month USD LIBOR + 0.500%
01/15/2027 | 1.804% | | 2,019,000 | 1,891,367 |
| Wells Fargo & Co. |
| 07/22/2022 | 2.625% | | 4,820,000 | 4,849,590 |
| 09/09/2024 | 3.300% | | 5,590,000 | 5,738,264 |
| 10/23/2026 | 3.000% | | 10,280,000 | 10,163,836 |
| Wells Fargo & Co.(a),(h) |
| 05/22/2028 | 3.584% | | 7,000,000 | 7,155,057 |
| Junior Subordinated |
| 03/29/2049 | 7.980% | | 5,995,000 | 6,165,096 |
| Wells Fargo Bank NA |
| 12/06/2019 | 2.150% | | 5,060,000 | 5,100,374 |
| Westpac Banking Corp. |
| 08/19/2019 | 1.600% | | 3,220,000 | 3,204,615 |
| 06/28/2022 | 2.500% | | 2,830,000 | 2,845,166 |
| Total | 777,576,203 |
| Brokerage/Asset Managers/Exchanges 0.1% |
| E*TRADE Financial Corp. |
| 08/24/2022 | 2.950% | | 3,405,000 | 3,426,983 |
| Jefferies Group LLC |
| 07/15/2019 | 8.500% | | 2,800,000 | 3,107,502 |
| 01/20/2043 | 6.500% | | 600,000 | 685,585 |
The accompanying Notes to Financial Statements are an integral part of this statement.
| 26 | Multi-Manager Total Return Bond Strategies Fund | Annual Report 2017 |
Portfolio of Investments (continued)
August 31, 2017
| Corporate Bonds & Notes (continued) |
| Issuer | Coupon
Rate | | Principal
Amount ($) | Value ($) |
| Nasdaq, Inc. |
| 01/15/2020 | 5.550% | | 600,000 | 648,470 |
| NFP Corp.(b) |
| 07/15/2025 | 6.875% | | 123,000 | 125,028 |
| Stifel Financial Corp. |
| 12/01/2020 | 3.500% | | 980,000 | 1,005,209 |
| 07/18/2024 | 4.250% | | 750,000 | 775,777 |
| VFH Parent LLC/Orchestra Co-Issuer, Inc.(b) |
| 06/15/2022 | 6.750% | | 40,000 | 41,499 |
| Total | 9,816,053 |
| Building Materials 0.1% |
| Allegion PLC |
| 09/15/2023 | 5.875% | | 210,000 | 224,973 |
| American Builders & Contractors Supply Co., Inc.(b) |
| 12/15/2023 | 5.750% | | 286,000 | 302,148 |
| Beacon Roofing Supply, Inc. |
| 10/01/2023 | 6.375% | | 367,000 | 388,822 |
| CD&R Waterworks Merger Sub LLC(b) |
| 08/15/2025 | 6.125% | | 63,000 | 64,241 |
| Gibraltar Industries, Inc. |
| 02/01/2021 | 6.250% | | 56,000 | 57,649 |
| HD Supply, Inc.(b) |
| 04/15/2024 | 5.750% | | 219,000 | 234,955 |
| Standard Industries, Inc.(b) |
| 10/15/2025 | 6.000% | | 3,360,000 | 3,613,865 |
| US Concrete, Inc. |
| 06/01/2024 | 6.375% | | 166,000 | 178,993 |
| USG Corp.(b) |
| 03/01/2025 | 5.500% | | 150,000 | 158,835 |
| Total | 5,224,481 |
| Cable and Satellite 1.1% |
| Altice US Finance I Corp.(b) |
| 07/15/2023 | 5.375% | | 670,000 | 698,777 |
| 05/15/2026 | 5.500% | | 4,046,000 | 4,275,914 |
| Cablevision Systems Corp. |
| 04/15/2018 | 7.750% | | 3,500,000 | 3,610,936 |
| CCO Holdings LLC/Capital Corp. |
| 09/30/2022 | 5.250% | | 4,050,000 | 4,170,147 |
| 09/01/2023 | 5.750% | | 1,000,000 | 1,038,740 |
| CCO Holdings LLC/Capital Corp.(b) |
| 05/01/2025 | 5.375% | | 307,000 | 320,112 |
| 02/15/2026 | 5.750% | | 125,000 | 132,288 |
| 05/01/2027 | 5.125% | | 758,000 | 781,168 |
| 05/01/2027 | 5.875% | | 648,000 | 687,153 |
| Corporate Bonds & Notes (continued) |
| Issuer | Coupon
Rate | | Principal
Amount ($) | Value ($) |
| Cequel Communications Holdings I LLC/Capital Corp.(b) |
| 09/15/2020 | 6.375% | | 4,609,000 | 4,721,036 |
| 12/15/2021 | 5.125% | | 300,000 | 305,515 |
| 12/15/2021 | 5.125% | | 50,000 | 50,951 |
| 07/15/2025 | 7.750% | | 350,000 | 386,572 |
| Charter Communications Operating LLC/Capital |
| 07/23/2022 | 4.464% | | 2,840,000 | 3,004,121 |
| 10/23/2045 | 6.484% | | 5,125,000 | 5,903,190 |
| Charter Communications Operating LLC/Capital(b) |
| 02/15/2028 | 3.750% | | 807,000 | 788,072 |
| Comcast Corp. |
| 02/15/2025 | 3.375% | | 900,000 | 932,567 |
| 02/15/2028 | 3.150% | | 6,860,000 | 6,862,778 |
| Cox Communications, Inc.(b) |
| 08/15/2024 | 3.150% | | 4,810,000 | 4,799,851 |
| 08/15/2047 | 4.600% | | 2,775,000 | 2,814,150 |
| COX Communications, Inc.(b) |
| 12/15/2022 | 3.250% | | 500,000 | 507,449 |
| CSC Holdings LLC |
| 02/15/2019 | 8.625% | | 250,000 | 271,651 |
| CSC Holdings LLC(b) |
| 10/15/2025 | 6.625% | | 483,000 | 528,638 |
| 10/15/2025 | 10.875% | | 247,000 | 303,754 |
| 04/15/2027 | 5.500% | | 800,000 | 833,490 |
| DISH DBS Corp. |
| 05/01/2020 | 5.125% | | 1,400,000 | 1,476,307 |
| 06/01/2021 | 6.750% | | 750,000 | 825,263 |
| 07/15/2022 | 5.875% | | 300,000 | 324,287 |
| 07/01/2026 | 7.750% | | 3,681,000 | 4,327,100 |
| Intelsat Jackson Holdings SA(b) |
| 07/15/2025 | 9.750% | | 490,000 | 498,482 |
| NBCUniversal Enterprise Inc.(b) |
| Junior Subordinated |
| 12/31/2049 | 5.250% | | 3,667,000 | 3,901,450 |
| NBCUniversal Media LLC |
| 04/30/2020 | 5.150% | | 2,280,000 | 2,476,495 |
| 01/15/2023 | 2.875% | | 720,000 | 735,954 |
| Radiate HoldCo LLC/Finance, Inc.(b) |
| 02/15/2025 | 6.625% | | 90,000 | 89,173 |
| Sirius XM Radio, Inc.(b) |
| 04/15/2025 | 5.375% | | 282,000 | 297,936 |
| 07/15/2026 | 5.375% | | 18,000 | 18,893 |
| 08/01/2027 | 5.000% | | 153,000 | 157,154 |
| Time Warner Cable LLC |
| 05/01/2037 | 6.550% | | 2,015,000 | 2,327,242 |
| 09/01/2041 | 5.500% | | 3,255,000 | 3,344,822 |
| Time Warner Cable, Inc. |
| 02/01/2020 | 5.000% | | 1,500,000 | 1,591,806 |
| 09/01/2021 | 4.000% | | 1,500,000 | 1,561,557 |
The accompanying Notes to Financial Statements are an integral part of this statement.
Multi-Manager Total Return Bond Strategies Fund | Annual Report 2017
| 27 |
Portfolio of Investments (continued)
August 31, 2017
| Corporate Bonds & Notes (continued) |
| Issuer | Coupon
Rate | | Principal
Amount ($) | Value ($) |
| Time Warner Entertainment Co. LP |
| 07/15/2033 | 8.375% | | 1,820,000 | 2,444,921 |
| Unitymedia Hessen GmbH & Co. KG NRW(b) |
| 01/15/2025 | 5.000% | | 458,000 | 481,583 |
| UPCB Finance IV Ltd.(b) |
| 01/15/2025 | 5.375% | | 3,450,000 | 3,581,207 |
| Videotron Ltd. |
| 07/15/2022 | 5.000% | | 2,750,000 | 2,950,008 |
| Videotron Ltd.(b) |
| 04/15/2027 | 5.125% | | 122,000 | 125,689 |
| Virgin Media Finance PLC(b) |
| 01/15/2025 | 5.750% | | 226,000 | 233,032 |
| Virgin Media Secured Finance PLC(b) |
| 01/15/2026 | 5.250% | | 473,000 | 492,347 |
| Ziggo Bond Finance BV(b) |
| 01/15/2027 | 6.000% | | 1,800,000 | 1,840,997 |
| Ziggo Secured Finance BV(b) |
| 01/15/2027 | 5.500% | | 426,000 | 439,273 |
| Total | 85,271,998 |
| Chemicals 0.4% |
| Agrium, Inc. |
| 01/15/2045 | 5.250% | | 1,400,000 | 1,604,011 |
| Albemarle Corp. |
| 12/01/2024 | 4.150% | | 535,000 | 569,585 |
| 12/01/2044 | 5.450% | | 545,000 | 649,269 |
| Angus Chemical Co.(b) |
| 02/15/2023 | 8.750% | | 223,000 | 227,830 |
| Atotech USA, Inc.(b) |
| 02/01/2025 | 6.250% | | 291,000 | 297,912 |
| Axalta Coating Systems LLC(b) |
| 08/15/2024 | 4.875% | | 1,168,000 | 1,193,798 |
| Celanese U.S. Holdings LLC |
| 11/15/2022 | 4.625% | | 100,000 | 108,856 |
| CF Industries, Inc. |
| 03/15/2044 | 5.375% | | 1,350,000 | 1,229,245 |
| Chemours Co. (The) |
| 05/15/2023 | 6.625% | | 270,000 | 287,293 |
| 05/15/2027 | 5.375% | | 46,000 | 47,935 |
| Dow Chemical Co. (The) |
| 05/15/2019 | 8.550% | | 500,000 | 554,988 |
| 11/15/2041 | 5.250% | | 3,280,000 | 3,766,148 |
| Eastman Chemical Co. |
| 03/15/2025 | 3.800% | | 1,700,000 | 1,763,835 |
| 10/15/2044 | 4.650% | | 2,511,000 | 2,665,283 |
| Eco Services Operations LLC/Finance Corp.(b) |
| 11/01/2022 | 8.500% | | 212,000 | 222,423 |
| Corporate Bonds & Notes (continued) |
| Issuer | Coupon
Rate | | Principal
Amount ($) | Value ($) |
| Incitec Pivot Finance LLC(b) |
| 12/10/2019 | 6.000% | | 1,000,000 | 1,073,891 |
| INEOS Group Holdings SA(b) |
| 08/01/2024 | 5.625% | | 167,000 | 172,032 |
| Koppers, Inc.(b) |
| 02/15/2025 | 6.000% | | 196,000 | 207,951 |
| LYB International Finance BV |
| 03/15/2044 | 4.875% | | 460,000 | 499,157 |
| LyondellBasell Industries NV |
| 02/26/2055 | 4.625% | | 5,741,000 | 5,772,885 |
| Mosaic Co. (The) |
| 11/15/2043 | 5.625% | | 985,000 | 1,024,599 |
| PQ Corp.(b) |
| 11/15/2022 | 6.750% | | 323,000 | 349,521 |
| Sherwin-Williams Co. (The) |
| 06/01/2027 | 3.450% | | 755,000 | 766,120 |
| SPCM SA(b) |
| 09/15/2025 | 4.875% | | 95,000 | 97,681 |
| Venator Finance SARL/Materials LLC(b) |
| 07/15/2025 | 5.750% | | 28,000 | 28,633 |
| WR Grace & Co.(b) |
| 10/01/2021 | 5.125% | | 2,000,000 | 2,170,272 |
| Total | 27,351,153 |
| Construction Machinery 0.2% |
| Ashtead Capital, Inc.(b) |
| 08/15/2027 | 4.375% | | 200,000 | 204,038 |
| Caterpillar Financial Services Corp. |
| 10/01/2021 | 1.931% | | 6,180,000 | 6,135,195 |
| H&E Equipment Services, Inc.(b) |
| 09/01/2025 | 5.625% | | 55,000 | 56,777 |
| Ritchie Bros. Auctioneers, Inc.(b) |
| 01/15/2025 | 5.375% | | 167,000 | 172,883 |
| United Rentals North America, Inc. |
| 07/15/2023 | 4.625% | | 175,000 | 182,965 |
| 07/15/2025 | 5.500% | | 5,300,000 | 5,669,898 |
| 09/15/2026 | 5.875% | | 215,000 | 234,267 |
| 05/15/2027 | 5.500% | | 278,000 | 294,671 |
| 01/15/2028 | 4.875% | | 41,000 | 41,355 |
| Total | 12,992,049 |
| Consumer Cyclical Services 0.4% |
| Alibaba Group Holding Ltd. |
| 11/28/2019 | 2.500% | | 6,130,000 | 6,191,521 |
The accompanying Notes to Financial Statements are an integral part of this statement.
| 28 | Multi-Manager Total Return Bond Strategies Fund | Annual Report 2017 |
Portfolio of Investments (continued)
August 31, 2017
| Corporate Bonds & Notes (continued) |
| Issuer | Coupon
Rate | | Principal
Amount ($) | Value ($) |
| Amazon.com, Inc.(b) |
| 02/22/2023 | 2.400% | | 4,825,000 | 4,849,332 |
| 08/22/2024 | 2.800% | | 2,000,000 | 2,029,320 |
| 08/22/2027 | 3.150% | | 2,875,000 | 2,926,632 |
| 08/22/2037 | 3.875% | | 4,640,000 | 4,784,666 |
| APX Group, Inc. |
| 12/01/2020 | 8.750% | | 129,000 | 132,760 |
| 12/01/2022 | 7.875% | | 371,000 | 403,051 |
| APX Group, Inc.(b) |
| 09/01/2023 | 7.625% | | 247,000 | 250,308 |
| Interval Acquisition Corp. |
| 04/15/2023 | 5.625% | | 197,000 | 203,591 |
| Priceline Group, Inc. (The) |
| 03/15/2023 | 2.750% | | 2,140,000 | 2,151,740 |
| Western Union Co. (The)(a) |
3-month USD LIBOR + 0.800%
05/22/2019 | 2.115% | | 5,000,000 | 5,000,230 |
| Western Union Co. (The) |
| 03/15/2022 | 3.600% | | 4,640,000 | 4,739,913 |
| Total | 33,663,064 |
| Consumer Products 0.2% |
| Central Garden & Pet Co. |
| 11/15/2023 | 6.125% | | 900,000 | 961,240 |
| Church & Dwight Co., Inc. |
| 08/01/2022 | 2.450% | | 740,000 | 741,148 |
| First Quality Finance Co., Inc.(b) |
| 07/01/2025 | 5.000% | | 690,000 | 702,514 |
| Newell, Inc. |
| 04/01/2026 | 4.200% | | 4,150,000 | 4,425,178 |
| Prestige Brands, Inc.(b) |
| 03/01/2024 | 6.375% | | 328,000 | 351,106 |
| Procter & Gamble Co. (The) |
| 08/11/2027 | 2.850% | | 6,910,000 | 7,007,459 |
| Scotts Miracle-Gro Co. (The) |
| 10/15/2023 | 6.000% | | 52,000 | 55,830 |
| 12/15/2026 | 5.250% | | 235,000 | 247,168 |
| Spectrum Brands, Inc. |
| 12/15/2024 | 6.125% | | 175,000 | 187,449 |
| 07/15/2025 | 5.750% | | 277,000 | 295,032 |
| Springs Industries, Inc. |
| 06/01/2021 | 6.250% | | 3,074,000 | 3,168,993 |
| Tempur Sealy International, Inc. |
| 10/15/2023 | 5.625% | | 79,000 | 82,302 |
| Valvoline, Inc.(b) |
| 08/15/2025 | 4.375% | | 1,022,000 | 1,032,850 |
| Total | 19,258,269 |
| Corporate Bonds & Notes (continued) |
| Issuer | Coupon
Rate | | Principal
Amount ($) | Value ($) |
| Diversified Manufacturing 0.7% |
| EnerSys (b) |
| 04/30/2023 | 5.000% | | 200,000 | 205,883 |
| Fortive Corp. |
| 06/15/2026 | 3.150% | | 1,125,000 | 1,136,793 |
| General Electric Co. |
| 01/08/2020 | 5.500% | | 1,432,000 | 1,554,645 |
| 10/17/2021 | 4.650% | | 487,000 | 537,265 |
| 09/07/2022 | 3.150% | | 337,000 | 352,200 |
| 01/09/2023 | 3.100% | | 1,146,000 | 1,198,484 |
| 01/14/2038 | 5.875% | | 1,196,000 | 1,560,513 |
| General Electric Co.(a) |
3-month USD LIBOR + 0.480%
08/15/2036 | 1.662% | | 5,380,000 | 4,811,372 |
| General Electric Co.(a),(h) |
| Junior Subordinated |
| 12/31/2049 | 5.000% | | 26,611,000 | 28,078,597 |
| Johnson Controls International PLC |
| 07/02/2064 | 4.950% | | 1,530,000 | 1,661,597 |
| Siemens Financieringsmaatschappij NV(b) |
| 09/15/2023 | 2.000% | | 2,645,000 | 2,574,667 |
| 10/15/2026 | 2.350% | | 700,000 | 667,769 |
| SPX FLOW, Inc.(b) |
| 08/15/2024 | 5.625% | | 98,000 | 101,904 |
| United Technologies Corp. |
| 05/04/2024 | 2.800% | | 5,525,000 | 5,562,769 |
| Valmont Industries, Inc. |
| 10/01/2054 | 5.250% | | 2,050,000 | 2,018,186 |
| Zekelman Industries, Inc.(b) |
| 06/15/2023 | 9.875% | | 129,000 | 144,725 |
| Total | 52,167,369 |
| Electric 2.6% |
| AEP Texas Central Co.(b) |
| 10/01/2025 | 3.850% | | 880,000 | 927,670 |
| AEP Texas Central Co. |
| 02/15/2033 | 6.650% | | 1,730,000 | 2,211,705 |
| AES Corp. |
| 09/01/2027 | 5.125% | | 158,000 | 160,629 |
| AES Gener SA(b) |
| 07/14/2025 | 5.000% | | 200,000 | 204,134 |
| Ameren Corp. |
| 02/15/2026 | 3.650% | | 590,000 | 613,406 |
| American Electric Power Co., Inc. |
| 12/15/2022 | 2.950% | | 750,000 | 769,949 |
| Berkshire Hathaway Energy Co. |
| 02/01/2025 | 3.500% | | 1,075,000 | 1,119,296 |
The accompanying Notes to Financial Statements are an integral part of this statement.
Multi-Manager Total Return Bond Strategies Fund | Annual Report 2017
| 29 |
Portfolio of Investments (continued)
August 31, 2017
| Corporate Bonds & Notes (continued) |
| Issuer | Coupon
Rate | | Principal
Amount ($) | Value ($) |
| Calpine Corp.(b) |
| 01/15/2024 | 5.875% | | 75,000 | 77,016 |
| Calpine Corp. |
| 01/15/2025 | 5.750% | | 5,708,000 | 5,251,971 |
| Cleveland Electric Illuminating Co. (The) |
| 12/15/2036 | 5.950% | | 1,839,000 | 2,293,788 |
| Commonwealth Edison Co. |
| 08/15/2047 | 3.750% | | 3,425,000 | 3,467,371 |
| Consolidated Edison Co. of New York, Inc. |
| 04/01/2018 | 5.850% | | 3,000,000 | 3,071,493 |
| 06/15/2046 | 3.850% | | 3,160,000 | 3,244,363 |
| 06/15/2047 | 3.875% | | 3,945,000 | 4,089,545 |
| Dominion Energy, Inc. |
| 08/15/2026 | 2.850% | | 750,000 | 728,945 |
| Dominion Energy, Inc.(a),(h) |
| Junior Subordinated |
| 07/01/2019 | 2.962% | | 845,000 | 858,631 |
| DPL, Inc. |
| 10/15/2021 | 7.250% | | 2,875,000 | 3,117,423 |
| DTE Energy Co. |
| 10/01/2026 | 2.850% | | 9,890,000 | 9,609,134 |
| Duke Energy Corp. |
| 09/01/2026 | 2.650% | | 4,710,000 | 4,554,782 |
| 08/15/2027 | 3.150% | | 2,735,000 | 2,745,666 |
| Duke Energy Progress LLC |
| 03/30/2044 | 4.375% | | 960,000 | 1,067,337 |
| 10/15/2046 | 3.700% | | 2,600,000 | 2,627,331 |
| Duke Energy Progress, Inc. |
| 08/15/2045 | 4.200% | | 1,780,000 | 1,946,902 |
| Duquesne Light Holdings, Inc.(b) |
| 09/15/2020 | 6.400% | | 5,000,000 | 5,591,895 |
| Dynegy, Inc. |
| 11/01/2022 | 7.375% | | 5,700,000 | 5,896,154 |
| 11/01/2024 | 7.625% | | 525,000 | 541,620 |
| Dynegy, Inc.(b) |
| 01/30/2026 | 8.125% | | 40,000 | 41,238 |
| E.ON International Finance BV(b) |
| 04/30/2038 | 6.650% | | 1,475,000 | 1,924,373 |
| EDP Finance BV(b) |
| 07/15/2024 | 3.625% | | 3,355,000 | 3,402,128 |
| Emera US Finance LP |
| 06/15/2026 | 3.550% | | 1,160,000 | 1,181,776 |
| Emera, Inc.(a),(h) |
| Subordinated |
| 06/15/2076 | 6.750% | | 7,235,000 | 8,262,862 |
| Enel Americas SA |
| 10/25/2026 | 4.000% | | 375,000 | 381,159 |
| Corporate Bonds & Notes (continued) |
| Issuer | Coupon
Rate | | Principal
Amount ($) | Value ($) |
| Enel Finance International NV(b) |
| 05/25/2047 | 4.750% | | 2,465,000 | 2,643,690 |
| Entergy Mississippi, Inc. |
| 07/01/2023 | 3.100% | | 2,000,000 | 2,065,406 |
| Exelon Corp. |
| 06/15/2025 | 3.950% | | 1,300,000 | 1,371,860 |
| 04/15/2046 | 4.450% | | 1,050,000 | 1,112,142 |
| Exelon Generation Co. LLC |
| 10/01/2041 | 5.750% | | 2,000,000 | 2,104,638 |
| FirstEnergy Transmission LLC(b) |
| 07/15/2044 | 5.450% | | 1,000,000 | 1,186,061 |
| Fortis, Inc. |
| 10/04/2021 | 2.100% | | 3,215,000 | 3,173,993 |
| Gulf Power Co. |
| 10/01/2044 | 4.550% | | 1,350,000 | 1,420,648 |
| IPALCO Enterprises, Inc. |
| 05/01/2018 | 5.000% | | 3,130,000 | 3,186,503 |
| ITC Holdings Corp. |
| 06/15/2024 | 3.650% | | 3,810,000 | 3,945,682 |
| Jersey Central Power & Light Co. |
| 06/15/2018 | 4.800% | | 2,000,000 | 2,036,186 |
| 06/01/2037 | 6.150% | | 665,000 | 799,514 |
| Jersey Central Power & Light Co.(b) |
| 04/01/2024 | 4.700% | | 2,000,000 | 2,193,456 |
| Kansas City Power & Light Co. |
| 08/15/2025 | 3.650% | | 665,000 | 679,506 |
| Metropolitan Edison Co. |
| 01/15/2019 | 7.700% | | 2,115,000 | 2,269,095 |
| MidAmerican Energy Co. |
| 05/01/2046 | 4.250% | | 3,433,000 | 3,753,162 |
| National Rural Utilities Cooperative Finance Corp. |
| 11/01/2018 | 10.375% | | 2,500,000 | 2,745,997 |
| 02/07/2024 | 2.950% | | 7,535,000 | 7,692,956 |
| National Rural Utilities Cooperative Finance Corp.(a),(h) |
| Subordinated |
| 04/20/2046 | 5.250% | | 1,750,000 | 1,874,115 |
| NextEra Energy Capital Holdings, Inc. |
| 09/01/2018 | 1.649% | | 6,440,000 | 6,436,039 |
| 06/15/2023 | 3.625% | | 3,000,000 | 3,132,846 |
| NextEra Energy Capital Holdings, Inc.(a),(h) |
| Junior Subordinated |
| 09/01/2067 | 4.664% | | 4,480,000 | 4,483,324 |
| NRG Energy, Inc. |
| 03/15/2023 | 6.625% | | 5,309,000 | 5,494,980 |
| 05/01/2024 | 6.250% | | 227,000 | 235,478 |
| 05/15/2026 | 7.250% | | 210,000 | 225,936 |
The accompanying Notes to Financial Statements are an integral part of this statement.
| 30 | Multi-Manager Total Return Bond Strategies Fund | Annual Report 2017 |
Portfolio of Investments (continued)
August 31, 2017
| Corporate Bonds & Notes (continued) |
| Issuer | Coupon
Rate | | Principal
Amount ($) | Value ($) |
| NRG Yield Operating LLC |
| 08/15/2024 | 5.375% | | 426,000 | 445,430 |
| 09/15/2026 | 5.000% | | 84,000 | 85,942 |
| Oncor Electric Delivery Co. LLC |
| 09/30/2040 | 5.250% | | 4,000,000 | 4,884,800 |
| Pacific Gas & Electric Co. |
| 03/01/2034 | 6.050% | | 235,000 | 306,295 |
| 12/01/2046 | 4.000% | | 3,340,000 | 3,519,041 |
| Pattern Energy Group, Inc.(b) |
| 02/01/2024 | 5.875% | | 284,000 | 297,198 |
| PPL Capital Funding, Inc. |
| 06/15/2022 | 4.200% | | 603,000 | 650,076 |
| 03/15/2024 | 3.950% | | 1,200,000 | 1,269,878 |
| PSEG Power LLC |
| 11/15/2018 | 2.450% | | 840,000 | 846,008 |
| Public Service Co. of Oklahoma |
| 02/01/2021 | 4.400% | | 3,500,000 | 3,722,523 |
| San Diego Gas & Electric Co. |
| 05/15/2026 | 2.500% | | 585,000 | 573,932 |
| Southern Co. (The) |
| 07/01/2026 | 3.250% | | 8,166,000 | 8,138,383 |
| 07/01/2036 | 4.250% | | 745,000 | 774,918 |
| Southwestern Electric Power Co. |
| 10/01/2026 | 2.750% | | 6,450,000 | 6,312,196 |
| Southwestern Public Service Co. |
| 08/15/2047 | 3.700% | | 3,420,000 | 3,463,533 |
| Toledo Edison Co. (The) |
| 05/15/2037 | 6.150% | | 1,706,000 | 2,153,608 |
| Tucson Electric Power Co. |
| 03/15/2023 | 3.850% | | 3,100,000 | 3,112,834 |
| Virginia Electric & Power Co. |
| 06/30/2019 | 5.000% | | 1,280,000 | 1,351,738 |
| WEC Energy Group, Inc. |
| 06/15/2025 | 3.550% | | 1,100,000 | 1,145,661 |
| Xcel Energy, Inc. |
| 06/01/2025 | 3.300% | | 2,535,000 | 2,600,383 |
| Total | 193,899,282 |
| Finance Companies 0.5% |
| Aircastle Ltd. |
| 02/15/2022 | 5.500% | | 5,414,000 | 5,899,885 |
| Ares Capital Corp. |
| 02/10/2023 | 3.500% | | 4,830,000 | 4,817,790 |
| CIT Group, Inc. |
| 08/01/2023 | 5.000% | | 325,000 | 353,287 |
| Corporate Bonds & Notes (continued) |
| Issuer | Coupon
Rate | | Principal
Amount ($) | Value ($) |
| GE Capital International Funding Co. Unlimited Co. |
| 11/15/2020 | 2.342% | | 5,522,000 | 5,584,034 |
| 11/15/2025 | 3.373% | | 2,980,000 | 3,106,853 |
| 11/15/2035 | 4.418% | | 5,630,000 | 6,137,815 |
| HSBC Finance Corp. |
| Subordinated |
| 01/15/2021 | 6.676% | | 6,916,000 | 7,863,153 |
| iStar, Inc. |
| 04/01/2022 | 6.000% | | 105,000 | 107,926 |
| Navient Corp. |
| 07/26/2021 | 6.625% | | 128,000 | 136,544 |
| 01/25/2022 | 7.250% | | 61,000 | 66,582 |
| 06/15/2022 | 6.500% | | 279,000 | 294,694 |
| 01/25/2023 | 5.500% | | 50,000 | 50,515 |
| 10/25/2024 | 5.875% | | 350,000 | 353,957 |
| OneMain Financial Holdings LLC(b) |
| 12/15/2021 | 7.250% | | 416,000 | 435,534 |
| Park Aerospace Holdings Ltd.(b) |
| 08/15/2022 | 5.250% | | 85,000 | 88,514 |
| Provident Funding Associates LP/Finance Corp.(b) |
| 06/15/2025 | 6.375% | | 93,000 | 96,496 |
| Quicken Loans, Inc.(b) |
| 05/01/2025 | 5.750% | | 302,000 | 315,655 |
| Total | 35,709,234 |
| Food and Beverage 0.7% |
| Acosta, Inc.(b) |
| 10/01/2022 | 7.750% | | 750,000 | 563,631 |
| Anheuser-Busch InBev Finance, Inc. |
| 02/01/2023 | 3.300% | | 8,745,000 | 9,083,475 |
| 02/01/2026 | 3.650% | | 4,990,000 | 5,193,282 |
| 02/01/2046 | 4.900% | | 7,970,000 | 9,055,602 |
| Aramark Services, Inc. |
| 06/01/2026 | 4.750% | | 562,000 | 588,733 |
| B&G Foods, Inc. |
| 04/01/2025 | 5.250% | | 84,000 | 86,165 |
| Central America Botling Corp.(b) |
| 01/31/2027 | 5.750% | | 1,600,000 | 1,691,982 |
| Chobani LLC/Finance Corp., Inc.(b) |
| 04/15/2025 | 7.500% | | 181,000 | 197,332 |
| Dr. Pepper Snapple Group, Inc.(b) |
| 06/15/2027 | 3.430% | | 1,460,000 | 1,491,136 |
| DS Services of America, Inc.(b) |
| 09/01/2021 | 10.000% | | 1,072,000 | 1,133,651 |
| FAGE International SA/USA Dairy Industry, Inc.(b) |
| 08/15/2026 | 5.625% | | 227,000 | 231,884 |
| JBS USA LUX SA/Finance, Inc.(b) |
| 06/15/2025 | 5.750% | | 100,000 | 100,723 |
The accompanying Notes to Financial Statements are an integral part of this statement.
Multi-Manager Total Return Bond Strategies Fund | Annual Report 2017
| 31 |
Portfolio of Investments (continued)
August 31, 2017
| Corporate Bonds & Notes (continued) |
| Issuer | Coupon
Rate | | Principal
Amount ($) | Value ($) |
| Kraft Heinz Foods Co.(a) |
3-month USD LIBOR + 0.570%
02/10/2021 | 1.879% | | 6,910,000 | 6,921,629 |
| Kraft Heinz Foods Co. |
| 07/15/2025 | 3.950% | | 4,000,000 | 4,140,848 |
| 06/01/2026 | 3.000% | | 5,840,000 | 5,632,744 |
| Lamb Weston Holdings, Inc.(b) |
| 11/01/2024 | 4.625% | | 899,000 | 930,088 |
| 11/01/2026 | 4.875% | | 201,000 | 208,519 |
| McCormick & Co., Inc. |
| 08/15/2022 | 2.700% | | 2,420,000 | 2,443,215 |
| 08/15/2047 | 4.200% | | 1,315,000 | 1,367,286 |
| Mead Johnson Nutrition Co. |
| 11/15/2025 | 4.125% | | 640,000 | 697,885 |
| PepsiCo, Inc. |
| 04/30/2025 | 2.750% | | 1,300,000 | 1,314,776 |
| Pinnacle Foods Finance LLC/Corp. |
| 01/15/2024 | 5.875% | | 25,000 | 26,660 |
| Post Holdings, Inc.(b) |
| 08/15/2026 | 5.000% | | 422,000 | 422,212 |
| 03/01/2027 | 5.750% | | 309,000 | 321,218 |
| Smithfield Foods, Inc.(b) |
| 02/01/2022 | 3.350% | | 1,110,000 | 1,125,538 |
| Tyson Foods, Inc.(a) |
3-month USD LIBOR + 0.450%
08/21/2020 | 1.765% | | 2,015,000 | 2,017,245 |
| Tyson Foods, Inc. |
| 08/15/2044 | 5.150% | | 200,000 | 229,023 |
| Total | 57,216,482 |
| Gaming 0.2% |
| Boyd Gaming Corp. |
| 05/15/2023 | 6.875% | | 439,000 | 472,613 |
| Churchill Downs, Inc. |
| 12/15/2021 | 5.375% | | 1,070,000 | 1,107,113 |
| Eldorado Resorts, Inc. |
| 04/01/2025 | 6.000% | | 66,000 | 69,933 |
| GLP Capital LP/Financing II, Inc. |
| 11/01/2023 | 5.375% | | 125,000 | 135,729 |
| 04/15/2026 | 5.375% | | 1,042,000 | 1,131,722 |
| International Game Technology PLC(b) |
| 02/15/2022 | 6.250% | | 364,000 | 401,237 |
| 02/15/2025 | 6.500% | | 54,000 | 60,562 |
| Jack Ohio Finance LLC/1 Corp.(b) |
| 11/15/2021 | 6.750% | | 165,000 | 171,956 |
| MGM Growth Properties Operating Partnership LP/Finance Co-Issuer, Inc. |
| 05/01/2024 | 5.625% | | 213,000 | 231,181 |
| 09/01/2026 | 4.500% | | 1,915,000 | 1,942,080 |
| Corporate Bonds & Notes (continued) |
| Issuer | Coupon
Rate | | Principal
Amount ($) | Value ($) |
| MGM Resorts International |
| 03/15/2023 | 6.000% | | 4,228,000 | 4,669,023 |
| 09/01/2026 | 4.625% | | 397,000 | 404,284 |
| Penn National Gaming, Inc.(b) |
| 01/15/2027 | 5.625% | | 128,000 | 132,960 |
| Pinnacle Entertainment, Inc. |
| 05/01/2024 | 5.625% | | 3,075,000 | 3,161,260 |
| Rivers Pittsburgh Borrower LP/Finance Corp.(b) |
| 08/15/2021 | 6.125% | | 101,000 | 102,464 |
| Scientific Games International, Inc.(b) |
| 01/01/2022 | 7.000% | | 271,000 | 288,931 |
| Scientific Games International, Inc. |
| 12/01/2022 | 10.000% | | 262,000 | 290,657 |
| Studio City Co., Ltd.(b) |
| 11/30/2021 | 7.250% | | 600,000 | 644,753 |
| Tunica-Biloxi Gaming Authority(b),(i) |
| 11/15/2016 | 0.000% | | 99,000 | 37,620 |
| Wynn Las Vegas LLC/Capital Corp.(b) |
| 05/15/2027 | 5.250% | | 90,000 | 90,830 |
| Total | 15,546,908 |
| Health Care 1.2% |
| Abbott Laboratories |
| 11/30/2021 | 2.900% | | 3,450,000 | 3,509,530 |
| Acadia Healthcare Co., Inc. |
| 03/01/2024 | 6.500% | | 322,000 | 346,760 |
| Amsurg Corp. |
| 07/15/2022 | 5.625% | | 282,000 | 294,884 |
| Barnabas Health, Inc. |
| 07/01/2028 | 4.000% | | 4,000,000 | 3,952,560 |
| Baxter International, Inc. |
| 08/15/2026 | 2.600% | | 2,385,000 | 2,311,978 |
| Becton Dickinson and Co.(a) |
3-month USD LIBOR + 1.030%
06/06/2022 | 2.253% | | 3,933,000 | 3,949,070 |
| Becton Dickinson and Co. |
| 12/15/2024 | 3.734% | | 158,000 | 163,260 |
| 05/15/2044 | 4.875% | | 1,945,000 | 2,044,757 |
| 12/15/2044 | 4.685% | | 320,000 | 336,473 |
| Change Healthcare Holdings LLC/Finance, Inc.(b) |
| 03/01/2025 | 5.750% | | 168,000 | 172,817 |
| CHS/Community Health Systems, Inc. |
| 07/15/2020 | 7.125% | | 4,300,000 | 4,048,648 |
| 08/01/2021 | 5.125% | | 225,000 | 225,027 |
| 02/01/2022 | 6.875% | | 1,015,000 | 842,242 |
| 03/31/2023 | 6.250% | | 338,000 | 340,851 |
The accompanying Notes to Financial Statements are an integral part of this statement.
| 32 | Multi-Manager Total Return Bond Strategies Fund | Annual Report 2017 |
Portfolio of Investments (continued)
August 31, 2017
| Corporate Bonds & Notes (continued) |
| Issuer | Coupon
Rate | | Principal
Amount ($) | Value ($) |
| DaVita, Inc. |
| 08/15/2022 | 5.750% | | 150,000 | 154,850 |
| 07/15/2024 | 5.125% | | 725,000 | 738,918 |
| 05/01/2025 | 5.000% | | 417,000 | 423,113 |
| Duke University Health System, Inc. |
| 06/01/2047 | 3.920% | | 875,000 | 914,365 |
| Express Scripts Holding Co. |
| 06/15/2024 | 3.500% | | 3,160,000 | 3,241,797 |
| 03/01/2027 | 3.400% | | 2,190,000 | 2,179,262 |
| 07/15/2046 | 4.800% | | 3,934,000 | 4,137,038 |
| Fresenius Medical Care U.S. Finance II, Inc.(b) |
| 07/31/2019 | 5.625% | | 3,000,000 | 3,186,990 |
| HCA, Inc. |
| 02/15/2020 | 6.500% | | 2,700,000 | 2,938,804 |
| 02/15/2022 | 7.500% | | 225,000 | 259,545 |
| 02/01/2025 | 5.375% | | 5,175,000 | 5,461,152 |
| 04/15/2025 | 5.250% | | 1,088,000 | 1,173,146 |
| Hill-Rom Holdings, Inc.(b) |
| 02/15/2025 | 5.000% | | 165,000 | 168,732 |
| Kaiser Foundation Hospitals |
| 05/01/2047 | 4.150% | | 2,000,000 | 2,160,140 |
| Laboratory Corp. of America Holdings |
| 09/01/2024 | 3.250% | | 3,455,000 | 3,496,622 |
| Mayo Clinic |
| 11/15/2052 | 4.128% | | 750,000 | 796,382 |
| MEDNAX, Inc.(b) |
| 12/01/2023 | 5.250% | | 193,000 | 200,843 |
| Memorial Sloan-Kettering Cancer Center |
| 07/01/2052 | 4.125% | | 4,630,000 | 4,841,781 |
| MPH Acquisition Holdings LLC(b) |
| 06/01/2024 | 7.125% | | 320,000 | 344,103 |
| New York and Presbyterian Hospital (The) |
| 08/01/2116 | 4.763% | | 1,050,000 | 1,103,327 |
| Northwell Healthcare, Inc. |
| 11/01/2042 | 4.800% | | 6,365,000 | 6,976,065 |
| NYU Hospitals Center |
| 07/01/2042 | 4.428% | | 4,000,000 | 4,290,940 |
| 07/01/2043 | 5.750% | | 705,000 | 902,080 |
| PAREXEL International Corp.(b) |
| 09/01/2025 | 6.375% | | 49,000 | 48,981 |
| Quest Diagnostics, Inc. |
| 06/01/2026 | 3.450% | | 3,255,000 | 3,333,930 |
| Quintiles IMS, Inc.(b) |
| 05/15/2023 | 4.875% | | 530,000 | 551,045 |
| 10/15/2026 | 5.000% | | 335,000 | 350,804 |
| SP Finco LLC(b) |
| 07/01/2025 | 6.750% | | 116,000 | 109,232 |
| Corporate Bonds & Notes (continued) |
| Issuer | Coupon
Rate | | Principal
Amount ($) | Value ($) |
| Sterigenics-Nordion Holdings LLC(b) |
| 05/15/2023 | 6.500% | | 281,000 | 290,259 |
| Sutter Health |
| 08/15/2053 | 2.286% | | 2,300,000 | 2,310,495 |
| Team Health Holdings, Inc.(b) |
| 02/01/2025 | 6.375% | | 146,000 | 140,848 |
| Tenet Healthcare Corp. |
| 02/01/2020 | 6.750% | | 2,800,000 | 2,922,413 |
| 04/01/2021 | 4.500% | | 715,000 | 729,790 |
| 10/01/2021 | 4.375% | | 25,000 | 25,439 |
| 04/01/2022 | 8.125% | | 629,000 | 660,163 |
| 06/15/2023 | 6.750% | | 375,000 | 372,726 |
| Tenet Healthcare Corp.(b) |
| 01/01/2022 | 7.500% | | 14,000 | 15,118 |
| 07/15/2024 | 4.625% | | 635,000 | 635,919 |
| 05/01/2025 | 5.125% | | 142,000 | 142,822 |
| 08/01/2025 | 7.000% | | 131,000 | 128,491 |
| Texas Health Resources |
| 11/15/2055 | 4.330% | | 700,000 | 760,360 |
| Thermo Fisher Scientific, Inc. |
| 08/15/2027 | 3.200% | | 4,835,000 | 4,837,659 |
| Zimmer Biomet Holdings, Inc. |
| 04/01/2025 | 3.550% | | 985,000 | 1,000,893 |
| Total | 91,996,239 |
| Healthcare Insurance 0.3% |
| Aetna, Inc. |
| 08/15/2047 | 3.875% | | 3,420,000 | 3,494,399 |
| Anthem, Inc. |
| 01/15/2043 | 4.650% | | 3,250,000 | 3,570,336 |
| Centene Corp. |
| 05/15/2022 | 4.750% | | 1,875,000 | 1,965,765 |
| 02/15/2024 | 6.125% | | 171,000 | 184,058 |
| 01/15/2025 | 4.750% | | 1,269,000 | 1,322,077 |
| Humana, Inc. |
| 03/15/2027 | 3.950% | | 625,000 | 662,448 |
| Molina Healthcare, Inc. |
| 11/15/2022 | 5.375% | | 232,000 | 242,583 |
| Molina Healthcare, Inc.(b) |
| 06/15/2025 | 4.875% | | 450,000 | 441,835 |
| UnitedHealth Group, Inc. |
| 11/15/2017 | 6.000% | | 2,383,000 | 2,403,072 |
| 07/15/2025 | 3.750% | | 1,295,000 | 1,378,561 |
| 07/15/2045 | 4.750% | | 2,460,000 | 2,866,072 |
| 04/15/2047 | 4.250% | | 3,920,000 | 4,256,124 |
| WellCare Health Plans, Inc. |
| 04/01/2025 | 5.250% | | 774,000 | 810,235 |
| Total | 23,597,565 |
The accompanying Notes to Financial Statements are an integral part of this statement.
Multi-Manager Total Return Bond Strategies Fund | Annual Report 2017
| 33 |
Portfolio of Investments (continued)
August 31, 2017
| Corporate Bonds & Notes (continued) |
| Issuer | Coupon
Rate | | Principal
Amount ($) | Value ($) |
| Healthcare REIT 0.4% |
| Alexandria Real Estate Equities, Inc. |
| 06/15/2023 | 3.900% | | 8,000,000 | 8,395,792 |
| HCP, Inc. |
| 11/15/2023 | 4.250% | | 4,896,000 | 5,241,785 |
| 08/15/2024 | 3.875% | | 782,000 | 814,416 |
| Healthcare Realty Trust, Inc. |
| 05/01/2025 | 3.875% | | 550,000 | 560,024 |
| Healthcare Trust of America Holdings LP |
| 07/15/2021 | 3.375% | | 3,455,000 | 3,560,581 |
| Omega Healthcare Investors, Inc. |
| 01/15/2028 | 4.750% | | 3,440,000 | 3,505,353 |
| Ventas Realty LP/Capital Corp. |
| 04/01/2020 | 2.700% | | 3,000,000 | 3,036,357 |
| Welltower, Inc. |
| 04/01/2019 | 4.125% | | 2,000,000 | 2,058,868 |
| Total | 27,173,176 |
| Home Construction 0.3% |
| CalAtlantic Group, Inc. |
| 11/15/2024 | 5.875% | | 270,000 | 293,095 |
| 06/01/2026 | 5.250% | | 2,323,000 | 2,397,645 |
| Lennar Corp. |
| 12/15/2017 | 4.750% | | 1,225,000 | 1,226,208 |
| 04/30/2024 | 4.500% | | 160,000 | 165,262 |
| Meritage Homes Corp. |
| 04/01/2022 | 7.000% | | 254,000 | 288,181 |
| PulteGroup, Inc. |
| 03/01/2026 | 5.500% | | 1,700,000 | 1,833,550 |
| 01/15/2027 | 5.000% | | 1,425,000 | 1,471,177 |
| Taylor Morrison Communities, Inc./Holdings II(b) |
| 04/15/2023 | 5.875% | | 121,000 | 128,334 |
| Toll Brothers Finance Corp. |
| 10/15/2017 | 8.910% | | 8,108,000 | 8,172,269 |
| William Lyon Homes, Inc. |
| 04/15/2019 | 5.750% | | 4,000,000 | 4,048,572 |
| Total | 20,024,293 |
| Independent Energy 0.5% |
| Afren PLC(b),(i) |
| 12/09/2020 | 0.000% | | 195,167 | 25 |
| Anadarko Petroleum Corp. |
| 07/15/2024 | 3.450% | | 2,100,000 | 2,084,437 |
| Antero Resources Corp. |
| 03/01/2025 | 5.000% | | 550,000 | 543,971 |
| Apache Corp. |
| 01/15/2023 | 2.625% | | 1,500,000 | 1,474,095 |
| Corporate Bonds & Notes (continued) |
| Issuer | Coupon
Rate | | Principal
Amount ($) | Value ($) |
| California Resources Corp. |
| 11/15/2024 | 6.000% | | 40,000 | 16,200 |
| Callon Petroleum Co. |
| 10/01/2024 | 6.125% | | 76,000 | 77,329 |
| 10/01/2024 | 6.125% | | 41,000 | 42,279 |
| Canadian Natural Resources Ltd. |
| 06/01/2027 | 3.850% | | 2,630,000 | 2,632,343 |
| 06/30/2033 | 6.450% | | 730,000 | 853,217 |
| 06/01/2047 | 4.950% | | 1,880,000 | 1,937,015 |
| Carrizo Oil & Gas, Inc. |
| 04/15/2023 | 6.250% | | 185,000 | 179,647 |
| Conoco Funding Co. |
| 10/15/2031 | 7.250% | | 2,000,000 | 2,715,892 |
| ConocoPhillips Co. |
| 03/15/2026 | 4.950% | | 8,525,000 | 9,583,993 |
| Continental Resources, Inc. |
| 04/15/2023 | 4.500% | | 405,000 | 401,417 |
| 06/01/2024 | 3.800% | | 1,672,000 | 1,560,394 |
| CrownRock LP/Finance, Inc.(b) |
| 02/15/2023 | 7.750% | | 398,000 | 420,902 |
| Devon Energy Corp. |
| 07/15/2041 | 5.600% | | 2,500,000 | 2,657,752 |
| 06/15/2045 | 5.000% | | 1,125,000 | 1,141,672 |
| Diamondback Energy, Inc. |
| 11/01/2024 | 4.750% | | 639,000 | 641,584 |
| 05/31/2025 | 5.375% | | 416,000 | 428,029 |
| EOG Resources, Inc. |
| 03/15/2023 | 2.625% | | 1,195,000 | 1,197,639 |
| Extraction Oil & Gas, Inc.(b) |
| 05/15/2024 | 7.375% | | 99,000 | 99,495 |
| Extraction Oil & Gas, Inc./Finance Corp.(b) |
| 07/15/2021 | 7.875% | | 123,000 | 126,909 |
| Gulfport Energy Corp.(b) |
| 05/15/2025 | 6.375% | | 175,000 | 172,226 |
| Halcon Resources Corp.(b) |
| 02/15/2025 | 6.750% | | 70,000 | 70,440 |
| Hess Corp. |
| 03/15/2033 | 7.125% | | 1,161,000 | 1,310,048 |
| 02/15/2041 | 5.600% | | 753,000 | 734,007 |
| 04/01/2047 | 5.800% | | 1,521,000 | 1,518,434 |
| Laredo Petroleum, Inc. |
| 03/15/2023 | 6.250% | | 421,000 | 430,304 |
| Noble Energy, Inc. |
| 11/15/2024 | 3.900% | | 1,000,000 | 1,026,613 |
| Occidental Petroleum Corp. |
| 02/15/2027 | 3.000% | | 705,000 | 699,670 |
The accompanying Notes to Financial Statements are an integral part of this statement.
| 34 | Multi-Manager Total Return Bond Strategies Fund | Annual Report 2017 |
Portfolio of Investments (continued)
August 31, 2017
| Corporate Bonds & Notes (continued) |
| Issuer | Coupon
Rate | | Principal
Amount ($) | Value ($) |
| Parsley Energy LLC/Finance Corp.(b) |
| 01/15/2025 | 5.375% | | 233,000 | 233,910 |
| 08/15/2025 | 5.250% | | 328,000 | 328,128 |
| PDC Energy, Inc.(b) |
| 09/15/2024 | 6.125% | | 262,000 | 268,754 |
| QEP Resources, Inc. |
| 10/01/2022 | 5.375% | | 187,000 | 181,690 |
| 05/01/2023 | 5.250% | | 188,000 | 179,628 |
| Range Resources Corp. |
| 05/15/2025 | 4.875% | | 350,000 | 335,012 |
| Rice Energy, Inc. |
| 05/01/2022 | 6.250% | | 325,000 | 338,189 |
| 05/01/2023 | 7.250% | | 50,000 | 53,248 |
| RSP Permian, Inc. |
| 10/01/2022 | 6.625% | | 225,000 | 234,120 |
| RSP Permian, Inc.(b) |
| 01/15/2025 | 5.250% | | 571,000 | 573,440 |
| SM Energy Co. |
| 09/15/2026 | 6.750% | | 344,000 | 324,697 |
| WPX Energy, Inc. |
| 01/15/2022 | 6.000% | | 429,000 | 441,301 |
| 09/15/2024 | 5.250% | | 78,000 | 76,645 |
| Total | 40,346,740 |
| Integrated Energy 0.4% |
| BP Capital Markets PLC |
| 05/03/2019 | 1.676% | | 2,905,000 | 2,905,279 |
| 05/06/2022 | 3.245% | | 1,875,000 | 1,951,251 |
| 05/10/2023 | 2.750% | | 1,500,000 | 1,510,003 |
| Cenovus Energy, Inc.(b) |
| 04/15/2027 | 4.250% | | 5,400,000 | 5,226,563 |
| 06/15/2047 | 5.400% | | 1,335,000 | 1,262,939 |
| Cenovus Energy, Inc. |
| 11/15/2039 | 6.750% | | 8,330,000 | 8,996,933 |
| Chevron Corp. |
| 06/24/2023 | 3.191% | | 700,000 | 731,757 |
| 05/16/2026 | 2.954% | | 2,490,000 | 2,515,699 |
| Husky Energy, Inc. |
| 04/15/2022 | 3.950% | | 3,000,000 | 3,148,263 |
| Total | 28,248,687 |
| Leisure 0.1% |
| Cedar Fair LP/Canada’s Wonderland Co./Magnum Management Corp./Millenium Operations LLC(b) |
| 04/15/2027 | 5.375% | | 124,000 | 130,227 |
| Cinemark USA, Inc. |
| 06/01/2023 | 4.875% | | 3,500,000 | 3,497,480 |
| Live Nation Entertainment, Inc.(b) |
| 11/01/2024 | 4.875% | | 85,000 | 86,732 |
| Corporate Bonds & Notes (continued) |
| Issuer | Coupon
Rate | | Principal
Amount ($) | Value ($) |
| LTF Merger Sub, Inc.(b) |
| 06/15/2023 | 8.500% | | 77,000 | 81,748 |
| Viking Cruises Ltd.(b) |
| 10/15/2022 | 8.500% | | 1,600,000 | 1,672,117 |
| Total | 5,468,304 |
| Life Insurance 1.1% |
| AIG Global Funding(b) |
| 07/02/2020 | 2.150% | | 590,000 | 591,618 |
| American International Group, Inc. |
| 02/15/2024 | 4.125% | | 1,600,000 | 1,712,984 |
| Athene Global Funding(b) |
| 04/20/2020 | 2.750% | | 4,465,000 | 4,511,516 |
| Brighthouse Financial, Inc.(b) |
| 06/22/2027 | 3.700% | | 2,775,000 | 2,745,982 |
| 06/22/2047 | 4.700% | | 7,805,000 | 7,672,393 |
| Genworth Holdings, Inc. |
| 05/22/2018 | 6.515% | | 2,105,000 | 2,132,312 |
| Guardian Life Global Funding(b) |
| 04/26/2021 | 2.000% | | 4,600,000 | 4,562,754 |
| Guardian Life Insurance Co. of America (The)(b) |
| Subordinated |
| 06/19/2064 | 4.875% | | 1,530,000 | 1,716,250 |
| Jackson National Life Global Funding(b) |
| 01/30/2020 | 2.200% | | 6,085,000 | 6,111,044 |
| Lincoln National Corp. |
| 06/15/2040 | 7.000% | | 930,000 | 1,263,234 |
| Massachusetts Mutual Life Insurance Co.(b) |
| Subordinated |
| 04/15/2065 | 4.500% | | 955,000 | 998,662 |
| MetLife Global Funding I(b) |
| 09/13/2019 | 1.550% | | 6,440,000 | 6,403,002 |
| MetLife, Inc. |
| 08/15/2018 | 6.817% | | 3,000,000 | 3,144,243 |
| MetLife, Inc.(a),(b),(h) |
| Junior Subordinated |
| 04/08/2068 | 9.250% | | 4,237,000 | 6,294,695 |
| Northwestern Mutual Life Insurance Co. (The)(b) |
| Subordinated |
| 03/30/2040 | 6.063% | | 1,250,000 | 1,642,690 |
| Nuveen Finance LLC(b) |
| 11/01/2024 | 4.125% | | 1,050,000 | 1,114,960 |
| Peachtree Corners Funding Trust(b) |
| 02/15/2025 | 3.976% | | 2,150,000 | 2,215,270 |
| Pricoa Global Funding I(b) |
| 05/16/2019 | 2.200% | | 4,850,000 | 4,882,330 |
| 09/13/2019 | 1.450% | | 3,750,000 | 3,716,014 |
The accompanying Notes to Financial Statements are an integral part of this statement.
Multi-Manager Total Return Bond Strategies Fund | Annual Report 2017
| 35 |
Portfolio of Investments (continued)
August 31, 2017
| Corporate Bonds & Notes (continued) |
| Issuer | Coupon
Rate | | Principal
Amount ($) | Value ($) |
| Principal Financial Group, Inc. |
| 09/15/2022 | 3.300% | | 1,510,000 | 1,566,208 |
| 05/15/2023 | 3.125% | | 667,000 | 684,072 |
| Prudential Financial, Inc. |
| 12/01/2017 | 6.000% | | 42,000 | 42,451 |
| Teachers Insurance & Annuity Association of America(b) |
| Subordinated |
| 09/15/2044 | 4.900% | | 4,077,000 | 4,634,660 |
| 05/15/2047 | 4.270% | | 4,455,000 | 4,649,487 |
| Unum Group |
| 05/15/2021 | 3.000% | | 1,250,000 | 1,270,265 |
| Voya Financial, Inc. |
| 07/15/2024 | 3.125% | | 2,245,000 | 2,239,989 |
| 06/15/2026 | 3.650% | | 2,497,000 | 2,534,128 |
| 06/15/2046 | 4.800% | | 1,075,000 | 1,155,540 |
| Total | 82,208,753 |
| Lodging 0.1% |
| Hilton Domestic Operating Co., Inc. |
| 09/01/2024 | 4.250% | | 299,000 | 305,040 |
| Marriott International, Inc. |
| 06/15/2026 | 3.125% | | 4,235,000 | 4,239,989 |
| Playa Resorts Holding BV(b) |
| 08/15/2020 | 8.000% | | 209,000 | 218,058 |
| RHP Hotel Properties LP/Finance Corp. |
| 04/15/2023 | 5.000% | | 2,400,000 | 2,477,464 |
| Total | 7,240,551 |
| Media and Entertainment 0.5% |
| 21st Century Fox America, Inc. |
| 08/15/2020 | 5.650% | | 1,760,000 | 1,933,145 |
| 03/15/2033 | 6.550% | | 1,000,000 | 1,276,222 |
| 01/09/2038 | 6.750% | | 220,000 | 289,235 |
| Activision Blizzard, Inc. |
| 09/15/2021 | 2.300% | | 795,000 | 792,774 |
| AMC Networks, Inc. |
| 04/01/2024 | 5.000% | | 2,636,000 | 2,720,025 |
| Clear Channel Worldwide Holdings, Inc. |
| 11/15/2022 | 6.500% | | 625,000 | 645,550 |
| Electronic Arts, Inc. |
| 03/01/2021 | 3.700% | | 2,000,000 | 2,092,834 |
| Grupo Televisa SAB |
| 05/15/2018 | 6.000% | | 200,000 | 205,871 |
| 05/13/2045 | 5.000% | | 2,100,000 | 2,135,641 |
| Lamar Media Corp. |
| 02/01/2026 | 5.750% | | 50,000 | 53,858 |
| Lin Television Corp. |
| 11/15/2022 | 5.875% | | 300,000 | 309,965 |
| Corporate Bonds & Notes (continued) |
| Issuer | Coupon
Rate | | Principal
Amount ($) | Value ($) |
| Match Group, Inc. |
| 06/01/2024 | 6.375% | | 265,000 | 288,264 |
| MDC Partners, Inc.(b) |
| 05/01/2024 | 6.500% | | 164,000 | 163,780 |
| Netflix, Inc.(b) |
| 11/15/2026 | 4.375% | | 568,000 | 553,828 |
| Nielsen Finance Co. SARL (The)(b) |
| 10/01/2021 | 5.500% | | 75,000 | 77,341 |
| Nielsen Finance LLC/Co.(b) |
| 04/15/2022 | 5.000% | | 3,350,000 | 3,475,156 |
| Nielsen Luxembourg SARL(b) |
| 02/01/2025 | 5.000% | | 289,000 | 297,841 |
| Outfront Media Capital LLC/Corp. |
| 03/15/2025 | 5.875% | | 328,000 | 341,779 |
| Scripps Networks Interactive, Inc. |
| 06/15/2022 | 3.500% | | 3,739,000 | 3,821,692 |
| Sinclair Television Group, Inc. |
| 10/01/2022 | 6.125% | | 75,000 | 77,212 |
| Sinclair Television Group, Inc.(b) |
| 08/01/2024 | 5.625% | | 550,000 | 561,854 |
| TEGNA, Inc. |
| 10/15/2023 | 6.375% | | 325,000 | 345,995 |
| Time Warner, Inc. |
| 03/29/2021 | 4.750% | | 1,700,000 | 1,838,132 |
| 02/15/2027 | 3.800% | | 735,000 | 739,359 |
| 03/29/2041 | 6.250% | | 2,280,000 | 2,731,128 |
| Univision Communications, Inc.(b) |
| 02/15/2025 | 5.125% | | 116,000 | 116,426 |
| Viacom, Inc. |
| 09/01/2023 | 4.250% | | 2,410,000 | 2,491,506 |
| 04/30/2036 | 6.875% | | 3,800,000 | 4,287,343 |
| Total | 34,663,756 |
| Metals and Mining 0.3% |
| ArcelorMittal (a),(h) |
| 03/01/2041 | 7.250% | | 730,000 | 846,321 |
| Barrick Gold Corp. |
| 05/01/2023 | 4.100% | | 6,300,000 | 6,929,156 |
| Barrick North America Finance LLC |
| 05/30/2021 | 4.400% | | 925,000 | 1,000,285 |
| BHP Billiton Finance USA Ltd.(a),(b),(h) |
| Junior Subordinated |
| 10/19/2075 | 6.750% | | 3,415,000 | 3,977,126 |
| Big River Steel LLC/Finance Corp.(b) |
| 09/01/2025 | 7.250% | | 125,000 | 130,752 |
| Constellium NV(b) |
| 05/15/2024 | 5.750% | | 456,000 | 464,151 |
The accompanying Notes to Financial Statements are an integral part of this statement.
| 36 | Multi-Manager Total Return Bond Strategies Fund | Annual Report 2017 |
Portfolio of Investments (continued)
August 31, 2017
| Corporate Bonds & Notes (continued) |
| Issuer | Coupon
Rate | | Principal
Amount ($) | Value ($) |
| Freeport-McMoRan, Inc. |
| 11/14/2017 | 2.300% | | 1,500,000 | 1,499,001 |
| 03/15/2023 | 3.875% | | 543,000 | 536,614 |
| 11/14/2024 | 4.550% | | 216,000 | 215,830 |
| 11/14/2034 | 5.400% | | 300,000 | 288,955 |
| Gerdau Holdings, Inc.(b) |
| 01/20/2020 | 7.000% | | 150,000 | 161,547 |
| Grinding Media, Inc./Moly-Cop AltaSteel Ltd.(b) |
| 12/15/2023 | 7.375% | | 186,000 | 200,512 |
| HudBay Minerals, Inc.(b) |
| 01/15/2025 | 7.625% | | 243,000 | 267,530 |
| Novelis Corp.(b) |
| 09/30/2026 | 5.875% | | 419,000 | 435,375 |
| Southern Copper Corp. |
| 11/08/2022 | 3.500% | | 130,000 | 134,452 |
| 04/23/2025 | 3.875% | | 600,000 | 624,320 |
| 11/08/2042 | 5.250% | | 1,400,000 | 1,478,116 |
| 04/23/2045 | 5.875% | | 1,663,000 | 1,886,486 |
| Teck Resources Ltd. |
| 07/15/2041 | 6.250% | | 514,000 | 565,273 |
| Vale Overseas Ltd. |
| 01/11/2022 | 4.375% | | 113,000 | 119,189 |
| 08/10/2026 | 6.250% | | 416,000 | 473,247 |
| 11/10/2039 | 6.875% | | 80,000 | 91,502 |
| Vale SA |
| 09/11/2042 | 5.625% | | 50,000 | 51,005 |
| Volcan Cia Minera SAA(b) |
| 02/02/2022 | 5.375% | | 100,000 | 104,470 |
| Total | 22,481,215 |
| Midstream 1.4% |
| Andeavor Logistics LP/Tesoro Finance Corp. |
| 10/01/2020 | 5.875% | | 198,000 | 201,441 |
| 05/01/2024 | 6.375% | | 143,000 | 154,975 |
| 01/15/2025 | 5.250% | | 406,000 | 430,953 |
| Cheniere Corpus Christi Holdings LLC(b) |
| 06/30/2027 | 5.125% | | 313,000 | 323,506 |
| Colorado Interstate Gas Co. LLC/Issuing Corp.(b) |
| 08/15/2026 | 4.150% | | 2,290,000 | 2,301,159 |
| Crestwood Midstream Partners LP/Finance Corp. |
| 04/01/2023 | 6.250% | | 50,000 | 51,526 |
| Delek Logistics Partners LP(b) |
| 05/15/2025 | 6.750% | | 115,000 | 115,850 |
| El Paso LLC |
| 01/15/2032 | 7.750% | | 975,000 | 1,254,691 |
| Enbridge Energy Partners LP |
| 10/15/2025 | 5.875% | | 1,000,000 | 1,148,258 |
| Enbridge, Inc. |
| 06/10/2024 | 3.500% | | 1,182,000 | 1,201,716 |
| Corporate Bonds & Notes (continued) |
| Issuer | Coupon
Rate | | Principal
Amount ($) | Value ($) |
| Enbridge, Inc.(a),(h) |
| Subordinated |
| 07/15/2077 | 5.500% | | 7,351,000 | 7,396,363 |
| Energy Transfer Equity LP |
| 01/15/2024 | 5.875% | | 575,000 | 620,005 |
| 06/01/2027 | 5.500% | | 548,000 | 584,201 |
| Energy Transfer Partners LP |
| 02/01/2024 | 4.900% | | 3,645,000 | 3,912,795 |
| 10/01/2043 | 5.950% | | 350,000 | 370,080 |
| Enterprise Products Operating LLC |
| 02/15/2024 | 3.900% | | 500,000 | 526,303 |
| 02/15/2025 | 3.750% | | 600,000 | 625,175 |
| 05/15/2046 | 4.900% | | 1,400,000 | 1,518,769 |
| Enterprise Products Operating LLC(a) |
| Junior Subordinated |
3-month USD LIBOR + 3.708%
08/01/2066 | 5.018% | | 13,698,000 | 13,718,643 |
| Enterprise Products Operating LLC(a),(h) |
| Junior Subordinated |
| 08/16/2077 | 5.250% | | 8,515,000 | 8,511,807 |
| Ferrellgas Partners LP/Finance Corp. |
| 05/01/2021 | 6.500% | | 350,000 | 335,853 |
| 01/15/2022 | 6.750% | | 150,000 | 143,096 |
| 06/15/2023 | 6.750% | | 200,000 | 189,283 |
| Florida Gas Transmission Co. LLC(b) |
| 07/15/2022 | 3.875% | | 2,250,000 | 2,362,225 |
| Kinder Morgan Energy Partners LP |
| 02/01/2024 | 4.150% | | 3,955,000 | 4,103,661 |
| 09/01/2024 | 4.250% | | 1,000,000 | 1,040,393 |
| 03/15/2032 | 7.750% | | 795,000 | 1,017,172 |
| 01/15/2038 | 6.950% | | 325,000 | 390,615 |
| 09/01/2039 | 6.500% | | 1,000,000 | 1,146,604 |
| 11/15/2040 | 7.500% | | 910,000 | 1,142,710 |
| Kinder Morgan, Inc. |
| 06/01/2018 | 7.250% | | 390,000 | 404,852 |
| Magellan Midstream Partners LP |
| 09/15/2046 | 4.250% | | 320,000 | 318,976 |
| MPLX LP |
| 12/01/2024 | 4.875% | | 325,000 | 350,888 |
| 06/01/2025 | 4.875% | | 200,000 | 214,337 |
| 03/01/2047 | 5.200% | | 1,500,000 | 1,547,084 |
| NGPL PipeCo LLC(b) |
| 08/15/2022 | 4.375% | | 151,000 | 155,211 |
| 08/15/2027 | 4.875% | | 412,000 | 425,165 |
| NuStar Logistics LP |
| 04/28/2027 | 5.625% | | 126,000 | 133,740 |
| ONEOK, Inc. |
| 07/13/2047 | 4.950% | | 2,050,000 | 2,062,093 |
| Phillips 66 Partners LP |
| 02/15/2045 | 4.680% | | 1,300,000 | 1,271,455 |
The accompanying Notes to Financial Statements are an integral part of this statement.
Multi-Manager Total Return Bond Strategies Fund | Annual Report 2017
| 37 |
Portfolio of Investments (continued)
August 31, 2017
| Corporate Bonds & Notes (continued) |
| Issuer | Coupon
Rate | | Principal
Amount ($) | Value ($) |
| Plains All American Pipeline LP/Finance Corp. |
| 01/31/2023 | 2.850% | | 4,720,000 | 4,558,878 |
| 10/15/2023 | 3.850% | | 2,025,000 | 2,043,166 |
| 10/15/2025 | 4.650% | | 500,000 | 518,751 |
| 06/01/2042 | 5.150% | | 2,185,000 | 2,058,578 |
| 02/15/2045 | 4.900% | | 930,000 | 865,889 |
| Regency Energy Partners LP/Finance Corp. |
| 11/01/2023 | 4.500% | | 1,000,000 | 1,049,763 |
| Rockies Express Pipeline LLC(b) |
| 01/15/2019 | 6.000% | | 500,000 | 517,190 |
| 04/15/2020 | 5.625% | | 350,000 | 367,727 |
| Ruby Pipeline LLC(b) |
| 04/01/2022 | 6.000% | | 3,000,000 | 3,190,269 |
| Southern Natural Gas Co. LLC |
| 02/15/2031 | 7.350% | | 2,910,000 | 3,776,033 |
| Suburban Propane Partners LP/Energy Finance Corp. |
| 03/01/2025 | 5.750% | | 225,000 | 221,264 |
| Targa Pipeline Partners LP/Finance Corp. |
| 08/01/2023 | 5.875% | | 100,000 | 98,968 |
| Targa Resources Partners LP/Finance Corp.(b) |
| 02/01/2027 | 5.375% | | 564,000 | 583,225 |
| Tennessee Gas Pipeline Co. LLC |
| 06/15/2032 | 8.375% | | 2,465,000 | 3,192,927 |
| 04/01/2037 | 7.625% | | 550,000 | 706,898 |
| Texas Eastern Transmission LP(b) |
| 10/15/2022 | 2.800% | | 3,350,000 | 3,334,469 |
| Transcanada Trust(a),(h) |
| Junior Subordinated |
| 08/15/2076 | 5.875% | | 3,452,000 | 3,766,463 |
| Western Refining Logistics LP/Finance Corp. |
| 02/15/2023 | 7.500% | | 275,000 | 295,581 |
| Williams Partners LP |
| 11/15/2020 | 4.125% | | 1,000,000 | 1,049,279 |
| 03/15/2022 | 3.600% | | 1,000,000 | 1,031,688 |
| 03/04/2024 | 4.300% | | 2,787,000 | 2,952,450 |
| 01/15/2025 | 3.900% | | 1,050,000 | 1,078,939 |
| 04/15/2040 | 6.300% | | 3,150,000 | 3,720,273 |
| Total | 104,702,297 |
| Natural Gas 0.3% |
| Atmos Energy Corp. |
| 10/15/2044 | 4.125% | | 2,045,000 | 2,204,197 |
| Boston Gas Co.(b) |
| 08/01/2027 | 3.150% | | 1,842,000 | 1,870,870 |
| KeySpan Corp. |
| 11/15/2030 | 8.000% | | 670,000 | 919,174 |
| NiSource Finance Corp. |
| 02/15/2023 | 3.850% | | 1,175,000 | 1,237,072 |
| 05/15/2047 | 4.375% | | 3,135,000 | 3,351,525 |
| Corporate Bonds & Notes (continued) |
| Issuer | Coupon
Rate | | Principal
Amount ($) | Value ($) |
| Sempra Energy |
| 02/15/2019 | 9.800% | | 1,000,000 | 1,110,949 |
| 11/15/2020 | 2.850% | | 3,455,000 | 3,526,000 |
| 06/15/2024 | 3.550% | | 1,500,000 | 1,550,209 |
| 11/15/2025 | 3.750% | | 3,290,000 | 3,428,147 |
| 06/15/2027 | 3.250% | | 2,055,000 | 2,050,089 |
| Total | 21,248,232 |
| Office REIT 0.3% |
| Boston Properties LP |
| 11/15/2020 | 5.625% | | 4,590,000 | 5,044,837 |
| 02/01/2023 | 3.850% | | 2,500,000 | 2,661,810 |
| Government Properties Income Trust |
| 07/15/2022 | 4.000% | | 5,120,000 | 5,145,462 |
| SL Green Realty Corp. |
| 08/15/2018 | 5.000% | | 6,935,000 | 7,088,027 |
| Total | 19,940,136 |
| Oil Field Services 0.2% |
| Nabors Industries, Inc. |
| 09/15/2021 | 4.625% | | 3,250,000 | 3,093,344 |
| Noble Holding International Ltd.(a),(h) |
| 03/16/2018 | 5.750% | | 10,074,000 | 10,135,159 |
| Schlumberger Holdings Corp.(b) |
| 12/21/2025 | 4.000% | | 2,100,000 | 2,221,594 |
| SESI LLC(b) |
| 09/15/2024 | 7.750% | | 30,000 | 30,215 |
| Weatherford International Ltd. |
| 06/15/2023 | 8.250% | | 144,000 | 141,509 |
| 08/01/2036 | 6.500% | | 25,000 | 20,770 |
| Total | 15,642,591 |
| Other Financial Institutions 0.0% |
| ORIX Corp. |
| 07/18/2022 | 2.900% | | 3,730,000 | 3,768,688 |
| Tanner Servicios Financieros SA(b) |
| 03/13/2018 | 4.375% | | 200,000 | 201,552 |
| Total | 3,970,240 |
| Other Industry 0.2% |
| Anixter, Inc. |
| 03/01/2023 | 5.500% | | 75,000 | 80,340 |
| Belden, Inc.(b) |
| 07/15/2024 | 5.250% | | 350,000 | 361,718 |
| KAR Auction Services, Inc.(b) |
| 06/01/2025 | 5.125% | | 97,000 | 100,287 |
| Massachusetts Institute of Technology |
| 07/01/2114 | 4.678% | | 1,768,000 | 2,019,793 |
| 07/01/2116 | 3.885% | | 1,850,000 | 1,775,771 |
The accompanying Notes to Financial Statements are an integral part of this statement.
| 38 | Multi-Manager Total Return Bond Strategies Fund | Annual Report 2017 |
Portfolio of Investments (continued)
August 31, 2017
| Corporate Bonds & Notes (continued) |
| Issuer | Coupon
Rate | | Principal
Amount ($) | Value ($) |
| President and Fellows of Harvard College |
| 07/15/2046 | 3.150% | | 3,031,000 | 2,933,826 |
| 07/15/2056 | 3.300% | | 2,230,000 | 2,184,031 |
| University of Pennsylvania |
| 09/01/2112 | 4.674% | | 1,620,000 | 1,796,706 |
| University of Southern California |
| 10/01/2039 | 3.028% | | 4,525,000 | 4,329,077 |
| Total | 15,581,549 |
| Other REIT 0.2% |
| CyrusOne LP/Finance Corp.(b) |
| 03/15/2024 | 5.000% | | 106,000 | 110,833 |
| 03/15/2027 | 5.375% | | 106,000 | 111,954 |
| Digital Realty Trust LP |
| 08/15/2027 | 3.700% | | 4,355,000 | 4,435,302 |
| Host Hotels & Resorts LP |
| 06/15/2025 | 4.000% | | 1,050,000 | 1,078,954 |
| 02/01/2026 | 4.500% | | 520,000 | 552,521 |
| Liberty Property LP |
| 06/15/2023 | 3.375% | | 2,500,000 | 2,554,553 |
| ProLogis LP |
| 02/01/2021 | 3.350% | | 1,000,000 | 1,039,676 |
| 08/15/2023 | 4.250% | | 1,600,000 | 1,752,234 |
| Select Income REIT |
| 05/15/2024 | 4.250% | | 2,025,000 | 2,040,503 |
| Total | 13,676,530 |
| Packaging 0.1% |
| Ardagh Packaging Finance PLC/Holdings USA, Inc.(b) |
| 06/30/2021 | 6.000% | | 150,000 | 153,961 |
| 05/15/2023 | 4.625% | | 500,000 | 514,243 |
| 05/15/2024 | 7.250% | | 275,000 | 303,752 |
| 02/15/2025 | 6.000% | | 403,000 | 427,828 |
| Berry Plastics Corp. |
| 10/15/2022 | 6.000% | | 111,000 | 117,818 |
| 07/15/2023 | 5.125% | | 168,000 | 175,303 |
| Novolex (b) |
| 01/15/2025 | 6.875% | | 90,000 | 93,454 |
| Owens-Brockway Glass Container, Inc.(b) |
| 01/15/2022 | 5.000% | | 50,000 | 52,525 |
| 08/15/2023 | 5.875% | | 100,000 | 109,343 |
| 01/15/2025 | 5.375% | | 150,000 | 160,500 |
| Reynolds Group Issuer, Inc./LLC |
| 10/15/2020 | 5.750% | | 1,380,000 | 1,406,177 |
| Reynolds Group Issuer, Inc./LLC(b) |
| 07/15/2024 | 7.000% | | 326,000 | 349,009 |
| Sealed Air Corp.(b) |
| 04/01/2023 | 5.250% | | 900,000 | 963,110 |
| Total | 4,827,023 |
| Corporate Bonds & Notes (continued) |
| Issuer | Coupon
Rate | | Principal
Amount ($) | Value ($) |
| Paper 0.2% |
| Celulosa Arauco y Constitucion SA |
| 07/29/2019 | 7.250% | | 150,000 | 163,504 |
| International Paper Co. |
| 11/15/2039 | 7.300% | | 2,000,000 | 2,774,990 |
| 08/15/2047 | 4.400% | | 55,000 | 56,038 |
| 08/15/2048 | 4.350% | | 3,410,000 | 3,458,139 |
| Packaging Corp. of America |
| 11/01/2023 | 4.500% | | 1,070,000 | 1,167,358 |
| Plum Creek Timberlands LP |
| 03/15/2023 | 3.250% | | 1,630,000 | 1,667,533 |
| Weyerhaeuser Co. |
| 10/01/2019 | 7.375% | | 1,000,000 | 1,106,647 |
| 03/15/2032 | 7.375% | | 1,630,000 | 2,309,511 |
| Total | 12,703,720 |
| Pharmaceuticals 1.0% |
| AbbVie, Inc. |
| 05/14/2018 | 1.800% | | 1,000,000 | 1,001,087 |
| 05/14/2020 | 2.500% | | 1,200,000 | 1,215,352 |
| 05/14/2025 | 3.600% | | 4,995,000 | 5,162,792 |
| Actavis, Inc. |
| 10/01/2042 | 4.625% | | 1,000,000 | 1,071,537 |
| Allergan Funding SCS |
| 06/15/2019 | 2.450% | | 2,000,000 | 2,018,928 |
| 03/15/2025 | 3.800% | | 1,000,000 | 1,045,491 |
| 03/15/2035 | 4.550% | | 1,000,000 | 1,074,831 |
| 03/15/2045 | 4.750% | | 1,220,000 | 1,332,822 |
| Amgen, Inc. |
| 05/22/2019 | 2.200% | | 5,740,000 | 5,773,303 |
| 05/01/2045 | 4.400% | | 4,140,000 | 4,339,279 |
| 06/15/2048 | 4.563% | | 2,043,000 | 2,179,560 |
| AstraZeneca PLC |
| 06/12/2027 | 3.125% | | 1,854,000 | 1,849,899 |
| Bayer US Finance LLC(b) |
| 10/08/2019 | 2.375% | | 1,310,000 | 1,320,611 |
| 10/08/2024 | 3.375% | | 520,000 | 536,897 |
| Celgene Corp. |
| 08/15/2025 | 3.875% | | 690,000 | 730,867 |
| 05/15/2044 | 4.625% | | 555,000 | 596,037 |
| 08/15/2045 | 5.000% | | 4,000,000 | 4,563,260 |
| Eagle Holding Co., II LLC PIK(b) |
| 05/15/2022 | 7.625% | | 32,000 | 33,033 |
| Endo Dac/Finance LLC/Finco, Inc.(b) |
| 07/15/2023 | 6.000% | | 250,000 | 210,000 |
| Endo Dac/Finance LLC/Finco, Inc.(a),(b),(h) |
| 02/01/2025 | 6.000% | | 545,000 | 446,161 |
The accompanying Notes to Financial Statements are an integral part of this statement.
Multi-Manager Total Return Bond Strategies Fund | Annual Report 2017
| 39 |
Portfolio of Investments (continued)
August 31, 2017
| Corporate Bonds & Notes (continued) |
| Issuer | Coupon
Rate | | Principal
Amount ($) | Value ($) |
| Gilead Sciences, Inc. |
| 04/01/2021 | 4.500% | | 1,500,000 | 1,617,575 |
| 09/01/2023 | 2.500% | | 1,355,000 | 1,352,133 |
| 02/01/2025 | 3.500% | | 3,060,000 | 3,202,795 |
| 02/01/2045 | 4.500% | | 3,114,000 | 3,352,483 |
| Jaguar Holding Co. II/Pharmaceutical Product Development LLC(b) |
| 08/01/2023 | 6.375% | | 405,000 | 424,850 |
| Johnson & Johnson |
| 12/05/2033 | 4.375% | | 2,625,000 | 3,009,783 |
| 03/03/2037 | 3.625% | | 2,280,000 | 2,382,465 |
| Mallinckrodt International Finance SA |
| 04/15/2023 | 4.750% | | 375,000 | 328,938 |
| Mallinckrodt International Finance SA/CB LLC(b) |
| 04/15/2020 | 4.875% | | 50,000 | 49,870 |
| 10/15/2023 | 5.625% | | 150,000 | 144,067 |
| 04/15/2025 | 5.500% | | 296,000 | 274,911 |
| Mylan NV |
| 06/15/2021 | 3.150% | | 4,530,000 | 4,589,334 |
| Shire Acquisitions Investments Ireland DAC |
| 09/23/2019 | 1.900% | | 6,900,000 | 6,879,997 |
| 09/23/2021 | 2.400% | | 3,500,000 | 3,478,818 |
| 09/23/2023 | 2.875% | | 2,640,000 | 2,625,417 |
| 09/23/2026 | 3.200% | | 2,310,000 | 2,275,715 |
| Valeant Pharmaceuticals International, Inc.(b) |
| 07/15/2021 | 7.500% | | 350,000 | 342,708 |
| 12/01/2021 | 5.625% | | 225,000 | 206,254 |
| 03/15/2022 | 6.500% | | 900,000 | 941,470 |
| 03/01/2023 | 5.500% | | 600,000 | 504,338 |
| 05/15/2023 | 5.875% | | 550,000 | 468,865 |
| 03/15/2024 | 7.000% | | 202,000 | 214,442 |
| 04/15/2025 | 6.125% | | 2,369,000 | 1,995,413 |
| Total | 77,164,388 |
| Property & Casualty 0.5% |
| Arch Capital Finance LLC |
| 12/15/2046 | 5.031% | | 970,000 | 1,099,581 |
| Berkshire Hathaway Finance Corp. |
| 05/15/2042 | 4.400% | | 3,850,000 | 4,237,776 |
| Berkshire Hathaway, Inc. |
| 03/15/2026 | 3.125% | | 850,000 | 869,363 |
| Chubb Corp. (The)(a) |
| Junior Subordinated |
3-month USD LIBOR + 2.250%
04/15/2037 | 3.554% | | 3,350,000 | 3,336,593 |
| Chubb INA Holdings, Inc. |
| 05/15/2024 | 3.350% | | 910,000 | 952,117 |
| CNA Financial Corp. |
| 11/15/2019 | 7.350% | | 3,435,000 | 3,837,197 |
| 08/15/2021 | 5.750% | | 925,000 | 1,032,948 |
| 08/15/2027 | 3.450% | | 4,222,000 | 4,231,377 |
| Corporate Bonds & Notes (continued) |
| Issuer | Coupon
Rate | | Principal
Amount ($) | Value ($) |
| Farmers Exchange Capital(b) |
| Subordinated |
| 07/15/2028 | 7.050% | | 1,000,000 | 1,281,396 |
| 07/15/2048 | 7.200% | | 1,615,000 | 2,119,439 |
| Farmers Exchange Capital II(a),(b),(h) |
| Subordinated |
| 11/01/2053 | 6.151% | | 2,700,000 | 3,102,562 |
| HUB International Ltd.(b) |
| 10/01/2021 | 7.875% | | 541,000 | 563,119 |
| Kemper Corp. |
| 02/15/2025 | 4.350% | | 2,330,000 | 2,386,071 |
| Liberty Mutual Group, Inc.(b) |
| 05/01/2022 | 4.950% | | 2,570,000 | 2,836,784 |
| 06/15/2023 | 4.250% | | 275,000 | 297,226 |
| 05/01/2042 | 6.500% | | 1,080,000 | 1,423,018 |
| 08/01/2044 | 4.850% | | 1,000,000 | 1,093,549 |
| Loews Corp. |
| 04/01/2026 | 3.750% | | 1,573,000 | 1,650,425 |
| 05/15/2043 | 4.125% | | 1,059,000 | 1,072,620 |
| Nationwide Mutual Insurance Co.(a),(b) |
| Subordinated |
3-month USD LIBOR + 2.290%
12/15/2024 | 3.536% | | 1,725,000 | 1,711,557 |
| RenaissanceRe Finance, Inc. |
| 07/01/2027 | 3.450% | | 1,765,000 | 1,767,803 |
| Total | 40,902,521 |
| Railroads 0.1% |
| Burlington Northern Santa Fe LLC |
| 09/15/2021 | 3.450% | | 295,000 | 309,468 |
| 09/01/2022 | 3.050% | | 475,000 | 493,382 |
| 03/15/2043 | 4.450% | | 2,500,000 | 2,733,718 |
| Canadian Pacific Railway Ltd. |
| 01/15/2022 | 4.500% | | 600,000 | 646,909 |
| CSX Corp. |
| 05/30/2042 | 4.750% | | 1,071,000 | 1,179,972 |
| 11/01/2066 | 4.250% | | 4,223,000 | 4,103,966 |
| Union Pacific Corp. |
| 02/15/2019 | 2.250% | | 765,000 | 772,159 |
| Total | 10,239,574 |
| Refining 0.1% |
| Andeavor |
| 04/01/2024 | 5.125% | | 225,000 | 237,357 |
| Marathon Petroleum Corp. |
| 03/01/2021 | 5.125% | | 1,000,000 | 1,089,248 |
| Phillips 66 |
| 11/15/2044 | 4.875% | | 1,550,000 | 1,689,433 |
The accompanying Notes to Financial Statements are an integral part of this statement.
| 40 | Multi-Manager Total Return Bond Strategies Fund | Annual Report 2017 |
Portfolio of Investments (continued)
August 31, 2017
| Corporate Bonds & Notes (continued) |
| Issuer | Coupon
Rate | | Principal
Amount ($) | Value ($) |
| Raizen Fuels Finance SA(b) |
| 01/20/2027 | 5.300% | | 900,000 | 945,663 |
| Valero Energy Corp. |
| 03/15/2019 | 9.375% | | 2,000,000 | 2,216,640 |
| 09/15/2026 | 3.400% | | 2,075,000 | 2,061,469 |
| Total | 8,239,810 |
| Restaurants 0.0% |
| 1011778 BC Unlimited Liability Co./New Red Finance, Inc.(b) |
| 04/01/2022 | 6.000% | | 355,000 | 366,811 |
| 05/15/2024 | 4.250% | | 1,065,000 | 1,083,302 |
| 10/15/2025 | 5.000% | | 157,000 | 160,836 |
| Brinker International, Inc.(b) |
| 10/01/2024 | 5.000% | | 1,425,000 | 1,404,243 |
| KFC Holding Co./Pizza Hut Holdings LLC/Taco Bell of America LLC(b) |
| 06/01/2026 | 5.250% | | 496,000 | 522,463 |
| Total | 3,537,655 |
| Retail REIT 0.2% |
| Brixmor Operating Partnership LP |
| 06/15/2024 | 3.650% | | 3,675,000 | 3,681,743 |
| Kimco Realty Corp. |
| 11/01/2022 | 3.400% | | 290,000 | 300,276 |
| 03/01/2024 | 2.700% | | 2,698,000 | 2,634,527 |
| 04/01/2027 | 3.800% | | 2,350,000 | 2,407,735 |
| VEREIT Operating Partnership LP |
| 08/15/2027 | 3.950% | | 3,440,000 | 3,446,302 |
| Total | 12,470,583 |
| Retailers 0.4% |
| Alimentation Couche-Tard, Inc.(b) |
| 07/26/2022 | 2.700% | | 2,790,000 | 2,800,454 |
| AutoNation, Inc. |
| 01/15/2021 | 3.350% | | 660,000 | 676,583 |
| AutoZone, Inc. |
| 04/21/2026 | 3.125% | | 415,000 | 406,063 |
| Coach, Inc. |
| 07/15/2022 | 3.000% | | 3,185,000 | 3,186,166 |
| CVS Health Corp. |
| 12/05/2023 | 4.000% | | 515,000 | 551,118 |
| 07/20/2025 | 3.875% | | 877,000 | 921,699 |
| 06/01/2026 | 2.875% | | 2,320,000 | 2,269,988 |
| 07/20/2045 | 5.125% | | 705,000 | 816,057 |
| CVS Pass-Through Trust(b) |
| 01/10/2036 | 4.704% | | 127,619 | 134,539 |
| 08/11/2036 | 4.163% | | 1,952,664 | 1,975,794 |
| Hanesbrands, Inc.(b) |
| 05/15/2026 | 4.875% | | 165,000 | 171,532 |
| Corporate Bonds & Notes (continued) |
| Issuer | Coupon
Rate | | Principal
Amount ($) | Value ($) |
| Hot Topic, Inc.(b) |
| 06/15/2021 | 9.250% | | 2,000,000 | 1,803,006 |
| L Brands, Inc. |
| 02/15/2022 | 5.625% | | 4,000,000 | 4,222,708 |
| 11/01/2035 | 6.875% | | 177,000 | 169,304 |
| Lithia Motors, Inc.(b) |
| 08/01/2025 | 5.250% | | 27,000 | 27,532 |
| Macy’s Retail Holdings, Inc. |
| 02/15/2043 | 4.300% | | 4,080,000 | 3,267,089 |
| O’Reilly Automotive, Inc. |
| 03/15/2026 | 3.550% | | 680,000 | 688,475 |
| Party City Holdings, Inc.(b) |
| 08/15/2023 | 6.125% | | 425,000 | 444,844 |
| Penske Automotive Group, Inc. |
| 12/01/2024 | 5.375% | | 202,000 | 204,208 |
| PetSmart, Inc.(b) |
| 03/15/2023 | 7.125% | | 725,000 | 590,613 |
| Rite Aid Corp.(b) |
| 04/01/2023 | 6.125% | | 375,000 | 368,479 |
| Walgreens Boots Alliance, Inc. |
| 11/18/2024 | 3.800% | | 3,050,000 | 3,182,468 |
| 11/18/2044 | 4.800% | | 1,950,000 | 2,098,980 |
| Wal-Mart Stores, Inc. |
| 04/22/2024 | 3.300% | | 2,100,000 | 2,220,078 |
| Total | 33,197,777 |
| Supermarkets 0.1% |
| Ahold Finance USA LLC |
| 05/01/2029 | 6.875% | | 1,800,000 | 2,290,108 |
| Kroger Co. (The) |
| 12/15/2018 | 6.800% | | 3,060,000 | 3,250,779 |
| 04/15/2042 | 5.000% | | 1,209,000 | 1,241,881 |
| 02/01/2047 | 4.450% | | 155,000 | 149,555 |
| 01/15/2048 | 4.650% | | 3,326,000 | 3,298,677 |
| Total | 10,231,000 |
| Supranational 0.1% |
| Corporación Andina de Fomento |
| 06/04/2019 | 8.125% | | 1,400,000 | 1,545,260 |
| 09/27/2021 | 2.125% | | 5,805,000 | 5,785,669 |
| 06/15/2022 | 4.375% | | 400,000 | 435,400 |
| North American Development Bank |
| 10/26/2022 | 2.400% | | 1,950,000 | 1,929,537 |
| Total | 9,695,866 |
The accompanying Notes to Financial Statements are an integral part of this statement.
Multi-Manager Total Return Bond Strategies Fund | Annual Report 2017
| 41 |
Portfolio of Investments (continued)
August 31, 2017
| Corporate Bonds & Notes (continued) |
| Issuer | Coupon
Rate | | Principal
Amount ($) | Value ($) |
| Technology 1.7% |
| Apple, Inc. |
| 02/09/2022 | 2.150% | | 1,460,000 | 1,463,927 |
| 02/09/2022 | 2.500% | | 540,000 | 549,600 |
| 02/09/2024 | 3.000% | | 2,925,000 | 3,006,809 |
| 05/06/2044 | 4.450% | | 550,000 | 612,172 |
| Ascend Learning LLC(b) |
| 08/01/2025 | 6.875% | | 47,000 | 48,881 |
| Broadcom Corp./Cayman Finance Ltd.(b) |
| 01/15/2027 | 3.875% | | 10,275,000 | 10,591,419 |
| Camelot Finance SA(b) |
| 10/15/2024 | 7.875% | | 208,000 | 225,622 |
| CDK Global, Inc.(b) |
| 06/01/2027 | 4.875% | | 289,000 | 293,206 |
| CDW LLC/Finance Corp. |
| 09/01/2023 | 5.000% | | 175,000 | 182,116 |
| 12/01/2024 | 5.500% | | 300,000 | 328,854 |
| Cisco Systems, Inc.(a) |
3-month USD LIBOR + 0.340%
09/20/2019 | 1.614% | | 3,645,000 | 3,665,492 |
| CommScope Technologies LLC(b) |
| 06/15/2025 | 6.000% | | 3,200,000 | 3,407,674 |
| CommScope, Inc.(b) |
| 06/15/2024 | 5.500% | | 250,000 | 260,464 |
| Dell International LLC/EMC Corp.(b) |
| 06/01/2019 | 3.480% | | 6,460,000 | 6,601,080 |
| 06/15/2023 | 5.450% | | 5,830,000 | 6,382,567 |
| 06/15/2026 | 6.020% | | 1,480,000 | 1,653,342 |
| Equifax, Inc. |
| 12/15/2022 | 3.300% | | 375,000 | 387,673 |
| Equinix, Inc. |
| 01/15/2026 | 5.875% | | 564,000 | 619,339 |
| 05/15/2027 | 5.375% | | 520,000 | 558,596 |
| Fidelity National Information Services, Inc. |
| 04/15/2023 | 3.500% | | 2,500,000 | 2,603,060 |
| 08/15/2026 | 3.000% | | 2,390,000 | 2,353,428 |
| First Data Corp.(b) |
| 08/15/2023 | 5.375% | | 225,000 | 236,294 |
| 12/01/2023 | 7.000% | | 5,380,000 | 5,795,040 |
| 01/15/2024 | 5.000% | | 450,000 | 468,812 |
| Flextronics International Ltd. |
| 06/15/2025 | 4.750% | | 385,000 | 421,983 |
| Gartner, Inc.(b) |
| 04/01/2025 | 5.125% | | 274,000 | 288,035 |
| Genpact Luxembourg SARL(b) |
| 04/01/2022 | 3.700% | | 3,425,000 | 3,487,551 |
| Corporate Bonds & Notes (continued) |
| Issuer | Coupon
Rate | | Principal
Amount ($) | Value ($) |
| Hewlett Packard Enterprise Co.(a),(h) |
| 10/05/2018 | 2.850% | | 2,000,000 | 2,021,148 |
| 10/15/2020 | 3.600% | | 690,000 | 716,038 |
| 10/15/2025 | 4.900% | | 3,155,000 | 3,353,181 |
| HP, Inc. |
| 06/01/2021 | 4.300% | | 3,865,000 | 4,121,126 |
| Infor US, Inc. |
| 05/15/2022 | 6.500% | | 350,000 | 358,582 |
| Informatica LLC(b) |
| 07/15/2023 | 7.125% | | 160,000 | 161,120 |
| Ingram Micro, Inc.(a),(h) |
| 12/15/2024 | 5.450% | | 802,000 | 817,686 |
| Jabil, Inc. |
| 12/15/2020 | 5.625% | | 1,000,000 | 1,081,385 |
| Micron Technology, Inc.(b) |
| 08/01/2023 | 5.250% | | 225,000 | 232,357 |
| Microsoft Corp. |
| 02/06/2027 | 3.300% | | 2,000,000 | 2,085,302 |
| 02/12/2055 | 4.000% | | 640,000 | 659,740 |
| 02/06/2057 | 4.500% | | 4,300,000 | 4,822,605 |
| MSCI, Inc.(b) |
| 08/01/2026 | 4.750% | | 850,000 | 885,707 |
| NCR Corp. |
| 02/15/2021 | 4.625% | | 600,000 | 611,357 |
| 07/15/2022 | 5.000% | | 50,000 | 51,094 |
| 12/15/2023 | 6.375% | | 125,000 | 133,453 |
| Nuance Communications, Inc.(b) |
| 08/15/2020 | 5.375% | | 1,482,000 | 1,503,162 |
| NXP BV/Funding LLC(b) |
| 06/01/2021 | 4.125% | | 850,000 | 888,916 |
| Oracle Corp. |
| 10/08/2019 | 2.250% | | 3,000,000 | 3,038,502 |
| 09/15/2023 | 2.400% | | 9,770,000 | 9,788,729 |
| 07/15/2036 | 3.850% | | 1,305,000 | 1,360,435 |
| 07/15/2046 | 4.000% | | 1,550,000 | 1,597,636 |
| Pitney Bowes, Inc. |
| 05/15/2022 | 3.875% | | 2,415,000 | 2,440,775 |
| PTC, Inc. |
| 05/15/2024 | 6.000% | | 267,000 | 285,639 |
| QUALCOMM, Inc. |
| 05/20/2024 | 2.900% | | 4,730,000 | 4,789,276 |
| Qualitytech LP/Finance Corp. |
| 08/01/2022 | 5.875% | | 366,000 | 379,937 |
| Seagate HDD Cayman(b) |
| 03/01/2024 | 4.875% | | 4,855,000 | 4,792,832 |
| Sensata Technologies BV(b) |
| 10/01/2025 | 5.000% | | 150,000 | 157,447 |
The accompanying Notes to Financial Statements are an integral part of this statement.
| 42 | Multi-Manager Total Return Bond Strategies Fund | Annual Report 2017 |
Portfolio of Investments (continued)
August 31, 2017
| Corporate Bonds & Notes (continued) |
| Issuer | Coupon
Rate | | Principal
Amount ($) | Value ($) |
| Sensata Technologies UK Financing Co. PLC(b) |
| 02/15/2026 | 6.250% | | 3,017,000 | 3,297,711 |
| Solera LLC/Finance, Inc.(b) |
| 03/01/2024 | 10.500% | | 174,000 | 198,380 |
| SS&C Technologies Holdings, Inc. |
| 07/15/2023 | 5.875% | | 275,000 | 289,218 |
| Symantec Corp.(b) |
| 04/15/2025 | 5.000% | | 273,000 | 286,117 |
| Tempo Acquisition LLC/Finance Corp.(b) |
| 06/01/2025 | 6.750% | | 73,000 | 74,604 |
| Total System Services, Inc. |
| 04/01/2026 | 4.800% | | 1,415,000 | 1,570,136 |
| VeriSign, Inc. |
| 05/01/2023 | 4.625% | | 286,000 | 294,956 |
| VeriSign, Inc.(b) |
| 07/15/2027 | 4.750% | | 176,000 | 179,488 |
| VMware, Inc. |
| 08/21/2022 | 2.950% | | 4,290,000 | 4,308,850 |
| Western Digital Corp. |
| 04/01/2024 | 10.500% | | 3,750,000 | 4,452,188 |
| Xerox Corp.(b) |
| 03/17/2022 | 4.070% | | 2,114,000 | 2,182,999 |
| Total | 126,762,850 |
| Tobacco 0.3% |
| BAT Capital Corp.(b) |
| 08/14/2020 | 2.297% | | 5,040,000 | 5,066,344 |
| 08/15/2022 | 2.764% | | 2,830,000 | 2,850,503 |
| 08/15/2024 | 3.222% | | 6,915,000 | 6,996,832 |
| Philip Morris International, Inc. |
| 08/17/2022 | 2.375% | | 4,820,000 | 4,821,094 |
| Reynolds American, Inc. |
| 06/12/2025 | 4.450% | | 1,325,000 | 1,434,949 |
| 08/04/2041 | 7.000% | | 1,170,000 | 1,523,593 |
| 08/15/2045 | 5.850% | | 1,450,000 | 1,758,064 |
| Total | 24,451,379 |
| Transportation Services 0.3% |
| Avis Budget Car Rental LLC/Finance, Inc. |
| 04/01/2023 | 5.500% | | 13,000 | 13,092 |
| Avis Budget Car Rental LLC/Finance, Inc.(b) |
| 03/15/2025 | 5.250% | | 254,000 | 248,323 |
| ERAC U.S.A. Finance LLC(b) |
| 10/01/2020 | 5.250% | | 2,500,000 | 2,710,310 |
| Corporate Bonds & Notes (continued) |
| Issuer | Coupon
Rate | | Principal
Amount ($) | Value ($) |
| ERAC USA Finance LLC(b) |
| 11/15/2024 | 3.850% | | 2,500,000 | 2,614,153 |
| 12/01/2026 | 3.300% | | 3,435,000 | 3,400,729 |
| 03/15/2042 | 5.625% | | 1,689,000 | 1,939,908 |
| 11/01/2046 | 4.200% | | 1,041,000 | 999,720 |
| Hertz Corp. (The) |
| 04/15/2019 | 6.750% | | 1,779,000 | 1,770,327 |
| Hertz Corp. (The)(b) |
| 06/01/2022 | 7.625% | | 2,163,000 | 2,192,847 |
| 10/15/2024 | 5.500% | | 62,000 | 52,879 |
| Penske Truck Leasing Co. LP/Finance Corp.(b) |
| 04/01/2021 | 3.300% | | 2,000,000 | 2,065,406 |
| 02/01/2022 | 3.375% | | 1,200,000 | 1,243,639 |
| Ryder System, Inc. |
| 11/15/2018 | 2.450% | | 660,000 | 664,617 |
| 06/01/2019 | 2.550% | | 1,500,000 | 1,516,011 |
| 09/01/2022 | 2.500% | | 1,645,000 | 1,648,331 |
| Total | 23,080,292 |
| Wireless 0.3% |
| America Movil SAB de CV |
| 03/30/2020 | 5.000% | | 300,000 | 323,044 |
| 07/16/2022 | 3.125% | | 200,000 | 207,224 |
| American Tower Corp. |
| 02/15/2024 | 5.000% | | 665,000 | 737,979 |
| Crown Castle International Corp. |
| 09/01/2024 | 3.200% | | 3,440,000 | 3,454,015 |
| 05/15/2047 | 4.750% | | 2,120,000 | 2,194,092 |
| Digicel Group Ltd.(b) |
| 09/30/2020 | 8.250% | | 600,000 | 577,199 |
| SBA Communications Corp. |
| 09/01/2024 | 4.875% | | 1,168,000 | 1,209,439 |
| SFR Group SA(b) |
| 05/01/2026 | 7.375% | | 768,000 | 828,876 |
| SoftBank Group Corp.(b) |
| 04/15/2020 | 4.500% | | 500,000 | 516,631 |
| Sprint Communications, Inc.(b) |
| 03/01/2020 | 7.000% | | 271,000 | 296,763 |
| Sprint Communications, Inc. |
| 04/15/2022 | 9.250% | | 3,339,000 | 4,145,732 |
| Sprint Corp. |
| 09/15/2023 | 7.875% | | 525,000 | 599,420 |
| 06/15/2024 | 7.125% | | 578,000 | 633,851 |
| 02/15/2025 | 7.625% | | 699,000 | 786,717 |
| Sprint Spectrum Co. I/II/III LLC(b) |
| 09/20/2021 | 3.360% | | 5,380,000 | 5,459,871 |
The accompanying Notes to Financial Statements are an integral part of this statement.
Multi-Manager Total Return Bond Strategies Fund | Annual Report 2017
| 43 |
Portfolio of Investments (continued)
August 31, 2017
| Corporate Bonds & Notes (continued) |
| Issuer | Coupon
Rate | | Principal
Amount ($) | Value ($) |
| T-Mobile USA, Inc. |
| 03/01/2023 | 6.000% | | 50,000 | 52,710 |
| 04/01/2023 | 6.625% | | 600,000 | 632,423 |
| 04/28/2023 | 6.836% | | 50,000 | 53,084 |
| 03/01/2025 | 6.375% | | 350,000 | 377,441 |
| 01/15/2026 | 6.500% | | 783,000 | 868,290 |
| Total | 23,954,801 |
| Wirelines 1.0% |
| AT&T, Inc. |
| 02/17/2026 | 4.125% | | 3,000,000 | 3,103,431 |
| 03/01/2037 | 5.250% | | 5,530,000 | 5,837,805 |
| 08/14/2037 | 4.900% | | 4,385,000 | 4,433,595 |
| 12/15/2042 | 4.300% | | 2,260,000 | 2,102,245 |
| 06/15/2044 | 4.800% | | 5,700,000 | 5,557,295 |
| 05/15/2046 | 4.750% | | 2,720,000 | 2,617,935 |
| 03/01/2047 | 5.450% | | 3,985,000 | 4,202,358 |
| 03/09/2049 | 4.550% | | 3,385,000 | 3,125,601 |
| 08/14/2058 | 5.300% | | 4,455,000 | 4,513,859 |
| CenturyLink, Inc. |
| 12/01/2023 | 6.750% | | 342,000 | 349,211 |
| 04/01/2025 | 5.625% | | 86,000 | 81,973 |
| Deutsche Telekom International Finance BV |
| 06/01/2032 | 9.250% | | 625,000 | 998,567 |
| Frontier Communications Corp. |
| 09/15/2025 | 11.000% | | 442,000 | 385,333 |
| Level 3 Communications, Inc. |
| 12/01/2022 | 5.750% | | 275,000 | 283,261 |
| Level 3 Financing, Inc. |
| 02/01/2023 | 5.625% | | 850,000 | 876,020 |
| 01/15/2024 | 5.375% | | 50,000 | 51,166 |
| 05/01/2025 | 5.375% | | 844,000 | 866,834 |
| 03/15/2026 | 5.250% | | 213,000 | 217,672 |
| Qwest Corp. |
| 09/15/2025 | 7.250% | | 3,978,000 | 4,376,548 |
| Telecom Italia Capital SA |
| 09/30/2034 | 6.000% | | 55,000 | 61,011 |
| Telecom Italia SpA(b) |
| 05/30/2024 | 5.303% | | 201,000 | 218,423 |
| Telefonica Emisiones SAU |
| 04/27/2018 | 3.192% | | 870,000 | 877,617 |
| Verizon Communications, Inc. |
| 09/15/2023 | 5.150% | | 1,720,000 | 1,922,862 |
| 08/10/2033 | 4.500% | | 9,305,000 | 9,453,554 |
| 11/01/2034 | 4.400% | | 2,000,000 | 2,003,114 |
| 11/01/2042 | 3.850% | | 1,395,000 | 1,219,318 |
| 08/21/2046 | 4.862% | | 2,500,000 | 2,483,202 |
| Verizon Communications, Inc.(b) |
| 02/15/2025 | 3.376% | | 622,000 | 623,903 |
| Zayo Group LLC/Capital, Inc. |
| 05/15/2025 | 6.375% | | 862,000 | 927,620 |
| Corporate Bonds & Notes (continued) |
| Issuer | Coupon
Rate | | Principal
Amount ($) | Value ($) |
| Zayo Group LLC/Capital, Inc.(b) |
| 01/15/2027 | 5.750% | | 8,141,000 | 8,625,463 |
| Total | 72,396,796 |
Total Corporate Bonds & Notes
(Cost $2,468,064,102) | 2,528,357,866 |
| Fixed-Income Funds 0.9% |
| | Shares | Value ($) |
| Investment Grade 0.9% |
| Columbia Mortgage Opportunities Fund, Class Y Shares(j) | 7,059,306 | 70,098,910 |
Total Fixed-Income Funds
(Cost $68,873,303) | 70,098,910 |
| Foreign Government Obligations(k) 1.7% |
| Issuer | Coupon
Rate | | Principal
Amount ($) | Value ($) |
| Argentina 0.1% |
| Argentina Republic Government International Bond(a),(h) |
| 12/31/2033 | 0.000% | | 112,163 | 130,600 |
| Argentine Republic Government International Bond |
| 04/22/2021 | 6.875% | | 1,800,000 | 1,956,890 |
| Argentine Republic Government International Bond(a),(h) |
| 12/31/2033 | 8.280% | | 168,245 | 191,064 |
| Provincia de Buenos Aires(b) |
| 06/09/2021 | 9.950% | | 1,770,000 | 2,035,757 |
| YPF SA(b) |
| 03/23/2021 | 8.500% | | 1,480,000 | 1,680,186 |
| Total | 5,994,497 |
| Brazil 0.1% |
| Banco Nacional de Desenvolvimento Economico e Social(b) |
| 06/10/2019 | 6.500% | | 100,000 | 106,633 |
| 06/10/2019 | 6.500% | | 100,000 | 106,633 |
| Brazilian Government International Bond |
| 01/05/2023 | 2.625% | | 1,450,000 | 1,384,152 |
| 01/20/2034 | 8.250% | | 150,000 | 194,484 |
| 01/07/2041 | 5.625% | | 800,000 | 801,786 |
| Petrobras Global Finance BV |
| 05/23/2021 | 8.375% | | 1,500,000 | 1,703,238 |
| 05/20/2023 | 4.375% | | 1,950,000 | 1,911,421 |
| 01/17/2027 | 7.375% | | 1,350,000 | 1,491,376 |
| Total | 7,699,723 |
| Canada 0.2% |
| CDP Financial, Inc.(b) |
| 11/25/2019 | 4.400% | | 10,000,000 | 10,548,540 |
The accompanying Notes to Financial Statements are an integral part of this statement.
| 44 | Multi-Manager Total Return Bond Strategies Fund | Annual Report 2017 |
Portfolio of Investments (continued)
August 31, 2017
| Foreign Government Obligations(k) (continued) |
| Issuer | Coupon
Rate | | Principal
Amount ($) | Value ($) |
| CNOOC Nexen Finance ULC |
| 04/30/2024 | 4.250% | | 400,000 | 429,764 |
| NOVA Chemicals Corp.(b) |
| 06/01/2024 | 4.875% | | 120,000 | 120,400 |
| 06/01/2027 | 5.250% | | 123,000 | 122,504 |
| Province of Manitoba |
| 06/22/2026 | 2.125% | | 300,000 | 289,567 |
| Province of Ontario |
| 04/14/2020 | 4.400% | | 600,000 | 640,088 |
| Province of Quebec(a),(h) |
| 02/27/2026 | 7.140% | | 1,230,000 | 1,592,311 |
| Total | 13,743,174 |
| Chile 0.1% |
| Chile Government International Bond |
| 10/30/2022 | 2.250% | | 1,370,000 | 1,371,114 |
| Corporación Nacional del Cobre de Chile(b) |
| 11/04/2044 | 4.875% | | 200,000 | 220,010 |
| 08/01/2047 | 4.500% | | 4,835,000 | 5,014,813 |
| Total | 6,605,937 |
| China 0.0% |
| Industrial & Commercial Bank of China Ltd.(a),(b),(h) |
| Junior Subordinated |
| 12/31/2049 | 6.000% | | 200,000 | 209,321 |
| Colombia 0.1% |
| Colombia Government International Bond |
| 01/28/2026 | 4.500% | | 900,000 | 967,037 |
| 01/18/2041 | 6.125% | | 1,367,000 | 1,622,393 |
| 06/15/2045 | 5.000% | | 600,000 | 622,520 |
| Total | 3,211,950 |
| Croatia 0.0% |
| Croatia Government International Bond(b) |
| 01/26/2024 | 6.000% | | 700,000 | 799,269 |
| 01/26/2024 | 6.000% | | 100,000 | 114,181 |
| Total | 913,450 |
| Dominican Republic 0.1% |
| Dominican Republic International Bond(b) |
| 05/06/2021 | 7.500% | | 4,000,000 | 4,454,904 |
| 05/06/2021 | 7.500% | | 100,000 | 111,373 |
| 01/28/2024 | 6.600% | | 500,000 | 563,576 |
| 01/27/2025 | 5.500% | | 100,000 | 106,188 |
| 01/27/2025 | 5.500% | | 100,000 | 106,188 |
| Total | 5,342,229 |
| Finland 0.0% |
| Republic of Finland |
| 02/15/2026 | 6.950% | | 1,500,000 | 1,966,938 |
| Foreign Government Obligations(k) (continued) |
| Issuer | Coupon
Rate | | Principal
Amount ($) | Value ($) |
| France 0.0% |
| Dexia Credit Local SA(b) |
| 09/15/2021 | 1.875% | | 2,250,000 | 2,219,440 |
| Hong Kong 0.0% |
| CITIC Ltd.(b) |
| 01/21/2018 | 6.875% | | 200,000 | 203,668 |
| Hungary 0.1% |
| Hungary Government International Bond |
| 02/19/2018 | 4.125% | | 70,000 | 70,792 |
| 03/29/2021 | 6.375% | | 546,000 | 619,048 |
| 02/21/2023 | 5.375% | | 3,400,000 | 3,862,468 |
| 11/22/2023 | 5.750% | | 2,000,000 | 2,337,980 |
| 03/25/2024 | 5.375% | | 430,000 | 496,939 |
| Magyar Export-Import Bank Zrt.(b) |
| 01/30/2020 | 4.000% | | 800,000 | 829,435 |
| Total | 8,216,662 |
| India 0.0% |
| Export-Import Bank of India(b) |
| 08/05/2026 | 3.375% | | 860,000 | 849,649 |
| Indonesia 0.0% |
| PT Pertamina Persero(b) |
| 05/20/2043 | 5.625% | | 250,000 | 269,439 |
| 05/30/2044 | 6.450% | | 200,000 | 236,686 |
| PT Perusahaan Gas Negara Persero Tbk(b) |
| 05/16/2024 | 5.125% | | 1,700,000 | 1,846,992 |
| Total | 2,353,117 |
| Israel 0.0% |
| Israel Electric Corp., Ltd.(b) |
| 01/15/2019 | 7.250% | | 200,000 | 213,358 |
| Japan 0.2% |
| Development Bank of Japan, Inc.(b),(d) |
| 09/01/2022 | 2.125% | | 2,600,000 | 2,596,687 |
| Japan Bank for International Cooperation |
| 05/29/2019 | 1.750% | | 5,000,000 | 4,993,735 |
| 02/24/2020 | 2.250% | | 1,400,000 | 1,411,822 |
| Japan Finance Organization for Municipalities(b) |
| 04/20/2022 | 2.625% | | 1,600,000 | 1,619,226 |
| Total | 10,621,470 |
| Kazakhstan 0.0% |
| Kazakhstan Government International Bond(b) |
| 07/21/2025 | 5.125% | | 700,000 | 784,548 |
The accompanying Notes to Financial Statements are an integral part of this statement.
Multi-Manager Total Return Bond Strategies Fund | Annual Report 2017
| 45 |
Portfolio of Investments (continued)
August 31, 2017
| Foreign Government Obligations(k) (continued) |
| Issuer | Coupon
Rate | | Principal
Amount ($) | Value ($) |
| KazMunayGas National Co. JSC(b) |
| 04/19/2022 | 3.875% | | 950,000 | 970,162 |
| 04/19/2027 | 4.750% | | 300,000 | 309,317 |
| Total | 2,064,027 |
| Mexico 0.5% |
| Mexico Government International Bond |
| 03/15/2022 | 3.625% | | 1,974,000 | 2,072,068 |
| 10/02/2023 | 4.000% | | 200,000 | 211,788 |
| 01/30/2025 | 3.600% | | 1,000,000 | 1,028,835 |
| 03/08/2044 | 4.750% | | 2,738,000 | 2,851,865 |
| Pemex Project Funding Master Trust |
| 03/05/2020 | 6.000% | | 3,000,000 | 3,240,849 |
| 01/21/2021 | 5.500% | | 1,600,000 | 1,717,973 |
| 06/15/2038 | 6.625% | | 50,000 | 53,419 |
| Petroleos Mexicanos |
| 07/18/2018 | 3.500% | | 55,000 | 55,804 |
| 02/04/2021 | 6.375% | | 3,815,000 | 4,207,361 |
| 12/20/2022 | 1.700% | | 563,750 | 558,988 |
| 01/15/2025 | 4.250% | | 300,000 | 301,038 |
| 08/04/2026 | 6.875% | | 6,320,000 | 7,266,009 |
| 01/23/2045 | 6.375% | | 940,000 | 969,709 |
| 01/23/2046 | 5.625% | | 300,000 | 282,607 |
| 09/21/2047 | 6.750% | | 1,185,000 | 1,274,220 |
| Petroleos Mexicanos(b) |
| 03/13/2022 | 5.375% | | 950,000 | 1,018,541 |
| 03/13/2022 | 5.375% | | 600,000 | 643,289 |
| 03/13/2027 | 6.500% | | 1,928,000 | 2,160,457 |
| 03/13/2027 | 6.500% | | 755,000 | 845,577 |
| 09/21/2047 | 6.750% | | 2,100,000 | 2,259,587 |
| Total | 33,019,984 |
| Netherlands 0.0% |
| Petrobras Global Finance BV |
| 01/17/2022 | 6.125% | | 235,000 | 248,522 |
| Panama 0.0% |
| Panama Government International Bond |
| 03/16/2025 | 3.750% | | 200,000 | 210,690 |
| 01/26/2036 | 6.700% | | 840,000 | 1,120,432 |
| Total | 1,331,122 |
| Peru 0.1% |
| Corporación Financiera de Desarrollo SA(b) |
| 07/15/2019 | 3.250% | | 200,000 | 203,845 |
| 07/15/2025 | 4.750% | | 520,000 | 563,139 |
| Fondo MIVIVIENDA SA(b) |
| 01/31/2023 | 3.500% | | 300,000 | 306,800 |
| Peruvian Government International Bond |
| 03/14/2037 | 6.550% | | 885,000 | 1,197,429 |
| 11/18/2050 | 5.625% | | 150,000 | 190,267 |
| Total | 2,461,480 |
| Foreign Government Obligations(k) (continued) |
| Issuer | Coupon
Rate | | Principal
Amount ($) | Value ($) |
| Philippines 0.0% |
| Philippine Government International Bond |
| 01/15/2032 | 6.375% | | 400,000 | 531,066 |
| 10/23/2034 | 6.375% | | 275,000 | 373,264 |
| Power Sector Assets & Liabilities Management Corp.(b) |
| 05/27/2019 | 7.250% | | 100,000 | 108,788 |
| Total | 1,013,118 |
| Poland 0.0% |
| Poland Government International Bond |
| 03/17/2023 | 3.000% | | 300,000 | 309,016 |
| Qatar 0.0% |
| Nakilat, Inc.(b) |
| 12/31/2033 | 6.067% | | 1,164,000 | 1,369,119 |
| QNB Finance Ltd.(b) |
| 10/31/2018 | 2.750% | | 200,000 | 200,152 |
| Ras Laffan Liquefied Natural Gas Co., Ltd. II(b) |
| 09/30/2020 | 5.298% | | 618,116 | 640,692 |
| Total | 2,209,963 |
| Romania 0.0% |
| Romanian Government International Bond(b) |
| 08/22/2023 | 4.375% | | 150,000 | 162,276 |
| Russian Federation 0.0% |
| Gazprom OAO Via Gaz Capital SA(b) |
| 04/28/2034 | 8.625% | | 200,000 | 272,289 |
| Russian Agricultural Bank OJSC Via RSHB Capital SA(b) |
| 07/25/2018 | 5.100% | | 200,000 | 203,925 |
| Russian Foreign Bond - Eurobond(b) |
| 04/04/2022 | 4.500% | | 800,000 | 854,663 |
| 09/16/2023 | 4.875% | | 200,000 | 218,810 |
| 04/04/2042 | 5.625% | | 800,000 | 905,735 |
| Total | 2,455,422 |
| South Africa 0.0% |
| South Africa Government International Bond |
| 01/17/2024 | 4.665% | | 500,000 | 518,140 |
| South Korea 0.0% |
| Export-Import Bank of Korea |
| 12/30/2020 | 2.625% | | 400,000 | 402,765 |
| Korea Development Bank (The) |
| 03/11/2020 | 2.500% | | 300,000 | 301,110 |
| 09/14/2022 | 3.000% | | 200,000 | 204,190 |
| Total | 908,065 |
The accompanying Notes to Financial Statements are an integral part of this statement.
| 46 | Multi-Manager Total Return Bond Strategies Fund | Annual Report 2017 |
Portfolio of Investments (continued)
August 31, 2017
| Foreign Government Obligations(k) (continued) |
| Issuer | Coupon
Rate | | Principal
Amount ($) | Value ($) |
| Turkey 0.1% |
| Turkey Government International Bond |
| 03/30/2021 | 5.625% | | 3,400,000 | 3,639,724 |
| 03/23/2023 | 3.250% | | 950,000 | 912,291 |
| Total | 4,552,015 |
| United Arab Emirates 0.0% |
| DAE Funding LLC(b) |
| 08/01/2024 | 5.000% | | 114,000 | 116,538 |
| DP World Ltd.(b) |
| 07/02/2037 | 6.850% | | 300,000 | 372,077 |
| Total | 488,615 |
| Uruguay 0.0% |
| Uruguay Government International Bond |
| 10/27/2027 | 4.375% | | 850,000 | 920,104 |
| 06/18/2050 | 5.100% | | 200,000 | 210,757 |
| Total | 1,130,861 |
| Venezuela 0.0% |
| Venezuela Government International Bond |
| 09/15/2027 | 9.250% | | 370,000 | 146,542 |
| Virgin Islands 0.0% |
| CNPC General Capital Ltd.(b) |
| 11/25/2019 | 2.700% | | 300,000 | 303,097 |
| Franshion Brilliant Ltd.(b) |
| 03/19/2019 | 5.750% | | 400,000 | 418,324 |
| Sinochem Offshore Capital Co., Ltd.(b) |
| 04/29/2019 | 3.250% | | 200,000 | 203,084 |
| Sinopec Group Overseas Development Ltd.(b) |
| 04/28/2025 | 3.250% | | 400,000 | 404,852 |
| 04/28/2025 | 3.250% | | 300,000 | 303,639 |
| Total | 1,632,996 |
Total Foreign Government Obligations
(Cost $120,766,789) | 125,016,747 |
|
| Inflation-Indexed Bonds 0.9% |
| | | | |
| United States 0.9% |
| U.S. Treasury Inflation-Indexed Bond |
| 04/15/2021 | 0.125% | | 9,498,141 | 9,543,940 |
| 04/15/2022 | 0.125% | | 4,799,451 | 4,815,660 |
| 07/15/2026 | 0.125% | | 24,541,409 | 24,120,679 |
| 07/15/2027 | 0.375% | | 4,456,141 | 4,463,828 |
| 02/15/2045 | 0.750% | | 11,073,248 | 10,723,076 |
| Inflation-Indexed Bonds (continued) |
| Issuer | Coupon
Rate | | Principal
Amount ($) | Value ($) |
| 02/15/2047 | 0.875% | | 13,607,931 | 13,637,159 |
| Total | 67,304,342 |
Total Inflation-Indexed Bonds
(Cost $67,453,881) | 67,304,342 |
|
| Municipal Bonds 0.8% |
| Issue Description | Coupon
Rate | | Principal
Amount ($) | Value ($) |
| Higher Education 0.1% |
| University of California |
| Refunding Revenue Bonds |
| Taxable General |
| Series 2017AX |
| 07/01/2025 | 3.063% | | 5,700,000 | 5,874,705 |
| University of Texas System (The) |
| Revenue Bonds |
| Series 2017J |
| 08/15/2025 | 5.000% | | 805,000 | 1,004,125 |
| 08/15/2026 | 5.000% | | 720,000 | 907,689 |
| Total | 7,786,519 |
| Local General Obligation 0.1% |
| City of Chicago |
| Unlimited Tax General Obligation Bonds |
| Series 2011-C1 |
| 01/01/2035 | 7.781% | | 270,000 | 318,959 |
| Series 2015B |
| 01/01/2033 | 7.375% | | 200,000 | 231,544 |
| Unlimited Tax General Obligation Refunding Bonds |
| Series 2014B |
| 01/01/2044 | 6.314% | | 1,080,000 | 1,160,968 |
| City of New York |
| Unlimited General Obligation Bonds |
| Series 2010 (BAM) |
| 03/01/2036 | 5.968% | | 3,100,000 | 4,128,332 |
| Series 2016B-1 |
| 12/01/2041 | 5.000% | | 865,000 | 1,012,950 |
| Los Angeles Unified School District |
| Unlimited General Obligation Bonds |
| Taxable Build America Bonds |
| Series 2009 |
| 07/01/2034 | 5.750% | | 2,685,000 | 3,465,153 |
| Total | 10,317,906 |
| Municipal Power 0.0% |
| Los Angeles Department of Water & Power System |
| Revenue Bonds |
| Series 2010 (BAM) |
| 07/01/2045 | 6.574% | | 1,595,000 | 2,385,083 |
The accompanying Notes to Financial Statements are an integral part of this statement.
Multi-Manager Total Return Bond Strategies Fund | Annual Report 2017
| 47 |
Portfolio of Investments (continued)
August 31, 2017
| Municipal Bonds (continued) |
| Issue Description | Coupon
Rate | | Principal
Amount ($) | Value ($) |
| Sales Tax 0.1% |
| Central Puget Sound Regional Transit Authority |
| Revenue Bonds |
| Green Bonds |
| Series 2016S-1 |
| 11/01/2046 | 5.000% | | 1,685,000 | 2,257,260 |
| Puerto Rico Sales Tax Financing Corp.(i),(l) |
| Revenue Bonds |
| 1st Senior Series 2009C |
| 08/01/2057 | 5.750% | | 500,000 | 316,875 |
| Subordinated Revenue Bonds |
| 1st Series 2009A-1 |
| 08/01/2043 | 5.250% | | 1,575,000 | 399,656 |
| 1st Series 2009B |
| 08/01/2044 | 6.500% | | 285,000 | 72,319 |
| 1st Series 2010C |
| 08/01/2041 | 5.250% | | 1,460,000 | 370,475 |
| Total | 3,416,585 |
| Special Non Property Tax 0.1% |
| JobsOhio Beverage System |
| Taxable Revenue Bonds |
| Series 2013B |
| 01/01/2035 | 4.532% | | 3,160,000 | 3,522,958 |
| State of Illinois |
| Revenue Bonds |
| Taxable Sales Tax |
| Series 2013 |
| 06/15/2028 | 3.350% | | 2,500,000 | 2,492,750 |
| Total | 6,015,708 |
| Special Property Tax 0.0% |
| New York State Urban Development Corp. |
| Revenue Bonds |
| Taxable State Personal Income Tax |
| Series 2013 |
| 03/15/2022 | 3.200% | | 2,650,000 | 2,771,344 |
| State General Obligation 0.3% |
| Commonwealth of Massachusetts |
| Limited General Obligation Bonds |
| Series 2016G |
| 09/01/2046 | 3.000% | | 4,200,000 | 3,933,090 |
| State of California |
| Unlimited General Obligation Bonds |
| Build America Bonds |
| Series 2010 |
| 03/01/2040 | 7.625% | | 800,000 | 1,245,776 |
| Taxable-Various Purpose |
| Series 2010 |
| 03/01/2019 | 6.200% | | 2,700,000 | 2,882,412 |
| Municipal Bonds (continued) |
| Issue Description | Coupon
Rate | | Principal
Amount ($) | Value ($) |
| State of Texas |
| Unlimited General Obligation Refunding Bonds |
| Transportation Commission Mobility Fund |
| Series 2017 |
| 10/01/2033 | 5.000% | | 2,395,000 | 2,928,079 |
| 10/01/2034 | 5.000% | | 7,350,000 | 8,942,084 |
| Total | 19,931,441 |
| Turnpike / Bridge / Toll Road 0.1% |
| Bay Area Toll Authority |
| Revenue Bonds |
| Series 2009 (BAM) |
| 04/01/2049 | 6.263% | | 1,920,000 | 2,812,857 |
| Pennsylvania Turnpike Commission |
| Revenue Bonds |
| Build America Bonds |
| Series 2009 |
| 12/01/2039 | 6.105% | | 1,620,000 | 2,195,084 |
| Total | 5,007,941 |
| Water & Sewer 0.0% |
| City of Chicago Waterworks |
| Revenue Bonds |
| Build America Bonds |
| Series 2010 |
| 11/01/2040 | 6.742% | | 615,000 | 810,213 |
| New York City Water & Sewer System |
| Revenue Bonds |
| Series 2010 (BAM) |
| 06/15/2043 | 5.440% | | 1,550,000 | 2,044,512 |
| Total | 2,854,725 |
Total Municipal Bonds
(Cost $58,976,573) | 60,487,252 |
|
| Preferred Debt 0.1% |
| Issuer | Coupon
Rate | | Principal
Amount ($) | Value ($) |
| Banking 0.1% |
| Bank of America Corp. |
| 12/31/2049 | 6.204% | | 41,000 | 1,066,000 |
| M&T Bank Corp.(a),(h) |
| 12/31/2049 | 6.375% | | 2,803 | 3,121,141 |
| 12/31/2049 | 6.375% | | 435 | 484,155 |
| State Street Corp.(a),(h) |
| 12/31/2049 | 5.350% | | 52,110 | 1,441,884 |
| 12/31/2049 | 5.900% | | 36,235 | 1,015,667 |
| Total | 7,128,847 |
The accompanying Notes to Financial Statements are an integral part of this statement.
| 48 | Multi-Manager Total Return Bond Strategies Fund | Annual Report 2017 |
Portfolio of Investments (continued)
August 31, 2017
| Preferred Debt (continued) |
| Issuer | Coupon
Rate | | Principal
Amount ($) | Value ($) |
| Property & Casualty 0.0% |
| Allstate Corp. (The)(a),(h) |
| 01/15/2053 | 5.100% | | 17,285 | 467,559 |
Total Preferred Debt
(Cost $7,091,080) | 7,596,406 |
|
| Residential Mortgage-Backed Securities - Agency 19.0% |
| | | | |
| Federal Home Loan Mortgage Corp. |
| 04/01/2021 | 9.000% | | 307 | 310 |
03/01/2022-
08/01/2022 | 8.500% | | 5,967 | 6,418 |
08/01/2024-
02/01/2025 | 8.000% | | 26,286 | 28,890 |
10/01/2028-
07/01/2032 | 7.000% | | 336,825 | 386,134 |
03/01/2031-
03/01/2047 | 3.000% | | 66,481,027 | 67,351,486 |
10/01/2031-
07/01/2037 | 6.000% | | 1,015,090 | 1,165,755 |
| 12/01/2031 | 2.500% | | 9,252,366 | 9,386,900 |
04/01/2033-
09/01/2039 | 5.500% | | 1,925,077 | 2,145,119 |
10/01/2039-
05/01/2041 | 5.000% | | 882,651 | 966,057 |
09/01/2040-
05/01/2047 | 4.000% | | 37,274,182 | 39,526,239 |
09/01/2040-
07/01/2041 | 4.500% | | 3,172,819 | 3,421,286 |
08/01/2045-
02/01/2047 | 3.500% | | 81,261,026 | 84,383,542 |
| CMO Series 3071 Class ZP |
| 11/15/2035 | 5.500% | | 5,754,777 | 7,175,323 |
| CMO Series 3741 Class PD |
| 10/15/2040 | 4.000% | | 1,855,000 | 2,027,843 |
| CMO Series 3809 Class HZ |
| 02/15/2041 | 4.000% | | 2,286,102 | 2,502,603 |
| CMO Series 4034 Class PB |
| 04/15/2042 | 4.500% | | 730,566 | 847,979 |
| CMO Series 4059 Class DY |
| 06/15/2042 | 3.500% | | 5,074,000 | 5,361,670 |
| CMO Series 4247 Class AY |
| 09/15/2043 | 4.500% | | 1,500,000 | 1,725,965 |
| CMO Series 4396 Class PZ |
| 06/15/2037 | 3.000% | | 672,893 | 646,817 |
| CMO Series 4496 Class PZ |
| 07/15/2045 | 2.500% | | 603,602 | 534,334 |
| Federal Home Loan Mortgage Corp.(m) |
| 08/01/2047 | 3.000% | | 2,667,583 | 2,699,667 |
| Federal Home Loan Mortgage Corp.(d) |
| 09/13/2047 | 4.000% | | 3,710,000 | 3,921,006 |
| Residential Mortgage-Backed Securities - Agency (continued) |
| Issuer | Coupon
Rate | | Principal
Amount ($) | Value ($) |
| Federal Home Loan Mortgage Corp.(a) |
| CMO Series 2380 Class F |
1-month USD LIBOR + 0.450%
11/15/2031 | 1.676% | | 403,728 | 404,717 |
| CMO Series 2557 Class FG |
1-month USD LIBOR + 0.400%
01/15/2033 | 1.626% | | 909,085 | 906,781 |
| CMO Series 2962 Class PF |
1-month USD LIBOR + 0.250%
03/15/2035 | 1.476% | | 510,268 | 510,704 |
| CMO Series 2981 Class FU |
1-month USD LIBOR + 0.200%
05/15/2030 | 1.426% | | 641,391 | 637,379 |
| CMO Series 3085 Class FV |
1-month USD LIBOR + 0.700%
08/15/2035 | 1.926% | | 1,610,776 | 1,637,017 |
| CMO Series 3135 Class FC |
1-month USD LIBOR + 0.300%
04/15/2026 | 1.526% | | 1,353,269 | 1,353,417 |
| CMO Series 3564 Class FC |
1-month USD LIBOR + 1.250%
01/15/2037 | 2.482% | | 747,677 | 753,081 |
| CMO Series 3785 Class LS |
1-month USD LIBOR + 9.900%
01/15/2041 | 7.449% | | 2,032,007 | 2,427,343 |
| CMO Series 3852 Class QN |
1-month USD LIBOR + 27.211%
05/15/2041 | 5.500% | | 98,557 | 104,159 |
| CMO Series 3973 Class FP |
1-month USD LIBOR + 0.300%
12/15/2026 | 1.526% | | 723,180 | 724,053 |
| CMO Series 4048 Class FJ |
1-month USD LIBOR + 0.400%
07/15/2037 | 1.627% | | 820,949 | 807,580 |
| CMO Series 4238 Class FD |
1-month USD LIBOR + 0.300%
02/15/2042 | 1.526% | | 3,297,861 | 3,293,289 |
| CMO Series 4311 Class PF |
1-month USD LIBOR + 0.350%
06/15/2042 | 1.576% | | 663,647 | 665,061 |
| CMO Series 4364 Class FE |
1-month USD LIBOR + 0.300%
12/15/2039 | 1.526% | | 777,257 | 775,203 |
| Federal Home Loan Mortgage Corp.(a),(f) |
| CMO Series 3404 Class AS |
1-month USD LIBOR + 5.895%
01/15/2038 | 4.669% | | 4,649,947 | 736,413 |
The accompanying Notes to Financial Statements are an integral part of this statement.
Multi-Manager Total Return Bond Strategies Fund | Annual Report 2017
| 49 |
Portfolio of Investments (continued)
August 31, 2017
| Residential Mortgage-Backed Securities - Agency (continued) |
| Issuer | Coupon
Rate | | Principal
Amount ($) | Value ($) |
| Federal Home Loan Mortgage Corp.(a),(e),(f) |
| CMO Series 3833 Class LI |
| 10/15/2040 | 1.726% | | 25,862,292 | 1,585,327 |
| Federal Home Loan Mortgage Corp. Multifamily Structured Pass-Through Certificates(a),(e),(f) |
| CMO Series K051 Class X1 |
| 09/25/2025 | 0.686% | | 19,118,383 | 709,560 |
| CMO Series K058 Class X1 |
| 08/25/2026 | 0.931% | | 2,483,966 | 172,074 |
| CMO Series KW02 Class X1 |
| 12/25/2026 | 0.447% | | 11,769,158 | 241,747 |
| Federal National Mortgage Association |
| 04/01/2023 | 8.500% | | 1,404 | 1,416 |
| 06/01/2024 | 9.000% | | 4,764 | 5,108 |
02/01/2025-
08/01/2027 | 8.000% | | 47,260 | 53,073 |
03/01/2026-
07/01/2038 | 7.000% | | 1,028,860 | 1,200,792 |
02/01/2027-
09/01/2045 | 3.000% | | 37,956,518 | 38,979,229 |
04/01/2027-
06/01/2032 | 7.500% | | 89,918 | 101,267 |
05/01/2029-
10/01/2040 | 6.000% | | 3,517,509 | 4,014,327 |
| 01/01/2031 | 2.500% | | 4,492,547 | 4,562,333 |
03/01/2033-
04/01/2041 | 5.500% | | 1,712,809 | 1,933,334 |
10/01/2033-
01/01/2047 | 3.500% | | 113,615,543 | 118,395,618 |
07/01/2039-
10/01/2041 | 5.000% | | 7,869,088 | 8,603,570 |
10/01/2040-
04/01/2047 | 4.500% | | 86,677,570 | 93,386,916 |
02/01/2041-
07/01/2047 | 4.000% | | 159,132,432 | 169,048,100 |
| CMO Series 2003-82 Class Z |
| 08/25/2033 | 5.500% | | 242,003 | 268,827 |
| CMO Series 2009-100 Class PL |
| 12/25/2039 | 5.000% | | 770,652 | 906,606 |
| CMO Series 2009-111 Class DA |
| 12/25/2039 | 5.000% | | 339,329 | 357,555 |
| CMO Series 2010-81 Class PB |
| 08/25/2040 | 5.000% | | 829,499 | 941,742 |
| CMO Series 2012-103 Class PY |
| 09/25/2042 | 3.000% | | 1,000,000 | 984,522 |
| CMO Series 2013-15 Class BL |
| 03/25/2043 | 2.500% | | 2,323,879 | 2,078,107 |
| CMO Series 2013-17 Class JP |
| 03/25/2043 | 3.000% | | 650,000 | 637,123 |
| CMO Series 2015-18 Class NB |
| 04/25/2045 | 3.000% | | 2,002,796 | 1,970,127 |
| Residential Mortgage-Backed Securities - Agency (continued) |
| Issuer | Coupon
Rate | | Principal
Amount ($) | Value ($) |
| CMO Series 2016-25 Class LB |
| 05/25/2046 | 3.000% | | 3,000,000 | 2,974,685 |
| CMO Series 2017-72 Class B |
| 09/25/2047 | 3.000% | | 17,500,000 | 17,941,016 |
| Federal National Mortgage Association(d) |
10/18/2031-
09/13/2047 | 3.000% | | 90,745,000 | 92,672,704 |
| 09/18/2032 | 2.500% | | 25,150,000 | 25,503,672 |
10/13/2046-
09/13/2047 | 3.500% | | 99,850,000 | 103,396,259 |
10/13/2046-
09/13/2047 | 4.000% | | 67,325,000 | 71,050,612 |
| 09/13/2047 | 4.500% | | 32,485,000 | 34,946,752 |
| Federal National Mortgage Association(a) |
6-month USD LIBOR + 0.000%
04/01/2034 | 2.820% | | 370,198 | 381,686 |
| CMO Series 2002-59 Class HF |
1-month USD LIBOR + 0.350%
08/17/2032 | 1.559% | | 431,921 | 432,005 |
| CMO Series 2003-134 Class FC |
1-month USD LIBOR + 0.600%
12/25/2032 | 1.834% | | 2,502,647 | 2,537,450 |
| CMO Series 2004-93 Class FC |
1-month USD LIBOR + 0.200%
12/25/2034 | 1.416% | | 1,630,554 | 1,621,017 |
| CMO Series 2006-71 Class SH |
1-month USD LIBOR + 15.738%
05/25/2035 | 12.548% | | 287,312 | 409,372 |
| CMO Series 2007-90 Class F |
1-month USD LIBOR + 0.490%
09/25/2037 | 1.706% | | 1,474,174 | 1,471,936 |
| CMO Series 2007-W7 Class 1A4 |
1-month USD LIBOR + 39.180%
07/25/2037 | 31.883% | | 163,972 | 236,191 |
| CMO Series 2008-15 Class AS |
1-month USD LIBOR + 33.000%
08/25/2036 | 26.920% | | 767,092 | 1,365,890 |
| CMO Series 2010-135 Class FD |
1-month USD LIBOR + 0.500%
06/25/2039 | 1.716% | | 3,008,685 | 3,018,637 |
| CMO Series 2010-142 Class HS |
1-month USD LIBOR + 10.000%
12/25/2040 | 7.537% | | 1,219,709 | 1,288,716 |
| CMO Series 2010-150 Class FL |
1-month USD LIBOR + 0.550%
10/25/2040 | 1.766% | | 933,602 | 938,748 |
The accompanying Notes to Financial Statements are an integral part of this statement.
| 50 | Multi-Manager Total Return Bond Strategies Fund | Annual Report 2017 |
Portfolio of Investments (continued)
August 31, 2017
| Residential Mortgage-Backed Securities - Agency (continued) |
| Issuer | Coupon
Rate | | Principal
Amount ($) | Value ($) |
| CMO Series 2010-74 Class WF |
1-month USD LIBOR + 0.600%
07/25/2034 | 1.816% | | 1,319,144 | 1,319,982 |
| CMO Series 2010-86 Class FE |
1-month USD LIBOR + 0.450%
08/25/2025 | 1.666% | | 1,418,382 | 1,418,863 |
| CMO Series 2011-99 Class KF |
1-month USD LIBOR + 0.300%
10/25/2026 | 1.516% | | 1,375,109 | 1,374,314 |
| CMO Series 2012-1 Class FA |
1-month USD LIBOR + 0.500%
02/25/2042 | 1.716% | | 3,043,448 | 3,066,339 |
| CMO Series 2012-115 Class MT |
1-month USD LIBOR + 13.500%
10/25/2042 | 4.500% | | 2,201,869 | 2,135,642 |
| CMO Series 2012-14 Class FB |
1-month USD LIBOR + 0.450%
08/25/2037 | 1.666% | | 414,024 | 415,522 |
| CMO Series 2012-47 Class HF |
1-month USD LIBOR + 0.400%
05/25/2027 | 1.616% | | 2,057,680 | 2,070,037 |
| CMO Series 2012-73 Class LF |
1-month USD LIBOR + 0.450%
06/25/2039 | 1.666% | | 2,609,962 | 2,606,883 |
| CMO Series 2016-32 Class GT |
1-month USD LIBOR + 18.000%
01/25/2043 | 4.500% | | 1,936,154 | 1,889,968 |
| Federal National Mortgage Association(n) |
| 02/01/2046 | 3.500% | | 10,665,126 | 11,057,769 |
| Federal National Mortgage Association(a),(f) |
| CMO Series 2006-43 Class SJ |
1-month USD LIBOR + 6.590%
06/25/2036 | 5.374% | | 2,400,109 | 425,658 |
| CMO Series 2016-32 Class SA |
1-month USD LIBOR + 6.100%
10/25/2034 | 4.884% | | 7,370,028 | 1,161,155 |
| Federal National Mortgage Association(a),(e) |
| CMO Series 2016-32 Class TG |
| 01/25/2043 | 4.500% | | 1,805,119 | 1,760,733 |
| CMO Series 2016-40 Class GA |
| 07/25/2046 | 3.387% | | 1,545,855 | 1,621,394 |
| Federal National Mortgage Association(o) |
| CMO Series G93-28 Class E |
| 07/25/2022 | 0.000% | | 254,283 | 239,703 |
| CMO STRIPS Series 43 Class 1 |
| 09/25/2018 | 0.000% | | 147 | 145 |
| Residential Mortgage-Backed Securities - Agency (continued) |
| Issuer | Coupon
Rate | | Principal
Amount ($) | Value ($) |
| Government National Mortgage Association |
| 05/15/2040 | 5.000% | | 1,112,723 | 1,220,486 |
| 05/20/2041 | 4.500% | | 1,665,700 | 1,787,736 |
| 02/15/2042 | 4.000% | | 2,216,590 | 2,353,570 |
03/20/2046-
04/20/2047 | 3.500% | | 44,198,267 | 46,143,846 |
12/20/2046-
05/20/2047 | 3.000% | | 22,954,209 | 23,451,217 |
| 08/20/2059 | 5.500% | | 4,614 | 4,660 |
| 12/20/2060 | 4.297% | | 64,885 | 65,398 |
| 01/20/2061 | 5.305% | | 64,383 | 67,280 |
| 04/20/2061 | 4.348% | | 132,943 | 135,120 |
01/20/2062-
11/20/2062 | 4.645% | | 1,668,757 | 1,735,168 |
| 03/20/2062 | 4.554% | | 182,465 | 188,091 |
| 05/20/2062 | 4.165% | | 1,885,016 | 1,947,792 |
| 05/20/2062 | 4.469% | | 154,060 | 159,273 |
| 05/20/2062 | 4.503% | | 204,929 | 211,757 |
| 06/20/2062 | 4.585% | | 147,081 | 151,905 |
| 07/20/2062 | 4.591% | | 102,587 | 106,068 |
08/20/2062-
04/20/2063 | 4.496% | | 295,133 | 306,596 |
| 08/20/2062 | 4.514% | | 1,654,504 | 1,717,054 |
08/20/2062-
04/20/2067 | 4.534% | | 4,665,603 | 5,051,645 |
| 09/20/2062 | 4.528% | | 1,239,905 | 1,285,205 |
| 10/20/2062 | 4.473% | | 55,162 | 57,481 |
| 10/20/2062 | 4.481% | | 1,806,779 | 1,873,230 |
| 11/20/2062 | 4.617% | | 484,166 | 503,335 |
| 12/20/2062 | 4.599% | | 1,749,272 | 1,816,020 |
| 02/20/2063 | 4.288% | | 409,024 | 425,661 |
| 02/20/2063 | 4.306% | | 227,856 | 238,546 |
| 02/20/2063 | 4.443% | | 981,286 | 1,024,027 |
| 02/20/2063 | 4.582% | | 215,828 | 225,047 |
| 03/20/2063 | 4.525% | | 100,707 | 105,121 |
| 03/20/2063 | 4.563% | | 548,853 | 573,833 |
| 04/20/2063 | 4.210% | | 1,574,729 | 1,649,272 |
| 04/20/2063 | 4.435% | | 1,509,456 | 1,577,188 |
| 04/20/2063 | 4.519% | | 230,390 | 240,747 |
| 04/20/2063 | 4.784% | | 19,019 | 19,399 |
| 05/20/2063 | 4.381% | | 1,709,400 | 1,789,149 |
| 05/20/2063 | 4.455% | | 2,304,852 | 2,413,482 |
| 06/20/2063 | 4.408% | | 916,212 | 957,876 |
| 06/20/2063 | 4.425% | | 4,660,871 | 4,895,168 |
| 06/20/2063 | 4.601% | | 2,983,148 | 3,123,987 |
| 01/20/2064 | 4.683% | | 83,484 | 86,168 |
| 12/20/2064 | 4.522% | | 1,284,274 | 1,334,050 |
| 12/20/2064 | 4.632% | | 4,516,230 | 4,937,658 |
| 01/20/2066 | 4.542% | | 2,979,740 | 3,276,048 |
| 01/20/2066 | 4.559% | | 806,359 | 888,335 |
| 01/20/2066 | 4.587% | | 1,070,750 | 1,176,703 |
| 02/20/2066 | 4.470% | | 3,738,962 | 4,115,161 |
| 02/20/2066 | 4.545% | | 2,625,746 | 2,894,755 |
| 04/20/2066 | 4.581% | | 2,568,151 | 2,836,707 |
| 08/20/2066 | 4.614% | | 1,079,458 | 1,204,646 |
| 12/20/2066 | 4.436% | | 487,429 | 540,133 |
| 12/20/2066 | 4.544% | | 644,161 | 716,244 |
The accompanying Notes to Financial Statements are an integral part of this statement.
Multi-Manager Total Return Bond Strategies Fund | Annual Report 2017
| 51 |
Portfolio of Investments (continued)
August 31, 2017
| Residential Mortgage-Backed Securities - Agency (continued) |
| Issuer | Coupon
Rate | | Principal
Amount ($) | Value ($) |
| 12/20/2066 | 4.565% | | 2,149,138 | 2,346,382 |
| 01/20/2067 | 4.611% | | 458,050 | 499,064 |
| 07/20/2067 | 4.620% | | 887,421 | 969,338 |
| CMO Series 2011-22 Class PL |
| 02/20/2041 | 5.000% | | 1,935,000 | 2,277,230 |
| CMO Series 2013-170 Class WZ |
| 11/16/2043 | 3.000% | | 744,886 | 705,868 |
| Government National Mortgage Association(d) |
| 09/18/2044 | 4.500% | | 31,970,000 | 34,028,069 |
| 09/21/2047 | 3.000% | | 45,000 | 45,933 |
| 09/21/2047 | 3.500% | | 31,585,000 | 32,937,233 |
| 09/21/2047 | 4.000% | | 73,540,000 | 77,501,394 |
| Government National Mortgage Association(a) |
1-year CMT + 0.000%
03/20/2066 | 2.285% | | 901,688 | 917,021 |
1-year CMT + 0.000%
04/20/2066 | 1.848% | | 940,976 | 948,916 |
| CMO Series 2003-60 Class GS |
1-month USD LIBOR + 12.417%
05/16/2033 | 10.464% | | 416,431 | 474,818 |
| CMO Series 2004-26 Class XF |
1-month USD LIBOR + 0.300%
04/16/2034 | 1.472% | | 1,291,251 | 1,291,450 |
| CMO Series 2010-H26 Class LF |
1-month USD LIBOR + 0.350%
08/20/2058 | 1.426% | | 444,213 | 440,384 |
| CMO Series 2011-114 Class KF |
1-month USD LIBOR + 0.450%
03/20/2041 | 1.678% | | 608,385 | 610,055 |
| CMO Series 2011-H03 Class FA |
1-month USD LIBOR + 0.500%
01/20/2061 | 1.576% | | 1,572,248 | 1,571,359 |
| CMO Series 2012-H20 Class BA |
1-month USD LIBOR + 0.560%
09/20/2062 | 1.636% | | 398,959 | 399,798 |
| CMO Series 2012-H21 Class CF |
1-month USD LIBOR + 0.700%
05/20/2061 | 1.776% | | 374,288 | 375,237 |
| CMO Series 2012-H21 Class DF |
1-month USD LIBOR + 0.650%
05/20/2061 | 1.726% | | 333,734 | 334,472 |
| CMO Series 2012-H22 Class FD |
1-month USD LIBOR + 0.470%
01/20/2061 | 1.546% | | 525,797 | 526,638 |
| CMO Series 2012-H24 Class FD |
1-month USD LIBOR + 0.590%
09/20/2062 | 1.362% | | 745,619 | 747,131 |
| Residential Mortgage-Backed Securities - Agency (continued) |
| Issuer | Coupon
Rate | | Principal
Amount ($) | Value ($) |
| CMO Series 2013-115 Class EF |
1-month USD LIBOR + 0.250%
04/16/2028 | 1.422% | | 807,462 | 805,370 |
| CMO Series 2013-135 Class FH |
1-month USD LIBOR + 0.150%
09/16/2043 | 1.322% | | 2,939,014 | 2,936,108 |
| CMO Series 2013-H02 Class FD |
1-month USD LIBOR + 0.340%
12/20/2062 | 1.416% | | 512,383 | 509,526 |
| CMO Series 2013-H05 Class FB |
1-month USD LIBOR + 0.400%
02/20/2062 | 1.624% | | 458,828 | 458,854 |
| CMO Series 2013-H17 Class FA |
1-month USD LIBOR + 0.550%
07/20/2063 | 1.626% | | 819,252 | 820,848 |
| CMO Series 2013-H18 Class EA |
1-month USD LIBOR + 0.500%
07/20/2063 | 1.576% | | 826,099 | 825,617 |
| CMO Series 2013-H19 Class FC |
1-month USD LIBOR + 0.600%
08/20/2063 | 1.676% | | 5,282,531 | 5,300,118 |
| CMO Series 2016-H04 Class FG |
1-month USD LIBOR + 0.700%
12/20/2061 | 1.776% | | 1,292,375 | 1,297,339 |
| CMO Series 2016-H10 Class FJ |
1-month USD LIBOR + 0.600%
04/20/2066 | 1.676% | | 9,160,013 | 9,182,130 |
| CMO Series 2016-H13 Class FT |
1-month USD LIBOR + 0.580%
05/20/2066 | 1.656% | | 9,913,018 | 9,930,882 |
| Government National Mortgage Association(a),(e),(f) |
| CMO Series 2014-150 Class IO |
| 07/16/2056 | 0.849% | | 39,460,305 | 2,096,396 |
| CMO Series 2014-H05 Class AI |
| 02/20/2064 | 1.327% | | 7,421,392 | 564,287 |
| CMO Series 2014-H14 Class BI |
| 06/20/2064 | 1.626% | | 8,993,718 | 836,435 |
| CMO Series 2014-H15 Class HI |
| 05/20/2064 | 1.411% | | 11,631,675 | 844,298 |
| CMO Series 2014-H20 Class HI |
| 10/20/2064 | 1.172% | | 4,117,996 | 218,647 |
| CMO Series 2015-163 Class IO |
| 12/16/2057 | 0.803% | | 5,327,989 | 299,599 |
| CMO Series 2015-189 Class IG |
| 01/16/2057 | 0.932% | | 31,782,266 | 2,031,742 |
| CMO Series 2015-30 Class IO |
| 07/16/2056 | 1.056% | | 8,679,196 | 552,553 |
The accompanying Notes to Financial Statements are an integral part of this statement.
| 52 | Multi-Manager Total Return Bond Strategies Fund | Annual Report 2017 |
Portfolio of Investments (continued)
August 31, 2017
| Residential Mortgage-Backed Securities - Agency (continued) |
| Issuer | Coupon
Rate | | Principal
Amount ($) | Value ($) |
| CMO Series 2015-32 Class IO |
| 09/16/2049 | 0.873% | | 12,477,261 | 730,393 |
| CMO Series 2015-73 Class IO |
| 11/16/2055 | 0.813% | | 8,970,035 | 503,395 |
| CMO Series 2015-9 Class IO |
| 02/16/2049 | 1.017% | | 27,663,194 | 1,601,118 |
| CMO Series 2016-72 Class IO |
| 12/16/2055 | 0.896% | | 18,289,880 | 1,235,902 |
| Government National Mortgage Association(a),(c),(e),(f) |
| CMO Series 2015-H22 Class BI |
| 09/20/2065 | 1.772% | | 3,784,092 | 308,782 |
Total Residential Mortgage-Backed Securities - Agency
(Cost $1,434,815,358) | 1,437,280,568 |
|
| Residential Mortgage-Backed Securities - Non-Agency 3.3% |
| | | | |
| Ajax Mortgage Loan Trust(b) |
| CMO Series 2017-A Class A |
| 04/25/2057 | 3.470% | | 3,543,009 | 3,540,009 |
| ASG Resecuritization Trust(a),(b),(e) |
| CMO Series 2009-2 Class G70 |
| 05/24/2036 | 3.291% | | 1,131,923 | 1,130,111 |
| CMO Series 2009-2 Class G75 |
| 05/24/2036 | 3.291% | | 1,925,000 | 1,916,530 |
| Asset-Backed Securities Corp. Home Equity Loan Trust(a) |
| CMO Series 2006-HE1 Class A4 |
1-month USD LIBOR + 0.300%
01/25/2036 | 1.534% | | 3,230,000 | 2,998,484 |
| Banc of America Funding Trust |
| CMO Series 2006-3 Class 4A14 |
| 03/25/2036 | 6.000% | | 1,571,071 | 1,610,841 |
| CMO Series 2006-3 Class 5A3 |
| 03/25/2036 | 5.500% | | 1,381,910 | 1,312,460 |
| Banc of America Funding Trust(a),(p) |
| CMO Series 2006-D Class 3A1 |
| 05/20/2036 | 3.517% | | 2,139,148 | 1,960,683 |
| Bayview Opportunity Master Fund IIIb Trust(b) |
| CMO Series 2017-RN3 Class A1 |
| 05/28/2032 | 3.228% | | 3,373,715 | 3,378,828 |
| Bayview Opportunity Master Fund IVA Trust(b) |
| CMO Series 2016-SPL1 Class A |
| 04/28/2055 | 4.000% | | 3,284,425 | 3,420,134 |
| Bayview Opportunity Master Fund IVb Trust(a),(b),(e) |
| CMO Series 2017-RN1 Class A1 |
| 02/28/2032 | 3.598% | | 3,699,921 | 3,720,100 |
| Bayview Opportunity Master Fund IVb Trust(b) |
| CMO Series 2017-RPL1 Class A1 |
| 07/28/2032 | 3.105% | | 4,664,558 | 4,664,558 |
| Residential Mortgage-Backed Securities - Non-Agency (continued) |
| Issuer | Coupon
Rate | | Principal
Amount ($) | Value ($) |
| BCAP LLC Trust(a) |
| CMO Series 2007-AA1 Class 1A2 |
1-month USD LIBOR + 0.160%
02/25/2047 | 1.184% | | 201,760 | 202,762 |
| BCAP LLC Trust(a),(b),(e) |
| CMO Series 2012-RR10 Class 9A1 |
| 10/26/2035 | 3.312% | | 117,588 | 118,476 |
| CMO Series 2015-RR2 Class 23A1 |
| 03/28/2037 | 1.441% | | 2,056,479 | 2,038,793 |
| BCAP LLC Trust(b),(c) |
| CMO Series 2013-RR2 Class 7A1 |
| 07/26/2036 | 3.000% | | 249,307 | 249,307 |
| BCAP LLC Trust(b) |
| CMO Series 2013-RR5 Class 1A1 |
| 10/26/2036 | 3.500% | | 309,084 | 308,775 |
| CMO Series 2013-RR5 Class 3A1 |
| 09/26/2036 | 3.500% | | 459,195 | 458,506 |
| Carrington Mortgage Loan Trust(a) |
| CMO Series 2006-NC3 Class A3 |
1-month USD LIBOR + 0.150%
08/25/2036 | 1.384% | | 3,800,000 | 2,743,645 |
| CIM Trust(a),(b) |
| CMO Series 2017-3 Class A1 |
1-month USD LIBOR + 0.000%
01/25/2057 | 3.227% | | 7,144,466 | 7,245,740 |
| CIM Trust(b),(c) |
| CMO Series 2017-6 Class A1 |
| 09/25/2037 | 3.000% | | 17,995,000 | 18,016,810 |
| Citicorp Mortgage Securities Trust |
| CMO Series 2007-8 Class 1A3 |
| 09/25/2037 | 6.000% | | 1,061,100 | 1,095,617 |
| Citigroup Commercial Mortgage Trust(b),(f) |
| CMO Series 2017-1500 Class XCP |
| 07/15/2019 | 1.492% | | 153,533,000 | 3,940,148 |
| Citigroup Mortgage Loan Trust, Inc.(a),(b),(e) |
| CMO Series 2012-7 Class 12A1 |
| 03/25/2036 | 3.154% | | 78,780 | 78,809 |
| CMO Series 2012-9 Class 1A1 |
| 02/20/2036 | 3.179% | | 127,096 | 126,919 |
| CMO Series 2013-2 Class 1A1 |
| 11/25/2037 | 3.255% | | 413,416 | 415,338 |
| CMO Series 2014-12 Class 3A1 |
| 10/25/2035 | 3.554% | | 2,065,365 | 2,094,280 |
| CMO Series 2015-A Class A4 |
| 06/25/2058 | 4.250% | | 1,414,784 | 1,469,773 |
| Countrywide Home Equity Loan Trust |
| CMO Series 2007-S2 Class A3 (NPFGC) |
| 05/25/2037 | 5.813% | | 174,054 | 173,802 |
The accompanying Notes to Financial Statements are an integral part of this statement.
Multi-Manager Total Return Bond Strategies Fund | Annual Report 2017
| 53 |
Portfolio of Investments (continued)
August 31, 2017
| Residential Mortgage-Backed Securities - Non-Agency (continued) |
| Issuer | Coupon
Rate | | Principal
Amount ($) | Value ($) |
| CMO Series 2007-S2 Class A6 (NPFGC) |
| 05/25/2037 | 5.779% | | 130,403 | 132,819 |
| Countrywide Home Loan Mortgage Pass-Through Trust(a),(e) |
| CMO Series 2007-HY5 Class 1A1 |
| 09/25/2047 | 3.718% | | 1,035,433 | 1,005,268 |
| Credit Suisse Mortgage Capital Certificates(a),(b),(e) |
| CMO Series 2009-14R Class 4A9 |
| 10/26/2035 | 3.312% | | 3,776,000 | 3,797,901 |
| CMO Series 2011-12R Class 3A1 |
| 07/27/2036 | 3.206% | | 3,013,329 | 3,015,637 |
| CMO Series 2014-RPL4 Class A1 |
| 08/25/2062 | 3.625% | | 2,579,886 | 2,659,457 |
| Credit Suisse Mortgage Capital Certificates(a),(b) |
| CMO Series 2016-RPL1 Class A1 |
1-month USD LIBOR + 3.150%
12/26/2046 | 4.382% | | 7,109,468 | 7,138,617 |
| Credit-Based Asset Servicing & Securitization LLC(a),(e) |
| CMO Series 2005-CB7 Class AF3 |
| 11/25/2035 | 3.886% | | 1,403,697 | 1,403,688 |
| CMO Series 2007-CB1 Class AF3 |
| 01/25/2037 | 1.649% | | 4,538,601 | 2,235,432 |
| Downey Savings & Loan Association Mortgage Loan Trust(a) |
| CMO Series 2005-AR6 Class 2A1A |
1-month USD LIBOR + 0.290%
10/19/2045 | 1.521% | | 2,509,782 | 2,485,442 |
| CMO Series 2006-AR2 Class 2A1A |
1-month USD LIBOR + 0.200%
10/19/2036 | 1.431% | | 3,112,165 | 2,758,516 |
| Fannie Mae Connecticut Avenue Securities(a) |
| CMO Series 14-C02 Class 1M2 |
1-month USD LIBOR + 2.600%
05/25/2024 | 3.624% | | 1,390,000 | 1,445,480 |
| First Franklin Mortgage Loan Trust(a) |
| Series 2006-FF18 Class A2D |
1-month USD LIBOR + 0.210%
12/25/2037 | 1.444% | | 3,271,140 | 2,327,193 |
| Series 2007-FF2 Class A2B |
1-month USD LIBOR + 0.100%
03/25/2037 | 1.334% | | 5,524,334 | 3,376,190 |
| First Horizon Mortgage Pass-Through Trust(a),(e) |
| CMO Series 2007-AR1 Class 1A1 |
| 05/25/2037 | 3.332% | | 757,592 | 660,181 |
| Freddie Mac Structured Agency Credit Risk Debt Notes(a) |
| CMO Series 2014-DN2 Class M2 |
1-month USD LIBOR + 1.650%
04/25/2024 | 2.884% | | 2,645,707 | 2,683,771 |
| GCAT LLC(b) |
| CMO Series 20 17-2 Class A1 |
| 04/25/2047 | 3.500% | | 4,371,675 | 4,383,957 |
| Residential Mortgage-Backed Securities - Non-Agency (continued) |
| Issuer | Coupon
Rate | | Principal
Amount ($) | Value ($) |
| CMO Series 2017-3 Class A1 |
| 04/25/2047 | 3.352% | | 5,146,104 | 5,155,933 |
| GreenPoint Mortgage Funding Trust(a) |
| CMO Series 2006-AR8 Class 1A2A |
1-month USD LIBOR + 0.180%
01/25/2047 | 1.414% | | 91,680 | 92,423 |
| GSAMP Trust(a) |
| CMO Series 2004-OPT Class M1 |
1-month USD LIBOR + 0.870%
11/25/2034 | 1.894% | | 2,186,626 | 2,065,822 |
| GSR Mortgage Loan Trust(a),(e) |
| CMO Series 2006-AR2 Class 2A1 |
| 04/25/2036 | 3.442% | | 2,341,104 | 2,126,976 |
| HarborView Mortgage Loan Trust(a) |
| CMO Series 2007-4 Class 2A1 |
1-month USD LIBOR + 0.220%
07/19/2047 | 1.451% | | 984,075 | 957,782 |
| JPMorgan Mortgage Trust |
| CMO Series 2006-S2 Class 2A2 |
| 06/25/2021 | 5.875% | | 903,143 | 893,857 |
| CMO Series 2007-S1 Class 1A2 |
| 03/25/2022 | 5.500% | | 343,172 | 353,462 |
| JPMorgan Resecuritization Trust(a),(b),(e) |
| CMO Series 2014-1 Class 1016 |
| 03/26/2036 | 3.117% | | 4,000,000 | 3,983,355 |
| JPMorgan Resecuritization Trust(b) |
| CMO Series 2014-5 Class 6A |
| 09/27/2036 | 4.000% | | 686,639 | 692,407 |
| Legacy Mortgage Asset Trust(b) |
| CMO Series 2017-GS1 Class A1 |
| 01/25/2057 | 3.500% | | 4,916,581 | 4,919,294 |
| Lehman XS Trust(a) |
| CMO Series 2005-4 Class 1A3 |
1-month USD LIBOR + 0.800%
10/25/2035 | 2.034% | | 1,754,221 | 1,732,000 |
| CMO Series 2005-5N Class 3A1A |
1-month USD LIBOR + 0.300%
11/25/2035 | 1.534% | | 3,805,778 | 3,647,190 |
| Long Beach Mortgage Loan Trust(a) |
| CMO Series 2005-1 Class M3 |
1-month USD LIBOR + 0.870%
02/25/2035 | 1.894% | | 5,925,000 | 5,848,582 |
| MASTR Alternative Loan Trust |
| CMO Series 2004-12 Class 4A1 |
| 12/25/2034 | 5.500% | | 1,111,774 | 1,174,226 |
| Mill City Mortgage Trust(b) |
| CMO Series 2016-1 Class A1 |
| 04/25/2057 | 2.500% | | 1,597,471 | 1,605,390 |
The accompanying Notes to Financial Statements are an integral part of this statement.
| 54 | Multi-Manager Total Return Bond Strategies Fund | Annual Report 2017 |
Portfolio of Investments (continued)
August 31, 2017
| Residential Mortgage-Backed Securities - Non-Agency (continued) |
| Issuer | Coupon
Rate | | Principal
Amount ($) | Value ($) |
| Morgan Stanley Mortgage Loan Trust(a) |
| CMO Series 2005-2AR Class A |
1-month USD LIBOR + 0.260%
04/25/2035 | 1.476% | | 4,528,567 | 4,363,742 |
| Morgan Stanley Re-Remic Trust(a),(b),(e) |
| CMO Series 2010-R1 Class 2B |
| 07/26/2035 | 3.485% | | 911,328 | 912,561 |
| CMO Series 2013-R3 Class 10A |
| 10/26/2035 | 3.312% | | 160,093 | 159,997 |
| Morgan Stanley Resecuritization Trust(a),(b),(e) |
| CMO Series 2013-R9 Class 2A |
| 06/26/2046 | 3.259% | | 235,270 | 235,072 |
| CMO Series 2013-R9 Class 4A |
| 06/26/2046 | 3.334% | | 258,426 | 257,660 |
| Mortgage Repurchase Agreement Financing Trust(a),(b),(c) |
| CMO Series 2016-4 Class A1 |
1-month USD LIBOR + 1.200%
05/10/2019 | 2.424% | | 9,420,000 | 9,420,000 |
| CMO Series 2016-5 Class A |
1-month USD LIBOR + 1.170%
06/10/2019 | 2.401% | | 1,600,000 | 1,600,000 |
| Mortgage Repurchase Agreement Financing Trust(a),(b) |
| CMO Series 2017-1 Class A2 |
1-month USD LIBOR + 0.850%
07/10/2019 | 2.081% | | 3,730,000 | 3,730,926 |
| MortgageIT Trust(a) |
| CMO Series 2005-5 Class A1 |
1-month USD LIBOR + 0.260%
12/25/2035 | 1.754% | | 2,466,673 | 2,375,185 |
| Nationstar Home Equity Loan Trust(a) |
| CMO Series 2007-B Class 2AV3 |
1-month USD LIBOR + 0.250%
04/25/2037 | 1.484% | | 7,509,000 | 7,421,013 |
| Nomura Asset Acceptance Corp. Alternative Loan Trust(a),(e) |
| CMO Series 2007-1 Class 1A3 (AGM) |
| 03/25/2047 | 5.957% | | 80,172 | 80,582 |
| CMO Series 2007-1 Class 1A4 (AGM) |
| 03/25/2047 | 6.138% | | 507,753 | 510,274 |
| Nomura Resecuritization Trust(a),(b) |
| CMO Series 2014-6R Class 3A1 |
1-month USD LIBOR + 0.260%
01/26/2036 | 1.492% | | 1,237,932 | 1,197,699 |
| Oaktown Re Ltd.(a),(b),(c) |
| CMO Series 2017-1A Class M1 |
1-month USD LIBOR + 2.250%
04/25/2027 | 3.484% | | 4,913,753 | 4,913,753 |
| RALI Trust(a),(e) |
| CMO Series 2005-QA4 Class A41 |
| 04/25/2035 | 3.860% | | 1,367,000 | 1,338,478 |
| Residential Mortgage-Backed Securities - Non-Agency (continued) |
| Issuer | Coupon
Rate | | Principal
Amount ($) | Value ($) |
| RALI Trust(a),(e),(f) |
| CMO Series 2006-QS18 Class 1AV |
| 12/25/2036 | 0.440% | | 59,052,007 | 969,386 |
| CMO Series 2006-QS9 Class 1AV |
| 07/25/2036 | 0.601% | | 27,671,527 | 602,050 |
| CMO Series 2007-QS1 Class 2AV |
| 01/25/2037 | 0.173% | | 59,117,258 | 350,021 |
| Residential Asset Mortgage Products Trust(a) |
| CMO Series 2006-RZ3 Class A3 |
1-month USD LIBOR + 0.290%
08/25/2036 | 1.524% | | 4,147,241 | 4,115,346 |
| RFMSI Trust(a),(e) |
| CMO Series 2005-SA5 Class 1A |
| 11/25/2035 | 3.492% | | 2,278,800 | 1,883,154 |
| CMO Series 2006-SA4 Class 2A1 |
| 11/25/2036 | 4.532% | | 644,644 | 615,299 |
| Securitized Asset-Backed Receivables LLC Trust(a) |
| Subordinated, Series 2006-OP1 Class M2 |
1-month USD LIBOR + 0.390%
10/25/2035 | 1.624% | | 6,421,000 | 6,235,545 |
| Structured Adjustable Rate Mortgage Loan Trust(a),(e) |
| CMO Series 2004-20 Class 1A2 |
| 01/25/2035 | 3.336% | | 1,320,936 | 1,263,007 |
| CMO Series 2006-5 Class 1A1 |
| 06/25/2036 | 3.619% | | 2,299,362 | 2,198,641 |
| Structured Asset Securities Corp. Mortgage Loan Trust(a),(b) |
| CMO Series 2006-GEL4 Class A3 |
1-month USD LIBOR + 0.300%
10/25/2036 | 1.534% | | 7,288,982 | 7,174,030 |
| Vericrest Opportunity Loan Transferee LVII LLC(b) |
| CMO Series 2017-NPL4 Class A1 |
| 04/25/2047 | 3.375% | | 834,185 | 841,579 |
| Vericrest Opportunity Loan Transferee LX LLC(b) |
| CMO Series 2017-NPL7 Class A1 |
| 04/25/2059 | 3.250% | | 933,719 | 935,164 |
| Verus Securitization Trust(a),(b),(e) |
| CMO Series 2017-2A Class A3 |
| 07/25/2047 | 2.845% | | 3,938,491 | 3,937,944 |
| VML LLC(b) |
| CMO Series 2014-NPL1 Class A1 |
| 04/27/2054 | 3.875% | | 92,219 | 92,262 |
| WaMu Asset-Backed Certificates(a) |
| CMO Series 2007-HE1 Class 2A3 |
1-month USD LIBOR + 0.150%
01/25/2037 | 1.174% | | 5,445,386 | 3,318,813 |
| WaMu Mortgage Pass-Through Certificates(a) |
| CMO Series 2006-AR4 Class 1A1A |
1-year MTA + 0.940%
05/25/2046 | 1.672% | | 3,392,084 | 3,324,017 |
The accompanying Notes to Financial Statements are an integral part of this statement.
Multi-Manager Total Return Bond Strategies Fund | Annual Report 2017
| 55 |
Portfolio of Investments (continued)
August 31, 2017
| Residential Mortgage-Backed Securities - Non-Agency (continued) |
| Issuer | Coupon
Rate | | Principal
Amount ($) | Value ($) |
| WaMu Mortgage Pass-Through Certificates Trust(a),(e) |
| CMO Series 2003-AR8 Class A |
| 08/25/2033 | 3.211% | | 916,152 | 925,594 |
| CMO Series 2007-HY1 Class 3A3 |
| 02/25/2037 | 3.172% | | 6,262,057 | 5,939,429 |
| CMO Series 2007-HY3 Class 1A1 |
| 03/25/2037 | 2.807% | | 965,801 | 864,953 |
| WaMu Mortgage Pass-Through Certificates Trust(a) |
| CMO Series 2005-AR11 Class A1A |
1-month USD LIBOR + 0.320%
08/25/2045 | 1.554% | | 2,257,335 | 2,262,287 |
| CMO Series 2005-AR17 Class A1A1 |
1-month USD LIBOR + 0.270%
12/25/2045 | 1.504% | | 5,507,426 | 5,276,381 |
| CMO Series 2005-AR2 Class 2A1A |
1-month USD LIBOR + 0.310%
01/25/2045 | 1.854% | | 2,357,766 | 2,295,999 |
| CMO Series 2005-AR8 Class 2A1A |
1-month USD LIBOR + 0.290%
07/25/2045 | 1.604% | | 1,910,710 | 1,880,727 |
| CMO Series 2005-AR9 Class A1A |
1-month USD LIBOR + 0.640%
07/25/2045 | 1.664% | | 1,713,236 | 1,706,609 |
| CMO Series 2006-AR5 Class A12A |
1-year MTA + 0.980%
06/25/2046 | 1.712% | | 1,018,208 | 1,006,563 |
| CMO Series 2007-OC2 Class A3 |
1-month USD LIBOR + 0.310%
06/25/2037 | 1.544% | | 4,293,964 | 3,872,844 |
Total Residential Mortgage-Backed Securities - Non-Agency
(Cost $233,991,899) | 249,593,072 |
|
| Senior Loans 0.2% |
| Borrower | Weighted
Average Coupon | | Principal
Amount ($) | Value ($) |
| Consumer Products 0.0% |
| Serta Simmons Holdings LLC(a),(q) |
| 2nd Lien Term Loan |
3-month USD LIBOR + 8.000%
11/08/2024 | 9.312% | | 271,057 | 261,402 |
| Electric 0.0% |
| Power Buyer LLC(a),(q) |
| 1st Lien Term Loan |
3-month USD LIBOR + 3.250%
05/06/2020 | 4.546% | | 1,352,971 | 1,339,441 |
| Senior Loans (continued) |
| Borrower | Weighted
Average Coupon | | Principal
Amount ($) | Value ($) |
| Vistra Operations Co. LLC(a),(q) |
| Term Loan |
3-month USD LIBOR + 4.000%
08/04/2023 | 3.987% | | 130,263 | 130,245 |
| Tranche C Term Loan |
3-month USD LIBOR + 4.000%
08/04/2023 | 3.982% | | 29,859 | 29,854 |
| Total | 1,499,540 |
| Environmental 0.0% |
| STI Infrastructure SARL(a),(c),(q) |
| Term Loan |
3-month USD LIBOR + 5.250%
08/22/2020 | 6.546% | | 673,372 | 643,070 |
| Gaming 0.1% |
| Golden Nugget, Inc.(a),(q) |
| Delayed Draw Term Loan |
3-month USD LIBOR + 4.500%
11/21/2019 | 4.740% | | 259,498 | 260,310 |
| Term Loan |
3-month USD LIBOR + 4.500%
11/21/2019 | 4.740% | | 605,495 | 607,390 |
| Twin River Management Group, Inc.(a),(q) |
| Term Loan |
3-month USD LIBOR + 4.250%
07/10/2020 | 4.796% | | 1,185,519 | 1,192,194 |
| Total | 2,059,894 |
| Independent Energy 0.0% |
| Chesapeake Energy Corp.(a),(q) |
| Tranche A Term Loan |
3-month USD LIBOR + 7.500%
08/23/2021 | 8.814% | | 160,811 | 170,728 |
| EMG Utica LLC(a),(q) |
| Term Loan |
3-month USD LIBOR + 3.750%
03/27/2020 | 5.191% | | 857,570 | 862,930 |
| Total | 1,033,658 |
| Oil Field Services 0.0% |
| Drillships Ocean Ventures, Inc.(a),(q) |
| Term Loan |
3-month USD LIBOR + 4.500%
07/25/2021 | 0.000% | | 1,462,500 | 1,204,735 |
| Other Industry 0.0% |
| EIF Channelview Cogeneration LLC(a),(q) |
| Term Loan |
3-month USD LIBOR + 3.250%
05/08/2020 | 4.489% | | 752,000 | 701,240 |
The accompanying Notes to Financial Statements are an integral part of this statement.
| 56 | Multi-Manager Total Return Bond Strategies Fund | Annual Report 2017 |
Portfolio of Investments (continued)
August 31, 2017
| Senior Loans (continued) |
| Borrower | Weighted
Average Coupon | | Principal
Amount ($) | Value ($) |
| Other REIT 0.0% |
| Lightstone Holdco LLC(a),(q) |
| Tranche B Term Loan |
3-month USD LIBOR + 4.500%
01/30/2024 | 5.739% | | 1,725,233 | 1,713,277 |
| Tranche C Term Loan |
3-month USD LIBOR + 4.500%
01/30/2024 | 5.739% | | 107,500 | 106,755 |
| Total | 1,820,032 |
| Packaging 0.0% |
| Reynolds Group Holdings, Inc.(a),(q) |
| Term Loan |
3-month USD LIBOR + 3.000%
02/05/2023 | 4.239% | | 580,620 | 580,899 |
| Pharmaceuticals 0.0% |
| Valeant Pharmaceuticals International, Inc.(a),(q) |
| Tranche B-F Term Loan |
3-month USD LIBOR + 3.000%
04/01/2022 | 5.990% | | 590,873 | 600,723 |
| Technology 0.1% |
| Ancestry.com Operations, Inc.(a),(q) |
| 2nd Lien Term Loan |
3-month USD LIBOR + 8.250%
10/19/2024 | 9.490% | | 82,535 | 83,464 |
| Ascend Learning LLC(a),(m),(q) |
| Term Loan |
3-month USD LIBOR + 3.250%
07/12/2024 | 0.000% | | 23,000 | 23,077 |
| BMC Software Finance, Inc.(a),(q) |
| Tranche B1 Term Loan |
3-month USD LIBOR + 4.000%
09/10/2022 | 5.239% | | 430,574 | 431,832 |
| Dell International LLC(a),(q) |
| Tranche A3 Term Loan |
3-month USD LIBOR + 1.750%
12/31/2018 | 2.436% | | 3,400,000 | 3,403,196 |
| First Data Corp.(a),(q) |
| Term Loan |
3-month USD LIBOR + 2.250%
07/08/2022 | 3.486% | | 1,374,288 | 1,372,570 |
| Hyland Software, Inc.(a),(q) |
| Tranche 1 1st Lien Term Loan |
3-month USD LIBOR + 3.250%
07/01/2022 | 4.489% | | 28,788 | 29,004 |
| Information Resources, Inc.(a),(q) |
| 2nd Lien Term Loan |
3-month USD LIBOR + 8.250%
01/20/2025 | 9.486% | | 340,000 | 338,725 |
| Senior Loans (continued) |
| Borrower | Weighted
Average Coupon | | Principal
Amount ($) | Value ($) |
| Kronos, Inc.(a),(q) |
| 2nd Lien Term Loan |
3-month USD LIBOR + 8.250%
11/01/2024 | 9.561% | | 129,000 | 133,192 |
| Misys Ltd.(a),(q) |
| 1st Lien Term Loan |
3-month USD LIBOR + 3.500%
06/13/2024 | 4.817% | | 74,661 | 74,978 |
| 2nd Lien Term Loan |
3-month USD LIBOR + 7.250%
06/13/2025 | 8.567% | | 28,472 | 28,948 |
| Total | 5,918,986 |
Total Senior Loans
(Cost $16,536,480) | 16,324,179 |
|
| Treasury Bills(r) 0.3% |
| Issuer | Effective
Yield | | Principal
Amount ($) | Value ($) |
| Japan 0.1% |
| Japan Treasury Discount Bill |
| 09/25/2017 | (0.050%) | JPY | 1,060,000,000 | 9,642,366 |
| Total | | | | 9,642,366 |
| Spain 0.0% |
| Instituto de Credito Oficial(b) |
| 09/14/2018 | 1.840% | | 1,900,000 | 1,895,841 |
| Total | | | | 1,895,841 |
| United States 0.2% |
| U.S. Treasury |
| 08/31/2019 | 1.330% | | 10,860,000 | 10,842,904 |
| Total | | | | 10,842,904 |
| U.S. Treasury Bills(n) |
| 09/07/2017 | 0.930% | | 1,192,000 | 1,191,789 |
| Total | | | | 1,191,789 |
| Total | 12,034,693 |
Total Treasury Bills
(Cost $23,463,660) | 23,572,900 |
|
| U.S. Government & Agency Obligations 1.6% |
| Issuer | Coupon
Rate | | Principal
Amount ($) | Value ($) |
| Federal Home Loan Banks Discount Notes |
| 09/08/2017 | 0.000% | | 5,260,000 | 5,258,753 |
| 11/13/2017 | 0.000% | | 17,745,000 | 17,707,132 |
| 12/04/2017 | 0.000% | | 26,000,000 | 25,928,786 |
| 12/11/2017 | 0.000% | | 24,690,000 | 24,616,720 |
| 12/13/2017 | 0.000% | | 29,080,000 | 28,991,772 |
The accompanying Notes to Financial Statements are an integral part of this statement.
Multi-Manager Total Return Bond Strategies Fund | Annual Report 2017
| 57 |
Portfolio of Investments (continued)
August 31, 2017
| U.S. Government & Agency Obligations (continued) |
| Issuer | Coupon
Rate | | Principal
Amount ($) | Value ($) |
| Federal Home Loan Mortgage Corp. Discount Notes |
| 09/08/2017 | 0.000% | | 2,000,000 | 1,999,513 |
| Federal National Mortgage Association(s) |
| STRIPS |
| 05/15/2030 | 0.000% | | 1,000,000 | 683,380 |
| Residual Funding Corp.(s) |
| STRIPS |
| 01/15/2030 | 0.000% | | 10,536,000 | 7,306,505 |
| 04/15/2030 | 0.000% | | 12,999,000 | 9,100,184 |
Total U.S. Government & Agency Obligations
(Cost $121,405,404) | 121,592,745 |
|
| U.S. Treasury Obligations 18.7% |
| | | | |
| U.S. Treasury |
| 10/31/2017 | 0.750% | | 98,135,000 | 98,074,251 |
| 07/31/2019 | 1.375% | | 77,110,000 | 77,185,943 |
| 07/15/2020 | 1.500% | | 1,450,000 | 1,453,096 |
| 08/15/2020 | 1.500% | | 46,785,000 | 46,872,796 |
| 05/15/2021 | 3.125% | | 4,005,000 | 4,230,537 |
| 05/31/2021 | 1.375% | | 1,865,000 | 1,851,620 |
| 08/15/2021 | 2.125% | | 84,600,000 | 86,324,866 |
| 08/31/2021 | 2.000% | | 27,100,000 | 27,509,522 |
| 09/30/2021 | 2.125% | | 10,000,000 | 10,199,514 |
| 10/31/2021 | 2.000% | | 10,045,000 | 10,193,664 |
| 07/31/2022 | 1.875% | | 324,742,000 | 327,181,533 |
| 11/30/2022 | 2.000% | | 2,765,000 | 2,798,234 |
| 08/15/2023 | 2.500% | | 1,685,000 | 1,748,014 |
| 02/29/2024 | 2.125% | | 765,000 | 775,548 |
| 11/15/2025 | 2.250% | | 12,160,000 | 12,349,422 |
| 05/15/2027 | 2.375% | | 62,880,000 | 64,251,644 |
| 08/15/2027 | 2.250% | | 101,751,600 | 102,916,807 |
| 02/15/2031 | 5.375% | | 11,315,000 | 15,449,034 |
| 05/15/2039 | 4.250% | | 64,745,000 | 82,935,652 |
| 05/15/2041 | 4.375% | | 6,088,000 | 7,977,011 |
| 11/15/2041 | 3.125% | | 21,135,000 | 22,933,516 |
| 02/15/2043 | 3.125% | | 980,000 | 1,060,096 |
| U.S. Treasury Obligations (continued) |
| Issuer | Coupon
Rate | | Principal
Amount ($) | Value ($) |
| 08/15/2043 | 3.625% | | 3,835,000 | 4,511,818 |
| 05/15/2045 | 3.000% | | 13,075,000 | 13,811,396 |
| 08/15/2045 | 2.875% | | 2,000,000 | 2,061,434 |
| 11/15/2046 | 2.875% | | 5,925,000 | 6,102,114 |
| 02/15/2047 | 3.000% | | 1,745,000 | 1,842,650 |
| 05/15/2047 | 3.000% | | 158,767,000 | 167,735,464 |
| 08/15/2047 | 2.750% | | 12,935,000 | 13,000,826 |
| U.S. Treasury(d) |
| 08/31/2022 | 1.625% | | 71,915,000 | 71,634,624 |
| U.S. Treasury(n) |
| 07/31/2024 | 2.125% | | 69,678,000 | 70,505,277 |
| 11/15/2040 | 4.250% | | 15,275,000 | 19,634,688 |
| 05/15/2043 | 2.875% | | 19,355,000 | 20,011,483 |
| U.S. Treasury(n),(s) |
| STRIPS |
| 05/15/2043 | 0.000% | | 25,207,000 | 12,324,844 |
| U.S. Treasury(s) |
| STRIPS |
| 02/15/2045 | 0.000% | | 19,275,000 | 8,919,958 |
Total U.S. Treasury Obligations
(Cost $1,410,543,825) | 1,418,368,896 |
| Money Market Funds 4.0% |
| | Shares | Value ($) |
| Columbia Short-Term Cash Fund, 1.146%(j),(t) | 305,159,668 | 305,159,668 |
Total Money Market Funds
(Cost $305,159,668) | 305,159,668 |
Total Investments
(Cost: $7,939,710,517) | 8,034,650,608 |
| Other Assets & Liabilities, Net | | (464,409,270) |
| Net Assets | 7,570,241,338 |
At August 31, 2017, securities and/or cash totaling $37,933,455 were pledged as collateral.
Investments in derivatives
| Forward foreign currency exchange contracts |
Currency to
be sold | Currency to
be purchased | Counterparty | Settlement
date | Unrealized
appreciation ($) | Unrealized
depreciation ($) |
| 1,060,000,000 JPY | 9,574,261 USD | Goldman Sachs | 09/25/2017 | — | (76,952) |
| Long futures contracts |
| Description | Number of
contracts | Expiration
date | Trading
currency | Notional
amount | Value/Unrealized
appreciation ($) | Value/Unrealized
depreciation ($) |
| 90-Day Euro$ | 240 | 12/2017 | USD | 59,151,000 | — | (626) |
| U.S. Treasury 10-Year Note | 1,319 | 12/2017 | USD | 168,255,980 | 494,484 | — |
| U.S. Treasury 10-Year Note | 63 | 12/2017 | USD | 8,036,487 | — | (19,791) |
The accompanying Notes to Financial Statements are an integral part of this statement.
| 58 | Multi-Manager Total Return Bond Strategies Fund | Annual Report 2017 |
Portfolio of Investments (continued)
August 31, 2017
| Long futures contracts (continued) |
| Description | Number of
contracts | Expiration
date | Trading
currency | Notional
amount | Value/Unrealized
appreciation ($) | Value/Unrealized
depreciation ($) |
| U.S. Treasury 2-Year Note | 985 | 12/2017 | USD | 215,122,178 | 100,704 | — |
| U.S. Treasury 2-Year Note | 317 | 12/2017 | USD | 69,232,214 | 386 | — |
| U.S. Treasury 5-Year Note | 5,962 | 12/2017 | USD | 708,107,157 | 1,514,751 | — |
| U.S. Treasury 5-Year Note | 590 | 12/2017 | USD | 70,074,341 | 159,517 | — |
| U.S. Treasury 5-Year Note | 113 | 12/2017 | USD | 13,421,018 | — | (7,003) |
| U.S. Treasury Ultra 10-Year Note | 324 | 12/2017 | USD | 44,737,570 | 280,997 | — |
| U.S. Ultra Bond | 934 | 12/2017 | USD | 160,330,702 | 1,329,939 | — |
| Total | | | | | 3,880,778 | (27,420) |
| Short futures contracts |
| Description | Number of
contracts | Expiration
date | Trading
currency | Notional
amount | Value/Unrealized
appreciation ($) | Value/Unrealized
depreciation ($) |
| 90-Day Euro$ | (240) | 12/2018 | USD | (59,028,000) | — | (51,626) |
| U.S. Long Bond | (335) | 12/2017 | USD | (52,833,855) | — | (380,486) |
| U.S. Treasury 10-Year Note | (120) | 12/2017 | USD | (15,307,595) | — | (10,268) |
| U.S. Treasury 2-Year Note | (1,704) | 12/2017 | USD | (372,150,448) | — | (37,073) |
| U.S. Treasury Ultra 10-Year Note | (198) | 12/2017 | USD | (27,339,626) | — | (75,741) |
| U.S. Ultra Bond | (62) | 12/2017 | USD | (10,642,937) | — | (58,283) |
| Total | | | | | — | (613,477) |
| Cleared interest rate swap contracts |
| Fund receives | Fund pays | Payment
frequency | Counterparty | Maturity
date | Notional
currency | Notional
amount | Value
($) | Upfront
payments
($) | Upfront
receipts
($) | Unrealized
appreciation
($) | Unrealized
depreciation
($) |
| 1-Day Overnight Fed Funds Effective Rate | Fixed rate of 0.539% | Receives Annually, Pays Annually | JPMorgan | 09/09/2017 | USD | 351,015,000 | 825,422 | 1,050 | — | 825,422 | — |
| 1-Day Overnight Fed Funds Effective Rate | Fixed rate of 0.590% | Receives Annually, Pays Annually | JPMorgan | 10/21/2017 | USD | 84,800,000 | 393,175 | 24 | — | 393,175 | — |
| 1-Day Overnight Fed Funds Effective Rate | Fixed rate of 0.639% | Receives Annually, Pays Annually | JPMorgan | 11/01/2017 | USD | 83,390,000 | 203,406 | 48 | — | 203,406 | — |
| 1-Day Overnight Fed Funds Effective Rate | Fixed rate of 0.675% | Receives Annually, Pays Annually | JPMorgan | 11/14/2017 | USD | 163,750,000 | 386,542 | — | (2,907) | 386,542 | — |
| 1-Day Overnight Fed Funds Effective Rate | Fixed rate of 0.716% | Receives Annually, Pays Annually | JPMorgan | 11/22/2017 | USD | 81,635,000 | 171,190 | 39 | — | 171,190 | — |
| 1-Day Overnight Fed Funds Effective Rate | Fixed rate of 1.093% | Receives Annually, Pays Annually | JPMorgan | 01/07/2018 | USD | 114,520,000 | 9,936 | 94 | — | 9,936 | — |
| 1-Day Overnight Fed Funds Effective Rate | Fixed rate of 1.280% | Receives Annually, Pays Annually | JPMorgan | 01/31/2018 | USD | 705,000,000 | (54,440) | 373 | — | — | (54,440) |
| 3-Month USD LIBOR | Fixed rate of 1.391% | Receives Quarterly, Pays Semi annually | JPMorgan | 03/30/2018 | USD | 892,500,000 | (3,291,539) | 529 | — | — | (3,291,539) |
| 1-Day Overnight Fed Funds Effective Rate | Fixed rate of 0.655% | Receives Annually, Pays Annually | JPMorgan | 09/30/2018 | USD | 64,700,000 | 518,453 | 6,320 | — | 518,453 | — |
| 1-Day Overnight Fed Funds Effective Rate | Fixed rate of 1.253% | Receives Annually, Pays Annually | JPMorgan | 10/07/2018 | USD | 37,880,000 | (46,578) | 135 | — | — | (46,578) |
| 1-Day Overnight Fed Funds Effective Rate | Fixed rate of 1.080% | Receives Annually, Pays Annually | JPMorgan | 11/17/2018 | USD | 81,845,000 | 162,535 | 172 | — | 162,535 | — |
The accompanying Notes to Financial Statements are an integral part of this statement.
Multi-Manager Total Return Bond Strategies Fund | Annual Report 2017
| 59 |
Portfolio of Investments (continued)
August 31, 2017
| Cleared interest rate swap contracts (continued) |
| Fund receives | Fund pays | Payment
frequency | Counterparty | Maturity
date | Notional
currency | Notional
amount | Value
($) | Upfront
payments
($) | Upfront
receipts
($) | Unrealized
appreciation
($) | Unrealized
depreciation
($) |
| 1-Day Overnight Fed Funds Effective Rate | Fixed rate of 0.911% | Receives Annually, Pays Annually | JPMorgan | 11/18/2018 | USD | 123,045,000 | 460,072 | — | (3,994) | 460,072 | — |
| 1-Day Overnight Fed Funds Effective Rate | Fixed rate of 1.431% | Receives Annually, Pays Annually | JPMorgan | 03/31/2019 | USD | 67,286,000 | (183,256) | 196 | — | — | (183,256) |
| 1-Day Overnight Fed Funds Effective Rate | Fixed rate of 1.502% | Receives Annually, Pays Annually | JPMorgan | 06/30/2019 | USD | 35,945,000 | (79,272) | — | (39,727) | — | (79,272) |
| 3-Month USD LIBOR | Fixed rate of 1.476% | Receives Quarterly, Pays Semi annually | JPMorgan | 12/31/2022 | USD | 146,365,000 | (2,671,782) | 5,034,351 | — | — | (2,671,782) |
| 3-Month USD LIBOR | Fixed rate of 2.115% | Receives Quarterly, Pays Semi annually | JPMorgan | 02/15/2024 | USD | 3,420,000 | (53,153) | 113 | — | — | (53,153) |
| 3-Month USD LIBOR | Fixed rate of 2.151% | Receives Quarterly, Pays Semi annually | JPMorgan | 02/15/2024 | USD | 6,690,000 | (118,727) | 129 | — | — | (118,727) |
| 3-Month USD LIBOR | Fixed rate of 2.167% | Receives Quarterly, Pays Semi annually | JPMorgan | 02/15/2024 | USD | 42,560,000 | (568,302) | — | (228,344) | — | (568,302) |
| 3-Month USD LIBOR | Fixed rate of 1.956% | Receives Quarterly, Pays Semi annually | JPMorgan | 05/15/2024 | USD | 69,165,000 | (489,536) | 193,475 | — | — | (489,536) |
| 1-Day Overnight Fed Funds Effective Rate | Fixed rate of 1.965% | Receives Annually, Pays Annually | JPMorgan | 02/15/2027 | USD | 8,075,000 | (162,480) | 156 | — | — | (162,480) |
| 1-Day Overnight Fed Funds Effective Rate | Fixed rate of 1.824% | Receives Annually, Pays Annually | JPMorgan | 02/15/2027 | USD | 14,238,000 | (269,823) | 159,471 | — | — | (269,823) |
| 1-Day Overnight Fed Funds Effective Rate | Fixed rate of 2.067% | Receives Annually, Pays Annually | JPMorgan | 02/15/2027 | USD | 15,490,000 | (441,787) | — | (9,357) | — | (441,787) |
| 3-Month USD LIBOR | Fixed rate of 2.309% | Receives Quarterly, Pays Semi annually | JPMorgan | 05/08/2027 | USD | 8,490,000 | (248,903) | 157 | — | — | (248,903) |
| 1-Day Overnight Fed Funds Effective Rate | Fixed rate of 1.823% | Receives Annually, Pays Annually | JPMorgan | 05/15/2027 | USD | 5,535,000 | (29,691) | 140 | — | — | (29,691) |
| Fixed rate of 2.434% | 3-Month USD LIBOR | Receives Semi annually, Pays Quarterly | JPMorgan | 05/03/2032 | USD | 16,855,000 | 551,016 | 322 | — | 551,016 | — |
| Fixed rate of 2.338% | 3-Month USD LIBOR | Receives Semi annually, Pays Quarterly | JPMorgan | 02/15/2036 | USD | 28,095,000 | 283,640 | — | (169,769) | 283,640 | — |
| 3-Month USD LIBOR | Fixed rate of 2.508% | Receives Quarterly, Pays Semi annually | JPMorgan | 05/03/2037 | USD | 13,340,000 | (500,617) | 312 | — | — | (500,617) |
| 1-Day Overnight Fed Funds Effective Rate | Fixed rate of 1.369% | Receives Annually, Pays Annually | JPMorgan | 02/15/2042 | USD | 4,280,000 | 517,937 | 171 | — | 517,937 | — |
| 1-Day Overnight Fed Funds Effective Rate | Fixed rate of 1.380% | Receives Annually, Pays Annually | JPMorgan | 09/27/2046 | USD | 2,780,000 | 373,626 | 146 | — | 373,626 | — |
| Total | | | | | | | (4,352,936) | 5,397,923 | (454,098) | 4,856,950 | (9,209,886) |
The accompanying Notes to Financial Statements are an integral part of this statement.
| 60 | Multi-Manager Total Return Bond Strategies Fund | Annual Report 2017 |
Portfolio of Investments (continued)
August 31, 2017
| Credit default swap contracts - buy protection |
Reference
entity | Counterparty | Maturity
date | Pay
fixed
rate
(%) | Payment
frequency | Notional
currency | Notional
amount | Value
($) | Periodic
payments
receivable
(payable)
($) | Upfront
payments
($) | Upfront
receipts
($) | Unrealized
appreciation
($) | Unrealized
depreciation
($) |
| Home Depot, Inc. | Barclays | 06/20/2022 | 1.000 | Quarterly | USD | 14,370,000 | (488,800) | (29,139) | — | (434,259) | — | (83,680) |
| International Business Machines Corp. | Barclays | 06/20/2022 | 1.000 | Quarterly | USD | 2,055,000 | (63,810) | (4,167) | — | (53,504) | — | (14,473) |
| McDonald’s Corp. | Barclays | 06/20/2022 | 1.000 | Quarterly | USD | 1,470,000 | (49,523) | (2,981) | — | (44,069) | — | (8,435) |
| PulteGroup, Inc. | Barclays | 06/20/2022 | 5.000 | Quarterly | USD | 2,060,000 | (375,726) | (20,886) | — | (338,813) | — | (57,799) |
| Weyerhaeuser Co. | Barclays | 06/20/2022 | 1.000 | Quarterly | USD | 4,940,000 | (118,375) | (10,017) | — | (131,070) | 2,678 | — |
| Carnival Corp. | Citi | 12/20/2022 | 1.000 | Quarterly | USD | 5,165,000 | (174,708) | (10,473) | — | (176,185) | — | (8,996) |
| Eastman Chemical Co. | Citi | 12/20/2021 | 1.000 | Quarterly | USD | 3,480,000 | (81,413) | (7,057) | — | (28,166) | — | (60,304) |
| Energy Transfer Partners LP | Citi | 12/20/2021 | 1.000 | Quarterly | USD | 880,000 | (7,025) | (1,784) | 29,864 | — | — | (38,673) |
| Energy Transfer Partners LP | Citi | 12/20/2021 | 1.000 | Quarterly | USD | 1,760,000 | (14,049) | (3,569) | 55,092 | — | — | (72,710) |
| International Business Machines Corp. | Citi | 06/20/2022 | 1.000 | Quarterly | USD | 6,160,000 | (191,275) | (12,491) | — | (158,953) | — | (44,813) |
| Lowe’s Companies, Inc. | Citi | 06/20/2022 | 1.000 | Quarterly | USD | 6,160,000 | (202,237) | (12,491) | — | (197,052) | — | (17,676) |
| Markit CDX Emerging Markets Index, Series 27 | Citi | 06/20/2022 | 1.000 | Quarterly | USD | 7,346,538 | 260,818 | (14,897) | 330,886 | — | — | (84,965) |
| Markit CDX Emerging Markets Index, Series 27 | Citi | 06/20/2022 | 1.000 | Quarterly | USD | 12,301,471 | 436,730 | (24,945) | 544,190 | — | — | (132,405) |
| Markit CDX Emerging Markets Index, Series 27 | Citi | 06/20/2022 | 1.000 | Quarterly | USD | 17,573,529 | 623,899 | (35,635) | 777,414 | — | — | (189,150) |
| Markit CDX Emerging Markets Index, Series 27 | Citi | 06/20/2022 | 1.000 | Quarterly | USD | 24,488,462 | 869,394 | (49,657) | 1,097,003 | — | — | (277,266) |
| Time Warner, Inc. | Citi | 06/20/2022 | 1.000 | Quarterly | USD | 5,892,000 | (126,608) | (11,948) | — | (167,550) | 28,994 | — |
| Carnival Corp. | Credit Suisse | 12/20/2022 | 1.000 | Quarterly | USD | 4,330,000 | (146,463) | (8,780) | — | (148,103) | — | (7,140) |
| Lowe’s Companies, Inc. | Credit Suisse | 06/20/2022 | 1.000 | Quarterly | USD | 4,105,000 | (134,771) | (8,324) | — | (137,183) | — | (5,912) |
| Carnival Corp. | Goldman Sachs International | 12/20/2022 | 1.000 | Quarterly | USD | 5,165,000 | (174,707) | (10,473) | — | (180,219) | — | (4,961) |
| Eastman Chemical Co. | Goldman Sachs International | 12/20/2021 | 1.000 | Quarterly | USD | 1,745,000 | (40,825) | (3,538) | — | (10,577) | — | (33,786) |
| Eastman Chemical Co. | Goldman Sachs International | 06/20/2022 | 1.000 | Quarterly | USD | 3,090,000 | (71,094) | (6,266) | — | (79,206) | 1,846 | — |
| Energy Transfer Partners LP | Goldman Sachs International | 12/20/2021 | 1.000 | Quarterly | USD | 880,000 | (7,024) | (1,784) | 27,573 | — | — | (36,381) |
| Energy Transfer Partners LP | Goldman Sachs International | 12/20/2021 | 1.000 | Quarterly | USD | 2,640,000 | (21,073) | (5,353) | 72,604 | — | — | (99,030) |
| General Electric Co. | Goldman Sachs International | 06/20/2022 | 1.000 | Quarterly | USD | 9,880,000 | (297,265) | (20,034) | — | (308,675) | — | (8,624) |
| General Mills, Inc. | Goldman Sachs International | 06/20/2022 | 1.000 | Quarterly | USD | 3,015,000 | (83,217) | (6,114) | — | (88,508) | — | (823) |
| General Mills, Inc. | Goldman Sachs International | 12/20/2022 | 1.000 | Quarterly | USD | 5,165,000 | (137,696) | (10,473) | — | (142,900) | — | (5,269) |
| General Motors Co. | Goldman Sachs International | 06/20/2022 | 5.000 | Quarterly | USD | 5,135,000 | (890,569) | (52,063) | — | (827,828) | — | (114,804) |
| Home Depot, Inc. | Goldman Sachs International | 06/20/2022 | 1.000 | Quarterly | USD | 10,265,000 | (349,167) | (20,815) | — | (310,134) | — | (59,848) |
| Lincoln National Corp. | Goldman Sachs International | 12/20/2022 | 1.000 | Quarterly | USD | 4,135,000 | (37,550) | (8,385) | — | (47,126) | 1,191 | — |
| McDonald’s Corp. | Goldman Sachs International | 06/20/2022 | 1.000 | Quarterly | USD | 7,390,000 | (248,965) | (14,985) | — | (218,095) | — | (45,855) |
| PulteGroup, Inc. | Goldman Sachs International | 06/20/2022 | 5.000 | Quarterly | USD | 4,100,000 | (747,804) | (41,569) | — | (657,850) | — | (131,523) |
| Walt Disney Co. (The) | Goldman Sachs International | 06/20/2022 | 1.000 | Quarterly | USD | 5,135,000 | (164,525) | (10,413) | — | (155,143) | — | (19,795) |
| American International Group, Inc. | JPMorgan | 12/20/2022 | 1.000 | Quarterly | USD | 5,165,000 | (83,781) | (10,473) | — | (105,764) | 11,510 | — |
| Eastman Chemical Co. | JPMorgan | 06/20/2022 | 1.000 | Quarterly | USD | 5,140,000 | (118,259) | (10,423) | — | (95,489) | — | (33,193) |
| Energy Transfer Partners LP | JPMorgan | 12/20/2021 | 1.000 | Quarterly | USD | 880,000 | (7,025) | (1,784) | 32,499 | — | — | (41,308) |
| Honeywell International, Inc. | JPMorgan | 06/20/2022 | 1.000 | Quarterly | USD | 4,940,000 | (175,213) | (10,017) | — | (184,821) | — | (409) |
| International Business Machines Corp. | JPMorgan | 06/20/2022 | 1.000 | Quarterly | USD | 4,105,000 | (127,465) | (8,324) | — | (105,926) | — | (29,863) |
| McDonald’s Corp. | JPMorgan | 06/20/2022 | 1.000 | Quarterly | USD | 6,165,000 | (207,695) | (12,501) | — | (185,646) | — | (34,550) |
| PulteGroup, Inc. | JPMorgan | 06/20/2022 | 5.000 | Quarterly | USD | 2,060,000 | (375,726) | (20,886) | — | (344,206) | — | (52,406) |
| PulteGroup, Inc. | JPMorgan | 06/20/2022 | 5.000 | Quarterly | USD | 4,120,000 | (751,451) | (41,772) | — | (675,572) | — | (117,651) |
| Textron, Inc. | JPMorgan | 06/20/2022 | 1.000 | Quarterly | USD | 4,105,000 | (55,739) | (8,324) | — | (45,993) | — | (18,070) |
| Time Warner, Inc. | JPMorgan | 06/20/2022 | 1.000 | Quarterly | USD | 3,928,000 | (84,405) | (7,965) | — | (109,770) | 17,400 | — |
| Toll Brothers, Inc. | JPMorgan | 06/20/2022 | 1.000 | Quarterly | USD | 11,820,000 | (87,091) | (23,968) | 155,084 | — | — | (266,143) |
| Valero Energy Corp. | JPMorgan | 06/20/2022 | 1.000 | Quarterly | USD | 4,720,000 | (77,087) | (9,571) | — | (44,695) | — | (41,963) |
| Valero Energy Corp. | JPMorgan | 06/20/2022 | 1.000 | Quarterly | USD | 9,240,000 | (150,906) | (18,737) | 56,801 | — | — | (226,444) |
| Weyerhaeuser Co. | JPMorgan | 06/20/2022 | 1.000 | Quarterly | USD | 2,650,000 | (63,500) | (5,374) | — | (72,812) | 3,938 | — |
The accompanying Notes to Financial Statements are an integral part of this statement.
Multi-Manager Total Return Bond Strategies Fund | Annual Report 2017
| 61 |
Portfolio of Investments (continued)
August 31, 2017
| Credit default swap contracts - buy protection (continued) |
Reference
entity | Counterparty | Maturity
date | Pay
fixed
rate
(%) | Payment
frequency | Notional
currency | Notional
amount | Value
($) | Periodic
payments
receivable
(payable)
($) | Upfront
payments
($) | Upfront
receipts
($) | Unrealized
appreciation
($) | Unrealized
depreciation
($) |
| Weyerhaeuser Co. | JPMorgan | 06/20/2022 | 1.000 | Quarterly | USD | 2,060,000 | (49,363) | (4,177) | — | (56,623) | 3,083 | — |
| Weyerhaeuser Co. | JPMorgan | 06/20/2022 | 1.000 | Quarterly | USD | 2,055,000 | (49,243) | (4,167) | — | (31,344) | — | (22,066) |
| Total | | | | | | | | (679,969) | 3,179,010 | (7,099,829) | 70,640 | (2,549,162) |
| Cleared credit default swap contracts - buy protection |
Reference
entity | Counterparty | Maturity
date | Pay
fixed
rate
(%) | Payment
frequency | Notional
currency | Notional
amount | Value
($) | Upfront
payments
($) | Upfront
receipts
($) | Unrealized
appreciation
($) | Unrealized
depreciation
($) |
| Markit CDX North America High Yield Index, Series 28 | Morgan Stanley | 06/20/2022 | 5.000 | Quarterly | USD | 441,160,000 | (7,074,707) | — | (29,437,569) | — | (7,074,707) |
| Markit CDX North America Investment Grade Index, Series 28 | Morgan Stanley | 06/20/2022 | 1.000 | Quarterly | USD | 86,475,000 | (472,075) | — | (1,354,304) | — | (472,075) |
| Total | | | | | | | (7,546,782) | — | (30,791,873) | — | (7,546,782) |
| Credit default swap contracts - sell protection |
Reference
entity | Counterparty | Maturity
date | Receive
fixed
rate
(%) | Payment
frequency | Implied
credit
spread
(%)* | Notional
currency | Notional
amount | Value
($) | Periodic
payments
receivable
(payable)
($) | Upfront
payments
($) | Upfront
receipts
($) | Unrealized
appreciation
($) | Unrealized
depreciation
($) |
| Anadarko Petroleum Corp. | Barclays | 12/20/2020 | 1.000 | Quarterly | 0.959 | USD | 3,615,000 | 4,753 | 7,330 | — | (238,390) | 250,473 | — |
| Anadarko Petroleum Corp. | Barclays | 06/20/2021 | 1.000 | Quarterly | 1.138 | USD | 1,810,000 | (9,165) | 3,670 | — | (151,730) | 146,235 | — |
| Bank of America Corp. | Barclays | 06/20/2018 | 1.000 | Quarterly | 0.198 | USD | 8,445,000 | 54,658 | 17,125 | 41,039 | — | 30,744 | — |
| Canadian Natural Resources Ltd. | Barclays | 12/20/2020 | 1.000 | Quarterly | 0.630 | USD | 1,810,000 | 21,638 | 3,670 | — | (147,089) | 172,397 | — |
| Citigroup, Inc. | Barclays | 06/20/2018 | 1.000 | Quarterly | 0.195 | USD | 8,355,000 | 54,263 | 16,942 | 33,934 | — | 37,271 | — |
| Frontier Communications Corp. | Barclays | 06/20/2019 | 5.000 | Quarterly | 5.561 | USD | 2,055,000 | (19,466) | 20,835 | 95,478 | — | — | (94,109) |
| iStar, Inc. | Barclays | 06/20/2020 | 5.000 | Quarterly | 1.261 | USD | 1,960,000 | 199,577 | 19,872 | 204,729 | — | 14,720 | — |
| JPMorgan Chase & Co. | Barclays | 06/20/2019 | 1.000 | Quarterly | 0.254 | USD | 10,265,000 | 137,392 | 20,815 | 129,836 | — | 28,371 | — |
| JPMorgan Chase & Co. | Barclays | 06/20/2019 | 1.000 | Quarterly | 0.254 | USD | 5,135,000 | 68,729 | 10,413 | 66,830 | — | 12,312 | — |
| JPMorgan Chase & Co. | Barclays | 06/20/2019 | 1.000 | Quarterly | 0.254 | USD | 5,135,000 | 68,729 | 10,413 | 66,830 | — | 12,312 | — |
| Navient Corp. | Barclays | 06/20/2020 | 5.000 | Quarterly | 1.484 | USD | 2,055,000 | 196,452 | 20,835 | 153,272 | — | 64,015 | — |
| Navient Corp. | Barclays | 06/20/2020 | 5.000 | Quarterly | 1.484 | USD | 875,000 | 83,647 | 8,872 | 79,218 | — | 13,301 | — |
| Valeant Pharmaceuticals International, Inc. | Barclays | 06/20/2019 | 5.000 | Quarterly | 2.622 | USD | 2,055,000 | 85,502 | 20,835 | — | (21,661) | 127,998 | — |
| Verizon Communications, Inc. | Barclays | 12/20/2017 | 1.000 | Quarterly | 0.219 | USD | 6,892,000 | 16,522 | 13,975 | 14,524 | — | 15,973 | — |
| Verizon Communications, Inc. | Barclays | 06/20/2022 | 1.000 | Quarterly | 0.680 | USD | 2,645,000 | 38,768 | 5,363 | 20,161 | — | 23,970 | — |
| Whiting Petroleum Corp. | Barclays | 06/20/2020 | 5.000 | Quarterly | 4.877 | USD | 1,750,000 | 5,353 | 17,743 | 89,886 | — | — | (66,790) |
| Whiting Petroleum Corp. | Barclays | 06/20/2020 | 5.000 | Quarterly | 4.877 | USD | 1,750,000 | 5,353 | 17,743 | 96,489 | — | — | (73,393) |
| Calpine Corp. | Citi | 06/20/2020 | 5.000 | Quarterly | 1.832 | USD | 980,000 | 83,888 | 9,936 | 90,142 | — | 3,682 | — |
| Dow Chemical Co. (The) | Citi | 12/20/2021 | 1.000 | Quarterly | 0.457 | USD | 3,480,000 | 78,820 | 7,057 | 15,434 | — | 70,443 | — |
The accompanying Notes to Financial Statements are an integral part of this statement.
| 62 | Multi-Manager Total Return Bond Strategies Fund | Annual Report 2017 |
Portfolio of Investments (continued)
August 31, 2017
| Credit default swap contracts - sell protection (continued) |
Reference
entity | Counterparty | Maturity
date | Receive
fixed
rate
(%) | Payment
frequency | Implied
credit
spread
(%)* | Notional
currency | Notional
amount | Value
($) | Periodic
payments
receivable
(payable)
($) | Upfront
payments
($) | Upfront
receipts
($) | Unrealized
appreciation
($) | Unrealized
depreciation
($) |
| FirstEnergy Corp. | Citi | 06/20/2022 | 1.000 | Quarterly | 0.754 | USD | 5,165,000 | 58,372 | 10,474 | 65,553 | — | 3,293 | — |
| Freeport-McMoRan, Inc. | Citi | 06/20/2020 | 1.000 | Quarterly | 0.852 | USD | 1,855,000 | 7,520 | 3,762 | — | (30,086) | 41,368 | — |
| Glencore PLC | Citi | 06/20/2019 | 5.000 | Quarterly | 0.398 | USD | 1,955,000 | 161,277 | 19,822 | 153,621 | — | 27,478 | — |
| JPMorgan Chase & Co. | Citi | 06/20/2019 | 1.000 | Quarterly | 0.254 | USD | 4,105,000 | 54,943 | 8,324 | 53,412 | — | 9,855 | — |
| Plains All American Pipeline LP | Citi | 12/20/2021 | 1.000 | Quarterly | 1.380 | USD | 1,760,000 | (27,091) | 3,569 | — | (65,006) | 41,484 | — |
| Target Corp. | Citi | 06/20/2022 | 1.000 | Quarterly | 0.638 | USD | 6,160,000 | 102,676 | 12,491 | 99,867 | — | 15,300 | — |
| Whiting Petroleum Corp. | Citi | 06/20/2020 | 5.000 | Quarterly | 4.877 | USD | 1,030,000 | 3,151 | 10,443 | — | — | 13,594 | — |
| Whiting Petroleum Corp. | Citi | 06/20/2020 | 5.000 | Quarterly | 4.877 | USD | 1,030,000 | 3,151 | 10,443 | 39,051 | — | — | (25,457) |
| DISH DBS Corp. | Credit Suisse | 06/20/2020 | 5.000 | Quarterly | 0.996 | USD | 1,855,000 | 203,216 | 18,808 | 197,609 | — | 24,415 | — |
| Markit CMBX North America Index, Series 7 BBB- | Credit Suisse | 01/17/2047 | 3.000 | Monthly | 5.171 | USD | 4,500,000 | (490,818) | 2,625 | — | (381,387) | — | (106,806) |
| Markit CMBX North America Index, Series 7 BBB- | Credit Suisse | 01/17/2047 | 3.000 | Monthly | 5.171 | USD | 4,000,000 | (436,282) | 2,333 | — | (300,955) | — | (132,994) |
| Markit CMBX North America Index, Series 7 BBB- | Credit Suisse | 01/17/2047 | 3.000 | Monthly | 5.171 | USD | 5,000,000 | (545,352) | 2,917 | — | (322,318) | — | (220,117) |
| Target Corp. | Credit Suisse | 06/20/2022 | 1.000 | Quarterly | 0.638 | USD | 4,105,000 | 68,423 | 8,324 | 72,223 | — | 4,524 | — |
| Weatherford International Ltd. | Credit Suisse | 06/20/2020 | 1.000 | Quarterly | 4.296 | USD | 410,000 | (35,058) | 831 | — | (15,501) | — | (18,726) |
| Anadarko Petroleum Corp. | Goldman Sachs International | 06/20/2020 | 1.000 | Quarterly | 0.712 | USD | 3,710,000 | 29,399 | 7,523 | 45,619 | — | — | (8,697) |
| Anadarko Petroleum Corp. | Goldman Sachs International | 12/20/2020 | 1.000 | Quarterly | 0.959 | USD | 4,525,000 | 5,950 | 9,176 | — | (280,495) | 295,621 | — |
| Anadarko Petroleum Corp. | Goldman Sachs International | 12/20/2020 | 1.000 | Quarterly | 0.959 | USD | 1,810,000 | 2,381 | 3,670 | — | (131,073) | 137,124 | — |
| Anadarko Petroleum Corp. | Goldman Sachs International | 12/20/2020 | 1.000 | Quarterly | 0.959 | USD | 1,800,000 | 2,367 | 3,650 | — | (130,550) | 136,567 | — |
| AT&T, Inc. | Goldman Sachs International | 12/20/2017 | 1.000 | Quarterly | 0.117 | USD | 10,265,000 | 27,828 | 20,815 | 21,849 | — | 26,794 | — |
| Avis Budget Car Rental LLC/Finance, Inc. | Goldman Sachs International | 06/20/2020 | 5.000 | Quarterly | 1.613 | USD | 1,030,000 | 94,685 | 10,443 | 72,472 | — | 32,656 | — |
| Berkshire Hathaway, Inc. | Goldman Sachs International | 12/20/2022 | 1.000 | Quarterly | 0.697 | USD | 4,135,000 | 63,205 | 8,385 | 83,621 | — | — | (12,031) |
| Canadian Natural Resources Ltd. | Goldman Sachs International | 06/20/2020 | 1.000 | Quarterly | 0.443 | USD | 3,915,000 | 60,190 | 7,939 | 53,556 | — | 14,573 | — |
| Citigroup, Inc. | Goldman Sachs International | 06/20/2018 | 1.000 | Quarterly | 0.195 | USD | 4,215,000 | 27,375 | 8,547 | 15,410 | — | 20,512 | — |
| DISH DBS Corp. | Goldman Sachs International | 06/20/2020 | 5.000 | Quarterly | 0.996 | USD | 925,000 | 101,334 | 9,378 | 101,396 | — | 9,316 | — |
| DISH DBS Corp. | Goldman Sachs International | 06/20/2022 | 5.000 | Quarterly | 2.436 | USD | 2,060,000 | 233,273 | 20,886 | 201,291 | — | 52,868 | — |
| Dow Chemical Co. (The) | Goldman Sachs International | 12/20/2021 | 1.000 | Quarterly | 0.457 | USD | 1,745,000 | 39,524 | 3,538 | 5,624 | — | 37,438 | — |
| FirstEnergy Corp. | Goldman Sachs International | 06/20/2022 | 1.000 | Quarterly | 0.754 | USD | 9,880,000 | 111,659 | 20,034 | 71,112 | — | 60,581 | — |
| Ford Motor Co. | Goldman Sachs International | 06/20/2022 | 5.000 | Quarterly | 1.135 | USD | 5,135,000 | 905,847 | 52,063 | 830,425 | — | 127,485 | — |
The accompanying Notes to Financial Statements are an integral part of this statement.
Multi-Manager Total Return Bond Strategies Fund | Annual Report 2017
| 63 |
Portfolio of Investments (continued)
August 31, 2017
| Credit default swap contracts - sell protection (continued) |
Reference
entity | Counterparty | Maturity
date | Receive
fixed
rate
(%) | Payment
frequency | Implied
credit
spread
(%)* | Notional
currency | Notional
amount | Value
($) | Periodic
payments
receivable
(payable)
($) | Upfront
payments
($) | Upfront
receipts
($) | Unrealized
appreciation
($) | Unrealized
depreciation
($) |
| Freeport-McMoRan, Inc. | Goldman Sachs International | 06/20/2020 | 1.000 | Quarterly | 0.852 | USD | 925,000 | 3,750 | 1,876 | — | (18,148) | 23,774 | — |
| Freeport-McMoRan, Inc. | Goldman Sachs International | 06/20/2020 | 1.000 | Quarterly | 0.852 | USD | 925,000 | 3,750 | 1,876 | — | (18,132) | 23,758 | — |
| Glencore PLC | Goldman Sachs International | 06/20/2019 | 5.000 | Quarterly | 0.398 | USD | 1,955,000 | 161,277 | 19,822 | 153,621 | — | 27,478 | — |
| Hertz Corp. (The) | Goldman Sachs International | 06/20/2019 | 5.000 | Quarterly | 5.413 | USD | 1,030,000 | (7,083) | 10,443 | — | (1,186) | 4,546 | — |
| iStar, Inc. | Goldman Sachs International | 06/20/2020 | 5.000 | Quarterly | 1.261 | USD | 585,000 | 59,568 | 5,931 | 57,193 | — | 8,306 | — |
| JPMorgan Chase & Co. | Goldman Sachs International | 06/20/2019 | 1.000 | Quarterly | 0.254 | USD | 10,265,000 | 137,392 | 20,815 | 129,836 | — | 28,371 | — |
| Kroger Co. (The) | Goldman Sachs International | 06/20/2022 | 1.000 | Quarterly | 1.025 | USD | 3,015,000 | (3,453) | 6,114 | — | (4,037) | 6,698 | — |
| Kroger Co. (The) | Goldman Sachs International | 12/20/2022 | 1.000 | Quarterly | 1.183 | USD | 5,165,000 | (47,035) | 10,474 | — | (21,481) | — | (15,080) |
| Markit CMBX North America Index, Series 6 BBB- | Goldman Sachs International | 05/11/2063 | 3.000 | Monthly | 6.418 | USD | 1,700,000 | (239,357) | 992 | — | (146,565) | — | (91,800) |
| Markit CMBX North America Index, Series 6 BBB- | Goldman Sachs International | 05/11/2063 | 3.000 | Monthly | 6.418 | USD | 3,500,000 | (492,794) | 2,042 | — | (283,788) | — | (206,964) |
| NRG Energy, Inc. | Goldman Sachs International | 06/20/2020 | 5.000 | Quarterly | 0.957 | USD | 1,960,000 | 217,093 | 19,872 | 193,766 | — | 43,199 | — |
| Rite Aid Corp. | Goldman Sachs International | 06/20/2020 | 5.000 | Quarterly | 2.395 | USD | 1,750,000 | 122,261 | 17,743 | 150,772 | — | — | (10,768) |
| Sherwin-Williams Co. (The) | Goldman Sachs International | 06/20/2022 | 1.000 | Quarterly | 0.624 | USD | 3,090,000 | 53,463 | 6,266 | 64,799 | — | — | (5,070) |
| Sprint Communications, Inc. | Goldman Sachs International | 06/20/2020 | 5.000 | Quarterly | 1.224 | USD | 1,960,000 | 201,998 | 19,872 | 193,766 | — | 28,104 | — |
| Targa Resources Partners LP/Finance Corp. | Goldman Sachs International | 06/20/2020 | 1.000 | Quarterly | 0.965 | USD | 1,750,000 | 1,663 | 3,549 | 19,048 | — | — | (13,836) |
| United Rentals North America, Inc. | Goldman Sachs International | 06/20/2020 | 5.000 | Quarterly | 0.656 | USD | 1,955,000 | 233,806 | 19,822 | 228,970 | — | 24,658 | — |
| Verizon Communications, Inc. | Goldman Sachs International | 06/20/2019 | 1.000 | Quarterly | 0.344 | USD | 3,915,000 | 46,043 | 7,939 | 43,287 | — | 10,695 | — |
| Verizon Communications, Inc. | Goldman Sachs International | 06/20/2022 | 1.000 | Quarterly | 0.680 | USD | 20,145,000 | 295,263 | 40,850 | 162,702 | — | 173,411 | — |
| Weatherford International Ltd. | Goldman Sachs International | 06/20/2020 | 1.000 | Quarterly | 4.296 | USD | 1,955,000 | (167,167) | 3,964 | — | (76,287) | — | (86,916) |
| Ally Financial, Inc. | JPMorgan | 06/20/2020 | 5.000 | Quarterly | 0.911 | USD | 3,075,000 | 344,620 | 31,177 | 299,924 | — | 75,873 | — |
| Ally Financial, Inc. | JPMorgan | 06/20/2020 | 5.000 | Quarterly | 0.911 | USD | 1,960,000 | 219,660 | 19,872 | 198,658 | — | 40,874 | — |
| Anadarko Petroleum Corp. | JPMorgan | 06/20/2021 | 1.000 | Quarterly | 1.138 | USD | 1,710,000 | (8,660) | 3,468 | — | (113,234) | 108,042 | — |
| AT&T, Inc. | JPMorgan | 06/20/2022 | 1.000 | Quarterly | 0.684 | USD | 4,005,000 | 58,225 | 8,121 | 47,026 | — | 19,320 | — |
| Avis Budget Car Rental LLC/Finance, Inc. | JPMorgan | 06/20/2020 | 5.000 | Quarterly | 1.613 | USD | 5,125,000 | 471,130 | 51,962 | 385,135 | — | 137,957 | — |
| Avis Budget Car Rental LLC/Finance, Inc. | JPMorgan | 06/20/2020 | 5.000 | Quarterly | 1.613 | USD | 1,750,000 | 160,873 | 17,743 | 91,386 | — | 87,230 | — |
| Avis Budget Car Rental LLC/Finance, Inc. | JPMorgan | 06/20/2020 | 5.000 | Quarterly | 1.613 | USD | 1,750,000 | 160,874 | 17,743 | 103,641 | — | 74,976 | — |
The accompanying Notes to Financial Statements are an integral part of this statement.
| 64 | Multi-Manager Total Return Bond Strategies Fund | Annual Report 2017 |
Portfolio of Investments (continued)
August 31, 2017
| Credit default swap contracts - sell protection (continued) |
Reference
entity | Counterparty | Maturity
date | Receive
fixed
rate
(%) | Payment
frequency | Implied
credit
spread
(%)* | Notional
currency | Notional
amount | Value
($) | Periodic
payments
receivable
(payable)
($) | Upfront
payments
($) | Upfront
receipts
($) | Unrealized
appreciation
($) | Unrealized
depreciation
($) |
| Bank of America Corp. | JPMorgan | 06/20/2018 | 1.000 | Quarterly | 0.198 | USD | 12,630,000 | 81,745 | 25,611 | 53,272 | — | 54,084 | — |
| Bank of America Corp. | JPMorgan | 06/20/2021 | 1.000 | Quarterly | 0.432 | USD | 8,535,000 | 179,214 | 17,307 | 41,608 | — | 154,913 | — |
| Berkshire Hathaway, Inc. | JPMorgan | 12/20/2022 | 1.000 | Quarterly | 0.697 | USD | 5,165,000 | 78,949 | 10,474 | 105,764 | — | — | (16,341) |
| Calpine Corp. | JPMorgan | 06/20/2020 | 5.000 | Quarterly | 1.832 | USD | 1,955,000 | 167,347 | 19,822 | 174,146 | — | 13,023 | — |
| Calpine Corp. | JPMorgan | 06/20/2020 | 5.000 | Quarterly | 1.832 | USD | 1,960,000 | 167,775 | 19,872 | 182,337 | — | 5,310 | — |
| Calpine Corp. | JPMorgan | 06/20/2020 | 5.000 | Quarterly | 1.832 | USD | 3,075,000 | 263,218 | 31,177 | 308,949 | — | — | (14,554) |
| Cenovus Energy, Inc. | JPMorgan | 06/20/2018 | 1.000 | Quarterly | 0.700 | USD | 4,135,000 | 9,965 | 8,385 | 13,289 | — | 5,061 | — |
| CenturyLink, Inc. | JPMorgan | 06/20/2020 | 1.000 | Quarterly | 1.643 | USD | 1,960,000 | (34,130) | 3,974 | — | — | — | (30,156) |
| CenturyLink, Inc. | JPMorgan | 06/20/2020 | 1.000 | Quarterly | 1.643 | USD | 1,955,000 | (34,042) | 3,964 | 2,645 | — | — | (32,723) |
| CenturyLink, Inc. | JPMorgan | 06/20/2020 | 1.000 | Quarterly | 1.643 | USD | 3,075,000 | (53,546) | 6,235 | — | (4,141) | — | (43,170) |
| Citigroup, Inc. | JPMorgan | 06/20/2018 | 1.000 | Quarterly | 0.195 | USD | 12,665,000 | 82,255 | 25,682 | 63,588 | — | 44,349 | — |
| Citigroup, Inc. | JPMorgan | 06/20/2018 | 1.000 | Quarterly | 0.195 | USD | 8,535,000 | 55,432 | 17,307 | 39,438 | — | 33,301 | — |
| Citigroup, Inc. | JPMorgan | 06/20/2018 | 1.000 | Quarterly | 0.195 | USD | 4,210,000 | 27,343 | 8,537 | 18,434 | — | 17,446 | — |
| CSC Holdings LLC | JPMorgan | 06/20/2020 | 5.000 | Quarterly | 0.742 | USD | 3,075,000 | 359,595 | 31,177 | 341,823 | — | 48,949 | — |
| CSC Holdings LLC | JPMorgan | 06/20/2020 | 5.000 | Quarterly | 0.742 | USD | 1,960,000 | 229,205 | 19,872 | 229,331 | — | 19,746 | — |
| CVS Health Corp. | JPMorgan | 06/20/2022 | 1.000 | Quarterly | 0.468 | USD | 6,165,000 | 151,624 | 12,501 | 142,518 | — | 21,607 | — |
| DISH DBS Corp. | JPMorgan | 06/20/2020 | 5.000 | Quarterly | 0.996 | USD | 3,075,000 | 336,868 | 31,177 | 307,141 | — | 60,904 | — |
| DISH DBS Corp. | JPMorgan | 06/20/2022 | 5.000 | Quarterly | 2.436 | USD | 5,135,000 | 581,486 | 52,063 | 616,137 | — | 17,412 | — |
| Energy Transfer Equity LP | JPMorgan | 06/20/2020 | 1.000 | Quarterly | 0.830 | USD | 3,075,000 | 14,270 | 6,235 | 12,488 | — | 8,017 | — |
| Equinix, Inc. | JPMorgan | 06/20/2020 | 1.000 | Quarterly | 0.762 | USD | 3,075,000 | 19,989 | 6,235 | 53,119 | — | — | (26,895) |
| Freeport-McMoRan, Inc. | JPMorgan | 06/20/2020 | 1.000 | Quarterly | 0.852 | USD | 3,075,000 | 12,466 | 6,235 | — | (32,013) | 50,714 | — |
| Frontier Communications Corp. | JPMorgan | 06/20/2019 | 5.000 | Quarterly | 5.561 | USD | 1,035,000 | (9,804) | 10,494 | 3,108 | — | — | (2,418) |
| Frontier Communications Corp. | JPMorgan | 06/20/2019 | 5.000 | Quarterly | 5.561 | USD | 8,200,000 | (77,676) | 83,139 | 429,265 | — | — | (423,802) |
| HD Supply, Inc. | JPMorgan | 06/20/2020 | 5.000 | Quarterly | 0.440 | USD | 3,075,000 | 385,390 | 31,177 | 389,437 | — | 27,130 | — |
| Hertz Corp. (The) | JPMorgan | 06/20/2019 | 5.000 | Quarterly | 5.413 | USD | 620,000 | (4,264) | 6,286 | — | (9,246) | 11,268 | — |
| Hertz Corp. (The) | JPMorgan | 06/20/2019 | 5.000 | Quarterly | 5.413 | USD | 8,200,000 | (56,397) | 83,139 | 107,035 | — | — | (80,293) |
| Hess Corp. | JPMorgan | 06/20/2022 | 1.000 | Quarterly | 1.808 | USD | 4,720,000 | (171,051) | 9,571 | — | (190,956) | 29,476 | — |
| International Paper Co. | JPMorgan | 06/20/2022 | 1.000 | Quarterly | 0.468 | USD | 2,060,000 | 50,719 | 4,177 | 56,623 | — | — | (1,727) |
| International Paper Co. | JPMorgan | 06/20/2022 | 1.000 | Quarterly | 0.468 | USD | 2,650,000 | 65,246 | 5,374 | 72,812 | — | — | (2,192) |
| iStar, Inc. | JPMorgan | 06/20/2020 | 5.000 | Quarterly | 1.261 | USD | 3,075,000 | 313,111 | 31,177 | 273,122 | — | 71,166 | — |
| MGM Resorts International | JPMorgan | 06/20/2020 | 5.000 | Quarterly | 0.592 | USD | 3,075,000 | 373,196 | 31,177 | 373,428 | — | 30,945 | — |
| Navient Corp. | JPMorgan | 06/20/2020 | 5.000 | Quarterly | 1.484 | USD | 5,125,000 | 489,935 | 51,962 | 428,727 | — | 113,170 | — |
| Navient Corp. | JPMorgan | 06/20/2020 | 5.000 | Quarterly | 1.484 | USD | 1,750,000 | 167,295 | 17,743 | 157,736 | — | 27,302 | — |
| NRG Energy, Inc. | JPMorgan | 06/20/2020 | 5.000 | Quarterly | 0.957 | USD | 3,075,000 | 340,592 | 31,177 | 308,949 | — | 62,820 | — |
| Pactiv Corp. | JPMorgan | 06/20/2020 | 5.000 | Quarterly | 0.819 | USD | 3,075,000 | 352,203 | 31,177 | 345,513 | — | 37,867 | — |
| Pactiv Corp. | JPMorgan | 06/20/2020 | 5.000 | Quarterly | 0.819 | USD | 1,960,000 | 224,494 | 19,872 | 229,331 | — | 15,035 | — |
| Plains All American Pipeline LP | JPMorgan | 06/20/2021 | 1.000 | Quarterly | 1.262 | USD | 905,000 | (8,593) | 1,835 | — | (111,725) | 104,967 | — |
| Plains All American Pipeline LP | JPMorgan | 06/20/2021 | 1.000 | Quarterly | 1.262 | USD | 840,000 | (7,976) | 1,703 | — | (84,458) | 78,185 | — |
| Plains All American Pipeline LP | JPMorgan | 06/20/2021 | 1.000 | Quarterly | 1.262 | USD | 845,000 | (8,023) | 1,713 | — | (73,098) | 66,788 | — |
| Rite Aid Corp. | JPMorgan | 06/20/2020 | 5.000 | Quarterly | 2.395 | USD | 2,055,000 | 143,570 | 20,835 | 176,612 | — | — | (12,207) |
| Rite Aid Corp. | JPMorgan | 06/20/2020 | 5.000 | Quarterly | 2.395 | USD | 1,750,000 | 122,261 | 17,743 | 157,837 | — | — | (17,833) |
| Rite Aid Corp. | JPMorgan | 06/20/2020 | 5.000 | Quarterly | 2.395 | USD | 3,075,000 | 214,830 | 31,177 | 327,138 | — | — | (81,131) |
| Sherwin-Williams Co. (The) | JPMorgan | 06/20/2022 | 1.000 | Quarterly | 0.624 | USD | 5,140,000 | 88,932 | 10,423 | 45,006 | — | 54,349 | — |
The accompanying Notes to Financial Statements are an integral part of this statement.
Multi-Manager Total Return Bond Strategies Fund | Annual Report 2017
| 65 |
Portfolio of Investments (continued)
August 31, 2017
| Credit default swap contracts - sell protection (continued) |
Reference
entity | Counterparty | Maturity
date | Receive
fixed
rate
(%) | Payment
frequency | Implied
credit
spread
(%)* | Notional
currency | Notional
amount | Value
($) | Periodic
payments
receivable
(payable)
($) | Upfront
payments
($) | Upfront
receipts
($) | Unrealized
appreciation
($) | Unrealized
depreciation
($) |
| Southern Co. (The) | JPMorgan | 06/20/2022 | 1.000 | Quarterly | 0.683 | USD | 9,880,000 | 143,910 | 20,034 | 156,759 | — | 7,185 | — |
| Southern Co. (The) | JPMorgan | 06/20/2022 | 1.000 | Quarterly | 0.683 | USD | 5,165,000 | 75,231 | 10,474 | 82,170 | — | 3,535 | — |
| Sprint Communications, Inc. | JPMorgan | 06/20/2020 | 5.000 | Quarterly | 1.224 | USD | 3,075,000 | 316,911 | 31,177 | 290,945 | — | 57,143 | — |
| Targa Resources Partners LP/Finance Corp. | JPMorgan | 06/20/2020 | 1.000 | Quarterly | 0.965 | USD | 5,125,000 | 4,870 | 10,392 | 20,814 | — | — | (5,552) |
| TransDigm, Inc. | JPMorgan | 06/20/2020 | 1.000 | Quarterly | 1.505 | USD | 5,125,000 | (70,066) | 10,392 | — | (7,644) | — | (52,030) |
| United Rentals North America, Inc. | JPMorgan | 06/20/2020 | 5.000 | Quarterly | 0.656 | USD | 3,075,000 | 367,752 | 31,177 | 352,451 | — | 46,478 | — |
| United Rentals North America, Inc. | JPMorgan | 06/20/2020 | 5.000 | Quarterly | 0.656 | USD | 1,960,000 | 234,405 | 19,872 | 228,148 | — | 26,129 | — |
| Valeant Pharmaceuticals International, Inc. | JPMorgan | 06/20/2019 | 5.000 | Quarterly | 2.622 | USD | 8,200,000 | 341,173 | 83,139 | 13,471 | — | 410,841 | — |
| Verizon Communications, Inc. | JPMorgan | 06/20/2022 | 1.000 | Quarterly | 0.680 | USD | 10,280,000 | 150,672 | 20,846 | 73,747 | — | 97,771 | — |
| Weatherford International Ltd. | JPMorgan | 06/20/2020 | 1.000 | Quarterly | 4.296 | USD | 3,075,000 | (262,934) | 6,235 | — | (83,697) | — | (173,002) |
| Whiting Petroleum Corp. | JPMorgan | 06/20/2020 | 5.000 | Quarterly | 4.877 | USD | 410,000 | 1,254 | 4,157 | 18,797 | — | — | (13,386) |
| Whiting Petroleum Corp. | JPMorgan | 06/20/2020 | 5.000 | Quarterly | 4.877 | USD | 5,125,000 | 15,676 | 51,962 | 337,944 | — | — | (270,306) |
| Anadarko Petroleum Corp. | Morgan Stanley | 12/20/2020 | 1.000 | Quarterly | 0.959 | USD | 2,645,000 | 3,478 | 5,363 | — | (283,291) | 292,132 | — |
| Anadarko Petroleum Corp. | Morgan Stanley | 12/20/2020 | 1.000 | Quarterly | 0.959 | USD | 3,355,000 | 4,412 | 6,803 | — | (240,026) | 251,241 | — |
| Anadarko Petroleum Corp. | Morgan Stanley | 12/20/2020 | 1.000 | Quarterly | 0.959 | USD | 3,345,000 | 4,398 | 6,783 | — | (199,857) | 211,038 | — |
| Bank of America Corp. | Morgan Stanley | 06/20/2018 | 1.000 | Quarterly | 0.198 | USD | 4,215,000 | 27,280 | 8,547 | 15,072 | — | 20,755 | — |
| Bank of America Corp. | Morgan Stanley | 06/20/2018 | 1.000 | Quarterly | 0.198 | USD | 4,200,000 | 27,183 | 8,517 | 16,367 | — | 19,333 | — |
| Canadian Natural Resources Ltd. | Morgan Stanley | 06/20/2021 | 1.000 | Quarterly | 0.766 | USD | 845,000 | 7,297 | 1,713 | — | (48,024) | 57,034 | — |
| Enterprise Products Partners LP | Morgan Stanley | 06/20/2021 | 1.000 | Quarterly | 0.738 | USD | 5,060,000 | 48,727 | 10,261 | — | (197,521) | 256,509 | — |
| Markit CMBX North America Index, Series 6 BBB- | Morgan Stanley | 05/11/2063 | 3.000 | Monthly | 6.418 | USD | 1,300,000 | (183,038) | 758 | — | (98,611) | — | (83,669) |
| Markit CMBX North America Index, Series 6 BBB- | Morgan Stanley | 05/11/2063 | 3.000 | Monthly | 6.418 | USD | 3,000,000 | (422,394) | 1,750 | — | (317,280) | — | (103,364) |
| Markit CMBX North America Index, Series 6 BBB- | Morgan Stanley | 05/11/2063 | 3.000 | Monthly | 6.418 | USD | 3,000,000 | (422,394) | 1,750 | — | (242,643) | — | (178,001) |
| Markit CMBX North America Index, Series 6 BBB- | Morgan Stanley | 05/11/2063 | 3.000 | Monthly | 6.418 | USD | 4,000,000 | (563,192) | 2,333 | — | (358,765) | — | (202,094) |
| Markit CMBX North America Index, Series 6 BBB- | Morgan Stanley | 05/11/2063 | 3.000 | Monthly | 6.418 | USD | 6,000,000 | (844,788) | 3,500 | — | (488,720) | — | (352,568) |
| Markit CMBX North America Index, Series 7 BBB- | Morgan Stanley | 01/17/2047 | 3.000 | Monthly | 5.171 | USD | 2,400,000 | (261,769) | 1,400 | — | (270,038) | 9,669 | — |
| Noble Energy, Inc. | Morgan Stanley | 06/20/2021 | 1.000 | Quarterly | 1.174 | USD | 4,175,000 | (26,417) | 8,466 | — | (222,186) | 204,235 | — |
| Noble Energy, Inc. | Morgan Stanley | 12/20/2021 | 1.000 | Quarterly | 1.336 | USD | 4,275,000 | (58,492) | 8,669 | — | (301,080) | 251,257 | — |
The accompanying Notes to Financial Statements are an integral part of this statement.
| 66 | Multi-Manager Total Return Bond Strategies Fund | Annual Report 2017 |
Portfolio of Investments (continued)
August 31, 2017
| Credit default swap contracts - sell protection (continued) |
Reference
entity | Counterparty | Maturity
date | Receive
fixed
rate
(%) | Payment
frequency | Implied
credit
spread
(%)* | Notional
currency | Notional
amount | Value
($) | Periodic
payments
receivable
(payable)
($) | Upfront
payments
($) | Upfront
receipts
($) | Unrealized
appreciation
($) | Unrealized
depreciation
($) |
| Noble Energy, Inc. | Morgan Stanley | 12/20/2021 | 1.000 | Quarterly | 1.336 | USD | 4,390,000 | (60,066) | 8,902 | — | (228,375) | 177,211 | — |
| Plains All American Pipeline LP | Morgan Stanley | 06/20/2021 | 1.000 | Quarterly | 1.262 | USD | 2,715,000 | (25,779) | 5,505 | — | (301,935) | 281,661 | — |
| Plains All American Pipeline LP | Morgan Stanley | 06/20/2021 | 1.000 | Quarterly | 1.262 | USD | 1,810,000 | (17,186) | 3,670 | — | (239,187) | 225,671 | — |
| Plains All American Pipeline LP | Morgan Stanley | 06/20/2021 | 1.000 | Quarterly | 1.262 | USD | 1,815,000 | (17,233) | 3,680 | — | (205,710) | 192,157 | — |
| Total | | | | | | | | | 2,220,145 | 14,099,434 | (7,739,326) | 7,488,622 | (3,408,968) |
| * | Implied credit spreads, represented in absolute terms, utilized in determining the market value of credit default swap agreements on corporate or sovereign issues as of period end serve as an indicator of the current status of the payment/performance risk and represent the likelihood or risk of default for the credit derivative. The implied credit spread of a particular referenced entity reflects the cost of buying/selling protection and may include upfront payments required to be made to enter into the agreement. Wider credit spreads represent a deterioration of the referenced entity’s credit soundness and a greater likelihood or risk of default or other credit event occurring as defined under the terms of the agreement. |
| Cleared credit default swap contracts - sell protection |
Reference
entity | Counterparty | Maturity
date | Receive
fixed
rate
(%) | Payment
frequency | Implied
credit
spread
(%)* | Notional
currency | Notional
amount | Value
($) | Upfront
payments
($) | Upfront
receipts
($) | Unrealized
appreciation
($) | Unrealized
depreciation
($) |
| Markit CDX North America High Yield Index, Series 21 | Morgan Stanley | 12/20/2018 | 5.000 | Quarterly | 1.668 | USD | 71,266,150 | 1,070,851 | 2,709,027 | — | 1,070,851 | — |
| Markit CDX North America Investment Grade Index, Series 28 | Morgan Stanley | 06/20/2024 | 1.000 | Quarterly | 0.846 | USD | 40,900,000 | 287,456 | 186,497 | — | 287,456 | — |
| Markit CDX North America Investment Grade Index, Series 28 | Morgan Stanley | 06/20/2027 | 1.000 | Quarterly | 1.061 | USD | 9,180,000 | 38,677 | — | (67,027) | 38,677 | — |
| Total | | | | | | | | 1,396,984 | 2,895,524 | (67,027) | 1,396,984 | — |
| * | Implied credit spreads, represented in absolute terms, utilized in determining the market value of credit default swap agreements on corporate or sovereign issues as of period end serve as an indicator of the current status of the payment/performance risk and represent the likelihood or risk of default for the credit derivative. The implied credit spread of a particular referenced entity reflects the cost of buying/selling protection and may include upfront payments required to be made to enter into the agreement. Wider credit spreads represent a deterioration of the referenced entity’s credit soundness and a greater likelihood or risk of default or other credit event occurring as defined under the terms of the agreement. |
Notes to Portfolio of Investments
| (a) | Variable rate security. |
| (b) | Represents privately placed and other securities and instruments exempt from SEC registration (collectively, private placements), such as Section 4(a)(2) and Rule 144A eligible securities, which are often sold only to qualified institutional buyers. The Fund may invest in private placements determined to be liquid as well as those determined to be illiquid. Private placements may be determined to be liquid under guidelines established by the Fund’s Board of Trustees. At August 31, 2017, the value of these securities amounted to $1,454,931,424, which represents 19.22% of net assets. |
| (c) | Valuation based on significant unobservable inputs. |
| (d) | Represents a security purchased on a when-issued basis. |
| (e) | Represents a variable rate security where the coupon rate adjusts periodically using the weighted average coupon of the underlying mortgages. |
| (f) | Represents interest only securities which have the right to receive the monthly interest payments on an underlying pool of mortgage loans. |
| (g) | Non-income producing investment. |
| (h) | Represents a step bond where the coupon rate adjusts according to a schedule for a series of periods, typically lower for an initial period and then increasing to a higher coupon rate thereafter. |
| (i) | Represents securities that have defaulted on payment of interest. The Fund has stopped accruing interest on these securities. At August 31, 2017, the value of these securities amounted to $1,196,970, which represents 0.02% of net assets. |
The accompanying Notes to Financial Statements are an integral part of this statement.
Multi-Manager Total Return Bond Strategies Fund | Annual Report 2017
| 67 |
Portfolio of Investments (continued)
August 31, 2017
Notes to Portfolio of Investments (continued)
| (j) | As defined in the Investment Company Act of 1940, an affiliated company is one in which the Fund owns 5% or more of the company’s outstanding voting securities, or a company which is under common ownership or control with the Fund. Holdings and transactions in these affiliated companies during the year ended August 31, 2017 are as follows: |
| Issuer | Beginning
shares | Shares
purchased | Shares
sold | Ending
shares | Capital gain
distributions ($) | Realized gain
(loss) ($) | Net change in
unrealized
appreciation
(depreciation) ($) | Dividends —
affiliated
issuers ($) | Value ($) |
| Columbia Mortgage Opportunities Fund, Class I Shares | 7,407,460 | 1,528,161 | (8,935,621)* | — | 946,900 | (435,966) | (22,058) | 1,690,132 | — |
| Columbia Mortgage Opportunities Fund, Class Y Shares | — | 7,059,306* | — | 7,059,306 | — | — | 1,225,607 | 1,116,412 | 70,098,910 |
| Columbia Short-Term Cash Fund, 1.146% | 370,397,057 | 4,240,406,194 | (4,305,643,583) | 305,159,668 | — | 13,091 | — | 2,075,178 | 305,159,668 |
| Total | 377,804,517 | 4,248,993,661 | (4,314,579,204) | 312,218,974 | 946,900 | (422,875) | 1,203,549 | 4,881,722 | 375,258,578 |
| * | Includes the effect of underlying share class exchange. |
| (k) | Principal and interest may not be guaranteed by the government. |
| (l) | Municipal obligations include debt obligations issued by or on behalf of territories, possessions, or sovereign nations within the territorial boundaries of the United States. At August 31, 2017, the value of these securities amounted to $1,159,325, which represents 0.02% of net assets. |
| (m) | Represents a security purchased on a forward commitment basis. |
| (n) | This security or a portion of this security has been pledged as collateral in connection with derivative contracts. |
| (o) | Represents principal only securities which have the right to receive the principal portion only on an underlying pool of mortgage loans. |
| (p) | Represents a variable rate security where the coupon adjusts periodically through an auction process. |
| (q) | Senior loans have interest rates that float periodically based primarily on the London Interbank Offered Rate (“LIBOR”) and other short-term rates. The interest rate shown reflects the weighted average coupon as of August 31, 2017. The interest rate shown for senior loans purchased on a when-issued or delayed delivery basis, if any, reflects an estimated average coupon. Remaining maturities of senior loans may be less than the stated maturities shown as a result of contractual or optional prepayments by the borrower. Such prepayments cannot be predicted. |
| (r) | Principal amounts are denominated in United States Dollars unless otherwise noted. |
| (s) | Zero coupon bond. |
| (t) | The rate shown is the seven-day current annualized yield at August 31, 2017. |
Abbreviation Legend
| AGM | Assured Guaranty Municipal Corporation |
| AMBAC | Ambac Assurance Corporation |
| BAM | Build America Mutual Assurance Co. |
| CMO | Collateralized Mortgage Obligation |
| NPFGC | National Public Finance Guarantee Corporation |
| PIK | Payment In Kind |
| STRIPS | Separate Trading of Registered Interest and Principal Securities |
Currency Legend
| JPY | Japanese Yen |
| USD | US Dollar |
Fair value measurements
The Fund categorizes its fair value measurements according to a three-level hierarchy that maximizes the use of observable inputs and minimizes the use of unobservable inputs by prioritizing that the most observable input be used when available. Observable inputs are those that market participants would use in pricing an investment based on market data obtained from sources independent of the reporting entity. Unobservable inputs are those that reflect the Fund’s assumptions about the information market participants would use in pricing an investment. An investment’s level within the fair value hierarchy is based on the lowest level of any input that is deemed significant to the asset’s or liability’s fair value measurement. The input levels are not necessarily an indication of the risk or liquidity associated with investments at that level. For example, certain U.S. government securities are generally high quality and liquid, however, they are reflected as Level 2 because the inputs used to determine fair value may not always be quoted prices in an active market.
The accompanying Notes to Financial Statements are an integral part of this statement.
| 68 | Multi-Manager Total Return Bond Strategies Fund | Annual Report 2017 |
Portfolio of Investments (continued)
August 31, 2017
Fair value measurements (continued)
Fair value inputs are summarized in the three broad levels listed below:
| • | Level 1 – Valuations based on quoted prices for investments in active markets that the Fund has the ability to access at the measurement date. Valuation adjustments are not applied to Level 1 investments. |
| • | Level 2 – Valuations based on other significant observable inputs (including quoted prices for similar securities, interest rates, prepayment speeds, credit risks, etc.). |
| • | Level 3 – Valuations based on significant unobservable inputs (including the Fund’s own assumptions and judgment in determining the fair value of investments). |
Inputs that are used in determining fair value of an investment may include price information, credit data, volatility statistics, and other factors. These inputs can be either observable or unobservable. The availability of observable inputs can vary between investments, and is affected by various factors such as the type of investment, and the volume and level of activity for that investment or similar investments in the marketplace. The inputs will be considered by the Investment Manager, along with any other relevant factors in the calculation of an investment’s fair value. The Fund uses prices and inputs that are current as of the measurement date, which may include periods of market dislocations. During these periods, the availability of prices and inputs may be reduced for many investments. This condition could cause an investment to be reclassified between the various levels within the hierarchy.
Certain investments that have been measured at fair value using the net asset value (NAV) per share (or its equivalent) are not categorized in the fair value hierarchy. The fair value amounts presented in the table are intended to reconcile the fair value hierarchy to the amounts presented in the Portfolio of Investments. The Columbia Short-Term Cash Fund seeks to provide shareholders with maximum current income consistent with liquidity and stability of principal. Columbia Short-Term Cash Fund prices its shares with a floating NAV and no longer seeks to maintain a stable NAV.
Investments falling into the Level 3 category are primarily supported by quoted prices from brokers and dealers participating in the market for those investments. However, these may be classified as Level 3 investments due to lack of market transparency and corroboration to support these quoted prices. Additionally, valuation models may be used as the pricing source for any remaining investments classified as Level 3. These models may rely on one or more significant unobservable inputs and/or significant assumptions by the Investment Manager. Inputs used in valuations may include, but are not limited to, financial statement analysis, capital account balances, discount rates and estimated cash flows, and comparable company data.
Under the direction of the Fund’s Board of Trustees (the Board), the Investment Manager’s Valuation Committee (the Committee) is responsible for overseeing the valuation procedures approved by the Board. The Committee consists of voting and non-voting members from various groups within the Investment Manager’s organization, including operations and accounting, trading and investments, compliance, risk management and legal.
The Committee meets at least monthly to review and approve valuation matters, which may include a description of specific valuation determinations, data regarding pricing information received from approved pricing vendors and brokers and the results of Board-approved valuation control policies and procedures (the Policies). The Policies address, among other things, instances when market quotations are or are not readily available, including recommendations of third party pricing vendors and a determination of appropriate pricing methodologies; events that require specific valuation determinations and assessment of fair value techniques; securities with a potential for stale pricing, including those that are illiquid, restricted, or in default; and the effectiveness of third party pricing vendors, including periodic reviews of vendors. The Committee meets more frequently, as needed, to discuss additional valuation matters, which may include the need to review back-testing results, review time-sensitive information or approve related valuation actions. The Committee reports to the Board, with members of the Committee meeting with the Board at each of its regularly scheduled meetings to discuss valuation matters and actions during the period, similar to those described earlier.
For investments categorized as Level 3, the Committee monitors information similar to that described above, which may include: (i) data specific to the issuer or comparable issuers, (ii) general market or specific sector news and (iii) quoted prices and specific or similar security transactions. The Committee considers this data and any changes from prior periods in order to assess the reasonableness of observable and unobservable inputs, any assumptions or internal models used to value those securities and changes in fair value. This data is also used to corroborate, when available, information received from approved pricing vendors and brokers. Various factors impact the frequency of monitoring this information (which may occur as often as daily). However, the Committee may determine that changes to inputs, assumptions and models are not required as a result of the monitoring procedures performed.
The following table is a summary of the inputs used to value the Fund’s investments at August 31, 2017:
| | Level 1
quoted prices
in active
markets for
identical
assets ($) | Level 2
other
significant
observable
inputs ($) | Level 3
significant
unobservable
inputs ($) | Investments
measured at
net asset
value ($) | Total ($) |
| Investments | | | | | |
| Asset-Backed Securities — Agency | — | 59,254,151 | — | — | 59,254,151 |
| Asset-Backed Securities — Non-Agency | — | 973,118,348 | 5,526,676 | — | 978,645,024 |
| Commercial Mortgage-Backed Securities - Agency | — | 167,415,288 | — | — | 167,415,288 |
| Commercial Mortgage-Backed Securities - Non-Agency | — | 393,979,878 | 4,602,160 | — | 398,582,038 |
| Common Stocks | | | | | |
| Energy | — | — | 556 | — | 556 |
| Corporate Bonds & Notes | — | 2,528,357,866 | — | — | 2,528,357,866 |
| Fixed-Income Funds | 70,098,910 | — | — | — | 70,098,910 |
| Foreign Government Obligations | — | 125,016,747 | — | — | 125,016,747 |
| Inflation-Indexed Bonds | — | 67,304,342 | — | — | 67,304,342 |
| Municipal Bonds | — | 60,487,252 | — | — | 60,487,252 |
| Preferred Debt | 7,596,406 | — | — | — | 7,596,406 |
| Residential Mortgage-Backed Securities - Agency | — | 1,436,971,786 | 308,782 | — | 1,437,280,568 |
| Residential Mortgage-Backed Securities - Non-Agency | — | 215,393,202 | 34,199,870 | — | 249,593,072 |
| Senior Loans | — | 15,681,109 | 643,070 | — | 16,324,179 |
The accompanying Notes to Financial Statements are an integral part of this statement.
Multi-Manager Total Return Bond Strategies Fund | Annual Report 2017
| 69 |
Portfolio of Investments (continued)
August 31, 2017
Fair value measurements (continued)
| | Level 1
quoted prices
in active
markets for
identical
assets ($) | Level 2
other
significant
observable
inputs ($) | Level 3
significant
unobservable
inputs ($) | Investments
measured at
net asset
value ($) | Total ($) |
| Treasury Bills | 12,034,693 | 11,538,207 | — | — | 23,572,900 |
| U.S. Government & Agency Obligations | — | 121,592,745 | — | — | 121,592,745 |
| U.S. Treasury Obligations | 1,397,124,094 | 21,244,802 | — | — | 1,418,368,896 |
| Money Market Funds | — | — | — | 305,159,668 | 305,159,668 |
| Total Investments | 1,486,854,103 | 6,197,355,723 | 45,281,114 | 305,159,668 | 8,034,650,608 |
| Derivatives | | | | | |
| Asset | | | | | |
| Futures Contracts | 3,880,778 | — | — | — | 3,880,778 |
| Swap Contracts | — | 13,813,196 | — | — | 13,813,196 |
| Liability | | | | | |
| Forward Foreign Currency Exchange Contracts | — | (76,952) | — | — | (76,952) |
| Futures Contracts | (640,897) | — | — | — | (640,897) |
| Swap Contracts | — | (22,714,798) | — | — | (22,714,798) |
| Total | 1,490,093,984 | 6,188,377,169 | 45,281,114 | 305,159,668 | 8,028,911,935 |
See the Portfolio of Investments for all investment classifications not indicated in the table.
The Fund’s assets assigned to the Level 2 input category are generally valued using the market approach, in which a security’s value is determined through reference to prices and information from market transactions for similar or identical assets.
Derivative instruments are valued at unrealized appreciation (depreciation).
There were no transfers of financial assets between Levels 1 and 2 during the period.
Financial Assets were transferred from Level 2 to Level 3 due to utilizing a single market quotation from a broker dealer. As a result, Management concluded that the market input(s) were generally unobservable.
Financial assets were transferred from Level 3 to Level 2 as observable market inputs were utilized and management determined that there was sufficient, reliable and observable market data to value these assets as of period end.
Transfers between Levels are determined based on the fair value at the beginning of the period for security positions held throughout the period.
The following table is a reconciliation of Level 3 assets for which significant observable and unobservable inputs were used to determine fair value:
| Investments in securities | Balance
as of
08/31/2016
($) | Increase
(decrease)
in accrued
discounts/
premiums
($) | Realized
gain (loss)
($) | Change
in unrealized
appreciation
(depreciation)(a)
($) | Purchases
($) | Sales
($) | Transfers
into
Level 3
($) | Transfers
out of
Level 3
($) | Balance
as of
08/31/2017
($) |
| Asset-Backed Securities — Non-Agency | 59,953,226 | — | 160 | (8,790) | 5,534,990 | (1,980,000) | — | (57,972,910) | 5,526,676 |
| Commercial Mortgage-Backed Securities — Non-Agency | 5,155,744 | (947,365) | — | 393,781 | — | — | — | — | 4,602,160 |
| Common Stocks | 5,893 | — | (2) | (5,334) | 7,499 | (7,500) | — | — | 556 |
| Residential Mortgage-Backed Securities — Agency | 289,839 | (68,481) | (11) | 34,149 | 343,125 | — | — | (289,839) | 308,782 |
| Residential Mortgage-Backed Securities — Non-Agency | 4,295,543 | (1,691) | — | 24,175 | 31,237,072 | (1,355,229) | — | — | 34,199,870 |
| Senior Loans | 1,363,080 | 745 | — | 100,260 | — | — | 542,065 | (1,363,080) | 643,070 |
| Total | 71,063,325 | (1,016,792) | 147 | 538,241 | 37,122,686 | (3,342,729) | 542,065 | (59,625,829) | 45,281,114 |
(a) Change in unrealized appreciation (depreciation) relating to securities held at August 31, 2017 was $537,120, which is comprised of Asset-Backed Securities — Non-Agency of $(8,314), Commercial Mortgage-Backed Securities — Non-Agency of $393,781, Common Stocks of $(6,941), Residential Mortgage-Backed Securities — Agency of $34,149, Residential Mortgage-Backed Securities — Non-Agency of $24,185 and Senior Loans of $100,260.
The Fund’s assets assigned to the Level 3 category are valued utilizing the valuation technique deemed the most appropriate in the circumstances.
Certain common stock classified as Level 3 securities are valued using the market approach. To determine fair value for these securities, management considered various factors which may have included, but were not limited to, the closing prices of similar securities from the issuer and quoted bids from market participants.
The accompanying Notes to Financial Statements are an integral part of this statement.
| 70 | Multi-Manager Total Return Bond Strategies Fund | Annual Report 2017 |
Portfolio of Investments (continued)
August 31, 2017
Fair value measurements (continued)
Certain senior loans, residential and commercial asset backed securities classified as Level 3 securities are valued using the market approach and utilize single market quotations from broker dealers which may have included, but not limited to, observable transactions for identical or similar assets in the market and the distressed nature of the security. The appropriateness of fair values for these securities is monitored on an ongoing basis which may include results of back testing, manual price reviews and other control procedures. Significant increases (decreases) to any of these inputs would result in a significantly lower (higher) valuation measurement.
The accompanying Notes to Financial Statements are an integral part of this statement.
Multi-Manager Total Return Bond Strategies Fund | Annual Report 2017
| 71 |
Statement of Assets and Liabilities
August 31, 2017
| Assets | |
| Investments in unaffiliated issuers, at cost | $7,565,677,546 |
| Investments in affiliated issuers, at cost | 374,032,971 |
| Investments in unaffiliated issuers, at value | 7,659,392,030 |
| Investments in affiliated issuers, at value | 375,258,578 |
| Foreign currency (identified cost $45,857) | 32,404 |
| Cash collateral held at broker for: | |
| Swap contracts | 2,494,000 |
| Margin deposits on: | |
| Futures contracts | 695,000 |
| Swap contracts | 10,288,122 |
| Unrealized appreciation on swap contracts | 7,559,262 |
| Upfront payments on swap contracts | 17,278,444 |
| Receivable for: | |
| Investments sold | 50,039,541 |
| Investments sold on a delayed delivery basis | 117,733,028 |
| Capital shares sold | 32,536,933 |
| Dividends | 313,729 |
| Interest | 42,197,360 |
| Foreign tax reclaims | 136,969 |
| Variation margin for futures contracts | 1,508,814 |
| Variation margin for swap contracts | 323,191 |
| Prepaid expenses | 48,990 |
| Trustees’ deferred compensation plan | 120,675 |
| Other assets | 6,336 |
| Total assets | 8,317,963,406 |
| Liabilities | |
| Due to custodian | 24,076 |
| Unrealized depreciation on forward foreign currency exchange contracts | 76,952 |
| Unrealized depreciation on swap contracts | 5,958,130 |
| Upfront receipts on swap contracts | 14,839,155 |
| Payable for: | |
| Investments purchased | 83,581,430 |
| Investments purchased on a delayed delivery basis | 608,459,015 |
| Capital shares purchased | 18,022,344 |
| Distributions to shareholders | 14,233,473 |
| Variation margin for futures contracts | 296,462 |
| Variation margin for swap contracts | 1,469,692 |
| Management services fees | 93,834 |
| Distribution and/or service fees | 144 |
| Transfer agent fees | 288,150 |
| Compensation of board members | 1,942 |
| Compensation of chief compliance officer | 504 |
| Other expenses | 256,090 |
| Trustees’ deferred compensation plan | 120,675 |
| Total liabilities | 747,722,068 |
| Net assets applicable to outstanding capital stock | $7,570,241,338 |
| Represented by | |
| Paid in capital | 7,486,877,326 |
| Undistributed net investment income | 1,708,885 |
| Accumulated net realized loss | (7,532,839) |
| Unrealized appreciation (depreciation) on: | |
| Investments - unaffiliated issuers | 93,714,484 |
| Investments - affiliated issuers | 1,225,607 |
| Foreign currency translations | (13,452) |
| Forward foreign currency exchange contracts | (76,952) |
| Futures contracts | 3,239,881 |
| Swap contracts | (8,901,602) |
| Total - representing net assets applicable to outstanding capital stock | $7,570,241,338 |
The accompanying Notes to Financial Statements are an integral part of this statement.
| 72 | Multi-Manager Total Return Bond Strategies Fund | Annual Report 2017 |
Statement of Assets and Liabilities (continued)
August 31, 2017
| Class A | |
| Net assets | $21,020,873 |
| Shares outstanding | 2,067,595 |
| Net asset value per share | $10.17 |
| Class Z | |
| Net assets | $7,549,220,465 |
| Shares outstanding | 742,274,877 |
| Net asset value per share | $10.17 |
The accompanying Notes to Financial Statements are an integral part of this statement.
Multi-Manager Total Return Bond Strategies Fund | Annual Report 2017
| 73 |
Statement of Operations
Year Ended August 31, 2017
| Net investment income | |
| Income: | |
| Dividends — unaffiliated issuers | $724,264 |
| Dividends — affiliated issuers | 4,881,722 |
| Interest | 195,492,354 |
| Foreign taxes withheld | (15,496) |
| Total income | 201,082,844 |
| Expenses: | |
| Management services fees | 31,282,846 |
| Distribution and/or service fees | |
| Class A | 8,847,864 |
| Transfer agent fees | |
| Class A | 1,999,901 |
| Class Z(a) | 1,813,778 |
| Compensation of board members | 138,647 |
| Custodian fees | 151,638 |
| Printing and postage fees | 319,817 |
| Registration fees | 314,852 |
| Audit fees | 53,622 |
| Legal fees | 195,260 |
| Compensation of chief compliance officer | 2,976 |
| Other | 195,466 |
| Total expenses | 45,316,667 |
| Fees waived or expenses reimbursed by Investment Manager and its affiliates | (327,050) |
| Total net expenses | 44,989,617 |
| Net investment income | 156,093,227 |
| Realized and unrealized gain (loss) — net | |
| Net realized gain (loss) on: | |
| Investments — unaffiliated issuers | 14,908,974 |
| Investments — affiliated issuers | (422,875) |
| Capital gain distributions from underlying affiliated funds | 946,900 |
| Foreign currency translations | (58,707) |
| Forward foreign currency exchange contracts | 36,181 |
| Futures contracts | (18,323,551) |
| Options purchased | (83,593) |
| Swap contracts | 7,635,115 |
| Net realized gain | 4,638,444 |
| Net change in unrealized appreciation (depreciation) on: | |
| Investments — unaffiliated issuers | (62,926,148) |
| Investments — affiliated issuers | 1,203,549 |
| Foreign currency translations | 1,828 |
| Forward foreign currency exchange contracts | (82,060) |
| Futures contracts | 5,332,794 |
| Swap contracts | 2,697,363 |
| Net change in unrealized appreciation (depreciation) | (53,772,674) |
| Net realized and unrealized loss | (49,134,230) |
| Net increase in net assets resulting from operations | $106,958,997 |
| (a) | Class Z shares are based on operations from January 3, 2017 (commencement of operations) through the stated period end. |
The accompanying Notes to Financial Statements are an integral part of this statement.
| 74 | Multi-Manager Total Return Bond Strategies Fund | Annual Report 2017 |
Statement of Changes in Net Assets
| | Year Ended
August 31, 2017 (a) | Year Ended
August 31, 2016 |
| Operations | | |
| Net investment income | $156,093,227 | $114,537,735 |
| Net realized gain | 4,638,444 | 81,213,988 |
| Net change in unrealized appreciation (depreciation) | (53,772,674) | 143,064,124 |
| Net increase in net assets resulting from operations | 106,958,997 | 338,815,847 |
| Distributions to shareholders | | |
| Net investment income | | |
| Class A | (72,687,460) | (107,921,973) |
| Class Z | (81,134,740) | — |
| Net realized gains | | |
| Class A | (88,689,055) | (18,209,384) |
| Total distributions to shareholders | (242,511,255) | (126,131,357) |
| Increase in net assets from capital stock activity | 1,091,113,982 | 1,304,537,319 |
| Total increase in net assets | 955,561,724 | 1,517,221,809 |
| Net assets at beginning of year | 6,614,679,614 | 5,097,457,805 |
| Net assets at end of year | $7,570,241,338 | $6,614,679,614 |
| Undistributed net investment income | $1,708,885 | $9,346,279 |
| (a) | Class Z shares are based on operations from January 3, 2017 (commencement of operations) through the stated period end. |
The accompanying Notes to Financial Statements are an integral part of this statement.
Multi-Manager Total Return Bond Strategies Fund | Annual Report 2017
| 75 |
Statement of Changes in Net Assets (continued)
| | Year Ended | Year Ended |
| | August 31, 2017 (a) | August 31, 2016 |
| | Shares | Dollars ($) | Shares | Dollars ($) |
| Capital stock activity |
| Class A | | | | |
| Subscriptions | 175,198,699 | 1,750,723,586 | 237,371,867 | 2,409,831,765 |
| Distributions reinvested | 16,189,824 | 161,376,159 | 12,447,472 | 126,131,125 |
| Redemptions | (824,632,018) | (8,178,534,846) | (121,192,224) | (1,231,425,571) |
| Net increase (decrease) | (633,243,495) | (6,266,435,101) | 128,627,115 | 1,304,537,319 |
| Class Z | | | | |
| Subscriptions | 811,402,435 | 8,053,277,002 | — | — |
| Distributions reinvested | 8,045,258 | 81,134,577 | — | — |
| Redemptions | (77,172,816) | (776,862,496) | — | — |
| Net increase | 742,274,877 | 7,357,549,083 | — | — |
| Total net increase | 109,031,382 | 1,091,113,982 | 128,627,115 | 1,304,537,319 |
| (a) | Class Z shares are based on operations from January 3, 2017 (commencement of operations) through the stated period end. |
The accompanying Notes to Financial Statements are an integral part of this statement.
| 76 | Multi-Manager Total Return Bond Strategies Fund | Annual Report 2017 |
[THIS PAGE INTENTIONALLY LEFT BLANK]
Multi-Manager Total Return Bond Strategies Fund | Annual Report 2017
| 77 |
The following table is intended to help you understand the Fund’s financial performance. Certain information reflects financial results for a single share of a class held for the periods shown. Per share net investment income (loss) amounts are calculated based on average shares outstanding during the period. Total return assumes reinvestment of all dividends and distributions, if any. Total return does not reflect payment of sales charges, if any. Total return and portfolio turnover are not annualized for periods of less than one year. The portfolio turnover rate is calculated without regard to purchase and sales transactions of short-term instruments and certain derivatives, if any. If such transactions were included, the Fund’s portfolio turnover rate may be higher.
| Year ended | Net asset value,
beginning of
period | Net
investment
income | Net
realized
and
unrealized
gain (loss) | Total from
investment
operations | Distributions
from net
investment
income | Distributions
from net
realized
gains |
| Class A |
| 8/31/2017 | $10.41 | 0.22 | (0.11) | 0.11 | (0.21) | (0.14) |
| 8/31/2016 | $10.06 | 0.20 | 0.38 | 0.58 | (0.19) | (0.04) |
| 8/31/2015 | $10.21 | 0.19 | (0.14) | 0.05 | (0.20) | — |
| 8/31/2014 | $9.87 | 0.21 | 0.36 | 0.57 | (0.20) | (0.03) |
| 8/31/2013 | $10.24 | 0.19 | (0.30) | (0.11) | (0.19) | (0.07) |
| Class Z |
| 8/31/2017 (c) | $9.91 | 0.16 | 0.26 (d) | 0.42 | (0.16) | — |
| Notes to Financial Highlights |
| (a) | In addition to the fees and expenses that the Fund bears directly, the Fund indirectly bears a pro rata share of the fees and expenses of any other funds in which it invests. Such indirect expenses are not included in the Fund’s reported expense ratios. |
| (b) | Total net expenses include the impact of certain fee waivers/expense reimbursements made by the Investment Manager and certain of its affiliates, if applicable. |
| (c) | Class Z shares commenced operations on January 3, 2017. Per share data and total return reflect activity from that date. |
| (d) | Calculation of the net gain (loss) per share (both realized and unrealized) does not correlate to the aggregate realized and unrealized gain (loss) presented in the Statement of Operations due to the timing of subscriptions and redemptions of Fund shares in relation to fluctuations in the market value of the portfolio. |
| (e) | Annualized. |
The accompanying Notes to Financial Statements are an integral part of this statement.
| 78 | Multi-Manager Total Return Bond Strategies Fund | Annual Report 2017 |
Total
distributions to
shareholders | Net
asset
value,
end of
period | Total
return | Total gross
expense
ratio to
average
net assets(a) | Total net
expense
ratio to
average
net assets(a),(b) | Net investment
income
ratio to
average
net assets | Portfolio
turnover | Net
assets,
end of
period
(000’s) |
| |
| (0.35) | $10.17 | 1.14% | 0.79% | 0.78% | 2.14% | 345% | $21,021 |
| (0.23) | $10.41 | 5.82% | 0.80% | 0.80% | 2.01% | 289% | $6,614,680 |
| (0.20) | $10.06 | 0.49% | 0.80% | 0.80% | 1.86% | 269% | $5,097,458 |
| (0.23) | $10.21 | 5.86% | 0.80% | 0.80% | 2.09% | 207% | $4,656,220 |
| (0.26) | $9.87 | (1.16%) | 0.79% | 0.79% | 1.88% | 213% | $4,013,878 |
| |
| (0.16) | $10.17 | 4.28% | 0.54% (e) | 0.53% (e) | 2.48% (e) | 345% | $7,549,220 |
Multi-Manager Total Return Bond Strategies Fund | Annual Report 2017
| 79 |
Notes to Financial Statements
August 31, 2017
Note 1. Organization
Multi-Manager Total Return Bond Strategies Fund (formerly known as Active Portfolios® Multi-Manager Total Return Bond Fund) (the Fund), a series of Columbia Funds Series Trust I (the Trust), is a diversified fund. The Trust is registered under the Investment Company Act of 1940, as amended (the 1940 Act), as an open-end management investment company organized as a Massachusetts business trust.
Fund shares
The Trust may issue an unlimited number of shares (without par value). The Fund is offered only through certain wrap fee programs sponsored and/or managed by Ameriprise Financial, Inc. (Ameriprise Financial) or its affiliates. The Fund offers each of the share classes identified below.
Class A shares are not subject to any front-end sales charge or contingent deferred sales charge.
Class Z shares are not subject to any front-end sales charge or contingent deferred sales charge. Class Z shares commenced operations on January 3, 2017. Effective November 1, 2017, Class Z shares will be renamed Institutional Class shares.
Note 2. Summary of significant accounting policies
Basis of preparation
The Fund is an investment company that applies the accounting and reporting guidance in the Financial Accounting Standards Board (FASB) Accounting Standards Codification Topic 946, Financial Services - Investment Companies (ASC 946). The financial statements are prepared in accordance with U.S. generally accepted accounting principles (GAAP), which requires management to make certain estimates and assumptions that affect the reported amounts of assets and liabilities, the disclosure of contingent assets and liabilities at the date of the financial statements and the reported amounts of income and expenses during the reporting period. Actual results could differ from those estimates.
The following is a summary of significant accounting policies followed by the Fund in the preparation of its financial statements.
Security valuation
All equity securities are valued at the close of business of the New York Stock Exchange. Equity securities are valued at the last quoted sales price on the principal exchange or market on which they trade, except for securities traded on the NASDAQ Stock Market, which are valued at the NASDAQ official close price. Unlisted securities or listed securities for which there were no sales during the day are valued at the mean of the latest quoted bid and ask prices on such exchanges or markets.
Debt securities generally are valued by pricing services approved by the Board of Trustees based upon market transactions for normal, institutional-size trading units of similar securities. The services may use various pricing techniques that take into account, as applicable, factors such as yield, quality, coupon rate, maturity, type of issue, trading characteristics and other data, as well as approved independent broker-dealer quotes. Debt securities for which quotations are not readily available or not believed to be reflective of market value may also be valued based upon a bid quote from an approved independent broker-dealer. Debt securities maturing in 60 days or less are valued primarily at amortized cost value, unless this method results in a valuation that management believes does not approximate market value.
Asset- and mortgage-backed securities are generally valued by pricing services, which utilize pricing models that incorporate the securities’ cash flow and loan performance data. These models also take into account available market data, including trades, market quotations, and benchmark yield curves for identical or similar securities. Factors used to identify similar securities may include, but are not limited to, issuer, collateral type, vintage, prepayment speeds, collateral performance, credit ratings, credit enhancement and expected life. Asset-backed securities for which quotations are readily available may also be valued based upon an over-the-counter or exchange bid quote from an approved independent broker-dealer.
Senior loan securities for which reliable market quotations are readily available are generally valued by pricing services at the average of the bids received.
| 80 | Multi-Manager Total Return Bond Strategies Fund | Annual Report 2017 |
Notes to Financial Statements (continued)
August 31, 2017
Foreign equity securities are valued based on the closing price on the foreign exchange in which such securities are primarily traded. If any foreign equity security closing prices are not readily available, the securities are valued at the mean of the latest quoted bid and ask prices on such exchanges or markets. Foreign currency exchange rates are generally determined at 4:00 p.m. Eastern (U.S.) time. Many securities markets and exchanges outside the U.S. close prior to the close of the New York Stock Exchange; therefore, the closing prices for securities in such markets or on such exchanges may not fully reflect events that occur after such close but before the close of the New York Stock Exchange. In those situations, foreign securities will be fair valued pursuant to a policy adopted by the Board of Trustees, including, if available, utilizing a third party pricing service to determine these fair values. The third party pricing service takes into account multiple factors, including, but not limited to, movements in the U.S. securities markets, certain depositary receipts, futures contracts and foreign exchange rates that have occurred subsequent to the close of the foreign exchange or market, to determine a good faith estimate that reasonably reflects the current market conditions as of the close of the New York Stock Exchange. The fair value of a security is likely to be different from the quoted or published price, if available.
Investments in open-end investment companies, including money market funds, are valued at their latest net asset value.
Forward foreign currency exchange contracts are marked-to-market based upon foreign currency exchange rates provided by a pricing service.
Futures and options on futures contracts are valued based upon the settlement price at the close of regular trading on their principal exchanges or, in the absence of transactions, at the mean of the latest quoted bid and ask prices.
Swap transactions are valued through an independent pricing service or broker, or if neither is available, through an internal model based upon observable inputs.
Investments for which market quotations are not readily available, or that have quotations which management believes are not reflective of market value or reliable, are valued at fair value as determined in good faith under procedures approved by and under the general supervision of the Board of Trustees. If a security or class of securities (such as foreign securities) is valued at fair value, such value is likely to be different from the quoted or published price for the security.
The determination of fair value often requires significant judgment. To determine fair value, management may use assumptions including but not limited to future cash flows and estimated risk premiums. Multiple inputs from various sources may be used to determine fair value.
GAAP requires disclosure regarding the inputs and valuation techniques used to measure fair value and any changes in valuation inputs or techniques. In addition, investments shall be disclosed by major category. This information is disclosed following the Fund’s Portfolio of Investments.
Foreign currency transactions and translations
The values of all assets and liabilities denominated in foreign currencies are generally translated into U.S. dollars at exchange rates determined at the close of regular trading on the New York Stock Exchange. Net realized and unrealized gains (losses) on foreign currency transactions and translations include gains (losses) arising from the fluctuation in exchange rates between trade and settlement dates on securities transactions, gains (losses) arising from the disposition of foreign currency and currency gains (losses) between the accrual and payment dates on dividends, interest income and foreign withholding taxes.
For financial statement purposes, the Fund does not distinguish that portion of gains (losses) on investments which is due to changes in foreign exchange rates from that which is due to changes in market prices of the investments. Such fluctuations are included with the net realized and unrealized gains (losses) on investments in the Statement of Operations.
Derivative instruments
The Fund invests in certain derivative instruments, as detailed below, to meet its investment objectives. Derivatives are instruments whose values depend on, or are derived from, in whole or in part, the value of one or more securities, currencies, commodities, indices, or other assets or instruments. Derivatives may be used to increase investment flexibility (including to maintain cash reserves while maintaining desired exposure to certain assets), for risk management (hedging)
Multi-Manager Total Return Bond Strategies Fund | Annual Report 2017
| 81 |
Notes to Financial Statements (continued)
August 31, 2017
purposes, to facilitate trading, to reduce transaction costs and to pursue higher investment returns. The Fund may also use derivative instruments to mitigate certain investment risks, such as foreign currency exchange rate risk, interest rate risk and credit risk. Derivatives may involve various risks, including the potential inability of the counterparty to fulfill its obligations under the terms of the contract, the potential for an illiquid secondary market (making it difficult for the Fund to sell or terminate, including at favorable prices) and the potential for market movements which may expose the Fund to gains or losses in excess of the amount shown in the Statement of Assets and Liabilities. The notional amounts of derivative instruments, if applicable, are not recorded in the financial statements.
A derivative instrument may suffer a marked-to-market loss if the value of the contract decreases due to an unfavorable change in the market rates or values of the underlying instrument. Losses can also occur if the counterparty does not perform its obligations under the contract. The Fund’s risk of loss from counterparty credit risk on over-the-counter derivatives is generally limited to the aggregate unrealized gain netted against any collateral held by the Fund and the amount of any variation margin held by the counterparty, plus any replacement costs or related amounts. With exchange-traded or centrally cleared derivatives, there is reduced counterparty credit risk to the Fund since the clearinghouse or central counterparty (CCP) provides some protection in the case of clearing member default. The clearinghouse or CCP stands between the buyer and the seller of the contract; therefore, additional counterparty credit risk is failure of the clearinghouse or CCP. However, credit risk still exists in exchange-traded or centrally cleared derivatives with respect to initial and variation margin that is held in a broker’s customer account. While brokers are required to segregate customer margin from their own assets, in the event that a broker becomes insolvent or goes into bankruptcy and at that time there is a shortfall in the aggregate amount of margin held by the broker for all its clients, U.S. bankruptcy laws will typically allocate that shortfall on a pro-rata basis across all the broker’s customers (including the Fund), potentially resulting in losses to the Fund.
In order to better define its contractual rights and to secure rights that will help the Fund mitigate its counterparty risk, the Fund may enter into an International Swaps and Derivatives Association, Inc. Master Agreement (ISDA Master Agreement) or similar agreement with its derivatives contract counterparties. An ISDA Master Agreement is an agreement between the Fund and a counterparty that governs over-the-counter derivatives and typically contains, among other things, collateral posting terms and netting provisions in the event of a default and/or termination event. Under an ISDA Master Agreement, the Fund may, under certain circumstances, offset with the counterparty certain derivative instrument’s payables and/or receivables with collateral held and/or posted and create one single net payment. The provisions of the ISDA Master Agreement typically permit a single net payment in the event of default (close-out netting), including the bankruptcy or insolvency of the counterparty. Note, however, that bankruptcy or insolvency laws of a particular jurisdiction may impose restrictions on or prohibitions against the right of offset or netting in bankruptcy, insolvency or other events.
Collateral (margin) requirements differ by type of derivative. Margin requirements are established by the clearinghouse or CCP for exchange-traded and centrally cleared derivatives. Brokers can ask for margin in excess of the minimum in certain circumstances. Collateral terms are contract specific for over-the-counter derivatives. For over-the-counter derivatives traded under an ISDA Master Agreement, the collateral requirements are typically calculated by netting the marked-to-market amount for each transaction under such agreement and comparing that amount to the value of any variation margin currently pledged by the Fund and/or the counterparty. Generally, the amount of collateral due from or to a party has to exceed a minimum transfer amount threshold (e.g., $250,000) before a transfer has to be made. To the extent amounts due to the Fund from its counterparties are not fully collateralized, contractually or otherwise, the Fund bears the risk of loss from counterparty nonperformance. The Fund attempts to mitigate counterparty risk by only entering into agreements with counterparties that it believes have the financial resources to honor their obligations and by monitoring the financial stability of those counterparties.
Certain ISDA Master Agreements allow counterparties of over-the-counter derivatives transactions to terminate derivatives contracts prior to maturity in the event the Fund’s net asset value declines by a stated percentage over a specified time period or if the Fund fails to meet certain terms of the ISDA Master Agreement, which would cause the Fund to accelerate payment of any net liability owed to the counterparty. The Fund also has termination rights if the counterparty fails to meet certain terms of the ISDA Master Agreement. In addition to considering counterparty credit risk, the Fund would consider terminating the derivatives contracts based on whether termination would result in a net liability owed from the counterparty.
For financial reporting purposes, the Fund does not offset derivative assets and derivative liabilities that are subject to netting arrangements in the Statement of Assets and Liabilities.
| 82 | Multi-Manager Total Return Bond Strategies Fund | Annual Report 2017 |
Notes to Financial Statements (continued)
August 31, 2017
Forward foreign currency exchange contracts
Forward foreign currency exchange contracts are over-the-counter agreements between two parties to buy and sell a currency at a set price on a future date. The Fund utilized forward foreign currency exchange contracts to hedge the currency exposure associated with some or all of the Fund’s securities and to shift foreign currency exposure back to U.S. dollars. These instruments may be used for other purposes in future periods.
The values of forward foreign currency exchange contracts fluctuate daily with changes in foreign currency exchange rates. Changes in the value of these contracts are recorded as unrealized appreciation or depreciation until the contract is exercised or has expired. The Fund will realize a gain or loss when the forward foreign currency exchange contract is closed or expires.
The use of forward foreign currency exchange contracts does not eliminate fluctuations in the prices of the Fund’s portfolio securities. The risks of forward foreign currency exchange contracts include movement in the values of the foreign currencies relative to the U.S. dollar (or other foreign currencies) and the possibility that counterparties will not complete their contractual obligations, which may be in excess of the amount reflected, if any, in the Statement of Assets and Liabilities.
Futures contracts
Futures contracts are exchange-traded and represent commitments for the future purchase or sale of an asset at a specified price on a specified date. The Fund bought and sold futures contracts to produce incremental earnings, to manage the duration and yield curve exposure of the Fund versus the benchmark and to manage exposure to movements in interest rates. These instruments may be used for other purposes in future periods. Upon entering into futures contracts, the Fund bears risks that it may not achieve the anticipated benefits of the futures contracts and may realize a loss. Additional risks include counterparty credit risk, the possibility of an illiquid market, and that a change in the value of the contract or option may not correlate with changes in the value of the underlying asset.
Upon entering into a futures contract, the Fund deposits cash or securities with the broker, known as a futures commission merchant (FCM), in an amount sufficient to meet the initial margin requirement. The initial margin deposit must be maintained at an established level over the life of the contract. Cash deposited as initial margin is recorded in the Statement of Assets and Liabilities as margin deposits. Securities deposited as initial margin are designated in the Portfolio of Investments. Subsequent payments (variation margin) are made or received by the Fund each day. The variation margin payments are equal to the daily change in the contract value and are recorded as variation margin receivable or payable and are offset in unrealized gains or losses. The Fund recognizes a realized gain or loss when the contract is closed or expires. Futures contracts involve, to varying degrees, risk of loss in excess of the variation margin disclosed in the Statement of Assets and Liabilities.
Options contracts
Options are contracts which entitle the holder to purchase or sell securities or other identified assets at a specified price, or in the case of index option contracts, to receive or pay the difference between the index value and the strike price of the index option contract. Option contracts can be either exchange-traded or over-the-counter. The Fund purchased option contracts to hedge portfolio investments. These instruments may be used for other purposes in future periods. Completion of transactions for option contracts traded in the over-the-counter market depends upon the performance of the other party. Cash collateral may be collected or posted by the Fund to secure certain over-the-counter option contract trades. Cash collateral held or posted by the Fund for such option contract trades must be returned to the broker or the Fund upon closure, exercise or expiration of the contract.
Options contracts purchased are recorded as investments. When the Fund writes an options contract, the premium received is recorded as an asset and an amount equivalent to the premium is recorded as a liability in the Statement of Assets and Liabilities and is subsequently adjusted to reflect the current fair value of the option written. Changes in the fair value of the written option are recorded as unrealized appreciation or depreciation until the contract is exercised or has expired. The Fund will realize a gain or loss when the option contract is closed or expires. When option contracts are exercised, the proceeds on sales for a written call or purchased put option contract, or the purchase cost for a written put or purchased call option contract, is adjusted by the amount of premium received or paid.
Multi-Manager Total Return Bond Strategies Fund | Annual Report 2017
| 83 |
Notes to Financial Statements (continued)
August 31, 2017
For over-the-counter options purchased, the Fund bears the risk of loss of the amount of the premiums paid plus the positive change in market values net of any collateral held by the Fund should the counterparty fail to perform under the contracts. Option contracts written by the Fund do not typically give rise to significant counterparty credit risk, as options written generally obligate the Fund and not the counterparty to perform. The risk in writing a call option contract is that the Fund gives up the opportunity for profit if the market price of the security increases above the strike price and the option contract is exercised. The risk in writing a put option contract is that the Fund may incur a loss if the market price of the security decreases below the strike price and the option contract is exercised. Exercise of a written option could result in the Fund purchasing or selling a security or foreign currency when it otherwise would not, or at a price different from the current market value. In purchasing and writing options, the Fund bears the risk of an unfavorable change in the value of the underlying instrument or the risk that the Fund may not be able to enter into a closing transaction due to an illiquid market.
Swap contracts
Swap contracts are negotiated in the over-the-counter market and may be entered into as a bilateral contract or centrally cleared (centrally cleared swap contract). In a centrally cleared swap contract, immediately following execution of the swap contract with a broker, the swap contract is novated to a central counterparty (the CCP) and the CCP becomes the Fund’s counterparty to the centrally cleared swap contract. The Fund is required to deposit initial margin with the futures commission merchant (FCM), which pledges it through to the CCP in the form of cash or securities in an amount that varies depending on the size and risk profile of the particular swap contract. Securities deposited as initial margin are designated in the Portfolio of Investments and cash deposited is recorded in the Statement of Assets and Liabilities as margin deposits. Unlike a bilateral swap contract, for centrally cleared swap contracts, the Fund has minimal credit exposure to the FCM because the CCP stands between the Fund and the relevant buyer/seller on the other side of the contract. Swap contracts are marked-to-market daily and changes in value are recorded as unrealized appreciation (depreciation). The daily change in valuation of centrally cleared swap contracts, if any, is recorded as a receivable or payable for variation margin in the Statement of Assets and Liabilities.
Entering into these contracts involves, to varying degrees, elements of interest, liquidity and counterparty credit risk in excess of the amounts recognized in the Statement of Assets and Liabilities. Such risks involve the possibility that there may be unfavorable changes in interest rates, market conditions or other conditions, it may be difficult to initiate a swap transaction or liquidate a position at an advantageous time or price which may result in significant losses, and that the FCM or CCP may not fulfill its obligation under the contract.
Credit default swap contracts
The Fund entered into credit default swap contracts to increase or decrease its credit exposure to an index, increase or decrease its credit exposure to a single issuer of debt securities and to increase or decrease its credit exposure to a specific debt security or a basket of debt securities, as a protection buyer to reduce overall credit exposure. Additionally, credit default swap contracts were used to hedge the Fund’s exposure on a debt security that it owns or in lieu of selling such debt security. These instruments may be used for other purposes in future periods. Credit default swap contracts are agreements in which one party pays fixed periodic payments to a counterparty in consideration for an agreement from the counterparty to make a specific payment should a specified credit event(s) take place. Although specified credit events are contract specific, credit events are generally defined as bankruptcy, failure to pay, restructuring, obligation acceleration, obligation default, or repudiation/moratorium.
As the purchaser of a credit default swap contract, the Fund purchases protection by paying a periodic interest rate on the notional amount to the counterparty. The interest amount is accrued daily as a component of unrealized appreciation (depreciation) and is recorded as a realized loss upon payment. If a credit event as specified in the contract occurs, the Fund may have the option either to deliver the reference obligation to the seller in exchange for a cash payment of its par amount, or to receive a net cash settlement equal to the par amount less an agreed-upon value of the reference obligation as of the date of the credit event. The difference between the value of the obligation or cash delivered and the notional amount received will be recorded as a realized gain (loss).
As the seller of a credit default swap contract, the Fund sells protection to a buyer and will generally receive a periodic interest rate on a notional amount. The interest amount is accrued daily as a component of unrealized appreciation (depreciation) and is recorded as a realized gain upon receipt of the payment. If a credit event as specified in the contract
| 84 | Multi-Manager Total Return Bond Strategies Fund | Annual Report 2017 |
Notes to Financial Statements (continued)
August 31, 2017
with the counterparty occurs, the Fund may either be required to accept the reference obligation from the buyer in exchange for a cash payment of its notional amount, or to pay the buyer a net cash settlement equal to the notional amount less an agreed-upon value of the reference obligation (recovery value) as of the date of the credit event. The difference between the value of the obligation or cash received and the notional amount paid will be recorded as a realized gain (loss). The maximum potential amount of undiscounted future payments the Fund could be required to make as the seller of protection under a credit default swap contract is equal to the notional amount of the reference obligation. These potential amounts may be partially offset by any recovery values of the respective reference obligations or upfront receipts upon entering into the agreement. The notional amounts and market values of all credit default swap contracts in which the Fund is the seller of protection, if any, are disclosed in the Credit Default Swap Contracts Outstanding schedule following the Portfolio of Investments.
As a protection seller, the Fund bears the risk of loss from the credit events specified in the contract with the counterparty. For credit default swap contracts on credit indices, quoted market prices and resulting market values serve as an indicator of the current status of the payment/performance risk. Increasing market values, in absolute terms when compared to the notional amount of the swap, represent a deterioration of the reference entity’s credit soundness and a greater likelihood or risk of default or other credit event occurring as defined under the terms of the contract.
Any upfront payments or receipts by the Fund upon entering into a credit default swap contract is recorded as an asset or liability, respectively, and amortized daily as a component of realized gain (loss) in the Statement of Operations. Credit default swap contracts are valued daily, and the change in value is recorded as unrealized appreciation (depreciation) until the termination of the swap, at which time a realized gain (loss) is recorded.
Credit default swap contracts can involve greater risks than if a fund had invested in the reference obligation directly since, in addition to general market risks, credit default swaps are subject to counterparty credit risk, leverage risk, hedging risk, correlation risk and liquidity risk.
Interest rate swap contracts
The Fund entered into interest rate swap transactions which may include inflation rate swap contracts to manage interest rate and market risk exposure to produce incremental earnings, to gain exposure to or protect itself from market rate changes and to hedge the portfolio risk associated with some or all of the Fund’s securities. These instruments may be used for other purposes in future periods. An interest rate swap is an agreement between two parties where there are two flows and payments are made between the two counterparties and the payments are dependent upon changes in an interest rate, inflation rate or inflation index calculated on a nominal amount. Interest rate swaps are agreements between two parties that involve the exchange of one type of interest rate for another type of interest rate cash flow on specified dates in the future, based on a predetermined, specified notional amount. Certain interest rate swaps are considered forward-starting, whereby the accrual for the exchange of cash flows does not begin until a specified date in the future. The net cash flow for a standard interest rate swap transaction is generally the difference between a floating market interest rate versus a fixed interest rate.
Interest rate swaps are valued daily and unrealized appreciation (depreciation) is recorded. Certain interest rate swaps may accrue periodic interest on a daily basis as a component of unrealized appreciation (depreciation); the Fund will realize a gain or loss upon the payment or receipt of accrued interest. The Fund will realize a gain or a loss when the interest rate swap is terminated.
Effects of derivative transactions in the financial statements
The following tables are intended to provide additional information about the effect of derivatives on the financial statements of the Fund, including: the fair value of derivatives by risk category and the location of those fair values in the Statement of Assets and Liabilities; and the impact of derivative transactions over the period in the Statement of Operations, including realized and unrealized gains (losses). The derivative instrument schedules following the Portfolio of Investments present additional information regarding derivative instruments outstanding at the end of the period, if any.
Multi-Manager Total Return Bond Strategies Fund | Annual Report 2017
| 85 |
Notes to Financial Statements (continued)
August 31, 2017
The following table is a summary of the fair value of derivative instruments (not considered to be hedging instruments for accounting disclosure purposes) at August 31, 2017:
| | Asset derivatives | |
Risk exposure
category | Statement
of assets and liabilities
location | Fair value ($) |
| Credit risk | Net assets — unrealized appreciation on swap contracts | 8,956,246* |
| Credit risk | Upfront payments on swap contracts | 17,278,444 |
| Interest rate risk | Net assets — unrealized appreciation on futures contracts | 3,880,778* |
| Interest rate risk | Net assets — unrealized appreciation on swap contracts | 4,856,950* |
| Total | | 34,972,418 |
| * | Includes cumulative appreciation (depreciation) as reported in the tables following the Portfolio of Investments. Only the current day’s variation margin is reported in receivables or payables in the Statement of Assets and Liabilities. |
| | Liability derivatives | |
Risk exposure
category | Statement
of assets and liabilities
location | Fair value ($) |
| Credit risk | Net assets — unrealized depreciation on swap contracts | 13,504,912* |
| Credit risk | Upfront receipts on swap contracts | 14,839,155 |
| Foreign exchange risk | Unrealized depreciation on forward foreign currency exchange contracts | 76,952 |
| Interest rate risk | Net assets — unrealized depreciation on futures contracts | 640,897* |
| Interest rate risk | Net assets — unrealized depreciation on swap contracts | 9,209,886* |
| Total | | 38,271,802 |
| * | Includes cumulative appreciation (depreciation) as reported in the tables following the Portfolio of Investments. Only the current day’s variation margin is reported in receivables or payables in the Statement of Assets and Liabilities. |
The following table indicates the effect of derivative instruments (not considered to be hedging instruments for accounting disclosure purposes) in the Statement of Operations for the year ended August 31, 2017:
| Amount of realized gain (loss) on derivatives recognized in income |
| Risk exposure category | Forward
foreign
currency
exchange
contracts
($) | Futures
contracts
($) | Options
contracts
purchased
($) | Swap
contracts
($) | Total
($) |
| Credit risk | — | — | — | (10,729,288) | (10,729,288) |
| Foreign exchange risk | 36,181 | — | — | — | 36,181 |
| Interest rate risk | — | (18,323,551) | (83,593) | 18,364,403 | (42,741) |
| Total | 36,181 | (18,323,551) | (83,593) | 7,635,115 | (10,735,848) |
| Change in unrealized appreciation (depreciation) on derivatives recognized in income |
| Risk exposure category | Forward
foreign
currency
exchange
contracts
($) | Futures
contracts
($) | Swap
contracts
($) | Total
($) |
| Credit risk | — | — | (1,711,145) | (1,711,145) |
| Foreign exchange risk | (82,060) | — | — | (82,060) |
| Interest rate risk | — | 5,332,794 | 4,408,508 | 9,741,302 |
| Total | (82,060) | 5,332,794 | 2,697,363 | 7,948,097 |
| 86 | Multi-Manager Total Return Bond Strategies Fund | Annual Report 2017 |
Notes to Financial Statements (continued)
August 31, 2017
The following table is a summary of the average outstanding volume by derivative instrument for the year ended August 31, 2017:
| Derivative instrument | Average notional
amounts ($)* |
| Futures contracts — long | 1,438,337,002 |
| Futures contracts — short | 411,352,600 |
| Credit default swap contracts — buy protection | 499,470,125 |
| Credit default swap contracts — sell protection | 579,790,255 |
| Derivative instrument | Average
value ($)** |
| Options contracts — purchased | 16,517 |
| Derivative instrument | Average unrealized
appreciation ($)* | Average unrealized
depreciation ($)* |
| Forward foreign currency exchange contracts | 1,859 | (19,238) |
| Interest rate swap contracts | 13,092,248 | (3,021,501) |
| * | Based on the ending quarterly outstanding amounts for the year ended August 31, 2017. |
| ** | Based on the ending monthly outstanding amounts for the year ended August 31, 2017. |
Investments in senior loans
The Fund may invest in senior loan assignments. When the Fund purchases an assignment of a senior loan, the Fund typically has direct rights against the borrower; provided, however, that the Fund’s rights may be more limited than the lender from which it acquired the assignment and the Fund may be able to enforce its rights only through an administrative agent. Although certain senior loan assignments are secured by collateral, the Fund could experience delays or limitations in realizing such collateral or have its interest subordinated to other indebtedness of the obligor. In the event that the administrator or collateral agent of a loan becomes insolvent or enters into receivership or bankruptcy, the Fund may incur costs and delays in realizing payment or may suffer a loss of principal and/or interest. The risk of loss is greater for unsecured or subordinated loans. In addition, senior loan assignments are vulnerable to market, economic or other conditions or events that may reduce the demand for senior loan assignments and certain senior loan assignments which were liquid when purchased, may become illiquid.
The Fund may enter into senior loan assignments where all or a portion of the loan may be unfunded. The Fund is obligated to fund these commitments at the borrower’s discretion. These commitments, if any, are generally traded and priced in the same manner as other senior loan securities and are disclosed as unfunded senior loan commitments in the Fund’s Portfolio of Investments with a corresponding payable for investments purchased. The Fund designates cash or liquid securities to cover these commitments.
Asset- and mortgage-backed securities
The Fund may invest in asset-backed and mortgage-backed securities. The maturity dates shown represent the original maturity of the underlying obligation. Actual maturity may vary based upon prepayment activity on these obligations. All, or a portion, of the obligation may be prepaid at any time because the underlying asset may be prepaid. As a result, decreasing market interest rates could result in an increased level of prepayment. An increased prepayment rate will have the effect of shortening the maturity of the security. Unless otherwise noted, the coupon rates presented are fixed rates.
Delayed delivery securities
The Fund may trade securities on other than normal settlement terms, including securities purchased or sold on a “when-issued” or "forward commitment" basis. This may increase risk to the Fund since the other party to the transaction may fail to deliver, which could cause the Fund to subsequently invest at less advantageous prices. The Fund designates cash or liquid securities in an amount equal to the delayed delivery commitment.
Multi-Manager Total Return Bond Strategies Fund | Annual Report 2017
| 87 |
Notes to Financial Statements (continued)
August 31, 2017
Mortgage dollar roll transactions
The Fund may enter into mortgage “dollar rolls” in which the Fund sells securities for delivery in the current month and simultaneously contracts with the same counterparty to repurchase similar but not identical securities (same type, coupon and maturity) on a specified future date. During the roll period, the Fund loses the right to receive principal and interest paid on the securities sold. However, the Fund will benefit because it receives negotiated amounts in the form of reductions of the purchase price for the future purchase plus the interest earned on the cash proceeds of the securities sold until the settlement date of the forward purchase. The Fund records the incremental difference between the forward purchase and sale of each forward roll as a realized gain or loss. Unless any realized gains exceed the income, capital appreciation, and gain or loss due to mortgage prepayments that would have been realized on the securities sold as part of the mortgage dollar roll, the use of this technique will diminish the investment performance of the Fund compared to what the performance would have been without the use of mortgage dollar rolls. All cash proceeds will be invested in instruments that are permissible investments for the Fund. The Fund identifies cash or liquid securities in an amount equal to the forward purchase price.
For financial reporting and tax purposes, the Fund treats “to be announced” mortgage dollar rolls as two separate transactions, one involving the purchase of a security and a separate transaction involving a sale. These transactions may increase the Fund’s portfolio turnover rate. The Fund does not currently enter into mortgage dollar rolls that are accounted for as financing transactions.
Mortgage dollar rolls involve the risk that the market value of the securities the Fund is obligated to repurchase may decline below the repurchase price, or that the counterparty may default on its obligations.
To be announced securities
The Fund may trade securities on a To Be Announced (TBA) basis. As with other delayed-delivery transactions, a seller agrees to issue a TBA security at a future date. However, the seller does not specify the particular securities to be delivered. Instead, the Fund agrees to accept any security that meets specified terms.
In some cases, Master Securities Forward Transaction Agreements (MSFTAs) may be used to govern transactions of certain forward-settling agency mortgage-backed securities, such as delayed-delivery and TBAs, between the Fund and counterparty. The MSFTA maintains provisions for, among other things, initiation and confirmation, payment and transfer, events of default, termination, and maintenance of collateral relating to such transactions.
Treasury inflation protected securities
The Fund may invest in treasury inflation protected securities (TIPS). The principal amount of TIPS is adjusted periodically and is increased for inflation or decreased for deflation based on a monthly published index. These adjustments are recorded as interest income in the Statement of Operations. Coupon payments are based on the adjusted principal at the time the interest is paid.
Interest only and principal only securities
The Fund may invest in Interest Only (IO) or Principal Only (PO) securities. IOs are stripped securities entitled to receive all of the security’s interest, but none of its principal. IOs are particularly sensitive to changes in interest rates and therefore subject to greater fluctuations in price than typical interest bearing debt securities. IOs are also subject to credit risk because the Fund may not receive all or part of the interest payments if the issuer, obligor, guarantor or counterparty defaults on its obligation. Payments received for IOs are included in interest income on the Statement of Operations. Because no principal will be received at the maturity of an IO, adjustments are made to the cost of the security on a monthly basis until maturity. These adjustments are included in interest income on the Statement of Operations. POs are stripped securities entitled to receive the principal from the underlying obligation, but not the interest. POs are particularly sensitive to changes in interest rates and therefore are subject to fluctuations in price. POs are also subject to credit risk because the Fund may not receive all or part of its principal if the issuer, obligor, guarantor or counterparty defaults on its obligation. The Fund may also invest in IO or PO stripped mortgage-backed securities. Payments received for POs are treated as reductions to the cost and par value of the securities.
| 88 | Multi-Manager Total Return Bond Strategies Fund | Annual Report 2017 |
Notes to Financial Statements (continued)
August 31, 2017
Offsetting of assets and liabilities
The following table presents the Fund’s gross and net amount of assets and liabilities available for offset under netting arrangements as well as any related collateral received or pledged by the Fund as of August 31, 2017:
| | Barclays ($) | Citi ($) | Credit
Suisse ($) | Goldman
Sachs ($) | Goldman
Sachs
International ($) | JPMorgan (a)($) | JPMorgan (a) ($) | Morgan
Stanley
(a)($) | Morgan
Stanley
(a)($) | Total ($) |
| Assets | | | | | | | | | | |
| Centrally cleared credit default swap contracts (b) | - | - | - | - | - | - | - | - | 19,232 | 19,232 |
| Centrally cleared interest rate swap contracts (b) | - | - | - | - | - | - | 303,959 | - | - | 303,959 |
| OTC credit default swap contracts (c) | 1,254,651 | 2,712,257 | 298,771 | - | 3,620,646 | 10,367,380 | - | 170,762 | - | 18,424,467 |
| Total assets | 1,254,651 | 2,712,257 | 298,771 | - | 3,620,646 | 10,367,380 | 303,959 | 170,762 | 19,232 | 18,747,658 |
| Liabilities | | | | | | | | | | |
| Centrally cleared credit default swap contracts (b) | - | - | - | - | - | - | - | - | 1,072,492 | 1,072,492 |
| Centrally cleared interest rate swap contracts (b) | - | - | - | - | - | - | 397,200 | - | - | 397,200 |
| Forward foreign currency exchange contracts | - | - | - | 76,952 | - | - | - | - | - | 76,952 |
| OTC credit default swap contracts (c) | 1,168,919 | 880,650 | 1,797,142 | - | 4,412,627 | 3,272,343 | - | 2,852,365 | - | 14,384,046 |
| Total liabilities | 1,168,919 | 880,650 | 1,797,142 | 76,952 | 4,412,627 | 3,272,343 | 397,200 | 2,852,365 | 1,072,492 | 15,930,690 |
| Total financial and derivative net assets | 85,732 | 1,831,607 | (1,498,371) | (76,952) | (791,981) | 7,095,037 | (93,241) | (2,681,603) | (1,053,260) | 2,816,968 |
| Total collateral received (pledged) (d) | - | 1,831,607 | (1,487,399) | - | (704,810) | 6,660,000 | (93,241) | (2,494,000) | (1,053,260) | 2,658,897 |
| Net amount (e) | 85,732 | - | (10,972) | (76,952) | (87,171) | 435,037 | - | (187,603) | - | 158,071 |
| (a) | Exposure can only be netted across transactions governed under the same master agreement with the same legal entity. |
| (b) | Centrally cleared swaps are included within payable/receivable for variation margin on the Statement of Assets and Liabilities. |
| (c) | Over-the-Counter swap contracts are presented at market value plus periodic payments receivable (payable), which is comprised of unrealized appreciation, unrealized depreciation, premiums paid and premiums received. |
| (d) | In some instances, the actual collateral received and/or pledged may be more than the amount shown due to overcollateralization. |
| (e) | Represents the net amount due from/(to) counterparties in the event of default. |
Security transactions
Security transactions are accounted for on the trade date. Cost is determined and gains (losses) are based upon the specific identification method for both financial statement and federal income tax purposes.
The trade date for senior loans purchased in the primary market is the date on which the loan is allocated. The trade date for senior loans purchased in the secondary market is the date on which the transaction is entered into.
Multi-Manager Total Return Bond Strategies Fund | Annual Report 2017
| 89 |
Notes to Financial Statements (continued)
August 31, 2017
Income recognition
Interest income is recorded on an accrual basis. Market premiums and discounts, including original issue discounts, are amortized and accreted, respectively, over the expected life of the security on all debt securities, unless otherwise noted. The Fund classifies gains and losses realized on prepayments received on mortgage-backed securities as adjustments to interest income.
The Fund may place a debt security on non-accrual status and reduce related interest income when it becomes probable that the interest will not be collected and the amount of uncollectible interest can be reasonably estimated. A defaulted debt security is removed from non-accrual status when the issuer resumes interest payments or when collectibility of interest is reasonably assured.
Corporate actions and dividend income are generally recorded net of any non-reclaimable tax withholdings, on the ex-dividend date or upon receipt of ex-dividend notification in the case of certain foreign securities.
The Fund may receive distributions from holdings in equity securities, business development companies (BDCs), exchange-traded funds (ETFs), limited partnerships (LPs), other regulated investment companies (RICs), and real estate investment trusts (REITs), which report information on the tax character of their distributions annually. These distributions are allocated to dividend income, capital gain and return of capital based on actual information reported. Return of capital is recorded as a reduction of the cost basis of securities held. If the Fund no longer owns the applicable securities, return of capital is recorded as a realized gain. With respect to REITs, to the extent actual information has not yet been reported, estimates for return of capital are made by the Fund’s management. Management’s estimates are subsequently adjusted when the actual character of the distributions is disclosed by the REITs, which could result in a proportionate change in return of capital to shareholders.
Awards from class action litigation are recorded as a reduction of cost basis if the Fund still owns the applicable securities on the payment date. If the Fund no longer owns the applicable securities, the proceeds are recorded as realized gains.
The value of additional securities received as an income payment through a payment in kind, if any, is recorded as interest income and increases the cost basis of such securities.
The Fund may receive other income from senior loans, including amendment fees, consent fees and commitment fees. These fees are recorded as income when received by the Fund. These amounts are included in Interest Income in the Statement of Operations.
Income and capital gain distributions from the Underlying Funds, if any, are recorded on the ex-dividend date.
Expenses
General expenses of the Trust are allocated to the Fund and other funds of the Trust based upon relative net assets or other expense allocation methodologies determined by the nature of the expense. Expenses directly attributable to the Fund are charged to the Fund. Expenses directly attributable to a specific class of shares are charged to that share class.
Determination of class net asset value
All income, expenses (other than class-specific expenses, which are charged to that share class, as shown in the Statement of Operations) and realized and unrealized gains (losses) are allocated to each class of the Fund on a daily basis, based on the relative net assets of each class, for purposes of determining the net asset value of each class.
Federal income tax status
The Fund intends to qualify each year as a regulated investment company under Subchapter M of the Internal Revenue Code, as amended, and will distribute substantially all of its taxable income (including net short-term capital gains) and capital gains, if any, for its tax year, and as such will not be subject to federal income taxes. In addition, the Fund intends to distribute in each calendar year substantially all of its net investment income, capital gains and certain other amounts, if any, such that the Fund should not be subject to federal excise tax. Therefore, no federal income or excise tax provision is recorded.
| 90 | Multi-Manager Total Return Bond Strategies Fund | Annual Report 2017 |
Notes to Financial Statements (continued)
August 31, 2017
Foreign taxes
The Fund may be subject to foreign taxes on income, gains on investments or currency repatriation, a portion of which may be recoverable. The Fund will accrue such taxes and recoveries, as applicable, based upon its current interpretation of tax rules and regulations that exist in the markets in which it invests.
Realized gains in certain countries may be subject to foreign taxes at the Fund level, based on statutory rates. The Fund accrues for such foreign taxes on realized and unrealized gains at the appropriate rate for each jurisdiction, as applicable. The amount, if any, is disclosed as a liability on the Statement of Assets and Liabilities.
Distributions to shareholders
Distributions from net investment income, if any, are declared daily and paid monthly. Net realized capital gains, if any, are distributed at least annually. Income distributions and capital gain distributions are determined in accordance with federal income tax regulations, which may differ from GAAP.
Guarantees and indemnifications
Under the Trust’s organizational documents and, in some cases, by contract, its officers and trustees are indemnified against certain liabilities arising out of the performance of their duties to the Trust or its funds. In addition, certain of the Fund’s contracts with its service providers contain general indemnification clauses. The Fund’s maximum exposure under these arrangements is unknown since the amount of any future claims that may be made against the Fund cannot be determined, and the Fund has no historical basis for predicting the likelihood of any such claims.
Recent accounting pronouncement
Accounting Standards Update 2017-08 Premium Amortization on Purchased Callable Debt Securities
In March 2017, the Financial Accounting Standards Board issued Accounting Standards Update (ASU) No. 2017-08 Premium Amortization on Purchased Callable Debt Securities. ASU No. 2017-08 updates the accounting standards to shorten the amortization period for certain purchased callable debt securities, held at a premium, to be amortized to the earliest call date. The update applies to securities with explicit, noncontingent call features that are callable at fixed prices and on preset dates. The standard is effective for annual periods beginning after December 15, 2018 and interim periods within those fiscal years. At this time, management is evaluating the implication of this guidance and the impact it will have on the financial statement amounts and footnote disclosures, if any.
Note 3. Fees and other transactions with affiliates
Management services fees
The Fund has entered into a Management Agreement with Columbia Management Investment Advisers, LLC (the Investment Manager), a wholly-owned subsidiary of Ameriprise Financial, Inc. (Ameriprise Financial). Under the Management Agreement, the Investment Manager provides the Fund with investment research and advice, as well as administrative and accounting services. The Investment Manager is responsible for the ultimate oversight of investments made by the Fund. The Fund’s subadvisers (see Subadvisory agreement below) have the primary responsibility for the day-to-day portfolio management of their portion of the Fund. The management services fee is an annual fee that is equal to a percentage of the Fund’s daily net assets that declines from 0.50% to 0.34% as the Fund’s net assets increase. The effective management services fee rate, net of waivers, for the year ended August 31, 2017 was 0.46% of the Fund’s average daily net assets.
The Investment Manager has voluntarily agreed to waive a portion of the management services fee on Fund assets that are invested in affiliated mutual funds, exchange-traded funds and closed-end funds that pay a management services fee, or where applicable, an advisory fee to the Investment Manager. The Investment Manager, in its discretion, may revise or discontinue this arrangement at any time.
Multi-Manager Total Return Bond Strategies Fund | Annual Report 2017
| 91 |
Notes to Financial Statements (continued)
August 31, 2017
Subadvisory agreement
The Investment Manager has entered into Subadvisory Agreements with Loomis Sayles & Company, L.P., PGIM, Inc., the asset management arm of Prudential Financial and TCW Investment Management Company, LLC, each of which, together with the Investment Manager, manage a portion of the assets of the Fund. New investments in the Fund, net of any redemptions, are allocated in accordance with the Investment Manager’s determination, subject to the oversight of the Fund’s Board of Trustees. Each subadviser’s proportionate share of investments in the Fund may also vary due to market fluctuations. The Investment Manager compensates each subadviser to manage the investment of the Fund’s assets.
Compensation of board members
Members of the Board of Trustees, who are not officers or employees of the Investment Manager or Ameriprise Financial, are compensated for their services to the Fund as disclosed in the Statement of Operations. These members of the Board of Trustees may participate in a Deferred Compensation Plan (the Plan) which may be terminated at any time. Obligations of the Plan will be paid solely out of the Fund’s assets, and all amounts payable under the Plan constitute a general unsecured obligation of the Fund.
Compensation of Chief Compliance Officer
The Board of Trustees has appointed a Chief Compliance Officer to the Fund in accordance with federal securities regulations. A portion of the Chief Compliance Officer’s total compensation is allocated to the Fund, along with other affiliated funds governed by the Board of Trustees, based on relative net assets. The total amount allocated to all affiliated funds governed by the Board of Trustees will not exceed $40,000 annually.
Transactions with affiliates
For the year ended August 31, 2017, the Fund engaged in purchase and/or sale transactions with affiliates and/or accounts that have a common investment manager (or affiliated investment managers), common directors/trustees, and/or common officers. Those purchase and sale transactions complied with provisions of Rule 17a-7 under the 1940 Act and were $23,046,326 and $0, respectively.
Transfer agency fees
Under a Transfer and Dividend Disbursing Agent Agreement, Columbia Management Investment Services Corp. (the Transfer Agent), an affiliate of the Investment Manager and a wholly-owned subsidiary of Ameriprise Financial, is responsible for providing transfer agency services to the Fund. The Transfer Agent has contracted with Boston Financial Data Services (BFDS) to serve as sub-transfer agent. The Transfer Agent pays the fees of BFDS for services as sub-transfer agent and BFDS is not entitled to reimbursement for such fees from the Fund (with the exception of out-of-pocket fees).
The Fund pays the Transfer Agent a monthly transfer agency fee based on the number or the average value of accounts, depending on the type of account. In addition, prior to October 1, 2016, the Transfer Agent also received sub-transfer agency fees based on a percentage of the average aggregate value of the Fund’s shares maintained in omnibus accounts (other than omnibus accounts for which American Enterprise Investment Services Inc. is the broker of record or accounts where the beneficial shareholder is a customer of Ameriprise Financial Services, Inc., for which the Transfer Agent receives a per account fee). Effective October 1, 2016, the Fund pays the Transfer Agent a fee for shareholder services based on the number of accounts or on a percentage of the average aggregate value of the Fund’s shares maintained in omnibus accounts up to the lesser of the amount charged by the financial intermediary or a cap established by the Board of Trustees from time to time.
The Transfer Agent also receives compensation from the Fund for various shareholder services and reimbursements for certain out-of-pocket fees.
| 92 | Multi-Manager Total Return Bond Strategies Fund | Annual Report 2017 |
Notes to Financial Statements (continued)
August 31, 2017
For the year ended August 31, 2017, the Fund’s effective transfer agency fee rates as a percentage of average daily net assets of each class were as follows:
| | Effective rate (%) |
| Class A | 0.06 |
| Class Z | 0.06 (a) |
Distribution and service fees
The Fund has entered into an agreement with Columbia Management Investment Distributors, Inc. (the Distributor), an affiliate of the Investment Manager and a wholly-owned subsidiary of Ameriprise Financial, for distribution and shareholder services. The Board of Trustees has approved, and the Fund has adopted, distribution and shareholder service plans (the Plans) applicable to certain share classes, which set the distribution and service fees for the Fund. These fees are calculated daily and are intended to compensate the Distributor and/or eligible selling and/or servicing agents for selling shares of the Fund and providing services to investors.
The Fund may pay distribution fee of up to 0.25% of the Fund’s average daily net assets attributable to Class A shares and a service fee of up to 0.25% of the Fund’s average daily net assets attributable to Class A shares, provided that the aggregate fee shall not exceed 0.25% of the Fund’s average daily net assets attributable to Class A shares.
Expenses waived/reimbursed by the Investment Manager and its affiliates
The Investment Manager and certain of its affiliates have contractually agreed to waive fees and/or reimburse expenses (excluding certain fees and expenses described below) for the period(s) disclosed below, unless sooner terminated at the sole discretion of the Board of Trustees, so that the Fund’s net operating expenses, after giving effect to fees waived/expenses reimbursed and any balance credits and/or overdraft charges from the Fund’s custodian, do not exceed the following annual rate(s) as a percentage of the class’ average daily net assets:
| | Fee rate(s) contractual through December 31, 2017 |
| Class A | 0.86% |
| Class Z | 0.61* |
*Expense cap rate is contractual from January 3, 2017 (the commencement of operations of Class Z shares) through December 31, 2017.
Under the agreement governing these fee waivers and/or expense reimbursement arrangements, the following fees and expenses are excluded from the waiver/reimbursement commitment, and therefore will be paid by the Fund, if applicable: taxes (including foreign transaction taxes), expenses associated with investments in affiliated and non-affiliated pooled investment vehicles (including mutual funds and exchange-traded funds), transaction costs and brokerage commissions, costs related to any securities lending program, dividend expenses associated with securities sold short, inverse floater program fees and expenses, transaction charges and interest on borrowed money, interest, infrequent and/or unusual expenses and any other expenses the exclusion of which is specifically approved by the Board of Trustees. This agreement may be modified or amended only with approval from the Investment Manager, certain of its affiliates and the Fund. Any fees waived and/or expenses reimbursed under the expense reimbursement arrangements described above are not recoverable by the Investment Manager or its affiliates in future periods.
Note 4. Federal tax information
The timing and character of income and capital gain distributions are determined in accordance with income tax regulations, which may differ from GAAP because of temporary or permanent book to tax differences.
At August 31, 2017, these differences are primarily due to differing treatment for deferral/reversal of wash sale losses, re-characterization of distributions for investments, derivative investments, tax straddles, swap investments, trustees’ deferred compensation, excess distributions, principal and/or interest from fixed income securities, foreign currency transactions, distribution reclassifications, non-deductible expenses and adjustments on certain convertible preferred securities. To the extent these differences are permanent, reclassifications are made among the components of the Fund’s net assets in the Statement of Assets and Liabilities. Temporary differences do not require reclassifications.
Multi-Manager Total Return Bond Strategies Fund | Annual Report 2017
| 93 |
Notes to Financial Statements (continued)
August 31, 2017
In the Statement of Assets and Liabilities the following reclassifications were made:"
Undistributed net
investment
income ($) | Accumulated
net realized
(loss) ($) | Paid in
capital ($) |
| (9,908,421) | 9,908,421 | — |
Net investment income (loss) and net realized gains (losses), as disclosed in the Statement of Operations, and net assets were not affected by this reclassification.
The tax character of distributions paid during the years indicated was as follows:
| August 31, 2017 | August 31, 2016 |
Ordinary
income ($) | Long-term
capital gains ($) | Total ($) | Ordinary
income ($) | Long-term
capital gains ($) | Total ($) |
| 222,130,332 | 20,380,923 | 242,511,255 | 126,131,357 | — | 126,131,357 |
Short-term capital gain distributions, if any, are considered ordinary income distributions for tax purposes.
At August 31, 2017, the components of distributable earnings on a tax basis were as follows:
Undistributed
ordinary income ($) | Undistributed
long-term
capital gains ($) | Capital loss
carryforwards ($) | Net unrealized
appreciation ($) |
| 14,127,029 | 2,908,510 | — | 80,701,474 |
At August 31, 2017, the cost of all investments for federal income tax purposes along with the aggregate gross unrealized appreciation and depreciation based on that cost was:
Federal
tax cost ($) | Gross unrealized
appreciation ($) | Gross unrealized
(depreciation) ($) | Net unrealized
appreciation ($) |
| 7,948,210,462 | 119,602,729 | (38,901,255) | 80,701,474 |
Tax cost of investments and unrealized appreciation/(depreciation) may also include timing differences that do not constitute adjustments to tax basis.
Management of the Fund has concluded that there are no significant uncertain tax positions in the Fund that would require recognition in the financial statements. However, management’s conclusion may be subject to review and adjustment at a later date based on factors including, but not limited to, new tax laws, regulations, and administrative interpretations (including relevant court decisions). Generally, the Fund’s federal tax returns for the prior three fiscal years remain subject to examination by the Internal Revenue Service.
Note 5. Portfolio information
The cost of purchases and proceeds from sales of securities, excluding short-term investments and derivatives, if any, aggregated to $24,677,889,472 and $23,771,492,114, respectively, for the year ended August 31, 2017, of which $16,009,195,454 and $15,372,224,906, respectively, were U.S. government securities. The amount of purchase and sale activity impacts the portfolio turnover rate reported in the Financial Highlights.
Note 6. Affiliated money market fund
The Fund invests in Columbia Short-Term Cash Fund, an affiliated money market fund established for the exclusive use by the Fund and other affiliated funds (the Affiliated MMF). The income earned by the Fund from such investments is included as Dividends - affiliated issuers in the Statement of Operations. As an investing fund, the Fund indirectly bears its proportionate share of the expenses of the Affiliated MMF. Effective October 1, 2016, the Affiliated MMF prices its shares with a floating net asset value (NAV) and no longer seeks to maintain a stable NAV. In addition, the Board of Trustees of the Affiliated MMF may impose a fee on redemptions (sometimes referred to as a liquidity fee) or temporarily suspend redemptions (sometimes referred to as imposing a redemption gate) in the event its liquidity falls below regulatory limits.
| 94 | Multi-Manager Total Return Bond Strategies Fund | Annual Report 2017 |
Notes to Financial Statements (continued)
August 31, 2017
Note 7. Line of credit
The Fund has access to a revolving credit facility with a syndicate of banks led by Citibank, N.A., HSBC Bank USA, N.A. and JPMorgan Chase Bank, N.A. whereby the Fund may borrow for the temporary funding of shareholder redemptions or for other temporary or emergency purposes. The credit facility, which is a collective agreement between the Fund and certain other funds managed by the Investment Manager, severally and not jointly, permits collective borrowings up to $1 billion. Interest is charged to each participating fund based on its borrowings at a rate equal to the higher of (i) the overnight federal funds rate plus 1.00% or (ii) the one-month LIBOR rate plus 1.00%. Each borrowing under the credit facility matures no later than 60 days after the date of borrowing. The Fund also pays a commitment fee equal to its pro rata share of the amount of the credit facility at a rate of 0.15% per annum. The commitment fee is included in other expenses in the Statement of Operations.
The Fund had no borrowings during the year ended August 31, 2017.
Note 8. Significant risks
Shareholder concentration risk
At August 31, 2017, affiliated shareholders of record owned 100.0% of the outstanding shares of the Fund in one or more accounts. Subscription and redemption activity by concentrated accounts may have a significant effect on the operations of the Fund. In the case of a large redemption, the Fund may be forced to sell investments at inopportune times, including its liquid positions, which may result in Fund losses and the Fund holding a higher percentage of less liquid positions. Large redemptions could result in decreased economies of scale and increased operating expenses for non-redeeming Fund shareholders.
Credit risk
Credit risk is the risk that the value of debt securities in the Fund’s portfolio may decline because the issuer may default and fail to pay interest or repay principal when due. Rating agencies assign credit ratings to debt securities to indicate their credit risk. Lower rated or unrated debt securities held by the Fund may present increased credit risk as compared to higher-rated debt securities.
Derivatives risk
Losses involving derivative instruments may be substantial, because a relatively small price movement in the underlying security(ies), commodity, currency or index or other instrument or asset may result in a substantial loss for the Fund. In addition to the potential for increased losses, the use of derivative instruments may lead to increased volatility within the Fund. Derivatives will typically increase the Fund’s exposure to principal risks to which it is otherwise exposed, and may expose the Fund to additional risks, including correlation risk, counterparty risk, hedging risk, leverage risk and liquidity risk.
Interest rate risk
Interest rate risk is the risk of losses attributable to changes in interest rates. In general, if prevailing interest rates rise, the values of debt securities tend to fall, and if interest rates fall, the values of debt securities tend to rise. Actions by governments and central banking authorities can result in increases in interest rates. Increasing interest rates may negatively affect the value of debt securities held by the Fund, resulting in a negative impact on the Fund’s performance and net asset value per share. In general, the longer the maturity or duration of a debt security, the greater its sensitivity to changes in interest rates.
Liquidity risk
Liquidity risk is the risk associated with a lack of marketability of investments which may make it difficult to sell the investment at a desirable time or price. Changing regulatory, market or other conditions or environments (for example, the interest rate or credit environments) may adversely affect the liquidity of the Fund’s investments. The Fund may have to accept a lower selling price for the holding, sell other investments, or forego another, more appealing investment opportunity.
Multi-Manager Total Return Bond Strategies Fund | Annual Report 2017
| 95 |
Notes to Financial Statements (continued)
August 31, 2017
Generally, the less liquid the market at the time the Fund sells a portfolio investment, the greater the risk of loss or decline of value to the Fund. A less liquid market can lead to an increase in Fund redemptions, which may negatively impact Fund performance and net asset value per share, including, for example, if the Fund is forced to sell securities in a down market.
Mortgage- and other asset-backed securities risk
The value of any mortgage-backed and other asset-backed securities held by the Fund may be affected by, among other things, changes or perceived changes in: interest rates; factors concerning the interests in and structure of the issuer or the originator of the mortgages or other assets; the creditworthiness of the entities that provide any supporting letters of credit, surety bonds or other credit enhancements; or the market’s assessment of the quality of underlying assets. Payment of principal and interest on some mortgage-backed securities (but not the market value of the securities themselves) may be guaranteed by the full faith and credit of a particular U.S. Government agency, authority, enterprise or instrumentality, and some, but not all, are also insured or guaranteed by the U.S. Government. Mortgage-backed securities issued by non-governmental issuers (such as commercial banks, savings and loan institutions, private mortgage insurance companies, mortgage bankers and other secondary market issuers) may entail greater risk than obligations guaranteed by the U.S. Government. Mortgage- and other asset-backed securities are subject to prepayment risk, which is the possibility that the underlying mortgage or other asset may be refinanced or prepaid prior to maturity during periods of declining or low interest rates, causing the Fund to have to reinvest the money received in securities that have lower yields. Rising or high interest rates tend to extend the duration of mortgage- and other asset-backed securities, making their prices more volatile and more sensitive to changes in interest rates.
Note 9. Subsequent events
Management has evaluated the events and transactions that have occurred through the date the financial statements were issued. Other than as noted in Note 1 above, there were no items requiring adjustment of the financial statements or additional disclosure.
Note 10. Information regarding pending and settled legal proceedings
Ameriprise Financial and certain of its affiliates have historically been involved in a number of legal, arbitration and regulatory proceedings, including routine litigation, class actions, and governmental actions, concerning matters arising in connection with the conduct of their business activities. Ameriprise Financial believes that the Fund is not currently the subject of, and that neither Ameriprise Financial nor any of its affiliates are the subject of, any pending legal, arbitration or regulatory proceedings that are likely to have a material adverse effect on the Fund or the ability of Ameriprise Financial or its affiliates to perform under their contracts with the Fund. Ameriprise Financial is required to make quarterly (10-Q), annual (10-K) and, as necessary, 8-K filings with the Securities and Exchange Commission (SEC) on legal and regulatory matters that relate to Ameriprise Financial and its affiliates. Copies of these filings may be obtained by accessing the SEC website at www.sec.gov.
There can be no assurance that these matters, or the adverse publicity associated with them, will not result in increased Fund redemptions, reduced sale of Fund shares or other adverse consequences to the Fund. Further, although we believe proceedings are not likely to have a material adverse effect on the Fund or the ability of Ameriprise Financial or its affiliates to perform under their contracts with the Fund, these proceedings are subject to uncertainties and, as such, we are unable to estimate the possible loss or range of loss that may result. An adverse outcome in one or more of these proceedings could result in adverse judgments, settlements, fines, penalties or other relief that could have a material adverse effect on the consolidated financial condition or results of operations of Ameriprise Financial.
| 96 | Multi-Manager Total Return Bond Strategies Fund | Annual Report 2017 |
Report of Independent Registered Public Accounting Firm
To the Trustees of Columbia Funds Series Trust I and the Shareholders of Multi-Manager Total Return Bond Strategies Fund
In our opinion, the accompanying statement of assets and liabilities, including the portfolio of investments, and the related statements of operations and of changes in net assets and the financial highlights present fairly, in all material respects, the financial position of Multi-Manager Total Return Bond Strategies Fund (the “Fund”, a series of Columbia Funds Series Trust I) as of August 31, 2017, the results of its operations for the year then ended, the changes in its net assets for each of the two years in the period then ended and the financial highlights for each of the five years in the period then ended, in conformity with accounting principles generally accepted in the United States of America. These financial statements and financial highlights (hereafter referred to as “financial statements”) are the responsibility of the Fund’s management. Our responsibility is to express an opinion on these financial statements based on our audits. We conducted our audits of these financial statements in accordance with the standards of the Public Company Accounting Oversight Board (United States). Those standards require that we plan and perform the audit to obtain reasonable assurance about whether the financial statements are free of material misstatement. An audit includes examining, on a test basis, evidence supporting the amounts and disclosures in the financial statements, assessing the accounting principles used and significant estimates made by management, and evaluating the overall financial statement presentation. We believe that our audits, which included confirmation of securities as of August 31, 2017 by correspondence with the custodian, brokers, agent banks and transfer agent provide a reasonable basis for our opinion.
/s/ PricewaterhouseCoopers LLP
Minneapolis, MN
October 20, 2017
Multi-Manager Total Return Bond Strategies Fund | Annual Report 2017
| 97 |
Federal Income Tax Information
(Unaudited)
The Fund hereby designates the following tax attributes for the fiscal year ended August 31, 2017. Shareholders will be notified in early 2018 of the amounts for use in preparing 2017 income tax returns.
Qualified
dividend
income | Dividends
received
deduction | Capital
gain
dividend |
| 0.40% | 0.39% | $3,158,613 |
Qualified dividend income. For taxable, non-corporate shareholders, the percentage of ordinary income distributed during the fiscal year that represents qualified dividend income subject to reduced tax rates.
Dividends received deduction. The percentage of ordinary income distributed during the fiscal year that qualifies for the corporate dividends received deduction.
Capital gain dividend. The Fund designates as a capital gain dividend the amount reflected above, or if subsequently determined to be different, the net capital gain of such fiscal period.
| 98 | Multi-Manager Total Return Bond Strategies Fund | Annual Report 2017 |
Shareholders elect the Board that oversees the Fund’s operations. The Board appoints officers who are responsible for day-to-day business decisions based on policies set by the Board. The following table provides basic biographical information about the Fund’s Trustees, including their principal occupations during the past five years, although specific titles for individuals may have varied over the period. The year set forth beneath Length of Service in the table below is the year in which the Trustee was first appointed or elected as Trustee to any Fund currently in the Columbia Funds Complex or a predecessor thereof. Under current Board policy, members serve terms of indefinite duration.
Independent trustees
| Name, address, year of birth | Position held with the Trust and length of service | Principal occupation(s) during the past five years and other relevant professional experience | Number of Funds in the Columbia Fund Complex overseen | Other directorships held by Trustee during the past five years |
Janet Langford Carrig
c/o Columbia Management
Investment Advisers, LLC
225 Franklin Street
Mail Drop BX32 05228
Boston, MA 02110
1957 | Trustee
1996 | Senior Vice President, General Counsel and Corporate Secretary, ConocoPhillips (independent energy company) since September 2007 | 57 | None |
Douglas A. Hacker
c/o Columbia Management
Investment Advisers, LLC
225 Franklin Street
Mail Drop BX32 05228
Boston, MA 02110
1955 | Trustee and Chairman of the Board
1996 | Independent business executive since May 2006; Executive Vice President — Strategy of United Airlines from December 2002 to May 2006; President of UAL Loyalty Services (airline marketing company) from September 2001 to December 2002; Executive Vice President and Chief Financial Officer of United Airlines from July 1999 to September 2001 | 57 | Spartan Nash Company, (food distributor); Nash Finch Company (food distributor) from 2005 to 2013; Aircastle Limited (aircraft leasing); SeaCube Container Leasing Ltd. (container leasing) from 2010 to 2013; and Travelport Worldwide Limited (travel information technology) |
Nancy T. Lukitsh
c/o Columbia Management
Investment Advisers, LLC
225 Franklin Street
Mail Drop BX32 05228
Boston, MA 02110
1956 | Trustee
2011 | Senior Vice President, Partner and Director of Marketing, Wellington Management Company, LLP (investment adviser) from 1997 to 2010; Chair, Wellington Management Portfolios (commingled non-U.S. investment pools) from 2007 to 2010; Director, Wellington Trust Company, NA and other Wellington affiliates from 1997 to 2010 | 57 | None |
David M. Moffett
c/o Columbia Management
Investment Advisers, LLC
225 Franklin Street
Mail Drop BX32 05228
Boston, MA 02110
1952 | Trustee
2011 | Retired. Consultant to Bridgewater and Associates | 57 | Director, CSX Corporation; Genworth Financial, Inc. (financial and insurance products and services); PayPal Holdings Inc. (payment and data processing services); Trustee, University of Oklahoma Foundation; former Director, eBay Inc. (online trading community), 2007-2015; and former Director, CIT Bank, CIT Group Inc. (commercial and consumer finance), 2010-2016 |
Multi-Manager Total Return Bond Strategies Fund | Annual Report 2017
| 99 |
TRUSTEES AND OFFICERS (continued)
Independent trustees (continued)
| Name, address, year of birth | Position held with the Trust and length of service | Principal occupation(s) during the past five years and other relevant professional experience | Number of Funds in the Columbia Fund Complex overseen | Other directorships held by Trustee during the past five years |
Charles R. Nelson
c/o Columbia Management
Investment Advisers, LLC
225 Franklin Street
Mail Drop BX32 05228
Boston, MA 02110
1942 | Trustee
1981 | Retired. Professor Emeritus, University of Washington since 2011; Professor of Economics, University of Washington from 1976 to 2011; Ford and Louisa Van Voorhis Professor of Political Economy, University of Washington from 1993 to 2011; Adjunct Professor of Statistics, University of Washington from 1980 to 2011; Associate Editor, Journal of Money, Credit and Banking from September 1993 to 2008; consultant on econometric and statistical matters | 57 | None |
John J. Neuhauser
c/o Columbia Management
Investment Advisers, LLC
225 Franklin Street
Mail Drop BX32 05228
Boston, MA 02110
1943 | Trustee
1984 | President, Saint Michael’s College since August 2007; Director or Trustee of several non-profit organizations, including University of Vermont Medical Center; Academic Vice President and Dean of Faculties, Boston College from August 1999 to October 2005; University Professor, Boston College from November 2005 to August 2007 | 57 | Liberty All-Star Equity Fund and Liberty All- Star Growth Fund (closed-end funds) |
Patrick J. Simpson
c/o Columbia Management
Investment Advisers, LLC
225 Franklin Street
Mail Drop BX32 05228
Boston, MA 02110
1944 | Trustee
2000 | Of Counsel, Perkins Coie LLP (law firm) since 2015; Partner, Perkins Coie LLP from 1988 to 2014 | 57 | None |
Anne-Lee Verville
c/o Columbia Management
Investment Advisers, LLC
225 Franklin Street
Mail Drop BX32 05228
Boston, MA 02110
1945 | Trustee
1998 | Retired. General Manager, Global Education Industry from 1994 to 1997, President – Application Systems Division from 1991 to 1994, Chief Financial Officer – US Marketing & Services from 1988 to 1991, and Chief Information Officer from 1987 to 1988, IBM Corporation (computer and technology) | 57 | Enesco Group, Inc. (producer of giftware and home and garden decor products) from 2001 to 2006 |
| 100 | Multi-Manager Total Return Bond Strategies Fund | Annual Report 2017 |
TRUSTEES AND OFFICERS (continued)
Consultants to the Independent Trustees*
| Name, address, year of birth | Position held with the Trust and length of service | Principal occupation(s) during the past five years and other relevant professional experience | Number of Funds in the Columbia Funds complex overseen | Other directorships held by Trustee during the past five years |
J. Kevin Connaughton
c/o Columbia
Management Investment
Advisers, LLC,
225 Franklin Street
Mail Drop BX32 05228,
Boston, MA 02110
1964 | Independent Trustee Consultant
2016 | Independent Trustee Consultant, Columbia Funds since March 2016; Managing Director and General Manager of Mutual Fund Products, Columbia Management Investment Advisers, LLC from May 2010 to February 2015; President, Columbia Funds from 2009 to 2015; and senior officer of Columbia Funds and affiliated funds from 2003 to 2015 | 57 | Board of Governors, Gateway Healthcare since January 2016; Trustee, New Century Portfolios since March 2015; and Director, The Autism Project since March 2015 |
Natalie A. Trunow
c/o Columbia
Management Investment
Advisers, LLC,
225 Franklin Street
Mail Drop BX32 05228,
Boston, MA 02110
1967 | Independent Trustee Consultant
2016 | Independent Trustee Consultant, Columbia Funds since September 2016; Chief Executive Officer, Millennial Partners (investment consulting services to institutions) since January 2016; Director of Investments, Casey Family Programs from April 2016 to September 2016; Senior Vice President and Chief Investment Officer, Calvert Investments from August 2008 to January 2016; Section Head and Portfolio Manager, General Motors Asset Management from June 1997 to August 2008 | 57 | Healthcare Services for Children with Special Needs |
| * | J. Kevin Connaughton was appointed consultant to the Independent Trustees effective March 1, 2016. Natalie A. Trunow was appointed consultant to the Independent Trustees effective September 1, 2016. Shareholders of the Funds are expected to be asked to elect each of Mr. Connaughton and Ms. Trunow as a Trustee at a future shareholder meeting. |
Interested trustee affiliated with Investment Manager*
| Name, address, year of birth | Position held with the Trust and length of service | Principal occupation(s) during the past five years and other relevant professional experience | Number of Funds in the Columbia Funds Complex overseen | Other directorships held by Trustee during the past five years |
William F. Truscott
c/o Columbia Management
Investment Advisers, LLC
225 Franklin Street
Boston, MA 02110
1960 | Trustee
2012 | Chairman of the Board and President, Columbia Management Investment Advisers, LLC since May 2010 and February 2012, respectively; Chief Executive Officer, Global Asset Management, Ameriprise Financial, Inc. since September 2012 (previously Chief Executive Officer, U.S. Asset Management & President, Annuities, May 2010-September 2012); Director and Chief Executive Officer, Columbia Management Investment Distributors, Inc. since May 2010 and February 2012, respectively; Chairman of the Board and Chief Executive Officer, RiverSource Distributors, Inc. since 2006; Director, Threadneedle Asset Management Holdings, SARL since 2014; President and Chief Executive Officer, Ameriprise Certificate Company, 2006-August 2012 | 179 | Chairman of the Board, Columbia Management Investment Advisers, LLC since May 2010; Director, Columbia Management Investment Distributors, Inc. since May 2010; former Director, Ameriprise Certificate Company, 2006 - January 2013 |
| * | Interested person (as defined under the 1940 Act) by reason of being an officer, director, security holder and/or employee of the Investment Manager or Ameriprise Financial. |
The Statement of Additional Information has additional information about the Fund’s Board members and is available,
without charge, upon request by calling 800.345.6611, contacting your financial intermediary or visiting
investor.columbiathreadneedleus.com.
Multi-Manager Total Return Bond Strategies Fund | Annual Report 2017
| 101 |
TRUSTEES AND OFFICERS (continued)
The Board has appointed officers who are responsible for day-to-day business decisions based on policies it has established. The officers serve at the pleasure of the Board. The following table provides basic information about the Officers of the Fund, including principal occupations during the past five years, although their specific titles may have varied over the period. In addition to Mr. Truscott, who is Senior Vice President, the Fund’s other officers are:
Name,
address and
year of birth | Position and year
first appointed to
position for any Fund
in the Columbia
Funds complex or a
predecessor thereof | Principal occupation(s) during past five years |
Christopher O. Petersen
5228 Ameriprise
Financial Center
Minneapolis, MN 55474
Born 1970 | President and Principal Executive Officer (2015) | Vice President and Lead Chief Counsel, Ameriprise Financial, Inc. since January 2015 (previously, Vice President and Chief Counsel, January 2010 - December 2014; officer of Columbia Funds and affiliated funds since 2007. |
Michael G. Clarke
225 Franklin Street
Boston, MA 02110
Born 1969 | Treasurer (2011), Chief Financial Officer (2009) and Chief Accounting Officer (2015) | Vice President — Mutual Fund Administration, Columbia Management Investment Advisers, LLC, since May 2010; senior officer of Columbia Funds and affiliated funds since 2002. |
Paul B. Goucher
100 Park Avenue
New York, NY 10017
Born 1968 | Senior Vice President (2011) and Assistant Secretary (2008) | Senior Vice President and Assistant General Counsel, Ameriprise Financial, Inc. since January 2017 (previously Vice President and Lead Chief Counsel, November 2008 - January 2017 and January 2013 - January 2017, respectively; and Chief Counsel, January 2010 - January 2013); Vice President, Chief Legal Officer and Assistant Secretary, Columbia Management Investment Advisers, LLC since May 2010. |
Thomas P. McGuire
225 Franklin Street
Boston, MA 02110
Born 1972 | Senior Vice President and Chief Compliance Officer (2012) | Vice President — Asset Management Compliance, Ameriprise Financial, Inc., since May 2010; Chief Compliance Officer, Ameriprise Certificate Company since September 2010. |
Colin Moore
225 Franklin Street
Boston, MA 02110
Born 1958 | Senior Vice President (2010) | Executive Vice President and Global Chief Investment Officer, Ameriprise Financial, Inc., since July 2013; Executive Vice President and Global Chief Investment Officer, Columbia Management Investment Advisers, LLC since July 2013 (previously Director and Global Chief Investment Officer, 2010 - 2013). |
Ryan C. Larrenaga
225 Franklin Street
Boston, MA 02110
Born 1970 | Senior Vice President (2017), Chief Legal Officer (2017) and Secretary (2015) | Vice President and Group Counsel, Ameriprise Financial, Inc. since August 2011; officer of Columbia Funds and affiliated funds since 2005. |
Michael E. DeFao
225 Franklin Street
Boston, MA 02110
Born 1968 | Vice President (2011) and Assistant Secretary (2010) | Vice President and Chief Counsel, Ameriprise Financial, Inc. since May 2010. |
Amy Johnson
5228 Ameriprise
Financial Center
Minneapolis, MN 55474
Born 1965 | Vice President (2006) | Managing Director and Global Head of Operations, Columbia Management Investment Advisers, LLC since April 2016 (previously Managing Director and Chief Operating Officer, 2010 - 2016). |
Lyn Kephart-Strong
5228 Ameriprise
Financial Center
Minneapolis, MN 55474
Born 1960 | Vice President (2015) | President, Columbia Management Investment Services Corp. since October 2014; Vice President & Resolution Officer, Ameriprise Trust Company since August 2009. |
| 102 | Multi-Manager Total Return Bond Strategies Fund | Annual Report 2017 |
Board Consideration and Approval of Management Agreement and Subadvisory Agreements
On June 14, 2017, the Board of Trustees (the Board) and the Trustees who are not interested persons (as defined in the Investment Company Act of 1940) (the Independent Trustees) of Columbia Funds Series Trust I (the Trust) unanimously approved the continuation of the Management Agreement (the Management Agreement) with Columbia Management Investment Advisers, LLC (the Investment Manager) and the Subadvisory Agreements (the Subadvisory Agreements) between the Investment Manager and Loomis, Sayles & Company, L.P., PGIM, Inc. and TCW Investment Management Company LLC (the Subadvisers) with respect to Multi-Manager Total Return Bond Strategies Fund (the Fund), a series of the Trust. As detailed below, the Board’s Advisory Fees and Expenses Committee (the Committee) and the Board met on multiple occasions to review and discuss, both among themselves and with the management team of the Investment Manager, materials provided by the Investment Manager and others before determining to approve the continuation of the Management Agreement and the Subadvisory Agreements (collectively, the Agreements).
In connection with their deliberations regarding the continuation of the Management Agreement and the Subadvisory Agreements, the Committee and the Board evaluated materials requested from the Investment Manager regarding the Fund and the Agreements, and discussed these materials with representatives of the Investment Manager at Committee meetings held on March 27, 2017, April 26, 2017 and June 13, 2017 and at Board meetings held on March 28, 2017 and June 14, 2017. In addition, the Board considers matters bearing on the Agreements at most of its other meetings throughout the year and meets regularly with senior management of the Trust and the Investment Manager. Through the Board’s Investment Oversight Committees, Trustees also meet with selected portfolio managers of the funds the Trustees oversee and other investment personnel at various times throughout the year. The Committee and the Board also consulted with its independent fee consultant, Fund counsel and the Independent Trustees’ independent legal counsel, who advised on various matters with respect to the Committee’s and the Board’s considerations and otherwise assisted the Committee and the Board in their deliberations. On June 13, 2017, the Committee recommended that the Board approve the continuation of the Management Agreement and the Subadvisory Agreements. On June 14, 2017, the Board, including the Independent Trustees, voting separately, unanimously approved the continuation of the Management Agreement and the Subadvisory Agreements for the Fund.
The Committee and the Board considered all information that they, their legal counsel or the Investment Manager believed reasonably necessary to evaluate and to determine whether to recommend for approval or approve the continuation of the Management Agreement and the Subadvisory Agreements. The information and factors considered by the Committee and the Board in recommending for approval or approving the continuation of the Management Agreement and the Subadvisory Agreements for the Fund included the following:
| • | Information on the investment performance of the Fund relative to the performance of a group of mutual funds determined to be comparable to the Fund by an independent third-party data provider, as well as performance relative to benchmarks; |
| • | Information on the Fund’s management fees and total expenses, including information comparing the Fund’s expenses to those of a group of comparable mutual funds, as determined by the independent third-party data provider; |
| • | The Investment Manager’s agreement to contractually limit or cap total operating expenses for the Fund through December 31, 2018 so that total operating expenses (excluding certain fees and expenses, such as transaction costs and certain other investment related expenses, interest, taxes, acquired fund fees and expenses, and infrequent and/or unusual expenses) would not exceed a specified annual rate, as a percentage of the Fund’s net assets; |
| • | The terms and conditions of the Agreements; |
| • | The subadvisory fees payable by the Investment Manager under the Subadvisory Agreements; |
| • | The current and proposed terms and conditions of other agreements and arrangements with affiliates of the Investment Manager relating to the operations of the Fund, including agreements with respect to the provision of distribution, transfer agency and shareholder services to the Fund; |
| • | Descriptions of various functions performed by the Investment Manager and the Subadvisers under the Agreements, including portfolio management and portfolio trading practices; |
Multi-Manager Total Return Bond Strategies Fund | Annual Report 2017
| 103 |
Board Consideration and Approval of Management Agreement and Subadvisory Agreements (continued)
| • | Information regarding the management fees of similarly-managed portfolios of other clients of the Investment Manager, including institutional separate accounts; |
| • | Information regarding the reputation, regulatory history and resources of the Investment Manager and the Subadvisers, including information regarding senior management, portfolio managers and other personnel; |
| • | Information regarding the capabilities of the Investment Manager and the Subadvisers with respect to compliance monitoring services, including an assessment of the Investment Manager’s and the Subadvisers’ compliance systems by the Fund’s Chief Compliance Officer; and |
| • | The profitability to the Investment Manager and its affiliates from their relationships with the Fund. |
Nature, extent and quality of services provided under the agreements
The Committee and the Board considered the nature, extent and quality of services provided to the Fund by the Investment Manager, the Subadvisers and the Investment Manager’s affiliates under the Agreements and under separate agreements for the provision of transfer agency and shareholder services, and the resources dedicated to the Fund and the other Columbia Funds by the Investment Manager, the Subadvisers and the Investment Manager’s affiliates. The Committee and the Board considered, among other things, the Investment Manager’s ability to attract, motivate and retain highly qualified research, advisory and supervisory investment professionals (including compensation programs for personnel involved in fund management, reputation and other attributes), the portfolio management services provided by those investment professionals, and the quality of the Investment Manager’s and each Subadviser’s investment research capabilities and trade execution services. The Committee and the Board also considered the potential benefits to shareholders of investing in a mutual fund that is part of a fund complex offering exposure to a variety of asset classes and investment disciplines and providing a variety of fund and shareholder services.
The Committee and the Board also considered the professional experience and qualifications of the senior personnel of the Investment Manager and the Subadvisers, which included consideration of the Investment Manager’s and the Subadvisers’ experience with similarly-structured funds. The Committee and the Board noted the compliance programs of and the compliance-related resources provided to the Fund by the Investment Manager and its affiliates, and considered the Investment Manager’s ability to provide administrative services to the Fund and coordinate the activities of the Fund’s other service providers. The Board also noted that the Board had approved the Subadvisers’ codes of ethics and compliance programs, and that the Chief Compliance Officer of the Funds reports to the Trustees on the Subadvisers’ compliance programs.
The Committee and the Board considered the diligence and selection process undertaken by the Investment Manager to select the Subadvisers, including the Investment Manager’s rationale for recommending the continuation of the Subadvisory Agreements, and the process for monitoring the Subadvisers’ ongoing performance of services for the Fund. As part of these deliberations, the Committee and the Board considered the ability of the Investment Manager, subject to the approval of the Board, to modify or enter into new subadvisory agreements without a shareholder vote pursuant to an exemptive order of the Securities and Exchange Commission. The Committee and the Board also considered the scope of services provided to the Fund by the Investment Manager that are distinct from and in addition to those provided by the Subadvisers, including cash flow management, treasury services, risk oversight, investment oversight and Subadviser selection, oversight and transition management. After reviewing these and related factors, the Committee and the Board concluded, within the context of their overall conclusions, that the nature, extent and quality of the services provided to the Fund under the Agreements supported the continuation of the Management Agreement and the Subadvisory Agreements.
Investment performance
The Committee and the Board reviewed information about the performance of the Fund over various time periods, including performance information relative to benchmarks and information that compared the performance of the Fund to the performance of a group of comparable mutual funds as determined by the independent third-party data provider, and data provided by the independent fee consultant. The Committee and the Board also reviewed a description of the third party’s methodology for identifying the Fund’s peer groups for purposes of performance and expense comparisons. Although the Fund’s performance lagged that of a relevant peer group for certain (although not necessarily all) periods, the Committee and
| 104 | Multi-Manager Total Return Bond Strategies Fund | Annual Report 2017 |
Board Consideration and Approval of Management Agreement and Subadvisory Agreements (continued)
the Board concluded that other factors relevant to performance were sufficient, in light of other considerations, to warrant continuation of the Management Agreement and the Subadvisory Agreements. Those factors included one or more of the following: (i) that the Fund’s performance, although lagging in certain recent periods, was stronger over the longer term; (ii) that the underperformance was attributable, to a significant extent, to investment decisions that were reasonable and consistent with the Fund’s investment strategy and policies and that the Fund was performing within a reasonable range of expectations, given those investment decisions, market conditions and the Fund’s investment strategy; (iii) that the Fund’s performance was competitive when compared to other relevant performance benchmarks or peer groups; and (iv) that the Investment Manager had taken or was taking steps designed to help improve the Fund’s investment performance, including, but not limited to, replacing portfolio managers, enhancing the resources supporting the portfolio managers, or modifying investment strategies.
The Committee and the Board noted that, through December 31, 2016, the Fund’s performance was in the thirty-eighth and fifty-fifth percentile (where the best performance would be in the first percentile) of its category selected by the independent third-party data provider for the purposes of performance comparisons for the one- and three-year periods, respectively.
The Committee and the Board also considered the Investment Manager’s and Subadvisers’ performance and reputation generally, the Investment Manager’s historical responsiveness to Board concerns about performance, and the Investment Manager’s willingness to take steps intended to improve performance. After reviewing these and related factors, the Committee and the Board concluded, within the context of their overall conclusions, that the performance of the Fund, the Investment Manager and the Subadvisers were sufficient, in light of other considerations, to warrant the continuation of the Management Agreement and the Subadvisory Agreements.
Investment management fee rates and other expenses
The Committee and the Board considered the management fees charged to the Fund under the Management Agreement and the Subadvisory Agreements, as well as the total expenses incurred by the Fund. In assessing the reasonableness of the fees under the Management Agreement, the Committee and the Board considered, among other information, the Fund’s total expense ratio as a percentage of average daily net assets. The Committee and the Board considered data provided by the independent third-party data provider and by the independent fee consultant. The Committee and the Board noted that, as of December 31, 2016, the Fund’s actual management fee and net total expense ratio are ranked in the fifth and third quintiles, respectively, (where the lowest fees and expenses would be in the first quintile) against the Fund’s expense universe as determined by the independent third-party data provider for purposes of expense comparison. The Committee and the Board also considered the fees that the Subadvisers charge to their other clients, and noted that the Investment Manager pays the fees of the Subadvisers. The Committee and the Board also took into account the fee waiver and expense limitation arrangements agreed to by the Investment Manager, as noted above.
The Committee and the Board also received and considered information about the management fees charged by the Investment Manager to institutional separate accounts. In considering the fees charged to those accounts, the Committee and the Board took into account, among other things, the Investment Manager’s representations about the differences between managing mutual funds as compared to other types of accounts, including differences in the services provided, differences in the risk profile of such business for the Investment Manager and the additional resources required to manage mutual funds effectively. The Committee and the Board also received and considered information about the fees charged by the Investment Manager for sub-advisory services it provides to comparable unaffiliated funds. In evaluating the Fund’s management fees, the Committee and the Board also took into account the demands, complexity and quality of the investment management of the Fund.
After reviewing these and related factors, the Committee and the Board concluded, within the context of their overall conclusions, that the management fee rates and expenses of the Fund, in light of other considerations, warranted the continuation of the Management Agreement and the Subadvisory Agreements.
Costs of services provided and profitability
The Committee and the Board also took note of the costs the Investment Manager and its affiliates incur in connection with the services provided and the profitability to the Investment Manager and its affiliates from their relationships with the Fund.
Multi-Manager Total Return Bond Strategies Fund | Annual Report 2017
| 105 |
Board Consideration and Approval of Management Agreement and Subadvisory Agreements (continued)
The Committee and the Board also considered the compensation directly or indirectly received by the Investment Manager’s affiliates in connection with their relationships with the Fund. The Committee and the Board reviewed information provided by management as to the profitability to the Investment Manager and its affiliates of their relationships with the Fund, information about the allocation of expenses used to calculate profitability, and comparisons of profitability levels realized in 2016 to profitability levels realized in 2015. When reviewing profitability, the Committee and the Board also considered court cases in which adviser profitability was an issue in whole or in part, the performance of similarly managed funds, the performance of the Fund, and the expense ratio of the Fund. In addition, the Committee and the Board considered information provided by the Investment Manager regarding the Investment Manager’s financial condition and comparing its profitability to that of other asset management firms that are, or are subsidiaries of, publicly traded companies. In this regard, the Committee and the Board also considered data provided by the independent fee consultant. Because the Subadvisory Agreements were negotiated at arms-length by the Investment Manager, which is responsible for payments to the Subadvisers thereunder, the Committee and the Board did not consider the profitability to each Subadviser of its relationship with the Fund.
After reviewing these and related factors, the Committee and the Board concluded, within the context of their overall conclusions, that the costs of services provided and the profitability to the Investment Manager and its affiliates from their relationships with the Fund supported the continuation of the Management Agreement and the Subadvisory Agreements.
Economies of scale
The Committee and the Board considered the potential existence of economies of scale in the provision by the Investment Manager of services to the Fund, to groups of related funds, and to the Investment Manager’s investment advisory clients as a whole, and whether those economies of scale were shared with the Fund through breakpoints in investment management fees or other means, such as expense limitation arrangements and additional investments by the Investment Manager in investment, trading, compliance and other resources. The Committee and the Board noted that the management fee schedules for the Fund contained breakpoints that would reduce the fee rate on assets above specified threshold levels.
The Committee and the Board noted that the breakpoints, if any, in the Subadvisory Agreements did not occur at the same levels as the breakpoints in the Management Agreement. The Committee and the Board noted that absent a shareholder vote, the Investment Manager would bear any increase in fees payable under the Subadvisory Agreements. The Committee and the Board also noted the potential challenges of seeking to tailor the Management Agreement breakpoints to those of a subadvisory agreement in this context, and the effect that capacity constraints on a subadviser’s ability to manage assets could potentially have on the ability of the Investment Manager to achieve economies of scale, as new subadvisers may need to be added as the Fund grows, increasing the Investment Manager’s cost of compensating and overseeing the Fund’s subadvisers.
In considering these matters, the Committee and the Board also considered the costs of the services provided and the profitability to the Investment Manager and its affiliates from their relationships with the Fund, as discussed above. After reviewing these and related factors, the Committee and the Board concluded, within the context of their overall conclusions, that the extent to which any economies of scale were expected to be shared with the Fund supported the continuation of the Management Agreement and the Subadvisory Agreements.
Other benefits to the Investment Manager and Subadvisers
The Committee and the Board received and considered information regarding “fall-out” or ancillary benefits received by the Investment Manager and its affiliates as a result of their relationships with the Fund, such as the engagement of the Investment Manager’s affiliates to provide distribution, transfer agency and shareholder services to the Fund. In this regard, among other matters, the Committee and the Board considered that the Fund’s distributor retains a portion of the distribution fees from the Fund and receives a portion of the sales charges on sales or redemptions of certain classes of shares of the Fund. The Committee and the Board also considered the benefits of research made available to the Investment Manager and the Subadvisers by reason of brokerage commissions generated by the Fund’s securities transactions, and reviewed information about the Investment Manager’s practices with respect to allocating portfolio transactions for brokerage and research services. The Committee and the Board recognized that the Investment Manager’s profitability would be somewhat lower without these benefits.
| 106 | Multi-Manager Total Return Bond Strategies Fund | Annual Report 2017 |
Board Consideration and Approval of Management Agreement and Subadvisory Agreements (continued)
Conclusion
The Committee and the Board reviewed all of the above considerations in reaching their decisions to recommend or approve the continuation of the Management Agreement and the Subadvisory Agreements. In their deliberations, the Trustees did not identify any particular information that was all-important or controlling, and individual Trustees may have attributed different weights to the various factors. Based on their evaluation of all factors that they deemed to be material, including those factors described above, and assisted by the advice of independent legal counsel, the Board, including the Independent Trustees, voting separately, unanimously approved the continuation of the Management Agreement and the Subadvisory Agreements.
Multi-Manager Total Return Bond Strategies Fund | Annual Report 2017
| 107 |
The Fund mails one shareholder report to each shareholder address. If you would like more than one report, please call shareholder services at 800.345.6611 and additional reports will be sent to you.
Proxy voting policies and procedures
The policy of the Board of Trustees is to vote the proxies of the companies in which the Fund holds investments consistent with the procedures as stated in the Statement of Additional Information (SAI). You may obtain a copy of the SAI without charge by calling 800.345.6611; contacting your financial intermediary; visiting investor.columbiathreadneedleus.com; or searching the website of the Securities and Exchange Commission (SEC) at sec.gov. Information regarding how the Fund voted proxies relating to portfolio securities is filed with the SEC by August 31st for the most recent 12-month period ending June 30th of that year, and is available without charge by visiting investor.columbiathreadneedleus.com, or searching the website of the SEC at sec.gov.
Quarterly schedule of investments
The Fund files a complete schedule of portfolio holdings with the SEC for the first and third quarters of each fiscal year on Form N-Q. The Fund’s Form N-Q is available on the SEC’s website at sec.gov and may be reviewed and copied at the SEC’s Public Reference Room in Washington, D.C. Information on the operation of the Public Reference Room may be obtained by calling 800.SEC.0330. The Fund’s complete schedule of portfolio holdings, as filed on Form N-Q, can also be obtained without charge, upon request, by calling 800.345.6611.
Additional Fund information
For more information about the Fund, please visit investor.columbiathreadneedleus.com or call 800.345.6611. Customer Service Representatives are available to answer your questions Monday through Friday from 8 a.m. to 7 p.m. Eastern time.
Fund investment manager
Columbia Management Investment Advisers, LLC
225 Franklin Street
Boston, MA 02110
Fund distributor
Columbia Management Investment Distributors, Inc.
225 Franklin Street
Boston, MA 02110
Fund transfer agent
Columbia Management Investment Services Corp.
P.O. Box 8081
Boston, MA 02266-8081
| 108 | Multi-Manager Total Return Bond Strategies Fund | Annual Report 2017 |
[THIS PAGE INTENTIONALLY LEFT BLANK]
Multi-Manager Total Return Bond Strategies Fund
P.O. Box 8081
Boston, MA 02266-8081
Please read and consider the investment objectives, risks, charges and expenses for any fund carefully before investing. For a prospectus and summary prospectus, which contains this and other important information about the Fund, go to
investor.columbiathreadneedleus.com. The Fund is distributed by Columbia Management Investment Distributors, Inc., member FINRA, and managed by Columbia Management Investment Advisers, LLC.
Columbia Threadneedle Investments (Columbia Threadneedle) is the global brand name of the Columbia and Threadneedle group of companies. All rights reserved. Columbia Management Investment Distributors, Inc., 225 Franklin Street, Boston, MA 02110-2804
© 2017 Columbia Management Investment Advisers, LLC.
investor.columbiathreadneedleus.com

Annual Report
August 31, 2017
Multi-Manager Small Cap Equity Strategies Fund
Not FDIC Insured • No bank guarantee • May lose value
Dear Shareholders,
The current outlook for financial markets is clouded by two primary concerns: the high valuation of equities and the direction of interest rates. Following the U.S. presidential election, U.S. equities rallied based on the assumption that the new administration’s policies would stimulate growth quickly. Unfortunately it’s unclear whether those measures will get passed, much less passed quickly. In fixed income, uncertainty stems from the possibility that interest rates won’t rise as rapidly as expected if the administration’s proposed growth policies are not implemented.
Given this uncertainty, investors value a consistent approach more than ever. Investors want strong, repeatable risk-adjusted returns. Consistency — not surprises. As a leading global asset manager, we believe our consistent, collaborative investment approach enables us to deliver the dependable experience your portfolio demands. So, how do we strive to deliver a consistent investment experience?
Better insights
Your portfolio benefits from the investment insights uncovered by our talented investment teams around the world.
Better decisions
Our collaborative, interactive environment enables our investment teams to construct portfolios that take advantage of the best investment ideas.
Better outcomes
We aim to deliver a consistent experience, which means fewer surprises, dependable insights, and products designed to do the thing you want.
Whether you’re trying to save money to help your children go to college or for your own retirement, it’s the consistency of the return that is most essential. People who chase higher returns are usually also the first to sell when that investment goes through a bad patch. We try to combat this behavioral tendency by offering strategies that aim for a more consistent return. Our goal is for investors to panic less during periods of volatility, which can have a significant effect on their long-term results.
Nothing is more important to us than making sure those who have entrusted us to protect and grow their assets can do what matters most to them: build a nest egg, leave a legacy, and live confidently — now and throughout retirement. It’s why our talented professionals around the world work together to uncover uncommon opportunities and why our process encourages challenge and debate around our most compelling ideas to ensure better informed investment decisions, which hopefully lead to better outcomes for you.
Your success is our priority. Talk to your financial advisor about how working with Columbia Threadneedle Investments may help you position your portfolio for consistent, sustainable outcomes, no matter the market conditions.
Sincerely,
Christopher O. Petersen
President, Columbia Funds
Investors should consider the investment objectives, risks, charges and expenses of a mutual fund carefully before investing. For a free prospectus and summary prospectus, which contains this and other important information about a fund, visit investor.columbiathreadneedleus.com. The prospectus should be read carefully before investing.
Columbia Funds are distributed by Columbia Management Investment Distributors, Inc., member FINRA, and managed by Columbia Management Investment Advisers, LLC.
© 2017 Columbia Management Investment Advisers, LLC. All rights reserved.
Multi-Manager Small Cap Equity Strategies Fund | Annual Report 2017
| 2 |
| 4 |
| 10 |
| 11 |
| 21 |
| 22 |
| 23 |
| 26 |
| 28 |
| 35 |
| 36 |
| 37 |
| 41 |
| 46 |
Multi-Manager Small Cap Equity Strategies Fund | Annual Report 2017
Investment objective
Multi-Manager Small Cap Equity Strategies Fund (the Fund) seeks long-term capital appreciation.
Portfolio management
BMO Asset Management Corp.
David Corris, CFA
Thomas Lettenberger, CFA
Columbia Management Investment Advisers, LLC
Christian Stadlinger, Ph.D., CFA
Jarl Ginsberg, CFA, CAIA
Conestoga Capital Advisors, LLC
Robert Mitchell
Joseph Monahan, CFA
Dalton, Greiner, Hartman, Maher & Co., LLC
Bruce Geller, CFA
Jeffrey Baker, CFA
Peter Gulli, CFA
Edward Turville, CFA
EAM Investors, LLC
Montie Weisenberger
Morningstar style boxTM
The Morningstar Style Box is based on a fund’s portfolio holdings. For equity funds, the vertical axis shows the market capitalization of the stocks owned, and the horizontal axis shows investment style (value, blend, or growth). Information shown is based on the most recent data provided by Morningstar.
© 2017 Morningstar, Inc. All rights reserved. The Morningstar information contained herein: (1) is proprietary to Morningstar and/or its content providers; (2) may not be copied or distributed; and (3) is not warranted to be accurate, complete or timely. Neither Morningstar nor its content providers are responsible for any damages or losses arising from any use of this information.
| Average annual total returns (%) (for the period ended August 31, 2017) |
| | | Inception | 1 Year | 5 Years | Life |
| Class A | 04/20/12 | 15.12 | 12.74 | 11.97 |
| Class Z* | 01/03/17 | 15.30 | 12.78 | 12.01 |
| Russell 2000 Index | | 14.91 | 13.15 | 12.52 |
All results shown assume reinvestment of distributions during the period. Returns do not reflect the deduction of taxes that a shareholder may pay on Fund distributions or on the redemption of Fund shares. Performance results reflect the effect of any fee waivers or reimbursements of Fund expenses by Columbia Management Investment Advisers, LLC and/or any of its affiliates. Absent these fee waivers or expense reimbursement arrangements, performance results would have been lower.
The performance information shown represents past performance and is not a guarantee of future results. The investment return and principal value of your investment will fluctuate so that your shares, when redeemed, may be worth more or less than their original cost. Current performance may be lower or higher than the performance information shown. You may obtain performance information current to the most recent month-end by contacting your financial intermediary, visiting investor.columbiathreadneedleus.com or calling 800.345.6611.
| * | The returns shown for periods prior to the share class inception date (including returns for the Life of the Fund, if shown, which are since Fund inception) include the returns of the Fund’s oldest share class. These returns are adjusted to reflect any higher class-related operating expenses of the newer share classes, as applicable. Please visit investor.columbiathreadneedleus.com/investment-products/mutual-funds/appended-performance for more information. |
The Russell 2000 Index measures the performance of the small-cap segment of the U.S. equity universe. The Russell 2000 is a subset of the Russell 3000 Index representing approximately 10% of the total market capitalization of that index. It includes the securities of approximately 2,000 of the smallest companies in the Russell 3000 Index based on a combination of their market capitalization and current index membership.
Indices are not available for investment, are not professionally managed and do not reflect sales charges, fees, brokerage commissions, taxes or other expenses of investing. Securities in the Fund may not match those in an index.
| 2 | Multi-Manager Small Cap Equity Strategies Fund | Annual Report 2017 |
Fund at a Glance (continued)
Performance of a hypothetical $10,000 investment (April 20, 2012 — August 31, 2017)
The chart above shows the change in value of a hypothetical $10,000 investment in Class A shares of Multi-Manager Small Cap Equity Strategies Fund during the stated time period, and does not reflect the deduction of taxes that a shareholder may pay on Fund distributions or on the redemption of Fund shares.
| Top 10 holdings (%) (at August 31, 2017) |
| Omnicell, Inc. | 1.0 |
| Rogers Corp. | 1.0 |
| Merit Medical Systems, Inc. | 0.9 |
| Sandy Spring Bancorp, Inc. | 0.8 |
| Grand Canyon Education, Inc. | 0.7 |
| Descartes Systems Group, Inc. (The) | 0.7 |
| Blackbaud, Inc. | 0.7 |
| Healthcare Services Group, Inc. | 0.7 |
| CNO Financial Group, Inc. | 0.7 |
| El Paso Electric Co. | 0.7 |
Percentages indicated are based upon total investments (excluding Money Market Funds).
For further detail about these holdings, please refer to the section entitled “Portfolio of Investments.”
Fund holdings are as of the date given, are subject to change at any time, and are not recommendations to buy or sell any security.
| Portfolio breakdown (%) (at August 31, 2017) |
| Common Stocks | 96.6 |
| Exchange-Traded Funds | 0.3 |
| Money Market Funds | 3.1 |
| Total | 100.0 |
Percentages indicated are based upon total investments. The Fund’s portfolio composition is subject to change.
| Equity sector breakdown (%) (at August 31, 2017) |
| Consumer Discretionary | 9.3 |
| Consumer Staples | 1.8 |
| Energy | 3.2 |
| Financials | 18.3 |
| Health Care | 16.8 |
| Industrials | 17.6 |
| Information Technology | 18.2 |
| Materials | 5.0 |
| Real Estate | 6.1 |
| Telecommunication Services | 0.1 |
| Utilities | 3.6 |
| Total | 100.0 |
Percentages indicated are based upon total equity investments. The Fund’s portfolio composition is subject to change.
Multi-Manager Small Cap Equity Strategies Fund | Annual Report 2017
| 3 |
MANAGER DISCUSSION OF FUND PERFORMANCE
The Fund is managed by four independent money management firms and by Columbia Management Investment Advisers, LLC (CMIA) and each invests a portion of the portfolio’s assets. As of August 31, 2017, Dalton, Greiner, Harman, Maher & Co., LLC (DGHM), EAM Investors, LLC (EAM), Conestoga Capital Advisors LLC (Conestoga), BMO Asset Management Corp. (BMO) and CMIA managed approximately 19%, 21%, 21%, 20% and 20% of the portfolio, respectively.
For the 12-month period that ended August 31, 2017, the Fund’s Class A shares returned 15.12%. The Fund outperformed its benchmark, the Russell 2000 Index, which returned 14.91% over the same period. Individual stock selection and sector allocation among the Fund’s managers generally accounted for the relative results.
Small cap equities gained despite heightened volatility
The current bull market for U.S. equities is now in its eighth year and is currently the third longest on record. Still, volatile market conditions reflected shifts in sentiment, as investors reacted to several themes. Perhaps the most significant factors that positively influenced the small cap segment of the U.S. equity market were stable economic growth in the U.S., low unemployment levels and subdued inflation. The Federal Reserve (the Fed) slowly increased its targeted federal funds rate during the period but remained accommodative. In addition, corporate earnings reflected a corporate sector that was generally healthy and seemingly on a growth trajectory.
Negatively influencing U.S. small cap equities were a weakening U.S. dollar, which benefited large multinational companies relative to their more domestically focused peers. Also, valuations for risk assets already appeared lofty to many. Further, while small cap companies experienced a brief span of outperformance after the U.S. presidential election on hopes of being the biggest beneficiary of tax reform, small cap stocks began to wane relative to large caps over increasing concern that such reform might take longer than originally expected.
Heightened volatility led to substantial divergence between styles and sectors as well as to momentum being out of favor for most of the period. After a strong showing in 2016 when value significantly outperformed growth within the small cap equity universe, style leadership changed since the beginning of 2017, with growth then outperforming value. For the period as a whole, there was also a wide dispersion of returns across sectors of the benchmark, with health care and information technology posting strong results, while energy and consumer staples declined sharply.
Individual stock selection impacted Fund performance most
DGHM: Our portion of the Fund underperformed the benchmark, attributable to both stock selection and sector allocation. Stock selection in the retail/apparel, miscellaneous financials and real estate industries detracted most from our portion of the Fund’s results. Having underweights in health care and information technology, which each outpaced the benchmark during the period, and having overweights in energy, financials and real estate, which each lagged the benchmark during the period, also hurt. These detractors were partially offset by effective stock selection in the information technology, banks and consumer durables market segments, which contributed positively.
Individual positions that disappointed most during the annual period were Kite Realty Group Trust, Greenhill & Co. and GameStop. Kite Realty Group Trust is a shopping center real estate investment trust (REIT), whose stock declined during the period due to slower growth and lower occupancy as well as to heightened concerns about the threat from Internet retailing. Greenhill & Co. is a boutique investment bank primarily focused on mergers and acquisitions. Its shares declined significantly during the period on a softer merger and acquisition environment, which, in turn, led to disappointing earnings for the company. Video game retailer GameStop saw its shares drop based on weak gaming trends that led to reduced earnings guidance. We maintained positions in each of these companies, as we believed the fundamentals of each were solid and the valuations of each remained attractive, in our view.
The individual positions in our portion of the Fund’s portfolio that contributed most positively were IPG Photonics, a leading producer of fiber lasers; Teradyne, a semiconductor test equipment manufacturer; and Merit Medical Systems, a medical technology company selling primarily single-use disposable products in the cardiovascular space. Each of these companies saw their respective share price rise based on stronger than market expected earnings.
| 4 | Multi-Manager Small Cap Equity Strategies Fund | Annual Report 2017 |
MANAGER DISCUSSION OF FUND PERFORMANCE (continued)
EAM: Our portion of the Fund outperformed the benchmark due mostly to effective stock selection, while sector allocation effects added further value. Stock selection in financials, health care and information technology contributed most positively. Having overweights to health care and information technology, which each outpaced the benchmark during the period, and meaningful underweights in real estate and energy, which each lagged the benchmark during the period, also helped. These positive contributors were only partially offset by weaker stock selection in industrials, real estate and materials, which detracted. Having an underweight in financials, which outperformed the benchmark during the period, also dampened our portion of the Fund’s relative results.
Our portion of the Fund’s inherent bias toward relative price strength, or medium-term momentum, had a positive effect on relative results, while our growth-oriented portfolio’s underexposure to value relative to the benchmark detracted.
Positions in Weight Watchers International, Loxo Oncology and Exact Sciences were top contributors to our portion of the Fund’s results. Weight Watchers International, an iconic weight-loss company, gained traction during the period under new management. Loxo Oncology, a new purchase for our portion of the Fund during the period, is a clinical-stage biopharmaceutical company. Its stock soared in June 2017 after reporting impressive mid-stage data that expands the company’s addressable market and increases the probability of a potential approval of its lead cancer drug candidate, Larotrectinib, from the FDA. Exact Sciences commercialized Cologuard, an FDA-cleared, non-invasive, stool-based DNA colon cancer screening test. The company reported first quarter 2017 results that surpassed market expectations, reporting accelerating demand. Additionally, UnitedHealth Group, the largest health insurer in the U.S., agreed to reimburse for Cologuard, which we believe should help Exact Sciences expand its addressable market.
The biggest individual detractors from our portion of the Fund’s results during the period were Impinj, Intra-Cellular Therapies and Energy Recovery. Impinj is a provider of a radio-frequency identification technology used in retail sectors and the health care industry to track inventory and plan deliveries. The company reported delays in product ramps at several large customers, reflecting, in our view, uncertainty around its near-term growth. Intra-Cellular Therapies is a biopharmaceutical company focused on developing small molecule drugs that target neuropsychiatric and neurological disorders. Its shares declined on reports of negative Phase III results for its developmental stage schizophrenia drug that came as a surprise after prior positive reports for the same drug. Energy Recovery is an industrial technology company focused on commercializing a novel pressure pumping/fracking solution. The company’s shares declined after reports of a product redesign setback with its key reference customer. We sold our portion of the Fund’s shares in each of these three stocks after the disappointing news from each company.
Conestoga: Our portion of the Fund outperformed the benchmark during the period due primarily to an emphasis on high quality companies, that is, those with positive earnings, sustainable earnings growth and strong balance sheets. Stock selection also added to relative returns as did sector allocation.
More specifically, stock selection was strongest in the consumer discretionary, industrials and information technology sectors. Having an overweight to information technology, which was among the best performers in the benchmark during the period, and having an underweight to real estate, which suffered from a lackluster period, also helped. Only partially offsetting these positive contributors was the detracting effect of having underweight allocations to financials and materials, as each of these sectors outpaced the benchmark during the period. Stock selection in materials also detracted as did having a position in cash during a period when the benchmark rallied.
The biggest individual contributors to our portion of the Fund’s results were Stamps.com, the leading provider of internet-based mailing and shipping solutions; Grand Canyon Education, a leading for-profit university offering both online and campus-based degree programs; and Fox Factory Holding, which designs, manufacturers and markets premium suspension products for high-end mountain bikes and powered vehicles. Stamps.com reported its 11th consecutive earnings per share beating market estimates in the first quarter of 2017, followed by favorable data points from the U.S. Postal Service supporting the company as a key solutions provider for e-commerce logistics and shipping. Grand Canyon Education saw share appreciation on expectations of a less onerous regulatory environment under the new administration. In addition, the company reported solid earnings results with guidance ahead of market expectations. Shares of Fox Factory Holding performed well due to an acceleration of top-line growth, driven in party by new program wins.
Multi-Manager Small Cap Equity Strategies Fund | Annual Report 2017
| 5 |
MANAGER DISCUSSION OF FUND PERFORMANCE (continued)
Positions in NIC, SPS Commerce and HealthStream detracted most from our portion of the Fund’s results. NIC designs, manages and markets eGovernment services on behalf of state and local governments as well as for several federal agencies. Despite positive operating results reported in May 2017, NIC’s stock sold off, as several significant state and federal rebids that will take place during 2018 became more of a focus for investors. SPS Commerce, a cloud-based software solutions provider within supply chain management for retailers, experienced weakness due to lower than market expected guidance for 2017. The company was affected by weakness at several retailers, as they struggle with their transition to an omni-channel selling platform. In addition, SPS Commerce announced a reorganization that may create more margin leverage in the future but which created uncertainty during the annual period. HealthStream offers internet-based solutions to the continuing education and training needs of the healthcare community. The company reported disappointing third quarter 2016 results and its outlook for the fourth quarter of 2016 was below consensus estimates. There were three issues that negatively affected HealthStream’s results during the annual period. First, growth within its workforce development solutions unit was driven by low margin products. Second, its patient survey business was adversely affected by two customers moving from a telephone-based surveying process to an on-line based surveying process, which came at a significantly lower price point. Third was an inability to implement new business wins within its provider solutions division, which caused a $5 million backlog.
BMO: Our portion of the Fund underperformed the benchmark during the period, with both sector allocation and stock selection overall detracting from relative results. Weak stock selection can be attributed to the performance of our stock selection model, which is designed to identify fundamentally strong, attractively valued stocks with positive investor interest. While investor sentiment supported performance, valuations were a significant detractor from returns. Our model struggled most in the consumer discretionary sector, where attractively valued retailers underperformed the benchmark, as the industry faced challenges from the disruption of technology. Other sectors that detracted from our portion of the Fund’s performance during the period were health care and energy, where both stock selection and sector allocation positioning hurt. Having an overweight to real estate, which underperformed the Fund’s benchmark during the period, also dampened relative results. In addition, our strategy’s style detracted, as the Russell 2000 Value Index underperformed the benchmark for the period.
The strongest-contributing sectors to our portion of the Fund were industrials and financials, wherein both stock selection and sector allocation positioning supported relative results. Having an underweight allocation to consumer staples, which underperformed the benchmark during the annual period, especially within the food retailing industry, also added value.
From an individual holdings perspective, the biggest detractors from our portion of the Fund’s results included Express, an apparel and retail accessories company, which faced headwinds from the presence of online retailing. Shares of Dean Foods, a company that engages in the manufacture, sale and direct-to-store distribution of dairy products, declined. Its earnings weakened due to decreasing volume and increasing input costs. DHI Group, a company that provides technology and security clearance for professionals detracted as well. Lower recruitment in the energy sector and increased competition created persistent headwinds for the company. We maintained positions in Express and Dean Foods at the end of the annual period, based primarily on what we see as strong fundamental characteristics of each, but we exited our portion of the Fund’s position in DHI Group, as the stock’s ranking within our model deteriorated.
Conversely, individual positive contributors included ArcBest, a new purchase for our portion of the Fund during the period. Since the time of purchase, ArcBest, a transportation services company, saw improved earnings through an increase in revenue from shipment growth and better than expected contract renewals. Shares of Brink’s, a company that provides secure transportation and cash management services, increased as the company accelerated earnings through organic growth in North America along with an improvement in operating margins. Another positive contributor was Walker & Dunlop, a mortgage operating company. Its shares gained after the company posted better than expected earnings during a seasonally-slower first calendar quarter, partially due to increased platform reach after a series of strategic acquisitions.
CMIA: During the period, our portion of the Fund outperformed the Russell 2000 Value Index, against which our portion of the Fund is managed. Our strategy is to look systematically for value opportunities where we see incremental improvement in a company’s business outlook, i.e. where we see upward inflection points. As such, we successfully navigated the extreme volatility of market behavior that was driven by expectations of infrastructure spending, lower tax rates and removal of many regulatory burdens. We were not enticed by exuberant market expectations, keeping steady our search for bargains with company-specific improvement opportunities.
| 6 | Multi-Manager Small Cap Equity Strategies Fund | Annual Report 2017 |
MANAGER DISCUSSION OF FUND PERFORMANCE (continued)
Sector allocation was the primary driver of outperformance relative to the Russell 2000 Value Index in our portion of the Fund, while stock selection had a rather neutral effect on results overall. From an allocation perspective, overweights to materials and health care contributed positively to relative results as did underweights to real estate, telecommunication services, consumer discretionary and consumer staples. An overweight to energy, the worst performing sector in the Russell 2000 Value Index during the period, detracted. Stock selection was strongest in the industrials, health care, information technology and financials sectors, offset by weaker stock selection in the energy, consumer discretionary and consumer staples sectors.
From an individual holdings perspective, the top three positive contributors to our portion of the Fund’s results were Merit Medical Systems, which designs, develops, manufactures and markets single-used medical products for interventional and diagnostic procedures; United States Steel, the second largest integrated steel producer in North America; and Rogers, which develops, manufactures and sells engineered materials and components worldwide. Merit Medical Systems reported stronger than expected earnings, highlighted by gross margin expansion and improving integration of recent acquisitions. Shares of United States Steel rallied in response to an increase in steel demand coupled with low import levels. We sold our portion of the Fund’s position in United States Steel on the strength of the share price increase. Rogers performed well, having demonstrated strong organic and inorganic growth and robust execution by its management.
The biggest individual detractors from our portion of the Fund’s results were Oasis Petroleum, an independent exploration and production company focused on the acquisition and development of unconventional oil and natural gas resources; SM Energy, an independent energy company engaged in the acquisition, exploration, development and production of crude oil and condensate, natural gas and natural gas liquids; and AmTrust Financial Services, an insurance holding company. We had initiated a Fund position in Oasis Petroleum toward the end of 2016. However, in a falling commodity price environment, the company’s diverse asset base did not garner favor with investors. Similarly, SM Energy underwent an active asset re-deployment transformation, but the market became increasingly concerned about the complexity of the asset repositioning amid challenging conditions for commodities. AmTrust Financial Services had been a highly profitable company, but as a niche player in various business lines, the complexity of the company raised questions on capital ratios sufficiency. We sold our portion of the Fund’s position in SM Energy and in AmTrust Financial Services on weakness.
Sector weighting changes were driven by bottom-up stock selection
DGHM: We initiated a position in our portion of the Fund during the period in Rice Energy, primarily a producer of dry natural gas from the Marcellus and Utica shales in Pennsylvania and Ohio. We established a position in our portion of the Fund in Greenbriar Companies, a leading manufacturer of railcars in the U.S. with approximately one-third market share and also in Europe and South America through two separate joint ventures in which it owns a majority stake. Conversely, we sold our portion of the Fund’s position in PDC Energy due to poor ratings within our stock selection model. We also exited our portion of the Fund’s position in United Fire Group due to rating deterioration and what we viewed as a less attractive upside/downside balance.
We do not engage in significant sector timing activities. Based on individual stock selection, our portion of the Fund was overweight relative to the benchmark in financials, was underweight in non-cyclicals, technology and consumer cyclicals and was rather neutral to the benchmark in utilities and industrials at the end of the period.
EAM: We initiated a Fund position in Ultra Clean Holdings, a leading manufacturer of subsystems for the semiconductor capital equipment industry, on strength after it reported better than expected results and guidance driven by its exposure and positioning in market segments benefiting from secular growth. We established a position in MiMedx Group, a leader in amniotic-based tissue technology for regenerative medicine, after its management pre-released strong first quarter 2017 revenues that beat expectations in a seasonally weak quarter. We purchased shares of Immunomedica, a clinical-stage biopharmaceutical company that develops monoclonal anti-body-based products for the treatment of cancer, auto-immune disorders and other serious disorders.
We sold our portion of the Fund’s position in KeyW Holding, which provides cybersecurity solutions for the Department of Defense and national intelligence agencies. We exited the position due to near-term Federal budget challenges and limited debt capacity to bolster long-term growth. We exited our portion of the Fund’s position in Whiting Petroleum, an exploration and production company, due to increased expectations for execution in Bakken shale completions and stagnating oil prices,
Multi-Manager Small Cap Equity Strategies Fund | Annual Report 2017
| 7 |
MANAGER DISCUSSION OF FUND PERFORMANCE (continued)
putting upward pressure on the average estimated ultimate recovery. We eliminated our portion of the Fund’s position in Bojangles, a restaurant franchise, after the company reported an in-line quarter with lackluster guidance for the second quarter of 2017.
Changes in sector allocation are a by-product of our purely bottom-up investment process. That said, overall, we increased our portion of the Fund’s exposure relative to the benchmark in health care, information technology and financials during the period. We decreased relative allocations to energy, consumer staples and industrials. As of August 31, 2017, our portion of the Fund was overweight relative to the benchmark in health care and information technology and underweight relative to the benchmark in financials, real estate, utilities, energy, consumer staples, materials and consumer discretionary. Our portion of the Fund was rather neutrally weighted to the benchmark in industrials and telecommunication services.
Conestoga: During the period, we established a new position in our portion of the Fund in LeMaitre Vascular, which manufactures disposable and implantable devices for the treatment of peripheral vascular disease. We initiated a position in Vocera Communications, which provides a secure and integrated communication solution primarily for the health care industry, currently being employed in more than 1,100 hospitals, both domestic and abroad. Conversely, we sold our portion of the Fund’s position in Fleetmatics Group, a market leader in providing software that allows companies to better manage its vehicle fleets. Verizon Communications decided on August 1, 2016 to acquire Fleetmatics Group for a 40% price premium, paying a high multiple of five times forward revenue and 30 times forward earnings. The deal closed in the fourth quarter of 2016, and we sold the stock. We exited our portion of the Fund’s position in iRadimed, a provider of MRI-compatible IV pumps, due to a lack of confidence in the company’s ability to restructure its salesforce.
Our sector allocations are driven more by our bottom-up stock selection process than by any top-down or sector level research. That said, we did not make any material changes in sector weightings relative to the benchmark during the period. At the end of August 2017, our portion of the Fund was overweight relative to the benchmark in health care, information technology and industrials; underweight in financials, consumer discretionary, real estate, materials and utilities; and relatively neutral in energy, consumer staples and telecommunication services.
BMO: In addition to the purchase of ArcBest, already mentioned, we established a position in our portion of the Fund in Rogers, a company that designs and manufactures electronics components. Conversely, in addition to the sale of DHI Group, mentioned earlier, we sold our portion of the Fund’s position in TTM Technologies, a company that engages in the manufacture and sale of circuit boards. We exited our portion of the Fund’s position in Greenhill & Co, an independent investment bank due to a weakening in the stock’s relative ranking by our model.
As a result of bottom-up stock attractiveness strategy, rather than top-down sector positioning, our portion of the Fund’s weights to materials, information technology and industrials increased and its weights to consumer discretionary, financials and utilities decreased. As of August 31, 2017, our portion of the Fund was overweight relative to the benchmark in financials, materials, real estate, energy and utilities and was underweight relative to the benchmark in health care, information technology and consumer discretionary. Our portion of the Fund was rather neutrally weighted compared to the benchmark in industrials, consumer staples and telecommunication services at the end of August 2017.
CMIA: During the period, we established a position in Aaron’s, a specialty retailer providing lease ownership, lease and retail sale of furniture, consumer electronics and home appliances. Its stock had sold off after a major competitor announced poor results. We felt the weakness was specific to the competitor and that Aaron’s may take market share from the competitor. We initiated a position in William Lyon Homes, which engages in the design, construction and sale of single-family homes. We see the company’s focus on first-time buyers and on the western U.S. as positive catalysts for its shares. We exited our portion of the Fund’s position in Cirrus Logic, which develops high precision analog and mixed-signal integrated circuits. Its stock reached our upside price target, and so, true to our sell discipline, we sold the position on valuation.
In general, changes in sector weights are a function of the number of value opportunities with upward inflection points we can find. Based on our individual fundamental, bottom-up stock selection process, notable sector shifts in our portion of the Fund during the period included increased allocations to materials and financials and decreased exposure to information technology, health care, consumer discretionary, consumer staples and real estate. At the end of the period, our portion of the Fund was overweight relative to the Russell 2000 Value Index in materials, health care and industrials. Our portion of the Fund was underweight relative to the Russell 2000 Value Index in real estate, consumer discretionary, consumer staples, utilities, energy, information technology, telecommunication services and financials at the end of August 2017.
| 8 | Multi-Manager Small Cap Equity Strategies Fund | Annual Report 2017 |
MANAGER DISCUSSION OF FUND PERFORMANCE (continued)
Market risk may affect a single issuer, sector of the economy, industry or the market as a whole. Foreign investments subject the Fund to risks, including political, economic, market, social and others within a particular country, as well as to currency instabilities and less stringent financial and accounting standards generally applicable to U.S. issuers. Investments in small-cap companies involve risks and volatility greater than investments in larger, more established companies. The Fund may invest significantly in issuers within a particular sector, which may be negatively affected by market, economic or other conditions, making the Fund more vulnerable to unfavorable developments in the sector. The Fund is managed by multiple advisers independently of one another, which may result in contradicting trades (i.e., with no net benefit to the Fund), while increasing transaction costs. Market or other (e.g., interest rate) environments may adversely affect the liquidity of fund investments, negatively impacting their price. Generally, the less liquid the market at the time the Fund sells a holding, the greater the risk of loss or decline of value to the Fund. See the Fund’s prospectus for information on these and other risks.
The views expressed in this report reflect the current views of the respective parties. These views are not guarantees of future performance and involve certain risks, uncertainties and assumptions that are difficult to predict, so actual outcomes and results may differ significantly from the views expressed. These views are subject to change at any time based upon economic, market or other conditions and the respective parties disclaim any responsibility to update such views. These views may not be relied on as investment advice and, because investment decisions for a Columbia fund are based on numerous factors, may not be relied on as an indication of trading intent on behalf of any particular Columbia fund. References to specific securities should not be construed as a recommendation or investment advice.
Multi-Manager Small Cap Equity Strategies Fund | Annual Report 2017
| 9 |
Understanding Your Fund’s Expenses
(Unaudited)
As an investor, you incur two types of costs. There are transaction costs, which may include redemption fees. There are also ongoing costs, which generally include management fees, distribution and/or service fees, and other fund expenses. The following information is intended to help you understand your ongoing costs (in dollars) of investing in the Fund and to help you compare these costs with the ongoing costs of investing in other mutual funds.
Analyzing your Fund’s expenses
To illustrate these ongoing costs, we have provided examples and calculated the expenses paid by investors in each share class of the Fund during the period. The actual and hypothetical information in the table is based on an initial investment of $1,000 at the beginning of the period indicated and held for the entire period. Expense information is calculated two ways and each method provides you with different information. The amount listed in the “Actual” column is calculated using the Fund’s actual operating expenses and total return for the period. You may use the Actual information, together with the amount invested, to estimate the expenses that you paid over the period. Simply divide your account value by $1,000 (for example, an $8,600 account value divided by $1,000 = 8.6), then multiply the results by the expenses paid during the period under the “Actual” column. The amount listed in the “Hypothetical” column assumes a 5% annual rate of return before expenses (which is not the Fund’s actual return) and then applies the Fund’s actual expense ratio for the period to the hypothetical return. You should not use the hypothetical account values and expenses to estimate either your actual account balance at the end of the period or the expenses you paid during the period. See “Compare with other funds” below for details on how to use the hypothetical data.
Compare with other funds
Since all mutual funds are required to include the same hypothetical calculations about expenses in shareholder reports, you can use this information to compare the ongoing cost of investing in the Fund with other funds. To do so, compare the hypothetical example with the 5% hypothetical examples that appear in the shareholder reports of other funds. As you compare hypothetical examples of other funds, it is important to note that hypothetical examples are meant to highlight the ongoing costs of investing in a fund only and do not reflect any transaction costs, such as redemption or exchange fees. Therefore, the hypothetical calculations are useful in comparing ongoing costs only, and will not help you determine the relative total costs of owning different funds. If transaction costs were included in these calculations, your costs would be higher.
| March 1, 2017 — August 31, 2017 |
| | Account value at the
beginning of the
period ($) | Account value at the
end of the
period ($) | Expenses paid during
the period ($) | Fund’s annualized
expense ratio (%) |
| | Actual | Hypothetical | Actual | Hypothetical | Actual | Hypothetical | Actual |
| Class A | 1,000.00 | 1,000.00 | 1,026.30 | 1,018.45 | 6.84 | 6.82 | 1.34 |
| Class Z | 1,000.00 | 1,000.00 | 1,027.80 | 1,019.71 | 5.57 | 5.55 | 1.09 |
Expenses paid during the period are equal to the annualized expense ratio for each class as indicated above, multiplied by the average account value over the period and then multiplied by the number of days in the Fund’s most recent fiscal half year and divided by 365.
Expenses do not include fees and expenses incurred indirectly by the Fund from its investment in underlying funds, including affiliated and non-affiliated pooled investment vehicles, such as mutual funds and exchange-traded funds.
Had Columbia Management Investment Advisers, LLC and/or certain of its affiliates not waived/reimbursed certain fees and expenses, account value at the end of the period would have been reduced.
The Fund is offered only through certain wrap fee programs sponsored and/or managed by Ameriprise Financial, Inc. or its affiliates. Participants in wrap fee programs pay other fees that are not included in the above table. Please refer to the wrap program documents for information about the fees charged.
| 10 | Multi-Manager Small Cap Equity Strategies Fund | Annual Report 2017 |
Portfolio of Investments
August 31, 2017
(Percentages represent value of investments compared to net assets)
| Common Stocks 96.9% |
| Issuer | Shares | Value ($) |
| Consumer Discretionary 9.0% |
| Auto Components 2.1% |
| Cooper Tire & Rubber Co. | 66,477 | 2,233,627 |
| Cooper-Standard Holding, Inc.(a) | 31,865 | 3,204,982 |
| Dana, Inc. | 91,115 | 2,193,138 |
| Dorman Products, Inc.(a) | 51,125 | 3,395,723 |
| Fox Factory Holding Corp.(a) | 129,450 | 5,178,000 |
| Modine Manufacturing Co.(a) | 76,396 | 1,233,795 |
| Tower International, Inc. | 55,700 | 1,250,465 |
| Visteon Corp.(a) | 15,835 | 1,827,992 |
| Total | | 20,517,722 |
| Diversified Consumer Services 2.2% |
| Adtalem Global Education, Inc. | 46,500 | 1,590,300 |
| American Public Education, Inc.(a) | 28,246 | 521,139 |
| Capella Education Co. | 10,700 | 720,645 |
| Grand Canyon Education, Inc.(a) | 84,596 | 6,941,102 |
| K12, Inc.(a) | 46,272 | 829,194 |
| ServiceMaster Global Holdings, Inc.(a) | 95,669 | 4,507,923 |
| Sotheby’s (a) | 98,048 | 4,399,414 |
| Weight Watchers International, Inc.(a) | 34,541 | 1,616,864 |
| Total | | 21,126,581 |
| Hotels, Restaurants & Leisure 0.7% |
| Arcos Dorados Holdings, Inc., Class A(a) | 121,427 | 1,044,272 |
| Dave & Buster’s Entertainment, Inc.(a) | 29,311 | 1,713,521 |
| Penn National Gaming, Inc.(a) | 26,851 | 595,824 |
| Planet Fitness, Inc., Class A | 52,045 | 1,320,382 |
| Red Robin Gourmet Burgers, Inc.(a) | 27,000 | 1,539,000 |
| Texas Roadhouse, Inc. | 19,951 | 946,675 |
| Total | | 7,159,674 |
| Household Durables 0.5% |
| KB Home | 81,952 | 1,753,773 |
| TopBuild Corp.(a) | 24,352 | 1,445,291 |
| William Lyon Homes, Inc., Class A(a) | 84,000 | 2,015,160 |
| Total | | 5,214,224 |
| Common Stocks (continued) |
| Issuer | Shares | Value ($) |
| Internet & Direct Marketing Retail 0.3% |
| Nutrisystem, Inc. | 16,994 | 922,774 |
| PetMed Express, Inc. | 23,696 | 859,454 |
| Wayfair, Inc., Class A(a) | 15,397 | 1,093,341 |
| Total | | 2,875,569 |
| Media 0.2% |
| Gray Television, Inc.(a) | 105,319 | 1,506,062 |
| Nexstar Broadcasting Group, Inc., Class A | 11,700 | 704,340 |
| Total | | 2,210,402 |
| Multiline Retail 0.2% |
| Ollie’s Bargain Outlet Holdings, Inc.(a) | 33,012 | 1,381,552 |
| Specialty Retail 2.5% |
| Aaron’s, Inc. | 75,072 | 3,323,438 |
| American Eagle Outfitters, Inc. | 360,139 | 4,303,661 |
| Caleres, Inc. | 77,634 | 2,094,565 |
| Camping World Holdings, Inc., Class A | 35,587 | 1,307,822 |
| Children’s Place, Inc. (The) | 34,556 | 3,668,119 |
| Conn’s, Inc.(a) | 64,244 | 1,114,633 |
| Express, Inc.(a) | 127,045 | 809,277 |
| GameStop Corp., Class A | 79,204 | 1,465,274 |
| Genesco, Inc.(a) | 19,924 | 421,393 |
| Hibbett Sports, Inc.(a) | 68,921 | 847,728 |
| Lumber Liquidators Holdings, Inc.(a) | 41,369 | 1,552,579 |
| Select Comfort Corp.(a) | 100,737 | 2,974,764 |
| Total | | 23,883,253 |
| Textiles, Apparel & Luxury Goods 0.3% |
| Deckers Outdoor Corp.(a) | 43,417 | 2,774,346 |
| Total Consumer Discretionary | 87,143,323 |
| Consumer Staples 1.7% |
| Beverages 0.5% |
| MGP Ingredients, Inc. | 84,325 | 4,741,595 |
| Food & Staples Retailing 0.3% |
| United Natural Foods, Inc.(a) | 30,000 | 1,042,500 |
| Weis Markets, Inc. | 33,593 | 1,485,147 |
| Total | | 2,527,647 |
The accompanying Notes to Financial Statements are an integral part of this statement.
Multi-Manager Small Cap Equity Strategies Fund | Annual Report 2017
| 11 |
Portfolio of Investments (continued)
August 31, 2017
| Common Stocks (continued) |
| Issuer | Shares | Value ($) |
| Food Products 0.4% |
| Darling Ingredients, Inc.(a) | 134,678 | 2,343,397 |
| Dean Foods Co. | 91,529 | 1,006,819 |
| Hostess Brands, Inc.(a) | 73,000 | 973,820 |
| Total | | 4,324,036 |
| Household Products 0.3% |
| WD-40 Co. | 27,350 | 2,979,782 |
| Personal Products 0.2% |
| Edgewell Personal Care Co.(a) | 30,114 | 2,286,857 |
| Total Consumer Staples | 16,859,917 |
| Energy 3.1% |
| Energy Equipment & Services 1.2% |
| C&J Energy Services, Inc.(a) | 40,000 | 1,010,400 |
| Dril-Quip, Inc.(a) | 54,414 | 2,043,246 |
| Exterran Corp.(a) | 46,010 | 1,276,318 |
| Keane Group, Inc.(a) | 93,500 | 1,210,825 |
| McDermott International, Inc.(a) | 239,938 | 1,473,219 |
| Newpark Resources, Inc.(a) | 100,212 | 806,707 |
| Patterson-UTI Energy, Inc. | 60,000 | 958,200 |
| Precision Drilling Corp.(a) | 488,070 | 1,249,459 |
| Rowan Companies PLC, Class A(a) | 85,191 | 830,612 |
| US Silica Holdings, Inc. | 24,735 | 673,039 |
| Total | | 11,532,025 |
| Oil, Gas & Consumable Fuels 1.9% |
| Aegean Marine Petroleum Network, Inc. | 110,000 | 555,500 |
| Arch Coal, Inc. | 23,000 | 1,837,010 |
| Callon Petroleum Co.(a) | 77,815 | 806,163 |
| Carrizo Oil & Gas, Inc.(a) | 92,399 | 1,241,843 |
| Extraction Oil & Gas, Inc.(a) | 71,000 | 932,940 |
| Matador Resources Co.(a) | 122,700 | 2,893,266 |
| Oasis Petroleum, Inc.(a) | 126,000 | 919,800 |
| Pacific Ethanol, Inc.(a) | 155,767 | 778,835 |
| PBF Energy, Inc., Class A | 37,500 | 888,000 |
| PDC Energy, Inc.(a) | 21,805 | 857,591 |
| Renewable Energy Group, Inc.(a) | 76,639 | 927,332 |
| Rice Energy, Inc.(a) | 107,520 | 2,941,747 |
| Common Stocks (continued) |
| Issuer | Shares | Value ($) |
| RSP Permian, Inc.(a) | 18,478 | 579,840 |
| WPX Energy, Inc.(a) | 238,249 | 2,380,107 |
| Total | | 18,539,974 |
| Total Energy | 30,071,999 |
| Financials 17.7% |
| Banks 9.5% |
| 1st Source Corp. | 23,555 | 1,099,312 |
| Ameris Bancorp | 51,000 | 2,246,550 |
| Associated Banc-Corp. | 143,803 | 3,149,286 |
| BancFirst Corp. | 17,627 | 888,401 |
| BancorpSouth, Inc. | 68,295 | 1,983,970 |
| Banner Corp. | 28,342 | 1,562,211 |
| Capital Bank Financial Corp. Class A | 66,785 | 2,511,116 |
| Cathay General Bancorp | 107,483 | 3,790,925 |
| Central Pacific Financial Corp. | 56,115 | 1,627,335 |
| City Holding Co. | 18,730 | 1,186,171 |
| Community Bank System, Inc. | 48,000 | 2,470,080 |
| Community Trust Bancorp, Inc. | 80,239 | 3,414,169 |
| Customers Bancorp, Inc.(a) | 98,000 | 2,761,640 |
| Fidelity Southern Corp. | 28,013 | 612,364 |
| Financial Institutions, Inc. | 18,537 | 504,206 |
| First Interstate Bancsystem, Inc. | 28,762 | 1,012,422 |
| First Midwest Bancorp, Inc. | 145,449 | 3,066,065 |
| Fulton Financial Corp. | 207,056 | 3,613,127 |
| Great Southern Bancorp, Inc. | 8,241 | 410,402 |
| Hancock Holding Co. | 116,976 | 5,141,095 |
| Hanmi Financial Corp. | 53,129 | 1,418,544 |
| Heartland Financial USA, Inc. | 29,752 | 1,353,716 |
| Heritage Financial Corp. | 27,861 | 728,565 |
| Hilltop Holdings, Inc. | 73,437 | 1,738,254 |
| Hope Bancorp, Inc. | 125,000 | 2,017,500 |
| Independent Bank Corp. | 39,000 | 2,702,700 |
| Independent Bank Corp. | 22,482 | 458,633 |
| Investors Bancorp, Inc. | 77,873 | 1,019,358 |
| MB Financial, Inc. | 35,100 | 1,395,927 |
| Old National Bancorp | 216,654 | 3,542,293 |
| Peapack Gladstone Financial Corp. | 15,145 | 461,468 |
| Peoples Bancorp, Inc. | 14,725 | 457,358 |
| Preferred Bank/Los Angeles | 26,262 | 1,412,896 |
The accompanying Notes to Financial Statements are an integral part of this statement.
| 12 | Multi-Manager Small Cap Equity Strategies Fund | Annual Report 2017 |
Portfolio of Investments (continued)
August 31, 2017
| Common Stocks (continued) |
| Issuer | Shares | Value ($) |
| Prosperity Bancshares, Inc. | 25,300 | 1,511,675 |
| Renasant Corp. | 60,000 | 2,389,800 |
| S&T Bancorp, Inc. | 13,124 | 471,677 |
| Sandy Spring Bancorp, Inc. | 183,579 | 7,080,642 |
| Sterling Bancorp | 125,000 | 2,806,250 |
| Trico Bancshares | 20,761 | 738,676 |
| UMB Financial Corp. | 30,000 | 2,013,600 |
| Umpqua Holdings Corp. | 129,151 | 2,260,142 |
| Union Bankshares Corp. | 74,000 | 2,318,420 |
| United Community Banks, Inc. | 57,241 | 1,494,563 |
| WesBanco, Inc. | 49,312 | 1,872,870 |
| Western Alliance Bancorp(a) | 30,500 | 1,471,015 |
| Wintrust Financial Corp. | 57,032 | 4,152,500 |
| Total | | 92,339,889 |
| Capital Markets 1.9% |
| Evercore, Inc., Class A | 12,200 | 920,490 |
| Greenhill & Co., Inc. | 136,982 | 2,061,579 |
| Houlihan Lokey, Inc. | 45,500 | 1,640,275 |
| Legg Mason, Inc. | 82,060 | 3,133,871 |
| LPL Financial Holdings, Inc. | 28,418 | 1,331,099 |
| Moelis & Co., ADR, Class A | 70,582 | 2,780,931 |
| PJT Partners, Inc. | 30,274 | 1,170,393 |
| Stifel Financial Corp. | 32,392 | 1,546,718 |
| Westwood Holdings Group, Inc. | 59,200 | 3,618,896 |
| Total | | 18,204,252 |
| Consumer Finance 0.5% |
| Encore Capital Group, Inc.(a) | 43,000 | 1,735,050 |
| Nelnet, Inc., Class A | 20,699 | 981,754 |
| SLM Corp.(a) | 190,000 | 1,932,300 |
| Total | | 4,649,104 |
| Insurance 3.0% |
| American Equity Investment Life Holding Co. | 140,639 | 3,904,139 |
| AMERISAFE, Inc. | 23,000 | 1,237,400 |
| Argo Group International Holdings Ltd. | 61,963 | 3,730,173 |
| CNO Financial Group, Inc. | 283,488 | 6,335,957 |
| Employers Holdings, Inc. | 133,884 | 5,643,210 |
| HCI Group, Inc. | 29,675 | 1,157,028 |
| Health Insurance Innovations, Inc., Class A(a) | 39,635 | 1,333,718 |
| Common Stocks (continued) |
| Issuer | Shares | Value ($) |
| Horace Mann Educators Corp. | 77,772 | 2,733,686 |
| MBIA, Inc.(a) | 115,000 | 1,156,900 |
| Safety Insurance Group, Inc. | 7,051 | 503,441 |
| Selective Insurance Group, Inc. | 29,715 | 1,497,636 |
| Total | | 29,233,288 |
| Mortgage Real Estate Investment Trusts (REITS) 0.2% |
| Blackstone Mortgage Trust, Inc. | 30,000 | 940,500 |
| Invesco Mortgage Capital, Inc. | 58,000 | 984,840 |
| Total | | 1,925,340 |
| Thrifts & Mortgage Finance 2.6% |
| BofI Holding, Inc.(a) | 52,700 | 1,397,077 |
| First Defiance Financial Corp. | 10,390 | 508,694 |
| HomeStreet, Inc.(a) | 55,493 | 1,401,198 |
| LendingTree, Inc.(a) | 7,292 | 1,684,087 |
| MGIC Investment Corp.(a) | 210,000 | 2,404,500 |
| NMI Holdings, Inc., Class A(a) | 48,215 | 523,133 |
| Provident Financial Services, Inc. | 140,814 | 3,499,228 |
| Radian Group, Inc. | 245,713 | 4,299,978 |
| TrustCo Bank Corp. | 92,012 | 726,895 |
| Walker & Dunlop, Inc.(a) | 58,702 | 2,828,849 |
| Washington Federal, Inc. | 125,190 | 3,912,188 |
| WSFS Financial Corp. | 46,000 | 2,056,200 |
| Total | | 25,242,027 |
| Total Financials | 171,593,900 |
| Health Care 16.3% |
| Biotechnology 4.7% |
| Akebia Therapeutics, Inc.(a) | 79,151 | 1,324,988 |
| Avexis, Inc.(a) | 18,908 | 1,765,062 |
| bluebird bio, Inc.(a) | 20,590 | 2,570,662 |
| Clovis Oncology, Inc.(a) | 14,159 | 1,077,075 |
| Dynavax Technologies Corp.(a) | 79,740 | 1,431,333 |
| Emergent Biosolutions, Inc.(a) | 31,712 | 1,183,809 |
| Enanta Pharmaceuticals, Inc.(a) | 26,197 | 1,122,803 |
| Esperion Therapeutics, Inc.(a) | 29,003 | 1,433,328 |
| Exact Sciences Corp.(a) | 37,334 | 1,563,921 |
| Exelixis, Inc.(a) | 40,575 | 1,186,413 |
| FibroGen, Inc.(a) | 36,678 | 1,767,880 |
| Global Blood Therapeutics, Inc.(a) | 40,289 | 1,224,786 |
The accompanying Notes to Financial Statements are an integral part of this statement.
Multi-Manager Small Cap Equity Strategies Fund | Annual Report 2017
| 13 |
Portfolio of Investments (continued)
August 31, 2017
| Common Stocks (continued) |
| Issuer | Shares | Value ($) |
| GlycoMimetics, Inc.(a) | 96,343 | 1,175,385 |
| Immunogen, Inc.(a) | 201,609 | 1,685,451 |
| Immunomedics, Inc.(a) | 175,296 | 2,215,742 |
| Ligand Pharmaceuticals, Inc.(a) | 40,500 | 5,219,235 |
| Loxo Oncology, Inc.(a) | 22,661 | 1,889,927 |
| MiMedx Group, Inc.(a) | 69,130 | 1,124,745 |
| Myriad Genetics, Inc.(a) | 53,515 | 1,631,672 |
| Portola Pharmaceuticals, Inc.(a) | 28,863 | 1,831,357 |
| Puma Biotechnology, Inc.(a) | 13,512 | 1,249,860 |
| Repligen Corp.(a) | 133,000 | 5,808,110 |
| Sarepta Therapeutics(a) | 29,797 | 1,200,521 |
| Spark Therapeutics, Inc.(a) | 15,966 | 1,314,481 |
| TG Therapeutics, Inc.(a) | 108,853 | 1,382,433 |
| Total | | 45,380,979 |
| Health Care Equipment & Supplies 4.6% |
| Analogic Corp. | 14,862 | 1,063,376 |
| Angiodynamics, Inc.(a) | 38,073 | 648,383 |
| Anika Therapeutics, Inc.(a) | 12,086 | 649,018 |
| AxoGen, Inc.(a) | 83,804 | 1,474,950 |
| Cantel Medical Corp. | 70,300 | 5,711,875 |
| Cutera, Inc.(a) | 54,819 | 2,036,526 |
| Inogen, Inc.(a) | 13,426 | 1,286,211 |
| Insulet Corp.(a) | 23,109 | 1,341,708 |
| Integer Holdings Corp.(a) | 29,566 | 1,358,558 |
| iRhythm Technologies, Inc.(a) | 28,072 | 1,340,157 |
| K2M Group Holdings, Inc.(a) | 51,620 | 1,206,876 |
| LeMaitre Vascular, Inc. | 71,000 | 2,584,400 |
| Masimo Corp.(a) | 10,642 | 897,972 |
| Merit Medical Systems, Inc.(a) | 201,772 | 8,333,184 |
| Natus Medical, Inc.(a) | 28,587 | 960,523 |
| Neogen Corp.(a) | 88,412 | 6,091,587 |
| OraSure Technologies, Inc.(a) | 77,262 | 1,576,917 |
| Orthofix International NV(a) | 11,781 | 579,743 |
| Penumbra, Inc.(a) | 13,955 | 1,200,130 |
| Quidel Corp.(a) | 40,674 | 1,421,150 |
| Tactile Systems Technology, Inc.(a) | 41,298 | 1,357,878 |
| Wright Medical Group NV(a) | 35,000 | 1,036,000 |
| Total | | 44,157,122 |
| Common Stocks (continued) |
| Issuer | Shares | Value ($) |
| Health Care Providers & Services 2.0% |
| Almost Family, Inc.(a) | 33,640 | 1,638,268 |
| BioTelemetry, Inc.(a) | 43,359 | 1,610,787 |
| HealthEquity, Inc.(a) | 23,860 | 1,020,492 |
| LHC Group, Inc.(a) | 87,217 | 5,690,909 |
| Magellan Health, Inc.(a) | 12,754 | 1,031,799 |
| Molina Healthcare, Inc.(a) | 18,000 | 1,152,000 |
| National Research Corp., Class A | 51,375 | 1,659,412 |
| National Research Corp., Class B | 27,180 | 1,426,950 |
| Teladoc, Inc.(a) | 46,151 | 1,548,366 |
| Tenet Healthcare Corp.(a) | 64,000 | 1,098,880 |
| Tivity Health, Inc.(a) | 30,799 | 1,207,321 |
| Triple-S Management Corp., Class B(a) | 22,989 | 568,058 |
| Total | | 19,653,242 |
| Health Care Technology 2.6% |
| Allscripts Healthcare Solutions, Inc.(a) | 315,417 | 4,144,579 |
| HealthStream, Inc.(a) | 132,300 | 3,107,727 |
| Medidata Solutions, Inc.(a) | 82,806 | 6,207,138 |
| Omnicell, Inc.(a) | 184,132 | 9,445,972 |
| Vocera Communications, Inc.(a) | 85,400 | 2,378,390 |
| Total | | 25,283,806 |
| Life Sciences Tools & Services 0.7% |
| Bio-Techne Corp. | 25,700 | 3,181,146 |
| Luminex Corp. | 64,559 | 1,247,926 |
| PAREXEL International Corp.(a) | 10,596 | 931,282 |
| Pra Health Sciences, Inc.(a) | 18,464 | 1,429,114 |
| Total | | 6,789,468 |
| Pharmaceuticals 1.7% |
| Aerie Pharmaceuticals, Inc.(a) | 23,294 | 1,335,911 |
| Catalent, Inc.(a) | 35,817 | 1,478,884 |
| Cymabay Therapeutics, Inc.(a) | 186,094 | 1,161,227 |
| Horizon Pharma PLC(a) | 103,000 | 1,409,040 |
| Impax Laboratories, Inc.(a) | 87,000 | 1,883,550 |
| Innoviva, Inc.(a) | 57,312 | 804,660 |
| Intersect ENT, Inc.(a) | 43,915 | 1,356,973 |
| MyoKardia, Inc.(a) | 32,565 | 1,411,693 |
| Nektar Therapeutics(a) | 58,842 | 1,237,447 |
| Omeros Corp.(a) | 48,397 | 990,687 |
The accompanying Notes to Financial Statements are an integral part of this statement.
| 14 | Multi-Manager Small Cap Equity Strategies Fund | Annual Report 2017 |
Portfolio of Investments (continued)
August 31, 2017
| Common Stocks (continued) |
| Issuer | Shares | Value ($) |
| Phibro Animal Health Corp., Class A | 42,316 | 1,502,218 |
| Sucampo Pharmaceuticals, Inc., Class A(a) | 56,916 | 668,763 |
| Supernus Pharmaceuticals, Inc.(a) | 34,474 | 1,578,909 |
| Total | | 16,819,962 |
| Total Health Care | 158,084,579 |
| Industrials 17.1% |
| Aerospace & Defense 0.9% |
| Aerojet Rocketdyne Holdings, Inc.(a) | 44,008 | 1,303,957 |
| Curtiss-Wright Corp. | 9,500 | 919,790 |
| KLX, Inc.(a) | 38,094 | 1,826,226 |
| Kratos Defense & Security Solutions, Inc.(a) | 104,841 | 1,402,773 |
| Mercury Systems, Inc.(a) | 35,377 | 1,706,940 |
| Moog, Inc., Class A(a) | 24,313 | 1,866,266 |
| Total | | 9,025,952 |
| Air Freight & Logistics 0.4% |
| Forward Air Corp. | 52,989 | 2,753,838 |
| XPO Logistics, Inc.(a) | 16,768 | 1,026,202 |
| Total | | 3,780,040 |
| Airlines 0.3% |
| Hawaiian Holdings, Inc.(a) | 28,531 | 1,222,554 |
| Skywest, Inc. | 54,000 | 1,873,800 |
| Total | | 3,096,354 |
| Building Products 1.8% |
| AAON, Inc. | 158,850 | 5,178,510 |
| Builders FirstSource, Inc.(a) | 78,578 | 1,279,250 |
| Continental Building Product(a) | 111,175 | 2,707,111 |
| Simpson Manufacturing Co., Inc. | 109,525 | 4,795,005 |
| Trex Co., Inc.(a) | 52,700 | 4,005,200 |
| Total | | 17,965,076 |
| Commercial Services & Supplies 2.7% |
| ABM Industries, Inc. | 102,979 | 4,575,357 |
| ACCO Brands Corp.(a) | 125,397 | 1,373,097 |
| Brink’s Co. (The) | 35,288 | 2,768,344 |
| CECO Environmental Corp. | 42,379 | 316,571 |
| Deluxe Corp. | 28,000 | 1,941,800 |
| Healthcare Services Group, Inc. | 124,288 | 6,363,546 |
| Herman Miller, Inc. | 25,774 | 867,295 |
| HNI Corp. | 75,450 | 2,765,242 |
| Common Stocks (continued) |
| Issuer | Shares | Value ($) |
| Kimball International, Inc., Class B | 38,351 | 650,433 |
| Rollins, Inc. | 97,125 | 4,313,321 |
| Total | | 25,935,006 |
| Construction & Engineering 1.3% |
| EMCOR Group, Inc. | 53,665 | 3,544,037 |
| Granite Construction, Inc. | 38,500 | 2,126,355 |
| MasTec, Inc.(a) | 72,725 | 2,967,180 |
| Quanta Services, Inc.(a) | 100,593 | 3,614,306 |
| Total | | 12,251,878 |
| Electrical Equipment 0.2% |
| Atkore International Group, Inc.(a) | 121,367 | 2,021,974 |
| Machinery 5.3% |
| AGCO Corp. | 18,925 | 1,295,416 |
| Altra Industrial Motion Corp. | 28,169 | 1,297,182 |
| Barnes Group, Inc. | 41,000 | 2,563,320 |
| Chart Industries, Inc.(a) | 30,390 | 1,025,359 |
| Columbus McKinnon Corp. | 67,271 | 2,221,961 |
| Douglas Dynamics, Inc. | 29,328 | 1,023,547 |
| EnPro Industries, Inc. | 37,312 | 2,629,377 |
| ESCO Technologies, Inc. | 68,999 | 3,756,995 |
| Franklin Electric Co., Inc. | 14,761 | 569,037 |
| Global Brass & Copper Holdings, Inc. | 109,635 | 3,272,605 |
| Greenbrier Companies, Inc. (The) | 101,946 | 4,373,483 |
| Hyster-Yale Materials Handling, Inc. | 8,066 | 574,138 |
| John Bean Technologies Corp. | 38,543 | 3,418,764 |
| Kadant, Inc. | 15,747 | 1,367,627 |
| Kennametal, Inc. | 53,500 | 1,872,500 |
| Mueller Industries, Inc. | 95,576 | 2,851,032 |
| Navistar International Corp.(a) | 51,000 | 1,742,160 |
| Oshkosh Corp. | 15,000 | 1,119,000 |
| Proto Labs, Inc.(a) | 46,400 | 3,331,520 |
| RBC Bearings, Inc.(a) | 11,537 | 1,272,185 |
| REV Group, Inc. | 28,000 | 705,320 |
| Sun Hydraulics Corp. | 127,514 | 6,109,196 |
| Wabash National Corp. | 79,115 | 1,662,997 |
| WABCO Holdings, Inc.(a) | 9,051 | 1,299,905 |
| Total | | 51,354,626 |
The accompanying Notes to Financial Statements are an integral part of this statement.
Multi-Manager Small Cap Equity Strategies Fund | Annual Report 2017
| 15 |
Portfolio of Investments (continued)
August 31, 2017
| Common Stocks (continued) |
| Issuer | Shares | Value ($) |
| Professional Services 2.1% |
| Exponent, Inc. | 80,100 | 5,454,810 |
| Navigant Consulting, Inc.(a) | 194,360 | 2,979,539 |
| On Assignment, Inc.(a) | 48,570 | 2,316,789 |
| RPX Corp.(a) | 124,423 | 1,624,964 |
| TrueBlue, Inc.(a) | 81,633 | 1,669,395 |
| Wageworks, Inc.(a) | 100,075 | 5,899,421 |
| Total | | 19,944,918 |
| Road & Rail 0.8% |
| ArcBest Corp. | 70,927 | 2,106,532 |
| Covenant Transportation Group, Inc., Class A(a) | 10,583 | 254,098 |
| Hertz Global Holdings, Inc.(a) | 78,000 | 1,695,720 |
| Old Dominion Freight Line, Inc. | 24,634 | 2,460,937 |
| Saia, Inc.(a) | 23,084 | 1,305,400 |
| Total | | 7,822,687 |
| Trading Companies & Distributors 1.3% |
| Aircastle Ltd. | 68,246 | 1,530,075 |
| Rush Enterprises, Inc., Class A(a) | 75,676 | 3,101,959 |
| SiteOne Landscape Supply, Inc.(a) | 85,425 | 4,291,752 |
| Triton International Ltd. | 97,794 | 3,610,555 |
| Total | | 12,534,341 |
| Total Industrials | 165,732,852 |
| Information Technology 17.6% |
| Communications Equipment 1.0% |
| Extreme Networks, Inc.(a) | 142,688 | 1,630,924 |
| Infinera Corp.(a) | 57,000 | 482,220 |
| Lumentum Holdings, Inc.(a) | 19,495 | 1,108,291 |
| Netscout Systems, Inc.(a) | 103,650 | 3,394,538 |
| Oclaro, Inc.(a) | 165,000 | 1,387,650 |
| Silicom Ltd. | 23,059 | 1,261,327 |
| Viavi Solutions, Inc.(a) | 94,177 | 945,537 |
| Total | | 10,210,487 |
| Electronic Equipment, Instruments & Components 4.2% |
| Benchmark Electronics, Inc.(a) | 59,232 | 1,925,040 |
| II-VI, Inc.(a) | 66,860 | 2,396,931 |
| IPG Photonics Corp.(a) | 28,565 | 5,021,441 |
| Itron, Inc.(a) | 17,115 | 1,242,549 |
| KEMET Corp.(a) | 79,456 | 1,899,793 |
| Common Stocks (continued) |
| Issuer | Shares | Value ($) |
| Littelfuse, Inc. | 8,064 | 1,501,194 |
| Mesa Laboratories, Inc. | 36,317 | 4,959,813 |
| Novanta, Inc.(a) | 32,769 | 1,281,268 |
| Rogers Corp.(a) | 79,189 | 9,387,856 |
| Scansource, Inc.(a) | 29,196 | 1,145,943 |
| SYNNEX Corp. | 16,300 | 1,949,643 |
| TTM Technologies, Inc.(a) | 354,799 | 5,052,338 |
| Universal Display Corp. | 8,411 | 1,069,038 |
| Vishay Intertechnology, Inc. | 129,842 | 2,298,203 |
| Total | | 41,131,050 |
| Internet Software & Services 3.7% |
| 2U, Inc.(a) | 29,791 | 1,492,529 |
| Alarm.com Holdings, Inc.(a) | 28,751 | 1,291,495 |
| Blucora, Inc.(a) | 54,326 | 1,238,633 |
| Box, Inc., Class A(a) | 60,907 | 1,194,995 |
| Carbonite, Inc.(a) | 52,743 | 1,054,860 |
| CoStar Group, Inc.(a) | 7,025 | 2,013,506 |
| Envestnet, Inc.(a) | 29,304 | 1,302,563 |
| GrubHub, Inc.(a) | 23,059 | 1,316,438 |
| GTT Communications, Inc.(a) | 40,682 | 1,291,654 |
| Hortonworks, Inc.(a) | 83,597 | 1,420,313 |
| Instructure, Inc.(a) | 59,801 | 1,770,110 |
| Internap Corp.(a) | 286,264 | 1,279,600 |
| LivePerson, Inc.(a) | 111,343 | 1,491,996 |
| New Relic, Inc.(a) | 21,133 | 1,012,271 |
| NIC, Inc. | 180,400 | 2,949,540 |
| Q2 Holdings, Inc.(a) | 31,671 | 1,285,843 |
| SPS Commerce, Inc.(a) | 33,100 | 2,016,452 |
| Stamps.com, Inc.(a) | 32,050 | 6,129,562 |
| Trade Desk, Inc. (The)(a) | 24,523 | 1,298,983 |
| TrueCar, Inc.(a) | 77,918 | 1,320,710 |
| Web.com Group, Inc.(a) | 53,267 | 1,347,655 |
| Total | | 35,519,708 |
| IT Services 0.7% |
| Blackhawk Network Holdings, Inc.(a) | 28,252 | 1,265,690 |
| Convergys Corp. | 79,571 | 1,869,918 |
| Science Applications International Corp. | 23,410 | 1,729,531 |
| Travelport Worldwide Ltd. | 131,932 | 1,997,450 |
| Total | | 6,862,589 |
The accompanying Notes to Financial Statements are an integral part of this statement.
| 16 | Multi-Manager Small Cap Equity Strategies Fund | Annual Report 2017 |
Portfolio of Investments (continued)
August 31, 2017
| Common Stocks (continued) |
| Issuer | Shares | Value ($) |
| Semiconductors & Semiconductor Equipment 3.1% |
| Axcelis Technologies, Inc.(a) | 47,287 | 988,298 |
| AXT, Inc.(a) | 203,830 | 1,589,874 |
| Brooks Automation, Inc. | 76,843 | 2,003,297 |
| Cohu, Inc. | 98,003 | 1,838,536 |
| Cypress Semiconductor Corp. | 57,000 | 780,330 |
| Diodes, Inc.(a) | 68,451 | 1,926,211 |
| Entegris, Inc.(a) | 106,377 | 2,707,295 |
| Formfactor, Inc.(a) | 108,918 | 1,644,662 |
| Ichor Holdings Ltd.(a) | 86,469 | 1,978,411 |
| Kulicke & Soffa Industries, Inc.(a) | 69,500 | 1,322,585 |
| MKS Instruments, Inc. | 11,706 | 963,989 |
| Monolithic Power Systems, Inc. | 10,803 | 1,094,560 |
| NVE Corp. | 25,750 | 1,952,880 |
| Photronics, Inc.(a) | 80,446 | 635,523 |
| Rudolph Technologies, Inc.(a) | 62,171 | 1,380,196 |
| Semtech Corp.(a) | 27,156 | 1,021,066 |
| Silicon Laboratories, Inc.(a) | 16,453 | 1,248,783 |
| Teradyne, Inc. | 107,422 | 3,825,298 |
| Ultra Clean Holdings, Inc.(a) | 43,219 | 997,062 |
| Total | | 29,898,856 |
| Software 4.8% |
| ACI Worldwide, Inc.(a) | 170,500 | 3,880,580 |
| Blackbaud, Inc. | 75,626 | 6,383,591 |
| Bottomline Technologies de, Inc.(a) | 156,900 | 4,755,639 |
| Callidus Software, Inc.(a) | 52,126 | 1,342,244 |
| Descartes Systems Group, Inc. (The)(a) | 237,600 | 6,664,680 |
| Ebix, Inc. | 15,700 | 905,890 |
| Everbridge, Inc.(a) | 56,189 | 1,301,899 |
| Exa Corp.(a) | 176,331 | 2,530,350 |
| Guidewire Software, Inc.(a) | 17,908 | 1,355,815 |
| Paycom Software, Inc.(a) | 17,390 | 1,297,468 |
| Pegasystems, Inc. | 17,445 | 1,003,960 |
| Progress Software Corp. | 46,439 | 1,559,422 |
| Proofpoint, Inc.(a) | 13,966 | 1,281,520 |
| PROS Holdings, Inc.(a) | 200,021 | 5,268,553 |
| RealPage, Inc.(a) | 32,086 | 1,382,906 |
| RingCentral, Inc., Class A(a) | 37,776 | 1,599,813 |
| Common Stocks (continued) |
| Issuer | Shares | Value ($) |
| Tyler Technologies, Inc.(a) | 13,825 | 2,388,960 |
| Varonis Systems, Inc.(a) | 34,386 | 1,334,177 |
| Total | | 46,237,467 |
| Technology Hardware, Storage & Peripherals 0.1% |
| Electronics for Imaging, Inc.(a) | 17,700 | 629,412 |
| Total Information Technology | 170,489,569 |
| Materials 4.9% |
| Chemicals 2.5% |
| A. Schulman, Inc. | 23,198 | 705,219 |
| Balchem Corp. | 47,250 | 3,541,860 |
| Ferro Corp.(a) | 65,055 | 1,253,610 |
| KMG Chemicals, Inc. | 24,184 | 1,161,316 |
| Koppers Holdings, Inc.(a) | 36,642 | 1,436,366 |
| Kraton Performance Polymers, Inc.(a) | 45,530 | 1,494,750 |
| Minerals Technologies, Inc. | 22,901 | 1,465,664 |
| Olin Corp. | 61,000 | 1,966,030 |
| Omnova Solutions, Inc.(a) | 49,901 | 434,139 |
| Orion Engineered Carbons SA | 205,206 | 4,411,929 |
| Platform Specialty Products Corp.(a) | 97,062 | 1,133,684 |
| PolyOne Corp. | 74,528 | 2,693,442 |
| Stepan Co. | 21,106 | 1,632,760 |
| Trinseo SA | 6,866 | 459,335 |
| Tronox Ltd., Class A | 32,374 | 669,818 |
| Total | | 24,459,922 |
| Construction Materials 0.5% |
| Summit Materials, Inc., Class A(a) | 46,717 | 1,380,020 |
| US Concrete, Inc.(a) | 37,741 | 3,021,167 |
| Total | | 4,401,187 |
| Metals & Mining 1.2% |
| AK Steel Holding Corp.(a) | 233,000 | 1,304,800 |
| Allegheny Technologies, Inc. | 56,000 | 1,166,480 |
| Carpenter Technology Corp. | 49,000 | 1,985,970 |
| Cleveland-Cliffs, Inc.(a) | 108,000 | 902,880 |
| Kaiser Aluminum Corp. | 52,208 | 5,028,675 |
| Materion Corp. | 30,000 | 1,146,000 |
| Total | | 11,534,805 |
The accompanying Notes to Financial Statements are an integral part of this statement.
Multi-Manager Small Cap Equity Strategies Fund | Annual Report 2017
| 17 |
Portfolio of Investments (continued)
August 31, 2017
| Common Stocks (continued) |
| Issuer | Shares | Value ($) |
| Paper & Forest Products 0.7% |
| Boise Cascade Co.(a) | 56,515 | 1,695,450 |
| KapStone Paper and Packaging Corp. | 77,000 | 1,722,490 |
| Louisiana-Pacific Corp.(a) | 61,209 | 1,559,605 |
| Neenah Paper, Inc. | 23,000 | 1,776,750 |
| Total | | 6,754,295 |
| Total Materials | 47,150,209 |
| Real Estate 5.9% |
| Equity Real Estate Investment Trusts (REITS) 5.5% |
| American Assets Trust, Inc. | 92,103 | 3,741,224 |
| Ashford Hospitality Prime, Inc. | 79,798 | 767,657 |
| Brandywine Realty Trust | 349,364 | 6,002,074 |
| Chesapeake Lodging Trust | 125,538 | 3,212,517 |
| Colony NorthStar, Inc. | 259,731 | 3,405,073 |
| Cousins Properties, Inc. | 306,827 | 2,868,832 |
| DCT Industrial Trust, Inc. | 28,351 | 1,654,281 |
| EPR Properties | 14,887 | 1,037,028 |
| First Industrial Realty Trust, Inc. | 152,786 | 4,733,310 |
| Hersha Hospitality Trust | 175,433 | 3,252,528 |
| Highwoods Properties, Inc. | 11,200 | 584,976 |
| Hudson Pacific Properties, Inc. | 47,500 | 1,567,500 |
| Kite Realty Group Trust | 140,551 | 2,827,886 |
| LaSalle Hotel Properties | 55,500 | 1,575,090 |
| Mack-Cali Realty Corp. | 138,047 | 3,159,896 |
| Pebblebrook Hotel Trust | 60,013 | 2,015,837 |
| Preferred Apartment Communities, Inc., Class A | 99,629 | 1,812,252 |
| PS Business Parks, Inc. | 14,600 | 1,972,606 |
| Saul Centers, Inc. | 10,427 | 631,876 |
| Select Income REIT | 53,562 | 1,243,174 |
| Sunstone Hotel Investors, Inc. | 99,000 | 1,564,200 |
| Tier REIT, Inc. | 34,177 | 629,199 |
| UMH Properties, Inc. | 61,599 | 974,496 |
| Xenia Hotels & Resorts, Inc. | 97,178 | 1,939,673 |
| Total | | 53,173,185 |
| Real Estate Management & Development 0.4% |
| Kennedy-Wilson Holdings, Inc. | 213,097 | 4,112,772 |
| Total Real Estate | 57,285,957 |
| Common Stocks (continued) |
| Issuer | Shares | Value ($) |
| Telecommunication Services 0.1% |
| Wireless Telecommunication Services 0.1% |
| Boingo Wireless, Inc.(a) | 66,689 | 1,373,126 |
| Total Telecommunication Services | 1,373,126 |
| Utilities 3.5% |
| Electric Utilities 1.6% |
| El Paso Electric Co. | 112,168 | 6,230,932 |
| PNM Resources, Inc. | 94,399 | 4,002,518 |
| Portland General Electric Co. | 102,323 | 4,861,366 |
| Total | | 15,094,816 |
| Gas Utilities 1.1% |
| New Jersey Resources Corp. | 60,000 | 2,619,000 |
| ONE Gas, Inc. | 24,500 | 1,843,380 |
| South Jersey Industries, Inc. | 63,000 | 2,260,440 |
| Southwest Gas Corp. | 47,080 | 3,743,801 |
| Total | | 10,466,621 |
| Independent Power and Renewable Electricity Producers 0.1% |
| Pattern Energy Group, Inc. | 23,390 | 587,557 |
| Multi-Utilities 0.7% |
| Black Hills Corp. | 27,500 | 1,935,450 |
| NorthWestern Corp. | 33,792 | 2,038,333 |
| Vectren Corp. | 50,337 | 3,302,611 |
| Total | | 7,276,394 |
| Total Utilities | 33,425,388 |
Total Common Stocks
(Cost $801,113,529) | 939,210,819 |
|
| Exchange-Traded Funds 0.3% |
| | Shares | Value ($) |
| iShares Russell 2000 ETF | 13,000 | 1,816,490 |
| iShares Russell 2000 Value ETF | 14,000 | 1,626,520 |
Total Exchange-Traded Funds
(Cost $3,432,838) | 3,443,010 |
|
The accompanying Notes to Financial Statements are an integral part of this statement.
| 18 | Multi-Manager Small Cap Equity Strategies Fund | Annual Report 2017 |
Portfolio of Investments (continued)
August 31, 2017
| Money Market Funds 3.1% |
| | Shares | Value ($) |
| Columbia Short-Term Cash Fund, 1.146%(b),(c) | 30,072,528 | 30,072,528 |
Total Money Market Funds
(Cost $30,072,490) | 30,072,528 |
Total Investments
(Cost: $834,618,857) | 972,726,357 |
| Other Assets & Liabilities, Net | | (3,067,312) |
| Net Assets | 969,659,045 |
Notes to Portfolio of Investments
| (a) | Non-income producing investment. |
| (b) | The rate shown is the seven-day current annualized yield at August 31, 2017. |
| (c) | As defined in the Investment Company Act of 1940, an affiliated company is one in which the Fund owns 5% or more of the company’s outstanding voting securities, or a company which is under common ownership or control with the Fund. Holdings and transactions in these affiliated companies during the year ended August 31, 2017 are as follows: |
| Issuer | Beginning
shares | Shares
purchased | Shares
sold | Ending
shares | Realized gain
(loss) ($) | Net change in
unrealized
appreciation
(depreciation) ($) | Dividends —
affiliated
issuers ($) | Value ($) |
| Columbia Short-Term Cash Fund, 1.146% | 13,907,784 | 310,273,112 | (294,108,368) | 30,072,528 | (1,582) | 38 | 139,143 | 30,072,528 |
Abbreviation Legend
| ADR | American Depositary Receipt |
Fair value measurements
The Fund categorizes its fair value measurements according to a three-level hierarchy that maximizes the use of observable inputs and minimizes the use of unobservable inputs by prioritizing that the most observable input be used when available. Observable inputs are those that market participants would use in pricing an investment based on market data obtained from sources independent of the reporting entity. Unobservable inputs are those that reflect the Fund’s assumptions about the information market participants would use in pricing an investment. An investment’s level within the fair value hierarchy is based on the lowest level of any input that is deemed significant to the asset’s or liability’s fair value measurement. The input levels are not necessarily an indication of the risk or liquidity associated with investments at that level. For example, certain U.S. government securities are generally high quality and liquid, however, they are reflected as Level 2 because the inputs used to determine fair value may not always be quoted prices in an active market.
Fair value inputs are summarized in the three broad levels listed below:
| • | Level 1 – Valuations based on quoted prices for investments in active markets that the Fund has the ability to access at the measurement date. Valuation adjustments are not applied to Level 1 investments. |
| • | Level 2 – Valuations based on other significant observable inputs (including quoted prices for similar securities, interest rates, prepayment speeds, credit risks, etc.). |
| • | Level 3 – Valuations based on significant unobservable inputs (including the Fund’s own assumptions and judgment in determining the fair value of investments). |
Inputs that are used in determining fair value of an investment may include price information, credit data, volatility statistics, and other factors. These inputs can be either observable or unobservable. The availability of observable inputs can vary between investments, and is affected by various factors such as the type of investment, and the volume and level of activity for that investment or similar investments in the marketplace. The inputs will be considered by the Investment Manager, along with any other relevant factors in the calculation of an investment’s fair value. The Fund uses prices and inputs that are current as of the measurement date, which may include periods of market dislocations. During these periods, the availability of prices and inputs may be reduced for many investments. This condition could cause an investment to be reclassified between the various levels within the hierarchy.
Certain investments that have been measured at fair value using the net asset value (NAV) per share (or its equivalent) are not categorized in the fair value hierarchy. The fair value amounts presented in the table are intended to reconcile the fair value hierarchy to the amounts presented in the Portfolio of Investments. The Columbia Short-Term Cash Fund seeks to provide shareholders with maximum current income consistent with liquidity and stability of principal. Columbia Short-Term Cash Fund prices its shares with a floating NAV and no longer seeks to maintain a stable NAV.
Investments falling into the Level 3 category are primarily supported by quoted prices from brokers and dealers participating in the market for those investments. However, these may be classified as Level 3 investments due to lack of market transparency and corroboration to support these quoted prices. Additionally, valuation models may be used as the pricing source for any remaining investments classified as Level 3. These models may rely on one or more significant unobservable inputs and/or significant assumptions by the Investment Manager. Inputs used in valuations may include, but are not limited to, financial statement analysis, capital account balances, discount rates and estimated cash flows, and comparable company data.
Under the direction of the Fund’s Board of Trustees (the Board), the Investment Manager’s Valuation Committee (the Committee) is responsible for overseeing the valuation procedures approved by the Board. The Committee consists of voting and non-voting members from various groups within the Investment Manager’s organization, including operations and accounting, trading and investments, compliance, risk management and legal.
The accompanying Notes to Financial Statements are an integral part of this statement.
Multi-Manager Small Cap Equity Strategies Fund | Annual Report 2017
| 19 |
Portfolio of Investments (continued)
August 31, 2017
Fair value measurements (continued)
The Committee meets at least monthly to review and approve valuation matters, which may include a description of specific valuation determinations, data regarding pricing information received from approved pricing vendors and brokers and the results of Board-approved valuation control policies and procedures (the Policies). The Policies address, among other things, instances when market quotations are or are not readily available, including recommendations of third party pricing vendors and a determination of appropriate pricing methodologies; events that require specific valuation determinations and assessment of fair value techniques; securities with a potential for stale pricing, including those that are illiquid, restricted, or in default; and the effectiveness of third party pricing vendors, including periodic reviews of vendors. The Committee meets more frequently, as needed, to discuss additional valuation matters, which may include the need to review back-testing results, review time-sensitive information or approve related valuation actions. The Committee reports to the Board, with members of the Committee meeting with the Board at each of its regularly scheduled meetings to discuss valuation matters and actions during the period, similar to those described earlier.
For investments categorized as Level 3, the Committee monitors information similar to that described above, which may include: (i) data specific to the issuer or comparable issuers, (ii) general market or specific sector news and (iii) quoted prices and specific or similar security transactions. The Committee considers this data and any changes from prior periods in order to assess the reasonableness of observable and unobservable inputs, any assumptions or internal models used to value those securities and changes in fair value. This data is also used to corroborate, when available, information received from approved pricing vendors and brokers. Various factors impact the frequency of monitoring this information (which may occur as often as daily). However, the Committee may determine that changes to inputs, assumptions and models are not required as a result of the monitoring procedures performed.
The following table is a summary of the inputs used to value the Fund’s investments at August 31, 2017:
| | Level 1
quoted prices
in active
markets for
identical
assets ($) | Level 2
other
significant
observable
inputs ($) | Level 3
significant
unobservable
inputs ($) | Investments
measured at
net asset
value ($) | Total ($) |
| Investments | | | | | |
| Common Stocks | | | | | |
| Consumer Discretionary | 87,143,323 | — | — | — | 87,143,323 |
| Consumer Staples | 16,859,917 | — | — | — | 16,859,917 |
| Energy | 30,071,999 | — | — | — | 30,071,999 |
| Financials | 171,593,900 | — | — | — | 171,593,900 |
| Health Care | 158,084,579 | — | — | — | 158,084,579 |
| Industrials | 165,732,852 | — | — | — | 165,732,852 |
| Information Technology | 170,489,569 | — | — | — | 170,489,569 |
| Materials | 47,150,209 | — | — | — | 47,150,209 |
| Real Estate | 57,285,957 | — | — | — | 57,285,957 |
| Telecommunication Services | 1,373,126 | — | — | — | 1,373,126 |
| Utilities | 33,425,388 | — | — | — | 33,425,388 |
| Total Common Stocks | 939,210,819 | — | — | — | 939,210,819 |
| Exchange-Traded Funds | 3,443,010 | — | — | — | 3,443,010 |
| Money Market Funds | — | — | — | 30,072,528 | 30,072,528 |
| Total Investments | 942,653,829 | — | — | 30,072,528 | 972,726,357 |
See the Portfolio of Investments for all investment classifications not indicated in the table.
There were no transfers of financial assets between levels during the period.
The accompanying Notes to Financial Statements are an integral part of this statement.
| 20 | Multi-Manager Small Cap Equity Strategies Fund | Annual Report 2017 |
Statement of Assets and Liabilities
August 31, 2017
| Assets | |
| Investments in unaffiliated issuers, at cost | $804,546,367 |
| Investments in affiliated issuers, at cost | 30,072,490 |
| Investments in unaffiliated issuers, at value | 942,653,829 |
| Investments in affiliated issuers, at value | 30,072,528 |
| Receivable for: | |
| Investments sold | 4,388,618 |
| Capital shares sold | 1,880,985 |
| Dividends | 655,810 |
| Expense reimbursement due from Investment Manager | 4,140 |
| Prepaid expenses | 6,562 |
| Trustees’ deferred compensation plan | 31,965 |
| Other assets | 6,336 |
| Total assets | 979,700,773 |
| Liabilities | |
| Payable for: | |
| Investments purchased | 7,356,118 |
| Capital shares purchased | 2,189,785 |
| Management services fees | 22,273 |
| Distribution and/or service fees | 36 |
| Transfer agent fees | 285,875 |
| Compensation of board members | 626 |
| Compensation of chief compliance officer | 67 |
| Other expenses | 154,983 |
| Trustees’ deferred compensation plan | 31,965 |
| Total liabilities | 10,041,728 |
| Net assets applicable to outstanding capital stock | $969,659,045 |
| Represented by | |
| Paid in capital | 757,057,660 |
| Excess of distributions over net investment income | (97,155) |
| Accumulated net realized gain | 74,591,040 |
| Unrealized appreciation (depreciation) on: | |
| Investments - unaffiliated issuers | 138,107,462 |
| Investments - affiliated issuers | 38 |
| Total - representing net assets applicable to outstanding capital stock | $969,659,045 |
| Class A | |
| Net assets | $5,277,745 |
| Shares outstanding | 346,577 |
| Net asset value per share | $15.23 |
| Class Z | |
| Net assets | $964,381,300 |
| Shares outstanding | 63,512,163 |
| Net asset value per share | $15.18 |
The accompanying Notes to Financial Statements are an integral part of this statement.
Multi-Manager Small Cap Equity Strategies Fund | Annual Report 2017
| 21 |
Statement of Operations
Year Ended August 31, 2017
| Net investment income | |
| Income: | |
| Dividends — unaffiliated issuers | $8,286,966 |
| Dividends — affiliated issuers | 139,143 |
| Interest | 1,038 |
| Non-cash dividends - unaffiliated issuers | 1,173,803 |
| Foreign taxes withheld | (21,127) |
| Total income | 9,579,823 |
| Expenses: | |
| Management services fees | 8,560,553 |
| Distribution and/or service fees | |
| Class A | 1,303,432 |
| Transfer agent fees | |
| Class A | 1,952,235 |
| Class Z(a) | 1,572,314 |
| Compensation of board members | 35,401 |
| Custodian fees | 71,191 |
| Printing and postage fees | 279,358 |
| Registration fees | 59,108 |
| Audit fees | 33,498 |
| Legal fees | 26,175 |
| Compensation of chief compliance officer | 396 |
| Other | 48,380 |
| Total expenses | 13,942,041 |
| Fees waived or expenses reimbursed by Investment Manager and its affiliates | (2,192,588) |
| Total net expenses | 11,749,453 |
| Net investment loss | (2,169,630) |
| Realized and unrealized gain (loss) — net | |
| Net realized gain (loss) on: | |
| Investments — unaffiliated issuers | 101,040,539 |
| Investments — affiliated issuers | (1,582) |
| Net realized gain | 101,038,957 |
| Net change in unrealized appreciation (depreciation) on: | |
| Investments — unaffiliated issuers | 36,188,507 |
| Investments — affiliated issuers | 38 |
| Net change in unrealized appreciation (depreciation) | 36,188,545 |
| Net realized and unrealized gain | 137,227,502 |
| Net increase in net assets resulting from operations | $135,057,872 |
| (a) | Class Z shares are based on operations from January 3, 2017 (commencement of operations) through the stated period end. |
The accompanying Notes to Financial Statements are an integral part of this statement.
| 22 | Multi-Manager Small Cap Equity Strategies Fund | Annual Report 2017 |
Statement of Changes in Net Assets
| | Year Ended
August 31, 2017 | Year Ended
August 31, 2016 |
| Operations | | |
| Net investment loss | $(2,169,630) | $(42,169) |
| Net realized gain (loss) | 101,038,957 | (14,110,022) |
| Net change in unrealized appreciation (depreciation) | 36,188,545 | 73,615,463 |
| Net increase in net assets resulting from operations | 135,057,872 | 59,463,272 |
| Distributions to shareholders | | |
| Net investment income | | |
| Class A | (715,704) | — |
| Net realized gains | | |
| Class A | (11,307,853) | (28,524,836) |
| Total distributions to shareholders | (12,023,557) | (28,524,836) |
| Decrease in net assets from capital stock activity | (103,971,871) | (420,616,448) |
| Total increase (decrease) in net assets | 19,062,444 | (389,678,012) |
| Net assets at beginning of year | 950,596,601 | 1,340,274,613 |
| Net assets at end of year | $969,659,045 | $950,596,601 |
| Excess of distributions over net investment income | $(97,155) | $(621,339) |
The accompanying Notes to Financial Statements are an integral part of this statement.
Multi-Manager Small Cap Equity Strategies Fund | Annual Report 2017
| 23 |
Statement of Changes in Net Assets (continued)
| | Year Ended | Year Ended |
| | August 31, 2017 (a) | August 31, 2016 |
| | Shares | Dollars ($) | Shares | Dollars ($) |
| Capital stock activity |
| Class A | | | | |
| Subscriptions | 8,100,484 | 116,177,389 | 22,401,596 | 275,029,786 |
| Distributions reinvested | 813,499 | 12,023,520 | 2,330,456 | 28,524,783 |
| Redemptions | (79,570,365) | (1,163,521,713) | (58,523,127) | (724,171,017) |
| Net decrease | (70,656,382) | (1,035,320,804) | (33,791,075) | (420,616,448) |
| Class Z | | | | |
| Subscriptions | 69,535,667 | 1,020,885,223 | — | — |
| Redemptions | (6,023,504) | (89,536,290) | — | — |
| Net increase | 63,512,163 | 931,348,933 | — | — |
| Total net decrease | (7,144,219) | (103,971,871) | (33,791,075) | (420,616,448) |
| (a) | Class Z shares are based on operations from January 3, 2017 (commencement of operations) through the stated period end. |
The accompanying Notes to Financial Statements are an integral part of this statement.
| 24 | Multi-Manager Small Cap Equity Strategies Fund | Annual Report 2017 |
[THIS PAGE INTENTIONALLY LEFT BLANK]
Multi-Manager Small Cap Equity Strategies Fund | Annual Report 2017
| 25 |
The following table is intended to help you understand the Fund’s financial performance. Certain information reflects financial results for a single share of a class held for the periods shown. Per share net investment income (loss) amounts are calculated based on average shares outstanding during the period. Total return assumes reinvestment of all dividends and distributions, if any. Total return does not reflect payment of sales charges, if any. Total return and portfolio turnover are not annualized for periods of less than one year. The portfolio turnover rate is calculated without regard to purchase and sales transactions of short-term instruments and certain derivatives, if any. If such transactions were included, the Fund’s portfolio turnover rate may be higher.
| Year ended | Net asset value,
beginning of
period | Net
investment
income
(loss) | Net
realized
and
unrealized
gain | Total from
investment
operations | Distributions
from net
investment
income | Distributions
from net
realized
gains |
| Class A |
| 8/31/2017 | $13.39 | (0.02) | 2.04 | 2.02 | (0.01) | (0.17) |
| 8/31/2016 | $12.79 | (0.00) (c) | 0.86 | 0.86 | — | (0.26) |
| 8/31/2015 | $13.68 | (0.05) | 0.28 (d) | 0.23 | — | (1.12) |
| 8/31/2014 | $12.73 | (0.07) | 1.86 | 1.79 | — | (0.84) |
| 8/31/2013 | $10.07 | 0.03 | 2.69 | 2.72 | (0.06) | — |
| Class Z |
| 8/31/2017 (f) | $14.60 | (0.04) (c) | 0.62 | 0.58 | — | — |
| Notes to Financial Highlights |
| (a) | In addition to the fees and expenses that the Fund bears directly, the Fund indirectly bears a pro rata share of the fees and expenses of any other funds in which it invests. Such indirect expenses are not included in the Fund’s reported expense ratios. |
| (b) | Total net expenses include the impact of certain fee waivers/expense reimbursements made by the Investment Manager and certain of its affiliates, if applicable. |
| (c) | Rounds to zero. |
| (d) | Calculation of the net gain (loss) per share (both realized and unrealized) does not correlate to the aggregate realized and unrealized gain (loss) presented in the Statement of Operations due to the timing of subscriptions and redemptions of Fund shares in relation to fluctuations in the market value of the portfolio. |
| (e) | Ratios include line of credit interest expense which is less than 0.01%. |
| (f) | Class Z shares commenced operations on January 3, 2017. Per share data and total return reflect activity from that date. |
| (g) | Annualized. |
The accompanying Notes to Financial Statements are an integral part of this statement.
| 26 | Multi-Manager Small Cap Equity Strategies Fund | Annual Report 2017 |
Total
distributions to
shareholders | Net
asset
value,
end of
period | Total
return | Total gross
expense
ratio to
average
net assets(a) | Total net
expense
ratio to
average
net assets(a),(b) | Net investment
income (loss)
ratio to
average
net assets | Portfolio
turnover | Net
assets,
end of
period
(000’s) |
| |
| (0.18) | $15.23 | 15.12% | 1.59% | 1.36% | (0.12%) | 85% | $5,278 |
| (0.26) | $13.39 | 6.91% | 1.52% | 1.38% | 0.00% (c) | 115% | $950,597 |
| (1.12) | $12.79 | 1.90% | 1.58% (e) | 1.37% (e) | (0.38%) | 75% | $1,340,275 |
| (0.84) | $13.68 | 14.28% | 1.57% | 1.34% | (0.48%) | 73% | $628,100 |
| (0.06) | $12.73 | 27.11% | 1.63% | 1.34% | (0.30%) | 97% | $570,786 |
| |
| — | $15.18 | 3.97% | 1.33% (g) | 1.09% (g) | (0.37%) (g) | 85% | $964,381 |
Multi-Manager Small Cap Equity Strategies Fund | Annual Report 2017
| 27 |
Notes to Financial Statements
August 31, 2017
Note 1. Organization
Multi-Manager Small Cap Equity Strategies Fund (formerly known as Active Portfolios® Mutli-Manager Small Cap Equity Fund) (the Fund), a series of Columbia Funds Series Trust I (the Trust), is a diversified fund. The Trust is registered under the Investment Company Act of 1940, as amended (the 1940 Act), as an open-end management investment company organized as a Massachusetts business trust.
Fund shares
The Trust may issue an unlimited number of shares (without par value). The Fund is offered only through certain wrap fee programs sponsored and/or managed by Ameriprise Financial, Inc. (Ameriprise Financial) or its affiliates. The Fund offers each of the share classes identified below.
Class A shares are not subject to any front-end sales charge or contingent deferred sales charge.
Class Z shares are not subject to any front-end sales charge or contingent deferred sales charge. Class Z shares commenced operations on January 3, 2017. Effective November 1, 2017, Class Z shares will be renamed Institutional Class shares.
Note 2. Summary of significant accounting policies
Basis of preparation
The Fund is an investment company that applies the accounting and reporting guidance in the Financial Accounting Standards Board (FASB) Accounting Standards Codification Topic 946, Financial Services - Investment Companies (ASC 946). The financial statements are prepared in accordance with U.S. generally accepted accounting principles (GAAP), which requires management to make certain estimates and assumptions that affect the reported amounts of assets and liabilities, the disclosure of contingent assets and liabilities at the date of the financial statements and the reported amounts of income and expenses during the reporting period. Actual results could differ from those estimates. The Fund received a reimbursement for expenses overbilled by a third party. Such reimbursement is included as an offset to other expenses on the Statement of Operations. All fee waivers and expense reimbursements by Columbia Management Investment Advisers, LLC and its affiliates were applied before giving effect to the third party reimbursement.
The following is a summary of significant accounting policies followed by the Fund in the preparation of its financial statements.
Security valuation
All equity securities and exchange-traded funds are valued at the close of business of the New York Stock Exchange. Equity securities and exchange-traded funds are valued at the last quoted sales price on the principal exchange or market on which they trade, except for securities traded on the NASDAQ Stock Market, which are valued at the NASDAQ official close price. Unlisted securities or listed securities for which there were no sales during the day are valued at the mean of the latest quoted bid and ask prices on such exchanges or markets.
Foreign equity securities are valued based on the closing price on the foreign exchange in which such securities are primarily traded. If any foreign equity security closing prices are not readily available, the securities are valued at the mean of the latest quoted bid and ask prices on such exchanges or markets. Foreign currency exchange rates are generally determined at 4:00 p.m. Eastern (U.S.) time. Many securities markets and exchanges outside the U.S. close prior to the close of the New York Stock Exchange; therefore, the closing prices for securities in such markets or on such exchanges may not fully reflect events that occur after such close but before the close of the New York Stock Exchange. In those situations, foreign securities will be fair valued pursuant to a policy adopted by the Board of Trustees, including, if available, utilizing a third party pricing service to determine these fair values. The third party pricing service takes into account multiple factors, including, but not limited to, movements in the U.S. securities markets, certain depositary receipts, futures contracts and foreign exchange rates that have occurred subsequent to the close of the foreign exchange or market, to determine a good faith estimate that reasonably reflects the current market conditions as of the close of the New York Stock Exchange. The fair value of a security is likely to be different from the quoted or published price, if available.
| 28 | Multi-Manager Small Cap Equity Strategies Fund | Annual Report 2017 |
Notes to Financial Statements (continued)
August 31, 2017
Investments in open-end investment companies, including money market funds, are valued at their latest net asset value.
Investments for which market quotations are not readily available, or that have quotations which management believes are not reflective of market value or reliable, are valued at fair value as determined in good faith under procedures approved by and under the general supervision of the Board of Trustees. If a security or class of securities (such as foreign securities) is valued at fair value, such value is likely to be different from the quoted or published price for the security.
The determination of fair value often requires significant judgment. To determine fair value, management may use assumptions including but not limited to future cash flows and estimated risk premiums. Multiple inputs from various sources may be used to determine fair value.
GAAP requires disclosure regarding the inputs and valuation techniques used to measure fair value and any changes in valuation inputs or techniques. In addition, investments shall be disclosed by major category. This information is disclosed following the Fund’s Portfolio of Investments.
Security transactions
Security transactions are accounted for on the trade date. Cost is determined and gains (losses) are based upon the specific identification method for both financial statement and federal income tax purposes.
Income recognition
Corporate actions and dividend income are recorded on the ex-dividend date.
Non-cash dividends received in the form of stock are recorded as dividend income at fair value.
The Fund may receive distributions from holdings in equity securities, business development companies (BDCs), exchange-traded funds (ETFs), limited partnerships (LPs), other regulated investment companies (RICs), and real estate investment trusts (REITs), which report information on the tax character of their distributions annually. These distributions are allocated to dividend income, capital gain and return of capital based on actual information reported. Return of capital is recorded as a reduction of the cost basis of securities held. If the Fund no longer owns the applicable securities, return of capital is recorded as a realized gain. With respect to REITs, to the extent actual information has not yet been reported, estimates for return of capital are made by the Fund’s management. Management’s estimates are subsequently adjusted when the actual character of the distributions is disclosed by the REITs, which could result in a proportionate change in return of capital to shareholders.
Awards from class action litigation are recorded as a reduction of cost basis if the Fund still owns the applicable securities on the payment date. If the Fund no longer owns the applicable securities, the proceeds are recorded as realized gains.
Expenses
General expenses of the Trust are allocated to the Fund and other funds of the Trust based upon relative net assets or other expense allocation methodologies determined by the nature of the expense. Expenses directly attributable to the Fund are charged to the Fund. Expenses directly attributable to a specific class of shares are charged to that share class.
Determination of class net asset value
All income, expenses (other than class-specific expenses, which are charged to that share class, as shown in the Statement of Operations) and realized and unrealized gains (losses) are allocated to each class of the Fund on a daily basis, based on the relative net assets of each class, for purposes of determining the net asset value of each class.
Multi-Manager Small Cap Equity Strategies Fund | Annual Report 2017
| 29 |
Notes to Financial Statements (continued)
August 31, 2017
Federal income tax status
The Fund intends to qualify each year as a regulated investment company under Subchapter M of the Internal Revenue Code, as amended, and will distribute substantially all of its taxable income (including net short-term capital gains) and capital gains, if any, for its tax year, and as such will not be subject to federal income taxes. In addition, the Fund intends to distribute in each calendar year substantially all of its net investment income, capital gains and certain other amounts, if any, such that the Fund should not be subject to federal excise tax. Therefore, no federal income or excise tax provision is recorded.
Foreign taxes
The Fund may be subject to foreign taxes on income, gains on investments or currency repatriation, a portion of which may be recoverable. The Fund will accrue such taxes and recoveries, as applicable, based upon its current interpretation of tax rules and regulations that exist in the markets in which it invests.
Realized gains in certain countries may be subject to foreign taxes at the Fund level, based on statutory rates. The Fund accrues for such foreign taxes on realized and unrealized gains at the appropriate rate for each jurisdiction, as applicable. The amount, if any, is disclosed as a liability on the Statement of Assets and Liabilities.
Distributions to shareholders
Distributions from net investment income, if any, are declared and paid annually. Net realized capital gains, if any, are distributed along with the income distribution. Income distributions and capital gain distributions are determined in accordance with federal income tax regulations, which may differ from GAAP.
Guarantees and indemnifications
Under the Trust’s organizational documents and, in some cases, by contract, its officers and trustees are indemnified against certain liabilities arising out of the performance of their duties to the Trust or its funds. In addition, certain of the Fund’s contracts with its service providers contain general indemnification clauses. The Fund’s maximum exposure under these arrangements is unknown since the amount of any future claims that may be made against the Fund cannot be determined, and the Fund has no historical basis for predicting the likelihood of any such claims.
Recent accounting pronouncement
Accounting Standards Update 2017-08 Premium Amortization on Purchased Callable Debt Securities
In March 2017, the Financial Accounting Standards Board issued Accounting Standards Update (ASU) No. 2017-08 Premium Amortization on Purchased Callable Debt Securities. ASU No. 2017-08 updates the accounting standards to shorten the amortization period for certain purchased callable debt securities, held at a premium, to be amortized to the earliest call date. The update applies to securities with explicit, noncontingent call features that are callable at fixed prices and on preset dates. The standard is effective for annual periods beginning after December 15, 2018 and interim periods within those fiscal years. At this time, management is evaluating the implication of this guidance and the impact it will have on the financial statement amounts and footnote disclosures, if any.
Note 3. Fees and other transactions with affiliates
Management services fees
The Fund has entered into a Management Agreement with Columbia Management Investment Advisers, LLC (the Investment Manager), a wholly-owned subsidiary of Ameriprise Financial, Inc. (Ameriprise Financial). Under the Management Agreement, the Investment Manager provides the Fund with investment research and advice, as well as administrative and accounting services. The Investment Manager is responsible for the ultimate oversight of investments made by the Fund. The Fund’s subadvisers (see Subadvisory agreement below) have the primary responsibility for the day-to-day portfolio management of their portion of the Fund. The management services fee is an annual fee that is equal to a percentage of the Fund’s daily net assets that declines from 0.87% to 0.75% as the Fund’s net assets increase. Prior to July 1, 2017, the management services
| 30 | Multi-Manager Small Cap Equity Strategies Fund | Annual Report 2017 |
Notes to Financial Statements (continued)
August 31, 2017
fee was an annual fee that was equal to a percentage of the Fund’s daily net assets that declined from 0.98% to 0.85% as the Fund’s net assets increased. The effective management services fee rate for the year ended August 31, 2017 was 0.90% of the Fund’s average daily net assets.
Subadvisory agreement
The Investment Manager has entered into Subadvisory Agreements with Conestoga Capital Advisors, LLC, Dalton, Greiner, Hartman, Maher & Co., LLC (DGHM), EAM Investors, LLC and BMO Asset Management Corp., with each serving as a subadviser to the Fund. In addition, Real Estate Management Services Group, LLC provides advisory services with respect to REITs in DGHM’s sleeve of investments. New investments in the Fund, net of any redemptions, are allocated in accordance with the Investment Manager’s determination, subject to the oversight of the Fund’s Board of Trustees. Each subadviser’s proportionate share of investments in the Fund will vary due to market fluctuations. The Investment Manager compensates each subadviser to manage the investment of the Fund’s assets.
Compensation of board members
Members of the Board of Trustees, who are not officers or employees of the Investment Manager or Ameriprise Financial, are compensated for their services to the Fund as disclosed in the Statement of Operations. These members of the Board of Trustees may participate in a Deferred Compensation Plan (the Plan) which may be terminated at any time. Obligations of the Plan will be paid solely out of the Fund’s assets, and all amounts payable under the Plan constitute a general unsecured obligation of the Fund.
Compensation of Chief Compliance Officer
The Board of Trustees has appointed a Chief Compliance Officer to the Fund in accordance with federal securities regulations. A portion of the Chief Compliance Officer’s total compensation is allocated to the Fund, along with other affiliated funds governed by the Board of Trustees, based on relative net assets. The total amount allocated to all affiliated funds governed by the Board of Trustees will not exceed $40,000 annually.
Transfer agency fees
Under a Transfer and Dividend Disbursing Agent Agreement, Columbia Management Investment Services Corp. (the Transfer Agent), an affiliate of the Investment Manager and a wholly-owned subsidiary of Ameriprise Financial, is responsible for providing transfer agency services to the Fund. The Transfer Agent has contracted with Boston Financial Data Services (BFDS) to serve as sub-transfer agent. The Transfer Agent pays the fees of BFDS for services as sub-transfer agent and BFDS is not entitled to reimbursement for such fees from the Fund (with the exception of out-of-pocket fees).
The Fund pays the Transfer Agent a monthly transfer agency fee based on the number or the average value of accounts, depending on the type of account. In addition, prior to October 1, 2016, the Transfer Agent also received sub-transfer agency fees based on a percentage of the average aggregate value of the Fund’s shares maintained in omnibus accounts (other than omnibus accounts for which American Enterprise Investment Services Inc. is the broker of record or accounts where the beneficial shareholder is a customer of Ameriprise Financial Services, Inc., for which the Transfer Agent receives a per account fee). Effective October 1, 2016, the Fund pays the Transfer Agent a fee for shareholder services based on the number of accounts or on a percentage of the average aggregate value of the Fund’s shares maintained in omnibus accounts up to the lesser of the amount charged by the financial intermediary or a cap established by the Board of Trustees from time to time.
The Transfer Agent also receives compensation from the Fund for various shareholder services and reimbursements for certain out-of-pocket fees.
For the year ended August 31, 2017, the Fund’s effective transfer agency fee rates as a percentage of average daily net assets of each class were as follows:
| | Effective rate (%) |
| Class A | 0.37 |
| Class Z | 0.37 (a) |
Multi-Manager Small Cap Equity Strategies Fund | Annual Report 2017
| 31 |
Notes to Financial Statements (continued)
August 31, 2017
Distribution and service fees
The Fund has entered into an agreement with Columbia Management Investment Distributors, Inc. (the Distributor), an affiliate of the Investment Manager and a wholly-owned subsidiary of Ameriprise Financial, for distribution and shareholder services. The Board of Trustees has approved, and the Fund has adopted, distribution and shareholder service plans (the Plans) applicable to certain share classes, which set the distribution and service fees for the Fund. These fees are calculated daily and are intended to compensate the Distributor and/or eligible selling and/or servicing agents for selling shares of the Fund and providing services to investors.
The Fund may pay distribution fee of up to 0.25% of the Fund’s average daily net assets attributable to Class A shares and a service fee of up to 0.25% of the Fund’s average daily net assets attributable to Class A shares, provided that the aggregate fee shall not exceed 0.25% of the Fund’s average daily net assets attributable to Class A shares.
Expenses waived/reimbursed by the Investment Manager and its affiliates
The Investment Manager and certain of its affiliates have contractually agreed to waive fees and/or reimburse expenses (excluding certain fees and expenses described below) for the period(s) disclosed below, unless sooner terminated at the sole discretion of the Board of Trustees, so that the Fund’s net operating expenses, after giving effect to fees waived/expenses reimbursed and any balance credits and/or overdraft charges from the Fund’s custodian, do not exceed the following annual rate(s) as a percentage of the class’ average daily net assets:
| | January 1, 2017
through
December 31, 2017 | Prior to
January 1, 2017 |
| Class A | 1.34% | 1.38% |
| Class Z | 1.09* | — |
*Expense cap rate is contractual from January 3, 2017 (the commencement of operations of Class Z shares) through December 31, 2017.
Under the agreement governing these fee waivers and/or expense reimbursement arrangements, the following fees and expenses are excluded from the waiver/reimbursement commitment, and therefore will be paid by the Fund, if applicable: taxes (including foreign transaction taxes), expenses associated with investments in affiliated and non-affiliated pooled investment vehicles (including mutual funds and exchange-traded funds), transaction costs and brokerage commissions, costs related to any securities lending program, dividend expenses associated with securities sold short, inverse floater program fees and expenses, transaction charges and interest on borrowed money, interest, infrequent and/or unusual expenses and any other expenses the exclusion of which is specifically approved by the Board of Trustees. This agreement may be modified or amended only with approval from the Investment Manager, certain of its affiliates and the Fund. Any fees waived and/or expenses reimbursed under the expense reimbursement arrangements described above are not recoverable by the Investment Manager or its affiliates in future periods.
Note 4. Federal tax information
The timing and character of income and capital gain distributions are determined in accordance with income tax regulations, which may differ from GAAP because of temporary or permanent book to tax differences.
At August 31, 2017, these differences are primarily due to differing treatment for deferral/reversal of wash sale losses, passive foreign investment company (PFIC) holdings, trustees’ deferred compensation, distribution reclassifications, net operating loss reclassification and earnings and profits distributed to shareholders on the redemption of shares. To the extent these differences are permanent, reclassifications are made among the components of the Fund’s net assets in the Statement of Assets and Liabilities. Temporary differences do not require reclassifications.
In the Statement of Assets and Liabilities the following reclassifications were made:
Excess of distributions
over net investment
income ($) | Accumulated
net realized
gain ($) | Paid in
capital ($) |
| 3,409,518 | (9,444,996) | 6,035,478 |
| 32 | Multi-Manager Small Cap Equity Strategies Fund | Annual Report 2017 |
Notes to Financial Statements (continued)
August 31, 2017
Net investment income (loss) and net realized gains (losses), as disclosed in the Statement of Operations, and net assets were not affected by this reclassification.
The tax character of distributions paid during the years indicated was as follows:
| August 31, 2017 | August 31, 2016 |
Ordinary
income ($) | Long-term
capital gains ($) | Total ($) | Ordinary
income ($) | Long-term
capital gains ($) | Total ($) |
| 6,057,348 | 5,966,209 | 12,023,557 | — | 28,524,836 | 28,524,836 |
Short-term capital gain distributions, if any, are considered ordinary income distributions for tax purposes.
At August 31, 2017, the components of distributable earnings on a tax basis were as follows:
Undistributed
ordinary income ($) | Undistributed
long-term
capital gains ($) | Capital loss
carryforwards ($) | Net unrealized
appreciation ($) |
| 23,569,173 | 56,738,328 | — | 132,329,083 |
At August 31, 2017, the cost of all investments for federal income tax purposes along with the aggregate gross unrealized appreciation and depreciation based on that cost was:
Federal
tax cost ($) | Gross unrealized
appreciation ($) | Gross unrealized
(depreciation) ($) | Net unrealized
appreciation ($) |
| 840,397,274 | 159,272,402 | (26,943,319) | 132,329,083 |
Tax cost of investments and unrealized appreciation/(depreciation) may also include timing differences that do not constitute adjustments to tax basis.
Management of the Fund has concluded that there are no significant uncertain tax positions in the Fund that would require recognition in the financial statements. However, management’s conclusion may be subject to review and adjustment at a later date based on factors including, but not limited to, new tax laws, regulations, and administrative interpretations (including relevant court decisions). Generally, the Fund’s federal tax returns for the prior three fiscal years remain subject to examination by the Internal Revenue Service.
Note 5. Portfolio information
The cost of purchases and proceeds from sales of securities, excluding short-term investments and derivatives, if any, aggregated to $784,864,718 and $916,398,816, respectively, for the year ended August 31, 2017. The amount of purchase and sale activity impacts the portfolio turnover rate reported in the Financial Highlights.
Note 6. Affiliated money market fund
The Fund invests in Columbia Short-Term Cash Fund, an affiliated money market fund established for the exclusive use by the Fund and other affiliated funds (the Affiliated MMF). The income earned by the Fund from such investments is included as Dividends - affiliated issuers in the Statement of Operations. As an investing fund, the Fund indirectly bears its proportionate share of the expenses of the Affiliated MMF. Effective October 1, 2016, the Affiliated MMF prices its shares with a floating net asset value (NAV) and no longer seeks to maintain a stable NAV. In addition, the Board of Trustees of the Affiliated MMF may impose a fee on redemptions (sometimes referred to as a liquidity fee) or temporarily suspend redemptions (sometimes referred to as imposing a redemption gate) in the event its liquidity falls below regulatory limits.
Note 7. Line of credit
The Fund has access to a revolving credit facility with a syndicate of banks led by Citibank, N.A., HSBC Bank USA, N.A. and JPMorgan Chase Bank, N.A. whereby the Fund may borrow for the temporary funding of shareholder redemptions or for other temporary or emergency purposes. The credit facility, which is a collective agreement between the Fund and certain other funds managed by the Investment Manager, severally and not jointly, permits collective borrowings up to $1 billion. Interest is
Multi-Manager Small Cap Equity Strategies Fund | Annual Report 2017
| 33 |
Notes to Financial Statements (continued)
August 31, 2017
charged to each participating fund based on its borrowings at a rate equal to the higher of (i) the overnight federal funds rate plus 1.00% or (ii) the one-month LIBOR rate plus 1.00%. Each borrowing under the credit facility matures no later than 60 days after the date of borrowing. The Fund also pays a commitment fee equal to its pro rata share of the amount of the credit facility at a rate of 0.15% per annum. The commitment fee is included in other expenses in the Statement of Operations.
The Fund had no borrowings during the year ended August 31, 2017.
Note 8. Significant risks
Shareholder concentration risk
At August 31, 2017, affiliated shareholders of record owned 100.0% of the outstanding shares of the Fund in one or more accounts. Subscription and redemption activity by concentrated accounts may have a significant effect on the operations of the Fund. In the case of a large redemption, the Fund may be forced to sell investments at inopportune times, including its liquid positions, which may result in Fund losses and the Fund holding a higher percentage of less liquid positions. Large redemptions could result in decreased economies of scale and increased operating expenses for non-redeeming Fund shareholders.
Note 9. Subsequent events
Management has evaluated the events and transactions that have occurred through the date the financial statements were issued. Other than as noted in Note 1 above, there were no items requiring adjustment of the financial statements or additional disclosure.
Note 10. Information regarding pending and settled legal proceedings
Ameriprise Financial and certain of its affiliates have historically been involved in a number of legal, arbitration and regulatory proceedings, including routine litigation, class actions, and governmental actions, concerning matters arising in connection with the conduct of their business activities. Ameriprise Financial believes that the Fund is not currently the subject of, and that neither Ameriprise Financial nor any of its affiliates are the subject of, any pending legal, arbitration or regulatory proceedings that are likely to have a material adverse effect on the Fund or the ability of Ameriprise Financial or its affiliates to perform under their contracts with the Fund. Ameriprise Financial is required to make quarterly (10-Q), annual (10-K) and, as necessary, 8-K filings with the Securities and Exchange Commission (SEC) on legal and regulatory matters that relate to Ameriprise Financial and its affiliates. Copies of these filings may be obtained by accessing the SEC website at www.sec.gov.
There can be no assurance that these matters, or the adverse publicity associated with them, will not result in increased Fund redemptions, reduced sale of Fund shares or other adverse consequences to the Fund. Further, although we believe proceedings are not likely to have a material adverse effect on the Fund or the ability of Ameriprise Financial or its affiliates to perform under their contracts with the Fund, these proceedings are subject to uncertainties and, as such, we are unable to estimate the possible loss or range of loss that may result. An adverse outcome in one or more of these proceedings could result in adverse judgments, settlements, fines, penalties or other relief that could have a material adverse effect on the consolidated financial condition or results of operations of Ameriprise Financial.
| 34 | Multi-Manager Small Cap Equity Strategies Fund | Annual Report 2017 |
Report of Independent Registered Public Accounting Firm
To the Trustees of Columbia Funds Series Trust I and the Shareholders of Multi-Manager Small Cap Equity Strategies Fund
In our opinion, the accompanying statement of assets and liabilities, including the portfolio of investments, and the related statements of operations and of changes in net assets and the financial highlights present fairly, in all material respects, the financial position of Multi-Manager Small Cap Equity Strategies Fund (the “Fund”, a series of Columbia Funds Series Trust I) as of August 31, 2017, the results of its operations for the year then ended, the changes in its net assets for each of the two years in the period then ended and the financial highlights for each of the five years in the period then ended, in conformity with accounting principles generally accepted in the United States of America. These financial statements and financial highlights (hereafter referred to as “financial statements”) are the responsibility of the Fund’s management. Our responsibility is to express an opinion on these financial statements based on our audits. We conducted our audits of these financial statements in accordance with the standards of the Public Company Accounting Oversight Board (United States). Those standards require that we plan and perform the audit to obtain reasonable assurance about whether the financial statements are free of material misstatement. An audit includes examining, on a test basis, evidence supporting the amounts and disclosures in the financial statements, assessing the accounting principles used and significant estimates made by management, and evaluating the overall financial statement presentation. We believe that our audits, which included confirmation of securities as of August 31, 2017 by correspondence with the custodian, brokers and transfer agent provide a reasonable basis for our opinion.
/s/ PricewaterhouseCoopers LLP
Minneapolis, MN
October 20, 2017
Multi-Manager Small Cap Equity Strategies Fund | Annual Report 2017
| 35 |
Federal Income Tax Information
(Unaudited)
The Fund hereby designates the following tax attributes for the fiscal year ended August 31, 2017. Shareholders will be notified in early 2018 of the amounts for use in preparing 2017 income tax returns.
Qualified
dividend
income | Dividends
received
deduction | Capital
gain
dividend |
| 28.69% | 28.25% | $66,079,543 |
Qualified dividend income. For taxable, non-corporate shareholders, the percentage of ordinary income distributed during the fiscal year that represents qualified dividend income subject to reduced tax rates.
Dividends received deduction. The percentage of ordinary income distributed during the fiscal year that qualifies for the corporate dividends received deduction.
Capital gain dividend. The Fund designates as a capital gain dividend the amount reflected above, or if subsequently determined to be different, the net capital gain of such fiscal period.
The Fund also here by designates an additional capital gain dividend of $1,480,768 attributable to the fiscal year ended August 31, 2016, or if subsequently determined to be different, the net capital gain of such fiscal period.
| 36 | Multi-Manager Small Cap Equity Strategies Fund | Annual Report 2017 |
Shareholders elect the Board that oversees the Fund’s operations. The Board appoints officers who are responsible for day-to-day business decisions based on policies set by the Board. The following table provides basic biographical information about the Fund’s Trustees, including their principal occupations during the past five years, although specific titles for individuals may have varied over the period. The year set forth beneath Length of Service in the table below is the year in which the Trustee was first appointed or elected as Trustee to any Fund currently in the Columbia Funds Complex or a predecessor thereof. Under current Board policy, members serve terms of indefinite duration.
Independent trustees
| Name, address, year of birth | Position held with the Trust and length of service | Principal occupation(s) during the past five years and other relevant professional experience | Number of Funds in the Columbia Fund Complex overseen | Other directorships held by Trustee during the past five years |
Janet Langford Carrig
c/o Columbia Management
Investment Advisers, LLC
225 Franklin Street
Mail Drop BX32 05228
Boston, MA 02110
1957 | Trustee
1996 | Senior Vice President, General Counsel and Corporate Secretary, ConocoPhillips (independent energy company) since September 2007 | 57 | None |
Douglas A. Hacker
c/o Columbia Management
Investment Advisers, LLC
225 Franklin Street
Mail Drop BX32 05228
Boston, MA 02110
1955 | Trustee and Chairman of the Board
1996 | Independent business executive since May 2006; Executive Vice President — Strategy of United Airlines from December 2002 to May 2006; President of UAL Loyalty Services (airline marketing company) from September 2001 to December 2002; Executive Vice President and Chief Financial Officer of United Airlines from July 1999 to September 2001 | 57 | Spartan Nash Company, (food distributor); Nash Finch Company (food distributor) from 2005 to 2013; Aircastle Limited (aircraft leasing); SeaCube Container Leasing Ltd. (container leasing) from 2010 to 2013; and Travelport Worldwide Limited (travel information technology) |
Nancy T. Lukitsh
c/o Columbia Management
Investment Advisers, LLC
225 Franklin Street
Mail Drop BX32 05228
Boston, MA 02110
1956 | Trustee
2011 | Senior Vice President, Partner and Director of Marketing, Wellington Management Company, LLP (investment adviser) from 1997 to 2010; Chair, Wellington Management Portfolios (commingled non-U.S. investment pools) from 2007 to 2010; Director, Wellington Trust Company, NA and other Wellington affiliates from 1997 to 2010 | 57 | None |
David M. Moffett
c/o Columbia Management
Investment Advisers, LLC
225 Franklin Street
Mail Drop BX32 05228
Boston, MA 02110
1952 | Trustee
2011 | Retired. Consultant to Bridgewater and Associates | 57 | Director, CSX Corporation; Genworth Financial, Inc. (financial and insurance products and services); PayPal Holdings Inc. (payment and data processing services); Trustee, University of Oklahoma Foundation; former Director, eBay Inc. (online trading community), 2007-2015; and former Director, CIT Bank, CIT Group Inc. (commercial and consumer finance), 2010-2016 |
Multi-Manager Small Cap Equity Strategies Fund | Annual Report 2017
| 37 |
TRUSTEES AND OFFICERS (continued)
Independent trustees (continued)
| Name, address, year of birth | Position held with the Trust and length of service | Principal occupation(s) during the past five years and other relevant professional experience | Number of Funds in the Columbia Fund Complex overseen | Other directorships held by Trustee during the past five years |
Charles R. Nelson
c/o Columbia Management
Investment Advisers, LLC
225 Franklin Street
Mail Drop BX32 05228
Boston, MA 02110
1942 | Trustee
1981 | Retired. Professor Emeritus, University of Washington since 2011; Professor of Economics, University of Washington from 1976 to 2011; Ford and Louisa Van Voorhis Professor of Political Economy, University of Washington from 1993 to 2011; Adjunct Professor of Statistics, University of Washington from 1980 to 2011; Associate Editor, Journal of Money, Credit and Banking from September 1993 to 2008; consultant on econometric and statistical matters | 57 | None |
John J. Neuhauser
c/o Columbia Management
Investment Advisers, LLC
225 Franklin Street
Mail Drop BX32 05228
Boston, MA 02110
1943 | Trustee
1984 | President, Saint Michael’s College since August 2007; Director or Trustee of several non-profit organizations, including University of Vermont Medical Center; Academic Vice President and Dean of Faculties, Boston College from August 1999 to October 2005; University Professor, Boston College from November 2005 to August 2007 | 57 | Liberty All-Star Equity Fund and Liberty All- Star Growth Fund (closed-end funds) |
Patrick J. Simpson
c/o Columbia Management
Investment Advisers, LLC
225 Franklin Street
Mail Drop BX32 05228
Boston, MA 02110
1944 | Trustee
2000 | Of Counsel, Perkins Coie LLP (law firm) since 2015; Partner, Perkins Coie LLP from 1988 to 2014 | 57 | None |
Anne-Lee Verville
c/o Columbia Management
Investment Advisers, LLC
225 Franklin Street
Mail Drop BX32 05228
Boston, MA 02110
1945 | Trustee
1998 | Retired. General Manager, Global Education Industry from 1994 to 1997, President – Application Systems Division from 1991 to 1994, Chief Financial Officer – US Marketing & Services from 1988 to 1991, and Chief Information Officer from 1987 to 1988, IBM Corporation (computer and technology) | 57 | Enesco Group, Inc. (producer of giftware and home and garden decor products) from 2001 to 2006 |
| 38 | Multi-Manager Small Cap Equity Strategies Fund | Annual Report 2017 |
TRUSTEES AND OFFICERS (continued)
Consultants to the Independent Trustees*
| Name, address, year of birth | Position held with the Trust and length of service | Principal occupation(s) during the past five years and other relevant professional experience | Number of Funds in the Columbia Funds complex overseen | Other directorships held by Trustee during the past five years |
J. Kevin Connaughton
c/o Columbia
Management Investment
Advisers, LLC,
225 Franklin Street
Mail Drop BX32 05228,
Boston, MA 02110
1964 | Independent Trustee Consultant
2016 | Independent Trustee Consultant, Columbia Funds since March 2016; Managing Director and General Manager of Mutual Fund Products, Columbia Management Investment Advisers, LLC from May 2010 to February 2015; President, Columbia Funds from 2009 to 2015; and senior officer of Columbia Funds and affiliated funds from 2003 to 2015 | 57 | Board of Governors, Gateway Healthcare since January 2016; Trustee, New Century Portfolios since March 2015; and Director, The Autism Project since March 2015 |
Natalie A. Trunow
c/o Columbia
Management Investment
Advisers, LLC,
225 Franklin Street
Mail Drop BX32 05228,
Boston, MA 02110
1967 | Independent Trustee Consultant
2016 | Independent Trustee Consultant, Columbia Funds since September 2016; Chief Executive Officer, Millennial Partners (investment consulting services to institutions) since January 2016; Director of Investments, Casey Family Programs from April 2016 to September 2016; Senior Vice President and Chief Investment Officer, Calvert Investments from August 2008 to January 2016; Section Head and Portfolio Manager, General Motors Asset Management from June 1997 to August 2008 | 57 | Healthcare Services for Children with Special Needs |
| * | J. Kevin Connaughton was appointed consultant to the Independent Trustees effective March 1, 2016. Natalie A. Trunow was appointed consultant to the Independent Trustees effective September 1, 2016. Shareholders of the Funds are expected to be asked to elect each of Mr. Connaughton and Ms. Trunow as a Trustee at a future shareholder meeting. |
Interested trustee affiliated with Investment Manager*
| Name, address, year of birth | Position held with the Trust and length of service | Principal occupation(s) during the past five years and other relevant professional experience | Number of Funds in the Columbia Funds Complex overseen | Other directorships held by Trustee during the past five years |
William F. Truscott
c/o Columbia Management
Investment Advisers, LLC
225 Franklin Street
Boston, MA 02110
1960 | Trustee
2012 | Chairman of the Board and President, Columbia Management Investment Advisers, LLC since May 2010 and February 2012, respectively; Chief Executive Officer, Global Asset Management, Ameriprise Financial, Inc. since September 2012 (previously Chief Executive Officer, U.S. Asset Management & President, Annuities, May 2010-September 2012); Director and Chief Executive Officer, Columbia Management Investment Distributors, Inc. since May 2010 and February 2012, respectively; Chairman of the Board and Chief Executive Officer, RiverSource Distributors, Inc. since 2006; Director, Threadneedle Asset Management Holdings, SARL since 2014; President and Chief Executive Officer, Ameriprise Certificate Company, 2006-August 2012 | 179 | Chairman of the Board, Columbia Management Investment Advisers, LLC since May 2010; Director, Columbia Management Investment Distributors, Inc. since May 2010; former Director, Ameriprise Certificate Company, 2006 - January 2013 |
| * | Interested person (as defined under the 1940 Act) by reason of being an officer, director, security holder and/or employee of the Investment Manager or Ameriprise Financial. |
The Statement of Additional Information has additional information about the Fund’s Board members and is available,
without charge, upon request by calling 800.345.6611, contacting your financial intermediary or visiting
investor.columbiathreadneedleus.com.
Multi-Manager Small Cap Equity Strategies Fund | Annual Report 2017
| 39 |
TRUSTEES AND OFFICERS (continued)
The Board has appointed officers who are responsible for day-to-day business decisions based on policies it has established. The officers serve at the pleasure of the Board. The following table provides basic information about the Officers of the Fund, including principal occupations during the past five years, although their specific titles may have varied over the period. In addition to Mr. Truscott, who is Senior Vice President, the Fund’s other officers are:
Fund officers
Name,
address and
year of birth | Position and year
first appointed to
position for any Fund
in the Columbia
Funds complex or a
predecessor thereof | Principal occupation(s) during past five years |
Christopher O. Petersen
5228 Ameriprise
Financial Center
Minneapolis, MN 55474
Born 1970 | President and Principal Executive Officer (2015) | Vice President and Lead Chief Counsel, Ameriprise Financial, Inc. since January 2015 (previously, Vice President and Chief Counsel, January 2010 - December 2014; officer of Columbia Funds and affiliated funds since 2007. |
Michael G. Clarke
225 Franklin Street
Boston, MA 02110
Born 1969 | Treasurer (2011), Chief Financial Officer (2009) and Chief Accounting Officer (2015) | Vice President — Mutual Fund Administration, Columbia Management Investment Advisers, LLC, since May 2010; senior officer of Columbia Funds and affiliated funds since 2002. |
Paul B. Goucher
100 Park Avenue
New York, NY 10017
Born 1968 | Senior Vice President (2011) and Assistant Secretary (2008) | Senior Vice President and Assistant General Counsel, Ameriprise Financial, Inc. since January 2017 (previously Vice President and Lead Chief Counsel, November 2008 - January 2017 and January 2013 - January 2017, respectively; and Chief Counsel, January 2010 - January 2013); Vice President, Chief Legal Officer and Assistant Secretary, Columbia Management Investment Advisers, LLC since May 2010. |
Thomas P. McGuire
225 Franklin Street
Boston, MA 02110
Born 1972 | Senior Vice President and Chief Compliance Officer (2012) | Vice President — Asset Management Compliance, Ameriprise Financial, Inc., since May 2010; Chief Compliance Officer, Ameriprise Certificate Company since September 2010. |
Colin Moore
225 Franklin Street
Boston, MA 02110
Born 1958 | Senior Vice President (2010) | Executive Vice President and Global Chief Investment Officer, Ameriprise Financial, Inc., since July 2013; Executive Vice President and Global Chief Investment Officer, Columbia Management Investment Advisers, LLC since July 2013 (previously Director and Global Chief Investment Officer, 2010 - 2013). |
Ryan C. Larrenaga
225 Franklin Street
Boston, MA 02110
Born 1970 | Senior Vice President (2017), Chief Legal Officer (2017) and Secretary (2015) | Vice President and Group Counsel, Ameriprise Financial, Inc. since August 2011; officer of Columbia Funds and affiliated funds since 2005. |
Michael E. DeFao
225 Franklin Street
Boston, MA 02110
Born 1968 | Vice President (2011) and Assistant Secretary (2010) | Vice President and Chief Counsel, Ameriprise Financial, Inc. since May 2010. |
Amy Johnson
5228 Ameriprise
Financial Center
Minneapolis, MN 55474
Born 1965 | Vice President (2006) | Managing Director and Global Head of Operations, Columbia Management Investment Advisers, LLC since April 2016 (previously Managing Director and Chief Operating Officer, 2010 - 2016). |
Lyn Kephart-Strong
5228 Ameriprise
Financial Center
Minneapolis, MN 55474
Born 1960 | Vice President (2015) | President, Columbia Management Investment Services Corp. since October 2014; Vice President & Resolution Officer, Ameriprise Trust Company since August 2009. |
| 40 | Multi-Manager Small Cap Equity Strategies Fund | Annual Report 2017 |
Board Consideration and Approval of Advisory Agreements and Subadvisory Agreements
On June 14, 2017, the Board of Trustees (the Board) and the Trustees who are not interested persons (as defined in the Investment Company Act of 1940) (the Independent Trustees) of Columbia Funds Series Trust I (the Trust) unanimously approved the continuation of the Management Agreement (the Management Agreement) with Columbia Management Investment Advisers, LLC (the Investment Manager) and the Subadvisory Agreements (the Subadvisory Agreements) between the Investment Manager and BMO Asset Management Corp. (BMO), Conestoga Capital Advisers, LLC, Dalton, Greiner, Hartman, Maher & Co., LLC and EAM Investors, LLC (the Subadvisers) with respect to Multi-Manager Small Cap Equity Strategies Fund (the Fund), a series of the Trust. As detailed below, the Board’s Advisory Fees and Expenses Committee (the Committee) and the Board met on multiple occasions to review and discuss, both among themselves and with the management team of the Investment Manager, materials provided by the Investment Manager and others before determining to approve the continuation of the Management Agreement and the Subadvisory Agreements (collectively, the Agreements).
In connection with their deliberations regarding the continuation of the Management Agreement and the Subadvisory Agreements, the Committee and the Board evaluated materials requested from the Investment Manager regarding the Fund and the Agreements, and discussed these materials with representatives of the Investment Manager at Committee meetings held on March 27, 2017, April 26, 2017 and June 13, 2017 and at Board meetings held on March 28, 2017 and June 14, 2017. In addition, the Board considers matters bearing on the Agreements at most of its other meetings throughout the year and meets regularly with senior management of the Trust and the Investment Manager. Through the Board’s Investment Oversight Committees, Trustees also meet with selected portfolio managers of the funds the Trustees oversee and other investment personnel at various times throughout the year. The Committee and the Board also consulted with its independent fee consultant, Fund counsel and the Independent Trustees’ independent legal counsel, who advised on various matters with respect to the Committee’s and the Board’s considerations and otherwise assisted the Committee and the Board in their deliberations. On June 13, 2017, the Committee recommended that the Board approve the continuation of the Management Agreement and the Subadvisory Agreements. On June 14, 2017, the Board, including the Independent Trustees, voting separately, unanimously approved the continuation of the Management Agreement and the Subadvisory Agreements for the Fund.
The Committee and the Board considered all information that they, their legal counsel or the Investment Manager believed reasonably necessary to evaluate and to determine whether to recommend for approval or approve the continuation of the Management Agreement and the Subadvisory Agreements. The information and factors considered by the Committee and the Board in recommending for approval or approving the continuation of the Management Agreement and the Subadvisory Agreements for the Fund included the following:
| • | Information on the investment performance of the Fund relative to the performance of a group of mutual funds determined to be comparable to the Fund by an independent third-party data provider, as well as performance relative to benchmarks; |
| • | Information on the Fund’s management fees and total expenses, including information comparing the Fund’s expenses to those of a group of comparable mutual funds, as determined by the independent third-party data provider; |
| • | The Investment Manager’s agreement to contractually limit or cap total operating expenses for the Fund through December 31, 2018 so that total operating expenses (excluding certain fees and expenses, such as transaction costs and certain other investment related expenses, interest, taxes, acquired fund fees and expenses, and infrequent and/or unusual expenses) would not exceed a specified annual rate, as a percentage of the Fund’s net assets; |
| • | The terms and conditions of the Agreements; |
| • | The subadvisory fees payable by the Investment Manager under the Subadvisory Agreements; |
| • | The current and proposed terms and conditions of other agreements and arrangements with affiliates of the Investment Manager relating to the operations of the Fund, including agreements with respect to the provision of distribution, transfer agency and shareholder services to the Fund; |
| • | Descriptions of various functions performed by the Investment Manager and the Subadvisers under the Agreements, including portfolio management and portfolio trading practices; |
Multi-Manager Small Cap Equity Strategies Fund | Annual Report 2017
| 41 |
Board Consideration and Approval of Advisory Agreements and Subadvisory Agreements (continued)
| • | Information regarding the management fees of similarly-managed portfolios of other clients of the Investment Manager, including institutional separate accounts; |
| • | Information regarding the reputation, regulatory history and resources of the Investment Manager and the Subadvisers, including information regarding senior management, portfolio managers and other personnel; |
| • | Information regarding the capabilities of the Investment Manager and the Subadvisers with respect to compliance monitoring services, including an assessment of the Investment Manager’s and the Subadvisers’ compliance systems by the Fund’s Chief Compliance Officer; and |
| • | The profitability to the Investment Manager and its affiliates from their relationships with the Fund. |
Nature, extent and quality of services provided under the agreements
The Committee and the Board considered the nature, extent and quality of services provided to the Fund by the Investment Manager, the Subadvisers and the Investment Manager’s affiliates under the Agreements and under separate agreements for the provision of transfer agency and shareholder services, and the resources dedicated to the Fund and the other Columbia Funds by the Investment Manager, the Subadvisers and the Investment Manager’s affiliates. The Committee and the Board considered, among other things, the Investment Manager’s ability to attract, motivate and retain highly qualified research, advisory and supervisory investment professionals (including compensation programs for personnel involved in fund management, reputation and other attributes), the portfolio management services provided by those investment professionals, and the quality of the Investment Manager’s and each Subadviser’s investment research capabilities and trade execution services. The Committee and the Board also considered the potential benefits to shareholders of investing in a mutual fund that is part of a fund complex offering exposure to a variety of asset classes and investment disciplines and providing a variety of fund and shareholder services.
The Committee and the Board also considered the professional experience and qualifications of the senior personnel of the Investment Manager and the Subadvisers, which included consideration of the Investment Manager’s and the Subadvisers’ experience with similarly-structured funds. The Committee and the Board noted the compliance programs of and the compliance-related resources provided to the Fund by the Investment Manager and its affiliates, and considered the Investment Manager’s ability to provide administrative services to the Fund and coordinate the activities of the Fund’s other service providers. The Board also noted that the Board had approved the Subadvisers’ codes of ethics and compliance programs, and that the Chief Compliance Officer of the Funds reports to the Trustees on the Subadvisers’ compliance programs.
The Committee and the Board considered the diligence and selection process undertaken by the Investment Manager to select the Subadvisers, including the Investment Manager’s rationale for recommending the continuation of the Subadvisory Agreements, and the process for monitoring the Subadvisers’ ongoing performance of services for the Fund. As part of these deliberations, the Committee and the Board considered the ability of the Investment Manager, subject to the approval of the Board, to modify or enter into new subadvisory agreements without a shareholder vote pursuant to an exemptive order of the Securities and Exchange Commission. The Committee and the Board also considered the scope of services provided to the Fund by the Investment Manager that are distinct from and in addition to those provided by the Subadvisers, including cash flow management, treasury services, risk oversight, investment oversight and Subadviser selection, oversight and transition management. After reviewing these and related factors, the Committee and the Board concluded, within the context of their overall conclusions, that the nature, extent and quality of the services provided to the Fund under the Agreements supported the continuation of the Management Agreement and the Subadvisory Agreements.
Investment performance
The Committee and the Board reviewed information about the performance of the Fund over various time periods, including performance information relative to benchmarks and information that compared the performance of the Fund to the performance of a group of comparable mutual funds as determined by the independent third-party data provider, and data provided by the independent fee consultant. The Committee and the Board also reviewed a description of the third party’s methodology for identifying the Fund’s peer groups for purposes of performance and expense comparisons. Although the Fund’s performance lagged that of a relevant peer group for certain (although not necessarily all) periods, the Committee and
| 42 | Multi-Manager Small Cap Equity Strategies Fund | Annual Report 2017 |
Board Consideration and Approval of Advisory Agreements and Subadvisory Agreements (continued)
the Board concluded that other factors relevant to performance were sufficient, in light of other considerations, to warrant continuation of the Management Agreement and the Subadvisory Agreements. Those factors included one or more of the following: (i) that the Fund’s performance, although lagging in certain recent periods, was stronger over the longer term; (ii) that the underperformance was attributable, to a significant extent, to investment decisions that were reasonable and consistent with the Fund’s investment strategy and policies and that the Fund was performing within a reasonable range of expectations, given those investment decisions, market conditions and the Fund’s investment strategy; (iii) that the Fund’s performance was competitive when compared to other relevant performance benchmarks or peer groups; and (iv) that the Investment Manager had taken or was taking steps designed to help improve the Fund’s investment performance, including, but not limited to, replacing portfolio managers, enhancing the resources supporting the portfolio managers, or modifying investment strategies.
The Committee and the Board noted that, through December 31, 2016, the Fund’s performance was in the sixtieth and fifty-seventh percentile (where the best performance would be in the first percentile) of its category selected by the independent third-party data provider for the purposes of performance comparisons for the one- and three-year periods, respectively.
The Committee and the Board also considered the Investment Manager’s and Subadvisers’ performance and reputation generally, the Investment Manager’s historical responsiveness to Board concerns about performance, and the Investment Manager’s willingness to take steps intended to improve performance. After reviewing these and related factors, the Committee and the Board concluded, within the context of their overall conclusions, that the performance of the Fund, the Investment Manager and the Subadvisers were sufficient, in light of other considerations, to warrant the continuation of the Management Agreement and the Subadvisory Agreements.
Investment management fee rates and other expenses
The Committee and the Board considered the management fees charged to the Fund under the Management Agreement and the Subadvisory Agreements, as well as the total expenses incurred by the Fund. In assessing the reasonableness of the fees under the Management Agreement, the Committee and the Board considered, among other information, the Fund’s total expense ratio as a percentage of average daily net assets. The Committee and the Board considered data provided by the independent third-party data provider and by the independent fee consultant. The Committee and the Board noted that, as of December 31, 2016, the Fund’s actual management fee and net total expense ratio are ranked in the second and third quintiles, respectively, (where the lowest fees and expenses would be in the first quintile) against the Fund’s expense universe as determined by the independent third-party data provider for purposes of expense comparison. The Committee and the Board also considered the fees that the Subadvisers charge to their other clients, and noted that the Investment Manager pays the fees of the Subadvisers. The Committee and the Board also took into account the fee waiver and expense limitation arrangements agreed to by the Investment Manager, as noted above.
The Committee and the Board also received and considered information about the management fees charged by the Investment Manager to institutional separate accounts. In considering the fees charged to those accounts, the Committee and the Board took into account, among other things, the Investment Manager’s representations about the differences between managing mutual funds as compared to other types of accounts, including differences in the services provided, differences in the risk profile of such business for the Investment Manager and the additional resources required to manage mutual funds effectively. The Committee and the Board also received and considered information about the fees charged by the Investment Manager for sub-advisory services it provides to comparable unaffiliated funds. In evaluating the Fund’s management fees, the Committee and the Board also took into account the demands, complexity and quality of the investment management of the Fund.
After reviewing these and related factors, the Committee and the Board concluded, within the context of their overall conclusions, that the management fee rates and expenses of the Fund, in light of other considerations, warranted the continuation of the Management Agreement and the Subadvisory Agreements.
Costs of services provided and profitability
The Committee and the Board also took note of the costs the Investment Manager and its affiliates incur in connection with the services provided and the profitability to the Investment Manager and its affiliates from their relationships with the Fund.
Multi-Manager Small Cap Equity Strategies Fund | Annual Report 2017
| 43 |
Board Consideration and Approval of Advisory Agreements and Subadvisory Agreements (continued)
The Committee and the Board also considered the compensation directly or indirectly received by the Investment Manager’s affiliates in connection with their relationships with the Fund. The Committee and the Board reviewed information provided by management as to the profitability to the Investment Manager and its affiliates of their relationships with the Fund, information about the allocation of expenses used to calculate profitability, and comparisons of profitability levels realized in 2016 to profitability levels realized in 2015. When reviewing profitability, the Committee and the Board also considered court cases in which adviser profitability was an issue in whole or in part, the performance of similarly managed funds, the performance of the Fund, and the expense ratio of the Fund. In addition, the Committee and the Board considered information provided by the Investment Manager regarding the Investment Manager’s financial condition and comparing its profitability to that of other asset management firms that are, or are subsidiaries of, publicly traded companies. In this regard, the Committee and the Board also considered data provided by the independent fee consultant. Because the Subadvisory Agreements were negotiated at arms-length by the Investment Manager, which is responsible for payments to the Subadvisers thereunder, the Committee and the Board did not consider the profitability to each Subadviser of its relationship with the Fund.
After reviewing these and related factors, the Committee and the Board concluded, within the context of their overall conclusions, that the costs of services provided and the profitability to the Investment Manager and its affiliates from their relationships with the Fund supported the continuation of the Management Agreement and the Subadvisory Agreements.
Economies of scale
The Committee and the Board considered the potential existence of economies of scale in the provision by the Investment Manager of services to the Fund, to groups of related funds, and to the Investment Manager’s investment advisory clients as a whole, and whether those economies of scale were shared with the Fund through breakpoints in investment management fees or other means, such as expense limitation arrangements and additional investments by the Investment Manager in investment, trading, compliance and other resources. The Committee and the Board noted that the management fee schedules for the Fund contained breakpoints that would reduce the fee rate on assets above specified threshold levels.
The Committee and the Board noted that the breakpoints, if any, in the Subadvisory Agreements did not occur at the same levels as the breakpoints in the Management Agreement. The Committee and the Board noted that absent a shareholder vote, the Investment Manager would bear any increase in fees payable under the Subadvisory Agreements. The Committee and the Board also noted the potential challenges of seeking to tailor the Management Agreement breakpoints to those of a subadvisory agreement in this context, and the effect that capacity constraints on a subadviser’s ability to manage assets could potentially have on the ability of the Investment Manager to achieve economies of scale, as new subadvisers may need to be added as the Fund grows, increasing the Investment Manager’s cost of compensating and overseeing the Fund’s subadvisers.
In considering these matters, the Committee and the Board also considered the costs of the services provided and the profitability to the Investment Manager and its affiliates from their relationships with the Fund, as discussed above. After reviewing these and related factors, the Committee and the Board concluded, within the context of their overall conclusions, that the extent to which any economies of scale were expected to be shared with the Fund supported the continuation of the Management Agreement and the Subadvisory Agreements.
Other benefits to the Investment Manager and Subadvisers
The Committee and the Board received and considered information regarding “fall-out” or ancillary benefits received by the Investment Manager and its affiliates as a result of their relationships with the Fund, such as the engagement of the Investment Manager’s affiliates to provide distribution, transfer agency and shareholder services to the Fund. In this regard, among other matters, the Committee and the Board considered that the Fund’s distributor retains a portion of the distribution fees from the Fund and receives a portion of the sales charges on sales or redemptions of certain classes of shares of the Fund. The Committee and the Board also considered the benefits of research made available to the Investment Manager and the Subadvisers by reason of brokerage commissions generated by the Fund’s securities transactions, and reviewed information about the Investment Manager’s practices with respect to allocating portfolio transactions for brokerage and research services. The Committee and the Board recognized that the Investment Manager’s profitability would be somewhat lower without these benefits.
| 44 | Multi-Manager Small Cap Equity Strategies Fund | Annual Report 2017 |
Board Consideration and Approval of Advisory Agreements and Subadvisory Agreements (continued)
Conclusion
The Committee and the Board reviewed all of the above considerations in reaching their decisions to recommend or approve the continuation of the Management Agreement and the Subadvisory Agreements. In their deliberations, the Trustees did not identify any particular information that was all-important or controlling, and individual Trustees may have attributed different weights to the various factors. Based on their evaluation of all factors that they deemed to be material, including those factors described above, and assisted by the advice of independent legal counsel, the Board, including the Independent Trustees, voting separately, unanimously approved the continuation of the Management Agreement and the Subadvisory Agreements.
Multi-Manager Small Cap Equity Strategies Fund | Annual Report 2017
| 45 |
The Fund mails one shareholder report to each shareholder address. If you would like more than one report, please call shareholder services at 800.345.6611 and additional reports will be sent to you.
Proxy voting policies and procedures
The policy of the Board of Trustees is to vote the proxies of the companies in which the Fund holds investments consistent with the procedures as stated in the Statement of Additional Information (SAI). You may obtain a copy of the SAI without charge by calling 800.345.6611; contacting your financial intermediary; visiting investor.columbiathreadneedleus.com; or searching the website of the Securities and Exchange Commission (SEC) at sec.gov. Information regarding how the Fund voted proxies relating to portfolio securities is filed with the SEC by August 31st for the most recent 12-month period ending June 30th of that year, and is available without charge by visiting investor.columbiathreadneedleus.com, or searching the website of the SEC at sec.gov.
Quarterly schedule of investments
The Fund files a complete schedule of portfolio holdings with the SEC for the first and third quarters of each fiscal year on Form N-Q. The Fund’s Form N-Q is available on the SEC’s website at sec.gov and may be reviewed and copied at the SEC’s Public Reference Room in Washington, D.C. Information on the operation of the Public Reference Room may be obtained by calling 800.SEC.0330. The Fund’s complete schedule of portfolio holdings, as filed on Form N-Q, can also be obtained without charge, upon request, by calling 800.345.6611.
Additional Fund information
For more information about the Fund, please visit investor.columbiathreadneedleus.com or call 800.345.6611. Customer Service Representatives are available to answer your questions Monday through Friday from 8 a.m. to 7 p.m. Eastern time.
Fund investment manager
Columbia Management Investment Advisers, LLC
225 Franklin Street
Boston, MA 02110
Fund distributor
Columbia Management Investment Distributors, Inc.
225 Franklin Street
Boston, MA 02110
Fund transfer agent
Columbia Management Investment Services Corp.
P.O. Box 8081
Boston, MA 02266-8081
| 46 | Multi-Manager Small Cap Equity Strategies Fund | Annual Report 2017 |
[THIS PAGE INTENTIONALLY LEFT BLANK]
[THIS PAGE INTENTIONALLY LEFT BLANK]
[THIS PAGE INTENTIONALLY LEFT BLANK]
Multi-Manager Small Cap Equity Strategies Fund
P.O. Box 8081
Boston, MA 02266-8081
Please read and consider the investment objectives, risks, charges and expenses for any fund carefully before investing. For a prospectus and summary prospectus, which contains this and other important information about the Fund, go to
investor.columbiathreadneedleus.com. The Fund is distributed by Columbia Management Investment Distributors, Inc., member FINRA, and managed by Columbia Management Investment Advisers, LLC.
Columbia Threadneedle Investments (Columbia Threadneedle) is the global brand name of the Columbia and Threadneedle group of companies. All rights reserved. Columbia Management Investment Distributors, Inc., 225 Franklin Street, Boston, MA 02110-2804
© 2017 Columbia Management Investment Advisers, LLC.
investor.columbiathreadneedleus.com

Annual Report
August 31, 2017
Multi-Manager Alternative Strategies Fund
Not FDIC Insured • No bank guarantee • May lose value
Dear Shareholders,
The current outlook for financial markets is clouded by two primary concerns: the high valuation of equities and the direction of interest rates. Following the U.S. presidential election, U.S. equities rallied based on the assumption that the new administration’s policies would stimulate growth quickly. Unfortunately it’s unclear whether those measures will get passed, much less passed quickly. In fixed income, uncertainty stems from the possibility that interest rates won’t rise as rapidly as expected if the administration’s proposed growth policies are not implemented.
Given this uncertainty, investors value a consistent approach more than ever. Investors want strong, repeatable risk-adjusted returns. Consistency — not surprises. As a leading global asset manager, we believe our consistent, collaborative investment approach enables us to deliver the dependable experience your portfolio demands. So, how do we strive to deliver a consistent investment experience?
Better insights
Your portfolio benefits from the investment insights uncovered by our talented investment teams around the world.
Better decisions
Our collaborative, interactive environment enables our investment teams to construct portfolios that take advantage of the best investment ideas.
Better outcomes
We aim to deliver a consistent experience, which means fewer surprises, dependable insights, and products designed to do the thing you want.
Whether you’re trying to save money to help your children go to college or for your own retirement, it’s the consistency of the return that is most essential. People who chase higher returns are usually also the first to sell when that investment goes through a bad patch. We try to combat this behavioral tendency by offering strategies that aim for a more consistent return. Our goal is for investors to panic less during periods of volatility, which can have a significant effect on their long-term results.
Nothing is more important to us than making sure those who have entrusted us to protect and grow their assets can do what matters most to them: build a nest egg, leave a legacy, and live confidently — now and throughout retirement. It’s why our talented professionals around the world work together to uncover uncommon opportunities and why our process encourages challenge and debate around our most compelling ideas to ensure better informed investment decisions, which hopefully lead to better outcomes for you.
Your success is our priority. Talk to your financial advisor about how working with Columbia Threadneedle Investments may help you position your portfolio for consistent, sustainable outcomes, no matter the market conditions.
Sincerely,
Christopher O. Petersen
President, Columbia Funds
Investors should consider the investment objectives, risks, charges and expenses of a mutual fund carefully before investing. For a free prospectus and summary prospectus, which contains this and other important information about a fund, visit investor.columbiathreadneedleus.com. The prospectus should be read carefully before investing.
Columbia Funds are distributed by Columbia Management Investment Distributors, Inc., member FINRA, and managed by Columbia Management Investment Advisers, LLC.
© 2017 Columbia Management Investment Advisers, LLC. All rights reserved.
Multi-Manager Alternative Strategies Fund | Annual Report 2017
Multi-Manager Alternative Strategies Fund | Annual Report 2017
Investment objective
Multi-Manager Alternative Strategies Fund (the Fund) seeks capital appreciation with an emphasis on absolute (positive) returns.
Portfolio management
AQR Capital Management, LLC
Clifford Asness, Ph.D., M.B.A.
Brian Hurst
John Liew, Ph.D., M.B.A.
Yao Hua Ooi
Ari Levine, M.S.
Water Island Capital, LLC
Edward Chen
Roger Foltynowicz, CAIA
Gregg Loprete
Todd Munn
TCW Investment Management Company LLC
Stephen Kane, CFA
Laird Landmann
Tad Rivelle
Bryan Whalen, CFA
Manulife Asset Management (US) LLC
Daniel Janis III
Christopher Chapman, CFA
Thomas Goggins
Kisoo Park
| Average annual total returns (%) (for the period ended August 31, 2017) |
| | | Inception | 1 Year | 5 Years | Life |
| Class A | 04/23/12 | -4.44 | 1.06 | 1.04 |
| Class Z* | 01/03/17 | -4.13 | 1.12 | 1.11 |
| Citi Three-Month U.S. Treasury Bill Index | | 0.58 | 0.18 | 0.17 |
All results shown assume reinvestment of distributions during the period. Returns do not reflect the deduction of taxes that a shareholder may pay on Fund distributions or on the redemption of Fund shares. Performance results reflect the effect of any fee waivers or reimbursements of Fund expenses by Columbia Management Investment Advisers, LLC and/or any of its affiliates. Absent these fee waivers or expense reimbursement arrangements, performance results would have been lower.
The performance information shown represents past performance and is not a guarantee of future results. The investment return and principal value of your investment will fluctuate so that your shares, when redeemed, may be worth more or less than their original cost. Current performance may be lower or higher than the performance information shown. You may obtain performance information current to the most recent month-end by contacting your financial intermediary, visiting investor.columbiathreadneedleus.com or calling 800.345.6611.
| * | The returns shown for periods prior to the share class inception date (including returns for the Life of the Fund, if shown, which are since Fund inception) include the returns of the Fund’s oldest share class. These returns are adjusted to reflect any higher class-related operating expenses of the newer share classes, as applicable. Please visit investor.columbiathreadneedleus.com/investment-products/mutual-funds/appended-performance for more information. |
The Citi Three-Month U.S. Treasury Bill Index, an unmanaged index, is representative of the performance of three-month Treasury bills.
Indices are not available for investment, are not professionally managed and do not reflect sales charges, fees, brokerage commissions, taxes or other expenses of investing. Securities in the Fund may not match those in an index.
| 2 | Multi-Manager Alternative Strategies Fund | Annual Report 2017 |
Fund at a Glance (continued)
Performance of a hypothetical $10,000 investment (April 23, 2012 — August 31, 2017)
The chart above shows the change in value of a hypothetical $10,000 investment in Class A shares of Multi-Manager Alternative Strategies Fund during the stated time period, and does not reflect the deduction of taxes that a shareholder may pay on Fund distributions or on the redemption of Fund shares.
| Portfolio breakdown — long positions (%) (at August 31, 2017) |
| Asset-Backed Securities — Non-Agency | 4.4 |
| Commercial Mortgage-Backed Securities - Agency | 3.6 |
| Commercial Mortgage-Backed Securities - Non-Agency | 2.5 |
| Common Stocks | 29.0 |
| Convertible Bonds | 0.5 |
| Corporate Bonds & Notes | 13.8 |
| Exchange-Traded Funds | 0.1 |
| Foreign Government Obligations | 0.6 |
| Limited Partnerships | 1.2 |
| Municipal Bonds | 0.7 |
| Mutual Funds | 2.0 |
| Options Purchased Calls | 0.0 (a) |
| Options Purchased Puts | 0.0 (a) |
| Residential Mortgage-Backed Securities - Agency | 0.2 |
| Residential Mortgage-Backed Securities - Non-Agency | 6.3 |
| Treasury Bills | 10.5 |
| Short-Term Investments Segregated in Connection with Open Derivatives Contracts(b) | 36.1 |
| Total | 111.5 |
| (a) | Rounds to zero. |
| (b) | Includes investments in Money Market Funds (amounting to $183.4 million) which have been segregated to cover obligations relating to the Fund’s investment in derivatives which provide exposure to multiple markets. For a description of the Fund’s investments in derivatives, see Investments in derivatives following the Consolidated Portfolio of Investments and Note 2 to the Notes to Consolidated Financial Statements. |
Percentages indicated are based upon total investments, net of investments sold short. The Fund’s portfolio composition is subject to change.
| Portfolio breakdown — short positions (%) (at August 31, 2017) |
| Common Stocks | (9.3) |
| Corporate Bonds & Notes | (0.4) |
| Exchange-Traded Funds | (1.8) |
| Total | (11.5) |
Percentages indicated are based upon total investments, net of investments sold short. The Fund’s portfolio composition is subject to change.
| Equity sector breakdown — long positions (%) (at August 31, 2017) |
| Consumer Discretionary | 18.4 |
| Consumer Staples | 1.3 |
| Energy | 0.5 |
| Financials | 8.5 |
| Health Care | 25.4 |
| Industrials | 10.6 |
| Information Technology | 23.8 |
| Materials | 6.1 |
| Real Estate | 2.1 |
| Telecommunication Services | 3.3 |
| Total | 100.0 |
Percentages indicated are based upon total long equity investments. The Fund’s portfolio composition is subject to change.
Multi-Manager Alternative Strategies Fund | Annual Report 2017
| 3 |
Fund at a Glance (continued)
| Equity sector breakdown — short positions (%) (at August 31, 2017) |
| Consumer Discretionary | (9.3) |
| Consumer Staples | (0.8) |
| Energy | (1.5) |
| Financials | (6.6) |
| Health Care | (12.0) |
| Industrials | (7.4) |
| Information Technology | (43.0) |
| Materials | (6.4) |
| Real Estate | (4.0) |
| Telecommunication Services | (9.0) |
| Total | (100.0) |
Percentages indicated are based upon total short equity investments. The Fund’s portfolio composition is subject to change.
| Market exposure through derivatives investments (% of notional exposure) (at August 31, 2017)(a) |
| | Long | Short | Net |
| Fixed Income Derivative Contracts | 18.0 | (179.3) | (161.3) |
| Commodities Derivative Contracts | 12.5 | (7.9) | 4.6 |
| Equity Derivative Contracts | 29.9 | (3.3) | 26.6 |
| Foreign Currency Derivative Contracts | 185.1 | (155.0) | 30.1 |
| Total Notional Market Value of Derivative Contracts | 245.5 | (345.5) | (100.0) |
(a) The Fund has market exposure (long and/or short) to fixed income, commodity and equity asset classes and foreign currency through its investments in derivatives. The notional exposure of a financial instrument is the nominal or face amount that is used to calculate payments made on that instrument and/or changes in value for the instrument. The notional exposure is a hypothetical underlying quantity upon which payment obligations are computed. Notional exposures provide a gauge for how the Fund may behave given changes in individual markets. For a description of the Fund’s investments in derivatives, see Investments in derivatives following the Consolidated Portfolio of Investments, and Note 2 to the Notes to Consolidated Financial Statements.
| 4 | Multi-Manager Alternative Strategies Fund | Annual Report 2017 |
Manager Discussion of Fund Performance
Effective October 20, 2016, Wasatch Advisors, Inc. no longer manages a portion of the Fund. Effective March 29, 2017, TCW Investment Management Company, LLC (TCW) was added as a manager of a portion of the Fund. Currently, the Fund is managed by three independent money management firms and each invests a portion of the Fund’s assets. As of August 31, 2017, AQR Capital Management, LLC (AQR), Water Island Capital, LLC (Water Island) and TCW managed approximately 35%, 26% and 39% of the Fund, respectively. While the Fund’s benchmark is the Citi Three-Month U.S. Treasury Bill Index, Wasatch also compared the performance of its portion of the Fund to the S& P 500® Index. Effective September 13, 2017, Manulife Asset Management (US) LLC (Manulife) began to manage a portion of the Fund’s assets.
For the 12-month period that ended August 31, 2017, the Fund’s Class A shares returned -4.44%. The Fund underperformed its benchmark, the Citi Three-Month U.S. Treasury Bill Index, which returned 0.58% over the same period. The Fund’s underperformance can be attributed primarily to implementation of various alternative strategies.
Financial markets marched higher despite heightened volatility
As the 12-month period began in September 2016, geopolitical uncertainty around the globe was heightened. The aftermath of the U.K. referendum to leave the European Union, increasing terrorist attacks in Europe, uncertainty brewing related to the U.S. elections, falling oil prices and rising gold prices all dominated investor concerns. Nonetheless, credit and equity markets marched higher, which we believe was aided in part by central bank support and the global search for yield. The fourth quarter of 2016 brought with it the election of Donald Trump and a subsequent market rally. This rally in our view was largely predicated on an optimistic outlook regarding the then-incoming Administration’s capacity to execute its agenda of tax reform, deregulation and infrastructure spending, with an aim to drive U.S. economic growth. Investors generally shifted from yield/bond proxies to growth assets. The first quarter of 2017 was punctuated by failure of the new Administration to pass health care reform, seemingly a prelude to the legislative gridlock seen through the remainder of the period. Also, the Federal Reserve (the Fed) raised the federal funds rate in March 2017 and again in June 2017, following up on its first interest rate increase in a year in December 2016.
The last several months of the period brought with them a reminder of just how much technical change can be a driver of disruption — cord-cutting has shifted the landscape in media and telecommunications; advances in wireless technology could topple the cable industry’s monopoly on broadband; the specter of self-driving cars has opened a potential gold rush for the future of the automobile; and the machinations of a single company — Amazon.com — have the potential to effect changes not just in retail specialties like grocers and office suppliers but also in cloud computing, wireless communications, shipping and logistics and even pre-packaged foods. Nevertheless, these months also generally maintained the theme of unrelenting demand for yield outweighing weaker credit fundamentals and rising geopolitical uncertainty, resulting in narrower credit spreads across nearly all sectors given the technical, or supply/demand, support.
Money management firms delivered results based on variety of alternative strategies
AQR: Our portion of the Fund, which pursues an active managed futures strategy, underperformed the benchmark during the period. We invest in a diverse portfolio of futures and forward contracts, both long and short, across the global equity, fixed-income, commodity and currency markets. In implementing our strategy, we utilize both short-term and long-term trend-following signals to attempt to profit from different types of trends that occur in each of these markets. Trend following can be simply described as taking long positions in markets that are rising in price and taking short positions in markets that are falling in price. In addition to trend-following signals, we also incorporate signals that seek to identify over-extended trends and seek to reduce risk when the chance of a reversal is perceived as higher than normal, since market reversals generally cause losses for trend-following strategies.
Overall, trend following in the Japanese yen, gold and WTI crude oil were the largest detractors from our portion of the Fund’s performance during the period. These detractors were partially offset by trend following in the euro, the NASDAQ Index and the MSCI Taiwan Index, which contributed positively.
By asset class, commodities detracted most from our portion of the Fund’s results during the period. Throughout the period, oil and oil-related commodities were whipsawed by evolving dynamics related to whether OPEC and Russia could agree on a production cap. After an agreement was reached, production data, particularly from the U.S., remained strong, causing
Multi-Manager Alternative Strategies Fund | Annual Report 2017
| 5 |
Manager Discussion of Fund Performance (continued)
additional volatility in prices. All signals contributed to losses, as markets exhibited several reversals, and as trends from late 2016 changed course in 2017. Our portion of the Fund varied positioning in response to changing market directions. The majority of losses were from the energy-related commodities, followed by precious metals.
Within fixed income, markets began to show weakness at the start of the period but reversed dramatically after the surprise outcome of the U.S. presidential elections. This particularly hurt longer term trend signals given the longer term fixed-income trend was bullish until then. However, these bearish trends again reversed with most global fixed-income markets rallying in 2017 through the end of August 2017. Toward the last few months of the period, however, fixed-income markets staged a significant reversal on more hawkish than expected rhetoric from central banks, with a sharp selloff at the end of June 2017 causing additional challenges for trend following. European fixed-income markets in particular experienced a number of reversals, with varying sentiment around the Dutch and French elections as well as from comments from European Central Bank Chair Mario Draghi, which we believe caused yields to spike. Most of the losses within our portion of the Fund came from trend following in European fixed income and U.S. short-term rates and bonds.
In contrast to these dynamics, equity markets sustained their bullish trends and contributed positively to our portion of the Fund’s performance. Positive sentiment following the U.S. elections carried over into 2017, generating momentum across global equity markets. Our portion of the Fund generally maintained balanced exposures across geographies, including North America, Europe, Asia and emerging markets for most of the period.
TCW: Our portion of the Fund, which implements an unconstrained bond strategy, outperformed the benchmark during the period from March 29, 2017, when we began managing a portion of the Fund’s assets, through August 31, 2017 (the “reporting period”). Notwithstanding the sharp sell-off at the end of June 2017, intermediate- and long-term U.S. Treasury rates edged lower during the reporting period, contributing to the positive absolute total returns for our portion of the Fund and for the benchmark. However, the impact on relative performance was minimal, with our portion of the Fund’s duration position of approximately 1.6 years generally rewarded given the falling U.S. Treasury rates, particularly in August 2017, but weighing on returns in June 2017 when yields rose. Our portion of the Fund’s relative outperformance was driven primarily by issue selection among securitized products. An emphasis on non-agency mortgage-backed securities backed by subprime collateral, which in our view continued to benefit from solid investor sponsorship and improving collateral characteristics amidst rising home prices, especially helped performance. Holdings in government guaranteed student loan asset-backed securities and commercial mortgage-backed securities also contributed positively. Further, exposure to investment-grade and high-yield corporate bonds added significant value, with allocations to banking, consumer non-cyclical and communication names contributing the most. An allocation to emerging market debt also boosted relative results, albeit more modestly.
There were few detractors from our portion of the Fund’s relative results during the reporting period, though June 2017’s sharp rise in U.S. Treasury yields weighed on performance in that month. Also, within the corporate bond sector, investments in retailers detracted modestly given some industry-specific structural pressures.
Wasatch: Our portion of the Fund, which implements a long/short equity strategy, underperformed the benchmark during the period from September 1, 2016 through October 19, 2016 (the “reporting period”). The performance of our portion of the Fund can be attributed primarily to weakness in a handful of long positions relative to the S&P 500® Index in the materials and energy sectors. These detractors were only partially offset by long positions relative to the S&P 500® Index in the information technology sector and short positions in the consumer staples and consumer discretionary sectors, which added value. Individual long positions in agricultural chemical products supplier Mosaic Company and energy exploration and production company Bill Barrett and a short position in energy driller Helmerich & Payne detracted most. The biggest individual contributors to our portion of the Fund’s results were long positions in Apple and United Continental Holdings and a short position in Tractor Supply Company.
Water Island: Our portion of the Fund, which employs a variety of alternative strategies, outperformed the benchmark during the period. All three sub-strategies we employ — merger arbitrage, credit opportunities and equity special situations — contributed positively to our portion of the Fund’s results during the period.
| 6 | Multi-Manager Alternative Strategies Fund | Annual Report 2017 |
Manager Discussion of Fund Performance (continued)
The largest contributors to our portion of the Fund’s performance during the period were a merger arbitrage investment in the merger between NXP Semiconductors and Qualcomm; a credit opportunities investment in Ambac Financial Group; and a merger arbitrage investment in the merger between Time Warner and AT&T. From a sector perspective, health care and information technology contributed most to our portion of the Fund’s returns. The countries that made the strongest positive contributions to our portion of the Fund’s performance were the U.S., the Netherlands and Switzerland.
The largest detractors from our portion of the Fund’s results during the period were a merger arbitrage investment in Noble Energy’s acquisition of Clayton Williams Energy; an equity special situations investment in Time; and an equity special situations investments in Computer Sciences. From a sector perspective, energy and telecommunication services detracted most from our portion of the Fund’s returns. Only two countries detracted from our portion of the Fund’s performance during the period, namely Singapore and the U.K.
Changes to the Fund’s portfolio based on strategy implementation
The Fund’s portfolio turnover rate for the 12-month period was 444%. A significant portion of the turnover was the result of rolling-maturity mortgage securities, processing of prepayments and opportunistic changes our managers made at the margin in response to valuations or market developments.
AQR: At the end of the period, within equities, our portion of the Fund was long in most developed and emerging markets. Within fixed-income, our portion of the Fund ended the period long in German bonds but net short in most other short-term rate and bond markets. Within currencies, our portion of the Fund ended the period long in the euro and short in the U.S. dollar and Japanese yen. Within commodities, our portion of the Fund ended the period long in base metals and precious metals and short in agricultural commodities.
TCW: Given that we assumed management of a portion of the Fund’s assets in late-March 2017, the reporting period was characterized by a ramping up of exposures rather than of making changes. By the end of the reporting period, corporate credit sector positioning favored higher quality regulated sectors like U.S. financials with limited re-leveraging risk and reasonable yield premiums given what we viewed as tight valuations and historically high leverage in the corporate bond sector. Exposure to industrial credit was selective, focused on what we considered to be high quality, low beta names with stable cash flows and strong balance sheets. We also maintained modest allocations to select high-yield corporate bonds and emerging market debt. Securitized products, which, in our view, provide protection from excesses in credit markets and offer opportunities for attractive risk-adjusted returns, represented a sizable position. Exposure among commercial mortgage-backed securities favored agency issues as well as seasoned non-agency bonds at the top of the capital structure and single-asset, single-borrower deals. Asset-backed securities holdings were focused on what we considered to be high quality, non-traditional collateral, such as government guaranteed student loan receivables. Non-agency mortgage-backed securities holdings emphasized securities with what we viewed as better relative quality and near-term cash flows. We believed non-agency mortgage-backed securities remained especially compelling at the end of the reporting period due to their available yield, potential for price upside, and solid fundamentals. Agency mortgage-backed securities represented only a modest position despite being higher quality and more liquid, as we believed that yield compensation remained small historically and prepayment risk weighed on the market given the low rate environment. As of the end of August 2017, our portion of the Fund’s duration was approximately 1.6 years.
Wasatch: In September 2016, we initiated a Fund position in Anadarko Petroleum and added to an existing position in Monsanto. Anadarko Petroleum contributed positively to performance during the reporting period, while Monsanto detracted. Subsequently, given the impending liquidation of the strategy, shifts were made to move our portion of the Fund to cash during the reporting period, a process entirely completed by October 19, 2016.
Water Island: During the period, we established positions in the mergers between Astoria Financial and Sterling Bancorp and between Mead Johnson Nutrition and Reckitt Benckiser Group. Upon a successful deal closing, our portion of the Fund no longer held a position in the acquisition of LinkedIn by Microsoft. We chose to exit the position in Cabela’s after our price targets were met, having taken a skeptical view of a proposed acquisition by Bass Pro and choosing to reverse the deal on the thesis it would not complete successfully.
Multi-Manager Alternative Strategies Fund | Annual Report 2017
| 7 |
Manager Discussion of Fund Performance (continued)
Any shifts in sector exposure were largely the result of the available opportunity set in terms of corporate activity and the subset of events that meet our risk/reward criteria. That said, the sectors in which we saw the highest levels of corporate activity during the period were information technology, health care and financials. While there were no changes to our portion of the Fund’s credit portfolio with regard to quality emphasis, yield curve or duration positioning, it is worth noting that we focused on maintaining a short duration in the portfolio’s credit sleeve. We maintained this focus not only from the perspective of effective duration but also when viewed through the lens of “duration to catalyst” — our proprietary metric that takes into account the potential for a shortened timeline should a particular expected corporate event come to fruition. As always, we seek returns driven by the outcomes of specific, idiosyncratic corporate events, rather than by the overall market. Our strategy is agnostic in terms of capitalization, style, sector or country weighting.
Derivative positions in the Fund
AQR: Our portion of the Fund invests mostly via derivatives, primarily futures contracts and futures-related instruments. These include global developed and emerging market equity index futures; global developed and emerging market currency forwards; commodity futures and swaps on commodity futures; and global developed market bonds and interest rate futures as well as swaps on bond futures. Our portion of the Fund is implemented using derivative instruments because we believe derivatives offer the most liquid, low cost and efficient way to gain market exposure. The overall impact of derivatives on performance is varied and linked to the strategies within which they are implemented.
TCW: Our portion of the Fund held U.S. Treasury futures as a method of managing duration. The use of these futures detracted modestly from our portion of the Fund’s results during the reporting period.
Wasatch: We did not invest in derivative instruments during the reporting period in our portion of the Fund.
Water Island: During the period, our portion of the Fund employed total return equity swaps, equity options and currency forwards for four core purposes — to hedge currency risk, to invest outside the U.S. more efficiently, to create income and optionality, and to limit volatility and correlation. During the period ended August 31, 2017, derivatives had a neutral effect on our portion of the Fund’s performance.
Market risk may affect a single issuer, sector of the economy, industry or the market as a whole. Investing in derivatives is a specialized activity that involves special risks that subject the Fund to significant loss potential, including when used as leverage, and may result in greater fluctuation in fund value. Commodity investments may be affected by the overall market and industry- and commodity-specific factors, and may be more volatile and less liquid than other investments. Fixed-income securities present issuer default risk. Non-investment-grade (high-yield or junk) securities present greater price volatility and more risk to principal and income than higher rated securities. A rise in interest rates may result in a price decline of fixed-income instruments held by the Fund, negatively impacting its performance and NAV. Falling rates may result in the Fund investing in lower yielding debt instruments, lowering the Fund’s income and yield. These risks may be heightened for longer maturity and duration securities. International investing involves certain risks and volatility due to potential political, economic or currency instabilities and different financial and accounting standards. Certain issuerevents, including initial public offerings, business consolidation or restructuring, may present heightened risks to securities from the high degree of uncertainty associated with such events. Short positions (where the underlying asset is not owned) can create unlimited risk. Risks are enhanced for emerging market and sovereign debt issuers. The Fund is managed by multiple advisers independently of one another, which may result in contradicting trades (i.e., with no net benefit to the Fund), while increasing transaction costs. As a non-diversified fund, fewer investments could have a greater effect on performance. Market or other (e.g., interest rate) environments may adversely affect the liquidity of fund investments, negatively impacting their price. Generally, the less liquid the market at the time the Fund sells a holding, the greater the risk of loss or decline of value to the Fund. See the Fund’s prospectus for information on these and other risks.
The views expressed in this report reflect the current views of the respective parties. These views are not guarantees of future performance and involve certain risks, uncertainties and assumptions that are difficult to predict, so actual outcomes and results may differ significantly from the views expressed. These views are subject to change at any time based upon economic, market or other conditions and the respective parties disclaim any responsibility to update such views. These views may not be relied on as investment advice and, because investment decisions for a Columbia fund are based on numerous factors, may not be relied on as an indication of trading intent on behalf of any particular Columbia fund. References to specific securities should not be construed as a recommendation or investment advice.
| 8 | Multi-Manager Alternative Strategies Fund | Annual Report 2017 |
Understanding Your Fund’s Expenses
(Unaudited)
As an investor, you incur two types of costs. There are transaction costs, which may include redemption fees. There are also ongoing costs, which generally include management fees, distribution and/or service fees, and other fund expenses. The following information is intended to help you understand your ongoing costs (in dollars) of investing in the Fund and to help you compare these costs with the ongoing costs of investing in other mutual funds.
Analyzing your Fund’s expenses
To illustrate these ongoing costs, we have provided examples and calculated the expenses paid by investors in each share class of the Fund during the period. The actual and hypothetical information in the table is based on an initial investment of $1,000 at the beginning of the period indicated and held for the entire period. Expense information is calculated two ways and each method provides you with different information. The amount listed in the “Actual” column is calculated using the Fund’s actual operating expenses and total return for the period. You may use the Actual information, together with the amount invested, to estimate the expenses that you paid over the period. Simply divide your account value by $1,000 (for example, an $8,600 account value divided by $1,000 = 8.6), then multiply the results by the expenses paid during the period under the “Actual” column. The amount listed in the “Hypothetical” column assumes a 5% annual rate of return before expenses (which is not the Fund’s actual return) and then applies the Fund’s actual expense ratio for the period to the hypothetical return. You should not use the hypothetical account values and expenses to estimate either your actual account balance at the end of the period or the expenses you paid during the period. See “Compare with other funds” below for details on how to use the hypothetical data.
Compare with other funds
Since all mutual funds are required to include the same hypothetical calculations about expenses in shareholder reports, you can use this information to compare the ongoing cost of investing in the Fund with other funds. To do so, compare the hypothetical example with the 5% hypothetical examples that appear in the shareholder reports of other funds. As you compare hypothetical examples of other funds, it is important to note that hypothetical examples are meant to highlight the ongoing costs of investing in a fund only and do not reflect any transaction costs, such as redemption or exchange fees. Therefore, the hypothetical calculations are useful in comparing ongoing costs only, and will not help you determine the relative total costs of owning different funds. If transaction costs were included in these calculations, your costs would be higher.
| March 1, 2017 — August 31, 2017 |
| | Account value at the
beginning of the
period ($) | Account value at the
end of the
period ($) | Expenses paid during
the period ($) | Fund’s annualized
expense ratio (%) |
| | Actual | Hypothetical | Actual | Hypothetical | Actual | Hypothetical | Actual |
| Class A | 1,000.00 | 1,000.00 | 980.50 | 1,016.53 | 8.59 | 8.74 | 1.72 |
| Class Z | 1,000.00 | 1,000.00 | 982.60 | 1,017.90 | 7.25 | 7.37 | 1.45 |
Expenses paid during the period are equal to the annualized expense ratio for each class as indicated above, multiplied by the average account value over the period and then multiplied by the number of days in the Fund’s most recent fiscal half year and divided by 365.
Expenses do not include fees and expenses incurred indirectly by the Fund from its investment in underlying funds, including affiliated and non-affiliated pooled investment vehicles, such as mutual funds and exchange-traded funds.
The Fund is offered only through certain wrap fee programs sponsored and/or managed by Ameriprise Financial, Inc. or its affiliates. Participants in wrap fee programs pay other fees that are not included in the above table. Please refer to the wrap program documents for information about the fees charged.
Multi-Manager Alternative Strategies Fund | Annual Report 2017
| 9 |
Consolidated Portfolio of Investments
August 31, 2017
(Percentages represent value of investments compared to net assets)
| Asset-Backed Securities — Non-Agency 3.8% |
| Issuer | Coupon
Rate | | Principal
Amount ($) | Value ($) |
| AIMCO CLO(a),(b) |
| Series 2014-AA Class AR |
3-month USD LIBOR + 1.100%
07/20/2026 | 2.407% | | 370,000 | 369,996 |
| American Money Management Corp. CLO 18 Ltd.(a),(b) |
| Series 2016-18A Class AL1 |
3-month USD LIBOR + 1.570%
05/26/2028 | 2.887% | | 520,000 | 522,518 |
| BA Credit Card Trust(b) |
| Series 2015-A1 Class A |
1-month USD LIBOR + 0.330%
06/15/2020 | 1.556% | | 490,000 | 490,487 |
| Blue Hill CLO Ltd.(a),(b) |
| Series 2013-1A Class AR |
3-month USD LIBOR + 1.180%
01/15/2026 | 2.484% | | 250,000 | 250,443 |
| Cedar Funding VI CLO Ltd.(a),(b) |
| Series 2016-6A Class A1 |
3-month USD LIBOR + 1.470%
10/20/2028 | 2.777% | | 400,000 | 403,082 |
| Chase Issuance Trust(b) |
| Series 2013-A3 Class A3 |
3-month USD LIBOR + 0.280%
04/15/2020 | 1.506% | | 400,000 | 400,579 |
| Citibank Credit Card Issuance Trust(b) |
| Series 2013-A2 Class A2 |
1-month USD LIBOR + 0.280%
05/26/2020 | 1.496% | | 480,000 | 480,765 |
| College Loan Corp. Trust I(b) |
| Subordinated Series 2005-2 Class B |
3-month USD LIBOR + 0.490%
01/15/2037 | 1.794% | | 526,025 | 481,192 |
| Dryden 41 Senior Loan Fund(a),(b) |
| Series 2015-41A Class A |
3-month USD LIBOR + 1.500%
01/15/2028 | 2.522% | | 250,000 | 251,948 |
| Eaton Vance CLO Ltd.(a),(b) |
| Series 2014-1A Class AR |
3-month USD LIBOR + 1.200%
07/15/2026 | 2.504% | | 400,000 | 400,399 |
| Education Loan Asset-Backed Trust I(a),(b) |
| Series 2013-1 Class A2 |
1-month USD LIBOR + 0.800%
04/26/2032 | 2.016% | | 436,000 | 429,028 |
| EFS Volunteer No. 2 LLC(a),(b) |
| Series 2012-1 Class A2 |
1-month USD LIBOR + 1.350%
03/25/2036 | 2.566% | | 555,000 | 562,897 |
| Asset-Backed Securities — Non-Agency (continued) |
| Issuer | Coupon
Rate | | Principal
Amount ($) | Value ($) |
| Flatiron CLO Ltd.(a),(b) |
| Series 2014-1A Class A1R |
3-month USD LIBOR + 1.180%
07/17/2026 | 2.338% | | 480,000 | 483,341 |
| Honda Auto Receivables Owner Trust |
| Series 2015-4 Class A3 |
| 09/23/2019 | 1.230% | | 370,000 | 369,356 |
| Limerock CLO II Ltd.(a),(b) |
| Series 2014-2A Class AR |
3-month USD LIBOR + 1.300%
04/18/2026 | 2.458% | | 250,000 | 250,610 |
| Magnetite IX Ltd.(a),(b) |
| Series 2014-9A |
3-month USD LIBOR + 1.000%
07/25/2026 | 2.156% | | 370,000 | 369,997 |
| Navient Student Loan Trust(b) |
| Series 2014-1 Class A3 |
1-month USD LIBOR + 0.510%
06/25/2031 | 1.534% | | 750,000 | 744,895 |
| Navient Student Loan Trust(a),(b) |
| Series 2016-1A Class A |
1-month USD LIBOR + 0.700%
02/25/2070 | 1.724% | | 655,786 | 650,147 |
| Series 2016-2 Class A3 |
1-month USD LIBOR + 1.500%
06/25/2065 | 2.524% | | 729,000 | 756,338 |
| Series 2017-3A Class A3 |
1-month USD LIBOR + 1.050%
07/26/2066 | 2.111% | | 750,000 | 755,996 |
| Nelnet Student Loan Trust(a),(b) |
| Series 2012-1A Class A |
1-month USD LIBOR + 0.800%
12/27/2039 | 2.016% | | 677,287 | 687,402 |
| Series 2012-2A Class A |
1-month USD LIBOR + 0.800%
12/26/2033 | 2.032% | | 987,562 | 990,703 |
| SLC Student Loan Trust(b) |
| Series 2006-1 Class A6 |
3-month USD LIBOR + 0.160%
03/15/2055 | 1.406% | | 841,000 | 785,581 |
| Series 2006-1 Class B |
3-month USD LIBOR + 0.210%
03/15/2055 | 1.456% | | 572,179 | 517,874 |
| SLM Student Loan Trust(a),(b) |
| Series 2003-10A Class A3 |
3-month USD LIBOR + 0.470%
12/15/2027 | 1.716% | | 690,048 | 689,320 |
| SLM Student Loan Trust(b) |
| Series 2007-3 Class A4 |
3-month USD LIBOR + 0.060%
01/25/2022 | 1.216% | | 870,000 | 839,161 |
The accompanying Notes to Consolidated Financial Statements are an integral part of this statement.
| 10 | Multi-Manager Alternative Strategies Fund | Annual Report 2017 |
Consolidated Portfolio of Investments (continued)
August 31, 2017
| Asset-Backed Securities — Non-Agency (continued) |
| Issuer | Coupon
Rate | | Principal
Amount ($) | Value ($) |
| Series 2007-6 Class A4 |
3-month USD LIBOR + 0.380%
10/25/2024 | 1.536% | | 662,153 | 663,169 |
| Series 2008-4 Class A4 |
3-month USD LIBOR + 1.650%
07/25/2022 | 2.806% | | 615,891 | 631,249 |
| Series 2008-5 Class A4 |
3-month USD LIBOR + 1.700%
07/25/2023 | 2.856% | | 724,291 | 745,898 |
| Series 2008-7 Class B |
3-month USD LIBOR + 1.850%
07/26/2083 | 3.164% | | 500,000 | 495,375 |
| Series 2008-9 Class A |
3-month USD LIBOR + 1.500%
04/25/2023 | 2.656% | | 630,218 | 645,351 |
| Series 2011-2 Class A2 |
1-month USD LIBOR + 1.200%
10/25/2034 | 2.224% | | 750,000 | 767,118 |
| Series 2012-1 Class A3 |
1-month USD LIBOR + 0.950%
09/25/2028 | 1.974% | | 720,422 | 726,201 |
| Series 2014-2 Class A3 |
1-month USD LIBOR + 0.590%
03/25/2055 | 1.614% | | 570,000 | 571,404 |
| Subordinated Series 2004-10 Class B |
3-month USD LIBOR + 0.370%
01/25/2040 | 1.526% | | 553,322 | 502,804 |
| Subordinated Series 2007-2 Class B |
3-month USD LIBOR + 0.170%
07/25/2025 | 1.484% | | 700,000 | 589,570 |
| Subordinated Series 2007-3 Class B |
3-month USD LIBOR + 0.150%
01/25/2028 | 1.464% | | 700,000 | 589,492 |
| Subordinated Series 2012-7 Class B |
1-month USD LIBOR + 1.800%
09/25/2043 | 2.824% | | 550,000 | 532,955 |
| Voya CLO Ltd.(a),(b) |
| Series 2014-4A Class A1R |
3-month USD LIBOR + 0.950%
10/14/2026 | 2.254% | | 365,000 | 364,997 |
| Series 2015-2A Class A |
3-month USD LIBOR + 1.400%
07/23/2027 | 2.713% | | 400,000 | 402,907 |
Total Asset-Backed Securities — Non-Agency
(Cost $22,035,175) | 22,162,545 |
|
| Commercial Mortgage-Backed Securities - Agency 3.2% |
| Issuer | Coupon
Rate | | Principal
Amount ($) | Value ($) |
| Federal Home Loan Mortgage Corp. Multifamily Structured Pass-Through Certificates(b),(c),(d) |
| CMO Series K014 Class X1 |
| 04/25/2021 | 1.364% | | 5,494,328 | 202,180 |
| Series K006 Class AX1 |
| 01/25/2020 | 1.131% | | 9,231,542 | 178,591 |
| Series K712 Class X1 |
| 11/25/2019 | 1.452% | | 6,633,606 | 143,023 |
| Federal Home Loan Mortgage Corp. Multifamily Structured Pass-Through Certificates |
| CMO Series K151 Class A3 |
| 04/25/2030 | 3.511% | | 710,000 | 745,880 |
| Series K004 Class A3 |
| 08/25/2019 | 4.241% | | 700,000 | 731,053 |
| Series K005 Class A2 |
| 11/25/2019 | 4.317% | | 600,000 | 630,101 |
| Series KJ02 Class A2 |
| 09/25/2020 | 2.597% | | 776,501 | 790,235 |
| Series KJ05 Class A1 |
| 05/25/2021 | 1.418% | | 222,163 | 220,970 |
| Series KJ13 |
| 09/25/2021 | 2.055% | | 1,070,379 | 1,076,174 |
| Federal Home Loan Mortgage Corp. Multifamily Structured Pass-Through Certificates(b) |
| Series KF02 Class A1 |
1-month USD LIBOR + 0.380%
07/25/2020 | 1.604% | | 1,067,799 | 1,068,801 |
| Series KS02 Class A |
1-month USD LIBOR + 0.380%
08/25/2023 | 1.604% | | 674,517 | 674,722 |
| Federal National Mortgage Association |
| 10/01/2020 | 3.570% | | 371,096 | 389,584 |
| 12/01/2020 | 3.479% | | 459,785 | 478,239 |
| 04/01/2021 | 4.386% | | 450,357 | 484,708 |
| 07/01/2021 | 3.980% | | 275,000 | 294,399 |
| 10/01/2021 | 3.440% | | 271,632 | 286,166 |
| 01/01/2022 | 3.118% | | 1,217,317 | 1,271,285 |
| 04/01/2028 | 3.050% | | 390,000 | 402,981 |
| 01/01/2031 | 3.480% | | 430,000 | 454,965 |
| 03/01/2031 | 3.030% | | 410,001 | 415,282 |
| Series 2011-M2 Class A3 |
| 04/25/2021 | 3.764% | | 1,055,000 | 1,114,689 |
| Series 2011-M4 Class A2 |
| 06/25/2021 | 3.726% | | 770,000 | 817,994 |
| Series 2011-M7 Class A2 |
| 09/25/2018 | 2.578% | | 373,350 | 374,170 |
| Series 2012-M1 Class A2 |
| 10/25/2021 | 2.729% | | 770,000 | 791,656 |
| Federal National Mortgage Association(b),(c),(d) |
| Series 2012-M14 Class X2 |
| 09/25/2022 | 0.577% | | 8,194,933 | 159,282 |
The accompanying Notes to Consolidated Financial Statements are an integral part of this statement.
Multi-Manager Alternative Strategies Fund | Annual Report 2017
| 11 |
Consolidated Portfolio of Investments (continued)
August 31, 2017
| Commercial Mortgage-Backed Securities - Agency (continued) |
| Issuer | Coupon
Rate | | Principal
Amount ($) | Value ($) |
| Federal National Mortgage Association(b) |
| Series 2013-M13 Class FA |
1-month USD LIBOR + 0.350%
05/25/2018 | 1.566% | | 662,127 | 662,563 |
| Government National Mortgage Association |
| CMO Series 2010-140 Class C |
| 10/16/2043 | 3.674% | | 710,000 | 727,851 |
| CMO Series 2011-110 Class C |
| 08/16/2043 | 3.174% | | 388,867 | 390,768 |
| CMO Series 2011-165 Class A |
| 10/16/2037 | 2.194% | | 618,022 | 619,641 |
| Government National Mortgage Association(b),(c),(d) |
| CMO Series 2014-103 Class IO |
| 05/16/2055 | 0.649% | | 3,341,337 | 134,670 |
| Series 2014-88 Class IE |
| 03/16/2055 | 0.322% | | 4,796,482 | 155,628 |
| Government National Mortgage Association(b),(c) |
| Series 2011-65 |
| 09/16/2050 | 4.017% | | 790,531 | 817,029 |
| Series 2011-67 |
| 09/16/2051 | 4.020% | | 705,000 | 723,658 |
Total Commercial Mortgage-Backed Securities - Agency
(Cost $18,374,251) | 18,428,938 |
|
| Commercial Mortgage-Backed Securities - Non-Agency 2.1% |
| | | | |
| Banc of America Commercial Mortgage Trust(b),(c) |
| Series 2008-1 Class A4 |
| 02/10/2051 | 6.486% | | 269,464 | 269,322 |
| Citigroup Commercial Mortgage Trust |
| Series 2013-GC15 Class A2 |
| 09/10/2046 | 3.161% | | 792,860 | 802,450 |
| Commercial Mortgage Pass-Through Certificates |
| Series 2012-CR3 Class A2 |
| 10/15/2045 | 1.765% | | 625,601 | 625,208 |
| Commercial Mortgage Trust(b),(c),(d) |
| Series 2012-CR4 Class XA |
| 10/15/2045 | 2.032% | | 4,135,696 | 267,249 |
| Series 2013-CR13 Class XA |
| 12/10/2023 | 1.086% | | 3,733,516 | 135,265 |
| Series 2013-LC6 Class XA |
| 01/10/2046 | 1.800% | | 2,928,882 | 135,079 |
| Commercial Mortgage Trust |
| Series 2013-CR6 Class A2 |
| 03/10/2046 | 2.122% | | 787,196 | 788,128 |
| Series 2013-CR8 Class A2 |
| 06/10/2046 | 2.367% | | 855,000 | 858,524 |
| Credit Suisse First Boston Mortgage Securities Corp.(b),(c),(d) |
| Series 98-C1 Class AX |
| 05/17/2040 | 1.964% | | 1,223,546 | 23,338 |
| Commercial Mortgage-Backed Securities - Non-Agency (continued) |
| Issuer | Coupon
Rate | | Principal
Amount ($) | Value ($) |
| CSAIL Commercial Mortgage Trust |
| Series 2015-C1 Class A2 |
| 04/15/2050 | 2.970% | | 1,000,000 | 1,020,511 |
| Grace Mortgage Trust(a) |
| Series 2014-GRCE Class A |
| 06/10/2028 | 3.369% | | 145,000 | 151,326 |
| GS Mortgage Securities Corp. II(a) |
| Series 2012-ALOH Class A |
| 04/10/2034 | 3.551% | | 125,000 | 131,780 |
| GS Mortgage Securities Corp. Trust(a) |
| Series 2013-NYC5 Class A |
| 01/10/2030 | 2.318% | | 1,100,000 | 1,100,942 |
| Subordinated Series 2013-NYC5 Class C |
| 01/10/2030 | 2.974% | | 1,100,000 | 1,103,528 |
| GS Mortgage Securities Corp. Trust(a),(b),(c),(d) |
| Series 2017-GPTX Class XCP |
| 05/10/2034 | 0.911% | | 6,000,000 | 128,135 |
| JPMBB Commercial Mortgage Securities Trust |
| Series 2013-C14 Class A2 |
| 08/15/2046 | 3.019% | | 786,777 | 798,320 |
| Series 2013-C15 Class A2 |
| 11/15/2045 | 2.977% | | 516,415 | 522,598 |
| JPMBB Commercial Mortgage Securities Trust(b),(c),(d) |
| Series 2014-C23 Class XA |
| 09/15/2047 | 0.981% | | 4,371,904 | 142,803 |
| JPMorgan Chase Commercial Mortgage Securities Trust(a) |
| Series 2010-C2 Class A2 |
| 11/15/2043 | 3.616% | | 139,068 | 141,173 |
| JPMorgan Chase Commercial Mortgage Securities Trust(b),(c),(d) |
| Series 2012-LC9 Class XA |
| 12/15/2047 | 1.831% | | 3,301,801 | 202,162 |
| JPMorgan Chase Commercial Mortgage Securities Trust |
| Series 2013-C16 Class A2 |
| 12/15/2046 | 3.070% | | 809,809 | 820,320 |
| Series 2014-C20 Class A2 |
| 07/15/2047 | 2.872% | | 750,000 | 762,806 |
| Morgan Stanley Bank of America Merrill Lynch Trust(b),(c),(d) |
| Series 2013-C7 Class XA |
| 02/15/2046 | 1.621% | | 3,137,179 | 174,844 |
| Morgan Stanley Capital I Trust(a) |
| Series 2014-MP Class A |
| 08/11/2033 | 3.469% | | 140,000 | 146,123 |
| OBP Depositor LLC Trust(a) |
| Series 2010-OBP Class A |
| 07/15/2045 | 4.646% | | 150,000 | 159,984 |
| Wachovia Bank Commercial Mortgage Trust(b),(c) |
| Series 2007-C34 Class AM |
| 05/15/2046 | 5.818% | | 435,000 | 434,691 |
The accompanying Notes to Consolidated Financial Statements are an integral part of this statement.
| 12 | Multi-Manager Alternative Strategies Fund | Annual Report 2017 |
Consolidated Portfolio of Investments (continued)
August 31, 2017
| Commercial Mortgage-Backed Securities - Non-Agency (continued) |
| Issuer | Coupon
Rate | | Principal
Amount ($) | Value ($) |
| WF-RBS Commercial Mortgage Trust(a),(b),(c),(d) |
| Series 2012-C8 Class XA |
| 08/15/2045 | 2.030% | | 1,820,596 | 132,914 |
| Series 2012-C9 Class XA |
| 11/15/2045 | 2.195% | | 2,101,726 | 153,970 |
| WF-RBS Commercial Mortgage Trust(b),(c),(d) |
| Series 2014-C24 Class XA |
| 11/15/2047 | 1.104% | | 2,948,533 | 147,505 |
| Series 2014-LC14 Class XA |
| 03/15/2047 | 1.523% | | 2,568,278 | 138,980 |
Total Commercial Mortgage-Backed Securities - Non-Agency
(Cost $12,441,344) | 12,419,978 |
| Common Stocks 25.3% |
| Issuer | Shares | Value ($) |
| Consumer Discretionary 4.9% |
| Auto Components 0.2% |
| Federal-Mogul Holdings Corp.(e),(f),(g) | 146,838 | 1,468,380 |
| Hotels, Restaurants & Leisure 0.8% |
| ClubCorp Holdings, Inc. | 144,000 | 2,448,000 |
| Jack in the Box, Inc.(h) | 14,440 | 1,351,873 |
| Wyndham Worldwide Corp. | 5,844 | 582,530 |
| Total | | 4,382,403 |
| Media 3.6% |
| Scripps Networks Interactive, Inc., Class A(i) | 20,640 | 1,767,816 |
| Sky PLC | 86,028 | 1,063,482 |
| Starz Acquisition LLC(e),(f),(g) | 89,648 | 3,320,803 |
| TEGNA, Inc. | 128,675 | 1,623,878 |
| Time Warner, Inc.(h),(i) | 99,747 | 10,084,422 |
| Tribune Media Co.(i) | 70,859 | 2,839,320 |
| Total | | 20,699,721 |
| Specialty Retail 0.3% |
| Rent-A-Center, Inc.(i) | 138,398 | 1,674,616 |
| Total Consumer Discretionary | 28,225,120 |
| Consumer Staples 0.3% |
| Food & Staples Retailing —% |
| Safeway, Inc. Casa Ley CVR(e),(f),(g) | 287,209 | 291,489 |
| Safeway, Inc. PDC CVR(e),(f),(g) | 287,209 | 86 |
| Total | | 291,575 |
| Common Stocks (continued) |
| Issuer | Shares | Value ($) |
| Food Products —% |
| Dole Food Co., Inc.(e),(f),(g) | 96,900 | 67,830 |
| Tobacco 0.3% |
| British American Tobacco, ADR | 24,717 | 1,535,420 |
| Total Consumer Staples | 1,894,825 |
| Energy 0.1% |
| Energy Equipment & Services 0.1% |
| Ensco PLC, Class A | 178,142 | 757,104 |
| Total Energy | 757,104 |
| Financials 1.2% |
| Banks 0.3% |
| CIT Group, Inc. | 36,185 | 1,622,897 |
| Capital Markets 0.2% |
| CME Group, Inc. | 3,559 | 447,722 |
| Intercontinental Exchange, Inc. | 6,864 | 443,895 |
| Total | | 891,617 |
| Insurance 0.7% |
| Fidelity & Guaranty Life(i) | 70,985 | 2,218,282 |
| MetLife, Inc.(i) | 43,441 | 2,034,342 |
| Total | | 4,252,624 |
| Thrifts & Mortgage Finance —% |
| Astoria Financial Corp. | 4,292 | 84,080 |
| Total Financials | 6,851,218 |
| Health Care 6.7% |
| Health Care Equipment & Supplies 1.7% |
| CR Bard, Inc.(i) | 30,086 | 9,651,890 |
| Health Care Providers & Services 1.4% |
| Aetna, Inc.(i) | 15,388 | 2,426,687 |
| Air Methods Corp.(e),(f),(g) | 238,585 | 2,564,789 |
| VCA, Inc.(f) | 33,721 | 3,134,704 |
| Total | | 8,126,180 |
| Life Sciences Tools & Services 2.6% |
| PAREXEL International Corp.(f),(i) | 100,489 | 8,831,978 |
| VWR Corp.(f) | 190,577 | 6,292,853 |
| Total | | 15,124,831 |
The accompanying Notes to Consolidated Financial Statements are an integral part of this statement.
Multi-Manager Alternative Strategies Fund | Annual Report 2017
| 13 |
Consolidated Portfolio of Investments (continued)
August 31, 2017
| Common Stocks (continued) |
| Issuer | Shares | Value ($) |
| Pharmaceuticals 1.0% |
| Akorn, Inc.(f) | 104,189 | 3,427,818 |
| Bayer AG, Registered Shares | 5,376 | 687,985 |
| Neuroderm Ltd.(f),(i) | 38,214 | 1,480,792 |
| Paratek Pharmaceuticals, Inc.(f) | 15,253 | 430,135 |
| Total | | 6,026,730 |
| Total Health Care | 38,929,631 |
| Industrials 2.8% |
| Aerospace & Defense 1.3% |
| Rockwell Collins, Inc.(h) | 41,587 | 5,449,976 |
| Zodiac Aerospace | 67,262 | 1,946,152 |
| Total | | 7,396,128 |
| Electrical Equipment 0.3% |
| General Cable Corp. | 119,688 | 2,028,712 |
| Professional Services 0.7% |
| Advisory Board Co. (The)(f),(h) | 78,263 | 4,167,505 |
| Road & Rail 0.5% |
| Knight Transportation, Inc.(i) | 36,475 | 1,424,349 |
| Norfolk Southern Corp. | 10,336 | 1,245,694 |
| Total | | 2,670,043 |
| Total Industrials | 16,262,388 |
| Information Technology 6.3% |
| Communications Equipment 0.5% |
| Brocade Communications Systems, Inc. | 229,323 | 2,839,019 |
| Internet Software & Services 1.0% |
| WebMD Health Corp.(f) | 90,208 | 5,993,420 |
| IT Services 1.1% |
| Affecto OYJ | 234,204 | 1,260,214 |
| Conduent, Inc.(f),(h) | 89,597 | 1,479,246 |
| International Business Machines Corp. | 376 | 53,779 |
| Worldpay Group PLC | 609,184 | 3,284,860 |
| Total | | 6,078,099 |
| Semiconductors & Semiconductor Equipment 2.6% |
| Intel Corp. | 1,787 | 62,670 |
| NXP Semiconductors NV(f),(h),(i) | 114,746 | 12,961,708 |
| Rambus, Inc.(f),(i) | 150,279 | 1,949,119 |
| Total | | 14,973,497 |
| Common Stocks (continued) |
| Issuer | Shares | Value ($) |
| Software 1.1% |
| 8x8, Inc.(f),(i) | 231,806 | 3,280,055 |
| CA, Inc. | 1,735 | 57,567 |
| Gigamon, Inc.(f),(i) | 25,230 | 1,083,629 |
| Micro Focus International PLC | 70,663 | 2,076,939 |
| Mobileye NV(f) | 374 | 23,439 |
| Oracle Corp. | 1,477 | 74,337 |
| Total | | 6,595,966 |
| Total Information Technology | 36,480,001 |
| Materials 1.6% |
| Chemicals 1.5% |
| Ashland Global Holdings, Inc. | 25,899 | 1,607,033 |
| Clariant AG, Registered Shares | 74,697 | 1,802,480 |
| Huntsman Corp.(i) | 45,567 | 1,210,715 |
| Monsanto Co. | 35,908 | 4,208,418 |
| Total | | 8,828,646 |
| Metals & Mining 0.1% |
| Constellium NV, Class A(f) | 49,976 | 564,729 |
| Total Materials | 9,393,375 |
| Real Estate 0.6% |
| Equity Real Estate Investment Trusts (REITS) 0.6% |
| JBG SMITH Properties(f),(i) | 98,843 | 3,235,131 |
| Total Real Estate | 3,235,131 |
| Telecommunication Services 0.8% |
| Diversified Telecommunication Services 0.8% |
| Straight Path Communications, Inc., Class B(f) | 27,832 | 4,968,290 |
| Total Telecommunication Services | 4,968,290 |
Total Common Stocks
(Cost $144,404,198) | 146,997,083 |
| Convertible Bonds 0.5% |
| Issuer | Coupon
Rate | | Principal
Amount ($) | Value ($) |
| Technology 0.5% |
| EnerNOC, Inc. |
| 08/15/2019 | 2.250% | | 2,692,000 | 2,673,156 |
Total Convertible Bonds
(Cost $2,677,815) | 2,673,156 |
|
The accompanying Notes to Consolidated Financial Statements are an integral part of this statement.
| 14 | Multi-Manager Alternative Strategies Fund | Annual Report 2017 |
Consolidated Portfolio of Investments (continued)
August 31, 2017
| Corporate Bonds & Notes 12.1% |
| Issuer | Coupon
Rate | | Principal
Amount ($) | Value ($) |
| Airlines 0.1% |
| American Airlines Pass-Through Trust |
| Series 2016-2 Class AA |
| 06/15/2028 | 3.200% | | 243,500 | 244,832 |
| US Airways Pass-Through Trust |
| 04/22/2023 | 6.250% | | 306,323 | 344,007 |
| Total | 588,839 |
| Apartment REIT 0.1% |
| Mid-America Apartments LP |
| 10/15/2023 | 4.300% | | 325,000 | 348,195 |
| Automotive 0.2% |
| Ford Motor Credit Co. LLC |
| 05/15/2018 | 5.000% | | 500,000 | 510,761 |
| General Motors Financial Co., Inc. |
| 04/13/2020 | 2.650% | | 370,000 | 372,825 |
| Total | 883,586 |
| Banking 1.8% |
| Bank of America Corp. |
| 05/01/2018 | 5.650% | | 500,000 | 512,482 |
| 07/15/2018 | 6.500% | | 265,000 | 275,638 |
| 06/01/2019 | 7.625% | | 1,000,000 | 1,095,334 |
| Bank of America Corp.(b),(j) |
| 04/24/2028 | 3.705% | | 750,000 | 766,469 |
| Citigroup, Inc. |
| 05/15/2018 | 6.125% | | 1,750,000 | 1,802,831 |
| Discover Bank |
| 02/21/2018 | 2.000% | | 625,000 | 626,076 |
| Goldman Sachs Group, Inc. (The) |
| 04/01/2018 | 6.150% | | 1,000,000 | 1,024,783 |
| 01/23/2025 | 3.500% | | 500,000 | 509,482 |
| 05/22/2025 | 3.750% | | 400,000 | 412,424 |
| JPMorgan Chase & Co.(b),(j) |
| 05/01/2028 | 3.540% | | 750,000 | 763,782 |
| Morgan Stanley |
| 05/13/2019 | 7.300% | | 500,000 | 544,065 |
| Morgan Stanley(b) |
3-month USD LIBOR + 0.800%
02/14/2020 | 1.982% | | 500,000 | 502,375 |
3-month USD LIBOR + 0.930%
07/22/2022 | 2.243% | | 400,000 | 400,558 |
| Santander UK Group Holdings PLC |
| 10/16/2020 | 2.875% | | 500,000 | 508,540 |
| Wells Fargo & Co.(b),(j) |
| 05/22/2028 | 3.584% | | 740,000 | 756,392 |
| Total | 10,501,231 |
| Corporate Bonds & Notes (continued) |
| Issuer | Coupon
Rate | | Principal
Amount ($) | Value ($) |
| Cable and Satellite 0.8% |
| Altice US Finance I Corp.(a) |
| 05/15/2026 | 5.500% | | 200,000 | 211,365 |
| CCO Holdings LLC/Capital Corp.(a) |
| 05/01/2027 | 5.125% | | 146,000 | 150,463 |
| Charter Communications Operating LLC/Capital |
| 07/23/2025 | 4.908% | | 250,000 | 267,590 |
| CSC Holdings LLC(a) |
| 04/15/2027 | 5.500% | | 200,000 | 208,372 |
| Intelsat Jackson Holdings SA |
| 10/15/2020 | 7.250% | | 2,645,000 | 2,521,061 |
| 08/01/2023 | 5.500% | | 165,000 | 138,236 |
| Intelsat Jackson Holdings SA(a) |
| 07/15/2025 | 9.750% | | 1,248,000 | 1,269,604 |
| Sirius XM Radio, Inc.(a) |
| 08/01/2022 | 3.875% | | 70,000 | 71,192 |
| Total | 4,837,883 |
| Chemicals 0.0% |
| Axalta Coating Systems LLC(a) |
| 08/15/2024 | 4.875% | | 150,000 | 153,313 |
| Construction Machinery 0.0% |
| Ritchie Bros. Auctioneers, Inc.(a) |
| 01/15/2025 | 5.375% | | 140,000 | 144,931 |
| Consumer Cyclical Services 0.9% |
| West Corp.(a) |
| 07/15/2022 | 5.375% | | 5,421,000 | 5,475,470 |
| Consumer Products 0.1% |
| Central Garden & Pet Co. |
| 11/15/2023 | 6.125% | | 135,000 | 144,186 |
| First Quality Finance Co., Inc.(a) |
| 05/15/2021 | 4.625% | | 75,000 | 75,822 |
| 07/01/2025 | 5.000% | | 75,000 | 76,360 |
| Valvoline, Inc.(a) |
| 07/15/2024 | 5.500% | | 140,000 | 148,699 |
| Total | 445,067 |
| Electric 0.7% |
| Dominion Energy, Inc.(a),(b) |
3-month USD LIBOR + 0.550%
06/01/2019 | 1.473% | | 540,000 | 541,842 |
| Duke Energy Progress, Inc. |
| 08/15/2045 | 4.200% | | 425,000 | 464,850 |
| Kansas City Power & Light Co. |
| 03/01/2018 | 6.375% | | 500,000 | 510,850 |
The accompanying Notes to Consolidated Financial Statements are an integral part of this statement.
Multi-Manager Alternative Strategies Fund | Annual Report 2017
| 15 |
Consolidated Portfolio of Investments (continued)
August 31, 2017
| Corporate Bonds & Notes (continued) |
| Issuer | Coupon
Rate | | Principal
Amount ($) | Value ($) |
| Metropolitan Edison Co. |
| 01/15/2019 | 7.700% | | 500,000 | 536,429 |
| MidAmerican Energy Co. |
| 05/01/2046 | 4.250% | | 400,000 | 437,304 |
| Public Service Co. of New Mexico |
| 05/15/2018 | 7.950% | | 500,000 | 520,820 |
| Southwestern Electric Power Co. |
| 03/01/2018 | 5.875% | | 500,000 | 509,616 |
| Tucson Electric Power Co. |
| 11/15/2021 | 5.150% | | 450,000 | 487,841 |
| Total | 4,009,552 |
| Finance Companies 0.1% |
| International Lease Finance Corp.(a) |
| 09/01/2018 | 7.125% | | 500,000 | 525,329 |
| Food and Beverage 0.1% |
| Beam Suntory, Inc. |
| 06/15/2018 | 1.750% | | 500,000 | 499,235 |
| Kraft Heinz Foods Co. |
| 06/01/2046 | 4.375% | | 200,000 | 194,817 |
| Post Holdings, Inc.(a) |
| 03/01/2027 | 5.750% | | 150,000 | 155,931 |
| Total | 849,983 |
| Gaming 0.0% |
| GLP Capital LP/Financing II, Inc. |
| 04/15/2026 | 5.375% | | 80,000 | 86,888 |
| Sugarhouse HSP Gaming Prop. Mezz LP/Finance Corp.(a) |
| 05/15/2025 | 5.875% | | 150,000 | 147,267 |
| Total | 234,155 |
| Health Care 0.5% |
| Abbott Laboratories |
| 11/30/2046 | 4.900% | | 225,000 | 251,544 |
| Baylor Scott & White Holdings |
| 11/15/2026 | 2.650% | | 500,000 | 483,684 |
| Change Healthcare Holdings LLC/Finance, Inc.(a) |
| 03/01/2025 | 5.750% | | 100,000 | 102,867 |
| DaVita, Inc. |
| 07/15/2024 | 5.125% | | 68,000 | 69,305 |
| 05/01/2025 | 5.000% | | 80,000 | 81,173 |
| Fresenius Medical Care U.S. Finance II, Inc.(a) |
| 09/15/2018 | 6.500% | | 200,000 | 208,887 |
| Hackensack Meridian Health, Inc. |
| 07/01/2057 | 4.500% | | 300,000 | 335,073 |
| HCA, Inc. |
| 03/15/2024 | 5.000% | | 280,000 | 298,024 |
| Corporate Bonds & Notes (continued) |
| Issuer | Coupon
Rate | | Principal
Amount ($) | Value ($) |
| Kaiser Foundation Hospitals |
| 05/01/2027 | 3.150% | | 440,000 | 447,956 |
| MPH Acquisition Holdings LLC(a) |
| 06/01/2024 | 7.125% | | 70,000 | 75,272 |
| New York and Presbyterian Hospital (The) |
| 08/01/2036 | 3.563% | | 390,000 | 387,405 |
| Quintiles IMS, Inc.(a) |
| 05/15/2023 | 4.875% | | 140,000 | 145,559 |
| Tenet Healthcare Corp.(a) |
| 07/15/2024 | 4.625% | | 54,000 | 54,078 |
| Total | 2,940,827 |
| Healthcare Insurance 0.1% |
| Anthem, Inc. |
| 02/15/2019 | 7.000% | | 300,000 | 321,400 |
| Centene Corp. |
| 01/15/2025 | 4.750% | | 195,000 | 203,156 |
| Molina Healthcare, Inc. |
| 11/15/2022 | 5.375% | | 28,000 | 29,277 |
| Molina Healthcare, Inc.(a) |
| 06/15/2025 | 4.875% | | 75,000 | 73,639 |
| WellCare Health Plans, Inc. |
| 04/01/2025 | 5.250% | | 118,000 | 123,524 |
| Total | 750,996 |
| Healthcare REIT 0.4% |
| HCP, Inc. |
| 02/01/2019 | 3.750% | | 425,000 | 433,478 |
| Healthcare Realty Trust, Inc. |
| 04/15/2023 | 3.750% | | 600,000 | 616,028 |
| Ventas Realty LP |
| 04/01/2027 | 3.850% | | 300,000 | 308,585 |
| Welltower, Inc. |
| 03/15/2018 | 2.250% | | 750,000 | 751,627 |
| Total | 2,109,718 |
| Independent Energy 0.1% |
| Antero Resources Corp. |
| 03/01/2025 | 5.000% | | 75,000 | 74,178 |
| Concho Resources, Inc. |
| 10/01/2022 | 5.500% | | 75,000 | 77,213 |
| 04/01/2023 | 5.500% | | 75,000 | 77,246 |
| Diamondback Energy, Inc. |
| 11/01/2024 | 4.750% | | 140,000 | 140,566 |
| Gulfport Energy Corp.(a) |
| 05/15/2025 | 6.375% | | 21,000 | 20,667 |
The accompanying Notes to Consolidated Financial Statements are an integral part of this statement.
| 16 | Multi-Manager Alternative Strategies Fund | Annual Report 2017 |
Consolidated Portfolio of Investments (continued)
August 31, 2017
| Corporate Bonds & Notes (continued) |
| Issuer | Coupon
Rate | | Principal
Amount ($) | Value ($) |
| Newfield Exploration Co. |
| 07/01/2024 | 5.625% | | 72,000 | 76,652 |
| Parsley Energy LLC/Finance Corp.(a) |
| 01/15/2025 | 5.375% | | 25,000 | 25,098 |
| 08/15/2025 | 5.250% | | 60,000 | 60,024 |
| QEP Resources, Inc. |
| 10/01/2022 | 5.375% | | 27,000 | 26,233 |
| 05/01/2023 | 5.250% | | 48,000 | 45,862 |
| Total | 623,739 |
| Media and Entertainment 0.1% |
| 21st Century Fox America, Inc. |
| 05/18/2018 | 7.250% | | 400,000 | 415,311 |
| AMC Networks, Inc. |
| 08/01/2025 | 4.750% | | 75,000 | 75,128 |
| TEGNA, Inc.(a) |
| 09/15/2024 | 5.500% | | 45,000 | 47,296 |
| Total | 537,735 |
| Midstream 0.4% |
| Cheniere Corpus Christi Holdings LLC(a) |
| 06/30/2027 | 5.125% | | 45,000 | 46,510 |
| Enbridge Energy Partners LP |
| 10/15/2045 | 7.375% | | 137,000 | 176,969 |
| Kinder Morgan Energy Partners LP |
| 09/01/2023 | 3.500% | | 200,000 | 202,279 |
| 05/01/2024 | 4.300% | | 129,000 | 134,823 |
| NGPL PipeCo LLC(a) |
| 08/15/2022 | 4.375% | | 95,000 | 97,649 |
| Plains All American Pipeline LP/Finance Corp. |
| 11/01/2024 | 3.600% | | 275,000 | 270,721 |
| Rockies Express Pipeline LLC(a) |
| 04/15/2020 | 5.625% | | 100,000 | 105,065 |
| Sabine Pass Liquefaction LLC |
| 03/01/2025 | 5.625% | | 200,000 | 220,463 |
| Texas Eastern Transmission LP(a) |
| 10/15/2022 | 2.800% | | 500,000 | 497,682 |
| Williams Partners LP |
| 03/15/2022 | 3.600% | | 200,000 | 206,338 |
| 09/15/2025 | 4.000% | | 225,000 | 231,778 |
| Total | 2,190,277 |
| Natural Gas 0.1% |
| Vectren Utility Holdings, Inc. |
| 08/01/2018 | 5.750% | | 500,000 | 516,708 |
| Office REIT 0.1% |
| Boston Properties LP |
| 02/01/2024 | 3.800% | | 500,000 | 528,563 |
| Corporate Bonds & Notes (continued) |
| Issuer | Coupon
Rate | | Principal
Amount ($) | Value ($) |
| Oil Field Services 0.5% |
| Atwood Oceanics, Inc. |
| 02/01/2020 | 6.500% | | 3,093,000 | 3,024,496 |
| Transocean Proteus Ltd.(a) |
| 12/01/2024 | 6.250% | | 95,000 | 99,408 |
| Total | 3,123,904 |
| Other Industry 0.0% |
| KAR Auction Services, Inc.(a) |
| 06/01/2025 | 5.125% | | 42,000 | 43,423 |
| Other REIT 0.1% |
| American Campus Communities Operating Partnership LP |
| 04/15/2023 | 3.750% | | 500,000 | 519,687 |
| Packaging 0.1% |
| Ardagh Packaging Finance PLC/Holdings USA, Inc.(a) |
| 09/15/2022 | 4.250% | | 200,000 | 205,224 |
| Crown Americas LLC/Capital Corp. V |
| 09/30/2026 | 4.250% | | 115,000 | 115,424 |
| Sealed Air Corp.(a) |
| 12/01/2022 | 4.875% | | 140,000 | 147,522 |
| Total | 468,170 |
| Paper 0.4% |
| Graphic Packaging International, Inc. |
| 11/15/2022 | 4.875% | | 150,000 | 159,068 |
| Tembec Industries, Inc.(a) |
| 12/15/2019 | 9.000% | | 2,000,000 | 2,060,218 |
| Total | 2,219,286 |
| Pharmaceuticals 0.6% |
| Amgen, Inc. |
| 05/01/2045 | 4.400% | | 200,000 | 209,627 |
| AstraZeneca PLC |
| 06/12/2027 | 3.125% | | 300,000 | 299,337 |
| Celgene Corp. |
| 08/15/2045 | 5.000% | | 200,000 | 228,163 |
| Eagle Holding Co., II LLC PIK(a) |
| 05/15/2022 | 7.625% | | 75,000 | 77,421 |
| Gilead Sciences, Inc. |
| 03/01/2027 | 2.950% | | 200,000 | 198,790 |
| 03/01/2047 | 4.150% | | 110,000 | 112,990 |
| Valeant Pharmaceuticals International, Inc.(a) |
| 10/15/2020 | 6.375% | | 1,756,000 | 1,740,941 |
| 04/15/2025 | 6.125% | | 375,000 | 315,863 |
| Total | 3,183,132 |
The accompanying Notes to Consolidated Financial Statements are an integral part of this statement.
Multi-Manager Alternative Strategies Fund | Annual Report 2017
| 17 |
Consolidated Portfolio of Investments (continued)
August 31, 2017
| Corporate Bonds & Notes (continued) |
| Issuer | Coupon
Rate | | Principal
Amount ($) | Value ($) |
| Property & Casualty 0.7% |
| Ambac Assurance Corp.(a) |
| Subordinated |
| 06/07/2020 | 5.100% | | 2,223,607 | 2,885,130 |
| Farmers Exchange Capital III(a),(b),(j) |
| Subordinated |
| 10/15/2054 | 5.454% | | 500,000 | 541,228 |
| Nationwide Mutual Insurance Co.(a),(b) |
| Subordinated |
3-month USD LIBOR + 2.290%
12/15/2024 | 3.536% | | 450,000 | 446,493 |
| Total | 3,872,851 |
| Refining 0.1% |
| Phillips 66(a),(b) |
3-month USD LIBOR + 0.650%
04/15/2019 | 1.786% | | 500,000 | 500,527 |
| Restaurants 0.1% |
| 1011778 BC Unlimited Liability Co./New Red Finance, Inc.(a) |
| 05/15/2024 | 4.250% | | 120,000 | 122,062 |
| KFC Holding Co./Pizza Hut Holdings LLC/Taco Bell of America LLC(a) |
| 06/01/2024 | 5.000% | | 145,000 | 151,128 |
| Total | 273,190 |
| Retail REIT 0.1% |
| WEA Finance LLC/Westfield UK & Europe Finance PLC(a) |
| 09/17/2019 | 2.700% | | 500,000 | 504,841 |
| Retailers 0.9% |
| Cumberland Farms, Inc.(a) |
| 05/01/2025 | 6.750% | | 70,000 | 75,110 |
| Rite Aid Corp. |
| 03/15/2020 | 9.250% | | 5,151,000 | 5,327,772 |
| Total | 5,402,882 |
| Technology 1.3% |
| Avaya, Inc.(a),(k) |
| 04/01/2019 | 3.500% | | 4,908,000 | 4,141,125 |
| 03/01/2021 | 0.000% | | 2,397,000 | 76,582 |
| CDK Global, Inc.(a) |
| 06/01/2027 | 4.875% | | 35,000 | 35,509 |
| First Data Corp.(a) |
| 01/15/2024 | 5.000% | | 217,000 | 226,072 |
| Neustar, Inc. |
| 01/15/2023 | 4.500% | | 2,381,000 | 2,458,913 |
| QUALCOMM, Inc. |
| 05/20/2019 | 1.850% | | 500,000 | 502,018 |
| Total | 7,440,219 |
| Corporate Bonds & Notes (continued) |
| Issuer | Coupon
Rate | | Principal
Amount ($) | Value ($) |
| Tobacco 0.1% |
| Altria Group, Inc. |
| 11/10/2018 | 9.700% | | 500,000 | 546,176 |
| BAT Capital Corp.(a) |
| 08/14/2020 | 2.297% | | 300,000 | 301,568 |
| Total | 847,744 |
| Wireless 0.1% |
| GTT Communications, Inc.(a) |
| 12/31/2024 | 7.875% | | 50,000 | 53,406 |
| SoftBank Group Corp.(a) |
| 04/15/2020 | 4.500% | | 200,000 | 206,652 |
| Sprint Communications, Inc.(a) |
| 11/15/2018 | 9.000% | | 264,000 | 284,689 |
| T-Mobile USA, Inc. |
| 04/28/2023 | 6.836% | | 210,000 | 222,954 |
| Total | 767,701 |
| Wirelines 0.3% |
| AT&T, Inc. |
| 08/14/2037 | 4.900% | | 145,000 | 146,607 |
| 06/15/2044 | 4.800% | | 300,000 | 292,489 |
| 03/09/2048 | 4.500% | | 300,000 | 276,576 |
| Level 3 Financing, Inc. |
| 02/01/2023 | 5.625% | | 100,000 | 103,061 |
| Qwest Corp. |
| 12/01/2021 | 6.750% | | 90,000 | 98,625 |
| Verizon Communications, Inc. |
| 04/15/2049 | 5.012% | | 525,000 | 527,094 |
| Zayo Group LLC/Capital, Inc.(a) |
| 01/15/2027 | 5.750% | | 70,000 | 74,166 |
| Total | 1,518,618 |
Total Corporate Bonds & Notes
(Cost $68,884,707) | 69,882,272 |
| Exchange-Traded Funds 0.1% |
| | Shares | Value ($) |
| Technology Select Sector SPDR Fund | 11,411 | 671,309 |
Total Exchange-Traded Funds
(Cost $634,266) | 671,309 |
The accompanying Notes to Consolidated Financial Statements are an integral part of this statement.
| 18 | Multi-Manager Alternative Strategies Fund | Annual Report 2017 |
Consolidated Portfolio of Investments (continued)
August 31, 2017
| Foreign Government Obligations(l) 0.5% |
| Issuer | Coupon
Rate | | Principal
Amount ($) | Value ($) |
| Brazil 0.1% |
| Brazilian Government International Bond |
| 01/05/2023 | 2.625% | | 325,000 | 310,241 |
| Colombia 0.1% |
| Colombia Government International Bond |
| 01/28/2026 | 4.500% | | 300,000 | 322,346 |
| Croatia 0.0% |
| Croatia Government International Bond(a) |
| 07/14/2020 | 6.625% | | 120,000 | 132,631 |
| Dominican Republic 0.0% |
| Dominican Republic International Bond(a) |
| 01/28/2024 | 6.600% | | 100,000 | 112,715 |
| Hungary 0.0% |
| Hungary Government International Bond |
| 11/22/2023 | 5.750% | | 140,000 | 163,659 |
| Indonesia 0.1% |
| PT Pertamina Persero(a) |
| 05/20/2023 | 4.300% | | 400,000 | 419,139 |
| Kazakhstan 0.0% |
| Kazakhstan Government International Bond(a) |
| 07/21/2025 | 5.125% | | 200,000 | 224,156 |
| Mexico 0.1% |
| Petroleos Mexicanos(a) |
| 03/13/2022 | 5.375% | | 320,000 | 343,087 |
| Peru 0.1% |
| Corporación Financiera de Desarrollo SA(a) |
| 07/15/2025 | 4.750% | | 220,000 | 238,251 |
| Russian Federation 0.0% |
| Russian Foreign Bond - Eurobond(a) |
| 09/16/2023 | 4.875% | | 200,000 | 218,810 |
| South Africa 0.0% |
| South Africa Government International Bond |
| 01/17/2024 | 4.665% | | 100,000 | 103,628 |
| Turkey 0.0% |
| Turkey Government International Bond |
| 03/23/2023 | 3.250% | | 240,000 | 230,474 |
| Uruguay 0.0% |
| Uruguay Government International Bond |
| 10/27/2027 | 4.375% | | 125,000 | 135,309 |
Total Foreign Government Obligations
(Cost $2,896,999) | 2,954,446 |
| Limited Partnerships 1.1% |
| Issuer | Shares | Value ($) |
| Financials 1.1% |
| Capital Markets 1.1% |
| Fortress Investment Group LLC(i) | 772,064 | 6,145,630 |
| Total Financials | 6,145,630 |
Total Limited Partnerships
(Cost $6,174,886) | 6,145,630 |
| Municipal Bonds 0.6% |
| Issue Description | Coupon
Rate | | Principal
Amount ($) | Value ($) |
| Higher Education 0.1% |
| University of California |
| Revenue Bonds |
| Taxable General |
| Series 2013-AJ |
| 05/15/2031 | 4.601% | | 500,000 | 566,580 |
| Local General Obligation 0.0% |
| Los Angeles Unified School District |
| Unlimited General Obligation Bonds |
| Build America Bonds -Taxable |
| Series 2009 |
| 07/01/2029 | 5.755% | | 250,000 | 312,360 |
| Sales Tax 0.0% |
| Santa Clara Valley Transportation Authority |
| Revenue Bonds |
| Build America Bonds |
| Series 2010 |
| 04/01/2032 | 5.876% | | 250,000 | 312,203 |
| Special Non Property Tax 0.1% |
| New York State Dormitory Authority |
| Revenue Bonds |
| Build America Bonds |
| 03/15/2030 | 5.500% | | 500,000 | 598,360 |
| State General Obligation 0.1% |
| State of California |
| Unlimited General Obligation Bonds |
| Taxable High Speed Passenger Train |
| Series 2017 |
| 04/01/2047 | 2.193% | | 500,000 | 502,720 |
| Transportation 0.1% |
| Metropolitan Transportation Authority |
| Revenue Bonds |
| Build America Bonds |
| 11/15/2031 | 6.548% | | 250,000 | 330,547 |
The accompanying Notes to Consolidated Financial Statements are an integral part of this statement.
Multi-Manager Alternative Strategies Fund | Annual Report 2017
| 19 |
Consolidated Portfolio of Investments (continued)
August 31, 2017
| Municipal Bonds (continued) |
| Issue Description | Coupon
Rate | | Principal
Amount ($) | Value ($) |
| Water & Sewer 0.2% |
| City of Houston Combined Utility System |
| Revenue Bonds |
| Taxable 1st Lien |
| Series 2014B |
| 05/15/2028 | 3.828% | | 500,000 | 534,235 |
| Metropolitan Water District of Southern California |
| Revenue Bonds |
| Build America Bonds |
| 07/01/2040 | 6.947% | | 400,000 | 451,352 |
| Total | 985,587 |
Total Municipal Bonds
(Cost $3,541,316) | 3,608,357 |
| Mutual Funds 1.8% |
| Issuer | Shares | Value ($) |
| Information Technology 1.8% |
| Internet Software & Services 1.8% |
| Altaba, Inc.(i) | 160,070 | 10,257,286 |
| Total Information Technology | 10,257,286 |
Total Mutual Funds
(Cost $8,383,738) | 10,257,286 |
| Residential Mortgage-Backed Securities - Agency 0.1% |
| Issuer | Coupon
Rate | | Principal
Amount ($) | Value ($) |
| Federal Home Loan Mortgage Corp.(b) |
| CMO Series 4638 Class UF |
1-month USD LIBOR + 1.000%
09/15/2044 | 2.232% | | 712,156 | 718,638 |
Total Residential Mortgage-Backed Securities - Agency
(Cost $715,715) | 718,638 |
|
| Residential Mortgage-Backed Securities - Non-Agency 5.5% |
| | | | |
| Alternative Loan Trust(b),(c) |
| CMO Series 2005-43 Class 1A |
| 10/25/2035 | 2.998% | | 691,585 | 669,676 |
| American Home Mortgage Investment Trust(b) |
| CMO Series 2005-1 Class 6A |
6-month USD LIBOR + 2.000%
06/25/2045 | 3.456% | | 683,024 | 691,334 |
| Ameriquest Mortgage Securities, Inc. Asset Backed Pass-Through Certificates(b) |
| CMO Series 2005-R11 Class A1 |
1-month USD LIBOR + 0.230%
01/25/2036 | 1.254% | | 720,490 | 719,318 |
| CMO Series 2005-R11 Class M1 |
1-month USD LIBOR + 0.450%
01/25/2036 | 1.474% | | 500,000 | 494,968 |
| Residential Mortgage-Backed Securities - Non-Agency (continued) |
| Issuer | Coupon
Rate | | Principal
Amount ($) | Value ($) |
| ASG Resecuritization Trust(a),(b) |
| CMO Series 2010-3 Class 3A68 |
1-month USD LIBOR + 0.290%
12/28/2045 | 1.522% | | 509,218 | 506,859 |
| Asset-Backed Securities Corp. Home Equity Loan Trust(b) |
| CMO Series 2004-HE6 Class M1 |
1-month USD LIBOR + 0.945%
09/25/2034 | 2.161% | | 556,101 | 554,640 |
| Banc of America Funding Trust(a),(b),(c) |
| CMO Series 2016-R1 Class A1 |
| 03/25/2040 | 2.500% | | 606,082 | 614,265 |
| Banc of America Funding Trust(b) |
| Series 2006-G Class 2A1 |
1-month USD LIBOR + 0.220%
07/20/2036 | 1.451% | | 602,690 | 606,714 |
| BCAP LLC(a),(b) |
| CMO Series 2014-RR2 Class 6A1 |
1-month USD LIBOR + 0.240%
10/26/2036 | 1.909% | | 683,951 | 675,028 |
| BCAP LLC Trust(a),(b),(c) |
| CMO Series 2012-RR11 Class 2A3 |
| 08/26/2036 | 1.336% | | 652,876 | 652,693 |
| BCAP LLC Trust(a),(b) |
| CMO Series 2014-RR1 Class 3A3 |
1-month USD LIBOR + 0.160%
03/26/2037 | 2.177% | | 686,518 | 672,650 |
| CMO Series 2014-RR5 Class 1A4 |
3-month USD LIBOR + 0.225%
01/26/2036 | 1.445% | | 849,000 | 803,324 |
| Bear Stearns ALT-A Trust(b) |
| CMO Series 2004-6 Class M1 |
1-month USD LIBOR + 0.825%
07/25/2034 | 2.059% | | 788,770 | 740,974 |
| Bear Stearns Mortgage Funding Trust(b) |
| Series 2006-AR4 Class A1 |
1-month USD LIBOR + 0.210%
12/25/2036 | 1.444% | | 667,105 | 633,638 |
| Bear Stearns Trust(b) |
| CMO Series 2005-1 Class A1 |
1-month USD LIBOR + 0.280%
01/25/2035 | 1.776% | | 580,545 | 585,332 |
| Centex Home Equity Loan Trust(b) |
| CMO Series 2005-A Class M1 |
1-month USD LIBOR + 0.720%
01/25/2035 | 1.936% | | 523,672 | 496,647 |
| CMO Series 2005-D Class M3 |
1-month USD LIBOR + 0.480%
10/25/2035 | 1.712% | | 900,000 | 896,787 |
| CIM Trust(a),(b),(c) |
| CMO Series 2017-5 Class A1 |
| 05/25/2057 | 2.500% | | 616,330 | 616,686 |
The accompanying Notes to Consolidated Financial Statements are an integral part of this statement.
| 20 | Multi-Manager Alternative Strategies Fund | Annual Report 2017 |
Consolidated Portfolio of Investments (continued)
August 31, 2017
| Residential Mortgage-Backed Securities - Non-Agency (continued) |
| Issuer | Coupon
Rate | | Principal
Amount ($) | Value ($) |
| Citigroup Mortgage Loan Trust(b) |
| CMO Series 2006-HE1 Class M2 |
1-month USD LIBOR + 0.510%
01/25/2036 | 1.726% | | 443,502 | 442,889 |
| CMO Series 2006-HE1 Class M3 |
1-month USD LIBOR + 0.540%
01/25/2036 | 1.756% | | 750,000 | 748,465 |
| COLT Mortgage Loan Trust(a),(b),(c) |
| CMO Series 2017-1 Class A1 |
| 05/27/2047 | 2.614% | | 589,726 | 592,752 |
| Countrywide Asset-Backed Certificates(b) |
| CMO Series 2007-13 Class 2A1 |
1-month USD LIBOR + 0.900%
10/25/2047 | 2.134% | | 294,048 | 292,968 |
| CMO Series 2007-13 Class 2A2 |
1-month USD LIBOR + 0.800%
10/25/2047 | 2.034% | | 584,533 | 578,721 |
| Credit Suisse Mortgage Capital Trust(a),(b) |
| CMO Series 2014-3R Class 5A3 |
1-month USD LIBOR + 0.190%
06/27/2036 | 1.422% | | 523,320 | 522,396 |
| Credit Suisse Mortgage Capital Trust(a) |
| CMO Series 2015-2R Class 1A1 |
| 08/27/2037 | 3.000% | | 705,672 | 710,500 |
| CMO Series 20154R Class 5A1 |
| 10/27/2036 | 3.000% | | 592,219 | 596,893 |
| Credit-Based Asset Servicing & Securitization LLC(b) |
| CMO Series 2005-CB4 Class M2 |
1-month USD LIBOR + 0.450%
07/25/2035 | 1.666% | | 560,000 | 556,339 |
| Deephaven Residential Mortgage Trust(a),(b),(c) |
| CMO Series 2017-1A Class A1 |
| 12/26/2046 | 2.725% | | 594,735 | 594,892 |
| First Franklin Mortgage Loan Trust(b) |
| CMO Series 2004-FF11 Class M3 |
1-month USD LIBOR + 0.900%
01/25/2035 | 2.116% | | 747,906 | 734,503 |
| CMO Series 2006-FF4 Class A3 |
1-month USD LIBOR + 0.280%
03/25/2036 | 1.304% | | 700,000 | 676,447 |
| First Horizon Mortgage Pass-Through Trust(b),(c) |
| CMO Series 2005-AR4 Class 2A1 |
| 10/25/2035 | 3.142% | | 711,970 | 677,549 |
| GMACM Mortgage Loan Trust(b),(c) |
| CMO Series 2006-AR1 Class 1A1 |
| 04/19/2036 | 3.853% | | 709,806 | 671,427 |
| GSAMP Trust(b) |
| CMO Series 2005-WMC3 Class A2C |
1-month USD LIBOR + 0.330%
12/25/2035 | 1.354% | | 810,000 | 714,708 |
| Residential Mortgage-Backed Securities - Non-Agency (continued) |
| Issuer | Coupon
Rate | | Principal
Amount ($) | Value ($) |
| Home Equity Mortgage Loan Asset-Backed Trust(b) |
| CMO Series 2005-D Class AII4 |
1-month USD LIBOR + 0.350%
03/25/2036 | 1.584% | | 735,000 | 732,787 |
| Impac CMB Trust(b) |
| CMO Series 2004-8 Class 2A1 (FGIC) |
1-month USD LIBOR + 0.700%
10/25/2034 | 1.934% | | 719,923 | 707,353 |
| Impac Secured Assets Corp.(b) |
| CMO Series 2004-3 Class 2A2 |
1-month USD LIBOR + 0.640%
11/25/2034 | 1.874% | | 636,227 | 640,046 |
| JP Morgan Mortgage Acquisition Trust(b) |
| CMO Series 2007-HE1 Class AV4 |
1-month USD LIBOR + 0.280%
03/25/2047 | 1.304% | | 1,103,000 | 889,399 |
| JPMorgan Mortgage Acquisition Trust(b) |
| CMO Series 2007-CH2 Class AV5 |
1-month USD LIBOR + 0.260%
01/25/2037 | 1.284% | | 630,000 | 611,926 |
| Morgan Stanley Mortgage Loan Trust(b) |
| CMO Series 2005-6AR Class 1A1 |
1-month USD LIBOR + 0.280%
11/25/2035 | 1.514% | | 510,962 | 513,240 |
| Nomura Resecuritization Trust(a),(b) |
| CMO Series 2014-6R Class 2A1 |
1-month USD LIBOR + 0.160%
03/26/2037 | 2.311% | | 580,187 | 560,692 |
| Nomura Resecuritization Trust(a),(b),(c) |
| CMO Series 2015-6R Class 2A1 |
| 01/26/2037 | 4.000% | | 470,871 | 474,450 |
| Option One Mortgage Loan Trust(b) |
1-month USD LIBOR + 0.440%
05/25/2035 | 1.876% | | 689,049 | 689,226 |
| RALI Series Trust(b) |
| CMO Series 2006-QA6 Class A3 |
1-month USD LIBOR + 0.190%
07/25/2036 | 1.424% | | 909,682 | 830,748 |
| RAMP Series Trust(b) |
| CMO Series 2005-RZ4 Class M1 |
1-month USD LIBOR + 0.480%
11/25/2035 | 1.714% | | 661,166 | 661,009 |
| RAMP Trust(b) |
| Series 2005-RS4 Class M4 |
1-month USD LIBOR + 0.640%
04/25/2035 | 1.984% | | 745,000 | 738,509 |
| Specialty Underwriting & Residential Finance Trust(b) |
| CMO Series 2005-AB3 Class A1A |
1-month USD LIBOR + 0.260%
09/25/2036 | 1.494% | | 725,679 | 720,843 |
The accompanying Notes to Consolidated Financial Statements are an integral part of this statement.
Multi-Manager Alternative Strategies Fund | Annual Report 2017
| 21 |
Consolidated Portfolio of Investments (continued)
August 31, 2017
| Residential Mortgage-Backed Securities - Non-Agency (continued) |
| Issuer | Coupon
Rate | | Principal
Amount ($) | Value ($) |
| Structured Adjustable Rate Mortgage Loan Trust(b) |
| CMO Series 2005-19XS Class 2A1 |
1-month USD LIBOR + 0.300%
10/25/2035 | 1.534% | | 688,808 | 677,679 |
| Structured Asset Investment Loan Trust(b) |
| CMO Series 2005-10 Class A6 |
1-month USD LIBOR + 0.330%
12/25/2035 | 1.564% | | 695,805 | 688,460 |
| Washington Mutual Mortgage Pass-Through Certificates WMALT Trust(b) |
| CMO Series 2006-AR2 Class A1A |
1-year MTA + 0.940%
04/25/2046 | 1.716% | | 508,126 | 456,555 |
| Wells Fargo Alternative Loan Trust(b) |
| CMO Series 2005-2 Class M1 |
1-month USD LIBOR + 0.675%
10/25/2035 | 1.446% | | 733,366 | 731,706 |
Total Residential Mortgage-Backed Securities - Non-Agency
(Cost $31,806,318) | 32,067,610 |
|
| Treasury Bills 9.2% |
| Issuer | Effective
Yield | | Principal
Amount ($) | Value ($) |
| United States 9.2% |
| U.S. Treasury Bills |
| 09/07/2017 | 0.930% | | 102,000 | 101,982 |
| 01/25/2018 | 1.020% | | 27,969,000 | 27,854,348 |
| 02/01/2018 | 1.060% | | 15,144,000 | 15,076,820 |
| 02/08/2018 | 1.060% | | 7,035,000 | 7,002,280 |
| 02/15/2018 | 1.060% | | 3,227,000 | 3,211,272 |
| Total | | | | 53,246,702 |
| Total | 53,246,702 |
Total Treasury Bills
(Cost $53,223,745) | 53,246,702 |
| Options Purchased Calls 0.0% |
| | | | | Value ($) |
| (Cost $21,013) | 9,708 |
|
| Options Purchased Puts 0.0% |
| | | | |
| (Cost $112,957) | 68,876 |
| Money Market Funds 31.6% |
| | Shares | Value ($) |
| Columbia Short-Term Cash Fund, 1.146%(m),(n) | 183,395,540 | 183,395,540 |
Total Money Market Funds
(Cost $183,393,506) | 183,395,540 |
Total Investments
(Cost $559,721,949) | 565,708,074 |
|
| Investments Sold Short (10.0) |
|
| Common Stocks (8.2)% |
| Issuer | Shares | Value ($) |
| Consumer Discretionary (0.8)% |
| Hotels, Restaurants & Leisure (0.5)% |
| Dunkin’ Brands Group, Inc. | (5,198) | (268,009) |
| Marriott Vacations World | (9,217) | (1,072,490) |
| McDonald’s Corp. | (1,993) | (318,820) |
| Sonic Corp. | (10,368) | (242,715) |
| Wendy’s Co. (The) | (17,935) | (267,590) |
| Yum! Brands, Inc. | (4,245) | (326,101) |
| Total | | (2,495,725) |
| Media (0.2)% |
| Discovery Communications, Inc., Class C(f) | (11,352) | (238,505) |
| Nexstar Broadcasting Group, Inc., Class A | (6,858) | (412,852) |
| Sinclair Broadcast Group, Inc., Class A | (21,657) | (655,124) |
| Total | | (1,306,481) |
| Specialty Retail (0.1)% |
| Aaron’s, Inc. | (7,564) | (334,858) |
| Conn’s, Inc.(f) | (15,798) | (274,096) |
| Total | | (608,954) |
| Total Consumer Discretionary | (4,411,160) |
| Consumer Staples (0.1)% |
| Food & Staples Retailing (0.1)% |
| CVS Health Corp. | (5,137) | (397,296) |
| Total Consumer Staples | (397,296) |
| Energy (0.1)% |
| Energy Equipment & Services (0.1)% |
| Atwood Oceanics, Inc.(f) | (111,333) | (731,458) |
| Total Energy | (731,458) |
| Financials (0.6)% |
| Banks (0.0)% |
| Sterling Bancorp | (3,743) | (84,030) |
The accompanying Notes to Consolidated Financial Statements are an integral part of this statement.
| 22 | Multi-Manager Alternative Strategies Fund | Annual Report 2017 |
Consolidated Portfolio of Investments (continued)
August 31, 2017
| Investments Sold Short (continued) |
|
| Common Stocks (continued) |
| Issuer | Shares | Value ($) |
| Capital Markets (0.2)% |
| CBOE Holdings, Inc. | (11,116) | (1,121,493) |
| Insurance (0.4)% |
| Aflac, Inc. | (7,895) | (651,732) |
| Prudential Financial, Inc. | (5,870) | (599,210) |
| Unum Group | (13,467) | (648,840) |
| Total | | (1,899,782) |
| Total Financials | (3,105,305) |
| Health Care (1.0)% |
| Health Care Equipment & Supplies (0.5)% |
| Becton Dickinson and Co. | (14,576) | (2,907,037) |
| Health Care Providers & Services (0.3)% |
| Anthem, Inc. | (2,350) | (460,694) |
| UnitedHealth Group, Inc. | (7,234) | (1,438,843) |
| Total | | (1,899,537) |
| Life Sciences Tools & Services (0.1)% |
| Cambrex Corp.(f) | (4,174) | (217,465) |
| Pharmaceuticals (0.1)% |
| Merck KGaA | (4,772) | (524,114) |
| Valeant Pharmaceuticals International, Inc.(f) | (10,167) | (136,441) |
| Total | | (660,555) |
| Total Health Care | (5,684,594) |
| Industrials (0.6)% |
| Aerospace & Defense (0.1)% |
| Hexcel Corp. | (10,643) | (572,274) |
| Air Freight & Logistics (0.0)% |
| C.H. Robinson Worldwide, Inc. | (3,062) | (216,269) |
| Machinery (0.0)% |
| Greenbrier Companies, Inc. (The) | (1,411) | (60,532) |
| Road & Rail (0.5)% |
| CSX Corp. | (30,848) | (1,548,570) |
| Heartland Express, Inc. | (11,871) | (263,180) |
| JB Hunt Transport Services, Inc. | (2,559) | (253,060) |
| Landstar System, Inc. | (2,726) | (254,472) |
| Werner Enterprises, Inc. | (8,893) | (294,358) |
| Total | | (2,613,640) |
| Investments Sold Short (continued) |
|
| Common Stocks (continued) |
| Issuer | Shares | Value ($) |
| Trading Companies & Distributors (0.0)% |
| GATX Corp. | (1,032) | (62,518) |
| Total Industrials | (3,525,233) |
| Information Technology (3.5)% |
| Internet Software & Services (1.6)% |
| Alibaba Group Holding Ltd., ADR(f) | (46,870) | (8,049,454) |
| Five9, Inc.(f) | (17,873) | (384,269) |
| LogMeIn, Inc. | (9,139) | (1,045,502) |
| Total | | (9,479,225) |
| IT Services (1.0)% |
| CGI Group, Inc., Class A(f) | (8,063) | (410,004) |
| Convergys Corp. | (6,873) | (161,515) |
| DXC Technology Co. | (10,795) | (917,575) |
| Genpact Ltd. | (14,335) | (407,831) |
| Infosys Ltd., ADR | (25,087) | (376,305) |
| MoneyGram International, Inc.(f) | (24,702) | (389,303) |
| Sykes Enterprises, Inc.(f) | (5,356) | (142,791) |
| Vantiv, Inc., Class A(f) | (40,937) | (2,893,837) |
| Total | | (5,699,161) |
| Semiconductors & Semiconductor Equipment (0.3)% |
| Versum Materials, Inc. | (31,268) | (1,154,727) |
| Xcerra Corp.(f) | (43,643) | (428,574) |
| Total | | (1,583,301) |
| Software (0.6)% |
| Micro Focus International PLC, ADR(f) | (107,818) | (3,180,631) |
| Symantec Corp. | (13,234) | (396,755) |
| Total | | (3,577,386) |
| Total Information Technology | (20,339,073) |
| Materials (0.5)% |
| Chemicals (0.5)% |
| Eastman Chemical Co. | (9,276) | (799,591) |
| International Flavors & Fragrances, Inc. | (3,512) | (480,617) |
| Olin Corp. | (18,018) | (580,720) |
| Platform Specialty Products Corp.(f) | (46,127) | (538,764) |
The accompanying Notes to Consolidated Financial Statements are an integral part of this statement.
Multi-Manager Alternative Strategies Fund | Annual Report 2017
| 23 |
Consolidated Portfolio of Investments (continued)
August 31, 2017
| Investments Sold Short (continued) |
|
| Common Stocks (continued) |
| Issuer | Shares | Value ($) |
| Sensient Technologies Corp. | (5,848) | (421,933) |
| The Chemours Co. | (4,152) | (203,739) |
| Total | | (3,025,364) |
| Total Materials | (3,025,364) |
| Real Estate (0.3)% |
| Equity Real Estate Investment Trusts (REITS) (0.3)% |
| Washington Real Estate Investment Trust | (57,131) | (1,877,325) |
| Total Real Estate | (1,877,325) |
| Telecommunication Services (0.7)% |
| Diversified Telecommunication Services (0.7)% |
| AT&T, Inc. | (75,512) | (2,828,680) |
| IDT Corp., Class B | (69,407) | (1,020,977) |
| Vonage Holdings Corp.(f) | (48,911) | (405,961) |
| Total | | (4,255,618) |
| Total Telecommunication Services | (4,255,618) |
Total Common Stocks
(Proceeds $44,945,583) | (47,352,426) |
|
|
| Corporate Bonds & Notes (0.3)% |
| Issuer | Coupon
Rate | | Principal
Amount ($) | Value ($) |
| Cable and Satellite (0.1)% |
| Intelsat Luxembourg SA |
| 06/01/2021 | 7.750% | | (1,102,000) | (697,015) |
| Investments Sold Short (continued) |
|
| Corporate Bonds & Notes (continued) |
| Issuer | Coupon
Rate | | Principal
Amount ($) | Value ($) |
| Retailers (0.2)% |
| Limited Brands, Inc. |
| 02/15/2022 | 5.625% | | (1,271,000) | (1,341,766) |
Total Corporate Bonds & Notes
(Proceeds $1,975,537) | (2,038,781) |
|
|
| Exchange-Traded Funds (1.5)% |
| | Shares | Value ($) |
| Consumer Staples Select Sector SPDR Fund | (14,432) | (789,575) |
| First Trust Dow Jones Internet Index Fund(f) | (11,706) | (1,176,687) |
| iShares Russell 2000 Growth ETF | (6,885) | (1,170,174) |
| Materials Select Sector SPDR Fund | (10,883) | (599,327) |
| SPDR S&P Regional Banking ETF | (13,129) | (682,970) |
| Vaneck Vectors Semiconductor | (29,396) | (2,603,898) |
| Vanguard REIT ETF | (22,043) | (1,852,494) |
Total Exchange-Traded Funds
(Proceeds $8,728,437) | (8,875,125) |
Total Investments Sold Short
(Proceeds $55,649,557) | (58,266,332) |
| Total Investments, Net of Investments Sold Short | 507,441,742 |
| Other Assets & Liabilities, Net | | 72,750,836 |
| Net Assets | 580,192,578 |
At August 31, 2017, securities and/or cash totaling $130,993,171 were pledged as collateral.
Investments in derivatives
| Forward foreign currency exchange contracts |
Currency to
be sold | Currency to
be purchased | Counterparty | Settlement
date | Unrealized
appreciation ($) | Unrealized
depreciation ($) |
| 1,364,331 AUD | 1,090,233 USD | Citi | 09/20/2017 | 5,856 | — |
| 12,362,815 AUD | 9,556,463 USD | Citi | 09/20/2017 | — | (269,563) |
| 3,817,836 BRL | 1,210,865 USD | Citi | 09/20/2017 | 854 | — |
| 14,463,164 BRL | 4,458,044 USD | Citi | 09/20/2017 | — | (125,858) |
| 2,164,146 CAD | 1,737,287 USD | Citi | 09/20/2017 | 3,959 | — |
| 25,805,854 CAD | 19,361,543 USD | Citi | 09/20/2017 | — | (1,307,117) |
| 219,000 CHF | 226,051 USD | Citi | 09/20/2017 | — | (2,553) |
| 2,180,635,000 CLP | 3,403,050 USD | Citi | 09/20/2017 | — | (83,316) |
| 1,468,271,512 COP | 498,393 USD | Citi | 09/20/2017 | 1,647 | — |
| 6,570,227,456 COP | 2,153,280 USD | Citi | 09/20/2017 | — | (69,560) |
| 26,202,000 EUR | 29,847,488 USD | Citi | 09/20/2017 | — | (1,370,105) |
The accompanying Notes to Consolidated Financial Statements are an integral part of this statement.
| 24 | Multi-Manager Alternative Strategies Fund | Annual Report 2017 |
Consolidated Portfolio of Investments (continued)
August 31, 2017
| Forward foreign currency exchange contracts (continued) |
Currency to
be sold | Currency to
be purchased | Counterparty | Settlement
date | Unrealized
appreciation ($) | Unrealized
depreciation ($) |
| 6,785,514 GBP | 8,823,519 USD | Citi | 09/20/2017 | 44,521 | — |
| 1,631,486 GBP | 2,096,416 USD | Citi | 09/20/2017 | — | (14,377) |
| 10,970,000 HKD | 1,408,450 USD | Citi | 09/20/2017 | 6,046 | — |
| 261,000 HUF | 1,022 USD | Citi | 09/20/2017 | 5 | — |
| 1,379,125,000 HUF | 5,290,678 USD | Citi | 09/20/2017 | — | (83,311) |
| 31,321,610,992 IDR | 2,343,906 USD | Citi | 09/20/2017 | — | (1,801) |
| 12,471,424 ILS | 3,513,415 USD | Citi | 09/20/2017 | 31,765 | — |
| 3,797,576 ILS | 1,052,002 USD | Citi | 09/20/2017 | — | (8,168) |
| 41,458,974 INR | 647,592 USD | Citi | 09/20/2017 | 78 | — |
| 423,727,820 INR | 6,569,541 USD | Citi | 09/20/2017 | — | (48,314) |
| 95,426,827 JPY | 873,271 USD | Citi | 09/20/2017 | 4,623 | — |
| 4,733,208,149 JPY | 42,124,791 USD | Citi | 09/20/2017 | — | (960,467) |
| 2,252,491,227 KRW | 2,004,226 USD | Citi | 09/20/2017 | 3,609 | — |
| 22,765,132,597 KRW | 20,008,225 USD | Citi | 09/20/2017 | — | (211,310) |
| 219,496,000 MXN | 12,348,543 USD | Citi | 09/20/2017 | 101,689 | — |
| 29,925,000 MXN | 1,640,226 USD | Citi | 09/20/2017 | — | (29,449) |
| 223,188,000 NOK | 27,775,290 USD | Citi | 09/20/2017 | — | (1,003,299) |
| 32,444,000 NZD | 23,697,263 USD | Citi | 09/20/2017 | 408,963 | — |
| 3,368,000 NZD | 2,354,518 USD | Citi | 09/20/2017 | — | (63,032) |
| 156,406,000 PHP | 3,080,839 USD | Citi | 09/20/2017 | 29,452 | — |
| 55,696,000 PHP | 1,081,757 USD | Citi | 09/20/2017 | — | (4,838) |
| 39,121,000 PLN | 10,745,738 USD | Citi | 09/20/2017 | — | (221,741) |
| 276,029,000 SEK | 33,114,381 USD | Citi | 09/20/2017 | — | (1,654,600) |
| 304,095 SGD | 224,324 USD | Citi | 09/20/2017 | 39 | — |
| 2,170,300 SGD | 1,584,918 USD | Citi | 09/20/2017 | — | (15,787) |
| 39,573,000 TRY | 10,845,850 USD | Citi | 09/20/2017 | — | (563,517) |
| 63,091,374 TWD | 2,101,500 USD | Citi | 09/20/2017 | 7,139 | — |
| 126,062,626 TWD | 4,164,721 USD | Citi | 09/20/2017 | — | (20,013) |
| 16,515,680 USD | 21,185,000 AUD | Citi | 09/20/2017 | 322,261 | — |
| 827,348 USD | 1,031,000 AUD | Citi | 09/20/2017 | — | (7,904) |
| 5,538,351 USD | 18,234,000 BRL | Citi | 09/20/2017 | 240,666 | — |
| 14,951 USD | 47,000 BRL | Citi | 09/20/2017 | — | (55) |
| 20,535,951 USD | 27,091,000 CAD | Citi | 09/20/2017 | 1,162,019 | — |
| 705,041 USD | 879,000 CAD | Citi | 09/20/2017 | — | (1,024) |
| 226,780 USD | 219,000 CHF | Citi | 09/20/2017 | 1,824 | — |
| 3,307,559 USD | 2,180,635,000 CLP | Citi | 09/20/2017 | 178,808 | — |
| 2,008,789 USD | 5,989,967,000 COP | Citi | 09/20/2017 | 17,737 | — |
| 695,816 USD | 2,048,531,968 COP | Citi | 09/20/2017 | — | (2,756) |
| 29,842,787 USD | 26,202,000 EUR | Citi | 09/20/2017 | 1,374,804 | — |
| 5,272,382 USD | 4,090,000 GBP | Citi | 09/20/2017 | 19,200 | — |
| 5,618,174 USD | 4,327,000 GBP | Citi | 09/20/2017 | — | (19,965) |
| 1,290,933 USD | 10,057,145 HKD | Citi | 09/20/2017 | — | (5,228) |
| 5,077,009 USD | 1,379,386,000 HUF | Citi | 09/20/2017 | 297,998 | — |
| 2,329,722 USD | 31,321,610,992 IDR | Citi | 09/20/2017 | 15,984 | — |
| 7,777 USD | 28,000 ILS | Citi | 09/20/2017 | 40 | — |
| 4,560,837 USD | 16,241,000 ILS | Citi | 09/20/2017 | — | (26,834) |
| 6,609,392 USD | 429,582,794 INR | Citi | 09/20/2017 | 99,908 | — |
| 556,821 USD | 35,604,000 INR | Citi | 09/20/2017 | — | (751) |
| 21,441,580 USD | 2,367,939,848 JPY | Citi | 09/20/2017 | 113,208 | — |
| 19,832,315 USD | 2,170,350,091 JPY | Citi | 09/20/2017 | — | (76,139) |
| 2,393,517 USD | 2,715,579,008 KRW | Citi | 09/20/2017 | 18,406 | — |
| 20,638,645 USD | 23,119,943,016 KRW | Citi | 09/20/2017 | — | (103,974) |
| 12,944,975 USD | 240,268,000 MXN | Citi | 09/20/2017 | 460,860 | — |
| 513,114 USD | 9,153,000 MXN | Citi | 09/20/2017 | — | (2,420) |
| 27,329,238 USD | 223,188,000 NOK | Citi | 09/20/2017 | 1,449,350 | — |
| 1,470,173 USD | 2,049,000 NZD | Citi | 09/20/2017 | 599 | — |
| 24,100,228 USD | 33,416,578 NZD | Citi | 09/20/2017 | — | (113,811) |
| 758,755 USD | 38,933,839 PHP | Citi | 09/20/2017 | 821 | — |
The accompanying Notes to Consolidated Financial Statements are an integral part of this statement.
Multi-Manager Alternative Strategies Fund | Annual Report 2017
| 25 |
Consolidated Portfolio of Investments (continued)
August 31, 2017
| Forward foreign currency exchange contracts (continued) |
Currency to
be sold | Currency to
be purchased | Counterparty | Settlement
date | Unrealized
appreciation ($) | Unrealized
depreciation ($) |
| 2,386,333 USD | 120,272,294 PHP | Citi | 09/20/2017 | — | (39,893) |
| 10,406,149 USD | 39,121,000 PLN | Citi | 09/20/2017 | 561,331 | — |
| 33,315,758 USD | 276,029,000 SEK | Citi | 09/20/2017 | 1,453,222 | — |
| 3,828,013 USD | 5,273,000 SGD | Citi | 09/20/2017 | 61,089 | — |
| 86,392 USD | 117,000 SGD | Citi | 09/20/2017 | — | (99) |
| 11,076,684 USD | 39,573,000 TRY | Citi | 09/20/2017 | 332,683 | — |
| 44,550 USD | 1,355,000 TWD | Citi | 09/20/2017 | 430 | — |
| 6,260,781 USD | 187,799,000 TWD | Citi | 09/20/2017 | — | (26,665) |
| 8,185,661 USD | 107,952,000 ZAR | Citi | 09/20/2017 | 92,490 | — |
| 294,961 USD | 3,818,000 ZAR | Citi | 09/20/2017 | — | (2,183) |
| 1,786,000 ZAR | 137,173 USD | Citi | 09/20/2017 | 216 | — |
| 76,329,879 ZAR | 5,739,851 USD | Citi | 09/20/2017 | — | (113,402) |
| 7,000 BRL | 2,172 USD | Citi | 12/20/2017 | — | (18) |
| 336,000 CAD | 269,086 USD | Citi | 12/20/2017 | — | (227) |
| 84,000 CHF | 87,652 USD | Citi | 12/20/2017 | — | (556) |
| 64,154,000 COP | 21,159 USD | Citi | 12/20/2017 | — | (312) |
| 973,000 EUR | 1,154,797 USD | Citi | 12/20/2017 | — | (10,184) |
| 1,237,000 GBP | 1,601,474 USD | Citi | 12/20/2017 | — | (3,707) |
| 559,145 HKD | 71,679 USD | Citi | 12/20/2017 | 24 | — |
| 101,990,000 HUF | 399,177 USD | Citi | 12/20/2017 | 75 | — |
| 42,609,000 HUF | 165,593 USD | Citi | 12/20/2017 | — | (1,142) |
| 48,068,000 IDR | 3,555 USD | Citi | 12/20/2017 | — | (10) |
| 1,059,000 ILS | 294,694 USD | Citi | 12/20/2017 | — | (2,049) |
| 879,204,075 JPY | 8,073,434 USD | Citi | 12/20/2017 | 34,790 | — |
| 319,979,800 JPY | 2,911,487 USD | Citi | 12/20/2017 | — | (14,118) |
| 1,381,399,968 KRW | 1,217,951 USD | Citi | 12/20/2017 | — | (11,840) |
| 1,210,578 NZD | 873,676 USD | Citi | 12/20/2017 | 6,207 | — |
| 187,000 NZD | 133,833 USD | Citi | 12/20/2017 | — | (167) |
| 50,732,294 PHP | 982,378 USD | Citi | 12/20/2017 | 2,303 | — |
| 54,254,839 PHP | 1,046,354 USD | Citi | 12/20/2017 | — | (1,773) |
| 843,000 PLN | 232,385 USD | Citi | 12/20/2017 | — | (4,025) |
| 19,684,000 TRY | 5,467,757 USD | Citi | 12/20/2017 | — | (62,318) |
| 1,637,000 TWD | 54,313 USD | Citi | 12/20/2017 | — | (352) |
| 5,545,627 USD | 7,013,815 AUD | Citi | 12/20/2017 | 22,490 | — |
| 1,088,970 USD | 1,364,331 AUD | Citi | 12/20/2017 | — | (5,857) |
| 2,792,767 USD | 8,966,164 BRL | Citi | 12/20/2017 | 12,610 | — |
| 1,187,381 USD | 3,792,836 BRL | Citi | 12/20/2017 | — | (660) |
| 162,459 USD | 202,854 CAD | Citi | 12/20/2017 | 134 | — |
| 1,738,737 USD | 2,164,146 CAD | Citi | 12/20/2017 | — | (4,114) |
| 2,467,036 USD | 1,555,750,000 CLP | Citi | 12/20/2017 | 13,385 | — |
| 565,770 USD | 1,692,024,504 COP | Citi | 12/20/2017 | 534 | — |
| 609,531 USD | 1,813,921,496 COP | Citi | 12/20/2017 | — | (2,430) |
| 3,270,346 USD | 2,754,000 EUR | Citi | 12/20/2017 | 27,041 | — |
| 388,080 USD | 300,000 GBP | Citi | 12/20/2017 | 1,212 | — |
| 42,889 USD | 33,000 GBP | Citi | 12/20/2017 | — | (67) |
| 4,062,525 USD | 1,039,584,000 HUF | Citi | 12/20/2017 | 5,521 | — |
| 2,227,015 USD | 30,040,435,992 IDR | Citi | 12/20/2017 | 783 | — |
| 222,530 USD | 796,576 ILS | Citi | 12/20/2017 | 679 | — |
| 1,070,660 USD | 3,808,424 ILS | Citi | 12/20/2017 | — | (3,499) |
| 4,818,131 USD | 311,737,820 INR | Citi | 12/20/2017 | 7,468 | — |
| 879,182 USD | 56,771,974 INR | Citi | 12/20/2017 | — | (371) |
| 2,707,114 USD | 294,575,000 JPY | Citi | 12/20/2017 | — | (13,788) |
| 432,392 USD | 486,897,599 KRW | Citi | 12/20/2017 | 1,069 | — |
| 189,119 USD | 211,938,993 KRW | Citi | 12/20/2017 | — | (440) |
| 49,429 USD | 900,000 MXN | Citi | 12/20/2017 | 70 | — |
| 10,388,591 USD | 187,353,000 MXN | Citi | 12/20/2017 | — | (84,396) |
| 20,763,118 USD | 162,632,000 NOK | Citi | 12/20/2017 | 247,264 | — |
| 307,095 USD | 2,369,000 NOK | Citi | 12/20/2017 | — | (1,045) |
The accompanying Notes to Consolidated Financial Statements are an integral part of this statement.
| 26 | Multi-Manager Alternative Strategies Fund | Annual Report 2017 |
Consolidated Portfolio of Investments (continued)
August 31, 2017
| Forward foreign currency exchange contracts (continued) |
Currency to
be sold | Currency to
be purchased | Counterparty | Settlement
date | Unrealized
appreciation ($) | Unrealized
depreciation ($) |
| 241,966 USD | 335,000 NZD | Citi | 12/20/2017 | — | (1,913) |
| 6,797,015 USD | 24,676,000 PLN | Citi | 12/20/2017 | 123,073 | — |
| 22,767,417 USD | 182,523,000 SEK | Citi | 12/20/2017 | 344,024 | — |
| 311,914 USD | 2,459,000 SEK | Citi | 12/20/2017 | — | (550) |
| 1,085,444 USD | 1,474,395 SGD | Citi | 12/20/2017 | 3,206 | — |
| 275,657 USD | 373,000 SGD | Citi | 12/20/2017 | — | (245) |
| 2,123,699 USD | 7,641,000 TRY | Citi | 12/20/2017 | 22,984 | — |
| 465,687 USD | 1,655,000 TRY | Citi | 12/20/2017 | — | (727) |
| 1,659,068 USD | 49,834,736 TWD | Citi | 12/20/2017 | 5,095 | — |
| 370,903 USD | 11,099,264 TWD | Citi | 12/20/2017 | — | (259) |
| 2,214,168 USD | 29,550,879 ZAR | Citi | 12/20/2017 | 19,972 | — |
| 139,473 USD | 1,842,000 ZAR | Citi | 12/20/2017 | — | (212) |
| 10,408,600 CAD | 7,878,494 USD | Goldman Sachs | 09/15/2017 | — | (457,611) |
| 80,600 CHF | 84,514 USD | Goldman Sachs | 09/15/2017 | 408 | — |
| 1,806,000 CHF | 1,877,254 USD | Goldman Sachs | 09/15/2017 | — | (7,315) |
| 91,500 EUR | 109,782 USD | Goldman Sachs | 09/15/2017 | 796 | — |
| 4,277,200 EUR | 4,925,880 USD | Goldman Sachs | 09/15/2017 | — | (168,680) |
| 1,492,231 GBP | 1,934,607 USD | Goldman Sachs | 09/15/2017 | 4,322 | — |
| 1,437,485 GBP | 1,840,651 USD | Goldman Sachs | 09/15/2017 | — | (18,817) |
| 7,563,352 USD | 9,982,700 CAD | Goldman Sachs | 09/15/2017 | 431,656 | — |
| 342,046 USD | 425,900 CAD | Goldman Sachs | 09/15/2017 | — | (948) |
| 80,657 USD | 77,700 CHF | Goldman Sachs | 09/15/2017 | 423 | — |
| 94,151 USD | 89,400 CHF | Goldman Sachs | 09/15/2017 | — | (862) |
| 1,732,542 USD | 1,490,300 EUR | Goldman Sachs | 09/15/2017 | 42,550 | — |
| 24,870 USD | 19,005 GBP | Goldman Sachs | 09/15/2017 | — | (286) |
| Total | | | | 10,308,367 | (9,563,089) |
| Long futures contracts |
| Description | Number of
contracts | Expiration
date | Trading
currency | Notional
amount | Value/Unrealized
appreciation ($) | Value/Unrealized
depreciation ($) |
| Amsterdam IDX | 13 | 09/2017 | EUR | 1,341,080 | — | (26,780) |
| AUD/USD Currency | 420 | 09/2017 | USD | 33,381,600 | 196,428 | — |
| Brent Crude | 28 | 09/2017 | USD | 1,480,080 | 47,735 | — |
| C$ Currency | 415 | 09/2017 | USD | 33,214,525 | 405,374 | — |
| CAC40 Index | 24 | 09/2017 | EUR | 1,220,280 | — | (27,961) |
| Copper | 8 | 12/2017 | USD | 1,359,700 | 4,949 | — |
| Copper | 105 | 12/2017 | USD | 8,133,563 | 189,468 | — |
| DJIA Mini E | 92 | 09/2017 | USD | 10,097,000 | 256,188 | — |
| Euro FX | 206 | 09/2017 | USD | 30,673,400 | 963,097 | — |
| Euro-Bobl | 90 | 09/2017 | EUR | 11,987,203 | 22,216 | — |
| Euro-Bobl | 143 | 12/2017 | EUR | 19,004,443 | — | (4,866) |
| Euro-Bund | 3 | 09/2017 | EUR | 495,540 | 1,172 | — |
| Euro-Bund | 3 | 12/2017 | EUR | 488,393 | — | (429) |
| Euro-Schatz | 57 | 09/2017 | EUR | 6,400,923 | 7,258 | — |
| Euro-Schatz | 41 | 12/2017 | EUR | 4,610,440 | — | (162) |
| FTSE 100 Index | 46 | 09/2017 | GBP | 3,418,950 | — | (17,589) |
| FTSE/JSE Top 40 Index | 69 | 09/2017 | ZAR | 34,383,390 | 26,522 | — |
| FTSE/MIB Index | 5 | 09/2017 | EUR | 541,575 | 10,984 | — |
| Gold 100 oz. | 56 | 12/2017 | USD | 7,404,320 | 75,727 | — |
| Hang Seng Index | 16 | 09/2017 | HKD | 22,349,600 | 25,786 | — |
| H-Shares Index | 21 | 09/2017 | HKD | 11,835,600 | — | (4,428) |
| IBEX 35 Index | 29 | 09/2017 | EUR | 2,987,870 | — | (74,851) |
| KOSPI 200 Index | 29 | 09/2017 | KRW | 2,233,000,000 | 1,160 | — |
| KOSPI 200 Index | 2 | 09/2017 | KRW | 154,000,000 | — | (363) |
| KOSPI 200 Index | 19 | 09/2017 | KRW | 1,463,000,000 | — | (2,330) |
| Low Sulphur Gasoil | 86 | 10/2017 | USD | 4,327,950 | 173,332 | — |
| Mini MSCI EAFE Index | 24 | 09/2017 | USD | 2,321,760 | 10,019 | — |
The accompanying Notes to Consolidated Financial Statements are an integral part of this statement.
Multi-Manager Alternative Strategies Fund | Annual Report 2017
| 27 |
Consolidated Portfolio of Investments (continued)
August 31, 2017
| Long futures contracts (continued) |
| Description | Number of
contracts | Expiration
date | Trading
currency | Notional
amount | Value/Unrealized
appreciation ($) | Value/Unrealized
depreciation ($) |
| MSCI Singapore IX ETS | 61 | 09/2017 | SGD | 2,228,025 | 8,060 | — |
| MSCI Taiwan Index | 12 | 09/2017 | USD | 475,440 | 4,082 | — |
| NASDAQ 100 E-mini | 59 | 09/2017 | USD | 7,069,085 | 253,739 | — |
| Nickel | 18 | 12/2017 | USD | 1,275,858 | 8,279 | — |
| NY Harbor ULSD | 57 | 09/2017 | USD | 4,170,109 | 237,883 | — |
| Platinum | 1 | 10/2017 | USD | 49,925 | 146 | — |
| Primary Aluminum | 46 | 12/2017 | USD | 2,439,725 | 34,016 | — |
| RBOB Gasoline | 47 | 09/2017 | USD | 3,512,141 | 437,984 | — |
| Russell 2000 Mini | 30 | 09/2017 | USD | 2,106,600 | — | (27,029) |
| S&P 500 E-mini | 38 | 09/2017 | USD | 4,693,190 | 39,772 | — |
| S&P Mid 400 E-mini | 12 | 09/2017 | USD | 2,076,480 | — | (33,426) |
| S&P/TSE 60 Index | 20 | 09/2017 | CAD | 3,564,000 | — | (35,460) |
| SGX Nifty Index | 94 | 09/2017 | USD | 1,868,344 | 6,866 | — |
| Soybean Oil | 18 | 12/2017 | USD | 378,648 | 6,612 | — |
| SPI 200 Index | 20 | 09/2017 | AUD | 2,844,000 | — | (7,869) |
| TOPIX Index | 82 | 09/2017 | JPY | 1,329,220,000 | 126,891 | — |
| U.S. Treasury 5-Year Note | 3 | 12/2017 | USD | 356,310 | 760 | — |
| U.S. Treasury 5-Year Note | 1 | 12/2017 | USD | 118,770 | — | (62) |
| Zinc | 17 | 12/2017 | USD | 1,337,263 | 13,023 | — |
| Total | | | | | 3,595,528 | (263,605) |
| Short futures contracts |
| Description | Number of
contracts | Expiration
date | Trading
currency | Notional
amount | Value/Unrealized
appreciation ($) | Value/Unrealized
depreciation ($) |
| 3-Month Euro Euribor | (24) | 12/2017 | EUR | (6,019,500) | — | (2,334) |
| 3-Month Euro Euribor | (58) | 03/2018 | EUR | (14,545,675) | — | (10,519) |
| 3-Month Euro Euribor | (17) | 06/2018 | EUR | (4,262,538) | — | (4,479) |
| 3-Month Euro Euribor | (21) | 09/2018 | EUR | (5,263,650) | — | (7,111) |
| 3-Month Euro Euribor | (28) | 12/2018 | EUR | (7,015,050) | — | (9,844) |
| 3-Month Euro Euribor | (48) | 03/2019 | EUR | (12,020,400) | — | (20,935) |
| 3-Month Euro Euribor | (41) | 06/2019 | EUR | (10,262,300) | — | (21,498) |
| 90-Day Euro$ | (155) | 12/2017 | USD | (38,201,688) | — | (7,194) |
| 90-Day Euro$ | (142) | 03/2018 | USD | (34,981,700) | — | (30,723) |
| 90-Day Euro$ | (109) | 06/2018 | USD | (26,839,888) | — | (40,317) |
| 90-Day Euro$ | (107) | 09/2018 | USD | (26,335,375) | — | (55,124) |
| 90-Day Euro$ | (98) | 12/2018 | USD | (24,103,100) | — | (66,638) |
| 90-Day Euro$ | (87) | 03/2019 | USD | (21,390,038) | — | (98,598) |
| 90-Day Euro$ | (84) | 06/2019 | USD | (20,645,100) | — | (40,797) |
| 90-Day Sterling | (57) | 12/2017 | GBP | (7,099,350) | — | (11,086) |
| 90-Day Sterling | (85) | 03/2018 | GBP | (10,581,438) | — | (21,169) |
| 90-Day Sterling | (81) | 06/2018 | GBP | (10,079,438) | — | (24,440) |
| 90-Day Sterling | (86) | 09/2018 | GBP | (10,697,325) | — | (27,060) |
| 90-Day Sterling | (82) | 12/2018 | GBP | (10,195,675) | — | (24,593) |
| 90-Day Sterling | (77) | 03/2019 | GBP | (9,569,175) | — | (22,438) |
| 90-Day Sterling | (81) | 06/2019 | GBP | (10,062,225) | — | (24,706) |
| Australian 10-Year Bond | (162) | 09/2017 | AUD | (20,841,342) | 35,104 | — |
| Australian 3-Year Bond | (901) | 09/2017 | AUD | (100,459,779) | 114,588 | — |
| Banker’s Acceptance | (34) | 12/2017 | CAD | (8,373,350) | 1,950 | — |
| Banker’s Acceptance | (41) | 03/2018 | CAD | (10,088,050) | 3,540 | — |
| BP Currency | (413) | 09/2017 | USD | (33,401,375) | — | (247,372) |
| Canadian Government 10-Year Bond | (3) | 12/2017 | CAD | (418,076) | — | (1,832) |
| Cocoa | (25) | 12/2017 | USD | (481,500) | — | (13,021) |
| Cocoa ICE | (31) | 12/2017 | GBP | (471,820) | — | (9,465) |
| Coffee C | (40) | 12/2017 | USD | (1,940,250) | 71,508 | — |
| Corn | (148) | 12/2017 | USD | (2,647,350) | 73,039 | — |
| Cotton | (12) | 12/2017 | USD | (425,580) | — | (17,252) |
| Euro CHF 3-Month ICE | (22) | 12/2017 | CHF | (5,540,700) | 977 | — |
The accompanying Notes to Consolidated Financial Statements are an integral part of this statement.
| 28 | Multi-Manager Alternative Strategies Fund | Annual Report 2017 |
Consolidated Portfolio of Investments (continued)
August 31, 2017
| Short futures contracts (continued) |
| Description | Number of
contracts | Expiration
date | Trading
currency | Notional
amount | Value/Unrealized
appreciation ($) | Value/Unrealized
depreciation ($) |
| Euro CHF 3-Month ICE | (3) | 12/2017 | CHF | (755,550) | — | (237) |
| Euro CHF 3-Month ICE | (4) | 03/2018 | CHF | (1,007,200) | 305 | — |
| Euro CHF 3-Month ICE | (13) | 03/2018 | CHF | (3,273,400) | — | (977) |
| Euro CHF 3-Month ICE | (15) | 06/2018 | CHF | (3,775,875) | — | (1,566) |
| EURO STOXX 50 | (16) | 09/2017 | EUR | (547,840) | 1,070 | — |
| Euro-Bobl | (10) | 09/2017 | EUR | (1,331,911) | — | (668) |
| HRW Wheat | (59) | 12/2017 | USD | (1,286,938) | — | (688) |
| JPY Currency | (310) | 09/2017 | USD | (35,256,688) | — | (373,745) |
| Lean Hogs | (19) | 10/2017 | USD | (466,640) | 9,235 | — |
| Natural Gas | (109) | 09/2017 | USD | (3,313,600) | — | (91,203) |
| New Zealand $ | (313) | 09/2017 | USD | (22,460,880) | 222,664 | — |
| OMXS30 Index | (5) | 09/2017 | SEK | (772,250) | 159 | — |
| Silver | (19) | 12/2017 | USD | (1,669,625) | — | (46,442) |
| Soybean | (35) | 11/2017 | USD | (1,654,188) | 14,511 | — |
| Soybean Meal | (12) | 12/2017 | USD | (359,400) | 19,718 | — |
| Sugar #11 | (232) | 09/2017 | USD | (3,741,696) | — | (100,305) |
| U.S. Long Bond | (32) | 12/2017 | USD | (5,046,816) | — | (38,759) |
| U.S. Treasury 10-Year Note | (66) | 12/2017 | USD | (8,419,177) | — | (20,248) |
| U.S. Treasury 10-Year Note | (98) | 12/2017 | USD | (12,501,202) | — | (41,014) |
| U.S. Treasury 2-Year Note | (7) | 12/2017 | USD | (1,528,787) | — | (559) |
| U.S. Treasury 5-Year Note | (26) | 12/2017 | USD | (3,088,022) | — | (6,784) |
| U.S. Ultra Bond | (2) | 12/2017 | USD | (343,321) | — | (254) |
| U.S. Ultra Bond | (30) | 12/2017 | USD | (5,149,808) | — | (43,106) |
| Wheat | (44) | 12/2017 | USD | (955,900) | 35,830 | — |
| WTI Crude | (66) | 09/2017 | USD | (3,117,180) | — | (19,804) |
| Total | | | | | 604,198 | (1,646,904) |
| Call option contracts purchased |
| Description | Counterparty | Trading
currency | Notional
amount | Number of
contracts | Exercise
price/Rate | Expiration
date | Cost ($) | Value ($) |
| Discovery Communications, Inc., Class C | Goldman Sachs | USD | 136,565 | 65 | 25.00 | 09/2017 | 2,584 | 163 |
| Discovery Communications, Inc., Class C | Goldman Sachs | USD | 136,565 | 65 | 25.00 | 12/2017 | 6,503 | 1,625 |
| NXP Semiconductors NV | Goldman Sachs | USD | 169,440 | 15 | 110.00 | 10/2017 | 2,956 | 5,925 |
| NXP Semiconductors NV | Goldman Sachs | USD | 33,888 | 3 | 110.00 | 12/2017 | 517 | 1,620 |
| Time, Inc. | Goldman Sachs | USD | 197,250 | 150 | 17.50 | 10/2017 | 7,407 | 375 |
| Whole Foods Market, Inc.(e),(g) | Goldman Sachs | USD | 168,000 | 40 | 44.00 | 11/2017 | 1,046 | — |
| Total | | | | | | | 21,013 | 9,708 |
| Put option contracts purchased |
| Description | Counterparty | Trading
currency | Notional
amount | Number of
contracts | Exercise
price/Rate | Expiration
date | Cost ($) | Value ($) |
| AT&T, Inc. | Goldman Sachs | USD | 618,090 | 165 | 37.00 | 10/2017 | 22,393 | 13,530 |
| Becton Dickinson and Co. | Goldman Sachs | USD | 119,664 | 6 | 175.00 | 09/2017 | 3,102 | 45 |
| Calpine Corp. | Goldman Sachs | USD | 505,680 | 344 | 12.00 | 09/2017 | 8,860 | 2,580 |
| Monsanto Co. | Goldman Sachs | USD | 1,101,680 | 94 | 105.00 | 01/2018 | 36,569 | 14,241 |
| Rockwell Collins, Inc. | Goldman Sachs | USD | 5,451,680 | 416 | 125.00 | 09/2017 | 42,033 | 38,480 |
| Total | | | | | | | 112,957 | 68,876 |
| Call option contracts written |
| Description | Counterparty | Trading
currency | Notional
amount | Number of
contracts | Exercise
price/Rate | Expiration
date | Premium
received ($) | Value ($) |
| Advisory Board Co. (The) | Goldman Sachs | USD | (1,597,500) | (300) | 55.00 | 09/2017 | (30,325) | (750) |
| Alibaba Group Holding Ltd., ADR | Goldman Sachs | USD | (412,176) | (24) | 180.00 | 09/2017 | (2,308) | (1,956) |
| Alibaba Group Holding Ltd., ADR | Goldman Sachs | USD | (309,132) | (18) | 175.00 | 09/2017 | (3,153) | (3,744) |
| Becton Dickinson and Co. | Goldman Sachs | USD | (119,664) | (6) | 185.00 | 09/2017 | (3,150) | (8,610) |
The accompanying Notes to Consolidated Financial Statements are an integral part of this statement.
Multi-Manager Alternative Strategies Fund | Annual Report 2017
| 29 |
Consolidated Portfolio of Investments (continued)
August 31, 2017
| Call option contracts written (continued) |
| Description | Counterparty | Trading
currency | Notional
amount | Number of
contracts | Exercise
price/Rate | Expiration
date | Premium
received ($) | Value ($) |
| Conduent, Inc. | Goldman Sachs | USD | (493,649) | (299) | 17.50 | 09/2017 | (13,204) | (2,990) |
| Conduent, Inc. | Goldman Sachs | USD | (42,926) | (26) | 17.50 | 10/2017 | (2,003) | (1,040) |
| Jack in the Box, Inc. | Goldman Sachs | USD | (767,684) | (82) | 100.00 | 09/2017 | (8,617) | (820) |
| Marriott Vacations Worldwide Corp. | Goldman Sachs | USD | (104,724) | (9) | 120.00 | 10/2017 | (2,782) | (2,745) |
| NXP Semiconductors NV | Goldman Sachs | USD | (293,696) | (26) | 115.00 | 10/2017 | (2,612) | (1,820) |
| Rockwell Collins, Inc. | Goldman Sachs | USD | (2,725,840) | (208) | 135.00 | 09/2017 | (16,422) | (22,360) |
| Time Warner, Inc. | Goldman Sachs | USD | (495,390) | (49) | 100.00 | 09/2017 | (12,755) | (9,677) |
| Total | | | | | | | (97,331) | (56,512) |
| Put option contracts written |
| Description | Counterparty | Trading
currency | Notional
amount | Number of
contracts | Exercise
price/Rate | Expiration
date | Premium
received ($) | Value ($) |
| Jack in the Box, Inc. | Goldman Sachs | USD | (215,326) | (23) | 90.00 | 09/2017 | (1,016) | (977) |
| Jack in the Box, Inc. | Goldman Sachs | USD | (205,964) | (22) | 90.00 | 10/2017 | (2,731) | (3,190) |
| LogMeIn, Inc. | Goldman Sachs | USD | (343,200) | (30) | 105.00 | 09/2017 | (2,978) | (900) |
| Marriott Vacations Worldwide Corp. | Goldman Sachs | USD | (104,724) | (9) | 105.00 | 10/2017 | (1,160) | (1,238) |
| Time Warner, Inc. | Goldman Sachs | USD | (495,390) | (49) | 100.00 | 09/2017 | (4,735) | (3,308) |
| Total | | | | | | | (12,620) | (9,613) |
| Total return swap contracts |
| Fund receives | Fund pays | Payment
frequency | Counterparty | Maturity
date | Notional
currency | Notional
amount | Value
($) | Periodic
payments
receivable
(payable)
($) | Upfront
payments | Upfront
receipts | Unrealized
appreciation
($) | Unrealized
depreciation
($) |
| Total return on Imagination Technologies Group PLC | Floating rate based on 1-month GBP LIBOR plus 0.450% | Monthly | Goldman Sachs | 02/22/2018 | GBP | 9,714 | 1,190 | (2) | — | — | 1,188 | — |
| Total return on Sky PLC | Floating rate based on 1-week GBP LIBOR plus 0.450% | Monthly | Goldman Sachs | 02/22/2018 | GBP | 46,295 | 487 | (2) | — | — | 485 | — |
| Total return on Sky PLC | Floating rate based on 1-week GBP LIBOR plus 0.450% | Monthly | Goldman Sachs | 02/22/2018 | GBP | 55,894 | 400 | (1) | — | — | 399 | — |
| Total return on Imagination Technologies Group PLC | Floating rate based on 1-month GBP LIBOR plus 0.450% | Monthly | Goldman Sachs | 02/22/2018 | GBP | 6,943 | 392 | (2) | — | — | 390 | — |
| Total return on Sky PLC | Floating rate based on 1-week GBP LIBOR plus 0.450% | Monthly | Goldman Sachs | 02/22/2018 | GBP | 6,422 | 28 | (3) | — | — | 25 | — |
| Total return on Sky PLC | Floating rate based on 1-week GBP LIBOR plus 0.450% | Monthly | Goldman Sachs | 02/22/2018 | GBP | 4,713 | 13 | (2) | — | — | 11 | — |
| Total return on Sky PLC | Floating rate based on 1-week GBP LIBOR plus 0.450% | Monthly | Goldman Sachs | 02/22/2018 | GBP | 753 | (9) | (1) | — | — | — | (10) |
| Total return on Sky PLC | Floating rate based on 1-week GBP LIBOR plus 0.450% | Monthly | Goldman Sachs | 02/22/2018 | GBP | 1,669 | (20) | (1) | — | — | — | (21) |
| Total return on Sky PLC | Floating rate based on 1-week GBP LIBOR plus 0.450% | Monthly | Goldman Sachs | 02/22/2018 | GBP | 2,538 | (31) | (2) | — | — | — | (33) |
The accompanying Notes to Consolidated Financial Statements are an integral part of this statement.
| 30 | Multi-Manager Alternative Strategies Fund | Annual Report 2017 |
Consolidated Portfolio of Investments (continued)
August 31, 2017
| Total return swap contracts (continued) |
| Fund receives | Fund pays | Payment
frequency | Counterparty | Maturity
date | Notional
currency | Notional
amount | Value
($) | Periodic
payments
receivable
(payable)
($) | Upfront
payments | Upfront
receipts | Unrealized
appreciation
($) | Unrealized
depreciation
($) |
| Total return on Sky PLC | Floating rate based on 1-week GBP LIBOR plus 0.450% | Monthly | Goldman Sachs | 02/22/2018 | GBP | 4,014 | (48) | (3) | — | — | — | (51) |
| Total return on Sky PLC | Floating rate based on 1-week GBP LIBOR plus 0.450% | Monthly | Goldman Sachs | 02/22/2018 | GBP | 4,178 | (50) | (3) | — | — | — | (53) |
| Total return on Sky PLC | Floating rate based on 1-week GBP LIBOR plus 0.450% | Monthly | Goldman Sachs | 02/22/2018 | GBP | 4,246 | (51) | (3) | — | — | — | (54) |
| Total return on Sky PLC | Floating rate based on 1-week GBP LIBOR plus 0.450% | Monthly | Goldman Sachs | 02/22/2018 | GBP | 4,391 | (53) | (3) | — | — | — | (56) |
| Total return on Sky PLC | Floating rate based on 1-week GBP LIBOR plus 0.450% | Monthly | Goldman Sachs | 02/22/2018 | GBP | 4,922 | (59) | (4) | — | — | — | (63) |
| Total return on Sky PLC | Floating rate based on 1-week GBP LIBOR plus 0.450% | Monthly | Goldman Sachs | 02/22/2018 | GBP | 5,568 | (67) | (4) | — | — | — | (71) |
| Total return on Sky PLC | Floating rate based on 1-week GBP LIBOR plus 0.450% | Monthly | Goldman Sachs | 02/22/2018 | GBP | 6,118 | (73) | (5) | — | — | — | (78) |
| Total return on Sky PLC | Floating rate based on 1-week GBP LIBOR plus 0.450% | Monthly | Goldman Sachs | 02/22/2018 | GBP | 6,813 | (82) | (5) | — | — | — | (87) |
| Total return on Sky PLC | Floating rate based on 1-week GBP LIBOR plus 0.450% | Monthly | Goldman Sachs | 02/22/2018 | GBP | 9,351 | (113) | (7) | — | — | — | (120) |
| Total return on Sky PLC | Floating rate based on 1-week GBP LIBOR plus 0.450% | Monthly | Goldman Sachs | 02/22/2018 | GBP | 9,592 | (116) | (7) | — | — | — | (123) |
| Total return on Sky PLC | Floating rate based on 1-week GBP LIBOR plus 0.450% | Monthly | Goldman Sachs | 02/22/2018 | GBP | 10,818 | (131) | (8) | — | — | — | (139) |
| Total return on Imagination Technologies Group PLC | Floating rate based on 1-month GBP LIBOR plus 0.500% | Monthly | Goldman Sachs | 02/22/2018 | GBP | 2,350 | (184) | (2) | — | — | — | (186) |
| Total return on Sky PLC | Floating rate based on 1-week GBP LIBOR plus 0.450% | Monthly | Goldman Sachs | 02/22/2018 | GBP | 14,967 | (181) | (11) | — | — | — | (192) |
| Total return on Sky PLC | Floating rate based on 1-week GBP LIBOR plus 0.450% | Monthly | Goldman Sachs | 02/22/2018 | GBP | 18,952 | (228) | (14) | — | — | — | (242) |
| Total return on Sky PLC | Floating rate based on 1-week GBP LIBOR plus 0.450% | Monthly | Goldman Sachs | 02/22/2018 | GBP | 19,339 | (233) | (15) | — | — | — | (248) |
The accompanying Notes to Consolidated Financial Statements are an integral part of this statement.
Multi-Manager Alternative Strategies Fund | Annual Report 2017
| 31 |
Consolidated Portfolio of Investments (continued)
August 31, 2017
| Total return swap contracts (continued) |
| Fund receives | Fund pays | Payment
frequency | Counterparty | Maturity
date | Notional
currency | Notional
amount | Value
($) | Periodic
payments
receivable
(payable)
($) | Upfront
payments | Upfront
receipts | Unrealized
appreciation
($) | Unrealized
depreciation
($) |
| Total return on Sky PLC | Floating rate based on 1-week GBP LIBOR plus 0.450% | Monthly | Goldman Sachs | 02/22/2018 | GBP | 19,406 | (234) | (15) | — | — | — | (249) |
| Total return on Sky PLC | Floating rate based on 1-week GBP LIBOR plus 0.450% | Monthly | Goldman Sachs | 02/22/2018 | GBP | 20,651 | (249) | (16) | — | — | — | (265) |
| Total return on Sky PLC | Floating rate based on 1-week GBP LIBOR plus 0.450% | Monthly | Goldman Sachs | 02/22/2018 | GBP | 21,520 | (260) | (16) | — | — | — | (276) |
| Total return on Sky PLC | Floating rate based on 1-week GBP LIBOR plus 0.450% | Monthly | Goldman Sachs | 02/22/2018 | GBP | 24,511 | (295) | (19) | — | — | — | (314) |
| Total return on Sky PLC | Floating rate based on 1-week GBP LIBOR plus 0.450% | Monthly | Goldman Sachs | 02/22/2018 | GBP | 39,776 | (479) | (30) | — | — | — | (509) |
| Total return on Sky PLC | Floating rate based on 1-week GBP LIBOR plus 0.450% | Monthly | Goldman Sachs | 02/22/2018 | GBP | 45,673 | (551) | (35) | — | — | — | (586) |
| Total return on Sky PLC | Floating rate based on 1-week GBP LIBOR plus 0.450% | Monthly | Goldman Sachs | 02/22/2018 | GBP | 46,976 | (566) | (36) | — | — | — | (602) |
| Total return on Sky PLC | Floating rate based on 1-week GBP LIBOR plus 0.450% | Monthly | Goldman Sachs | 02/22/2018 | GBP | 63,265 | (763) | (48) | — | — | — | (811) |
| Total return on Sky PLC | Floating rate based on 1-week GBP LIBOR plus 0.450% | Monthly | Goldman Sachs | 02/22/2018 | GBP | 79,188 | (955) | (60) | — | — | — | (1,015) |
| Total return on Imagination Technologies Group PLC | Floating rate based on 1-month GBP LIBOR plus 0.450% | Monthly | Goldman Sachs | 02/22/2018 | GBP | 17,943 | (1,405) | (15) | — | — | — | (1,420) |
| Total return on Sky PLC | Floating rate based on 1-week GBP LIBOR plus 0.450% | Monthly | Goldman Sachs | 02/22/2018 | GBP | 129,725 | (1,564) | (99) | — | — | — | (1,663) |
| Total return on Sky PLC | Floating rate based on 1-week GBP LIBOR plus 0.450% | Monthly | Goldman Sachs | 02/22/2018 | GBP | 130,034 | (1,568) | (99) | — | — | — | (1,667) |
| Total return on Imagination Technologies Group PLC | Floating rate based on 1-month GBP LIBOR plus 0.500% | Monthly | Goldman Sachs | 02/22/2018 | GBP | 26,628 | (2,085) | (22) | — | — | — | (2,107) |
| Total return on Imagination Technologies Group PLC | Floating rate based on 1-month GBP LIBOR plus 0.500% | Monthly | Goldman Sachs | 02/22/2018 | GBP | 32,306 | (2,529) | (27) | — | — | — | (2,556) |
| Total return on Sky PLC | Floating rate based on 1-week GBP LIBOR plus 0.450% | Monthly | Goldman Sachs | 02/22/2018 | GBP | 234,437 | (2,828) | (178) | — | — | — | (3,006) |
The accompanying Notes to Consolidated Financial Statements are an integral part of this statement.
| 32 | Multi-Manager Alternative Strategies Fund | Annual Report 2017 |
Consolidated Portfolio of Investments (continued)
August 31, 2017
| Total return swap contracts (continued) |
| Fund receives | Fund pays | Payment
frequency | Counterparty | Maturity
date | Notional
currency | Notional
amount | Value
($) | Periodic
payments
receivable
(payable)
($) | Upfront
payments | Upfront
receipts | Unrealized
appreciation
($) | Unrealized
depreciation
($) |
| Total return on Imagination Technologies Group PLC | Floating rate based on 1-month GBP LIBOR plus 0.500% | Monthly | Goldman Sachs | 02/22/2018 | GBP | 43,691 | (3,420) | (36) | — | — | — | (3,456) |
| Total return on Sky PLC | Floating rate based on 1-week GBP LIBOR plus 0.450% | Monthly | Goldman Sachs | 02/22/2018 | GBP | 280,815 | (3,386) | (214) | — | — | — | (3,600) |
| Total return on Imagination Technologies Group PLC | Floating rate based on 1-month GBP LIBOR plus 0.500% | Monthly | Goldman Sachs | 02/22/2018 | GBP | 81,696 | (6,396) | (68) | — | — | — | (6,464) |
| Total return on Sky PLC | Floating rate based on 1-week GBP LIBOR plus 0.450% | Monthly | Goldman Sachs | 02/22/2018 | GBP | 683,376 | (8,243) | (520) | — | — | — | (8,763) |
| Total return on Sky PLC | Floating rate based on 1-week GBP LIBOR plus 0.450% | Monthly | Goldman Sachs | 02/22/2018 | GBP | 710,703 | (8,571) | (541) | — | — | — | (9,112) |
| Total return on Imagination Technologies Group PLC | Floating rate based on 1-month GBP LIBOR plus 0.500% | Monthly | Goldman Sachs | 02/22/2018 | GBP | 131,865 | (10,882) | (115) | — | — | — | (10,997) |
| Total return on Imagination Technologies Group PLC | Floating rate based on 1-month GBP LIBOR plus 0.500% | Monthly | Goldman Sachs | 02/22/2018 | GBP | 245,953 | (19,259) | (203) | — | — | — | (19,462) |
| Total return on Micro Focus International | Floating rate based on 1-week GBP LIBOR plus 0.450% | Monthly | Goldman Sachs | 08/25/2018 | GBP | 845,664 | (1,463) | (144) | — | — | — | (1,607) |
| Total return on Revolution Bars Group PLC | Floating rate based on 1-week GBP LIBOR plus 0.900% | Monthly | Goldman Sachs | 08/30/2018 | GBP | 253,620 | 2,349 | (20) | — | — | 2,329 | — |
| Total | | | | | | | (74,821) | (2,686) | — | — | 4,827 | (82,334) |
| Total return swap contracts on futures |
| Reference instrument* | Counterparty | Expiration
date | Trading
currency | Notional amount
long(short) | Upfront
payments ($) | Upfront
receipts ($) | Value/Unrealized
appreciation
($) | Value/Unrealized
depreciation
($) |
| Canadian Government 10-Year Bond Dec 17 | Barclays | 12/2017 | CAD | (2,350,250) | — | — | — | (4,953) |
| Euro-Bobl Dec 17 | Barclays | 12/2017 | EUR | 920,920 | — | — | 31 | — |
| Euro-Buxl 30-Year Bond Dec 17 | Barclays | 12/2017 | EUR | (1,835,020) | — | — | 1,264 | — |
| Euro-Schatz Dec 17 | Barclays | 12/2017 | EUR | 57,538,080 | — | — | — | (14,891) |
| Japanese 10-Year Government Bond Sep 17 | Barclays | 09/2017 | JPY | (755,600,000) | — | — | — | (33,600) |
| Cocoa Dec 17 | Citi | 11/2017 | USD | (211,860) | — | — | — | (1,035) |
| Coffee Dec 17 | Citi | 11/2017 | USD | (1,067,138) | — | — | 27,889 | — |
| Corn Dec 17 | Citi | 11/2017 | USD | (1,896,075) | — | — | — | (8,333) |
| Cotton Dec 17 | Citi | 11/2017 | USD | (177,325) | — | — | — | (9,431) |
| Soybean Meal Dec 17 | Citi | 11/2017 | USD | (3,444,250) | — | — | 54,765 | — |
| Soybean Nov 17 | Citi | 10/2017 | USD | (3,072,063) | — | — | — | (42,880) |
| Soybean Oil Dec 17 | Citi | 11/2017 | USD | 504,864 | — | — | 1,959 | — |
| Wheat Dec 17 | Citi | 11/2017 | USD | (21,813) | — | — | 1,648 | — |
| Wheat Dec 17 | Citi | 11/2017 | USD | (2,585,275) | — | — | — | (8,638) |
| Hang Seng Index Sep 17 | JPMorgan | 09/2017 | HKD | 33,524,400 | — | — | 19,546 | — |
The accompanying Notes to Consolidated Financial Statements are an integral part of this statement.
Multi-Manager Alternative Strategies Fund | Annual Report 2017
| 33 |
Consolidated Portfolio of Investments (continued)
August 31, 2017
| Total return swap contracts on futures (continued) |
| Reference instrument* | Counterparty | Expiration
date | Trading
currency | Notional amount
long(short) | Upfront
payments ($) | Upfront
receipts ($) | Value/Unrealized
appreciation
($) | Value/Unrealized
depreciation
($) |
| H-Shares Index Sep 17 | JPMorgan | 09/2017 | HKD | 50,724,000 | — | — | — | (16,112) |
| MSCI Taiwan Index Sep 17 | JPMorgan | 09/2017 | USD | 7,131,600 | — | — | 21,458 | — |
| SGX Nifty Index Sep 17 | JPMorgan | 09/2017 | USD | 1,073,304 | — | — | — | (1,964) |
| Swiss Market Index Sep 17 | JPMorgan | 09/2017 | CHF | 4,369,820 | — | — | 21,023 | — |
| Total | | | | | — | — | 149,583 | (141,837) |
| * If the notional amount of the swap contract is long and the swap contract’s value is positive (negative), the fund will receive (pay) the total return. If the notional amount of the swap contract is short and the swap contract’s value is positive (negative), the fund will pay (receive) the total return. Receipts and payments occur upon termination of the contract. |
Notes to Consolidated Portfolio of Investments
| (a) | Represents privately placed and other securities and instruments exempt from SEC registration (collectively, private placements), such as Section 4(a)(2) and Rule 144A eligible securities, which are often sold only to qualified institutional buyers. The Fund may invest in private placements determined to be liquid as well as those determined to be illiquid. Private placements may be determined to be liquid under guidelines established by the Fund’s Board of Trustees. At August 31, 2017, the value of these securities amounted to $49,457,374, which represents 8.52% of net assets. |
| (b) | Variable rate security. |
| (c) | Represents a variable rate security where the coupon rate adjusts periodically using the weighted average coupon of the underlying mortgages. |
| (d) | Represents interest only securities which have the right to receive the monthly interest payments on an underlying pool of mortgage loans. |
| (e) | Represents fair value as determined in good faith under procedures approved by the Board of Trustees. At August 31, 2017, the value of these securities amounted to $7,713,377, which represents 1.33% of net assets. |
| (f) | Non-income producing investment. |
| (g) | Valuation based on significant unobservable inputs. |
| (h) | At August 31, 2017, securities valued at $6,416,685 were held to cover open call options written. |
| (i) | This security or a portion of this security has been pledged as collateral in connection with investments sold short. |
| (j) | Represents a step bond where the coupon rate adjusts according to a schedule for a series of periods, typically lower for an initial period and then increasing to a higher coupon rate thereafter. |
| (k) | Represents securities that have defaulted on payment of interest. The Fund has stopped accruing interest on these securities. At August 31, 2017, the value of these securities amounted to $4,217,707, which represents 0.73% of net assets. |
| (l) | Principal and interest may not be guaranteed by the government. |
| (m) | The rate shown is the seven-day current annualized yield at August 31, 2017. |
| (n) | As defined in the Investment Company Act of 1940, an affiliated company is one in which the Fund owns 5% or more of the company’s outstanding voting securities, or a company which is under common ownership or control with the Fund. Holdings and transactions in these affiliated companies during the year ended August 31, 2017 are as follows: |
| Issuer | Beginning
shares | Shares
purchased | Shares
sold | Ending
shares | Realized gain
(loss) ($) | Net change in
unrealized
appreciation
(depreciation) ($) | Dividends —
affiliated
issuers($) | Value ($) |
| Columbia Short-Term Cash Fund, 1.146% | 255,529,165 | 1,335,807,979 | (1,407,941,604) | 183,395,540 | 3,109 | 2,034 | 1,464,561 | 183,395,540 |
Abbreviation Legend
| ADR | American Depositary Receipt |
| CMO | Collateralized Mortgage Obligation |
| FGIC | Financial Guaranty Insurance Corporation |
| PIK | Payment In Kind |
Currency Legend
| AUD | Australian Dollar |
| BRL | Brazilian Real |
| CAD | Canada Dollar |
The accompanying Notes to Consolidated Financial Statements are an integral part of this statement.
| 34 | Multi-Manager Alternative Strategies Fund | Annual Report 2017 |
Consolidated Portfolio of Investments (continued)
August 31, 2017
Currency Legend (continued)
| CHF | Swiss Franc |
| CLP | Chilean Peso |
| COP | Colombian Peso |
| EUR | Euro |
| GBP | British Pound |
| HKD | Hong Kong Dollar |
| HUF | Hungarian Forint |
| IDR | Indonesian Rupiah |
| ILS | New Israeli Sheqel |
| INR | Indian Rupee |
| JPY | Japanese Yen |
| KRW | South Korean Won |
| MXN | Mexican Peso |
| NOK | Norwegian Krone |
| NZD | New Zealand Dollar |
| PHP | Philippine Peso |
| PLN | Polish Zloty |
| SEK | Swedish Krona |
| SGD | Singapore Dollar |
| TRY | Turkish Lira |
| TWD | New Taiwan Dollar |
| USD | US Dollar |
| ZAR | South African Rand |
Fair value measurements
The Fund categorizes its fair value measurements according to a three-level hierarchy that maximizes the use of observable inputs and minimizes the use of unobservable inputs by prioritizing that the most observable input be used when available. Observable inputs are those that market participants would use in pricing an investment based on market data obtained from sources independent of the reporting entity. Unobservable inputs are those that reflect the Fund’s assumptions about the information market participants would use in pricing an investment. An investment’s level within the fair value hierarchy is based on the lowest level of any input that is deemed significant to the asset’s or liability’s fair value measurement. The input levels are not necessarily an indication of the risk or liquidity associated with investments at that level. For example, certain U.S. government securities are generally high quality and liquid, however, they are reflected as Level 2 because the inputs used to determine fair value may not always be quoted prices in an active market.
Fair value inputs are summarized in the three broad levels listed below:
| • | Level 1 – Valuations based on quoted prices for investments in active markets that the Fund has the ability to access at the measurement date. Valuation adjustments are not applied to Level 1 investments. |
| • | Level 2 – Valuations based on other significant observable inputs (including quoted prices for similar securities, interest rates, prepayment speeds, credit risks, etc.). |
| • | Level 3 – Valuations based on significant unobservable inputs (including the Fund’s own assumptions and judgment in determining the fair value of investments). |
Inputs that are used in determining fair value of an investment may include price information, credit data, volatility statistics, and other factors. These inputs can be either observable or unobservable. The availability of observable inputs can vary between investments, and is affected by various factors such as the type of investment, and the volume and level of activity for that investment or similar investments in the marketplace. The inputs will be considered by the Investment Manager, along with any other relevant factors in the calculation of an investment’s fair value. The Fund uses prices and inputs that are current as of the measurement date, which may include periods of market dislocations. During these periods, the availability of prices and inputs may be reduced for many investments. This condition could cause an investment to be reclassified between the various levels within the hierarchy.
Foreign equity securities actively traded in markets where there is a significant delay in the local close relative to the New York Stock Exchange are classified as Level 2. The values of these securities may include an adjustment to reflect the impact of significant market movements following the close of local trading, as described in Note 2 to the Notes to Consolidated Financial Statements – Security valuation.
Certain investments that have been measured at fair value using the net asset value (NAV) per share (or its equivalent) are not categorized in the fair value hierarchy. The fair value amounts presented in the table are intended to reconcile the fair value hierarchy to the amounts presented in the Consolidated Portfolio of Investments. The Columbia Short-Term Cash Fund seeks to provide shareholders with maximum current income consistent with liquidity and stability of principal. Columbia Short-Term Cash Fund prices its shares with a floating NAV and no longer seeks to maintain a stable NAV.
Investments falling into the Level 3 category are primarily supported by quoted prices from brokers and dealers participating in the market for those investments. However, these may be classified as Level 3 investments due to lack of market transparency and corroboration to support these quoted prices. Additionally, valuation models may be used as the pricing source for any remaining investments classified as Level 3. These models may rely on one or more significant unobservable inputs and/or significant assumptions by the Investment Manager. Inputs used in valuations may include, but are not limited to, financial statement analysis, capital account balances, discount rates and estimated cash flows, and comparable company data.
The accompanying Notes to Consolidated Financial Statements are an integral part of this statement.
Multi-Manager Alternative Strategies Fund | Annual Report 2017
| 35 |
Consolidated Portfolio of Investments (continued)
August 31, 2017
Fair value measurements (continued)
Under the direction of the Fund’s Board of Trustees (the Board), the Investment Manager’s Valuation Committee (the Committee) is responsible for overseeing the valuation procedures approved by the Board. The Committee consists of voting and non-voting members from various groups within the Investment Manager’s organization, including operations and accounting, trading and investments, compliance, risk management and legal.
The Committee meets at least monthly to review and approve valuation matters, which may include a description of specific valuation determinations, data regarding pricing information received from approved pricing vendors and brokers and the results of Board-approved valuation control policies and procedures (the Policies). The Policies address, among other things, instances when market quotations are or are not readily available, including recommendations of third party pricing vendors and a determination of appropriate pricing methodologies; events that require specific valuation determinations and assessment of fair value techniques; securities with a potential for stale pricing, including those that are illiquid, restricted, or in default; and the effectiveness of third party pricing vendors, including periodic reviews of vendors. The Committee meets more frequently, as needed, to discuss additional valuation matters, which may include the need to review back-testing results, review time-sensitive information or approve related valuation actions. The Committee reports to the Board, with members of the Committee meeting with the Board at each of its regularly scheduled meetings to discuss valuation matters and actions during the period, similar to those described earlier.
For investments categorized as Level 3, the Committee monitors information similar to that described above, which may include: (i) data specific to the issuer or comparable issuers, (ii) general market or specific sector news and (iii) quoted prices and specific or similar security transactions. The Committee considers this data and any changes from prior periods in order to assess the reasonableness of observable and unobservable inputs, any assumptions or internal models used to value those securities and changes in fair value. This data is also used to corroborate, when available, information received from approved pricing vendors and brokers. Various factors impact the frequency of monitoring this information (which may occur as often as daily). However, the Committee may determine that changes to inputs, assumptions and models are not required as a result of the monitoring procedures performed.
The following table is a summary of the inputs used to value the Fund’s investments at August 31, 2017:
| | Level 1
quoted prices
in active
markets for
identical
assets ($) | Level 2
other
significant
observable
inputs ($) | Level 3
significant
unobservable
inputs ($) | Investments
measured at
net asset
value ($) | Total ($) |
| Investments | | | | | |
| Asset-Backed Securities — Non-Agency | — | 22,162,545 | — | — | 22,162,545 |
| Commercial Mortgage-Backed Securities - Agency | — | 18,428,938 | — | — | 18,428,938 |
| Commercial Mortgage-Backed Securities - Non-Agency | — | 12,419,978 | — | — | 12,419,978 |
| Common Stocks | | | | | |
| Consumer Discretionary | 22,372,455 | 1,063,482 | 4,789,183 | — | 28,225,120 |
| Consumer Staples | 1,535,420 | — | 359,405 | — | 1,894,825 |
| Energy | 757,104 | — | — | — | 757,104 |
| Financials | 6,851,218 | — | — | — | 6,851,218 |
| Health Care | 35,676,857 | 687,985 | 2,564,789 | — | 38,929,631 |
| Industrials | 14,316,236 | 1,946,152 | — | — | 16,262,388 |
| Information Technology | 29,857,988 | 6,622,013 | — | — | 36,480,001 |
| Materials | 7,590,895 | 1,802,480 | — | — | 9,393,375 |
| Real Estate | 3,235,131 | — | — | — | 3,235,131 |
| Telecommunication Services | 4,968,290 | — | — | — | 4,968,290 |
| Total Common Stocks | 127,161,594 | 12,122,112 | 7,713,377 | — | 146,997,083 |
| Convertible Bonds | — | 2,673,156 | — | — | 2,673,156 |
| Corporate Bonds & Notes | — | 69,882,272 | — | — | 69,882,272 |
| Exchange-Traded Funds | 671,309 | — | — | — | 671,309 |
| Foreign Government Obligations | — | 2,954,446 | — | — | 2,954,446 |
| Limited Partnerships | | | | | |
| Financials | 6,145,630 | — | — | — | 6,145,630 |
| Municipal Bonds | — | 3,608,357 | — | — | 3,608,357 |
| Mutual Funds | 10,257,286 | — | — | — | 10,257,286 |
| Residential Mortgage-Backed Securities - Agency | — | 718,638 | — | — | 718,638 |
| Residential Mortgage-Backed Securities - Non-Agency | — | 32,067,610 | — | — | 32,067,610 |
| Treasury Bills | 53,246,702 | — | — | — | 53,246,702 |
| Options Purchased Calls | 9,708 | — | — | — | 9,708 |
| Options Purchased Puts | 68,876 | — | — | — | 68,876 |
| Money Market Funds | — | — | — | 183,395,540 | 183,395,540 |
| Total Investments | 197,561,105 | 177,038,052 | 7,713,377 | 183,395,540 | 565,708,074 |
| Investments Sold Short | | | | | |
The accompanying Notes to Consolidated Financial Statements are an integral part of this statement.
| 36 | Multi-Manager Alternative Strategies Fund | Annual Report 2017 |
Consolidated Portfolio of Investments (continued)
August 31, 2017
Fair value measurements (continued)
| | Level 1
quoted prices
in active
markets for
identical
assets ($) | Level 2
other
significant
observable
inputs ($) | Level 3
significant
unobservable
inputs ($) | Investments
measured at
net asset
value ($) | Total ($) |
| Common Stocks | | | | | |
| Consumer Discretionary | (4,411,160) | — | — | — | (4,411,160) |
| Consumer Staples | (397,296) | — | — | — | (397,296) |
| Energy | (731,458) | — | — | — | (731,458) |
| Financials | (3,105,305) | — | — | — | (3,105,305) |
| Health Care | (5,160,480) | (524,114) | — | — | (5,684,594) |
| Industrials | (3,525,233) | — | — | — | (3,525,233) |
| Information Technology | (20,339,073) | — | — | — | (20,339,073) |
| Materials | (3,025,364) | — | — | — | (3,025,364) |
| Real Estate | (1,877,325) | — | — | — | (1,877,325) |
| Telecommunication Services | (4,255,618) | — | — | — | (4,255,618) |
| Total Common Stocks | (46,828,312) | (524,114) | — | — | (47,352,426) |
| Corporate Bonds & Notes | — | (2,038,781) | — | — | (2,038,781) |
| Exchange-Traded Funds | (8,875,125) | — | — | — | (8,875,125) |
| Total Investments Sold Short | (55,703,437) | (2,562,895) | — | — | (58,266,332) |
| Total Investments, Net of Investments Sold Short | 141,857,668 | 174,475,157 | 7,713,377 | 183,395,540 | 507,441,742 |
| Derivatives | | | | | |
| Asset | | | | | |
| Forward Foreign Currency Exchange Contracts | — | 10,308,367 | — | — | 10,308,367 |
| Futures Contracts | 4,199,726 | — | — | — | 4,199,726 |
| Swap Contracts | — | 154,410 | — | — | 154,410 |
| Liability | | | | | |
| Forward Foreign Currency Exchange Contracts | — | (9,563,089) | — | — | (9,563,089) |
| Futures Contracts | (1,910,509) | — | — | — | (1,910,509) |
| Options Contracts Written | (66,125) | — | — | — | (66,125) |
| Swap Contracts | — | (224,171) | — | — | (224,171) |
| Total | 144,080,760 | 175,150,674 | 7,713,377 | 183,395,540 | 510,340,351 |
See the Consolidated Portfolio of Investments for all investment classifications not indicated in the table.
The Fund’s assets assigned to the Level 2 input category are generally valued using the market approach, in which a security’s value is determined through reference to prices and information from market transactions for similar or identical assets. These assets include certain foreign securities for which a third party statistical pricing service may be employed for purposes of fair market valuation. The model utilized by such third party statistical pricing service takes into account a security’s correlation to available market data including, but not limited to, intraday index, ADR, and exchange-traded fund movements.
Forward foreign currency exchange contracts, futures contracts and swap contracts are valued at unrealized appreciation (depreciation).
There were no transfers of financial assets between levels during the period.
The following table is a reconciliation of Level 3 assets for which significant observable and unobservable inputs were used to determine fair value:
| Investments in securities | Balance
as of
08/31/2016
($) | Realized
gain (loss)
($) | Change
in unrealized
appreciation
(depreciation)(a)
($) | Purchases
($) | Sales
($) | Balance
as of
08/31/2017
($) |
| Common Stocks | 506,487 | (17,073) | 360,118 | 15,474,595 | (8,610,750) | 7,713,377 |
| Options Purchased Calls | — | — | (1,046) | 1,046 | — | — |
| Options Purchased Puts | — | (25) | 25 | — | — | — |
| Options Written Calls | (150) | 261 | (286) | 175 | — | — |
| Total | 506,337 | (16,837) | 358,811 | 15,475,816 | (8,610,750) | 7,713,377 |
(a) Change in unrealized appreciation (depreciation) relating to securities held at August 31, 2017 was $344,818, which is comprised of Common Stocks of $344,818.
The accompanying Notes to Consolidated Financial Statements are an integral part of this statement.
Multi-Manager Alternative Strategies Fund | Annual Report 2017
| 37 |
Consolidated Portfolio of Investments (continued)
August 31, 2017
Fair value measurements (continued)
The Fund’s assets assigned to the Level 3 category are valued utilizing the valuation technique deemed the most appropriate in the circumstances. Certain common stocks and options classified as Level 3 are valued using the market approach. To determine fair value for these securities, management considered various factors which may have included, but were not limited to, estimated cash flows of the securities, observed yields on securities deemed comparable, the subscription price of the security, closing prices of similar securities from the issuer. Significant increases (decreases) to any of these inputs would result in a significantly lower (higher) fair value measurement.
The accompanying Notes to Consolidated Financial Statements are an integral part of this statement.
| 38 | Multi-Manager Alternative Strategies Fund | Annual Report 2017 |
Consolidated Statement of Assets and Liabilities
August 31, 2017
| Assets | |
| Investments in unaffiliated issuers, at cost | $376,194,473 |
| Investments in affiliated issuers, at cost | 183,393,506 |
| Investments in options purchased, at cost | 133,970 |
| Investments in unaffiliated issuers, at value | 382,233,950 |
| Investments in affiliated issuers, at value | 183,395,540 |
| Investments in options purchased, at value | 78,584 |
| Foreign currency (identified cost $211,767) | 213,292 |
| Cash collateral held at broker for: | |
| Forward foreign currency exchange contracts | 2,850,000 |
| Swap contracts | 5,020,000 |
| Other (a) | 54,984,849 |
| Margin deposits on: | |
| Futures contracts | 10,056,228 |
| Unrealized appreciation on forward foreign currency exchange contracts | 10,308,367 |
| Unrealized appreciation on swap contracts | 154,410 |
| Receivable for: | |
| Investments sold | 9,816,616 |
| Capital shares sold | 828,366 |
| Dividends | 238,499 |
| Interest | 1,519,264 |
| Foreign tax reclaims | 5,186 |
| Variation margin for futures contracts | 1,863,339 |
| Prepaid expenses | 3,921 |
| Trustees’ deferred compensation plan | 31,809 |
| Other assets | 6,336 |
| Total assets | 663,608,556 |
| Liabilities | |
| Securities sold short, at value (proceeds $55,649,557) | 58,266,332 |
| Option contracts written, at value (premiums received $109,951) | 66,125 |
| Due to custodian | 116,988 |
| Unrealized depreciation on forward foreign currency exchange contracts | 9,563,089 |
| Unrealized depreciation on swap contracts | 224,171 |
| Payable for: | |
| Investments purchased | 12,166,648 |
| Capital shares purchased | 1,871,080 |
| Dividends and interest on securities sold short | 67,199 |
| Variation margin for futures contracts | 872,977 |
| Management services fees | 17,354 |
| Distribution and/or service fees | 14 |
| Transfer agent fees | 53,859 |
| Compensation of board members | 529 |
| Compensation of chief compliance officer | 41 |
| Other expenses | 97,763 |
| Trustees’ deferred compensation plan | 31,809 |
| Total liabilities | 83,415,978 |
| Net assets applicable to outstanding capital stock | $580,192,578 |
The accompanying Notes to Consolidated Financial Statements are an integral part of this statement.
Multi-Manager Alternative Strategies Fund | Annual Report 2017
| 39 |
Consolidated Statement of Assets and Liabilities (continued)
August 31, 2017
| Represented by | |
| Paid in capital | $663,527,286 |
| Excess of distributions over net investment income | (50,241,444) |
| Accumulated net realized loss | (39,580,044) |
| Unrealized appreciation (depreciation) on: | |
| Investments - unaffiliated issuers | 6,039,477 |
| Investments - affiliated issuers | 2,034 |
| Foreign currency translations | 108,870 |
| Forward foreign currency exchange contracts | 745,278 |
| Futures contracts | 2,289,217 |
| Options purchased | (55,386) |
| Options contracts written | 43,826 |
| Securities sold short | (2,616,775) |
| Swap contracts | (69,761) |
| Total - representing net assets applicable to outstanding capital stock | $580,192,578 |
| Class A | |
| Net assets | $1,953,184 |
| Shares outstanding | 216,405 |
| Net asset value per share | $9.03 |
| Class Z | |
| Net assets | $578,239,394 |
| Shares outstanding | 64,012,297 |
| Net asset value per share | $9.03 |
| (a) | Includes collateral related to options purchased, options contracts written, forward foreign currency exchange contracts, and securities sold short. |
The accompanying Notes to Consolidated Financial Statements are an integral part of this statement.
| 40 | Multi-Manager Alternative Strategies Fund | Annual Report 2017 |
Consolidated Statement of Operations
Year Ended August 31, 2017
| Net investment income | |
| Income: | |
| Dividends — unaffiliated issuers | $2,813,718 |
| Dividends — affiliated issuers | 1,464,561 |
| Interest | 3,907,432 |
| Foreign taxes withheld | (28,704) |
| Total income | 8,157,007 |
| Expenses: | |
| Management services fees | 6,656,052 |
| Distribution and/or service fees | |
| Class A | 891,194 |
| Transfer agent fees | |
| Class A | 414,990 |
| Class Z(a) | 304,727 |
| Compensation of board members | 29,620 |
| Custodian fees | 74,156 |
| Printing and postage fees | 87,268 |
| Registration fees | 65,783 |
| Audit fees | 80,208 |
| Legal fees | 17,355 |
| Dividends and interest on securities sold short | 1,389,886 |
| Compensation of chief compliance officer | 265 |
| Other | 44,016 |
| Total expenses | 10,055,520 |
| Net investment loss | (1,898,513) |
| Realized and unrealized gain (loss) — net | |
| Net realized gain (loss) on: | |
| Investments — unaffiliated issuers | 19,932,398 |
| Investments — affiliated issuers | 3,109 |
| Foreign currency translations | (610,871) |
| Forward foreign currency exchange contracts | (2,135,235) |
| Futures contracts | (25,158,631) |
| Options purchased | (1,051,967) |
| Options contracts written | 1,504,531 |
| Securities sold short | (17,000,327) |
| Swap contracts | (1,829,442) |
| Net realized loss | (26,346,435) |
| Net change in unrealized appreciation (depreciation) on: | |
| Investments — unaffiliated issuers | (5,844,227) |
| Investments — affiliated issuers | 2,034 |
| Foreign currency translations | 148,214 |
| Forward foreign currency exchange contracts | 667,230 |
| Futures contracts | (3,017,859) |
| Options purchased | (1,476) |
| Options contracts written | (2,744) |
| Securities sold short | 9,581,841 |
| Swap contracts | (1,478,739) |
| Net change in unrealized appreciation (depreciation) | 54,274 |
| Net realized and unrealized loss | (26,292,161) |
| Net decrease in net assets resulting from operations | $(28,190,674) |
| (a) | Class Z shares are based on operations from January 3, 2017 (commencement of operations) through the stated period end. |
The accompanying Notes to Consolidated Financial Statements are an integral part of this statement.
Multi-Manager Alternative Strategies Fund | Annual Report 2017
| 41 |
Consolidated Statement of Changes in Net Assets
| | Year Ended
August 31, 2017 | Year Ended
August 31, 2016 |
| Operations | | |
| Net investment loss | $(1,898,513) | $(3,766,980) |
| Net realized loss | (26,346,435) | (28,442,430) |
| Net change in unrealized appreciation (depreciation) | 54,274 | 37,334,140 |
| Net increase (decrease) in net assets resulting from operations | (28,190,674) | 5,124,730 |
| Distributions to shareholders | | |
| Net investment income | | |
| Class A | — | (52,422,234) |
| Total distributions to shareholders | — | (52,422,234) |
| Increase (decrease) in net assets from capital stock activity | (139,092,973) | 9,833,439 |
| Total decrease in net assets | (167,283,647) | (37,464,065) |
| Net assets at beginning of year | 747,476,225 | 784,940,290 |
| Net assets at end of year | $580,192,578 | $747,476,225 |
| Excess of distributions over net investment income | $(50,241,444) | $(42,446,542) |
The accompanying Notes to Consolidated Financial Statements are an integral part of this statement.
| 42 | Multi-Manager Alternative Strategies Fund | Annual Report 2017 |
Consolidated Statement of Changes in Net Assets (continued)
| | Year Ended | Year Ended |
| | August 31, 2017 (a) | August 31, 2016 |
| | Shares | Dollars ($) | Shares | Dollars ($) |
| Capital stock activity |
| Class A | | | | |
| Subscriptions | 15,207,720 | 140,714,297 | 20,877,104 | 197,467,461 |
| Distributions reinvested | — | — | 5,773,356 | 52,422,072 |
| Redemptions | (94,092,240) | (864,114,185) | (25,487,363) | (240,056,094) |
| Net increase (decrease) | (78,884,520) | (723,399,888) | 1,163,097 | 9,833,439 |
| Class Z | | | | |
| Subscriptions | 71,597,470 | 652,815,075 | — | — |
| Redemptions | (7,585,173) | (68,508,160) | — | — |
| Net increase | 64,012,297 | 584,306,915 | — | — |
| Total net increase (decrease) | (14,872,223) | (139,092,973) | 1,163,097 | 9,833,439 |
| (a) | Class Z shares are based on operations from January 3, 2017 (commencement of operations) through the stated period end. |
The accompanying Notes to Consolidated Financial Statements are an integral part of this statement.
Multi-Manager Alternative Strategies Fund | Annual Report 2017
| 43 |
Consolidated Financial Highlights
The following table is intended to help you understand the Fund’s financial performance. Certain information reflects financial results for a single share of a class held for the periods shown. Per share net investment income (loss) amounts are calculated based on average shares outstanding during the period. Total return assumes reinvestment of all dividends and distributions, if any. Total return does not reflect payment of sales charges, if any. Total return and portfolio turnover are not annualized for periods of less than one year. The portfolio turnover rate is calculated without regard to purchase and sales transactions of short-term instruments and certain derivatives, if any. If such transactions were included, the Fund’s portfolio turnover rate may be higher.
| Year ended | Net asset value,
beginning of
period | Net
investment
income
(loss) | Net
realized
and
unrealized
gain (loss) | Total from
investment
operations | Distributions
from net
investment
income | Distributions
from net
realized
gains |
| Class A |
| 8/31/2017 | $9.45 | (0.07) | (0.35) | (0.42) | — | — |
| 8/31/2016 | $10.07 | (0.05) | 0.10 | 0.05 | (0.67) | — |
| 8/31/2015 | $10.88 | 0.03 (d) | (0.26) | (0.23) | (0.10) | (0.48) |
| 8/31/2014 | $10.49 | (0.03) | 0.67 | 0.64 | (0.13) | (0.12) |
| 8/31/2013 | $10.03 | 0.02 | 0.53 | 0.55 | (0.08) | (0.01) |
| Class Z |
| 8/31/2017 (e) | $9.10 | 0.02 | (0.09) | (0.07) | — | — |
| Notes to Consolidated Financial Highlights |
| (a) | In addition to the fees and expenses that the Fund bears directly, the Fund indirectly bears a pro rata share of the fees and expenses of any other funds in which it invests. Such indirect expenses are not included in the Fund’s reported expense ratios. |
| (b) | Total net expenses include the impact of certain fee waivers/expense reimbursements made by the Investment Manager and certain of its affiliates, if applicable. |
| (c) | Ratios include dividends and interest on securities sold short. If dividends and interest on securities sold short had been excluded, expenses would have been lower by: |
| Class | 08/31/2017 | 08/31/2016 | 08/31/2015 | 08/31/2014 | 08/31/2013 |
| Class A | 0.28% | 0.32% | 0.35% | 0.31% | 0.17% |
| Class Z | 0.15% (f) | —% | —% | —% | —% |
| (d) | Net investment income per share includes special dividends. The effect of these dividends amounted to $0.08 per share. |
| (e) | Class Z shares commenced operations on January 3, 2017. Per share data and total return reflect activity from that date. |
| (f) | Annualized. |
The accompanying Notes to Consolidated Financial Statements are an integral part of this statement.
| 44 | Multi-Manager Alternative Strategies Fund | Annual Report 2017 |
Total
distributions to
shareholders | Net
asset
value,
end of
period | Total
return | Total gross
expense
ratio to
average
net assets(a) | Total net
expense
ratio to
average
net assets(a),(b) | Net investment
income (loss)
ratio to
average
net assets | Portfolio
turnover | Net
assets,
end of
period
(000’s) |
| |
| — | $9.03 | (4.44%) | 1.75% (c) | 1.75% (c) | (0.77%) | 444% | $1,953 |
| (0.67) | $9.45 | 0.79% | 1.80% (c) | 1.80% (c) | (0.49%) | 289% | $747,476 |
| (0.58) | $10.07 | (2.30%) | 1.83% (c) | 1.83% (c) | 0.27% | 304% | $784,940 |
| (0.25) | $10.88 | 6.15% | 1.79% (c) | 1.79% (c) | (0.27%) | 246% | $777,811 |
| (0.09) | $10.49 | 5.53% | 1.70% (c) | 1.67% (c) | 0.17% | 239% | $666,228 |
| |
| — | $9.03 | (0.77%) | 1.45% (c),(f) | 1.45% (c),(f) | 0.34% (f) | 444% | $578,239 |
Multi-Manager Alternative Strategies Fund | Annual Report 2017
| 45 |
Notes to Consolidated Financial Statements
August 31, 2017
Note 1. Organization
Multi-Manager Alternative Strategies Fund (formerly known as Active Portfolios® Multi-Manager Alternatives Fund) (the Fund), a series of Columbia Funds Series Trust I (the Trust), is a non-diversified fund. The Trust is registered under the Investment Company Act of 1940, as amended (the 1940 Act), as an open-end management investment company organized as a Massachusetts business trust.
Basis for consolidation
ASGM Offshore Fund, Ltd. and ASMF Offshore Fund, Ltd. (each, a Subsidiary) are each a Cayman Islands exempted company and wholly-owned subsidiary of the Fund. Each Subsidiary acts as an investment vehicle in order to effect certain investment strategies consistent with the Fund’s investment objective and policies as stated in its current prospectus and statement of additional information. In accordance with the Memorandum and Articles of Association of the Subsidiary (the Articles), the Fund owns the sole issued share of each Subsidiary and retains all rights associated with such share, including the right to receive notice of, attend and vote at general meetings of the Subsidiaries, rights in a winding-up or repayment of capital and the right to participate in the profits or assets of the Subsidiaries. The consolidated financial statements (financial statements) include the accounts of the consolidated Fund and each respective Subsidiary. Subsequent references to the Fund within the Notes to Consolidated Financial Statements collectively refer to the Fund and each Subsidiary. All intercompany transactions and balances have been eliminated in the consolidation process.
At August 31, 2017, each Subsidiary’s financial statement information is as follows:
| | ASGM Offshore Fund, Ltd. | ASMF Offshore Fund, Ltd. |
| % of consolidated fund net assets | 0.01% | 8.24% |
| Net assets | $50,702 | $47,812,419 |
| Net investment loss | (3,633) | (294,476) |
| Net realized loss | — | (23,503,115) |
| Net change in unrealized appreciation (depreciation) | — | 748,816 |
The financial statements present the portfolio holdings, financial position and results of operations of the Fund and the Subsidiaries on a consolidated basis.
Fund shares
The Trust may issue an unlimited number of shares (without par value). The Fund is offered only through certain wrap fee programs sponsored and/or managed by Ameriprise Financial, Inc. (Ameriprise Financial) or its affiliates. The Fund offers each of the share classes identified below.
Class A shares are not subject to any front-end sales charge or contingent deferred sales charge.
Class Z shares are not subject to any front-end sales charge or contingent deferred sales charge. Class Z shares commenced operations on January 3, 2017. Effective November 1, 2017, Class Z shares will be renamed Institutional Class shares.
Note 2. Summary of significant accounting policies
Basis of preparation
The Fund is an investment company that applies the accounting and reporting guidance in the Financial Accounting Standards Board (FASB) Accounting Standards Codification Topic 946, Financial Services - Investment Companies (ASC 946). The financial statements are prepared in accordance with U.S. generally accepted accounting principles (GAAP), which requires management to make certain estimates and assumptions that affect the reported amounts of assets and liabilities, the disclosure of contingent assets and liabilities at the date of the financial statements and the reported amounts of income and expenses during the reporting period. Actual results could differ from those estimates.
The following is a summary of significant accounting policies followed by the Fund in the preparation of its financial statements.
| 46 | Multi-Manager Alternative Strategies Fund | Annual Report 2017 |
Notes to Consolidated Financial Statements (continued)
August 31, 2017
Security valuation
All equity securities and exchange-traded funds are valued at the close of business of the New York Stock Exchange. Equity securities and exchange-traded funds are valued at the last quoted sales price on the principal exchange or market on which they trade, except for securities traded on the NASDAQ Stock Market, which are valued at the NASDAQ official close price. Unlisted securities or listed securities for which there were no sales during the day are valued at the mean of the latest quoted bid and ask prices on such exchanges or markets.
Debt securities generally are valued by pricing services approved by the Board of Trustees based upon market transactions for normal, institutional-size trading units of similar securities. The services may use various pricing techniques that take into account, as applicable, factors such as yield, quality, coupon rate, maturity, type of issue, trading characteristics and other data, as well as approved independent broker-dealer quotes. Debt securities for which quotations are not readily available or not believed to be reflective of market value may also be valued based upon a bid quote from an approved independent broker-dealer. Debt securities maturing in 60 days or less are valued primarily at amortized cost value, unless this method results in a valuation that management believes does not approximate market value.
Asset- and mortgage-backed securities are generally valued by pricing services, which utilize pricing models that incorporate the securities’ cash flow and loan performance data. These models also take into account available market data, including trades, market quotations, and benchmark yield curves for identical or similar securities. Factors used to identify similar securities may include, but are not limited to, issuer, collateral type, vintage, prepayment speeds, collateral performance, credit ratings, credit enhancement and expected life. Asset-backed securities for which quotations are readily available may also be valued based upon an over-the-counter or exchange bid quote from an approved independent broker-dealer.
Foreign equity securities are valued based on the closing price on the foreign exchange in which such securities are primarily traded. If any foreign equity security closing prices are not readily available, the securities are valued at the mean of the latest quoted bid and ask prices on such exchanges or markets. Foreign currency exchange rates are generally determined at 4:00 p.m. Eastern (U.S.) time. Many securities markets and exchanges outside the U.S. close prior to the close of the New York Stock Exchange; therefore, the closing prices for securities in such markets or on such exchanges may not fully reflect events that occur after such close but before the close of the New York Stock Exchange. In those situations, foreign securities will be fair valued pursuant to a policy adopted by the Board of Trustees, including, if available, utilizing a third party pricing service to determine these fair values. The third party pricing service takes into account multiple factors, including, but not limited to, movements in the U.S. securities markets, certain depositary receipts, futures contracts and foreign exchange rates that have occurred subsequent to the close of the foreign exchange or market, to determine a good faith estimate that reasonably reflects the current market conditions as of the close of the New York Stock Exchange. The fair value of a security is likely to be different from the quoted or published price, if available.
Investments in open-end investment companies, including money market funds, are valued at their latest net asset value.
Forward foreign currency exchange contracts are marked-to-market based upon foreign currency exchange rates provided by a pricing service.
Futures and options on futures contracts are valued based upon the settlement price at the close of regular trading on their principal exchanges or, in the absence of transactions, at the mean of the latest quoted bid and ask prices.
Option contracts are valued at the mean of the latest quoted bid and ask prices on their primary exchanges. Option contracts, including over-the-counter option contracts, with no readily available market quotations are valued using quotes obtained from independent brokers as of the close of the New York Stock Exchange.
Swap transactions are valued through an independent pricing service or broker, or if neither is available, through an internal model based upon observable inputs.
Investments for which market quotations are not readily available, or that have quotations which management believes are not reflective of market value or reliable, are valued at fair value as determined in good faith under procedures approved by and under the general supervision of the Board of Trustees. If a security or class of securities (such as foreign securities) is valued at fair value, such value is likely to be different from the quoted or published price for the security.
Multi-Manager Alternative Strategies Fund | Annual Report 2017
| 47 |
Notes to Consolidated Financial Statements (continued)
August 31, 2017
The determination of fair value often requires significant judgment. To determine fair value, management may use assumptions including but not limited to future cash flows and estimated risk premiums. Multiple inputs from various sources may be used to determine fair value.
GAAP requires disclosure regarding the inputs and valuation techniques used to measure fair value and any changes in valuation inputs or techniques. In addition, investments shall be disclosed by major category. This information is disclosed following the Fund’s Consolidated Portfolio of Investments.
Foreign currency transactions and translations
The values of all assets and liabilities denominated in foreign currencies are generally translated into U.S. dollars at exchange rates determined at the close of regular trading on the New York Stock Exchange. Net realized and unrealized gains (losses) on foreign currency transactions and translations include gains (losses) arising from the fluctuation in exchange rates between trade and settlement dates on securities transactions, gains (losses) arising from the disposition of foreign currency and currency gains (losses) between the accrual and payment dates on dividends, interest income and foreign withholding taxes.
For financial statement purposes, the Fund does not distinguish that portion of gains (losses) on investments which is due to changes in foreign exchange rates from that which is due to changes in market prices of the investments. Such fluctuations are included with the net realized and unrealized gains (losses) on investments in the Consolidated Statement of Operations.
Derivative instruments
The Fund invests in certain derivative instruments, as detailed below, to meet its investment objectives. Derivatives are instruments whose values depend on, or are derived from, in whole or in part, the value of one or more securities, currencies, commodities, indices, or other assets or instruments. Derivatives may be used to increase investment flexibility (including to maintain cash reserves while maintaining desired exposure to certain assets), for risk management (hedging) purposes, to facilitate trading, to reduce transaction costs and to pursue higher investment returns. The Fund may also use derivative instruments to mitigate certain investment risks, such as foreign currency exchange rate risk, interest rate risk and credit risk. Derivatives may involve various risks, including the potential inability of the counterparty to fulfill its obligations under the terms of the contract, the potential for an illiquid secondary market (making it difficult for the Fund to sell or terminate, including at favorable prices) and the potential for market movements which may expose the Fund to gains or losses in excess of the amount shown in the Consolidated Statement of Assets and Liabilities. The notional amounts of derivative instruments, if applicable, are not recorded in the financial statements.
A derivative instrument may suffer a marked-to-market loss if the value of the contract decreases due to an unfavorable change in the market rates or values of the underlying instrument. Losses can also occur if the counterparty does not perform its obligations under the contract. The Fund’s risk of loss from counterparty credit risk on over-the-counter derivatives is generally limited to the aggregate unrealized gain netted against any collateral held by the Fund and the amount of any variation margin held by the counterparty, plus any replacement costs or related amounts. With exchange-traded or centrally cleared derivatives, there is reduced counterparty credit risk to the Fund since the clearinghouse or central counterparty (CCP) provides some protection in the case of clearing member default. The clearinghouse or CCP stands between the buyer and the seller of the contract; therefore, additional counterparty credit risk is failure of the clearinghouse or CCP. However, credit risk still exists in exchange-traded or centrally cleared derivatives with respect to initial and variation margin that is held in a broker’s customer account. While brokers are required to segregate customer margin from their own assets, in the event that a broker becomes insolvent or goes into bankruptcy and at that time there is a shortfall in the aggregate amount of margin held by the broker for all its clients, U.S. bankruptcy laws will typically allocate that shortfall on a pro-rata basis across all the broker’s customers (including the Fund), potentially resulting in losses to the Fund.
In order to better define its contractual rights and to secure rights that will help the Fund mitigate its counterparty risk, the Fund may enter into an International Swaps and Derivatives Association, Inc. Master Agreement (ISDA Master Agreement) or similar agreement with its derivatives contract counterparties. An ISDA Master Agreement is an agreement between the Fund and a counterparty that governs over-the-counter derivatives and typically contains, among other things, collateral posting terms and netting provisions in the event of a default and/or termination event. Under an ISDA Master Agreement, the Fund may, under certain circumstances, offset with the counterparty certain derivative instrument’s payables and/or receivables
| 48 | Multi-Manager Alternative Strategies Fund | Annual Report 2017 |
Notes to Consolidated Financial Statements (continued)
August 31, 2017
with collateral held and/or posted and create one single net payment. The provisions of the ISDA Master Agreement typically permit a single net payment in the event of default (close-out netting), including the bankruptcy or insolvency of the counterparty. Note, however, that bankruptcy or insolvency laws of a particular jurisdiction may impose restrictions on or prohibitions against the right of offset or netting in bankruptcy, insolvency or other events.
Collateral (margin) requirements differ by type of derivative. Margin requirements are established by the clearinghouse or CCP for exchange-traded and centrally cleared derivatives. Brokers can ask for margin in excess of the minimum in certain circumstances. Collateral terms are contract specific for over-the-counter derivatives. For over-the-counter derivatives traded under an ISDA Master Agreement, the collateral requirements are typically calculated by netting the marked-to-market amount for each transaction under such agreement and comparing that amount to the value of any variation margin currently pledged by the Fund and/or the counterparty. Generally, the amount of collateral due from or to a party has to exceed a minimum transfer amount threshold (e.g., $250,000) before a transfer has to be made. To the extent amounts due to the Fund from its counterparties are not fully collateralized, contractually or otherwise, the Fund bears the risk of loss from counterparty nonperformance. The Fund attempts to mitigate counterparty risk by only entering into agreements with counterparties that it believes have the financial resources to honor their obligations and by monitoring the financial stability of those counterparties.
Certain ISDA Master Agreements allow counterparties of over-the-counter derivatives transactions to terminate derivatives contracts prior to maturity in the event the Fund’s net asset value declines by a stated percentage over a specified time period or if the Fund fails to meet certain terms of the ISDA Master Agreement, which would cause the Fund to accelerate payment of any net liability owed to the counterparty. The Fund also has termination rights if the counterparty fails to meet certain terms of the ISDA Master Agreement. In addition to considering counterparty credit risk, the Fund would consider terminating the derivatives contracts based on whether termination would result in a net liability owed from the counterparty.
For financial reporting purposes, the Fund does not offset derivative assets and derivative liabilities that are subject to netting arrangements in the Consolidated Statement of Assets and Liabilities.
Forward foreign currency exchange contracts
Forward foreign currency exchange contracts are over-the-counter agreements between two parties to buy and sell a currency at a set price on a future date. The Fund utilized forward foreign currency exchange contracts to hedge the currency exposure associated with some or all of the Fund’s securities, to shift foreign currency exposure back to U.S. dollars, to shift investment exposure from one currency to another and to generate total return through long and short positions versus the U.S. dollar. These instruments may be used for other purposes in future periods.
The values of forward foreign currency exchange contracts fluctuate daily with changes in foreign currency exchange rates. Changes in the value of these contracts are recorded as unrealized appreciation or depreciation until the contract is exercised or has expired. The Fund will realize a gain or loss when the forward foreign currency exchange contract is closed or expires.
The use of forward foreign currency exchange contracts does not eliminate fluctuations in the prices of the Fund’s portfolio securities. The risks of forward foreign currency exchange contracts include movement in the values of the foreign currencies relative to the U.S. dollar (or other foreign currencies) and the possibility that counterparties will not complete their contractual obligations, which may be in excess of the amount reflected, if any, in the Consolidated Statement of Assets and Liabilities.
Futures contracts
Futures contracts are exchange-traded and represent commitments for the future purchase or sale of an asset at a specified price on a specified date. The Fund bought and sold futures contracts to produce incremental earnings, to manage exposure to movements in interest rates, to manage the duration and yield curve of the Fund versus the benchmark, to manage exposure to the securities market and to gain commodity and currency exposure. These instruments may be used for other purposes in future periods. Upon entering into futures contracts, the Fund bears risks that it may not achieve the anticipated benefits of the futures contracts and may realize a loss. Additional risks include counterparty credit risk, the possibility of an illiquid market, and that a change in the value of the contract or option may not correlate with changes in the value of the underlying asset.
Multi-Manager Alternative Strategies Fund | Annual Report 2017
| 49 |
Notes to Consolidated Financial Statements (continued)
August 31, 2017
Upon entering into a futures contract, the Fund deposits cash or securities with the broker, known as a futures commission merchant (FCM), in an amount sufficient to meet the initial margin requirement. The initial margin deposit must be maintained at an established level over the life of the contract. Cash deposited as initial margin is recorded in the Consolidated Statement of Assets and Liabilities as margin deposits. Securities deposited as initial margin are designated in the Consolidated Portfolio of Investments. Subsequent payments (variation margin) are made or received by the Fund each day. The variation margin payments are equal to the daily change in the contract value and are recorded as variation margin receivable or payable and are offset in unrealized gains or losses. The Fund recognizes a realized gain or loss when the contract is closed or expires. Futures contracts involve, to varying degrees, risk of loss in excess of the variation margin disclosed in the Consolidated Statement of Assets and Liabilities.
Options contracts
Options are contracts which entitle the holder to purchase or sell securities or other identified assets at a specified price, or in the case of index option contracts, to receive or pay the difference between the index value and the strike price of the index option contract. Option contracts can be either exchange-traded or over-the-counter. The Fund purchased and wrote option contracts to decrease the Fund’s exposure to equity market risk and to increase return on investments, to protect gains and to facilitate buying and selling of securities for investments. These instruments may be used for other purposes in future periods. Completion of transactions for option contracts traded in the over-the-counter market depends upon the performance of the other party. Cash collateral may be collected or posted by the Fund to secure certain over-the-counter option contract trades. Cash collateral held or posted by the Fund for such option contract trades must be returned to the broker or the Fund upon closure, exercise or expiration of the contract.
Options contracts purchased are recorded as investments. When the Fund writes an options contract, the premium received is recorded as an asset and an amount equivalent to the premium is recorded as a liability in the Consolidated Statement of Assets and Liabilities and is subsequently adjusted to reflect the current fair value of the option written. Changes in the fair value of the written option are recorded as unrealized appreciation or depreciation until the contract is exercised or has expired. The Fund will realize a gain or loss when the option contract is closed or expires. When option contracts are exercised, the proceeds on sales for a written call or purchased put option contract, or the purchase cost for a written put or purchased call option contract, is adjusted by the amount of premium received or paid.
For over-the-counter options purchased, the Fund bears the risk of loss of the amount of the premiums paid plus the positive change in market values net of any collateral held by the Fund should the counterparty fail to perform under the contracts. Option contracts written by the Fund do not typically give rise to significant counterparty credit risk, as options written generally obligate the Fund and not the counterparty to perform. The risk in writing a call option contract is that the Fund gives up the opportunity for profit if the market price of the security increases above the strike price and the option contract is exercised. The risk in writing a put option contract is that the Fund may incur a loss if the market price of the security decreases below the strike price and the option contract is exercised. Exercise of a written option could result in the Fund purchasing or selling a security or foreign currency when it otherwise would not, or at a price different from the current market value. In purchasing and writing options, the Fund bears the risk of an unfavorable change in the value of the underlying instrument or the risk that the Fund may not be able to enter into a closing transaction due to an illiquid market.
Swap contracts
Swap contracts are negotiated in the over-the-counter market and may be entered into as a bilateral contract or centrally cleared (centrally cleared swap contract). In a centrally cleared swap contract, immediately following execution of the swap contract with a broker, the swap contract is novated to a central counterparty (the CCP) and the CCP becomes the Fund’s counterparty to the centrally cleared swap contract. The Fund is required to deposit initial margin with the futures commission merchant (FCM), which pledges it through to the CCP in the form of cash or securities in an amount that varies depending on the size and risk profile of the particular swap contract. Securities deposited as initial margin are designated in the Consolidated Portfolio of Investments and cash deposited is recorded in the Consolidated Statement of Assets and Liabilities as margin deposits. Unlike a bilateral swap contract, for centrally cleared swap contracts, the Fund has minimal credit exposure to the FCM because the CCP stands between the Fund and the relevant buyer/seller on the other side of the contract. Swap contracts are marked-to-market daily and changes in value are recorded as unrealized appreciation (depreciation). The daily change in valuation of centrally cleared swap contracts, if any, is recorded as a receivable or payable for variation margin in the Consolidated Statement of Assets and Liabilities.
| 50 | Multi-Manager Alternative Strategies Fund | Annual Report 2017 |
Notes to Consolidated Financial Statements (continued)
August 31, 2017
Entering into these contracts involves, to varying degrees, elements of interest, liquidity and counterparty credit risk in excess of the amounts recognized in the Consolidated Statement of Assets and Liabilities. Such risks involve the possibility that there may be unfavorable changes in interest rates, market conditions or other conditions, it may be difficult to initiate a swap transaction or liquidate a position at an advantageous time or price which may result in significant losses, and that the FCM or CCP may not fulfill its obligation under the contract.
Total return swap contracts
The Fund entered into total return swap contracts to get synthetic exposure to bond, commodity and equity index futures, to manage long or short exposure to the total return on a specified reference security in return for periodic payments based on a fixed or variable interest rate. These instruments may be used for other purposes in future periods. Total return swap contracts may be used to obtain exposure to an underlying reference security, instrument, or other asset or index or market without owning, taking physical custody of, or short selling any such security, instrument or asset in a market.
Total return swap contracts are valued daily, and the change in value is recorded as unrealized appreciation (depreciation) until the termination of the swap, at which time the Fund will realize a gain (loss). Periodic payments received (or made) by the Fund over the term of the contract are recorded as realized gains (losses). Total return swap contracts are subject to the risk associated with the investment in the underlying reference security, instrument or asset. The risk in the case of short total return swap contracts is unlimited based on the potential for unlimited increases in the market value of the underlying reference security, instrument or asset. This risk may be offset if the Fund holds any of the underlying reference security, instrument or asset. The risk in the case of long total return swap contracts is limited to the current notional amount of the total return swap contract.
Effects of derivative transactions in the financial statements
The following tables are intended to provide additional information about the effect of derivatives on the financial statements of the Fund, including: the fair value of derivatives by risk category and the location of those fair values in the Consolidated Statement of Assets and Liabilities; and the impact of derivative transactions over the period in the Consolidated Statement of Operations, including realized and unrealized gains (losses). The derivative instrument schedules following the Consolidated Portfolio of Investments present additional information regarding derivative instruments outstanding at the end of the period, if any.
The following table is a summary of the fair value of derivative instruments (not considered to be hedging instruments for accounting disclosure purposes) at August 31, 2017:
| | Asset derivatives | |
Risk exposure
category | Consolidated statement
of assets and liabilities
location | Fair value ($) |
| Equity risk | Net assets — unrealized appreciation on futures contracts | 771,298* |
| Equity risk | Investments, at value — Options Purchased | 78,584 |
| Equity risk | Net assets — unrealized appreciation on swap contracts | 66,854* |
| Foreign exchange risk | Unrealized appreciation on forward foreign currency exchange contracts | 10,308,367 |
| Foreign exchange risk | Net assets — unrealized appreciation on futures contracts | 1,787,563* |
| Interest rate risk | Net assets — unrealized appreciation on futures contracts | 187,870* |
| Interest rate risk | Net assets — unrealized appreciation on swap contracts | 1,295* |
| Commodity-related investment risk | Net assets — unrealized appreciation on futures contracts | 1,452,995* |
| Commodity-related investment risk | Net assets — unrealized appreciation on swap contracts | 86,261* |
| Total | | 14,741,087 |
Multi-Manager Alternative Strategies Fund | Annual Report 2017
| 51 |
Notes to Consolidated Financial Statements (continued)
August 31, 2017
| | Liability derivatives | |
Risk exposure
category | Consolidated statement
of assets and liabilities
location | Fair value ($) |
| Equity risk | Net assets — unrealized depreciation on futures contracts | 258,086 |
| Equity risk | Options contracts written, at value | 66,125 |
| Equity risk | Net assets — unrealized depreciation on swap contracts | 100,410 |
| Foreign exchange risk | Unrealized depreciation on forward foreign currency exchange contracts | 9,563,089 |
| Foreign exchange risk | Net assets — unrealized depreciation on futures contracts | 621,117 |
| Interest rate risk | Net assets — unrealized depreciation on futures contracts | 733,126 |
| Interest rate risk | Net assets — unrealized depreciation on swap contracts | 53,444 |
| Commodity-related investment risk | Net assets — unrealized depreciation on futures contracts | 298,180 |
| Commodity-related investment risk | Net assets — unrealized depreciation on swap contracts | 70,317 |
| Total | | 11,763,894 |
| * | Includes cumulative appreciation (depreciation) as reported in the tables following the Consolidated Portfolio of Investments. Only the current day’s variation margin is reported in receivables or payables in the Consolidated Statement of Assets and Liabilities. |
The following table indicates the effect of derivative instruments (not considered to be hedging instruments for accounting disclosure purposes) in the Consolidated Statement of Operations for the year ended August 31, 2017:
| Amount of realized gain (loss) on derivatives recognized in income |
| Risk exposure category | Forward
foreign
currency
exchange
contracts
($) | Futures
contracts
($) | Options
contracts
written
($) | Options
contracts
purchased
($) | Swap
contracts
($) | Total
($) |
| Commodity-related investment risk | — | (21,834,654) | — | — | (1,660,165) | (23,494,819) |
| Equity risk | — | 7,913,083 | 1,504,531 | (1,051,967) | (229,635) | 8,136,012 |
| Foreign exchange risk | (2,135,235) | (2,032,657) | — | — | — | (4,167,892) |
| Interest rate risk | — | (9,204,403) | — | — | 60,358 | (9,144,045) |
| Total | (2,135,235) | (25,158,631) | 1,504,531 | (1,051,967) | (1,829,442) | (28,670,744) |
| |
| Change in unrealized appreciation (depreciation) on derivatives recognized in income |
| Risk exposure category | Forward
foreign
currency
exchange
contracts
($) | Futures
contracts
($) | Options
contracts
written
($) | Options
contracts
purchased
($) | Swap
contracts
($) | Total
($) |
| Commodity-related investment risk | — | 1,358,443 | — | — | (618,082) | 740,361 |
| Equity risk | — | 7,663 | (2,744) | (1,476) | (16,481) | (13,038) |
| Foreign exchange risk | 667,230 | (2,591,625) | — | — | — | (1,924,395) |
| Interest rate risk | — | (1,792,340) | — | — | (844,176) | (2,636,516) |
| Total | 667,230 | (3,017,859) | (2,744) | (1,476) | (1,478,739) | (3,833,588) |
The following table is a summary of the average outstanding volume by derivative instrument for the year ended August 31, 2017:
| Derivative instrument | Average notional
amounts ($)* |
| Futures contracts — long | 357,180,378 |
| Futures contracts — short | 825,433,561 |
| 52 | Multi-Manager Alternative Strategies Fund | Annual Report 2017 |
Notes to Consolidated Financial Statements (continued)
August 31, 2017
| Derivative instrument | Average
value ($)* |
| Options contracts — purchased | 173,215 |
| Options contracts — written | (268,079) |
| Derivative instrument | Average unrealized
appreciation ($)* | Average unrealized
depreciation ($)* |
| Forward foreign currency exchange contracts | 11,914,566 | (12,479,397) |
| Total return swap contracts | 725,857 | (342,660) |
| * | Based on the ending quarterly outstanding amounts for the year ended August 31, 2017. |
Asset- and mortgage-backed securities
The Fund may invest in asset-backed and mortgage-backed securities. The maturity dates shown represent the original maturity of the underlying obligation. Actual maturity may vary based upon prepayment activity on these obligations. All, or a portion, of the obligation may be prepaid at any time because the underlying asset may be prepaid. As a result, decreasing market interest rates could result in an increased level of prepayment. An increased prepayment rate will have the effect of shortening the maturity of the security. Unless otherwise noted, the coupon rates presented are fixed rates.
Interest only and principal only securities
The Fund may invest in Interest Only (IO) or Principal Only (PO) securities. IOs are stripped securities entitled to receive all of the security’s interest, but none of its principal. IOs are particularly sensitive to changes in interest rates and therefore subject to greater fluctuations in price than typical interest bearing debt securities. IOs are also subject to credit risk because the Fund may not receive all or part of the interest payments if the issuer, obligor, guarantor or counterparty defaults on its obligation. Payments received for IOs are included in interest income on the Consolidated Statement of Operations. Because no principal will be received at the maturity of an IO, adjustments are made to the cost of the security on a monthly basis until maturity. These adjustments are included in interest income on the Consolidated Statement of Operations. POs are stripped securities entitled to receive the principal from the underlying obligation, but not the interest. POs are particularly sensitive to changes in interest rates and therefore are subject to fluctuations in price. POs are also subject to credit risk because the Fund may not receive all or part of its principal if the issuer, obligor, guarantor or counterparty defaults on its obligation. The Fund may also invest in IO or PO stripped mortgage-backed securities. Payments received for POs are treated as reductions to the cost and par value of the securities.
Short Sales
The Fund may sell a security it does not own in anticipation of a decline in the fair value of the security. When the Fund sells a security short, it must borrow the security sold short and deliver it to the broker-dealer through which it made the short sale. The Fund is required to maintain a margin account with the broker and to pledge assets to the broker as collateral for the borrowed security. Securities pledged as collateral are designated in the Consolidated Portfolio of Investments. In addition, the collateral is recorded as cash collateral held at broker in the Consolidated Statement of Assets and Liabilities. The Fund can purchase the same security at the current market price and deliver it to the broker to close out the short sale. The Fund is obligated to pay the broker a fee for borrowing the security. The fee is included in "Dividends and interest on securities sold short" in the Consolidated Statement of Operations and a short position is reported as a liability at fair value in the Consolidated Statement of Assets and Liabilities. The Fund must also pay the broker for any dividends accrued (recognized on ex-date) on the borrowed security. This amount is recorded as an expense in the Consolidated Statement of Operations. The Fund will record a gain if the security declines in value, and will realize a loss if the security appreciates. Such gain, limited to the price at which the Fund sold the security short, or such loss, potentially unlimited in size because the short position loses value as the market price of the security sold short increases, will be recognized upon the termination of a short sale.
Multi-Manager Alternative Strategies Fund | Annual Report 2017
| 53 |
Notes to Consolidated Financial Statements (continued)
August 31, 2017
Offsetting of assets and liabilities
The following table presents the Fund’s gross and net amount of assets and liabilities available for offset under netting arrangements as well as any related collateral received or pledged by the Fund as of August 31, 2017:
| | Barclays ($) | Citi ($)(a) | Citi ($)(a) | Goldman
Sachs ($)(a) | Goldman
Sachs ($)(a) | JPMorgan ($) | Total ($) |
| Assets | | | | | | | |
| Forward foreign currency exchange contracts | - | 9,828,212 | - | - | 480,155 | - | 10,308,367 |
| Options purchased calls | - | - | - | - | 9,708 | - | 9,708 |
| Options purchased puts | - | - | - | - | 68,876 | - | 68,876 |
| OTC total return swap contracts (b) | - | - | - | 4,827 | - | - | 4,827 |
| OTC total return swap contracts on futures (b) | 1,295 | - | 86,261 | - | - | 62,027 | 149,583 |
| Total assets | 1,295 | 9,828,212 | 86,261 | 4,827 | 558,739 | 62,027 | 10,541,361 |
| Liabilities | | | | | | | |
| Forward foreign currency exchange contracts | - | 8,908,570 | - | - | 654,519 | - | 9,563,089 |
| Options contracts written | - | - | - | - | 66,125 | - | 66,125 |
| OTC total return swap contracts (b) | - | - | - | 82,334 | - | - | 82,334 |
| OTC total return swap contracts on futures (b) | 53,444 | - | 70,317 | - | - | 18,076 | 141,837 |
| Securities borrowed | - | - | - | - | 58,266,332 | - | 58,266,332 |
| Total liabilities | 53,444 | 8,908,570 | 70,317 | 82,334 | 58,986,976 | 18,076 | 68,119,717 |
| Total financial and derivative net assets | (52,149) | 919,642 | 15,944 | (77,507) | (58,428,237) | 43,951 | (57,578,356) |
| Total collateral received (pledged) (c) | (52,149) | - | - | - | (58,428,237) | - | (58,480,386) |
| Net amount (d) | - | 919,642 | 15,944 | (77,507) | - | 43,951 | 902,030 |
| (a) | Exposure can only be netted across transactions governed under the same master agreement with the same legal entity. |
| (b) | Over-the-Counter swap contracts are presented at market value plus periodic payments receivable (payable), which is comprised of unrealized appreciation, unrealized depreciation, premiums paid and premiums received. |
| (c) | In some instances, the actual collateral received and/or pledged may be more than the amount shown due to overcollateralization. |
| (d) | Represents the net amount due from/(to) counterparties in the event of default. |
Security transactions
Security transactions are accounted for on the trade date. Cost is determined and gains (losses) are based upon the specific identification method for both financial statement and federal income tax purposes.
Income recognition
Interest income is recorded on an accrual basis. Market premiums and discounts, including original issue discounts, are amortized and accreted, respectively, over the expected life of the security on all debt securities, unless otherwise noted. The Fund classifies gains and losses realized on prepayments received on mortgage-backed securities as adjustments to interest income.
The Fund may place a debt security on non-accrual status and reduce related interest income when it becomes probable that the interest will not be collected and the amount of uncollectible interest can be reasonably estimated. A defaulted debt security is removed from non-accrual status when the issuer resumes interest payments or when collectibility of interest is reasonably assured.
Corporate actions and dividend income are generally recorded net of any non-reclaimable tax withholdings, on the ex-dividend date or upon receipt of ex-dividend notification in the case of certain foreign securities.
The Fund may receive distributions from holdings in equity securities, business development companies (BDCs), exchange-traded funds (ETFs), limited partnerships (LPs), other regulated investment companies (RICs), and real estate investment trusts (REITs), which report information on the tax character of their distributions annually. These distributions are allocated to dividend income, capital gain and return of capital based on actual information reported. Return of capital is recorded as a reduction of the cost basis of securities held. If the Fund no longer owns the applicable securities, return of capital is recorded as a realized gain. With respect to REITs, to the extent actual information has not yet been reported,
| 54 | Multi-Manager Alternative Strategies Fund | Annual Report 2017 |
Notes to Consolidated Financial Statements (continued)
August 31, 2017
estimates for return of capital are made by the Fund’s management. Management’s estimates are subsequently adjusted when the actual character of the distributions is disclosed by the REITs, which could result in a proportionate change in return of capital to shareholders.
Awards from class action litigation are recorded as a reduction of cost basis if the Fund still owns the applicable securities on the payment date. If the Fund no longer owns the applicable securities, the proceeds are recorded as realized gains.
The value of additional securities received as an income payment through a payment in kind, if any, is recorded as interest income and increases the cost basis of such securities.
Expenses
General expenses of the Trust are allocated to the Fund and other funds of the Trust based upon relative net assets or other expense allocation methodologies determined by the nature of the expense. Expenses directly attributable to the Fund are charged to the Fund. Expenses directly attributable to a specific class of shares are charged to that share class.
Determination of class net asset value
All income, expenses (other than class-specific expenses, which are charged to that share class, as shown in the Consolidated Statement of Operations) and realized and unrealized gains (losses) are allocated to each class of the Fund on a daily basis, based on the relative net assets of each class, for purposes of determining the net asset value of each class.
Federal income tax status
The Fund intends to qualify each year as a regulated investment company under Subchapter M of the Internal Revenue Code, as amended, and will distribute substantially all of its taxable income (including net short-term capital gains) and capital gains, if any, for its tax year, and as such will not be subject to federal income taxes. In addition, the Fund intends to distribute in each calendar year substantially all of its net investment income, capital gains and certain other amounts, if any, such that the Fund should not be subject to federal excise tax. Therefore, no federal income or excise tax provision is recorded.
Foreign taxes
The Fund may be subject to foreign taxes on income, gains on investments or currency repatriation, a portion of which may be recoverable. The Fund will accrue such taxes and recoveries, as applicable, based upon its current interpretation of tax rules and regulations that exist in the markets in which it invests.
Realized gains in certain countries may be subject to foreign taxes at the Fund level, based on statutory rates. The Fund accrues for such foreign taxes on realized and unrealized gains at the appropriate rate for each jurisdiction, as applicable. The amount, if any, is disclosed as a liability on the Consolidated Statement of Assets and Liabilities.
Distributions to shareholders
Distributions from net investment income, if any, are declared and paid annually. Net realized capital gains, if any, are distributed along with the income distribution. Income distributions and capital gain distributions are determined in accordance with federal income tax regulations, which may differ from GAAP.
Guarantees and indemnifications
Under the Trust’s organizational documents and, in some cases, by contract, its officers and trustees are indemnified against certain liabilities arising out of the performance of their duties to the Trust or its funds. In addition, certain of the Fund’s contracts with its service providers contain general indemnification clauses. The Fund’s maximum exposure under these arrangements is unknown since the amount of any future claims that may be made against the Fund cannot be determined, and the Fund has no historical basis for predicting the likelihood of any such claims.
Recent accounting pronouncement
Accounting Standards Update 2017-08 Premium Amortization on Purchased Callable Debt Securities
Multi-Manager Alternative Strategies Fund | Annual Report 2017
| 55 |
Notes to Consolidated Financial Statements (continued)
August 31, 2017
In March 2017, the Financial Accounting Standards Board issued Accounting Standards Update (ASU) No. 2017-08 Premium Amortization on Purchased Callable Debt Securities. ASU No. 2017-08 updates the accounting standards to shorten the amortization period for certain purchased callable debt securities, held at a premium, to be amortized to the earliest call date. The update applies to securities with explicit, noncontingent call features that are callable at fixed prices and on preset dates. The standard is effective for annual periods beginning after December 15, 2018 and interim periods within those fiscal years. At this time, management is evaluating the implication of this guidance and the impact it will have on the financial statement amounts and footnote disclosures, if any.
Note 3. Fees and other transactions with affiliates
Management services fees
The Fund has entered into a Management Agreement with Columbia Management Investment Advisers, LLC (the Investment Manager), a wholly-owned subsidiary of Ameriprise Financial, Inc. (Ameriprise Financial). Under the Management Agreement, the Investment Manager provides the Fund with investment research and advice, as well as administrative and accounting services. The Investment Manager is responsible for the ultimate oversight of investments made by the Fund. The Fund’s subadvisers (see Subadvisory agreement below) have the primary responsibility for the day-to-day portfolio management of their portion of the Fund. The management services fee is an annual fee that is equal to a percentage of the Fund’s daily net assets that declines from 1.10% to 0.95% as the Fund’s net assets increase. The effective management services fee rate for the year ended August 31, 2017 was 1.09% of the Fund’s average daily net assets.
Subadvisory agreement
The Investment Manager has entered into Subadvisory Agreements with AQR Capital Management, LLC and Water Island Capital, LLC, each of which subadvises a portion of the assets of the Fund. Effective March 29, 2017, the Investment Manager has entered into a Subadvisory Agreement with TCW Investment Management Company LLC to subadvise a portion the assets of the Fund. Effective September 13, 2017, the Investment Manager has entered into a Subadvisory Agreement with Manulife Asset Management (US) LLC to subadvise a portion of the assets of the Fund. New investments in the Fund, net of any redemptions, are allocated in accordance with the Investment Manager’s determination, subject to the oversight of the Fund’s Board of Trustees. Each subadviser’s proportionate share of investments in the Fund will vary due to market fluctuations. The Investment Manager compensates each subadviser to manage the investment of the Fund’s assets.
Compensation of board members
Members of the Board of Trustees, who are not officers or employees of the Investment Manager or Ameriprise Financial, are compensated for their services to the Fund as disclosed in the Consolidated Statement of Operations. These members of the Board of Trustees may participate in a Deferred Compensation Plan (the Plan) which may be terminated at any time. Obligations of the Plan will be paid solely out of the Fund’s assets, and all amounts payable under the Plan constitute a general unsecured obligation of the Fund.
Compensation of Chief Compliance Officer
The Board of Trustees has appointed a Chief Compliance Officer to the Fund in accordance with federal securities regulations. A portion of the Chief Compliance Officer’s total compensation is allocated to the Fund, along with other affiliated funds governed by the Board of Trustees, based on relative net assets. The total amount allocated to all affiliated funds governed by the Board of Trustees will not exceed $40,000 annually.
Transactions with affiliates
For the year ended August 31, 2017, the Fund engaged in purchase and/or sale transactions with affiliates and/or accounts that have a common investment manager (or affiliated investment managers), common directors/trustees, and/or common officers. Those purchase and sale transactions complied with provisions of Rule 17a-7 under the 1940 Act and were $1,604,129 and $0, respectively.
| 56 | Multi-Manager Alternative Strategies Fund | Annual Report 2017 |
Notes to Consolidated Financial Statements (continued)
August 31, 2017
Transfer agency fees
Under a Transfer and Dividend Disbursing Agent Agreement, Columbia Management Investment Services Corp. (the Transfer Agent), an affiliate of the Investment Manager and a wholly-owned subsidiary of Ameriprise Financial, is responsible for providing transfer agency services to the Fund. The Transfer Agent has contracted with Boston Financial Data Services (BFDS) to serve as sub-transfer agent. The Transfer Agent pays the fees of BFDS for services as sub-transfer agent and BFDS is not entitled to reimbursement for such fees from the Fund (with the exception of out-of-pocket fees).
The Fund pays the Transfer Agent a monthly transfer agency fee based on the number or the average value of accounts, depending on the type of account. In addition, prior to October 1, 2016, the Transfer Agent also received sub-transfer agency fees based on a percentage of the average aggregate value of the Fund’s shares maintained in omnibus accounts (other than omnibus accounts for which American Enterprise Investment Services Inc. is the broker of record or accounts where the beneficial shareholder is a customer of Ameriprise Financial Services, Inc., for which the Transfer Agent receives a per account fee). Effective October 1, 2016, the Fund pays the Transfer Agent a fee for shareholder services based on the number of accounts or on a percentage of the average aggregate value of the Fund’s shares maintained in omnibus accounts up to the lesser of the amount charged by the financial intermediary or a cap established by the Board of Trustees from time to time.
The Transfer Agent also receives compensation from the Fund for various shareholder services and reimbursements for certain out-of-pocket fees.
For the year ended August 31, 2017, the Fund’s effective transfer agency fee rates as a percentage of average daily net assets of each class were as follows:
| | Effective rate (%) |
| Class A | 0.12 |
| Class Z | 0.12 (a) |
Distribution and service fees
The Fund has entered into an agreement with Columbia Management Investment Distributors, Inc. (the Distributor), an affiliate of the Investment Manager and a wholly-owned subsidiary of Ameriprise Financial, for distribution and shareholder services. The Board of Trustees has approved, and the Fund has adopted, distribution and shareholder service plans (the Plans) applicable to certain share classes, which set the distribution and service fees for the Fund. These fees are calculated daily and are intended to compensate the Distributor and/or eligible selling and/or servicing agents for selling shares of the Fund and providing services to investors.
The Fund may pay distribution fee of up to 0.25% of the Fund’s average daily net assets attributable to Class A shares and a service fee of up to 0.25% of the Fund’s average daily net assets attributable to Class A shares, provided that the aggregate fee shall not exceed 0.25% of the Fund’s average daily net assets attributable to Class A shares.
Expenses waived/reimbursed by the Investment Manager and its affiliates
The Investment Manager and certain of its affiliates have contractually agreed to waive fees and/or reimburse expenses (excluding certain fees and expenses described below) for the period(s) disclosed below, unless sooner terminated at the sole discretion of the Board of Trustees, so that the Fund’s net operating expenses, after giving effect to fees waived/expenses reimbursed and any balance credits and/or overdraft charges from the Fund’s custodian, do not exceed the following annual rate(s) as a percentage of the class’ average daily net assets:
| | January 1, 2017
through
December 31, 2017 | Prior to
January 1, 2017 |
| Class A | 1.82% | 2.00% |
| Class Z | 1.57* | — |
*Expense cap rate is contractual from January 3, 2017 (the commencement of operations of Class Z shares) through December 31, 2017.
Multi-Manager Alternative Strategies Fund | Annual Report 2017
| 57 |
Notes to Consolidated Financial Statements (continued)
August 31, 2017
Under the agreement governing these fee waivers and/or expense reimbursement arrangements, the following fees and expenses are excluded from the waiver/reimbursement commitment, and therefore will be paid by the Fund, if applicable: taxes (including foreign transaction taxes), expenses associated with investments in affiliated and non-affiliated pooled investment vehicles (including mutual funds and exchange-traded funds), transaction costs and brokerage commissions, costs related to any securities lending program, dividend expenses associated with securities sold short, inverse floater program fees and expenses, transaction charges and interest on borrowed money, interest, infrequent and/or unusual expenses and any other expenses the exclusion of which is specifically approved by the Board of Trustees. This agreement may be modified or amended only with approval from the Investment Manager, certain of its affiliates and the Fund. Any fees waived and/or expenses reimbursed under the expense reimbursement arrangements described above are not recoverable by the Investment Manager or its affiliates in future periods.
Note 4. Federal tax information
The timing and character of income and capital gain distributions are determined in accordance with income tax regulations, which may differ from GAAP because of temporary or permanent book to tax differences.
At August 31, 2017, these differences are primarily due to differing treatment for deferral/reversal of wash sale losses, passive foreign investment company (PFIC) holdings, re-characterization of distributions for investments, derivative investments, tax straddles, swap investments, late-year ordinary losses, capital loss carryforwards, trustees’ deferred compensation, principal and/or interest from fixed income securities, foreign currency transactions, non-deductible expenses, net operating loss reclassification, investments in commodity subsidiaries and constructive sales of appreciated financial positions. To the extent these differences are permanent, reclassifications are made among the components of the Fund’s net assets in the Consolidated Statement of Assets and Liabilities. Temporary differences do not require reclassifications.
In the Consolidated Statement of Assets and Liabilities the following reclassifications were made:
Excess of distributions
over net investment
income ($) | Accumulated
net realized
(loss) ($) | Paid in
capital ($) |
| (5,896,389) | 6,273,936 | (377,547) |
Net investment income (loss) and net realized gains (losses), as disclosed in the Consolidated Statement of Operations, and net assets were not affected by this reclassification.
| August 31, 2017 | August 31, 2016 |
Ordinary
income ($) | Long-term
capital gains ($) | Total ($) | Ordinary
income ($) | Long-term
capital gains ($) | Total ($) |
| — | — | — | 52,422,234 | — | 52,422,234 |
Short-term capital gain distributions, if any, are considered ordinary income distributions for tax purposes.
At August 31, 2017, the components of distributable earnings on a tax basis were as follows:
Undistributed
ordinary income ($) | Undistributed
long-term
capital gains ($) | Capital loss
carryforwards ($) | Net unrealized
(depreciation) ($) |
| — | — | (45,740,767) | (28,059,538) |
At August 31, 2017, the cost of all investments for federal income tax purposes along with the aggregate gross unrealized appreciation and depreciation based on that cost was:
Federal
tax cost ($) | Gross unrealized
appreciation ($) | Gross unrealized
(depreciation) ($) | Net unrealized
(depreciation) ($) |
| 596,517,574 | 15,711,593 | (43,771,131) | (28,059,538) |
| 58 | Multi-Manager Alternative Strategies Fund | Annual Report 2017 |
Notes to Consolidated Financial Statements (continued)
August 31, 2017
Tax cost of investments and unrealized appreciation/(depreciation) may also include timing differences that do not constitute adjustments to tax basis.
The following capital loss carryforwards, determined at August 31, 2017, may be available to reduce taxable income arising from future net realized gains on investments, if any, to the extent permitted by the Internal Revenue Code. Capital loss carryforwards with no expiration are required to be utilized prior to any capital losses which carry an expiration date. As a result of this ordering rule, capital loss carryforwards which carry an expiration date may be more likely to expire unused. In addition, for the year ended August 31, 2017, capital loss carryforwards utilized, expired unused and permanently lost, if any, were as follows:
| 2018 ($) | 2019 ($) | No expiration
short-term ($) | No expiration
long-term ($) | Total ($) | Utilized ($) | Expired ($) | Permanently
lost ($) |
| — | — | 10,816,699 | 34,924,068 | 45,740,767 | — | — | — |
Under current tax rules, regulated investment companies can elect to treat certain late-year ordinary losses incurred and post-October capital losses (capital losses realized after October 31) as arising on the first day of the following taxable year. As of August 31, 2017, the Fund will elect to treat the following late-year ordinary losses and post-October capital losses as arising on September 1, 2017.
Late year
ordinary losses ($) | Post-October
capital losses ($) |
| 7,644,343 | — |
Management of the Fund has concluded that there are no significant uncertain tax positions in the Fund that would require recognition in the financial statements. However, management’s conclusion may be subject to review and adjustment at a later date based on factors including, but not limited to, new tax laws, regulations, and administrative interpretations (including relevant court decisions). Generally, the Fund’s federal tax returns for the prior three fiscal years remain subject to examination by the Internal Revenue Service.
Note 5. Portfolio information
The cost of purchases and proceeds from sales of securities, excluding short-term investments and derivatives, if any, aggregated to $1,641,409,487 and $1,603,609,924, respectively, for the year ended August 31, 2017, of which $14,276,827 and $1,357,880, respectively, were U.S. government securities. The amount of purchase and sale activity impacts the portfolio turnover rate reported in the Consolidated Financial Highlights.
Note 6. Affiliated money market fund
The Fund invests significantly in Columbia Short-Term Cash Fund, an affiliated money market fund established for the exclusive use by the Fund and other affiliated funds (the Affiliated MMF). The income earned by the Fund from such investments is included as Dividends - affiliated issuers in the Consolidated Statement of Operations. As an investing fund, the Fund indirectly bears its proportionate share of the expenses of the Affiliated MMF. Effective October 1, 2016, the Affiliated MMF prices its shares with a floating net asset value (NAV) and no longer seeks to maintain a stable NAV. In addition, the Board of Trustees of the Affiliated MMF may impose a fee on redemptions (sometimes referred to as a liquidity fee) or temporarily suspend redemptions (sometimes referred to as imposing a redemption gate) in the event its liquidity falls below regulatory limits.
Note 7. Line of credit
The Fund has access to a revolving credit facility with a syndicate of banks led by Citibank, N.A., HSBC Bank USA, N.A. and JPMorgan Chase Bank, N.A. whereby the Fund may borrow for the temporary funding of shareholder redemptions or for other temporary or emergency purposes. The credit facility, which is a collective agreement between the Fund and certain other funds managed by the Investment Manager, severally and not jointly, permits collective borrowings up to $1 billion. Interest is charged to each participating fund based on its borrowings at a rate equal to the higher of (i) the overnight federal funds rate plus 1.00% or (ii) the one-month LIBOR rate plus 1.00%. Each borrowing under the credit facility matures no later than
Multi-Manager Alternative Strategies Fund | Annual Report 2017
| 59 |
Notes to Consolidated Financial Statements (continued)
August 31, 2017
60 days after the date of borrowing. The Fund also pays a commitment fee equal to its pro rata share of the amount of the credit facility at a rate of 0.15% per annum. The commitment fee is included in other expenses in the Consolidated Statement of Operations.
The Fund had no borrowings during the year ended August 31, 2017.
Note 8. Significant risks
Shareholder concentration risk
At August 31, 2017, affiliated shareholders of record owned 100.0% of the outstanding shares of the Fund in one or more accounts. Subscription and redemption activity by concentrated accounts may have a significant effect on the operations of the Fund. In the case of a large redemption, the Fund may be forced to sell investments at inopportune times, including its liquid positions, which may result in Fund losses and the Fund holding a higher percentage of less liquid positions. Large redemptions could result in decreased economies of scale and increased operating expenses for non-redeeming Fund shareholders.
Credit risk
Credit risk is the risk that the value of debt securities in the Fund’s portfolio may decline because the issuer may default and fail to pay interest or repay principal when due. Rating agencies assign credit ratings to debt securities to indicate their credit risk. Lower rated or unrated debt securities held by the Fund may present increased credit risk as compared to higher-rated debt securities.
Derivatives risk
Losses involving derivative instruments may be substantial, because a relatively small price movement in the underlying security(ies), commodity, currency or index or other instrument or asset may result in a substantial loss for the Fund. In addition to the potential for increased losses, the use of derivative instruments may lead to increased volatility within the Fund. Derivatives will typically increase the Fund’s exposure to principal risks to which it is otherwise exposed, and may expose the Fund to additional risks, including correlation risk, counterparty risk, hedging risk, leverage risk and liquidity risk.
Interest rate risk
Interest rate risk is the risk of losses attributable to changes in interest rates. In general, if prevailing interest rates rise, the values of debt securities tend to fall, and if interest rates fall, the values of debt securities tend to rise. Actions by governments and central banking authorities can result in increases in interest rates. Increasing interest rates may negatively affect the value of debt securities held by the Fund, resulting in a negative impact on the Fund’s performance and net asset value per share. In general, the longer the maturity or duration of a debt security, the greater its sensitivity to changes in interest rates.
Liquidity risk
Liquidity risk is the risk associated with a lack of marketability of investments which may make it difficult to sell the investment at a desirable time or price. Changing regulatory, market or other conditions or environments (for example, the interest rate or credit environments) may adversely affect the liquidity of the Fund’s investments. The Fund may have to accept a lower selling price for the holding, sell other investments, or forego another, more appealing investment opportunity. Generally, the less liquid the market at the time the Fund sells a portfolio investment, the greater the risk of loss or decline of value to the Fund. A less liquid market can lead to an increase in Fund redemptions, which may negatively impact Fund performance and net asset value per share, including, for example, if the Fund is forced to sell securities in a down market.
Non-diversification risk
A non-diversified fund is permitted to invest a greater percentage of its total assets in fewer issuers than a diversified fund. The Fund may, therefore, have a greater risk of loss from a few issuers than a similar fund that invests more broadly.
| 60 | Multi-Manager Alternative Strategies Fund | Annual Report 2017 |
Notes to Consolidated Financial Statements (continued)
August 31, 2017
Short Selling Risk
Leverage occurs when the Fund increases its assets available for investment using borrowings, short sales, derivatives, or similar instruments or techniques. Because short sales involve borrowing securities and then selling them, the Fund’s short sales effectively leverage the Fund’s assets. The Fund’s assets that are used as collateral to secure the Fund’s obligations to return the securities sold short may decrease in value while the short positions are outstanding, which may force the Fund to use its other assets to increase the collateral. Leverage can create an interest expense that may lower the Fund’s overall returns. Leverage presents the opportunity for increased net income and capital gains, but may also exaggerate the Fund’s volatility and risk of loss. There can be no guarantee that a leveraging strategy will be successful.
Note 9. Subsequent events
Management has evaluated the events and transactions that have occurred through the date the financial statements were issued. Other than as noted in Note 1 and Note 3 above, there were no items requiring adjustment of the financial statements or additional disclosure.
Note 10. Information regarding pending and settled legal proceedings
Ameriprise Financial and certain of its affiliates have historically been involved in a number of legal, arbitration and regulatory proceedings, including routine litigation, class actions, and governmental actions, concerning matters arising in connection with the conduct of their business activities. Ameriprise Financial believes that the Funds are not currently the subject of, and that neither Ameriprise Financial nor any of its affiliates are the subject of, any pending legal, arbitration or regulatory proceedings that are likely to have a material adverse effect on the Fund or the ability of Ameriprise Financial or its affiliates to perform under their contracts with the Fund. Ameriprise Financial is required to make quarterly (10-Q), annual (10-K) and, as necessary, 8-K filings with the Securities and Exchange Commission (SEC) on legal and regulatory matters that relate to Ameriprise Financial and its affiliates. Copies of these filings may be obtained by accessing the SEC website at www.sec.gov.
There can be no assurance that these matters, or the adverse publicity associated with them, will not result in increased Fund redemptions, reduced sale of Fund shares or other adverse consequences to the Fund. Further, although we believe proceedings are not likely to have a material adverse effect on the Fund or the ability of Ameriprise Financial or its affiliates to perform under their contracts with the Fund, these proceedings are subject to uncertainties and, as such, we are unable to estimate the possible loss or range of loss that may result. An adverse outcome in one or more of these proceedings could result in adverse judgments, settlements, fines, penalties or other relief that could have a material adverse effect on the consolidated financial condition or results of operations of Ameriprise Financial.
Multi-Manager Alternative Strategies Fund | Annual Report 2017
| 61 |
Report of Independent Registered Public Accounting Firm
To the Trustees of Columbia Funds Series Trust I and the Shareholders of Multi-Manager Alternative Strategies Fund
In our opinion, the accompanying consolidated statement of assets and liabilities, including the consolidated portfolio of investments, and the related consolidated statements of operations and of changes in net assets and the consolidated financial highlights present fairly, in all material respects, the financial position of Multi-Manager Alternative Strategies Fund and its subsidiaries (the “Fund”, a series of Columbia Funds Series Trust I) as of August 31, 2017, the results of their operations for the year then ended, the changes in their net assets for each of the two years in the period then ended and the financial highlights for each of the five years in the period then ended, in conformity with accounting principles generally accepted in the United States of America. These financial statements and financial highlights (hereafter referred to as “financial statements”) are the responsibility of the Fund’s management. Our responsibility is to express an opinion on these financial statements based on our audits. We conducted our audits of these financial statements in accordance with the standards of the Public Company Accounting Oversight Board (United States). Those standards require that we plan and perform the audit to obtain reasonable assurance about whether the financial statements are free of material misstatement. An audit includes examining, on a test basis, evidence supporting the amounts and disclosures in the financial statements, assessing the accounting principles used and significant estimates made by management, and evaluating the overall financial statement presentation. We believe that our audits, which included confirmation of securities as of August 31, 2017 by correspondence with the custodian, brokers and transfer agent provide a reasonable basis for our opinion.
/s/PricewaterhouseCoopers LLP
Minneapolis, MN
October 24, 2017
| 62 | Multi-Manager Alternative Strategies Fund | Annual Report 2017 |
Shareholders elect the Board that oversees the Fund’s operations. The Board appoints officers who are responsible for day-to-day business decisions based on policies set by the Board. The following table provides basic biographical information about the Fund’s Trustees, including their principal occupations during the past five years, although specific titles for individuals may have varied over the period. The year set forth beneath Length of Service in the table below is the year in which the Trustee was first appointed or elected as Trustee to any Fund currently in the Columbia Funds Complex or a predecessor thereof. Under current Board policy, members serve terms of indefinite duration.
Independent trustees
| Name, address, year of birth | Position held with the Trust and length of service | Principal occupation(s) during the past five years and other relevant professional experience | Number of Funds in the Columbia Fund Complex overseen | Other directorships held by Trustee during the past five years |
Janet Langford Carrig
c/o Columbia Management
Investment Advisers, LLC
225 Franklin Street
Mail Drop BX32 05228
Boston, MA 02110
1957 | Trustee
1996 | Senior Vice President, General Counsel and Corporate Secretary, ConocoPhillips (independent energy company) since September 2007 | 57 | None |
Douglas A. Hacker
c/o Columbia Management
Investment Advisers, LLC
225 Franklin Street
Mail Drop BX32 05228
Boston, MA 02110
1955 | Trustee and Chairman of the Board
1996 | Independent business executive since May 2006; Executive Vice President — Strategy of United Airlines from December 2002 to May 2006; President of UAL Loyalty Services (airline marketing company) from September 2001 to December 2002; Executive Vice President and Chief Financial Officer of United Airlines from July 1999 to September 2001 | 57 | Spartan Nash Company, (food distributor); Nash Finch Company (food distributor) from 2005 to 2013; Aircastle Limited (aircraft leasing); SeaCube Container Leasing Ltd. (container leasing) from 2010 to 2013; and Travelport Worldwide Limited (travel information technology) |
Nancy T. Lukitsh
c/o Columbia Management
Investment Advisers, LLC
225 Franklin Street
Mail Drop BX32 05228
Boston, MA 02110
1956 | Trustee
2011 | Senior Vice President, Partner and Director of Marketing, Wellington Management Company, LLP (investment adviser) from 1997 to 2010; Chair, Wellington Management Portfolios (commingled non-U.S. investment pools) from 2007 to 2010; Director, Wellington Trust Company, NA and other Wellington affiliates from 1997 to 2010 | 57 | None |
David M. Moffett
c/o Columbia Management
Investment Advisers, LLC
225 Franklin Street
Mail Drop BX32 05228
Boston, MA 02110
1952 | Trustee
2011 | Retired. Consultant to Bridgewater and Associates | 57 | Director, CSX Corporation; Genworth Financial, Inc. (financial and insurance products and services); PayPal Holdings Inc. (payment and data processing services); Trustee, University of Oklahoma Foundation; former Director, eBay Inc. (online trading community), 2007-2015; and former Director, CIT Bank, CIT Group Inc. (commercial and consumer finance), 2010-2016 |
Multi-Manager Alternative Strategies Fund | Annual Report 2017
| 63 |
TRUSTEES AND OFFICERS (continued)
Independent trustees (continued)
| Name, address, year of birth | Position held with the Trust and length of service | Principal occupation(s) during the past five years and other relevant professional experience | Number of Funds in the Columbia Fund Complex overseen | Other directorships held by Trustee during the past five years |
Charles R. Nelson
c/o Columbia Management
Investment Advisers, LLC
225 Franklin Street
Mail Drop BX32 05228
Boston, MA 02110
1942 | Trustee
1981 | Retired. Professor Emeritus, University of Washington since 2011; Professor of Economics, University of Washington from 1976 to 2011; Ford and Louisa Van Voorhis Professor of Political Economy, University of Washington from 1993 to 2011; Adjunct Professor of Statistics, University of Washington from 1980 to 2011; Associate Editor, Journal of Money, Credit and Banking from September 1993 to 2008; consultant on econometric and statistical matters | 57 | None |
John J. Neuhauser
c/o Columbia Management
Investment Advisers, LLC
225 Franklin Street
Mail Drop BX32 05228
Boston, MA 02110
1943 | Trustee
1984 | President, Saint Michael’s College since August 2007; Director or Trustee of several non-profit organizations, including University of Vermont Medical Center; Academic Vice President and Dean of Faculties, Boston College from August 1999 to October 2005; University Professor, Boston College from November 2005 to August 2007 | 57 | Liberty All-Star Equity Fund and Liberty All- Star Growth Fund (closed-end funds) |
Patrick J. Simpson
c/o Columbia Management
Investment Advisers, LLC
225 Franklin Street
Mail Drop BX32 05228
Boston, MA 02110
1944 | Trustee
2000 | Of Counsel, Perkins Coie LLP (law firm) since 2015; Partner, Perkins Coie LLP from 1988 to 2014 | 57 | None |
Anne-Lee Verville
c/o Columbia Management
Investment Advisers, LLC
225 Franklin Street
Mail Drop BX32 05228
Boston, MA 02110
1945 | Trustee
1998 | Retired. General Manager, Global Education Industry from 1994 to 1997, President – Application Systems Division from 1991 to 1994, Chief Financial Officer – US Marketing & Services from 1988 to 1991, and Chief Information Officer from 1987 to 1988, IBM Corporation (computer and technology) | 57 | Enesco Group, Inc. (producer of giftware and home and garden decor products) from 2001 to 2006 |
| 64 | Multi-Manager Alternative Strategies Fund | Annual Report 2017 |
TRUSTEES AND OFFICERS (continued)
Consultants to the Independent Trustees*
| Name, address, year of birth | Position held with the Trust and length of service | Principal occupation(s) during the past five years and other relevant professional experience | Number of Funds in the Columbia Funds complex overseen | Other directorships held by Trustee during the past five years |
J. Kevin Connaughton
c/o Columbia
Management Investment
Advisers, LLC,
225 Franklin Street
Mail Drop BX32 05228,
Boston, MA 02110
1964 | Independent Trustee Consultant
2016 | Independent Trustee Consultant, Columbia Funds since March 2016; Managing Director and General Manager of Mutual Fund Products, Columbia Management Investment Advisers, LLC from May 2010 to February 2015; President, Columbia Funds from 2009 to 2015; and senior officer of Columbia Funds and affiliated funds from 2003 to 2015 | 57 | Board of Governors, Gateway Healthcare since January 2016; Trustee, New Century Portfolios since March 2015; and Director, The Autism Project since March 2015 |
Natalie A. Trunow
c/o Columbia
Management Investment
Advisers, LLC,
225 Franklin Street
Mail Drop BX32 05228,
Boston, MA 02110
1967 | Independent Trustee Consultant
2016 | Independent Trustee Consultant, Columbia Funds since September 2016; Chief Executive Officer, Millennial Partners (investment consulting services to institutions) since January 2016; Director of Investments, Casey Family Programs from April 2016 to September 2016; Senior Vice President and Chief Investment Officer, Calvert Investments from August 2008 to January 2016; Section Head and Portfolio Manager, General Motors Asset Management from June 1997 to August 2008 | 57 | Healthcare Services for Children with Special Needs |
| * | J. Kevin Connaughton was appointed consultant to the Independent Trustees effective March 1, 2016. Natalie A. Trunow was appointed consultant to the Independent Trustees effective September 1, 2016. Shareholders of the Funds are expected to be asked to elect each of Mr. Connaughton and Ms. Trunow as a Trustee at a future shareholder meeting. |
Interested trustee affiliated with Investment Manager*
| Name, address, year of birth | Position held with the Trust and length of service | Principal occupation(s) during the past five years and other relevant professional experience | Number of Funds in the Columbia Funds Complex overseen | Other directorships held by Trustee during the past five years |
William F. Truscott
c/o Columbia Management
Investment Advisers, LLC
225 Franklin Street
Boston, MA 02110
1960 | Trustee
2012 | Chairman of the Board and President, Columbia Management Investment Advisers, LLC since May 2010 and February 2012, respectively; Chief Executive Officer, Global Asset Management, Ameriprise Financial, Inc. since September 2012 (previously Chief Executive Officer, U.S. Asset Management & President, Annuities, May 2010-September 2012); Director and Chief Executive Officer, Columbia Management Investment Distributors, Inc. since May 2010 and February 2012, respectively; Chairman of the Board and Chief Executive Officer, RiverSource Distributors, Inc. since 2006; Director, Threadneedle Asset Management Holdings, SARL since 2014; President and Chief Executive Officer, Ameriprise Certificate Company, 2006-August 2012 | 179 | Chairman of the Board, Columbia Management Investment Advisers, LLC since May 2010; Director, Columbia Management Investment Distributors, Inc. since May 2010; former Director, Ameriprise Certificate Company, 2006 - January 2013 |
| * | Interested person (as defined under the 1940 Act) by reason of being an officer, director, security holder and/or employee of the Investment Manager or Ameriprise Financial. |
The Statement of Additional Information has additional information about the Fund’s Board members and is available,
without charge, upon request by calling 800.345.6611, contacting your financial intermediary or visiting
investor.columbiathreadneedleus.com.
Multi-Manager Alternative Strategies Fund | Annual Report 2017
| 65 |
TRUSTEES AND OFFICERS (continued)
The Board has appointed officers who are responsible for day-to-day business decisions based on policies it has established. The officers serve at the pleasure of the Board. The following table provides basic information about the Officers of the Fund, including principal occupations during the past five years, although their specific titles may have varied over the period. In addition to Mr. Truscott, who is Senior Vice President, the Fund’s other officers are:
Fund officers
Name,
address and
year of birth | Position and year
first appointed to
position for any Fund
in the Columbia
Funds complex or a
predecessor thereof | Principal occupation(s) during past five years |
Christopher O. Petersen
5228 Ameriprise
Financial Center
Minneapolis, MN 55474
Born 1970 | President and Principal Executive Officer (2015) | Vice President and Lead Chief Counsel, Ameriprise Financial, Inc. since January 2015 (previously, Vice President and Chief Counsel, January 2010 - December 2014; officer of Columbia Funds and affiliated funds since 2007. |
Michael G. Clarke
225 Franklin Street
Boston, MA 02110
Born 1969 | Treasurer (2011), Chief Financial Officer (2009) and Chief Accounting Officer (2015) | Vice President — Mutual Fund Administration, Columbia Management Investment Advisers, LLC, since May 2010; senior officer of Columbia Funds and affiliated funds since 2002. |
Paul B. Goucher
100 Park Avenue
New York, NY 10017
Born 1968 | Senior Vice President (2011) and Assistant Secretary (2008) | Senior Vice President and Assistant General Counsel, Ameriprise Financial, Inc. since January 2017 (previously Vice President and Lead Chief Counsel, November 2008 - January 2017 and January 2013 - January 2017, respectively; and Chief Counsel, January 2010 - January 2013); Vice President, Chief Legal Officer and Assistant Secretary, Columbia Management Investment Advisers, LLC since May 2010. |
Thomas P. McGuire
225 Franklin Street
Boston, MA 02110
Born 1972 | Senior Vice President and Chief Compliance Officer (2012) | Vice President — Asset Management Compliance, Ameriprise Financial, Inc., since May 2010; Chief Compliance Officer, Ameriprise Certificate Company since September 2010. |
Colin Moore
225 Franklin Street
Boston, MA 02110
Born 1958 | Senior Vice President (2010) | Executive Vice President and Global Chief Investment Officer, Ameriprise Financial, Inc., since July 2013; Executive Vice President and Global Chief Investment Officer, Columbia Management Investment Advisers, LLC since July 2013 (previously Director and Global Chief Investment Officer, 2010 - 2013). |
Ryan C. Larrenaga
225 Franklin Street
Boston, MA 02110
Born 1970 | Senior Vice President (2017), Chief Legal Officer (2017) and Secretary (2015) | Vice President and Group Counsel, Ameriprise Financial, Inc. since August 2011; officer of Columbia Funds and affiliated funds since 2005. |
Michael E. DeFao
225 Franklin Street
Boston, MA 02110
Born 1968 | Vice President (2011) and Assistant Secretary (2010) | Vice President and Chief Counsel, Ameriprise Financial, Inc. since May 2010. |
Amy Johnson
5228 Ameriprise
Financial Center
Minneapolis, MN 55474
Born 1965 | Vice President (2006) | Managing Director and Global Head of Operations, Columbia Management Investment Advisers, LLC since April 2016 (previously Managing Director and Chief Operating Officer, 2010 - 2016). |
Lyn Kephart-Strong
5228 Ameriprise
Financial Center
Minneapolis, MN 55474
Born 1960 | Vice President (2015) | President, Columbia Management Investment Services Corp. since October 2014; Vice President & Resolution Officer, Ameriprise Trust Company since August 2009. |
| 66 | Multi-Manager Alternative Strategies Fund | Annual Report 2017 |
Board Consideration and Approval of Advisory Agreements and Subadvisory Agreements
On June 14, 2017, the Board of Trustees (the Board) and the Trustees who are not interested persons (as defined in the Investment Company Act of 1940) (the Independent Trustees) of Columbia Funds Series Trust I (the Trust) unanimously approved the continuation of the Management Agreement (the Management Agreement) with Columbia Management Investment Advisers, LLC (the Investment Manager) and the Subadvisory Agreements (the Subadvisory Agreements) between the Investment Manager and AQR Capital Management, LLC (AQR), TCW Investment Management Company LLC (TCW) and Water Island Capital, LLC (Water Island) (the Subadvisers) with respect to Multi-Manager Alternative Strategies Fund (the Fund), a series of the Trust. On August 16, 2017, the Board and the Independent Trustees of the Trust also unanimously approved, for an initial two-year term, the Subadvisory Agreement, effective September 13, 2017, between the Investment Manager and Manulife Asset Management (US) LLC (Manulife) (the Manulife Subadvisory Agreement) with respect to the Fund. As detailed below, the Board’s Advisory Fees and Expenses Committee (the Committee) and the Board met on multiple occasions to review and discuss, both among themselves and with the management team of the Investment Manager, materials provided by the Investment Manager and others before determining to approve the continuation of the Management Agreement and the Subadvisory Agreements (together with the Manulife Subadvisory Agreement, the Agreements).
In connection with their deliberations regarding the continuation of the Management Agreement and the Subadvisory Agreements, the Committee and the Board evaluated materials requested from the Investment Manager regarding the Fund and the Agreements, and discussed these materials with representatives of the Investment Manager at Committee meetings held on March 27, 2017, April 26, 2017 and June 13, 2017 and at Board meetings held on March 28, 2017 and June 14, 2017. In connection with its deliberations regarding the Subadvisory Agreement between the Investment Manager and TCW, each of the Board and the Committee noted its considerations at meetings held on January 24, 2017 and January 25, 2017, respectively, in connection with the initial approval of the Subadvisory Agreement between the Investment Manager and TCW with respect to the Fund. Additionally, in connection with its deliberations regarding the Manulife Subadvisory Agreement, the Board and the Committee noted their considerations at meetings held in connection with the continuation of the Management Agreement and the Subadvisory Agreements and requested and evaluated materials from the Investment Manager and others regarding the Fund and the Manulife Subadvisory Agreement, and discussed these materials with representatives of the Investment Manager at Committee and Board meetings held on August 15 and August 16, 2017, respectively. In addition, the Board considers matters bearing on the Agreements at most of its other meetings throughout the year and meets regularly with senior management of the Trust and the Investment Manager. Through the Board’s Investment Oversight Committees, Trustees also meet with selected portfolio managers of the funds the Trustees oversee and other investment personnel at various times throughout the year. The Committee and the Board also consulted with its independent fee consultant, Fund counsel and the Independent Trustees’ independent legal counsel, who advised on various matters with respect to the Committee’s and the Board’s considerations and otherwise assisted the Committee and the Board in their deliberations. On June 13, 2017, the Committee recommended that the Board approve the continuation of the Management Agreement and the Subadvisory Agreements. On June 14, 2017, the Board, including the Independent Trustees, voting separately, unanimously approved the continuation of the Management Agreement and the Subadvisory Agreements for the Fund. On August 15, 2017, the Committee recommended that the Board approve the Manulife Subadvisory Agreement for an initial two-year term. On August 15, 2017, the Board, including the Independent Trustees, voting separately, unanimously approved the Manulife Subadvisory Agreement for an initial two-year term.
The Committee and the Board considered all information that they, their legal counsel or the Investment Manager believed reasonably necessary to evaluate and to determine whether to recommend for approval or approve the Manulife Subadvisory Agreement and the continuation of the Management Agreement and the Subadvisory Agreements. The information and factors considered by the Committee and the Board in recommending for approval or approving the Manulife Subadvisory Agreement and the continuation of the Management Agreement and the Subadvisory Agreements for the Fund included the following:
| • | Information on the investment performance of the Fund relative to the performance of a group of mutual funds determined to be comparable to the Fund by an independent third-party data provider, as well as performance relative to benchmarks; |
| • | Information on the Fund’s management fees and total expenses, including information comparing the Fund’s expenses to those of a group of comparable mutual funds, as determined by the independent third-party data provider; |
Multi-Manager Alternative Strategies Fund | Annual Report 2017
| 67 |
Board Consideration and Approval of Advisory Agreements and Subadvisory Agreements (continued)
| • | The Investment Manager’s agreement to contractually limit or cap total operating expenses for the Fund through December 31, 2018 so that total operating expenses (excluding certain fees and expenses, such as transaction costs and certain other investment related expenses, interest, taxes, acquired fund fees and expenses, and infrequent and/or unusual expenses) would not exceed a specified annual rate, as a percentage of the Fund’s net assets; |
| • | The terms and conditions of the Agreements; |
| • | The subadvisory fees payable or to be payable by the Investment Manager under the Subadvisory Agreements; |
| • | The current and proposed terms and conditions of other agreements and arrangements with affiliates of the Investment Manager relating to the operations of the Fund, including agreements with respect to the provision of distribution, transfer agency and shareholder services to the Fund; |
| • | Descriptions of various functions performed by the Investment Manager and the Subadvisers under the Agreements, including portfolio management and portfolio trading practices; |
| • | Information regarding the management fees of similarly-managed portfolios of other clients of the Investment Manager, including institutional separate accounts; |
| • | Information regarding the reputation, regulatory history and resources of the Investment Manager and the Subadvisers, including information regarding senior management, portfolio managers and other personnel; |
| • | Information regarding the capabilities of the Investment Manager and the Subadvisers with respect to compliance monitoring services, including an assessment of the Investment Manager’s and the Subadvisers’ compliance systems by the Fund’s Chief Compliance Officer; and |
| • | The profitability to the Investment Manager and its affiliates from their relationships with the Fund. |
Nature, extent and quality of services provided under the agreements
The Committee and the Board considered the nature, extent and quality of services provided or to be provided to the Fund by the Investment Manager, the Subadvisers and the Investment Manager’s affiliates under the Agreements and under separate agreements for the provision of transfer agency and shareholder services, and the resources dedicated or to be dedicated to the Fund and the other Columbia Funds by the Investment Manager, the Subadvisers and the Investment Manager’s affiliates. The Committee and the Board considered, among other things, the Investment Manager’s ability to attract, motivate and retain highly qualified research, advisory and supervisory investment professionals (including compensation programs for personnel involved in fund management, reputation and other attributes), the portfolio management services provided by those investment professionals, and the quality of the Investment Manager’s and each Subadviser’s investment research capabilities and trade execution services. The Committee and the Board also considered the potential benefits to shareholders of investing in a mutual fund that is part of a fund complex offering exposure to a variety of asset classes and investment disciplines and providing a variety of fund and shareholder services.
The Committee and the Board also considered the professional experience and qualifications of the senior personnel of the Investment Manager and the Subadvisers, which included consideration of the Investment Manager’s and the Subadvisers’ experience with similarly-structured funds. The Committee and the Board noted the compliance programs of and the compliance-related resources provided to the Fund by the Investment Manager and its affiliates, and considered the Investment Manager’s ability to provide administrative services to the Fund and coordinate the activities of the Fund’s other service providers. The Board also noted that the Board had approved the Subadvisers’ codes of ethics and compliance programs, and that the Chief Compliance Officer of the Funds reports to the Trustees on the Subadvisers’ compliance programs.
The Committee and the Board considered the diligence and selection process undertaken by the Investment Manager to select the Subadvisers, including the Investment Manager’s rationale for recommending approval of the Manulife Subadvisory Agreement and the continuation of the Subadvisory Agreements, and the process for monitoring the Subadvisers’ ongoing performance of services for the Fund. As part of these deliberations, the Committee and the Board considered the ability of the Investment Manager, subject to the approval of the Board, to modify or enter into new subadvisory agreements without a
| 68 | Multi-Manager Alternative Strategies Fund | Annual Report 2017 |
Board Consideration and Approval of Advisory Agreements and Subadvisory Agreements (continued)
shareholder vote pursuant to an exemptive order of the Securities and Exchange Commission. The Committee and the Board also considered the scope of services provided to the Fund by the Investment Manager that are distinct from and in addition to those provided or to be provided by the Subadvisers, including cash flow management, treasury services, risk oversight, investment oversight and Subadviser selection, oversight and transition management. After reviewing these and related factors, the Committee and the Board concluded, within the context of their overall conclusions, that the nature, extent and quality of the services provided or to be provided to the Fund under the Agreements supported approval of the Manulife Subadvisory Agreement and the continuation of the Management Agreement and the Subadvisory Agreements.
Investment performance
The Committee and the Board reviewed information about the performance of the Fund over various time periods, including performance information relative to benchmarks and information that compared the performance of the Fund to the performance of a group of comparable mutual funds as determined by the independent third-party data provider, and data provided by the independent fee consultant. The Committee and the Board also reviewed a description of the third party’s methodology for identifying the Fund’s peer groups for purposes of performance and expense comparisons. Although the Fund’s performance lagged that of a relevant peer group for certain (although not necessarily all) periods, the Committee and the Board concluded that other factors relevant to performance were sufficient, in light of other considerations, to warrant continuation of the Management Agreement and the Subadvisory Agreements. Those factors included one or more of the following: (i) that the Fund’s performance, although lagging in certain recent periods, was stronger over the longer term; (ii) that the underperformance was attributable, to a significant extent, to investment decisions that were reasonable and consistent with the Fund’s investment strategy and policies and that the Fund was performing within a reasonable range of expectations, given those investment decisions, market conditions and the Fund’s investment strategy; (iii) that the Fund’s performance was competitive when compared to other relevant performance benchmarks or peer groups; and (iv) that the Investment Manager had taken or was taking steps designed to help improve the Fund’s investment performance, including, but not limited to, replacing portfolio managers, enhancing the resources supporting the portfolio managers, or modifying investment strategies.
The Committee and the Board noted that, through December 31, 2016, the Fund’s performance was in the seventy-eighth and eighty-ninth percentile (where the best performance would be in the first percentile) of its category selected by the independent third-party data provider for the purposes of performance comparisons for the one- and three-year periods, respectively.
The Committee and the Board also considered the Investment Manager’s and Subadvisers’ performance and reputation generally, the Investment Manager’s historical responsiveness to Board concerns about performance, and the Investment Manager’s willingness to take steps intended to improve performance. The Board also considered Manulife’s investment performance, including its absolute and risk-adjusted returns, noting that Manulife had delivered strong performance over the one-, three- and five-year periods for the Manulife Strategic Fixed Income Opportunities Composite, for the periods ended June 30, 2017. After reviewing these and related factors, the Committee and the Board concluded, within the context of their overall conclusions, that the performance of the Fund, the Investment Manager and the Subadvisers were sufficient, in light of other considerations, to warrant the approval of the Manulife Subadvisory Agreement and the continuation of the Management Agreement and the Subadvisory Agreements.
Investment management fee rates and other expenses
The Committee and the Board considered the management fees charged to the Fund under the Management Agreement and the Subadvisory Agreements, as well as the total expenses incurred or to be incurred by the Fund. In assessing the reasonableness of the fees under the Management Agreement, the Committee and the Board considered, among other information, the Fund’s total expense ratio as a percentage of average daily net assets. The Committee and the Board considered data provided by the independent third-party data provider and by the independent fee consultant. The Committee and the Board noted that, as of December 31, 2016, the Fund’s actual management fee and net total expense ratio are ranked in the third and second quintiles, respectively, (where the lowest fees and expenses would be in the first quintile) against the Fund’s expense universe as determined by the independent third-party data provider for purposes of expense
Multi-Manager Alternative Strategies Fund | Annual Report 2017
| 69 |
Board Consideration and Approval of Advisory Agreements and Subadvisory Agreements (continued)
comparison. The Committee and the Board also considered the fees that the Subadvisers charge to their other clients, and noted that the Investment Manager pays the fees of the Subadvisers. The Committee and the Board also took into account the fee waiver and expense limitation arrangements agreed to by the Investment Manager, as noted above.
The Committee and the Board also received and considered information about the management fees charged by the Investment Manager to institutional separate accounts. In considering the fees charged to those accounts, the Committee and the Board took into account, among other things, the Investment Manager’s representations about the differences between managing mutual funds as compared to other types of accounts, including differences in the services provided, differences in the risk profile of such business for the Investment Manager and the additional resources required to manage mutual funds effectively. The Committee and the Board also received and considered information about the fees charged by the Investment Manager for sub-advisory services it provides to comparable unaffiliated funds. In evaluating the Fund’s management fees, the Committee and the Board also took into account the demands, complexity and quality of the investment management of the Fund.
After reviewing these and related factors, the Committee and the Board concluded, within the context of their overall conclusions, that the management fee rates and expenses of the Fund, in light of other considerations, warranted the approval of the Manulife Subadvisory Agreement and continuation of the Management Agreement and the Subadvisory Agreements.
Costs of services provided and profitability
The Committee and the Board also took note of the costs the Investment Manager and its affiliates incur in connection with the services provided and the profitability to the Investment Manager and its affiliates from their relationships with the Fund.
The Committee and the Board also considered the compensation directly or indirectly received by the Investment Manager’s affiliates in connection with their relationships with the Fund. The Committee and the Board reviewed information provided by management as to the profitability to the Investment Manager and its affiliates of their relationships with the Fund, information about the allocation of expenses used to calculate profitability, and comparisons of profitability levels realized in 2016 to profitability levels realized in 2015. When reviewing profitability, the Committee and the Board also considered court cases in which adviser profitability was an issue in whole or in part, the performance of similarly managed funds, the performance of the Fund, and the expense ratio of the Fund. In addition, the Committee and the Board considered information provided by the Investment Manager regarding the Investment Manager’s financial condition and comparing its profitability to that of other asset management firms that are, or are subsidiaries of, publicly traded companies. In this regard, the Committee and the Board also considered data provided by the independent fee consultant. Because the Subadvisory Agreements and the Manulife Subadvisory Agreement were negotiated at arms-length by the Investment Manager, which is responsible for payments to the Subadvisers thereunder, the Committee and the Board did not consider the profitability to each Subadviser of its relationship with the Fund.
After reviewing these and related factors, the Committee and the Board concluded, within the context of their overall conclusions, that the costs of services provided and the profitability to the Investment Manager and its affiliates from their relationships with the Fund supported the approval of the Manulife Subadvisory Agreement and the continuation of the Management Agreement and the Subadvisory Agreements.
Economies of scale
The Committee and the Board considered the potential existence of economies of scale in the provision by the Investment Manager of services to the Fund, to groups of related funds, and to the Investment Manager’s investment advisory clients as a whole, and whether those economies of scale were shared with the Fund through breakpoints in investment management fees or other means, such as expense limitation arrangements and additional investments by the Investment Manager in investment, trading, compliance and other resources. The Committee and the Board noted that the management fee schedules for the Fund contained breakpoints that would reduce the fee rate on assets above specified threshold levels.
The Committee and the Board noted that the breakpoints, if any, in the Subadvisory Agreements did not occur at the same levels as the breakpoints in the Management Agreement. The Committee and the Board noted that absent a shareholder vote, the Investment Manager would bear any increase in fees payable under the Subadvisory Agreements. The Committee
| 70 | Multi-Manager Alternative Strategies Fund | Annual Report 2017 |
Board Consideration and Approval of Advisory Agreements and Subadvisory Agreements (continued)
and the Board also noted the potential challenges of seeking to tailor the Management Agreement breakpoints to those of a subadvisory agreement in this context, and the effect that capacity constraints on a subadviser’s ability to manage assets could potentially have on the ability of the Investment Manager to achieve economies of scale, as new subadvisers may need to be added as the Fund grows, increasing the Investment Manager’s cost of compensating and overseeing the Fund’s subadvisers.
In considering these matters, the Committee and the Board also considered the costs of the services provided and the profitability to the Investment Manager and its affiliates from their relationships with the Fund, as discussed above. After reviewing these and related factors, the Committee and the Board concluded, within the context of their overall conclusions, that the extent to which any economies of scale were expected to be shared with the Fund supported the approval of the Manulife Subadvisory Agreement and the continuation of the Management Agreement and the Subadvisory Agreements.
Other benefits to the Investment Manager and Subadvisers
The Committee and the Board received and considered information regarding “fall-out” or ancillary benefits received by the Investment Manager and its affiliates as a result of their relationships with the Fund, such as the engagement of the Investment Manager’s affiliates to provide distribution, transfer agency and shareholder services to the Fund. In this regard, among other matters, the Committee and the Board considered that the Fund’s distributor retains a portion of the distribution fees from the Fund and receives a portion of the sales charges on sales or redemptions of certain classes of shares of the Fund. The Committee and the Board also considered the benefits of research made available to the Subadvisers by reason of brokerage commissions generated by the Fund’s securities transactions, and reviewed information about the Investment Manager’s practices with respect to allocating portfolio transactions for brokerage and research services. The Committee and the Board recognized that the Investment Manager’s profitability would be somewhat lower without these benefits.
Conclusion
The Committee and the Board reviewed all of the above considerations in reaching their decisions to recommend or approve the Manulife Subadvisory Agreement and the continuation of the Management Agreement and the Subadvisory Agreements. In their deliberations, the Trustees did not identify any particular information that was all-important or controlling, and individual Trustees may have attributed different weights to the various factors. Based on their evaluation of all factors that they deemed to be material, including those factors described above, and assisted by the advice of independent legal counsel, the Board, including the Independent Trustees, voting separately, unanimously approved the Manulife Subadvisory Agreement and the continuation of the Management Agreement and the Subadvisory Agreements.
Multi-Manager Alternative Strategies Fund | Annual Report 2017
| 71 |
The Fund mails one shareholder report to each shareholder address. If you would like more than one report, please call shareholder services at 800.345.6611 and additional reports will be sent to you.
Proxy voting policies and procedures
The policy of the Board of Trustees is to vote the proxies of the companies in which the Fund holds investments consistent with the procedures as stated in the Statement of Additional Information (SAI). You may obtain a copy of the SAI without charge by calling 800.345.6611; contacting your financial intermediary; visiting investor.columbiathreadneedleus.com; or searching the website of the Securities and Exchange Commission (SEC) at sec.gov. Information regarding how the Fund voted proxies relating to portfolio securities is filed with the SEC by August 31st for the most recent 12-month period ending June 30th of that year, and is available without charge by visiting investor.columbiathreadneedleus.com, or searching the website of the SEC at sec.gov.
Quarterly schedule of investments
The Fund files a complete schedule of portfolio holdings with the SEC for the first and third quarters of each fiscal year on Form N-Q. The Fund’s Form N-Q is available on the SEC’s website at sec.gov and may be reviewed and copied at the SEC’s Public Reference Room in Washington, D.C. Information on the operation of the Public Reference Room may be obtained by calling 800.SEC.0330. The Fund’s complete schedule of portfolio holdings, as filed on Form N-Q, can also be obtained without charge, upon request, by calling 800.345.6611.
Additional Fund information
For more information about the Fund, please visit investor.columbiathreadneedleus.com or call 800.345.6611. Customer Service Representatives are available to answer your questions Monday through Friday from 8 a.m. to 7 p.m. Eastern time.
Fund investment manager
Columbia Management Investment Advisers, LLC
225 Franklin Street
Boston, MA 02110
Fund distributor
Columbia Management Investment Distributors, Inc.
225 Franklin Street
Boston, MA 02110
Fund transfer agent
Columbia Management Investment Services Corp.
P.O. Box 8081
Boston, MA 02266-8081
You may obtain the current net asset value (NAV) of Fund shares at no cost by calling 800.345.6611 or by sending an e-mail to serviceinquiries@columbiathreadneedle.com.
| 72 | Multi-Manager Alternative Strategies Fund | Annual Report 2017 |
[THIS PAGE INTENTIONALLY LEFT BLANK]
Multi-Manager Alternative Strategies Fund
P.O. Box 8081
Boston, MA 02266-8081
Please read and consider the investment objectives, risks, charges and expenses for any fund carefully before investing. For a prospectus and summary prospectus, which contains this and other important information about the Fund, go to
investor.columbiathreadneedleus.com. The Fund is distributed by Columbia Management Investment Distributors, Inc., member FINRA, and managed by Columbia Management Investment Advisers, LLC.
Columbia Threadneedle Investments (Columbia Threadneedle) is the global brand name of the Columbia and Threadneedle group of companies. All rights reserved. Columbia Management Investment Distributors, Inc., 225 Franklin Street, Boston, MA 02110-2804
© 2017 Columbia Management Investment Advisers, LLC.
investor.columbiathreadneedleus.com

Annual Report
August 31, 2017
Columbia Global Energy and Natural Resources Fund
Not FDIC Insured • No bank guarantee • May lose value
Dear Shareholders,
The current outlook for financial markets is clouded by two primary concerns: the high valuation of equities and the direction of interest rates. Following the U.S. presidential election, U.S. equities rallied based on the assumption that the new administration’s policies would stimulate growth quickly. Unfortunately it’s unclear whether those measures will get passed, much less passed quickly. In fixed income, uncertainty stems from the possibility that interest rates won’t rise as rapidly as expected if the administration’s proposed growth policies are not implemented.
Given this uncertainty, investors value a consistent approach more than ever. Investors want strong, repeatable risk-adjusted returns. Consistency — not surprises. As a leading global asset manager, we believe our consistent, collaborative investment approach enables us to deliver the dependable experience your portfolio demands. So, how do we strive to deliver a consistent investment experience?
Better insights
Your portfolio benefits from the investment insights uncovered by our talented investment teams around the world.
Better decisions
Our collaborative, interactive environment enables our investment teams to construct portfolios that take advantage of the best investment ideas.
Better outcomes
We aim to deliver a consistent experience, which means fewer surprises, dependable insights, and products designed to do the thing you want.
Whether you’re trying to save money to help your children go to college or for your own retirement, it’s the consistency of the return that is most essential. People who chase higher returns are usually also the first to sell when that investment goes through a bad patch. We try to combat this behavioral tendency by offering strategies that aim for a more consistent return. Our goal is for investors to panic less during periods of volatility, which can have a significant effect on their long-term results.
Nothing is more important to us than making sure those who have entrusted us to protect and grow their assets can do what matters most to them: build a nest egg, leave a legacy, and live confidently — now and throughout retirement. It’s why our talented professionals around the world work together to uncover uncommon opportunities and why our process encourages challenge and debate around our most compelling ideas to ensure better informed investment decisions, which hopefully lead to better outcomes for you.
Your success is our priority. Talk to your financial advisor about how working with Columbia Threadneedle Investments may help you position your portfolio for consistent, sustainable outcomes, no matter the market conditions.
Sincerely,
Christopher O. Petersen
President, Columbia Funds
Investors should consider the investment objectives, risks, charges and expenses of a mutual fund carefully before investing. For a free prospectus and summary prospectus, which contains this and other important information about a fund, visit investor.columbiathreadneedleus.com. The prospectus should be read carefully before investing.
Columbia Funds are distributed by Columbia Management Investment Distributors, Inc., member FINRA, and managed by Columbia Management Investment Advisers, LLC.
© 2017 Columbia Management Investment Advisers, LLC. All rights reserved.
Columbia Global Energy and Natural Resources Fund | Annual Report 2017
Columbia Global Energy and Natural Resources Fund | Annual Report 2017
Investment objective
Columbia Global Energy and Natural Resources Fund (the Fund) seeks long-term capital appreciation.
Portfolio management
Josh Kapp, CFA
Portfolio manager
Managed Fund since 2011
*Effective June 2, 2017, Jonathan Mogil no longer serves as portfolio manager of the Fund.
Morningstar style boxTM
The Morningstar Style Box is based on a fund’s portfolio holdings. For equity funds, the vertical axis shows the market capitalization of the stocks owned, and the horizontal axis shows investment style (value, blend, or growth). Information shown is based on the most recent data provided by Morningstar.
© 2017 Morningstar, Inc. All rights reserved. The Morningstar information contained herein: (1) is proprietary to Morningstar and/or its content providers; (2) may not be copied or distributed; and (3) is not warranted to be accurate, complete or timely. Neither Morningstar nor its content providers are responsible for any damages or losses arising from any use of this information.
| Average annual total returns (%) (for the period ended August 31, 2017) |
| | | Inception | 1 Year | 5 Years | 10 Years |
| Class A* | Excluding sales charges | 09/28/07 | 6.34 | -0.27 | -0.79 |
| | Including sales charges | | 0.25 | -1.44 | -1.38 |
| Class C* | Excluding sales charges | 09/28/07 | 5.52 | -1.02 | -1.52 |
| | Including sales charges | | 4.52 | -1.02 | -1.52 |
| Class K* | 03/07/11 | 6.42 | -0.11 | -0.70 |
| Class R* | 09/27/10 | 6.07 | -0.51 | -1.07 |
| Class R4* | 11/08/12 | 6.52 | -0.02 | -0.55 |
| Class R5* | 11/08/12 | 6.76 | 0.15 | -0.47 |
| Class Y* | 03/01/17 | 6.61 | -0.01 | -0.55 |
| Class Z | 12/31/92 | 6.51 | -0.02 | -0.55 |
| Blended Benchmark | | 8.72 | 1.48 | 0.30 |
| S&P North American Natural Resources Sector Index | | -3.50 | -1.41 | -0.29 |
Returns for Class A shares are shown with and without the maximum initial sales charge of 5.75%. Returns for Class C shares are shown with and without the 1.00% contingent deferred sales charge for the first year only. The Fund’s other share classes are not subject to sales charges and have limited eligibility. Please see the Fund’s prospectus for details. Performance for different share classes will vary based on differences in sales charges and fees associated with each share class. All results shown assume reinvestment of distributions during the period. Returns do not reflect the deduction of taxes that a shareholder may pay on Fund distributions or on the redemption of Fund shares. Performance results reflect the effect of any fee waivers or reimbursements of Fund expenses by Columbia Management Investment Advisers, LLC and/or any of its affiliates. Absent these fee waivers or expense reimbursement arrangements, performance results would have been lower.
The performance information shown represents past performance and is not a guarantee of future results. The investment return and principal value of your investment will fluctuate so that your shares, when redeemed, may be worth more or less than their original cost. Current performance may be lower or higher than the performance information shown. You may obtain performance information current to the most recent month-end by contacting your financial intermediary, visiting investor.columbiathreadneedleus.com or calling 800.345.6611.
| * | The returns shown for periods prior to the share class inception date (including returns for the Life of the Fund, if shown, which are since Fund inception) include the returns of the Fund’s oldest share class. These returns are adjusted to reflect any higher class-related operating expenses of the newer share classes, as applicable. Please visit investor.columbiathreadneedleus.com/investment-products/mutual-funds/appended-performance for more information. |
The Blended Benchmark, a weighted custom composite, established by the Investment Manager, consists of a 60% weighting in the MSCI World Energy Sector Index (Net) and a 40% weighting in the MSCI World Materials Sector Index (Net). The MSCI World Energy Sector Index (Net) is a free float-adjusted market capitalization weighted index that represents the energy segment in global developed market equity performance. The MSCI World Materials Sector Index (Net) is a free float-adjusted market capitalization weighted index that represents the materials segment in global developed-market equity performance.
The S&P North American Natural Resources Sector Index is a modified market capitalization-weighted equity index designed as a benchmark for U.S. traded securities in the natural resources sector. The index includes companies involved in the following categories: extractive industries, energy companies, owners and operators of timber tracts, forestry services, producers of pulp and paper and owners of plantations.
Indices are not available for investment, are not professionally managed and do not reflect sales charges, fees, brokerage commissions, taxes (except the MSCI World Energy Sector Index (Net) and the MSCI World Materials Sector Index (Net), which reflect reinvested dividends net of withholding taxes) or other expenses of investing. Securities in the Fund may not match those in an index.
| 2 | Columbia Global Energy and Natural Resources Fund | Annual Report 2017 |
Fund at a Glance (continued)
Performance of a hypothetical $10,000 investment (August 31, 2007 — August 31, 2017)
The chart above shows the change in value of a hypothetical $10,000 investment in Class A shares of Columbia Global Energy and Natural Resources Fund during the stated time period, and does not reflect the deduction of taxes that a shareholder may pay on Fund distributions or on the redemption of Fund shares.
| Top 10 holdings (%) (at August 31, 2017) |
| Exxon Mobil Corp. (United States) | 7.7 |
| Royal Dutch Shell PLC, Class A (United Kingdom) | 5.0 |
| Rio Tinto PLC (United Kingdom) | 4.7 |
| Chevron Corp. (United States) | 4.3 |
| BP PLC (United Kingdom) | 4.3 |
| Dow Chemical Co. (The) (United States) | 3.7 |
| Suncor Energy, Inc. (Canada) | 3.3 |
| BASF SE (Germany) | 2.8 |
| Schlumberger Ltd.1.740% (United States) | 2.5 |
| PPG Industries, Inc. (United States) | 2.5 |
Percentages indicated are based upon total investments (excluding Money Market Funds).
For further detail about these holdings, please refer to the section entitled “Portfolio of Investments.”
Fund holdings are as of the date given, are subject to change at any time, and are not recommendations to buy or sell any security.
| Equity sector breakdown (%) (at August 31, 2017) |
| Energy | 58.1 |
| Materials | 41.9 |
| Total | 100.0 |
Percentages indicated are based upon total equity investments. The Fund’s portfolio composition is subject to change.
| Country breakdown (%) (at August 31, 2017) |
| Australia | 0.6 |
| Belgium | 1.0 |
| Canada | 9.6 |
| France | 4.3 |
| Germany | 2.8 |
| Japan | 2.7 |
| Netherlands | 2.8 |
| Switzerland | 1.6 |
| United Kingdom | 15.3 |
| United States(a) | 59.3 |
| Total | 100.0 |
| (a) | Includes investments in Money Market Funds and Exchange-Traded Funds. |
Country breakdown is based primarily on issuer’s place of organization/incorporation. Percentages indicated are based upon total investments. The Fund’s portfolio composition is subject to change.
The Fund may use place of organization/incorporation or other factors in determining whether an issuer is domestic (U.S.) or foreign for purposes of its investment policies. At August 31, 2017, the Fund invested at least 40% of its net assets in foreign companies in accordance with its principal investment strategy.
Columbia Global Energy and Natural Resources Fund | Annual Report 2017
| 3 |
Fund at a Glance (continued)
Summary of investments in securities by industry (%)
(at August 31, 2017) |
| Chemicals | 26.7 |
| Construction Materials | 0.6 |
| Containers & Packaging | 3.7 |
| Diversified Financial Services | 3.2 |
| Energy Equipment & Services | 4.8 |
| Metals & Mining | 9.1 |
| Oil, Gas & Consumable Fuels | 51.1 |
| Money Market Funds | 0.4 |
| Total | 99.6 |
Percentages indicated are based upon net assets. The Fund’s portfolio composition is subject to change.
| 4 | Columbia Global Energy and Natural Resources Fund | Annual Report 2017 |
Manager Discussion of Fund Performance
For the 12-month period that ended August 31, 2017, the Fund’s Class A shares returned 6.34% excluding sales charges. During the same time period, the Fund’s Blended Benchmark returned 8.72% and the S&P North American Natural Resources Sector Index returned -3.50%. The Fund’s modest shortfall against its Blended Benchmark was generally the result of positioning in the energy sector. Materials holdings outperformed.
Market overview
The price of oil per barrel ranged from the low $40s to the mid $50s during the one-year period ended August 31, 2017. However, that relatively narrow range masked the significant volatility the commodity experienced, with prices rallying when expectations turned too bullish and falling when expectations were too bearish. This volatility affected the equity valuations investors were willing to ascribe to energy companies. Natural gas prices hovered near $3/MMBtu (million British thermal units) for the majority of the period as supply-demand was relatively balanced and the inventory situation was improved on a year-on-year basis. The commodity experienced volatility induced by seasonality and weather, with prices ranging between $2.60 and $3.90 during the winter before ending the year close to $3.
Materials prices were also fairly volatile throughout the period, but mostly to the upside, as commodity prices that were depressed in late 2015 and early 2016 experienced a rally in late 2016 and into 2017. The price of iron ore rose roughly 70% over the period, and copper was up nearly 50%. Chinese demand was better than expected, and Chinese policy, especially on environmental issues, constrained supply and contributed to the increase in raw materials prices.
Another volatile year for energy
On the energy side of the portfolio, positioning produced mixed results. The Fund came into the year positioned for improving crude oil supply-demand fundamentals. However, when Libya and Nigeria increased oil production, commodity prices declined, which detracted from Fund performance. Against this backdrop, Devon, Noble and Hess were top performance detractors for the period. All three companies have above-average financial leverage and are highly sensitive to changing commodity prices. An overweight in pressure pumping companies in the oil service industry detracted from returns. Expectations for these companies were high going into the period, and they failed to meet those expectations. The Fund’s results benefited by not having positions in either Pioneer Natural Resources or Cenovus, a Canadian integrated energy company. A position in Suncor helped returns as shares of the integrated company rose as investors viewed its business operations positively.
Above-benchmark results from materials sector
In the materials sector, the Fund outperformed its Blended Benchmark as stock selection in chemicals produced solid performers. Overweights in Eastman Chemical Company, Albemarle, Tronox and Dow enhanced results. Eastman reported higher revenues and solid year-over-year growth in earnings per share. Albemarle shares rose on expectations for the potential of lithium, one of the company’s key products that is used in electric vehicle (EV) batteries. The Fund took some profits in Albemarle and reduced its weight to in line with the benchmark. Tronox, which produces titanium dioxide, was also a beneficiary of rising prices. In February 2017, the company announced plans to acquire Saudi-owned Cristal. The pending purchase would give Tronox a major market share in titanium dioxide and position it as a highly integrated producer.
In the metals & mining industry, an overweight in Rio Tinto, one of the world’s largest metals and mining corporations, aided relative results. The shares rose on higher iron ore prices, and investors responded favorably to the company’s deal to sell its coal mines. However, we gave up some ground with an underweight in the segment, missing out on strong gains from Glencore, to which the Fund had no exposure, and BHP, a small position in the portfolio. Fundamentals for both companies exceeded expectations for the period.
At period end
Within the energy sector, the Fund is positioned for a range bound but volatile oil price environment. We are focusing on high quality companies that we believe offer the potential to create and sustain value for shareholders in a volatile environment. As part of our ongoing efforts to improve portfolio construction, we plan to focus the Fund’s positions going forward and to
Columbia Global Energy and Natural Resources Fund | Annual Report 2017
| 5 |
Manager Discussion of Fund Performance (continued)
scrutinize smaller positions. We tend to view market selloffs as opportunities to add shares of companies on which we have a positive view of important qualities such as the balance sheet, competitive positioning, and management. In that regard, we took steps to become somewhat more focused on names for which our confidence is high.
Within materials, the Fund remained overweight in chemicals, where consolidation, shifting cost curves and current China policy have created a positive dynamic for the industry in general, and for Fund holdings, in particular. We maintained an underweight in metals & mining despite disappointing results of that positioning over the prior 12 months. If iron ore supply increases, prices may retreat and weigh on the associated equities. A change in commodity pricing, supply and demand or our view on China policy would be cause to revisit the Fund’s position in the sector.
Market risk may affect a single issuer, sector of the economy, industry or the market as a whole. Foreign investments subject the Fund to risks, including political, economic, market, social and others within a particular country, as well as to currency instabilities and less stringent financial and accounting standards generally applicable to U.S. issuers. Investing in derivatives is a specialized activity that involves special risks that subject the Fund to significant loss potential, including when used as leverage, and may result in greater fluctuation in fund value. Issuers engaged in the energy and natural resources industry may be subject to legislative or regulatory changes, adverse market conditions and/or increased competition. The values of natural resources are affected by numerous factors including naturally occurring events, demand, inflation, interest rates, and local and international politics. As a non-diversified fund, fewer investments could have a greater effect on performance. See the Fund’s prospectus for more information on these and other risks.
The views expressed in this report reflect the current views of the respective parties. These views are not guarantees of future performance and involve certain risks, uncertainties and assumptions that are difficult to predict, so actual outcomes and results may differ significantly from the views expressed. These views are subject to change at any time based upon economic, market or other conditions and the respective parties disclaim any responsibility to update such views. These views may not be relied on as investment advice and, because investment decisions for a Columbia fund are based on numerous factors, may not be relied on as an indication of trading intent on behalf of any particular Columbia fund. References to specific securities should not be construed as a recommendation or investment advice.
| 6 | Columbia Global Energy and Natural Resources Fund | Annual Report 2017 |
Understanding Your Fund’s Expenses
(Unaudited)
As an investor, you incur two types of costs. There are transaction costs, which generally include sales charges on purchases and may include redemption fees. There are also ongoing costs, which generally include management fees, distribution and/or service fees, and other fund expenses. The following information is intended to help you understand your ongoing costs (in dollars) of investing in the Fund and to help you compare these costs with the ongoing costs of investing in other mutual funds.
Analyzing your Fund’s expenses
To illustrate these ongoing costs, we have provided examples and calculated the expenses paid by investors in each share class of the Fund during the period. The actual and hypothetical information in the table is based on an initial investment of $1,000 at the beginning of the period indicated and held for the entire period. Expense information is calculated two ways and each method provides you with different information. The amount listed in the “Actual” column is calculated using the Fund’s actual operating expenses and total return for the period. You may use the Actual information, together with the amount invested, to estimate the expenses that you paid over the period. Simply divide your account value by $1,000 (for example, an $8,600 account value divided by $1,000 = 8.6), then multiply the results by the expenses paid during the period under the “Actual” column. The amount listed in the “Hypothetical” column assumes a 5% annual rate of return before expenses (which is not the Fund’s actual return) and then applies the Fund’s actual expense ratio for the period to the hypothetical return. You should not use the hypothetical account values and expenses to estimate either your actual account balance at the end of the period or the expenses you paid during the period. See “Compare with other funds” below for details on how to use the hypothetical data.
Compare with other funds
Since all mutual funds are required to include the same hypothetical calculations about expenses in shareholder reports, you can use this information to compare the ongoing cost of investing in the Fund with other funds. To do so, compare the hypothetical example with the 5% hypothetical examples that appear in the shareholder reports of other funds. As you compare hypothetical examples of other funds, it is important to note that hypothetical examples are meant to highlight the ongoing costs of investing in a fund only and do not reflect any transaction costs, such as sales charges, or redemption or exchange fees. Therefore, the hypothetical calculations are useful in comparing ongoing costs only, and will not help you determine the relative total costs of owning different funds. If transaction costs were included in these calculations, your costs would be higher.
| March 1, 2017 — August 31, 2017 |
| | Account value at the
beginning of the
period ($) | Account value at the
end of the
period ($) | Expenses paid during
the period ($) | Fund’s annualized
expense ratio (%) |
| | Actual | Hypothetical | Actual | Hypothetical | Actual | Hypothetical | Actual |
| Class A | 1,000.00 | 1,000.00 | 992.70 | 1,018.35 | 6.83 | 6.92 | 1.36 |
| Class C | 1,000.00 | 1,000.00 | 988.70 | 1,014.52 | 10.63 | 10.76 | 2.12 |
| Class K | 1,000.00 | 1,000.00 | 993.30 | 1,019.11 | 6.08 | 6.16 | 1.21 |
| Class R | 1,000.00 | 1,000.00 | 991.50 | 1,017.04 | 8.13 | 8.24 | 1.62 |
| Class R4 | 1,000.00 | 1,000.00 | 993.40 | 1,019.56 | 5.63 | 5.70 | 1.12 |
| Class R5 | 1,000.00 | 1,000.00 | 994.50 | 1,020.37 | 4.83 | 4.89 | 0.96 |
| Class Y | 1,000.00 | 1,000.00 | 978.90 | 1,020.62 | 4.49 | 4.63 | 0.91 |
| Class Z | 1,000.00 | 1,000.00 | 993.30 | 1,019.56 | 5.63 | 5.70 | 1.12 |
Expenses paid during the period are equal to the annualized expense ratio for each class as indicated above, multiplied by the average account value over the period and then multiplied by the number of days in the Fund’s most recent fiscal half year and divided by 365.
Expenses do not include fees and expenses incurred indirectly by the Fund from its investment in underlying funds, including affiliated and non-affiliated pooled investment vehicles, such as mutual funds and exchange-traded funds.
Columbia Global Energy and Natural Resources Fund | Annual Report 2017
| 7 |
Portfolio of Investments
August 31, 2017
(Percentages represent value of investments compared to net assets)
| Common Stocks 95.3% |
| Issuer | Shares | Value ($) |
| Australia 0.6% |
| BHP Billiton Ltd. | 57,710 | 1,256,298 |
| Belgium 1.0% |
| Solvay SA | 15,632 | 2,267,522 |
| Canada 9.6% |
| Agrium, Inc. | 6,410 | 628,436 |
| Canadian Natural Resources Ltd. | 114,563 | 3,529,320 |
| Enbridge, Inc. | 27,698 | 1,107,643 |
| Enbridge, Inc. | 75,195 | 3,005,994 |
| First Quantum Minerals Ltd. | 137,031 | 1,651,505 |
| Suncor Energy, Inc. | 42,301 | 1,325,290 |
| Suncor Energy, Inc. | 230,074 | 7,209,446 |
| TransCanada Corp. | 57,826 | 2,936,334 |
| Total | 21,393,968 |
| France 4.3% |
| Air Liquide SA | 17,463 | 2,131,895 |
| Arkema SA | 20,453 | 2,222,512 |
| Total SA | 99,256 | 5,133,434 |
| Total | 9,487,841 |
| Germany 2.7% |
| BASF SE | 63,144 | 6,116,568 |
| Japan 2.7% |
| Mitsubishi Chemical Holdings Corp. | 336,700 | 3,138,220 |
| Mitsui Chemicals, Inc. | 267,000 | 1,599,230 |
| Teijin Ltd. | 63,900 | 1,298,137 |
| Total | 6,035,587 |
| Netherlands 2.7% |
| Akzo Nobel NV | 25,535 | 2,334,579 |
| LyondellBasell Industries NV, Class A | 41,563 | 3,765,192 |
| Total | 6,099,771 |
| Switzerland 1.6% |
| Clariant AG, Registered Shares | 88,253 | 2,129,594 |
| LafargeHolcim Ltd. | 24,492 | 1,439,312 |
| Total | 3,568,906 |
| Common Stocks (continued) |
| Issuer | Shares | Value ($) |
| United Kingdom 15.3% |
| BP PLC | 1,643,468 | 9,460,192 |
| BP PLC, ADR | 7,752 | 269,227 |
| Ferroglobe PLC | 65,510 | 883,730 |
| Randgold Resources Ltd. | 19,612 | 2,005,999 |
| Rio Tinto PLC | 212,511 | 10,295,311 |
| Rio Tinto PLC, ADR | 139 | 6,822 |
| Royal Dutch Shell PLC, Class A | 402,977 | 11,083,581 |
| Total | 34,004,862 |
| United States 54.8% |
| Albemarle Corp. | 10,829 | 1,258,980 |
| Anadarko Petroleum Corp. | 35,321 | 1,445,689 |
| Andeavor | 13,410 | 1,343,011 |
| Baker Hughes, Inc. | 18,665 | 632,743 |
| Cabot Oil & Gas Corp. | 58,749 | 1,501,037 |
| Chevron Corp. | 89,235 | 9,603,471 |
| Cimarex Energy Co. | 24,634 | 2,455,763 |
| ConocoPhillips | 44,230 | 1,931,082 |
| Continental Resources, Inc.(a) | 50,454 | 1,711,400 |
| Devon Energy Corp. | 28,651 | 899,641 |
| Dow Chemical Co. (The) | 121,464 | 8,095,576 |
| Eastman Chemical Co. | 52,726 | 4,544,981 |
| EI du Pont de Nemours & Co. | 41,774 | 3,506,092 |
| EOG Resources, Inc. | 47,624 | 4,047,564 |
| EQT Corp. | 24,942 | 1,554,884 |
| Exxon Mobil Corp. | 223,597 | 17,067,159 |
| Halliburton Co. | 90,223 | 3,515,990 |
| Hess Corp. | 55,726 | 2,167,741 |
| International Paper Co. | 91,020 | 4,903,247 |
| Kinder Morgan, Inc. | 168,289 | 3,253,026 |
| Marathon Petroleum Corp. | 38,240 | 2,005,688 |
| Monsanto Co. | 21,278 | 2,493,782 |
| Mosaic Co. (The) | 87,848 | 1,755,203 |
| Newfield Exploration Co.(a) | 61,212 | 1,599,470 |
| Noble Energy, Inc. | 90,921 | 2,161,192 |
| Nucor Corp. | 13,813 | 761,234 |
| Occidental Petroleum Corp. | 43,497 | 2,596,771 |
| Patterson-UTI Energy, Inc. | 63,350 | 1,011,699 |
| Phillips 66 | 36,168 | 3,031,240 |
The accompanying Notes to Financial Statements are an integral part of this statement.
| 8 | Columbia Global Energy and Natural Resources Fund | Annual Report 2017 |
Portfolio of Investments (continued)
August 31, 2017
| Common Stocks (continued) |
| Issuer | Shares | Value ($) |
| PPG Industries, Inc. | 52,174 | 5,442,792 |
| Praxair, Inc. | 36,651 | 4,821,073 |
| RSP Permian, Inc.(a) | 53,642 | 1,683,286 |
| Schlumberger Ltd. | 88,836 | 5,641,974 |
| Sealed Air Corp. | 58,270 | 2,586,023 |
| Steel Dynamics, Inc. | 102,953 | 3,546,731 |
| Valero Energy Corp. | 38,262 | 2,605,642 |
| WestRock Co. | 10,860 | 618,043 |
| Williams Companies, Inc. (The) | 32,520 | 966,820 |
| WPX Energy, Inc.(a) | 128,430 | 1,283,016 |
| Total | 122,050,756 |
Total Common Stocks
(Cost $191,510,257) | 212,282,079 |
|
| Exchange-Traded Funds 3.2% |
| | Shares | Value ($) |
| United States 3.2% |
| iShares Global Energy ETF | 32,650 | 1,018,680 |
| iShares Global Materials ETF | 11,890 | 766,905 |
| VanEck Vectors Gold Miners ETF | 219,142 | 5,417,190 |
| Total | 7,202,775 |
Total Exchange-Traded Funds
(Cost $4,860,762) | 7,202,775 |
|
| Limited Partnerships 0.7% |
| Issuer | Shares | Value ($) |
| United States 0.7% |
| Enterprise Products Partners LP | 57,213 | 1,491,543 |
Total Limited Partnerships
(Cost $1,740,027) | 1,491,543 |
|
| Money Market Funds 0.4% |
| | Shares | Value ($) |
| Columbia Short-Term Cash Fund, 1.146%(b),(c) | 950,586 | 950,586 |
Total Money Market Funds
(Cost $950,586) | 950,586 |
Total Investments
(Cost $199,061,632) | 221,926,983 |
| Other Assets & Liabilities, Net | | 941,580 |
| Net Assets | $222,868,563 |
Notes to Portfolio of Investments
| (a) | Non-income producing investment. |
| (b) | The rate shown is the seven-day current annualized yield at August 31, 2017. |
| (c) | As defined in the Investment Company Act of 1940, an affiliated company is one in which the Fund owns 5% or more of the company’s outstanding voting securities, or a company which is under common ownership or control with the Fund. Holdings and transactions in these affiliated companies during the year ended August 31, 2017 are as follows: |
| Issuer | Beginning
shares | Shares
purchased | Shares
sold | Ending
shares | Realized gain
(loss) ($) | Net change in
unrealized
appreciation
(depreciation) ($) | Dividends —
affiliated
issuers($) | Value ($) |
| Columbia Short-Term Cash Fund, 1.146% | 2,417,147 | 43,377,641 | (44,844,202) | 950,586 | 44 | 0 | 6,496 | 950,586 |
Abbreviation Legend
| ADR | American Depositary Receipt |
Fair value measurements
The Fund categorizes its fair value measurements according to a three-level hierarchy that maximizes the use of observable inputs and minimizes the use of unobservable inputs by prioritizing that the most observable input be used when available. Observable inputs are those that market participants would use in pricing an investment based on market data obtained from sources independent of the reporting entity. Unobservable inputs are those that reflect the Fund’s assumptions about the information market participants would use in
The accompanying Notes to Financial Statements are an integral part of this statement.
Columbia Global Energy and Natural Resources Fund | Annual Report 2017
| 9 |
Portfolio of Investments (continued)
August 31, 2017
Fair value measurements (continued)
pricing an investment. An investment’s level within the fair value hierarchy is based on the lowest level of any input that is deemed significant to the asset’s or liability’s fair value measurement. The input levels are not necessarily an indication of the risk or liquidity associated with investments at that level. For example, certain U.S. government securities are generally high quality and liquid, however, they are reflected as Level 2 because the inputs used to determine fair value may not always be quoted prices in an active market.
Fair value inputs are summarized in the three broad levels listed below:
| • | Level 1 – Valuations based on quoted prices for investments in active markets that the Fund has the ability to access at the measurement date. Valuation adjustments are not applied to Level 1 investments. |
| • | Level 2 – Valuations based on other significant observable inputs (including quoted prices for similar securities, interest rates, prepayment speeds, credit risks, etc.). |
| • | Level 3 – Valuations based on significant unobservable inputs (including the Fund’s own assumptions and judgment in determining the fair value of investments). |
Inputs that are used in determining fair value of an investment may include price information, credit data, volatility statistics, and other factors. These inputs can be either observable or unobservable. The availability of observable inputs can vary between investments, and is affected by various factors such as the type of investment, and the volume and level of activity for that investment or similar investments in the marketplace. The inputs will be considered by the Investment Manager, along with any other relevant factors in the calculation of an investment’s fair value. The Fund uses prices and inputs that are current as of the measurement date, which may include periods of market dislocations. During these periods, the availability of prices and inputs may be reduced for many investments. This condition could cause an investment to be reclassified between the various levels within the hierarchy.
Foreign equity securities actively traded in markets where there is a significant delay in the local close relative to the New York Stock Exchange are classified as Level 2. The values of these securities may include an adjustment to reflect the impact of significant market movements following the close of local trading, as described in Note 2 to the financial statements – Security valuation.
Certain investments that have been measured at fair value using the net asset value (NAV) per share (or its equivalent) are not categorized in the fair value hierarchy. The fair value amounts presented in the table are intended to reconcile the fair value hierarchy to the amounts presented in the Portfolio of Investments. The Columbia Short-Term Cash Fund seeks to provide shareholders with maximum current income consistent with liquidity and stability of principal. Columbia Short-Term Cash Fund prices its shares with a floating NAV and no longer seeks to maintain a stable NAV.
Investments falling into the Level 3 category are primarily supported by quoted prices from brokers and dealers participating in the market for those investments. However, these may be classified as Level 3 investments due to lack of market transparency and corroboration to support these quoted prices. Additionally, valuation models may be used as the pricing source for any remaining investments classified as Level 3. These models may rely on one or more significant unobservable inputs and/or significant assumptions by the Investment Manager. Inputs used in valuations may include, but are not limited to, financial statement analysis, capital account balances, discount rates and estimated cash flows, and comparable company data.
Under the direction of the Fund’s Board of Trustees (the Board), the Investment Manager’s Valuation Committee (the Committee) is responsible for overseeing the valuation procedures approved by the Board. The Committee consists of voting and non-voting members from various groups within the Investment Manager’s organization, including operations and accounting, trading and investments, compliance, risk management and legal.
The Committee meets at least monthly to review and approve valuation matters, which may include a description of specific valuation determinations, data regarding pricing information received from approved pricing vendors and brokers and the results of Board-approved valuation control policies and procedures (the Policies). The Policies address, among other things, instances when market quotations are or are not readily available, including recommendations of third party pricing vendors and a determination of appropriate pricing methodologies; events that require specific valuation determinations and assessment of fair value techniques; securities with a potential for stale pricing, including those that are illiquid, restricted, or in default; and the effectiveness of third party pricing vendors, including periodic reviews of vendors. The Committee meets more frequently, as needed, to discuss additional valuation matters, which may include the need to review back-testing results, review time-sensitive information or approve related valuation actions. The Committee reports to the Board, with members of the Committee meeting with the Board at each of its regularly scheduled meetings to discuss valuation matters and actions during the period, similar to those described earlier.
For investments categorized as Level 3, the Committee monitors information similar to that described above, which may include: (i) data specific to the issuer or comparable issuers, (ii) general market or specific sector news and (iii) quoted prices and specific or similar security transactions. The Committee considers this data and any changes from prior periods in order to assess the reasonableness of observable and unobservable inputs, any assumptions or internal models used to value those securities and changes in fair value. This data is also used to corroborate, when available, information received from approved pricing vendors and brokers. Various factors impact the frequency of monitoring this information (which may occur as often as daily). However, the Committee may determine that changes to inputs, assumptions and models are not required as a result of the monitoring procedures performed.
The following table is a summary of the inputs used to value the Fund’s investments at August 31, 2017:
| | Level 1
quoted prices
in active
markets for
identical
assets ($) | Level 2
other
significant
observable
inputs ($) | Level 3
significant
unobservable
inputs ($) | Investments
measured at
net asset
value ($) | Total ($) |
| Investments | | | | | |
| Common Stocks | | | | | |
| Australia | — | 1,256,298 | — | — | 1,256,298 |
| Belgium | — | 2,267,522 | — | — | 2,267,522 |
| Canada | 21,393,968 | — | — | — | 21,393,968 |
| France | — | 9,487,841 | — | — | 9,487,841 |
| Germany | — | 6,116,568 | — | — | 6,116,568 |
| Japan | — | 6,035,587 | — | — | 6,035,587 |
| Netherlands | 3,765,192 | 2,334,579 | — | — | 6,099,771 |
| Switzerland | — | 3,568,906 | — | — | 3,568,906 |
The accompanying Notes to Financial Statements are an integral part of this statement.
| 10 | Columbia Global Energy and Natural Resources Fund | Annual Report 2017 |
Portfolio of Investments (continued)
August 31, 2017
Fair value measurements (continued)
| | Level 1
quoted prices
in active
markets for
identical
assets ($) | Level 2
other
significant
observable
inputs ($) | Level 3
significant
unobservable
inputs ($) | Investments
measured at
net asset
value ($) | Total ($) |
| United Kingdom | 1,159,779 | 32,845,083 | — | — | 34,004,862 |
| United States | 122,050,756 | — | — | — | 122,050,756 |
| Total Common Stocks | 148,369,695 | 63,912,384 | — | — | 212,282,079 |
| Exchange-Traded Funds | 7,202,775 | — | — | — | 7,202,775 |
| Limited Partnerships | | | | | |
| United States | 1,491,543 | — | — | — | 1,491,543 |
| Total Limited Partnerships | 1,491,543 | — | — | — | 1,491,543 |
| Money Market Funds | — | — | — | 950,586 | 950,586 |
| Total Investments | 157,064,013 | 63,912,384 | — | 950,586 | 221,926,983 |
See the Portfolio of Investments for all investment classifications not indicated in the table.
The Fund’s assets assigned to the Level 2 input category are generally valued using the market approach, in which a security’s value is determined through reference to prices and information from market transactions for similar or identical assets. These assets include certain foreign securities for which a third party statistical pricing service may be employed for purposes of fair market valuation. The model utilized by such third party statistical pricing service takes into account a security’s correlation to available market data including, but not limited to, intraday index, ADR, and exchange-traded fund movements.
There were no transfers of financial assets between levels during the period.
The accompanying Notes to Financial Statements are an integral part of this statement.
Columbia Global Energy and Natural Resources Fund | Annual Report 2017
| 11 |
Statement of Assets and Liabilities
August 31, 2017
| Assets | |
| Investments in unaffiliated issuers, at cost | $198,111,046 |
| Investments in affiliated issuers, at cost | 950,586 |
| Investments in unaffiliated issuers, at value | 220,976,397 |
| Investments in affiliated issuers, at value | 950,586 |
| Receivable for: | |
| Capital shares sold | 110,681 |
| Dividends | 1,164,503 |
| Foreign tax reclaims | 118,847 |
| Prepaid expenses | 1,569 |
| Trustees’ deferred compensation plan | 45,915 |
| Other assets | 9,677 |
| Total assets | 223,378,175 |
| Liabilities | |
| Due to custodian | 50 |
| Payable for: | |
| Capital shares purchased | 361,403 |
| Management services fees | 4,549 |
| Distribution and/or service fees | 1,022 |
| Transfer agent fees | 41,162 |
| Plan administration fees | 1 |
| Compensation of board members | 456 |
| Compensation of chief compliance officer | 17 |
| Audit fees | 33,463 |
| Other expenses | 21,574 |
| Trustees’ deferred compensation plan | 45,915 |
| Total liabilities | 509,612 |
| Net assets applicable to outstanding capital stock | $222,868,563 |
| Represented by | |
| Paid in capital | 235,247,251 |
| Undistributed net investment income | 1,451,625 |
| Accumulated net realized loss | (36,702,486) |
| Unrealized appreciation (depreciation) on: | |
| Investments - unaffiliated issuers | 22,865,351 |
| Foreign currency translations | 6,822 |
| Total - representing net assets applicable to outstanding capital stock | $222,868,563 |
The accompanying Notes to Financial Statements are an integral part of this statement.
| 12 | Columbia Global Energy and Natural Resources Fund | Annual Report 2017 |
Statement of Assets and Liabilities (continued)
August 31, 2017
| Class A | |
| Net assets | $76,762,820 |
| Shares outstanding | 4,370,015 |
| Net asset value per share | $17.57 |
| Maximum offering price per share(a) | $18.64 |
| Class C | |
| Net assets | $12,795,716 |
| Shares outstanding | 772,236 |
| Net asset value per share | $16.57 |
| Class K | |
| Net assets | $4,836 |
| Shares outstanding | 273 |
| Net asset value per share(b) | $17.74 |
| Class R | |
| Net assets | $11,018,527 |
| Shares outstanding | 632,294 |
| Net asset value per share | $17.43 |
| Class R4 | |
| Net assets | $7,383,135 |
| Shares outstanding | 407,877 |
| Net asset value per share | $18.10 |
| Class R5 | |
| Net assets | $10,022,115 |
| Shares outstanding | 550,701 |
| Net asset value per share | $18.20 |
| Class Y | |
| Net assets | $17,162,732 |
| Shares outstanding | 971,814 |
| Net asset value per share | $17.66 |
| Class Z | |
| Net assets | $87,718,682 |
| Shares outstanding | 4,929,731 |
| Net asset value per share | $17.79 |
| (a) | The maximum offering price per share is calculated by dividing the net asset value per share by 1.0 minus the maximum sales charge of 5.75% for Class A. |
| (b) | Net asset value per share rounds to this amount due to fractional shares outstanding. |
The accompanying Notes to Financial Statements are an integral part of this statement.
Columbia Global Energy and Natural Resources Fund | Annual Report 2017
| 13 |
Statement of Operations
Year Ended August 31, 2017
| Net investment income | |
| Income: | |
| Dividends — unaffiliated issuers | $7,671,528 |
| Dividends — affiliated issuers | 6,496 |
| Foreign taxes withheld | (336,202) |
| Total income | 7,341,822 |
| Expenses: | |
| Management services fees | 1,792,602 |
| Distribution and/or service fees | |
| Class A | 221,768 |
| Class B(a) | 3,646 |
| Class C | 145,380 |
| Class R | 45,637 |
| Transfer agent fees | |
| Class A | 197,980 |
| Class B(a) | 813 |
| Class C | 32,473 |
| Class I(b) | 420 |
| Class K | 4 |
| Class R | 20,430 |
| Class R4 | 16,382 |
| Class R5 | 5,001 |
| Class Y(c) | 743 |
| Class Z | 209,808 |
| Plan administration fees | |
| Class K | 13 |
| Compensation of board members | 22,423 |
| Custodian fees | 11,636 |
| Printing and postage fees | 57,801 |
| Registration fees | 122,925 |
| Audit fees | 50,117 |
| Legal fees | 6,835 |
| Compensation of chief compliance officer | 105 |
| Other | 25,062 |
| Total expenses | 2,990,004 |
| Expense reduction | (2,328) |
| Total net expenses | 2,987,676 |
| Net investment income | 4,354,146 |
| Realized and unrealized gain (loss) — net | |
| Net realized gain (loss) on: | |
| Investments — unaffiliated issuers | (6,262,841) |
| Investments — affiliated issuers | 44 |
| Foreign currency translations | (3,670) |
| Net realized loss | (6,266,467) |
| Net change in unrealized appreciation (depreciation) on: | |
| Investments — unaffiliated issuers | 17,027,821 |
| Foreign currency translations | 6,426 |
| Net change in unrealized appreciation (depreciation) | 17,034,247 |
| Net realized and unrealized gain | 10,767,780 |
| Net increase in net assets resulting from operations | $15,121,926 |
| (a) | Effective July 17, 2017, Class B shares were automatically converted to Class A shares. |
| (b) | Effective March 27, 2017, Class I shares were redeemed or exchanged for Class Y shares. |
| (c) | Class Y shares are based on operations from March 1, 2017 (commencement of operations) through the stated period end. |
The accompanying Notes to Financial Statements are an integral part of this statement.
| 14 | Columbia Global Energy and Natural Resources Fund | Annual Report 2017 |
Statement of Changes in Net Assets
| | Year Ended
August 31, 2017 | Year Ended
August 31, 2016 |
| Operations | | |
| Net investment income | $4,354,146 | $5,153,676 |
| Net realized loss | (6,266,467) | (26,548,541) |
| Net change in unrealized appreciation (depreciation) | 17,034,247 | 34,225,598 |
| Net increase in net assets resulting from operations | 15,121,926 | 12,830,733 |
| Distributions to shareholders | | |
| Net investment income | | |
| Class A | (1,453,246) | — |
| Class B(a) | (5,638) | — |
| Class C | (187,945) | — |
| Class I(b) | (289,335) | — |
| Class K | (88) | — |
| Class R | (113,853) | — |
| Class R4 | (121,661) | — |
| Class R5 | (114,412) | — |
| Class Z | (1,520,089) | — |
| Total distributions to shareholders | (3,806,267) | — |
| Decrease in net assets from capital stock activity | (34,920,402) | (17,630,870) |
| Total decrease in net assets | (23,604,743) | (4,800,137) |
| Net assets at beginning of year | 246,473,306 | 251,273,443 |
| Net assets at end of year | $222,868,563 | $246,473,306 |
| Undistributed net investment income | $1,451,625 | $860,749 |
| (a) | Effective July 17, 2017, Class B shares were automatically converted to Class A shares. |
| (b) | Effective March 27, 2017, Class I shares were redeemed or exchanged for Class Y shares. |
The accompanying Notes to Financial Statements are an integral part of this statement.
Columbia Global Energy and Natural Resources Fund | Annual Report 2017
| 15 |
Statement of Changes in Net Assets (continued)
| | Year Ended | Year Ended |
| | August 31, 2017 (a) | August 31, 2016 |
| | Shares | Dollars ($) | Shares | Dollars ($) |
| Capital stock activity |
| Class A(b) | | | | |
| Subscriptions (c) | 831,117 | 14,602,433 | 3,378,861 | 52,411,407 |
| Distributions reinvested | 80,190 | 1,429,227 | — | — |
| Redemptions | (2,417,383) | (42,118,380) | (2,922,740) | (45,992,961) |
| Net increase (decrease) | (1,506,076) | (26,086,720) | 456,121 | 6,418,446 |
| Class B(b) | | | | |
| Subscriptions | — | — | 1,852 | 25,884 |
| Distributions reinvested | 288 | 4,926 | — | — |
| Redemptions (c) | (35,052) | (581,102) | (32,123) | (472,365) |
| Net decrease | (34,764) | (576,176) | (30,271) | (446,481) |
| Class C | | | | |
| Subscriptions | 86,394 | 1,430,560 | 288,730 | 4,167,002 |
| Distributions reinvested | 9,813 | 167,893 | — | — |
| Redemptions | (296,481) | (4,915,551) | (267,212) | (3,907,041) |
| Net increase (decrease) | (200,274) | (3,317,098) | 21,518 | 259,961 |
| Class I(d) | | | | |
| Subscriptions | 19,262 | 353,299 | 35,261 | 597,289 |
| Distributions reinvested | 16,040 | 289,295 | — | — |
| Redemptions | (1,098,560) | (19,532,630) | (1,184,581) | (17,912,630) |
| Net decrease | (1,063,258) | (18,890,036) | (1,149,320) | (17,315,341) |
| Class K | | | | |
| Distributions reinvested | 3 | 56 | — | — |
| Redemptions | (42) | (750) | — | — |
| Net decrease | (39) | (694) | — | — |
| Class R | | | | |
| Subscriptions | 492,942 | 8,590,740 | 372,218 | 5,735,638 |
| Distributions reinvested | 6,396 | 113,853 | — | — |
| Redemptions | (289,032) | (5,054,123) | (142,602) | (2,252,951) |
| Net increase | 210,306 | 3,650,470 | 229,616 | 3,482,687 |
| Class R4 | | | | |
| Subscriptions | 102,521 | 1,849,762 | 495,439 | 7,828,276 |
| Distributions reinvested | 6,057 | 110,783 | — | — |
| Redemptions | (157,940) | (2,865,286) | (479,252) | (7,592,219) |
| Net increase (decrease) | (49,362) | (904,741) | 16,187 | 236,057 |
| Class R5 | | | | |
| Subscriptions | 311,320 | 5,656,436 | 235,771 | 3,731,941 |
| Distributions reinvested | 6,236 | 114,379 | — | — |
| Redemptions | (145,170) | (2,621,842) | (161,916) | (2,537,219) |
| Net increase | 172,386 | 3,148,973 | 73,855 | 1,194,722 |
| Class Y(d) | | | | |
| Subscriptions | 980,098 | 17,141,454 | — | — |
| Redemptions | (8,284) | (145,003) | — | — |
| Net increase | 971,814 | 16,996,451 | — | — |
| Class Z | | | | |
| Subscriptions | 1,081,284 | 19,162,038 | 840,334 | 12,757,609 |
| Distributions reinvested | 81,673 | 1,468,582 | — | — |
| Redemptions | (1,670,089) | (29,571,451) | (1,569,013) | (24,218,530) |
| Net decrease | (507,132) | (8,940,831) | (728,679) | (11,460,921) |
| Total net decrease | (2,006,399) | (34,920,402) | (1,110,973) | (17,630,870) |
The accompanying Notes to Financial Statements are an integral part of this statement.
| 16 | Columbia Global Energy and Natural Resources Fund | Annual Report 2017 |
Statement of Changes in Net Assets (continued)
| (a) | Class Y shares are based on operations from March 1, 2017 (commencement of operations) through the stated period end. |
| (b) | Effective July 17, 2017, Class B shares were automatically converted to Class A shares. |
| (c) | Includes conversions of Class B shares to Class A shares, if any. |
| (d) | Effective March 27, 2017, Class I shares were redeemed or exchanged for Class Y shares. |
The accompanying Notes to Financial Statements are an integral part of this statement.
Columbia Global Energy and Natural Resources Fund | Annual Report 2017
| 17 |
The following table is intended to help you understand the Fund’s financial performance. Certain information reflects financial results for a single share of a class held for the periods shown. Per share net investment income (loss) amounts are calculated based on average shares outstanding during the period. Total return assumes reinvestment of all dividends and distributions, if any. Total return does not reflect payment of sales charges, if any. Total return and portfolio turnover are not annualized for periods of less than one year. The portfolio turnover rate is calculated without regard to purchase and sales transactions of short-term instruments and certain derivatives, if any. If such transactions were included, the Fund’s portfolio turnover rate may be higher.
| Year ended | Net asset value,
beginning of
period | Net
investment
income | Net
realized
and
unrealized
gain (loss) | Total from
investment
operations | Distributions
from net
investment
income | Distributions
from net
realized
gains |
| Class A |
| 8/31/2017 | $16.77 | 0.30 | 0.77 | 1.07 | (0.27) | — |
| 8/31/2016 | $15.89 | 0.32 | 0.56 | 0.88 | — | — |
| 8/31/2015 | $24.98 | 0.29 | (7.95) | (7.66) | — | (1.43) |
| 8/31/2014 | $21.07 | 0.26 | 4.10 | 4.36 | (0.14) | (0.31) |
| 8/31/2013 | $20.04 | 0.24 | 0.87 | 1.11 | (0.08) | — |
| Class C |
| 8/31/2017 | $15.89 | 0.16 | 0.72 | 0.88 | (0.20) | — |
| 8/31/2016 | $15.17 | 0.20 | 0.52 | 0.72 | — | — |
| 8/31/2015 | $24.10 | 0.14 | (7.64) | (7.50) | — | (1.43) |
| 8/31/2014 | $20.36 | 0.08 | 3.97 | 4.05 | — | (0.31) |
| 8/31/2013 | $19.44 | 0.08 | 0.84 | 0.92 | (0.00) (e) | — |
| Class K |
| 8/31/2017 | $16.93 | 0.32 | 0.77 | 1.09 | (0.28) | — |
| 8/31/2016 | $16.01 | 0.36 | 0.56 | 0.92 | — | — |
| 8/31/2015 | $25.11 | 0.26 | (7.93) | (7.67) | — | (1.43) |
| 8/31/2014 | $21.18 | 0.30 | 4.12 | 4.42 | (0.18) | (0.31) |
| 8/31/2013 | $20.13 | 0.28 | 0.87 | 1.15 | (0.10) | — |
| Class R |
| 8/31/2017 | $16.66 | 0.27 | 0.75 | 1.02 | (0.25) | — |
| 8/31/2016 | $15.83 | 0.29 | 0.54 | 0.83 | — | — |
| 8/31/2015 | $24.94 | 0.25 | (7.93) | (7.68) | — | (1.43) |
| 8/31/2014 | $21.03 | 0.21 | 4.10 | 4.31 | (0.09) | (0.31) |
| 8/31/2013 | $20.03 | 0.21 | 0.84 | 1.05 | (0.05) | — |
| Class R4 |
| 8/31/2017 | $17.26 | 0.36 | 0.77 | 1.13 | (0.29) | — |
| 8/31/2016 | $16.30 | 0.37 | 0.59 | 0.96 | — | — |
| 8/31/2015 | $25.52 | 0.34 | (8.13) | (7.79) | — | (1.43) |
| 8/31/2014 | $21.51 | 0.35 | 4.17 | 4.52 | (0.20) | (0.31) |
| 8/31/2013 (f) | $20.25 | 0.35 | 0.96 | 1.31 | (0.05) | — |
The accompanying Notes to Financial Statements are an integral part of this statement.
| 18 | Columbia Global Energy and Natural Resources Fund | Annual Report 2017 |
Total
distributions to
shareholders | Net
asset
value,
end of
period | Total
return | Total gross
expense
ratio to
average
net assets(a) | Total net
expense
ratio to
average
net assets(a),(b) | Net investment
income
ratio to
average
net assets | Portfolio
turnover | Net
assets,
end of
period
(000’s) |
| |
| (0.27) | $17.57 | 6.34% | 1.34% | 1.34% (c) | 1.70% | 19% | $76,763 |
| — | $16.77 | 5.54% | 1.33% | 1.33% (c) | 2.06% | 45% | $98,566 |
| (1.43) | $15.89 | (31.16%) | 1.32% | 1.32% (c) | 1.48% | 51% | $86,133 |
| (0.45) | $24.98 | 21.00% | 1.30% | 1.30% (c) | 1.13% | 34% | $130,692 |
| (0.08) | $21.07 | 5.54% | 1.32% (d) | 1.32% (c),(d) | 1.17% | 73% | $110,896 |
| |
| (0.20) | $16.57 | 5.52% | 2.09% | 2.09% (c) | 0.96% | 19% | $12,796 |
| — | $15.89 | 4.75% | 2.09% | 2.09% (c) | 1.34% | 45% | $15,457 |
| (1.43) | $15.17 | (31.66%) | 2.07% | 2.07% (c) | 0.77% | 51% | $14,428 |
| (0.31) | $24.10 | 20.07% | 2.05% | 2.05% (c) | 0.38% | 34% | $16,745 |
| (0.00) (e) | $20.36 | 4.75% | 2.06% (d) | 2.06% (c),(d) | 0.41% | 73% | $15,340 |
| |
| (0.28) | $17.74 | 6.42% | 1.21% | 1.21% | 1.83% | 19% | $5 |
| — | $16.93 | 5.75% | 1.16% | 1.16% | 2.27% | 45% | $5 |
| (1.43) | $16.01 | (31.03%) | 1.13% | 1.13% | 1.18% | 51% | $5 |
| (0.49) | $25.11 | 21.21% | 1.12% | 1.12% | 1.31% | 34% | $79 |
| (0.10) | $21.18 | 5.71% | 1.13% (d) | 1.13% (d) | 1.35% | 73% | $69 |
| |
| (0.25) | $17.43 | 6.07% | 1.60% | 1.60% (c) | 1.53% | 19% | $11,019 |
| — | $16.66 | 5.24% | 1.59% | 1.59% (c) | 1.84% | 45% | $7,031 |
| (1.43) | $15.83 | (31.29%) | 1.57% | 1.57% (c) | 1.30% | 51% | $3,045 |
| (0.40) | $24.94 | 20.73% | 1.55% | 1.55% (c) | 0.90% | 34% | $3,131 |
| (0.05) | $21.03 | 5.27% | 1.57% (d) | 1.57% (c),(d) | 1.01% | 73% | $1,664 |
| |
| (0.29) | $18.10 | 6.52% | 1.10% | 1.10% (c) | 1.98% | 19% | $7,383 |
| — | $17.26 | 5.89% | 1.09% | 1.09% (c) | 2.30% | 45% | $7,890 |
| (1.43) | $16.30 | (31.00%) | 1.07% | 1.07% (c) | 1.69% | 51% | $7,191 |
| (0.51) | $25.52 | 21.32% | 1.05% | 1.05% (c) | 1.49% | 34% | $12,899 |
| (0.05) | $21.51 | 6.50% | 1.06% (g) | 1.06% (c),(g) | 2.05% (g) | 73% | $1,575 |
Columbia Global Energy and Natural Resources Fund | Annual Report 2017
| 19 |
Financial Highlights (continued)
| Year ended | Net asset value,
beginning of
period | Net
investment
income | Net
realized
and
unrealized
gain (loss) | Total from
investment
operations | Distributions
from net
investment
income | Distributions
from net
realized
gains |
| Class R5 |
| 8/31/2017 | $17.33 | 0.40 | 0.77 | 1.17 | (0.30) | — |
| 8/31/2016 | $16.35 | 0.41 | 0.57 | 0.98 | — | — |
| 8/31/2015 | $25.54 | 0.39 | (8.15) | (7.76) | — | (1.43) |
| 8/31/2014 | $21.53 | 0.37 | 4.19 | 4.56 | (0.24) | (0.31) |
| 8/31/2013 (h) | $20.25 | 0.34 | 1.00 | 1.34 | (0.06) | — |
| Class Y |
| 8/31/2017 (i) | $18.04 | 0.23 | (0.61) (j) | (0.38) | — | — |
| Class Z |
| 8/31/2017 | $16.97 | 0.35 | 0.76 | 1.11 | (0.29) | — |
| 8/31/2016 | $16.03 | 0.37 | 0.57 | 0.94 | — | — |
| 8/31/2015 | $25.12 | 0.33 | (7.99) | (7.66) | — | (1.43) |
| 8/31/2014 | $21.19 | 0.32 | 4.12 | 4.44 | (0.20) | (0.31) |
| 8/31/2013 | $20.13 | 0.28 | 0.88 | 1.16 | (0.10) | — |
| Notes to Financial Highlights |
| (a) | In addition to the fees and expenses that the Fund bears directly, the Fund indirectly bears a pro rata share of the fees and expenses of any other funds in which it invests. Such indirect expenses are not included in the Fund’s reported expense ratios. |
| (b) | Total net expenses include the impact of certain fee waivers/expense reimbursements made by the Investment Manager and certain of its affiliates, if applicable. |
| (c) | The benefits derived from expense reductions had an impact of less than 0.01%. |
| (d) | Ratios include line of credit interest expense which is less than 0.01%. |
| (e) | Rounds to zero. |
| (f) | Class R4 shares commenced operations on November 8, 2012. Per share data and total return reflect activity from that date. |
| (g) | Annualized. |
| (h) | Class R5 shares commenced operations on November 8, 2012. Per share data and total return reflect activity from that date. |
| (i) | Class Y shares commenced operations on March 1, 2017. Per share data and total return reflect activity from that date. |
| (j) | Calculation of the net gain (loss) per share (both realized and unrealized) does not correlate to the aggregate realized and unrealized gain (loss) presented in the Statement of Operations due to the timing of subscriptions and redemptions of Fund shares in relation to fluctuations in the market value of the portfolio. |
The accompanying Notes to Financial Statements are an integral part of this statement.
| 20 | Columbia Global Energy and Natural Resources Fund | Annual Report 2017 |
Total
distributions to
shareholders | Net
asset
value,
end of
period | Total
return | Total gross
expense
ratio to
average
net assets(a) | Total net
expense
ratio to
average
net assets(a),(b) | Net investment
income
ratio to
average
net assets | Portfolio
turnover | Net
assets,
end of
period
(000’s) |
| |
| (0.30) | $18.20 | 6.76% | 0.94% | 0.94% | 2.22% | 19% | $10,022 |
| — | $17.33 | 5.99% | 0.91% | 0.91% | 2.53% | 45% | $6,558 |
| (1.43) | $16.35 | (30.85%) | 0.89% | 0.89% | 1.97% | 51% | $4,978 |
| (0.55) | $25.54 | 21.53% | 0.87% | 0.87% | 1.58% | 34% | $4,578 |
| (0.06) | $21.53 | 6.63% | 0.88% (g) | 0.88% (g) | 2.02% (g) | 73% | $1,058 |
| |
| — | $17.66 | (2.11%) | 0.91% (g) | 0.91% (g) | 2.66% (g) | 19% | $17,163 |
| |
| (0.29) | $17.79 | 6.51% | 1.10% | 1.10% (c) | 1.98% | 19% | $87,719 |
| — | $16.97 | 5.86% | 1.09% | 1.09% (c) | 2.35% | 45% | $92,245 |
| (1.43) | $16.03 | (30.97%) | 1.07% | 1.07% (c) | 1.68% | 51% | $98,857 |
| (0.51) | $25.12 | 21.29% | 1.05% | 1.05% (c) | 1.36% | 34% | $174,759 |
| (0.10) | $21.19 | 5.80% | 1.07% (d) | 1.07% (c),(d) | 1.35% | 73% | $186,303 |
Columbia Global Energy and Natural Resources Fund | Annual Report 2017
| 21 |
Notes to Financial Statements
August 31, 2017
Note 1. Organization
Columbia Global Energy and Natural Resources Fund (the Fund), a series of Columbia Funds Series Trust I (the Trust), is a non-diversified fund. The Trust is registered under the Investment Company Act of 1940, as amended (the 1940 Act), as an open-end management investment company organized as a Massachusetts business trust.
Fund shares
The Trust may issue an unlimited number of shares (without par value). Although all share classes generally have identical voting, dividend and liquidation rights, each share class votes separately when required by the Trust’s organizational documents or by law. Different share classes pay different distribution amounts to the extent the expenses of such share classes differ, and distributions in liquidation will be proportional to the net asset value of each share class. Each share class has its own expense and sales charge structure. The Fund offers each of the share classes identified below.
Class A shares are subject to a maximum front-end sales charge of 5.75% based on the initial investment amount. Class A shares purchased without an initial sales charge in accounts aggregating $1 million to $50 million at the time of purchase are subject to a contingent deferred sales charge (CDSC) if the shares are sold within 18 months after purchase, charged as follows: 1.00% CDSC if redeemed within 12 months after purchase, and 0.50% CDSC if redeemed more than 12, but less than 18, months after purchase.
Class B shares of the Fund are no longer offered for sale. When available, Class B shares were subject to a maximum CDSC of 5.00% based upon the holding period after purchase. Effective July 17, 2017, Class B shares were automatically converted to Class A shares without a CDSC. On August 4, 2017, the capital owned by Columbia Management Investment Advisers, LLC in Class B shares was redeemed without a CDSC.
Class C shares are subject to a 1.00% CDSC on shares redeemed within 12 months after purchase.
The Fund no longer accepts investments by new or existing investors in Class I shares. Class I shares, when available, were not subject to sales charges, and were made available only to the Columbia Family of Funds. On March 27, 2017, Class I shares were redeemed or exchanged for Class Y shares of the Fund in a tax free transaction that had no impact on the fees and expenses paid by shareholders.
Class K shares are not subject to sales charges; however, this share class is closed to new investors.
Class R shares are not subject to sales charges and are generally available only to certain retirement plans and other investors as described in the Fund’s prospectus.
Class R4 shares are not subject to sales charges and are generally available only to omnibus retirement plans and certain investors as described in the Fund’s prospectus. Effective November 1, 2017, Class R4 shares will be renamed Advisor Class shares.
Class R5 shares are not subject to sales charges and are generally available only to investors purchasing through authorized investment professionals and omnibus retirement plans as described in the Fund’s prospectus. Effective November 1, 2017, Class R5 shares will be renamed Institutional 2 Class shares.
Class Y shares are not subject to sales charges and are available to institutional and certain other investors as described in the Fund’s prospectus. Class Y shares commenced operations on March 1, 2017. Effective November 1, 2017, Class Y shares will be renamed Institutional 3 Class shares.
Class Z shares are not subject to sales charges and are generally available only to eligible investors, which are subject to different investment minimums as described in the Fund’s prospectus. Effective November 1, 2017, Class Z shares will be renamed Institutional Class shares.
| 22 | Columbia Global Energy and Natural Resources Fund | Annual Report 2017 |
Notes to Financial Statements (continued)
August 31, 2017
Note 2. Summary of significant accounting policies
Basis of preparation
The Fund is an investment company that applies the accounting and reporting guidance in the Financial Accounting Standards Board (FASB) Accounting Standards Codification Topic 946, Financial Services - Investment Companies (ASC 946). The financial statements are prepared in accordance with U.S. generally accepted accounting principles (GAAP), which requires management to make certain estimates and assumptions that affect the reported amounts of assets and liabilities, the disclosure of contingent assets and liabilities at the date of the financial statements and the reported amounts of income and expenses during the reporting period. Actual results could differ from those estimates.
The following is a summary of significant accounting policies followed by the Fund in the preparation of its financial statements.
Security valuation
All equity securities and exchange-traded funds are valued at the close of business of the New York Stock Exchange. Equity securities and exchange-traded funds are valued at the last quoted sales price on the principal exchange or market on which they trade, except for securities traded on the NASDAQ Stock Market, which are valued at the NASDAQ official close price. Unlisted securities or listed securities for which there were no sales during the day are valued at the mean of the latest quoted bid and ask prices on such exchanges or markets.
Foreign equity securities are valued based on the closing price on the foreign exchange in which such securities are primarily traded. If any foreign equity security closing prices are not readily available, the securities are valued at the mean of the latest quoted bid and ask prices on such exchanges or markets. Foreign currency exchange rates are generally determined at 4:00 p.m. Eastern (U.S.) time. Many securities markets and exchanges outside the U.S. close prior to the close of the New York Stock Exchange; therefore, the closing prices for securities in such markets or on such exchanges may not fully reflect events that occur after such close but before the close of the New York Stock Exchange. In those situations, foreign securities will be fair valued pursuant to a policy adopted by the Board of Trustees, including, if available, utilizing a third party pricing service to determine these fair values. The third party pricing service takes into account multiple factors, including, but not limited to, movements in the U.S. securities markets, certain depositary receipts, futures contracts and foreign exchange rates that have occurred subsequent to the close of the foreign exchange or market, to determine a good faith estimate that reasonably reflects the current market conditions as of the close of the New York Stock Exchange. The fair value of a security is likely to be different from the quoted or published price, if available.
Investments in open-end investment companies, including money market funds, are valued at their latest net asset value.
Investments for which market quotations are not readily available, or that have quotations which management believes are not reflective of market value or reliable, are valued at fair value as determined in good faith under procedures approved by and under the general supervision of the Board of Trustees. If a security or class of securities (such as foreign securities) is valued at fair value, such value is likely to be different from the quoted or published price for the security.
The determination of fair value often requires significant judgment. To determine fair value, management may use assumptions including but not limited to future cash flows and estimated risk premiums. Multiple inputs from various sources may be used to determine fair value.
GAAP requires disclosure regarding the inputs and valuation techniques used to measure fair value and any changes in valuation inputs or techniques. In addition, investments shall be disclosed by major category. This information is disclosed following the Fund’s Portfolio of Investments.
Foreign currency transactions and translations
The values of all assets and liabilities denominated in foreign currencies are generally translated into U.S. dollars at exchange rates determined at the close of regular trading on the New York Stock Exchange. Net realized and unrealized gains (losses) on foreign currency transactions and translations include gains (losses) arising from the fluctuation in exchange
Columbia Global Energy and Natural Resources Fund | Annual Report 2017
| 23 |
Notes to Financial Statements (continued)
August 31, 2017
rates between trade and settlement dates on securities transactions, gains (losses) arising from the disposition of foreign currency and currency gains (losses) between the accrual and payment dates on dividends, interest income and foreign withholding taxes.
For financial statement purposes, the Fund does not distinguish that portion of gains (losses) on investments which is due to changes in foreign exchange rates from that which is due to changes in market prices of the investments. Such fluctuations are included with the net realized and unrealized gains (losses) on investments in the Statement of Operations.
Security transactions
Security transactions are accounted for on the trade date. Cost is determined and gains (losses) are based upon the specific identification method for both financial statement and federal income tax purposes.
Income recognition
Corporate actions and dividend income are generally recorded net of any non-reclaimable tax withholdings, on the ex-dividend date or upon receipt of ex-dividend notification in the case of certain foreign securities.
The Fund may receive distributions from holdings in equity securities, business development companies (BDCs), exchange-traded funds (ETFs), limited partnerships (LPs), other regulated investment companies (RICs), and real estate investment trusts (REITs), which report information on the tax character of their distributions annually. These distributions are allocated to dividend income, capital gain and return of capital based on actual information reported. Return of capital is recorded as a reduction of the cost basis of securities held. If the Fund no longer owns the applicable securities, return of capital is recorded as a realized gain. With respect to REITs, to the extent actual information has not yet been reported, estimates for return of capital are made by the Fund’s management. Management’s estimates are subsequently adjusted when the actual character of the distributions is disclosed by the REITs, which could result in a proportionate change in return of capital to shareholders.
Awards from class action litigation are recorded as a reduction of cost basis if the Fund still owns the applicable securities on the payment date. If the Fund no longer owns the applicable securities, the proceeds are recorded as realized gains.
Expenses
General expenses of the Trust are allocated to the Fund and other funds of the Trust based upon relative net assets or other expense allocation methodologies determined by the nature of the expense. Expenses directly attributable to the Fund are charged to the Fund. Expenses directly attributable to a specific class of shares are charged to that share class.
Determination of class net asset value
All income, expenses (other than class-specific expenses, which are charged to that share class, as shown in the Statement of Operations) and realized and unrealized gains (losses) are allocated to each class of the Fund on a daily basis, based on the relative net assets of each class, for purposes of determining the net asset value of each class.
Federal income tax status
The Fund intends to qualify each year as a regulated investment company under Subchapter M of the Internal Revenue Code, as amended, and will distribute substantially all of its taxable income (including net short-term capital gains) and capital gains, if any, for its tax year, and as such will not be subject to federal income taxes. In addition, the Fund intends to distribute in each calendar year substantially all of its net investment income, capital gains and certain other amounts, if any, such that the Fund should not be subject to federal excise tax. Therefore, no federal income or excise tax provision is recorded.
Foreign taxes
The Fund may be subject to foreign taxes on income, gains on investments or currency repatriation, a portion of which may be recoverable. The Fund will accrue such taxes and recoveries, as applicable, based upon its current interpretation of tax rules and regulations that exist in the markets in which it invests.
| 24 | Columbia Global Energy and Natural Resources Fund | Annual Report 2017 |
Notes to Financial Statements (continued)
August 31, 2017
Realized gains in certain countries may be subject to foreign taxes at the Fund level, based on statutory rates. The Fund accrues for such foreign taxes on realized and unrealized gains at the appropriate rate for each jurisdiction, as applicable. The amount, if any, is disclosed as a liability on the Statement of Assets and Liabilities.
Distributions to shareholders
Distributions from net investment income, if any, are declared and paid each calendar quarter. Net realized capital gains, if any, are distributed at least annually. Income distributions and capital gain distributions are determined in accordance with federal income tax regulations, which may differ from GAAP.
Guarantees and indemnifications
Under the Trust’s organizational documents and, in some cases, by contract, its officers and trustees are indemnified against certain liabilities arising out of the performance of their duties to the Trust or its funds. In addition, certain of the Fund’s contracts with its service providers contain general indemnification clauses. The Fund’s maximum exposure under these arrangements is unknown since the amount of any future claims that may be made against the Fund cannot be determined, and the Fund has no historical basis for predicting the likelihood of any such claims.
Recent accounting pronouncement
Accounting Standards Update 2017-08 Premium Amortization on Purchased Callable Debt Securities
In March 2017, the Financial Accounting Standards Board issued Accounting Standards Update (ASU) No. 2017-08 Premium Amortization on Purchased Callable Debt Securities. ASU No. 2017-08 updates the accounting standards to shorten the amortization period for certain purchased callable debt securities, held at a premium, to be amortized to the earliest call date. The update applies to securities with explicit, noncontingent call features that are callable at fixed prices and on preset dates. The standard is effective for annual periods beginning after December 15, 2018 and interim periods within those fiscal years. At this time, management is evaluating the implication of this guidance and the impact it will have on the financial statement amounts and footnote disclosures, if any.
Note 3. Fees and other transactions with affiliates
Management services fees
The Fund has entered into a Management Agreement with Columbia Management Investment Advisers, LLC (the Investment Manager), a wholly-owned subsidiary of Ameriprise Financial, Inc. (Ameriprise Financial). Under the Management Agreement, the Investment Manager provides the Fund with investment research and advice, as well as administrative and accounting services. The management services fee is an annual fee that is equal to a percentage of the Fund’s daily net assets that declines from 0.75% to 0.58% as the Fund’s net assets increase. The effective management services fee rate for the year ended August 31, 2017 was 0.75% of the Fund’s average daily net assets.
Compensation of board members
Members of the Board of Trustees, who are not officers or employees of the Investment Manager or Ameriprise Financial, are compensated for their services to the Fund as disclosed in the Statement of Operations. These members of the Board of Trustees may participate in a Deferred Compensation Plan (the Plan) which may be terminated at any time. Obligations of the Plan will be paid solely out of the Fund’s assets, and all amounts payable under the Plan constitute a general unsecured obligation of the Fund.
Compensation of Chief Compliance Officer
The Board of Trustees has appointed a Chief Compliance Officer to the Fund in accordance with federal securities regulations. A portion of the Chief Compliance Officer’s total compensation is allocated to the Fund, along with other affiliated funds governed by the Board of Trustees, based on relative net assets. The total amount allocated to all affiliated funds governed by the Board of Trustees will not exceed $40,000 annually.
Columbia Global Energy and Natural Resources Fund | Annual Report 2017
| 25 |
Notes to Financial Statements (continued)
August 31, 2017
Transfer agency fees
Under a Transfer and Dividend Disbursing Agent Agreement, Columbia Management Investment Services Corp. (the Transfer Agent), an affiliate of the Investment Manager and a wholly-owned subsidiary of Ameriprise Financial, is responsible for providing transfer agency services to the Fund. The Transfer Agent has contracted with Boston Financial Data Services (BFDS) to serve as sub-transfer agent. The Transfer Agent pays the fees of BFDS for services as sub-transfer agent and BFDS is not entitled to reimbursement for such fees from the Fund (with the exception of out-of-pocket fees).
The Fund pays the Transfer Agent a monthly transfer agency fee based on the number or the average value of accounts, depending on the type of account. In addition, prior to October 1, 2016, the Transfer Agent also received sub-transfer agency fees based on a percentage of the average aggregate value of the Fund’s shares maintained in omnibus accounts (other than omnibus accounts for which American Enterprise Investment Services Inc. is the broker of record or accounts where the beneficial shareholder is a customer of Ameriprise Financial Services, Inc., for which the Transfer Agent receives a per account fee). Effective October 1, 2016, the Fund pays the Transfer Agent a fee for shareholder services based on the number of accounts or on a percentage of the average aggregate value of the Fund’s shares maintained in omnibus accounts up to the lesser of the amount charged by the financial intermediary or a cap established by the Board of Trustees from time to time.
The Transfer Agent also receives compensation from the Fund for various shareholder services and reimbursements for certain out-of-pocket fees. Effective August 1, 2017, total transfer agency fees for Class K, Class R5 and Class Y shares are subject to an annual limitation of not more than 0.07%, 0.07% and 0.02%, respectively, of the average daily net assets attributable to each share class. From January 1, 2017 to July 31, 2017, these limitations were 0.075% for Class K and Class R5 shares and 0.025% for Class I and Class Y shares; and prior to January 1, 2017, the limitation was 0.05% for Class K and Class R5 shares and Class I shares did not pay transfer agency fees.
For the year ended August 31, 2017, the Fund’s effective transfer agency fee rates as a percentage of average daily net assets of each class were as follows:
| | Effective rate (%) |
| Class A | 0.22 |
| Class B | 0.21 (a),(b) |
| Class C | 0.22 |
| Class I | 0.00 (b),(c) |
| Class K | 0.07 |
| Class R | 0.22 |
| Class R4 | 0.22 |
| Class R5 | 0.06 |
| Class Y | 0.01 (d) |
| Class Z | 0.22 |
| (a) | Effective July 17, 2017, Class B shares were automatically converted to Class A shares. |
| (b) | Unannualized. |
| (c) | Effective March 27, 2017, Class I shares were redeemed or exchanged for Class Y shares. |
| (d) | Annualized. |
An annual minimum account balance fee of $20 may apply to certain accounts with a value below the applicable share class’s initial minimum investment requirements to reduce the impact of small accounts on transfer agency fees. These minimum account balance fees are remitted to the Fund and recorded as part of expense reductions in the Statement of Operations. For the year ended August 31, 2017, these minimum account balance fees reduced total expenses of the Fund by $2,328.
Plan administration fees
Under a Plan Administration Services Agreement with the Transfer Agent, the Fund pays an annual fee at a rate of 0.25% of the Fund’s average daily net assets attributable to Class K shares for the provision of various administrative, recordkeeping, communication and educational services.
| 26 | Columbia Global Energy and Natural Resources Fund | Annual Report 2017 |
Notes to Financial Statements (continued)
August 31, 2017
Distribution and service fees
The Fund has entered into an agreement with Columbia Management Investment Distributors, Inc. (the Distributor), an affiliate of the Investment Manager and a wholly-owned subsidiary of Ameriprise Financial, for distribution and shareholder services. The Board of Trustees has approved, and the Fund has adopted, distribution and shareholder service plans (the Plans) applicable to certain share classes, which set the distribution and service fees for the Fund. These fees are calculated daily and are intended to compensate the Distributor and/or eligible selling and/or servicing agents for selling shares of the Fund and providing services to investors.
Under the Plans, the Fund pays a monthly service fee to the Distributor at the maximum annual rate of 0.25% of the average daily net assets attributable to Class A, Class B and Class C shares of the Fund. Also under the Plans, the Fund pays a monthly distribution fee to the Distributor at the maximum annual rates of 0.75%, 0.75% and 0.50% of the average daily net assets attributable to Class B, Class C and Class R shares of the Fund, respectively. As a result of all Class B shares of the Fund being redeemed or converted to Class A shares, August 4, 2017 was the last day the Fund paid a service fee or distribution fee for Class B shares.
Sales charges (unaudited)
Sales charges, including front-end charges and CDSCs, received by the Distributor for distributing Fund shares for the year ended August 31, 2017, if any, are listed below:
| | Amount ($) |
| Class A | 91,357 |
| Class C | 1,247 |
Expenses waived/reimbursed by the Investment Manager and its affiliates
The Investment Manager and certain of its affiliates have contractually agreed to waive fees and/or reimburse expenses (excluding certain fees and expenses described below) for the period(s) disclosed below, unless sooner terminated at the sole discretion of the Board of Trustees, so that the Fund’s net operating expenses, after giving effect to fees waived/expenses reimbursed and any balance credits and/or overdraft charges from the Fund’s custodian, do not exceed the following annual rate(s) as a percentage of the class’ average daily net assets:
| | January 1, 2017
through
December 31, 2017 | Prior to
January 1, 2017 |
| Class A | 1.43% | 1.51% |
| Class C | 2.18 | 2.26 |
| Class K | 1.345 | 1.39 |
| Class R | 1.68 | 1.76 |
| Class R4 | 1.18 | 1.26 |
| Class R5 | 1.095 | 1.14 |
| Class Y | 1.045* | – |
| Class Z | 1.18 | 1.26 |
* Effective March 1, 2017 (inception) throughout December 31, 2017.
Under the agreement governing these fee waivers and/or expense reimbursement arrangements, the following fees and expenses are excluded from the waiver/reimbursement commitment, and therefore will be paid by the Fund, if applicable: taxes (including foreign transaction taxes), expenses associated with investments in affiliated and non-affiliated pooled investment vehicles (including mutual funds and exchange-traded funds), transaction costs and brokerage commissions, costs related to any securities lending program, dividend expenses associated with securities sold short, inverse floater program fees and expenses, transaction charges and interest on borrowed money, interest, infrequent and/or unusual expenses and any other expenses the exclusion of which is specifically approved by the Board of Trustees. This agreement may be modified or amended only with approval from the Investment Manager, certain of its affiliates and the Fund. Any fees waived and/or expenses reimbursed under the expense reimbursement arrangements described above are not recoverable by the Investment Manager or its affiliates in future periods.
Columbia Global Energy and Natural Resources Fund | Annual Report 2017
| 27 |
Notes to Financial Statements (continued)
August 31, 2017
Note 4. Federal tax information
The timing and character of income and capital gain distributions are determined in accordance with income tax regulations, which may differ from GAAP because of temporary or permanent book to tax differences.
At August 31, 2017, these differences are primarily due to differing treatment for deferral/reversal of wash sale losses, tax straddles, capital loss carryforwards, trustees’ deferred compensation, foreign currency transactions and investments in partnerships. To the extent these differences are permanent, reclassifications are made among the components of the Fund’s net assets in the Statement of Assets and Liabilities. Temporary differences do not require reclassifications.
In the Statement of Assets and Liabilities the following reclassifications were made:
Undistributed net
investment
income ($) | Accumulated
net realized
(loss) ($) | Paid in
capital ($) |
| 42,997 | (42,958) | (39) |
Net investment income (loss) and net realized gains (losses), as disclosed in the Statement of Operations, and net assets were not affected by this reclassification.
| August 31, 2017 | August 31, 2016 |
Ordinary
income ($) | Long-term
capital gains ($) | Total ($) | Ordinary
income ($) | Long-term
capital gains ($) | Total ($) |
| 3,806,267 | — | 3,806,267 | — | — | — |
Short-term capital gain distributions, if any, are considered ordinary income distributions for tax purposes.
At August 31, 2017, the components of distributable earnings on a tax basis were as follows:
Undistributed
ordinary income ($) | Undistributed
long-term
capital gains ($) | Capital loss
carryforwards ($) | Net unrealized
appreciation ($) |
| 1,234,060 | — | (33,763,919) | 20,190,264 |
At August 31, 2017, the cost of all investments for federal income tax purposes along with the aggregate gross unrealized appreciation and depreciation based on that cost was:
Federal
tax cost ($) | Gross unrealized
appreciation ($) | Gross unrealized
(depreciation) ($) | Net unrealized
appreciation ($) |
| 201,736,719 | 31,945,686 | (11,755,422) | 20,190,264 |
Tax cost of investments and unrealized appreciation/(depreciation) may also include timing differences that do not constitute adjustments to tax basis.
The following capital loss carryforwards, determined at August 31, 2017, may be available to reduce taxable income arising from future net realized gains on investments, if any, to the extent permitted by the Internal Revenue Code. Capital loss carryforwards with no expiration are required to be utilized prior to any capital losses which carry an expiration date. As a result of this ordering rule, capital loss carryforwards which carry an expiration date may be more likely to expire unused. In addition, for the year ended August 31, 2017, capital loss carryforwards utilized, expired unused and permanently lost, if any, were as follows:
| 2018 ($) | 2019 ($) | No expiration
short-term ($) | No expiration
long-term ($) | Total ($) | Utilized ($) | Expired ($) | Permanently
lost ($) |
| — | — | 3,003,362 | 30,760,557 | 33,763,919 | — | — | — |
| 28 | Columbia Global Energy and Natural Resources Fund | Annual Report 2017 |
Notes to Financial Statements (continued)
August 31, 2017
Management of the Fund has concluded that there are no significant uncertain tax positions in the Fund that would require recognition in the financial statements. However, management’s conclusion may be subject to review and adjustment at a later date based on factors including, but not limited to, new tax laws, regulations, and administrative interpretations (including relevant court decisions). Generally, the Fund’s federal tax returns for the prior three fiscal years remain subject to examination by the Internal Revenue Service.
Note 5. Portfolio information
The cost of purchases and proceeds from sales of securities, excluding short-term investments and derivatives, if any, aggregated to $45,952,032 and $78,625,043, respectively, for the year ended August 31, 2017. The amount of purchase and sale activity impacts the portfolio turnover rate reported in the Financial Highlights.
Note 6. Affiliated money market fund
The Fund invests in Columbia Short-Term Cash Fund, an affiliated money market fund established for the exclusive use by the Fund and other affiliated funds (the Affiliated MMF). The income earned by the Fund from such investments is included as Dividends - affiliated issuers in the Statement of Operations. As an investing fund, the Fund indirectly bears its proportionate share of the expenses of the Affiliated MMF. Effective October 1, 2016, the Affiliated MMF prices its shares with a floating net asset value (NAV) and no longer seeks to maintain a stable NAV. In addition, the Board of Trustees of the Affiliated MMF may impose a fee on redemptions (sometimes referred to as a liquidity fee) or temporarily suspend redemptions (sometimes referred to as imposing a redemption gate) in the event its liquidity falls below regulatory limits.
Note 7. Line of credit
The Fund has access to a revolving credit facility with a syndicate of banks led by Citibank, N.A., HSBC Bank USA, N.A. and JPMorgan Chase Bank, N.A. whereby the Fund may borrow for the temporary funding of shareholder redemptions or for other temporary or emergency purposes. The credit facility, which is a collective agreement between the Fund and certain other funds managed by the Investment Manager, severally and not jointly, permits collective borrowings up to $1 billion. Interest is charged to each participating fund based on its borrowings at a rate equal to the higher of (i) the overnight federal funds rate plus 1.00% or (ii) the one-month LIBOR rate plus 1.00%. Each borrowing under the credit facility matures no later than 60 days after the date of borrowing. The Fund also pays a commitment fee equal to its pro rata share of the amount of the credit facility at a rate of 0.15% per annum. The commitment fee is included in other expenses in the Statement of Operations.
The Fund had no borrowings during the year ended August 31, 2017.
Note 8. Significant risks
Energy sector risk
The Fund may be more susceptible to the particular risks that may affect companies in the energy sector than if it were invested in a wider variety of companies in unrelated sectors. Companies in the energy sector are subject to certain risks, including legislative or regulatory changes, adverse market conditions and increased competition. Performance of such companies may be affected by factors including, among others, fluctuations in energy prices and supply and demand of energy fuels, energy conservation, the success of exploration projects, events occurring in nature and local and international politics. In addition, rising interest rates and high inflation may affect the demand for certain natural resources and, therefore, the performance of companies in the energy sector.
Foreign securities and emerging market countries risk
Investing in foreign securities may include certain risks and considerations not typically associated with investing in U.S. securities, such as fluctuating currency values and changing local and regional economic, political and social conditions, which may result in greater market volatility. In addition, certain foreign securities may not be as liquid as U.S. securities. Investing in emerging markets may accentuate these risks. These countries are also more likely to experience high levels of inflation, deflation or currency devaluation which could hurt their economies and securities markets. To the extent that the
Columbia Global Energy and Natural Resources Fund | Annual Report 2017
| 29 |
Notes to Financial Statements (continued)
August 31, 2017
Fund concentrates its investment exposure to any one or a few specific countries, the Fund will be particularly susceptible to the various conditions, events or other factors impacting those countries and may, therefore, have a greater risk than that of a fund which is more geographically diversified.
Materials sector risk
The Fund may be more susceptible to the particular risks that may affect companies in the materials sector than if it were invested in a wider variety of companies in unrelated sectors. Companies in the materials sector are subject to certain risks, including that many materials companies are significantly affected by the level and volatility of commodity prices, exchange rates, import controls, worldwide competition, environmental policies and consumer demand. Performance of such companies may be affected by factors including, among others, that at times worldwide production of industrial materials has exceeded demand as a result of over-building or economic downturns, leading to poor investment returns or losses. Other risks may include liabilities for environmental damage and general civil liabilities, depletion of resources, and mandated expenditures for safety and pollution control. The materials sector may also be affected by economic cycles, technical progress, labor relations, and government regulations.
Non-diversification risk
A non-diversified fund is permitted to invest a greater percentage of its total assets in fewer issuers than a diversified fund. The Fund may, therefore, have a greater risk of loss from a few issuers than a similar fund that invests more broadly.
Shareholder concentration risk
At August 31, 2017, one unaffiliated shareholder of record owned 14.8% of the outstanding shares of the Fund in one or more accounts. The Fund has no knowledge about whether any portion of those shares was owned beneficially. Affiliated shareholders of record owned 36.3% of the outstanding shares of the Fund in one or more accounts. Subscription and redemption activity by concentrated accounts may have a significant effect on the operations of the Fund. In the case of a large redemption, the Fund may be forced to sell investments at inopportune times, including its liquid positions, which may result in Fund losses and the Fund holding a higher percentage of less liquid positions. Large redemptions could result in decreased economies of scale and increased operating expenses for non-redeeming Fund shareholders.
Note 9. Subsequent events
Management has evaluated the events and transactions that have occurred through the date the financial statements were issued. Other than as noted in Note 1 above, there were no items requiring adjustment of the financial statements or additional disclosure.
Note 10. Information regarding pending and settled legal proceedings
Ameriprise Financial and certain of its affiliates have historically been involved in a number of legal, arbitration and regulatory proceedings, including routine litigation, class actions, and governmental actions, concerning matters arising in connection with the conduct of their business activities. Ameriprise Financial believes that the Fund is not currently the subject of, and that neither Ameriprise Financial nor any of its affiliates are the subject of, any pending legal, arbitration or regulatory proceedings that are likely to have a material adverse effect on the Fund or the ability of Ameriprise Financial or its affiliates to perform under their contracts with the Fund. Ameriprise Financial is required to make quarterly (10-Q), annual (10-K) and, as necessary, 8-K filings with the Securities and Exchange Commission (SEC) on legal and regulatory matters that relate to Ameriprise Financial and its affiliates. Copies of these filings may be obtained by accessing the SEC website at www.sec.gov.
There can be no assurance that these matters, or the adverse publicity associated with them, will not result in increased Fund redemptions, reduced sale of Fund shares or other adverse consequences to the Fund. Further, although we believe proceedings are not likely to have a material adverse effect on the Fund or the ability of Ameriprise Financial or its affiliates to perform under their contracts with the Fund, these proceedings are subject to uncertainties and, as such, we are unable to estimate the possible loss or range of loss that may result. An adverse outcome in one or more of these proceedings could result in adverse judgments, settlements, fines, penalties or other relief that could have a material adverse effect on the consolidated financial condition or results of operations of Ameriprise Financial.
| 30 | Columbia Global Energy and Natural Resources Fund | Annual Report 2017 |
Report of Independent Registered Public Accounting Firm
To the Trustees of Columbia Funds Series Trust I and the Shareholders of Columbia Global Energy And Natural Resources Fund
In our opinion, the accompanying statement of assets and liabilities, including the portfolio of investments, and the related statements of operations and of changes in net assets and the financial highlights present fairly, in all material respects, the financial position of Columbia Global Energy and Natural Resources Fund (the “Fund”, a series of Columbia Funds Series Trust I) as of August 31, 2017, the results of its operations for the year then ended, the changes in its net assets for each of the two years in the period then ended and the financial highlights for each of the five years in the period then ended, in conformity with accounting principles generally accepted in the United States of America. These financial statements and financial highlights (hereafter referred to as “financial statements”) are the responsibility of the Fund’s management. Our responsibility is to express an opinion on these financial statements based on our audits. We conducted our audits of these financial statements in accordance with the standards of the Public Company Accounting Oversight Board (United States). Those standards require that we plan and perform the audit to obtain reasonable assurance about whether the financial statements are free of material misstatement. An audit includes examining, on a test basis, evidence supporting the amounts and disclosures in the financial statements, assessing the accounting principles used and significant estimates made by management, and evaluating the overall financial statement presentation. We believe that our audits, which included confirmation of securities as of August 31, 2017 by correspondence with the custodian and transfer agent provide a reasonable basis for our opinion.
/s/PricewaterhouseCoopers LLP
Minneapolis, MN
October 20, 2017
Columbia Global Energy and Natural Resources Fund | Annual Report 2017
| 31 |
Federal Income Tax Information
(Unaudited)
The Fund hereby designates the following tax attributes for the fiscal year ended August 31, 2017. Shareholders will be notified in early 2018 of the amounts for use in preparing 2017 income tax returns.
Qualified
dividend
income | Dividends
received
deduction |
| 100.00% | 85.06% |
Qualified dividend income. For taxable, non-corporate shareholders, the percentage of ordinary income distributed during the fiscal year that represents qualified dividend income subject to reduced tax rates.
Dividends received deduction. The percentage of ordinary income distributed during the fiscal year that qualifies for the corporate dividends received deduction.
| 32 | Columbia Global Energy and Natural Resources Fund | Annual Report 2017 |
Shareholders elect the Board that oversees the Fund’s operations. The Board appoints officers who are responsible for day-to-day business decisions based on policies set by the Board. The following table provides basic biographical information about the Fund’s Trustees, including their principal occupations during the past five years, although specific titles for individuals may have varied over the period. The year set forth beneath Length of Service in the table below is the year in which the Trustee was first appointed or elected as Trustee to any Fund currently in the Columbia Funds Complex or a predecessor thereof. Under current Board policy, members serve terms of indefinite duration.
Independent trustees
| Name, address, year of birth | Position held with the Trust and length of service | Principal occupation(s) during the past five years and other relevant professional experience | Number of Funds in the Columbia Fund Complex overseen | Other directorships held by Trustee during the past five years |
Janet Langford Carrig
c/o Columbia Management
Investment Advisers, LLC
225 Franklin Street
Mail Drop BX32 05228
Boston, MA 02110
1957 | Trustee
1996 | Senior Vice President, General Counsel and Corporate Secretary, ConocoPhillips (independent energy company) since September 2007 | 57 | None |
Douglas A. Hacker
c/o Columbia Management
Investment Advisers, LLC
225 Franklin Street
Mail Drop BX32 05228
Boston, MA 02110
1955 | Trustee and Chairman of the Board
1996 | Independent business executive since May 2006; Executive Vice President — Strategy of United Airlines from December 2002 to May 2006; President of UAL Loyalty Services (airline marketing company) from September 2001 to December 2002; Executive Vice President and Chief Financial Officer of United Airlines from July 1999 to September 2001 | 57 | Spartan Nash Company, (food distributor); Nash Finch Company (food distributor) from 2005 to 2013; Aircastle Limited (aircraft leasing); SeaCube Container Leasing Ltd. (container leasing) from 2010 to 2013; and Travelport Worldwide Limited (travel information technology) |
Nancy T. Lukitsh
c/o Columbia Management
Investment Advisers, LLC
225 Franklin Street
Mail Drop BX32 05228
Boston, MA 02110
1956 | Trustee
2011 | Senior Vice President, Partner and Director of Marketing, Wellington Management Company, LLP (investment adviser) from 1997 to 2010; Chair, Wellington Management Portfolios (commingled non-U.S. investment pools) from 2007 to 2010; Director, Wellington Trust Company, NA and other Wellington affiliates from 1997 to 2010 | 57 | None |
David M. Moffett
c/o Columbia Management
Investment Advisers, LLC
225 Franklin Street
Mail Drop BX32 05228
Boston, MA 02110
1952 | Trustee
2011 | Retired. Consultant to Bridgewater and Associates | 57 | Director, CSX Corporation; Genworth Financial, Inc. (financial and insurance products and services); PayPal Holdings Inc. (payment and data processing services); Trustee, University of Oklahoma Foundation; former Director, eBay Inc. (online trading community), 2007-2015; and former Director, CIT Bank, CIT Group Inc. (commercial and consumer finance), 2010-2016 |
Columbia Global Energy and Natural Resources Fund | Annual Report 2017
| 33 |
TRUSTEES AND OFFICERS (continued)
Independent trustees (continued)
| Name, address, year of birth | Position held with the Trust and length of service | Principal occupation(s) during the past five years and other relevant professional experience | Number of Funds in the Columbia Fund Complex overseen | Other directorships held by Trustee during the past five years |
Charles R. Nelson
c/o Columbia Management
Investment Advisers, LLC
225 Franklin Street
Mail Drop BX32 05228
Boston, MA 02110
1942 | Trustee
1981 | Retired. Professor Emeritus, University of Washington since 2011; Professor of Economics, University of Washington from 1976 to 2011; Ford and Louisa Van Voorhis Professor of Political Economy, University of Washington from 1993 to 2011; Adjunct Professor of Statistics, University of Washington from 1980 to 2011; Associate Editor, Journal of Money, Credit and Banking from September 1993 to 2008; consultant on econometric and statistical matters | 57 | None |
John J. Neuhauser
c/o Columbia Management
Investment Advisers, LLC
225 Franklin Street
Mail Drop BX32 05228
Boston, MA 02110
1943 | Trustee
1984 | President, Saint Michael’s College since August 2007; Director or Trustee of several non-profit organizations, including University of Vermont Medical Center; Academic Vice President and Dean of Faculties, Boston College from August 1999 to October 2005; University Professor, Boston College from November 2005 to August 2007 | 57 | Liberty All-Star Equity Fund and Liberty All- Star Growth Fund (closed-end funds) |
Patrick J. Simpson
c/o Columbia Management
Investment Advisers, LLC
225 Franklin Street
Mail Drop BX32 05228
Boston, MA 02110
1944 | Trustee
2000 | Of Counsel, Perkins Coie LLP (law firm) since 2015; Partner, Perkins Coie LLP from 1988 to 2014 | 57 | None |
Anne-Lee Verville
c/o Columbia Management
Investment Advisers, LLC
225 Franklin Street
Mail Drop BX32 05228
Boston, MA 02110
1945 | Trustee
1998 | Retired. General Manager, Global Education Industry from 1994 to 1997, President – Application Systems Division from 1991 to 1994, Chief Financial Officer – US Marketing & Services from 1988 to 1991, and Chief Information Officer from 1987 to 1988, IBM Corporation (computer and technology) | 57 | Enesco Group, Inc. (producer of giftware and home and garden decor products) from 2001 to 2006 |
| 34 | Columbia Global Energy and Natural Resources Fund | Annual Report 2017 |
TRUSTEES AND OFFICERS (continued)
Consultants to the Independent Trustees*
| Name, address, year of birth | Position held with the Trust and length of service | Principal occupation(s) during the past five years and other relevant professional experience | Number of Funds in the Columbia Funds complex overseen | Other directorships held by Trustee during the past five years |
J. Kevin Connaughton
c/o Columbia
Management Investment
Advisers, LLC,
225 Franklin Street
Mail Drop BX32 05228,
Boston, MA 02110
1964 | Independent Trustee Consultant
2016 | Independent Trustee Consultant, Columbia Funds since March 2016; Managing Director and General Manager of Mutual Fund Products, Columbia Management Investment Advisers, LLC from May 2010 to February 2015; President, Columbia Funds from 2009 to 2015; and senior officer of Columbia Funds and affiliated funds from 2003 to 2015 | 57 | Board of Governors, Gateway Healthcare since January 2016; Trustee, New Century Portfolios since March 2015; and Director, The Autism Project since March 2015 |
Natalie A. Trunow
c/o Columbia
Management Investment
Advisers, LLC,
225 Franklin Street
Mail Drop BX32 05228,
Boston, MA 02110
1967 | Independent Trustee Consultant
2016 | Independent Trustee Consultant, Columbia Funds since September 2016; Chief Executive Officer, Millennial Partners (investment consulting services to institutions) since January 2016; Director of Investments, Casey Family Programs from April 2016 to September 2016; Senior Vice President and Chief Investment Officer, Calvert Investments from August 2008 to January 2016; Section Head and Portfolio Manager, General Motors Asset Management from June 1997 to August 2008 | 57 | Healthcare Services for Children with Special Needs |
| * | J. Kevin Connaughton was appointed consultant to the Independent Trustees effective March 1, 2016. Natalie A. Trunow was appointed consultant to the Independent Trustees effective September 1, 2016. Shareholders of the Funds are expected to be asked to elect each of Mr. Connaughton and Ms. Trunow as a Trustee at a future shareholder meeting. |
Interested trustee affiliated with Investment Manager*
| Name, address, year of birth | Position held with the Trust and length of service | Principal occupation(s) during the past five years and other relevant professional experience | Number of Funds in the Columbia Funds Complex overseen | Other directorships held by Trustee during the past five years |
William F. Truscott
c/o Columbia Management
Investment Advisers, LLC
225 Franklin Street
Boston, MA 02110
1960 | Trustee
2012 | Chairman of the Board and President, Columbia Management Investment Advisers, LLC since May 2010 and February 2012, respectively; Chief Executive Officer, Global Asset Management, Ameriprise Financial, Inc. since September 2012 (previously Chief Executive Officer, U.S. Asset Management & President, Annuities, May 2010-September 2012); Director and Chief Executive Officer, Columbia Management Investment Distributors, Inc. since May 2010 and February 2012, respectively; Chairman of the Board and Chief Executive Officer, RiverSource Distributors, Inc. since 2006; Director, Threadneedle Asset Management Holdings, SARL since 2014; President and Chief Executive Officer, Ameriprise Certificate Company, 2006-August 2012 | 179 | Chairman of the Board, Columbia Management Investment Advisers, LLC since May 2010; Director, Columbia Management Investment Distributors, Inc. since May 2010; former Director, Ameriprise Certificate Company, 2006 - January 2013 |
| * | Interested person (as defined under the 1940 Act) by reason of being an officer, director, security holder and/or employee of the Investment Manager or Ameriprise Financial. |
The Statement of Additional Information has additional information about the Fund’s Board members and is available,
without charge, upon request by calling 800.345.6611, contacting your financial intermediary or visiting
investor.columbiathreadneedleus.com.
Columbia Global Energy and Natural Resources Fund | Annual Report 2017
| 35 |
TRUSTEES AND OFFICERS (continued)
The Board has appointed officers who are responsible for day-to-day business decisions based on policies it has established. The officers serve at the pleasure of the Board. The following table provides basic information about the Officers of the Fund, including principal occupations during the past five years, although their specific titles may have varied over the period. In addition to Mr. Truscott, who is Senior Vice President, the Fund’s other officers are:
Fund officers
Name,
address and
year of birth | Position and year
first appointed to
position for any Fund
in the Columbia
Funds complex or a
predecessor thereof | Principal occupation(s) during past five years |
Christopher O. Petersen
5228 Ameriprise
Financial Center
Minneapolis, MN 55474
Born 1970 | President and Principal Executive Officer (2015) | Vice President and Lead Chief Counsel, Ameriprise Financial, Inc. since January 2015 (previously, Vice President and Chief Counsel, January 2010 - December 2014; officer of Columbia Funds and affiliated funds since 2007. |
Michael G. Clarke
225 Franklin Street
Boston, MA 02110
Born 1969 | Treasurer (2011), Chief Financial Officer (2009) and Chief Accounting Officer (2015) | Vice President — Mutual Fund Administration, Columbia Management Investment Advisers, LLC, since May 2010; senior officer of Columbia Funds and affiliated funds since 2002. |
Paul B. Goucher
100 Park Avenue
New York, NY 10017
Born 1968 | Senior Vice President (2011) and Assistant Secretary (2008) | Senior Vice President and Assistant General Counsel, Ameriprise Financial, Inc. since January 2017 (previously Vice President and Lead Chief Counsel, November 2008 - January 2017 and January 2013 - January 2017, respectively; and Chief Counsel, January 2010 - January 2013); Vice President, Chief Legal Officer and Assistant Secretary, Columbia Management Investment Advisers, LLC since May 2010. |
Thomas P. McGuire
225 Franklin Street
Boston, MA 02110
Born 1972 | Senior Vice President and Chief Compliance Officer (2012) | Vice President — Asset Management Compliance, Ameriprise Financial, Inc., since May 2010; Chief Compliance Officer, Ameriprise Certificate Company since September 2010. |
Colin Moore
225 Franklin Street
Boston, MA 02110
Born 1958 | Senior Vice President (2010) | Executive Vice President and Global Chief Investment Officer, Ameriprise Financial, Inc., since July 2013; Executive Vice President and Global Chief Investment Officer, Columbia Management Investment Advisers, LLC since July 2013 (previously Director and Global Chief Investment Officer, 2010 - 2013). |
Ryan C. Larrenaga
225 Franklin Street
Boston, MA 02110
Born 1970 | Senior Vice President (2017), Chief Legal Officer (2017) and Secretary (2015) | Vice President and Group Counsel, Ameriprise Financial, Inc. since August 2011; officer of Columbia Funds and affiliated funds since 2005. |
Michael E. DeFao
225 Franklin Street
Boston, MA 02110
Born 1968 | Vice President (2011) and Assistant Secretary (2010) | Vice President and Chief Counsel, Ameriprise Financial, Inc. since May 2010. |
Amy Johnson
5228 Ameriprise
Financial Center
Minneapolis, MN 55474
Born 1965 | Vice President (2006) | Managing Director and Global Head of Operations, Columbia Management Investment Advisers, LLC since April 2016 (previously Managing Director and Chief Operating Officer, 2010 - 2016). |
Lyn Kephart-Strong
5228 Ameriprise
Financial Center
Minneapolis, MN 55474
Born 1960 | Vice President (2015) | President, Columbia Management Investment Services Corp. since October 2014; Vice President & Resolution Officer, Ameriprise Trust Company since August 2009. |
| 36 | Columbia Global Energy and Natural Resources Fund | Annual Report 2017 |
Board Consideration and Approval of Management
Agreement
On June 14, 2017, the Board of Trustees (the Board) and the Trustees who are not interested persons (as defined in the Investment Company Act of 1940) (the Independent Trustees) of Columbia Funds Series Trust I (the Trust) unanimously approved the continuation of the Management Agreement (the Management Agreement) with Columbia Management Investment Advisers, LLC (the Investment Manager) with respect to Columbia Global Energy and Natural Resources Fund (the Fund), a series of the Trust. As detailed below, the Board’s Advisory Fees and Expenses Committee (the Committee) and the Board met on multiple occasions to review and discuss, both among themselves and with the management team of the Investment Manager, materials provided by the Investment Manager and others before determining to approve the continuation of the Management Agreement.
In connection with their deliberations regarding the continuation of the Management Agreement, the Committee and the Board evaluated materials requested from the Investment Manager regarding the Fund and the Management Agreement, and discussed these materials with representatives of the Investment Manager at Committee meetings held on March 27, 2017, April 26, 2017 and June 13, 2017 and at Board meetings held on March 28, 2017 and June 14, 2017. In addition, the Board considers matters bearing on the Management Agreement at most of its other meetings throughout the year and meets regularly with senior management of the Trust and the Investment Manager. Through the Board’s Investment Oversight Committees, Trustees also meet with selected portfolio managers of the funds the Trustees oversee and other investment personnel at various times throughout the year. The Committee and the Board also consulted with its independent fee consultant, Fund counsel and the Independent Trustees’ independent legal counsel, who advised on various matters with respect to the Committee’s and the Board’s considerations and otherwise assisted the Committee and the Board in their deliberations. On June 13, 2017, the Committee recommended that the Board approve the continuation of the Management Agreement. On June 14, 2017, the Board, including the Independent Trustees, voting separately, unanimously approved the continuation of the Management Agreement for the Fund.
The Committee and the Board considered all information that they, their legal counsel or the Investment Manager believed reasonably necessary to evaluate and to determine whether to recommend for approval or approve the continuation of the Management Agreement. The information and factors considered by the Committee and the Board in recommending for approval or approving the continuation of the Management Agreement for the Fund included the following:
| • | Information on the investment performance of the Fund relative to the performance of a group of mutual funds determined to be comparable to the Fund by an independent third-party data provider, as well as performance relative to benchmarks; |
| • | Information on the Fund’s management fees and total expenses, including information comparing the Fund’s expenses to those of a group of comparable mutual funds, as determined by the independent third-party data provider; |
| • | The Investment Manager’s agreement to contractually limit or cap total operating expenses for the Fund through December 31, 2018 so that total operating expenses (excluding certain fees and expenses, such as transaction costs and certain other investment related expenses, interest, taxes, acquired fund fees and expenses, and infrequent and/or unusual expenses) would not exceed a specified annual rate, as a percentage of the Fund’s net assets; |
| • | The terms and conditions of the Management Agreement; |
| • | The current and proposed terms and conditions of other agreements and arrangements with affiliates of the Investment Manager relating to the operations of the Fund, including agreements with respect to the provision of distribution, transfer agency and shareholder services to the Fund; |
| • | Descriptions of various functions performed by the Investment Manager under the Management Agreement, including portfolio management and portfolio trading practices; |
| • | Information regarding the management fees of similarly-managed portfolios of other clients of the Investment Manager, including institutional separate accounts; |
| • | Information regarding the reputation, regulatory history and resources of the Investment Manager, including information regarding senior management, portfolio managers and other personnel; |
Columbia Global Energy and Natural Resources Fund | Annual Report 2017
| 37 |
Board Consideration and Approval of Management
Agreement (continued)
| • | Information regarding the capabilities of the Investment Manager with respect to compliance monitoring services, including an assessment of the Investment Manager’s compliance system by the Fund’s Chief Compliance Officer; and |
| • | The profitability to the Investment Manager and its affiliates from their relationships with the Fund. |
Nature, extent and quality of services provided under the Management Agreement
The Committee and the Board considered the nature, extent and quality of services provided to the Fund by the Investment Manager and its affiliates under the Management Agreement and under separate agreements for the provision of transfer agency and shareholder services, and the resources dedicated to the Fund and the other Columbia Funds by the Investment Manager and its affiliates. The Committee and the Board considered, among other things, the Investment Manager’s ability to attract, motivate and retain highly qualified research, advisory and supervisory investment professionals (including compensation programs for personnel involved in fund management, reputation and other attributes), the portfolio management services provided by those investment professionals, and the quality of the Investment Manager’s investment research capabilities and trade execution services. The Committee and the Board also considered the potential benefits to shareholders of investing in a mutual fund that is part of a fund complex offering exposure to a variety of asset classes and investment disciplines and providing a variety of fund and shareholder services.
The Committee and the Board also considered the professional experience and qualifications of the senior personnel of the Investment Manager, which included consideration of the Investment Manager’s experience with similarly-structured funds. The Committee and the Board noted the compliance programs of and the compliance-related resources provided to the Fund by the Investment Manager and its affiliates, and considered the Investment Manager’s ability to provide administrative services to the Fund and coordinate the activities of the Fund’s other service providers. After reviewing these and related factors, the Committee and the Board concluded, within the context of their overall conclusions, that the nature, extent and quality of the services provided to the Fund under the Management Agreement supported the continuation of the Management Agreement.
Investment performance
The Committee and the Board reviewed information about the performance of the Fund over various time periods, including performance information relative to benchmarks and information that compared the performance of the Fund to the performance of a group of comparable mutual funds as determined by the independent third-party data provider, and data provided by the independent fee consultant. The Committee and the Board also reviewed a description of the third party’s methodology for identifying the Fund’s peer groups for purposes of performance and expense comparisons.
The Committee and the Board noted that, through December 31, 2016, the Fund’s performance was in the fiftieth, sixteenth and twenty-first percentile (where the best performance would be in the first percentile) of its category selected by the independent third-party data provider for the purposes of performance comparisons for the one-, three- and five-year periods, respectively.
The Committee and the Board also considered the Investment Manager’s performance and reputation generally, the Investment Manager’s historical responsiveness to Board concerns about performance, and the Investment Manager’s willingness to take steps intended to improve performance. After reviewing these and related factors, the Committee and the Board concluded, within the context of their overall conclusions, that the performance of the Fund and the Investment Manager was sufficient, in light of other considerations, to warrant the continuation of the Management Agreement.
Investment management fee rates and other expenses
The Committee and the Board considered the management fees charged to the Fund under the Management Agreement as well as the total expenses incurred by the Fund. In assessing the reasonableness of the fees under the Management Agreement, the Committee and the Board considered, among other information, the Fund’s total expense ratio as a percentage of average daily net assets. The Committee and the Board considered data provided by the independent third-party data provider and the independent fee consultant. The Committee and the Board noted that, as of December 31, 2016, the Fund’s actual management fee and net total expense ratio are ranked in the third and second quintiles,
| 38 | Columbia Global Energy and Natural Resources Fund | Annual Report 2017 |
Board Consideration and Approval of Management
Agreement (continued)
respectively, (where the lowest fees and expenses would be in the first quintile) against the Fund’s expense universe as determined by the independent third-party data provider for purposes of expense comparison. The Committee and the Board also took into account the fee waiver and expense limitation arrangements agreed to by the Investment Manager, as noted above.
The Committee and the Board also received and considered information about the management fees charged by the Investment Manager to institutional separate accounts. In considering the fees charged to those accounts, the Committee and the Board took into account, among other things, the Investment Manager’s representations about the differences between managing mutual funds as compared to other types of accounts, including differences in the services provided, differences in the risk profile of such business for the Investment Manager and the additional resources required to manage mutual funds effectively. The Committee and the Board also received and considered information about the fees charged by the Investment Manager for sub-advisory services it provides to comparable unaffiliated funds. In evaluating the Fund’s management fees, the Committee and the Board also took into account the demands, complexity and quality of the investment management of the Fund.
After reviewing these and related factors, the Committee and the Board concluded, within the context of their overall conclusions, that the management fee rates and expenses of the Fund, in light of other considerations, warranted the continuation of the Management Agreement.
Costs of services provided and profitability
The Committee and the Board also took note of the costs the Investment Manager and its affiliates incur in connection with the services provided and the profitability to the Investment Manager and its affiliates from their relationships with the Fund.
The Committee and the Board also considered the compensation directly or indirectly received by the Investment Manager’s affiliates in connection with their relationships with the Fund. The Committee and the Board reviewed information provided by management as to the profitability to the Investment Manager and its affiliates of their relationships with the Fund, information about the allocation of expenses used to calculate profitability, and comparisons of profitability levels realized in 2016 to profitability levels realized in 2015. When reviewing profitability, the Committee and the Board also considered court cases in which adviser profitability was an issue in whole or in part, the performance of similarly managed funds, the performance of the Fund, and the expense ratio of the Fund. In addition, the Committee and the Board considered information provided by the Investment Manager regarding the Investment Manager’s financial condition and comparing its profitability to that of other asset management firms that are, or are subsidiaries of, publicly traded companies. In this regard, the Committee and the Board also considered data provided by the independent fee consultant.
After reviewing these and related factors, the Committee and the Board concluded, within the context of their overall conclusions, that the costs of services provided and the profitability to the Investment Manager and its affiliates from their relationships with the Fund supported the continuation of the Management Agreement.
Economies of scale
The Committee and the Board considered the potential existence of economies of scale in the provision by the Investment Manager of services to the Fund, to groups of related funds, and to the Investment Manager’s investment advisory clients as a whole, and whether those economies of scale were shared with the Fund through breakpoints in investment management fees or other means, such as expense limitation arrangements and additional investments by the Investment Manager in investment, trading, compliance and other resources. The Committee and the Board noted that the management fee schedules for the Fund contained breakpoints that would reduce the fee rate on assets above specified threshold levels.
In considering these matters, the Committee and the Board also considered the costs of the services provided and the profitability to the Investment Manager and its affiliates from their relationships with the Fund, as discussed above. After reviewing these and related factors, the Committee and the Board concluded, within the context of their overall conclusions, that the extent to which any economies of scale were expected to be shared with the Fund supported the continuation of the Management Agreement.
Columbia Global Energy and Natural Resources Fund | Annual Report 2017
| 39 |
Board Consideration and Approval of Management
Agreement (continued)
Other benefits to the Investment Manager
The Committee and the Board received and considered information regarding “fall-out” or ancillary benefits received by the Investment Manager and its affiliates as a result of their relationships with the Fund, such as the engagement of the Investment Manager’s affiliates to provide distribution, transfer agency and shareholder services to the Fund. In this regard, among other matters, the Committee and the Board considered that the Fund’s distributor retains a portion of the distribution fees from the Fund and receives a portion of the sales charges on sales or redemptions of certain classes of shares of the Fund. The Committee and the Board also considered the benefits of research made available to the Investment Manager by reason of brokerage commissions generated by the Fund’s securities transactions, and reviewed information about the Investment Manager’s practices with respect to allocating portfolio transactions for brokerage and research services. The Committee and the Board recognized that the Investment Manager’s profitability would be somewhat lower without these benefits.
Conclusion
The Committee and the Board reviewed all of the above considerations in reaching their decisions to recommend or approve the continuation of the Management Agreement. In their deliberations, the Trustees did not identify any particular information that was all-important or controlling, and individual Trustees may have attributed different weights to the various factors. Based on their evaluation of all factors that they deemed to be material, including those factors described above, and assisted by the advice of independent legal counsel, the Board, including the Independent Trustees, voting separately, unanimously approved the continuation of the Management Agreement.
| 40 | Columbia Global Energy and Natural Resources Fund | Annual Report 2017 |
The Fund mails one shareholder report to each shareholder address. If you would like more than one report, please call shareholder services at 800.345.6611 and additional reports will be sent to you.
Proxy voting policies and procedures
The policy of the Board of Trustees is to vote the proxies of the companies in which the Fund holds investments consistent with the procedures as stated in the Statement of Additional Information (SAI). You may obtain a copy of the SAI without charge by calling 800.345.6611; contacting your financial intermediary; visiting investor.columbiathreadneedleus.com; or searching the website of the Securities and Exchange Commission (SEC) at sec.gov. Information regarding how the Fund voted proxies relating to portfolio securities is filed with the SEC by August 31st for the most recent 12-month period ending June 30th of that year, and is available without charge by visiting investor.columbiathreadneedleus.com, or searching the website of the SEC at sec.gov.
Quarterly schedule of investments
The Fund files a complete schedule of portfolio holdings with the SEC for the first and third quarters of each fiscal year on Form N-Q. The Fund’s Form N-Q is available on the SEC’s website at sec.gov and may be reviewed and copied at the SEC’s Public Reference Room in Washington, D.C. Information on the operation of the Public Reference Room may be obtained by calling 800.SEC.0330. The Fund’s complete schedule of portfolio holdings, as filed on Form N-Q, can also be obtained without charge, upon request, by calling 800.345.6611.
Additional Fund information
For more information about the Fund, please visit investor.columbiathreadneedleus.com or call 800.345.6611. Customer Service Representatives are available to answer your questions Monday through Friday from 8 a.m. to 7 p.m. Eastern time.
Fund investment manager
Columbia Management Investment Advisers, LLC
225 Franklin Street
Boston, MA 02110
Fund distributor
Columbia Management Investment Distributors, Inc.
225 Franklin Street
Boston, MA 02110
Fund transfer agent
Columbia Management Investment Services Corp.
P.O. Box 8081
Boston, MA 02266-8081
Columbia Global Energy and Natural Resources Fund | Annual Report 2017
| 41 |
Columbia Global Energy and Natural Resources Fund
P.O. Box 8081
Boston, MA 02266-8081
Please read and consider the investment objectives, risks, charges and expenses for any fund carefully before investing. For a prospectus and summary prospectus, which contains this and other important information about the Fund, go to
investor.columbiathreadneedleus.com. The Fund is distributed by Columbia Management Investment Distributors, Inc., member FINRA, and managed by Columbia Management Investment Advisers, LLC.
Columbia Threadneedle Investments (Columbia Threadneedle) is the global brand name of the Columbia and Threadneedle group of companies. All rights reserved. Columbia Management Investment Distributors, Inc., 225 Franklin Street, Boston, MA 02110-2804
© 2017 Columbia Management Investment Advisers, LLC.
investor.columbiathreadneedleus.com

Annual Report
August 31, 2017
Columbia Strategic Income Fund
Not FDIC Insured • No bank guarantee • May lose value
Dear Shareholders,
The current outlook for financial markets is clouded by two primary concerns: the high valuation of equities and the direction of interest rates. Following the U.S. presidential election, U.S. equities rallied based on the assumption that the new administration’s policies would stimulate growth quickly. Unfortunately it’s unclear whether those measures will get passed, much less passed quickly. In fixed income, uncertainty stems from the possibility that interest rates won’t rise as rapidly as expected if the administration’s proposed growth policies are not implemented.
Given this uncertainty, investors value a consistent approach more than ever. Investors want strong, repeatable risk-adjusted returns. Consistency — not surprises. As a leading global asset manager, we believe our consistent, collaborative investment approach enables us to deliver the dependable experience your portfolio demands. So, how do we strive to deliver a consistent investment experience?
Better insights
Your portfolio benefits from the investment insights uncovered by our talented investment teams around the world.
Better decisions
Our collaborative, interactive environment enables our investment teams to construct portfolios that take advantage of the best investment ideas.
Better outcomes
We aim to deliver a consistent experience, which means fewer surprises, dependable insights, and products designed to do the thing you want.
Whether you’re trying to save money to help your children go to college or for your own retirement, it’s the consistency of the return that is most essential. People who chase higher returns are usually also the first to sell when that investment goes through a bad patch. We try to combat this behavioral tendency by offering strategies that aim for a more consistent return. Our goal is for investors to panic less during periods of volatility, which can have a significant effect on their long-term results.
Nothing is more important to us than making sure those who have entrusted us to protect and grow their assets can do what matters most to them: build a nest egg, leave a legacy, and live confidently — now and throughout retirement. It’s why our talented professionals around the world work together to uncover uncommon opportunities and why our process encourages challenge and debate around our most compelling ideas to ensure better informed investment decisions, which hopefully lead to better outcomes for you.
Your success is our priority. Talk to your financial advisor about how working with Columbia Threadneedle Investments may help you position your portfolio for consistent, sustainable outcomes, no matter the market conditions.
Sincerely,
Christopher O. Petersen
President, Columbia Funds
Investors should consider the investment objectives, risks, charges and expenses of a mutual fund carefully before investing. For a free prospectus and summary prospectus, which contains this and other important information about a fund, visit investor.columbiathreadneedleus.com. The prospectus should be read carefully before investing.
Columbia Funds are distributed by Columbia Management Investment Distributors, Inc., member FINRA, and managed by Columbia Management Investment Advisers, LLC.
© 2017 Columbia Management Investment Advisers, LLC. All rights reserved.
Columbia Strategic Income Fund | Annual Report 2017
Columbia Strategic Income Fund | Annual Report 2017
Investment objective
Columbia Strategic Income Fund (the Fund) seeks total return, consisting of current income and capital appreciation.
Portfolio management
Gene Tannuzzo, CFA
Co-manager
Managed Fund since 2010
Colin Lundgren, CFA
Co-manager
Managed Fund since 2010
Brian Lavin, CFA
Co-manager
Managed Fund since 2010
| Average annual total returns (%) (for the period ended August 31, 2017) |
| | | Inception | 10 Months
cumulative | 1 Year | 5 Years | 10 Years |
| Class A | Excluding sales charges | 04/21/77 | 4.42 | 4.67 | 3.92 | 5.77 |
| | Including sales charges | | -0.58 | -0.33 | 2.90 | 5.27 |
| Class C | Excluding sales charges | 07/01/97 | 3.78 | 3.89 | 3.21 | 5.09 |
| | Including sales charges | | 2.78 | 2.89 | 3.21 | 5.09 |
| Class K* | 03/07/11 | 4.38 | 4.83 | 4.02 | 5.84 |
| Class R* | 09/27/10 | 4.18 | 4.38 | 3.67 | 5.56 |
| Class R4* | 11/08/12 | 4.53 | 5.00 | 4.16 | 5.90 |
| Class R5* | 03/07/11 | 4.77 | 5.08 | 4.31 | 6.02 |
| Class T* | Excluding sales charges | 09/27/10 | 4.26 | 4.50 | 3.94 | 5.77 |
| | Including sales charges | | 1.70 | 1.94 | 3.42 | 5.51 |
| Class Y* | 06/13/13 | 4.65 | 4.97 | 4.27 | 5.95 |
| Class Z | 01/29/99 | 4.53 | 4.83 | 4.17 | 6.02 |
| Bloomberg Barclays U.S. Aggregate Bond Index | | 1.33 | 0.49 | 2.19 | 4.40 |
| BofAML US Cash Pay High Yield Constrained Index | | 7.75 | 8.78 | 6.46 | 7.88 |
| Citi Non-U.S. World Government Bond (All Maturities) Index – Unhedged | | 2.92 | -0.76 | -0.43 | 3.11 |
| JPMorgan Emerging Markets Bond Index – Global | | 5.71 | 4.52 | 4.63 | 7.52 |
Returns for Class A shares are shown with and without the maximum initial sales charge of 4.75%. Returns for Class C shares are shown with and without the 1.00% contingent deferred sales charge for the first year only. Returns for Class T shares are shown with and without the maximum initial sales charge of 2.50% per transaction. The Fund’s other share classes are not subject to sales charges and have limited eligibility. Please see the Fund’s prospectus for details. Performance for different share classes will vary based on differences in sales charges and fees associated with each share class. All results shown assume reinvestment of distributions during the period. Returns do not reflect the deduction of taxes that a shareholder may pay on Fund distributions or on the redemption of Fund shares. Performance results reflect the effect of any fee waivers or reimbursements of Fund expenses by Columbia Management Investment Advisers, LLC and/or any of its affiliates. Absent these fee waivers or expense reimbursement arrangements, performance results would have been lower.
The performance information shown represents past performance and is not a guarantee of future results. The investment return and principal value of your investment will fluctuate so that your shares, when redeemed, may be worth more or less than their original cost. Current performance may be lower or higher than the performance information shown. You may obtain performance information current to the most recent month-end by contacting your financial intermediary, visiting investor.columbiathreadneedleus.com/us or calling 800.345.6611.
| * | The returns shown for periods prior to the share class inception date (including returns for the Life of the Fund, if shown, which are since Fund inception) include the returns of the Fund’s oldest share class. These returns are adjusted to reflect any higher class-related operating expenses of the newer share classes, as applicable. Please visit investor.columbiathreadneedleus.com/investment-products/mutual-funds/appended-performance for more information. |
The Fund’s performance prior to August 29, 2014 reflects returns achieved pursuant to different principal investment strategies.
The Bloomberg Barclays U.S. Aggregate Bond Index is a market value-weighted index that tracks the daily price, coupon, pay-downs and total return performance of fixed-rate, publicly placed, dollar-denominated and non-convertible investment-grade debt issues with at least $250 million par amount outstanding and with at least one year to final maturity.
The BofAML US Cash Pay High Yield Constrained Index tracks the performance of U.S. dollar-denominated below investment-grade corporate debt, currently in a coupon paying period, that is publicly issued in the U.S. domestic market.
| 2 | Columbia Strategic Income Fund | Annual Report 2017 |
Fund at a Glance (continued)
The Citi Non-U.S. World Government Bond (All Maturities) Index — Unhedged is calculated on a market-weighted basis and includes all fixed-rate bonds with a remaining maturity of one year or longer and with amounts outstanding of at least the equivalent of U.S. $25 million, while excluding floating or variable rate bonds.
The JPMorgan Emerging Markets Bond Index — Global is based on U.S. dollar-denominated debt instruments issued by emerging market sovereign and quasi-sovereign entities, such as Brady bonds, Eurobonds and loans, and reflects reinvestment of all distributions and changes in market prices.
Indices are not available for investment, are not professionally managed and do not reflect sales charges, fees, brokerage commissions, taxes or other expenses of investing. Securities in the Fund may not match those in an index.
Performance of a hypothetical $10,000 investment (August 31, 2007 — August 31, 2017)
The chart above shows the change in value of a hypothetical $10,000 investment in Class A shares of Columbia Strategic Income Fund during the stated time period, and does not reflect the deduction of taxes that a shareholder may pay on Fund distributions or on the redemption of Fund shares.
| Portfolio breakdown (%) (at August 31, 2017) |
| Asset-Backed Securities — Non-Agency | 8.0 |
| Commercial Mortgage-Backed Securities - Non-Agency | 3.6 |
| Common Stocks | 0.0 (a) |
| Corporate Bonds & Notes | 39.7 |
| Foreign Government Obligations | 11.1 |
| Inflation-Indexed Bonds | 3.1 |
| Money Market Funds | 6.4 |
| Options Purchased Calls | 0.1 |
| Options Purchased Puts | 0.1 |
| Residential Mortgage-Backed Securities - Agency | 4.7 |
| Residential Mortgage-Backed Securities - Non-Agency | 15.9 |
| Senior Loans | 7.3 |
| Total | 100.0 |
Percentages indicated are based upon total investments. The Fund’s portfolio composition is subject to change.
| Quality breakdown (%) (at August 31, 2017) |
| AAA rating | 9.5 |
| AA rating | 3.4 |
| A rating | 3.5 |
| BBB rating | 22.2 |
| BB rating | 19.4 |
| B rating | 18.5 |
| CCC rating | 3.8 |
| CC rating | 0.1 |
| Not rated | 19.6 |
| Total | 100.0 |
Percentages indicated are based upon total fixed income investments (excluding Money Market Funds).
Bond ratings apply to the underlying holdings of the Fund and not the Fund itself and are divided into categories ranging from highest to lowest credit quality, determined by using the middle rating of Moody’s, S&P and Fitch, after dropping the highest and lowest available ratings. When ratings are available from only two rating agencies, the lower rating is used. When a rating is available from only one rating agency, that rating is used. When a bond is not rated by any rating agency, it is designated as “Not rated.” Credit
Columbia Strategic Income Fund | Annual Report 2017
| 3 |
Fund at a Glance (continued)
quality ratings assigned by a rating agency are subjective opinions, not statements of fact, and are subject to change, including daily. The ratings assigned by credit rating agencies are but one of the considerations that the Investment Manager and/or Fund’s subadviser incorporates into its credit analysis process, along with such other issuer-specific factors as cash flows, capital structure and leverage ratios, ability to de-leverage (repay) through free cash flow, quality of management, market positioning and access to capital, as well as such security-specific factors as the terms of the security (e.g., interest rate and time to maturity) and the amount and type of any collateral.
| 4 | Columbia Strategic Income Fund | Annual Report 2017 |
Manager Discussion of Fund Performance
Effective August 31, 2017, Columbia Strategic Income Fund’s fiscal year-end was changed from October 31 to August 31. As such, the discussion below covers the 10-month period from November 1, 2016 through August 31, 2017 (the “reporting period”).
For the 10-month period that ended August 31, 2017, the Fund’s Class A shares returned 4.42% excluding sales charges. The Fund outperformed its benchmark, the Bloomberg Barclays U.S. Aggregate Bond Index, which returned 1.33% for the same time period. During the same time period, the BofAML US Cash Pay High Yield Constrained Index returned 7.75%, the Citi Non-U.S. World Government Bond (All Maturities) Index – Unhedged returned 2.92% and the JPMorgan Emerging Markets Bond Index – Global returned 5.71%. Sector allocation, security selection and duration positioning overall contributed positively, while currency positioning as a whole detracted from the Fund’s performance versus its benchmark.
Bond markets generally supported by still-accommodative central bank policy
At the start of the reporting period, global bond markets were relatively subdued due to a persistent lack of action from the Federal Reserve (the Fed) as well as tempered inflation expectations across most developed markets. Yields increased broadly following the November 8, 2016 U.S. presidential election, although spreads tightened, with U.S. Treasuries absorbing the brunt of the election results. (Spreads are yield differentials between non-government bond sectors and government bond sectors). This, together with the introduction of an expansionary fiscal policy platform, were expected to push the Fed to act more rapidly on its interest rate hiking cycle. However, as White House infighting emerged through the early months of 2017, fiscal policy expectations were tempered as was the Fed’s projected path for raising interest rates. U.S. Treasuries rallied with increasing geopolitical tensions, which focused mostly on the Korean Peninsula, almost completely retracing their sell-off after the November 2016 elections. Corporate bonds, both high yield and investment grade, posted the best performance, as robust demand for yield drove tighter spreads. Emerging market debt also generated solid returns for the reporting period, with local exposure favored on broad weakness in the U.S. dollar. Structured debt products were weaker but still positive on a total return basis during the reporting period. The exception was mortgage-backed securities, which posted a negative return during the reporting period, attributable primarily to anticipation about the Fed’s unwinding of its balance sheet, expected to begin in earnest later in 2017.
All told, the Fed increased the targeted federal funds rate three times by a total of 75 basis points during the reporting period, whereas the yield on the 10-year U.S. Treasury bond was up approximately 30 basis points during the same time period. (A basis point is 1/100 of a percentage point.) The U.S. Treasury yield curve, or spectrum of maturities, flattened slightly, as expectations for further interest rate hikes decreased and investors demanded more yield on the short-term end of the curve to compensate for upcoming risks, such as a potential debt ceiling and/or government shut-down.
High-yield corporate bond overweight aided Fund results
Relative to the benchmark, having overweight exposures to high-yield corporate bond and high-yield loans contributed most positively to the Fund’s results, as both of these sectors outpaced the benchmark during the reporting period. Effective security selection across most sectors also boosted Fund results, especially among mortgage-backed securities. The primary exception was security selection among high-yield corporate bonds, which detracted modestly. Duration positioning also contributed positively to the Fund’s relative results during the reporting period, with the bulk of the added value coming from a shorter duration than that of the benchmark leading up to the November 2016 elections when interest rates rose. When interest rates rallied, or declined, as geopolitical tensions rose, the Fund gave back some of these gains. Duration is a measure of the Fund’s sensitivity to changes in interest rates. Yield curve positioning had a rather neutral effect on the Fund’s results during the reporting period.
Detracting most from the Fund’s results during the reporting period was local currency positioning. In particular, the Fund’s defensive position in developed market currencies was a drag on relative results, as the U.S. dollar weakened versus most other developed market currencies for much of the reporting period.
Shifting market conditions drove portfolio changes
During the reporting period, we significantly reduced the Fund’s exposure to agency mortgage-backed securities, Treasury inflation protected securities (TIPS) and high-yield corporate bonds. Agency mortgage-backed security spreads widened following the U.S. elections and continued to hold, in our view, near-term risk from the Fed’s proposed balance sheet
Columbia Strategic Income Fund | Annual Report 2017
| 5 |
Manager Discussion of Fund Performance (continued)
unwinding toward the latter months of 2017. The Fund’s allocation to TIPS was reduced as widely-held inflation expectations decreased with the lack of fiscal policy action from Washington D.C. and with global central bank tightening. We materially reduced the Fund’s exposure to high-yield corporate bonds as spreads ground tighter, only to take a small respite after North Korea missile threats and Washington D.C. drama. Instead, we reallocated proceeds toward high-yield loans, which we believe offer better spread compression potential than high-yield corporate bonds. We also increased the Fund’s exposure to emerging market debt, commercial mortgage-backed securities and asset-backed securities. Overall, the ratio within the Fund between allocations to high quality and lower quality assets remained rather constant. Also, we modestly adjusted the Fund’s duration throughout the reporting period as market conditions shifted, although we maintained a shorter duration than that of the benchmark throughout.
Derivative positions in the Fund
The Fund utilized government bond futures and swaps to manage duration and yield curve exposure, credit default swaps to tactically adjust credit exposure in the high-yield and emerging market debt sectors, currency forwards to hedge foreign currency risk and total return purposes, and mortgage TBAs to add exposure to agency mortgage-backed securities (MBS). TBAs, which stands for “to be announced,” are mortgage securities bought and sold for future settlement with an agreed upon price, coupon and face value, but without reference to the characteristics of the underlying pool of mortgages until 48 hours before delivery is taken. This feature gives TBA participants immediate exposure to agency MBS without having to value each individual security. On a stand-alone basis, these derivatives had a negative impact on Fund performance.
Market risk may affect a single issuer, sector of the economy, industry or the market as a whole. Mortgage- and asset-backed securities are affected by interest rates, financial health of issuers/originators, creditworthiness of entities providing credit enhancements and the value of underlying assets. Fixed-income securities present issuer default risk. Non-investment-grade (high-yield or junk) securities present greater price volatility and more risk to principal and income than higher rated securities. A rise in interest rates may result in a price decline of fixed-income instruments held by the Fund, negatively impacting its performance and NAV. Falling rates may result in the Fund investing in lower yielding debt instruments, lowering the Fund’s income and yield. These risks may be heightened for longer maturity and duration securities. Floating rate loans typically present greater risk than other fixed-income investments as they are generally subject to legal or contractual resale restrictions, may trade less frequently and experience value impairments during liquidation. Prepayment and extension risk exists because the timing of payments on a loan, bond or other investment may accelerate when interest rates fall or decelerate when interest rates rise which may reduce investment opportunities and potential returns. Foreign investments subject the Fund to risks, including political, economic, market, social and others within a particular country, as well as to currency instabilities and less stringent financial and accounting standards generally applicable to U.S. issuers. Risks are enhanced for emerging market and sovereign debt issuers. Investing in derivatives is a specialized activity that involves special risks that subject the Fund to significant loss potential, including when used as leverage, and may result in greater fluctuation in Fund value. Liquidity risk is associated with the difficulty of selling underlying investments at a desirable time or price. See the Fund’s prospectus for more information on these and other risks.
The views expressed in this report reflect the current views of the respective parties. These views are not guarantees of future performance and involve certain risks, uncertainties and assumptions that are difficult to predict, so actual outcomes and results may differ significantly from the views expressed. These views are subject to change at any time based upon economic, market or other conditions and the respective parties disclaim any responsibility to update such views. These views may not be relied on as investment advice and, because investment decisions for a Columbia fund are based on numerous factors, may not be relied on as an indication of trading intent on behalf of any particular Columbia fund. References to specific securities should not be construed as a recommendation or investment advice.
| 6 | Columbia Strategic Income Fund | Annual Report 2017 |
Understanding Your Fund’s Expenses
(Unaudited)
As an investor, you incur two types of costs. There are transaction costs, which generally include sales charges on purchases and may include redemption fees. There are also ongoing costs, which generally include management fees, distribution and/or service fees, and other fund expenses. The following information is intended to help you understand your ongoing costs (in dollars) of investing in the Fund and to help you compare these costs with the ongoing costs of investing in other mutual funds.
Analyzing your Fund’s expenses
To illustrate these ongoing costs, we have provided examples and calculated the expenses paid by investors in each share class of the Fund during the period. The actual and hypothetical information in the table is based on an initial investment of $1,000 at the beginning of the period indicated and held for the entire period. Expense information is calculated two ways and each method provides you with different information. The amount listed in the “Actual” column is calculated using the Fund’s actual operating expenses and total return for the period. You may use the Actual information, together with the amount invested, to estimate the expenses that you paid over the period. Simply divide your account value by $1,000 (for example, an $8,600 account value divided by $1,000 = 8.6), then multiply the results by the expenses paid during the period under the “Actual” column. The amount listed in the “Hypothetical” column assumes a 5% annual rate of return before expenses (which is not the Fund’s actual return) and then applies the Fund’s actual expense ratio for the period to the hypothetical return. You should not use the hypothetical account values and expenses to estimate either your actual account balance at the end of the period or the expenses you paid during the period. See “Compare with other funds” below for details on how to use the hypothetical data.
Compare with other funds
Since all mutual funds are required to include the same hypothetical calculations about expenses in shareholder reports, you can use this information to compare the ongoing cost of investing in the Fund with other funds. To do so, compare the hypothetical example with the 5% hypothetical examples that appear in the shareholder reports of other funds. As you compare hypothetical examples of other funds, it is important to note that hypothetical examples are meant to highlight the ongoing costs of investing in a fund only and do not reflect any transaction costs, such as sales charges, or redemption or exchange fees. Therefore, the hypothetical calculations are useful in comparing ongoing costs only, and will not help you determine the relative total costs of owning different funds. If transaction costs were included in these calculations, your costs would be higher.
| March 1, 2017 — August 31, 2017 |
| | Account value at the
beginning of the
period ($) | Account value at the
end of the
period ($) | Expenses paid during
the period ($) | Fund’s annualized
expense ratio (%) |
| | Actual | Hypothetical | Actual | Hypothetical | Actual | Hypothetical | Actual |
| Class A | 1,000.00 | 1,000.00 | 1,031.30 | 1,020.39 | 4.89 | 4.86 | 0.95 |
| Class C | 1,000.00 | 1,000.00 | 1,027.40 | 1,016.58 | 8.74 | 8.70 | 1.71 |
| Class K | 1,000.00 | 1,000.00 | 1,030.40 | 1,020.65 | 4.63 | 4.61 | 0.90 |
| Class R | 1,000.00 | 1,000.00 | 1,029.80 | 1,019.10 | 6.20 | 6.17 | 1.21 |
| Class R4 | 1,000.00 | 1,000.00 | 1,033.10 | 1,021.61 | 3.65 | 3.63 | 0.71 |
| Class R5 | 1,000.00 | 1,000.00 | 1,033.40 | 1,021.90 | 3.36 | 3.34 | 0.66 |
| Class T (formerly Class W) | 1,000.00 | 1,000.00 | 1,029.70 | 1,020.41 | 4.86 | 4.84 | 0.95 |
| Class Y | 1,000.00 | 1,000.00 | 1,032.00 | 1,021.94 | 3.31 | 3.30 | 0.65 |
| Class Z | 1,000.00 | 1,000.00 | 1,031.30 | 1,021.60 | 3.67 | 3.65 | 0.72 |
Expenses paid during the period are equal to the annualized expense ratio for each class as indicated above, multiplied by the average account value over the period and then multiplied by the number of days in the Fund’s most recent fiscal half year and divided by 365.
Expenses do not include fees and expenses incurred indirectly by the Fund from its investment in underlying funds, including affiliated and non-affiliated pooled investment vehicles, such as mutual funds and exchange-traded funds.
Had Columbia Management Investment Advisers, LLC and/or certain of its affiliates not waived/reimbursed certain fees and expenses, account value at the end of the period would have been reduced.
Columbia Strategic Income Fund | Annual Report 2017
| 7 |
Portfolio of Investments
August 31, 2017
(Percentages represent value of investments compared to net assets)
| Asset-Backed Securities — Non-Agency 8.1% |
| Issuer | Coupon
Rate | | Principal
Amount ($) | Value ($) |
| ARES XLIV CLO Ltd.(a),(b) |
| Series 2017-44A Class D |
3-month USD LIBOR + 6.550%
10/15/2029 | 7.800% | | 12,000,000 | 11,832,864 |
| Avery Point VII CLO Ltd.(a),(b) |
3-month USD LIBOR + 6.600%
01/15/2028 | 7.904% | | 2,200,000 | 2,231,726 |
| Conn Funding II LP(a) |
| Series 2017-A Class A |
| 05/15/2020 | 2.730% | | 6,921,998 | 6,929,433 |
| Series 2017-A Class B |
| 05/15/2020 | 5.110% | | 15,000,000 | 15,053,721 |
| Conn’s Receivables Funding LLC(a) |
| Series 2016-B Class B |
| 03/15/2019 | 7.340% | | 25,000,000 | 25,482,285 |
| Dryden 33 Senior Loan Fund(a),(b) |
| Series 2014-33A Class ER |
3-month USD LIBOR + 7.540%
10/15/2028 | 8.844% | | 9,500,000 | 9,716,524 |
| Dryden XXVIII Senior Loan Fund(a),(b) |
| Series 2013-28A Class A2LR |
3-month USD LIBOR + 1.650%
08/15/2030 | 2.965% | | 23,650,000 | 23,649,787 |
| FNA Trust(a),(c) |
| Series 2015-1 Class A |
| 12/10/2023 | 3.240% | | 1,142,381 | 1,137,675 |
| Hertz Vehicle Financing II LP(a) |
| Subordinated, Series 2015-1A Class B |
| 03/25/2021 | 3.520% | | 7,800,000 | 7,820,211 |
| Hertz Vehicle Financing LLC(a) |
| Series 2016-4A Class A |
| 07/25/2022 | 2.650% | | 10,600,000 | 10,428,417 |
| Madison Park Funding XI Ltd.(a),(b),(c),(d) |
| Series 2013-11A Class BR |
3-month USD LIBOR + 1.650%
07/23/2029 | 2.963% | | 34,000,000 | 34,000,000 |
| Marlette Funding Trust(a) |
| Series 2017-1A Class A |
| 03/15/2024 | 2.827% | | 13,298,002 | 13,367,480 |
| Octagon Investment Partners XXVI Ltd.(a),(b) |
| Series 2016-1A Class E |
3-month USD LIBOR + 7.850%
04/15/2027 | 9.154% | | 2,000,000 | 2,022,498 |
| OZLM Funding Ltd.(a),(b) |
| Series 2012-1A Class DR2 |
3-month USD LIBOR + 6.670%
07/23/2029 | 7.983% | | 9,500,000 | 9,299,844 |
| Asset-Backed Securities — Non-Agency (continued) |
| Issuer | Coupon
Rate | | Principal
Amount ($) | Value ($) |
| OZLM XI Ltd.(a),(b) |
| Series 2015-11A Class A2R |
3-month USD LIBOR + 1.750%
10/30/2030 | 3.061% | | 14,700,000 | 14,699,912 |
| OZLM XIV Ltd.(a),(b) |
| Series 2015-14A Class C |
3-month USD LIBOR + 4.350%
01/15/2029 | 5.654% | | 4,750,000 | 4,767,755 |
| Prosper Marketplace Issuance Trust(a) |
| Subordinated Series 2017-2A Class C |
| 09/15/2023 | 5.370% | | 10,000,000 | 10,027,105 |
| RR 1 LLC(a),(b) |
| Series 2017-1A Class A2R |
3-month USD LIBOR + 1.700%
07/15/2029 | 2.979% | | 14,200,000 | 14,199,219 |
| SoFi Consumer Loan Program LLC(a) |
| Series 2016-2A Class A |
| 10/27/2025 | 3.090% | | 4,511,499 | 4,567,735 |
| Series 2016-3 Class A |
| 12/26/2025 | 3.050% | | 8,869,388 | 8,982,441 |
| SoFi Professional Loan Program LLC(a),(c),(e),(f) |
| Series 2015-D Class RC |
| 10/26/2037 | 0.000% | | 25 | 16,000,000 |
| Series 2016-A Class RIO |
| 01/25/2038 | 0.000% | | 20 | 6,800,000 |
| Series 2016-A Class RPO |
| 01/25/2038 | 0.000% | | 20 | 13,200,000 |
| Series 2016-B Class RC |
| 04/25/2037 | 0.000% | | 5 | 2,650,000 |
| SoFi Professional Loan Program LLC(a) |
| Series 2017-1 Class A |
| 01/26/2026 | 3.280% | | 7,761,733 | 7,886,014 |
| Voya CLO Ltd.(a),(b) |
| Series 2016-2A Class D |
3-month USD LIBOR + 6.950%
07/19/2028 | 8.256% | | 10,580,000 | 10,637,862 |
| Westcott Park CLO Ltd.(a),(b) |
| Series 2016-1A Class E |
3-month USD LIBOR + 7.200%
07/20/2028 | 8.507% | | 10,000,000 | 10,169,530 |
Total Asset-Backed Securities — Non-Agency
(Cost $294,007,622) | 297,560,038 |
|
| Commercial Mortgage-Backed Securities - Non-Agency 3.6% |
| | | | |
| Banc of America Merrill Lynch Commercial Mortgage Securities Trust(a),(b) |
| Series 2013-DSNY Class F |
1-month USD LIBOR + 3.500%
09/15/2026 | 4.727% | | 11,687,195 | 11,687,429 |
The accompanying Notes to Financial Statements are an integral part of this statement.
| 8 | Columbia Strategic Income Fund | Annual Report 2017 |
Portfolio of Investments (continued)
August 31, 2017
| Commercial Mortgage-Backed Securities - Non-Agency (continued) |
| Issuer | Coupon
Rate | | Principal
Amount ($) | Value ($) |
| BHMS Mortgage Trust(a),(b),(g) |
| Series 2014-ATLS Class DFX |
| 07/05/2033 | 4.847% | | 12,043,469 | 12,325,928 |
| Credit Suisse Mortgage Capital Certificates OA LLC(a) |
| Subordinated Series 2014-USA Class E |
| 09/15/2037 | 4.373% | | 12,260,000 | 11,027,234 |
| Subordinated Series 2014-USA Class F |
| 09/15/2037 | 4.373% | | 6,670,000 | 5,713,997 |
| Subordinated, Series 2014-USA Class D |
| 09/15/2037 | 4.373% | | 14,870,000 | 14,264,172 |
| Hilton USA Trust(a),(b),(g) |
| Series 2016-HHV Class F |
| 11/05/2038 | 4.333% | | 37,590,000 | 30,331,724 |
| Hilton USA Trust(a) |
| Subordinated, Series 2016-SFP Class E |
| 11/05/2035 | 5.519% | | 9,700,000 | 10,040,975 |
| Invitation Homes Trust(a),(b) |
| Series 2014-SFR3 Class D |
1-month USD LIBOR + 3.000%
12/17/2031 | 4.227% | | 1,275,909 | 1,275,905 |
| Series 2015-SFR3 Class E |
1-month USD LIBOR + 3.750%
08/17/2032 | 4.977% | | 3,000,000 | 3,041,766 |
| Series 2015-SFR3 Class F |
1-month USD LIBOR + 4.750%
08/17/2032 | 5.977% | | 18,500,000 | 18,804,928 |
| ORES NPL LLC(a) |
| Series 2014-LV3 Class B |
| 03/27/2024 | 6.000% | | 2,763,802 | 2,763,803 |
| Rialto Real Estate Fund LLC(a) |
| Subordinated, Series 2015-LT7 Class B |
| 12/25/2032 | 5.071% | | 11,064,221 | 11,064,221 |
Total Commercial Mortgage-Backed Securities - Non-Agency
(Cost $129,423,391) | 132,342,082 |
| Common Stocks 0.1% |
| Issuer | Shares | Value ($) |
| Consumer Discretionary —% |
| Auto Components —% |
| Delphi Automotive PLC | 1,315 | 126,766 |
| Media —% |
| Cengage Learning, Inc.(c),(h) | 7,982 | 59,865 |
| Tribune Media Co. | 1,338 | 53,613 |
| tronc, Inc.(h) | 198 | 2,873 |
| Total | | 116,351 |
| Total Consumer Discretionary | 243,117 |
| Common Stocks (continued) |
| Issuer | Shares | Value ($) |
| Financials —% |
| Capital Markets —% |
| RCS Capital Corp.(h) | 5,448 | 108,279 |
| Total Financials | 108,279 |
| Materials —% |
| Chemicals —% |
| LyondellBasell Industries NV, Class A | 3,806 | 344,786 |
| Metals & Mining —% |
| Aleris International, Inc.(h) | 3,721 | 109,769 |
| Total Materials | 454,555 |
| Telecommunication Services —% |
| Diversified Telecommunication Services —% |
| Hawaiian Telcom Holdco, Inc.(h) | 478 | 14,541 |
| Total Telecommunication Services | 14,541 |
| Utilities 0.1% |
| Independent Power and Renewable Electricity Producers 0.1% |
| Samson Resources(h) | 22,248 | 526,537 |
| Templar Energy LLC(h) | 24,262 | 101,597 |
| Vistra Energy Corp | 21,925 | 388,073 |
| Total | | 1,016,207 |
| Total Utilities | 1,016,207 |
Total Common Stocks
(Cost $1,654,954) | 1,836,699 |
| Corporate Bonds & Notes(i) 40.0% |
| Issuer | Coupon
Rate | | Principal
Amount ($) | Value ($) |
| Aerospace & Defense 0.5% |
| Bombardier, Inc.(a) |
| 12/01/2021 | 8.750% | | 1,629,000 | 1,850,629 |
| L3 Technologies, Inc. |
| 05/28/2024 | 3.950% | | 7,855,000 | 8,287,103 |
| TransDigm, Inc. |
| 07/15/2024 | 6.500% | | 3,037,000 | 3,154,878 |
| 05/15/2025 | 6.500% | | 2,799,000 | 2,881,176 |
| 06/15/2026 | 6.375% | | 1,703,000 | 1,751,774 |
| Total | 17,925,560 |
| Automotive 0.1% |
| Gates Global LLC/Co.(a) |
| 07/15/2022 | 6.000% | | 2,949,000 | 3,026,045 |
The accompanying Notes to Financial Statements are an integral part of this statement.
Columbia Strategic Income Fund | Annual Report 2017
| 9 |
Portfolio of Investments (continued)
August 31, 2017
| Corporate Bonds & Notes(i) (continued) |
| Issuer | Coupon
Rate | | Principal
Amount ($) | Value ($) |
| IHO Verwaltungs GmbH PIK(a) |
| 09/15/2023 | 4.500% | | 500,000 | 507,465 |
| 09/15/2026 | 4.750% | | 987,000 | 992,258 |
| Total | 4,525,768 |
| Banking 1.0% |
| Agromercantil Senior Trust(a) |
| 04/10/2019 | 6.250% | | 1,295,000 | 1,341,131 |
| Ally Financial, Inc. |
| 11/01/2031 | 8.000% | | 3,888,000 | 5,005,796 |
| Banco de Bogota SA(a) |
| Subordinated |
| 05/12/2026 | 6.250% | | 2,500,000 | 2,702,540 |
| Banco de Credito del Peru(a),(b),(c),(j) |
| Subordinated |
| 10/15/2022 | 7.170% | PEN | 2,000,000 | 617,688 |
| Banco Mercantil del Norte SA(a),(b),(j) |
| Subordinated |
| 10/04/2031 | 5.750% | | 2,400,000 | 2,443,754 |
| Bank of America Corp.(b),(j) |
| 01/20/2028 | 3.824% | | 7,615,000 | 7,844,927 |
| BBVA Bancomer SA(a),(b),(j) |
| Subordinated |
| 11/12/2029 | 5.350% | | 1,198,000 | 1,208,635 |
| Citigroup, Inc. |
| 05/01/2026 | 3.400% | | 6,995,000 | 7,039,145 |
| Industrial Senior Trust(a) |
| 11/01/2022 | 5.500% | | 1,000,000 | 1,015,086 |
| Popular, Inc. |
| 07/01/2019 | 7.000% | | 714,000 | 747,567 |
| Wells Fargo & Co. |
| 10/23/2026 | 3.000% | | 6,000,000 | 5,932,200 |
| Total | 35,898,469 |
| Brokerage/Asset Managers/Exchanges 0.1% |
| NFP Corp.(a) |
| 07/15/2025 | 6.875% | | 1,599,000 | 1,625,361 |
| VFH Parent LLC/Orchestra Co-Issuer, Inc.(a) |
| 06/15/2022 | 6.750% | | 536,000 | 556,091 |
| Total | 2,181,452 |
| Building Materials 0.4% |
| Allegion US Holding Co., Inc. |
| 10/01/2021 | 5.750% | | 1,646,000 | 1,698,084 |
| American Builders & Contractors Supply Co., Inc.(a) |
| 12/15/2023 | 5.750% | | 3,171,000 | 3,350,041 |
| Beacon Roofing Supply, Inc. |
| 10/01/2023 | 6.375% | | 2,060,000 | 2,182,486 |
| Corporate Bonds & Notes(i) (continued) |
| Issuer | Coupon
Rate | | Principal
Amount ($) | Value ($) |
| CD&R Waterworks Merger Sub LLC(a) |
| 08/15/2025 | 6.125% | | 833,000 | 849,412 |
| Cementos Pacasmayo SAA(a) |
| 02/08/2023 | 4.500% | | 650,000 | 668,101 |
| Cemex SAB de CV(a) |
| 04/16/2026 | 7.750% | | 2,550,000 | 2,929,562 |
| Gibraltar Industries, Inc. |
| 02/01/2021 | 6.250% | | 723,000 | 744,293 |
| HD Supply, Inc.(a) |
| 04/15/2024 | 5.750% | | 1,082,000 | 1,160,825 |
| Union Andina de Cementos SAA(a) |
| 10/30/2021 | 5.875% | | 676,000 | 707,648 |
| US Concrete, Inc. |
| 06/01/2024 | 6.375% | | 1,080,000 | 1,164,535 |
| Total | 15,454,987 |
| Cable and Satellite 2.6% |
| Altice US Finance I Corp.(a) |
| 07/15/2023 | 5.375% | | 4,057,000 | 4,231,252 |
| 05/15/2026 | 5.500% | | 5,305,000 | 5,606,457 |
| CCO Holdings LLC/Capital Corp.(a) |
| 04/01/2024 | 5.875% | | 1,453,000 | 1,546,156 |
| 05/01/2025 | 5.375% | | 1,568,000 | 1,634,969 |
| 02/15/2026 | 5.750% | | 3,586,000 | 3,795,082 |
| 05/01/2026 | 5.500% | | 80,000 | 83,369 |
| 05/01/2027 | 5.125% | | 1,932,000 | 1,991,052 |
| 05/01/2027 | 5.875% | | 766,000 | 812,283 |
| Cequel Communications Holdings I LLC/Capital Corp.(a) |
| 09/15/2020 | 6.375% | | 1,042,000 | 1,067,329 |
| 12/15/2021 | 5.125% | | 1,569,000 | 1,597,845 |
| 07/15/2025 | 7.750% | | 942,000 | 1,040,432 |
| CSC Holdings LLC(a) |
| 01/15/2023 | 10.125% | | 828,000 | 958,552 |
| 10/15/2025 | 6.625% | | 6,387,000 | 6,990,495 |
| 10/15/2025 | 10.875% | | 2,105,000 | 2,588,674 |
| 04/15/2027 | 5.500% | | 832,000 | 866,829 |
| DISH DBS Corp. |
| 11/15/2024 | 5.875% | | 5,215,000 | 5,621,426 |
| 07/01/2026 | 7.750% | | 4,522,000 | 5,315,715 |
| NBCUniversal Media LLC |
| 01/15/2043 | 4.450% | | 990,000 | 1,046,322 |
| Quebecor Media, Inc. |
| 01/15/2023 | 5.750% | | 4,930,000 | 5,273,375 |
| Radiate HoldCo LLC/Finance, Inc.(a) |
| 02/15/2025 | 6.625% | | 835,000 | 827,331 |
| Sirius XM Radio, Inc.(a) |
| 04/15/2025 | 5.375% | | 2,209,000 | 2,333,833 |
| 07/15/2026 | 5.375% | | 733,000 | 769,373 |
| 08/01/2027 | 5.000% | | 2,815,000 | 2,891,419 |
The accompanying Notes to Financial Statements are an integral part of this statement.
| 10 | Columbia Strategic Income Fund | Annual Report 2017 |
Portfolio of Investments (continued)
August 31, 2017
| Corporate Bonds & Notes(i) (continued) |
| Issuer | Coupon
Rate | | Principal
Amount ($) | Value ($) |
| Sky PLC(a) |
| 09/16/2024 | 3.750% | | 12,889,000 | 13,336,635 |
| Unitymedia GmbH(a) |
| 01/15/2025 | 6.125% | | 796,000 | 853,254 |
| Unitymedia Hessen GmbH & Co. KG NRW(a) |
| 01/15/2025 | 5.000% | | 4,876,000 | 5,127,075 |
| Videotron Ltd.(a) |
| 04/15/2027 | 5.125% | | 565,000 | 582,083 |
| Virgin Media Secured Finance PLC(a) |
| 01/15/2026 | 5.250% | | 8,162,000 | 8,495,842 |
| 08/15/2026 | 5.500% | | 740,000 | 780,337 |
| Ziggo Secured Finance BV(a) |
| 01/15/2027 | 5.500% | | 5,821,000 | 6,002,371 |
| Total | 94,067,167 |
| Chemicals 0.9% |
| Angus Chemical Co.(a) |
| 02/15/2023 | 8.750% | | 1,488,000 | 1,520,230 |
| Atotech USA, Inc.(a) |
| 02/01/2025 | 6.250% | | 2,146,000 | 2,196,972 |
| Axalta Coating Systems LLC(a) |
| 08/15/2024 | 4.875% | | 1,475,000 | 1,507,578 |
| Chemours Co. (The) |
| 05/15/2023 | 6.625% | | 1,541,000 | 1,639,698 |
| 05/15/2025 | 7.000% | | 1,830,000 | 2,018,678 |
| 05/15/2027 | 5.375% | | 1,640,000 | 1,709,000 |
| Eco Services Operations LLC/Finance Corp.(a) |
| 11/01/2022 | 8.500% | | 1,324,000 | 1,389,092 |
| Elementia SAB de CV(a) |
| 01/15/2025 | 5.500% | | 2,000,000 | 2,097,678 |
| INEOS Group Holdings SA(a) |
| 08/01/2024 | 5.625% | | 2,168,000 | 2,233,320 |
| Koppers, Inc.(a) |
| 02/15/2025 | 6.000% | | 597,000 | 633,403 |
| LYB International Finance BV |
| 03/15/2044 | 4.875% | | 4,790,000 | 5,197,744 |
| Mexichem SAB de CV(a) |
| 09/17/2044 | 5.875% | | 1,200,000 | 1,234,522 |
| Platform Specialty Products Corp.(a) |
| 05/01/2021 | 10.375% | | 739,000 | 809,495 |
| 02/01/2022 | 6.500% | | 906,000 | 940,317 |
| PQ Corp.(a) |
| 11/15/2022 | 6.750% | | 5,633,000 | 6,095,520 |
| SPCM SA(a) |
| 09/15/2025 | 4.875% | | 1,262,000 | 1,297,616 |
| Corporate Bonds & Notes(i) (continued) |
| Issuer | Coupon
Rate | | Principal
Amount ($) | Value ($) |
| Venator Finance SARL/Materials LLC(a) |
| 07/15/2025 | 5.750% | | 357,000 | 365,066 |
| Total | 32,885,929 |
| Construction Machinery 0.3% |
| Ashtead Capital, Inc.(a) |
| 08/15/2025 | 4.125% | | 704,000 | 721,724 |
| 08/15/2027 | 4.375% | | 1,985,000 | 2,025,075 |
| H&E Equipment Services, Inc.(a) |
| 09/01/2025 | 5.625% | | 731,000 | 754,623 |
| Ritchie Bros. Auctioneers, Inc.(a) |
| 01/15/2025 | 5.375% | | 527,000 | 545,563 |
| United Rentals North America, Inc. |
| 09/15/2026 | 5.875% | | 3,761,000 | 4,098,042 |
| 05/15/2027 | 5.500% | | 1,706,000 | 1,808,307 |
| 01/15/2028 | 4.875% | | 1,757,000 | 1,772,212 |
| Total | 11,725,546 |
| Consumer Cyclical Services 0.6% |
| APX Group, Inc. |
| 12/01/2020 | 8.750% | | 3,485,000 | 3,586,574 |
| 12/01/2022 | 7.875% | | 5,510,000 | 5,986,014 |
| APX Group, Inc.(a) |
| 09/01/2023 | 7.625% | | 3,275,000 | 3,318,865 |
| IHS Markit Ltd.(a) |
| 11/01/2022 | 5.000% | | 2,302,000 | 2,478,814 |
| 02/15/2025 | 4.750% | | 2,397,000 | 2,549,428 |
| Interval Acquisition Corp. |
| 04/15/2023 | 5.625% | | 2,601,000 | 2,688,017 |
| Total | 20,607,712 |
| Consumer Products 0.3% |
| American Greetings Corp.(a) |
| 02/15/2025 | 7.875% | | 255,000 | 276,411 |
| Prestige Brands, Inc.(a) |
| 03/01/2024 | 6.375% | | 1,744,000 | 1,866,854 |
| Scotts Miracle-Gro Co. (The) |
| 10/15/2023 | 6.000% | | 1,598,000 | 1,715,704 |
| 12/15/2026 | 5.250% | | 553,000 | 581,633 |
| Spectrum Brands, Inc. |
| 07/15/2025 | 5.750% | | 1,409,000 | 1,500,723 |
| Springs Industries, Inc. |
| 06/01/2021 | 6.250% | | 2,499,000 | 2,576,224 |
| Tempur Sealy International, Inc. |
| 10/15/2023 | 5.625% | | 1,076,000 | 1,120,977 |
The accompanying Notes to Financial Statements are an integral part of this statement.
Columbia Strategic Income Fund | Annual Report 2017
| 11 |
Portfolio of Investments (continued)
August 31, 2017
| Corporate Bonds & Notes(i) (continued) |
| Issuer | Coupon
Rate | | Principal
Amount ($) | Value ($) |
| Valvoline, Inc.(a) |
| 07/15/2024 | 5.500% | | 314,000 | 333,510 |
| 08/15/2025 | 4.375% | | 1,603,000 | 1,620,017 |
| Total | 11,592,053 |
| Diversified Manufacturing 0.2% |
| Entegris, Inc.(a) |
| 04/01/2022 | 6.000% | | 1,983,000 | 2,069,351 |
| SPX FLOW, Inc.(a) |
| 08/15/2024 | 5.625% | | 526,000 | 546,952 |
| 08/15/2026 | 5.875% | | 1,942,000 | 2,031,497 |
| WESCO Distribution, Inc. |
| 06/15/2024 | 5.375% | | 852,000 | 890,733 |
| Zekelman Industries, Inc.(a) |
| 06/15/2023 | 9.875% | | 1,862,000 | 2,088,978 |
| Total | 7,627,511 |
| Electric 5.0% |
| AES Corp. |
| 09/01/2027 | 5.125% | | 439,000 | 446,305 |
| AES Corp. (The) |
| 05/15/2023 | 4.875% | | 1,340,000 | 1,373,002 |
| 05/15/2026 | 6.000% | | 1,179,000 | 1,261,402 |
| Calpine Corp. |
| 01/15/2025 | 5.750% | | 2,037,000 | 1,874,258 |
| CMS Energy Corp. |
| 03/01/2024 | 3.875% | | 7,500,000 | 7,954,163 |
| 02/15/2027 | 2.950% | | 5,675,000 | 5,571,448 |
| 03/31/2043 | 4.700% | | 6,629,000 | 7,321,485 |
| DTE Energy Co. |
| 06/01/2024 | 3.500% | | 6,660,000 | 6,875,451 |
| 10/01/2026 | 2.850% | | 27,095,000 | 26,325,529 |
| Duke Energy Carolinas LLC |
| 03/15/2046 | 3.875% | | 1,600,000 | 1,669,734 |
| Duke Energy Corp. |
| 10/15/2023 | 3.950% | | 9,115,000 | 9,721,813 |
| 04/15/2024 | 3.750% | | 949,000 | 1,005,808 |
| 09/01/2046 | 3.750% | | 12,000,000 | 11,647,680 |
| Dynegy, Inc. |
| 11/01/2024 | 7.625% | | 1,685,000 | 1,738,344 |
| Dynegy, Inc.(a) |
| 01/30/2026 | 8.125% | | 480,000 | 494,851 |
| Emera US Finance LP |
| 06/15/2046 | 4.750% | | 11,095,000 | 11,886,883 |
| Energuate Trust(a) |
| 05/03/2027 | 5.875% | | 2,400,000 | 2,482,231 |
| Indiana Michigan Power Co. |
| 07/01/2047 | 3.750% | | 7,010,000 | 7,026,361 |
| Corporate Bonds & Notes(i) (continued) |
| Issuer | Coupon
Rate | | Principal
Amount ($) | Value ($) |
| NextEra Energy Capital Holdings, Inc. |
| 05/01/2027 | 3.550% | | 16,760,000 | 17,404,740 |
| NRG Energy, Inc. |
| 01/15/2027 | 6.625% | | 2,762,000 | 2,907,389 |
| NRG Yield Operating LLC |
| 08/15/2024 | 5.375% | | 4,650,000 | 4,862,091 |
| 09/15/2026 | 5.000% | | 1,817,000 | 1,859,018 |
| Pacific Gas & Electric Co. |
| 02/15/2044 | 4.750% | | 4,800,000 | 5,578,075 |
| Pattern Energy Group, Inc.(a) |
| 02/01/2024 | 5.875% | | 3,103,000 | 3,247,203 |
| PPL Capital Funding, Inc. |
| 06/01/2023 | 3.400% | | 5,615,000 | 5,827,870 |
| 03/15/2024 | 3.950% | | 7,750,000 | 8,201,298 |
| Progress Energy, Inc. |
| 04/01/2022 | 3.150% | | 8,094,000 | 8,309,600 |
| Southern Co. (The) |
| 07/01/2046 | 4.400% | | 14,095,000 | 14,670,682 |
| Xcel Energy, Inc. |
| 12/01/2026 | 3.350% | | 3,175,000 | 3,260,389 |
| Total | 182,805,103 |
| Finance Companies 0.6% |
| Aircastle Ltd. |
| 02/15/2022 | 5.500% | | 862,000 | 939,361 |
| 04/01/2023 | 5.000% | | 702,000 | 747,596 |
| iStar, Inc. |
| 04/01/2022 | 6.000% | | 1,394,000 | 1,432,845 |
| Navient Corp. |
| 01/25/2022 | 7.250% | | 1,039,000 | 1,134,084 |
| 06/15/2022 | 6.500% | | 969,000 | 1,023,506 |
| 03/25/2024 | 6.125% | | 1,599,000 | 1,634,348 |
| 10/25/2024 | 5.875% | | 1,278,000 | 1,292,449 |
| OneMain Financial Holdings LLC(a) |
| 12/15/2019 | 6.750% | | 2,017,000 | 2,107,769 |
| 12/15/2021 | 7.250% | | 2,660,000 | 2,784,908 |
| Park Aerospace Holdings Ltd.(a) |
| 08/15/2022 | 5.250% | | 799,000 | 832,029 |
| 02/15/2024 | 5.500% | | 514,000 | 534,598 |
| Provident Funding Associates LP/Finance Corp.(a) |
| 06/15/2025 | 6.375% | | 1,248,000 | 1,294,913 |
| Quicken Loans, Inc.(a) |
| 05/01/2025 | 5.750% | | 2,789,000 | 2,915,102 |
| Springleaf Finance Corp. |
| 05/15/2022 | 6.125% | | 1,690,000 | 1,779,024 |
| Total | 20,452,532 |
The accompanying Notes to Financial Statements are an integral part of this statement.
| 12 | Columbia Strategic Income Fund | Annual Report 2017 |
Portfolio of Investments (continued)
August 31, 2017
| Corporate Bonds & Notes(i) (continued) |
| Issuer | Coupon
Rate | | Principal
Amount ($) | Value ($) |
| Food and Beverage 2.7% |
| Anheuser-Busch InBev Finance, Inc. |
| 02/01/2026 | 3.650% | | 22,895,000 | 23,827,696 |
| Aramark Services, Inc. |
| 01/15/2024 | 5.125% | | 799,000 | 848,453 |
| B&G Foods, Inc. |
| 04/01/2025 | 5.250% | | 2,566,000 | 2,632,128 |
| Chobani LLC/Finance Corp., Inc.(a) |
| 04/15/2025 | 7.500% | | 2,813,000 | 3,066,820 |
| ConAgra Foods, Inc. |
| 09/15/2022 | 3.250% | | 3,130,000 | 3,212,419 |
| 01/25/2023 | 3.200% | | 5,148,000 | 5,280,968 |
| FAGE International SA/USA Dairy Industry, Inc.(a) |
| 08/15/2026 | 5.625% | | 1,658,000 | 1,693,670 |
| Kernel Holding SA(a) |
| 01/31/2022 | 8.750% | | 2,950,000 | 3,232,058 |
| Kraft Heinz Foods Co. |
| 06/01/2046 | 4.375% | | 8,595,000 | 8,372,261 |
| Lamb Weston Holdings, Inc.(a) |
| 11/01/2024 | 4.625% | | 727,000 | 752,140 |
| 11/01/2026 | 4.875% | | 2,538,000 | 2,632,949 |
| MARB BondCo PLC(a) |
| 03/15/2024 | 7.000% | | 1,850,000 | 1,822,605 |
| MHP SE(a) |
| 04/02/2020 | 8.250% | | 2,333,000 | 2,499,303 |
| Molson Coors Brewing Co. |
| 07/15/2026 | 3.000% | | 2,965,000 | 2,905,869 |
| 07/15/2046 | 4.200% | | 10,617,000 | 10,610,248 |
| Mondelez International, Inc.(a) |
| 10/28/2019 | 1.625% | | 6,252,000 | 6,201,046 |
| Post Holdings, Inc.(a) |
| 03/01/2025 | 5.500% | | 742,000 | 770,268 |
| 08/15/2026 | 5.000% | | 3,107,000 | 3,108,563 |
| 03/01/2027 | 5.750% | | 5,753,000 | 5,980,474 |
| Sysco Corp. |
| 07/15/2027 | 3.250% | | 8,284,000 | 8,353,627 |
| Total | 97,803,565 |
| Gaming 1.0% |
| Boyd Gaming Corp. |
| 05/15/2023 | 6.875% | | 980,000 | 1,055,037 |
| 04/01/2026 | 6.375% | | 2,849,000 | 3,105,330 |
| Eldorado Resorts, Inc. |
| 04/01/2025 | 6.000% | | 1,930,000 | 2,044,997 |
| GLP Capital LP/Financing II, Inc. |
| 04/15/2026 | 5.375% | | 1,475,000 | 1,602,006 |
| Corporate Bonds & Notes(i) (continued) |
| Issuer | Coupon
Rate | | Principal
Amount ($) | Value ($) |
| International Game Technology PLC(a) |
| 02/15/2022 | 6.250% | | 1,963,000 | 2,163,815 |
| 02/15/2025 | 6.500% | | 4,512,000 | 5,060,330 |
| Jack Ohio Finance LLC/1 Corp.(a) |
| 11/15/2021 | 6.750% | | 2,230,000 | 2,324,012 |
| MGM Growth Properties Operating Partnership LP/Finance Co-Issuer, Inc. |
| 05/01/2024 | 5.625% | | 899,000 | 975,736 |
| 09/01/2026 | 4.500% | | 873,000 | 885,345 |
| MGM Resorts International |
| 12/15/2021 | 6.625% | | 2,043,000 | 2,300,798 |
| Penn National Gaming, Inc.(a) |
| 01/15/2027 | 5.625% | | 1,446,000 | 1,502,037 |
| Rivers Pittsburgh Borrower LP/Finance Corp.(a) |
| 08/15/2021 | 6.125% | | 1,095,000 | 1,110,867 |
| Scientific Games International, Inc.(a) |
| 01/01/2022 | 7.000% | | 6,075,000 | 6,476,965 |
| Scientific Games International, Inc. |
| 12/01/2022 | 10.000% | | 3,541,000 | 3,928,300 |
| Seminole Tribe of Florida, Inc.(a) |
| 10/01/2020 | 7.804% | | 1,400,000 | 1,438,542 |
| Tunica-Biloxi Gaming Authority(a),(k) |
| 11/15/2016 | 0.000% | | 2,397,000 | 910,860 |
| Wynn Las Vegas LLC/Capital Corp.(a) |
| 05/15/2027 | 5.250% | | 1,207,000 | 1,218,131 |
| Total | 38,103,108 |
| Health Care 2.1% |
| Acadia Healthcare Co., Inc. |
| 07/01/2022 | 5.125% | | 524,000 | 542,022 |
| 03/01/2024 | 6.500% | | 2,077,000 | 2,236,707 |
| Amsurg Corp. |
| 07/15/2022 | 5.625% | | 1,400,000 | 1,463,965 |
| Becton Dickinson and Co. |
| 06/06/2027 | 3.700% | | 10,770,000 | 10,932,573 |
| Change Healthcare Holdings LLC/Finance, Inc.(a) |
| 03/01/2025 | 5.750% | | 3,071,000 | 3,159,058 |
| CHS/Community Health Systems, Inc. |
| 02/01/2022 | 6.875% | | 2,552,000 | 2,117,637 |
| 03/31/2023 | 6.250% | | 4,003,000 | 4,036,761 |
| DaVita, Inc. |
| 05/01/2025 | 5.000% | | 4,269,000 | 4,331,584 |
| Envision Healthcare Corp.(a) |
| 12/01/2024 | 6.250% | | 634,000 | 682,490 |
| Express Scripts Holding Co. |
| 07/15/2046 | 4.800% | | 3,475,000 | 3,654,348 |
The accompanying Notes to Financial Statements are an integral part of this statement.
Columbia Strategic Income Fund | Annual Report 2017
| 13 |
Portfolio of Investments (continued)
August 31, 2017
| Corporate Bonds & Notes(i) (continued) |
| Issuer | Coupon
Rate | | Principal
Amount ($) | Value ($) |
| HCA, Inc. |
| 02/15/2020 | 6.500% | | 2,296,000 | 2,499,072 |
| 02/15/2022 | 7.500% | | 3,328,000 | 3,838,961 |
| 04/15/2025 | 5.250% | | 4,188,000 | 4,515,749 |
| 02/15/2027 | 4.500% | | 5,235,000 | 5,330,083 |
| Hill-Rom Holdings, Inc.(a) |
| 02/15/2025 | 5.000% | | 1,112,000 | 1,137,151 |
| Hologic, Inc.(a) |
| 07/15/2022 | 5.250% | | 1,697,000 | 1,784,565 |
| MEDNAX, Inc.(a) |
| 12/01/2023 | 5.250% | | 1,078,000 | 1,121,805 |
| MPH Acquisition Holdings LLC(a) |
| 06/01/2024 | 7.125% | | 2,986,000 | 3,210,908 |
| PAREXEL International Corp.(a) |
| 09/01/2025 | 6.375% | | 651,000 | 650,749 |
| Quintiles IMS, Inc.(a) |
| 05/15/2023 | 4.875% | | 1,308,000 | 1,359,937 |
| 10/15/2026 | 5.000% | | 506,000 | 529,872 |
| SP Finco LLC(a) |
| 07/01/2025 | 6.750% | | 2,481,000 | 2,336,256 |
| Sterigenics-Nordion Holdings LLC(a) |
| 05/15/2023 | 6.500% | | 2,051,000 | 2,118,578 |
| Team Health Holdings, Inc.(a) |
| 02/01/2025 | 6.375% | | 1,506,000 | 1,452,858 |
| Teleflex, Inc. |
| 06/01/2026 | 4.875% | | 539,000 | 554,936 |
| Tenet Healthcare Corp. |
| 04/01/2022 | 8.125% | | 1,535,000 | 1,611,048 |
| 06/15/2023 | 6.750% | | 761,000 | 756,385 |
| Tenet Healthcare Corp.(a) |
| 07/15/2024 | 4.625% | | 2,428,000 | 2,431,513 |
| 05/01/2025 | 5.125% | | 3,757,000 | 3,778,749 |
| 08/01/2025 | 7.000% | | 1,406,000 | 1,379,072 |
| Universal Health Services, Inc.(a) |
| 06/01/2026 | 5.000% | | 3,040,000 | 3,200,272 |
| Total | 78,755,664 |
| Healthcare Insurance 0.3% |
| Centene Corp. |
| 02/15/2024 | 6.125% | | 3,126,000 | 3,364,711 |
| 01/15/2025 | 4.750% | | 4,847,000 | 5,049,730 |
| Molina Healthcare, Inc.(a) |
| 06/15/2025 | 4.875% | | 1,252,000 | 1,229,284 |
| WellCare Health Plans, Inc. |
| 04/01/2025 | 5.250% | | 2,627,000 | 2,749,983 |
| Total | 12,393,708 |
| Corporate Bonds & Notes(i) (continued) |
| Issuer | Coupon
Rate | | Principal
Amount ($) | Value ($) |
| Home Construction 0.3% |
| CalAtlantic Group, Inc. |
| 11/15/2024 | 5.875% | | 1,191,000 | 1,292,877 |
| 06/01/2026 | 5.250% | | 601,000 | 620,312 |
| 06/15/2027 | 5.000% | | 971,000 | 971,892 |
| Lennar Corp. |
| 04/30/2024 | 4.500% | | 2,127,000 | 2,196,949 |
| Meritage Homes Corp. |
| 04/01/2022 | 7.000% | | 673,000 | 763,566 |
| Meritage Homes Corp.(a) |
| 06/06/2027 | 5.125% | | 2,223,000 | 2,216,851 |
| Taylor Morrison Communities, Inc./Holdings II(a) |
| 04/15/2023 | 5.875% | | 1,265,000 | 1,341,675 |
| 03/01/2024 | 5.625% | | 695,000 | 733,395 |
| Total | 10,137,517 |
| Independent Energy 1.8% |
| Anadarko Petroleum Corp. |
| 03/15/2040 | 6.200% | | 185,000 | 209,920 |
| 07/15/2044 | 4.500% | | 855,000 | 806,266 |
| Callon Petroleum Co. |
| 10/01/2024 | 6.125% | | 961,000 | 977,806 |
| 10/01/2024 | 6.125% | | 610,000 | 629,027 |
| Canadian Natural Resources Ltd. |
| 06/01/2047 | 4.950% | | 7,475,000 | 7,701,694 |
| Carrizo Oil & Gas, Inc. |
| 04/15/2023 | 6.250% | | 2,712,000 | 2,633,528 |
| Continental Resources, Inc. |
| 06/01/2024 | 3.800% | | 444,000 | 414,363 |
| CrownRock LP/Finance, Inc.(a) |
| 02/15/2023 | 7.750% | | 5,362,000 | 5,670,540 |
| Diamondback Energy, Inc. |
| 11/01/2024 | 4.750% | | 533,000 | 535,155 |
| 05/31/2025 | 5.375% | | 3,049,000 | 3,137,162 |
| Extraction Oil & Gas, Inc.(a) |
| 05/15/2024 | 7.375% | | 1,272,000 | 1,278,358 |
| Extraction Oil & Gas, Inc./Finance Corp.(a) |
| 07/15/2021 | 7.875% | | 1,556,000 | 1,605,456 |
| Halcon Resources Corp.(a) |
| 02/15/2025 | 6.750% | | 959,000 | 965,024 |
| Kosmos Energy Ltd.(a) |
| 08/01/2021 | 7.875% | | 1,808,000 | 1,867,393 |
| 08/01/2021 | 7.875% | | 1,150,000 | 1,179,691 |
| Laredo Petroleum, Inc. |
| 03/15/2023 | 6.250% | | 5,577,000 | 5,700,246 |
| Noble Energy, Inc. |
| 11/15/2043 | 5.250% | | 2,725,000 | 2,823,670 |
The accompanying Notes to Financial Statements are an integral part of this statement.
| 14 | Columbia Strategic Income Fund | Annual Report 2017 |
Portfolio of Investments (continued)
August 31, 2017
| Corporate Bonds & Notes(i) (continued) |
| Issuer | Coupon
Rate | | Principal
Amount ($) | Value ($) |
| Parsley Energy LLC/Finance Corp.(a) |
| 06/01/2024 | 6.250% | | 1,271,000 | 1,323,082 |
| 01/15/2025 | 5.375% | | 2,485,000 | 2,494,704 |
| 08/15/2025 | 5.250% | | 2,621,000 | 2,622,022 |
| PDC Energy, Inc.(a) |
| 09/15/2024 | 6.125% | | 2,717,000 | 2,787,044 |
| RSP Permian, Inc.(a) |
| 01/15/2025 | 5.250% | | 7,119,000 | 7,149,420 |
| SM Energy Co. |
| 06/01/2025 | 5.625% | | 642,000 | 583,260 |
| 09/15/2026 | 6.750% | | 3,680,000 | 3,473,504 |
| WPX Energy, Inc. |
| 01/15/2022 | 6.000% | | 6,536,000 | 6,723,413 |
| 09/15/2024 | 5.250% | | 1,026,000 | 1,008,178 |
| Total | 66,299,926 |
| Integrated Energy 0.4% |
| Cenovus Energy, Inc. |
| 09/15/2042 | 4.450% | | 3,943,000 | 3,302,937 |
| 09/15/2043 | 5.200% | | 8,345,000 | 7,690,343 |
| Lukoil International Finance BV(a) |
| 11/02/2026 | 4.750% | | 2,400,000 | 2,499,468 |
| Total | 13,492,748 |
| Leisure 0.2% |
| Cedar Fair LP/Canada’s Wonderland Co./Magnum Management Corp./Millenium Operations LLC(a) |
| 04/15/2027 | 5.375% | | 1,655,000 | 1,738,107 |
| Live Nation Entertainment, Inc.(a) |
| 11/01/2024 | 4.875% | | 1,163,000 | 1,186,695 |
| LTF Merger Sub, Inc.(a) |
| 06/15/2023 | 8.500% | | 1,037,000 | 1,100,954 |
| Silversea Cruise Finance Ltd.(a) |
| 02/01/2025 | 7.250% | | 1,880,000 | 2,014,678 |
| Total | 6,040,434 |
| Life Insurance 2.6% |
| Brighthouse Financial, Inc.(a) |
| 06/22/2047 | 4.700% | | 10,700,000 | 10,518,207 |
| Five Corners Funding Trust(a) |
| 11/15/2023 | 4.419% | | 22,756,000 | 24,838,834 |
| Guardian Life Insurance Co. of America (The)(a) |
| Subordinated |
| 06/19/2064 | 4.875% | | 9,445,000 | 10,594,759 |
| MetLife, Inc. |
| 03/01/2045 | 4.050% | | 9,740,000 | 9,944,404 |
| Peachtree Corners Funding Trust(a) |
| 02/15/2025 | 3.976% | | 22,118,000 | 22,789,458 |
| Corporate Bonds & Notes(i) (continued) |
| Issuer | Coupon
Rate | | Principal
Amount ($) | Value ($) |
| Teachers Insurance & Annuity Association of America(a) |
| Subordinated |
| 09/15/2044 | 4.900% | | 9,550,000 | 10,856,268 |
| 05/15/2047 | 4.270% | | 2,961,000 | 3,090,265 |
| Voya Financial, Inc. |
| 06/15/2046 | 4.800% | | 1,475,000 | 1,585,508 |
| Total | 94,217,703 |
| Lodging 0.2% |
| Grupo Posadas SAB de CV(a) |
| 06/30/2022 | 7.875% | | 2,650,000 | 2,793,895 |
| Hilton Domestic Operating Co., Inc. |
| 09/01/2024 | 4.250% | | 1,630,000 | 1,662,926 |
| Hilton Grand Vacations Borrower LLC/Inc.(a) |
| 12/01/2024 | 6.125% | | 775,000 | 849,206 |
| Playa Resorts Holding BV(a) |
| 08/15/2020 | 8.000% | | 3,431,000 | 3,579,700 |
| Total | 8,885,727 |
| Media and Entertainment 1.4% |
| 21st Century Fox America, Inc. |
| 09/15/2044 | 4.750% | | 8,832,000 | 9,517,955 |
| AMC Networks, Inc. |
| 04/01/2024 | 5.000% | | 1,135,000 | 1,171,179 |
| Match Group, Inc. |
| 06/01/2024 | 6.375% | | 2,214,000 | 2,408,365 |
| MDC Partners, Inc.(a) |
| 05/01/2024 | 6.500% | | 2,163,000 | 2,160,093 |
| Netflix, Inc. |
| 02/15/2025 | 5.875% | | 2,718,000 | 2,947,079 |
| Netflix, Inc.(a) |
| 11/15/2026 | 4.375% | | 4,541,000 | 4,427,702 |
| Nielsen Finance LLC/Co.(a) |
| 04/15/2022 | 5.000% | | 922,000 | 956,446 |
| Nielsen Luxembourg SARL(a) |
| 02/01/2025 | 5.000% | | 2,622,000 | 2,702,215 |
| Outfront Media Capital LLC/Corp. |
| 03/15/2025 | 5.875% | | 5,248,000 | 5,468,463 |
| Scripps Networks Interactive, Inc. |
| 11/15/2024 | 3.900% | | 7,245,000 | 7,498,807 |
| 06/15/2025 | 3.950% | | 7,400,000 | 7,585,466 |
| Thomson Reuters Corp. |
| 05/23/2043 | 4.500% | | 3,580,000 | 3,713,516 |
| Univision Communications, Inc.(a) |
| 02/15/2025 | 5.125% | | 2,319,000 | 2,327,522 |
| Total | 52,884,808 |
The accompanying Notes to Financial Statements are an integral part of this statement.
Columbia Strategic Income Fund | Annual Report 2017
| 15 |
Portfolio of Investments (continued)
August 31, 2017
| Corporate Bonds & Notes(i) (continued) |
| Issuer | Coupon
Rate | | Principal
Amount ($) | Value ($) |
| Metals and Mining 0.9% |
| Alcoa Nederland Holding BV(a) |
| 09/30/2024 | 6.750% | | 876,000 | 961,201 |
| 09/30/2026 | 7.000% | | 694,000 | 772,884 |
| Big River Steel LLC/Finance Corp.(a) |
| 09/01/2025 | 7.250% | | 1,664,000 | 1,740,564 |
| Constellium NV(a) |
| 05/15/2024 | 5.750% | | 3,722,000 | 3,788,531 |
| 03/01/2025 | 6.625% | | 1,472,000 | 1,537,511 |
| Freeport-McMoRan, Inc. |
| 03/01/2022 | 3.550% | | 790,000 | 777,324 |
| 03/15/2023 | 3.875% | | 1,818,000 | 1,796,618 |
| 11/14/2024 | 4.550% | | 4,139,000 | 4,135,751 |
| Grinding Media, Inc./Moly-Cop AltaSteel Ltd.(a) |
| 12/15/2023 | 7.375% | | 2,080,000 | 2,242,284 |
| HudBay Minerals, Inc.(a) |
| 01/15/2023 | 7.250% | | 506,000 | 544,771 |
| 01/15/2025 | 7.625% | | 1,496,000 | 1,647,017 |
| Noranda Aluminum Acquisition Corp. PIK(a),(l) |
| 10/20/2020 | 10.000% | | 8,653 | 260 |
| Novelis Corp.(a) |
| 08/15/2024 | 6.250% | | 910,000 | 958,917 |
| 09/30/2026 | 5.875% | | 4,288,000 | 4,455,579 |
| Teck Resources Ltd.(a) |
| 06/01/2024 | 8.500% | | 668,000 | 772,611 |
| Teck Resources Ltd. |
| 07/15/2041 | 6.250% | | 6,345,000 | 6,977,933 |
| Total | 33,109,756 |
| Midstream 3.1% |
| Andeavor Logistics LP/Tesoro Finance Corp. |
| 10/15/2022 | 6.250% | | 1,630,000 | 1,722,827 |
| 05/01/2024 | 6.375% | | 1,023,000 | 1,108,664 |
| 01/15/2025 | 5.250% | | 4,443,000 | 4,716,071 |
| Cheniere Corpus Christi Holdings LLC(a) |
| 06/30/2027 | 5.125% | | 1,793,000 | 1,853,180 |
| Delek Logistics Partners LP(a) |
| 05/15/2025 | 6.750% | | 1,539,000 | 1,550,375 |
| Energy Transfer Equity LP |
| 06/01/2027 | 5.500% | | 7,483,000 | 7,977,334 |
| Enterprise Products Operating LLC |
| 02/15/2045 | 5.100% | | 6,635,000 | 7,374,033 |
| 05/15/2046 | 4.900% | | 3,310,000 | 3,590,804 |
| Holly Energy Partners LP/Finance Corp.(a) |
| 08/01/2024 | 6.000% | | 1,445,000 | 1,499,284 |
| Kinder Morgan Energy Partners LP |
| 11/01/2042 | 4.700% | | 2,335,000 | 2,209,263 |
| 03/01/2043 | 5.000% | | 20,788,000 | 20,482,396 |
| Corporate Bonds & Notes(i) (continued) |
| Issuer | Coupon
Rate | | Principal
Amount ($) | Value ($) |
| Kinder Morgan, Inc. |
| 02/15/2046 | 5.050% | | 695,000 | 696,644 |
| NGPL PipeCo LLC(a) |
| 08/15/2022 | 4.375% | | 683,000 | 702,047 |
| 08/15/2027 | 4.875% | | 829,000 | 855,491 |
| 12/15/2037 | 7.768% | | 1,924,000 | 2,388,488 |
| NuStar Logistics LP |
| 04/28/2027 | 5.625% | | 2,709,000 | 2,875,414 |
| Plains All American Pipeline LP/Finance Corp. |
| 06/15/2044 | 4.700% | | 18,390,000 | 16,795,808 |
| Regency Energy Partners LP/Finance Corp. |
| 09/01/2020 | 5.750% | | 1,682,000 | 1,815,583 |
| Tallgrass Energy Partners LP/Finance Corp.(a) |
| 09/15/2024 | 5.500% | | 731,000 | 738,906 |
| Targa Resources Partners LP/Finance Corp. |
| 11/15/2023 | 4.250% | | 2,634,000 | 2,603,801 |
| 03/15/2024 | 6.750% | | 3,045,000 | 3,292,942 |
| Targa Resources Partners LP/Finance Corp.(a) |
| 02/01/2027 | 5.375% | | 3,864,000 | 3,995,712 |
| Williams Companies, Inc. (The) |
| 01/15/2023 | 3.700% | | 809,000 | 801,894 |
| 06/24/2024 | 4.550% | | 9,419,000 | 9,631,248 |
| Williams Partners LP |
| 09/15/2045 | 5.100% | | 11,459,000 | 12,004,746 |
| Total | 113,282,955 |
| Natural Gas 1.0% |
| NiSource Finance Corp. |
| 02/15/2043 | 5.250% | | 3,620,000 | 4,263,593 |
| 05/15/2047 | 4.375% | | 7,500,000 | 8,018,003 |
| Sempra Energy |
| 12/01/2023 | 4.050% | | 8,695,000 | 9,276,704 |
| 06/15/2024 | 3.550% | | 6,059,000 | 6,261,813 |
| 06/15/2027 | 3.250% | | 10,850,000 | 10,824,068 |
| Total | 38,644,181 |
| Oil Field Services 0.1% |
| SESI LLC(a) |
| 09/15/2024 | 7.750% | | 401,000 | 403,878 |
| Weatherford International Ltd. |
| 06/15/2021 | 7.750% | | 1,596,000 | 1,586,416 |
| 06/15/2023 | 8.250% | | 632,000 | 621,065 |
| Total | 2,611,359 |
| Other Financial Institutions 0.0% |
| FTI Consulting, Inc. |
| 11/15/2022 | 6.000% | | 859,000 | 888,215 |
The accompanying Notes to Financial Statements are an integral part of this statement.
| 16 | Columbia Strategic Income Fund | Annual Report 2017 |
Portfolio of Investments (continued)
August 31, 2017
| Corporate Bonds & Notes(i) (continued) |
| Issuer | Coupon
Rate | | Principal
Amount ($) | Value ($) |
| Other Industry 0.1% |
| CB Richard Ellis Services, Inc. |
| 03/15/2025 | 5.250% | | 1,655,000 | 1,849,155 |
| KAR Auction Services, Inc.(a) |
| 06/01/2025 | 5.125% | | 1,313,000 | 1,357,493 |
| Total | 3,206,648 |
| Other REIT 0.0% |
| CyrusOne LP/Finance Corp.(a) |
| 03/15/2024 | 5.000% | | 697,000 | 728,780 |
| 03/15/2027 | 5.375% | | 696,000 | 735,095 |
| Total | 1,463,875 |
| Packaging 0.7% |
| ARD Finance SA PIK |
| 09/15/2023 | 7.125% | | 1,208,000 | 1,281,238 |
| Ardagh Packaging Finance PLC/Holdings USA, Inc.(a) |
| 05/15/2024 | 7.250% | | 2,355,000 | 2,601,222 |
| 02/15/2025 | 6.000% | | 5,086,000 | 5,399,344 |
| Berry Plastics Corp. |
| 10/15/2022 | 6.000% | | 795,000 | 843,831 |
| 07/15/2023 | 5.125% | | 4,020,000 | 4,194,741 |
| Novolex (a) |
| 01/15/2025 | 6.875% | | 654,000 | 679,096 |
| Owens-Brockway Glass Container, Inc.(a) |
| 08/15/2023 | 5.875% | | 1,527,000 | 1,669,672 |
| 08/15/2025 | 6.375% | | 1,801,000 | 2,026,125 |
| Reynolds Group Issuer, Inc./LLC(a) |
| 07/15/2023 | 5.125% | | 2,299,000 | 2,399,666 |
| 07/15/2024 | 7.000% | | 3,073,000 | 3,289,892 |
| Total | 24,384,827 |
| Pharmaceuticals 0.7% |
| Allergan Funding SCS |
| 03/15/2025 | 3.800% | | 3,915,000 | 4,093,097 |
| Amgen, Inc. |
| 06/15/2051 | 4.663% | | 4,060,000 | 4,397,557 |
| Eagle Holding Co., II LLC PIK(a) |
| 05/15/2022 | 7.625% | | 420,000 | 433,558 |
| Endo Dac/Finance LLC/Finco, Inc.(a),(b),(j) |
| 02/01/2025 | 6.000% | | 940,000 | 769,525 |
| Jaguar Holding Co. II/Pharmaceutical Product Development LLC(a) |
| 08/01/2023 | 6.375% | | 2,774,000 | 2,909,962 |
| Mallinckrodt International Finance SA/CB LLC(a) |
| 04/15/2025 | 5.500% | | 1,279,000 | 1,187,875 |
| Corporate Bonds & Notes(i) (continued) |
| Issuer | Coupon
Rate | | Principal
Amount ($) | Value ($) |
| Valeant Pharmaceuticals International, Inc.(a) |
| 07/15/2021 | 7.500% | | 3,913,000 | 3,831,477 |
| 05/15/2023 | 5.875% | | 5,582,000 | 4,758,555 |
| 03/15/2024 | 7.000% | | 4,059,000 | 4,309,010 |
| 04/15/2025 | 6.125% | | 1,026,000 | 864,202 |
| Total | 27,554,818 |
| Property & Casualty 1.0% |
| Hub Holdings LLC/Finance, Inc.(a) |
| PIK |
| 07/15/2019 | 8.125% | | 480,000 | 480,750 |
| HUB International Ltd.(a) |
| 10/01/2021 | 7.875% | | 7,256,000 | 7,552,669 |
| Liberty Mutual Group, Inc.(a) |
| 06/15/2023 | 4.250% | | 10,370,000 | 11,208,114 |
| 08/01/2044 | 4.850% | | 3,460,000 | 3,783,679 |
| Loews Corp. |
| 04/01/2026 | 3.750% | | 11,415,000 | 11,976,858 |
| Total | 35,002,070 |
| Railroads 0.4% |
| CSX Corp. |
| 11/01/2046 | 3.800% | | 11,895,000 | 11,477,605 |
| Union Pacific Corp. |
| 10/01/2051 | 3.799% | | 4,285,000 | 4,251,568 |
| Total | 15,729,173 |
| Restaurants 0.4% |
| 1011778 BC Unlimited Liability Co./New Red Finance, Inc.(a) |
| 05/15/2024 | 4.250% | | 2,348,000 | 2,388,350 |
| 10/15/2025 | 5.000% | | 2,084,000 | 2,134,916 |
| KFC Holding Co./Pizza Hut Holdings LLC/Taco Bell of America LLC(a) |
| 06/01/2026 | 5.250% | | 1,115,000 | 1,174,489 |
| 06/01/2027 | 4.750% | | 1,566,000 | 1,609,958 |
| McDonald’s Corp. |
| 12/09/2045 | 4.875% | | 7,351,000 | 8,306,917 |
| Total | 15,614,630 |
| Retailers 0.5% |
| Asbury Automotive Group, Inc. |
| 12/15/2024 | 6.000% | | 2,662,000 | 2,740,886 |
| Cencosud SA(a) |
| 02/12/2045 | 6.625% | | 1,750,000 | 1,924,414 |
| CVS Health Corp. |
| 06/01/2026 | 2.875% | | 8,285,000 | 8,106,400 |
| Group 1 Automotive, Inc. |
| 06/01/2022 | 5.000% | | 828,000 | 844,803 |
| Group 1 Automotive, Inc.(a) |
| 12/15/2023 | 5.250% | | 2,032,000 | 2,031,079 |
The accompanying Notes to Financial Statements are an integral part of this statement.
Columbia Strategic Income Fund | Annual Report 2017
| 17 |
Portfolio of Investments (continued)
August 31, 2017
| Corporate Bonds & Notes(i) (continued) |
| Issuer | Coupon
Rate | | Principal
Amount ($) | Value ($) |
| L Brands, Inc. |
| 11/01/2035 | 6.875% | | 1,525,000 | 1,458,695 |
| Lithia Motors, Inc.(a) |
| 08/01/2025 | 5.250% | | 350,000 | 356,893 |
| Penske Automotive Group, Inc. |
| 12/01/2024 | 5.375% | | 1,605,000 | 1,622,546 |
| 05/15/2026 | 5.500% | | 1,071,000 | 1,079,971 |
| Total | 20,165,687 |
| Supermarkets 0.1% |
| Kroger Co. (The) |
| 02/01/2047 | 4.450% | | 5,393,000 | 5,203,555 |
| Supranational 0.1% |
| Banque Ouest Africaine de Developpement(a) |
| 07/27/2027 | 5.000% | | 2,400,000 | 2,482,795 |
| Technology 1.5% |
| Ascend Learning LLC(a) |
| 08/01/2025 | 6.875% | | 616,000 | 640,658 |
| Broadcom Corp./Cayman Finance Ltd.(a) |
| 01/15/2027 | 3.875% | | 10,520,000 | 10,843,963 |
| Camelot Finance SA(a) |
| 10/15/2024 | 7.875% | | 1,121,000 | 1,215,973 |
| CDK Global, Inc.(a) |
| 06/01/2027 | 4.875% | | 863,000 | 875,558 |
| Equinix, Inc. |
| 01/15/2026 | 5.875% | | 4,604,000 | 5,055,740 |
| 05/15/2027 | 5.375% | | 2,478,000 | 2,661,922 |
| First Data Corp.(a) |
| 12/01/2023 | 7.000% | | 6,969,000 | 7,506,624 |
| 01/15/2024 | 5.750% | | 2,385,000 | 2,509,094 |
| Gartner, Inc.(a) |
| 04/01/2025 | 5.125% | | 3,384,000 | 3,557,332 |
| Informatica LLC(a) |
| 07/15/2023 | 7.125% | | 1,165,000 | 1,173,155 |
| MSCI, Inc.(a) |
| 08/15/2025 | 5.750% | | 1,566,000 | 1,697,594 |
| PTC, Inc. |
| 05/15/2024 | 6.000% | | 2,399,000 | 2,566,474 |
| Qualitytech LP/Finance Corp. |
| 08/01/2022 | 5.875% | | 3,443,000 | 3,574,106 |
| Solera LLC/Finance, Inc.(a) |
| 03/01/2024 | 10.500% | | 2,100,000 | 2,394,244 |
| 03/01/2024 | 10.500% | | 139,000 | 158,380 |
| Symantec Corp.(a) |
| 04/15/2025 | 5.000% | | 3,050,000 | 3,196,540 |
| Corporate Bonds & Notes(i) (continued) |
| Issuer | Coupon
Rate | | Principal
Amount ($) | Value ($) |
| Tempo Acquisition LLC/Finance Corp.(a) |
| 06/01/2025 | 6.750% | | 969,000 | 990,284 |
| VeriSign, Inc. |
| 05/01/2023 | 4.625% | | 1,734,000 | 1,788,302 |
| 04/01/2025 | 5.250% | | 2,495,000 | 2,661,284 |
| VeriSign, Inc.(a) |
| 07/15/2027 | 4.750% | | 1,460,000 | 1,488,936 |
| Total | 56,556,163 |
| Transportation Services 1.0% |
| ACI Airport SudAmerica SA(a) |
| 11/29/2032 | 6.875% | | 1,670,250 | 1,707,231 |
| Avis Budget Car Rental LLC/Finance, Inc. |
| 04/01/2023 | 5.500% | | 194,000 | 195,364 |
| Avis Budget Car Rental LLC/Finance, Inc.(a) |
| 03/15/2025 | 5.250% | | 3,310,000 | 3,236,022 |
| Concesionaria Mexiquense SA de CV(a) |
| (linked to Mexican Unidad de Inversion Index) |
| 12/15/2035 | 5.950% | MXN | 34,763,826 | 1,889,069 |
| ERAC U.S.A. Finance LLC(a) |
| 02/15/2045 | 4.500% | | 11,606,000 | 11,661,303 |
| ERAC USA Finance LLC(a) |
| 12/01/2026 | 3.300% | | 9,780,000 | 9,682,425 |
| FedEx Corp. |
| 04/01/2046 | 4.550% | | 5,000,000 | 5,294,015 |
| Hertz Corp. (The)(a) |
| 06/01/2022 | 7.625% | | 1,929,000 | 1,955,618 |
| Total | 35,621,047 |
| Wireless 1.3% |
| Comcel Trust(a) |
| 02/06/2024 | 6.875% | | 1,750,000 | 1,862,668 |
| SBA Communications Corp. |
| 09/01/2024 | 4.875% | | 8,706,000 | 9,014,880 |
| SFR Group SA(a) |
| 05/15/2022 | 6.000% | | 2,353,000 | 2,461,311 |
| 05/15/2024 | 6.250% | | 2,566,000 | 2,685,804 |
| 05/01/2026 | 7.375% | | 4,000,000 | 4,317,060 |
| Sprint Capital Corp. |
| 11/15/2028 | 6.875% | | 820,000 | 900,925 |
| Sprint Communications, Inc.(a) |
| 03/01/2020 | 7.000% | | 6,100,000 | 6,679,903 |
| Sprint Corp. |
| 09/15/2023 | 7.875% | | 1,691,000 | 1,930,703 |
| 06/15/2024 | 7.125% | | 1,762,000 | 1,932,258 |
| 02/15/2025 | 7.625% | | 6,740,000 | 7,585,803 |
| T-Mobile USA, Inc. |
| 01/15/2026 | 6.500% | | 7,774,000 | 8,620,798 |
The accompanying Notes to Financial Statements are an integral part of this statement.
| 18 | Columbia Strategic Income Fund | Annual Report 2017 |
Portfolio of Investments (continued)
August 31, 2017
| Corporate Bonds & Notes(i) (continued) |
| Issuer | Coupon
Rate | | Principal
Amount ($) | Value ($) |
| Wind Acquisition Finance SA(a) |
| 04/23/2021 | 7.375% | | 763,000 | 792,873 |
| Total | 48,784,986 |
| Wirelines 1.5% |
| AT&T, Inc. |
| 06/15/2045 | 4.350% | | 18,935,000 | 17,247,191 |
| CenturyLink, Inc. |
| 04/01/2024 | 7.500% | | 5,796,000 | 6,070,238 |
| Frontier Communications Corp. |
| 04/15/2024 | 7.625% | | 978,000 | 772,524 |
| 01/15/2025 | 6.875% | | 1,685,000 | 1,277,402 |
| 09/15/2025 | 11.000% | | 3,751,000 | 3,270,103 |
| Level 3 Communications, Inc. |
| 12/01/2022 | 5.750% | | 3,346,000 | 3,446,510 |
| Level 3 Financing, Inc. |
| 01/15/2024 | 5.375% | | 793,000 | 811,486 |
| 03/15/2026 | 5.250% | | 2,029,000 | 2,073,500 |
| Liquid Telecommunications Financing PLC(a) |
| 07/13/2022 | 8.500% | | 2,750,000 | 2,865,701 |
| Telecom Italia Capital SA |
| 09/30/2034 | 6.000% | | 2,658,000 | 2,948,511 |
| Telecom Italia SpA(a) |
| 05/30/2024 | 5.303% | | 92,000 | 99,975 |
| Verizon Communications, Inc. |
| 03/15/2055 | 4.672% | | 8,620,000 | 8,025,754 |
| Zayo Group LLC/Capital, Inc.(a) |
| 01/15/2027 | 5.750% | | 5,511,000 | 5,838,954 |
| Total | 54,747,849 |
Total Corporate Bonds & Notes
(Cost $1,404,571,321) | 1,471,819,286 |
|
| Foreign Government Obligations(i),(m) 11.2% |
| | | | |
| Argentina 0.7% |
| Argentine Republic Government International Bond |
| 04/22/2026 | 7.500% | | 1,780,000 | 1,992,909 |
| 01/26/2027 | 6.875% | | 1,578,000 | 1,699,942 |
| 07/06/2028 | 6.625% | | 3,960,000 | 4,151,387 |
| 07/06/2036 | 7.125% | | 2,000,000 | 2,098,608 |
| 04/22/2046 | 7.625% | | 1,100,000 | 1,208,118 |
| Argentine Republic Government International Bond(b),(j) |
| 12/31/2033 | 8.280% | | 1,682,446 | 1,910,637 |
| Argentine Republic Government International Bond(a) |
| 06/28/2117 | 7.125% | | 2,200,000 | 2,173,945 |
| City of Buenos Aires Argentina(a) |
| 06/01/2027 | 7.500% | | 1,700,000 | 1,870,211 |
| Foreign Government Obligations(i),(m) (continued) |
| Issuer | Coupon
Rate | | Principal
Amount ($) | Value ($) |
| Provincia de Buenos Aires(a) |
| 06/09/2021 | 9.950% | | 1,200,000 | 1,380,174 |
| 06/15/2027 | 7.875% | | 1,900,000 | 2,052,428 |
| Provincia de Cordoba(a) |
| 09/01/2024 | 7.450% | | 2,725,000 | 2,937,234 |
| 08/01/2027 | 7.125% | | 3,500,000 | 3,591,581 |
| Total | 27,067,174 |
| Azerbaijan 0.1% |
| Southern Gas Corridor CJSC(a) |
| 03/24/2026 | 6.875% | | 3,100,000 | 3,468,773 |
| Belarus 0.1% |
| Republic of Belarus International Bond(a) |
| 02/28/2023 | 6.875% | | 1,200,000 | 1,288,003 |
| 06/29/2027 | 7.625% | | 2,300,000 | 2,540,387 |
| Total | 3,828,390 |
| Brazil 1.1% |
| Brazil Minas SPE via State of Minas Gerais(a) |
| 02/15/2028 | 5.333% | | 800,000 | 809,021 |
| Brazil Notas do Tesouro Nacional Series F |
| 01/01/2025 | 10.000% | BRL | 67,000,000 | 21,879,233 |
| Brazilian Government International Bond |
| 01/20/2034 | 8.250% | | 2,460,000 | 3,189,535 |
| 01/07/2041 | 5.625% | | 5,800,000 | 5,812,945 |
| Petrobras Global Finance BV |
| 01/27/2021 | 5.375% | | 1,880,000 | 1,944,010 |
| 05/23/2021 | 8.375% | | 2,400,000 | 2,725,181 |
| 03/17/2024 | 6.250% | | 208,000 | 220,413 |
| 05/23/2026 | 8.750% | | 3,600,000 | 4,310,550 |
| 01/17/2027 | 7.375% | | 680,000 | 751,212 |
| Total | 41,642,100 |
| Canada 1.1% |
| Canadian Government Bond |
| 05/01/2019 | 0.750% | CAD | 45,100,000 | 35,820,903 |
| NOVA Chemicals Corp.(a) |
| 06/01/2024 | 4.875% | | 1,000,000 | 1,003,331 |
| 05/01/2025 | 5.000% | | 2,133,000 | 2,129,875 |
| 06/01/2027 | 5.250% | | 2,059,000 | 2,050,694 |
| Total | 41,004,803 |
| China 0.3% |
| State Grid Overseas Investment 2016 Ltd.(a) |
| 05/04/2027 | 3.500% | | 11,000,000 | 11,328,229 |
The accompanying Notes to Financial Statements are an integral part of this statement.
Columbia Strategic Income Fund | Annual Report 2017
| 19 |
Portfolio of Investments (continued)
August 31, 2017
| Foreign Government Obligations(i),(m) (continued) |
| Issuer | Coupon
Rate | | Principal
Amount ($) | Value ($) |
| Colombia 0.4% |
| Colombia Government International Bond |
| 04/14/2021 | 7.750% | COP | 9,150,000,000 | 3,310,517 |
| 06/28/2027 | 9.850% | COP | 19,242,000,000 | 8,158,920 |
| 02/26/2044 | 5.625% | | 2,100,000 | 2,361,767 |
| Ecopetrol SA |
| 09/18/2043 | 7.375% | | 1,900,000 | 2,148,993 |
| Total | 15,980,197 |
| Costa Rica 0.1% |
| Costa Rica Government International Bond(a) |
| 03/12/2045 | 7.158% | | 3,500,000 | 3,737,401 |
| Croatia 0.1% |
| Croatia Government International Bond(a) |
| 01/26/2024 | 6.000% | | 4,692,000 | 5,357,382 |
| Dominican Republic 0.7% |
| Dominican Republic International Bond(a) |
| 02/22/2019 | 12.000% | DOP | 31,000,000 | 673,478 |
| 07/05/2019 | 14.500% | DOP | 101,000,000 | 2,315,244 |
| 01/08/2021 | 14.000% | DOP | 79,470,000 | 1,860,618 |
| 03/04/2022 | 10.375% | DOP | 281,400,000 | 6,019,360 |
| 02/10/2023 | 14.500% | DOP | 25,000,000 | 613,023 |
| 01/25/2027 | 5.950% | | 3,875,000 | 4,214,020 |
| 04/20/2027 | 8.625% | | 2,900,000 | 3,548,962 |
| 04/30/2044 | 7.450% | | 3,900,000 | 4,671,042 |
| 01/27/2045 | 6.850% | | 2,681,000 | 3,014,605 |
| Total | 26,930,352 |
| Ecuador 0.2% |
| Ecuador Government International Bond(a) |
| 03/24/2020 | 10.500% | | 2,050,000 | 2,198,484 |
| 03/28/2022 | 10.750% | | 2,200,000 | 2,413,589 |
| 12/13/2026 | 9.650% | | 1,000,000 | 1,050,312 |
| Total | 5,662,385 |
| Egypt 0.2% |
| Egypt Government International Bond(a) |
| 01/31/2022 | 6.125% | | 1,700,000 | 1,770,860 |
| 06/11/2025 | 5.875% | | 1,000,000 | 1,017,408 |
| 01/31/2027 | 7.500% | | 3,900,000 | 4,312,936 |
| 01/31/2047 | 8.500% | | 1,700,000 | 1,917,581 |
| Total | 9,018,785 |
| El Salvador 0.1% |
| El Salvador Government International Bond(a) |
| 01/18/2027 | 6.375% | | 450,000 | 433,897 |
| 02/28/2029 | 8.625% | | 1,500,000 | 1,647,957 |
| 06/15/2035 | 7.650% | | 490,000 | 488,183 |
| Total | 2,570,037 |
| Foreign Government Obligations(i),(m) (continued) |
| Issuer | Coupon
Rate | | Principal
Amount ($) | Value ($) |
| Georgia 0.1% |
| Georgian Railway JSC(a) |
| 07/11/2022 | 7.750% | | 2,683,000 | 2,958,166 |
| Ghana 0.1% |
| Ghana Government International Bond(a) |
| 10/14/2030 | 10.750% | | 3,500,000 | 4,532,573 |
| Guatemala 0.1% |
| Guatemala Government Bond(a) |
| 06/05/2027 | 4.375% | | 2,700,000 | 2,687,677 |
| Honduras 0.2% |
| Honduras Government International Bond(a) |
| 03/15/2024 | 7.500% | | 2,668,000 | 3,022,182 |
| 01/19/2027 | 6.250% | | 3,500,000 | 3,764,516 |
| Total | 6,786,698 |
| Hungary 0.2% |
| Hungary Government International Bond |
| 11/22/2023 | 5.750% | | 5,382,000 | 6,291,504 |
| Magyar Export-Import Bank Zrt.(a) |
| 01/30/2020 | 4.000% | | 1,579,000 | 1,637,098 |
| Total | 7,928,602 |
| Indonesia 1.0% |
| Indonesia Government International Bond(a) |
| 03/13/2020 | 5.875% | | 11,125,000 | 12,150,925 |
| 04/25/2022 | 3.750% | | 1,200,000 | 1,245,938 |
| 01/15/2024 | 5.875% | | 1,288,000 | 1,490,219 |
| 01/17/2038 | 7.750% | | 3,550,000 | 5,074,647 |
| Majapahit Holding BV(a) |
| 01/20/2020 | 7.750% | | 1,100,000 | 1,233,874 |
| 06/29/2037 | 7.875% | | 2,780,000 | 3,693,547 |
| PT Pertamina Persero(a) |
| 05/03/2022 | 4.875% | | 1,600,000 | 1,724,555 |
| 05/30/2044 | 6.450% | | 2,600,000 | 3,076,921 |
| PT Perusahaan Listrik Negara(a) |
| 11/22/2021 | 5.500% | | 5,400,000 | 5,955,774 |
| Total | 35,646,400 |
| Ivory Coast 0.3% |
| Ivory Coast Government International Bond(a) |
| 07/23/2024 | 5.375% | | 2,000,000 | 2,014,294 |
| 07/23/2024 | 5.375% | | 700,000 | 705,003 |
| 06/15/2025 | 5.125% | EUR | 700,000 | 864,556 |
| 03/03/2028 | 6.375% | | 5,400,000 | 5,628,857 |
| 06/15/2033 | 6.125% | | 847,000 | 845,738 |
The accompanying Notes to Financial Statements are an integral part of this statement.
| 20 | Columbia Strategic Income Fund | Annual Report 2017 |
Portfolio of Investments (continued)
August 31, 2017
| Foreign Government Obligations(i),(m) (continued) |
| Issuer | Coupon
Rate | | Principal
Amount ($) | Value ($) |
| Ivory Coast Government International Bond(a),(b),(j) |
| 12/31/2032 | 5.750% | | 901,310 | 897,149 |
| Total | 10,955,597 |
| Jamaica 0.1% |
| Jamaica Government International Bond |
| 04/28/2028 | 6.750% | | 1,950,000 | 2,271,374 |
| 03/15/2039 | 8.000% | | 700,000 | 863,102 |
| Total | 3,134,476 |
| Kazakhstan 0.2% |
| Kazakhstan Government International Bond(a) |
| 07/21/2045 | 6.500% | | 3,500,000 | 4,339,587 |
| KazMunayGas National Co. JSC(a) |
| 07/02/2018 | 9.125% | | 1,980,000 | 2,089,597 |
| 04/09/2021 | 6.375% | | 500,000 | 550,414 |
| Total | 6,979,598 |
| Kuwait 0.1% |
| Equate Petrochemical BV(a) |
| 11/03/2026 | 4.250% | | 1,900,000 | 1,965,191 |
| Mexico 1.4% |
| Banco Nacional de Comercio Exterior SNC(a),(b),(j) |
| Subordinated |
| 08/11/2026 | 3.800% | | 1,400,000 | 1,399,807 |
| Mexican Bonos |
| 06/11/2020 | 8.000% | MXN | 44,530,000 | 2,567,065 |
| 06/10/2021 | 6.500% | MXN | 50,000 | 2,772 |
| 06/09/2022 | 6.500% | MXN | 144,272,800 | 7,982,704 |
| Mexico City Airport Trust(a) |
| 10/31/2026 | 4.250% | | 1,500,000 | 1,549,901 |
| Mexico Government International Bond |
| 05/29/2031 | 7.750% | MXN | 140,000,000 | 8,312,332 |
| 01/11/2040 | 6.050% | | 2,350,000 | 2,847,413 |
| 01/23/2046 | 4.600% | | 1,800,000 | 1,840,973 |
| Pemex Finance Ltd. |
| 11/15/2018 | 9.150% | | 776,562 | 819,084 |
| Pemex Project Funding Master Trust |
| 01/21/2021 | 5.500% | | 1,750,000 | 1,879,033 |
| Petroleos Mexicanos(a) |
| 11/24/2021 | 7.650% | MXN | 18,600,000 | 1,008,330 |
| 09/12/2024 | 7.190% | MXN | 3,800,000 | 192,683 |
| 03/13/2027 | 6.500% | | 1,800,000 | 2,017,024 |
| 03/13/2027 | 6.500% | | 1,200,000 | 1,343,964 |
| Petroleos Mexicanos |
| 01/30/2023 | 3.500% | | 750,000 | 743,492 |
| 09/21/2023 | 4.625% | | 948,000 | 988,509 |
| 01/23/2026 | 4.500% | | 900,000 | 907,523 |
| 08/04/2026 | 6.875% | | 3,000,000 | 3,449,055 |
| 11/12/2026 | 7.470% | MXN | 23,700,000 | 1,193,084 |
| Foreign Government Obligations(i),(m) (continued) |
| Issuer | Coupon
Rate | | Principal
Amount ($) | Value ($) |
| 06/15/2035 | 6.625% | | 870,000 | 948,866 |
| 06/02/2041 | 6.500% | | 2,500,000 | 2,634,082 |
| 01/23/2045 | 6.375% | | 4,000,000 | 4,126,420 |
| 09/21/2047 | 6.750% | | 2,000,000 | 2,150,582 |
| Total | 50,904,698 |
| Morocco 0.1% |
| Morocco Government International Bond(a) |
| 12/11/2022 | 4.250% | | 1,804,000 | 1,922,212 |
| Namibia 0.1% |
| Namibia International Bonds(a) |
| 11/03/2021 | 5.500% | | 3,192,000 | 3,452,582 |
| Nigeria 0.1% |
| Nigeria Government International Bond(a) |
| 02/16/2032 | 7.875% | | 2,200,000 | 2,456,630 |
| Pakistan 0.2% |
| Pakistan Government International Bond(a) |
| 09/30/2025 | 8.250% | | 2,300,000 | 2,625,841 |
| 03/31/2036 | 7.875% | | 5,700,000 | 5,991,931 |
| Total | 8,617,772 |
| Paraguay 0.2% |
| Paraguay Government International Bond(a) |
| 03/27/2027 | 4.700% | | 2,464,000 | 2,580,062 |
| 08/11/2044 | 6.100% | | 2,439,000 | 2,784,467 |
| Total | 5,364,529 |
| Peru 0.3% |
| Peruvian Government International Bond(a) |
| 08/12/2028 | 6.350% | PEN | 27,300,000 | 9,053,706 |
| Peruvian Government International Bond |
| 11/21/2033 | 8.750% | | 1,508,000 | 2,374,548 |
| Total | 11,428,254 |
| Philippines 0.0% |
| Philippine Government International Bond |
| 03/30/2026 | 5.500% | | 798,000 | 962,641 |
| Russian Federation 0.5% |
| Gazprom Neft OAO Via GPN Capital SA(a) |
| 09/19/2022 | 4.375% | | 4,800,000 | 4,879,099 |
| Gazprom OAO Via Gaz Capital SA(a) |
| 04/11/2018 | 8.146% | | 1,013,000 | 1,048,117 |
| 02/06/2028 | 4.950% | | 1,000,000 | 1,017,738 |
| 08/16/2037 | 7.288% | | 300,000 | 362,731 |
| Russian Agricultural Bank OJSC Via RSHB Capital SA(a) |
| 12/27/2017 | 5.298% | | 300,000 | 302,553 |
The accompanying Notes to Financial Statements are an integral part of this statement.
Columbia Strategic Income Fund | Annual Report 2017
| 21 |
Portfolio of Investments (continued)
August 31, 2017
| Foreign Government Obligations(i),(m) (continued) |
| Issuer | Coupon
Rate | | Principal
Amount ($) | Value ($) |
| Russian Federal Bond - OFZ |
| 01/19/2028 | 7.050% | RUB | 347,000,000 | 5,775,903 |
| Russian Foreign Bond - Eurobond(a) |
| 04/04/2042 | 5.625% | | 4,000,000 | 4,528,676 |
| Total | 17,914,817 |
| Senegal 0.1% |
| Senegal Government International Bond(a) |
| 07/30/2024 | 6.250% | | 2,905,000 | 3,107,264 |
| Serbia 0.1% |
| Serbia International Bond(a) |
| 12/03/2018 | 5.875% | | 1,735,000 | 1,809,265 |
| 09/28/2021 | 7.250% | | 1,600,000 | 1,855,933 |
| Total | 3,665,198 |
| Sri Lanka 0.1% |
| Sri Lanka Government International Bond(a) |
| 07/18/2026 | 6.825% | | 1,685,000 | 1,849,594 |
| 05/11/2027 | 6.200% | | 1,450,000 | 1,524,400 |
| Total | 3,373,994 |
| Trinidad and Tobago 0.1% |
| Petroleum Co. of Trinidad & Tobago Ltd.(a) |
| 08/14/2019 | 9.750% | | 4,000,000 | 4,366,324 |
| Turkey 0.2% |
| Turkey Government International Bond |
| 03/25/2027 | 6.000% | | 8,000,000 | 8,789,240 |
| Ukraine 0.1% |
| Ukraine Government International Bond(a) |
| 09/01/2024 | 7.750% | | 1,200,000 | 1,237,562 |
| 09/01/2026 | 7.750% | | 2,600,000 | 2,666,802 |
| Total | 3,904,364 |
| United Arab Emirates 0.0% |
| DAE Funding LLC(a) |
| 08/01/2024 | 5.000% | | 1,525,000 | 1,558,953 |
Total Foreign Government Obligations
(Cost $398,322,508) | 412,960,458 |
|
| Inflation-Indexed Bonds(i) 3.1% |
| | | | |
| Brazil 0.0% |
| Brazil Notas do Tesouro Nacional |
| 08/15/2030 | 6.000% | BRL | 3,006,380 | 1,037,330 |
| Mexico 0.2% |
| Mexican Udibonos |
| 11/15/2040 | 4.000% | MXN | 104,291,478 | 6,275,968 |
| Inflation-Indexed Bonds(i) (continued) |
| Issuer | Coupon
Rate | | Principal
Amount ($) | Value ($) |
| United States 2.9% |
| U.S. Treasury Inflation-Indexed Bond |
| 04/15/2022 | 0.125% | | 35,756,665 | 35,877,429 |
| 07/15/2027 | 0.375% | | 5,006,900 | 5,015,537 |
| U.S. Treasury Inflation-Indexed Bond(n) |
| 01/15/2024 | 0.625% | | 13,665,507 | 14,042,237 |
| 02/15/2046 | 1.000% | | 51,349,343 | 52,916,226 |
| Total | 107,851,429 |
Total Inflation-Indexed Bonds
(Cost $117,969,112) | 115,164,727 |
|
| Residential Mortgage-Backed Securities - Agency 4.7% |
| | | | |
| Federal Home Loan Mortgage Corp. |
| 01/01/2020 | 10.500% | | 984 | 990 |
| Federal Home Loan Mortgage Corp.(b),(o) |
| CMO Series 2957 Class SW |
1-month USD LIBOR + 6.000%
04/15/2035 | 4.773% | | 3,112,924 | 454,259 |
| CMO Series 311 Class S1 |
1-month USD LIBOR + 5.950%
08/15/2043 | 4.723% | | 30,872,532 | 6,415,925 |
| CMO Series 318 Class S1 |
1-month USD LIBOR + 5.950%
11/15/2043 | 4.723% | | 9,265,046 | 1,968,180 |
| CMO Series 326 Class S2 |
1-month USD LIBOR + 5.950%
03/15/2044 | 4.723% | | 31,851,478 | 6,122,192 |
| CMO Series 3761 Class KS |
1-month USD LIBOR + 6.000%
06/15/2040 | 4.773% | | 3,527,522 | 253,303 |
| CMO Series 4174 Class SB |
1-month USD LIBOR + 6.200%
05/15/2039 | 4.973% | | 12,349,832 | 1,627,083 |
| CMO STRIPS Series 326 Class S1 |
1-month USD LIBOR + 6.000%
03/15/2044 | 4.773% | | 3,462,117 | 699,410 |
| Federal Home Loan Mortgage Corp.(o) |
| CMO Series 304 Class C69 |
| 12/15/2042 | 4.000% | | 11,557,845 | 2,130,861 |
| CMO Series 4098 Class AI |
| 05/15/2039 | 3.500% | | 9,668,776 | 962,294 |
The accompanying Notes to Financial Statements are an integral part of this statement.
| 22 | Columbia Strategic Income Fund | Annual Report 2017 |
Portfolio of Investments (continued)
August 31, 2017
| Residential Mortgage-Backed Securities - Agency (continued) |
| Issuer | Coupon
Rate | | Principal
Amount ($) | Value ($) |
| CMO Series 4120 Class AI |
| 11/15/2039 | 3.500% | | 9,152,083 | 922,810 |
| CMO Series 4121 Class IA |
| 01/15/2041 | 3.500% | | 8,990,584 | 1,133,111 |
| CMO Series 4147 Class CI |
| 01/15/2041 | 3.500% | | 19,690,091 | 2,646,908 |
| CMO Series 4213 Class DI |
| 06/15/2038 | 3.500% | | 15,971,289 | 1,506,648 |
| Federal Home Loan Mortgage Corp.(b),(g),(o) |
| CMO Series 4515 Class SA |
| 08/15/2038 | 1.661% | | 22,479,988 | 1,224,694 |
| CMO Series 4620 Class AS |
| 11/15/2042 | 1.565% | | 46,954,754 | 2,187,809 |
| Federal National Mortgage Association(d) |
| 09/18/2032 | 3.000% | | 19,000,000 | 19,617,500 |
| Federal National Mortgage Association |
| 05/01/2041 | 4.000% | | 3,898,250 | 4,089,051 |
| Federal National Mortgage Association(b),(g),(o) |
| CMO Series 2006-5 Class N1 |
| 08/25/2034 | 0.000% | | 12,137,038 | 1 |
| Federal National Mortgage Association(b),(o) |
| CMO Series 2010-135 Class MS |
1-month USD LIBOR + 5.950%
12/25/2040 | 4.716% | | 1,848,979 | 273,681 |
| CMO Series 2013-101 Class CS |
1-month USD LIBOR + 5.900%
10/25/2043 | 4.876% | | 20,033,461 | 4,570,923 |
| CMO Series 2013-107 Class SB |
1-month USD LIBOR + 5.950%
02/25/2043 | 4.716% | | 15,729,339 | 3,472,475 |
| CMO Series 2014-93 Class ES |
1-month USD LIBOR + 6.150%
01/25/2045 | 4.916% | | 31,694,630 | 6,058,891 |
| CMO Series 2016-31 Class H5 |
1-month USD LIBOR + 6.000%
06/25/2046 | 4.766% | | 30,122,688 | 6,559,224 |
| CMO Series 2016-31 Class VS |
1-month USD LIBOR + 6.000%
06/25/2046 | 4.766% | | 24,939,144 | 4,925,743 |
| CMO Series 2016-42 Class SB |
1-month USD LIBOR + 6.000%
07/25/2046 | 4.766% | | 66,492,733 | 14,951,091 |
| Residential Mortgage-Backed Securities - Agency (continued) |
| Issuer | Coupon
Rate | | Principal
Amount ($) | Value ($) |
| CMO Series 2016-54 Class SD |
1-month USD LIBOR + 6.000%
08/25/2046 | 4.766% | | 26,972,715 | 5,961,738 |
| CMO Series 2017-8 Class SB |
1-month USD LIBOR + 6.100%
02/25/2047 | 4.866% | | 19,768,276 | 3,538,632 |
| Federal National Mortgage Association(o) |
| CMO Series 2012-118 Class BI |
| 12/25/2039 | 3.500% | | 14,138,547 | 1,806,554 |
| CMO Series 2012-121 Class GI |
| 08/25/2039 | 3.500% | | 10,222,430 | 1,189,327 |
| CMO Series 2012-129 Class IC |
| 01/25/2041 | 3.500% | | 9,384,370 | 1,365,906 |
| CMO Series 2012-131 Class MI |
| 01/25/2040 | 3.500% | | 13,817,193 | 1,915,350 |
| CMO Series 2012-133 Class EI |
| 07/25/2031 | 3.500% | | 5,411,143 | 584,287 |
| CMO Series 2012-139 Class IL |
| 04/25/2040 | 3.500% | | 7,534,839 | 963,542 |
| CMO Series 2012-96 Class CI |
| 04/25/2039 | 3.500% | | 9,975,112 | 857,270 |
| CMO Series 2013-1 Class AI |
| 02/25/2043 | 3.500% | | 5,895,311 | 1,129,841 |
| CMO Series 2013-6 Class MI |
| 02/25/2040 | 3.500% | | 9,089,069 | 1,165,699 |
| CMO STRIPS Series 417 Class C5 |
| 02/25/2043 | 3.500% | | 8,785,234 | 1,650,252 |
| Government National Mortgage Association(d) |
| 09/21/2047 | 3.000% | | 32,000,000 | 32,663,750 |
| Government National Mortgage Association(o) |
| CMO Series 2014-190 Class AI |
| 12/20/2038 | 3.500% | | 19,936,227 | 2,458,203 |
| Government National Mortgage Association(b),(o) |
| CMO Series 2015-144 Class SA |
1-month USD LIBOR + 6.200%
10/20/2045 | 4.969% | | 12,860,095 | 3,103,531 |
| CMO Series 2016-108 Class SN |
1-month USD LIBOR + 6.080%
08/20/2046 | 4.849% | | 18,999,396 | 4,684,731 |
| CMO Series 2016-146 Class NS |
1-month USD LIBOR + 6.100%
10/20/2046 | 4.869% | | 9,502,197 | 2,291,654 |
The accompanying Notes to Financial Statements are an integral part of this statement.
Columbia Strategic Income Fund | Annual Report 2017
| 23 |
Portfolio of Investments (continued)
August 31, 2017
| Residential Mortgage-Backed Securities - Agency (continued) |
| Issuer | Coupon
Rate | | Principal
Amount ($) | Value ($) |
| CMO Series 2016-91 Class NS |
1-month USD LIBOR + 6.080%
07/20/2046 | 4.849% | | 41,673,084 | 10,521,629 |
Total Residential Mortgage-Backed Securities - Agency
(Cost $183,732,170) | 172,626,953 |
|
| Residential Mortgage-Backed Securities - Non-Agency 16.0% |
| | | | |
| Ajax Mortgage Loan Trust(a) |
| CMO Series 2016-C Class A |
| 10/25/2057 | 4.000% | | 10,733,056 | 10,735,645 |
| Angel Oak Mortgage Trust I LLC(a) |
| Series 2016-1 Class A1 |
| 07/25/2046 | 3.500% | | 9,330,357 | 9,505,706 |
| Series 2016-1 Class A2 |
| 07/25/2046 | 5.000% | | 2,011,462 | 2,000,579 |
| Angel Oak Mortgage Trust LLC(a) |
| Series 2015-1 |
| 11/25/2045 | 4.500% | | 2,854,847 | 2,852,424 |
| Banc of America Funding Trust(a),(b),(c),(g) |
| CMO Series 2016-R1 Class M2 |
| 03/25/2040 | 3.500% | | 12,763,517 | 12,201,922 |
| Bayview Opportunity Master Fund IIa Trust(a),(c) |
| CMO Series 2017-RN5 Class A1 |
| 08/28/2032 | 3.105% | | 8,000,000 | 8,000,000 |
| Bayview Opportunity Master Fund IIIb Trust(a),(b),(g) |
| CMO Series 2017-RN2 Class A1 |
| 04/28/2032 | 3.475% | | 15,537,194 | 15,659,956 |
| Bayview Opportunity Master Fund IIIb Trust(a),(c) |
| CMO Series 2017-RN6 Class A1 |
| 08/28/2032 | 3.105% | | 15,000,000 | 15,000,000 |
| Bayview Opportunity Master Fund IVb Trust(a) |
| CMO Series 2017-NPL1 Class A1 |
| 01/28/2032 | 3.598% | | 12,424,392 | 12,402,568 |
| CMO Series 2017-RPL1 Class A1 |
| 07/28/2032 | 3.105% | | 17,103,380 | 17,103,380 |
| Bayview Opportunity Master Fund IVB Trust(a) |
| CMO Series 2016-RN4 Class A1 |
| 10/28/2031 | 3.475% | | 4,136,686 | 4,158,765 |
| BCAP LLC Trust(a),(b),(g) |
| CMO Series 2013-RR3 Class 6A5 |
| 03/26/2036 | 3.274% | | 285,435 | 283,000 |
| CMO Series 2013-RR5 Class 4A1 |
| 09/26/2036 | 3.000% | | 2,340,303 | 2,326,729 |
| BCAP LLC Trust(a),(b) |
| Series 2011-RR5 Class 11A4 |
1-month USD LIBOR + 0.150%
05/28/2036 | 1.382% | | 5,417,602 | 5,229,696 |
| Residential Mortgage-Backed Securities - Non-Agency (continued) |
| Issuer | Coupon
Rate | | Principal
Amount ($) | Value ($) |
| BCAP LLC Trust(a) |
| Series 2013-RR1 Class 10A1 |
| 10/26/2036 | 3.000% | | 624,545 | 625,397 |
| Bellemeade Re II Ltd.(a),(b) |
| CMO Series 2016-1A Class M2A |
1-month USD LIBOR + 4.500%
04/25/2026 | 5.734% | | 790,137 | 791,562 |
| CAM Mortgage Trust(a) |
| CMO Series 2016-1 Class A |
| 01/15/2056 | 4.000% | | 606,961 | 607,494 |
| CMO Series 2016-2 Class A1 |
| 06/15/2057 | 3.250% | | 16,816,160 | 16,817,192 |
| CIM Trust(a),(b) |
| CMO Series 2015-3AG Class A2 |
1-month USD LIBOR + 3.500%
10/25/2057 | 4.737% | | 10,000,000 | 10,129,339 |
| CIM Trust(a),(c) |
| CMO Series 2017-6 Class A1 |
| 09/25/2037 | 3.000% | | 37,815,000 | 37,860,832 |
| Citigroup Mortgage Loan Trust, Inc.(a),(b),(g) |
| CMO Series 2009-4 Class 9A2 |
| 03/25/2036 | 3.288% | | 2,710,458 | 2,526,623 |
| CMO Series 2010-6 Class 2A2 |
| 09/25/2035 | 3.288% | | 1,143,314 | 1,124,678 |
| CMO Series 2010-7 Class 3A4 |
| 12/25/2035 | 5.500% | | 798,866 | 800,784 |
| CMO Series 2013-11 Class 3A3 |
| 09/25/2034 | 3.497% | | 4,670,692 | 4,581,015 |
| CMO Series 2013-2 Class 1A1 |
| 11/25/2037 | 3.255% | | 1,021,778 | 1,026,530 |
| Citigroup Mortgage Loan Trust, Inc.(a),(b) |
| CMO Series 2014-11 Class 3A3 |
1-month USD LIBOR + 0.160%
09/25/2036 | 1.392% | | 5,510,000 | 5,309,987 |
| COLT LLC(a),(b) |
| CMO Series 15-1 Class A1V |
1-month USD LIBOR + 3.000%
12/26/2045 | 4.234% | | 2,506,866 | 2,519,356 |
| COLT LLC(a),(b),(c) |
| CMO Series 15-1 Class A2 |
1-month USD LIBOR + 3.750%
12/26/2045 | 4.984% | | 822,945 | 844,009 |
| COLT Mortgage Loan Trust(a) |
| CMO Series 2016-1 Class A2 |
| 05/25/2046 | 3.500% | | 8,674,717 | 8,723,856 |
The accompanying Notes to Financial Statements are an integral part of this statement.
| 24 | Columbia Strategic Income Fund | Annual Report 2017 |
Portfolio of Investments (continued)
August 31, 2017
| Residential Mortgage-Backed Securities - Non-Agency (continued) |
| Issuer | Coupon
Rate | | Principal
Amount ($) | Value ($) |
| COLT Mortgage Loan Trust(a),(b),(g) |
| CMO Series 2016-2 Class A2 |
| 09/25/2046 | 3.250% | | 4,668,740 | 4,741,145 |
| Credit Suisse Mortgage Capital Certificates(a),(b),(g) |
| CMO Series 2008-4R Class 3A4 |
| 01/26/2038 | 3.494% | | 4,662,174 | 4,560,586 |
| CMO Series 2011-5R Class 3A1 |
| 09/27/2047 | 3.469% | | 1,180,717 | 1,157,464 |
| CMO Series 2014-RPL4 Class A1 |
| 08/25/2062 | 3.625% | | 8,108,213 | 8,358,293 |
| CMO Series 2014-RPL4 Class A2 |
| 08/25/2062 | 4.785% | | 13,556,000 | 13,861,712 |
| Credit Suisse Mortgage Capital Certificates(a) |
| CMO Series 2010-9R Class 10A5 |
| 04/27/2037 | 4.000% | | 1,073,002 | 1,070,325 |
| CMO Series 2010-9R Class 1A5 |
| 08/27/2037 | 4.000% | | 9,414,000 | 9,334,747 |
| CMO Series 2010-9R Class 7A5 |
| 05/27/2037 | 4.000% | | 473,415 | 472,434 |
| Series 2014-2R Class 18A1 |
| 01/27/2037 | 3.000% | | 4,585,482 | 4,533,984 |
| Series 2014-2R Class 19A1 |
| 05/27/2036 | 3.000% | | 3,044,419 | 3,009,465 |
| Credit Suisse Mortgage Capital Certificates(a),(b) |
| CMO Series 2014-CIM1 Class A2 |
1-month USD LIBOR + 3.500%
01/25/2058 | 4.737% | | 12,000,000 | 11,829,016 |
| Credit Suisse Mortgage Capital Certificates(a),(b),(c) |
| Series 2012-11 Class 3A2 |
1-month USD LIBOR + 1.000%
06/29/2047 | 2.239% | | 1,217,113 | 1,124,214 |
| CTS Corp.(a),(c) |
| Series 2015-6R Class 3A2 |
| 02/27/2036 | 3.750% | | 7,017,973 | 7,069,555 |
| Deephaven Residential Mortgage Trust(a) |
| Series 2016-1A Class A1 |
| 07/25/2046 | 4.000% | | 15,817,304 | 15,828,760 |
| Deephaven Residential Mortgage Trust(a),(c) |
| Series 2016-1A Class A2 |
| 07/25/2046 | 5.500% | | 1,829,265 | 1,821,438 |
| Deutsche Mortgage Securities, Inc. Mortgage Loan Trust |
| CMO Series 2003-1 Class 1A7 |
| 04/25/2033 | 5.500% | | 659,653 | 668,653 |
| GCAT (a) |
| Series 2017-1 Class A2 |
| 03/25/2047 | 3.375% | | 16,089,552 | 16,072,336 |
| Residential Mortgage-Backed Securities - Non-Agency (continued) |
| Issuer | Coupon
Rate | | Principal
Amount ($) | Value ($) |
| GCAT LLC(a) |
| CMO Series 20 17-2 Class A1 |
| 04/25/2047 | 3.500% | | 14,863,695 | 14,905,453 |
| CMO Series 2017-3 Class A1 |
| 04/25/2047 | 3.352% | | 14,151,786 | 14,178,816 |
| CMO Series 2017-4 Class A1 |
| 05/25/2022 | 3.228% | | 18,462,469 | 18,489,312 |
| GMAC Mortgage Home Equity Loan Trust |
| CMO Series 2004-HE5 Class A5 (FGIC) |
| 09/25/2034 | 5.865% | | 557,708 | 566,469 |
| Jefferies Resecuritization Trust(a) |
| CMO Series 2014-R1 Class 1A1 |
| 12/27/2037 | 4.000% | | 514,421 | 513,679 |
| Legacy Mortgage Asset Trust(a) |
| CMO Series 2017-GS1 Class A1 |
| 01/25/2057 | 3.500% | | 21,821,754 | 21,833,793 |
| Mill City Mortgage Trust(a),(b),(g) |
| CMO Series 2015-1 Class M1 |
| 06/25/2056 | 3.416% | | 5,000,000 | 5,031,916 |
| CMO Series 2015-2 Class M2 |
| 09/25/2057 | 3.610% | | 10,000,000 | 9,362,931 |
| Nomura Resecuritization Trust(a),(b),(g) |
| CMO Series 2011-2RA Class 2A13 |
| 07/26/2035 | 3.509% | | 1,444,511 | 1,431,714 |
| NRPL Trust(a),(b),(g) |
| CMO Series 2014-1A Class A1 |
| 04/25/2054 | 3.250% | | 7,007,820 | 7,016,959 |
| NRZ Excess Spread-Collateralized Notes(a),(c) |
| CMO Series 2016-PLS2 Class A |
| 07/25/2021 | 5.683% | | 10,272,677 | 10,285,518 |
| Oak Hill Advisors Residential Loan Trust(a) |
| CMO Series 2017-NPL1 Class A1 |
| 06/25/2057 | 3.000% | | 16,980,386 | 16,980,219 |
| Oaktown Re Ltd.(a),(b),(c) |
| CMO Series 2017-1A Class M1 |
1-month USD LIBOR + 2.250%
04/25/2027 | 3.484% | | 20,473,971 | 20,473,970 |
| PennyMac Mortgage Investment Trust(a),(b),(c) |
| Series 2017-GT1 Class A |
1-month USD LIBOR + 4.750%
02/25/2050 | 5.984% | | 32,500,000 | 32,674,200 |
| PNMAC GMSR Issuer Trust(a),(b),(c) |
| Series 2017-GT2 Class A |
1-month USD LIBOR + 4.000%
08/25/2023 | 5.231% | | 31,100,000 | 31,100,000 |
The accompanying Notes to Financial Statements are an integral part of this statement.
Columbia Strategic Income Fund | Annual Report 2017
| 25 |
Portfolio of Investments (continued)
August 31, 2017
| Residential Mortgage-Backed Securities - Non-Agency (continued) |
| Issuer | Coupon
Rate | | Principal
Amount ($) | Value ($) |
| Pretium Mortgage Credit Partners I(a) |
| CMO Series 2017-NPL2 Class A1 |
| 03/28/2057 | 3.250% | | 8,887,561 | 8,905,184 |
| Pretium Mortgage Credit Partners I LLC(a),(c) |
| CMO Series 2017-NPL4 Class A1 |
| 08/27/2032 | 3.250% | | 13,000,000 | 13,000,000 |
| RBSSP Resecuritization Trust(a),(b),(g) |
| CMO Series 2010-1 Class 3A2 |
| 08/26/2035 | 3.533% | | 10,000,000 | 9,773,000 |
| SGR Residential Mortgage Trust(a) |
| CMO Series 2016-1 Class A1 |
| 11/25/2046 | 3.750% | | 7,996,704 | 7,942,853 |
| Sunset Mortgage Loan Co., LLC(a) |
| CMO Series 2017-NPL1 Class A |
| 06/16/2047 | 3.500% | | 14,378,004 | 14,421,411 |
| Vericrest Opportunity Loan Transferee LX LLC(a) |
| CMO Series 2017-NPL7 Class A1 |
| 04/25/2059 | 3.250% | | 11,564,414 | 11,582,305 |
| VML LLC(a) |
| CMO Series 2014-NPL1 Class A1 |
| 04/27/2054 | 3.875% | | 1,153,833 | 1,154,363 |
Total Residential Mortgage-Backed Securities - Non-Agency
(Cost $585,107,922) | 588,887,216 |
|
| Senior Loans 7.4% |
| Borrower | Weighted
Average Coupon | | Principal
Amount ($) | Value ($) |
| Aerospace & Defense 0.2% |
| Doncasters US Finance LLC(b),(p) |
| Tranche B Term Loan |
3-month USD LIBOR + 3.500%
04/09/2020 | 4.796% | | 1,328,772 | 1,271,196 |
| Engility Corp.(b),(p) |
| Tranche B2 Term Loan |
3-month USD LIBOR + 4.750%
08/14/2023 | 4.489% | | 836,765 | 842,522 |
| Leidos Innovations Corp.(b),(p) |
| Tranche B Term Loan |
3-month USD LIBOR + 2.750%
08/16/2023 | 3.250% | | 1,313,400 | 1,315,370 |
| TransDigm, Inc.(b),(p) |
| Tranche E Term Loan |
3-month USD LIBOR + 2.750%
05/14/2022 | 4.258% | | 1,616,994 | 1,618,643 |
| Senior Loans (continued) |
| Borrower | Weighted
Average Coupon | | Principal
Amount ($) | Value ($) |
| Tranche F Term Loan |
3-month USD LIBOR + 3.000%
06/09/2023 | 4.239% | | 1,492,462 | 1,494,164 |
| Total | 6,541,895 |
| Airlines 0.2% |
| American Airlines, Inc.(b),(p) |
| Term Loan |
3-month USD LIBOR + 2.000%
10/10/2021 | 3.231% | | 989,899 | 989,899 |
| Tranche B Term Loan |
3-month USD LIBOR + 2.500%
12/14/2023 | 3.727% | | 759,596 | 761,259 |
| Avolon Borrower 1 LLC(b),(p) |
| Tranche B2 Term Loan |
3-month USD LIBOR + 2.250%
03/21/2022 | 3.981% | | 3,000,000 | 3,008,160 |
| United Airlines, Inc.(b),(p) |
| Tranche B Term Loan |
3-month USD LIBOR + 2.250%
04/01/2024 | 3.561% | | 1,521,187 | 1,527,364 |
| Total | 6,286,682 |
| Automotive 0.1% |
| Dayco Products LLC(b),(p) |
| Term Loan |
3-month USD LIBOR + 5.000%
05/19/2023 | 6.317% | | 773,063 | 774,995 |
| DexKo Global, Inc.(b),(p) |
| Tranche B 1st Lien Term Loan |
3-month USD LIBOR + 4.000%
07/24/2024 | 5.313% | | 1,000,000 | 1,005,830 |
| Gates Global LLC(b),(p) |
| Tranche B1 Term Loan |
3-month USD LIBOR + 3.250%
04/01/2024 | 4.546% | | 732,924 | 735,086 |
| Horizon Global Corp.(b),(p) |
| Term Loan |
3-month USD LIBOR + 4.500%
06/30/2021 | 5.739% | | 169,554 | 171,038 |
The accompanying Notes to Financial Statements are an integral part of this statement.
| 26 | Columbia Strategic Income Fund | Annual Report 2017 |
Portfolio of Investments (continued)
August 31, 2017
| Senior Loans (continued) |
| Borrower | Weighted
Average Coupon | | Principal
Amount ($) | Value ($) |
| Navistar, Inc.(b),(p) |
| Tranche B Term Loan |
3-month USD LIBOR + 4.000%
08/07/2020 | 5.240% | | 982,500 | 989,053 |
| Total | 3,676,002 |
| Brokerage/Asset Managers/Exchanges 0.0% |
| Aretec Group, Inc.(b),(c),(p) |
| 1st Lien Term Loan |
3-month USD LIBOR + 8.000%
11/23/2020 | 0.000% | | 599,728 | 605,725 |
| 2nd Lien Term Loan PIK |
3-month USD LIBOR + 7.500%
05/23/2021 | 0.000% | | 450,562 | 448,872 |
| Total | 1,054,597 |
| Building Materials 0.1% |
| QUIKRETE Holdings, Inc.(b),(p) |
| 1st Lien Term Loan |
3-month USD LIBOR + 2.750%
11/15/2023 | 3.989% | | 1,816,748 | 1,805,629 |
| SRS Distribution, Inc.(b),(p) |
| Tranche B4 1st Lien Term Loan |
3-month USD LIBOR + 4.250%
08/25/2022 | 4.546% | | 989,924 | 991,162 |
| Total | 2,796,791 |
| Cable and Satellite 0.2% |
| Atlantic Broadband Finance, LLC(b),(p),(q) |
| Term Loan |
3-month USD LIBOR + 2.375%
08/09/2024 | 0.000% | | 1,175,000 | 1,166,610 |
| Charter Communications Operating LLC(b),(p) |
| Tranche I1 Term Loan |
3-month USD LIBOR + 2.250%
01/15/2024 | 3.489% | | 2,983,637 | 2,996,884 |
| Encompass Digital Media, Inc.(b),(p) |
| Tranche B 1st Lien Term Loan |
3-month USD LIBOR + 4.500%
06/06/2021 | 5.800% | | 1,189,188 | 1,126,756 |
| Senior Loans (continued) |
| Borrower | Weighted
Average Coupon | | Principal
Amount ($) | Value ($) |
| Telesat Canada(b),(p) |
| Tranche B4 Term Loan |
3-month USD LIBOR + 3.000%
11/17/2023 | 4.300% | | 995,000 | 1,001,756 |
| Virgin Media Bristol LLC(b),(p) |
| Tranche I Term Loan |
3-month USD LIBOR + 2.750%
01/31/2025 | 3.977% | | 1,000,000 | 1,001,940 |
| Total | 7,293,946 |
| Chemicals 0.8% |
| Aruba Investments, Inc.(b),(p) |
| Tranche B1 Term Loan |
3-month USD LIBOR + 3.500%
02/02/2022 | 4.796% | | 992,405 | 991,988 |
| Axalta Coating Systems Dutch Holding BBV/US Holdings, Inc.(b),(p) |
| Tranche B2 Term Loan |
3-month USD LIBOR + 2.000%
06/01/2024 | 3.296% | | 1,725,000 | 1,728,778 |
| Chemours Co. (The)(b),(p) |
| Tranche B1 Term Loan |
3-month USD LIBOR + 2.500%
05/12/2022 | 3.740% | | 946,643 | 948,716 |
| ColourOz Investment 1 GmbH(b),(p) |
| Tranche C 1st Lien Term Loan |
3-month USD LIBOR + 3.500%
09/07/2021 | 4.312% | | 237,544 | 231,161 |
| ColourOz Investment 2 LLC(b),(p) |
| Tranche B2 1st Lien Term Loan |
3-month USD LIBOR + 3.500%
09/07/2021 | 4.312% | | 1,436,947 | 1,398,337 |
| Duke Finance LLC(b),(p) |
| Term Loan |
3-month USD LIBOR + 4.250%
02/21/2024 | 5.514% | | 882,090 | 884,295 |
| HII Holding Corp.(b),(c),(p) |
| 2nd Lien Term Loan |
3-month USD LIBOR + 8.250%
12/21/2020 | 9.796% | | 1,350,000 | 1,366,875 |
The accompanying Notes to Financial Statements are an integral part of this statement.
Columbia Strategic Income Fund | Annual Report 2017
| 27 |
Portfolio of Investments (continued)
August 31, 2017
| Senior Loans (continued) |
| Borrower | Weighted
Average Coupon | | Principal
Amount ($) | Value ($) |
| Ineos US Finance LLC(b),(p) |
| Term Loan |
3-month USD LIBOR + 2.750%
03/31/2022 | 4.007% | | 2,985,000 | 2,991,388 |
| KMG Chemicals, Inc.(b),(p) |
| Term Loan |
3-month USD LIBOR + 4.750%
06/15/2024 | 5.489% | | 978,182 | 988,550 |
| Kraton Polymers LLC(b),(p) |
| Term Loan |
3-month USD LIBOR + 3.000%
01/06/2022 | 4.239% | | 610,329 | 614,143 |
| Kronos Worldwide, Inc.(b),(p) |
| Term Loan |
3-month USD LIBOR + 3.000%
02/18/2020 | 4.300% | | 1,935,000 | 1,937,419 |
| MacDermid, Inc.(b),(p) |
| Tranche B6 Term Loan |
3-month USD LIBOR + 3.000%
06/07/2023 | 4.239% | | 1,464,456 | 1,469,040 |
| Nexeo Solutions LLC(b),(p) |
| Tranche B Term Loan |
3-month USD LIBOR + 3.750%
06/09/2023 | 5.058% | | 1,410,756 | 1,417,373 |
| PolyOne Corp.(b),(p) |
| Tranche B3 Term Loan |
3-month USD LIBOR + 2.000%
11/11/2022 | 3.227% | | 2,150,416 | 2,155,792 |
| PQ Corp.(b),(p) |
| Tranche B1 Term Loan |
3-month USD LIBOR + 3.250%
11/04/2022 | 4.562% | | 1,041,381 | 1,045,286 |
| Ravago Holdings America, Inc.(b),(p) |
| Term Loan |
3-month USD LIBOR + 4.000%
07/13/2023 | 4.490% | | 1,809,231 | 1,809,231 |
| Royal Holdings, Inc.(b),(c),(p) |
| 2nd Lien Term Loan |
3-month USD LIBOR + 7.500%
06/19/2023 | 8.796% | | 551,724 | 550,345 |
| Senior Loans (continued) |
| Borrower | Weighted
Average Coupon | | Principal
Amount ($) | Value ($) |
| Solenis International LP/Holdings 3 LLC(b),(p) |
| 1st Lien Term Loan |
3-month USD LIBOR + 3.250%
07/31/2021 | 4.567% | | 1,602,300 | 1,604,703 |
| Trinseo Materials Operating SCA/Finance, Inc.(b),(p),(q) |
| 1st Lien Term Loan |
3-month USD LIBOR + 2.500%
08/16/2024 | 0.000% | | 1,050,000 | 1,054,599 |
| Trinseo Materials Operating SCA/Finance, Inc.(b),(p) |
| Tranche B Term Loan |
3-month USD LIBOR + 3.250%
11/05/2021 | 4.486% | | 980,000 | 980,412 |
| Tronox Pigments BV(b),(p) |
| Term Loan |
3-month USD LIBOR + 3.000%
03/19/2020 | 4.796% | | 1,488,372 | 1,489,072 |
| Univar USA, Inc.(b),(p) |
| Tranche B2 Term Loan |
3-month USD LIBOR + 2.750%
07/01/2022 | 3.989% | | 1,778,537 | 1,780,209 |
| Total | 29,437,712 |
| Construction Machinery 0.1% |
| Doosan Bobcat, Inc.(b),(p) |
| Tranche B Term Loan |
3-month USD LIBOR + 2.750%
05/18/2024 | 4.013% | | 1,072,313 | 1,074,103 |
| Douglas Dynamics LLC(b),(p) |
| Term Loan |
3-month USD LIBOR + 3.000%
12/31/2021 | 4.230% | | 296,985 | 297,543 |
| DXP Enterprises, Inc.(b),(p),(q) |
| Tranche B Term Loan |
3-month USD LIBOR + 5.500%
08/16/2023 | 0.000% | | 800,000 | 794,000 |
| North American Lifting Holdings, Inc.(b),(p) |
| 1st Lien Term Loan |
3-month USD LIBOR + 4.500%
11/27/2020 | 5.796% | | 1,432,889 | 1,332,587 |
The accompanying Notes to Financial Statements are an integral part of this statement.
| 28 | Columbia Strategic Income Fund | Annual Report 2017 |
Portfolio of Investments (continued)
August 31, 2017
| Senior Loans (continued) |
| Borrower | Weighted
Average Coupon | | Principal
Amount ($) | Value ($) |
| Vertiv Group Corp.(b),(p) |
| Tranche B Term Loan |
3-month USD LIBOR + 4.000%
11/30/2023 | 5.239% | | 967,672 | 973,314 |
| Total | 4,471,547 |
| Consumer Cyclical Services 0.1% |
| DTZ US Borrower LLC/AUS Holdco PTY Ltd.(b),(p) |
| 1st Lien Term Loan |
3-month USD LIBOR + 3.250%
11/04/2021 | 4.564% | | 1,001,036 | 1,002,647 |
| IG Investments Holdings LLC(b),(p) |
| Term Loan |
3-month USD LIBOR + 4.000%
10/31/2021 | 5.296% | | 303,763 | 305,534 |
| Weight Watchers International, Inc.(b),(p) |
| Tranche B2 Term Loan |
3-month USD LIBOR + 3.250%
04/02/2020 | 4.529% | | 1,340,500 | 1,309,146 |
| Total | 2,617,327 |
| Consumer Products 0.2% |
| Culligan NewCo Ltd.(b),(p) |
| Tranche B1 1st Lien Term Loan |
3-month USD LIBOR + 4.000%
12/13/2023 | 5.229% | | 572,125 | 576,061 |
| Nature’s Bounty Co. (The)(b),(p) |
| Tranche B1 Term Loan |
3-month USD LIBOR + 3.500%
05/05/2023 | 4.796% | | 1,512,270 | 1,512,738 |
| Prestige Brands, Inc.(b),(p) |
| Tranche B4 Term Loan |
3-month USD LIBOR + 2.750%
01/26/2024 | 3.989% | | 479,012 | 479,534 |
| Serta Simmons Holdings LLC(b),(p) |
| 1st Lien Term Loan |
3-month USD LIBOR + 3.500%
11/08/2023 | 4.801% | | 1,691,500 | 1,641,601 |
| 2nd Lien Term Loan |
3-month USD LIBOR + 8.000%
11/08/2024 | 9.312% | | 2,868,477 | 2,766,302 |
| Senior Loans (continued) |
| Borrower | Weighted
Average Coupon | | Principal
Amount ($) | Value ($) |
| Steinway Musical Instruments, Inc.(b),(p) |
| 1st Lien Term Loan |
3-month USD LIBOR + 3.750%
09/19/2019 | 5.061% | | 994,724 | 960,734 |
| Varsity Brands Holding Co.(b),(p) |
| 1st Lien Term Loan |
3-month USD LIBOR + 4.000%
12/10/2021 | 4.732% | | 587,024 | 589,960 |
| Total | 8,526,930 |
| Diversified Manufacturing 0.4% |
| Accudyne Industries Borrower SCA/LLC(b),(p),(q) |
| Term Loan |
3-month USD LIBOR + 3.500%
08/18/2024 | 5.013% | | 1,000,000 | 999,690 |
| Allnex & Cy SCA(b),(p) |
| Tranche B2 Term Loan |
3-month USD LIBOR + 4.250%
09/13/2023 | 4.567% | | 1,132,092 | 1,133,507 |
| Tranche B3 Term Loan |
3-month USD LIBOR + 4.250%
09/13/2023 | 4.567% | | 852,907 | 853,973 |
| Apex Tool Group LLC(b),(p) |
| Term Loan |
3-month USD LIBOR + 3.250%
01/31/2020 | 4.500% | | 1,832,004 | 1,756,892 |
| Bright Bidco BV(b),(p) |
| Tranche B 1st Lien Term Loan |
3-month USD LIBOR + 4.500%
06/30/2024 | 5.796% | | 1,225,000 | 1,232,656 |
| Culligan NewCo Ltd.(b),(p),(q) |
| Tranche B1 1st Lien Term Loan |
3-month USD LIBOR + 3.500%
12/13/2023 | 5.229% | | 350,000 | 350,658 |
| Filtration Group Corp.(b),(p) |
| 1st Lien Term Loan |
3-month USD LIBOR + 3.250%
11/23/2020 | 4.257% | | 2,069,872 | 2,076,599 |
| Gardner Denver, Inc.(b),(p),(q) |
| Tranche B1 Term Loan |
3-month USD LIBOR + 2.750%
07/30/2024 | 4.012% | | 1,265,180 | 1,263,447 |
The accompanying Notes to Financial Statements are an integral part of this statement.
Columbia Strategic Income Fund | Annual Report 2017
| 29 |
Portfolio of Investments (continued)
August 31, 2017
| Senior Loans (continued) |
| Borrower | Weighted
Average Coupon | | Principal
Amount ($) | Value ($) |
| LTI Holdings, Inc.(b),(p) |
| 1st Lien Term Loan |
3-month USD LIBOR + 4.750%
05/16/2024 | 5.989% | | 525,000 | 521,719 |
| Rexnord LLC(b),(p) |
| Tranche B Term Loan |
3-month USD LIBOR + 2.750%
08/21/2023 | 4.049% | | 1,831,391 | 1,834,175 |
| Zekelman Industries, Inc.(b),(p) |
| Term Loan |
3-month USD LIBOR + 5.000%
06/14/2021 | 4.039% | | 990,025 | 990,847 |
| Total | 13,014,163 |
| Electric 0.3% |
| AES Corp. (The)(b),(p) |
| Term Loan |
3-month USD LIBOR + 2.000%
05/24/2022 | 3.317% | | 623,438 | 623,437 |
| Astoria Energy LLC(b),(p) |
| Tranche B Term Loan |
3-month USD LIBOR + 4.000%
12/24/2021 | 5.240% | | 1,286,886 | 1,289,306 |
| Calpine Corp.(b),(p) |
| Term Loan |
3-month USD LIBOR + 2.750%
01/15/2024 | 4.050% | | 1,552,804 | 1,547,229 |
| Eastern Power LLC/Covert Midco LLC/TPF II LC LLC(b),(p) |
| Term Loan |
3-month USD LIBOR + 4.000%
10/02/2023 | 4.989% | | 1,431,969 | 1,433,530 |
| Energy Future Intermediate Holding Co. LLC(b),(p),(r) |
| Debtor in Posession Term Loan |
3-month USD LIBOR + 3.000%
06/30/2018 | 4.234% | | 1,325,000 | 1,330,300 |
| MRP Generation Holdings, LLC(b),(c),(p) |
| Term Loan |
3-month USD LIBOR + 7.000%
10/18/2022 | 8.296% | | 2,012,549 | 1,861,608 |
| Senior Loans (continued) |
| Borrower | Weighted
Average Coupon | | Principal
Amount ($) | Value ($) |
| Vistra Operations Co. LLC(b),(p) |
| Term Loan |
3-month USD LIBOR + 4.000%
08/04/2023 | 3.987% | | 384,852 | 384,798 |
3-month USD LIBOR + 3.250%
12/14/2023 | 3.979% | | 1,293,500 | 1,295,350 |
| Tranche C Term Loan |
3-month USD LIBOR + 4.000%
08/04/2023 | 3.982% | | 88,214 | 88,202 |
| Viva Alamo LLC(b),(c),(p) |
| Term Loan |
3-month USD LIBOR + 4.250%
02/22/2021 | 5.567% | | 991,925 | 939,849 |
| WG Partners Acquisition LLC(b),(c),(p) |
| Tranche B Term Loan |
3-month USD LIBOR + 4.000%
11/15/2023 | 5.296% | | 611,311 | 612,839 |
| Total | 11,406,448 |
| Environmental 0.1% |
| Advanced Disposal Services, Inc.(b),(p) |
| Term Loan |
3-month USD LIBOR + 2.750%
11/10/2023 | 3.952% | | 1,093,301 | 1,098,254 |
| STI Infrastructure SARL(b),(c),(p) |
| Term Loan |
3-month USD LIBOR + 5.250%
08/22/2020 | 6.546% | | 3,032,719 | 2,896,246 |
| Total | 3,994,500 |
| Finance Companies 0.0% |
| FinCo I LLC(b),(p) |
| Term Loan |
3-month USD LIBOR + 2.750%
12/30/1899 | 1.375% | | 1,525,000 | 1,537,200 |
| Food and Beverage 0.2% |
| Blue Buffalo Pet Products, Inc.(b),(p) |
| Term Loan |
3-month USD LIBOR + 2.000%
05/27/2024 | 3.234% | | 1,400,000 | 1,403,500 |
The accompanying Notes to Financial Statements are an integral part of this statement.
| 30 | Columbia Strategic Income Fund | Annual Report 2017 |
Portfolio of Investments (continued)
August 31, 2017
| Senior Loans (continued) |
| Borrower | Weighted
Average Coupon | | Principal
Amount ($) | Value ($) |
| Dole Food Co., Inc.(b),(p) |
| Tranche B Term Loan |
3-month USD LIBOR + 3.000%
04/06/2024 | 4.001% | | 650,000 | 651,222 |
| Hostess Brands LLC(b),(p) |
| Tranche B 1st Lien Term Loan |
3-month USD LIBOR + 2.500%
08/03/2022 | 3.739% | | 395,010 | 395,899 |
| JBS USA Lux SA(b),(p) |
| Term Loan |
3-month USD LIBOR + 2.500%
10/30/2022 | 3.804% | | 1,396,500 | 1,379,630 |
| Pinnacle Foods Finance LLC(b),(p) |
| Term Loan |
3-month USD LIBOR + 2.000%
02/02/2024 | 3.232% | | 1,467,625 | 1,470,751 |
| US Foods, Inc.(b),(p) |
| Term Loan |
3-month USD LIBOR + 3.250%
06/27/2023 | 3.989% | | 1,476,214 | 1,480,805 |
| Total | 6,781,807 |
| Gaming 0.3% |
| Affinity Gaming(b),(p) |
| 2nd Lien Term Loan |
3-month USD LIBOR + 8.250%
01/31/2025 | 9.526% | | 1,525,000 | 1,542,156 |
| Amaya Holdings BV(b),(p) |
| Tranche B3 1st Lien Term Loan |
3-month USD LIBOR + 3.500%
08/01/2021 | 4.796% | | 1,957,537 | 1,961,981 |
| CBAC Borrower LLC(b),(p) |
| Tranche B Term Loan |
3-month USD LIBOR + 4.000%
07/08/2024 | 5.239% | | 1,075,000 | 1,079,483 |
| Las Vegas Sands LLC(b),(p) |
| Term Loan |
3-month USD LIBOR + 2.000%
03/29/2024 | 3.240% | | 982,341 | 984,188 |
| Senior Loans (continued) |
| Borrower | Weighted
Average Coupon | | Principal
Amount ($) | Value ($) |
| Mohegan Tribal Gaming Authority(b),(p) |
| Tranche B Term Loan |
3-month USD LIBOR + 4.500%
10/13/2023 | 5.239% | | 1,042,125 | 1,051,244 |
| MotorCity Casino Hotel(b),(p) |
| Term Loan |
3-month USD LIBOR + 3.500%
08/06/2021 | 3.989% | | 279,467 | 279,992 |
| Penn National Gaming, Inc.(b),(p) |
| Tranche B Term Loan |
3-month USD LIBOR + 2.500%
01/19/2024 | 3.796% | | 498,750 | 500,266 |
| Scientific Games International, Inc.(b),(p) |
| Tranche B4 Term Loan |
3-month USD LIBOR + 3.500%
08/14/2024 | 4.512% | | 2,625,000 | 2,642,719 |
| Seminole Tribe of Florida(b),(p) |
| Tranche B Term Loan |
3-month USD LIBOR + 2.000%
07/08/2024 | 3.456% | | 575,000 | 576,345 |
| Yonkers Racing Corp.(b),(p) |
| 1st Lien Term Loan |
3-month USD LIBOR + 3.250%
05/31/2024 | 4.490% | | 1,225,000 | 1,225,000 |
| Total | 11,843,374 |
| Health Care 0.5% |
| Air Methods Corp.(b),(p) |
| Term Loan |
3-month USD LIBOR + 3.500%
04/22/2024 | 4.796% | | 663,822 | 644,737 |
| Alliance HealthCare Services, Inc.(b),(c),(p) |
| Term Loan |
3-month USD LIBOR + 3.250%
06/03/2019 | 4.533% | | 743,859 | 740,139 |
| Change Healthcare Holdings, Inc.(b),(p) |
| Term Loan |
3-month USD LIBOR + 2.750%
03/01/2024 | 3.989% | | 1,271,813 | 1,271,177 |
The accompanying Notes to Financial Statements are an integral part of this statement.
Columbia Strategic Income Fund | Annual Report 2017
| 31 |
Portfolio of Investments (continued)
August 31, 2017
| Senior Loans (continued) |
| Borrower | Weighted
Average Coupon | | Principal
Amount ($) | Value ($) |
| CHS/Community Health Systems, Inc.(b),(p) |
| Tranche G Term Loan |
3-month USD LIBOR + 2.750%
12/31/2019 | 4.067% | | 338,445 | 337,443 |
| Tranche H Term Loan |
3-month USD LIBOR + 3.000%
01/27/2021 | 4.317% | | 440,798 | 438,383 |
| Envision Healthcare Corp.(b),(p) |
| Term Loan |
3-month USD LIBOR + 3.000%
12/01/2023 | 4.300% | | 1,492,500 | 1,502,574 |
| HC Group Holdings III, Inc.(b),(c),(p) |
| 1st Lien Term Loan |
3-month USD LIBOR + 5.000%
04/07/2022 | 6.317% | | 992,405 | 997,367 |
| IASIS Healthcare LLC(b),(p) |
| Tranche B3 Term Loan |
3-month USD LIBOR + 4.000%
02/17/2021 | 5.296% | | 1,420,361 | 1,423,557 |
| INC Research Holdings, Inc.(b),(p) |
| Tranche B Term Loan |
3-month USD LIBOR + 2.250%
08/01/2024 | 3.489% | | 1,000,000 | 1,000,540 |
| Jaguar Holding Co. I LLC(b),(p) |
| Term Loan |
3-month USD LIBOR + 2.750%
08/18/2022 | 4.019% | | 1,274,000 | 1,276,650 |
| Kindred Healthcare, Inc.(b),(p) |
| Term Loan |
3-month USD LIBOR + 3.250%
04/09/2021 | 4.813% | | 487,442 | 485,766 |
| MPH Acquisition Holdings LLC(b),(p) |
| Term Loan |
3-month USD LIBOR + 3.000%
06/07/2023 | 4.296% | | 409,150 | 410,598 |
| National Mentor Holdings, Inc.(b),(p) |
| Tranche B Term Loan |
3-month USD LIBOR + 3.750%
01/31/2021 | 4.296% | | 982,234 | 987,764 |
| Senior Loans (continued) |
| Borrower | Weighted
Average Coupon | | Principal
Amount ($) | Value ($) |
| Nautilus Power, LLC(b),(p) |
| Term Loan |
3-month USD LIBOR + 4.500%
05/16/2024 | 5.739% | | 925,000 | 929,625 |
| Onex Carestream Finance LP(b),(p) |
| 1st Lien Term Loan |
3-month USD LIBOR + 4.000%
06/07/2019 | 5.267% | | 1,656,984 | 1,653,620 |
| Ortho-Clinical Diagnostics Holdings SARL(b),(p) |
| Term Loan |
3-month USD LIBOR + 3.750%
06/30/2021 | 5.046% | | 1,875,373 | 1,878,861 |
| Sterigenics-Nordion Holdings LLC(b),(p) |
| Term Loan |
3-month USD LIBOR + 3.000%
05/15/2022 | 4.239% | | 992,462 | 991,222 |
| Team Health Holdings, Inc.(b),(p) |
| Term Loan |
3-month USD LIBOR + 2.750%
02/06/2024 | 3.989% | | 498,750 | 491,892 |
| Total | 17,461,915 |
| Healthcare REIT 0.0% |
| Quality Care Properties, Inc.(b),(p) |
| 1st Lien Term Loan |
3-month USD LIBOR + 5.250%
10/31/2022 | 6.489% | | 497,500 | 498,331 |
| Independent Energy 0.1% |
| Chesapeake Energy Corp.(b),(p) |
| Tranche A Term Loan |
3-month USD LIBOR + 7.500%
08/23/2021 | 8.814% | | 2,040,142 | 2,165,957 |
| Leisure 0.2% |
| 24 Hour Fitness Worldwide, Inc.(b),(p) |
| Term Loan |
3-month USD LIBOR + 3.750%
05/28/2021 | 5.046% | | 703,250 | 701,056 |
| Constellation Merger Sub(b),(p),(q) |
| Term Loan |
3-month USD LIBOR + 3.250%
09/13/2024 | 4.565% | | 1,650,000 | 1,638,994 |
The accompanying Notes to Financial Statements are an integral part of this statement.
| 32 | Columbia Strategic Income Fund | Annual Report 2017 |
Portfolio of Investments (continued)
August 31, 2017
| Senior Loans (continued) |
| Borrower | Weighted
Average Coupon | | Principal
Amount ($) | Value ($) |
| Delta 2 SARL(b),(p) |
| Tranche B3 Term Loan |
3-month USD LIBOR + 3.750%
02/01/2024 | 4.489% | | 1,250,000 | 1,257,287 |
| Life Time Fitness, Inc.(b),(p) |
| Term Loan |
3-month USD LIBOR + 3.000%
06/10/2022 | 4.317% | | 318,524 | 319,095 |
| UFC Holdings LLC(b),(p) |
| 1st Lien Term Loan |
3-month USD LIBOR + 3.250%
08/18/2023 | 4.490% | | 1,092,994 | 1,095,726 |
| William Morris Endeavor Entertainment LLC/IMG Worldwide Holdings, LLC(b),(p) |
| 1st Lien Term Loan |
3-month USD LIBOR + 3.250%
05/06/2021 | 4.490% | | 1,370,401 | 1,375,883 |
| 2nd Lien Term Loan |
3-month USD LIBOR + 7.250%
05/06/2022 | 8.489% | | 166,667 | 168,542 |
| Total | 6,556,583 |
| Lodging 0.1% |
| CityCenter Holdings LLC(b),(p) |
| Tranche B Term Loan |
3-month USD LIBOR + 2.500%
04/18/2024 | 3.734% | | 825,000 | 826,237 |
| Hilton Worldwide Finance LLC(b),(p) |
| Tranche B2 Term Loan |
3-month USD LIBOR + 2.500%
10/25/2023 | 3.234% | | 1,990,000 | 1,995,930 |
| RHP Hotel Properties LP(b),(p) |
| Tranche B Term Loan |
3-month USD LIBOR + 2.250%
05/11/2024 | 3.560% | | 598,500 | 601,493 |
| Total | 3,423,660 |
| Media and Entertainment 0.4% |
| Cengage Learning, Inc.(b),(p) |
| Term Loan |
3-month USD LIBOR + 4.250%
06/07/2023 | 5.481% | | 413,801 | 383,974 |
| Senior Loans (continued) |
| Borrower | Weighted
Average Coupon | | Principal
Amount ($) | Value ($) |
| Cumulus Media Holdings, Inc.(b),(p) |
| Term Loan |
3-month USD LIBOR + 3.250%
12/23/2020 | 4.490% | | 954,895 | 780,627 |
| Emerald Expositions Holding, Inc.(b),(p) |
| Term Loan |
3-month USD LIBOR + 3.000%
05/22/2024 | 4.296% | | 725,000 | 730,437 |
| Getty Images, Inc.(b),(p) |
| Term Loan |
3-month USD LIBOR + 3.500%
10/18/2019 | 4.796% | | 1,910,000 | 1,649,457 |
| Hubbard Radio LLC(b),(p) |
| Term Loan |
3-month USD LIBOR + 3.250%
05/27/2022 | 4.490% | | 829,566 | 829,051 |
| iHeartCommunications, Inc.(b),(p) |
| Tranche D Term Loan |
3-month USD LIBOR + 6.750%
01/30/2019 | 7.989% | | 1,128,407 | 902,726 |
| Ion Media Networks, Inc.(b),(p) |
| Tranche B3 Term Loan |
3-month USD LIBOR + 3.000%
12/18/2020 | 4.260% | | 836,322 | 837,368 |
| Learfield Communications(b),(p) |
| 1st Lien Term Loan |
3-month USD LIBOR + 3.250%
12/01/2023 | 4.490% | | 597,000 | 599,615 |
| Lions Gate Entertainment Corp.(b),(c),(p) |
| Tranche A Term Loan |
3-month USD LIBOR + 2.500%
12/08/2021 | 3.239% | | 268,125 | 267,790 |
| Lions Gate Entertainment Corp.(b),(p) |
| Tranche B Term Loan |
3-month USD LIBOR + 3.000%
12/08/2023 | 4.239% | | 308,438 | 310,751 |
| Mission Broadcasting, Inc.(b),(p) |
| Tranche B2 Term Loan |
3-month USD LIBOR + 2.500%
01/17/2024 | 3.737% | | 54,684 | 54,753 |
The accompanying Notes to Financial Statements are an integral part of this statement.
Columbia Strategic Income Fund | Annual Report 2017
| 33 |
Portfolio of Investments (continued)
August 31, 2017
| Senior Loans (continued) |
| Borrower | Weighted
Average Coupon | | Principal
Amount ($) | Value ($) |
| Nexstar Broadcasting, Inc.(b),(p) |
| Tranche B2 Term Loan |
3-month USD LIBOR + 2.500%
01/17/2024 | 3.737% | | 440,362 | 440,913 |
| Nielsen Finance LLC(b),(p) |
| Tranche B4 Term Loan |
3-month USD LIBOR + 2.000%
10/04/2023 | 3.229% | | 719,572 | 719,485 |
| Radio One, Inc.(b),(p) |
| Term Loan |
3-month USD LIBOR + 4.000%
04/18/2023 | 5.300% | | 1,446,375 | 1,421,063 |
| Tribune Media Co.(b),(p) |
| Tranche B Term Loan |
3-month USD LIBOR + 3.000%
12/27/2020 | 4.239% | | 60,422 | 60,498 |
| Tranche C Term Loan |
3-month USD LIBOR + 3.000%
01/26/2024 | 4.239% | | 836,735 | 838,132 |
| UFC Holdings LLC(b),(p) |
| 2nd Lien Term Loan |
3-month USD LIBOR + 7.750%
08/18/2024 | 8.736% | | 678,000 | 690,712 |
| Univision Communications, Inc.(b),(p) |
| 1st Lien Term Loan |
3-month USD LIBOR + 2.750%
03/15/2024 | 3.989% | | 2,044,131 | 2,026,879 |
| Total | 13,544,231 |
| Metals and Mining 0.0% |
| Noranda Aluminum Acquisition Corp.(k),(p) |
| Tranche B Term Loan |
| 02/28/2019 | 0.000% | | 146,029 | 4,381 |
| Midstream 0.0% |
| Energy Transfer Equity LP(b),(p) |
| Term Loan |
3-month USD LIBOR + 2.750%
02/02/2024 | 3.981% | | 200,000 | 200,182 |
| Senior Loans (continued) |
| Borrower | Weighted
Average Coupon | | Principal
Amount ($) | Value ($) |
| Oil Field Services 0.0% |
| Fieldwood Energy LLC(b),(c),(p) |
| 1st Lien Term Loan |
3-month USD LIBOR + 7.125%
09/30/2020 | 8.421% | | 372,536 | 264,500 |
| Term Loan |
3-month USD LIBOR + 7.000%
08/31/2020 | 8.296% | | 275,952 | 253,876 |
| Fieldwood Energy LLC(b),(p) |
| 2nd Lien Term Loan |
3-month USD LIBOR + 7.125%
09/30/2020 | 8.421% | | 627,464 | 266,673 |
| MRC Global (US), Inc.(b),(p) |
| Term Loan |
3-month USD LIBOR + 4.000%
11/08/2019 | 5.239% | | 985,820 | 992,287 |
| Total | 1,777,336 |
| Other Industry 0.1% |
| Generac Power Systems, Inc.(b),(p) |
| Term Loan |
3-month USD LIBOR + 2.250%
05/31/2023 | 3.549% | | 1,000,000 | 1,001,250 |
| Harland Clarke Holdings Corp.(b),(p) |
| Tranche B6 Term Loan |
3-month USD LIBOR + 5.500%
02/09/2022 | 6.796% | | 1,547,777 | 1,552,297 |
| Husky Injection Molding Systems Ltd.(b),(p) |
| Term Loan |
3-month USD LIBOR + 3.250%
06/30/2021 | 4.489% | | 911,165 | 914,581 |
| Uber Technologies, Inc.(b),(p) |
| Term Loan |
3-month USD LIBOR + 4.000%
07/13/2023 | 5.236% | | 2,037,112 | 2,032,651 |
| Total | 5,500,779 |
| Other REIT 0.0% |
| Lightstone Holdco LLC(b),(p) |
| Tranche B Term Loan |
3-month USD LIBOR + 4.500%
01/30/2024 | 5.739% | | 1,860,725 | 1,847,830 |
The accompanying Notes to Financial Statements are an integral part of this statement.
| 34 | Columbia Strategic Income Fund | Annual Report 2017 |
Portfolio of Investments (continued)
August 31, 2017
| Senior Loans (continued) |
| Borrower | Weighted
Average Coupon | | Principal
Amount ($) | Value ($) |
| Tranche C Term Loan |
3-month USD LIBOR + 4.500%
01/30/2024 | 5.739% | | 115,942 | 115,138 |
| Total | 1,962,968 |
| Other Utility 0.0% |
| EWT Holdings III Corp.(b),(p) |
| 1st Lien Term Loan |
3-month USD LIBOR + 3.750%
01/15/2021 | 5.046% | | 950,305 | 959,808 |
| Packaging 0.5% |
| Anchor Glass Container Corp.(b),(p) |
| 1st Lien Term Loan |
3-month USD LIBOR + 2.750%
12/07/2023 | 4.032% | | 1,343,250 | 1,345,346 |
| Berry Global, Inc.(b),(p) |
| Tranche N Term Loan |
3-month USD LIBOR + 2.250%
01/19/2024 | 3.481% | | 2,992,500 | 2,991,752 |
| BWAY Holding Co.(b),(p) |
| Term Loan |
3-month USD LIBOR + 3.250%
04/03/2024 | 4.481% | | 1,325,000 | 1,325,411 |
| Consolidated Container Co. LLC(b),(p) |
| 1st Lien Term Loan |
3-month USD LIBOR + 3.500%
05/22/2024 | 4.739% | | 450,000 | 452,250 |
| Coveris Holdings SA(b),(p) |
| Tranche B1 Term Loan |
3-month USD LIBOR + 4.250%
06/29/2022 | 5.546% | | 1,469,543 | 1,457,302 |
| Novolex (b),(p) |
| Term Loan |
3-month USD LIBOR + 3.250%
12/29/2023 | 4.299% | | 1,770,563 | 1,767,021 |
| Packaging Coordinators Midco, Inc.(b),(p) |
| Term Loan |
3-month USD LIBOR + 4.000%
06/30/2023 | 5.300% | | 445,500 | 443,273 |
| Senior Loans (continued) |
| Borrower | Weighted
Average Coupon | | Principal
Amount ($) | Value ($) |
| Pregis Holding I Corp.(b),(p) |
| 1st Lien Term Loan |
3-month USD LIBOR + 4.000%
05/20/2021 | 4.796% | | 1,350,090 | 1,346,714 |
| Printpack Holdings, Inc.(b),(p) |
| Term Loan |
3-month USD LIBOR + 4.000%
07/26/2023 | 4.250% | | 766,067 | 768,939 |
| ProAmpac PG Borrower LLC(b),(p) |
| 1st Lien Term Loan |
3-month USD LIBOR + 4.000%
11/20/2023 | 5.275% | | 995,000 | 1,005,577 |
| 2nd Lien Term Loan |
3-month USD LIBOR + 8.500%
11/18/2024 | 9.816% | | 700,000 | 710,941 |
| Ranpak Corp.(b),(p) |
| Tranche B1 Term Loan |
3-month USD LIBOR + 3.250%
10/01/2021 | 4.489% | | 1,822,771 | 1,822,771 |
| Reynolds Group Holdings, Inc.(b),(p) |
| Term Loan |
3-month USD LIBOR + 3.000%
02/05/2023 | 4.239% | | 1,016,436 | 1,016,924 |
| SIG Combibloc Holdings SCA(b),(p) |
| Term Loan |
3-month USD LIBOR + 3.000%
03/11/2022 | 4.239% | | 963,379 | 966,992 |
| Tricorbraun Holdings, Inc.(b),(p) |
| 1st Lien Term Loan |
3-month USD LIBOR + 3.750%
11/30/2023 | 5.046% | | 407,045 | 409,284 |
| Tricorbraun Holdings, Inc.(b),(d),(p),(s) |
| Delayed Draw 1st Lien Term Loan |
3-month USD LIBOR + 3.750%
11/30/2023 | 3.750% | | 40,909 | 41,134 |
| Twist Beauty International Holdings SA(b),(p) |
| Tranche B Term Loan |
3-month USD LIBOR + 3.750%
04/22/2024 | 5.163% | | 1,000,000 | 998,130 |
| Total | 18,869,761 |
The accompanying Notes to Financial Statements are an integral part of this statement.
Columbia Strategic Income Fund | Annual Report 2017
| 35 |
Portfolio of Investments (continued)
August 31, 2017
| Senior Loans (continued) |
| Borrower | Weighted
Average Coupon | | Principal
Amount ($) | Value ($) |
| Paper 0.0% |
| Caraustar Industries, Inc.(b),(p) |
| Term Loan |
3-month USD LIBOR + 5.500%
03/14/2022 | 6.796% | | 872,812 | 863,212 |
| Pharmaceuticals 0.2% |
| Atrium Innovations, Inc.(b),(c),(p) |
| Tranche B1 1st Lien Term Loan |
3-month USD LIBOR + 3.250%
02/15/2021 | 4.796% | | 947,793 | 952,532 |
| Endo Finance Co. I SARL(b),(p) |
| Term Loan |
3-month USD LIBOR + 4.250%
04/29/2024 | 5.500% | | 725,000 | 729,756 |
| Grifols Worldwide Operations Ltd.(b),(p) |
| Tranche B Term Loan |
3-month USD LIBOR + 2.250%
01/31/2025 | 3.452% | | 1,246,875 | 1,248,209 |
| RPI Finance Trust(b),(p) |
| Tranche B6 Term Loan |
3-month USD LIBOR + 2.000%
03/27/2023 | 3.296% | | 1,990,000 | 1,997,144 |
| Valeant Pharmaceuticals International, Inc.(b),(p) |
| Tranche B-F Term Loan |
3-month USD LIBOR + 3.250%
04/01/2022 | 5.990% | | 761,972 | 774,674 |
| Total | 5,702,315 |
| Property & Casualty 0.1% |
| Alliant Holdings Intermediate LLC(b),(p) |
| Term Loan |
3-month USD LIBOR + 3.500%
08/12/2022 | 4.564% | | 392,004 | 391,694 |
| Asurion LLC(b),(p) |
| Tranche B4 Term Loan |
3-month USD LIBOR + 2.750%
08/04/2022 | 3.989% | | 262,426 | 263,000 |
| Tranche B5 Term Loan |
3-month USD LIBOR + 3.000%
11/03/2023 | 4.239% | | 425,853 | 427,450 |
| Senior Loans (continued) |
| Borrower | Weighted
Average Coupon | | Principal
Amount ($) | Value ($) |
| HUB International Ltd.(b),(p) |
| Term Loan |
3-month USD LIBOR + 3.000%
10/02/2020 | 4.312% | | 1,581,712 | 1,586,426 |
| USI, Inc.(b),(p) |
| Term Loan |
3-month USD LIBOR + 3.000%
05/16/2024 | 4.314% | | 775,000 | 770,319 |
| Total | 3,438,889 |
| Restaurants 0.1% |
| Burger King/Tim Hortons(b),(p) |
| Tranche B3 Term Loan |
3-month USD LIBOR + 2.250%
02/16/2024 | 3.511% | | 1,985,762 | 1,978,931 |
| P.F. Chang’s China Bistro, Inc.(b),(p),(q) |
| Tranche B Term Loan |
3-month USD LIBOR + 5.000%
08/18/2022 | 0.000% | | 1,025,000 | 994,250 |
| Yum! Brands, Inc.(b),(p) |
| Tranche B Term Loan |
3-month USD LIBOR + 2.750%
06/16/2023 | 3.228% | | 1,990,000 | 1,998,179 |
| Total | 4,971,360 |
| Retailers 0.5% |
| Academy Ltd.(b),(p) |
| Term Loan |
3-month USD LIBOR + 4.000%
07/01/2022 | 5.242% | | 997,305 | 664,205 |
| Bass Pro Group LLC(b),(p) |
| Term Loan |
3-month USD LIBOR + 3.250%
06/05/2020 | 4.479% | | 1,560,392 | 1,551,295 |
3-month USD LIBOR + 5.000%
12/15/2023 | 6.296% | | 1,000,000 | 945,630 |
| Belk, Inc.(b),(p) |
| 1st Lien Term Loan |
3-month USD LIBOR + 4.750%
12/12/2022 | 6.054% | | 544,274 | 441,313 |
The accompanying Notes to Financial Statements are an integral part of this statement.
| 36 | Columbia Strategic Income Fund | Annual Report 2017 |
Portfolio of Investments (continued)
August 31, 2017
| Senior Loans (continued) |
| Borrower | Weighted
Average Coupon | | Principal
Amount ($) | Value ($) |
| BJ’s Wholesale Club, Inc.(b),(p) |
| Tranche B 1st Lien Term Loan |
3-month USD LIBOR + 3.750%
02/03/2024 | 4.968% | | 922,688 | 887,755 |
| Burlington Coat Factory Warehouse Corp.(b),(p) |
| Tranche B4 Term Loan |
3-month USD LIBOR + 2.750%
08/13/2021 | 3.980% | | 2,000,000 | 2,005,000 |
| David’s Bridal, Inc.(b),(p) |
| Term Loan |
3-month USD LIBOR + 3.750%
10/11/2019 | 5.300% | | 2,442,188 | 1,906,445 |
| Dollar Tree, Inc.(p) |
| Tranche B2 Term Loan |
| 07/06/2022 | 4.250% | | 250,000 | 252,813 |
| General Nutrition Centers, Inc.(b),(p) |
| Tranche B Term Loan |
3-month USD LIBOR + 2.500%
03/04/2019 | 3.740% | | 964,208 | 909,171 |
| Harbor Freight Tools USA, Inc.(b),(p) |
| Term Loan |
3-month USD LIBOR + 3.250%
08/18/2023 | 4.489% | | 1,965,000 | 1,971,642 |
| Hudson’s Bay Co.(b),(p) |
| Term Loan |
3-month USD LIBOR + 3.750%
09/30/2022 | 4.546% | | 476,728 | 457,659 |
| J. Crew Group, Inc.(b),(p) |
| Term Loan |
3-month USD LIBOR + 3.000%
03/05/2021 | 4.491% | | 1,783,214 | 1,007,516 |
| JC Penney Corp., Inc.(b),(p) |
| Term Loan |
3-month USD LIBOR + 4.250%
06/23/2023 | 5.568% | | 780,000 | 767,653 |
| Neiman Marcus Group, Inc. (The)(b),(p) |
| Term Loan |
3-month USD LIBOR + 3.250%
10/25/2020 | 4.481% | | 992,754 | 729,446 |
| Senior Loans (continued) |
| Borrower | Weighted
Average Coupon | | Principal
Amount ($) | Value ($) |
| PetSmart, Inc.(b),(p) |
| Tranche B2 Term Loan |
3-month USD LIBOR + 3.000%
03/11/2022 | 4.240% | | 735,600 | 645,952 |
| Rite Aid Corp.(b),(p) |
| Tranche 1 2nd Lien Term Loan |
3-month USD LIBOR + 4.750%
08/21/2020 | 5.990% | | 1,050,000 | 1,057,875 |
| Tranche 2 2nd Lien Term Loan |
3-month USD LIBOR + 3.875%
06/21/2021 | 5.115% | | 325,000 | 326,219 |
| Sports Authority, Inc. (The)(k),(p) |
| Tranche B Term Loan |
| 11/16/2017 | 0.000% | | 619,565 | 25,817 |
| Staples, Inc.(b),(p),(q) |
| Tranche B Term Loan |
3-month USD LIBOR + 4.000%
08/15/2024 | 0.000% | | 1,275,000 | 1,268,332 |
| Total | 17,821,738 |
| Supermarkets 0.1% |
| Albertson’s LLC(b),(p) |
| Tranche B4 Term Loan |
3-month USD LIBOR + 2.750%
08/25/2021 | 3.989% | | 984,320 | 954,436 |
| Tranche B6 Term Loan |
3-month USD LIBOR + 3.000%
06/22/2023 | 4.317% | | 1,418,660 | 1,377,278 |
| SUPERVALU, Inc.(b),(p) |
| Delayed Draw Term Loan |
3-month USD LIBOR + 3.500%
06/08/2024 | 4.739% | | 346,008 | 333,610 |
| Term Loan |
3-month USD LIBOR + 3.500%
06/08/2024 | 4.739% | | 576,679 | 556,017 |
| Total | 3,221,341 |
| Technology 0.9% |
| Ancestry.com Operations, Inc.(b),(p) |
| 2nd Lien Term Loan |
3-month USD LIBOR + 8.250%
10/19/2024 | 9.490% | | 603,537 | 610,327 |
The accompanying Notes to Financial Statements are an integral part of this statement.
Columbia Strategic Income Fund | Annual Report 2017
| 37 |
Portfolio of Investments (continued)
August 31, 2017
| Senior Loans (continued) |
| Borrower | Weighted
Average Coupon | | Principal
Amount ($) | Value ($) |
| Applied Systems, Inc.(b),(p) |
| 1st Lien Term Loan |
3-month USD LIBOR + 4.000%
01/25/2021 | 4.546% | | 1,057,356 | 1,063,964 |
| Ascend Learning LLC(b),(p),(q) |
| Term Loan |
3-month USD LIBOR + 3.250%
07/12/2024 | 0.000% | | 296,000 | 296,986 |
| BMC Foreign Holding Co. Unlimited Co.(b),(p) |
| Tranche B1 Term Loan |
3-month USD LIBOR + 4.000%
09/10/2022 | 5.296% | | 968,217 | 964,586 |
| Cirque Du Soleil, Inc.(b),(p) |
| 2nd Lien Term Loan |
3-month USD LIBOR + 8.250%
07/10/2023 | 9.546% | | 1,000,000 | 998,750 |
| Dell International LLC(b),(p) |
| Tranche B Term Loan |
3-month USD LIBOR + 2.500%
09/07/2023 | 3.740% | | 1,542,250 | 1,547,972 |
| First Data Corp.(b),(p) |
| Term Loan |
3-month USD LIBOR + 2.250%
07/08/2022 | 3.486% | | 962,001 | 960,799 |
| Genesys Telecommunications Laboratories, Inc.(b),(p),(q) |
| Tranche B2 Term Loan |
3-month USD LIBOR + 3.750%
12/01/2023 | 5.007% | | 666,375 | 669,827 |
| Go Daddy Operating Co. LLC(b),(p) |
| Term Loan |
3-month USD LIBOR + 2.500%
02/15/2024 | 3.739% | | 3,344,229 | 3,349,814 |
| Hyland Software, Inc.(b),(p) |
| Tranche 1 1st Lien Term Loan |
3-month USD LIBOR + 3.250%
07/01/2022 | 4.489% | | 1,000,000 | 1,007,500 |
| Infor US, Inc.(b),(p) |
| Tranche B6 Term Loan |
3-month USD LIBOR + 2.750%
02/01/2022 | 4.046% | | 905,804 | 902,896 |
| Senior Loans (continued) |
| Borrower | Weighted
Average Coupon | | Principal
Amount ($) | Value ($) |
| Informatica Corp.(b),(p) |
| Term Loan |
3-month USD LIBOR + 3.500%
08/05/2022 | 4.796% | | 982,478 | 983,097 |
| Information Resources, Inc.(b),(p) |
| 1st Lien Term Loan |
3-month USD LIBOR + 4.250%
01/18/2024 | 5.486% | | 1,371,562 | 1,380,135 |
| 2nd Lien Term Loan |
3-month USD LIBOR + 8.250%
01/20/2025 | 9.486% | | 375,000 | 373,594 |
| Kronos, Inc.(b),(p) |
| 2nd Lien Term Loan |
3-month USD LIBOR + 8.250%
11/01/2024 | 9.561% | | 957,000 | 988,102 |
| MA FinanceCo LLC(b),(p) |
| Tranche B2 Term Loan |
3-month USD LIBOR + 2.500%
11/19/2021 | 3.811% | | 367,563 | 366,735 |
| Tranche B3 Term Loan |
3-month USD LIBOR + 2.750%
06/21/2024 | 3.981% | | 284,673 | 284,318 |
| MacDonald, Dettwiler and Associates Ltd.(b),(p),(q) |
| Tranche B Term Loan |
3-month USD LIBOR + 2.750%
07/05/2024 | 0.000% | | 1,000,000 | 995,250 |
| Microsemi Corp.(b),(p) |
| Tranche B Term Loan |
3-month USD LIBOR + 3.750%
01/15/2023 | 3.553% | | 546,106 | 547,018 |
| Misys Ltd.(b),(p) |
| 1st Lien Term Loan |
3-month USD LIBOR + 3.500%
06/13/2024 | 4.817% | | 725,000 | 728,081 |
| 2nd Lien Term Loan |
3-month USD LIBOR + 7.250%
06/13/2025 | 8.567% | | 374,090 | 380,345 |
The accompanying Notes to Financial Statements are an integral part of this statement.
| 38 | Columbia Strategic Income Fund | Annual Report 2017 |
Portfolio of Investments (continued)
August 31, 2017
| Senior Loans (continued) |
| Borrower | Weighted
Average Coupon | | Principal
Amount ($) | Value ($) |
| Oberthur Technologies Holding SAS(b),(p),(q) |
| Tranche B1 Term Loan |
3-month USD LIBOR + 3.750%
01/10/2024 | 5.046% | | 1,349,125 | 1,326,635 |
| ON Semiconductor Corp.(b),(p) |
| Term Loan |
3-month USD LIBOR + 2.250%
03/31/2023 | 3.489% | | 714,542 | 716,528 |
| Rackspace Hosting, Inc.(b),(p) |
| Tranche B 1st Lien Term Loan |
3-month USD LIBOR + 3.000%
11/03/2023 | 4.310% | | 448,875 | 449,248 |
| Riverbed Technology, Inc.(b),(p) |
| Term Loan |
3-month USD LIBOR + 4.000%
04/24/2022 | 4.490% | | 1,673,412 | 1,622,858 |
| Sabre GLBL, Inc.(b),(p) |
| Tranche B1 Term Loan |
3-month USD LIBOR + 2.250%
02/22/2024 | 3.486% | | 1,143,062 | 1,146,994 |
| SCS Holdings I, Inc.(b),(p) |
| Tranche B 1st Lien Term Loan |
3-month USD LIBOR + 4.250%
10/30/2022 | 5.489% | | 324,158 | 326,048 |
| Seattle SpinCo, Inc.(b),(p) |
| Term Loan |
3-month USD LIBOR + 2.750%
06/21/2024 | 4.030% | | 1,665,327 | 1,663,245 |
| Synchronoss Technologies, Inc.(b),(p) |
| Term Loan |
3-month USD LIBOR + 2.750%
01/19/2024 | 5.757% | | 673,312 | 663,213 |
| Tempo Acquisition, LLC(b),(p) |
| Term Loan |
3-month USD LIBOR + 3.000%
05/01/2024 | 4.237% | | 950,000 | 952,850 |
| Tessera Holdings Corp.(b),(p) |
| Tranche B Term Loan |
3-month USD LIBOR + 3.250%
12/01/2023 | 4.489% | | 373,125 | 377,091 |
| Senior Loans (continued) |
| Borrower | Weighted
Average Coupon | | Principal
Amount ($) | Value ($) |
| Verint Systems, Inc.(b),(p) |
| Term Loan |
3-month USD LIBOR + 2.250%
06/28/2024 | 3.561% | | 1,097,250 | 1,098,622 |
| Veritas US, Inc.(b),(p) |
| Tranche B Term Loan |
3-month USD LIBOR + 4.500%
01/27/2023 | 5.796% | | 1,239,751 | 1,248,528 |
| Zebra Technologies Corp.(b),(p) |
| Tranche B Term Loan |
3-month USD LIBOR + 2.000%
10/27/2021 | 3.314% | | 689,268 | 688,358 |
| Total | 31,680,314 |
| Wireless 0.2% |
| Cellular South, Inc.(b),(p) |
| Tranche B Term Loan |
3-month USD LIBOR + 2.250%
05/17/2024 | 3.546% | | 2,395,000 | 2,395,000 |
| Numericable US LLC(b),(p) |
| Tranche B11 Term Loan |
3-month USD LIBOR + 2.750%
07/31/2025 | 4.061% | | 997,500 | 991,764 |
| Sprint Communications, Inc.(b),(p) |
| Term Loan |
3-month USD LIBOR + 2.500%
02/02/2024 | 3.750% | | 2,817,937 | 2,817,938 |
| Switch Ltd.(b),(p) |
| Term Loan |
3-month USD LIBOR + 2.750%
06/27/2024 | 3.984% | | 575,000 | 578,237 |
| Total | 6,782,939 |
| Wirelines 0.1% |
| CenturyLink, Inc.(b),(p) |
| Tranche B Term Loan |
3-month USD LIBOR + 2.750%
01/31/2025 | 2.750% | | 325,000 | 317,824 |
| Level 3 Financing, Inc.(b),(p) |
| Tranche B Term Loan |
3-month USD LIBOR + 2.250%
02/22/2024 | 3.485% | | 1,250,000 | 1,248,825 |
The accompanying Notes to Financial Statements are an integral part of this statement.
Columbia Strategic Income Fund | Annual Report 2017
| 39 |
Portfolio of Investments (continued)
August 31, 2017
| Senior Loans (continued) |
| Borrower | Weighted
Average Coupon | | Principal
Amount ($) | Value ($) |
| Windstream Services LLC(b),(p) |
| Tranche B6 Term Loan |
3-month USD LIBOR + 4.000%
03/29/2021 | 5.230% | | 1,243,734 | 1,133,664 |
| Total | 2,700,313 |
Total Senior Loans
(Cost $275,080,638) | 271,389,234 |
| Options Purchased Calls 0.1% |
| | | | | Value ($) |
| (Cost $3,845,400) | 4,639,072 |
|
| Options Purchased Puts 0.1% |
| | | | | Value ($) |
| (Cost $3,736,500) | 2,090,819 |
| Money Market Funds 6.4% |
| | Shares | Value ($) |
| Columbia Short-Term Cash Fund, 1.146%(t),(u) | 237,155,963 | 237,155,963 |
Total Money Market Funds
(Cost $237,157,524) | 237,155,963 |
Total Investments
(Cost: $3,634,609,062) | 3,708,472,547 |
| Other Assets & Liabilities, Net | | (29,858,887) |
| Net Assets | 3,678,613,660 |
At August 31, 2017, securities and/or cash totaling $39,232,670 were pledged as collateral.
Investments in derivatives
| Forward foreign currency exchange contracts |
Currency to
be sold | Currency to
be purchased | Counterparty | Settlement
date | Unrealized
appreciation ($) | Unrealized
depreciation ($) |
| 4,336,000,000 HUF | 16,611,563 USD | Barclays | 09/12/2017 | — | (277,890) |
| 16,828,640 USD | 4,336,000,000 HUF | Barclays | 09/12/2017 | 60,813 | — |
| 55,987,000 ILS | 15,800,361 USD | BNP Paribas | 09/12/2017 | 175,008 | — |
| 11,091,466 USD | 39,835,000 ILS | BNP Paribas | 09/12/2017 | 26,043 | — |
| 4,511,606 USD | 16,152,000 ILS | BNP Paribas | 09/12/2017 | — | (3,761) |
| 14,847,000 EUR | 17,582,337 USD | BNP Paribas | 09/19/2017 | — | (105,719) |
| 16,300,000 EUR | 19,305,068 USD | Credit Suisse | 09/19/2017 | — | (114,027) |
| 36,738,994 USD | 296,088,000 SEK | Credit Suisse | 09/19/2017 | 554,516 | — |
| 30,169,000,000 COP | 9,984,776 USD | HSBC | 09/12/2017 | — | (233,977) |
| 68,761,000 BRL | 21,626,356 USD | Standard Chartered | 09/12/2017 | — | (193,671) |
| Total | | | | 816,380 | (929,045) |
| Long futures contracts |
| Description | Number of
contracts | Expiration
date | Trading
currency | Notional
amount | Value/Unrealized
appreciation ($) | Value/Unrealized
depreciation ($) |
| Euro-BTP | 638 | 09/2017 | EUR | 87,788,494 | 719,680 | — |
| U.S. Treasury 2-Year Note | 708 | 12/2017 | USD | 154,625,890 | 64,993 | — |
| U.S. Treasury 5-Year Note | 2,862 | 12/2017 | USD | 339,919,940 | 575,477 | — |
| Total | | | | | 1,360,150 | — |
| Short futures contracts |
| Description | Number of
contracts | Expiration
date | Trading
currency | Notional
amount | Value/Unrealized
appreciation ($) | Value/Unrealized
depreciation ($) |
| Euro-Bund | (522) | 09/2017 | EUR | (86,223,892) | — | (203,802) |
| Euro-Buxl 30-Year | (292) | 09/2017 | EUR | (49,410,462) | — | (343,486) |
| Euro-Schatz | (2,852) | 09/2017 | EUR | (320,270,730) | — | (409,005) |
| Long Gilt | (1,789) | 12/2017 | GBP | (231,881,110) | — | (1,497,111) |
The accompanying Notes to Financial Statements are an integral part of this statement.
| 40 | Columbia Strategic Income Fund | Annual Report 2017 |
Portfolio of Investments (continued)
August 31, 2017
| Short futures contracts (continued) |
| Description | Number of
contracts | Expiration
date | Trading
currency | Notional
amount | Value/Unrealized
appreciation ($) | Value/Unrealized
depreciation ($) |
| U.S. Treasury 10-Year Note | (2,513) | 12/2017 | USD | (320,566,548) | — | (947,778) |
| U.S. Ultra Bond | (1,558) | 12/2017 | USD | (267,446,716) | — | (1,561,599) |
| Total | | | | | — | (4,962,781) |
| Call option contracts purchased |
| Description | Counterparty | Trading
currency | Notional
amount | Number of
contracts | Exercise
price/Rate | Expiration
date | Cost ($) | Value ($) |
| 10-Year OTC interest rate swap with Citi to receive exercise rate and pay 3-Month USD LIBOR BBA | Citi | USD | 75,000,000 | 75,000,000 | 2.40 | 05/2018 | 1,935,000 | 2,414,445 |
| 10-Year OTC interest rate swap with Citi to receive exercise rate and pay 3-Month USD LIBOR BBA | Citi | USD | 96,000,000 | 96,000,000 | 2.15 | 08/2018 | 1,910,400 | 2,224,627 |
| Total | | | | | | | 3,845,400 | 4,639,072 |
| Put option contracts purchased |
| Description | Counterparty | Trading
currency | Notional
amount | Number of
contracts | Exercise
price/Rate | Expiration
date | Cost ($) | Value ($) |
| 10-Year OTC interest rate swap with Citi to receive 3-Month USD LIBOR BBA and pay exercise rate | Citi | USD | 96,000,000 | 96,000,000 | 2.40 | 08/2018 | 1,872,000 | 1,584,797 |
| 5-Year OTC interest rate swap with Citi to receive 3-Month USD LIBOR BBA and pay exercise rate | Citi | USD | 165,000,000 | 165,000,000 | 2.30 | 05/2018 | 1,864,500 | 506,022 |
| Total | | | | | | | 3,736,500 | 2,090,819 |
| Cleared interest rate swap contracts |
| Fund receives | Fund pays | Payment
frequency | Counterparty | Maturity
date | Notional
currency | Notional
amount | Value
($) | Upfront
payments
($) | Upfront
receipts
($) | Unrealized
appreciation
($) | Unrealized
depreciation
($) |
| Fixed rate of 1.377% | 3-Month USD LIBOR-BBA | Receives Semi annually, Pays Quarterly | Morgan Stanley | 11/01/2021 | USD | 160,000,000 | (1,609,322) | 21 | — | — | (1,609,322) |
| Fixed rate of 1.335% | 3-Month USD LIBOR-BBA | Receives Semi annually, Pays Quarterly | Morgan Stanley | 11/09/2021 | USD | 150,000,000 | (1,805,218) | 649 | — | — | (1,805,218) |
| Fixed rate of 1.728% | 3-Month USD LIBOR | Receives Semi annually, Pays Quarterly | Morgan Stanley | 11/17/2021 | USD | 166,000,000 | 819,994 | 720 | — | 819,994 | — |
| 3-Month USD LIBOR | Fixed rate of 2.090% | Receives Quarterly, Pays Semi annually | Morgan Stanley | 02/11/2025 | USD | 183,000,000 | (1,893,618) | 1,220 | — | — | (1,893,618) |
| Fixed rate of 6.318% | 28-Day MXN TIIE-Banxico | Receives Monthly, Pays Monthly | Morgan Stanley | 01/09/2026 | MXN | 580,000,000 | (1,849,992) | — | — | — | (1,849,992) |
| Fixed rate of 5.985% | 28-Day MXN TIIE-Banxico | Receives Monthly, Pays Monthly | Morgan Stanley | 01/21/2026 | MXN | 211,000,000 | (862,710) | 1 | — | — | (862,710) |
| 3-Month USD LIBOR-BBA | Fixed rate of 1.783% | Receives Quarterly, Pays Semi annually | Morgan Stanley | 02/04/2026 | USD | 19,000,000 | 330,126 | 101 | — | 330,126 | — |
| 3-Month USD LIBOR-BBA | Fixed rate of 1.980% | Receives Quarterly, Pays Semi annually | Morgan Stanley | 10/21/2046 | USD | 32,513,120 | 2,879,095 | 24 | — | 2,879,095 | — |
| 3-Month USD LIBOR-BBA | Fixed rate of 2.086% | Receives Quarterly, Pays Semi annually | Morgan Stanley | 11/09/2046 | USD | 30,286,624 | 1,977,039 | 172 | — | 1,977,039 | — |
| Total | | | | | | | (2,014,606) | 2,908 | — | 6,006,254 | (8,020,860) |
The accompanying Notes to Financial Statements are an integral part of this statement.
Columbia Strategic Income Fund | Annual Report 2017
| 41 |
Portfolio of Investments (continued)
August 31, 2017
| Cleared credit default swap contracts - buy protection |
Reference
entity | Counterparty | Maturity
date | Pay
fixed
rate
(%) | Payment
frequency | Notional
currency | Notional
amount | Value
($) | Upfront
payments
($) | Upfront
receipts
($) | Unrealized
appreciation
($) | Unrealized
depreciation
($) |
| Markit CDX North America High Yield Index, Series 28 | Morgan Stanley | 06/20/2022 | 5.000 | Quarterly | USD | 113,400,000 | (2,751,348) | — | (6,634,118) | — | (2,751,348) |
| Markit iTraxx Europe Crossover Index, Series 25 | Morgan Stanley | 06/20/2022 | 5.000 | Quarterly | EUR | 43,000,000 | (2,526,073) | — | (3,977,078) | — | (2,526,073) |
| Total | | | | | | | (5,277,421) | — | (10,611,196) | — | (5,277,421) |
| Credit default swap contracts - sell protection |
Reference
entity | Counterparty | Maturity
date | Receive
fixed
rate
(%) | Payment
frequency | Implied
credit
spread
(%)* | Notional
currency | Notional
amount | Value
($) | Periodic
payments
receivable
(payable)
($) | Upfront
payments
($) | Upfront
receipts
($) | Unrealized
appreciation
($) | Unrealized
depreciation
($) |
| Markit CMBX North America Index, Series 6 BBB- | Credit Suisse | 05/11/2063 | 3.000 | Monthly | 6.418 | USD | 5,000,000 | (703,990) | 2,916 | — | (629,474) | — | (71,600) |
| Markit CMBX North America Index, Series 6 BBB- | Credit Suisse | 05/11/2063 | 3.000 | Monthly | 6.418 | USD | 2,750,000 | (387,195) | 1,605 | — | (296,769) | — | (88,821) |
| Markit CMBX North America Index, Series 7 BBB- | Credit Suisse | 01/17/2047 | 3.000 | Monthly | 5.171 | USD | 10,000,000 | (1,090,705) | 5,833 | — | (1,609,680) | 524,808 | — |
| Markit CMBX North America Index, Series 7 BBB- | Credit Suisse | 01/17/2047 | 3.000 | Monthly | 5.171 | USD | 12,000,000 | (1,308,846) | 6,999 | — | (1,074,543) | — | (227,304) |
| Markit CMBX North America Index, Series 10 BBB- | Goldman Sachs International | 11/17/2059 | 3.000 | Monthly | 4.518 | USD | 9,500,000 | (1,004,503) | 5,541 | — | (1,087,837) | 88,875 | — |
| Markit CMBX North America Index, Series 6 BBB- | Goldman Sachs International | 05/11/2063 | 3.000 | Monthly | 6.418 | USD | 7,250,000 | (1,020,786) | 4,230 | — | (867,956) | — | (148,600) |
| Markit CMBX North America Index, Series 6 BBB- | Goldman Sachs International | 05/11/2063 | 3.000 | Monthly | 6.418 | USD | 5,750,000 | (809,588) | 3,354 | — | (598,178) | — | (208,056) |
| Markit CMBX North America Index, Series 6 BBB- | Goldman Sachs International | 05/11/2063 | 3.000 | Monthly | 6.418 | USD | 5,750,000 | (809,589) | 3,355 | — | (510,076) | — | (296,158) |
| Markit CMBX North America Index, Series 6 BBB- | JPMorgan | 05/11/2063 | 0.000 | Monthly | 6.418 | USD | 9,600,000 | (1,357,261) | 5,601 | — | (1,332,041) | — | (19,619) |
| Markit CMBX North America Index, Series 10 BBB- | Morgan Stanley | 11/17/2059 | 3.000 | Monthly | 4.518 | USD | 7,000,000 | (740,160) | 4,083 | — | (824,162) | 88,085 | — |
| Markit CMBX North America Index, Series 6 BBB- | Morgan Stanley | 05/11/2063 | 3.000 | Monthly | 6.418 | USD | 2,900,000 | (408,314) | 1,691 | — | (280,797) | — | (125,826) |
| Markit CMBX North America Index, Series 6 BBB- | Morgan Stanley | 05/11/2063 | 3.000 | Monthly | 6.418 | USD | 5,500,000 | (774,389) | 3,209 | — | (330,883) | — | (440,297) |
| Total | | | | | | | | | 48,417 | — | (9,442,396) | 701,768 | (1,626,281) |
| * | Implied credit spreads, represented in absolute terms, utilized in determining the market value of credit default swap agreements on corporate or sovereign issues as of period end serve as an indicator of the current status of the payment/performance risk and represent the likelihood or risk of default for the credit derivative. The implied credit spread of a particular referenced entity reflects the cost of buying/selling protection and may include upfront payments required to be made to enter into the agreement. Wider credit spreads represent a deterioration of the referenced entity’s credit soundness and a greater likelihood or risk of default or other credit event occurring as defined under the terms of the agreement. |
The accompanying Notes to Financial Statements are an integral part of this statement.
| 42 | Columbia Strategic Income Fund | Annual Report 2017 |
Portfolio of Investments (continued)
August 31, 2017
Notes to Portfolio of Investments
| (a) | Represents privately placed and other securities and instruments exempt from SEC registration (collectively, private placements), such as Section 4(a)(2) and Rule 144A eligible securities, which are often sold only to qualified institutional buyers. The Fund may invest in private placements determined to be liquid as well as those determined to be illiquid. Private placements may be determined to be liquid under guidelines established by the Fund’s Board of Trustees. At August 31, 2017, the value of these securities amounted to $1,856,962,364, which represents 50.48% of net assets. |
| (b) | Variable rate security. |
| (c) | Valuation based on significant unobservable inputs. |
| (d) | Represents a security purchased on a when-issued basis. |
| (e) | Represents shares owned in the residual interest of an asset-backed securitization. |
| (f) | Zero coupon bond. |
| (g) | Represents a variable rate security where the coupon rate adjusts periodically using the weighted average coupon of the underlying mortgages. |
| (h) | Non-income producing investment. |
| (i) | Principal amounts are denominated in United States Dollars unless otherwise noted. |
| (j) | Represents a step bond where the coupon rate adjusts according to a schedule for a series of periods, typically lower for an initial period and then increasing to a higher coupon rate thereafter. |
| (k) | Represents securities that have defaulted on payment of interest. The Fund has stopped accruing interest on these securities. At August 31, 2017, the value of these securities amounted to $941,058, which represents 0.03% of net assets. |
| (l) | Represents fair value as determined in good faith under procedures approved by the Board of Trustees. At August 31, 2017, the value of these securities amounted to $260, which represents less than 0.01% of net assets. |
| (m) | Principal and interest may not be guaranteed by the government. |
| (n) | This security or a portion of this security has been pledged as collateral in connection with derivative contracts. |
| (o) | Represents interest only securities which have the right to receive the monthly interest payments on an underlying pool of mortgage loans. |
| (p) | Senior loans have interest rates that float periodically based primarily on the London Interbank Offered Rate (“LIBOR”) and other short-term rates. The interest rate shown reflects the weighted average coupon as of August 31, 2017. The interest rate shown for senior loans purchased on a when-issued or delayed delivery basis, if any, reflects an estimated average coupon. Remaining maturities of senior loans may be less than the stated maturities shown as a result of contractual or optional prepayments by the borrower. Such prepayments cannot be predicted. |
| (q) | Represents a security purchased on a forward commitment basis. |
| (r) | The borrower filed for protection under Chapter 11 of the U.S. Federal Bankruptcy Code. |
| (s) | At August 31, 2017, the Fund had unfunded senior loan commitments pursuant to the terms of the loan agreement. The Fund receives a stated coupon rate until the borrower draws on the loan commitment, at which time the rate will become the stated rate in the loan agreement. |
| Borrower | Unfunded Commitment ($) |
Tricorbraun Holdings, Inc.
Delayed Draw 1st Lien Term Loan
11/30/2023 3.750% | 40,909 |
| (t) | The rate shown is the seven-day current annualized yield at August 31, 2017. |
| (u) | As defined in the Investment Company Act of 1940, an affiliated company is one in which the Fund owns 5% or more of the company’s outstanding voting securities, or a company which is under common ownership or control with the Fund. Holdings and transactions in these affiliated companies during the year ended August 31, 2017 are as follows: |
| Issuer | Beginning
shares | Shares
purchased | Shares
sold | Ending
shares | Realized gain
(loss) ($) | Net change in
unrealized
appreciation
(depreciation) ($) | Dividends —
affiliated
issuers($) | Value ($) |
| Columbia Short-Term Cash Fund, 1.146% | 170,028,454 | 1,035,517,306 | (968,389,797) | 237,155,963 | 11,756 | (1,455) | 1,340,693 | 237,155,963 |
Abbreviation Legend
| CMO | Collateralized Mortgage Obligation |
| FGIC | Financial Guaranty Insurance Corporation |
| PIK | Payment In Kind |
| STRIPS | Separate Trading of Registered Interest and Principal Securities |
The accompanying Notes to Financial Statements are an integral part of this statement.
Columbia Strategic Income Fund | Annual Report 2017
| 43 |
Portfolio of Investments (continued)
August 31, 2017
Currency Legend
| BRL | Brazilian Real |
| CAD | Canada Dollar |
| COP | Colombian Peso |
| DOP | Dominican Republic Peso |
| EUR | Euro |
| GBP | British Pound |
| HUF | Hungarian Forint |
| ILS | New Israeli Sheqel |
| MXN | Mexican Peso |
| PEN | Peruvian New Sol |
| RUB | Russia Ruble |
| SEK | Swedish Krona |
| USD | US Dollar |
Fair value measurements
The Fund categorizes its fair value measurements according to a three-level hierarchy that maximizes the use of observable inputs and minimizes the use of unobservable inputs by prioritizing that the most observable input be used when available. Observable inputs are those that market participants would use in pricing an investment based on market data obtained from sources independent of the reporting entity. Unobservable inputs are those that reflect the Fund’s assumptions about the information market participants would use in pricing an investment. An investment’s level within the fair value hierarchy is based on the lowest level of any input that is deemed significant to the asset’s or liability’s fair value measurement. The input levels are not necessarily an indication of the risk or liquidity associated with investments at that level. For example, certain U.S. government securities are generally high quality and liquid, however, they are reflected as Level 2 because the inputs used to determine fair value may not always be quoted prices in an active market.
Fair value inputs are summarized in the three broad levels listed below:
| • | Level 1 – Valuations based on quoted prices for investments in active markets that the Fund has the ability to access at the measurement date. Valuation adjustments are not applied to Level 1 investments. |
| • | Level 2 – Valuations based on other significant observable inputs (including quoted prices for similar securities, interest rates, prepayment speeds, credit risks, etc.). |
| • | Level 3 – Valuations based on significant unobservable inputs (including the Fund’s own assumptions and judgment in determining the fair value of investments). |
Inputs that are used in determining fair value of an investment may include price information, credit data, volatility statistics, and other factors. These inputs can be either observable or unobservable. The availability of observable inputs can vary between investments, and is affected by various factors such as the type of investment, and the volume and level of activity for that investment or similar investments in the marketplace. The inputs will be considered by the Investment Manager, along with any other relevant factors in the calculation of an investment’s fair value. The Fund uses prices and inputs that are current as of the measurement date, which may include periods of market dislocations. During these periods, the availability of prices and inputs may be reduced for many investments. This condition could cause an investment to be reclassified between the various levels within the hierarchy.
Certain investments that have been measured at fair value using the net asset value (NAV) per share (or its equivalent) are not categorized in the fair value hierarchy. The fair value amounts presented in the table are intended to reconcile the fair value hierarchy to the amounts presented in the Portfolio of Investments. The Columbia Short-Term Cash Fund seeks to provide shareholders with maximum current income consistent with liquidity and stability of principal. Columbia Short-Term Cash Fund prices its shares with a floating NAV and no longer seeks to maintain a stable NAV.
Investments falling into the Level 3 category are primarily supported by quoted prices from brokers and dealers participating in the market for those investments. However, these may be classified as Level 3 investments due to lack of market transparency and corroboration to support these quoted prices. Additionally, valuation models may be used as the pricing source for any remaining investments classified as Level 3. These models may rely on one or more significant unobservable inputs and/or significant assumptions by the Investment Manager. Inputs used in valuations may include, but are not limited to, financial statement analysis, capital account balances, discount rates and estimated cash flows, and comparable company data.
Under the direction of the Fund’s Board of Trustees (the Board), the Investment Manager’s Valuation Committee (the Committee) is responsible for overseeing the valuation procedures approved by the Board. The Committee consists of voting and non-voting members from various groups within the Investment Manager’s organization, including operations and accounting, trading and investments, compliance, risk management and legal.
The Committee meets at least monthly to review and approve valuation matters, which may include a description of specific valuation determinations, data regarding pricing information received from approved pricing vendors and brokers and the results of Board-approved valuation control policies and procedures (the Policies). The Policies address, among other things, instances when market quotations are or are not readily available, including recommendations of third party pricing vendors and a determination of appropriate pricing methodologies; events that require specific valuation determinations and assessment of fair value techniques; securities with a potential for stale pricing, including those that are illiquid, restricted, or in default; and the effectiveness of third party pricing vendors, including periodic reviews of vendors. The Committee meets more frequently, as needed, to discuss additional valuation matters, which may include the need to review back-testing results, review time-sensitive information or approve related valuation actions. The Committee reports to the Board, with members of the Committee meeting with the Board at each of its regularly scheduled meetings to discuss valuation matters and actions during the period, similar to those described earlier.
For investments categorized as Level 3, the Committee monitors information similar to that described above, which may include: (i) data specific to the issuer or comparable issuers, (ii) general market or specific sector news and (iii) quoted prices and specific or similar security transactions. The Committee considers this data and any changes from prior periods in order to assess the reasonableness of observable and unobservable inputs, any assumptions or internal models used to value those securities and changes in fair value. This data is also used to corroborate, when available, information received from approved pricing vendors and brokers. Various factors impact the frequency of monitoring this information (which may occur as often as daily). However, the Committee may determine that changes to inputs, assumptions and models are not required as a result of the monitoring procedures performed.
The accompanying Notes to Financial Statements are an integral part of this statement.
| 44 | Columbia Strategic Income Fund | Annual Report 2017 |
Portfolio of Investments (continued)
August 31, 2017
Fair value measurements (continued)
The following table is a summary of the inputs used to value the Fund’s investments at August 31, 2017:
| | Level 1
quoted prices
in active
markets for
identical
assets ($) | Level 2
other
significant
observable
inputs ($) | Level 3
significant
unobservable
inputs ($) | Investments
measured at
net asset
value ($) | Total ($) |
| Investments | | | | | |
| Asset-Backed Securities — Non-Agency | — | 223,772,363 | 73,787,675 | — | 297,560,038 |
| Commercial Mortgage-Backed Securities - Non-Agency | — | 132,342,082 | — | — | 132,342,082 |
| Common Stocks | | | | | |
| Consumer Discretionary | 183,252 | — | 59,865 | — | 243,117 |
| Financials | — | 108,279 | — | — | 108,279 |
| Materials | 344,786 | 109,769 | — | — | 454,555 |
| Telecommunication Services | 14,541 | — | — | — | 14,541 |
| Utilities | 388,073 | 628,134 | — | — | 1,016,207 |
| Total Common Stocks | 930,652 | 846,182 | 59,865 | — | 1,836,699 |
| Corporate Bonds & Notes | — | 1,471,201,598 | 617,688 | — | 1,471,819,286 |
| Foreign Government Obligations | — | 412,960,458 | — | — | 412,960,458 |
| Inflation-Indexed Bonds | — | 115,164,727 | — | — | 115,164,727 |
| Residential Mortgage-Backed Securities - Agency | — | 172,626,953 | — | — | 172,626,953 |
| Residential Mortgage-Backed Securities - Non-Agency | — | 397,431,558 | 191,455,658 | — | 588,887,216 |
| Senior Loans | — | 258,630,671 | 12,758,563 | — | 271,389,234 |
| Options Purchased Calls | — | 4,639,072 | — | — | 4,639,072 |
| Options Purchased Puts | — | 2,090,819 | — | — | 2,090,819 |
| Money Market Funds | — | — | — | 237,155,963 | 237,155,963 |
| Total Investments | 930,652 | 3,191,706,483 | 278,679,449 | 237,155,963 | 3,708,472,547 |
| Derivatives | | | | | |
| Asset | | | | | |
| Forward Foreign Currency Exchange Contracts | — | 816,380 | — | — | 816,380 |
| Futures Contracts | 1,360,150 | — | — | — | 1,360,150 |
| Swap Contracts | — | 6,708,022 | — | — | 6,708,022 |
| Liability | | | | | |
| Forward Foreign Currency Exchange Contracts | — | (929,045) | — | — | (929,045) |
| Futures Contracts | (4,962,781) | — | — | — | (4,962,781) |
| Swap Contracts | — | (14,924,562) | — | — | (14,924,562) |
| Total | (2,671,979) | 3,183,377,278 | 278,679,449 | 237,155,963 | 3,696,540,711 |
See the Portfolio of Investments for all investment classifications not indicated in the table.
The Fund’s assets assigned to the Level 2 input category are generally valued using the market approach, in which a security’s value is determined through reference to prices and information from market transactions for similar or identical assets.
Forward foreign currency exchange contracts, futures contracts and swap contracts are valued at unrealized appreciation (depreciation).
There were no transfers of financial assets between Levels 1 and 2 during the period.
Financial assets were transferred from Level 2 to Level 3 due to utilizing a single market quotation from a broker dealer. As a result, as of period end, management determined to value the security(s) under consistently applied procedures established by and under the general supervision of the Board of Trustees.
Financial assets were transferred from Level 3 to Level 2 as observable market inputs were utilized and management determined that there was sufficient, reliable and observable market data to value these assets as of period end.
Transfers between Levels are determined based on the fair value at the beginning of the period for security positions held throughout the period.
The following table is a reconciliation of Level 3 assets for which significant observable and unobservable inputs were used to determine fair value:
The accompanying Notes to Financial Statements are an integral part of this statement.
Columbia Strategic Income Fund | Annual Report 2017
| 45 |
Portfolio of Investments (continued)
August 31, 2017
Fair value measurements (continued)
| Investments in securities | Balance
as of
10/31/2016
($) | Increase
(decrease)
in accrued
discounts/
premiums
($) | Realized
gain (loss)
($) | Change
in unrealized
appreciation
(depreciation)(a)
($) | Purchases
($) | Sales
($) | Transfers
into
Level 3
($) | Transfers
out of
Level 3
($) | Balance
as of
08/31/2017
($) |
| Asset-Backed Securities — Non-Agency | 38,542,897 | — | 59 | (4,572,691) | 51,054,307 | (1,391,043) | — | (9,845,854) | 73,787,675 |
| Common Stocks | 197,643 | — | (21,314) | (106,902) | — | (52,395) | 165,626 | (122,793) | 59,865 |
| Corporate Bonds & Notes | 573,807 | 619 | — | 43,262 | — | — | — | — | 617,688 |
| Foreign Government Obligations | 4,987,010 | — | — | — | — | — | — | (4,987,010) | — |
| Residential Mortgage-Backed Securities — Non-Agency | 130,338,169 | 370,005 | 146,117 | 554,489 | 162,518,706 | (50,419,695) | — | (52,052,133) | 191,455,658 |
| Senior Loans | 13,263,050 | 100,397 | 87,005 | 282,773 | 4,836,857 | (8,365,138) | 5,695,277 | (3,141,658) | 12,758,563 |
| Total | 187,902,576 | 471,021 | 211,867 | (3,799,069) | 218,409,870 | (60,228,271) | 5,860,903 | (70,149,448) | 278,679,449 |
(a) Change in unrealized appreciation (depreciation) relating to securities held at August 31, 2017 was $(3,816,967), which is comprised of Asset-Backed Securities — Non-Agency of $(4,572,691), Common Stocks of $(105,762), Corporate Bonds & Notes of $43,262, Residential Mortgage-Backed Securities — Non-Agency of $554,489 and Senior Loans of $263,735.
The Fund’s assets assigned to the Level 3 category are valued utilizing the valuation technique deemed the most appropriate in the circumstances. Certain corporate bonds, mortgage backed securities and senior loans classified as Level 3 securities are valued using the market approach and utilize single market quotations from broker dealers which may have included, but were not limited to, observable transactions for identical or similar assets in the market and the distressed nature of the security. The appropriateness of fair values for these securities is monitored on an ongoing basis which may include results of back testing, manual price reviews and other control procedures. Significant increases (decreases) to any of these inputs would result in a significantly lower (higher) fair value measurement.
Certain common stock classified as Level 3 securities are valued using the market approach. To determine fair value for the securities, management considered various factors which may have included, but were not limited to, the closing prices of similar securities from the issuer and quoted bids from market participants.
The accompanying Notes to Financial Statements are an integral part of this statement.
| 46 | Columbia Strategic Income Fund | Annual Report 2017 |
Statement of Assets and Liabilities
August 31, 2017
| Assets | |
| Investments in unaffiliated issuers, at cost | $3,389,869,638 |
| Investments in affiliated issuers, at cost | 237,157,524 |
| Investments in options purchased, at cost | 7,581,900 |
| Investments in unaffiliated issuers, at value | 3,464,586,693 |
| Investments in affiliated issuers, at value | 237,155,963 |
| Investments in options purchased, at value | 6,729,891 |
| Cash | 144,310 |
| Foreign currency (identified cost $27,950) | 28,175 |
| Cash collateral held at broker for: | |
| Swap contracts | 4,242,000 |
| Margin deposits on: | |
| Futures contracts | 18,673,753 |
| Swap contracts | 11,311,421 |
| Unrealized appreciation on forward foreign currency exchange contracts | 816,380 |
| Unrealized appreciation on swap contracts | 701,768 |
| Receivable for: | |
| Investments sold | 17,993,738 |
| Investments sold on a delayed delivery basis | 725,906 |
| Capital shares sold | 9,813,604 |
| Dividends | 234,651 |
| Interest | 28,994,284 |
| Foreign tax reclaims | 87,097 |
| Variation margin for futures contracts | 626,119 |
| Variation margin for swap contracts | 278,166 |
| Prepaid expenses | 23,597 |
| Trustees’ deferred compensation plan | 229,138 |
| Total assets | 3,803,396,654 |
| Liabilities | |
| Unrealized depreciation on forward foreign currency exchange contracts | 929,045 |
| Unrealized depreciation on swap contracts | 1,626,281 |
| Upfront receipts on swap contracts | 9,442,396 |
| Payable for: | |
| Investments purchased | 4,878,791 |
| Investments purchased on a delayed delivery basis | 101,078,857 |
| Capital shares purchased | 3,143,444 |
| Variation margin for futures contracts | 1,600,422 |
| Variation margin for swap contracts | 1,102,667 |
| Management services fees | 56,920 |
| Distribution and/or service fees | 16,771 |
| Transfer agent fees | 338,886 |
| Plan administration fees | 20 |
| Compensation of board members | 60,178 |
| Compensation of chief compliance officer | 236 |
| Other expenses | 278,942 |
| Trustees’ deferred compensation plan | 229,138 |
| Total liabilities | 124,782,994 |
| Net assets applicable to outstanding capital stock | $3,678,613,660 |
The accompanying Notes to Financial Statements are an integral part of this statement.
Columbia Strategic Income Fund | Annual Report 2017
| 47 |
Statement of Assets and Liabilities (continued)
August 31, 2017
| Represented by | |
| Paid in capital | $3,582,992,795 |
| Undistributed net investment income | 13,434,696 |
| Accumulated net realized gain | 19,903,626 |
| Unrealized appreciation (depreciation) on: | |
| Investments - unaffiliated issuers | 74,717,055 |
| Investments - affiliated issuers | (1,561) |
| Foreign currency translations | 350,894 |
| Forward foreign currency exchange contracts | (112,665) |
| Futures contracts | (3,602,631) |
| Options purchased | (852,009) |
| Swap contracts | (8,216,540) |
| Total - representing net assets applicable to outstanding capital stock | $3,678,613,660 |
| Class A | |
| Net assets | $1,100,584,962 |
| Shares outstanding | 180,766,737 |
| Net asset value per share | $6.09 |
| Maximum offering price per share(a) | $6.39 |
| Class C | |
| Net assets | $334,829,183 |
| Shares outstanding | 54,986,142 |
| Net asset value per share | $6.09 |
| Class K | |
| Net assets | $85,935 |
| Shares outstanding | 14,352 |
| Net asset value per share | $5.99 |
| Class R | |
| Net assets | $6,442,646 |
| Shares outstanding | 1,051,401 |
| Net asset value per share | $6.13 |
| Class R4 | |
| Net assets | $99,896,107 |
| Shares outstanding | 16,686,534 |
| Net asset value per share | $5.99 |
| Class R5 | |
| Net assets | $155,371,587 |
| Shares outstanding | 25,913,172 |
| Net asset value per share | $6.00 |
| Class T(b) | |
| Net assets | $10,038 |
| Shares outstanding | 1,650 |
| Net asset value per share | $6.08 |
| Maximum offering price per share(c) | $6.24 |
| Class Y | |
| Net assets | $100,172,570 |
| Shares outstanding | 16,759,136 |
| Net asset value per share | $5.98 |
| Class Z | |
| Net assets | $1,881,220,632 |
| Shares outstanding | 313,928,646 |
| Net asset value per share | $5.99 |
| (a) | The maximum offering price per share is calculated by dividing the net asset value per share by 1.0 minus the maximum sales charge of 4.75% for Class A. |
| (b) | Prior to March 27, 2017, Class T shares were known as Class W shares. |
| (c) | The maximum offering price per share is calculated by dividing the net asset value per share by 1.0 minus the maximum sales charge of 2.50% for Class T. |
The accompanying Notes to Financial Statements are an integral part of this statement.
| 48 | Columbia Strategic Income Fund | Annual Report 2017 |
| | Year Ended
August 31, 2017(a) | Year Ended
October 31, 2016 |
| Net investment income | | |
| Income: | | |
| Dividends — unaffiliated issuers | $8,287,696 | $38,758 |
| Dividends — affiliated issuers | 1,340,693 | 665,933 |
| Interest | 129,393,373 | 127,978,020 |
| Foreign taxes withheld | (48,588) | (135,224) |
| Total income | 138,973,174 | 128,547,487 |
| Expenses: | | |
| Management services fees | 15,719,912 | 15,389,393 |
| Distribution and/or service fees | | |
| Class A | 2,848,122 | 3,993,115 |
| Class B(b) | 20,959 | 68,094 |
| Class C | 2,719,573 | 2,636,196 |
| Class R | 24,995 | 19,497 |
| Class T(c) | 21 | 24 |
| Transfer agent fees | | |
| Class A | 1,316,629 | 2,590,489 |
| Class B(b) | 2,508 | 11,225 |
| Class C | 308,775 | 425,817 |
| Class K | 41 | 43 |
| Class R | 5,667 | 6,243 |
| Class R4 | 65,154 | 50,086 |
| Class R5 | 63,102 | 29,369 |
| Class T(c) | 8 | 17 |
| Class Y | 1,807 | — |
| Class Z | 1,286,373 | 1,114,480 |
| Plan administration fees | | |
| Class K | 174 | 214 |
| Compensation of board members | 69,138 | 67,946 |
| Custodian fees | 127,481 | 131,573 |
| Printing and postage fees | 314,278 | 307,421 |
| Registration fees | 283,506 | 263,566 |
| Audit fees | 53,787 | 51,965 |
| Legal fees | 76,801 | 71,696 |
| Compensation of chief compliance officer | 1,217 | 1,251 |
| Other | (175,142) | 94,193 |
| Total expenses | 25,134,886 | 27,323,913 |
| Fees waived or expenses reimbursed by Investment Manager and its affiliates | — | (97,786) |
| Fees waived by transfer agent | | |
| Class K | (4) | — |
| Class R5 | (7,394) | — |
| Class Y | (1,554) | — |
| Expense reduction | (3,838) | (3,649) |
| Total net expenses | 25,122,096 | 27,222,478 |
| Net investment income | 113,851,078 | 101,325,009 |
The accompanying Notes to Financial Statements are an integral part of this statement.
Columbia Strategic Income Fund | Annual Report 2017
| 49 |
Statement of Operations (continued)
| | Year Ended
August 31, 2017(a) | Year Ended
October 31, 2016 |
| Realized and unrealized gain (loss) — net | | |
| Net realized gain (loss) on: | | |
| Investments — unaffiliated issuers | $20,274,955 | $1,101,236 |
| Investments — affiliated issuers | 11,756 | — |
| Foreign currency translations | 1,498,519 | (99,471) |
| Forward foreign currency exchange contracts | (6,962,792) | (8,384,460) |
| Futures contracts | (2,966,768) | 3,583,757 |
| Options purchased | 3,201,750 | (2,280,000) |
| Options contracts written | 2,752,975 | — |
| Swap contracts | (5,768,972) | (23,069,633) |
| Net realized gain (loss) | 12,041,423 | (29,148,571) |
| Net change in unrealized appreciation (depreciation) on: | | |
| Investments — unaffiliated issuers | 24,144,481 | 101,751,281 |
| Investments — affiliated issuers | (1,455) | (106) |
| Foreign currency translations | 283,946 | 129,491 |
| Forward foreign currency exchange contracts | (269,525) | 617,635 |
| Futures contracts | (2,460,937) | (4,303,360) |
| Options purchased | (1,142,859) | 1,141,250 |
| Swap contracts | (3,038,557) | 5,846,123 |
| Foreign capital gains tax | 36,960 | (36,960) |
| Net change in unrealized appreciation (depreciation) | 17,552,054 | 105,145,354 |
| Net realized and unrealized gain | 29,593,477 | 75,996,783 |
| Net increase in net assets resulting from operations | $143,444,555 | $177,321,792 |
| (a) | For the period from November 1, 2016 to August 31, 2017. During the period, the Fund’s fiscal year end was changed from October 31 to August 31. |
| (b) | Effective July 17, 2017, Class B shares were automatically converted to Class A shares. |
| (c) | Prior to March 27, 2017, Class T shares were known as Class W shares. |
The accompanying Notes to Financial Statements are an integral part of this statement.
| 50 | Columbia Strategic Income Fund | Annual Report 2017 |
Statement of Changes in Net Assets
| | Year Ended
August 31, 2017 (a) | Year Ended
October 31, 2016 | Year Ended
October 31, 2015 |
| Operations | | | |
| Net investment income | $113,851,078 | $101,325,009 | $81,817,548 |
| Net realized gain (loss) | 12,041,423 | (29,148,571) | 4,039,766 |
| Net change in unrealized appreciation (depreciation) | 17,552,054 | 105,145,354 | (84,511,507) |
| Net increase in net assets resulting from operations | 143,444,555 | 177,321,792 | 1,345,807 |
| Distributions to shareholders | | | |
| Net investment income | | | |
| Class A | (32,253,534) | (52,011,573) | (56,328,880) |
| Class B(b) | (44,993) | (176,258) | (426,942) |
| Class C | (5,585,037) | (6,559,934) | (6,660,428) |
| Class K | (2,031) | (3,006) | (6,768) |
| Class R | (125,666) | (113,353) | (76,719) |
| Class R4 | (1,784,601) | (1,079,659) | (488,718) |
| Class R5 | (3,380,935) | (2,035,362) | (351,761) |
| Class T(c) | (231) | (314) | (415) |
| Class Y | (568,568) | (429,162) | (178,689) |
| Class Z | (35,240,382) | (24,493,759) | (24,659,843) |
| Net realized gains | | | |
| Class A | — | — | (20,888,229) |
| Class B(b) | — | — | (244,113) |
| Class C | — | — | (3,011,720) |
| Class K | — | — | (2,576) |
| Class R | — | — | (23,273) |
| Class R4 | — | — | (107,555) |
| Class R5 | — | — | (89,286) |
| Class T(c) | — | — | (164) |
| Class Y | — | — | (27,589) |
| Class Z | — | — | (10,389,836) |
| Total distributions to shareholders | (78,985,978) | (86,902,380) | (123,963,504) |
| Increase in net assets from capital stock activity | 439,268,981 | 775,776,495 | 237,775,190 |
| Total increase in net assets | 503,727,558 | 866,195,907 | 115,157,493 |
| Net assets at beginning of year | 3,174,886,102 | 2,308,690,195 | 2,193,532,702 |
| Net assets at end of year | $3,678,613,660 | $3,174,886,102 | $2,308,690,195 |
| Undistributed net investment income | $13,434,696 | $1,044,653 | $5,999,749 |
| (a) | For the period from November 1, 2016 to August 31, 2017. During the period, the Fund’s fiscal year end was changed from October 31 to August 31. |
| (b) | Effective July 17, 2017, Class B shares were automatically converted to Class A shares. |
| (c) | Prior to March 27, 2017, Class T shares were known as Class W shares. |
The accompanying Notes to Financial Statements are an integral part of this statement.
Columbia Strategic Income Fund | Annual Report 2017
| 51 |
Statement of Changes in Net Assets (continued)
| | Year Ended | Year Ended | Year Ended |
| | August 31, 2017 (a) | October 31, 2016 | October 31, 2015 |
| | Shares | Dollars ($) | Shares | Dollars ($) | Shares | Dollars ($) |
| Capital stock activity |
| Class A(b) | | | | | | |
| Subscriptions (c) | 65,505,955 | 391,489,911 | 116,785,483 | 675,723,346 | 84,974,597 | 502,761,926 |
| Distributions reinvested | 5,073,556 | 30,238,572 | 8,440,437 | 48,688,323 | 12,102,913 | 70,936,223 |
| Redemptions | (186,149,836) | (1,106,962,799) | (81,299,032) | (469,359,257) | (59,103,690) | (350,817,597) |
| Net increase (decrease) | (115,570,325) | (685,234,316) | 43,926,888 | 255,052,412 | 37,973,820 | 222,880,552 |
| Class B(b) | | | | | | |
| Subscriptions | 14,935 | 89,225 | 70,969 | 409,109 | 119,968 | 710,706 |
| Distributions reinvested | 6,156 | 36,484 | 23,834 | 136,589 | 91,682 | 536,107 |
| Redemptions (c) | (847,190) | (5,076,450) | (826,574) | (4,769,547) | (1,296,696) | (7,694,888) |
| Net decrease | (826,099) | (4,950,741) | (731,771) | (4,223,849) | (1,085,046) | (6,448,075) |
| Class C | | | | | | |
| Subscriptions | 14,114,450 | 84,502,366 | 22,508,267 | 130,730,626 | 13,475,323 | 79,522,045 |
| Distributions reinvested | 838,077 | 5,007,074 | 958,696 | 5,531,198 | 1,321,429 | 7,737,129 |
| Redemptions | (12,920,506) | (77,450,379) | (8,471,609) | (49,119,840) | (7,313,925) | (43,349,157) |
| Net increase | 2,032,021 | 12,059,061 | 14,995,354 | 87,141,984 | 7,482,827 | 43,910,017 |
| Class K | | | | | | |
| Distributions reinvested | 304 | 1,789 | 471 | 2,673 | 1,513 | 8,740 |
| Redemptions | — | — | (12,999) | (73,447) | (750) | (4,411) |
| Net increase (decrease) | 304 | 1,789 | (12,528) | (70,774) | 763 | 4,329 |
| Class R | | | | | | |
| Subscriptions | 679,723 | 4,098,076 | 657,958 | 3,849,456 | 261,629 | 1,565,927 |
| Distributions reinvested | 15,120 | 90,990 | 13,642 | 79,332 | 15,478 | 91,228 |
| Redemptions | (589,584) | (3,553,720) | (144,203) | (847,267) | (122,818) | (731,144) |
| Net increase | 105,259 | 635,346 | 527,397 | 3,081,521 | 154,289 | 926,011 |
| Class R4 | | | | | | |
| Subscriptions | 10,344,320 | 61,170,118 | 8,100,635 | 46,580,937 | 3,255,604 | 18,930,651 |
| Distributions reinvested | 302,635 | 1,783,215 | 188,910 | 1,079,316 | 91,959 | 530,126 |
| Redemptions | (3,057,053) | (17,968,120) | (2,462,481) | (14,059,309) | (1,019,615) | (5,889,927) |
| Net increase | 7,589,902 | 44,985,213 | 5,827,064 | 33,600,944 | 2,327,948 | 13,570,850 |
| Class R5 | | | | | | |
| Subscriptions | 14,271,742 | 84,108,174 | 17,074,109 | 97,770,835 | 1,926,247 | 11,280,662 |
| Distributions reinvested | 573,232 | 3,378,777 | 352,567 | 2,029,968 | 75,700 | 437,568 |
| Redemptions | (6,471,882) | (38,071,185) | (2,029,791) | (11,675,518) | (552,583) | (3,233,750) |
| Net increase | 8,373,092 | 49,415,766 | 15,396,885 | 88,125,285 | 1,449,364 | 8,484,480 |
| Class Y | | | | | | |
| Subscriptions | 15,316,189 | 91,323,531 | 1,311,521 | 7,448,398 | 1,657,870 | 9,520,309 |
| Distributions reinvested | 64,287 | 377,991 | 75,667 | 428,016 | 35,820 | 205,182 |
| Redemptions | (434,951) | (2,565,657) | (1,454,095) | (8,338,628) | (75,475) | (429,032) |
| Net increase (decrease) | 14,945,525 | 89,135,865 | (66,907) | (462,214) | 1,618,215 | 9,296,459 |
| Class Z | | | | | | |
| Subscriptions | 253,036,382 | 1,487,603,132 | 118,272,882 | 675,059,092 | 50,637,205 | 294,144,453 |
| Distributions reinvested | 4,957,658 | 29,267,700 | 2,860,008 | 16,316,983 | 1,966,899 | 11,347,117 |
| Redemptions | (98,930,646) | (583,649,834) | (67,032,087) | (377,844,889) | (61,741,742) | (360,341,003) |
| Net increase (decrease) | 159,063,394 | 933,220,998 | 54,100,803 | 313,531,186 | (9,137,638) | (54,849,433) |
| Total net increase | 75,713,073 | 439,268,981 | 133,963,185 | 775,776,495 | 40,784,542 | 237,775,190 |
| (a) | For the period from November 1, 2016 to August 31, 2017. During the period, the Fund’s fiscal year end was changed from October 31 to August 31. |
| (b) | Effective July 17, 2017, Class B shares were automatically converted to Class A shares. |
| (c) | Includes conversions of Class B shares to Class A shares, if any. |
The accompanying Notes to Financial Statements are an integral part of this statement.
| 52 | Columbia Strategic Income Fund | Annual Report 2017 |
[THIS PAGE INTENTIONALLY LEFT BLANK]
Columbia Strategic Income Fund | Annual Report 2017
| 53 |
The following table is intended to help you understand the Fund’s financial performance. Certain information reflects financial results for a single share of a class held for the periods shown. Per share net investment income (loss) amounts are calculated based on average shares outstanding during the period. Total return assumes reinvestment of all dividends and distributions, if any. Total return does not reflect payment of sales charges, if any. Total return and portfolio turnover are not annualized for periods of less than one year. The portfolio turnover rate is calculated without regard to purchase and sales transactions of short-term instruments and certain derivatives, if any. If such transactions were included, the Fund’s portfolio turnover rate may be higher.
| Year ended | Net asset value,
beginning of
period | Net
investment
income | Net
realized
and
unrealized
gain (loss) | Total from
investment
operations | Distributions
from net
investment
income | Distributions
from net
realized
gains |
| Class A |
| 08/31/2017 (c) | $5.97 | 0.20 | 0.06 | 0.26 | (0.14) | — |
| 10/31/2016 | $5.79 | 0.22 | 0.15 | 0.37 | (0.19) | — |
| 10/31/2015 | $6.13 | 0.23 | (0.22) | 0.01 | (0.25) | (0.10) |
| 10/31/2014 | $6.27 | 0.25 | 0.03 | 0.28 | (0.25) | (0.17) |
| 10/31/2013 | $6.41 | 0.26 | (0.13) | 0.13 | (0.25) | (0.02) |
| 10/31/2012 (g) | $6.11 | 0.11 | 0.30 | 0.41 | (0.11) | — |
| 05/31/2012 | $6.16 | 0.30 | (0.04) | 0.26 | (0.31) | — |
| Class C |
| 08/31/2017 (c) | $5.97 | 0.17 | 0.05 | 0.22 | (0.10) | — |
| 10/31/2016 | $5.79 | 0.18 | 0.15 | 0.33 | (0.15) | — |
| 10/31/2015 | $6.13 | 0.19 | (0.22) | (0.03) | (0.21) | (0.10) |
| 10/31/2014 | $6.27 | 0.22 | 0.02 | 0.24 | (0.21) | (0.17) |
| 10/31/2013 | $6.41 | 0.22 | (0.13) | 0.09 | (0.21) | (0.02) |
| 10/31/2012 (g) | $6.11 | 0.09 | 0.30 | 0.39 | (0.09) | — |
| 05/31/2012 | $6.17 | 0.26 | (0.04) | 0.22 | (0.28) | — |
| Class K |
| 08/31/2017 (c) | $5.88 | 0.20 | 0.05 | 0.25 | (0.14) | — |
| 10/31/2016 | $5.70 | 0.22 | 0.16 | 0.38 | (0.20) | — |
| 10/31/2015 | $6.04 | 0.24 | (0.22) | 0.02 | (0.26) | (0.10) |
| 10/31/2014 | $6.18 | 0.26 | 0.02 | 0.28 | (0.25) | (0.17) |
| 10/31/2013 | $6.33 | 0.26 | (0.14) | 0.12 | (0.25) | (0.02) |
| 10/31/2012 (g) | $6.04 | 0.11 | 0.29 | 0.40 | (0.11) | — |
| 05/31/2012 | $6.09 | 0.30 | (0.03) | 0.27 | (0.32) | — |
| Class R |
| 08/31/2017 (c) | $6.01 | 0.19 | 0.06 | 0.25 | (0.13) | — |
| 10/31/2016 | $5.82 | 0.21 | 0.16 | 0.37 | (0.18) | — |
| 10/31/2015 | $6.16 | 0.22 | (0.22) | 0.00 (h) | (0.24) | (0.10) |
| 10/31/2014 | $6.30 | 0.24 | 0.02 | 0.26 | (0.23) | (0.17) |
| 10/31/2013 | $6.44 | 0.25 | (0.14) | 0.11 | (0.23) | (0.02) |
| 10/31/2012 (g) | $6.14 | 0.10 | 0.30 | 0.40 | (0.10) | — |
| 05/31/2012 | $6.19 | 0.27 | (0.02) | 0.25 | (0.30) | — |
The accompanying Notes to Financial Statements are an integral part of this statement.
| 54 | Columbia Strategic Income Fund | Annual Report 2017 |
Total
distributions to
shareholders | Net
asset
value,
end of
period | Total
Return | Total gross
expense
ratio to
average
net assets(a) | Total net
expense
ratio to
average
net assets(a),(b) | Net investment
income
ratio to
average
net assets | Portfolio
turnover | Net
assets,
end of
period
(000’s) |
| |
| (0.14) | $6.09 | 4.42% | 0.95% (d),(e) | 0.95% (d),(e),(f) | 4.00% (d) | 110% | $1,100,585 |
| (0.19) | $5.97 | 6.57% | 1.03% | 1.02% (f) | 3.81% | 168% | $1,770,085 |
| (0.35) | $5.79 | 0.25% | 1.06% | 1.03% (f) | 3.94% | 169% | $1,461,248 |
| (0.42) | $6.13 | 4.64% | 1.04% | 1.04% (f) | 4.14% | 124% | $1,313,683 |
| (0.27) | $6.27 | 2.01% | 1.03% | 1.03% (f) | 4.10% | 113% | $1,303,812 |
| (0.11) | $6.41 | 6.72% | 1.02% (d) | 1.02% (d),(f) | 4.11% (d) | 48% | $1,492,620 |
| (0.31) | $6.11 | 4.44% | 1.03% | 1.02% (f) | 4.89% | 83% | $1,365,605 |
| |
| (0.10) | $6.09 | 3.78% | 1.71% (d),(e) | 1.71% (d),(e),(f) | 3.33% (d) | 110% | $334,829 |
| (0.15) | $5.97 | 5.78% | 1.78% | 1.77% (f) | 3.05% | 168% | $316,346 |
| (0.31) | $5.79 | (0.49%) | 1.81% | 1.78% (f) | 3.19% | 169% | $219,782 |
| (0.38) | $6.13 | 4.00% | 1.79% | 1.66% (f) | 3.52% | 124% | $186,746 |
| (0.23) | $6.27 | 1.40% | 1.78% | 1.63% (f) | 3.50% | 113% | $221,063 |
| (0.09) | $6.41 | 6.45% | 1.77% (d) | 1.62% (d),(f) | 3.51% (d) | 48% | $263,736 |
| (0.28) | $6.11 | 3.64% | 1.78% | 1.62% (f) | 4.28% | 83% | $234,351 |
| |
| (0.14) | $5.99 | 4.38% | 0.90% (d),(e) | 0.90% (d),(e) | 4.14% (d) | 110% | $86 |
| (0.20) | $5.88 | 6.81% | 0.91% | 0.91% | 3.90% | 168% | $83 |
| (0.36) | $5.70 | 0.37% | 0.92% | 0.92% | 4.05% | 169% | $152 |
| (0.42) | $6.04 | 4.83% | 0.92% | 0.92% | 4.27% | 124% | $156 |
| (0.27) | $6.18 | 1.99% | 0.91% | 0.91% | 4.22% | 113% | $172 |
| (0.11) | $6.33 | 6.68% | 0.91% (d) | 0.91% (d),(f) | 4.22% (d) | 48% | $182 |
| (0.32) | $6.04 | 4.59% | 0.90% | 0.90% (f) | 5.00% | 83% | $219 |
| |
| (0.13) | $6.13 | 4.18% | 1.21% (d),(e) | 1.21% (d),(e),(f) | 3.83% (d) | 110% | $6,443 |
| (0.18) | $6.01 | 6.45% | 1.28% | 1.27% (f) | 3.54% | 168% | $5,687 |
| (0.34) | $5.82 | 0.00% (h) | 1.31% | 1.28% (f) | 3.69% | 169% | $2,439 |
| (0.40) | $6.16 | 4.35% | 1.29% | 1.29% (f) | 3.88% | 124% | $1,629 |
| (0.25) | $6.30 | 1.74% | 1.29% | 1.29% (f) | 3.92% | 113% | $1,220 |
| (0.10) | $6.44 | 6.58% | 1.27% (d) | 1.27% (d),(f) | 3.82% (d) | 48% | $218 |
| (0.30) | $6.14 | 4.20% | 1.29% | 1.27% (f) | 4.44% | 83% | $71 |
Columbia Strategic Income Fund | Annual Report 2017
| 55 |
Financial Highlights (continued)
| Year ended | Net asset value,
beginning of
period | Net
investment
income | Net
realized
and
unrealized
gain (loss) | Total from
investment
operations | Distributions
from net
investment
income | Distributions
from net
realized
gains |
| Class R4 |
| 08/31/2017 (c) | $5.88 | 0.21 | 0.05 | 0.26 | (0.15) | — |
| 10/31/2016 | $5.70 | 0.23 | 0.16 | 0.39 | (0.21) | — |
| 10/31/2015 | $6.04 | 0.24 | (0.21) | 0.03 | (0.27) | (0.10) |
| 10/31/2014 | $6.18 | 0.26 | 0.03 | 0.29 | (0.26) | (0.17) |
| 10/31/2013 (i) | $6.34 | 0.27 | (0.15) | 0.12 | (0.26) | (0.02) |
| Class R5 |
| 08/31/2017 (c) | $5.88 | 0.22 | 0.06 | 0.28 | (0.16) | — |
| 10/31/2016 | $5.71 | 0.24 | 0.14 | 0.38 | (0.21) | — |
| 10/31/2015 | $6.04 | 0.25 | (0.21) | 0.04 | (0.27) | (0.10) |
| 10/31/2014 | $6.19 | 0.27 | 0.02 | 0.29 | (0.27) | (0.17) |
| 10/31/2013 | $6.33 | 0.29 | (0.14) | 0.15 | (0.27) | (0.02) |
| 10/31/2012 (g) | $6.04 | 0.12 | 0.29 | 0.41 | (0.12) | — |
| 05/31/2012 | $6.09 | 0.32 | (0.03) | 0.29 | (0.34) | — |
| Class T(j) |
| 08/31/2017 (c) | $5.97 | 0.20 | 0.05 | 0.25 | (0.14) | — |
| 10/31/2016 | $5.78 | 0.22 | 0.16 | 0.38 | (0.19) | — |
| 10/31/2015 | $6.12 | 0.23 | (0.22) | 0.01 | (0.25) | (0.10) |
| 10/31/2014 | $6.26 | 0.25 | 0.03 | 0.28 | (0.25) | (0.17) |
| 10/31/2013 | $6.41 | 0.27 | (0.15) | 0.12 | (0.25) | (0.02) |
| 10/31/2012 (g) | $6.10 | 0.11 | 0.31 | 0.42 | (0.11) | — |
| 05/31/2012 | $6.16 | 0.30 | (0.04) | 0.26 | (0.32) | — |
| Class Y |
| 08/31/2017 (c) | $5.87 | 0.22 | 0.05 | 0.27 | (0.16) | — |
| 10/31/2016 | $5.69 | 0.24 | 0.15 | 0.39 | (0.21) | — |
| 10/31/2015 | $6.03 | 0.25 | (0.21) | 0.04 | (0.28) | (0.10) |
| 10/31/2014 | $6.17 | 0.27 | 0.03 | 0.30 | (0.27) | (0.17) |
| 10/31/2013 (k) | $6.18 | 0.11 | (0.02) | 0.09 | (0.10) | — |
The accompanying Notes to Financial Statements are an integral part of this statement.
| 56 | Columbia Strategic Income Fund | Annual Report 2017 |
Total
distributions to
shareholders | Net
asset
value,
end of
period | Total
Return | Total gross
expense
ratio to
average
net assets(a) | Total net
expense
ratio to
average
net assets(a),(b) | Net investment
income
ratio to
average
net assets | Portfolio
turnover | Net
assets,
end of
period
(000’s) |
| |
| (0.15) | $5.99 | 4.53% | 0.71% (d),(e) | 0.71% (d),(e),(f) | 4.38% (d) | 110% | $99,896 |
| (0.21) | $5.88 | 6.95% | 0.77% | 0.77% (f) | 4.02% | 168% | $53,447 |
| (0.37) | $5.70 | 0.52% | 0.82% | 0.78% (f) | 4.20% | 169% | $18,630 |
| (0.43) | $6.04 | 4.98% | 0.79% | 0.79% (f) | 4.36% | 124% | $5,683 |
| (0.28) | $6.18 | 1.97% | 0.80% (d) | 0.79% (d),(f) | 4.54% (d) | 113% | $3,389 |
| |
| (0.16) | $6.00 | 4.77% | 0.66% (d),(e) | 0.65% (d),(e) | 4.41% (d) | 110% | $155,372 |
| (0.21) | $5.88 | 6.87% | 0.67% | 0.67% | 4.11% | 168% | $103,204 |
| (0.37) | $5.71 | 0.80% | 0.68% | 0.68% | 4.32% | 169% | $12,231 |
| (0.44) | $6.04 | 4.92% | 0.67% | 0.67% | 4.47% | 124% | $4,193 |
| (0.29) | $6.19 | 2.39% | 0.69% | 0.69% | 4.73% | 113% | $1,563 |
| (0.12) | $6.33 | 6.79% | 0.66% (d) | 0.66% (d),(f) | 4.50% (d) | 48% | $8 |
| (0.34) | $6.04 | 4.86% | 0.65% | 0.65% (f) | 5.26% | 83% | $277 |
| |
| (0.14) | $6.08 | 4.26% | 0.95% (d),(e) | 0.95% (d),(e),(f) | 4.09% (d) | 110% | $10 |
| (0.19) | $5.97 | 6.76% | 1.04% | 1.03% (f) | 3.81% | 168% | $10 |
| (0.35) | $5.78 | 0.25% | 1.07% | 1.03% (f) | 3.94% | 169% | $10 |
| (0.42) | $6.12 | 4.67% | 1.04% | 1.04% (f) | 4.08% | 124% | $10 |
| (0.27) | $6.26 | 1.91% | 0.97% | 0.97% (f) | 4.21% | 113% | $3 |
| (0.11) | $6.41 | 6.90% | 1.00% (d) | 1.00% (d),(f) | 4.19% (d) | 48% | $3 |
| (0.32) | $6.10 | 4.34% | 1.03% | 1.02% (f) | 4.89% | 83% | $2 |
| |
| (0.16) | $5.98 | 4.65% | 0.64% (d),(e) | 0.63% (d),(e) | 4.75% (d) | 110% | $100,173 |
| (0.21) | $5.87 | 7.13% | 0.62% | 0.62% | 4.24% | 168% | $10,642 |
| (0.38) | $5.69 | 0.68% | 0.64% | 0.64% | 4.35% | 169% | $10,704 |
| (0.44) | $6.03 | 5.15% | 0.63% | 0.63% | 4.50% | 124% | $1,582 |
| (0.10) | $6.17 | 1.57% | 0.64% (d) | 0.64% (d) | 4.94% (d) | 113% | $19 |
Columbia Strategic Income Fund | Annual Report 2017
| 57 |
Financial Highlights (continued)
| Year ended | Net asset value,
beginning of
period | Net
investment
income | Net
realized
and
unrealized
gain (loss) | Total from
investment
operations | Distributions
from net
investment
income | Distributions
from net
realized
gains |
| Class Z |
| 08/31/2017 (c) | $5.88 | 0.22 | 0.04 | 0.26 | (0.15) | — |
| 10/31/2016 | $5.70 | 0.23 | 0.16 | 0.39 | (0.21) | — |
| 10/31/2015 | $6.04 | 0.24 | (0.21) | 0.03 | (0.27) | (0.10) |
| 10/31/2014 | $6.18 | 0.27 | 0.02 | 0.29 | (0.26) | (0.17) |
| 10/31/2013 | $6.33 | 0.27 | (0.14) | 0.13 | (0.26) | (0.02) |
| 10/31/2012 (g) | $6.04 | 0.11 | 0.29 | 0.40 | (0.11) | — |
| 05/31/2012 | $6.09 | 0.31 | (0.03) | 0.28 | (0.33) | — |
| Notes to Financial Highlights |
| (a) | In addition to the fees and expenses that the Fund bears directly, the Fund indirectly bears a pro rata share of the fees and expenses of any other funds in which it invests. Such indirect expenses are not included in the Fund’s reported expense ratios. |
| (b) | Total net expenses include the impact of certain fee waivers/expense reimbursements made by the Investment Manager and certain of its affiliates, if applicable. |
| (c) | For the period from November 1, 2016 to August 31, 2017. During the period, the Fund’s fiscal year end was changed from October 31 to August 31. |
| (d) | Annualized. |
| (e) | Expenses have been reduced due to a reimbursement of expenses overbilled by a third party. If the reimbursement had been excluded, the expense ratios would have been higher by the percentages shown for each class in the table below. All fee waivers and expense reimbursements by the Investment Manager and its affiliates were applied before giving effect to this third party reimbursement. |
| | Class A | Class C | Class K | Class R | Class R4 | Class R5 | Class T | Class Y | Class Z |
| 08/31/2017 | 0.01 % | 0.01 % | 0.01 % | 0.01 % | 0.01 % | 0.01 % | 0.01 % | 0.01 % | 0.01 % |
| (f) | The benefits derived from expense reductions had an impact of less than 0.01%. |
| (g) | For the period from June 1, 2012 to October 31, 2012. During the period, the Fund’s fiscal year end was changed from May 31 to October 31. |
| (h) | Rounds to zero. |
| (i) | Class R4 shares commenced operations on November 8, 2012. Per share data and total return reflect activity from that date. |
| (j) | Prior to March 27, 2017, Class T shares were known as Class W shares. |
| (k) | Class Y shares commenced operations on June 13, 2013. Per share data and total return reflect activity from that date. |
The accompanying Notes to Financial Statements are an integral part of this statement.
| 58 | Columbia Strategic Income Fund | Annual Report 2017 |
Total
distributions to
shareholders | Net
asset
value,
end of
period | Total
Return | Total gross
expense
ratio to
average
net assets(a) | Total net
expense
ratio to
average
net assets(a),(b) | Net investment
income
ratio to
average
net assets | Portfolio
turnover | Net
assets,
end of
period
(000’s) |
| |
| (0.15) | $5.99 | 4.53% | 0.71% (d),(e) | 0.71% (d),(e),(f) | 4.42% (d) | 110% | $1,881,221 |
| (0.21) | $5.88 | 6.95% | 0.78% | 0.77% (f) | 4.05% | 168% | $910,452 |
| (0.37) | $5.70 | 0.51% | 0.81% | 0.78% (f) | 4.19% | 169% | $574,482 |
| (0.43) | $6.04 | 4.97% | 0.79% | 0.79% (f) | 4.39% | 124% | $663,669 |
| (0.28) | $6.18 | 2.13% | 0.78% | 0.78% (f) | 4.34% | 113% | $755,920 |
| (0.11) | $6.33 | 6.74% | 0.77% (d) | 0.77% (d),(f) | 4.37% (d) | 48% | $985,278 |
| (0.33) | $6.04 | 4.75% | 0.78% | 0.77% (f) | 5.13% | 83% | $812,836 |
Columbia Strategic Income Fund | Annual Report 2017
| 59 |
Notes to Financial Statements
August 31, 2017
Note 1. Organization
Columbia Strategic Income Fund (the Fund), a series of Columbia Funds Series Trust I (the Trust), is a diversified fund. The Trust is registered under the Investment Company Act of 1940, as amended (the 1940 Act), as an open-end management investment company organized as a Massachusetts business trust.
Fiscal year end change
During the period, the Fund changed its fiscal year end from October 31 to August 31. All references to the year ended August 31, 2017 in the report refer to the ten-month period from November 1, 2016 through August 31, 2017.
Fund shares
The Trust may issue an unlimited number of shares (without par value). Although all share classes generally have identical voting, dividend and liquidation rights, each share class votes separately when required by the Trust’s organizational documents or by law. Different share classes pay different distribution amounts to the extent the expenses of such share classes differ, and distributions in liquidation will be proportional to the net asset value of each share class. Each share class has its own expense and sales charge structure. The Fund offers each of the share classes identified below.
Class A shares are subject to a maximum front-end sales charge of 4.75% based on the initial investment amount. Class A shares purchased without an initial sales charge in accounts aggregating $1 million to $50 million at the time of purchase are subject to a contingent deferred sales charge (CDSC) if the shares are sold within 18 months after purchase, charged as follows: 1.00% CDSC if redeemed within 12 months after purchase, and 0.50% CDSC if redeemed more than 12, but less than 18, months after purchase.
Class B shares of the Fund are no longer offered for sale. When available, Class B shares were subject to a maximum CDSC of 5.00% based upon the holding period after purchase. Effective July 17, 2017, Class B shares were automatically converted to Class A shares without a CDSC. On August 4, 2017, the capital owned by Columbia Management Investment Advisers, LLC in Class B shares was redeemed without a CDSC.
Class C shares are subject to a 1.00% CDSC on shares redeemed within 12 months after purchase.
Class K shares are not subject to sales charges; however, this share class is closed to new investors.
Class R shares are not subject to sales charges and are generally available only to certain retirement plans and other investors as described in the Fund’s prospectus.
Class R4 shares are not subject to sales charges and are generally available only to omnibus retirement plans and certain investors as described in the Fund’s prospectus. Effective November 1, 2017, Class R4 shares will be renamed Advisor Class shares.
Class R5 shares are not subject to sales charges and are generally available only to investors purchasing through authorized investment professionals and omnibus retirement plans as described in the Fund’s prospectus. Effective November 1, 2017, Class R5 shares will be renamed Institutional 2 Class shares.
Class T shares are subject to a maximum front-end sales charge of 2.50% per transaction and must be purchased through financial intermediaries that, by written agreement with Columbia Management Investment Distributors, Inc., are specifically authorized to sell Class T shares. Prior to March 27, 2017, Class T shares were known as Class W shares, were not subject to sales charges, and were generally available only to investors purchasing through authorized investment programs managed by investment professionals, including discretionary managed accounts.
Class Y shares are not subject to sales charges and are available to institutional and certain other investors as described in the Fund’s prospectus. Effective November 1, 2017, Class Y shares will be renamed Institutional 3 Class shares.
Class Z shares are not subject to sales charges and are generally available only to eligible investors, which are subject to different investment minimums as described in the Fund’s prospectus. Effective November 1, 2017, Class Z shares will be renamed Institutional Class shares.
| 60 | Columbia Strategic Income Fund | Annual Report 2017 |
Notes to Financial Statements (continued)
August 31, 2017
Note 2. Summary of significant accounting policies
Basis of preparation
The Fund is an investment company that applies the accounting and reporting guidance in the Financial Accounting Standards Board (FASB) Accounting Standards Codification Topic 946, Financial Services - Investment Companies (ASC 946). The financial statements are prepared in accordance with U.S. generally accepted accounting principles (GAAP), which requires management to make certain estimates and assumptions that affect the reported amounts of assets and liabilities, the disclosure of contingent assets and liabilities at the date of the financial statements and the reported amounts of income and expenses during the reporting period. Actual results could differ from those estimates. The Fund received a reimbursement for expenses overbilled by a third party. Such reimbursement is included as an offset to other expenses on the Statement of Operations. All fee waivers and expense reimbursements by Columbia Management Investment Advisers, LLC and its affiliates were applied before giving effect to the third party reimbursement.
The following is a summary of significant accounting policies followed by the Fund in the preparation of its financial statements.
Security valuation
All equity securities are valued at the close of business of the New York Stock Exchange. Equity securities are valued at the last quoted sales price on the principal exchange or market on which they trade, except for securities traded on the NASDAQ Stock Market, which are valued at the NASDAQ official close price. Unlisted securities or listed securities for which there were no sales during the day are valued at the mean of the latest quoted bid and ask prices on such exchanges or markets.
Debt securities generally are valued by pricing services approved by the Board of Trustees based upon market transactions for normal, institutional-size trading units of similar securities. The services may use various pricing techniques that take into account, as applicable, factors such as yield, quality, coupon rate, maturity, type of issue, trading characteristics and other data, as well as approved independent broker-dealer quotes. Debt securities for which quotations are not readily available or not believed to be reflective of market value may also be valued based upon a bid quote from an approved independent broker-dealer. Debt securities maturing in 60 days or less are valued primarily at amortized cost value, unless this method results in a valuation that management believes does not approximate market value.
Asset- and mortgage-backed securities are generally valued by pricing services, which utilize pricing models that incorporate the securities’ cash flow and loan performance data. These models also take into account available market data, including trades, market quotations, and benchmark yield curves for identical or similar securities. Factors used to identify similar securities may include, but are not limited to, issuer, collateral type, vintage, prepayment speeds, collateral performance, credit ratings, credit enhancement and expected life. Asset-backed securities for which quotations are readily available may also be valued based upon an over-the-counter or exchange bid quote from an approved independent broker-dealer.
Senior loan securities for which reliable market quotations are readily available are generally valued by pricing services at the average of the bids received.
Foreign equity securities are valued based on the closing price on the foreign exchange in which such securities are primarily traded. If any foreign equity security closing prices are not readily available, the securities are valued at the mean of the latest quoted bid and ask prices on such exchanges or markets. Foreign currency exchange rates are generally determined at 4:00 p.m. Eastern (U.S.) time. Many securities markets and exchanges outside the U.S. close prior to the close of the New York Stock Exchange; therefore, the closing prices for securities in such markets or on such exchanges may not fully reflect events that occur after such close but before the close of the New York Stock Exchange. In those situations, foreign securities will be fair valued pursuant to a policy adopted by the Board of Trustees, including, if available, utilizing a third party pricing service to determine these fair values. The third party pricing service takes into account multiple factors, including, but not limited to, movements in the U.S. securities markets, certain depositary receipts, futures contracts and foreign exchange rates that have occurred subsequent to the close of the foreign exchange or market, to determine a good faith estimate that reasonably reflects the current market conditions as of the close of the New York Stock Exchange. The fair value of a security is likely to be different from the quoted or published price, if available.
Investments in open-end investment companies, including money market funds, are valued at their latest net asset value.
Columbia Strategic Income Fund | Annual Report 2017
| 61 |
Notes to Financial Statements (continued)
August 31, 2017
Forward foreign currency exchange contracts are marked-to-market based upon foreign currency exchange rates provided by a pricing service.
Futures and options on futures contracts are valued based upon the settlement price at the close of regular trading on their principal exchanges or, in the absence of transactions, at the mean of the latest quoted bid and ask prices.
Option contracts are valued at the mean of the latest quoted bid and ask prices on their primary exchanges. Option contracts, including over-the-counter option contracts, with no readily available market quotations are valued using quotes obtained from independent brokers as of the close of the New York Stock Exchange.
Swap transactions are valued through an independent pricing service or broker, or if neither is available, through an internal model based upon observable inputs.
Investments for which market quotations are not readily available, or that have quotations which management believes are not reflective of market value or reliable, are valued at fair value as determined in good faith under procedures approved by and under the general supervision of the Board of Trustees. If a security or class of securities (such as foreign securities) is valued at fair value, such value is likely to be different from the quoted or published price for the security.
The determination of fair value often requires significant judgment. To determine fair value, management may use assumptions including but not limited to future cash flows and estimated risk premiums. Multiple inputs from various sources may be used to determine fair value.
GAAP requires disclosure regarding the inputs and valuation techniques used to measure fair value and any changes in valuation inputs or techniques. In addition, investments shall be disclosed by major category. This information is disclosed following the Fund’s Portfolio of Investments.
Foreign currency transactions and translations
The values of all assets and liabilities denominated in foreign currencies are generally translated into U.S. dollars at exchange rates determined at the close of regular trading on the New York Stock Exchange. Net realized and unrealized gains (losses) on foreign currency transactions and translations include gains (losses) arising from the fluctuation in exchange rates between trade and settlement dates on securities transactions, gains (losses) arising from the disposition of foreign currency and currency gains (losses) between the accrual and payment dates on dividends, interest income and foreign withholding taxes.
For financial statement purposes, the Fund does not distinguish that portion of gains (losses) on investments which is due to changes in foreign exchange rates from that which is due to changes in market prices of the investments. Such fluctuations are included with the net realized and unrealized gains (losses) on investments in the Statement of Operations.
Derivative instruments
The Fund invests in certain derivative instruments, as detailed below, to meet its investment objectives. Derivatives are instruments whose values depend on, or are derived from, in whole or in part, the value of one or more securities, currencies, commodities, indices, or other assets or instruments. Derivatives may be used to increase investment flexibility (including to maintain cash reserves while maintaining desired exposure to certain assets), for risk management (hedging) purposes, to facilitate trading, to reduce transaction costs and to pursue higher investment returns. The Fund may also use derivative instruments to mitigate certain investment risks, such as foreign currency exchange rate risk, interest rate risk and credit risk. Derivatives may involve various risks, including the potential inability of the counterparty to fulfill its obligations under the terms of the contract, the potential for an illiquid secondary market (making it difficult for the Fund to sell or terminate, including at favorable prices) and the potential for market movements which may expose the Fund to gains or losses in excess of the amount shown in the Statement of Assets and Liabilities. The notional amounts of derivative instruments, if applicable, are not recorded in the financial statements.
A derivative instrument may suffer a marked-to-market loss if the value of the contract decreases due to an unfavorable change in the market rates or values of the underlying instrument. Losses can also occur if the counterparty does not perform its obligations under the contract. The Fund’s risk of loss from counterparty credit risk on over-the-counter derivatives
| 62 | Columbia Strategic Income Fund | Annual Report 2017 |
Notes to Financial Statements (continued)
August 31, 2017
is generally limited to the aggregate unrealized gain netted against any collateral held by the Fund and the amount of any variation margin held by the counterparty, plus any replacement costs or related amounts. With exchange-traded or centrally cleared derivatives, there is reduced counterparty credit risk to the Fund since the clearinghouse or central counterparty (CCP) provides some protection in the case of clearing member default. The clearinghouse or CCP stands between the buyer and the seller of the contract; therefore, additional counterparty credit risk is failure of the clearinghouse or CCP. However, credit risk still exists in exchange-traded or centrally cleared derivatives with respect to initial and variation margin that is held in a broker’s customer account. While brokers are required to segregate customer margin from their own assets, in the event that a broker becomes insolvent or goes into bankruptcy and at that time there is a shortfall in the aggregate amount of margin held by the broker for all its clients, U.S. bankruptcy laws will typically allocate that shortfall on a pro-rata basis across all the broker’s customers (including the Fund), potentially resulting in losses to the Fund.
In order to better define its contractual rights and to secure rights that will help the Fund mitigate its counterparty risk, the Fund may enter into an International Swaps and Derivatives Association, Inc. Master Agreement (ISDA Master Agreement) or similar agreement with its derivatives contract counterparties. An ISDA Master Agreement is an agreement between the Fund and a counterparty that governs over-the-counter derivatives and typically contains, among other things, collateral posting terms and netting provisions in the event of a default and/or termination event. Under an ISDA Master Agreement, the Fund may, under certain circumstances, offset with the counterparty certain derivative instrument’s payables and/or receivables with collateral held and/or posted and create one single net payment. The provisions of the ISDA Master Agreement typically permit a single net payment in the event of default (close-out netting), including the bankruptcy or insolvency of the counterparty. Note, however, that bankruptcy or insolvency laws of a particular jurisdiction may impose restrictions on or prohibitions against the right of offset or netting in bankruptcy, insolvency or other events.
Collateral (margin) requirements differ by type of derivative. Margin requirements are established by the clearinghouse or CCP for exchange-traded and centrally cleared derivatives. Brokers can ask for margin in excess of the minimum in certain circumstances. Collateral terms are contract specific for over-the-counter derivatives. For over-the-counter derivatives traded under an ISDA Master Agreement, the collateral requirements are typically calculated by netting the marked-to-market amount for each transaction under such agreement and comparing that amount to the value of any variation margin currently pledged by the Fund and/or the counterparty. Generally, the amount of collateral due from or to a party has to exceed a minimum transfer amount threshold (e.g., $250,000) before a transfer has to be made. To the extent amounts due to the Fund from its counterparties are not fully collateralized, contractually or otherwise, the Fund bears the risk of loss from counterparty nonperformance. The Fund attempts to mitigate counterparty risk by only entering into agreements with counterparties that it believes have the financial resources to honor their obligations and by monitoring the financial stability of those counterparties.
Certain ISDA Master Agreements allow counterparties of over-the-counter derivatives transactions to terminate derivatives contracts prior to maturity in the event the Fund’s net asset value declines by a stated percentage over a specified time period or if the Fund fails to meet certain terms of the ISDA Master Agreement, which would cause the Fund to accelerate payment of any net liability owed to the counterparty. The Fund also has termination rights if the counterparty fails to meet certain terms of the ISDA Master Agreement. In addition to considering counterparty credit risk, the Fund would consider terminating the derivatives contracts based on whether termination would result in a net liability owed from the counterparty.
For financial reporting purposes, the Fund does not offset derivative assets and derivative liabilities that are subject to netting arrangements in the Statement of Assets and Liabilities.
Forward foreign currency exchange contracts
Forward foreign currency exchange contracts are over-the-counter agreements between two parties to buy and sell a currency at a set price on a future date. The Fund utilized forward foreign currency exchange contracts to hedge the currency exposure associated with some or all of the Fund’s securities. These instruments may be used for other purposes in future periods.
The values of forward foreign currency exchange contracts fluctuate daily with changes in foreign currency exchange rates. Changes in the value of these contracts are recorded as unrealized appreciation or depreciation until the contract is exercised or has expired. The Fund will realize a gain or loss when the forward foreign currency exchange contract is closed or expires.
Columbia Strategic Income Fund | Annual Report 2017
| 63 |
Notes to Financial Statements (continued)
August 31, 2017
The use of forward foreign currency exchange contracts does not eliminate fluctuations in the prices of the Fund’s portfolio securities. The risks of forward foreign currency exchange contracts include movement in the values of the foreign currencies relative to the U.S. dollar (or other foreign currencies) and the possibility that counterparties will not complete their contractual obligations, which may be in excess of the amount reflected, if any, in the Statement of Assets and Liabilities.
Futures contracts
Futures contracts are exchange-traded and represent commitments for the future purchase or sale of an asset at a specified price on a specified date. The Fund bought and sold futures contracts to manage the duration and yield curve exposure of the Fund versus the benchmark. These instruments may be used for other purposes in future periods. Upon entering into futures contracts, the Fund bears risks that it may not achieve the anticipated benefits of the futures contracts and may realize a loss. Additional risks include counterparty credit risk, the possibility of an illiquid market, and that a change in the value of the contract or option may not correlate with changes in the value of the underlying asset.
Upon entering into a futures contract, the Fund deposits cash or securities with the broker, known as a futures commission merchant (FCM), in an amount sufficient to meet the initial margin requirement. The initial margin deposit must be maintained at an established level over the life of the contract. Cash deposited as initial margin is recorded in the Statement of Assets and Liabilities as margin deposits. Securities deposited as initial margin are designated in the Portfolio of Investments. Subsequent payments (variation margin) are made or received by the Fund each day. The variation margin payments are equal to the daily change in the contract value and are recorded as variation margin receivable or payable and are offset in unrealized gains or losses. The Fund recognizes a realized gain or loss when the contract is closed or expires. Futures contracts involve, to varying degrees, risk of loss in excess of the variation margin disclosed in the Statement of Assets and Liabilities.
Options contracts
Options are contracts which entitle the holder to purchase or sell securities or other identified assets at a specified price, or in the case of index option contracts, to receive or pay the difference between the index value and the strike price of the index option contract. Option contracts can be either exchange-traded or over-the-counter. The Fund purchased and wrote option contracts to manage duration and yield curve exposure. These instruments may be used for other purposes in future periods. Completion of transactions for option contracts traded in the over-the-counter market depends upon the performance of the other party. Cash collateral may be collected or posted by the Fund to secure certain over-the-counter option contract trades. Cash collateral held or posted by the Fund for such option contract trades must be returned to the broker or the Fund upon closure, exercise or expiration of the contract.
Options contracts purchased are recorded as investments. When the Fund writes an options contract, the premium received is recorded as an asset and an amount equivalent to the premium is recorded as a liability in the Statement of Assets and Liabilities and is subsequently adjusted to reflect the current fair value of the option written. Changes in the fair value of the written option are recorded as unrealized appreciation or depreciation until the contract is exercised or has expired. The Fund will realize a gain or loss when the option contract is closed or expires. When option contracts are exercised, the proceeds on sales for a written call or purchased put option contract, or the purchase cost for a written put or purchased call option contract, is adjusted by the amount of premium received or paid.
For over-the-counter options purchased, the Fund bears the risk of loss of the amount of the premiums paid plus the positive change in market values net of any collateral held by the Fund should the counterparty fail to perform under the contracts. Option contracts written by the Fund do not typically give rise to significant counterparty credit risk, as options written generally obligate the Fund and not the counterparty to perform. The risk in writing a call option contract is that the Fund gives up the opportunity for profit if the market price of the security increases above the strike price and the option contract is exercised. The risk in writing a put option contract is that the Fund may incur a loss if the market price of the security decreases below the strike price and the option contract is exercised. Exercise of a written option could result in the Fund purchasing or selling a security or foreign currency when it otherwise would not, or at a price different from the current market value. In purchasing and writing options, the Fund bears the risk of an unfavorable change in the value of the underlying instrument or the risk that the Fund may not be able to enter into a closing transaction due to an illiquid market.
| 64 | Columbia Strategic Income Fund | Annual Report 2017 |
Notes to Financial Statements (continued)
August 31, 2017
Interest rate swaption contracts
Interest rate swaption contracts entered into by the Fund typically represent an option that gives the purchaser the right, but not the obligation, to enter into an interest rate swap contract on a future date. Each interest rate swaption agreement will specify if the buyer is entitled to receive the fixed or floating rate if the interest rate is exercised. Changes in the value of a purchased interest rate swaption contracts are reported as unrealized appreciation or depreciation on options in the Statement of Assets and Liabilities. Gain or loss is recognized in the Statement of Operations when the interest rate swaption contract is closed or expires.
When the Fund writes an interest rate swaption contract, the premium received is recorded as an asset and an amount equivalent to the premium is recorded as a liability in the Statement of Assets and Liabilities and is subsequently adjusted to reflect the current fair value of the interest rate swaption contract written. Premiums received from writing interest rate swaption contracts that expire unexercised are recorded by the Fund on the expiration date as realized gains from options written in the Statement of Operations. The difference between the premium and the amount paid on effecting a closing purchase transaction, including brokerage commissions, is also recorded as realized gain, or if the premium is less than the amount paid for the closing purchase, as realized loss. These amounts are reflected as net realized gain (loss) on options written in the Statement of Operations.
Swap contracts
Swap contracts are negotiated in the over-the-counter market and may be entered into as a bilateral contract or centrally cleared (centrally cleared swap contract). In a centrally cleared swap contract, immediately following execution of the swap contract with a broker, the swap contract is novated to a central counterparty (the CCP) and the CCP becomes the Fund’s counterparty to the centrally cleared swap contract. The Fund is required to deposit initial margin with the futures commission merchant (FCM), which pledges it through to the CCP in the form of cash or securities in an amount that varies depending on the size and risk profile of the particular swap contract. Securities deposited as initial margin are designated in the Portfolio of Investments and cash deposited is recorded in the Statement of Assets and Liabilities as margin deposits. Unlike a bilateral swap contract, for centrally cleared swap contracts, the Fund has minimal credit exposure to the FCM because the CCP stands between the Fund and the relevant buyer/seller on the other side of the contract. Swap contracts are marked-to-market daily and changes in value are recorded as unrealized appreciation (depreciation). The daily change in valuation of centrally cleared swap contracts, if any, is recorded as a receivable or payable for variation margin in the Statement of Assets and Liabilities.
Entering into these contracts involves, to varying degrees, elements of interest, liquidity and counterparty credit risk in excess of the amounts recognized in the Statement of Assets and Liabilities. Such risks involve the possibility that there may be unfavorable changes in interest rates, market conditions or other conditions, it may be difficult to initiate a swap transaction or liquidate a position at an advantageous time or price which may result in significant losses, and that the FCM or CCP may not fulfill its obligation under the contract.
Credit default swap contracts
The Fund entered into credit default swap contracts to increase or decrease its credit exposure to an index and to increase or decrease its credit exposure to a single issuer of debt securities. These instruments may be used for other purposes in future periods. Credit default swap contracts are agreements in which one party pays fixed periodic payments to a counterparty in consideration for an agreement from the counterparty to make a specific payment should a specified credit event(s) take place. Although specified credit events are contract specific, credit events are generally defined as bankruptcy, failure to pay, restructuring, obligation acceleration, obligation default, or repudiation/moratorium.
As the purchaser of a credit default swap contract, the Fund purchases protection by paying a periodic interest rate on the notional amount to the counterparty. The interest amount is accrued daily as a component of unrealized appreciation (depreciation) and is recorded as a realized loss upon payment. If a credit event as specified in the contract occurs, the Fund may have the option either to deliver the reference obligation to the seller in exchange for a cash payment of its par amount, or to receive a net cash settlement equal to the par amount less an agreed-upon value of the reference obligation as of the date of the credit event. The difference between the value of the obligation or cash delivered and the notional amount received will be recorded as a realized gain (loss).
Columbia Strategic Income Fund | Annual Report 2017
| 65 |
Notes to Financial Statements (continued)
August 31, 2017
As the seller of a credit default swap contract, the Fund sells protection to a buyer and will generally receive a periodic interest rate on a notional amount. The interest amount is accrued daily as a component of unrealized appreciation (depreciation) and is recorded as a realized gain upon receipt of the payment. If a credit event as specified in the contract with the counterparty occurs, the Fund may either be required to accept the reference obligation from the buyer in exchange for a cash payment of its notional amount, or to pay the buyer a net cash settlement equal to the notional amount less an agreed-upon value of the reference obligation (recovery value) as of the date of the credit event. The difference between the value of the obligation or cash received and the notional amount paid will be recorded as a realized gain (loss). The maximum potential amount of undiscounted future payments the Fund could be required to make as the seller of protection under a credit default swap contract is equal to the notional amount of the reference obligation. These potential amounts may be partially offset by any recovery values of the respective reference obligations or upfront receipts upon entering into the agreement. The notional amounts and market values of all credit default swap contracts in which the Fund is the seller of protection, if any, are disclosed in the Credit Default Swap Contracts Outstanding schedule following the Portfolio of Investments.
As a protection seller, the Fund bears the risk of loss from the credit events specified in the contract with the counterparty. For credit default swap contracts on credit indices, quoted market prices and resulting market values serve as an indicator of the current status of the payment/performance risk. Increasing market values, in absolute terms when compared to the notional amount of the swap, represent a deterioration of the reference entity’s credit soundness and a greater likelihood or risk of default or other credit event occurring as defined under the terms of the contract.
Any upfront payments or receipts by the Fund upon entering into a credit default swap contract is recorded as an asset or liability, respectively, and amortized daily as a component of realized gain (loss) in the Statement of Operations. Credit default swap contracts are valued daily, and the change in value is recorded as unrealized appreciation (depreciation) until the termination of the swap, at which time a realized gain (loss) is recorded.
Credit default swap contracts can involve greater risks than if a fund had invested in the reference obligation directly since, in addition to general market risks, credit default swaps are subject to counterparty credit risk, leverage risk, hedging risk, correlation risk and liquidity risk.
Interest rate swap contracts
The Fund entered into interest rate swap transactions which may include inflation rate swap contracts to manage long or short exposure to an inflation index and to manage duration and yield curve exposure. These instruments may be used for other purposes in future periods. An interest rate swap is an agreement between two parties where there are two flows and payments are made between the two counterparties and the payments are dependent upon changes in an interest rate, inflation rate or inflation index calculated on a nominal amount. Interest rate swaps are agreements between two parties that involve the exchange of one type of interest rate for another type of interest rate cash flow on specified dates in the future, based on a predetermined, specified notional amount. Certain interest rate swaps are considered forward-starting, whereby the accrual for the exchange of cash flows does not begin until a specified date in the future. The net cash flow for a standard interest rate swap transaction is generally the difference between a floating market interest rate versus a fixed interest rate.
Interest rate swaps are valued daily and unrealized appreciation (depreciation) is recorded. Certain interest rate swaps may accrue periodic interest on a daily basis as a component of unrealized appreciation (depreciation); the Fund will realize a gain or loss upon the payment or receipt of accrued interest. The Fund will realize a gain or a loss when the interest rate swap is terminated.
Effects of derivative transactions in the financial statements
The following tables are intended to provide additional information about the effect of derivatives on the financial statements of the Fund, including: the fair value of derivatives by risk category and the location of those fair values in the Statement of Assets and Liabilities; and the impact of derivative transactions over the period in the Statement of Operations, including realized and unrealized gains (losses). The derivative instrument schedules following the Portfolio of Investments present additional information regarding derivative instruments outstanding at the end of the period, if any.
| 66 | Columbia Strategic Income Fund | Annual Report 2017 |
Notes to Financial Statements (continued)
August 31, 2017
The following table is a summary of the fair value of derivative instruments (not considered to be hedging instruments for accounting disclosure purposes) at August 31, 2017:
| | Asset derivatives | |
Risk exposure
category | Statement
of assets and liabilities
location | Fair value ($) |
| Credit risk | Net assets — unrealized appreciation on swap contracts | 701,768* |
| Foreign exchange risk | Unrealized appreciation on forward foreign currency exchange contracts | 816,380 |
| Interest rate risk | Net assets — unrealized appreciation on futures contracts | 1,360,150* |
| Interest rate risk | Investments, at value — Options purchased | 6,729,891 |
| Interest rate risk | Net assets — unrealized appreciation on swap contracts | 6,006,254* |
| Total | | 15,614,443 |
| | Liability derivatives | |
Risk exposure
category | Statement
of assets and liabilities
location | Fair value ($) |
| Credit risk | Net assets — unrealized depreciation on swap contracts | 6,903,702* |
| Credit risk | Upfront receipts on swap contracts | 9,442,396 |
| Foreign exchange risk | Unrealized depreciation on forward foreign currency exchange contracts | 929,045 |
| Interest rate risk | Net assets — unrealized depreciation on futures contracts | 4,962,781* |
| Interest rate risk | Net assets — unrealized depreciation on swap contracts | 8,020,860* |
| Total | | 30,258,784 |
| * | Includes cumulative appreciation (depreciation) as reported in the tables following the Portfolio of Investments. Only the current day’s variation margin is reported in receivables or payables in the Statement of Assets and Liabilities. |
The following table indicates the effect of derivative instruments (not considered to be hedging instruments for accounting disclosure purposes) in the Statement of Operations for the year ended August 31, 2017:
| Amount of realized gain (loss) on derivatives recognized in income |
| Risk exposure category | Forward
foreign
currency
exchange
contracts
($) | Futures
contracts
($) | Options
contracts
written
($) | Options
contracts
purchased
($) | Swap
contracts
($) | Total
($) |
| Credit risk | — | — | — | — | (5,091,932) | (5,091,932) |
| Foreign exchange risk | (6,962,792) | — | — | — | — | (6,962,792) |
| Interest rate risk | — | (2,966,768) | 2,752,975 | 3,201,750 | (677,040) | 2,310,917 |
| Total | (6,962,792) | (2,966,768) | 2,752,975 | 3,201,750 | (5,768,972) | (9,743,807) |
| Change in unrealized appreciation (depreciation) on derivatives recognized in income |
| Risk exposure category | Forward
foreign
currency
exchange
contracts
($) | Futures
contracts
($) | Options
contracts
purchased
($) | Swap
contracts
($) | Total
($) |
| Credit risk | — | — | — | (8,488,586) | (8,488,586) |
| Foreign exchange risk | (269,525) | — | — | — | (269,525) |
| Interest rate risk | — | (2,460,937) | (1,142,859) | 5,450,029 | 1,846,233 |
| Total | (269,525) | (2,460,937) | (1,142,859) | (3,038,557) | (6,911,878) |
Columbia Strategic Income Fund | Annual Report 2017
| 67 |
Notes to Financial Statements (continued)
August 31, 2017
The following table is a summary of the average outstanding volume by derivative instrument for the year ended August 31, 2017:
| Derivative instrument | Average notional
amounts ($)* |
| Futures contracts — long | 794,309,631 |
| Futures contracts — short | 1,061,839,821 |
| Credit default swap contracts — buy protection | 175,122,418 |
| Credit default swap contracts — sell protection | 58,762,500 |
| Derivative instrument | Average
value ($)* |
| Options contracts — purchased | 2,347,371 |
| Options contracts — written | (120,087) |
| Derivative instrument | Average unrealized
appreciation ($)* | Average unrealized
depreciation ($)* |
| Forward foreign currency exchange contracts | 1,510,446 | (2,780,792) |
| Interest rate swap contracts | 10,431,152 | (12,860,710) |
| * | Based on the ending quarterly outstanding amounts for the year ended August 31, 2017. |
The following table is a summary of the fair value of derivative instruments (not considered to be hedging instruments for accounting disclosure purposes) at October 31, 2016:
| | Asset derivatives | |
Risk exposure
category | Statement
of assets and liabilities
location | Fair value ($) |
| Credit risk | Net assets — unrealized appreciation on swap contracts | 2,609,521* |
| Credit risk | Upfront payments on swap contracts | 92,738 |
| Foreign exchange risk | Unrealized appreciation on forward foreign currency exchange contracts | 1,200,012 |
| Interest rate risk | Net assets — unrealized appreciation on futures contracts | 5,101,636* |
| Interest rate risk | Investments, at value — Options purchased | 1,847,100 |
| Interest rate risk | Net assets — unrealized appreciation on swap contracts | 2,219,778* |
| Total | | 13,070,785 |
| | Liability derivatives | |
Risk exposure
category | Statement
of assets and liabilities
location | Fair value ($) |
| Credit risk | Net assets — unrealized depreciation on swap contracts | 322,869* |
| Credit risk | Upfront receipts on swap contracts | 8,167,721 |
| Foreign exchange risk | Unrealized depreciation on forward foreign currency exchange contracts | 1,043,152 |
| Interest rate risk | Net assets — unrealized depreciation on futures contracts | 6,243,330* |
| Interest rate risk | Net assets — unrealized depreciation on swap contracts | 9,684,413* |
| Total | | 25,461,485 |
| * | Includes cumulative appreciation (depreciation) as reported in the tables following the Portfolio of Investments. Only the current day’s variation margin is reported in receivables or payables in the Statement of Assets and Liabilities. |
| 68 | Columbia Strategic Income Fund | Annual Report 2017 |
Notes to Financial Statements (continued)
August 31, 2017
The following table indicates the effect of derivative instruments (not considered to be hedging instruments for accounting disclosure purposes) in the Statement of Operations for the year ended October 31, 2016:
| Amount of realized gain (loss) on derivatives recognized in income |
| Risk exposure category | Forward
foreign
currency
exchange
contracts
($) | Futures
contracts
($) | Options
contracts
purchased
($) | Swap
contracts
($) | Total
($) |
| Credit risk | — | — | — | (1,115,524) | (1,115,524) |
| Foreign exchange risk | (8,384,460) | — | — | — | (8,384,460) |
| Interest rate risk | — | 3,583,757 | (2,280,000) | (21,954,109) | (20,650,352) |
| Total | (8,384,460) | 3,583,757 | (2,280,000) | (23,069,633) | (30,150,336) |
| |
| Change in unrealized appreciation (depreciation) on derivatives recognized in income |
| Risk exposure category | Forward
foreign
currency
exchange
contracts
($) | Futures
contracts
($) | Options
contracts
purchased
($) | Swap
contracts
($) | Total
($) |
| Credit risk | — | — | — | 1,653,031 | 1,653,031 |
| Foreign exchange risk | 617,635 | — | — | — | 617,635 |
| Interest rate risk | — | (4,303,360) | 1,141,250 | 4,193,092 | 1,030,982 |
| Total | 617,635 | (4,303,360) | 1,141,250 | 5,846,123 | 3,301,648 |
The following table is a summary of the average outstanding volume by derivative instrument for the year ended October 31, 2016:
| Derivative instrument | Average notional
amounts ($)* |
| Futures contracts — long | 382,996,717 |
| Futures contracts — short | 701,969,329 |
| Credit default swap contracts — buy protection | 172,285,000 |
| Credit default swap contracts — sell protection | 96,475,000 |
| Derivative instrument | Average
value ($)* |
| Options contracts — purchased | 586,479 |
| Derivative instrument | Average unrealized
appreciation ($)* | Average unrealized
depreciation ($)* |
| Forward foreign currency exchange contracts | 1,328,470 | (2,276,293) |
| Interest rate swap contracts | 1,027,856 | (18,512,646) |
| * | Based on the ending quarterly outstanding amounts for the year ended October 31, 2016. |
Investments in senior loans
The Fund may invest in senior loan assignments. When the Fund purchases an assignment of a senior loan, the Fund typically has direct rights against the borrower; provided, however, that the Fund’s rights may be more limited than the lender from which it acquired the assignment and the Fund may be able to enforce its rights only through an administrative agent. Although certain senior loan assignments are secured by collateral, the Fund could experience delays or limitations in realizing such collateral or have its interest subordinated to other indebtedness of the obligor. In the event that the administrator or collateral agent of a loan becomes insolvent or enters into receivership or bankruptcy, the Fund may incur costs and delays in realizing payment or may suffer a loss of principal and/or interest. The risk of loss is greater for
Columbia Strategic Income Fund | Annual Report 2017
| 69 |
Notes to Financial Statements (continued)
August 31, 2017
unsecured or subordinated loans. In addition, senior loan assignments are vulnerable to market, economic or other conditions or events that may reduce the demand for senior loan assignments and certain senior loan assignments which were liquid when purchased, may become illiquid.
The Fund may enter into senior loan assignments where all or a portion of the loan may be unfunded. The Fund is obligated to fund these commitments at the borrower’s discretion. These commitments, if any, are generally traded and priced in the same manner as other senior loan securities and are disclosed as unfunded senior loan commitments in the Fund’s Portfolio of Investments with a corresponding payable for investments purchased. The Fund designates cash or liquid securities to cover these commitments.
Asset- and mortgage-backed securities
The Fund may invest in asset-backed and mortgage-backed securities. The maturity dates shown represent the original maturity of the underlying obligation. Actual maturity may vary based upon prepayment activity on these obligations. All, or a portion, of the obligation may be prepaid at any time because the underlying asset may be prepaid. As a result, decreasing market interest rates could result in an increased level of prepayment. An increased prepayment rate will have the effect of shortening the maturity of the security. Unless otherwise noted, the coupon rates presented are fixed rates.
Delayed delivery securities
The Fund may trade securities on other than normal settlement terms, including securities purchased or sold on a “when-issued” or "forward commitment" basis. This may increase risk to the Fund since the other party to the transaction may fail to deliver, which could cause the Fund to subsequently invest at less advantageous prices. The Fund designates cash or liquid securities in an amount equal to the delayed delivery commitment.
To be announced securities
The Fund may trade securities on a To Be Announced (TBA) basis. As with other delayed-delivery transactions, a seller agrees to issue a TBA security at a future date. However, the seller does not specify the particular securities to be delivered. Instead, the Fund agrees to accept any security that meets specified terms.
In some cases, Master Securities Forward Transaction Agreements (MSFTAs) may be used to govern transactions of certain forward-settling agency mortgage-backed securities, such as delayed-delivery and TBAs, between the Fund and counterparty. The MSFTA maintains provisions for, among other things, initiation and confirmation, payment and transfer, events of default, termination, and maintenance of collateral relating to such transactions.
Mortgage dollar roll transactions
The Fund may enter into mortgage “dollar rolls” in which the Fund sells securities for delivery in the current month and simultaneously contracts with the same counterparty to repurchase similar but not identical securities (same type, coupon and maturity) on a specified future date. During the roll period, the Fund loses the right to receive principal and interest paid on the securities sold. However, the Fund will benefit because it receives negotiated amounts in the form of reductions of the purchase price for the future purchase plus the interest earned on the cash proceeds of the securities sold until the settlement date of the forward purchase. The Fund records the incremental difference between the forward purchase and sale of each forward roll as a realized gain or loss. Unless any realized gains exceed the income, capital appreciation, and gain or loss due to mortgage prepayments that would have been realized on the securities sold as part of the mortgage dollar roll, the use of this technique will diminish the investment performance of the Fund compared to what the performance would have been without the use of mortgage dollar rolls. All cash proceeds will be invested in instruments that are permissible investments for the Fund. The Fund identifies cash or liquid securities in an amount equal to the forward purchase price.
For financial reporting and tax purposes, the Fund treats “to be announced” mortgage dollar rolls as two separate transactions, one involving the purchase of a security and a separate transaction involving a sale. These transactions may increase the Fund’s portfolio turnover rate. The Fund does not currently enter into mortgage dollar rolls that are accounted for as financing transactions.
Mortgage dollar rolls involve the risk that the market value of the securities the Fund is obligated to repurchase may decline below the repurchase price, or that the counterparty may default on its obligations.
| 70 | Columbia Strategic Income Fund | Annual Report 2017 |
Notes to Financial Statements (continued)
August 31, 2017
Treasury inflation protected securities
The Fund may invest in treasury inflation protected securities (TIPS). The principal amount of TIPS is adjusted periodically and is increased for inflation or decreased for deflation based on a monthly published index. These adjustments are recorded as interest income in the Statement of Operations. Coupon payments are based on the adjusted principal at the time the interest is paid.
Interest only and principal only securities
The Fund may invest in Interest Only (IO) or Principal Only (PO) securities. IOs are stripped securities entitled to receive all of the security’s interest, but none of its principal. IOs are particularly sensitive to changes in interest rates and therefore subject to greater fluctuations in price than typical interest bearing debt securities. IOs are also subject to credit risk because the Fund may not receive all or part of the interest payments if the issuer, obligor, guarantor or counterparty defaults on its obligation. Payments received for IOs are included in interest income on the Statement of Operations. Because no principal will be received at the maturity of an IO, adjustments are made to the cost of the security on a monthly basis until maturity. These adjustments are included in interest income on the Statement of Operations. POs are stripped securities entitled to receive the principal from the underlying obligation, but not the interest. POs are particularly sensitive to changes in interest rates and therefore are subject to fluctuations in price. POs are also subject to credit risk because the Fund may not receive all or part of its principal if the issuer, obligor, guarantor or counterparty defaults on its obligation. The Fund may also invest in IO or PO stripped mortgage-backed securities. Payments received for POs are treated as reductions to the cost and par value of the securities.
Offsetting of assets and liabilities
The following table presents the Fund’s gross and net amount of assets and liabilities available for offset under netting arrangements as well as any related collateral received or pledged by the Fund as of August 31, 2017:
| | Barclays
($) | BNP
Paribas
($) | Citi
($) | Credit
Suisse
($) | Goldman
Sachs
International
($) | HSBC
($) | JPMorgan
($) | Morgan
Stanley
($)(e) | Morgan
Stanley
($)(e) | Standard
Chartered
($) | Total
($) |
| Assets | | | | | | | | | | | |
| Centrally cleared interest rate swap contracts (a) | - | - | - | - | - | - | - | - | 278,166 | - | 278,166 |
| Forward foreign currency exchange contracts | 60,813 | 201,051 | - | 554,516 | - | - | - | - | - | - | 816,380 |
| Options purchased calls | - | - | 4,639,072 | - | - | - | - | - | - | - | 4,639,072 |
| Options purchased puts | - | - | 2,090,819 | - | - | - | - | - | - | - | 2,090,819 |
| Total assets | 60,813 | 201,051 | 6,729,891 | 554,516 | - | - | - | - | 278,166 | - | 7,824,437 |
| Liabilities | | | | | | | | | | | |
| Centrally cleared credit default swap contracts (a) | - | - | - | - | - | - | - | - | 433,126 | - | 433,126 |
| Centrally cleared interest rate swap contracts (a) | - | - | - | - | - | - | - | - | 669,541 | - | 669,541 |
| Forward foreign currency exchange contracts | 277,890 | 109,480 | - | 114,027 | - | 233,977 | - | - | - | 193,671 | 929,045 |
| OTC credit default swap contracts (b) | - | - | - | 3,473,383 | 3,627,986 | - | 1,351,660 | 1,913,880 | - | - | 10,366,909 |
| Total liabilities | 277,890 | 109,480 | - | 3,587,410 | 3,627,986 | 233,977 | 1,351,660 | 1,913,880 | 1,102,667 | 193,671 | 12,398,621 |
| Total financial and derivative net assets | (217,077) | 91,571 | 6,729,891 | (3,032,894) | (3,627,986) | (233,977) | (1,351,660) | (1,913,880) | (824,501) | (193,671) | (4,574,184) |
| Total collateral received (pledged) (c) | - | - | 6,635,000 | (3,032,894) | (3,627,986) | - | - | (1,913,880) | (824,501) | - | (2,764,261) |
| Net amount (d) | (217,077) | 91,571 | 94,891 | - | - | (233,977) | (1,351,660) | - | - | (193,671) | (1,809,923) |
Columbia Strategic Income Fund | Annual Report 2017
| 71 |
Notes to Financial Statements (continued)
August 31, 2017
| (a) | Centrally cleared swaps are included within payable/receivable for variation margin on the Statement of Assets and Liabilities. |
| (b) | Over-the-Counter Swap Contracts are presented at market value plus periodic payments receivable (payable), which is comprised of unrealized appreciation, unrealized depreciation, premiums paid and premiums received. |
| (c) | In some instances, the actual collateral received and/or pledged may be more than the amount shown due to overcollateralization. |
| (d) | Represents the net amount due from/(to) counterparties in the event of default. |
| (e) | Exposure can only be netted across transactions governed under the same master agreement with the same legal entity. |
Security transactions
Security transactions are accounted for on the trade date. Cost is determined and gains (losses) are based upon the specific identification method for both financial statement and federal income tax purposes.
The trade date for senior loans purchased in the primary market is the date on which the loan is allocated. The trade date for senior loans purchased in the secondary market is the date on which the transaction is entered into.
Income recognition
Interest income is recorded on an accrual basis. Market premiums and discounts, including original issue discounts, are amortized and accreted, respectively, over the expected life of the security on all debt securities, unless otherwise noted. The Fund classifies gains and losses realized on prepayments received on mortgage-backed securities as adjustments to interest income.
The Fund may place a debt security on non-accrual status and reduce related interest income when it becomes probable that the interest will not be collected and the amount of uncollectible interest can be reasonably estimated. A defaulted debt security is removed from non-accrual status when the issuer resumes interest payments or when collectibility of interest is reasonably assured.
Corporate actions and dividend income are generally recorded net of any non-reclaimable tax withholdings, on the ex-dividend date or upon receipt of ex-dividend notification in the case of certain foreign securities.
The Fund may receive distributions from holdings in equity securities, business development companies (BDCs), exchange-traded funds (ETFs), limited partnerships (LPs), other regulated investment companies (RICs), and real estate investment trusts (REITs), which report information on the tax character of their distributions annually. These distributions are allocated to dividend income, capital gain and return of capital based on actual information reported. Return of capital is recorded as a reduction of the cost basis of securities held. If the Fund no longer owns the applicable securities, return of capital is recorded as a realized gain. With respect to REITs, to the extent actual information has not yet been reported, estimates for return of capital are made by the Fund’s management. Management’s estimates are subsequently adjusted when the actual character of the distributions is disclosed by the REITs, which could result in a proportionate change in return of capital to shareholders.
Awards from class action litigation are recorded as a reduction of cost basis if the Fund still owns the applicable securities on the payment date. If the Fund no longer owns the applicable securities, the proceeds are recorded as realized gains.
The value of additional securities received as an income payment through a payment in kind, if any, is recorded as interest income and increases the cost basis of such securities.
The Fund may receive other income from senior loans, including amendment fees, consent fees and commitment fees. These fees are recorded as income when received by the Fund. These amounts are included in Interest Income in the Statement of Operations.
Expenses
General expenses of the Trust are allocated to the Fund and other funds of the Trust based upon relative net assets or other expense allocation methodologies determined by the nature of the expense. Expenses directly attributable to the Fund are charged to the Fund. Expenses directly attributable to a specific class of shares are charged to that share class.
| 72 | Columbia Strategic Income Fund | Annual Report 2017 |
Notes to Financial Statements (continued)
August 31, 2017
Determination of class net asset value
All income, expenses (other than class-specific expenses, which are charged to that share class, as shown in the Statement of Operations) and realized and unrealized gains (losses) are allocated to each class of the Fund on a daily basis, based on the relative net assets of each class, for purposes of determining the net asset value of each class.
Federal income tax status
The Fund intends to qualify each year as a regulated investment company under Subchapter M of the Internal Revenue Code, as amended, and will distribute substantially all of its taxable income (including net short-term capital gains) and capital gains, if any, for its tax year, and as such will not be subject to federal income taxes. In addition, the Fund intends to distribute in each calendar year substantially all of its net investment income, capital gains and certain other amounts, if any, such that the Fund should not be subject to federal excise tax. Therefore, no federal income or excise tax provision is recorded.
Foreign taxes
The Fund may be subject to foreign taxes on income, gains on investments or currency repatriation, a portion of which may be recoverable. The Fund will accrue such taxes and recoveries, as applicable, based upon its current interpretation of tax rules and regulations that exist in the markets in which it invests.
Realized gains in certain countries may be subject to foreign taxes at the Fund level, based on statutory rates. The Fund accrues for such foreign taxes on realized and unrealized gains at the appropriate rate for each jurisdiction, as applicable. The amount, if any, is disclosed as a liability on the Statement of Assets and Liabilities.
Distributions to shareholders
Distributions from net investment income, if any, are declared and paid monthly. Net realized capital gains, if any, are distributed at least annually. Income distributions and capital gain distributions are determined in accordance with federal income tax regulations, which may differ from GAAP.
Guarantees and indemnifications
Under the Trust’s organizational documents and, in some cases, by contract, its officers and trustees are indemnified against certain liabilities arising out of the performance of their duties to the Trust or its funds. In addition, certain of the Fund’s contracts with its service providers contain general indemnification clauses. The Fund’s maximum exposure under these arrangements is unknown since the amount of any future claims that may be made against the Fund cannot be determined, and the Fund has no historical basis for predicting the likelihood of any such claims.
Recent accounting pronouncement
Accounting Standards Update 2017-08 Premium Amortization on Purchased Callable Debt Securities
In March 2017, the Financial Accounting Standards Board issued Accounting Standards Update (ASU) No. 2017-08 Premium Amortization on Purchased Callable Debt Securities. ASU No. 2017-08 updates the accounting standards to shorten the amortization period for certain purchased callable debt securities, held at a premium, to be amortized to the earliest call date. The update applies to securities with explicit, noncontingent call features that are callable at fixed prices and on preset dates. The standard is effective for annual periods beginning after December 15, 2018 and interim periods within those fiscal years. At this time, management is evaluating the implication of this guidance and the impact it will have on the financial statement amounts and footnote disclosures, if any.
Note 3. Fees and other transactions with affiliates
Management services fees
The Fund has entered into a Management Agreement with Columbia Management Investment Advisers, LLC (the Investment Manager), a wholly-owned subsidiary of Ameriprise Financial, Inc. (Ameriprise Financial). Under the Management Agreement, the Investment Manager provides the Fund with investment research and advice, as well as administrative and accounting
Columbia Strategic Income Fund | Annual Report 2017
| 73 |
Notes to Financial Statements (continued)
August 31, 2017
services. The management services fee is an annual fee that is equal to a percentage of the Fund’s daily net assets that declines from 0.600% to 0.393% as the Fund’s net assets increase. The annualized effective management services fee rate for the year ended August 31, 2017 was 0.571% and for the year ended October 31, 2016 (reflecting all management, advisory and administrative services fees paid to the Investment Manager) was 0.580%, of the Fund’s average daily net assets.
Compensation of board members
Members of the Board of Trustees, who are not officers or employees of the Investment Manager or Ameriprise Financial, are compensated for their services to the Fund as disclosed in the Statement of Operations. These members of the Board of Trustees may participate in a Deferred Compensation Plan (the Plan) which may be terminated at any time. Obligations of the Plan will be paid solely out of the Fund’s assets, and all amounts payable under the Plan constitute a general unsecured obligation of the Fund.
Compensation of Chief Compliance Officer
The Board of Trustees has appointed a Chief Compliance Officer to the Fund in accordance with federal securities regulations. A portion of the Chief Compliance Officer’s total compensation is allocated to the Fund, along with other affiliated funds governed by the Board of Trustees, based on relative net assets. The total amount allocated to all affiliated funds governed by the Board of Trustees will not exceed $40,000 annually.
Transfer agency fees
Under a Transfer and Dividend Disbursing Agent Agreement, Columbia Management Investment Services Corp. (the Transfer Agent), an affiliate of the Investment Manager and a wholly-owned subsidiary of Ameriprise Financial, is responsible for providing transfer agency services to the Fund. The Transfer Agent has contracted with Boston Financial Data Services (BFDS) to serve as sub-transfer agent. The Transfer Agent pays the fees of BFDS for services as sub-transfer agent and BFDS is not entitled to reimbursement for such fees from the Fund (with the exception of out-of-pocket fees).
The Fund pays the Transfer Agent a monthly transfer agency fee based on the number or the average value of accounts, depending on the type of account. In addition, the Fund pays the Transfer Agent a fee for shareholder services based on the number of accounts or on a percentage of the average aggregate value of the Fund’s shares maintained in omnibus accounts up to the lesser of the amount charged by the financial intermediary or a cap established by the Board of Trustees from time to time.
The Transfer Agent also receives compensation from the Fund for various shareholder services and reimbursements for certain out-of-pocket fees. Effective August 1, 2017, total transfer agency fees for Class K, Class R5 and Class Y shares are subject to an annual limitation of not more than 0.07%, 0.07% and 0.02%, respectively, of the average daily net assets attributable to each share class. From January 1, 2017 to July 31, 2017, these limitations were 0.075% for Class K and Class R5 shares and 0.025% for Class Y shares. Prior to January 1, 2017, the limitation was 0.05% for Class K and Class R5 shares and Class Y shares did not pay transfer agency fees. In addition, effective March 1, 2017 through February 28, 2018, Class K and Class R5 shares are subject to a contractual transfer agency fee annual limitation of not more than 0.05% and Class Y shares are subject to a contractual transfer agency fee annual limitation of not more than 0.00% of the average daily net assets attributable to each share class.
| 74 | Columbia Strategic Income Fund | Annual Report 2017 |
Notes to Financial Statements (continued)
August 31, 2017
For the year ended August 31, 2017 and the year ended October 31, 2016, the Fund’s annualized effective transfer agency fee rates as a percentage of average daily net assets of each class were as follows:
| | August 31, 2017 | October 31, 2016 |
| | Effective rate (%) | Effective rate (%) |
| Class A | 0.12 | 0.16 |
| Class B | 0.09 (a),(b) | 0.16 |
| Class C | 0.11 | 0.16 |
| Class K | 0.05 | 0.05 |
| Class R | 0.11 | 0.16 |
| Class R4 | 0.11 | 0.16 |
| Class R5 | 0.05 | 0.05 |
| Class T | 0.10 | 0.18 |
| Class Y | 0.00 | — |
| Class Z | 0.11 | 0.16 |
| (a) | Effective July 17, 2017, Class B shares were automatically converted to Class A shares. |
| (b) | Unannualized. |
An annual minimum account balance fee of $20 may apply to certain accounts with a value below the applicable share class’s initial minimum investment requirements to reduce the impact of small accounts on transfer agency fees. These minimum account balance fees are remitted to the Fund and recorded as part of expense reductions in the Statement of Operations. For the year ended August 31, 2017 and for the year ended October 31, 2016, these minimum account balance fees reduced total expenses of the Fund by $3,838 and $3,649, respectively.
Plan administration fees
Under a Plan Administration Services Agreement with the Transfer Agent, the Fund pays an annual fee at a rate of 0.25% of the Fund’s average daily net assets attributable to Class K shares for the provision of various administrative, recordkeeping, communication and educational services.
Distribution and service fees
The Fund has entered into an agreement with Columbia Management Investment Distributors, Inc. (the Distributor), an affiliate of the Investment Manager and a wholly-owned subsidiary of Ameriprise Financial, for distribution and shareholder services. The Board of Trustees has approved, and the Fund has adopted, distribution and shareholder service plans (the Plans) applicable to certain share classes, which set the distribution and service fees for the Fund. These fees are calculated daily and are intended to compensate the Distributor and/or eligible selling and/or servicing agents for selling shares of the Fund and providing services to investors.
Under the Plans, the Fund pays a monthly service fee to the Distributor at the maximum annual rate of 0.25% of the average daily net assets attributable to Class A, Class B, Class C and Class T shares of the Fund. Also under the Plans, the Fund pays a monthly distribution fee to the Distributor at the maximum annual rates of 0.75%, 0.75%, 0.50% and 0.25% of the average daily net assets attributable to Class B, Class C, Class R and Class T shares of the Fund, respectively. As a result of all Class B shares of the Fund being redeemed or converted to Class A shares, August 4, 2017 was the last day the Fund paid a service fee or distribution fee for Class B shares.
Although the Fund may pay a distribution fee up to 0.25% of the Fund’s average daily net assets attributable to Class T shares and a service fee of up to 0.25% of the Fund’s average daily net assets attributable to Class T shares, the aggregate fee shall not exceed 0.25% of the Fund’s average daily net assets attributable to Class T shares.
Columbia Strategic Income Fund | Annual Report 2017
| 75 |
Notes to Financial Statements (continued)
August 31, 2017
Sales charges (unaudited)
Sales charges, including front-end charges and CDSCs, received by the Distributor for distributing Fund shares for the year ended August 31, 2017 and the year ended October 31, 2016, if any, are listed below:
| | August 31, 2017 | October 31, 2016 |
| | Amount ($) | Amount ($) |
| Class A | 1,748,961 | 2,191,789 |
| Class B | — | 10,143 |
| Class C | 41,990 | 37,537 |
Expenses waived/reimbursed by the Investment Manager and its affiliates
The Investment Manager and certain of its affiliates have contractually agreed to waive fees and/or reimburse expenses (excluding certain fees and expenses described below) for the period(s) disclosed below, unless sooner terminated at the sole discretion of the Board of Trustees, so that the Fund’s net operating expenses, after giving effect to fees waived/expenses reimbursed and any balance credits and/or overdraft charges from the Fund’s custodian, do not exceed the following annual rate(s) as a percentage of the class’ average daily net assets:
| | March 1, 2017
through
February 28, 2018 | Prior to
March 1, 2017 |
| Class A | 1.06% | 1.03% |
| Class C | 1.81 | 1.78 |
| Class K | 1.045 | 0.95 |
| Class R | 1.31 | 1.28 |
| Class R4 | 0.81 | 0.78 |
| Class R5 | 0.795 | 0.70 |
| Class T | 1.06 | 1.03 |
| Class Y | 0.745 | 0.65 |
| Class Z | 0.81 | 0.78 |
Under the agreement governing these fee waivers and/or expense reimbursement arrangements, the following fees and expenses are excluded from the waiver/reimbursement commitment, and therefore will be paid by the Fund, if applicable: taxes (including foreign transaction taxes), expenses associated with investments in affiliated and non-affiliated pooled investment vehicles (including mutual funds and exchange-traded funds), transaction costs and brokerage commissions, costs related to any securities lending program, dividend expenses associated with securities sold short, inverse floater program fees and expenses, transaction charges and interest on borrowed money, interest, infrequent and/or unusual expenses and any other expenses the exclusion of which is specifically approved by the Board of Trustees. This agreement may be modified or amended only with approval from the Investment Manager, certain of its affiliates and the Fund. Any fees waived and/or expenses reimbursed under the expense reimbursement arrangements described above are not recoverable by the Investment Manager or its affiliates in future periods. In addition to the waiver/reimbursement commitment under the agreement, effective March 1, 2017 through February 28, 2018, is the Transfer Agent’s contractual agreement to limit total transfer agency fees to an annual rate of not more than 0.05% for Class K and R5 and 0.00% for Class Y of the average daily net assets attributable to each share class, unless sooner terminated at the sole discretion of the Board of Trustees.
Note 4. Federal tax information
The timing and character of income and capital gain distributions are determined in accordance with income tax regulations, which may differ from GAAP because of temporary or permanent book to tax differences.
| 76 | Columbia Strategic Income Fund | Annual Report 2017 |
Notes to Financial Statements (continued)
August 31, 2017
At August 31, 2017, these differences are primarily due to differing treatment for deferral/reversal of wash sale losses, derivative investments, tax straddles, swap investments, trustees’ deferred compensation, principal and/or interest from fixed income securities, foreign currency transactions and investments in partnerships. To the extent these differences are permanent, reclassifications are made among the components of the Fund’s net assets in the Statement of Assets and Liabilities. Temporary differences do not require reclassifications.
In the Statement of Assets and Liabilities the following reclassifications were made:
Undistributed net
investment
income ($) | Accumulated
net realized
gain ($) | Paid in
capital ($) |
| (22,475,057) | 22,475,057 | — |
Net investment income (loss) and net realized gains (losses), as disclosed in the Statement of Operations, and net assets were not affected by this reclassification.
The tax character of distributions paid during the years indicated was as follows:
| August 31, 2017 | October 31, 2016 | October 31, 2015 |
Ordinary
income ($) | Long-term
capital gains ($) | Total ($) | Ordinary
income ($) | Long-term
capital gains ($) | Total ($) | Ordinary
income ($) | Long-term
capital gains ($) | Total ($) |
| 78,985,978 | — | 78,985,978 | 86,902,380 | — | 86,902,380 | 93,872,376 | 30,091,128 | 123,963,504 |
Short-term capital gain distributions, if any, are considered ordinary income distributions for tax purposes.
At August 31, 2017, the components of distributable earnings on a tax basis were as follows:
Undistributed
ordinary income ($) | Undistributed
long-term
capital gains ($) | Capital loss
carryforwards ($) | Net unrealized
appreciation ($) |
| 24,847,089 | 7,212,723 | — | 64,817,689 |
At August 31, 2017, the cost of all investments for federal income tax purposes along with the aggregate gross unrealized appreciation and depreciation based on that cost was:
Federal
tax cost ($) | Gross unrealized
appreciation ($) | Gross unrealized
(depreciation) ($) | Net unrealized
appreciation ($) |
| 3,631,723,022 | 117,498,552 | (52,680,863) | 64,817,689 |
Tax cost of investments and unrealized appreciation/(depreciation) may also include timing differences that do not constitute adjustments to tax basis.
The following capital loss carryforwards, determined at August 31, 2017, may be available to reduce taxable income arising from future net realized gains on investments, if any, to the extent permitted by the Internal Revenue Code. Capital loss carryforwards with no expiration are required to be utilized prior to any capital losses which carry an expiration date. As a result of this ordering rule, capital loss carryforwards which carry an expiration date may be more likely to expire unused. In addition, for the year ended August 31, 2017, capital loss carryforwards utilized, expired unused and permanently lost, if any, were as follows:
| 2018 ($) | 2019 ($) | No expiration
short-term ($) | No expiration
long-term ($) | Total ($) | Utilized ($) | Expired ($) | Permanently
lost ($) |
| — | — | — | — | — | 6,434,594 | — | — |
Management of the Fund has concluded that there are no significant uncertain tax positions in the Fund that would require recognition in the financial statements. However, management’s conclusion may be subject to review and adjustment at a later date based on factors including, but not limited to, new tax laws, regulations, and administrative interpretations (including relevant court decisions). Generally, the Fund’s federal tax returns for the prior three fiscal years remain subject to examination by the Internal Revenue Service.
Columbia Strategic Income Fund | Annual Report 2017
| 77 |
Notes to Financial Statements (continued)
August 31, 2017
Note 5. Portfolio information
The cost of purchases and proceeds from sales of securities, excluding short-term investments and derivatives, if any, aggregated to $3,962,618,468 and $3,566,438,501, respectively, for the year ended August 31, 2017, of which $2,091,957,971 and $2,145,586,453, respectively, were U.S. government securities. The amount of purchase and sale activity impacts the portfolio turnover rate reported in the Financial Highlights.
Note 6. Affiliated money market fund
The Fund invests in Columbia Short-Term Cash Fund, an affiliated money market fund established for the exclusive use by the Fund and other affiliated funds (the Affiliated MMF). The income earned by the Fund from such investments is included as Dividends - affiliated issuers in the Statement of Operations. As an investing fund, the Fund indirectly bears its proportionate share of the expenses of the Affiliated MMF. The Affiliated MMF prices its shares with a floating net asset value. In addition, the Board of Trustees of the Affiliated MMF may impose a fee on redemptions (sometimes referred to as a liquidity fee) or temporarily suspend redemptions (sometimes referred to as imposing a redemption gate) in the event its liquidity falls below regulatory limits.
Note 7. Line of credit
The Fund has access to a revolving credit facility with a syndicate of banks led by Citibank, N.A., HSBC Bank USA, N.A. and JPMorgan Chase Bank, N.A. whereby the Fund may borrow for the temporary funding of shareholder redemptions or for other temporary or emergency purposes. The credit facility, which is a collective agreement between the Fund and certain other funds managed by the Investment Manager, severally and not jointly, permits collective borrowings up to $1 billion. Interest is charged to each participating fund based on its borrowings at a rate equal to the higher of (i) the overnight federal funds rate plus 1.00% or (ii) the one-month LIBOR rate plus 1.00%. Each borrowing under the credit facility matures no later than 60 days after the date of borrowing. The Fund also pays a commitment fee equal to its pro rata share of the amount of the credit facility at a rate of 0.15% per annum. The commitment fee is included in other expenses in the Statement of Operations.
The Fund had no borrowings during the year ended August 31, 2017 or the year ended October 31, 2016.
Note 8. Significant risks
Credit risk
Credit risk is the risk that the value of debt securities in the Fund’s portfolio may decline because the issuer may default and fail to pay interest or repay principal when due. Rating agencies assign credit ratings to debt securities to indicate their credit risk. Lower rated or unrated debt securities held by the Fund may present increased credit risk as compared to higher-rated debt securities.
Derivatives risk
Losses involving derivative instruments may be substantial, because a relatively small price movement in the underlying security(ies), commodity, currency or index or other instrument or asset may result in a substantial loss for the Fund. In addition to the potential for increased losses, the use of derivative instruments may lead to increased volatility within the Fund. Derivatives will typically increase the Fund’s exposure to principal risks to which it is otherwise exposed, and may expose the Fund to additional risks, including correlation risk, counterparty risk, hedging risk, leverage risk and liquidity risk.
Foreign securities and emerging market countries risk
Investing in foreign securities may include certain risks and considerations not typically associated with investing in U.S. securities, such as fluctuating currency values and changing local and regional economic, political and social conditions, which may result in greater market volatility. In addition, certain foreign securities may not be as liquid as U.S. securities. Investing in emerging markets may accentuate these risks. These countries are also more likely to experience high levels of inflation, deflation or currency devaluation which could hurt their economies and securities markets. To the extent that the
| 78 | Columbia Strategic Income Fund | Annual Report 2017 |
Notes to Financial Statements (continued)
August 31, 2017
Fund concentrates its investment exposure to any one or a few specific countries, the Fund will be particularly susceptible to the various conditions, events or other factors impacting those countries and may, therefore, have a greater risk than that of a fund which is more geographically diversified.
High-yield investments risk
Securities and other debt instruments held by the Fund that are rated below investment grade (commonly called "high-yield" or "junk" bonds) and unrated debt instruments of comparable quality expose the Fund to a greater risk of loss of principal and income than a fund that invests solely or primarily in investment grade securities. In addition, these investments have greater price fluctuations, are less liquid and are more likely to experience a default than higher-rated debt instruments. High-yield debt instruments are considered to be predominantly speculative with respect to the issuer’s capacity to pay interest and repay principal.
Interest rate risk
Interest rate risk is the risk of losses attributable to changes in interest rates. In general, if prevailing interest rates rise, the values of debt securities tend to fall, and if interest rates fall, the values of debt securities tend to rise. Actions by governments and central banking authorities can result in increases in interest rates. Increasing interest rates may negatively affect the value of debt securities held by the Fund, resulting in a negative impact on the Fund’s performance and net asset value per share. In general, the longer the maturity or duration of a debt security, the greater its sensitivity to changes in interest rates.
Liquidity risk
Liquidity risk is the risk associated with a lack of marketability of investments which may make it difficult to sell the investment at a desirable time or price. Changing regulatory, market or other conditions or environments (for example, the interest rate or credit environments) may adversely affect the liquidity of the Fund’s investments. The Fund may have to accept a lower selling price for the holding, sell other investments, or forego another, more appealing investment opportunity. Generally, the less liquid the market at the time the Fund sells a portfolio investment, the greater the risk of loss or decline of value to the Fund. A less liquid market can lead to an increase in Fund redemptions, which may negatively impact Fund performance and net asset value per share, including, for example, if the Fund is forced to sell securities in a down market.
Mortgage- and other asset-backed securities risk
The value of any mortgage-backed and other asset-backed securities held by the Fund may be affected by, among other things, changes or perceived changes in: interest rates; factors concerning the interests in and structure of the issuer or the originator of the mortgages or other assets; the creditworthiness of the entities that provide any supporting letters of credit, surety bonds or other credit enhancements; or the market’s assessment of the quality of underlying assets. Payment of principal and interest on some mortgage-backed securities (but not the market value of the securities themselves) may be guaranteed by the full faith and credit of a particular U.S. Government agency, authority, enterprise or instrumentality, and some, but not all, are also insured or guaranteed by the U.S. Government. Mortgage-backed securities issued by non-governmental issuers (such as commercial banks, savings and loan institutions, private mortgage insurance companies, mortgage bankers and other secondary market issuers) may entail greater risk than obligations guaranteed by the U.S. Government. Mortgage- and other asset-backed securities are subject to prepayment risk, which is the possibility that the underlying mortgage or other asset may be refinanced or prepaid prior to maturity during periods of declining or low interest rates, causing the Fund to have to reinvest the money received in securities that have lower yields. Rising or high interest rates tend to extend the duration of mortgage- and other asset-backed securities, making their prices more volatile and more sensitive to changes in interest rates.
Shareholder concentration risk
At August 31, 2017, affiliated shareholders of record owned 38.9% of the outstanding shares of the Fund in one or more accounts. Subscription and redemption activity by concentrated accounts may have a significant effect on the operations of the Fund. In the case of a large redemption, the Fund may be forced to sell investments at inopportune times, including its liquid positions, which may result in Fund losses and the Fund holding a higher percentage of less liquid positions. Large redemptions could result in decreased economies of scale and increased operating expenses for non-redeeming Fund shareholders.
Columbia Strategic Income Fund | Annual Report 2017
| 79 |
Notes to Financial Statements (continued)
August 31, 2017
Note 9. Subsequent events
Management has evaluated the events and transactions that have occurred through the date the financial statements were issued. Other than as noted in Note 1 above, there were no items requiring adjustment of the financial statements or additional disclosure.
Note 10. Information regarding pending and settled legal proceedings
Ameriprise Financial and certain of its affiliates have historically been involved in a number of legal, arbitration and regulatory proceedings, including routine litigation, class actions, and governmental actions, concerning matters arising in connection with the conduct of their business activities. Ameriprise Financial believes that the Funds are not currently the subject of, and that neither Ameriprise Financial nor any of its affiliates are the subject of, any pending legal, arbitration or regulatory proceedings that are likely to have a material adverse effect on the Fund or the ability of Ameriprise Financial or its affiliates to perform under their contracts with the Fund. Ameriprise Financial is required to make quarterly (10-Q), annual (10-K) and, as necessary, 8-K filings with the Securities and Exchange Commission (SEC) on legal and regulatory matters that relate to Ameriprise Financial and its affiliates. Copies of these filings may be obtained by accessing the SEC website at www.sec.gov.
There can be no assurance that these matters, or the adverse publicity associated with them, will not result in increased Fund redemptions, reduced sale of Fund shares or other adverse consequences to the Fund. Further, although we believe proceedings are not likely to have a material adverse effect on the Fund or the ability of Ameriprise Financial or its affiliates to perform under their contracts with the Fund, these proceedings are subject to uncertainties and, as such, we are unable to estimate the possible loss or range of loss that may result. An adverse outcome in one or more of these proceedings could result in adverse judgments, settlements, fines, penalties or other relief that could have a material adverse effect on the consolidated financial condition or results of operations of Ameriprise Financial.
| 80 | Columbia Strategic Income Fund | Annual Report 2017 |
Report of Independent Registered Public Accounting Firm
To the Trustees of Columbia Funds Series Trust I and the Shareholders of Columbia Strategic Income Fund
In our opinion, the accompanying statement of assets and liabilities, including the portfolio of investments, and the related statements of operations and of changes in net assets and the financial highlights present fairly, in all material respects, the financial position of Columbia Strategic Income Fund (the “Fund”, a series of Columbia Funds Series Trust I) as of August 31, 2017, the results of its operations for the period November 1, 2016 through August 31, 2017 and the year ended October 31, 2016, the changes in its net assets for the period November 1, 2016 through August 31, 2017 and each of the two years in the period ended October 31, 2016 and the financial highlights for each of the periods indicated therein, in conformity with accounting principles generally accepted in the United States of America. These financial statements and financial highlights (hereafter referred to as “financial statements”) are the responsibility of the Fund’s management. Our responsibility is to express an opinion on these financial statements based on our audits. We conducted our audits of these financial statements in accordance with the standards of the Public Company Accounting Oversight Board (United States). Those standards require that we plan and perform the audit to obtain reasonable assurance about whether the financial statements are free of material misstatement. An audit includes examining, on a test basis, evidence supporting the amounts and disclosures in the financial statements, assessing the accounting principles used and significant estimates made by management, and evaluating the overall financial statement presentation. We believe that our audits, which included confirmation of securities as of August 31, 2017 by correspondence with the custodian, brokers, agent banks and transfer agent provide a reasonable basis for our opinion.
/s/ PricewaterhouseCoopers LLP
Minneapolis, MN
October 20, 2017
Columbia Strategic Income Fund | Annual Report 2017
| 81 |
Federal Income Tax Information
(Unaudited)
The Fund hereby designates the following tax attributes for the fiscal year ended August 31, 2017. Shareholders will be notified in early 2018 of the amounts for use in preparing 2017 income tax returns.
Capital
gain
dividend | |
| $7,573,359 | |
Capital gain dividend. The Fund designates as a capital gain dividend the amount reflected above, or if subsequently determined to be different, the net capital gain of such fiscal period.
| 82 | Columbia Strategic Income Fund | Annual Report 2017 |
Shareholders elect the Board that oversees the Fund’s operations. The Board appoints officers who are responsible for day-to-day business decisions based on policies set by the Board. The following table provides basic biographical information about the Fund’s Trustees, including their principal occupations during the past five years, although specific titles for individuals may have varied over the period. The year set forth beneath Length of Service in the table below is the year in which the Trustee was first appointed or elected as Trustee to any Fund currently in the Columbia Funds Complex or a predecessor thereof. Under current Board policy, members serve terms of indefinite duration.
Independent trustees
| Name, address, year of birth | Position held with the Trust and length of service | Principal occupation(s) during the past five years and other relevant professional experience | Number of Funds in the Columbia Fund Complex overseen | Other directorships held by Trustee during the past five years |
Janet Langford Carrig
c/o Columbia Management
Investment Advisers, LLC
225 Franklin Street
Mail Drop BX32 05228
Boston, MA 02110
1957 | Trustee
1996 | Senior Vice President, General Counsel and Corporate Secretary, ConocoPhillips (independent energy company) since September 2007 | 57 | None |
Douglas A. Hacker
c/o Columbia Management
Investment Advisers, LLC
225 Franklin Street
Mail Drop BX32 05228
Boston, MA 02110
1955 | Trustee and Chairman of the Board
1996 | Independent business executive since May 2006; Executive Vice President — Strategy of United Airlines from December 2002 to May 2006; President of UAL Loyalty Services (airline marketing company) from September 2001 to December 2002; Executive Vice President and Chief Financial Officer of United Airlines from July 1999 to September 2001 | 57 | Spartan Nash Company, (food distributor); Nash Finch Company (food distributor) from 2005 to 2013; Aircastle Limited (aircraft leasing); SeaCube Container Leasing Ltd. (container leasing) from 2010 to 2013; and Travelport Worldwide Limited (travel information technology) |
Nancy T. Lukitsh
c/o Columbia Management
Investment Advisers, LLC
225 Franklin Street
Mail Drop BX32 05228
Boston, MA 02110
1956 | Trustee
2011 | Senior Vice President, Partner and Director of Marketing, Wellington Management Company, LLP (investment adviser) from 1997 to 2010; Chair, Wellington Management Portfolios (commingled non-U.S. investment pools) from 2007 to 2010; Director, Wellington Trust Company, NA and other Wellington affiliates from 1997 to 2010 | 57 | None |
David M. Moffett
c/o Columbia Management
Investment Advisers, LLC
225 Franklin Street
Mail Drop BX32 05228
Boston, MA 02110
1952 | Trustee
2011 | Retired. Consultant to Bridgewater and Associates | 57 | Director, CSX Corporation; Genworth Financial, Inc. (financial and insurance products and services); PayPal Holdings Inc. (payment and data processing services); Trustee, University of Oklahoma Foundation; former Director, eBay Inc. (online trading community), 2007-2015; and former Director, CIT Bank, CIT Group Inc. (commercial and consumer finance), 2010-2016 |
Columbia Strategic Income Fund | Annual Report 2017
| 83 |
TRUSTEES AND OFFICERS (continued)
Independent trustees (continued)
| Name, address, year of birth | Position held with the Trust and length of service | Principal occupation(s) during the past five years and other relevant professional experience | Number of Funds in the Columbia Fund Complex overseen | Other directorships held by Trustee during the past five years |
Charles R. Nelson
c/o Columbia Management
Investment Advisers, LLC
225 Franklin Street
Mail Drop BX32 05228
Boston, MA 02110
1942 | Trustee
1981 | Retired. Professor Emeritus, University of Washington since 2011; Professor of Economics, University of Washington from 1976 to 2011; Ford and Louisa Van Voorhis Professor of Political Economy, University of Washington from 1993 to 2011; Adjunct Professor of Statistics, University of Washington from 1980 to 2011; Associate Editor, Journal of Money, Credit and Banking from September 1993 to 2008; consultant on econometric and statistical matters | 57 | None |
John J. Neuhauser
c/o Columbia Management
Investment Advisers, LLC
225 Franklin Street
Mail Drop BX32 05228
Boston, MA 02110
1943 | Trustee
1984 | President, Saint Michael’s College since August 2007; Director or Trustee of several non-profit organizations, including University of Vermont Medical Center; Academic Vice President and Dean of Faculties, Boston College from August 1999 to October 2005; University Professor, Boston College from November 2005 to August 2007 | 57 | Liberty All-Star Equity Fund and Liberty All- Star Growth Fund (closed-end funds) |
Patrick J. Simpson
c/o Columbia Management
Investment Advisers, LLC
225 Franklin Street
Mail Drop BX32 05228
Boston, MA 02110
1944 | Trustee
2000 | Of Counsel, Perkins Coie LLP (law firm) since 2015; Partner, Perkins Coie LLP from 1988 to 2014 | 57 | None |
Anne-Lee Verville
c/o Columbia Management
Investment Advisers, LLC
225 Franklin Street
Mail Drop BX32 05228
Boston, MA 02110
1945 | Trustee
1998 | Retired. General Manager, Global Education Industry from 1994 to 1997, President – Application Systems Division from 1991 to 1994, Chief Financial Officer – US Marketing & Services from 1988 to 1991, and Chief Information Officer from 1987 to 1988, IBM Corporation (computer and technology) | 57 | Enesco Group, Inc. (producer of giftware and home and garden decor products) from 2001 to 2006 |
| 84 | Columbia Strategic Income Fund | Annual Report 2017 |
TRUSTEES AND OFFICERS (continued)
Consultants to the Independent Trustees*
| Name, address, year of birth | Position held with the Trust and length of service | Principal occupation(s) during the past five years and other relevant professional experience | Number of Funds in the Columbia Funds complex overseen | Other directorships held by Trustee during the past five years |
J. Kevin Connaughton
c/o Columbia
Management Investment
Advisers, LLC,
225 Franklin Street
Mail Drop BX32 05228,
Boston, MA 02110
1964 | Independent Trustee Consultant
2016 | Independent Trustee Consultant, Columbia Funds since March 2016; Managing Director and General Manager of Mutual Fund Products, Columbia Management Investment Advisers, LLC from May 2010 to February 2015; President, Columbia Funds from 2009 to 2015; and senior officer of Columbia Funds and affiliated funds from 2003 to 2015 | 57 | Board of Governors, Gateway Healthcare since January 2016; Trustee, New Century Portfolios since March 2015; and Director, The Autism Project since March 2015 |
Natalie A. Trunow
c/o Columbia
Management Investment
Advisers, LLC,
225 Franklin Street
Mail Drop BX32 05228,
Boston, MA 02110
1967 | Independent Trustee Consultant
2016 | Independent Trustee Consultant, Columbia Funds since September 2016; Chief Executive Officer, Millennial Partners (investment consulting services to institutions) since January 2016; Director of Investments, Casey Family Programs from April 2016 to September 2016; Senior Vice President and Chief Investment Officer, Calvert Investments from August 2008 to January 2016; Section Head and Portfolio Manager, General Motors Asset Management from June 1997 to August 2008 | 57 | Healthcare Services for Children with Special Needs |
| * | J. Kevin Connaughton was appointed consultant to the Independent Trustees effective March 1, 2016. Natalie A. Trunow was appointed consultant to the Independent Trustees effective September 1, 2016. Shareholders of the Funds are expected to be asked to elect each of Mr. Connaughton and Ms. Trunow as a Trustee at a future shareholder meeting. |
Interested trustee affiliated with Investment Manager*
| Name, address, year of birth | Position held with the Trust and length of service | Principal occupation(s) during the past five years and other relevant professional experience | Number of Funds in the Columbia Funds Complex overseen | Other directorships held by Trustee during the past five years |
William F. Truscott
c/o Columbia Management
Investment Advisers, LLC
225 Franklin Street
Boston, MA 02110
1960 | Trustee
2012 | Chairman of the Board and President, Columbia Management Investment Advisers, LLC since May 2010 and February 2012, respectively; Chief Executive Officer, Global Asset Management, Ameriprise Financial, Inc. since September 2012 (previously Chief Executive Officer, U.S. Asset Management & President, Annuities, May 2010-September 2012); Director and Chief Executive Officer, Columbia Management Investment Distributors, Inc. since May 2010 and February 2012, respectively; Chairman of the Board and Chief Executive Officer, RiverSource Distributors, Inc. since 2006; Director, Threadneedle Asset Management Holdings, SARL since 2014; President and Chief Executive Officer, Ameriprise Certificate Company, 2006-August 2012 | 179 | Chairman of the Board, Columbia Management Investment Advisers, LLC since May 2010; Director, Columbia Management Investment Distributors, Inc. since May 2010; former Director, Ameriprise Certificate Company, 2006 - January 2013 |
| * | Interested person (as defined under the 1940 Act) by reason of being an officer, director, security holder and/or employee of the Investment Manager or Ameriprise Financial. |
The Statement of Additional Information has additional information about the Fund’s Board members and is available,
without charge, upon request by calling 800.345.6611, contacting your financial intermediary or visiting
investor.columbiathreadneedleus.com.
Columbia Strategic Income Fund | Annual Report 2017
| 85 |
TRUSTEES AND OFFICERS (continued)
The Board has appointed officers who are responsible for day-to-day business decisions based on policies it has established. The officers serve at the pleasure of the Board. The following table provides basic information about the Officers of the Fund, including principal occupations during the past five years, although their specific titles may have varied over the period. In addition to Mr. Truscott, who is Senior Vice President, the Fund’s other officers are:
Fund officers
Name,
address and
year of birth | Position and year
first appointed to
position for any Fund
in the Columbia
Funds complex or a
predecessor thereof | Principal occupation(s) during past five years |
Christopher O. Petersen
5228 Ameriprise
Financial Center
Minneapolis, MN 55474
Born 1970 | President and Principal Executive Officer (2015) | Vice President and Lead Chief Counsel, Ameriprise Financial, Inc. since January 2015 (previously, Vice President and Chief Counsel, January 2010 - December 2014; officer of Columbia Funds and affiliated funds since 2007. |
Michael G. Clarke
225 Franklin Street
Boston, MA 02110
Born 1969 | Treasurer (2011), Chief Financial Officer (2009) and Chief Accounting Officer (2015) | Vice President — Mutual Fund Administration, Columbia Management Investment Advisers, LLC, since May 2010; senior officer of Columbia Funds and affiliated funds since 2002. |
Paul B. Goucher
100 Park Avenue
New York, NY 10017
Born 1968 | Senior Vice President (2011) and Assistant Secretary (2008) | Senior Vice President and Assistant General Counsel, Ameriprise Financial, Inc. since January 2017 (previously Vice President and Lead Chief Counsel, November 2008 - January 2017 and January 2013 - January 2017, respectively; and Chief Counsel, January 2010 - January 2013); Vice President, Chief Legal Officer and Assistant Secretary, Columbia Management Investment Advisers, LLC since May 2010. |
Thomas P. McGuire
225 Franklin Street
Boston, MA 02110
Born 1972 | Senior Vice President and Chief Compliance Officer (2012) | Vice President — Asset Management Compliance, Ameriprise Financial, Inc., since May 2010; Chief Compliance Officer, Ameriprise Certificate Company since September 2010. |
Colin Moore
225 Franklin Street
Boston, MA 02110
Born 1958 | Senior Vice President (2010) | Executive Vice President and Global Chief Investment Officer, Ameriprise Financial, Inc., since July 2013; Executive Vice President and Global Chief Investment Officer, Columbia Management Investment Advisers, LLC since July 2013 (previously Director and Global Chief Investment Officer, 2010 - 2013). |
Ryan C. Larrenaga
225 Franklin Street
Boston, MA 02110
Born 1970 | Senior Vice President (2017), Chief Legal Officer (2017) and Secretary (2015) | Vice President and Group Counsel, Ameriprise Financial, Inc. since August 2011; officer of Columbia Funds and affiliated funds since 2005. |
Michael E. DeFao
225 Franklin Street
Boston, MA 02110
Born 1968 | Vice President (2011) and Assistant Secretary (2010) | Vice President and Chief Counsel, Ameriprise Financial, Inc. since May 2010. |
Amy Johnson
5228 Ameriprise
Financial Center
Minneapolis, MN 55474
Born 1965 | Vice President (2006) | Managing Director and Global Head of Operations, Columbia Management Investment Advisers, LLC since April 2016 (previously Managing Director and Chief Operating Officer, 2010 - 2016). |
Lyn Kephart-Strong
5228 Ameriprise
Financial Center
Minneapolis, MN 55474
Born 1960 | Vice President (2015) | President, Columbia Management Investment Services Corp. since October 2014; Vice President & Resolution Officer, Ameriprise Trust Company since August 2009. |
| 86 | Columbia Strategic Income Fund | Annual Report 2017 |
Board Consideration and Approval of Management
Agreement
On June 14, 2017, the Board of Trustees (the Board) and the Trustees who are not interested persons (as defined in the Investment Company Act of 1940) (the Independent Trustees) of Columbia Funds Series Trust I (the Trust) unanimously approved the continuation of the Management Agreement (the Management Agreement) with Columbia Management Investment Advisers, LLC (the Investment Manager) with respect to Columbia Strategic Income Fund (the Fund), a series of the Trust. As detailed below, the Board’s Advisory Fees and Expenses Committee (the Committee) and the Board met on multiple occasions to review and discuss, both among themselves and with the management team of the Investment Manager, materials provided by the Investment Manager and others before determining to approve the continuation of the Management Agreement.
In connection with their deliberations regarding the continuation of the Management Agreement, the Committee and the Board evaluated materials requested from the Investment Manager regarding the Fund and the Management Agreement, and discussed these materials with representatives of the Investment Manager at Committee meetings held on March 27, 2017, April 26, 2017 and June 13, 2017 and at Board meetings held on March 28, 2017 and June 14, 2017. In addition, the Board considers matters bearing on the Management Agreement at most of its other meetings throughout the year and meets regularly with senior management of the Trust and the Investment Manager. Through the Board’s Investment Oversight Committees, Trustees also meet with selected portfolio managers of the funds the Trustees oversee and other investment personnel at various times throughout the year. The Committee and the Board also consulted with its independent fee consultant, Fund counsel and the Independent Trustees’ independent legal counsel, who advised on various matters with respect to the Committee’s and the Board’s considerations and otherwise assisted the Committee and the Board in their deliberations. On June 13, 2017, the Committee recommended that the Board approve the continuation of the Management Agreement. On June 14, 2017, the Board, including the Independent Trustees, voting separately, unanimously approved the continuation of the Management Agreement for the Fund.
The Committee and the Board considered all information that they, their legal counsel or the Investment Manager believed reasonably necessary to evaluate and to determine whether to recommend for approval or approve the continuation of the Management Agreement. The information and factors considered by the Committee and the Board in recommending for approval or approving the continuation of the Management Agreement for the Fund included the following:
| • | Information on the investment performance of the Fund relative to the performance of a group of mutual funds determined to be comparable to the Fund by an independent third-party data provider, as well as performance relative to benchmarks; |
| • | Information on the Fund’s management fees and total expenses, including information comparing the Fund’s expenses to those of a group of comparable mutual funds, as determined by the independent third-party data provider; |
| • | The Investment Manager’s agreement to contractually limit or cap total operating expenses for the Fund through February 28, 2018 so that total operating expenses (excluding certain fees and expenses, such as transaction costs and certain other investment related expenses, interest, taxes, acquired fund fees and expenses, and infrequent and/or unusual expenses) would not exceed a specified annual rate, as a percentage of the Fund’s net assets; |
| • | The terms and conditions of the Management Agreement; |
| • | The current and proposed terms and conditions of other agreements and arrangements with affiliates of the Investment Manager relating to the operations of the Fund, including agreements with respect to the provision of distribution, transfer agency and shareholder services to the Fund; |
| • | Descriptions of various functions performed by the Investment Manager under the Management Agreement, including portfolio management and portfolio trading practices; |
| • | Information regarding the management fees of similarly-managed portfolios of other clients of the Investment Manager, including institutional separate accounts; |
| • | Information regarding the reputation, regulatory history and resources of the Investment Manager, including information regarding senior management, portfolio managers and other personnel; |
Columbia Strategic Income Fund | Annual Report 2017
| 87 |
Board Consideration and Approval of Management
Agreement (continued)
| • | Information regarding the capabilities of the Investment Manager with respect to compliance monitoring services, including an assessment of the Investment Manager’s compliance system by the Fund’s Chief Compliance Officer; and |
| • | The profitability to the Investment Manager and its affiliates from their relationships with the Fund. |
Nature, extent and quality of services provided under the Management Agreement
The Committee and the Board considered the nature, extent and quality of services provided to the Fund by the Investment Manager and its affiliates under the Management Agreement and under separate agreements for the provision of transfer agency and shareholder services, and the resources dedicated to the Fund and the other Columbia Funds by the Investment Manager and its affiliates. The Committee and the Board considered, among other things, the Investment Manager’s ability to attract, motivate and retain highly qualified research, advisory and supervisory investment professionals (including compensation programs for personnel involved in fund management, reputation and other attributes), the portfolio management services provided by those investment professionals, and the quality of the Investment Manager’s investment research capabilities and trade execution services. The Committee and the Board also considered the potential benefits to shareholders of investing in a mutual fund that is part of a fund complex offering exposure to a variety of asset classes and investment disciplines and providing a variety of fund and shareholder services.
The Committee and the Board also considered the professional experience and qualifications of the senior personnel of the Investment Manager, which included consideration of the Investment Manager’s experience with similarly-structured funds. The Committee and the Board noted the compliance programs of and the compliance-related resources provided to the Fund by the Investment Manager and its affiliates, and considered the Investment Manager’s ability to provide administrative services to the Fund and coordinate the activities of the Fund’s other service providers. After reviewing these and related factors, the Committee and the Board concluded, within the context of their overall conclusions, that the nature, extent and quality of the services provided to the Fund under the Management Agreement supported the continuation of the Management Agreement.
Investment performance
The Committee and the Board reviewed information about the performance of the Fund over various time periods, including performance information relative to benchmarks and information that compared the performance of the Fund to the performance of a group of comparable mutual funds as determined by the independent third-party data provider, and data provided by the independent fee consultant. The Committee and the Board also reviewed a description of the third party’s methodology for identifying the Fund’s peer groups for purposes of performance and expense comparisons.
The Committee and the Board noted that, through December 31, 2016, the Fund’s performance was in the forty-sixth, twentieth and forty-sixth percentile (where the best performance would be in the first percentile) of its category selected by the independent third-party data provider for the purposes of performance comparisons for the one-, three- and five-year periods, respectively.
The Committee and the Board also considered the Investment Manager’s performance and reputation generally, the Investment Manager’s historical responsiveness to Board concerns about performance, and the Investment Manager’s willingness to take steps intended to improve performance. After reviewing these and related factors, the Committee and the Board concluded, within the context of their overall conclusions, that the performance of the Fund and the Investment Manager was sufficient, in light of other considerations, to warrant the continuation of the Management Agreement.
Investment management fee rates and other expenses
The Committee and the Board considered the management fees charged to the Fund under the Management Agreement as well as the total expenses incurred by the Fund. In assessing the reasonableness of the fees under the Management Agreement, the Committee and the Board considered, among other information, the Fund’s total expense ratio as a percentage of average daily net assets. The Committee and the Board considered data provided by the independent third-party data provider and the independent fee consultant. The Committee and the Board noted that, as of December 31, 2016, the Fund’s actual management fee and net total expense ratio are ranked in the fourth and third quintiles, respectively,
| 88 | Columbia Strategic Income Fund | Annual Report 2017 |
Board Consideration and Approval of Management
Agreement (continued)
(where the lowest fees and expenses would be in the first quintile) against the Fund’s expense universe as determined by the independent third-party data provider for purposes of expense comparison. The Committee and the Board also took into account the fee waiver and expense limitation arrangements agreed to by the Investment Manager, as noted above.
The Committee and the Board also received and considered information about the management fees charged by the Investment Manager to institutional separate accounts. In considering the fees charged to those accounts, the Committee and the Board took into account, among other things, the Investment Manager’s representations about the differences between managing mutual funds as compared to other types of accounts, including differences in the services provided, differences in the risk profile of such business for the Investment Manager and the additional resources required to manage mutual funds effectively. The Committee and the Board also received and considered information about the fees charged by the Investment Manager for sub-advisory services it provides to comparable unaffiliated funds. In evaluating the Fund’s management fees, the Committee and the Board also took into account the demands, complexity and quality of the investment management of the Fund.
After reviewing these and related factors, the Committee and the Board concluded, within the context of their overall conclusions, that the management fee rates and expenses of the Fund, in light of other considerations, warranted the continuation of the Management Agreement.
Costs of services provided and profitability
The Committee and the Board also took note of the costs the Investment Manager and its affiliates incur in connection with the services provided and the profitability to the Investment Manager and its affiliates from their relationships with the Fund.
The Committee and the Board also considered the compensation directly or indirectly received by the Investment Manager’s affiliates in connection with their relationships with the Fund. The Committee and the Board reviewed information provided by management as to the profitability to the Investment Manager and its affiliates of their relationships with the Fund, information about the allocation of expenses used to calculate profitability, and comparisons of profitability levels realized in 2016 to profitability levels realized in 2015. When reviewing profitability, the Committee and the Board also considered court cases in which adviser profitability was an issue in whole or in part, the performance of similarly managed funds, the performance of the Fund, and the expense ratio of the Fund. In addition, the Committee and the Board considered information provided by the Investment Manager regarding the Investment Manager’s financial condition and comparing its profitability to that of other asset management firms that are, or are subsidiaries of, publicly traded companies. In this regard, the Committee and the Board also considered data provided by the independent fee consultant.
After reviewing these and related factors, the Committee and the Board concluded, within the context of their overall conclusions, that the costs of services provided and the profitability to the Investment Manager and its affiliates from their relationships with the Fund supported the continuation of the Management Agreement.
Economies of scale
The Committee and the Board considered the potential existence of economies of scale in the provision by the Investment Manager of services to the Fund, to groups of related funds, and to the Investment Manager’s investment advisory clients as a whole, and whether those economies of scale were shared with the Fund through breakpoints in investment management fees or other means, such as expense limitation arrangements and additional investments by the Investment Manager in investment, trading, compliance and other resources. The Committee and the Board noted that the management fee schedules for the Fund contained breakpoints that would reduce the fee rate on assets above specified threshold levels.
In considering these matters, the Committee and the Board also considered the costs of the services provided and the profitability to the Investment Manager and its affiliates from their relationships with the Fund, as discussed above. After reviewing these and related factors, the Committee and the Board concluded, within the context of their overall conclusions, that the extent to which any economies of scale were expected to be shared with the Fund supported the continuation of the Management Agreement.
Columbia Strategic Income Fund | Annual Report 2017
| 89 |
Board Consideration and Approval of Management
Agreement (continued)
Other benefits to the Investment Manager
The Committee and the Board received and considered information regarding “fall-out” or ancillary benefits received by the Investment Manager and its affiliates as a result of their relationships with the Fund, such as the engagement of the Investment Manager’s affiliates to provide distribution, transfer agency and shareholder services to the Fund. In this regard, among other matters, the Committee and the Board considered that the Fund’s distributor retains a portion of the distribution fees from the Fund and receives a portion of the sales charges on sales or redemptions of certain classes of shares of the Fund. The Committee and the Board also considered the benefits of research made available to the Investment Manager by reason of brokerage commissions generated by the Fund’s securities transactions, and reviewed information about the Investment Manager’s practices with respect to allocating portfolio transactions for brokerage and research services. The Committee and the Board recognized that the Investment Manager’s profitability would be somewhat lower without these benefits.
Conclusion
The Committee and the Board reviewed all of the above considerations in reaching their decisions to recommend or approve the continuation of the Management Agreement. In their deliberations, the Trustees did not identify any particular information that was all-important or controlling, and individual Trustees may have attributed different weights to the various factors. Based on their evaluation of all factors that they deemed to be material, including those factors described above, and assisted by the advice of independent legal counsel, the Board, including the Independent Trustees, voting separately, unanimously approved the continuation of the Management Agreement.
| 90 | Columbia Strategic Income Fund | Annual Report 2017 |
The Fund mails one shareholder report to each shareholder address. If you would like more than one report, please call shareholder services at 800.345.6611 and additional reports will be sent to you.
Proxy voting policies and procedures
The policy of the Board of Trustees is to vote the proxies of the companies in which the Fund holds investments consistent with the procedures as stated in the Statement of Additional Information (SAI). You may obtain a copy of the SAI without charge by calling 800.345.6611; contacting your financial intermediary; visiting investor.columbiathreadneedleus.com; or searching the website of the Securities and Exchange Commission (SEC) at sec.gov. Information regarding how the Fund voted proxies relating to portfolio securities is filed with the SEC by August 31st for the most recent 12-month period ending June 30th of that year, and is available without charge by visiting investor.columbiathreadneedleus.com, or searching the website of the SEC at sec.gov.
Quarterly schedule of investments
The Fund files a complete schedule of portfolio holdings with the SEC for the first and third quarters of each fiscal year on Form N-Q. The Fund’s Form N-Q is available on the SEC’s website at sec.gov and may be reviewed and copied at the SEC’s Public Reference Room in Washington, D.C. Information on the operation of the Public Reference Room may be obtained by calling 800.SEC.0330. The Fund’s complete schedule of portfolio holdings, as filed on Form N-Q, can also be obtained without charge, upon request, by calling 800.345.6611.
Additional Fund information
For more information about the Fund, please visit investor.columbiathreadneedleus.com or call 800.345.6611. Customer Service Representatives are available to answer your questions Monday through Friday from 8 a.m. to 7 p.m. Eastern time.
Fund investment manager
Columbia Management Investment Advisers, LLC
225 Franklin Street
Boston, MA 02110
Fund distributor
Columbia Management Investment Distributors, Inc.
225 Franklin Street
Boston, MA 02110
Fund transfer agent
Columbia Management Investment Services Corp.
P.O. Box 8081
Boston, MA 02266-8081
Columbia Strategic Income Fund | Annual Report 2017
| 91 |
[THIS PAGE INTENTIONALLY LEFT BLANK]
[THIS PAGE INTENTIONALLY LEFT BLANK]
Columbia Strategic Income Fund
P.O. Box 8081
Boston, MA 02266-8081
Please read and consider the investment objectives, risks, charges and expenses for any fund carefully before investing. For a prospectus and summary prospectus, which contains this and other important information about the Fund, go to
investor.columbiathreadneedleus.com. The Fund is distributed by Columbia Management Investment Distributors, Inc., member FINRA, and managed by Columbia Management Investment Advisers, LLC.
Columbia Threadneedle Investments (Columbia Threadneedle) is the global brand name of the Columbia and Threadneedle group of companies. All rights reserved. Columbia Management Investment Distributors, Inc., 225 Franklin Street, Boston, MA 02110-2804
© 2017 Columbia Management Investment Advisers, LLC.
investor.columbiathreadneedleus.com
Item 2. Code of Ethics.
| | (a) | The registrant has adopted a code of ethics that applies to the registrant’s principal executive officer, principal financial officer, principal accounting officer or controller, or persons performing similar functions, regardless of whether these individuals are employed by the registrant or a third party. |
| | (b) | During the period covered by this report, there were not any amendments to a provision of the code of ethics adopted in 2(a) above. |
| | (c) | During the period covered by this report, there were no waivers, including any implicit waivers, from a provision of the code of ethics described in 2(a) above that relates to one or more of the items set forth in paragraph (b) of this item’s instructions. |
Item 3. Audit Committee Financial Expert.
The registrant’s Board of Trustees has determined that Douglas A. Hacker, David M. Moffett and Anne-Lee Verville, each of whom are members of the registrant’s Board of Trustees and Audit Committee, each qualify as an audit committee financial expert. Mr. Hacker, Mr. Moffett and Ms. Verville are each independent trustees, as defined in paragraph (a)(2) of this item’s instructions.
Item 4. Principal Accountant Fees and Services.
Fee information below is disclosed for the fourteen series of the registrant whose reports to shareholders are included in this annual filing. One of the registrant’s series, Columbia Value and Restructuring Fund, merged into another series on June 24, 2016 and the fees incurred by this series through its merger date are included in the response to this Item. One of the registrant’s series, Columbia Strategic Income Fund, changed its fiscal year end to August 31 from October 31 effective August 31, 2017. Fee information for this series is for the ten month period ended August 31, 2017 and the year ended October 31, 2016.
(a) Audit Fees. Aggregate Audit Fees billed by the principal accountant for professional services rendered during the fiscal years ended August 31, 2017 and August 31, 2016 are approximately as follows:
| | |
| 2017 | | 2016 |
| $459,700 | | $417,700 |
Audit Fees include amounts related to the audit of the registrant’s annual financial statements or services that are normally provided by the accountant in connection with statutory and regulatory filings or engagements for those fiscal years.
(b) Audit-Related Fees. Aggregate Audit-Related Fees billed to the registrant by the principal accountant for professional services rendered during the fiscal years ended August 31, 2017 and August 31, 2016 are approximately as follows:
Audit-Related Fees include amounts for assurance and related services by the principal accountant that are reasonably related to the performance of the audit of the registrant’s financial statements and are not reported in Audit Fees above. In fiscal years 2017 and 2016, Audit-Related Fees consist of agreed-upon procedures performed for semi-annual shareholder reports. Fiscal year 2016 also includes Audit-Related Fees for agreed upon procedures for a fund merger and issuance of consent related to N-14 filings.
During the fiscal years ended August 31, 2017 and August 31, 2016, there were no Audit-Related Fees billed by the registrant’s principal accountant to the registrant’s investment adviser (not including any sub-adviser whose role is primarily portfolio management and is subcontracted with or overseen by another investment adviser) and any entity controlling, controlled by, or under common control with the adviser that provides ongoing services to the registrant for an engagement that related directly to the operations and financial reporting of the registrant.
(c) Tax Fees. Aggregate Tax Fees billed by the principal accountant to the registrant for professional services rendered during the fiscal years ended August 31, 2017 and August 31, 2016 are approximately as follows:
| | |
| 2017 | | 2016 |
| $111,700 | | $103,000 |
Tax Fees include amounts for the review of annual tax returns, the review of required shareholder distribution calculations and typically include amounts for professional services by the principal accountant for tax compliance, tax advice and tax planning. Fiscal year 2016 also includes Tax Fees for agreed-upon procedures related to a fund merger and a final tax return. Fiscal years 2017 and 2016 include Tax Fees for foreign tax filings.
During the fiscal years ended August 31, 2017 and August 31, 2016, there were no Tax Fees billed by the registrant’s principal accountant to the registrant’s investment adviser (not including any sub-adviser whose role is primarily portfolio management and is subcontracted with or overseen by another investment adviser) and any entity controlling, controlled by, or under common control with the adviser that provides ongoing services to the registrant for an engagement that related directly to the operations and financial reporting of the registrant.
(d) All Other Fees. Aggregate All Other Fees billed by the principal accountant to the registrant for professional services rendered during the fiscal years ended August 31, 2017 and August 31, 2016 are approximately as follows:
All Other Fees include amounts for products and services provided by the principal accountant, other than the services reported in paragraphs (a) through (c) above.
Aggregate All Other Fees billed by the registrant’s principal accountant to the registrant’s investment adviser (not including any sub-adviser whose role is primarily portfolio management and is subcontracted with or overseen by another investment adviser) and any entity controlling, controlled by, or under common control with the adviser that provides ongoing services to the registrant for an engagement that related directly to the operations and financial reporting of the registrant during the fiscal years ended August 31, 2017 and August 31, 2016 are approximately as follows:
| | |
| 2017 | | 2016 |
| $242,500 | | $242,500 |
In fiscal years 2017 and 2016, All Other Fees primarily consists of fees billed for internal control examinations of the registrant’s transfer agent and investment adviser.
(e)(1) Audit Committee Pre-Approval Policies and Procedures
The registrant’s Audit Committee is required to pre-approve the engagement of the registrant’s independent auditors to provide audit and non-audit services to the registrant and non-audit services to its investment adviser (excluding any sub-adviser whose role is primarily portfolio management and is sub-contracted or overseen by another investment adviser (the “Adviser”) or any entity controlling, controlled by or under common control with the Adviser that provides ongoing services to the Fund (a “Control Affiliate”) if the engagement relates directly to the operations and financial reporting of the registrant.
The Audit Committee has adopted a Policy for Engagement of Independent Auditors for Audit and Non-Audit Services (the “Policy”). The Policy sets forth the understanding of the Audit Committee regarding the engagement of the registrant’s independent accountants to provide (i) audit and permissible audit-related, tax and other services to the registrant (“Fund Services”); (ii) non-audit services to the registrant’s Adviser and any Control Affiliates, that relates directly to the operations and financial reporting of a Fund (“Fund-related Adviser Services”); and (iii) certain other audit and non-audit services to the registrant’s Adviser and its Control Affiliates. A service will require specific pre-approval by the Audit Committee if it is to be provided by the Fund’s independent auditor; provided, however, that pre-approval of non-audit services to the Fund, the Adviser or Control Affiliates may be waived if certain de minimis requirements set forth in the SEC’s rules are met.
Under the Policy, the Audit Committee may delegate pre-approval authority to any pre-designated member or members who are independent board members. The member(s) to whom such authority is delegated must report, for informational purposes only, any pre-approval decisions to the Audit Committee at its next regular meeting. The Audit Committee’s responsibilities with respect to the pre-approval of services performed by the independent auditor may not be delegated to management.
On an annual basis, at a regularly scheduled Audit Committee meeting, the Fund’s Treasurer or other Fund officer shall submit to the Audit Committee a schedule of the types of Fund Services and Fund-related Adviser Services that are subject to specific pre-approval. This schedule will provide a description of each type of service that is subject to specific pre-approval, along with total projected fees for each service. The pre-approval will generally cover a one-year period. The Audit Committee will review and approve the types of services and the projected fees for the next one-year period and may add to, or subtract from, the list of pre-approved services from time to time, based on subsequent determinations. This specific approval acknowledges that the Audit Committee is in agreement with the specific types of services that the independent auditor will be permitted to perform and the projected fees for each service.
The Fund’s Treasurer or other Fund officer shall report to the Audit Committee at each of its regular meetings regarding all Fund Services or Fund-related Adviser Services provided since the last such report was rendered, including a description of the services, by category, with forecasted fees for the annual reporting period, proposed changes requiring specific pre-approval and a description of services provided by the independent auditor, by category, with actual fees during the current reporting period.
*****
(e)(2) 100% of the services performed for items (b) through (d) above during 2017 and 2016 were pre-approved by the registrant’s Audit Committee.
(f) Not applicable.
(g) The aggregate non-audit fees billed by the registrant’s accountant for services rendered to the registrant, and rendered to the registrant’s investment adviser (not including any sub-adviser whose role is primarily portfolio management and is subcontracted with or overseen by another investment adviser), and any entity controlling, controlled by, or under common control with the adviser that provides ongoing services to the registrant during the fiscal years ended August 31, 2017 and August 31, 2016 are approximately as follows:
| | |
| 2017 | | 2016 |
| $359,800 | | $361,000 |
(h) The registrant’s Audit Committee of the Board of Directors has considered whether the provision of non-audit services that were rendered to the registrant’s adviser (not including any sub-adviser whose role is primarily portfolio management and is
subcontracted with or overseen by another investment adviser), and any entity controlling, controlled by, or under common control with the investment adviser that provides ongoing services to the registrant that were not pre-approved pursuant to paragraph (c)(7)(ii) of Rule 2-01 of Regulation S-X, is compatible with maintaining the principal accountant’s independence.
Item 5. Audit Committee of Listed Registrants.
Not applicable.
Item 6. Investments
| | (a) | The registrant’s “Schedule I – Investments in securities of unaffiliated issuers” (as set forth in 17 CFR 210.12-12) is included in Item 1 of this Form N-CSR. |
Item 7. Disclosure of Proxy Voting Policies and Procedures for Closed-End Management Investment Companies.
Not applicable.
Item 8. Portfolio Managers of Closed-End Management Investment Companies.
Not applicable.
Item 9. Purchases of Equity Securities by Closed-End Management Investment Company and Affiliated Purchasers.
Not applicable.
Item 10. Submission of Matters to a Vote of Security Holders.
There were no material changes to the procedures by which shareholders may recommend nominees to the registrant’s board of directors.
Item 11. Controls and Procedures.
| | (a) | The registrant’s principal executive officer and principal financial officers, based on their evaluation of the registrant’s disclosure controls and procedures as of a date within 90 days of the filing of this report, have concluded that such controls and procedures are adequately designed to ensure that material information required to be disclosed by the registrant in Form N-CSR is accumulated and communicated to the registrant’s management, including the principal executive officer and principal financial officer, or persons performing similar functions, as appropriate to allow timely decisions regarding required disclosure. |
| | (b) | There was no change in the registrant’s internal control over financial reporting that occurred during the registrant’s second fiscal quarter of the period covered by this report that has materially affected, or is reasonably likely to materially affect, the registrant’s internal control over financial reporting. |
Item 12. Exhibits.
(a)(1) Code of ethics required to be disclosed under Item 2 of Form N-CSR attached hereto as Exhibit 99.CODE ETH.
(a)(2) Certifications pursuant to Rule 30a-2(a) under the Investment Company Act of 1940 (17 CFR 270.30a-2(a)) attached hereto as Exhibit 99.CERT.
(a)(3) Not applicable.
(b) Certification pursuant to Rule 30a-2(b) under the Investment Company Act of 1940 (17 CFR 270.30a-2(b)) attached hereto as Exhibit 99.906CERT.
SIGNATURES
Pursuant to the requirements of the Securities Exchange Act of 1934 and the Investment Company Act of 1940, the registrant has duly caused this report to be signed on its behalf by the undersigned, thereunto duly authorized.
| | | | |
| (registrant) | | | | Columbia Funds Series Trust I |
| | |
| By (Signature and Title) | | /s/ Christopher O. Petersen |
| | Christopher O. Petersen, President and Principal Executive Officer |
Pursuant to the requirements of the Securities Exchange Act of 1934 and the Investment Company Act of 1940, this report has been signed below by the following persons on behalf of the registrant and in the capacities and on the dates indicated.
| | |
| By (Signature and Title) | | /s/ Christopher O. Petersen |
| | Christopher O. Petersen, President and Principal Executive Officer |
| | |
| By (Signature and Title) | | /s/ Michael G. Clarke |
| | Michael G. Clarke, Treasurer and Chief Financial Officer |