UNITED STATES
SECURITIES AND EXCHANGE COMMISSION
Washington, D.C. 20549
FORM N-CSR
CERTIFIED SHAREHOLDER REPORT OF REGISTERED
MANAGEMENT INVESTMENT COMPANIES
Investment Company Act file number 811-04367
Columbia Funds Series Trust I
(Exact name of registrant as specified in charter)
225 Franklin Street
Boston, Massachusetts 02110
(Address of principal executive offices) (Zip code)
Ryan Larrenaga
c/o Columbia Management Investment Advisers, LLC
225 Franklin Street
Boston, MA 02110
(Name and address of agent for service)
Registrant’s telephone number, including area code: (800) 345-6611
Date of fiscal year end: May 31
Date of reporting period: May 31, 2017
Form N-CSR is to be used by management investment companies to file reports with the Commission not later than 10 days after the transmission to stockholders of any report that is required to be transmitted to stockholders under Rule 30e-1 under the Investment Company Act of 1940 (17 CFR 270.30e-1). The Commission may use the information provided on Form N-CSR in its regulatory, disclosure review, inspection, and policymaking roles.
A registrant is required to disclose the information specified by Form N-CSR, and the Commission will make this information public. A registrant is not required to respond to the collection of information contained in Form N-CSR unless the Form displays a currently valid Office of Management and Budget (“OMB”) control number. Please direct comments concerning the accuracy of the information collection burden estimate and any suggestions for reducing the burden to Secretary, Securities and Exchange Commission, 450 Fifth Street, NW, Washington, DC 20549-0609. The OMB has reviewed this collection of information under the clearance requirements of 44 U.S.C. § 3507.
Item 1. Reports to Stockholders.

Annual Report
May 31, 2017
Columbia Dividend Income Fund
Not FDIC Insured • No bank guarantee • May lose value
Dear Shareholders,
The current outlook for financial markets is clouded by two primary concerns: the high valuation of equities and the direction of interest rates. Following the U.S. presidential election, U.S. equities rallied based on the assumption that the new administration’s policies would stimulate growth quickly. Unfortunately it’s unclear whether those measures will get passed, much less passed quickly. In fixed income, uncertainty stems from the possibility that interest rates won’t rise as rapidly as expected if the administration’s proposed growth policies are not implemented.
Given this uncertainty, investors value a consistent approach more than ever. Investors want strong, repeatable risk-adjusted returns. Consistency — not surprises. As a leading global asset manager, we believe our consistent, collaborative investment approach enables us to deliver the dependable experience your portfolio demands. So, how do we strive to deliver a consistent investment experience?
Better insights
Your portfolio benefits from the investment insights uncovered by our talented investment teams around the world.
Better decisions
Our collaborative, interactive environment enables our investment teams to construct portfolios that take advantage of the best investment ideas.
Better outcomes
We aim to deliver a consistent experience, which means fewer surprises, dependable insights, and products designed to do the thing you want.
Whether you’re trying to save money to help your children go to college or for your own retirement, it’s the consistency of the return that is most essential. People who chase higher returns are usually also the first to sell when that investment goes through a bad patch. We try to combat this behavioral tendency by offering strategies that aim for a more consistent return. Our goal is for investors to panic less during periods of volatility, which can have a significant effect on their long-term results.
Nothing is more important to us than making sure those who have entrusted us to protect and grow their assets can do what matters most to them: build a nest egg, leave a legacy, and live confidently — now and throughout retirement. It’s why our talented professionals around the world work together to uncover uncommon opportunities and why our process encourages challenge and debate around our most compelling ideas to ensure better informed investment decisions, which hopefully lead to better outcomes for you.
Your success is our priority. Talk to your financial advisor about how working with Columbia Threadneedle Investments may help you position your portfolio for consistent, sustainable outcomes, no matter the market conditions.
Sincerely,
Christopher O. Petersen
President, Columbia Funds
There is no guarantee that investment objectives will be achieved or that any particular investment will be profitable.
Columbia Funds are distributed by Columbia Management Investment Distributors, Inc., member FINRA, and managed by Columbia Management Investment Advisers, LLC.
© 2017 Columbia Management Investment Advisers, LLC. All rights reserved.
Columbia Dividend Income Fund | Annual Report 2017
Columbia Dividend Income Fund | Annual Report 2017
Investment objective
Columbia Dividend Income Fund (the Fund) seeks total return, consisting of current income and capital appreciation.
Portfolio management
Scott Davis
Lead manager
Managed Fund since 2001
Michael Barclay, CFA
Co-manager
Managed Fund since 2011
Peter Santoro, CFA
Co-manager
Managed Fund since 2014
Morningstar style boxTM
The Morningstar Style Box is based on a fund’s portfolio holdings. For equity funds, the vertical axis shows the market capitalization of the stocks owned, and the horizontal axis shows investment style (value, blend, or growth). Information shown is based on the most recent data provided by Morningstar.
© 2017 Morningstar, Inc. All rights reserved. The Morningstar information contained herein: (1) is proprietary to Morningstar and/or its content providers; (2) may not be copied or distributed; and (3) is not warranted to be accurate, complete or timely. Neither Morningstar nor its content providers are responsible for any damages or losses arising from any use of this information.
| Average annual total returns (%) (for the period ended May 31, 2017) |
| | | Inception | 1 Year | 5 Years | 10 Years |
| Class A | Excluding sales charges | 11/25/02 | 15.52 | 13.63 | 6.92 |
| | Including sales charges | | 8.91 | 12.29 | 6.29 |
| Class B | Excluding sales charges | 11/25/02 | 14.72 | 12.78 | 6.12 |
| | Including sales charges | | 9.72 | 12.53 | 6.12 |
| Class C | Excluding sales charges | 11/25/02 | 14.73 | 12.78 | 6.12 |
| | Including sales charges | | 13.73 | 12.78 | 6.12 |
| Class R * | 03/28/08 | 15.29 | 13.36 | 6.67 |
| Class R4 * | 11/08/12 | 15.89 | 13.93 | 7.20 |
| Class R5 * | 11/08/12 | 15.92 | 14.05 | 7.26 |
| Class T * | Excluding sales charges | 09/27/10 | 15.53 | 13.62 | 6.94 |
| | Including sales charges | | 12.66 | 13.05 | 6.67 |
| Class V | Excluding sales charges | 03/04/98 | 15.58 | 13.61 | 6.89 |
| | Including sales charges | | 8.96 | 12.27 | 6.25 |
| Class Y * | 11/08/12 | 16.03 | 14.10 | 7.28 |
| Class Z | 03/04/98 | 15.79 | 13.91 | 7.19 |
| Russell 1000 Index | | 17.48 | 15.37 | 7.01 |
Returns for Class A and Class V are shown with and without the maximum initial sales charge of 5.75%. Prior to January 24, 2017, Class V shares were known as Class T shares. Class V shares have no relation to, or connection with, the Fund’s current Class T shares which were renamed and re-designated from Class W shares effective March 27, 2017. Returns for Class B are shown with and without the applicable contingent deferred sales charge (CDSC) of 5.00% in the first year, declining to 1.00% in the sixth year and eliminated thereafter. As of May 31, 2017, the Fund’s Class B investors, having held their shares for the requisite time period, were no longer subject to a CDSC upon redemption of their shares. Effective July 17, 2017, Class B shares were automatically converted to Class A shares and the Fund no longer accepts investments by new or existing investors in Class B shares. Returns for Class C are shown with and without the 1.00% CDSC for the first year only. The returns for Class T shares are shown with and without the maximum initial sales charge of 2.50% per transaction. Prior to March 27, 2017, Class T shares were known as Class W shares and were sold without a sales charge. The Fund’s other classes are not subject to sales charges and have limited eligibility. Please see the Fund’s prospectus for details. Performance for different share classes will vary based on differences in sales charges and fees associated with each class. All results shown assume reinvestment of distributions during the period. Returns do not reflect the deduction of taxes that a shareholder may pay on Fund distributions or on the redemption of Fund shares. Performance results reflect the effect of any fee waivers or reimbursements of Fund expenses by Columbia Management Investment Advisers, LLC and/or any of its affiliates. Absent these fee waivers or expense reimbursement arrangements, performance results would have been lower.
The performance information shown represents past performance and is not a guarantee of future results. The investment return and principal value of your investment will fluctuate so that your shares, when redeemed, may be worth more or less than their original cost. Current performance may be lower or higher than the performance information shown. You may obtain performance information current to the most recent month-end by contacting your financial intermediary, visiting investor.columbiathreadneedleus.com or calling 800.345.6611.
| * | The returns shown for periods prior to the share class inception date (including returns for the Life of the Fund, if shown, which are since Fund inception) include the returns of the Fund’s oldest share class. Since the Fund launched more than one share class at its inception, Class Z shares were used. These returns are adjusted to reflect any higher class-related operating expenses of the newer share classes, as applicable. Please visit investor.columbiathreadneedleus.com/investment-products/mutual-funds/appended-performance for more information. |
The Russell 1000 Index measures the performance of the large-cap segment of the U.S. equity universe. It is a subset of the Russell 3000 Index and includes approximately 1000 of the largest securities based on a combination of their market cap and current index membership.The Russell 1000 Index represents approximately 92% of the U.S. market.
Indices are not available for investment, are not professionally managed and do not reflect sales charges, fees, brokerage commissions, taxes or other expenses of investing. Securities in the Fund may not match those in an index.
| 2 | Columbia Dividend Income Fund | Annual Report 2017 |
Fund at a Glance (continued)
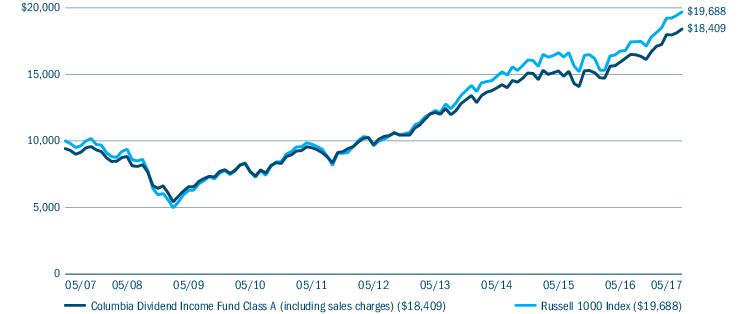
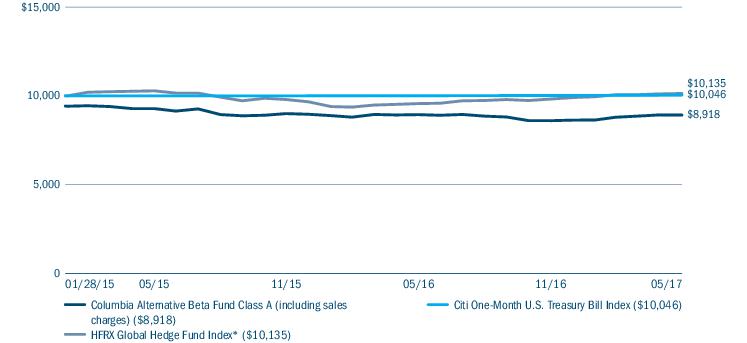
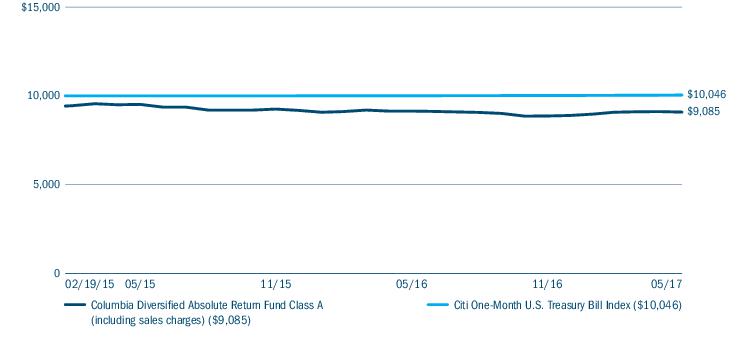
Performance of a hypothetical $10,000 investment (May 31, 2007 — May 31, 2017)
The chart above shows the change in value of a hypothetical $10,000 investment in Class A shares of Columbia Dividend Income Fund during the stated time period, and does not reflect the deduction of taxes that a shareholder may pay on Fund distributions or on the redemption of Fund shares.
| Top 10 holdings (%) (at May 31, 2017) |
| Microsoft Corp. | 4.6 |
| Johnson & Johnson | 3.4 |
| JPMorgan Chase & Co. | 3.3 |
| Apple, Inc. | 3.1 |
| Exxon Mobil Corp. | 2.8 |
| Comcast Corp., Class A | 2.8 |
| Philip Morris International, Inc. | 2.7 |
| Home Depot, Inc. (The) | 2.5 |
| Merck & Co., Inc. | 2.5 |
| General Dynamics Corp. | 2.2 |
Percentages indicated are based upon total investments (excluding Money Market Funds).
For further detail about these holdings, please refer to the section entitled “Portfolio of Investments.”
Fund holdings are as of the date given, are subject to change at any time, and are not recommendations to buy or sell any security.
| Portfolio breakdown (%) (at May 31, 2017) |
| Common Stocks | 96.6 |
| Convertible Preferred Stocks | 0.2 |
| Exchange-Traded Funds | 0.7 |
| Money Market Funds | 2.5 |
| Total | 100.0 |
Percentages indicated are based upon total investments. The Fund’s portfolio composition is subject to change.
| Equity sector breakdown (%) (at May 31, 2017) |
| Consumer Discretionary | 10.0 |
| Consumer Staples | 12.2 |
| Energy | 5.4 |
| Financials | 16.8 |
| Health Care | 11.3 |
| Industrials | 15.1 |
| Information Technology | 16.1 |
| Materials | 2.2 |
| Real Estate | 3.5 |
| Telecommunication Services | 2.3 |
| Utilities | 5.1 |
| Total | 100.0 |
Percentages indicated are based upon total equity investments. The Fund’s portfolio composition is subject to change.
Columbia Dividend Income Fund | Annual Report 2017
| 3 |
Manager Discussion of Fund Performance
For the 12-month period that ended May 31, 2017, the Fund’s Class A shares returned 15.52% excluding sales charges. The Fund underperformed its benchmark, the Russell 1000 Index, which returned 17.48% over the same period. An underweight in information technology, where the Fund could not own many of the top performers because they do not pay dividends, generally accounted for the shortfall relative to the benchmark. Overall, stock selection was strong and the Fund delivered solid absolute gains for the period.
U.S. equity markets logged solid gains
Global events, political uncertainty and mixed economic data were enough to keep investors off balance during the first half of the 12-month period, as financial markets moved sharply in reaction to each significant change on the world stage. However, the end of a contentious U.S. presidential contest eliminated a key element of uncertainty, and the U.S. equity markets moved solidly higher in the second half of the period. Positive economic data, steady job growth, rising corporate earnings and accelerated manufacturing activity further bolstered investor confidence. Against this backdrop, information technology stocks were the market’s top performers.
In December 2016, the Federal Reserve (the Fed) raised the target range of its benchmark interest rate by a quarter of a point to between 0.50% and 0.75%, its first such move in a year. In March 2017, the Fed again raised the target short-term interest rate to between 0.75% and 1.00%. The Fed signaled that it was prepared to raise rates more aggressively in 2017 on the heels of strong job gains and progress towards its 2.0% inflation target. After the Fed’s May meeting, Bloomberg estimated the probability of a June rate hike at 97.5%.
Contributors and detractors
On a sector basis, industrials, consumer discretionary and health care were the strongest performers for the Fund relative to the benchmark. In the industrials sector, overweights in aerospace and defense contractors General Dynamics and Lockheed Martin aided results. Both companies benefited as defense spending emerged from sequestration. Lockheed Martin has contracted to build a new fighter jet and the submarine business has been a stalwart for General Dynamics. Within industrials, we did well to sell General Electric (GE) in the third quarter of 2016. By the end of the period, GE shares were well below where we sold them. In the consumer discretionary sector, Comcast and Time Warner were top contributors to Fund results. Comcast continued to execute well, growing its customer base and adding customers on the data side. Time Warner is set to be acquired by AT&T at a premium, which boosted its share price. We also did well to avoid some of the blow-ups in the sector, especially among retailers, which continued to struggle against online competition. In the health care sector, we avoided the meltdown in biotechnology, which weighed on the sector. An overweight position in Merck aided relative results, which gained ground on positive news of its lung cancer drug Keytruda.
Even though the Fund lagged the benchmark in information technology — it could not invest in the benchmark’s top performers because they do not pay dividends — returns from technology holdings were solid and two of the Fund’s top performers were technology stocks: Lam Research and Microsoft. Lam Research benefited from the strong business fundamentals surrounding memory pricing. In the fourth quarter of 2016, Lam Research formally abandoned its planned merger with a competitor, which had raised antitrust concerns. Investors welcomed the removal of the overhang of uncertainty. Microsoft is a leader in cloud computing, which has produced solid results since the appointment of Satya Nadella to CEO in February of 2014.
An overweight in energy was a drag on relative performance as the sector was one of two sectors with a negative return for the period. The Fund’s exposure to ExxonMobil was greater than the benchmark’s, which amplified the impact of its decline on relative results. That said, ExxonMobil held up better than many energy names with greater exposure to declining commodity prices. CVS was the biggest individual disappointment for the Fund during the period. The company lost two major contracts and concerns about pharmaceutical pricing also weighed on the stocks. Elsewhere in the portfolio, a significant position in self-storage real estate investment trust (REIT) Public Storage detracted from relative returns as its shares lost ground. However, we continued to believe that Public Storage’s business prospects remained solid with its 95% occupancy rate.
| 4 | Columbia Dividend Income Fund | Annual Report 2017 |
Manager Discussion of Fund Performance (continued)
Some final thoughts
During the period, we believed the U.S. economy was stronger than it appeared in the headlines, with decent corporate earnings, solid job growth and a sense of optimism about company prospects. Against that backdrop, we continued to identify high quality companies with healthy free cash flow and attractive dividend payments. Regardless of the environment, we continue to believe in the Fund’s relatively conservative process, which pays careful attention to risk while seeking to capitalize on opportunity over the longer term.
Market risk may affect a single issuer, sector of the economy, industry or the market as a whole. Value securities may be unprofitable if the market fails to recognize their intrinsic worth or the portfolio manager misgauged that worth. Foreign investments subject the Fund to risks, including political, economic, market, social and others within a particular country, as well as to currency instabilities and less stringent financial and accounting standards generally applicable to U.S. issuers. Dividend payments are not guaranteed and the amount, if any, can vary over time. A rise in interest rates may result in a price decline of fixed-income instruments held by the Fund, negatively impacting its performance and NAV. Falling rates may result in the Fund investing in lower yielding debt instruments, lowering the Fund’s income and yield. These risks may be heightened for longer maturity and duration securities. The Fund may invest significantly in issuers within a particular sector, which may be negatively affected by market, economic or other conditions, making the Fund more vulnerable to unfavorable developments in the sector. See the Fund’s prospectus for more information on these and other risks.
The views expressed in this report reflect the current views of the respective parties. These views are not guarantees of future performance and involve certain risks, uncertainties and assumptions that are difficult to predict, so actual outcomes and results may differ significantly from the views expressed. These views are subject to change at any time based upon economic, market or other conditions and the respective parties disclaim any responsibility to update such views. These views may not be relied on as investment advice and, because investment decisions for a Columbia fund are based on numerous factors, may not be relied on as an indication of trading intent on behalf of any particular Columbia fund. References to specific securities should not be construed as a recommendation or investment advice.
Columbia Dividend Income Fund | Annual Report 2017
| 5 |
Understanding Your Fund’s Expenses
(Unaudited)
As an investor, you incur two types of costs. There are transaction costs, which generally include sales charges on purchases and may include redemption fees. There are also ongoing costs, which generally include management fees, distribution and/or service fees, and other fund expenses. The following information is intended to help you understand your ongoing costs (in dollars) of investing in the Fund and to help you compare these costs with the ongoing costs of investing in other mutual funds.
Analyzing your Fund’s expenses
To illustrate these ongoing costs, we have provided examples and calculated the expenses paid by investors in each share class of the Fund during the period. The actual and hypothetical information in the table is based on an initial investment of $1,000 at the beginning of the period indicated and held for the entire period. Expense information is calculated two ways and each method provides you with different information. The amount listed in the “Actual” column is calculated using the Fund’s actual operating expenses and total return for the period. You may use the Actual information, together with the amount invested, to estimate the expenses that you paid over the period. Simply divide your account value by $1,000 (for example, an $8,600 account value divided by $1,000 = 8.6), then multiply the results by the expenses paid during the period under the “Actual” column. The amount listed in the “Hypothetical” column assumes a 5% annual rate of return before expenses (which is not the Fund’s actual return) and then applies the Fund’s actual expense ratio for the period to the hypothetical return. You should not use the hypothetical account values and expenses to estimate either your actual account balance at the end of the period or the expenses you paid during the period. See “Compare with other funds” below for details on how to use the hypothetical data.
Compare with other funds
Since all mutual funds are required to include the same hypothetical calculations about expenses in shareholder reports, you can use this information to compare the ongoing cost of investing in the Fund with other funds. To do so, compare the hypothetical example with the 5% hypothetical examples that appear in the shareholder reports of other funds. As you compare hypothetical examples of other funds, it is important to note that hypothetical examples are meant to highlight the ongoing costs of investing in a fund only and do not reflect any transaction costs, such as sales charges, or redemption or exchange fees. Therefore, the hypothetical calculations are useful in comparing ongoing costs only, and will not help you determine the relative total costs of owning different funds. If transaction costs were included in these calculations, your costs would be higher.
| December 1, 2016 — May 31, 2017 |
| | Account value at the
beginning of the
period ($) | Account value at the
end of the
period ($) | Expenses paid during
the period ($) | Fund’s annualized
expense ratio (%) |
| | Actual | Hypothetical | Actual | Hypothetical | Actual | Hypothetical | Actual |
| Class A | 1,000.00 | 1,000.00 | 1,102.50 | 1,020.00 | 5.19 | 4.99 | 0.99 |
| Class B | 1,000.00 | 1,000.00 | 1,098.70 | 1,016.26 | 9.10 | 8.75 | 1.74 |
| Class C | 1,000.00 | 1,000.00 | 1,098.80 | 1,016.21 | 9.16 | 8.80 | 1.75 |
| Class R | 1,000.00 | 1,000.00 | 1,101.60 | 1,018.70 | 6.55 | 6.29 | 1.25 |
| Class R4 | 1,000.00 | 1,000.00 | 1,104.20 | 1,021.19 | 3.93 | 3.78 | 0.75 |
| Class R5 | 1,000.00 | 1,000.00 | 1,104.40 | 1,021.74 | 3.36 | 3.23 | 0.64 |
| Class T (formerly Class W) | 1,000.00 | 1,000.00 | 1,102.50 | 1,020.00 | 5.19 | 4.99 | 0.99 |
| Class V (formerly Class T) | 1,000.00 | 1,000.00 | 1,102.40 | 1,019.95 | 5.24 | 5.04 | 1.00 |
| Class Y | 1,000.00 | 1,000.00 | 1,104.60 | 1,021.99 | 3.10 | 2.97 | 0.59 |
| Class Z | 1,000.00 | 1,000.00 | 1,103.70 | 1,021.19 | 3.93 | 3.78 | 0.75 |
Expenses paid during the period are equal to the annualized expense ratio for each class as indicated above, multiplied by the average account value over the period and then multiplied by the number of days in the Fund’s most recent fiscal half year and divided by 365.
Expenses do not include fees and expenses incurred indirectly by the Fund from its investment in underlying funds, including affiliated and non-affiliated pooled investment vehicles, such as mutual funds and exchange-traded funds.
The Fund’s annualized expense ratio excludes the impact of an expense reimbursement from a third party due to overbilling.
| 6 | Columbia Dividend Income Fund | Annual Report 2017 |
Portfolio of Investments
May 31, 2017
(Percentages represent value of investments compared to net assets)
| Common Stocks 96.5% |
| Issuer | Shares | Value ($) |
| Consumer Discretionary 9.7% |
| Distributors 0.5% |
| Genuine Parts Co. | 580,000 | 53,719,600 |
| Hotels, Restaurants & Leisure 1.0% |
| McDonald’s Corp. | 675,500 | 101,926,195 |
| Media 5.0% |
| Comcast Corp., Class A | 6,657,600 | 277,555,344 |
| Interpublic Group of Companies, Inc. (The) | 2,010,000 | 50,109,300 |
| Time Warner, Inc. | 1,326,000 | 131,923,740 |
| Walt Disney Co. (The) | 487,550 | 52,626,147 |
| Total | | 512,214,531 |
| Specialty Retail 3.2% |
| Home Depot, Inc. (The) | 1,671,000 | 256,515,210 |
| TJX Companies, Inc. (The) | 1,003,746 | 75,491,737 |
| Total | | 332,006,947 |
| Total Consumer Discretionary | 999,867,273 |
| Consumer Staples 11.8% |
| Beverages 2.4% |
| Coca-Cola European Partners PLC | 1,228,000 | 50,397,120 |
| PepsiCo, Inc. | 1,688,840 | 197,374,731 |
| Total | | 247,771,851 |
| Food & Staples Retailing 2.0% |
| CVS Health Corp. | 1,249,868 | 96,027,358 |
| Wal-Mart Stores, Inc. | 1,361,650 | 107,025,690 |
| Total | | 203,053,048 |
| Food Products 0.9% |
| General Mills, Inc. | 1,570,000 | 89,081,800 |
| Household Products 1.8% |
| Kimberly-Clark Corp. | 610,000 | 79,135,300 |
| Procter & Gamble Co. (The) | 1,260,000 | 110,993,400 |
| Total | | 190,128,700 |
| Tobacco 4.7% |
| Altria Group, Inc. | 2,900,000 | 218,776,000 |
| Philip Morris International, Inc. | 2,230,000 | 267,154,000 |
| Total | | 485,930,000 |
| Total Consumer Staples | 1,215,965,399 |
| Common Stocks (continued) |
| Issuer | Shares | Value ($) |
| Energy 5.1% |
| Oil, Gas & Consumable Fuels 5.1% |
| Chevron Corp. | 1,220,000 | 126,245,600 |
| Exxon Mobil Corp. | 3,500,000 | 281,750,000 |
| Suncor Energy, Inc. | 1,700,000 | 53,227,000 |
| Valero Energy Corp. | 1,042,000 | 64,051,740 |
| Total | | 525,274,340 |
| Total Energy | 525,274,340 |
| Financials 16.2% |
| Banks 8.7% |
| Bank of America Corp. | 4,625,000 | 103,646,250 |
| BB&T Corp. | 1,700,000 | 70,805,000 |
| JPMorgan Chase & Co. | 4,020,000 | 330,243,000 |
| PNC Financial Services Group, Inc. (The) | 1,312,825 | 155,832,327 |
| U.S. Bancorp | 2,162,000 | 110,024,180 |
| Wells Fargo & Co. | 2,501,425 | 127,922,875 |
| Total | | 898,473,632 |
| Capital Markets 4.1% |
| BlackRock, Inc. | 320,550 | 131,181,882 |
| CME Group, Inc. | 1,190,000 | 139,575,100 |
| Northern Trust Corp. | 1,036,000 | 90,587,840 |
| T. Rowe Price Group, Inc. | 950,000 | 66,918,000 |
| Total | | 428,262,822 |
| Insurance 3.4% |
| Chubb Ltd. | 1,280,000 | 183,283,200 |
| Marsh & McLennan Companies, Inc. | 2,192,000 | 170,011,520 |
| Total | | 353,294,720 |
| Total Financials | 1,680,031,174 |
| Health Care 10.9% |
| Biotechnology 1.0% |
| AbbVie, Inc. | 1,600,000 | 105,632,000 |
| Health Care Equipment & Supplies 0.7% |
| Medtronic PLC | 822,800 | 69,345,584 |
| Health Care Providers & Services 0.8% |
| Aetna, Inc. | 186,800 | 27,059,848 |
| UnitedHealth Group, Inc. | 338,500 | 59,298,430 |
| Total | | 86,358,278 |
The accompanying Notes to Financial Statements are an integral part of this statement.
Columbia Dividend Income Fund | Annual Report 2017
| 7 |
Portfolio of Investments (continued)
May 31, 2017
| Common Stocks (continued) |
| Issuer | Shares | Value ($) |
| Pharmaceuticals 8.4% |
| Bristol-Myers Squibb Co. | 760,000 | 41,002,000 |
| Eli Lilly & Co. | 575,000 | 45,752,750 |
| Johnson & Johnson | 2,680,000 | 343,710,000 |
| Merck & Co., Inc. | 3,800,000 | 247,418,000 |
| Pfizer, Inc. | 5,895,000 | 192,471,750 |
| Total | | 870,354,500 |
| Total Health Care | 1,131,690,362 |
| Industrials 14.6% |
| Aerospace & Defense 5.3% |
| Boeing Co. (The) | 344,491 | 64,636,846 |
| General Dynamics Corp. | 1,090,000 | 221,542,500 |
| Lockheed Martin Corp. | 732,100 | 205,815,273 |
| United Technologies Corp. | 495,300 | 60,069,984 |
| Total | | 552,064,603 |
| Air Freight & Logistics 0.6% |
| United Parcel Service, Inc., Class B | 607,719 | 64,399,983 |
| Commercial Services & Supplies 0.9% |
| Waste Management, Inc. | 1,363,171 | 99,388,798 |
| Industrial Conglomerates 3.5% |
| 3M Co. | 700,000 | 143,129,000 |
| Honeywell International, Inc. | 1,640,000 | 218,103,600 |
| Total | | 361,232,600 |
| Machinery 2.8% |
| Cummins, Inc. | 334,359 | 52,728,414 |
| Ingersoll-Rand PLC | 786,000 | 70,425,600 |
| Parker-Hannifin Corp. | 522,500 | 82,278,075 |
| Stanley Black & Decker, Inc. | 588,000 | 80,932,320 |
| Total | | 286,364,409 |
| Road & Rail 1.5% |
| Union Pacific Corp. | 1,376,551 | 151,833,575 |
| Total Industrials | 1,515,283,968 |
| Information Technology 15.6% |
| Communications Equipment 1.8% |
| Cisco Systems, Inc. | 5,830,000 | 183,819,900 |
| IT Services 1.2% |
| Automatic Data Processing, Inc. | 1,220,000 | 124,891,400 |
| Common Stocks (continued) |
| Issuer | Shares | Value ($) |
| Semiconductors & Semiconductor Equipment 5.1% |
| Broadcom Ltd. | 642,497 | 153,865,181 |
| Intel Corp. | 2,860,000 | 103,274,600 |
| Lam Research Corp. | 850,000 | 131,894,500 |
| Texas Instruments, Inc. | 1,642,500 | 135,489,825 |
| Total | | 524,524,106 |
| Software 4.5% |
| Microsoft Corp. | 6,685,000 | 466,880,400 |
| Technology Hardware, Storage & Peripherals 3.0% |
| Apple, Inc. | 2,066,556 | 315,687,095 |
| Total Information Technology | 1,615,802,901 |
| Materials 2.1% |
| Chemicals 1.3% |
| Dow Chemical Co. (The) | 1,612,735 | 99,925,061 |
| LyondellBasell Industries NV, Class A | 475,000 | 38,247,000 |
| Total | | 138,172,061 |
| Containers & Packaging 0.8% |
| International Paper Co. | 468,398 | 24,768,886 |
| Sonoco Products Co. | 1,146,000 | 58,113,660 |
| Total | | 82,882,546 |
| Total Materials | 221,054,607 |
| Real Estate 3.4% |
| Equity Real Estate Investment Trusts (REITS) 3.4% |
| American Tower Corp. | 250,000 | 32,797,500 |
| AvalonBay Communities, Inc. | 111,997 | 21,418,306 |
| Crown Castle International Corp. | 377,500 | 38,372,875 |
| Digital Realty Trust, Inc. | 517,000 | 61,104,230 |
| Duke Realty Corp. | 1,206,500 | 34,590,355 |
| Equity LifeStyle Properties, Inc. | 339,775 | 28,677,010 |
| Essex Property Trust, Inc. | 143,400 | 36,842,328 |
| Public Storage | 439,700 | 94,689,395 |
| Total | | 348,491,999 |
| Total Real Estate | 348,491,999 |
The accompanying Notes to Financial Statements are an integral part of this statement.
| 8 | Columbia Dividend Income Fund | Annual Report 2017 |
Portfolio of Investments (continued)
May 31, 2017
| Common Stocks (continued) |
| Issuer | Shares | Value ($) |
| Telecommunication Services 2.2% |
| Diversified Telecommunication Services 2.2% |
| AT&T, Inc. | 2,837,817 | 109,341,089 |
| Verizon Communications, Inc. | 2,548,526 | 118,863,253 |
| Total | | 228,204,342 |
| Total Telecommunication Services | 228,204,342 |
| Utilities 4.9% |
| Electric Utilities 2.5% |
| American Electric Power Co., Inc. | 892,500 | 64,063,650 |
| Eversource Energy | 1,049,500 | 65,142,465 |
| NextEra Energy, Inc. | 525,000 | 74,256,000 |
| PG&E Corp. | 848,225 | 58,001,625 |
| Total | | 261,463,740 |
| Multi-Utilities 2.4% |
| CMS Energy Corp. | 1,605,000 | 76,093,050 |
| Dominion Energy, Inc. | 705,000 | 56,942,850 |
| Sempra Energy | 438,000 | 51,022,620 |
| WEC Energy Group, Inc. | 1,042,500 | 65,427,300 |
| Total | | 249,485,820 |
| Total Utilities | 510,949,560 |
Total Common Stocks
(Cost $6,284,915,408) | 9,992,615,925 |
| Convertible Preferred Stocks 0.2% |
| Issuer | Coupon
Rate | Shares | Value ($) |
| Energy 0.2% |
| Oil, Gas & Consumable Fuels 0.2% |
| Hess Corp. | 8.000% | 291,000 | 16,322,190 |
| Total Energy | 16,322,190 |
Total Convertible Preferred Stocks
(Cost $16,428,453) | 16,322,190 |
| Exchange-Traded Funds 0.7% |
| | Shares | Value ($) |
| SPDR S&P 500 ETF Trust | 320,594 | 77,404,216 |
Total Exchange-Traded Funds
(Cost $65,690,345) | 77,404,216 |
|
| Money Market Funds 2.5% |
| | |
| Columbia Short-Term Cash Fund, 0.916%(a),(b) | 261,665,545 | 261,665,545 |
Total Money Market Funds
(Cost $261,666,251) | 261,665,545 |
Total Investments
(Cost: $6,628,700,457) | 10,348,007,876 |
| Other Assets & Liabilities, Net | | 11,388,544 |
| Net Assets | 10,359,396,420 |
Notes to Portfolio of Investments
| (a) | The rate shown is the seven-day current annualized yield at May 31, 2017. |
| (b) | As defined in the Investment Company Act of 1940, an affiliated company is one in which the Fund owns 5% or more of the company’s outstanding voting securities, or a company which is under common ownership or control with the Fund. Holdings and transactions in these affiliated companies during the year ended May 31, 2017 are as follows: |
| Issuer | Beginning
shares | Shares
purchased | Shares
sold | Ending
shares | Realized gain
(loss) ($) | Dividends —
affiliated
issuers($) | Value ($) |
| Columbia Short-Term Cash Fund, 0.916% | 383,359,315 | 1,105,580,516 | (1,227,274,286) | 261,665,545 | 7,075 | 1,256,955 | 261,665,545 |
Fair value measurements
The Fund categorizes its fair value measurements according to a three-level hierarchy that maximizes the use of observable inputs and minimizes the use of unobservable inputs by prioritizing that the most observable input be used when available. Observable inputs are those that market participants would use in pricing an investment based on market data obtained from sources independent of the reporting entity. Unobservable inputs are those that reflect the Fund’s assumptions about the information market participants would use in pricing an investment. An investment’s level within the fair value hierarchy is based on the lowest level of any input that is deemed significant to the asset’s or liability’s fair value measurement. The input levels are not necessarily an indication of the risk or liquidity associated with investments at that level. For example, certain U.S. government securities are generally high quality and liquid, however, they are reflected as Level 2 because the inputs used to determine fair value may not always be quoted prices in an active market.
Fair value inputs are summarized in the three broad levels listed below:
| • | Level 1 – Valuations based on quoted prices for investments in active markets that the Fund has the ability to access at the measurement date (including NAV for open-end mutual funds). Valuation adjustments are not applied to Level 1 investments. |
| • | Level 2 – Valuations based on other significant observable inputs (including quoted prices for similar securities, interest rates, prepayment speeds, credit risks, etc.). |
The accompanying Notes to Financial Statements are an integral part of this statement.
Columbia Dividend Income Fund | Annual Report 2017
| 9 |
Portfolio of Investments (continued)
May 31, 2017
Fair value measurements (continued)
| • | Level 3 – Valuations based on significant unobservable inputs (including the Fund’s own assumptions and judgment in determining the fair value of investments). |
Inputs that are used in determining fair value of an investment may include price information, credit data, volatility statistics, and other factors. These inputs can be either observable or unobservable. The availability of observable inputs can vary between investments, and is affected by various factors such as the type of investment, and the volume and level of activity for that investment or similar investments in the marketplace. The inputs will be considered by the Investment Manager, along with any other relevant factors in the calculation of an investment’s fair value. The Fund uses prices and inputs that are current as of the measurement date, which may include periods of market dislocations. During these periods, the availability of prices and inputs may be reduced for many investments. This condition could cause an investment to be reclassified between the various levels within the hierarchy.
Certain investments that have been measured at fair value using the net asset value (NAV) per share (or its equivalent) are not categorized in the fair value hierarchy. The fair value amounts presented in the table are intended to reconcile the fair value hierarchy to the amounts presented in the Portfolio of Investments. The Columbia Short-Term Cash Fund seeks to provide shareholders with maximum current income consistent with liquidity and stability of principal. Columbia Short-Term Cash Fund prices its shares with a floating NAV and no longer seeks to maintain a stable NAV.
Investments falling into the Level 3 category are primarily supported by quoted prices from brokers and dealers participating in the market for those investments. However, these may be classified as Level 3 investments due to lack of market transparency and corroboration to support these quoted prices. Additionally, valuation models may be used as the pricing source for any remaining investments classified as Level 3. These models may rely on one or more significant unobservable inputs and/or significant assumptions by the Investment Manager. Inputs used in valuations may include, but are not limited to, financial statement analysis, capital account balances, discount rates and estimated cash flows, and comparable company data.
Under the direction of the Fund’s Board of Trustees (the Board), the Investment Manager’s Valuation Committee (the Committee) is responsible for overseeing the valuation procedures approved by the Board. The Committee consists of voting and non-voting members from various groups within the Investment Manager’s organization, including operations and accounting, trading and investments, compliance, risk management and legal.
The Committee meets at least monthly to review and approve valuation matters, which may include a description of specific valuation determinations, data regarding pricing information received from approved pricing vendors and brokers and the results of Board-approved valuation control policies and procedures (the Policies). The Policies address, among other things, instances when market quotations are or are not readily available, including recommendations of third party pricing vendors and a determination of appropriate pricing methodologies; events that require specific valuation determinations and assessment of fair value techniques; securities with a potential for stale pricing, including those that are illiquid, restricted, or in default; and the effectiveness of third party pricing vendors, including periodic reviews of vendors. The Committee meets more frequently, as needed, to discuss additional valuation matters, which may include the need to review back-testing results, review time-sensitive information or approve related valuation actions. The Committee reports to the Board, with members of the Committee meeting with the Board at each of its regularly scheduled meetings to discuss valuation matters and actions during the period, similar to those described earlier.
For investments categorized as Level 3, the Committee monitors information similar to that described above, which may include: (i) data specific to the issuer or comparable issuers, (ii) general market or specific sector news and (iii) quoted prices and specific or similar security transactions. The Committee considers this data and any changes from prior periods in order to assess the reasonableness of observable and unobservable inputs, any assumptions or internal models used to value those securities and changes in fair value. This data is also used to corroborate, when available, information received from approved pricing vendors and brokers. Various factors impact the frequency of monitoring this information (which may occur as often as daily). However, the Committee may determine that changes to inputs, assumptions and models are not required as a result of the monitoring procedures performed.
The following table is a summary of the inputs used to value the Fund’s investments at May 31, 2017:
| | Level 1
quoted prices
in active
markets for
identical
assets ($) | Level 2
other
significant
observable
inputs ($) | Level 3
significant
unobservable
inputs ($) | Investments
measured at
net asset
value ($) | Total ($) |
| Investments | | | | | |
| Common Stocks | | | | | |
| Consumer Discretionary | 999,867,273 | — | — | — | 999,867,273 |
| Consumer Staples | 1,215,965,399 | — | — | — | 1,215,965,399 |
| Energy | 525,274,340 | — | — | — | 525,274,340 |
| Financials | 1,680,031,174 | — | — | — | 1,680,031,174 |
| Health Care | 1,131,690,362 | — | — | — | 1,131,690,362 |
| Industrials | 1,515,283,968 | — | — | — | 1,515,283,968 |
| Information Technology | 1,615,802,901 | — | — | — | 1,615,802,901 |
| Materials | 221,054,607 | — | — | — | 221,054,607 |
| Real Estate | 348,491,999 | — | — | — | 348,491,999 |
| Telecommunication Services | 228,204,342 | — | — | — | 228,204,342 |
| Utilities | 510,949,560 | — | — | — | 510,949,560 |
| Total Common Stocks | 9,992,615,925 | — | — | — | 9,992,615,925 |
| Convertible Preferred Stocks | | | | | |
| Energy | 16,322,190 | — | — | — | 16,322,190 |
| Exchange-Traded Funds | 77,404,216 | — | — | — | 77,404,216 |
| Money Market Funds | — | — | — | 261,665,545 | 261,665,545 |
| Total Investments | 10,086,342,331 | — | — | 261,665,545 | 10,348,007,876 |
The accompanying Notes to Financial Statements are an integral part of this statement.
| 10 | Columbia Dividend Income Fund | Annual Report 2017 |
Portfolio of Investments (continued)
May 31, 2017
Fair value measurements (continued)
See the Portfolio of Investments for all investment classifications not indicated in the table.
There were no transfers of financial assets between levels during the period.
The accompanying Notes to Financial Statements are an integral part of this statement.
Columbia Dividend Income Fund | Annual Report 2017
| 11 |
Statement of Assets and Liabilities
May 31, 2017
| Assets | |
| Investments, at cost | |
| Unaffiliated issuers, at cost | $6,367,034,206 |
| Affiliated issuers, at cost | 261,666,251 |
| Total investments, at cost | 6,628,700,457 |
| Investments, at value | |
| Unaffiliated issuers, at value | 10,086,342,331 |
| Affiliated issuers, at value | 261,665,545 |
| Total investments, at value | 10,348,007,876 |
| Receivable for: | |
| Capital shares sold | 8,700,810 |
| Dividends | 28,399,401 |
| Prepaid expenses | 8,166 |
| Trustees’ deferred compensation plan | 292,074 |
| Total assets | 10,385,408,327 |
| Liabilities | |
| Payable for: | |
| Capital shares purchased | 23,799,071 |
| Management services fees | 159,307 |
| Distribution and/or service fees | 34,905 |
| Transfer agent fees | 1,482,054 |
| Compensation of board members | 243 |
| Compensation of chief compliance officer | 738 |
| Other expenses | 243,515 |
| Trustees’ deferred compensation plan | 292,074 |
| Total liabilities | 26,011,907 |
| Net assets applicable to outstanding capital stock | $10,359,396,420 |
| Represented by | |
| Paid in capital | 6,516,947,550 |
| Undistributed net investment income | 30,021,301 |
| Accumulated net realized gain | 93,120,150 |
| Unrealized appreciation (depreciation) on: | |
| Investments - unaffiliated issuers | 3,719,308,125 |
| Investments - affiliated issuers | (706) |
| Total - representing net assets applicable to outstanding capital stock | $10,359,396,420 |
The accompanying Notes to Financial Statements are an integral part of this statement.
| 12 | Columbia Dividend Income Fund | Annual Report 2017 |
Statement of Assets and Liabilities (continued)
May 31, 2017
| Class A | |
| Net assets | $1,750,089,632 |
| Shares outstanding | 85,531,891 |
| Net asset value per share | $20.46 |
| Maximum offering price per share(a) | $21.71 |
| Class B | |
| Net assets | $1,109,735 |
| Shares outstanding | 55,901 |
| Net asset value per share | $19.85 |
| Class C | |
| Net assets | $764,035,658 |
| Shares outstanding | 38,515,042 |
| Net asset value per share | $19.84 |
| Class R | |
| Net assets | $99,305,254 |
| Shares outstanding | 4,852,007 |
| Net asset value per share | $20.47 |
| Class R4 | |
| Net assets | $390,004,022 |
| Shares outstanding | 18,753,925 |
| Net asset value per share | $20.80 |
| Class R5 | |
| Net assets | $524,608,189 |
| Shares outstanding | 25,240,303 |
| Net asset value per share | $20.78 |
| Class T(b) | |
| Net assets | $58,690 |
| Shares outstanding | 2,870 |
| Net asset value per share | $20.45 |
| Maximum offering price per share(c) | $20.97 |
| Class V(d) | |
| Net assets | $78,342,421 |
| Shares outstanding | 3,827,136 |
| Net asset value per share | $20.47 |
| Maximum offering price per share(e) | $21.72 |
| Class Y | |
| Net assets | $610,881,702 |
| Shares outstanding | 29,363,517 |
| Net asset value per share | $20.80 |
| Class Z | |
| Net assets | $6,140,961,117 |
| Shares outstanding | 299,781,516 |
| Net asset value per share | $20.48 |
| (a) | The maximum offering price per share is calculated by dividing the net asset value per share by 1.0 minus the maximum sales charge of 5.75% for Class A. |
| (b) | Effective March 27, 2017, Class W shares were renamed Class T shares. |
| (c) | The maximum offering price per share is calculated by dividing the net asset value per share by 1.0 minus the maximum sales charge of 2.50% for Class T. |
| (d) | Effective January 24, 2017, Class T shares were renamed Class V shares. |
| (e) | The maximum offering price per share is calculated by dividing the net asset value per share by 1.0 minus the maximum sales charge of 5.75% for Class V. |
The accompanying Notes to Financial Statements are an integral part of this statement.
Columbia Dividend Income Fund | Annual Report 2017
| 13 |
Statement of Operations
Year Ended May 31, 2017
| Net investment income | |
| Income: | |
| Dividends — unaffiliated issuers | $264,906,364 |
| Dividends — affiliated issuers | 1,256,956 |
| Foreign taxes withheld | (196,679) |
| Total income | 265,966,641 |
| Expenses: | |
| Management services fees | 54,720,306 |
| Distribution and/or service fees | |
| Class A | 5,750,410 |
| Class B | 35,702 |
| Class C | 7,385,509 |
| Class R | 463,216 |
| Class T(a) | 224 |
| Class V(b) | 190,638 |
| Transfer agent fees | |
| Class A | 3,932,936 |
| Class B | 6,146 |
| Class C | 1,261,561 |
| Class I(c) | 2,841 |
| Class R | 158,220 |
| Class R4 | 524,404 |
| Class R5 | 260,988 |
| Class T(a) | 154 |
| Class V(b) | 130,325 |
| Class Y | 20,952 |
| Class Z | 8,973,708 |
| Compensation of board members | 189,021 |
| Custodian fees | 56,146 |
| Printing and postage fees | 447,062 |
| Registration fees | 301,122 |
| Audit fees | 32,034 |
| Legal fees | 289,384 |
| Compensation of chief compliance officer | 4,353 |
| Other | 258,625 |
| Total expenses | 85,395,987 |
| Expense reduction | (3,200) |
| Total net expenses | 85,392,787 |
| Net investment income | 180,573,854 |
| Realized and unrealized gain (loss) — net | |
| Net realized gain (loss) on: | |
| Investments — unaffiliated issuers | 166,170,298 |
| Investments — affiliated issuers | 7,075 |
| Foreign currency translations | (4,537) |
| Net realized gain | 166,172,836 |
| Net change in unrealized appreciation (depreciation) on: | |
| Investments — unaffiliated issuers | 1,075,003,300 |
| Investments — affiliated issuers | (706) |
| Net change in unrealized appreciation (depreciation) | 1,075,002,594 |
| Net realized and unrealized gain | 1,241,175,430 |
| Net increase in net assets resulting from operations | $1,421,749,284 |
| (a) | Effective March 27, 2017, Class W shares were renamed Class T shares. |
| (b) | Effective January 24, 2017, Class T shares were renamed Class V shares. |
| (c) | Effective March 27, 2017, Class I shares were redeemed or exchanged for Class Y shares. |
The accompanying Notes to Financial Statements are an integral part of this statement.
| 14 | Columbia Dividend Income Fund | Annual Report 2017 |
Statement of Changes in Net Assets
| | Year Ended
May 31, 2017 | Year Ended
May 31, 2016 |
| Operations | | |
| Net investment income | $180,573,854 | $157,010,028 |
| Net realized gain | 166,172,836 | 208,460,952 |
| Net change in unrealized appreciation (depreciation) | 1,075,002,594 | (3,768,566) |
| Net increase in net assets resulting from operations | 1,421,749,284 | 361,702,414 |
| Distributions to shareholders | | |
| Net investment income | | |
| Class A | (37,627,869) | (55,027,655) |
| Class B | (35,879) | (112,945) |
| Class C | (7,060,195) | (11,192,608) |
| Class I(a) | (2,814,423) | (5,472,958) |
| Class R | (1,306,961) | (1,817,441) |
| Class R4 | (5,575,531) | (4,735,609) |
| Class R5 | (9,356,423) | (9,885,264) |
| Class T(b) | (1,462) | (3,106) |
| Class V(c) | (1,272,666) | (1,831,540) |
| Class Y | (6,330,936) | (5,350,267) |
| Class Z | (101,128,414) | (120,411,297) |
| Net realized gains | | |
| Class A | (56,795,302) | (111,629,908) |
| Class B | (93,412) | (323,970) |
| Class C | (17,670,070) | (33,162,014) |
| Class I(a) | (2,693,321) | (8,564,828) |
| Class R | (2,165,669) | (4,164,077) |
| Class R4 | (6,865,325) | (9,046,224) |
| Class R5 | (10,746,353) | (17,781,173) |
| Class T(b) | (2,264) | (5,560) |
| Class V(c) | (1,762,889) | (3,737,695) |
| Class Y | (7,726,783) | (9,507,811) |
| Class Z | (117,094,884) | (223,233,007) |
| Total distributions to shareholders | (396,127,031) | (636,996,957) |
| Increase in net assets from capital stock activity | 280,181,713 | 266,419,122 |
| Total increase (decrease) in net assets | 1,305,803,966 | (8,875,421) |
| Net assets at beginning of year | 9,053,592,454 | 9,062,467,875 |
| Net assets at end of year | $10,359,396,420 | $9,053,592,454 |
| Undistributed net investment income | $30,021,301 | $22,839,914 |
| (a) | Effective March 27, 2017, Class I shares were redeemed or exchanged for Class Y shares. |
| (b) | Effective March 27, 2017, Class W shares were renamed Class T shares. |
| (c) | Effective January 24, 2017, Class T shares were renamed Class V shares. |
The accompanying Notes to Financial Statements are an integral part of this statement.
Columbia Dividend Income Fund | Annual Report 2017
| 15 |
Statement of Changes in Net Assets (continued)
| | Year Ended | Year Ended |
| | May 31, 2017 | May 31, 2016 |
| | Shares | Dollars ($) | Shares | Dollars ($) |
| Capital stock activity |
| Class A | | | | |
| Subscriptions (a) | 29,695,879 | 567,733,173 | 30,044,947 | 544,040,351 |
| Distributions reinvested | 4,571,689 | 87,268,866 | 8,754,726 | 153,461,192 |
| Redemptions | (77,924,997) | (1,532,793,249) | (41,481,154) | (747,383,055) |
| Net decrease | (43,657,429) | (877,791,210) | (2,681,481) | (49,881,512) |
| Class B | | | | |
| Subscriptions | 6,694 | 127,739 | 10,472 | 182,644 |
| Distributions reinvested | 5,693 | 105,580 | 20,705 | 352,479 |
| Redemptions (a) | (220,684) | (4,194,521) | (221,027) | (3,883,553) |
| Net decrease | (208,297) | (3,961,202) | (189,850) | (3,348,430) |
| Class C | | | | |
| Subscriptions | 7,689,756 | 143,049,052 | 6,671,910 | 116,143,870 |
| Distributions reinvested | 1,099,241 | 20,414,237 | 2,118,177 | 36,003,454 |
| Redemptions | (8,982,100) | (168,696,541) | (6,072,143) | (106,230,711) |
| Net increase (decrease) | (193,103) | (5,233,252) | 2,717,944 | 45,916,613 |
| Class I(b) | | | | |
| Subscriptions | 1,352,872 | 25,226,903 | 6,746,241 | 120,049,859 |
| Distributions reinvested | 288,336 | 5,507,628 | 797,214 | 14,037,585 |
| Redemptions | (11,082,601) | (216,652,243) | (10,599,392) | (194,815,866) |
| Net decrease | (9,441,393) | (185,917,712) | (3,055,937) | (60,728,422) |
| Class R | | | | |
| Subscriptions | 1,293,128 | 24,831,054 | 1,304,089 | 23,619,929 |
| Distributions reinvested | 161,141 | 3,084,149 | 306,136 | 5,366,096 |
| Redemptions | (1,217,628) | (23,505,280) | (1,590,754) | (28,645,921) |
| Net increase | 236,641 | 4,409,923 | 19,471 | 340,104 |
| Class R4 | | | | |
| Subscriptions | 9,947,550 | 194,943,152 | 7,215,555 | 131,875,625 |
| Distributions reinvested | 574,766 | 11,180,689 | 670,352 | 11,918,272 |
| Redemptions | (4,106,859) | (80,789,222) | (4,817,980) | (88,710,635) |
| Net increase | 6,415,457 | 125,334,619 | 3,067,927 | 55,083,262 |
| Class R5 | | | | |
| Subscriptions | 7,235,464 | 141,396,798 | 9,551,777 | 176,029,543 |
| Distributions reinvested | 1,003,214 | 19,477,627 | 1,516,893 | 26,966,555 |
| Redemptions | (5,254,991) | (103,257,837) | (5,003,726) | (91,544,963) |
| Net increase | 2,983,687 | 57,616,588 | 6,064,944 | 111,451,135 |
| Class T(c) | | | | |
| Distributions reinvested | 189 | 3,621 | 483 | 8,476 |
| Redemptions | (2,632) | (52,712) | (3,772) | (69,255) |
| Net decrease | (2,443) | (49,091) | (3,289) | (60,779) |
| Class V(d) | | | | |
| Subscriptions | 43,144 | 830,934 | 68,236 | 1,211,885 |
| Distributions reinvested | 127,283 | 2,434,352 | 256,403 | 4,495,643 |
| Redemptions | (423,748) | (8,197,473) | (501,788) | (9,216,770) |
| Net decrease | (253,321) | (4,932,187) | (177,149) | (3,509,242) |
| Class Y(b) | | | | |
| Subscriptions | 20,553,514 | 407,513,662 | 4,479,377 | 82,362,611 |
| Distributions reinvested | 695,268 | 13,532,540 | 820,902 | 14,606,163 |
| Redemptions | (4,068,442) | (79,569,159) | (1,974,589) | (36,311,263) |
| Net increase | 17,180,340 | 341,477,043 | 3,325,690 | 60,657,511 |
The accompanying Notes to Financial Statements are an integral part of this statement.
| 16 | Columbia Dividend Income Fund | Annual Report 2017 |
Statement of Changes in Net Assets (continued)
| | Year Ended | Year Ended |
| | May 31, 2017 | May 31, 2016 |
| | Shares | Dollars ($) | Shares | Dollars ($) |
| Class Z | | | | |
| Subscriptions | 112,856,692 | 2,212,408,393 | 52,334,824 | 937,290,640 |
| Distributions reinvested | 6,098,628 | 116,881,045 | 9,975,763 | 175,050,909 |
| Redemptions | (77,553,354) | (1,500,061,244) | (55,459,993) | (1,001,842,667) |
| Net increase | 41,401,966 | 829,228,194 | 6,850,594 | 110,498,882 |
| Total net increase | 14,462,105 | 280,181,713 | 15,938,864 | 266,419,122 |
| (a) | Includes conversions of Class B shares to Class A shares, if any. |
| (b) | Effective March 27, 2017, Class I shares were redeemed or exchanged for Class Y shares. |
| (c) | Effective March 27, 2017, Class W shares were renamed Class T shares. |
| (d) | Effective January 24, 2017, Class T shares were renamed Class V shares. |
The accompanying Notes to Financial Statements are an integral part of this statement.
Columbia Dividend Income Fund | Annual Report 2017
| 17 |
The following table is intended to help you understand the Fund’s financial performance. Certain information reflects financial results for a single share of a class held for the periods shown. Per share net investment income (loss) amounts are calculated based on average shares outstanding during the period. Total return assumes reinvestment of all dividends and distributions, if any. Total return does not reflect payment of sales charges, if any. Total return and portfolio turnover are not annualized for periods of less than one year. The portfolio turnover rate is calculated without regard to purchase and sales transactions of short-term instruments and certain derivatives, if any. If such transactions were included, the Fund’s portfolio turnover rate may be higher.
| Year ended | Net asset value,
beginning of
period | Net
investment
income | Net
realized
and
unrealized
gain | Total from
investment
operations | Distributions
from net
investment
income | Distributions
from net
realized
gains |
| Class A |
| 5/31/2017 | $18.43 | 0.34 | 2.46 | 2.80 | (0.32) | (0.45) |
| 5/31/2016 | $19.07 | 0.32 | 0.43 | 0.75 | (0.45) | (0.94) |
| 5/31/2015 | $19.02 | 0.48 | 1.17 | 1.65 | (0.40) | (1.20) |
| 5/31/2014 | $17.05 | 0.35 | 2.20 | 2.55 | (0.34) | (0.24) |
| 5/31/2013 | $13.96 | 0.34 | 3.09 | 3.43 | (0.34) | — |
| Class B |
| 5/31/2017 | $17.89 | 0.18 | 2.41 | 2.59 | (0.18) | (0.45) |
| 5/31/2016 | $18.55 | 0.17 | 0.42 | 0.59 | (0.31) | (0.94) |
| 5/31/2015 | $18.54 | 0.30 | 1.16 | 1.46 | (0.25) | (1.20) |
| 5/31/2014 | $16.64 | 0.21 | 2.14 | 2.35 | (0.21) | (0.24) |
| 5/31/2013 | $13.63 | 0.22 | 3.02 | 3.24 | (0.23) | — |
| Class C |
| 5/31/2017 | $17.88 | 0.18 | 2.41 | 2.59 | (0.18) | (0.45) |
| 5/31/2016 | $18.54 | 0.18 | 0.41 | 0.59 | (0.31) | (0.94) |
| 5/31/2015 | $18.53 | 0.34 | 1.12 | 1.46 | (0.25) | (1.20) |
| 5/31/2014 | $16.63 | 0.21 | 2.13 | 2.34 | (0.20) | (0.24) |
| 5/31/2013 | $13.62 | 0.22 | 3.02 | 3.24 | (0.23) | — |
| Class R |
| 5/31/2017 | $18.43 | 0.29 | 2.47 | 2.76 | (0.27) | (0.45) |
| 5/31/2016 | $19.07 | 0.27 | 0.43 | 0.70 | (0.40) | (0.94) |
| 5/31/2015 | $19.02 | 0.44 | 1.16 | 1.60 | (0.35) | (1.20) |
| 5/31/2014 | $17.05 | 0.31 | 2.19 | 2.50 | (0.29) | (0.24) |
| 5/31/2013 | $13.96 | 0.30 | 3.09 | 3.39 | (0.30) | — |
| Class R4 |
| 5/31/2017 | $18.71 | 0.39 | 2.52 | 2.91 | (0.37) | (0.45) |
| 5/31/2016 | $19.34 | 0.37 | 0.44 | 0.81 | (0.50) | (0.94) |
| 5/31/2015 | $19.27 | 0.57 | 1.14 | 1.71 | (0.44) | (1.20) |
| 5/31/2014 | $17.27 | 0.42 | 2.20 | 2.62 | (0.38) | (0.24) |
| 5/31/2013 (d) | $14.65 | 0.20 | 2.60 | 2.80 | (0.18) | — |
| Class R5 |
| 5/31/2017 | $18.71 | 0.41 | 2.50 | 2.91 | (0.39) | (0.45) |
| 5/31/2016 | $19.33 | 0.39 | 0.45 | 0.84 | (0.52) | (0.94) |
| 5/31/2015 | $19.26 | 0.62 | 1.12 | 1.74 | (0.47) | (1.20) |
| 5/31/2014 | $17.26 | 0.43 | 2.21 | 2.64 | (0.40) | (0.24) |
| 5/31/2013 (f) | $14.65 | 0.22 | 2.58 | 2.80 | (0.19) | — |
The accompanying Notes to Financial Statements are an integral part of this statement.
| 18 | Columbia Dividend Income Fund | Annual Report 2017 |
Total
distributions to
shareholders | Net
asset
value,
end of
period | Total
return | Total gross
expense
ratio to
average
net assets(a) | Total net
expense
ratio to
average
net assets(a),(b) | Net investment
income
ratio to
average
net assets | Portfolio
turnover | Net
assets,
end of
period
(000’s) |
| |
| (0.77) | $20.46 | 15.52% | 1.00% | 1.00% (c) | 1.74% | 16% | $1,750,090 |
| (1.39) | $18.43 | 4.42% | 1.02% | 1.02% (c) | 1.74% | 25% | $2,380,538 |
| (1.60) | $19.07 | 9.08% | 1.02% | 1.02% (c) | 2.52% | 27% | $2,514,422 |
| (0.58) | $19.02 | 15.25% | 1.02% | 1.02% (c) | 1.96% | 19% | $2,556,782 |
| (0.34) | $17.05 | 24.91% | 1.04% | 1.03% (c) | 2.20% | 24% | $2,518,406 |
| |
| (0.63) | $19.85 | 14.72% | 1.75% | 1.75% (c) | 0.98% | 16% | $1,110 |
| (1.25) | $17.89 | 3.62% | 1.78% | 1.78% (c) | 0.98% | 25% | $4,728 |
| (1.45) | $18.55 | 8.26% | 1.77% | 1.77% (c) | 1.60% | 27% | $8,423 |
| (0.45) | $18.54 | 14.33% | 1.77% | 1.77% (c) | 1.22% | 19% | $12,896 |
| (0.23) | $16.64 | 23.99% | 1.79% | 1.77% (c) | 1.47% | 24% | $15,034 |
| |
| (0.63) | $19.84 | 14.73% | 1.75% | 1.75% (c) | 0.99% | 16% | $764,036 |
| (1.25) | $17.88 | 3.62% | 1.78% | 1.78% (c) | 1.00% | 25% | $692,229 |
| (1.45) | $18.54 | 8.26% | 1.77% | 1.77% (c) | 1.83% | 27% | $667,300 |
| (0.44) | $18.53 | 14.33% | 1.77% | 1.77% (c) | 1.24% | 19% | $601,468 |
| (0.23) | $16.63 | 24.00% | 1.79% | 1.78% (c) | 1.45% | 24% | $459,966 |
| |
| (0.72) | $20.47 | 15.29% | 1.25% | 1.25% (c) | 1.49% | 16% | $99,305 |
| (1.34) | $18.43 | 4.15% | 1.27% | 1.27% (c) | 1.49% | 25% | $85,066 |
| (1.55) | $19.07 | 8.80% | 1.27% | 1.27% (c) | 2.28% | 27% | $87,646 |
| (0.53) | $19.02 | 14.96% | 1.27% | 1.27% (c) | 1.73% | 19% | $87,406 |
| (0.30) | $17.05 | 24.60% | 1.29% | 1.28% (c) | 1.95% | 24% | $72,979 |
| |
| (0.82) | $20.80 | 15.89% | 0.75% | 0.75% (c) | 1.99% | 16% | $390,004 |
| (1.44) | $18.71 | 4.67% | 0.77% | 0.77% (c) | 2.01% | 25% | $230,893 |
| (1.64) | $19.34 | 9.33% | 0.77% | 0.77% (c) | 2.93% | 27% | $179,306 |
| (0.62) | $19.27 | 15.51% | 0.77% | 0.77% (c) | 2.29% | 19% | $123,274 |
| (0.18) | $17.27 | 19.22% | 0.82% (e) | 0.82% (e) | 2.17% (e) | 24% | $37,359 |
| |
| (0.84) | $20.78 | 15.92% | 0.63% | 0.63% | 2.10% | 16% | $524,608 |
| (1.46) | $18.71 | 4.88% | 0.64% | 0.64% | 2.14% | 25% | $416,310 |
| (1.67) | $19.33 | 9.48% | 0.63% | 0.63% | 3.19% | 27% | $313,051 |
| (0.64) | $19.26 | 15.68% | 0.64% | 0.64% | 2.41% | 19% | $156,525 |
| (0.19) | $17.26 | 19.27% | 0.65% (e) | 0.65% (e) | 2.41% (e) | 24% | $64,986 |
Columbia Dividend Income Fund | Annual Report 2017
| 19 |
Financial Highlights (continued)
| Year ended | Net asset value,
beginning of
period | Net
investment
income | Net
realized
and
unrealized
gain | Total from
investment
operations | Distributions
from net
investment
income | Distributions
from net
realized
gains |
| Class T(g) |
| 5/31/2017 | $18.42 | 0.34 | 2.46 | 2.80 | (0.32) | (0.45) |
| 5/31/2016 | $19.06 | 0.32 | 0.43 | 0.75 | (0.45) | (0.94) |
| 5/31/2015 | $19.01 | 0.47 | 1.18 | 1.65 | (0.40) | (1.20) |
| 5/31/2014 | $17.05 | 0.31 | 2.23 | 2.54 | (0.34) | (0.24) |
| 5/31/2013 | $13.96 | 0.33 | 3.10 | 3.43 | (0.34) | — |
| Class V(h) |
| 5/31/2017 | $18.43 | 0.33 | 2.48 | 2.81 | (0.32) | (0.45) |
| 5/31/2016 | $19.07 | 0.32 | 0.43 | 0.75 | (0.45) | (0.94) |
| 5/31/2015 | $19.02 | 0.48 | 1.16 | 1.64 | (0.39) | (1.20) |
| 5/31/2014 | $17.05 | 0.34 | 2.20 | 2.54 | (0.33) | (0.24) |
| 5/31/2013 | $13.96 | 0.33 | 3.09 | 3.42 | (0.33) | — |
| Class Y |
| 5/31/2017 | $18.72 | 0.43 | 2.50 | 2.93 | (0.40) | (0.45) |
| 5/31/2016 | $19.35 | 0.40 | 0.44 | 0.84 | (0.53) | (0.94) |
| 5/31/2015 | $19.27 | 0.66 | 1.10 | 1.76 | (0.48) | (1.20) |
| 5/31/2014 | $17.27 | 0.47 | 2.18 | 2.65 | (0.41) | (0.24) |
| 5/31/2013 (i) | $14.66 | 0.23 | 2.58 | 2.81 | (0.20) | — |
| Class Z |
| 5/31/2017 | $18.45 | 0.38 | 2.47 | 2.85 | (0.37) | (0.45) |
| 5/31/2016 | $19.09 | 0.36 | 0.44 | 0.80 | (0.50) | (0.94) |
| 5/31/2015 | $19.03 | 0.53 | 1.18 | 1.71 | (0.45) | (1.20) |
| 5/31/2014 | $17.07 | 0.39 | 2.19 | 2.58 | (0.38) | (0.24) |
| 5/31/2013 | $13.97 | 0.38 | 3.10 | 3.48 | (0.38) | — |
| Notes to Financial Highlights |
| (a) | In addition to the fees and expenses that the Fund bears directly, the Fund indirectly bears a pro rata share of the fees and expenses of any other funds in which it invests. Such indirect expenses are not included in the Fund’s reported expense ratios. |
| (b) | Total net expenses include the impact of certain fee waivers/expense reimbursements made by the Investment Manager and certain of its affiliates, if applicable. |
| (c) | The benefits derived from expense reductions had an impact of less than 0.01%. |
| (d) | Class R4 shares commenced operations on November 8, 2012. Per share data and total return reflect activity from that date. |
| (e) | Annualized. |
| (f) | Class R5 shares commenced operations on November 8, 2012. Per share data and total return reflect activity from that date. |
| (g) | Effective March 27, 2017, Class W shares were renamed Class T shares. |
| (h) | Effective January 24, 2017, Class T shares were renamed Class V shares. |
| (i) | Class Y shares commenced operations on November 8, 2012. Per share data and total return reflect activity from that date. |
The accompanying Notes to Financial Statements are an integral part of this statement.
| 20 | Columbia Dividend Income Fund | Annual Report 2017 |
Total
distributions to
shareholders | Net
asset
value,
end of
period | Total
return | Total gross
expense
ratio to
average
net assets(a) | Total net
expense
ratio to
average
net assets(a),(b) | Net investment
income
ratio to
average
net assets | Portfolio
turnover | Net
assets,
end of
period
(000’s) |
| |
| (0.77) | $20.45 | 15.53% | 1.00% | 1.00% (c) | 1.74% | 16% | $59 |
| (1.39) | $18.42 | 4.43% | 1.02% | 1.02% (c) | 1.72% | 25% | $98 |
| (1.60) | $19.06 | 9.09% | 1.02% | 1.02% (c) | 2.47% | 27% | $164 |
| (0.58) | $19.01 | 15.21% | 1.00% | 1.00% (c) | 1.75% | 19% | $193 |
| (0.34) | $17.05 | 24.91% | 1.04% | 1.02% (c) | 2.20% | 24% | $9,373 |
| |
| (0.77) | $20.47 | 15.58% | 1.00% | 1.00% (c) | 1.74% | 16% | $78,342 |
| (1.39) | $18.43 | 4.42% | 1.02% | 1.02% (c) | 1.74% | 25% | $75,218 |
| (1.59) | $19.07 | 9.03% | 1.04% | 1.04% (c) | 2.49% | 27% | $81,206 |
| (0.57) | $19.02 | 15.19% | 1.07% | 1.07% (c) | 1.92% | 19% | $85,511 |
| (0.33) | $17.05 | 24.85% | 1.09% | 1.08% (c) | 2.16% | 24% | $84,342 |
| |
| (0.85) | $20.80 | 16.03% | 0.59% | 0.59% | 2.17% | 16% | $610,882 |
| (1.47) | $18.72 | 4.87% | 0.59% | 0.59% | 2.19% | 25% | $228,089 |
| (1.68) | $19.35 | 9.59% | 0.59% | 0.59% | 3.41% | 27% | $171,392 |
| (0.65) | $19.27 | 15.72% | 0.59% | 0.59% | 2.58% | 19% | $78,674 |
| (0.20) | $17.27 | 19.29% | 0.60% (e) | 0.60% (e) | 2.49% (e) | 24% | $1,190 |
| |
| (0.82) | $20.48 | 15.79% | 0.75% | 0.75% (c) | 1.98% | 16% | $6,140,961 |
| (1.44) | $18.45 | 4.69% | 0.77% | 0.77% (c) | 2.00% | 25% | $4,766,037 |
| (1.65) | $19.09 | 9.40% | 0.77% | 0.77% (c) | 2.76% | 27% | $4,800,733 |
| (0.62) | $19.03 | 15.46% | 0.77% | 0.77% (c) | 2.22% | 19% | $5,062,852 |
| (0.38) | $17.07 | 25.27% | 0.79% | 0.78% (c) | 2.46% | 24% | $4,846,586 |
Columbia Dividend Income Fund | Annual Report 2017
| 21 |
Notes to Financial Statements
May 31, 2017
Note 1. Organization
Columbia Dividend Income Fund (the Fund), a series of Columbia Funds Series Trust I (the Trust), is a diversified fund. The Trust is registered under the Investment Company Act of 1940, as amended (the 1940 Act), as an open-end management investment company organized as a Massachusetts business trust.
Fund shares
The Trust may issue an unlimited number of shares (without par value). Although all share classes generally have identical voting, dividend and liquidation rights, each share class votes separately when required by the Trust’s organizational documents or by law. Different share classes pay different distribution amounts to the extent the expenses of such share classes differ, and distributions in liquidation will be proportional to the net asset value of each share class. Each share class has its own expense and sales charge structure. The Fund offers each of the share classes identified below.
Class A shares are subject to a maximum front-end sales charge of 5.75% based on the initial investment amount. Class A shares purchased without an initial sales charge in accounts aggregating $1 million to $50 million at the time of purchase are subject to a contingent deferred sales charge (CDSC) if the shares are sold within 18 months after purchase, charged as follows: 1.00% CDSC if redeemed within 12 months after purchase, and 0.50% CDSC if redeemed more than 12, but less than 18, months after purchase.
The Fund no longer accepts investments by new or existing investors in the Fund’s Class B shares, except in connection with the reinvestment of any dividend and/or capital gain distributions in Class B shares of the Fund and exchanges by existing Class B shareholders of certain other funds within the Columbia Family of Funds. Class B shares are typically subject to a maximum CDSC of 5.00% based upon the holding period after purchase. However, the Fund’s current Class B investors, having held their shares for the requisite time period, are no longer subject to a CDSC upon redemption of their shares. Effective on or about July 17, 2017, Class B shares will automatically convert to Class A shares and the Fund will no longer accept investments by new or existing investors in Class B shares.
Class C shares are subject to a 1.00% CDSC on shares redeemed within 12 months after purchase.
Effective March 27, 2017, Class I shares of the Fund are no longer offered for sale. Class I shares, when available, were not subject to sales charges or distribution and service (12b-1) fees, and were made available only to the Columbia Family of Funds. On March 27, 2017, Class I shares were redeemed or exchanged for Class Y shares of the Fund in a tax free transaction that had no impact on the fees and expenses paid by shareholders.
Class R shares are not subject to sales charges and are generally available only to certain retirement plans and other investors as described in the Fund’s prospectus.
Class R4 shares are not subject to sales charges and are generally available only to omnibus retirement plans and certain investors as described in the Fund’s prospectus.
Class R5 shares are not subject to sales charges and are generally available only to investors purchasing through authorized investment professionals and omnibus retirement plans.
Class T shares are subject to a maximum front-end sales charge of 2.50% per transaction and must be purchased through financial intermediaries that, by written agreement with Columbia Management Investment Distributors, Inc., are specifically authorized to sell Class T shares. Prior to March 27, 2017, Class T shares were known as Class W shares, were not subject to sales charges, and were generally available only to investors purchasing through authorized investment programs managed by investment professionals, including discretionary managed accounts.
Class V shares (formerly Class T shares) are subject to a maximum front-end sales charge of 5.75% based on the investment amount. Class V shares purchased without an initial sales charge in accounts aggregating $1 million to $50 million at the time of purchase are subject to a CDSC if the shares are sold within 18 months after purchase, charged as follows: 1.00% CDSC if redeemed within 12 months after purchase, and 0.50% CDSC if redeemed more than 12, but less than 18, months after purchase. Class V shares are available only to investors who received (and who have continuously held) Class V shares in connection with previous fund reorganizations. Effective January 24, 2017, Class T shares were renamed Class V shares.
| 22 | Columbia Dividend Income Fund | Annual Report 2017 |
Notes to Financial Statements (continued)
May 31, 2017
Class Y shares are not subject to sales charges or distribution and service (12b-1) fees, and are available to institutional and certain other investors as described in the Fund’s prospectus. On March 27, 2017, Class I shares were redeemed or exchanged for Class Y shares of the Fund in a tax free transaction that had no impact on the fees and expenses paid by shareholders. Class I shares of the Fund are no longer offered for sale.
Class Z shares are not subject to sales charges and are generally available only to eligible investors, which are subject to different investment minimums as described in the Fund’s prospectus.
Note 2. Summary of significant accounting policies
Basis of preparation
The Fund is an investment company that applies the accounting and reporting guidance in the Financial Accounting Standards Board (FASB) Accounting Standards Codification Topic 946, Financial Services - Investment Companies (ASC 946). The financial statements are prepared in accordance with U.S. generally accepted accounting principles (GAAP), which requires management to make certain estimates and assumptions that affect the reported amounts of assets and liabilities, the disclosure of contingent assets and liabilities at the date of the financial statements and the reported amounts of income and expenses during the reporting period. Actual results could differ from those estimates.
The following is a summary of significant accounting policies followed by the Fund in the preparation of its financial statements.
Security valuation
All equity securities and exchange-traded funds are valued at the close of business of the New York Stock Exchange. Equity securities and exchange-traded funds are valued at the last quoted sales price on the principal exchange or market on which they trade, except for securities traded on the NASDAQ Stock Market, which are valued at the NASDAQ official close price. Unlisted securities or listed securities for which there were no sales during the day are valued at the mean of the latest quoted bid and ask prices on such exchanges or markets.
Foreign equity securities are valued based on the closing price on the foreign exchange in which such securities are primarily traded. If any foreign equity security closing prices are not readily available, the securities are valued at the mean of the latest quoted bid and ask prices on such exchanges or markets. Foreign currency exchange rates are generally determined at 4:00 p.m. Eastern (U.S.) time. Many securities markets and exchanges outside the U.S. close prior to the close of the New York Stock Exchange; therefore, the closing prices for securities in such markets or on such exchanges may not fully reflect events that occur after such close but before the close of the New York Stock Exchange. In those situations, foreign securities will be fair valued pursuant to a policy adopted by the Board of Trustees, including, if available, utilizing a third party pricing service to determine these fair values. The third party pricing service takes into account multiple factors, including, but not limited to, movements in the U.S. securities markets, certain depositary receipts, futures contracts and foreign exchange rates that have occurred subsequent to the close of the foreign exchange or market, to determine a good faith estimate that reasonably reflects the current market conditions as of the close of the New York Stock Exchange. The fair value of a security is likely to be different from the quoted or published price, if available.
Investments in open-end investment companies, including money market funds, are valued at their latest net asset value.
Investments for which market quotations are not readily available, or that have quotations which management believes are not reflective of market value or reliable, are valued at fair value as determined in good faith under procedures approved by and under the general supervision of the Board of Trustees. If a security or class of securities (such as foreign securities) is valued at fair value, such value is likely to be different from the quoted or published price for the security.
The determination of fair value often requires significant judgment. To determine fair value, management may use assumptions including but not limited to future cash flows and estimated risk premiums. Multiple inputs from various sources may be used to determine fair value.
Columbia Dividend Income Fund | Annual Report 2017
| 23 |
Notes to Financial Statements (continued)
May 31, 2017
GAAP requires disclosure regarding the inputs and valuation techniques used to measure fair value and any changes in valuation inputs or techniques. In addition, investments shall be disclosed by major category. This information is disclosed following the Fund’s Portfolio of Investments.
Security transactions
Security transactions are accounted for on the trade date. Cost is determined and gains (losses) are based upon the specific identification method for both financial statement and federal income tax purposes.
Income recognition
Corporate actions and dividend income are generally recorded net of any non-reclaimable tax withholdings, on the ex-dividend date or upon receipt of ex-dividend notification in the case of certain foreign securities.
The Fund may receive distributions from holdings in equity securities, business development companies (BDCs), exchange-traded funds, other regulated investment companies (RICs), and real estate investment trusts (REITs), which report information on the tax character of their distributions annually. These distributions are allocated to dividend income, capital gain and return of capital based on actual information reported. Return of capital is recorded as a reduction of the cost basis of securities held. If the Fund no longer owns the applicable securities, return of capital is recorded as a realized gain. With respect to REITs, to the extent actual information has not yet been reported, estimates for return of capital are made by the Fund’s management. Management’s estimates are subsequently adjusted when the actual character of the distributions is disclosed by the REITs, which could result in a proportionate change in return of capital to shareholders.
Awards from class action litigation are recorded as a reduction of cost basis if the Fund still owns the applicable securities on the payment date. If the Fund no longer owns the applicable securities, the proceeds are recorded as realized gains.
Expenses
General expenses of the Trust are allocated to the Fund and other funds of the Trust based upon relative net assets or other expense allocation methodologies determined by the nature of the expense. Expenses directly attributable to the Fund are charged to the Fund. Expenses directly attributable to a specific class of shares are charged to that share class.
Determination of class net asset value
All income, expenses (other than class-specific expenses, which are charged to that share class, as shown in the Statement of Operations) and realized and unrealized gains (losses) are allocated to each class of the Fund on a daily basis, based on the relative net assets of each class, for purposes of determining the net asset value of each class.
Federal income tax status
The Fund intends to qualify each year as a regulated investment company under Subchapter M of the Internal Revenue Code, as amended, and will distribute substantially all of its taxable income (including net short-term capital gains), if any, for its tax year, and as such will not be subject to federal income taxes. In addition, the Fund intends to distribute in each calendar year substantially all of its net investment income, capital gains and certain other amounts, if any, such that the Fund should not be subject to federal excise tax. Therefore, no federal income or excise tax provision is recorded.
Foreign taxes
The Fund may be subject to foreign taxes on income, gains on investments or currency repatriation, a portion of which may be recoverable. The Fund will accrue such taxes and recoveries, as applicable, based upon its current interpretation of tax rules and regulations that exist in the markets in which it invests.
Realized gains in certain countries may be subject to foreign taxes at the Fund level, based on statutory rates. The Fund accrues for such foreign taxes on realized and unrealized gains at the appropriate rate for each jurisdiction, as applicable. The amount, if any, is disclosed as a liability on the Statement of Assets and Liabilities.
| 24 | Columbia Dividend Income Fund | Annual Report 2017 |
Notes to Financial Statements (continued)
May 31, 2017
Distributions to shareholders
Distributions from net investment income, if any, are declared and paid each calendar quarter. Net realized capital gains, if any, are distributed at least annually. Income distributions and capital gain distributions are determined in accordance with federal income tax regulations, which may differ from GAAP.
Guarantees and indemnifications
Under the Trust’s organizational documents and, in some cases, by contract, its officers and trustees are indemnified against certain liabilities arising out of the performance of their duties to the Trust or its funds. In addition, certain of the Fund’s contracts with its service providers contain general indemnification clauses. The Fund’s maximum exposure under these arrangements is unknown since the amount of any future claims that may be made against the Fund cannot be determined, and the Fund has no historical basis for predicting the likelihood of any such claims.
Investment company reporting modernization
In October 2016, the U.S. Securities and Exchange Commission adopted new rules and forms, and amendments to certain current rules and forms, to modernize reporting and disclosure of information by registered investment companies. The amendments to Regulation S-X will require standardized, enhanced disclosure about derivatives in investment company financial statements, and will also change the rules governing the form and content of such financial statements. The amendments to Regulation S-X take effect on August 1, 2017. At this time, management is assessing the anticipated impact of these regulatory developments.
Note 3. Fees and other transactions with affiliates
Management services fees
The Fund entered into a Management Agreement with Columbia Management Investment Advisers, LLC (the Investment Manager), a wholly-owned subsidiary of Ameriprise Financial, Inc. (Ameriprise Financial). Under the Management Agreement, the Investment Manager provides the Fund with investment research and advice, as well as administrative and accounting services. The management services fee is an annual fee that is equal to a percentage of the Fund’s average daily net assets that declines from 0.72% to 0.52% as the Fund’s net assets increase. The effective management services fee rate for the year ended May 31, 2017 was 0.56% of the Fund’s average daily net assets.
Compensation of board members
Members of the Board of Trustees, who are not officers or employees of the Investment Manager or Ameriprise Financial, are compensated for their services to the Fund as disclosed in the Statement of Operations. These members of the Board of Trustees may participate in a Deferred Compensation Plan (the Plan) which may be terminated at any time. Obligations of the Plan will be paid solely out of the Fund’s assets, and all amounts payable under the Plan constitute a general unsecured obligation of the Fund.
Compensation of Chief Compliance Officer
The Board of Trustees has appointed a Chief Compliance Officer to the Fund in accordance with federal securities regulations. A portion of the Chief Compliance Officer’s total compensation is allocated to the Fund, along with other affiliated funds governed by the Board of Trustees, based on relative net assets. The total amount allocated to all affiliated funds governed by the Board of Trustees will not exceed $40,000 annually.
Transfer agency fees
Under a Transfer and Dividend Disbursing Agent Agreement, Columbia Management Investment Services Corp. (the Transfer Agent), an affiliate of the Investment Manager and a wholly-owned subsidiary of Ameriprise Financial, is responsible for providing transfer agency services to the Fund. The Transfer Agent has contracted with Boston Financial Data Services (BFDS) to serve as sub-transfer agent. The Transfer Agent pays the fees of BFDS for services as sub-transfer agent and BFDS is not entitled to reimbursement for such fees from the Fund (with the exception of out-of-pocket fees).
Columbia Dividend Income Fund | Annual Report 2017
| 25 |
Notes to Financial Statements (continued)
May 31, 2017
The Fund pays the Transfer Agent a monthly transfer agency fee based on the number or the average value of accounts, depending on the type of account. In addition, prior to October 1, 2016, the Transfer Agent also received sub-transfer agency fees based on a percentage of the average aggregate value of the Fund’s shares maintained in omnibus accounts (other than omnibus accounts for which American Enterprise Investment Services Inc. is the broker of record or accounts where the beneficial shareholder is a customer of Ameriprise Financial Services, Inc., for which the Transfer Agent receives a per account fee). Effective October 1, 2016, the Fund pays the Transfer Agent a fee for shareholder services based on the number of accounts or on a percentage of the average aggregate value of the Fund’s shares maintained in omnibus accounts up to the lesser of the amount charged by the financial intermediary or a cap established by the Board of Trustees from time to time.
The Transfer Agent also receives compensation from the Fund for various shareholder services and reimbursements for certain out-of-pocket fees. Effective January 1, 2017, total transfer agency fees for Class R5 shares are subject to an annual limitation of not more than 0.075% of the average daily net assets attributable to Class R5 shares. Total transfer agency fees for Class I, prior to March 27, 2017 were, and Class Y shares are subject to an annual limitation of not more than 0.025% of the average daily net assets attributable to each share class. Prior to January 1, 2017, total transfer agency fees for Class R5 shares were subject to an annual limitation of not more than 0.05% of the average daily net assets attributable to Class R5 shares and Class I and Class Y shares did not pay transfer agency fees.
For the year ended May 31, 2017, the Fund’s effective transfer agency fee rates as a percentage of average daily net assets of each class were as follows:
| | Effective rate (%) |
| Class A | 0.17 |
| Class B | 0.17 |
| Class C | 0.17 |
| Class I | 0.003 (a),(b) |
| Class R | 0.17 |
| Class R4 | 0.17 |
| Class R5 | 0.055 |
| Class T | 0.17 |
| Class V | 0.17 |
| Class Y | 0.006 |
| Class Z | 0.17 |
| (a) | Annualized. |
| (b) | Effective March 27, 2017, Class I shares were redeemed or exchanged for Class Y shares. |
An annual minimum account balance fee of $20 may apply to certain accounts with a value below the applicable share class’s initial minimum investment requirements to reduce the impact of small accounts on transfer agency fees. These minimum account balance fees are remitted to the Fund and recorded as part of expense reductions in the Statement of Operations. For the year ended May 31, 2017, these minimum account balance fees reduced total expenses of the Fund by $3,200.
Distribution and service fees
The Fund has an agreement with Columbia Management Investment Distributors, Inc. (the Distributor), an affiliate of the Investment Manager and a wholly-owned subsidiary of Ameriprise Financial, for distribution and shareholder services. The Board of Trustees has approved, and the Fund has adopted, distribution and shareholder service plans (the Plans) applicable to certain share classes, which set the distribution and service fees for the Fund. These fees are calculated daily and are intended to compensate the Distributor and/or eligible selling and/or servicing agents for selling shares of the Fund and providing services to investors.
Under the Plans, the Fund pays a monthly service fee to the Distributor at the maximum annual rate of 0.25% of the average daily net assets attributable to Class A, Class B, Class C and Class T shares of the Fund. Also under the Plans, the Fund pays a monthly distribution fee to the Distributor at the maximum annual rates of 0.10%, 0.75%, 0.75%, 0.50% and 0.25% of the average daily net assets attributable to Class A, Class B, Class C, Class R and Class T shares of the Fund, respectively.
| 26 | Columbia Dividend Income Fund | Annual Report 2017 |
Notes to Financial Statements (continued)
May 31, 2017
Although the Fund may pay distribution and service fees up to a maximum annual rate of 0.35% of the Fund’s average daily net assets attributable to Class A shares (comprised of up to 0.10% for distribution services and up to 0.25% for shareholder liaison services), the Fund currently limits such fees to an aggregate fee of not more than 0.25% of the Fund’s average daily net assets attributable to Class A shares.
Although the Fund may pay a distribution fee up to 0.25% of the Fund’s average daily net assets attributable to Class T shares and a service fee of up to 0.25% of the Fund’s average daily net assets attributable to Class T shares, the aggregate fee shall not exceed 0.25% of the Fund’s average daily net assets attributable to Class T shares.
Shareholder services fees
The Fund has adopted a shareholder services plan that permits it to pay for certain services provided to Class V shareholders by their selling and/or servicing agents. The Fund may pay shareholder servicing fees up to an aggregate annual rate of 0.50% of the Fund’s average daily net assets attributable to Class V shares (comprised of up to 0.25% for shareholder liaison services and up to 0.25% for administrative support services). These fees are currently limited to an aggregate annual rate of not more than 0.25% of the Fund’s average daily net assets attributable to Class V shares.
Sales charges (unaudited)
Sales charges, including front-end charges and CDSCs, received by the Distributor for distributing Fund shares for the year ended May 31, 2017, if any, are listed below:
| | Amount ($) |
| Class A | 3,148,937 |
| Class B | 1,165 |
| Class C | 61,221 |
| Class V | 1,586 |
Expenses waived/reimbursed by the Investment Manager and its affiliates
The Investment Manager and certain of its affiliates have contractually agreed to waive fees and/or reimburse expenses (excluding certain fees and expenses described below) for the periods disclosed below, unless sooner terminated at the sole discretion of the Board of Trustees, so that the Fund’s net operating expenses, after giving effect to fees waived/expenses reimbursed and any balance credits and/or overdraft charges from the Fund’s custodian, do not exceed the following annual rates as a percentage of the class’ average daily net assets:
| | October 1, 2016
through
Septemeber 30, 2017 | Prior to
October 1, 2016 |
| Class A | 1.190% | 1.13% |
| Class B | 1.940 | 1.88 |
| Class C | 1.940 | 1.88 |
| Class R | 1.440 | 1.38 |
| Class R4 | 0.940 | 0.88 |
| Class R5 | 0.860 | 0.79 |
| Class T | 1.190 | 1.13 |
| Class V | 1.190 | 1.13 |
| Class Y | 0.810 | 0.74 |
| Class Z | 0.940 | 0.88 |
Under the agreement governing these fee waivers and/or expense reimbursement arrangements, the following fees and expenses are excluded from the waiver/reimbursement commitment, and therefore will be paid by the Fund, if applicable: taxes (including foreign transaction taxes), expenses associated with investments in affiliated and non-affiliated pooled investment vehicles (including mutual funds and exchange-traded funds), transaction costs and brokerage commissions, costs related to any securities lending program, dividend and interest expenses associated with securities sold short, inverse floater program fees and expenses, transaction charges and interest on borrowed money, interest,
Columbia Dividend Income Fund | Annual Report 2017
| 27 |
Notes to Financial Statements (continued)
May 31, 2017
infrequent and/or unusual expenses and any other expenses the exclusion of which is specifically approved by the Board of Trustees. This agreement may be modified or amended only with approval from the Investment Manager, certain of its affiliates and the Fund. Any fees waived and/or expenses reimbursed under the expense reimbursement arrangements described above are not recoverable by the Investment Manager or its affiliates in future periods.
Note 4. Federal tax information
The timing and character of income and capital gain distributions are determined in accordance with income tax regulations, which may differ from GAAP because of temporary or permanent book to tax differences.
At May 31, 2017, these differences are primarily due to differing treatment for deferral/reversal of wash sale losses, re-characterization of distributions for investments, trustees’ deferred compensation and foreign currency transactions. To the extent these differences are permanent, reclassifications are made among the components of the Fund’s net assets in the Statement of Assets and Liabilities. Temporary differences do not require reclassifications.
In the Statement of Assets and Liabilities the following reclassifications were made:
Undistributed net
investment
income ($) | Accumulated
net realized
gain ($) | Paid in
capital ($) |
| (881,708) | 881,708 | — |
Net investment income (loss) and net realized gains (losses), as disclosed in the Statement of Operations, and net assets were not affected by these reclassifications.
The tax character of distributions paid during the years indicated was as follows:
| May 31, 2017 | May 31, 2016 |
Ordinary
income ($) | Long-term
capital gains ($) | Total ($) | Ordinary
income (S) | Long-term
capital gains ($) | Total ($) |
| 172,510,759 | 223,616,272 | 396,127,031 | 220,439,013 | 416,557,944 | 636,996,957 |
Short-term capital gain distributions, if any, are considered ordinary income distributions for tax purposes.
At May 31, 2017, the components of distributable earnings on a tax basis were as follows:
Undistributed
ordinary income ($) | Undistributed
long-term
capital gains ($) | Capital loss
carryforwards ($) | Net unrealized
appreciation ($) |
| 30,313,375 | 96,073,861 | — | 3,716,353,708 |
At May 31, 2017, the cost of investments for federal income tax purposes along with the aggregate gross unrealized appreciation and depreciation based on that cost was:
Federal
tax cost ($) | Gross unrealized
appreciation ($) | Gross unrealized
(depreciation) ($) | Net unrealized
appreciation ($) |
| 6,631,654,168 | 3,732,915,315 | (16,561,607) | 3,716,353,708 |
Management of the Fund has concluded that there are no significant uncertain tax positions in the Fund that would require recognition in the financial statements. However, management’s conclusion may be subject to review and adjustment at a later date based on factors including, but not limited to, new tax laws, regulations, and administrative interpretations (including relevant court decisions). Generally, the Fund’s federal tax returns for the prior three fiscal years remain subject to examination by the Internal Revenue Service.
| 28 | Columbia Dividend Income Fund | Annual Report 2017 |
Notes to Financial Statements (continued)
May 31, 2017
Note 5. Portfolio information
The cost of purchases and proceeds from sales of securities, excluding short-term investments and derivatives, if any, aggregated to $1,654,676,871 and $1,538,971,045, respectively, for the year ended May 31, 2017. The amount of purchase and sale activity impacts the portfolio turnover rate reported in the Financial Highlights.
Note 6. Affiliated money market fund
The Fund invests in Columbia Short-Term Cash Fund, an affiliated money market fund established for the exclusive use by the Fund and other affiliated funds (the Affiliated MMF). The income earned by the Fund from such investments is included as Dividends - affiliated issuers in the Statement of Operations. As an investing fund, the Fund indirectly bears its proportionate share of the expenses of the Affiliated MMF. Effective October 1, 2016, the Affiliated MMF prices its shares with a floating net asset value (NAV) and no longer seeks to maintain a stable NAV. In addition, the Board of Trustees of the Affiliated MMF may impose a fee on redemptions (sometimes referred to as a liquidity fee) or temporarily suspend redemptions (sometimes referred to as imposing a redemption gate) in the event its liquidity falls below regulatory limits.
Note 7. Line of credit
The Fund has access to a revolving credit facility with a syndicate of banks led by Citibank, N.A., HSBC Bank USA, N.A. and JPMorgan Chase Bank, N.A. whereby the Fund may borrow for the temporary funding of shareholder redemptions or for other temporary or emergency purposes. The credit facility agreement, which is a collective agreement between the Fund and certain other funds managed by the Investment Manager, severally and not jointly, permits collective borrowings up to $1 billion. Interest is charged to each participating fund based on its borrowings at a rate equal to the higher of (i) the overnight federal funds rate plus 1.00% or (ii) the one-month LIBOR rate plus 1.00%. Each borrowing under the credit facility matures no later than 60 days after the date of borrowing. The Fund also pays a commitment fee equal to its pro rata share of the amount of the credit facility at a rate of 0.15% per annum. The commitment fee is included in other expenses in the Statement of Operations.
The Fund had no borrowings during the year ended May 31, 2017.
Note 8. Significant risks
Shareholder concentration risk
At May 31, 2017, unaffiliated shareholders of record owned 39.6% of the outstanding shares of the Fund in one or more accounts. The Fund has no knowledge about whether any portion of those shares was owned beneficially. Affiliated shareholders of record owned 13.2% of the outstanding shares of the Fund in one or more accounts. Subscription and redemption activity by concentrated accounts may have a significant effect on the operations of the Fund. In the case of a large redemption, the Fund may be forced to sell investments at inopportune times, including its liquid or more liquid positions, resulting in Fund losses and the Fund holding a higher percentage of less liquid or illiquid securities. Large redemptions could result in decreased economies of scale and increased operating expenses for non-redeeming Fund shareholders.
Note 9. Subsequent events
Management has evaluated the events and transactions that have occurred through the date the financial statements were issued. Other than as noted in Note 1 above, there were no items requiring adjustment of the financial statements or additional disclosure.
Note 10. Information regarding pending and settled legal proceedings
Ameriprise Financial and certain of its affiliates have historically been involved in a number of legal, arbitration and regulatory proceedings, including routine litigation, class actions, and governmental actions, concerning matters arising in connection with the conduct of their business activities. Ameriprise Financial believes that the Funds are not currently the subject of, and that neither Ameriprise Financial nor any of its affiliates are the subject of, any pending legal, arbitration or regulatory proceedings that are likely to have a material adverse effect on the Funds or the ability of Ameriprise Financial or its affiliates
Columbia Dividend Income Fund | Annual Report 2017
| 29 |
Notes to Financial Statements (continued)
May 31, 2017
to perform under their contracts with the Funds. Ameriprise Financial is required to make quarterly (10-Q), annual (10-K) and, as necessary, 8-K filings with the Securities and Exchange Commission (SEC) on legal and regulatory matters that relate to Ameriprise Financial and its affiliates. Copies of these filings may be obtained by accessing the SEC website at www.sec.gov.
There can be no assurance that these matters, or the adverse publicity associated with them, will not result in increased Fund redemptions, reduced sale of Fund shares or other adverse consequences to the Funds. Further, although we believe proceedings are not likely to have a material adverse effect on the Funds or the ability of Ameriprise Financial or its affiliates to perform under their contracts with the Funds, these proceedings are subject to uncertainties and, as such, we are unable to estimate the possible loss or range of loss that may result. An adverse outcome in one or more of these proceedings could result in adverse judgments, settlements, fines, penalties or other relief that could have a material adverse effect on the consolidated financial condition or results of operations of Ameriprise Financial.
| 30 | Columbia Dividend Income Fund | Annual Report 2017 |
Report of Independent Registered Public Accounting Firm
To the Trustees of Columbia Funds Series Trust I and the Shareholders of Columbia Dividend Income Fund
In our opinion, the accompanying statement of assets and liabilities, including the portfolio of investments, and the related statements of operations and of changes in net assets and the financial highlights present fairly, in all material respects, the financial position of Columbia Dividend Income Fund (the “Fund”, a series of Columbia Funds Series Trust I) as of May 31, 2017, the results of its operations for the year then ended, the changes in its net assets for each of the two years in the period then ended and the financial highlights for each of the five years in the period then ended, in conformity with accounting principles generally accepted in the United States of America. These financial statements and financial highlights (hereafter referred to as “financial statements”) are the responsibility of the Fund’s management. Our responsibility is to express an opinion on these financial statements based on our audits. We conducted our audits of these financial statements in accordance with the standards of the Public Company Accounting Oversight Board (United States). Those standards require that we plan and perform the audit to obtain reasonable assurance about whether the financial statements are free of material misstatement. An audit includes examining, on a test basis, evidence supporting the amounts and disclosures in the financial statements, assessing the accounting principles used and significant estimates made by management, and evaluating the overall financial statement presentation. We believe that our audits, which included confirmation of securities as of May 31, 2017 by correspondence with the custodian and transfer agent, provide a reasonable basis for our opinion.
PricewaterhouseCoopers LLP
Minneapolis, MN
July 21, 2017
Columbia Dividend Income Fund | Annual Report 2017
| 31 |
Federal Income Tax Information
(Unaudited)
The Fund hereby designates the following tax attributes for the fiscal year ended May 31, 2017. Shareholders will be notified in early 2018 of the amounts for use in preparing 2017 income tax returns.
Qualified
dividend
income | Dividends
received
deduction | Capital
gain
dividend |
| 100.00% | 100.00% | $175,460,757 |
Qualified dividend income. For taxable, non-corporate shareholders, the percentage of ordinary income distributed during the fiscal year that represents qualified dividend income subject to reduced tax rates.
Dividends received deduction. The percentage of ordinary income distributed during the fiscal year that qualifies for the corporate dividends received deduction.
Capital gain dividend. The Fund designates as a capital gain dividend the amount reflected above, or if subsequently determined to be different, the net capital gain of such fiscal period.
| 32 | Columbia Dividend Income Fund | Annual Report 2017 |
Shareholders elect the Board that oversees the Fund’s operations. The Board appoints officers who are responsible for day-to-day business decisions based on policies set by the Board. The following table provides basic biographical information about the Fund’s Trustees, including their principal occupations during the past five years, although specific titles for individuals may have varied over the period. The year set forth beneath Length of Service in the table below is the year in which the Trustee was first appointed or elected as Trustee to any Fund currently in the Columbia Funds Complex or a predecessor thereof. Under current Board policy, members serve terms of indefinite duration.
Independent trustees
| Name, address, year of birth | Position held with the Trust and length of service | Principal occupation(s) during the past five years and other relevant professional experience | Number of Funds in the Columbia Fund Complex overseen | Other directorships held by Trustee during the past five years |
Janet Langford Carrig
c/o Columbia Management
Investment Advisers, LLC
225 Franklin Street
Mail Drop BX32 05228
Boston, MA 02110
1957 | Trustee
1996 | Senior Vice President, General Counsel and Corporate Secretary, ConocoPhillips (independent energy company) since September 2007 | 57 | None |
Douglas A. Hacker
c/o Columbia Management
Investment Advisers, LLC
225 Franklin Street
Mail Drop BX32 05228
Boston, MA 02110
1955 | Trustee and Chairman of the Board
1996 | Independent business executive since May 2006; Executive Vice President — Strategy of United Airlines from December 2002 to May 2006; President of UAL Loyalty Services (airline marketing company) from September 2001 to December 2002; Executive Vice President and Chief Financial Officer of United Airlines from July 1999 to September 2001 | 57 | Spartan Nash Company, (food distributor); Nash Finch Company (food distributor) from 2005 to 2013; Aircastle Limited (aircraft leasing); SeaCube Container Leasing Ltd. (container leasing) from 2010 to 2013; and Travelport Worldwide Limited (travel information technology) |
Nancy T. Lukitsh
c/o Columbia Management
Investment Advisers, LLC
225 Franklin Street
Mail Drop BX32 05228
Boston, MA 02110
1956 | Trustee
2011 | Senior Vice President, Partner and Director of Marketing, Wellington Management Company, LLP (investment adviser) from 1997 to 2010; Chair, Wellington Management Portfolios (commingled non-U.S. investment pools) from 2007 to 2010; Director, Wellington Trust Company, NA and other Wellington affiliates from 1997 to 2010 | 57 | None |
David M. Moffett
c/o Columbia Management
Investment Advisers, LLC
225 Franklin Street
Mail Drop BX32 05228
Boston, MA 02110
1952 | Trustee
2011 | Retired. Consultant to Bridgewater and Associates | 57 | Director, CSX Corporation; Genworth Financial, Inc. (financial and insurance products and services); PayPal Holdings Inc. (payment and data processing services); Trustee, University of Oklahoma Foundation; former Director, eBay Inc. (online trading community), 2007-2015; and former Director, CIT Bank, CIT Group Inc. (commercial and consumer finance), 2010-2016 |
Columbia Dividend Income Fund | Annual Report 2017
| 33 |
TRUSTEES AND OFFICERS (continued)
Independent trustees (continued)
| Name, address, year of birth | Position held with the Trust and length of service | Principal occupation(s) during the past five years and other relevant professional experience | Number of Funds in the Columbia Fund Complex overseen | Other directorships held by Trustee during the past five years |
Charles R. Nelson
c/o Columbia Management
Investment Advisers, LLC
225 Franklin Street
Mail Drop BX32 05228
Boston, MA 02110
1942 | Trustee
1981 | Retired. Professor Emeritus, University of Washington since 2011; Professor of Economics, University of Washington from 1976 to 2011; Ford and Louisa Van Voorhis Professor of Political Economy, University of Washington from 1993 to 2011; Adjunct Professor of Statistics, University of Washington from 1980 to 2011; Associate Editor, Journal of Money, Credit and Banking from September 1993 to 2008; consultant on econometric and statistical matters | 57 | None |
John J. Neuhauser
c/o Columbia Management
Investment Advisers, LLC
225 Franklin Street
Mail Drop BX32 05228
Boston, MA 02110
1943 | Trustee
1984 | President, Saint Michael’s College since August 2007; Director or Trustee of several non-profit organizations, including University of Vermont Medical Center; Academic Vice President and Dean of Faculties, Boston College from August 1999 to October 2005; University Professor, Boston College from November 2005 to August 2007 | 57 | Liberty All-Star Equity Fund and Liberty All- Star Growth Fund (closed-end funds) |
Patrick J. Simpson
c/o Columbia Management
Investment Advisers, LLC
225 Franklin Street
Mail Drop BX32 05228
Boston, MA 02110
1944 | Trustee
2000 | Of Counsel, Perkins Coie LLP (law firm) since 2015; Partner, Perkins Coie LLP from 1988 to 2014 | 57 | None |
Anne-Lee Verville
c/o Columbia Management
Investment Advisers, LLC
225 Franklin Street
Mail Drop BX32 05228
Boston, MA 02110
1945 | Trustee
1998 | Retired. General Manager, Global Education Industry from 1994 to 1997, President – Application Systems Division from 1991 to 1994, Chief Financial Officer – US Marketing & Services from 1988 to 1991, and Chief Information Officer from 1987 to 1988, IBM Corporation (computer and technology) | 57 | Enesco Group, Inc. (producer of giftware and home and garden decor products) from 2001 to 2006 |
| 34 | Columbia Dividend Income Fund | Annual Report 2017 |
TRUSTEES AND OFFICERS (continued)
Consultants to the Independent Trustees*
| Name, address, year of birth | Position held with the Trust and length of service | Principal occupation(s) during the past five years and other relevant professional experience | Number of Funds in the Columbia Funds complex overseen | Other directorships held by Trustee during the past five years |
J. Kevin Connaughton
c/o Columbia
Management Investment
Advisers, LLC,
225 Franklin Street
Mail Drop BX32 05228,
Boston, MA 02110
1964 | Independent Trustee Consultant
2016 | Independent Trustee Consultant, Columbia Funds since March 2016; Managing Director and General Manager of Mutual Fund Products, Columbia Management Investment Advisers, LLC from May 2010 to February 2015; President, Columbia Funds from 2009 to 2015; and senior officer of Columbia Funds and affiliated funds from 2003 to 2015 | 57 | Board of Governors, Gateway Healthcare since January 2016; Trustee, New Century Portfolios since March 2015; and Director, The Autism Project since March 2015 |
Natalie A. Trunow
c/o Columbia
Management Investment
Advisers, LLC,
225 Franklin Street
Mail Drop BX32 05228,
Boston, MA 02110
1967 | Independent Trustee Consultant
2016 | Independent Trustee Consultant, Columbia Funds since September 2016; Chief Executive Officer, Millennial Partners (investment consulting services to institutions) since January 2016; Director of Investments, Casey Family Programs from April 2016 to September 2016; Senior Vice President and Chief Investment Officer, Calvert Investments from August 2008 to January 2016; Section Head and Portfolio Manager, General Motors Asset Management from June 1997 to August 2008 | 57 | Healthcare Services for Children with Special Needs |
| * | J. Kevin Connaughton was appointed consultant to the Independent Trustees effective March 1, 2016. Natalie A. Trunow was appointed consultant to the Independent Trustees effective September 1, 2016. Shareholders of the Funds are expected to be asked to elect each of Mr. Connaughton and Ms. Trunow as a Trustee at a future shareholder meeting. |
Interested trustee affiliated with Investment Manager*
| Name, address, year of birth | Position held with the Trust and length of service | Principal occupation(s) during the past five years and other relevant professional experience | Number of Funds in the Columbia Funds Complex overseen | Other directorships held by Trustee during the past five years |
William F. Truscott
c/o Columbia Management
Investment Advisers, LLC
225 Franklin Street
Boston, MA 02110
1960 | Trustee
2012 | Chairman of the Board and President, Columbia Management Investment Advisers, LLC since May 2010 and February 2012, respectively; Chief Executive Officer, Global Asset Management, Ameriprise Financial, Inc. since September 2012 (previously Chief Executive Officer, U.S. Asset Management & President, Annuities, May 2010-September 2012); Director and Chief Executive Officer, Columbia Management Investment Distributors, Inc. since May 2010 and February 2012, respectively; Chairman of the Board and Chief Executive Officer, RiverSource Distributors, Inc. since 2006; Director, Threadneedle Asset Management Holdings, SARL since 2014; President and Chief Executive Officer, Ameriprise Certificate Company, 2006-August 2012 | 179 | Chairman of the Board, Columbia Management Investment Advisers, LLC since May 2010; Director, Columbia Management Investment Distributors, Inc. since May 2010; former Director, Ameriprise Certificate Company, 2006 - January 2013 |
| * | Interested person (as defined under the 1940 Act) by reason of being an officer, director, security holder and/or employee of the Investment Manager or Ameriprise Financial. |
The Statement of Additional Information has additional information about the Fund’s Board members and is available,
without charge, upon request by calling 800.345.6611; contacting your financial intermediary; or visiting
investor.columbiathreadneedleus.com.
Columbia Dividend Income Fund | Annual Report 2017
| 35 |
TRUSTEES AND OFFICERS (continued)
The Board has appointed officers who are responsible for day-to-day business decisions based on policies it has established. The officers serve at the pleasure of the Board. The following table provides basic information about the Officers of the Fund, including principal occupations during the past five years, although their specific titles may have varied over the period. In addition to Mr. Truscott, who is Senior Vice President, the Fund’s other officers are:
Fund officers
Name,
address and
year of birth | Position and year
first appointed to
position for any Fund
in the Columbia
Funds complex or a
predecessor thereof | Principal occupation(s) during past five years |
Christopher O. Petersen
5228 Ameriprise
Financial Center
Minneapolis, MN 55474
Born 1970 | President and Principal Executive Officer (2015) | Vice President and Lead Chief Counsel, Ameriprise Financial, Inc. since January 2015 (previously, Vice President and Chief Counsel, January 2010 - December 2014; officer of Columbia Funds and affiliated funds since 2007. |
Michael G. Clarke
225 Franklin Street
Boston, MA 02110
Born 1969 | Treasurer (2011), Chief Financial Officer (2009) and Chief Accounting Officer (2015) | Vice President — Mutual Fund Administration, Columbia Management Investment Advisers, LLC, since May 2010; senior officer of Columbia Funds and affiliated funds since 2002. |
Paul B. Goucher
100 Park Avenue
New York, NY 10017
Born 1968 | Senior Vice President (2011) and Assistant Secretary (2008) | Senior Vice President and Assistant General Counsel, Ameriprise Financial, Inc. since January 2017 (previously Vice President and Lead Chief Counsel, November 2008 - January 2017 and January 2013 - January 2017, respectively; and Chief Counsel, January 2010 - January 2013); Vice President, Chief Legal Officer and Assistant Secretary, Columbia Management Investment Advisers, LLC since May 2010. |
Thomas P. McGuire
225 Franklin Street
Boston, MA 02110
Born 1972 | Senior Vice President and Chief Compliance Officer (2012) | Vice President — Asset Management Compliance, Ameriprise Financial, Inc., since May 2010; Chief Compliance Officer, Ameriprise Certificate Company since September 2010. |
Colin Moore
225 Franklin Street
Boston, MA 02110
Born 1958 | Senior Vice President (2010) | Executive Vice President and Global Chief Investment Officer, Ameriprise Financial, Inc., since July 2013; Executive Vice President and Global Chief Investment Officer, Columbia Management Investment Advisers, LLC since July 2013 (previously Director and Global Chief Investment Officer, 2010 - 2013). |
Ryan C. Larrenaga
225 Franklin Street
Boston, MA 02110
Born 1970 | Senior Vice President (2017), Chief Legal Officer (2017) and Secretary (2015) | Vice President and Group Counsel, Ameriprise Financial, Inc. since August 2011; officer of Columbia Funds and affiliated funds since 2005. |
Michael E. DeFao
225 Franklin Street
Boston, MA 02110
Born 1968 | Vice President (2011) and Assistant Secretary (2010) | Vice President and Chief Counsel, Ameriprise Financial, Inc. since May 2010. |
Amy Johnson
5228 Ameriprise
Financial Center
Minneapolis, MN 55474
Born 1965 | Vice President (2006) | Managing Director and Global Head of Operations, Columbia Management Investment Advisers, LLC since April 2016 (previously Managing Director and Chief Operating Officer, 2010 - 2016). |
Lyn Kephart-Strong
5228 Ameriprise
Financial Center
Minneapolis, MN 55474
Born 1960 | Vice President (2015) | President, Columbia Management Investment Services Corp. since October 2014; Vice President & Resolution Officer, Ameriprise Trust Company since August 2009. |
| 36 | Columbia Dividend Income Fund | Annual Report 2017 |
The Fund mails one shareholder report to each shareholder address. If you would like more than one report, please call shareholder services at 800.345.6611 and additional reports will be sent to you.
Proxy voting policies and procedures
The policy of the Board of Trustees is to vote the proxies of the companies in which the Fund holds investments consistent with the procedures as stated in the Statement of Additional Information (SAI). You may obtain a copy of the SAI without charge by calling 800.345.6611; contacting your financial intermediary; visiting investor.columbiathreadneedleus.com; or searching the website of the Securities and Exchange Commission (SEC) at sec.gov. Information regarding how the Fund voted proxies relating to portfolio securities is filed with the SEC by August 31st for the most recent 12-month period ending June 30th of that year, and is available without charge by visiting investor.columbiathreadneedleus.com, or searching the website of the SEC at sec.gov.
Quarterly schedule of investments
The Fund files a complete schedule of portfolio holdings with the SEC for the first and third quarters of each fiscal year on Form N-Q. The Fund’s Form N-Q is available on the SEC’s website at sec.gov and may be reviewed and copied at the SEC’s Public Reference Room in Washington, D.C. Information on the operation of the Public Reference Room may be obtained by calling 800.SEC.0330. The Fund’s complete schedule of portfolio holdings, as filed on Form N-Q, can also be obtained without charge, upon request, by calling 800.345.6611.
Additional Fund information
For more information about the Fund, please visit investor.columbiathreadneedleus.com or call 800.345.6611. Customer Service Representatives are available to answer your questions Monday through Friday from 8 a.m. to 7 p.m. Eastern time.
Fund investment manager
Columbia Management Investment Advisers, LLC
225 Franklin Street
Boston, MA 02110
Fund distributor
Columbia Management Investment Distributors, Inc.
225 Franklin Street
Boston, MA 02110
Fund transfer agent
Columbia Management Investment Services Corp.
P.O. Box 8081
Boston, MA 02266-8081
Columbia Dividend Income Fund | Annual Report 2017
| 37 |
Columbia Dividend Income Fund
P.O. Box 8081
Boston, MA 02266-8081
Please read and consider the investment objectives, risks, charges and expenses for any fund carefully before investing. For a prospectus and summary prospectus, which contains this and other important information about the Fund, go to
investor.columbiathreadneedleus.com. The Fund is distributed by Columbia Management Investment Distributors, Inc., member FINRA, and managed by Columbia Management Investment Advisers, LLC.
Columbia Threadneedle Investments (Columbia Threadneedle) is the global brand name of the Columbia and Threadneedle group of companies. All rights reserved. Columbia Management Investment Distributors, Inc., 225 Franklin Street, Boston, MA 02110-2804
© 2017 Columbia Management Investment Advisers, LLC.
investor.columbiathreadneedleus.com

Annual Report
May 31, 2017
Columbia High Yield Municipal Fund
Not FDIC Insured • No bank guarantee • May lose value
Dear Shareholders,
The current outlook for financial markets is clouded by two primary concerns: the high valuation of equities and the direction of interest rates. Following the U.S. presidential election, U.S. equities rallied based on the assumption that the new administration’s policies would stimulate growth quickly. Unfortunately it’s unclear whether those measures will get passed, much less passed quickly. In fixed income, uncertainty stems from the possibility that interest rates won’t rise as rapidly as expected if the administration’s proposed growth policies are not implemented.
Given this uncertainty, investors value a consistent approach more than ever. Investors want strong, repeatable risk-adjusted returns. Consistency — not surprises. As a leading global asset manager, we believe our consistent, collaborative investment approach enables us to deliver the dependable experience your portfolio demands. So, how do we strive to deliver a consistent investment experience?
Better insights
Your portfolio benefits from the investment insights uncovered by our talented investment teams around the world.
Better decisions
Our collaborative, interactive environment enables our investment teams to construct portfolios that take advantage of the best investment ideas.
Better outcomes
We aim to deliver a consistent experience, which means fewer surprises, dependable insights, and products designed to do the thing you want.
Whether you’re trying to save money to help your children go to college or for your own retirement, it’s the consistency of the return that is most essential. People who chase higher returns are usually also the first to sell when that investment goes through a bad patch. We try to combat this behavioral tendency by offering strategies that aim for a more consistent return. Our goal is for investors to panic less during periods of volatility, which can have a significant effect on their long-term results.
Nothing is more important to us than making sure those who have entrusted us to protect and grow their assets can do what matters most to them: build a nest egg, leave a legacy, and live confidently — now and throughout retirement. It’s why our talented professionals around the world work together to uncover uncommon opportunities and why our process encourages challenge and debate around our most compelling ideas to ensure better informed investment decisions, which hopefully lead to better outcomes for you.
Your success is our priority. Talk to your financial advisor about how working with Columbia Threadneedle Investments may help you position your portfolio for consistent, sustainable outcomes, no matter the market conditions.
Sincerely,
Christopher O. Petersen
President, Columbia Funds
There is no guarantee that investment objectives will be achieved or that any particular investment will be profitable.
Columbia Funds are distributed by Columbia Management Investment Distributors, Inc., member FINRA, and managed by Columbia Management Investment Advisers, LLC.
© 2017 Columbia Management Investment Advisers, LLC. All rights reserved.
Columbia High Yield Municipal Fund | Annual Report 2017
Columbia High Yield Municipal Fund | Annual Report 2017
Investment objective
Columbia High Yield Municipal Fund (the Fund) seeks total return, consisting of current income exempt from federal income tax and capital appreciation.
Portfolio management
Chad Farrington, CFA
Co-manager
Managed Fund since 2009
Catherine Stienstra
Co-manager
Managed Fund since October 2016
| Average annual total returns (%) (for the period ended May 31, 2017) |
| | | Inception | 1 Year | 5 Years | 10 Years |
| Class A | Excluding sales charges | 07/31/00 | 1.81 | 4.75 | 4.17 |
| | Including sales charges | | -1.27 | 4.12 | 3.86 |
| Class B | Excluding sales charges | 07/15/02 | 1.05 | 3.97 | 3.40 |
| | Including sales charges | | -3.83 | 3.63 | 3.40 |
| Class C | Excluding sales charges | 07/15/02 | 1.15 | 4.10 | 3.54 |
| | Including sales charges | | 0.17 | 4.10 | 3.54 |
| Class R4 * | 03/19/13 | 1.92 | 4.97 | 4.38 |
| Class R5 * | 11/08/12 | 2.00 | 5.06 | 4.43 |
| Class Y * | 03/01/17 | 2.03 | 4.96 | 4.38 |
| Class Z | 03/05/84 | 2.01 | 4.96 | 4.38 |
| Blended Benchmark | | 3.35 | 4.59 | 4.56 |
| Bloomberg Barclays High Yield Municipal Bond Index | | 4.60 | 5.42 | 4.46 |
Returns for Class A are shown with and without the maximum initial sales charge of 3.00%. Returns for Class B are shown with and without the applicable contingent deferred sales charge (CDSC) of 5.00% in the first year, declining to 1.00% in the sixth year and eliminated thereafter. As of May 31, 2017, the Fund’s Class B investors, having held their shares for the requisite time period, were no longer subject to a CDSC upon redemption of their shares. Effective July 17, 2017, Class B shares were automatically converted to Class A shares and the Fund no longer accepts investments by new or existing investors in Class B shares. Returns for Class C are shown with and without the 1.00% CDSC for the first year only. The Fund’s other classes are not subject to sales charges and have limited eligibility. Please see the Fund’s prospectus for details. Performance for different share classes will vary based on differences in sales charges and fees associated with each class. All results shown assume reinvestment of distributions during the period. Returns do not reflect the deduction of taxes that a shareholder may pay on Fund distributions or on the redemption of Fund shares. Performance results reflect the effect of any fee waivers or reimbursements of Fund expenses by Columbia Management Investment Advisers, LLC and/or any of its affiliates. Absent these fee waivers or expense reimbursement arrangements, performance results would have been lower.
The performance information shown represents past performance and is not a guarantee of future results. The investment return and principal value of your investment will fluctuate so that your shares, when redeemed, may be worth more or less than their original cost. Current performance may be lower or higher than the performance information shown. You may obtain performance information current to the most recent month-end by contacting your financial intermediary, visiting investor.columbiathreadneedleus.com or calling 800.345.6611.
| * | The returns shown for periods prior to the share class inception date (including returns for the Life of the Fund, if shown, which are since Fund inception) include the returns of the Fund’s oldest share class. These returns are adjusted to reflect any higher class-related operating expenses of the newer share classes, as applicable. Please visit investor.columbiathreadneedleus.com/investment-products/mutual-funds/appended-performance for more information. |
The Blended Benchmark, established by the Investment Manager, consists of a 60% weighting of the Bloomberg Barclays High Yield Municipal Bond Index and a 40% weighting of the Bloomberg Barclays Municipal Bond Index.
The Bloomberg Barclays Municipal Bond Index is considered representative of the broad market for investment-grade, tax-exempt bonds with a maturity of at least one year.
The Bloomberg Barclays High Yield Municipal Bond Index is comprised of bonds with maturities greater than one-year, having a par value of at least $3 million issued as part of a transaction size greater than $20 million, and rated no higher than “BB+” or equivalent by any of the three principal rating agencies.
Indices are not available for investment, are not professionally managed and do not reflect sales charges, fees, brokerage commissions, taxes or other expenses of investing. Securities in the Fund may not match those in an index.
| 2 | Columbia High Yield Municipal Fund | Annual Report 2017 |
Fund at a Glance (continued)
Performance of a hypothetical $10,000 investment (May 31, 2007 — May 31, 2017)
The chart above shows the change in value of a hypothetical $10,000 investment in Class A shares of Columbia High Yield Municipal Fund during the stated time period, and does not reflect the deduction of taxes that a shareholder may pay on Fund distributions or on the redemption of Fund shares.
| Quality breakdown (%) (at May 31, 2017) |
| AAA rating | 1.7 |
| AA rating | 8.9 |
| A rating | 19.2 |
| BBB rating | 24.4 |
| BB rating | 7.1 |
| B rating | 1.3 |
| CC rating | 0.3 |
| C rating | 1.3 |
| Not rated | 35.8 |
| Total | 100.0 |
Percentages indicated are based upon total fixed income investments.
Bond ratings apply to the underlying holdings of the Fund and not the Fund itself and are divided into categories ranging from highest to lowest credit quality, determined by using the middle rating of Moody’s, S&P and Fitch, after dropping the highest and lowest available ratings. When ratings are available from only two rating agencies, the lower rating is used. When a rating is available from only one rating agency, that rating is used. When a bond is not rated by any rating agency, it is designated as “Not rated.” Credit quality ratings assigned by a rating agency are subjective opinions, not statements of fact, and are subject to change, including daily. The ratings assigned by credit rating agencies are but one of the considerations that the Investment Manager and/or Fund’s subadviser incorporates into its credit analysis process, along with such other issuer-specific factors as cash flows, capital structure and leverage ratios, ability to de-leverage (repay) through free cash flow, quality of management, market positioning and access to capital, as well as such security-specific factors as the terms of the security (e.g., interest rate and time to maturity) and the amount and type of any collateral.
Top Ten States/Territories (%)
(at May 31, 2017) |
| Illinois | 10.4 |
| Florida | 10.3 |
| California | 9.0 |
| Texas | 8.3 |
| Pennsylvania | 5.7 |
| New York | 5.3 |
| Michigan | 3.3 |
| New Jersey | 2.9 |
| Georgia | 2.9 |
| Colorado | 2.9 |
Percentages indicated are based upon total investments.
For further detail about these holdings, please refer to the section entitled “Portfolio of Investments.”
Fund holdings are as of the date given, are subject to change at any time, and are not recommendations to buy or sell any security.
Columbia High Yield Municipal Fund | Annual Report 2017
| 3 |
Manager Discussion of Fund Performance
For the 12-month period that ended May 31, 2017, Class A shares of the Fund returned 1.81% excluding sales charges. Class Z shares of the Fund returned 2.01% for the same 12 months. During the same time period, the Fund’s Blended Benchmark returned 3.35%, and the Bloomberg Barclays High Yield Municipal Bond Index returned 4.60%.
Uneven performance for municipal bonds
The municipal bond market experienced a fair amount of volatility during the 12 months ended May 31, 2017. Yields reached historic lows at the beginning of the period (indicating strength in prices), but the combination of large new issue supply and an unexpected presidential election result led to a sharp, but brief, downturn in November 2016. Strong demand for municipal bonds — together with lower new issue supply — fueled a return of positive momentum from December onward, but yields nonetheless closed above where they stood at the beginning of the reporting period.
With the exception of difficulties experienced by a handful of selected issuers, credit conditions generally remained stable. However, yield spreads widened following the election and remained attractive in certain sectors at the end of the period. Tobacco was once again the best performing sector, as above-average yields attracted robust investor demand.
Contributors and detractors
Three factors stood out as being notable causes for the Fund’s underperformance relative to its benchmark.
First, the Fund held an underweight position in tobacco securitization debt (i.e., bonds issued by state governments that are backed by legal settlement payments from tobacco companies). Tobacco is one of the largest sector weightings in the Fund’s Blended Benchmark, but the Fund is typically underweight the group since it is one of the most volatile segments of the municipal market. With that said, we took advantage of the downturn that followed the November election to increase the Fund’s tobacco allocation at what we believed to be attractive levels. As prices rebounded and approached par later in the period, we reduced exposure to the sector.
Second, the Fund’s underweight in Puerto Rico weighed on performance as certain securities rebounded from the very distressed levels of mid-2016. We increased the extent of the underweight later in the period due to what we saw as diminished recovery prospects.
Third, the underperformance of several high-yield holdings in the Fund that either defaulted or experienced distress detracted from performance. Notable defaults included Allen Academy Charter School (Michigan), UTS Bioenergy (a California-based operator of fuel-cell plants), and Louisiana Pellets, a maker of wood pellets that sold its properties in bankruptcy. Texas Pellets, which encountered problems with one of its facilities as it moved toward a bankruptcy auction, further detracted. A position in the Florida-based fertilizer company Annuvia, which suffered operational problems stemming from waste disposal issues, also negatively impacted the Fund’s performance.
On the plus side, we added value by having an underweight in short-maturity bonds. Short-term issues have a higher degree of sensitivity to U.S. Federal Reserve (Fed) policy, which was a headwind at a time in which the Fed was raising rates. Certain holdings in local general obligation bonds, namely Chicago and Atlantic City, contributed positively as improving fundamental news led to stronger sentiment regarding their credit quality. Overweight allocations to high-yield sectors, namely continuing care retirement communities (CCRCs) and charter schools, performed well due to the robust demand for higher yielding investments.
A risk-conscious approach
In terms of our portfolio activity, we generally sought to maintain buying discipline early in the period given that yields were near all-time lows. The Fund’s overall credit quality shifted higher in this time, reflecting tighter yield spreads and a dearth of compelling opportunities in the high-yield segment. However, as yields rose in late 2016, we were able to find some attractive opportunities among lower quality issues. The Fund’s average credit quality composition ended the annual period slightly lower than where it began.
| 4 | Columbia High Yield Municipal Fund | Annual Report 2017 |
Manager Discussion of Fund Performance (continued)
The market’s overall credit quality remained stable at the close of May, and investors had segregated Puerto Rico as a unique situation. Nevertheless, Illinois attracted attention as the political stalemate on balancing its budget continued. Developments in Illinois may carry risks for the broader market, particularly if bondholders’ strong legal protections are questioned and applied to other, weaker bonds. Accordingly, we continue to closely monitor credit conditions in the state.
We maintained a higher quality bias, with the majority of the portfolio allocated to investment-grade bonds at the end of the period. In addition, we retained a high level of selectivity in adding lower quality securities given where we believe we are in the economic cycle. The Fund held a longer duration (higher interest-rate sensitivity) than the benchmark at the end of the period, based on our broader view that deflationary forces and lower odds of significant economic growth may constrain the possible upside for rates.
Fixed-income securities present issuer default risk. The Fund invests substantially in municipal securities and will be affected by tax, legislative, regulatory, demographic or political changes, as well as changes impacting a state’s financial, economic or other conditions. A relatively small number of tax-exempt issuers may necessitate the Fund investing more heavily in a single issuer and, therefore, be more exposed to the risk of loss than a Fund that invests more broadly. Prepayment and extension risk exists because a loan, bond or other investment may be called, prepaid or redeemed before maturity and similar yielding investments may not be available for purchase. A rise in interest rates may result in a price decline of fixed-income instruments held by the Fund, negatively impacting its performance and NAV. Falling rates may result in the Fund investing in lower yielding debt instruments, lowering the Fund’s income and yield. These risks may be heightened for longer maturity and duration securities. Non-investment-grade (high-yield or junk) securities present greater price volatility and more risk to principal and income than higher rated securities. Market risk may affect a single issuer, sector of the economy, industry or the market as a whole. Federal and state tax rules apply to capital gain distributions and any gains or losses on sales. Income may be subject to state, local or alternative minimum taxes. Market or other (e.g., interest rate) environments may adversely affect the liquidity of Fund investments, negatively impacting their price. Generally, the less liquid the market at the time the Fund sells a holding, the greater the risk of loss or decline of value to the Fund. See the Fund’s prospectus for more information on these and other risks.
The views expressed in this report reflect the current views of the respective parties. These views are not guarantees of future performance and involve certain risks, uncertainties and assumptions that are difficult to predict, so actual outcomes and results may differ significantly from the views expressed. These views are subject to change at any time based upon economic, market or other conditions and the respective parties disclaim any responsibility to update such views. These views may not be relied on as investment advice and, because investment decisions for a Columbia fund are based on numerous factors, may not be relied on as an indication of trading intent on behalf of any particular Columbia fund. References to specific securities should not be construed as a recommendation or investment advice.
Columbia High Yield Municipal Fund | Annual Report 2017
| 5 |
Understanding Your Fund’s Expenses
(Unaudited)
As an investor, you incur two types of costs. There are transaction costs, which generally include sales charges on purchases and may include redemption fees. There are also ongoing costs, which generally include management fees, distribution and/or service fees, and other fund expenses. The following information is intended to help you understand your ongoing costs (in dollars) of investing in the Fund and to help you compare these costs with the ongoing costs of investing in other mutual funds.
Analyzing your Fund’s expenses
To illustrate these ongoing costs, we have provided examples and calculated the expenses paid by investors in each share class of the Fund during the period. The actual and hypothetical information in the table is based on an initial investment of $1,000 at the beginning of the period indicated and held for the entire period. Expense information is calculated two ways and each method provides you with different information. The amount listed in the “Actual” column is calculated using the Fund’s actual operating expenses and total return for the period. You may use the Actual information, together with the amount invested, to estimate the expenses that you paid over the period. Simply divide your account value by $1,000 (for example, an $8,600 account value divided by $1,000 = 8.6), then multiply the results by the expenses paid during the period under the “Actual” column. The amount listed in the “Hypothetical” column assumes a 5% annual rate of return before expenses (which is not the Fund’s actual return) and then applies the Fund’s actual expense ratio for the period to the hypothetical return. You should not use the hypothetical account values and expenses to estimate either your actual account balance at the end of the period or the expenses you paid during the period. See “Compare with other funds” below for details on how to use the hypothetical data.
Compare with other funds
Since all mutual funds are required to include the same hypothetical calculations about expenses in shareholder reports, you can use this information to compare the ongoing cost of investing in the Fund with other funds. To do so, compare the hypothetical example with the 5% hypothetical examples that appear in the shareholder reports of other funds. As you compare hypothetical examples of other funds, it is important to note that hypothetical examples are meant to highlight the ongoing costs of investing in a fund only and do not reflect any transaction costs, such as sales charges, or redemption or exchange fees. Therefore, the hypothetical calculations are useful in comparing ongoing costs only, and will not help you determine the relative total costs of owning different funds. If transaction costs were included in these calculations, your costs would be higher.
| December 1, 2016 – May 31, 2017 |
| | Account value at the
beginning of the
period ($) | Account value at the
end of the
period ($) | Expenses paid during
the period ($) | Fund’s annualized
expense ratio (%) |
| | Actual | Hypothetical | Actual | Hypothetical | Actual | Hypothetical | Actual |
| Class A | 1,000.00 | 1,000.00 | 1,050.50 | 1,020.64 | 4.40 | 4.33 | 0.86 |
| Class B | 1,000.00 | 1,000.00 | 1,046.60 | 1,016.90 | 8.21 | 8.10 | 1.61 |
| Class C | 1,000.00 | 1,000.00 | 1,047.10 | 1,017.40 | 7.71 | 7.59 | 1.51 |
| Class R4 | 1,000.00 | 1,000.00 | 1,051.50 | 1,021.64 | 3.38 | 3.33 | 0.66 |
| Class R5 | 1,000.00 | 1,000.00 | 1,052.00 | 1,022.04 | 2.97 | 2.92 | 0.58 |
| Class Y | 1,000.00 | 1,000.00 | 1,028.60 (a) | 1,022.29 | 1.33 (a) | 2.67 | 0.53 (a) |
| Class Z | 1,000.00 | 1,000.00 | 1,051.60 | 1,021.64 | 3.38 | 3.33 | 0.66 |
(a) Based on operations from March 1, 2017 (commencement of operations) through the stated period end.
Expenses paid during the period are equal to the annualized expense ratio for each class as indicated above, multiplied by the average account value over the period and then multiplied by the number of days in the Fund’s most recent fiscal half year and divided by 365.
Expenses do not include fees and expenses incurred indirectly by the Fund from its investment in underlying funds, including affiliated and non-affiliated pooled investment vehicles, such as mutual funds and exchange-traded funds.
Had Columbia Management Investment Advisers, LLC and/or certain of its affiliates not waived/reimbursed certain fees and expenses, account value at the end of the period would have been reduced.
The Fund’s annualized expense ratio excludes the impact of an expense reimbursement from a third party due to overbilling.
| 6 | Columbia High Yield Municipal Fund | Annual Report 2017 |
Portfolio of Investments
May 31, 2017
(Percentages represent value of investments compared to net assets)
| Floating Rate Notes 1.0% |
| Issue Description | Effective
Yield | | Principal
Amount ($) | Value ($) |
| Minnesota 0.3% |
| City of Minneapolis/St. Paul Housing & Redevelopment Authority(a) |
| Revenue Bonds |
| VRDN Series 2009B-1 |
| 11/15/2035 | 0.780% | | 2,300,000 | 2,300,000 |
| New Hampshire 0.2% |
| New Hampshire Health & Education Facilities Authority Act(a) |
| Revenue Bonds |
University of New Hampshire
VRDN Series 2012B-2 |
| 07/01/2033 | 0.770% | | 1,250,000 | 1,250,000 |
| New York 0.5% |
| City of New York(a) |
| Unlimited General Obligation Bonds |
Fiscal 2015
VRDN Subordinated Series 2015 |
| 06/01/2044 | 0.790% | | 1,200,000 | 1,200,000 |
| VRDN Subordinated Series 2014D-3 |
| 10/01/2039 | 0.790% | | 3,100,000 | 3,100,000 |
| Total | 4,300,000 |
Total Floating Rate Notes
(Cost $7,850,000) | 7,850,000 |
|
| Municipal Bonds 97.9% |
| Issue Description | Coupon
Rate | | Principal
Amount ($) | Value ($) |
| Alabama 1.0% |
| Lower Alabama Gas District (The) |
| Revenue Bonds |
| Series 2016A |
| 09/01/2046 | 5.000% | | 4,215,000 | 5,241,310 |
| State of Alabama Docks Department(b) |
| Refunding Revenue Bonds |
Docks Facilities
Series 2017A (AGM) AMT |
| 10/01/2032 | 5.000% | | 2,500,000 | 2,914,725 |
| Total | 8,156,035 |
| Arizona 2.0% |
| Industrial Development Authority of the County of Pima (The) |
| Revenue Bonds |
American Charter Schools Foundation
Series 2007A |
| 07/01/2038 | 5.625% | | 3,840,000 | 3,855,091 |
| La Paz County Industrial Development Authority |
| Revenue Bonds |
Charter School Solutions - Harmony Public
Series 2016 |
| 02/15/2036 | 5.000% | | 1,200,000 | 1,284,684 |
| Municipal Bonds (continued) |
| Issue Description | Coupon
Rate | | Principal
Amount ($) | Value ($) |
Charter School Solutions - Harmony Public
Series 2016 |
| 02/15/2046 | 5.000% | | 1,500,000 | 1,564,410 |
| Maricopa County Industrial Development Authority(c) |
| Revenue Bonds |
Christian Care Surprise, Inc. Project
Series 2016 |
| 01/01/2048 | 6.000% | | 3,595,000 | 3,538,379 |
| Maricopa County Pollution Control Corp. |
| Revenue Bonds |
El Paso Electric Co. Project
Series 2009B |
| 04/01/2040 | 7.250% | | 3,600,000 | 3,961,296 |
| Surprise Municipal Property Corp. |
| Revenue Bonds |
| Series 2007 |
| 04/01/2032 | 4.900% | | 2,000,000 | 2,010,780 |
| Total | 16,214,640 |
| California 8.9% |
| Alameda Corridor Transportation Authority |
| Refunding Revenue Bonds |
2nd Subordinated Lien
Series 2016B |
| 10/01/2035 | 5.000% | | 1,000,000 | 1,143,330 |
| California Health Facilities Financing Authority |
| Refunding Revenue Bonds |
Northern California Presbyterian Homes
Series 2015 |
| 07/01/2039 | 5.000% | | 900,000 | 1,022,796 |
| California Municipal Finance Authority(b),(c) |
| Revenue Bonds |
UTS Renewable Energy-Waste Water Facilities
Series 2011 AMT |
| 12/01/2032 | 7.500% | | 1,835,000 | 458,750 |
| California Pollution Control Financing Authority(b),(c) |
| Revenue Bonds |
Aemerge Redpak Services Southern California, LLC Project
Series 2016 AMT |
| 12/01/2027 | 7.000% | | 2,500,000 | 2,443,150 |
| California State Public Works Board |
| Refunding Revenue Bonds |
Various Capital Projects
Series 2012G |
| 11/01/2037 | 5.000% | | 1,250,000 | 1,426,413 |
| California Statewide Communities Development Authority |
| Refunding Revenue Bonds |
899 Charleston Project
Series 2014A |
| 11/01/2044 | 5.250% | | 1,500,000 | 1,541,175 |
The accompanying Notes to Financial Statements are an integral part of this statement.
Columbia High Yield Municipal Fund | Annual Report 2017
| 7 |
Portfolio of Investments (continued)
May 31, 2017
| Municipal Bonds (continued) |
| Issue Description | Coupon
Rate | | Principal
Amount ($) | Value ($) |
| Revenue Bonds |
American Baptist Homes West
Series 2010 |
| 10/01/2039 | 6.250% | | 2,750,000 | 3,004,485 |
Loma Linda University Medical Center
Series 2014 |
| 12/01/2054 | 5.500% | | 5,000,000 | 5,468,300 |
| Chino Public Financing Authority |
| Refunding Special Tax Bonds |
| Series 2012 |
| 09/01/2034 | 5.000% | | 1,775,000 | 1,912,474 |
| City of Carson |
| Special Assessment Bonds |
Assessment District No. 92-1
Series 1992 |
| 09/02/2022 | 7.375% | | 60,000 | 60,596 |
| City of Long Beach Marina System |
| Revenue Bonds |
| Series 2015 |
| 05/15/2045 | 5.000% | | 500,000 | 547,680 |
| City of Los Angeles Department of Airports(b) |
| Revenue Bonds |
| Senior Series 2015A AMT |
| 05/15/2027 | 5.000% | | 1,250,000 | 1,497,775 |
| City of Santa Maria Water & Wastewater(d) |
| Refunding Revenue Bonds |
| Series 2012A |
| 02/01/2025 | 0.000% | | 3,100,000 | 2,413,102 |
| City of Upland |
| Certificate of Participation |
San Antonio Community Hospital
Series 2011 |
| 01/01/2041 | 6.500% | | 5,000,000 | 5,630,050 |
| Compton Unified School District(d) |
| Unlimited General Obligation Bonds |
Election of 2002 - Capital Appreciation
Series 2006C |
| 06/01/2025 | 0.000% | | 2,310,000 | 1,914,967 |
| County of Sacramento Airport System |
| Revenue Bonds |
| Subordinated Series 2009D |
| 07/01/2035 | 6.000% | | 2,500,000 | 2,628,325 |
| Empire Union School District(d) |
| Special Tax Bonds |
Communities Facilities District No. 1987-1
Series 2002A (AMBAC) |
| 10/01/2021 | 0.000% | | 1,665,000 | 1,509,189 |
| Foothill-Eastern Transportation Corridor Agency |
| Refunding Revenue Bonds |
Junior Lien
Series 2014C |
| 01/15/2043 | 6.500% | | 5,000,000 | 5,992,250 |
| Municipal Bonds (continued) |
| Issue Description | Coupon
Rate | | Principal
Amount ($) | Value ($) |
| Hesperia Public Financing Authority |
| Tax Allocation Bonds |
Redevelopment & Housing Projects
Series 2007A (SGI) |
| 09/01/2027 | 5.500% | | 5,430,000 | 5,470,182 |
| M-S-R Energy Authority |
| Revenue Bonds |
| Series 2009B |
| 11/01/2039 | 6.500% | | 5,000,000 | 7,149,150 |
| Oakdale Public Financing Authority |
| Tax Allocation Bonds |
Central City Redevelopment Project
Series 2004 |
| 06/01/2033 | 5.375% | | 2,000,000 | 2,002,040 |
| Palomar Health |
| Certificate of Participation |
| Series 2010 |
| 11/01/2041 | 6.000% | | 2,500,000 | 2,724,600 |
| Refunding Revenue Bonds |
| Series 2016 |
| 11/01/2036 | 5.000% | | 1,845,000 | 2,023,430 |
| San Diego Public Facilities Financing Authority |
| Refunding Revenue Bonds |
Ballpark
Series 2016 |
| 10/15/2031 | 5.000% | | 650,000 | 763,464 |
| State of California |
| Unlimited General Obligation Bonds |
Various Purpose
Series 2012 |
| 04/01/2042 | 5.000% | | 3,000,000 | 3,390,420 |
| State of California Department of Veterans Affairs |
| Revenue Bonds |
| Series 2012A |
| 12/01/2025 | 3.500% | | 3,760,000 | 3,965,371 |
| University of California |
| Refunding Revenue Bonds |
Limited Project
Series 2015I |
| 05/15/2027 | 5.000% | | 2,000,000 | 2,437,700 |
| Total | 70,541,164 |
| Colorado 2.9% |
| Colliers Hill Metropolitan District No. 2 |
| Limited General Obligation Bonds |
Senior Bonds
Series 2017A |
| 12/01/2047 | 6.500% | | 4,380,000 | 4,442,722 |
The accompanying Notes to Financial Statements are an integral part of this statement.
| 8 | Columbia High Yield Municipal Fund | Annual Report 2017 |
Portfolio of Investments (continued)
May 31, 2017
| Municipal Bonds (continued) |
| Issue Description | Coupon
Rate | | Principal
Amount ($) | Value ($) |
| Colorado Health Facilities Authority |
| Refunding Revenue Bonds |
NCMC, Inc. Project
Series 2016 |
| 05/15/2032 | 4.000% | | 3,535,000 | 3,805,003 |
| Revenue Bonds |
Senior Living - Ralston Creek at Arvada
Series 2017 |
| 11/01/2052 | 6.000% | | 5,000,000 | 4,999,700 |
| Leyden Rock Metropolitan District No. 10 |
| Limited General Obligation Bonds |
| Series 2016A |
| 12/01/2045 | 5.000% | | 1,000,000 | 1,002,480 |
| Palisade Metropolitan District No. 2 |
| Limited General Obligation Bonds |
| Series 2016 |
| 12/01/2046 | 5.000% | | 1,500,000 | 1,434,105 |
| Regional Transportation District |
| Certificate of Participation |
| Series 2014A |
| 06/01/2039 | 5.000% | | 5,000,000 | 5,606,600 |
| Sierra Ridge Metropolitan District No. 2 |
| Senior Limited General Obligation Bonds |
| Series 2016A |
| 12/01/2046 | 5.500% | | 1,500,000 | 1,527,195 |
| Total | 22,817,805 |
| Connecticut 0.9% |
| Connecticut State Health & Educational Facility Authority(c) |
| Revenue Bonds |
Church Home of Hartford, Inc. Project
Series 2016 |
| 09/01/2053 | 5.000% | | 1,750,000 | 1,752,433 |
| Harbor Point Infrastructure Improvement District |
| Tax Allocation Bonds |
Harbor Point Project
Series 2010A |
| 04/01/2039 | 7.875% | | 4,000,000 | 4,469,000 |
| Mohegan Tribe of Indians of Connecticut(c),(e) |
| Revenue Bonds |
Public Improvement-Priority Distribution
Series 2003 |
| 01/01/2033 | 5.250% | | 1,000,000 | 907,750 |
| Total | 7,129,183 |
| Delaware 0.2% |
| Centerline Equity Issuer Trust(b),(c) |
| Secured AMT |
| 05/14/2004 |
| 05/15/2019 | 6.300% | | 1,000,000 | 1,082,950 |
| Municipal Bonds (continued) |
| Issue Description | Coupon
Rate | | Principal
Amount ($) | Value ($) |
| City of Wilmington(b) |
| Revenue Bonds |
Housing-Electra Arms Senior Associates Project
Series 1998 AMT |
| 06/01/2028 | 6.250% | | 595,000 | 595,381 |
| Total | 1,678,331 |
| District of Columbia 0.6% |
| Metropolitan Washington Airports Authority(b) |
| Revenue Bonds |
Airport System
Series 2012A AMT |
| 10/01/2024 | 5.000% | | 4,000,000 | 4,686,920 |
| Florida 10.2% |
| Capital Trust Agency, Inc.(c) |
| Revenue Bonds |
1st Mortgage Tallahassee Tapestry Senior Housing Project
Series 2015 |
| 12/01/2050 | 7.125% | | 2,000,000 | 2,014,920 |
| Capital Trust Agency, Inc.(f) |
| Revenue Bonds |
Atlantic Housing Foundation
Subordinated Series 2008B |
| 07/15/2032 | 0.000% | | 1,370,000 | 1,027,514 |
| City of Lakeland |
| Refunding Revenue Bonds |
1st Mortgage-Carpenters Home Estates
Series 2008 |
| 01/01/2028 | 6.250% | | 675,000 | 697,997 |
1st Mortgage-Carpenters Home Estates
Series 2008 |
| 01/01/2043 | 6.375% | | 2,250,000 | 2,323,935 |
| Revenue Bonds |
Lakeland Regional Health
Series 2015 |
| 11/15/2040 | 5.000% | | 5,000,000 | 5,509,050 |
| City of Tallahassee |
| Revenue Bonds |
Tallahassee Memorial Healthcare, Inc. Project
Series 2016 |
| 12/01/2055 | 5.000% | | 3,000,000 | 3,230,040 |
| County of Miami-Dade(d) |
| Revenue Bonds |
Capital Appreciation
Subordinated Series 2009B |
| 10/01/2041 | 0.000% | | 10,000,000 | 3,501,000 |
| County of Miami-Dade |
| Subordinated Refunding Revenue Bonds |
| Series 2012B |
| 10/01/2037 | 5.000% | | 1,530,000 | 1,704,451 |
The accompanying Notes to Financial Statements are an integral part of this statement.
Columbia High Yield Municipal Fund | Annual Report 2017
| 9 |
Portfolio of Investments (continued)
May 31, 2017
| Municipal Bonds (continued) |
| Issue Description | Coupon
Rate | | Principal
Amount ($) | Value ($) |
| County of Miami-Dade Aviation |
| Refunding Revenue Bonds |
| Series 2016 |
| 10/01/2030 | 5.000% | | 1,310,000 | 1,548,171 |
| Florida Development Finance Corp.(c) |
| Revenue Bonds |
Miami Arts Charter School Project
Series 2014A |
| 06/15/2044 | 6.000% | | 6,100,000 | 6,265,127 |
Renaissance Charter School
Series 2015 |
| 06/15/2046 | 6.125% | | 4,900,000 | 5,017,110 |
Southwest Charter Foundation, Inc. Project
Series 2017A |
| 06/15/2047 | 6.125% | | 5,360,000 | 5,423,891 |
| Florida Development Finance Corp. |
| Revenue Bonds |
Renaissance Charter School
Series 2010A |
| 09/15/2040 | 6.000% | | 3,750,000 | 3,864,375 |
Renaissance Charter School
Series 2012A |
| 06/15/2043 | 6.125% | | 5,500,000 | 5,896,275 |
Renaissance Charter School Projects
Series 2013A |
| 06/15/2044 | 8.500% | | 5,000,000 | 5,789,550 |
| Florida Higher Educational Facilities Financial Authority |
| Refunding Revenue Bonds |
Nova Southeastern University
Series 2016 |
| 04/01/2035 | 5.000% | | 1,190,000 | 1,328,397 |
| Mid-Bay Bridge Authority |
| Prerefunded 10/01/21 Revenue Bonds |
| Series 2011A |
| 10/01/2040 | 7.250% | | 4,000,000 | 4,999,520 |
| Middle Village Community Development District |
| Special Assessment Bonds |
| Series 2004A |
| 05/01/2035 | 6.000% | | 1,790,000 | 1,528,356 |
| Orange County Health Facilities Authority |
| Refunding Revenue Bonds |
Mayflower Retirement Center
Series 2012 |
| 06/01/2042 | 5.125% | | 750,000 | 792,833 |
Orlando Health, Inc.
Series 2016A |
| 10/01/2034 | 5.000% | | 2,000,000 | 2,298,840 |
| Revenue Bonds |
1st Mortgage-Orlando Lutheran Towers
Series 2007 |
| 07/01/2032 | 5.500% | | 350,000 | 351,341 |
| Municipal Bonds (continued) |
| Issue Description | Coupon
Rate | | Principal
Amount ($) | Value ($) |
1st Mortgage-Orlando Lutheran Towers
Series 2007 |
| 07/01/2038 | 5.500% | | 1,750,000 | 1,756,702 |
| Orange County Industrial Development Authority(b),(c) |
| Revenue Bonds |
VITAG Florida LLC Project
Series 2014 AMT |
| 07/01/2036 | 8.000% | | 5,000,000 | 4,038,950 |
| Palm Beach County Health Facilities Authority |
| Revenue Bonds |
Sinai Residences Boca Raton
Series 2014 |
| 06/01/2049 | 7.500% | | 1,250,000 | 1,490,275 |
| South Lake County Hospital District |
| Revenue Bonds |
South Lake Hospital, Inc.
Series 2010A |
| 04/01/2039 | 6.250% | | 2,000,000 | 2,152,580 |
| St. Johns County Industrial Development Authority |
| Refunding Revenue Bonds |
Bayview Project
Series 2007A |
| 10/01/2041 | 5.250% | | 3,725,000 | 3,254,011 |
| St. Johns County Industrial Development Authority(f) |
| Refunding Revenue Bonds |
Glenmoor Project
Series 2014A |
| 01/01/2049 | 0.000% | | 3,206,250 | 2,050,717 |
Glenmoor Project
Subordinated Series 2014B |
| 01/01/2049 | 0.000% | | 1,186,427 | 12 |
| Westridge Community Development District(f) |
| Special Assessment Bonds |
| Series 2005 |
| 05/01/2037 | 0.000% | | 2,650,000 | 1,590,026 |
| Total | 81,445,966 |
| Georgia 2.9% |
| DeKalb County Hospital Authority |
| Revenue Bonds |
DeKalb Medical Center, Inc. Project
Series 2010 |
| 09/01/2040 | 6.125% | | 4,500,000 | 4,916,070 |
| Gainesville & Hall County Development Authority |
| Refunding Revenue Bonds |
Riverside Military Academy
Series 2017 |
| 03/01/2047 | 5.000% | | 500,000 | 512,180 |
The accompanying Notes to Financial Statements are an integral part of this statement.
| 10 | Columbia High Yield Municipal Fund | Annual Report 2017 |
Portfolio of Investments (continued)
May 31, 2017
| Municipal Bonds (continued) |
| Issue Description | Coupon
Rate | | Principal
Amount ($) | Value ($) |
| Georgia Housing & Finance Authority |
| Revenue Bonds |
Single Family Mortgage
Series 2017A |
| 12/01/2042 | 4.050% | | 3,000,000 | 3,107,670 |
| Georgia State Road & Tollway Authority(c),(d) |
| Revenue Bonds |
I-75 S Expressway
Series 2014S |
| 06/01/2049 | 0.000% | | 9,100,000 | 5,591,768 |
| Rockdale County Development Authority(b) |
| Revenue Bonds |
Visy Paper Project
Series 2007A AMT |
| 01/01/2034 | 6.125% | | 5,000,000 | 5,010,650 |
| Savannah Economic Development Authority |
| Refunding Revenue Bonds |
Marshes Skidaway Island Project
Series 2013 |
| 01/01/2049 | 7.250% | | 3,500,000 | 3,926,510 |
| Total | 23,064,848 |
| Guam 0.6% |
| Guam Department of Education(e) |
| Certificate of Participation |
John F. Kennedy High School
Series 2010A |
| 12/01/2040 | 6.875% | | 4,750,000 | 5,020,275 |
| Hawaii 1.5% |
| State of Hawaii |
| Refunding Unlimited General Obligation Bonds |
| Series 2016FE |
| 10/01/2027 | 5.000% | | 4,890,000 | 6,086,094 |
| State of Hawaii Department of Budget & Finance |
| Prerefunded 11/15/19 Revenue Bonds |
15 Craigside Project
Series 2009A |
| 11/15/2044 | 9.000% | | 2,375,000 | 2,829,100 |
| Revenue Bonds |
Hawaii Pacific University
Series 2013A |
| 07/01/2043 | 6.875% | | 2,800,000 | 3,041,360 |
| Total | 11,956,554 |
| Idaho 0.5% |
| Idaho Health Facilities Authority |
| Revenue Bonds |
Terraces of Boise Project
Series 2014A |
| 10/01/2049 | 8.125% | | 4,000,000 | 4,320,640 |
| Municipal Bonds (continued) |
| Issue Description | Coupon
Rate | | Principal
Amount ($) | Value ($) |
| Illinois 10.3% |
| Chicago Board of Education |
| Unlimited General Obligation Bonds |
Project
Series 2015C |
| 12/01/2039 | 5.250% | | 2,000,000 | 1,651,360 |
| Series 2016B |
| 12/01/2046 | 6.500% | | 1,500,000 | 1,416,720 |
| Chicago Park District |
| Limited General Obligation Bonds |
| Series 2015A |
| 01/01/2040 | 5.000% | | 3,000,000 | 3,227,760 |
| Series 2016A |
| 01/01/2040 | 5.000% | | 850,000 | 931,260 |
| Limited General Obligation Refunding Bonds |
Limited Tax
Series 2014B |
| 01/01/2026 | 5.000% | | 1,500,000 | 1,697,115 |
| City of Chicago |
| Refunding Revenue Bonds |
| Series 2002 |
| 01/01/2030 | 5.000% | | 1,000,000 | 1,072,260 |
| Refunding Unlimited General Obligation Bonds |
| Series 2005D |
| 01/01/2033 | 5.500% | | 1,000,000 | 1,011,680 |
| Unlimited General Obligation Bonds |
Project
Series 2011A |
| 01/01/2040 | 5.000% | | 5,000,000 | 4,771,950 |
| Series 2009C |
| 01/01/2040 | 5.000% | | 2,500,000 | 2,385,975 |
| Series 2015A |
| 01/01/2039 | 5.500% | | 500,000 | 504,290 |
| Series 2017A |
| 01/01/2038 | 6.000% | | 5,235,000 | 5,459,372 |
| Unlimited General Obligation Refunding Bonds |
Project
Series 2014A |
| 01/01/2033 | 5.250% | | 1,000,000 | 996,790 |
Project
Series 2014A |
| 01/01/2035 | 5.000% | | 2,000,000 | 1,931,820 |
Project
Series 2014A |
| 01/01/2036 | 5.000% | | 4,500,000 | 4,336,290 |
| Series 2007F |
| 01/01/2042 | 5.500% | | 1,000,000 | 1,007,960 |
| Series 2016C |
| 01/01/2038 | 5.000% | | 2,500,000 | 2,397,525 |
The accompanying Notes to Financial Statements are an integral part of this statement.
Columbia High Yield Municipal Fund | Annual Report 2017
| 11 |
Portfolio of Investments (continued)
May 31, 2017
| Municipal Bonds (continued) |
| Issue Description | Coupon
Rate | | Principal
Amount ($) | Value ($) |
| City of Chicago Wastewater Transmission |
| Refunding Revenue Bonds |
2nd Lien
Series 2015C |
| 01/01/2035 | 5.000% | | 1,000,000 | 1,097,030 |
| Du Page County Special Service Area No. 31 |
| Special Tax Bonds |
Monarch Landing Project
Series 2006 |
| 03/01/2036 | 5.625% | | 724,000 | 723,957 |
| Illinois Finance Authority |
| Prerefunded 08/15/19 Revenue Bonds |
Provena Health
Series 2009A |
| 08/15/2034 | 7.750% | | 40,000 | 45,863 |
| Refunding Revenue Bonds |
DePaul University
Series 2016A |
| 10/01/2034 | 4.000% | | 1,500,000 | 1,582,470 |
| Revenue Bonds |
CHF-Normal LLC-Illinois State University
Series 2011 |
| 04/01/2043 | 7.000% | | 3,450,000 | 3,832,329 |
| Unrefunded Revenue Bonds |
Riverside Health System
Series 2009 |
| 11/15/2035 | 6.250% | | 1,190,000 | 1,309,381 |
| Illinois Finance Authority(f) |
| Revenue Bonds |
Leafs Hockey Club Project
Series 2007A |
| 03/01/2037 | 0.000% | | 1,000,000 | 244,720 |
| Illinois State Toll Highway Authority |
| Senior Revenue Bonds |
| Series 2016B |
| 01/01/2037 | 5.000% | | 3,500,000 | 4,025,840 |
| Metropolitan Pier & Exposition Authority |
| Refunding Revenue Bonds |
McCormick Place Project
Series 2010B-2 |
| 06/15/2050 | 5.000% | | 5,000,000 | 5,006,850 |
| Metropolitan Water Reclamation District of Greater Chicago |
| Green Unlimited General Obligation Bond |
| Series 2016E |
| 12/01/2036 | 5.000% | | 2,225,000 | 2,560,686 |
| Unlimited General Obligation Bonds |
Green Bond
Series 2016E |
| 12/01/2035 | 5.000% | | 1,620,000 | 1,855,823 |
| Municipal Bonds (continued) |
| Issue Description | Coupon
Rate | | Principal
Amount ($) | Value ($) |
| Northern Illinois Municipal Power Agency |
| Refunding Revenue Bonds |
| Series 2016A |
| 12/01/2041 | 4.000% | | 5,000,000 | 5,111,200 |
| Railsplitter Tobacco Settlement Authority |
| Revenue Bonds |
| Series 2010 |
| 06/01/2028 | 6.000% | | 5,000,000 | 5,724,750 |
| State of Illinois |
| Unlimited General Obligation Bonds |
| Series 2014 |
| 05/01/2029 | 5.000% | | 3,500,000 | 3,591,805 |
| Series 2016 |
| 01/01/2041 | 5.000% | | 3,830,000 | 3,867,113 |
| Village of Annawan |
| Tax Allocation Bonds |
Patriot Renewable Fuels LLC Project
Series 2007 |
| 01/01/2018 | 5.625% | | 760,000 | 756,724 |
| Village of Hillside |
| Tax Allocation Bonds |
Senior Lien-Mannheim Redevelopment Project
Series 2008 |
| 01/01/2028 | 7.000% | | 5,240,000 | 5,403,593 |
| Village of Lincolnshire |
| Special Tax Bonds |
Sedgebrook Project
Series 2004 |
| 03/01/2034 | 6.250% | | 632,000 | 633,744 |
| Total | 82,174,005 |
| Indiana 0.3% |
| Indiana Finance Authority |
| Revenue Bonds |
BHI Senior Living
Series 2016A |
| 11/15/2046 | 5.250% | | 2,500,000 | 2,705,100 |
| Iowa 0.4% |
| Iowa Finance Authority(a) |
| Refunding Revenue Bonds |
Deerfield Retirement Community
Series 2014 |
| 11/15/2046 | 5.400% | | 2,138,019 | 2,029,664 |
| Iowa Finance Authority(f) |
| Refunding Revenue Bonds |
Deerfield Retirement Community
Series 2014 |
| 05/15/2056 | 0.000% | | 401,062 | 4,207 |
The accompanying Notes to Financial Statements are an integral part of this statement.
| 12 | Columbia High Yield Municipal Fund | Annual Report 2017 |
Portfolio of Investments (continued)
May 31, 2017
| Municipal Bonds (continued) |
| Issue Description | Coupon
Rate | | Principal
Amount ($) | Value ($) |
| Iowa Student Loan Liquidity Corp.(b) |
| Revenue Bonds |
| Senior Series 2011A-2 AMT |
| 12/01/2030 | 5.850% | | 1,260,000 | 1,346,008 |
| Total | 3,379,879 |
| Kansas 1.6% |
| City of Lenexa |
| Prerefunded 05/15/19 Revenue Bonds |
Lakeview Village, Inc. Project
Series 2009 |
| 05/15/2029 | 7.125% | | 500,000 | 558,280 |
Lakeview Village, Inc. Project
Series 2009 |
| 05/15/2039 | 7.250% | | 1,500,000 | 1,678,470 |
| City of Overland Park |
| Revenue Bonds |
Prairiefire-Lionsgate Project
Series 2012 |
| 12/15/2032 | 6.000% | | 6,000,000 | 5,374,740 |
| Wyandotte County-Kansas City Unified Government |
| Revenue Bonds |
Legends Village West Project
Series 2006 |
| 10/01/2028 | 4.875% | | 4,865,000 | 4,866,995 |
| Total | 12,478,485 |
| Kentucky 0.4% |
| Kentucky Economic Development Finance Authority |
| Refunding Revenue Bonds |
Owensboro Health
Series 2017A |
| 06/01/2045 | 5.000% | | 1,000,000 | 1,094,700 |
| Revenue Bonds |
Louisville Arena
Subordinated Series 2008A-1 (AGM) |
| 12/01/2038 | 6.000% | | 1,150,000 | 1,193,137 |
| Paducah Electric Plant Board |
| Refunding Revenue Bonds |
| Series 2016A (AGM) |
| 10/01/2035 | 5.000% | | 1,000,000 | 1,136,420 |
| Total | 3,424,257 |
| Louisiana 2.7% |
| Louisiana Local Government Environmental Facilities & Community Development Authority |
| Revenue Bonds |
Westlake Chemical Corp.
Series 2010A-2 |
| 11/01/2035 | 6.500% | | 5,000,000 | 5,707,550 |
| Municipal Bonds (continued) |
| Issue Description | Coupon
Rate | | Principal
Amount ($) | Value ($) |
| Louisiana Public Facilities Authority |
| Refunding Revenue Bonds |
Nineteenth Judicial District
Series 2015C (AGM) |
| 06/01/2042 | 5.000% | | 1,000,000 | 1,107,560 |
Ochsner Clinic Foundation
Series 2016 |
| 05/15/2034 | 5.000% | | 2,100,000 | 2,390,535 |
| Louisiana Public Facilities Authority(b) |
| Revenue Bonds |
Impala Warehousing LLC Project
Series 2013 AMT |
| 07/01/2036 | 6.500% | | 5,000,000 | 5,538,000 |
| Louisiana Public Facilities Authority(b),(c) |
| Revenue Bonds |
Louisiana Pellets, Inc. Project
Series 2013 AMT |
| 07/01/2039 | 10.500% | | 5,000,000 | 1,650,550 |
| New Orleans Aviation Board |
| Revenue Bonds |
Consolidated Rental Car
Series 2009A |
| 01/01/2040 | 6.500% | | 5,000,000 | 5,356,150 |
| Total | 21,750,345 |
| Maryland 1.3% |
| Howard County Housing Commission |
| Revenue Bonds |
Woodfield Oxford Square Apartments
Series 2017 |
| 12/01/2037 | 5.000% | | 6,000,000 | 6,876,000 |
| Maryland Health & Higher Educational Facilities Authority |
| Refunding Revenue Bonds |
University of Maryland Medical System
Series 2015 |
| 07/01/2034 | 5.000% | | 2,750,000 | 3,159,145 |
| Resolution Trust Corp. |
| Pass-Through Certificates |
| Series 1993A |
| 12/01/2017 | 8.500% | | 455,481 | 455,946 |
| Total | 10,491,091 |
| Massachusetts 2.4% |
| Massachusetts Development Finance Agency |
| Refunding Revenue Bonds |
1st Mortgage-VOA Concord
Series 2007 |
| 11/01/2041 | 5.200% | | 1,000,000 | 1,001,790 |
South Shore Hospital
Series 2016I |
| 07/01/2036 | 4.000% | | 750,000 | 761,992 |
The accompanying Notes to Financial Statements are an integral part of this statement.
Columbia High Yield Municipal Fund | Annual Report 2017
| 13 |
Portfolio of Investments (continued)
May 31, 2017
| Municipal Bonds (continued) |
| Issue Description | Coupon
Rate | | Principal
Amount ($) | Value ($) |
| Revenue Bonds |
Foxborough Regional Charter School
Series 2010A |
| 07/01/2042 | 7.000% | | 4,200,000 | 4,625,964 |
| Massachusetts Development Finance Agency(d) |
| Revenue Bonds |
Linden Ponds, Inc. Facility
Subordinated Series 2011B |
| 11/15/2056 | 0.000% | | 1,391,019 | 32,898 |
| Massachusetts Educational Financing Authority(b) |
| Refunding Revenue Bonds |
| Series 2016J AMT |
| 07/01/2033 | 3.500% | | 6,000,000 | 5,694,420 |
| Revenue Bonds |
Education Loan
Series 2014-I AMT |
| 01/01/2021 | 5.000% | | 1,885,000 | 2,071,351 |
| Series 2008H (AGM) AMT |
| 01/01/2030 | 6.350% | | 1,235,000 | 1,293,033 |
| Series 2012J AMT |
| 07/01/2021 | 5.000% | | 3,000,000 | 3,327,510 |
| Total | 18,808,958 |
| Michigan 3.3% |
| Allen Academy(f) |
| Refunding Revenue Bonds |
Public School Academy
Series 2013 |
| 06/01/2033 | 0.000% | | 5,750,000 | 2,012,615 |
| City of Detroit Sewage Disposal System |
| Refunding Revenue Bonds |
Senior Lien
Series 2012A |
| 07/01/2039 | 5.250% | | 1,375,000 | 1,531,475 |
| City of Detroit Water Supply System |
| Revenue Bonds |
Senior Lien
Series 2011A |
| 07/01/2041 | 5.250% | | 1,445,000 | 1,576,581 |
Senior Lien
Series 2011C |
| 07/01/2041 | 5.000% | | 1,025,000 | 1,096,289 |
| Kalamazoo Hospital Finance Authority |
| Refunding Revenue Bonds |
Bronson Healthcare Group
Series 2016 |
| 05/15/2036 | 4.000% | | 7,000,000 | 7,277,900 |
| Michigan Finance Authority |
| Refunding Revenue Bonds |
Henry Ford Health System
Series 2016 |
| 11/15/2046 | 4.000% | | 4,580,000 | 4,644,853 |
| Municipal Bonds (continued) |
| Issue Description | Coupon
Rate | | Principal
Amount ($) | Value ($) |
| Series 2014H1 |
| 10/01/2022 | 5.000% | | 1,075,000 | 1,218,480 |
| Michigan Tobacco Settlement Finance Authority |
| Revenue Bonds |
| Senior Series 2007A |
| 06/01/2034 | 6.000% | | 1,000,000 | 1,001,530 |
| Senior Series 2007A |
| 06/01/2048 | 6.000% | | 6,000,000 | 5,854,140 |
| Total | 26,213,863 |
| Minnesota 1.8% |
| City of Blaine |
| Refunding Revenue Bonds |
Crest View Senior Community Project
Series 2015 |
| 07/01/2045 | 6.125% | | 3,500,000 | 3,639,860 |
Crest View Senior Community Project
Series 2015 |
| 07/01/2050 | 6.125% | | 1,500,000 | 1,556,970 |
| City of Brooklyn Center |
| Revenue Bonds |
Sanctuary Brooklyn Center Project
Series 2016 |
| 11/01/2035 | 5.500% | | 2,000,000 | 1,995,300 |
| City of Eveleth |
| Refunding Revenue Bonds |
Arrowhead Senior Living Community
Series 2007 |
| 10/01/2027 | 5.200% | | 2,375,000 | 2,374,952 |
| Dakota County Community Development Agency |
| Revenue Bonds |
Sanctuary at West St. Paul Project
Series 2015 |
| 08/01/2035 | 6.000% | | 2,235,000 | 2,247,047 |
| Minneapolis/St. Paul Housing Finance Board(b) |
| Revenue Bonds |
Mortgage-Backed Securities Program-Cityliving
Series 2006A-2 (GNMA / FNMA) AMT |
| 12/01/2038 | 5.000% | | 2,022 | 2,025 |
| St. Cloud Housing & Redevelopment Authority |
| Revenue Bonds |
Sanctuary St. Cloud Project
Series 2016A |
| 08/01/2036 | 5.250% | | 2,250,000 | 2,127,667 |
| Total | 13,943,821 |
| Mississippi 0.3% |
| County of Lowndes |
| Refunding Revenue Bonds |
Weyerhaeuser Co. Project
Series 1992A |
| 04/01/2022 | 6.800% | | 1,995,000 | 2,330,679 |
The accompanying Notes to Financial Statements are an integral part of this statement.
| 14 | Columbia High Yield Municipal Fund | Annual Report 2017 |
Portfolio of Investments (continued)
May 31, 2017
| Municipal Bonds (continued) |
| Issue Description | Coupon
Rate | | Principal
Amount ($) | Value ($) |
Weyerhaeuser Co. Project
Series 1992B |
| 04/01/2022 | 6.700% | | 230,000 | 267,842 |
| Total | 2,598,521 |
| Missouri 2.7% |
| City of Kansas City |
| Tax Allocation Bonds |
Kansas City-Maincor Project
Series 2007A Escrowed to Maturity |
| 03/01/2018 | 5.250% | | 400,000 | 411,168 |
| City of Manchester |
| Refunding Tax Allocation Bonds |
Highway 141/Manchester Road Project
Series 2010 |
| 11/01/2039 | 6.875% | | 5,000,000 | 5,161,250 |
| Grundy County Industrial Development Authority |
| Revenue Bonds |
Wright Memorial Hospital
Series 2009 |
| 09/01/2034 | 6.750% | | 2,250,000 | 2,406,240 |
| Kirkwood Industrial Development Authority |
| Prerefunded 05/15/20 Revenue Bonds |
Aberdeen Heights
Series 2010A |
| 05/15/2045 | 8.250% | | 4,500,000 | 5,416,695 |
| Refunding Revenue Bonds |
Aberdeen Heights Project
Series 2017 |
| 05/15/2050 | 5.250% | | 4,500,000 | 4,713,120 |
| St. Louis County Industrial Development Authority |
| Refunding Revenue Bonds |
St. Andrews Residence for Seniors
Series 2015 |
| 12/01/2045 | 5.125% | | 3,000,000 | 3,037,110 |
| Total | 21,145,583 |
| Montana 0.3% |
| City of Kalispell |
| Refunding Revenue Bonds |
Immanuel Lutheran Corp. Project
Series 2017 |
| 05/15/2047 | 5.250% | | 2,200,000 | 2,277,572 |
| Nebraska 1.3% |
| Central Plains Energy Project |
| Revenue Bonds |
Project #3
Series 2012 |
| 09/01/2042 | 5.000% | | 5,000,000 | 5,376,450 |
| Municipal Bonds (continued) |
| Issue Description | Coupon
Rate | | Principal
Amount ($) | Value ($) |
| Public Power Generation Agency |
| Refunding Revenue Bonds |
Whelan Energy Center Unit
Series 2015 |
| 01/01/2028 | 5.000% | | 4,000,000 | 4,641,840 |
| Total | 10,018,290 |
| Nevada 1.0% |
| City of Sparks(c) |
| Tax Anticipation Revenue Bonds |
Senior Sales
Series 2008A |
| 06/15/2028 | 6.750% | | 5,000,000 | 5,129,750 |
| State of Nevada Department of Business & Industry(c) |
| Revenue Bonds |
Somerset Academy
Series 2015A |
| 12/15/2045 | 5.125% | | 2,515,000 | 2,525,286 |
| Total | 7,655,036 |
| New Hampshire 0.0% |
| New Hampshire Business Finance Authority(b) |
| Revenue Bonds |
Pennichuck Water Works, Inc. Project
Series 1988 Escrowed to Maturity AMT |
| 07/01/2018 | 7.500% | | 60,000 | 62,028 |
| New Jersey 2.9% |
| City of Atlantic City |
| Unlimited General Obligation Refunding Bonds |
Tax Appeal
Series 2013 |
| 12/01/2021 | 5.000% | | 2,500,000 | 2,245,500 |
Tax Appeal
Series 2013 |
| 12/01/2024 | 5.000% | | 2,095,000 | 1,881,750 |
Tax Appeal
Series 2013 |
| 12/01/2025 | 5.000% | | 450,000 | 404,213 |
Tax Appeal
Series 2013 |
| 12/01/2028 | 5.000% | | 270,000 | 242,568 |
| Middlesex County Improvement Authority(f) |
| Revenue Bonds |
Heldrich Center Hotel
Series 2005C |
| 01/01/2037 | 0.000% | | 1,250,000 | 36,575 |
| Subordinated Revenue Bonds |
Heldrich Center Hotel
Series 2005B |
| 01/01/2025 | 0.000% | | 2,750,000 | 106,590 |
The accompanying Notes to Financial Statements are an integral part of this statement.
Columbia High Yield Municipal Fund | Annual Report 2017
| 15 |
Portfolio of Investments (continued)
May 31, 2017
| Municipal Bonds (continued) |
| Issue Description | Coupon
Rate | | Principal
Amount ($) | Value ($) |
Heldrich Center Hotel
Series 2005B |
| 01/01/2037 | 0.000% | | 6,450,000 | 250,002 |
| New Jersey Building Authority |
| Prerefunded 06/15/26 Revenue Bonds |
| Series 2016A |
| 06/15/2030 | 4.000% | | 400,000 | 465,984 |
| Unrefunded Revenue Bonds |
| Series 2016A |
| 06/15/2030 | 4.000% | | 600,000 | 583,392 |
| New Jersey Economic Development Authority |
| Revenue Bonds |
Provident Group-Kean Properties
Series 2017 |
| 07/01/2047 | 5.000% | | 500,000 | 538,390 |
Provident Group-Rowan Properties LLC
Series 2015 |
| 01/01/2048 | 5.000% | | 960,000 | 1,022,227 |
School Facilities Construction
Series 2014UU |
| 06/15/2040 | 5.000% | | 1,500,000 | 1,527,570 |
| Series 2015WW |
| 06/15/2040 | 5.250% | | 375,000 | 392,501 |
| New Jersey Economic Development Authority(b) |
| Revenue Bonds |
UMM Energy Partners LLC
Series 2012A AMT |
| 06/15/2043 | 5.125% | | 2,000,000 | 2,072,620 |
| New Jersey Higher Education Student Assistance Authority(b) |
| Revenue Bonds |
| Senior Series 2013-1A AMT |
| 12/01/2021 | 5.000% | | 1,500,000 | 1,666,080 |
| Senior Series 2014-1A-1 AMT |
| 12/01/2022 | 5.000% | | 1,000,000 | 1,128,630 |
| Subordinated Revenue Bonds |
| Series 2013-1B AMT |
| 12/01/2043 | 4.750% | | 5,000,000 | 5,151,150 |
| New Jersey Transportation Trust Fund Authority |
| Revenue Bonds |
Transportation Program
Series 2015AA |
| 06/15/2045 | 5.000% | | 1,750,000 | 1,783,600 |
| Tobacco Settlement Financing Corp.(d) |
| Revenue Bonds |
Capital Appreciation
Series 2007-1C |
| 06/01/2041 | 0.000% | | 6,265,000 | 1,703,453 |
| Total | 23,202,795 |
| Municipal Bonds (continued) |
| Issue Description | Coupon
Rate | | Principal
Amount ($) | Value ($) |
| New York 4.7% |
| Brooklyn Arena Local Development Corp. |
| Refunding Revenue Bonds |
Barclays Center Project
Series 2016A |
| 07/15/2042 | 5.000% | | 550,000 | 618,800 |
| Build NYC Resource Corp. |
| Revenue Bonds |
International Leadership Charter School
Series 2013 |
| 07/01/2043 | 6.000% | | 4,330,000 | 3,983,297 |
| Build NYC Resource Corp.(c) |
| Revenue Bonds |
International Leadership Charter School
Series 2016 |
| 07/01/2046 | 6.250% | | 765,000 | 716,499 |
Taxable International Leadership
Series 2016 |
| 07/01/2021 | 5.000% | | 195,000 | 192,728 |
| City of New York |
| Unlimited General Obligation Refunding Bonds |
| Series 2015C |
| 08/01/2027 | 5.000% | | 4,000,000 | 4,839,160 |
| Glen Cove Local Economic Assistance Corp.(a) |
| Revenue Bonds |
Garvies Point
Series 2016 CABS |
| 01/01/2055 | 0.000% | | 2,500,000 | 1,833,575 |
| Jefferson County Industrial Development Agency(b) |
| Revenue Bonds |
Green Bonds
Series 2014 AMT |
| 01/01/2024 | 5.250% | | 1,620,000 | 1,448,248 |
| Nassau County Tobacco Settlement Corp.(d) |
| Asset-Backed Revenue Bonds |
Capital Appreciation
Third Series 2006D |
| 06/01/2060 | 0.000% | | 25,000,000 | 382,250 |
| New York City Water & Sewer System |
| Refunding Revenue Bonds |
2nd General Resolution
Series 2015FF |
| 06/15/2027 | 5.000% | | 2,645,000 | 3,278,874 |
| New York Transportation Development Corp.(b) |
| Refunding Revenue Bonds |
American Airlines, Inc.
Series 2016 AMT |
| 08/01/2026 | 5.000% | | 4,000,000 | 4,305,960 |
| Revenue Bonds |
LaGuardia Airport Terminal B Redevelopment Project
Series 2016 AMT |
| 07/01/2046 | 4.000% | | 6,000,000 | 5,873,460 |
The accompanying Notes to Financial Statements are an integral part of this statement.
| 16 | Columbia High Yield Municipal Fund | Annual Report 2017 |
Portfolio of Investments (continued)
May 31, 2017
| Municipal Bonds (continued) |
| Issue Description | Coupon
Rate | | Principal
Amount ($) | Value ($) |
| Port Authority of New York & New Jersey(b) |
| Revenue Bonds |
5th Installment-Special Project
Series 1996-4 AMT |
| 10/01/2019 | 6.750% | | 120,000 | 122,054 |
| Syracuse Industrial Development Agency(b) |
| Refunding Revenue Bonds |
Carousel Center Project
Series 2016 AMT |
| 01/01/2035 | 5.000% | | 500,000 | 565,465 |
| Town of Oyster Bay |
| Limited General Obligation Bonds |
| BAN Series 2016C |
| 06/01/2018 | 4.000% | | 4,685,000 | 4,742,766 |
| Ulster County Industrial Development Agency |
| Revenue Bonds |
| Series 2007A |
| 09/15/2037 | 6.000% | | 900,000 | 900,198 |
| Series 2007A |
| 09/15/2042 | 6.000% | | 3,400,000 | 3,402,414 |
| Total | 37,205,748 |
| North Carolina 0.5% |
| Durham Housing Authority(b) |
| Revenue Bonds |
Magnolia Pointe Apartments
Series 2005 AMT |
| 02/01/2038 | 5.650% | | 3,041,015 | 3,107,583 |
| North Carolina Medical Care Commission |
| Refunding Revenue Bonds |
United Methodist Retirement Homes
Series 2016 |
| 10/01/2035 | 5.000% | | 1,000,000 | 1,121,900 |
| Total | 4,229,483 |
| North Dakota 0.4% |
| City of Fargo |
| Revenue Bonds |
Sanford Obligation Group
Series 2011 |
| 11/01/2031 | 6.250% | | 2,500,000 | 2,964,400 |
| Ohio 1.7% |
| Buckeye Tobacco Settlement Financing Authority |
| Asset-Backed Senior Turbo Revenue Bonds |
| Series 2007A-2 |
| 06/01/2047 | 5.875% | | 6,000,000 | 5,892,120 |
| County of Hamilton Sales Tax |
| Refunding Revenue Bonds |
| Series 2016A |
| 12/01/2031 | 4.000% | | 1,250,000 | 1,365,637 |
| Municipal Bonds (continued) |
| Issue Description | Coupon
Rate | | Principal
Amount ($) | Value ($) |
| County of Scioto |
| Refunding Revenue Bonds |
Southern Ohio Medical Center
Series 2016 |
| 02/15/2034 | 5.000% | | 1,445,000 | 1,653,008 |
| State of Ohio(b) |
| Revenue Bonds |
Portsmouth Bypass Project
Series 2015 AMT |
| 12/31/2039 | 5.000% | | 4,100,000 | 4,481,300 |
| Total | 13,392,065 |
| Oregon 1.0% |
| Cow Creek Band of Umpqua Tribe of Indians(c),(e) |
| Revenue Bonds |
| Series 2006C |
| 10/01/2026 | 5.625% | | 1,700,000 | 1,702,482 |
| Hospital Facilities Authority of Multnomah County |
| Refunding Revenue Bonds |
Mirabella at South Waterfront
Series 2014A |
| 10/01/2049 | 5.500% | | 3,115,000 | 3,320,964 |
| Warm Springs Reservation Confederated Tribe(e) |
| Revenue Bonds |
Pelton Round Butte Tribal
Series 2009B |
| 11/01/2033 | 6.375% | | 2,410,000 | 2,571,156 |
| Total | 7,594,602 |
| Pennsylvania 5.6% |
| Allegheny County Higher Education Building Authority |
| Refunding Revenue Bonds |
Duquesne University
Series 2016 |
| 03/01/2029 | 5.000% | | 1,030,000 | 1,216,883 |
| Dauphin County Industrial Development Authority(b) |
| Revenue Bonds |
Dauphin Consolidated Water Supply
Series 1992A AMT |
| 06/01/2024 | 6.900% | | 3,200,000 | 4,025,472 |
| Montgomery County Industrial Development Authority |
| Refunding Revenue Bonds |
Albert Einstein Healthcare
Series 2015 |
| 01/15/2046 | 5.250% | | 1,250,000 | 1,345,775 |
| Pennsylvania Economic Development Financing Authority(b) |
| Revenue Bonds |
PA Bridges Finco LP
Series 2015 AMT |
| 12/31/2038 | 5.000% | | 1,650,000 | 1,841,119 |
The accompanying Notes to Financial Statements are an integral part of this statement.
Columbia High Yield Municipal Fund | Annual Report 2017
| 17 |
Portfolio of Investments (continued)
May 31, 2017
| Municipal Bonds (continued) |
| Issue Description | Coupon
Rate | | Principal
Amount ($) | Value ($) |
PA Bridges Finco LP
Series 2015 AMT |
| 06/30/2042 | 5.000% | | 3,700,000 | 4,107,259 |
| Pennsylvania Economic Development Financing Authority |
| Revenue Bonds |
Philadelphia Biosolids Facility
Series 2009 |
| 01/01/2032 | 6.250% | | 3,375,000 | 3,597,075 |
| Pennsylvania Higher Educational Facilities Authority |
| Revenue Bonds |
Shippensburg University
Series 2011 |
| 10/01/2043 | 6.250% | | 2,000,000 | 2,213,320 |
| Pennsylvania Housing Finance Agency(b) |
| Revenue Bonds |
| Series 2013-115A AMT |
| 10/01/2033 | 4.200% | | 4,865,000 | 5,133,889 |
| Pennsylvania Industrial Development Authority |
| Prerefunded 07/01/18 Revenue Bonds |
Economic Development
Series 2008 |
| 07/01/2023 | 5.500% | | 295,000 | 309,791 |
| Pennsylvania Turnpike Commission |
| Revenue Bonds |
| Series 2014C |
| 12/01/2044 | 5.000% | | 3,000,000 | 3,346,950 |
| Subordinated Refunding Revenue Bonds |
| Series 2015A-1 |
| 12/01/2028 | 5.000% | | 3,300,000 | 3,833,346 |
| Philadelphia Authority for Industrial Development |
| Revenue Bonds |
1st Philadelphia Preparatory Charter School
Series 2014 |
| 06/15/2033 | 7.000% | | 1,870,000 | 2,156,634 |
| Philadelphia Gas Works Co. |
| Refunding Revenue Bonds |
1998 General Ordinance
14th Series 2016 |
| 10/01/2037 | 4.000% | | 500,000 | 520,550 |
| Scranton School District |
| Limited General Obligation Refunding Bonds |
| Series 2017D (NPFGC) |
| 06/01/2037 | 4.250% | | 1,750,000 | 1,830,938 |
| State Public School Building Authority |
| Refunding Revenue Bonds |
Philadelphia School District
Series 2015 |
| 06/01/2025 | 5.000% | | 8,000,000 | 9,175,040 |
| Total | 44,654,041 |
| Municipal Bonds (continued) |
| Issue Description | Coupon
Rate | | Principal
Amount ($) | Value ($) |
| Puerto Rico 2.0% |
| Commonwealth of Puerto Rico(e),(f) |
| Unlimited General Obligation Bonds |
| Series 2014A |
| 07/01/2035 | 0.000% | | 4,000,000 | 2,425,000 |
| Unlimited General Obligation Refunding Bonds |
Public Improvement
Series 2012A |
| 07/01/2041 | 0.000% | | 2,000,000 | 1,105,000 |
| Puerto Rico Electric Power Authority(e) |
| Refunding Revenue Bonds |
| Series 2010ZZ |
| 07/01/2025 | 5.250% | | 2,000,000 | 1,355,000 |
| Revenue Bonds |
| Series 2013A |
| 07/01/2043 | 7.000% | | 4,570,000 | 3,107,600 |
| Puerto Rico Highways & Transportation Authority(e),(f) |
| Refunding Revenue Bonds |
| Series 2007N |
| 07/01/2021 | 0.000% | | 760,000 | 189,050 |
| Puerto Rico Industrial Tourist Educational, Medical & Environmental Control Facilities Financing Authority(b),(e) |
| Revenue Bonds |
Cogen Facilities AES Puerto Rico Project
Series 2000 AMT |
| 06/01/2026 | 6.625% | | 5,820,000 | 5,643,712 |
| Puerto Rico Sales Tax Financing Corp.(e) |
| Revenue Bonds |
Senior Lien
Series 2011C |
| 08/01/2040 | 5.250% | | 1,885,000 | 1,063,234 |
Senior Lien
Series 2011C |
| 08/01/2046 | 5.000% | | 2,000,000 | 1,132,880 |
| Total | 16,021,476 |
| Rhode Island 0.3% |
| Rhode Island Student Loan Authority(b) |
| Revenue Bonds |
| Series 2016A AMT |
| 12/01/2027 | 3.125% | | 2,675,000 | 2,657,318 |
| South Carolina 0.8% |
| South Carolina Jobs-Economic Development Authority |
| Revenue Bonds |
Lutheran Homes of South Carolina, Inc. Obligation Group
Series 2013 |
| 05/01/2043 | 5.000% | | 750,000 | 758,385 |
Lutheran Homes of South Carolina, Inc. Obligation Group
Series 2013 |
| 05/01/2048 | 5.125% | | 1,500,000 | 1,522,470 |
The accompanying Notes to Financial Statements are an integral part of this statement.
| 18 | Columbia High Yield Municipal Fund | Annual Report 2017 |
Portfolio of Investments (continued)
May 31, 2017
| Municipal Bonds (continued) |
| Issue Description | Coupon
Rate | | Principal
Amount ($) | Value ($) |
York Preparatory Academy Project
Series 2014A |
| 11/01/2045 | 7.250% | | 4,000,000 | 4,460,000 |
| Total | 6,740,855 |
| Texas 8.2% |
| Capital Area Cultural Education Facilities Finance Corp. |
| Revenue Bonds |
Roman Catholic Diocese
Series 2005B |
| 04/01/2045 | 6.125% | | 5,000,000 | 5,531,300 |
| Central Texas Regional Mobility Authority |
| Prerefunded 01/01/21 Subordinated Revenue Bonds |
Lien
Series 2011 |
| 01/01/2041 | 6.750% | | 5,000,000 | 5,974,250 |
| Central Texas Turnpike System |
| Refunding Revenue Bonds |
| Series 2015B |
| 08/15/2037 | 5.000% | | 3,000,000 | 3,394,380 |
| City of Houston Airport System(b) |
| Refunding Revenue Bonds |
Special Facilities - United Airlines
Series 2011A AMT |
| 07/15/2038 | 6.625% | | 4,000,000 | 4,457,880 |
| Clifton Higher Education Finance Corp. |
| Revenue Bonds |
International Leadership of Texas
Series 2015 |
| 08/15/2045 | 5.750% | | 5,500,000 | 5,881,260 |
| Deaf Smith County Hospital District |
| Limited General Obligation Bonds |
| Series 2010A |
| 03/01/2040 | 6.500% | | 4,000,000 | 4,393,360 |
| Gulf Coast Industrial Development Authority(b) |
| Revenue Bonds |
Citgo Petroleum Project
Series 1998 AMT |
| 04/01/2028 | 8.000% | | 875,000 | 876,558 |
| Mission Economic Development Corp(b) |
| Revenue Bonds |
Dallas Clean Energy McCommas
Series 2011 AMT |
| 12/01/2024 | 6.875% | | 5,000,000 | 5,068,850 |
| Mission Economic Development Corp.(b),(c) |
| Revenue Bonds |
Senior Lien - Natgasoline Project
Series 2016 AMT |
| 10/01/2031 | 5.750% | | 4,500,000 | 4,721,400 |
| Municipal Bonds (continued) |
| Issue Description | Coupon
Rate | | Principal
Amount ($) | Value ($) |
| New Hope Cultural Education Facilities Finance Corp. |
| Revenue Bonds |
Cardinal Bay, Inc. - Village on the Park
Series 2016 |
| 07/01/2046 | 5.000% | | 2,300,000 | 2,475,467 |
CHF - Collegiate Housing Corpus Christi
Series 2016 |
| 04/01/2048 | 5.000% | | 1,000,000 | 1,066,840 |
| New Hope Cultural Education Facilities Finance Corp.(c) |
| Revenue Bonds |
Jubilee Academic Center Project
Series 2017 |
| 08/15/2047 | 5.125% | | 2,085,000 | 2,087,022 |
| Pharr Higher Education Finance Authority |
| Unrefunded Revenue Bonds |
IDEA Public Schools
Series 2009 |
| 08/15/2039 | 6.500% | | 530,000 | 569,628 |
| Pottsboro Higher Education Finance Corp. |
| Revenue Bonds |
| Series 2016A |
| 08/15/2046 | 5.000% | | 1,000,000 | 1,003,810 |
| Red River Health Facilities Development Corp. |
| Revenue Bonds |
MRC Crossings Project
Series 2014A |
| 11/15/2049 | 8.000% | | 2,000,000 | 2,306,460 |
| Sanger Industrial Development Corp.(b),(c) |
| Revenue Bonds |
Texas Pellets Project
Series 2012B AMT |
| 07/01/2038 | 8.000% | | 4,950,000 | 2,163,645 |
| Tarrant County Cultural Education Facilities Finance Corp.(g) |
| Revenue Bonds |
Buckner Senior Living Ventana Project
Series 2017 |
| 11/15/2052 | 6.750% | | 3,500,000 | 3,557,995 |
| Tarrant County Cultural Education Facilities Finance Corp. |
| Revenue Bonds |
CC Young Memorial Home
Series 2009A |
| 02/15/2038 | 8.000% | | 4,000,000 | 4,325,760 |
| Texas Municipal Gas Acquisition & Supply Corp. III |
| Revenue Bonds |
| Series 2012 |
| 12/15/2032 | 5.000% | | 1,250,000 | 1,378,700 |
| Texas Private Activity Bond Surface Transportation Corp.(b) |
| Revenue Bonds |
Senior Lien - Blueridge Transportation
Series 2016 AMT |
| 12/31/2055 | 5.000% | | 3,515,000 | 3,771,560 |
| Total | 65,006,125 |
The accompanying Notes to Financial Statements are an integral part of this statement.
Columbia High Yield Municipal Fund | Annual Report 2017
| 19 |
Portfolio of Investments (continued)
May 31, 2017
| Municipal Bonds (continued) |
| Issue Description | Coupon
Rate | | Principal
Amount ($) | Value ($) |
| Utah 0.3% |
| Salt Lake City Corp. Airport(b) |
| Revenue Bonds |
| Series 2017A AMT |
| 07/01/2037 | 5.000% | | 2,000,000 | 2,323,100 |
| Virgin Islands, U.S. 0.3% |
| Virgin Islands Public Finance Authority(e) |
| Revenue Bonds |
Matching Fund Loan Notes
Series 2012A |
| 10/01/2022 | 4.000% | | 1,000,000 | 842,530 |
| Virgin Islands Water & Power Authority - Electric System(e) |
| Refunding Revenue Bonds |
| Series 2012A |
| 07/01/2021 | 4.000% | | 2,170,000 | 1,508,042 |
| Total | 2,350,572 |
| Virginia 2.6% |
| Alexandria Industrial Development Authority |
| Refunding Revenue Bonds |
Goodwin House, Inc.
Series 2015 |
| 10/01/2045 | 5.000% | | 3,725,000 | 4,114,337 |
Goodwin House, Inc.
Series 2015 |
| 10/01/2050 | 5.000% | | 2,275,000 | 2,505,890 |
| City of Chesapeake Expressway Toll Road(d) |
| Refunding Revenue Bonds |
Transportation System
Series 2012 |
| 07/15/2040 | 0.000% | | 7,530,000 | 6,134,992 |
| Mosaic District Community Development Authority |
| Special Assessment Bonds |
| Series 2011A |
| 03/01/2036 | 6.875% | | 2,500,000 | 2,765,225 |
| Tobacco Settlement Financing Corp. |
| Revenue Bonds |
| Senior Series 2007-B1 |
| 06/01/2047 | 5.000% | | 5,000,000 | 4,887,550 |
| Total | 20,407,994 |
| Washington 2.6% |
| Greater Wenatchee Regional Events Center Public Facilities District |
| Revenue Bonds |
| Series 2012A |
| 09/01/2042 | 5.500% | | 2,150,000 | 2,215,424 |
| King County Public Hospital District No. 4 |
| Revenue Bonds |
| Series 2015A |
| 12/01/2035 | 6.000% | | 1,250,000 | 1,231,213 |
| Municipal Bonds (continued) |
| Issue Description | Coupon
Rate | | Principal
Amount ($) | Value ($) |
| Series 2015A |
| 12/01/2045 | 6.250% | | 2,500,000 | 2,468,875 |
| Port of Seattle Industrial Development Corp.(b) |
| Refunding Revenue Bonds |
Special Facilities Delta Air Lines, Inc.
Series 2012 AMT |
| 04/01/2030 | 5.000% | | 2,500,000 | 2,698,675 |
| Tacoma Consolidated Local Improvement Districts |
| Special Assessment Bonds |
No. 65
Series 2013 |
| 04/01/2043 | 5.750% | | 1,950,000 | 1,952,613 |
| Washington State Housing Finance Commission(c) |
| Refunding Revenue Bonds |
Bayview Manor Homes
Series 2016A |
| 07/01/2051 | 5.000% | | 2,150,000 | 2,184,421 |
| Washington State Housing Finance Commission |
| Refunding Revenue Bonds |
Nonprofit Housing-Mirabella
Series 2012 |
| 10/01/2047 | 6.750% | | 5,000,000 | 5,479,400 |
| Revenue Bonds |
Heron’s Key
Series 2015A |
| 07/01/2050 | 7.000% | | 2,100,000 | 2,101,491 |
| Total | 20,332,112 |
| Wisconsin 1.7% |
| Public Finance Authority(b) |
| Refunding Revenue Bonds |
Celanese Project
Series 2016C AMT |
| 11/01/2030 | 4.300% | | 2,000,000 | 2,036,900 |
Waste Management, Inc. Project
Series 2016 AMT |
| 05/01/2027 | 2.875% | | 630,000 | 625,634 |
| Public Finance Authority(c) |
| Refunding Revenue Bonds |
Mary’s Woods At Marylhurst
Series 2017 |
| 05/15/2052 | 5.250% | | 2,300,000 | 2,433,354 |
| Revenue Bonds |
North Carolina Charter Educational Foundation Project
Series 2016 |
| 06/15/2046 | 5.000% | | 5,000,000 | 4,687,500 |
| Public Finance Authority |
| Revenue Bonds |
FFAH North Carolina and Missouri Portfolio
Series 2015A |
| 12/01/2050 | 5.150% | | 3,220,000 | 3,356,335 |
The accompanying Notes to Financial Statements are an integral part of this statement.
| 20 | Columbia High Yield Municipal Fund | Annual Report 2017 |
Portfolio of Investments (continued)
May 31, 2017
| Municipal Bonds (continued) |
| Issue Description | Coupon
Rate | | Principal
Amount ($) | Value ($) |
| Wisconsin Health & Educational Facilities Authority |
| Unrefunded Revenue Bonds |
Medical College of Wisconsin
Series 2008A |
| 12/01/2035 | 5.250% | | 475,000 | 500,360 |
| Total | 13,640,083 |
Total Municipal Bonds
(Cost $763,652,097) | 778,881,964 |
| Municipal Preferred Stocks 0.1% |
| Issue Description | Coupon
Rate | Principal
Amount ($) | Value ($) |
| Maryland 0.1% |
| Munimae TE Bond Subsidiary LLC(b),(c) |
| AMT |
| 06/30/2049 | 5.800% | 1,000,000 | 1,024,600 |
Total Municipal Preferred Stocks
(Cost $1,000,000) | 1,024,600 |
Total Investments
(Cost $772,502,097) | 787,756,564 |
| Other Assets & Liabilities, Net | | 8,241,936 |
| Net Assets | $795,998,500 |
Notes to Portfolio of Investments
| (a) | Variable rate security. |
| (b) | Income from this security may be subject to alternative minimum tax. |
| (c) | Represents privately placed and other securities and instruments exempt from SEC registration (collectively, private placements), such as Section 4(a)(2) and Rule 144A eligible securities, which are often sold only to qualified institutional buyers. The Fund may invest in private placements determined to be liquid as well as those determined to be illiquid. Private placements may be determined to be liquid under guidelines established by the Fund’s Board of Trustees. At May 31, 2017, the value of these securities amounted to $69,754,415 which represents 8.76% of net assets. |
| (d) | Zero coupon bond. |
| (e) | Municipal obligations include debt obligations issued by or on behalf of territories, possessions, or sovereign nations within the territorial boundaries of the United States. At May 31, 2017, the value of these securities amounted to $28,573,711 which represents 3.59% of net assets. |
| (f) | Represents securities that have defaulted on payment of interest. The Fund has stopped accruing interest on these securities. At May 31, 2017, the value of these securities amounted to $11,042,028 which represents 1.39% of net assets. |
| (g) | Represents a security purchased on a when-issued basis. |
Abbreviation Legend
| AGM | Assured Guaranty Municipal Corporation |
| AMBAC | Ambac Assurance Corporation |
| AMT | Alternative Minimum Tax |
| BAN | Bond Anticipation Note |
| FNMA | Federal National Mortgage Association |
| GNMA | Government National Mortgage Association |
| NPFGC | National Public Finance Guarantee Corporation |
| SGI | Syncora Guarantee, Inc. |
| VRDN | Variable Rate Demand Note |
Fair value measurements
The Fund categorizes its fair value measurements according to a three-level hierarchy that maximizes the use of observable inputs and minimizes the use of unobservable inputs by prioritizing that the most observable input be used when available. Observable inputs are those that market participants would use in pricing an investment based on market data obtained from sources independent of the reporting entity. Unobservable inputs are those that reflect the Fund’s assumptions about the information market participants would use in
The accompanying Notes to Financial Statements are an integral part of this statement.
Columbia High Yield Municipal Fund | Annual Report 2017
| 21 |
Portfolio of Investments (continued)
May 31, 2017
pricing an investment. An investment’s level within the fair value hierarchy is based on the lowest level of any input that is deemed significant to the asset’s or liability’s fair value measurement. The input levels are not necessarily an indication of the risk or liquidity associated with investments at that level. For example, certain U.S. government securities are generally high quality and liquid, however, they are reflected as Level 2 because the inputs used to determine fair value may not always be quoted prices in an active market.
Fair value inputs are summarized in the three broad levels listed below:
| • | Level 1 – Valuations based on quoted prices for investments in active markets that the Fund has the ability to access at the measurement date (including NAV for open-end mutual funds). Valuation adjustments are not applied to Level 1 investments. |
| • | Level 2 – Valuations based on other significant observable inputs (including quoted prices for similar securities, interest rates, prepayment speeds, credit risks, etc.). |
| • | Level 3 – Valuations based on significant unobservable inputs (including the Fund’s own assumptions and judgment in determining the fair value of investments). |
Inputs that are used in determining fair value of an investment may include price information, credit data, volatility statistics, and other factors. These inputs can be either observable or unobservable. The availability of observable inputs can vary between investments, and is affected by various factors such as the type of investment, and the volume and level of activity for that investment or similar investments in the marketplace. The inputs will be considered by the Investment Manager, along with any other relevant factors in the calculation of an investment’s fair value. The Fund uses prices and inputs that are current as of the measurement date, which may include periods of market dislocations. During these periods, the availability of prices and inputs may be reduced for many investments. This condition could cause an investment to be reclassified between the various levels within the hierarchy.
Investments falling into the Level 3 category are primarily supported by quoted prices from brokers and dealers participating in the market for those investments. However, these may be classified as Level 3 investments due to lack of market transparency and corroboration to support these quoted prices. Additionally, valuation models may be used as the pricing source for any remaining investments classified as Level 3. These models may rely on one or more significant unobservable inputs and/or significant assumptions by the Investment Manager. Inputs used in valuations may include, but are not limited to, financial statement analysis, capital account balances, discount rates and estimated cash flows, and comparable company data.
Under the direction of the Fund’s Board of Trustees (the Board), the Investment Manager’s Valuation Committee (the Committee) is responsible for overseeing the valuation procedures approved by the Board. The Committee consists of voting and non-voting members from various groups within the Investment Manager’s organization, including operations and accounting, trading and investments, compliance, risk management and legal.
The Committee meets at least monthly to review and approve valuation matters, which may include a description of specific valuation determinations, data regarding pricing information received from approved pricing vendors and brokers and the results of Board-approved valuation control policies and procedures (the Policies). The Policies address, among other things, instances when market quotations are or are not readily available, including recommendations of third party pricing vendors and a determination of appropriate pricing methodologies; events that require specific valuation determinations and assessment of fair value techniques; securities with a potential for stale pricing, including those that are illiquid, restricted, or in default; and the effectiveness of third party pricing vendors, including periodic reviews of vendors. The Committee meets more frequently, as needed, to discuss additional valuation matters, which may include the need to review back-testing results, review time-sensitive information or approve related valuation actions. The Committee reports to the Board, with members of the Committee meeting with the Board at each of its regularly scheduled meetings to discuss valuation matters and actions during the period, similar to those described earlier.
For investments categorized as Level 3, the Committee monitors information similar to that described above, which may include: (i) data specific to the issuer or comparable issuers, (ii) general market or specific sector news and (iii) quoted prices and specific or similar security transactions. The Committee considers this data and any changes from prior periods in order to assess the reasonableness of observable and unobservable inputs, any assumptions or internal models used to value those securities and changes in fair value. This data is also used to corroborate, when available, information received from approved pricing vendors and brokers. Various factors impact the frequency of monitoring this information (which may occur as often as daily). However, the Committee may determine that changes to inputs, assumptions and models are not required as a result of the monitoring procedures performed.
The following table is a summary of the inputs used to value the Fund’s investments at May 31, 2017:
| | Level 1
quoted prices in active
markets for identical
assets ($) | Level 2
other significant
observable inputs ($) | Level 3
significant
unobservable inputs ($) | Total ($) |
| Investments | | | | |
| Floating Rate Notes | — | 7,850,000 | — | 7,850,000 |
| Municipal Bonds | — | 778,881,964 | — | 778,881,964 |
| Municipal Preferred Stocks | — | 1,024,600 | — | 1,024,600 |
| Total Investments | — | 787,756,564 | — | 787,756,564 |
See the Portfolio of Investments for all investment classifications not indicated in the table.
The Fund’s assets assigned to the Level 2 input category are generally valued using the market approach, in which a security’s value is determined through reference to prices and information from market transactions for similar or identical assets.
There were no transfers of financial assets between levels during the period.
The accompanying Notes to Financial Statements are an integral part of this statement.
| 22 | Columbia High Yield Municipal Fund | Annual Report 2017 |
Statement of Assets and Liabilities
May 31, 2017
| Assets | |
| Investments, at cost | |
| Unaffiliated issuers, at cost | $772,502,097 |
| Total investments, at cost | 772,502,097 |
| Investments, at value | |
| Unaffiliated issuers, at value | 787,756,564 |
| Total investments, at value | 787,756,564 |
| Cash | 54,149 |
| Receivable for: | |
| Investments sold | 1,119,340 |
| Capital shares sold | 1,681,073 |
| Interest | 13,358,001 |
| Expense reimbursement due from Investment Manager | 1,289 |
| Prepaid expenses | 844 |
| Trustees’ deferred compensation plan | 90,549 |
| Other assets | 11,809 |
| Total assets | 804,073,618 |
| Liabilities | |
| Payable for: | |
| Investments purchased on a delayed delivery basis | 3,490,410 |
| Capital shares purchased | 1,529,389 |
| Distributions to shareholders | 2,813,989 |
| Management services fees | 11,729 |
| Distribution and/or service fees | 1,921 |
| Transfer agent fees | 91,923 |
| Compensation of board members | 628 |
| Compensation of chief compliance officer | 59 |
| Other expenses | 44,521 |
| Trustees’ deferred compensation plan | 90,549 |
| Total liabilities | 8,075,118 |
| Net assets applicable to outstanding capital stock | $795,998,500 |
| Represented by | |
| Paid in capital | 817,696,319 |
| Undistributed net investment income | 6,816,423 |
| Accumulated net realized loss | (43,768,709) |
| Unrealized appreciation (depreciation) on: | |
| Investments - unaffiliated issuers | 15,254,467 |
| Total - representing net assets applicable to outstanding capital stock | $795,998,500 |
The accompanying Notes to Financial Statements are an integral part of this statement.
Columbia High Yield Municipal Fund | Annual Report 2017
| 23 |
Statement of Assets and Liabilities (continued)
May 31, 2017
| Class A | |
| Net assets | $130,916,529 |
| Shares outstanding | 12,307,310 |
| Net asset value per share | $10.64 |
| Maximum offering price per share(a) | $10.97 |
| Class B | |
| Net assets | $43,631 |
| Shares outstanding | 4,101 |
| Net asset value per share | $10.64 |
| Class C | |
| Net assets | $51,775,154 |
| Shares outstanding | 4,867,620 |
| Net asset value per share | $10.64 |
| Class R4 | |
| Net assets | $3,753,220 |
| Shares outstanding | 352,371 |
| Net asset value per share | $10.65 |
| Class R5 | |
| Net assets | $5,469,203 |
| Shares outstanding | 514,405 |
| Net asset value per share | $10.63 |
| Class Y | |
| Net assets | $10,175 |
| Shares outstanding | 954 |
| Net asset value per share(b) | $10.66 |
| Class Z | |
| Net assets | $604,030,588 |
| Shares outstanding | 56,774,177 |
| Net asset value per share | $10.64 |
| (a) | The maximum offering price per share is calculated by dividing the net asset value per share by 1.0 minus the maximum sales charge of 3.00% for Class A. |
| (b) | Net asset value per share rounds to this amount due to fractional shares outstanding. |
The accompanying Notes to Financial Statements are an integral part of this statement.
| 24 | Columbia High Yield Municipal Fund | Annual Report 2017 |
Statement of Operations
Year Ended May 31, 2017
| Net investment income | |
| Income: | |
| Dividends — unaffiliated issuers | $10,724 |
| Interest | 44,016,434 |
| Total income | 44,027,158 |
| Expenses: | |
| Management services fees | 4,668,440 |
| Distribution and/or service fees | |
| Class A | 340,902 |
| Class B | 2,740 |
| Class C | 561,979 |
| Transfer agent fees | |
| Class A | 261,037 |
| Class B | 447 |
| Class C | 90,132 |
| Class R4 | 4,600 |
| Class R5 | 3,421 |
| Class Y(a) | 1 |
| Class Z | 957,262 |
| Compensation of board members | 34,506 |
| Custodian fees | 8,399 |
| Printing and postage fees | 40,352 |
| Registration fees | 141,240 |
| Audit fees | 30,415 |
| Legal fees | 26,029 |
| Compensation of chief compliance officer | 387 |
| Other | (176,953) |
| Total expenses | 6,995,336 |
| Fees waived or expenses reimbursed by Investment Manager and its affiliates | (570,809) |
| Fees waived by distributor | |
| Class C | (59,246) |
| Expense reduction | (400) |
| Total net expenses | 6,364,881 |
| Net investment income | 37,662,277 |
| Realized and unrealized gain (loss) — net | |
| Net realized gain (loss) on: | |
| Investments — unaffiliated issuers | 12,190,282 |
| Net realized gain | 12,190,282 |
| Net change in unrealized appreciation (depreciation) on: | |
| Investments — unaffiliated issuers | (36,848,714) |
| Net change in unrealized appreciation (depreciation) | (36,848,714) |
| Net realized and unrealized loss | (24,658,432) |
| Net increase in net assets resulting from operations | $13,003,845 |
| (a) | Class Y shares are based on operations from March 1, 2017 (commencement of operations) through the stated period end. |
The accompanying Notes to Financial Statements are an integral part of this statement.
Columbia High Yield Municipal Fund | Annual Report 2017
| 25 |
Statement of Changes in Net Assets
| | Year Ended
May 31, 2017 (a) | Year Ended
May 31, 2016 |
| Operations | | |
| Net investment income | $37,662,277 | $39,122,835 |
| Net realized gain | 12,190,282 | 6,703,655 |
| Net change in unrealized appreciation (depreciation) | (36,848,714) | 8,563,697 |
| Net increase in net assets resulting from operations | 13,003,845 | 54,390,187 |
| Distributions to shareholders | | |
| Net investment income | | |
| Class A | (7,144,448) | (6,659,083) |
| Class B | (9,935) | (16,117) |
| Class C | (2,101,735) | (1,550,533) |
| Class R4 | (132,031) | (174,625) |
| Class R5 | (278,018) | (298,416) |
| Class Y | (113) | — |
| Class Z | (27,718,517) | (30,016,673) |
| Total distributions to shareholders | (37,384,797) | (38,715,447) |
| Increase (decrease) in net assets from capital stock activity | (115,592,097) | 63,139,825 |
| Total increase (decrease) in net assets | (139,973,049) | 78,814,565 |
| Net assets at beginning of year | 935,971,549 | 857,156,984 |
| Net assets at end of year | $795,998,500 | $935,971,549 |
| Undistributed net investment income | $6,816,423 | $6,145,186 |
| (a) | Class Y shares are based on operations from March 1, 2017 (commencement of operations) through the stated period end. |
The accompanying Notes to Financial Statements are an integral part of this statement.
| 26 | Columbia High Yield Municipal Fund | Annual Report 2017 |
Statement of Changes in Net Assets (continued)
| | Year Ended | Year Ended |
| | May 31, 2017 (a) | May 31, 2016 |
| | Shares | Dollars ($) | Shares | Dollars ($) |
| Capital stock activity |
| Class A | | | | |
| Subscriptions (b) | 7,141,734 | 77,197,323 | 9,497,720 | 102,169,905 |
| Distributions reinvested | 609,542 | 6,525,871 | 557,693 | 5,997,009 |
| Redemptions | (12,895,312) | (137,266,743) | (6,652,755) | (71,278,715) |
| Net increase (decrease) | (5,144,036) | (53,543,549) | 3,402,658 | 36,888,199 |
| Class B | | | | |
| Subscriptions | 766 | 7,992 | 2,359 | 25,076 |
| Distributions reinvested | 387 | 4,129 | 532 | 5,713 |
| Redemptions (b) | (32,050) | (335,495) | (18,932) | (202,354) |
| Net decrease | (30,897) | (323,374) | (16,041) | (171,565) |
| Class C | | | | |
| Subscriptions | 1,438,687 | 15,542,781 | 2,941,111 | 31,667,069 |
| Distributions reinvested | 176,746 | 1,889,047 | 122,791 | 1,320,888 |
| Redemptions | (2,265,388) | (23,902,758) | (587,907) | (6,302,634) |
| Net increase (decrease) | (649,955) | (6,470,930) | 2,475,995 | 26,685,323 |
| Class R4 | | | | |
| Subscriptions | 295,285 | 3,139,850 | 321,870 | 3,446,632 |
| Distributions reinvested | 12,261 | 131,508 | 16,168 | 174,147 |
| Redemptions | (377,210) | (4,084,029) | (309,403) | (3,295,468) |
| Net increase (decrease) | (69,664) | (812,671) | 28,635 | 325,311 |
| Class R5 | | | | |
| Subscriptions | 272,005 | 2,873,560 | 902,960 | 9,659,184 |
| Distributions reinvested | 25,872 | 277,546 | 27,670 | 297,378 |
| Redemptions | (510,619) | (5,485,441) | (567,183) | (6,059,468) |
| Net increase (decrease) | (212,742) | (2,334,335) | 363,447 | 3,897,094 |
| Class Y | | | | |
| Subscriptions | 954 | 10,000 | — | — |
| Net increase | 954 | 10,000 | — | — |
| Class Z | | | | |
| Subscriptions | 12,434,645 | 131,835,129 | 13,430,368 | 144,231,439 |
| Distributions reinvested | 782,350 | 8,357,752 | 625,211 | 6,719,777 |
| Redemptions | (18,139,822) | (192,310,119) | (14,482,989) | (155,435,753) |
| Net decrease | (4,922,827) | (52,117,238) | (427,410) | (4,484,537) |
| Total net increase (decrease) | (11,029,167) | (115,592,097) | 5,827,284 | 63,139,825 |
| (a) | Class Y shares are based on operations from March 1, 2017 (commencement of operations) through the stated period end. |
| (b) | Includes conversions of Class B shares to Class A shares, if any. |
The accompanying Notes to Financial Statements are an integral part of this statement.
Columbia High Yield Municipal Fund | Annual Report 2017
| 27 |
The following table is intended to help you understand the Fund’s financial performance. Certain information reflects financial results for a single share of a class held for the periods shown. Per share net investment income (loss) amounts are calculated based on average shares outstanding during the period. Total return assumes reinvestment of all dividends and distributions, if any. Total return does not reflect payment of sales charges, if any. Total return and portfolio turnover are not annualized for periods of less than one year. The portfolio turnover rate is calculated without regard to purchase and sales transactions of short-term instruments and certain derivatives, if any. If such transactions were included, the Fund’s portfolio turnover rate may be higher.
| Year ended | Net asset value,
beginning of
period | Net
investment
income | Net
realized
and
unrealized
gain (loss) | Total from
investment
operations | Distributions
from net
investment
income |
| Class A |
| 5/31/2017 | $10.90 | 0.45 | (0.26) | 0.19 | (0.45) |
| 5/31/2016 | $10.71 | 0.47 | 0.19 | 0.66 | (0.47) |
| 5/31/2015 | $10.56 | 0.47 | 0.15 | 0.62 | (0.47) |
| 5/31/2014 | $10.72 | 0.49 | (0.16) | 0.33 | (0.49) |
| 5/31/2013 | $10.49 | 0.45 | 0.22 | 0.67 | (0.44) |
| Class B |
| 5/31/2017 | $10.90 | 0.37 | (0.26) | 0.11 | (0.37) |
| 5/31/2016 | $10.71 | 0.39 | 0.18 | 0.57 | (0.38) |
| 5/31/2015 | $10.56 | 0.39 | 0.15 | 0.54 | (0.39) |
| 5/31/2014 | $10.72 | 0.42 | (0.17) | 0.25 | (0.41) |
| 5/31/2013 | $10.49 | 0.37 | 0.22 | 0.59 | (0.36) |
| Class C |
| 5/31/2017 | $10.90 | 0.38 | (0.26) | 0.12 | (0.38) |
| 5/31/2016 | $10.71 | 0.40 | 0.19 | 0.59 | (0.40) |
| 5/31/2015 | $10.56 | 0.40 | 0.15 | 0.55 | (0.40) |
| 5/31/2014 | $10.72 | 0.43 | (0.16) | 0.27 | (0.43) |
| 5/31/2013 | $10.49 | 0.38 | 0.22 | 0.60 | (0.37) |
| Class R4 |
| 5/31/2017 | $10.92 | 0.47 | (0.27) | 0.20 | (0.47) |
| 5/31/2016 | $10.72 | 0.49 | 0.20 | 0.69 | (0.49) |
| 5/31/2015 | $10.57 | 0.49 | 0.15 | 0.64 | (0.49) |
| 5/31/2014 | $10.73 | 0.52 | (0.18) | 0.34 | (0.50) |
| 5/31/2013 (e) | $10.77 | 0.10 | (0.05) (f) | 0.05 | (0.09) |
The accompanying Notes to Financial Statements are an integral part of this statement.
| 28 | Columbia High Yield Municipal Fund | Annual Report 2017 |
Total
distributions to
shareholders | Net
asset
value,
end of
period | Total
return | Total gross
expense
ratio to
average
net assets(a) | Total net
expense
ratio to
average
net assets(a),(b) | Net investment
income
ratio to
average
net assets | Portfolio
turnover | Net
assets,
end of
period
(000’s) |
| |
| (0.45) | $10.64 | 1.81% | 0.90% (c) | 0.84% (c),(d) | 4.21% | 21% | $130,917 |
| (0.47) | $10.90 | 6.27% | 0.95% | 0.86% (d) | 4.33% | 10% | $190,262 |
| (0.47) | $10.71 | 5.97% | 0.95% | 0.86% (d) | 4.44% | 7% | $150,483 |
| (0.49) | $10.56 | 3.35% | 0.95% | 0.86% (d) | 4.87% | 12% | $123,890 |
| (0.44) | $10.72 | 6.44% | 0.96% | 0.85% (d) | 4.17% | 9% | $91,422 |
| |
| (0.37) | $10.64 | 1.05% | 1.64% (c) | 1.58% (c),(d) | 3.47% | 21% | $44 |
| (0.38) | $10.90 | 5.48% | 1.70% | 1.61% (d) | 3.62% | 10% | $382 |
| (0.39) | $10.71 | 5.19% | 1.70% | 1.61% (d) | 3.70% | 7% | $547 |
| (0.41) | $10.56 | 2.59% | 1.71% | 1.62% (d) | 4.13% | 12% | $774 |
| (0.36) | $10.72 | 5.65% | 1.70% | 1.60% (d) | 3.41% | 9% | $1,217 |
| |
| (0.38) | $10.64 | 1.15% | 1.65% (c) | 1.48% (c),(d) | 3.58% | 21% | $51,775 |
| (0.40) | $10.90 | 5.58% | 1.70% | 1.51% (d) | 3.67% | 10% | $60,144 |
| (0.40) | $10.71 | 5.31% | 1.70% | 1.49% (d) | 3.79% | 7% | $32,575 |
| (0.43) | $10.56 | 2.73% | 1.70% | 1.46% (d) | 4.26% | 12% | $19,946 |
| (0.37) | $10.72 | 5.81% | 1.71% | 1.45% (d) | 3.57% | 9% | $14,684 |
| |
| (0.47) | $10.65 | 1.92% | 0.71% (c) | 0.64% (c),(d) | 4.41% | 21% | $3,753 |
| (0.49) | $10.92 | 6.58% | 0.75% | 0.66% (d) | 4.52% | 10% | $4,607 |
| (0.49) | $10.72 | 6.18% | 0.76% | 0.66% (d) | 4.65% | 7% | $4,218 |
| (0.50) | $10.57 | 3.53% | 0.76% | 0.65% (d) | 5.09% | 12% | $2,476 |
| (0.09) | $10.73 | 0.50% | 0.71% (g) | 0.68% (g) | 4.54% (g) | 9% | $3 |
Columbia High Yield Municipal Fund | Annual Report 2017
| 29 |
Financial Highlights (continued)
| Year ended | Net asset value,
beginning of
period | Net
investment
income | Net
realized
and
unrealized
gain (loss) | Total from
investment
operations | Distributions
from net
investment
income |
| Class R5 |
| 5/31/2017 | $10.90 | 0.48 | (0.27) | 0.21 | (0.48) |
| 5/31/2016 | $10.70 | 0.50 | 0.20 | 0.70 | (0.50) |
| 5/31/2015 | $10.55 | 0.50 | 0.15 | 0.65 | (0.50) |
| 5/31/2014 | $10.71 | 0.52 | (0.17) | 0.35 | (0.51) |
| 5/31/2013 (h) | $10.75 | 0.28 | (0.06) (f) | 0.22 | (0.26) |
| Class Y |
| 5/31/2017 (i) | $10.48 | 0.12 | 0.18 (f) | 0.30 | (0.12) |
| Class Z |
| 5/31/2017 | $10.90 | 0.47 | (0.26) | 0.21 | (0.47) |
| 5/31/2016 | $10.71 | 0.49 | 0.19 | 0.68 | (0.49) |
| 5/31/2015 | $10.56 | 0.49 | 0.15 | 0.64 | (0.49) |
| 5/31/2014 | $10.72 | 0.51 | (0.16) | 0.35 | (0.51) |
| 5/31/2013 | $10.49 | 0.47 | 0.22 | 0.69 | (0.46) |
| Notes to Financial Highlights |
| (a) | In addition to the fees and expenses that the Fund bears directly, the Fund indirectly bears a pro rata share of the fees and expenses of any other funds in which it invests. Such indirect expenses are not included in the Fund’s reported expense ratios. |
| (b) | Total net expenses include the impact of certain fee waivers/expense reimbursements made by the Investment Manager and certain of its affiliates, if applicable. |
| (c) | Expenses have been reduced due to a reimbursement of expenses overbilled by a third party. If the reimbursement had been excluded, the expense ratios would have been higher by the percentages shown for each class in the table below. All fee waivers and expense reimbursements by the Investment Manager and its affiliates were applied before giving effect to this third party reimbursement. |
| | Class A | Class B | Class C | Class R4 | Class R5 | Class Z |
| 05/31/2017 | 0.02 % | 0.03 % | 0.03 % | 0.02 % | 0.02 % | 0.02 % |
| (d) | The benefits derived from expense reductions had an impact of less than 0.01%. |
| (e) | Class R4 shares commenced operations on March 19, 2013. Per share data and total return reflect activity from that date. |
| (f) | Calculation of the net gain (loss) per share (both realized and unrealized) does not correlate to the aggregate realized and unrealized gain (loss) presented in the Statement of Operations due to the timing of subscriptions and redemptions of Fund shares in relation to fluctuations in the market value of the portfolio. |
| (g) | Annualized. |
| (h) | Class R5 shares commenced operations on November 8, 2012. Per share data and total return reflect activity from that date. |
| (i) | Class Y shares commenced operations on March 1, 2017. Per share data and total return reflect activity from that date. |
The accompanying Notes to Financial Statements are an integral part of this statement.
| 30 | Columbia High Yield Municipal Fund | Annual Report 2017 |
Total
distributions to
shareholders | Net
asset
value,
end of
period | Total
return | Total gross
expense
ratio to
average
net assets(a) | Total net
expense
ratio to
average
net assets(a),(b) | Net investment
income
ratio to
average
net assets | Portfolio
turnover | Net
assets,
end of
period
(000’s) |
| |
| (0.48) | $10.63 | 2.00% | 0.61% (c) | 0.56% (c) | 4.48% | 21% | $5,469 |
| (0.50) | $10.90 | 6.67% | 0.62% | 0.57% | 4.62% | 10% | $7,922 |
| (0.50) | $10.70 | 6.27% | 0.61% | 0.58% | 4.67% | 7% | $3,893 |
| (0.51) | $10.55 | 3.64% | 0.63% | 0.57% | 5.21% | 12% | $7,807 |
| (0.26) | $10.71 | 2.05% | 0.61% (g) | 0.61% (g) | 4.76% (g) | 9% | $509 |
| |
| (0.12) | $10.66 | 2.86% | 0.61% (g) | 0.53% (g) | 4.62% (g) | 21% | $10 |
| |
| (0.47) | $10.64 | 2.01% | 0.70% (c) | 0.64% (c),(d) | 4.43% | 21% | $604,031 |
| (0.49) | $10.90 | 6.48% | 0.75% | 0.66% (d) | 4.55% | 10% | $672,655 |
| (0.49) | $10.71 | 6.19% | 0.75% | 0.66% (d) | 4.64% | 7% | $665,442 |
| (0.51) | $10.56 | 3.56% | 0.75% | 0.67% (d) | 5.07% | 12% | $605,931 |
| (0.46) | $10.72 | 6.65% | 0.76% | 0.65% (d) | 4.37% | 9% | $849,332 |
Columbia High Yield Municipal Fund | Annual Report 2017
| 31 |
Notes to Financial Statements
May 31, 2017
Note 1. Organization
Columbia High Yield Municipal Fund (the Fund), a series of Columbia Funds Series Trust I (the Trust), is a diversified fund. The Trust is registered under the Investment Company Act of 1940, as amended (the 1940 Act), as an open-end management investment company organized as a Massachusetts business trust.
Fund shares
The Trust may issue an unlimited number of shares (without par value). Although all share classes generally have identical voting, dividend and liquidation rights, each share class votes separately when required by the Trust’s organizational documents or by law. Different share classes pay different distribution amounts to the extent the expenses of such share classes differ, and distributions in liquidation will be proportional to the net asset value of each share class. Each share class has its own expense and sales charge structure. The Fund offers each of the share classes identified below.
Class A shares are subject to a maximum front-end sales charge of 3.00% based on the initial investment amount. Class A shares purchased without an initial sales charge are subject to a contingent deferred sales charge (CDSC) of 0.75% on certain investments of $500,000 or more if redeemed within 12 months after purchase.
The Fund no longer accepts investments by new or existing investors in the Fund’s Class B shares, except in connection with the reinvestment of any dividend and/or capital gain distributions in Class B shares of the Fund and exchanges by existing Class B shareholders of certain other funds within the Columbia Family of Funds. Class B shares are typically subject to a maximum CDSC of 5.00% based upon the holding period after purchase. However, the Fund’s current Class B investors, having held their shares for the requisite time period, are no longer subject to a CDSC upon redemption of their shares. Effective July 17, 2017, Class B shares were automatically converted to Class A shares, and the Fund no longer accepts investments by new or existing investors in Class B shares.
Class C shares are subject to a 1.00% CDSC on shares redeemed within 12 months after purchase.
Class R4 shares are not subject to sales charges and are generally available only to omnibus retirement plans and certain investors as described in the Fund’s prospectus.
Class R5 shares are not subject to sales charges and are generally available only to investors purchasing through authorized investment professionals and omnibus retirement plans.
Class Y shares are not subject to sales charges or distribution and service (12b-1) fees, and are available to institutional and certain other investors as described in the Fund’s prospectus. Class Y shares commenced operations on March 1, 2017.
Class Z shares are not subject to sales charges and are generally available only to eligible investors, which are subject to different investment minimums as described in the Fund’s prospectus.
Note 2. Summary of significant accounting policies
Basis of preparation
The Fund is an investment company that applies the accounting and reporting guidance in the Financial Accounting Standards Board (FASB) Accounting Standards Codification Topic 946, Financial Services - Investment Companies (ASC 946). The financial statements are prepared in accordance with U.S. generally accepted accounting principles (GAAP), which requires management to make certain estimates and assumptions that affect the reported amounts of assets and liabilities, the disclosure of contingent assets and liabilities at the date of the financial statements and the reported amounts of income and expenses during the reporting period. Actual results could differ from those estimates. The Fund received a reimbursement for expenses overbilled by a third party. Such reimbursement is included as an offset to other expenses on the Statement of Operations. All fee waivers and expense reimbursements by the Investment Manager and its affiliates were applied before giving effect to the third party reimbursement.
The following is a summary of significant accounting policies followed by the Fund in the preparation of its financial statements.
| 32 | Columbia High Yield Municipal Fund | Annual Report 2017 |
Notes to Financial Statements (continued)
May 31, 2017
Security valuation
All equity securities are valued at the close of business of the New York Stock Exchange. Equity securities are valued at the last quoted sales price on the principal exchange or market on which they trade, except for securities traded on the NASDAQ Stock Market, which are valued at the NASDAQ official close price. Unlisted securities or listed securities for which there were no sales during the day are valued at the mean of the latest quoted bid and ask prices on such exchanges or markets.
Debt securities generally are valued by pricing services approved by the Board of Trustees based upon market transactions for normal, institutional-size trading units of similar securities. The services may use various pricing techniques that take into account, as applicable, factors such as yield, quality, coupon rate, maturity, type of issue, trading characteristics and other data, as well as approved independent broker-dealer quotes. Debt securities for which quotations are not readily available or not believed to be reflective of market value may also be valued based upon a bid quote from an approved independent broker-dealer. Debt securities maturing in 60 days or less are valued primarily at amortized cost value, unless this method results in a valuation that management believes does not approximate market value.
Investments for which market quotations are not readily available, or that have quotations which management believes are not reflective of market value or reliable, are valued at fair value as determined in good faith under procedures approved by and under the general supervision of the Board of Trustees. If a security or class of securities (such as foreign securities) is valued at fair value, such value is likely to be different from the quoted or published price for the security.
The determination of fair value often requires significant judgment. To determine fair value, management may use assumptions including but not limited to future cash flows and estimated risk premiums. Multiple inputs from various sources may be used to determine fair value.
GAAP requires disclosure regarding the inputs and valuation techniques used to measure fair value and any changes in valuation inputs or techniques. In addition, investments shall be disclosed by major category. This information is disclosed following the Fund’s Portfolio of Investments.
Delayed delivery securities
The Fund may trade securities on other than normal settlement terms, including securities purchased or sold on a “when-issued” or "forward commitment" basis. This may increase risk to the Fund since the other party to the transaction may fail to deliver, which could cause the Fund to subsequently invest at less advantageous prices. The Fund designates cash or liquid securities in an amount equal to the delayed delivery commitment.
Security transactions
Security transactions are accounted for on the trade date. Cost is determined and gains (losses) are based upon the specific identification method for both financial statement and federal income tax purposes.
Income recognition
Interest income is recorded on an accrual basis. Market premiums and discounts, including original issue discounts, are amortized and accreted, respectively, over the expected life of the security on all debt securities, unless otherwise noted.
The Fund may place a debt security on non-accrual status and reduce related interest income when it becomes probable that the interest will not be collected and the amount of uncollectible interest can be reasonably estimated. A defaulted debt security is removed from non-accrual status when the issuer resumes interest payments or when collectibility of interest is reasonably assured.
Dividend income is recorded on the ex-dividend date.
Awards from class action litigation are recorded as a reduction of cost basis if the Fund still owns the applicable securities on the payment date. If the Fund no longer owns the applicable securities, the proceeds are recorded as realized gains.
Columbia High Yield Municipal Fund | Annual Report 2017
| 33 |
Notes to Financial Statements (continued)
May 31, 2017
Expenses
General expenses of the Trust are allocated to the Fund and other funds of the Trust based upon relative net assets or other expense allocation methodologies determined by the nature of the expense. Expenses directly attributable to the Fund are charged to the Fund. Expenses directly attributable to a specific class of shares are charged to that share class.
Determination of class net asset value
All income, expenses (other than class-specific expenses, which are charged to that share class, as shown in the Statement of Operations) and realized and unrealized gains (losses) are allocated to each class of the Fund on a daily basis, based on the relative net assets of each class, for purposes of determining the net asset value of each class.
Federal income tax status
The Fund intends to qualify each year as a regulated investment company under Subchapter M of the Internal Revenue Code, as amended, and will distribute substantially all of its tax exempt and taxable income (including net short-term capital gains), if any, for its tax year, and as such will not be subject to federal income taxes. In addition, the Fund intends to distribute in each calendar year substantially all of its net investment income, capital gains and certain other amounts, if any, such that the Fund should not be subject to federal excise tax. Therefore, no federal income or excise tax provision is recorded.
Distributions to shareholders
Distributions from net investment income, if any, are declared daily and paid monthly. Net realized capital gains, if any, are distributed at least annually. Income distributions and capital gain distributions are determined in accordance with federal income tax regulations, which may differ from GAAP.
Guarantees and indemnifications
Under the Trust’s organizational documents and, in some cases, by contract, its officers and trustees are indemnified against certain liabilities arising out of the performance of their duties to the Trust or its funds. In addition, certain of the Fund’s contracts with its service providers contain general indemnification clauses. The Fund’s maximum exposure under these arrangements is unknown since the amount of any future claims that may be made against the Fund cannot be determined, and the Fund has no historical basis for predicting the likelihood of any such claims.
Investment company reporting modernization
In October 2016, the U.S. Securities and Exchange Commission adopted new rules and forms, and amendments to certain current rules and forms, to modernize reporting and disclosure of information by registered investment companies. The amendments to Regulation S-X will require standardized, enhanced disclosure about derivatives in investment company financial statements, and will also change the rules governing the form and content of such financial statements. The amendments to Regulation S-X take effect on August 1, 2017. At this time, management is assessing the anticipated impact of these regulatory developments.
Note 3. Fees and other transactions with affiliates
Management services fees
The Fund entered into a Management Agreement with Columbia Management Investment Advisers, LLC (the Investment Manager), a wholly-owned subsidiary of Ameriprise Financial, Inc. (Ameriprise Financial). Under the Management Agreement, the Investment Manager provides the Fund with investment research and advice, as well as administrative and accounting services. The management services fee is an annual fee that is equal to a percentage of the Fund’s average daily net assets that declines from 0.54% to 0.34% as the Fund’s net assets increase. The effective management services fee rate for the year ended May 31, 2017 was 0.54% of the Fund’s average daily net assets.
| 34 | Columbia High Yield Municipal Fund | Annual Report 2017 |
Notes to Financial Statements (continued)
May 31, 2017
Compensation of board members
Members of the Board of Trustees, who are not officers or employees of the Investment Manager or Ameriprise Financial, are compensated for their services to the Fund as disclosed in the Statement of Operations. These members of the Board of Trustees may participate in a Deferred Compensation Plan (the Plan) which may be terminated at any time. Obligations of the Plan will be paid solely out of the Fund’s assets, and all amounts payable under the Plan constitute a general unsecured obligation of the Fund.
Compensation of Chief Compliance Officer
The Board of Trustees has appointed a Chief Compliance Officer to the Fund in accordance with federal securities regulations. A portion of the Chief Compliance Officer’s total compensation is allocated to the Fund, along with other affiliated funds governed by the Board of Trustees, based on relative net assets. The total amount allocated to all affiliated funds governed by the Board of Trustees will not exceed $40,000 annually.
Transfer agency fees
Under a Transfer and Dividend Disbursing Agent Agreement, Columbia Management Investment Services Corp. (the Transfer Agent), an affiliate of the Investment Manager and a wholly-owned subsidiary of Ameriprise Financial, is responsible for providing transfer agency services to the Fund. The Transfer Agent has contracted with Boston Financial Data Services (BFDS) to serve as sub-transfer agent. The Transfer Agent pays the fees of BFDS for services as sub-transfer agent and BFDS is not entitled to reimbursement for such fees from the Fund (with the exception of out-of-pocket fees).
The Fund pays the Transfer Agent a monthly transfer agency fee based on the number or the average value of accounts, depending on the type of account. In addition, prior to October 1, 2016, the Transfer Agent also received sub-transfer agency fees based on a percentage of the average aggregate value of the Fund’s shares maintained in omnibus accounts (other than omnibus accounts for which American Enterprise Investment Services Inc. is the broker of record or accounts where the beneficial shareholder is a customer of Ameriprise Financial Services, Inc., for which the Transfer Agent receives a per account fee). Effective October 1, 2016, the Fund pays the Transfer Agent a fee for shareholder services based on the number of accounts or on a percentage of the average aggregate value of the Fund’s shares maintained in omnibus accounts up to the lesser of the amount charged by the financial intermediary or a cap established by the Board of Trustees from time to time.
The Transfer Agent also receives compensation from the Fund for various shareholder services and reimbursements for certain out-of-pocket fees. Effective January 1, 2017, total transfer agency fees for Class R5 shares are subject to an annual limitation of not more than 0.075% of the average daily net assets attributable to Class R5 shares. Prior to January 1, 2017, total transfer agency fees for Class R5 shares were subject to an annual limitation of not more than 0.05% of the average daily net assets attributable to Class R5 shares. Total transfer agency fees for Class Y shares are subject to an annual limitation of not more than 0.025% of the average daily net assets attributable to Class Y shares.
For the year ended May 31, 2017, the Fund’s effective transfer agency fee rates as a percentage of average daily net assets of each class were as follows:
| | Effective rate (%) |
| Class A | 0.15 |
| Class B | 0.15 |
| Class C | 0.15 |
| Class R4 | 0.15 |
| Class R5 | 0.055 |
| Class Y | 0.025 (a) |
| Class Z | 0.15 |
Columbia High Yield Municipal Fund | Annual Report 2017
| 35 |
Notes to Financial Statements (continued)
May 31, 2017
An annual minimum account balance fee of $20 may apply to certain accounts with a value below the applicable share class’s initial minimum investment requirements to reduce the impact of small accounts on transfer agency fees. These minimum account balance fees are remitted to the Fund and recorded as part of expense reductions in the Statement of Operations. For the year ended May 31, 2017, these minimum account balance fees reduced total expenses of the Fund by $400.
Distribution and service fees
The Fund has an agreement with Columbia Management Investment Distributors, Inc. (the Distributor), an affiliate of the Investment Manager and a wholly-owned subsidiary of Ameriprise Financial, for distribution and shareholder services. The Board of Trustees has approved, and the Fund has adopted, distribution and shareholder service plans (the Plans) applicable to certain share classes, which set the distribution and service fees for the Fund. These fees are calculated daily and are intended to compensate the Distributor and/or eligible selling and/or servicing agents for selling shares of the Fund and providing services to investors.
Under the Plans, the Fund pays a monthly service fee to the Distributor at the maximum annual rate of 0.20% of the average daily net assets attributable to Class A, Class B and Class C shares of the Fund. Also under the Plans, the Fund pays a monthly distribution fee to the Distributor at the maximum annual rates of 0.75% of the average daily net assets attributable to Class B and Class C shares of the Fund.
The Distributor has voluntarily agreed to waive a portion of the distribution fee for Class C shares so that the distribution fee does not exceed 0.65% annually of the average daily net assets attributable to Class C shares. This arrangement may be modified or terminated by the Distributor at any time.
Sales charges (unaudited)
Sales charges, including front-end charges and CDSCs, received by the Distributor for distributing Fund shares for the year ended May 31, 2017, if any, are listed below:
| | Amount ($) |
| Class A | 222,749 |
| Class C | 11,537 |
Expenses waived/reimbursed by the Investment Manager and its affiliates
The Investment Manager and certain of its affiliates have contractually agreed to waive fees and/or reimburse expenses (excluding certain fees and expenses described below) for the periods disclosed below, unless sooner terminated at the sole discretion of the Board of Trustees, so that the Fund’s net operating expenses, after giving effect to fees waived/expenses reimbursed and any balance credits and/or overdraft charges from the Fund’s custodian, do not exceed the following annual rates as a percentage of the class’ average daily net assets:
| | October 1, 2016
through
September 30, 2017 | Prior to
October 1, 2016 |
| Class A | 0.860% | 0.86% |
| Class B | 1.610 | 1.61 |
| Class C | 1.610 | 1.61 |
| Class R4 | 0.660 | 0.66 |
| Class R5 | 0.580 | 0.57 |
| Class Y | 0.530* | - |
| Class Z | 0.660 | 0.66 |
*Expense cap rate is contractual from March 1, 2017 (the commencement of operations of Class Y shares) through September 30, 2017.
Under the agreement governing these fee waivers and/or expense reimbursement arrangements, the following fees and expenses are excluded from the waiver/reimbursement commitment, and therefore will be paid by the Fund, if applicable: taxes (including foreign transaction taxes), expenses associated with investments in affiliated and non-affiliated
| 36 | Columbia High Yield Municipal Fund | Annual Report 2017 |
Notes to Financial Statements (continued)
May 31, 2017
pooled investment vehicles (including mutual funds and exchange-traded funds), transaction costs and brokerage commissions, costs related to any securities lending program, dividend and interest expenses associated with securities sold short, inverse floater program fees and expenses, transaction charges and interest on borrowed money, interest, infrequent and/or unusual expenses and any other expenses the exclusion of which is specifically approved by the Board of Trustees. This agreement may be modified or amended only with approval from the Investment Manager, certain of its affiliates and the Fund. Any fees waived and/or expenses reimbursed under the expense reimbursement arrangements described above are not recoverable by the Investment Manager or its affiliates in future periods. Class C distribution fees waived by the Distributor, as discussed above, are in addition to the waiver/reimbursement commitment under the agreement.
Note 4. Federal tax information
The timing and character of income and capital gain distributions are determined in accordance with income tax regulations, which may differ from GAAP because of temporary or permanent book to tax differences.
At May 31, 2017, these differences are primarily due to differing treatment for deferral/reversal of wash sale losses, tax straddles, capital loss carryforwards, trustees’ deferred compensation, distributions, principal and/or interest from fixed income securities and investments in partnerships. To the extent these differences are permanent, reclassifications are made among the components of the Fund’s net assets in the Statement of Assets and Liabilities. Temporary differences do not require reclassifications.
In the Statement of Assets and Liabilities the following reclassifications were made:
Undistributed net
investment
income ($) | Accumulated
net realized
(loss) ($) | Paid in
capital ($) |
| 393,757 | 17,350,361 | (17,744,118) |
Net investment income (loss) and net realized gains (losses), as disclosed in the Statement of Operations, and net assets were not affected by this reclassification.
The tax character of distributions paid during the years indicated was as follows:
| Year Ended May 31, 2017 | Year Ended May 31, 2016 |
Ordinary
income ($) | Tax-exempt
income ($) | Long-term
capital gains ($) | Total ($) | Ordinary
income ($) | Tax-exempt
income ($) | Long-term
capital gains ($) | Total ($) |
| 656,347 | 36,728,450 | — | 37,384,797 | 769,511 | 37,945,936 | — | 38,715,447 |
Short-term capital gain distributions, if any, are considered ordinary income distributions for tax purposes.
At May 31, 2017, the components of distributable earnings on a tax basis were as follows:
Undistributed
ordinary income ($) | Undistributed tax-
exempt income ($) | Undistributed
long-term
capital gains ($) | Capital loss
carryforwards ($) | Net unrealized
appreciation ($) |
| — | 15,517,793 | — | (42,710,600) | 15,384,784 |
At May 31, 2017, the cost of investments for federal income tax purposes along with the aggregate gross unrealized appreciation and depreciation based on that cost was:
Federal
tax cost ($) | Gross unrealized
appreciation ($) | Gross unrealized
(depreciation) ($) | Net unrealized
appreciation ($) |
| 772,371,780 | 45,941,176 | (30,556,392) | 15,384,784 |
The following capital loss carryforwards, determined at May 31, 2017, may be available to reduce taxable income arising from future net realized gains on investments, if any, to the extent permitted by the Internal Revenue Code. Capital loss carryforwards with no expiration are required to be utilized prior to any capital losses which carry an expiration date. As a
Columbia High Yield Municipal Fund | Annual Report 2017
| 37 |
Notes to Financial Statements (continued)
May 31, 2017
result of this ordering rule, capital loss carryforwards which carry an expiration date may be more likely to expire unused. In addition, for the year ended May 31, 2017, capital loss carryforwards utilized, expired unused and permanently lost were as follows:
| 2018 ($) | 2019 ($) | No expiration
short-term ($) | No expiration
long-term ($) | Total ($) | Utilized ($) | Expired ($) | Permanently
lost ($) |
| 35,721,468 | 4,244,605 | 1,961,649 | 782,878 | 42,710,600 | 11,619,406 | 17,741,445 | — |
Management of the Fund has concluded that there are no significant uncertain tax positions in the Fund that would require recognition in the financial statements. However, management’s conclusion may be subject to review and adjustment at a later date based on factors including, but not limited to, new tax laws, regulations, and administrative interpretations (including relevant court decisions). Generally, the Fund’s federal tax returns for the prior three fiscal years remain subject to examination by the Internal Revenue Service.
Note 5. Portfolio information
The cost of purchases and proceeds from sales of securities, excluding short-term investments and derivatives, if any, aggregated to $175,370,007 and $257,626,969, respectively, for the year ended May 31, 2017. The amount of purchase and sale activity impacts the portfolio turnover rate reported in the Financial Highlights.
Note 6. Line of credit
The Fund has access to a revolving credit facility with a syndicate of banks led by Citibank, N.A., HSBC Bank USA, N.A. and JPMorgan Chase Bank, N.A. whereby the Fund may borrow for the temporary funding of shareholder redemptions or for other temporary or emergency purposes. The credit facility agreement, which is a collective agreement between the Fund and certain other funds managed by the Investment Manager, severally and not jointly, permits collective borrowings up to $1 billion. Interest is charged to each participating fund based on its borrowings at a rate equal to the higher of (i) the overnight federal funds rate plus 1.00% or (ii) the one-month LIBOR rate plus 1.00%. Each borrowing under the credit facility matures no later than 60 days after the date of borrowing. The Fund also pays a commitment fee equal to its pro rata share of the amount of the credit facility at a rate of 0.15% per annum. The commitment fee is included in other expenses in the Statement of Operations.
The Fund had no borrowings during the year ended May 31, 2017.
Note 7. Significant risks
Credit risk
Credit risk is the risk that the value of debt securities in the Fund’s portfolio may decline because the issuer may default and fail to pay interest or repay principal when due. Rating agencies assign credit ratings to debt securities to indicate their credit risk. Lower rated or unrated debt securities held by the Fund may present increased credit risk as compared to higher-rated debt securities.
High-yield investments risk
Securities and other debt instruments held by the Fund that are rated below investment grade (commonly called "high-yield" or "junk" bonds) and unrated debt instruments of comparable quality expose the Fund to a greater risk of loss of principal and income than a fund that invests solely or primarily in investment grade securities. In addition, these investments have greater price fluctuations, are less liquid and are more likely to experience a default than higher-rated debt instruments. High-yield debt instruments are considered to be predominantly speculative with respect to the issuer’s capacity to pay interest and repay principal.
Interest rate risk
Interest rate risk is the risk of losses attributable to changes in interest rates. In general, if prevailing interest rates rise, the values of debt securities tend to fall, and if interest rates fall, the values of debt securities tend to rise. Actions by governments and central banking authorities can result in increases in interest rates. Increasing interest rates may negatively
| 38 | Columbia High Yield Municipal Fund | Annual Report 2017 |
Notes to Financial Statements (continued)
May 31, 2017
affect the value of debt securities held by the Fund, resulting in a negative impact on the Fund’s performance and net asset value per share. In general, the longer the maturity or duration of a debt security, the greater its sensitivity to changes in interest rates.
Liquidity risk
Liquidity risk is the risk associated with a lack of marketability of investments which may make it difficult to sell the investment at a desirable time or price. Changing regulatory, market or other conditions or environments (for example, the interest rate or credit environments) may adversely affect the liquidity of the Fund’s investments. The Fund may have to accept a lower selling price for the holding, sell other investments, or forego another, more appealing investment opportunity. Generally, the less liquid the market at the time the Fund sells a portfolio investment, the greater the risk of loss or decline of value to the Fund. A less liquid market can lead to an increase in Fund redemptions, which may negatively impact Fund performance and net asset value per share, including, for example, if the Fund is forced to sell securities in a down market.
Shareholder concentration risk
At May 31, 2017, one unaffiliated shareholder of record owned 48.3% of the outstanding shares of the Fund in one or more accounts. The Fund has no knowledge about whether any portion of those shares was owned beneficially. Affiliated shareholders of record owned 11.4% of the outstanding shares of the Fund in one or more accounts. Subscription and redemption activity by concentrated accounts may have a significant effect on the operations of the Fund. In the case of a large redemption, the Fund may be forced to sell investments at inopportune times, including its liquid or more liquid positions, resulting in Fund losses and the Fund holding a higher percentage of less liquid or illiquid securities. Large redemptions could result in decreased economies of scale and increased operating expenses for non-redeeming Fund shareholders.
Note 8. Subsequent events
Management has evaluated the events and transactions that have occurred through the date the financial statements were issued. Other than as noted in Note 1 above, there were no items requiring adjustment of the financial statements or additional disclosure.
Note 9. Information regarding pending and settled legal proceedings
Ameriprise Financial and certain of its affiliates have historically been involved in a number of legal, arbitration and regulatory proceedings, including routine litigation, class actions, and governmental actions, concerning matters arising in connection with the conduct of their business activities. Ameriprise Financial believes that the Funds are not currently the subject of, and that neither Ameriprise Financial nor any of its affiliates are the subject of, any pending legal, arbitration or regulatory proceedings that are likely to have a material adverse effect on the Funds or the ability of Ameriprise Financial or its affiliates to perform under their contracts with the Funds. Ameriprise Financial is required to make quarterly (10-Q), annual (10-K) and, as necessary, 8-K filings with the Securities and Exchange Commission (SEC) on legal and regulatory matters that relate to Ameriprise Financial and its affiliates. Copies of these filings may be obtained by accessing the SEC website at www.sec.gov.
There can be no assurance that these matters, or the adverse publicity associated with them, will not result in increased Fund redemptions, reduced sale of Fund shares or other adverse consequences to the Funds. Further, although we believe proceedings are not likely to have a material adverse effect on the Funds or the ability of Ameriprise Financial or its affiliates to perform under their contracts with the Funds, these proceedings are subject to uncertainties and, as such, we are unable to estimate the possible loss or range of loss that may result. An adverse outcome in one or more of these proceedings could result in adverse judgments, settlements, fines, penalties or other relief that could have a material adverse effect on the consolidated financial condition or results of operations of Ameriprise Financial.
Columbia High Yield Municipal Fund | Annual Report 2017
| 39 |
Report of Independent Registered Public Accounting Firm
To the Trustees of Columbia Funds Series Trust I and the Shareholders of Columbia High Yield Municipal Fund
In our opinion, the accompanying statement of assets and liabilities, including the portfolio of investments, and the related statements of operations and of changes in net assets and the financial highlights present fairly, in all material respects, the financial position of Columbia High Yield Municipal Fund (the “Fund”, a series of Columbia Funds Series Trust I) as of May 31, 2017, the results of its operations for the year then ended, the changes in its net assets for each of the two years in the period then ended and the financial highlights for each of the five years in the period then ended, in conformity with accounting principles generally accepted in the United States of America. These financial statements and financial highlights (hereafter referred to as “financial statements”) are the responsibility of the Fund’s management. Our responsibility is to express an opinion on these financial statements based on our audits. We conducted our audits of these financial statements in accordance with the standards of the Public Company Accounting Oversight Board (United States). Those standards require that we plan and perform the audit to obtain reasonable assurance about whether the financial statements are free of material misstatement. An audit includes examining, on a test basis, evidence supporting the amounts and disclosures in the financial statements, assessing the accounting principles used and significant estimates made by management, and evaluating the overall financial statement presentation. We believe that our audits, which included confirmation of securities as of May 31, 2017 by correspondence with the custodian and brokers, provide a reasonable basis for our opinion.
PricewaterhouseCoopers LLP
Minneapolis, MN
July 21, 2017
| 40 | Columbia High Yield Municipal Fund | Annual Report 2017 |
Federal Income Tax Information
(Unaudited)
The Fund hereby designates the following tax attributes for the fiscal year ended May 31, 2017. Shareholders will be notified in early 2018 of the amounts for use in preparing 2017 income tax returns.
Exempt-
interest
dividends | |
| 98.24% | |
Exempt-interest dividends. The percentage of net investment income distributed during the fiscal year that qualifies as exempt-interest dividends for federal income tax purposes.
Columbia High Yield Municipal Fund | Annual Report 2017
| 41 |
Shareholders elect the Board that oversees the Fund’s operations. The Board appoints officers who are responsible for day-to-day business decisions based on policies set by the Board. The following table provides basic biographical information about the Fund’s Trustees, including their principal occupations during the past five years, although specific titles for individuals may have varied over the period. The year set forth beneath Length of Service in the table below is the year in which the Trustee was first appointed or elected as Trustee to any Fund currently in the Columbia Funds Complex or a predecessor thereof. Under current Board policy, members serve terms of indefinite duration.
Independent trustees
| Name, address, year of birth | Position held with the Trust and length of service | Principal occupation(s) during the past five years and other relevant professional experience | Number of Funds in the Columbia Fund Complex overseen | Other directorships held by Trustee during the past five years |
Janet Langford Carrig
c/o Columbia Management
Investment Advisers, LLC
225 Franklin Street
Mail Drop BX32 05228
Boston, MA 02110
1957 | Trustee
1996 | Senior Vice President, General Counsel and Corporate Secretary, ConocoPhillips (independent energy company) since September 2007 | 57 | None |
Douglas A. Hacker
c/o Columbia Management
Investment Advisers, LLC
225 Franklin Street
Mail Drop BX32 05228
Boston, MA 02110
1955 | Trustee and Chairman of the Board
1996 | Independent business executive since May 2006; Executive Vice President — Strategy of United Airlines from December 2002 to May 2006; President of UAL Loyalty Services (airline marketing company) from September 2001 to December 2002; Executive Vice President and Chief Financial Officer of United Airlines from July 1999 to September 2001 | 57 | Spartan Nash Company, (food distributor); Nash Finch Company (food distributor) from 2005 to 2013; Aircastle Limited (aircraft leasing); SeaCube Container Leasing Ltd. (container leasing) from 2010 to 2013; and Travelport Worldwide Limited (travel information technology) |
Nancy T. Lukitsh
c/o Columbia Management
Investment Advisers, LLC
225 Franklin Street
Mail Drop BX32 05228
Boston, MA 02110
1956 | Trustee
2011 | Senior Vice President, Partner and Director of Marketing, Wellington Management Company, LLP (investment adviser) from 1997 to 2010; Chair, Wellington Management Portfolios (commingled non-U.S. investment pools) from 2007 to 2010; Director, Wellington Trust Company, NA and other Wellington affiliates from 1997 to 2010 | 57 | None |
David M. Moffett
c/o Columbia Management
Investment Advisers, LLC
225 Franklin Street
Mail Drop BX32 05228
Boston, MA 02110
1952 | Trustee
2011 | Retired. Consultant to Bridgewater and Associates | 57 | Director, CSX Corporation; Genworth Financial, Inc. (financial and insurance products and services); PayPal Holdings Inc. (payment and data processing services); Trustee, University of Oklahoma Foundation; former Director, eBay Inc. (online trading community), 2007-2015; and former Director, CIT Bank, CIT Group Inc. (commercial and consumer finance), 2010-2016 |
| 42 | Columbia High Yield Municipal Fund | Annual Report 2017 |
TRUSTEES AND OFFICERS (continued)
Independent trustees (continued)
| Name, address, year of birth | Position held with the Trust and length of service | Principal occupation(s) during the past five years and other relevant professional experience | Number of Funds in the Columbia Fund Complex overseen | Other directorships held by Trustee during the past five years |
Charles R. Nelson
c/o Columbia Management
Investment Advisers, LLC
225 Franklin Street
Mail Drop BX32 05228
Boston, MA 02110
1942 | Trustee
1981 | Retired. Professor Emeritus, University of Washington since 2011; Professor of Economics, University of Washington from 1976 to 2011; Ford and Louisa Van Voorhis Professor of Political Economy, University of Washington from 1993 to 2011; Adjunct Professor of Statistics, University of Washington from 1980 to 2011; Associate Editor, Journal of Money, Credit and Banking from September 1993 to 2008; consultant on econometric and statistical matters | 57 | None |
John J. Neuhauser
c/o Columbia Management
Investment Advisers, LLC
225 Franklin Street
Mail Drop BX32 05228
Boston, MA 02110
1943 | Trustee
1984 | President, Saint Michael’s College since August 2007; Director or Trustee of several non-profit organizations, including University of Vermont Medical Center; Academic Vice President and Dean of Faculties, Boston College from August 1999 to October 2005; University Professor, Boston College from November 2005 to August 2007 | 57 | Liberty All-Star Equity Fund and Liberty All- Star Growth Fund (closed-end funds) |
Patrick J. Simpson
c/o Columbia Management
Investment Advisers, LLC
225 Franklin Street
Mail Drop BX32 05228
Boston, MA 02110
1944 | Trustee
2000 | Of Counsel, Perkins Coie LLP (law firm) since 2015; Partner, Perkins Coie LLP from 1988 to 2014 | 57 | None |
Anne-Lee Verville
c/o Columbia Management
Investment Advisers, LLC
225 Franklin Street
Mail Drop BX32 05228
Boston, MA 02110
1945 | Trustee
1998 | Retired. General Manager, Global Education Industry from 1994 to 1997, President – Application Systems Division from 1991 to 1994, Chief Financial Officer – US Marketing & Services from 1988 to 1991, and Chief Information Officer from 1987 to 1988, IBM Corporation (computer and technology) | 57 | Enesco Group, Inc. (producer of giftware and home and garden decor products) from 2001 to 2006 |
Columbia High Yield Municipal Fund | Annual Report 2017
| 43 |
TRUSTEES AND OFFICERS (continued)
Consultants to the Independent Trustees*
| Name, address, year of birth | Position held with the Trust and length of service | Principal occupation(s) during the past five years and other relevant professional experience | Number of Funds in the Columbia Funds complex overseen | Other directorships held by Trustee during the past five years |
J. Kevin Connaughton
c/o Columbia
Management Investment
Advisers, LLC,
225 Franklin Street
Mail Drop BX32 05228,
Boston, MA 02110
1964 | Independent Trustee Consultant
2016 | Independent Trustee Consultant, Columbia Funds since March 2016; Managing Director and General Manager of Mutual Fund Products, Columbia Management Investment Advisers, LLC from May 2010 to February 2015; President, Columbia Funds from 2009 to 2015; and senior officer of Columbia Funds and affiliated funds from 2003 to 2015 | 57 | Board of Governors, Gateway Healthcare since January 2016; Trustee, New Century Portfolios since March 2015; and Director, The Autism Project since March 2015 |
Natalie A. Trunow
c/o Columbia
Management Investment
Advisers, LLC,
225 Franklin Street
Mail Drop BX32 05228,
Boston, MA 02110
1967 | Independent Trustee Consultant
2016 | Independent Trustee Consultant, Columbia Funds since September 2016; Chief Executive Officer, Millennial Partners (investment consulting services to institutions) since January 2016; Director of Investments, Casey Family Programs from April 2016 to September 2016; Senior Vice President and Chief Investment Officer, Calvert Investments from August 2008 to January 2016; Section Head and Portfolio Manager, General Motors Asset Management from June 1997 to August 2008 | 57 | Healthcare Services for Children with Special Needs |
| * | J. Kevin Connaughton was appointed consultant to the Independent Trustees effective March 1, 2016. Natalie A. Trunow was appointed consultant to the Independent Trustees effective September 1, 2016. Shareholders of the Funds are expected to be asked to elect each of Mr. Connaughton and Ms. Trunow as a Trustee at a future shareholder meeting. |
Interested trustee affiliated with Investment Manager*
| Name, address, year of birth | Position held with the Trust and length of service | Principal occupation(s) during the past five years and other relevant professional experience | Number of Funds in the Columbia Funds Complex overseen | Other directorships held by Trustee during the past five years |
William F. Truscott
c/o Columbia Management
Investment Advisers, LLC
225 Franklin Street
Boston, MA 02110
1960 | Trustee
2012 | Chairman of the Board and President, Columbia Management Investment Advisers, LLC since May 2010 and February 2012, respectively; Chief Executive Officer, Global Asset Management, Ameriprise Financial, Inc. since September 2012 (previously Chief Executive Officer, U.S. Asset Management & President, Annuities, May 2010-September 2012); Director and Chief Executive Officer, Columbia Management Investment Distributors, Inc. since May 2010 and February 2012, respectively; Chairman of the Board and Chief Executive Officer, RiverSource Distributors, Inc. since 2006; Director, Threadneedle Asset Management Holdings, SARL since 2014; President and Chief Executive Officer, Ameriprise Certificate Company, 2006-August 2012 | 179 | Chairman of the Board, Columbia Management Investment Advisers, LLC since May 2010; Director, Columbia Management Investment Distributors, Inc. since May 2010; former Director, Ameriprise Certificate Company, 2006 - January 2013 |
| * | Interested person (as defined under the 1940 Act) by reason of being an officer, director, security holder and/or employee of the Investment Manager or Ameriprise Financial. |
The Statement of Additional Information has additional information about the Fund’s Board members and is available,
without charge, upon request by calling 800.345.6611; contacting your financial intermediary; or visiting
investor.columbiathreadneedleus.com.
| 44 | Columbia High Yield Municipal Fund | Annual Report 2017 |
TRUSTEES AND OFFICERS (continued)
The Board has appointed officers who are responsible for day-to-day business decisions based on policies it has established. The officers serve at the pleasure of the Board. The following table provides basic information about the Officers of the Fund, including principal occupations during the past five years, although their specific titles may have varied over the period. In addition to Mr. Truscott, who is Senior Vice President, the Fund’s other officers are:
Fund officers
Name,
address and
year of birth | Position and year
first appointed to
position for any Fund
in the Columbia
Funds complex or a
predecessor thereof | Principal occupation(s) during past five years |
Christopher O. Petersen
5228 Ameriprise
Financial Center
Minneapolis, MN 55474
Born 1970 | President and Principal Executive Officer (2015) | Vice President and Lead Chief Counsel, Ameriprise Financial, Inc. since January 2015 (previously, Vice President and Chief Counsel, January 2010 - December 2014; officer of Columbia Funds and affiliated funds since 2007. |
Michael G. Clarke
225 Franklin Street
Boston, MA 02110
Born 1969 | Treasurer (2011), Chief Financial Officer (2009) and Chief Accounting Officer (2015) | Vice President — Mutual Fund Administration, Columbia Management Investment Advisers, LLC, since May 2010; senior officer of Columbia Funds and affiliated funds since 2002. |
Paul B. Goucher
100 Park Avenue
New York, NY 10017
Born 1968 | Senior Vice President (2011) and Assistant Secretary (2008) | Senior Vice President and Assistant General Counsel, Ameriprise Financial, Inc. since January 2017 (previously Vice President and Lead Chief Counsel, November 2008 - January 2017 and January 2013 - January 2017, respectively; and Chief Counsel, January 2010 - January 2013); Vice President, Chief Legal Officer and Assistant Secretary, Columbia Management Investment Advisers, LLC since May 2010. |
Thomas P. McGuire
225 Franklin Street
Boston, MA 02110
Born 1972 | Senior Vice President and Chief Compliance Officer (2012) | Vice President — Asset Management Compliance, Ameriprise Financial, Inc., since May 2010; Chief Compliance Officer, Ameriprise Certificate Company since September 2010. |
Colin Moore
225 Franklin Street
Boston, MA 02110
Born 1958 | Senior Vice President (2010) | Executive Vice President and Global Chief Investment Officer, Ameriprise Financial, Inc., since July 2013; Executive Vice President and Global Chief Investment Officer, Columbia Management Investment Advisers, LLC since July 2013 (previously Director and Global Chief Investment Officer, 2010 - 2013). |
Ryan C. Larrenaga
225 Franklin Street
Boston, MA 02110
Born 1970 | Senior Vice President (2017), Chief Legal Officer (2017) and Secretary (2015) | Vice President and Group Counsel, Ameriprise Financial, Inc. since August 2011; officer of Columbia Funds and affiliated funds since 2005. |
Michael E. DeFao
225 Franklin Street
Boston, MA 02110
Born 1968 | Vice President (2011) and Assistant Secretary (2010) | Vice President and Chief Counsel, Ameriprise Financial, Inc. since May 2010. |
Amy Johnson
5228 Ameriprise
Financial Center
Minneapolis, MN 55474
Born 1965 | Vice President (2006) | Managing Director and Global Head of Operations, Columbia Management Investment Advisers, LLC since April 2016 (previously Managing Director and Chief Operating Officer, 2010 - 2016). |
Lyn Kephart-Strong
5228 Ameriprise
Financial Center
Minneapolis, MN 55474
Born 1960 | Vice President (2015) | President, Columbia Management Investment Services Corp. since October 2014; Vice President & Resolution Officer, Ameriprise Trust Company since August 2009. |
Columbia High Yield Municipal Fund | Annual Report 2017
| 45 |
The Fund mails one shareholder report to each shareholder address. If you would like more than one report, please call shareholder services at 800.345.6611 and additional reports will be sent to you.
Proxy voting policies and procedures
The policy of the Board of Trustees is to vote the proxies of the companies in which the Fund holds investments consistent with the procedures as stated in the Statement of Additional Information (SAI). You may obtain a copy of the SAI without charge by calling 800.345.6611; contacting your financial intermediary; visiting investor.columbiathreadneedleus.com; or searching the website of the Securities and Exchange Commission (SEC) at sec.gov. Information regarding how the Fund voted proxies relating to portfolio securities is filed with the SEC by August 31st for the most recent 12-month period ending June 30th of that year, and is available without charge by visiting investor.columbiathreadneedleus.com, or searching the website of the SEC at sec.gov.
Quarterly schedule of investments
The Fund files a complete schedule of portfolio holdings with the SEC for the first and third quarters of each fiscal year on Form N-Q. The Fund’s Form N-Q is available on the SEC’s website at sec.gov and may be reviewed and copied at the SEC’s Public Reference Room in Washington, D.C. Information on the operation of the Public Reference Room may be obtained by calling 800.SEC.0330. The Fund’s complete schedule of portfolio holdings, as filed on Form N-Q, can also be obtained without charge, upon request, by calling 800.345.6611.
Additional Fund information
For more information about the Fund, please visit investor.columbiathreadneedleus.com or call 800.345.6611. Customer Service Representatives are available to answer your questions Monday through Friday from 8 a.m. to 7 p.m. Eastern time.
Fund investment manager
Columbia Management Investment Advisers, LLC
225 Franklin Street
Boston, MA 02110
Fund distributor
Columbia Management Investment Distributors, Inc.
225 Franklin Street
Boston, MA 02110
Fund transfer agent
Columbia Management Investment Services Corp.
P.O. Box 8081
Boston, MA 02266-8081
| 46 | Columbia High Yield Municipal Fund | Annual Report 2017 |
[THIS PAGE INTENTIONALLY LEFT BLANK]
[THIS PAGE INTENTIONALLY LEFT BLANK]
[THIS PAGE INTENTIONALLY LEFT BLANK]
Columbia High Yield Municipal Fund
P.O. Box 8081
Boston, MA 02266-8081
Please read and consider the investment objectives, risks, charges and expenses for any fund carefully before investing. For a prospectus and summary prospectus, which contains this and other important information about the Fund, go to
investor.columbiathreadneedleus.com. The Fund is distributed by Columbia Management Investment Distributors, Inc., member FINRA, and managed by Columbia Management Investment Advisers, LLC.
Columbia Threadneedle Investments (Columbia Threadneedle) is the global brand name of the Columbia and Threadneedle group of companies. All rights reserved. Columbia Management Investment Distributors, Inc., 225 Franklin Street, Boston, MA 02110-2804
© 2017 Columbia Management Investment Advisers, LLC.
investor.columbiathreadneedleus.com

Annual Report
May 31, 2017
Columbia Adaptive Risk Allocation Fund
Not FDIC Insured • No bank guarantee • May lose value
Dear Shareholders,
The current outlook for financial markets is clouded by two primary concerns: the high valuation of equities and the direction of interest rates. Following the U.S. presidential election, U.S. equities rallied based on the assumption that the new administration’s policies would stimulate growth quickly. Unfortunately it’s unclear whether those measures will get passed, much less passed quickly. In fixed income, uncertainty stems from the possibility that interest rates won’t rise as rapidly as expected if the administration’s proposed growth policies are not implemented.
Given this uncertainty, investors value a consistent approach more than ever. Investors want strong, repeatable risk-adjusted returns. Consistency — not surprises. As a leading global asset manager, we believe our consistent, collaborative investment approach enables us to deliver the dependable experience your portfolio demands. So, how do we strive to deliver a consistent investment experience?
Better insights
Your portfolio benefits from the investment insights uncovered by our talented investment teams around the world.
Better decisions
Our collaborative, interactive environment enables our investment teams to construct portfolios that take advantage of the best investment ideas.
Better outcomes
We aim to deliver a consistent experience, which means fewer surprises, dependable insights, and products designed to do the thing you want.
Whether you’re trying to save money to help your children go to college or for your own retirement, it’s the consistency of the return that is most essential. People who chase higher returns are usually also the first to sell when that investment goes through a bad patch. We try to combat this behavioral tendency by offering strategies that aim for a more consistent return. Our goal is for investors to panic less during periods of volatility, which can have a significant effect on their long-term results.
Nothing is more important to us than making sure those who have entrusted us to protect and grow their assets can do what matters most to them: build a nest egg, leave a legacy, and live confidently — now and throughout retirement. It’s why our talented professionals around the world work together to uncover uncommon opportunities and why our process encourages challenge and debate around our most compelling ideas to ensure better informed investment decisions, which hopefully lead to better outcomes for you.
Your success is our priority. Talk to your financial advisor about how working with Columbia Threadneedle Investments may help you position your portfolio for consistent, sustainable outcomes, no matter the market conditions.
Sincerely,
There is no guarantee that investment objectives will be achieved or that any particular investment will be profitable.
Columbia Funds are distributed by Columbia Management Investment Distributors, Inc., member FINRA, and managed by Columbia Management Investment Advisers, LLC.
© 2017 Columbia Management Investment Advisers, LLC. All rights reserved.
Columbia Adaptive Risk Allocation Fund | Annual Report 2017
Columbia Adaptive Risk Allocation Fund | Annual Report 2017
Investment objective
Columbia Adaptive Risk Allocation Fund (the Fund) pursues consistent total returns by seeking to allocate risks across multiple asset classes.
Portfolio management
Jeffrey Knight, CFA
Lead manager
Managed Fund since 2013
Joshua Kutin, CFA
Co-manager
Managed Fund since 2015
Effective January 27, 2017, Orhan Imer, Toby Nangle and Beth Vanney no longer serve as portfolio managers of the Fund.
| Average annual total returns (%) (for the period ended May 31, 2017) |
| | | Inception | 1 Year | Life |
| Class A | Excluding sales charges | 06/19/12 | 10.35 | 4.40 |
| | Including sales charges | | 4.01 | 3.16 |
| Class C | Excluding sales charges | 06/19/12 | 9.59 | 3.63 |
| | Including sales charges | | 8.59 | 3.63 |
| Class K | 06/19/12 | 10.43 | 4.48 |
| Class R | 06/19/12 | 10.15 | 4.16 |
| Class R4 * | 10/01/14 | 10.75 | 4.57 |
| Class R5 | 06/19/12 | 10.69 | 4.75 |
| Class T | Excluding sales charges | 06/19/12 | 10.43 | 4.44 |
| | Including sales charges | | 7.64 | 3.90 |
| Class Y * | 10/01/14 | 10.85 | 4.63 |
| Class Z | 06/19/12 | 10.64 | 4.68 |
| Blended Benchmark | | 10.60 | 6.86 |
| Citi Three-Month U.S. Treasury Bill Index | | 0.41 | 0.13 |
Returns for Class A are shown with and without the maximum initial sales charge of 5.75%. Returns for Class C are shown with and without the 1.00% contingent deferred sales charge for the first year only. The returns for Class T shares are shown with and without the maximum initial sales charge of 2.50% per transaction. Prior to March 27, 2017, Class T shares were known as Class W shares and were sold without a sales charge. The Fund’s other classes are not subject to sales charges and have limited eligibility. Please see the Fund’s prospectus for details. Performance for different share classes will vary based on differences in sales charges and fees associated with each class. All results shown assume reinvestment of distributions during the period. Returns do not reflect the deduction of taxes that a shareholder may pay on Fund distributions or on the redemption of Fund shares. Performance results reflect the effect of any fee waivers or reimbursements of Fund expenses by Columbia Management Investment Advisers, LLC and/or any of its affiliates. Absent these fee waivers or expense reimbursement arrangements, performance results would have been lower.
The performance information shown represents past performance and is not a guarantee of future results. The investment return and principal value of your investment will fluctuate so that your shares, when redeemed, may be worth more or less than their original cost. Current performance may be lower or higher than the performance information shown. You may obtain performance information current to the most recent month-end by contacting your financial intermediary, visiting investor.columbiathreadneedleus.com or calling 800.345.6611.
| * | The returns shown for periods prior to the share class inception date (including returns for the Life of the Fund, if shown, which are since Fund inception) include the returns of the Fund’s oldest share class. Since the Fund launched more than one share class at its inception, Class A shares were used. These returns are adjusted to reflect any higher class-related operating expenses of the newer share classes, as applicable. Please visit investor.columbiathreadneedleus.com/investment-products/mutual-funds/appended-performance for more information. |
The Blended Benchmark, a weighted custom composite established by the Investment Manager, consists of a 60% weighting of the MSCI ACWI All Cap Index (Net) and a 40% weighting of the Bloomberg Barclays Global Aggregate Index. The MSCI ACWI All Cap Index captures large, mid, small and micro cap representation across 23 developed markets countries and large, mid and small cap representation across 23 emerging markets countries. The Bloomberg Barclays Global Aggregate Index is a broad-based benchmark that measures the global investment-grade fixed-rate debt markets.
The Citi Three-Month U.S. Treasury Bill Index is an unmanaged index that represents the performance of three-month Treasury bills and reflects reinvestment of all distributions and changes in market prices.
Indices are not available for investment, are not professionally managed and do not reflect sales charges, fees, brokerage commissions, taxes (except the MSCI ACWI All Cap Index (Net), which reflects reinvested dividends net of withholding taxes) or other expenses of investing. Securities in the Fund may not match those in an index.
| 2 | Columbia Adaptive Risk Allocation Fund | Annual Report 2017 |
Fund at a Glance (continued)
Performance of a hypothetical $10,000 investment (June 19, 2012 — May 31, 2017)
The chart above shows the change in value of a hypothetical $10,000 investment in Class A shares of Columbia Adaptive Risk Allocation Fund during the stated time period, and does not reflect the deduction of taxes that a shareholder may pay on Fund distributions or on the redemption of Fund shares.
| Portfolio breakdown (%) (at May 31, 2017) |
| Alternative Strategies Funds | 3.4 |
| Equity Funds | 5.0 |
| Exchange-Traded Funds | 0.4 |
| Foreign Government Obligations | 11.7 |
| Inflation-Indexed Bonds | 7.3 |
| Money Market Funds(a) | 70.1 |
| Residential Mortgage-Backed Securities - Agency | 1.7 |
| U.S. Treasury Obligations | 0.4 |
| Total | 100.0 |
| (a) | Includes investments in Money Market Funds (amounting to $1,242 million) which have been segregated to cover obligations relating to the Fund’s investment in derivatives which provide exposure to multiple markets. For a description of the Fund’s investments in derivatives, see Investments in Derivatives following the Portfolio of Investments and Note 2 to the Notes to Financial Statements. |
Percentages indicated are based upon total investments. The Fund’s portfolio composition is subject to change.
| Market exposure by asset class categories (%)(a) (at May 31, 2017) |
| Equity Assets | 16.29% |
| Inflation-Hedging Assets | 9.42% |
| Spread Assets | 7.57% |
| Interest Rate Assets | 54.73% |
(a) Percentages are based upon net assets. The percentages do not equal 100% due to the effects of leverage within the Fund’s portfolio. Leverage exists when the Fund purchases or sells an instrument or enters into a transaction without investing cash in an amount equal to the full economic exposure of the instrument or transaction. The Fund’s portfolio composition and its market exposure are subject to change. Inflation-Hedging Assets may include, but are not limited to, direct or indirect investments in commodity-related investments, including certain types of commodities-linked derivatives and notes, and U.S. and non-U.S. inflation-linked bonds. Interest Rate Assets generally include fixed-income securities issued by U.S. and non-U.S. governments. Spread Assets generally include any other fixed-income securities.
Columbia Adaptive Risk Allocation Fund | Annual Report 2017
| 3 |
Manager Discussion of Fund Performance
For the 12-months that ended May 31, 2017, the Fund’s Class A shares returned 10.35% excluding sales charges. The Fund closely tracked its Blended Benchmark, which returned 10.60% over the same period. During the period, the MSCI AWCI All Cap Index, a broad measure of the global equity market, returned 17.51%, and the Bloomberg Barclays Global Aggregate Bond Index, a broad measure of the global fixed-income market, returned 0.77%. To compare, the Citi Three-Month Treasury Bill Index returned 0.41% during the same 12 months. The Fund takes a risk-based approach to allocating assets across four primary segments of global capital markets.
Market state policy implementation contributed positively
The Fund uses a global allocation strategy and takes a flexible approach to allocating portfolio risk across multiple asset classes — equity securities, inflation hedging assets, and fixed-income securities (generally consisting of fixed-income securities issued by governments, which are referred to as interest rate assets, and other fixed-income securities, which are referred to as spread assets). The Fund employs a market state classification process, based on multiple market-based indicators, to identify four distinct market environments and creates a policy or benchmark portfolio with a strategic risk allocation for each environment that is intended to generate attractive risk-adjusted returns in that environment. Allocations of risk to asset classes may differ significantly across market environments. While a global risk-balanced portfolio is what the investment manager expects the Fund to be in most often, other market states represent conditions when risk balancing may be less than ideal, and the portfolio can deviate from balance to improve risk-adjusted return potential for that environment. This could be to protect capital in a weakening market or to more fully participate when market conditions are considered favorable. Once a policy portfolio is established, the Fund then employs a tactical overlay process driven by the Columbia Global Asset Allocation Team’s Investment Strategy Outlook. During the 12-month period ended May 31, 2017, changes using this market state classification process contributed positively.
While absolute returns were strong, the investment manager’s tactical positioning overall was a modest detractor from the Fund’s relative performance during the period. Of the broad global asset classes to which the Fund allocates, its exposure to global equities contributed most positively, as global equity markets responded favorably to a pro-growth sentiment following the surprise results of the U.S. presidential election. Additionally, the Fund’s allocation to spread assets — primarily investment-grade corporate bonds, high-yield bonds, mortgage-backed securities and emerging market debt — significantly boosted relative results. The Fund’s allocation to global government fixed-income securities also contributed positively but more modestly. Exposure to inflation hedging assets added value, albeit modestly so, as well. Positions in commodities detracted from the Fund’s relative performance, as commodity prices were hit hard during the period, driven largely by energy prices. The effect of the Fund’s commodity exposure was mostly offset by exposure to real estate investment trusts (REITs) and global inflation-linked bonds, which contributed positively.
Global positioning reflected changing market conditions
The Fund uses an adaptive approach to re-allocate portfolio risk exposures as market conditions change in an effort to improve risk-adjusted returns. The investment manager believes no single portfolio is appropriate for all market environments and has identified four distinct market states—highly bullish, bullish, neutral and capital preservation, but expects the Fund to be in the neutral market state the majority of the time. The Fund made several deviations from the neutral market state during the period, moving into the bullish and highly bullish market states when market-based indicators became more positive. From a risk allocation perspective, then, the Fund in the neutral state was approximately 50% of the portfolio’s risk allocation in equities, with the remaining 50% of the portfolio’s risk allocation divided among the other three asset classes. In the months when the Fund was in a bullish or highly bullish market state, the Fund increased risk exposure to equities and decreased exposure to interest rates. With these changes, the Fund’s portfolio turnover rate for the 12-month period was 396%.
At the end of the period, the Columbia Global Asset Allocation Team favored a neutral stance toward equities, given the tactical view that the upside opportunities for stocks — particularly U.S. stocks — seemed modest in comparison with the downside risks. At the end of May 2017, we believed ongoing strength in growth and profits had been largely priced into valuations by investors, so delivery of these outcomes was not expected to drive prices higher by any significant degree in the near term. Downside surprises, however, may catch investors by surprise and spur volatility-induced price declines. Thus, at the end of the period, we believed a shift to a capital preservation market state for the Fund may be appropriate to reflect a cautious stance in relation to the possibility of this view materializing in the near term.
| 4 | Columbia Adaptive Risk Allocation Fund | Annual Report 2017 |
Manager Discussion of Fund Performance (continued)
Also, consistent with such a view, the Fund moved at the end of the period to a risk allocation that emphasizes government bonds. Overall, duration tools remained neutral. Our inflation forecasts showed the U.S. Consumer Price Index had likely peaked for the time being with diminishing inflation rates likely taking hold. U.S. Treasuries were neutral, although within the context of a capital preservation market state, we viewed these investment holdings as key to executing our investment strategy at the end of the period. International government bonds remained a modest underweight but were also helpful tools, in our opinion, in implementing a capital preservation market state.
Derivatives usage
During the period, the Fund used futures (including bond, currency, equity, index and interest rate futures), currency forwards, options and swaps (including credit default, credit default swap index, interest rate and total return swaps). The Fund used derivatives for both hedging and non-hedging purposes, including, for example, seeking to enhance returns or as a substitute for a position in an underlying asset. The Fund also used derivatives to manage its overall risk exposure and to obtain leverage (market exposure in excess of the Fund’s assets) within certain asset classes and during certain market environments in seeking to maintain attractive expected risk-adjusted returns while adhering to the Fund’s risk allocation framework. While the use of derivatives allows the Fund to pursue its risk allocation objectives, derivatives were neither a material contributor to nor a detractor from the Fund’s relative results during the period.
Market risk may affect a single issuer, sector of the economy, industry or the market as a whole. The Fund’s investment in other funds subjects it to the investment performance (positive or negative), risks and expenses of these underlying funds. Asset allocation does not assure a profit or protect against loss. Investing in derivatives is a specialized activity that involves special risks that subject the Fund to significant loss potential, including when used as leverage, and may result in greater fluctuation in fund value. Commodity investments may be affected by the overall market and industry- and commodity-specific factors, and may be more volatile and less liquid than other investments. Short positions (where the underlying asset is not owned) can create unlimited risk. International investing involves certain risks and volatility due to potential political, economic or currency instabilities and different financial and accounting standards. Risks are enhanced for emerging market issuers. Investment in or exposure to foreign currencies subjects the Fund to currency fluctuation and risk of loss. Investments in small- and mid-cap companies involve risks and volatility greater than investments in larger, more established companies. Fixed-income securities present issuer default risk. A rise in interest rates may result in a price decline of fixed-income instruments held by the Fund, negatively impacting its performance and NAV. Falling rates may result in the Fund investing in lower yielding debt instruments, lowering the Fund’s income and yield. These risks may be heightened for longer maturity and duration securities Interest payments on inflation-protected securities may be more volatile than interest paid on ordinary bonds. In periods of deflation, these securities provide no income. As a non-diversified fund, fewer investments could have a greater affect on performance. Investments selected using quantitative methods may perform differently from the market as a whole and may not enable the Fund to achieve its objective. Market or other (e.g., interest rate) environments may adversely affect the liquidity of fund investments, negatively impacting their price. Generally, the less liquid the market at the time the Fund sells a holding, the greater the risk of loss or decline of value to the Fund. See the Fund’s prospectus for more information on these and other risks.
The views expressed in this report reflect the current views of the respective parties. These views are not guarantees of future performance and involve certain risks, uncertainties and assumptions that are difficult to predict, so actual outcomes and results may differ significantly from the views expressed. These views are subject to change at any time based upon economic, market or other conditions and the respective parties disclaim any responsibility to update such views. These views may not be relied on as investment advice and, because investment decisions for a Columbia fund are based on numerous factors, may not be relied on as an indication of trading intent on behalf of any particular Columbia fund. References to specific securities should not be construed as a recommendation or investment advice.
Columbia Adaptive Risk Allocation Fund | Annual Report 2017
| 5 |
Understanding Your Fund’s Expenses
(Unaudited)
As an investor, you incur two types of costs. There are transaction costs, which generally include sales charges on purchases and may include redemption fees. There are also ongoing costs, which generally include management fees, distribution and/or service fees, and other fund expenses. The following information is intended to help you understand your ongoing costs (in dollars) of investing in the Fund and to help you compare these costs with the ongoing costs of investing in other mutual funds.
Analyzing your Fund’s expenses
To illustrate these ongoing costs, we have provided examples and calculated the expenses paid by investors in each share class of the Fund during the period. The actual and hypothetical information in the table is based on an initial investment of $1,000 at the beginning of the period indicated and held for the entire period. Expense information is calculated two ways and each method provides you with different information. The amount listed in the “Actual” column is calculated using the Fund’s actual operating expenses and total return for the period. You may use the Actual information, together with the amount invested, to estimate the expenses that you paid over the period. Simply divide your account value by $1,000 (for example, an $8,600 account value divided by $1,000 = 8.6), then multiply the results by the expenses paid during the period under the “Actual” column. The amount listed in the “Hypothetical” column assumes a 5% annual rate of return before expenses (which is not the Fund’s actual return) and then applies the Fund’s actual expense ratio for the period to the hypothetical return. You should not use the hypothetical account values and expenses to estimate either your actual account balance at the end of the period or the expenses you paid during the period. See “Compare with other funds” below for details on how to use the hypothetical data.
Compare with other funds
Since all mutual funds are required to include the same hypothetical calculations about expenses in shareholder reports, you can use this information to compare the ongoing cost of investing in the Fund with other funds. To do so, compare the hypothetical example with the 5% hypothetical examples that appear in the shareholder reports of other funds. As you compare hypothetical examples of other funds, it is important to note that hypothetical examples are meant to highlight the ongoing costs of investing in a fund only and do not reflect any transaction costs, such as sales charges, or redemption or exchange fees. Therefore, the hypothetical calculations are useful in comparing ongoing costs only, and will not help you determine the relative total costs of owning different funds. If transaction costs were included in these calculations, your costs would be higher.
| December 1, 2016 — May 31, 2017 |
| | Account value at the
beginning of the
period ($) | Account value at the
end of the
period ($) | Expenses paid during
the period ($) | Fund’s annualized
expense ratio (%) |
| | Actual | Hypothetical | Actual | Hypothetical | Actual | Hypothetical | Actual |
| Class A | 1,000.00 | 1,000.00 | 1,077.60 | 1,020.19 | 4.92 | 4.78 | 0.95 |
| Class C | 1,000.00 | 1,000.00 | 1,074.90 | 1,016.40 | 8.85 | 8.60 | 1.71 |
| Class K | 1,000.00 | 1,000.00 | 1,078.50 | 1,020.14 | 4.97 | 4.84 | 0.96 |
| Class R | 1,000.00 | 1,000.00 | 1,077.60 | 1,018.90 | 6.27 | 6.09 | 1.21 |
| Class R4 | 1,000.00 | 1,000.00 | 1,080.70 | 1,021.39 | 3.68 | 3.58 | 0.71 |
| Class R5 | 1,000.00 | 1,000.00 | 1,080.10 | 1,021.24 | 3.84 | 3.73 | 0.74 |
| Class T (formerly Class W) | 1,000.00 | 1,000.00 | 1,078.50 | 1,020.19 | 4.92 | 4.78 | 0.95 |
| Class Y | 1,000.00 | 1,000.00 | 1,080.70 | 1,021.59 | 3.48 | 3.38 | 0.67 |
| Class Z | 1,000.00 | 1,000.00 | 1,079.70 | 1,021.34 | 3.73 | 3.63 | 0.72 |
Expenses paid during the period are equal to the annualized expense ratio for each class as indicated above, multiplied by the average account value over the period and then multiplied by the number of days in the Fund’s most recent fiscal half year and divided by 365.
Expenses do not include fees and expenses incurred indirectly by the Fund from its investment in underlying funds, including affiliated and non-affiliated pooled investment vehicles, such as mutual funds and exchange-traded funds.
| 6 | Columbia Adaptive Risk Allocation Fund | Annual Report 2017 |
Portfolio of Investments
May 31, 2017
(Percentages represent value of investments compared to net assets)
| Alternative Strategies Funds 3.0% |
| | Shares | Value ($) |
| Columbia Commodity Strategy Fund, Class Y Shares(a),(b) | 11,294,769 | 60,539,961 |
Total Alternative Strategies Funds
(Cost $62,876,065) | 60,539,961 |
|
| Equity Funds 4.3% |
| | |
| Global Real Estate 4.3% |
| Columbia Real Estate Equity Fund, Class Y Shares(a) | 5,587,408 | 88,001,679 |
Total Equity Funds
(Cost $85,955,778) | 88,001,679 |
|
| Exchange-Traded Funds 0.3% |
| | |
| iShares MSCI Canada ETF | 245,000 | 6,409,200 |
Total Exchange-Traded Funds
(Cost $6,416,550) | 6,409,200 |
| Foreign Government Obligations(c),(d) 10.2% |
| Issuer | Coupon
Rate | | Principal
Amount ($) | Value ($) |
| Belgium 1.5% |
| Kingdom of Belgium Government Bond(e) |
| 06/22/2024 | 2.600% | EUR | 23,600,000 | 31,155,356 |
| France 0.5% |
| French Republic Government Bond OAT(e) |
| 05/25/2045 | 3.250% | EUR | 6,125,000 | 9,205,489 |
| Italy 1.2% |
| Italy Buoni Poliennali Del Tesoro(e) |
| 09/01/2046 | 3.250% | EUR | 22,000,000 | 24,585,991 |
| Japan 3.1% |
| Japan Government 30-Year Bond |
| 03/20/2037 | 2.400% | JPY | 659,000,000 | 7,982,195 |
| 03/20/2047 | 0.800% | JPY | 6,132,350,000 | 55,408,482 |
| Total | 63,390,677 |
| Mexico 0.5% |
| Mexican Bonos |
| 06/10/2021 | 6.500% | MXN | 200,000,000 | 10,436,855 |
| Poland 0.4% |
| Republic of Poland Government Bond |
| 07/25/2026 | 2.500% | PLN | 31,250,000 | 7,980,185 |
| Portugal 0.3% |
| Portugal Obrigacoes do Tesouro OT(e) |
| 10/15/2025 | 2.875% | EUR | 5,000,000 | 5,760,794 |
| Foreign Government Obligations(c),(d) (continued) |
| Issuer | Coupon
Rate | | Principal
Amount ($) | Value ($) |
| Spain 2.5% |
| Spain Government Bond(e) |
| 01/31/2022 | 5.850% | EUR | 27,000,000 | 38,220,440 |
| 01/31/2037 | 4.200% | EUR | 8,500,000 | 12,150,533 |
| Total | 50,370,973 |
| United Kingdom 0.2% |
| United Kingdom Gilt(e) |
| 01/22/2045 | 3.500% | GBP | 2,600,000 | 4,642,699 |
Total Foreign Government Obligations
(Cost $201,723,227) | 207,529,019 |
|
| Inflation-Indexed Bonds(c) 6.4% |
| | | | |
| Australia 0.1% |
| Australia Government Index-Linked Bond(e) |
| 09/20/2025 | 3.000% | AUD | 1,825,469 | 1,635,748 |
| Canada 0.1% |
| Canadian Government Real Return Bond |
| 12/01/2047 | 1.250% | CAD | 2,317,832 | 2,093,310 |
| France 0.5% |
| French Republic Government Bond OAT(e) |
| 07/25/2024 | 0.250% | EUR | 4,015,947 | 4,909,340 |
| 07/25/2040 | 1.800% | EUR | 3,018,418 | 4,819,025 |
| Total | 9,728,365 |
| Germany 0.2% |
| Bundesrepublik Deutschland Bundesobligation Inflation-Linked Bond(e) |
| 04/15/2018 | 0.750% | EUR | 1,615,950 | 1,832,377 |
| Deutsche Bundesrepublik Inflation-Linked Bond(e) |
| 04/15/2023 | 0.100% | EUR | 2,099,200 | 2,545,274 |
| 04/15/2046 | 0.100% | EUR | 617,550 | 772,501 |
| Total | 5,150,152 |
| Italy 0.3% |
| Italy Buoni Poliennali Del Tesoro(e) |
| 09/15/2019 | 2.350% | EUR | 336,639 | 404,518 |
| 09/15/2021 | 2.100% | EUR | 329,469 | 405,035 |
| 09/15/2024 | 2.350% | EUR | 305,610 | 380,982 |
| 09/15/2026 | 3.100% | EUR | 161,252 | 212,920 |
| 09/15/2041 | 2.550% | EUR | 3,083,780 | 3,889,970 |
| Total | 5,293,425 |
| Japan 0.2% |
| Japanese Government CPI-Linked Bond |
| 03/10/2027 | 0.100% | JPY | 349,772,500 | 3,345,834 |
The accompanying Notes to Financial Statements are an integral part of this statement.
Columbia Adaptive Risk Allocation Fund | Annual Report 2017
| 7 |
Portfolio of Investments (continued)
May 31, 2017
| Inflation-Indexed Bonds(c) (continued) |
| Issuer | Coupon
Rate | | Principal
Amount ($) | Value ($) |
| New Zealand 0.0% |
| New Zealand Government Bond(e) |
| 09/20/2025 | 2.000% | NZD | 1,563,561 | 1,158,986 |
| Spain 0.1% |
| Spain Government Inflation-Linked Bond(e) |
| 11/30/2030 | 1.000% | EUR | 1,366,551 | 1,558,853 |
| Sweden 0.1% |
| Sweden Inflation-Linked Bond |
| 06/01/2025 | 1.000% | SEK | 10,377,949 | 1,455,876 |
| United Kingdom 2.2% |
| United Kingdom Gilt Inflation-Linked(e) |
| 03/22/2024 | 0.125% | GBP | 3,998,772 | 6,054,070 |
| United Kingdom Gilt Inflation-Linked Bond(e) |
| 03/22/2029 | 0.125% | GBP | 1,701,225 | 2,770,929 |
| 03/22/2034 | 0.750% | GBP | 4,753,991 | 9,125,881 |
| 03/22/2044 | 0.125% | GBP | 4,687,365 | 9,662,624 |
| 03/22/2052 | 0.250% | GBP | 3,003,642 | 7,339,523 |
| 11/22/2065 | 0.125% | GBP | 3,095,677 | 9,411,960 |
| Total | 44,364,987 |
| United States 2.6% |
| U.S. Treasury Inflation-Indexed Bond |
| 04/15/2019 | 0.125% | | 5,380,219 | 5,417,699 |
| 01/15/2021 | 1.125% | | 2,911,100 | 3,051,944 |
| 01/15/2022 | 0.125% | | 6,217,425 | 6,270,233 |
| 01/15/2024 | 0.625% | | 11,493,570 | 11,810,279 |
| 07/15/2024 | 0.125% | | 4,084,451 | 4,066,581 |
| 01/15/2025 | 0.250% | | 10,293,300 | 10,250,872 |
| 07/15/2026 | 0.125% | | 2,034,200 | 1,995,772 |
| 02/15/2042 | 0.750% | | 4,639,485 | 4,504,503 |
| 02/15/2043 | 0.625% | | 4,347,681 | 4,084,811 |
| 02/15/2045 | 0.750% | | 2,588,325 | 2,483,837 |
| Total | 53,936,531 |
Total Inflation-Indexed Bonds
(Cost $125,909,409) | 129,722,067 |
|
| Residential Mortgage-Backed Securities - Agency 1.5% |
| Issuer | Coupon
Rate | | Principal
Amount ($) | Value ($) |
| Federal National Mortgage Association(f) |
| 06/19/2032 | 2.500% | | 3,884,329 | 3,924,233 |
| 06/13/2047 | 3.000% | | 5,800,000 | 5,831,945 |
| 06/13/2047 | 3.500% | | 7,175,000 | 7,411,197 |
| 06/13/2047 | 4.000% | | 3,950,000 | 4,173,434 |
| 06/13/2047 | 4.500% | | 1,425,000 | 1,536,523 |
| 06/13/2047 | 5.000% | | 355,000 | 390,313 |
| Government National Mortgage Association(f) |
| 06/21/2047 | 3.500% | | 7,250,000 | 7,562,600 |
Total Residential Mortgage-Backed Securities - Agency
(Cost $30,599,358) | 30,830,245 |
|
| U.S. Treasury Obligations 0.4% |
| | | | |
| U.S. Treasury |
| 02/15/2021 | 3.625% | | 5,000,000 | 5,368,028 |
| 08/15/2027 | 6.375% | | 1,500,000 | 2,068,826 |
Total U.S. Treasury Obligations
(Cost $7,388,417) | 7,436,854 |
| Money Market Funds 61.0% |
| | Shares | Value ($) |
| Columbia Short-Term Cash Fund, 0.916%(a),(g) | 1,241,745,376 | 1,241,745,376 |
Total Money Market Funds
(Cost $1,241,735,369) | 1,241,745,376 |
Total Investments
(Cost: $1,762,604,173) | 1,772,214,401 |
| Other Assets & Liabilities, Net | | 261,646,528 |
| Net Assets | 2,033,860,929 |
At May 31, 2017, securities and/or cash totaling $53,753,078 were pledged as collateral.
Investments in derivatives
| Forward foreign currency exchange contracts open at May 31, 2017 |
| Counterparty | Exchange
date | Currency to
be delivered | Currency to
be received | Unrealized
appreciation ($) | Unrealized
depreciation ($) |
| Barclays | 6/20/2017 | 249,847,000 EUR | 273,170,974 USD | — | (7,776,457) |
| Barclays | 6/20/2017 | 13,101,000 NOK | 1,524,631 USD | — | (26,376) |
| Barclays | 6/20/2017 | 41,710,190 USD | 37,122,000 EUR | 32,679 | — |
| Barclays | 6/20/2017 | 52,875,370 USD | 47,002,000 EUR | — | (22,660) |
The accompanying Notes to Financial Statements are an integral part of this statement.
| 8 | Columbia Adaptive Risk Allocation Fund | Annual Report 2017 |
Portfolio of Investments (continued)
May 31, 2017
Investments in derivatives (continued)
| Forward foreign currency exchange contracts open at May 31, 2017 (continued) |
| Counterparty | Exchange
date | Currency to
be delivered | Currency to
be received | Unrealized
appreciation ($) | Unrealized
depreciation ($) |
| Barclays | 6/20/2017 | 749,551 USD | 6,325,000 NOK | — | (745) |
| Citi | 6/20/2017 | 35,899,000 AUD | 26,455,768 USD | — | (211,017) |
| Citi | 6/20/2017 | 8,674,000 CAD | 6,424,376 USD | 922 | — |
| Citi | 6/20/2017 | 6,491,000 CAD | 4,742,110 USD | — | (64,743) |
| Citi | 6/20/2017 | 15,877,483,000 JPY | 140,077,700 USD | — | (3,406,526) |
| Citi | 6/20/2017 | 109,612,000 SEK | 12,365,100 USD | — | (260,184) |
| Citi | 6/20/2017 | 4,403,000 SGD | 3,127,222 USD | — | (55,604) |
| Citi | 6/20/2017 | 15,981,468 USD | 21,490,000 AUD | — | (18,093) |
| Citi | 6/20/2017 | 2,872,848 USD | 3,878,000 CAD | — | (1,029) |
| Citi | 6/20/2017 | 47,236,585 USD | 5,231,407,000 JPY | 39,447 | — |
| Citi | 6/20/2017 | 2,342,159 USD | 20,357,000 SEK | 2,593 | — |
| Citi | 6/20/2017 | 5,115,122 USD | 44,399,000 SEK | — | (1,174) |
| Citi | 6/20/2017 | 1,526,580 USD | 2,111,000 SGD | — | (587) |
| Credit Suisse | 6/20/2017 | 27,099,000 CHF | 26,973,170 USD | — | (1,040,852) |
| Credit Suisse | 6/20/2017 | 36,104,000 DKK | 5,282,661 USD | — | (175,643) |
| Credit Suisse | 6/20/2017 | 6,960,000 NZD | 4,761,649 USD | — | (167,630) |
| Credit Suisse | 6/20/2017 | 1,855,345 USD | 1,806,000 CHF | 11,636 | — |
| Credit Suisse | 6/20/2017 | 14,626,700 USD | 14,142,000 CHF | — | (7,182) |
| Credit Suisse | 6/20/2017 | 3,194,137 USD | 21,117,000 DKK | — | (1,610) |
| Credit Suisse | 6/20/2017 | 3,499,184 USD | 4,926,000 NZD | — | (10,444) |
| HSBC | 6/20/2017 | 29,522,000 PLN | 7,611,600 USD | — | (323,100) |
| Standard Chartered | 6/20/2017 | 2,454,000 GBP | 3,170,873 USD | 7,116 | — |
| Standard Chartered | 6/20/2017 | 132,743,637 GBP | 171,060,778 USD | — | (75,545) |
| Standard Chartered | 6/20/2017 | 74,785,000 HKD | 9,608,269 USD | 7,045 | — |
| Standard Chartered | 6/20/2017 | 203,521,000 MXN | 10,729,137 USD | — | (151,722) |
| Standard Chartered | 6/20/2017 | 98,854,109 USD | 76,550,000 GBP | — | (163,989) |
| Total | | | | 101,438 | (13,962,912) |
Futures contracts outstanding at May 31, 2017
| Long futures contracts outstanding |
| Contract description | Number of
contracts | Trading
currency | Notional market
value ($) | Expiration date | Unrealized
appreciation ($) | Unrealized
depreciation ($) |
| Australian 10-Year Bond | 345 | AUD | 33,756,665 | 06/2017 | 873,516 | — |
| Australian 3-Year Bond | 175 | AUD | 14,644,232 | 06/2017 | 116,984 | — |
| Canadian Government 10-Year Bond | 210 | CAD | 22,612,873 | 09/2017 | 92,419 | — |
| Euro-Bobl | 339 | EUR | 50,339,993 | 06/2017 | 129,673 | — |
| Euro-BTP | 74 | EUR | 11,067,642 | 06/2017 | 111,686 | — |
| Euro-Bund | 245 | EUR | 44,673,807 | 06/2017 | 143,764 | — |
| Euro-Buxl 30-Year | 77 | EUR | 14,557,597 | 06/2017 | 41,974 | — |
| Euro-OAT | 369 | EUR | 62,828,178 | 06/2017 | 1,159,930 | — |
| Japanese 10-Year Government Bond | 58 | JPY | 78,906,185 | 06/2017 | 164,569 | — |
| Long Gilt | 374 | GBP | 61,651,794 | 09/2017 | 174,686 | — |
| Mini MSCI EAFE Index | 1,167 | USD | 110,042,265 | 06/2017 | 5,634,476 | — |
| Mini MSCI EAFE Index | 204 | USD | 19,236,180 | 06/2017 | 998,353 | — |
| Mini MSCI Emerging Markets Index | 311 | USD | 15,609,090 | 06/2017 | 854,492 | — |
| Mini MSCI Emerging Markets Index | 135 | USD | 6,775,650 | 06/2017 | 257,604 | — |
| S&P 500 E-mini | 186 | USD | 22,423,230 | 06/2017 | 402,694 | — |
| S&P 500 E-mini | 192 | USD | 23,146,560 | 06/2017 | 388,376 | — |
| Short Term Euro-BTP | 35 | EUR | 4,444,813 | 06/2017 | 23,494 | — |
| TOPIX Index | 280 | JPY | 39,693,002 | 06/2017 | 790,886 | — |
| U.S. Long Bond | 16 | USD | 2,461,000 | 09/2017 | 28,594 | — |
| U.S. Long Bond | 7 | USD | 1,076,688 | 09/2017 | — | (233) |
| U.S. Treasury 10-Year Note | 357 | USD | 45,087,984 | 09/2017 | 261,570 | — |
The accompanying Notes to Financial Statements are an integral part of this statement.
Columbia Adaptive Risk Allocation Fund | Annual Report 2017
| 9 |
Portfolio of Investments (continued)
May 31, 2017
| Long futures contracts outstanding (continued) |
| Contract description | Number of
contracts | Trading
currency | Notional market
value ($) | Expiration date | Unrealized
appreciation ($) | Unrealized
depreciation ($) |
| U.S. Treasury 10-Year Note | 102 | USD | 12,882,281 | 09/2017 | — | (204) |
| U.S. Treasury 2-Year Note | 550 | USD | 119,066,407 | 09/2017 | 110,592 | — |
| U.S. Treasury 2-Year Note | 162 | USD | 35,070,469 | 09/2017 | — | (308) |
| U.S. Treasury 5-Year Note | 1,961 | USD | 232,010,812 | 09/2017 | 577,437 | — |
| U.S. Treasury Ultra 10-Year Note | 152 | USD | 20,631,625 | 09/2017 | 165,923 | — |
| U.S. Treasury Ultra 10-Year Note | 19 | USD | 2,578,953 | 09/2017 | — | (335) |
| U.S. Ultra Bond | 671 | USD | 110,798,875 | 09/2017 | 1,774,231 | — |
| U.S. Ultra Bond | 251 | USD | 41,446,375 | 09/2017 | 2,695 | — |
| Total | | | 1,259,521,225 | | 15,280,618 | (1,080) |
Credit default swap contracts outstanding at May 31, 2017
| Sell protection |
| Counterparty | Reference
entity | Expiration
date | Receive
fixed
rate
(%) | Implied
credit
spread
(%) | Notional
currency | Notional
amount | Market
value
($) | Periodic
payments
receivable
(payable)
($) | Premium
paid
($) | Premium
received
($) | Unrealized
appreciation
($) | Unrealized
depreciation
($) |
| Barclays | Markit CDX Emerging Markets Index, Series 27 | 6/20/2022 | 1.000 | 1.953 | USD | 42,454,501 | (1,869,080) | 227,111 | — | (2,188,171) | 546,202 | — |
Cleared credit default swap contracts outstanding at May 31, 2017
| Sell protection |
| Counterparty | Reference
entity | Expiration
date | Receive fixed
rate (%) | Implied
credit
spread (%) | Notional
currency | Notional
amount | Unrealized
appreciation ($) | Unrealized
depreciation ($) |
| Morgan Stanley | Markit CDX North America High Yield Index, Series 28 | 6/20/2022 | 5.000 | 3.279 | USD | 75,005,279 | 2,939,645 | — |
| Morgan Stanley | Markit CDX North America Investment Grade Index, Series 28 | 6/20/2022 | 1.000 | 0.617 | USD | 12,469,283 | 176,836 | — |
| Morgan Stanley | Markit CDX North America Investment Grade Index, Series 28 | 6/20/2027 | 1.000 | 1.067 | USD | 38,270,000 | 221,517 | — |
| Total | | | | | | | 3,337,998 | — |
The accompanying Notes to Financial Statements are an integral part of this statement.
| 10 | Columbia Adaptive Risk Allocation Fund | Annual Report 2017 |
Portfolio of Investments (continued)
May 31, 2017
Notes to Portfolio of Investments
| (a) | As defined in the Investment Company Act of 1940, an affiliated company is one in which the Fund owns 5% or more of the company’s outstanding voting securities, or a company which is under common ownership or control with the Fund. Holdings and transactions in these affiliated companies during the year ended May 31, 2017 are as follows: |
| Issuer | Beginning
shares | Shares
purchased | Shares
sold | Ending
shares | Capital gain
distributions ($) | Realized gain
(loss) ($) | Dividends —
affiliated
issuers ($) | Value ($) |
| Columbia Commodity Strategy Fund, Class I Shares | 7,954,786 | 51,236,463 | (59,191,249) * | — | — | 2,274,530 | — | — |
| Columbia Commodity Strategy Fund, Class Y Shares | — | 47,552,908 * | (36,258,139) | 11,294,769 | — | (3,594,590) | — | 60,539,961 |
| Columbia Real Estate Equity Fund, Class I Shares | 2,750,135 | 6,124,996 | (8,875,131) * | — | 1,840,085 | 246,354 | 1,890,287 | — |
| Columbia Real Estate Equity Fund, Class Y Shares | — | 8,698,519 * | (3,111,111) | 5,587,408 | — | (1,233,608) | — | 88,001,679 |
| Columbia Short-Term Cash Fund, 0.916% | 250,808,285 | 3,256,814,253 | (2,265,877,162) | 1,241,745,376 | — | (15,158) | 4,095,696 | 1,241,745,376 |
| Total | 261,513,206 | 3,370,427,139 | (2,373,312,792) | 1,258,627,553 | 1,840,085 | (2,322,472) | 5,985,983 | 1,390,287,016 |
| * | Includes the effect of underlying share class exchange. |
| (b) | Non-income producing investment. |
| (c) | Principal amounts are denominated in United States Dollars unless otherwise noted. |
| (d) | Principal and interest may not be guaranteed by the government. |
| (e) | Represents privately placed and other securities and instruments exempt from SEC registration (collectively, private placements), such as Section 4(a)(2) and Rule 144A eligible securities, which are often sold only to qualified institutional buyers. The Fund may invest in private placements determined to be liquid as well as those determined to be illiquid. Private placements may be determined to be liquid under guidelines established by the Fund’s Board of Trustees. At May 31, 2017, the value of these securities amounted to $194,611,818 or 9.57% of net assets. |
| (f) | Represents a security purchased on a when-issued basis. |
| (g) | The rate shown is the seven-day current annualized yield at May 31, 2017. |
Currency Legend
| AUD | Australian Dollar |
| CAD | Canada Dollar |
| CHF | Swiss Franc |
| DKK | Danish Krone |
| EUR | Euro |
| GBP | British Pound |
| HKD | Hong Kong Dollar |
| JPY | Japanese Yen |
| MXN | Mexican Peso |
| NOK | Norwegian Krone |
| NZD | New Zealand Dollar |
| PLN | Polish Zloty |
| SEK | Swedish Krona |
| SGD | Singapore Dollar |
| USD | US Dollar |
The accompanying Notes to Financial Statements are an integral part of this statement.
Columbia Adaptive Risk Allocation Fund | Annual Report 2017
| 11 |
Portfolio of Investments (continued)
May 31, 2017
Fair value measurements
The Fund categorizes its fair value measurements according to a three-level hierarchy that maximizes the use of observable inputs and minimizes the use of unobservable inputs by prioritizing that the most observable input be used when available. Observable inputs are those that market participants would use in pricing an investment based on market data obtained from sources independent of the reporting entity. Unobservable inputs are those that reflect the Fund’s assumptions about the information market participants would use in pricing an investment. An investment’s level within the fair value hierarchy is based on the lowest level of any input that is deemed significant to the asset’s or liability’s fair value measurement. The input levels are not necessarily an indication of the risk or liquidity associated with investments at that level. For example, certain U.S. government securities are generally high quality and liquid, however, they are reflected as Level 2 because the inputs used to determine fair value may not always be quoted prices in an active market.
Fair value inputs are summarized in the three broad levels listed below:
| • | Level 1 – Valuations based on quoted prices for investments in active markets that the Fund has the ability to access at the measurement date (including NAV for open-end mutual funds). Valuation adjustments are not applied to Level 1 investments. |
| • | Level 2 – Valuations based on other significant observable inputs (including quoted prices for similar securities, interest rates, prepayment speeds, credit risks, etc.). |
| • | Level 3 – Valuations based on significant unobservable inputs (including the Fund’s own assumptions and judgment in determining the fair value of investments). |
Inputs that are used in determining fair value of an investment may include price information, credit data, volatility statistics, and other factors. These inputs can be either observable or unobservable. The availability of observable inputs can vary between investments, and is affected by various factors such as the type of investment, and the volume and level of activity for that investment or similar investments in the marketplace. The inputs will be considered by the Investment Manager, along with any other relevant factors in the calculation of an investment’s fair value. The Fund uses prices and inputs that are current as of the measurement date, which may include periods of market dislocations. During these periods, the availability of prices and inputs may be reduced for many investments. This condition could cause an investment to be reclassified between the various levels within the hierarchy.
Certain investments that have been measured at fair value using the net asset value (NAV) per share (or its equivalent) are not categorized in the fair value hierarchy. The fair value amounts presented in the table are intended to reconcile the fair value hierarchy to the amounts presented in the Portfolio of Investments. The Columbia Short-Term Cash Fund seeks to provide shareholders with maximum current income consistent with liquidity and stability of principal. Columbia Short-Term Cash Fund prices its shares with a floating NAV and no longer seeks to maintain a stable NAV.
Investments falling into the Level 3 category are primarily supported by quoted prices from brokers and dealers participating in the market for those investments. However, these may be classified as Level 3 investments due to lack of market transparency and corroboration to support these quoted prices. Additionally, valuation models may be used as the pricing source for any remaining investments classified as Level 3. These models may rely on one or more significant unobservable inputs and/or significant assumptions by the Investment Manager. Inputs used in valuations may include, but are not limited to, financial statement analysis, capital account balances, discount rates and estimated cash flows, and comparable company data.
Under the direction of the Fund’s Board of Trustees (the Board), the Investment Manager’s Valuation Committee (the Committee) is responsible for overseeing the valuation procedures approved by the Board. The Committee consists of voting and non-voting members from various groups within the Investment Manager’s organization, including operations and accounting, trading and investments, compliance, risk management and legal.
The Committee meets at least monthly to review and approve valuation matters, which may include a description of specific valuation determinations, data regarding pricing information received from approved pricing vendors and brokers and the results of Board-approved valuation control policies and procedures (the Policies). The Policies address, among other things, instances when market quotations are or are not readily available, including recommendations of third party pricing vendors and a determination of appropriate pricing methodologies; events that require specific valuation determinations and assessment of fair value techniques; securities with a potential for stale pricing, including those that are illiquid, restricted, or in default; and the effectiveness of third party pricing vendors, including periodic reviews of vendors. The Committee meets more frequently, as needed, to discuss additional valuation matters, which may include the need to review back-testing results, review time-sensitive information or approve related valuation actions. The Committee reports to the Board, with members of the Committee meeting with the Board at each of its regularly scheduled meetings to discuss valuation matters and actions during the period, similar to those described earlier.
For investments categorized as Level 3, the Committee monitors information similar to that described above, which may include: (i) data specific to the issuer or comparable issuers, (ii) general market or specific sector news and (iii) quoted prices and specific or similar security transactions. The Committee considers this data and any changes from prior periods in order to assess the reasonableness of observable and unobservable inputs, any assumptions or internal models used to value those securities and changes in fair value. This data is also used to corroborate, when available, information received from approved pricing vendors and brokers. Various factors impact the frequency of monitoring this information (which may occur as often as daily). However, the Committee may determine that changes to inputs, assumptions and models are not required as a result of the monitoring procedures performed.
The following table is a summary of the inputs used to value the Fund’s investments at May 31, 2017:
| | Level 1
quoted prices
in active
markets for
identical
assets ($) | Level 2
other
significant
observable
inputs ($) | Level 3
significant
unobservable
inputs ($) | Investments
measured at
net asset
value ($) | Total ($) |
| Investments | | | | | |
| Alternative Strategies Funds | 60,539,961 | — | — | — | 60,539,961 |
| Equity Funds | 88,001,679 | — | — | — | 88,001,679 |
| Exchange-Traded Funds | 6,409,200 | — | — | — | 6,409,200 |
| Foreign Government Obligations | — | 207,529,019 | — | — | 207,529,019 |
| Inflation-Indexed Bonds | — | 129,722,067 | — | — | 129,722,067 |
| Residential Mortgage-Backed Securities - Agency | — | 30,830,245 | — | — | 30,830,245 |
| U.S. Treasury Obligations | 7,436,854 | — | — | — | 7,436,854 |
| Money Market Funds | — | — | — | 1,241,745,376 | 1,241,745,376 |
| Total Investments | 162,387,694 | 368,081,331 | — | 1,241,745,376 | 1,772,214,401 |
The accompanying Notes to Financial Statements are an integral part of this statement.
| 12 | Columbia Adaptive Risk Allocation Fund | Annual Report 2017 |
Portfolio of Investments (continued)
May 31, 2017
Fair value measurements (continued)
| | Level 1
quoted prices
in active
markets for
identical
assets ($) | Level 2
other
significant
observable
inputs ($) | Level 3
significant
unobservable
inputs ($) | Investments
measured at
net asset
value ($) | Total ($) |
| Derivatives | | | | | |
| Asset | | | | | |
| Forward Foreign Currency Exchange Contracts | — | 101,438 | — | — | 101,438 |
| Futures Contracts | 15,280,618 | — | — | — | 15,280,618 |
| Swap Contracts | — | 3,884,200 | — | — | 3,884,200 |
| Liability | | | | | |
| Forward Foreign Currency Exchange Contracts | — | (13,962,912) | — | — | (13,962,912) |
| Futures Contracts | (1,080) | — | — | — | (1,080) |
| Total | 177,667,232 | 358,104,057 | — | 1,241,745,376 | 1,777,516,665 |
See the Portfolio of Investments for all investment classifications not indicated in the table.
The Fund’s assets assigned to the Level 2 input category are generally valued using the market approach, in which a security’s value is determined through reference to prices and information from market transactions for similar or identical assets.
Forward foreign currency exchange contracts, futures contracts and swap contracts are valued at unrealized appreciation (depreciation).
There were no transfers of financial assets between levels during the period.
The accompanying Notes to Financial Statements are an integral part of this statement.
Columbia Adaptive Risk Allocation Fund | Annual Report 2017
| 13 |
Statement of Assets and Liabilities
May 31, 2017
| Assets | |
| Investments, at cost | |
| Unaffiliated issuers, at cost | $372,036,961 |
| Affiliated issuers, at cost | 1,390,567,212 |
| Total investments, at cost | 1,762,604,173 |
| Investments, at value | |
| Unaffiliated issuers, at value | 381,927,385 |
| Affiliated issuers, at value | 1,390,287,016 |
| Total investments, at value | 1,772,214,401 |
| Foreign currency (identified cost $223,872) | 225,818 |
| Cash collateral held at broker | 4,860,000 |
| Margin deposits | 48,893,077 |
| Unrealized appreciation on forward foreign currency exchange contracts | 101,438 |
| Unrealized appreciation on swap contracts | 546,202 |
| Receivable for: | |
| Investments sold | 306,342,884 |
| Investments sold on a delayed delivery basis | 63,585,311 |
| Capital shares sold | 16,743,980 |
| Dividends | 855,424 |
| Interest | 2,613,245 |
| Foreign tax reclaims | 134,736 |
| Variation margin for futures contracts | 1,305,426 |
| Variation margin for swap contracts | 9,461 |
| Prepaid expenses | 601 |
| Trustees’ deferred compensation plan | 19,158 |
| Total assets | 2,218,451,162 |
| Liabilities | |
| Unrealized depreciation on forward foreign currency exchange contracts | 13,962,912 |
| Premiums received on outstanding swap contracts | 2,188,171 |
| Payable for: | |
| Investments purchased | 70,651,362 |
| Investments purchased on a delayed delivery basis | 93,781,267 |
| Capital shares purchased | 2,531,608 |
| Variation margin for futures contracts | 1,058,924 |
| Variation margin for swap contracts | 188,854 |
| Management services fees | 34,969 |
| Distribution and/or service fees | 3,391 |
| Transfer agent fees | 67,782 |
| Compensation of board members | 653 |
| Compensation of chief compliance officer | 120 |
| Other expenses | 101,062 |
| Trustees’ deferred compensation plan | 19,158 |
| Total liabilities | 184,590,233 |
| Net assets applicable to outstanding capital stock | $2,033,860,929 |
| Represented by | |
| Paid in capital | 1,931,970,529 |
| Undistributed net investment income | 812,549 |
| Accumulated net realized gain | 85,804,106 |
| Unrealized appreciation (depreciation) on: | |
| Investments - unaffiliated issuers | 9,890,424 |
| Investments - affiliated issuers | (280,196) |
| Foreign currency translations | 361,253 |
| Forward foreign currency exchange contracts | (13,861,474) |
| Futures contracts | 15,279,538 |
| Swap contracts | 3,884,200 |
| Total - representing net assets applicable to outstanding capital stock | $2,033,860,929 |
The accompanying Notes to Financial Statements are an integral part of this statement.
| 14 | Columbia Adaptive Risk Allocation Fund | Annual Report 2017 |
Statement of Assets and Liabilities (continued)
May 31, 2017
| Class A | |
| Net assets | $100,789,556 |
| Shares outstanding | 9,302,496 |
| Net asset value per share | $10.83 |
| Maximum offering price per share(a) | $11.49 |
| Class C | |
| Net assets | $95,199,163 |
| Shares outstanding | 9,026,711 |
| Net asset value per share | $10.55 |
| Class K | |
| Net assets | $2,935 |
| Shares outstanding | 270 |
| Net asset value per share(b) | $10.85 |
| Class R | |
| Net assets | $5,899,723 |
| Shares outstanding | 548,911 |
| Net asset value per share | $10.75 |
| Class R4 | |
| Net assets | $11,579,661 |
| Shares outstanding | 1,060,859 |
| Net asset value per share | $10.92 |
| Class R5 | |
| Net assets | $7,177,498 |
| Shares outstanding | 656,765 |
| Net asset value per share | $10.93 |
| Class T(c) | |
| Net assets | $2,312,516 |
| Shares outstanding | 213,149 |
| Net asset value per share | $10.85 |
| Maximum offering price per share(d) | $11.13 |
| Class Y | |
| Net assets | $2,697 |
| Shares outstanding | 246 |
| Net asset value per share(b) | $10.95 |
| Class Z | |
| Net assets | $1,810,897,180 |
| Shares outstanding | 166,003,944 |
| Net asset value per share | $10.91 |
| (a) | The maximum offering price per share is calculated by dividing the net asset value per share by 1.0 minus the maximum sales charge of 5.75% for Class A. |
| (b) | Net asset value per share rounds to this amount due to fractional shares outstanding. |
| (c) | Effective March 27, 2017, Class W shares were renamed Class T shares. |
| (d) | The maximum offering price per share is calculated by dividing the net asset value per share by 1.0 minus the maximum sales charge of 2.50% for Class T. |
The accompanying Notes to Financial Statements are an integral part of this statement.
Columbia Adaptive Risk Allocation Fund | Annual Report 2017
| 15 |
Statement of Operations
Year Ended May 31, 2017
| Net investment income | |
| Income: | |
| Dividends — unaffiliated issuers | $1,345,766 |
| Dividends — affiliated issuers | 5,985,983 |
| Interest | 5,236,529 |
| Foreign taxes withheld | (8,108) |
| Total income | 12,560,170 |
| Expenses: | |
| Management services fees | 8,000,497 |
| Distribution and/or service fees | |
| Class A | 384,411 |
| Class C | 780,436 |
| Class R | 15,933 |
| Class T(a) | 1,550,105 |
| Transfer agent fees | |
| Class A | 121,358 |
| Class C | 58,807 |
| Class K | 2 |
| Class R | 2,072 |
| Class R4 | 9,873 |
| Class R5 | 1,728 |
| Class T(a) | 502,503 |
| Class Z | 232,872 |
| Plan administration fees | |
| Class K | 7 |
| Compensation of board members | 37,880 |
| Custodian fees | 86,092 |
| Printing and postage fees | 98,810 |
| Registration fees | 323,815 |
| Audit fees | 45,500 |
| Legal fees | 38,636 |
| Compensation of chief compliance officer | 569 |
| Other | 36,046 |
| Total expenses | 12,327,952 |
| Expense reduction | (40) |
| Total net expenses | 12,327,912 |
| Net investment income | 232,258 |
The accompanying Notes to Financial Statements are an integral part of this statement.
| 16 | Columbia Adaptive Risk Allocation Fund | Annual Report 2017 |
Statement of Operations (continued)
Year Ended May 31, 2017
| Realized and unrealized gain (loss) — net | |
| Net realized gain (loss) on: | |
| Investments — unaffiliated issuers | $(5,846,932) |
| Investments — affiliated issuers | (2,322,472) |
| Capital gain distributions from underlying affiliated funds | 1,840,085 |
| Foreign currency translations | 77,657 |
| Forward foreign currency exchange contracts | 13,186,881 |
| Futures contracts | 95,793,195 |
| Options purchased | (3,775,614) |
| Swap contracts | 28,550,972 |
| Increase from payment by affiliate (Note 6) | 344,293 |
| Net realized gain | 127,848,065 |
| Net change in unrealized appreciation (depreciation) on: | |
| Investments — unaffiliated issuers | 8,793,094 |
| Investments — affiliated issuers | (2,965,531) |
| Foreign currency translations | 357,924 |
| Forward foreign currency exchange contracts | (14,193,154) |
| Futures contracts | 9,909,467 |
| Swap contracts | 1,591,697 |
| Net change in unrealized appreciation (depreciation) | 3,493,497 |
| Net realized and unrealized gain | 131,341,562 |
| Net increase in net assets resulting from operations | $131,573,820 |
| (a) | Effective March 27, 2017, Class W shares were renamed Class T shares. |
The accompanying Notes to Financial Statements are an integral part of this statement.
Columbia Adaptive Risk Allocation Fund | Annual Report 2017
| 17 |
Statement of Changes in Net Assets
| | Year Ended
May 31, 2017 | Year Ended
May 31, 2016 |
| Operations | | |
| Net investment income (loss) | $232,258 | $(1,814,971) |
| Net realized gain (loss) | 127,848,065 | (6,460,191) |
| Net change in unrealized appreciation (depreciation) | 3,493,497 | 9,733,744 |
| Net increase in net assets resulting from operations | 131,573,820 | 1,458,582 |
| Distributions to shareholders | | |
| Net investment income | | |
| Class A | (1,910,227) | — |
| Class C | (243,404) | — |
| Class K | (31) | — |
| Class R | (29,257) | — |
| Class R4 | (141,268) | — |
| Class R5 | (24,304) | — |
| Class T(a) | (11,021,316) | — |
| Class Y | (36) | — |
| Class Z | (868,460) | — |
| Net realized gains | | |
| Class A | (1,740,349) | (1,583,099) |
| Class C | (773,591) | (617,046) |
| Class K | (26) | (27) |
| Class R | (35,333) | (2,605) |
| Class R4 | (103,975) | (107,570) |
| Class R5 | (17,090) | (12,937) |
| Class T(a) | (10,080,281) | (1,821,566) |
| Class Y | (24) | (24) |
| Class Z | (639,198) | (192,670) |
| Total distributions to shareholders | (27,628,170) | (4,337,544) |
| Increase in net assets from capital stock activity | 1,305,414,282 | 196,174,393 |
| Total increase in net assets | 1,409,359,932 | 193,295,431 |
| Net assets at beginning of year | 624,500,997 | 431,205,566 |
| Net assets at end of year | $2,033,860,929 | $624,500,997 |
| Undistributed (excess of distributions over) net investment income | $812,549 | $(675,972) |
| (a) | Effective March 27, 2017, Class W shares were renamed Class T shares. |
The accompanying Notes to Financial Statements are an integral part of this statement.
| 18 | Columbia Adaptive Risk Allocation Fund | Annual Report 2017 |
Statement of Changes in Net Assets (continued)
| | Year Ended | Year Ended |
| | May 31, 2017 | May 31, 2016 |
| | Shares | Dollars ($) | Shares | Dollars ($) |
| Capital stock activity |
| Class A | | | | |
| Subscriptions | 11,356,840 | 118,267,708 | 6,477,611 | 63,559,452 |
| Distributions reinvested | 351,985 | 3,569,124 | 166,863 | 1,578,524 |
| Redemptions | (16,421,262) | (171,054,994) | (9,344,931) | (90,415,838) |
| Net decrease | (4,712,437) | (49,218,162) | (2,700,457) | (25,277,862) |
| Class C | | | | |
| Subscriptions | 4,272,792 | 43,520,811 | 2,529,237 | 24,329,314 |
| Distributions reinvested | 101,737 | 1,007,198 | 66,586 | 615,252 |
| Redemptions | (1,645,970) | (16,768,855) | (1,549,411) | (14,704,497) |
| Net increase | 2,728,559 | 27,759,154 | 1,046,412 | 10,240,069 |
| Class R | | | | |
| Subscriptions | 586,829 | 5,986,038 | 79,167 | 761,750 |
| Distributions reinvested | 6,409 | 64,542 | 275 | 2,579 |
| Redemptions | (130,982) | (1,348,548) | (7,249) | (70,691) |
| Net increase | 462,256 | 4,702,032 | 72,193 | 693,638 |
| Class R4 | | | | |
| Subscriptions | 892,526 | 9,419,772 | 536,608 | 5,350,191 |
| Distributions reinvested | 24,038 | 245,186 | 11,297 | 107,546 |
| Redemptions | (937,711) | (9,739,345) | (553,645) | (5,366,946) |
| Net increase (decrease) | (21,147) | (74,387) | (5,740) | 90,791 |
| Class R5 | | | | |
| Subscriptions | 605,341 | 6,457,550 | 76,079 | 763,436 |
| Distributions reinvested | 4,044 | 41,332 | 1,355 | 12,910 |
| Redemptions | (113,835) | (1,185,895) | (77,319) | (753,316) |
| Net increase | 495,550 | 5,312,987 | 115 | 23,030 |
| Class T(a) | | | | |
| Subscriptions | 101,125,247 | 1,048,428,796 | 24,944,483 | 242,892,513 |
| Distributions reinvested | 2,076,923 | 21,101,542 | 192,348 | 1,821,539 |
| Redemptions | (141,258,260) | (1,492,126,983) | (3,998,727) | (39,020,767) |
| Net increase (decrease) | (38,056,090) | (422,596,645) | 21,138,104 | 205,693,285 |
| Class Z | | | | |
| Subscriptions | 173,506,980 | 1,846,743,172 | 1,479,031 | 14,678,134 |
| Distributions reinvested | 119,523 | 1,219,132 | 19,209 | 182,674 |
| Redemptions | (10,189,919) | (108,433,001) | (1,036,140) | (10,149,366) |
| Net increase | 163,436,584 | 1,739,529,303 | 462,100 | 4,711,442 |
| Total net increase | 124,333,275 | 1,305,414,282 | 20,012,727 | 196,174,393 |
| (a) | Effective March 27, 2017, Class W shares were renamed Class T shares. |
The accompanying Notes to Financial Statements are an integral part of this statement.
Columbia Adaptive Risk Allocation Fund | Annual Report 2017
| 19 |
The following table is intended to help you understand the Fund’s financial performance. Certain information reflects financial results for a single share of a class held for the periods shown. Per share net investment income (loss) amounts are calculated based on average shares outstanding during the period. Total return assumes reinvestment of all dividends and distributions, if any. Total return does not reflect payment of sales charges, if any. Total return and portfolio turnover are not annualized for periods of less than one year. The portfolio turnover rate is calculated without regard to purchase and sales transactions of short-term instruments and certain derivatives, if any. If such transactions were included, the Fund’s portfolio turnover rate may be higher.
| Year ended | Net asset value,
beginning of
period | Net
investment
income
(loss) | Net
realized
and
unrealized
gain (loss) | Increase
from payment
by affiliate | Total from
investment
operations | Distributions
from net
investment
income | Distributions
from net
realized
gains |
| Class A |
| 5/31/2017 | $10.01 | (0.01) | 1.03 | 0.00 (c) | 1.02 | (0.10) | (0.10) |
| 5/31/2016 | $10.17 | (0.03) | (0.03) (f) | — | (0.06) | — | (0.10) |
| 5/31/2015 | $10.24 | (0.04) | 0.14 | 0.01 | 0.11 | (0.00) (c) | (0.18) |
| 5/31/2014 | $10.06 | 0.01 | 0.65 | — | 0.66 | — | (0.48) |
| 5/31/2013 (h) | $10.00 | (0.04) | 0.47 | — | 0.43 | (0.14) | (0.23) |
| Class C |
| 5/31/2017 | $9.75 | (0.08) | 1.01 | 0.00 (c) | 0.93 | (0.03) | (0.10) |
| 5/31/2016 | $9.98 | (0.10) | (0.03) (f) | — | (0.13) | — | (0.10) |
| 5/31/2015 | $10.11 | (0.11) | 0.15 | 0.01 | 0.05 | — | (0.18) |
| 5/31/2014 | $10.03 | (0.06) | 0.62 | — | 0.56 | — | (0.48) |
| 5/31/2013 (h) | $10.00 | (0.12) | 0.48 | — | 0.36 | (0.10) | (0.23) |
| Class K |
| 5/31/2017 | $10.03 | 0.00 (c) | 1.03 | 0.00 (c) | 1.03 | (0.11) | (0.10) |
| 5/31/2016 | $10.18 | (0.02) | (0.03) (f) | — | (0.05) | — | (0.10) |
| 5/31/2015 | $10.25 | (0.03) | 0.15 | 0.01 | 0.13 | (0.02) | (0.18) |
| 5/31/2014 | $10.06 | 0.03 | 0.64 | — | 0.67 | — | (0.48) |
| 5/31/2013 (h) | $10.00 | (0.04) | 0.47 | — | 0.43 | (0.14) | (0.23) |
| Class R |
| 5/31/2017 | $9.93 | (0.03) | 1.03 | 0.00 (c) | 1.00 | (0.08) | (0.10) |
| 5/31/2016 | $10.11 | (0.06) | (0.02) (f) | — | (0.08) | — | (0.10) |
| 5/31/2015 | $10.20 | (0.08) | 0.16 | 0.01 | 0.09 | — | (0.18) |
| 5/31/2014 | $10.05 | (0.01) | 0.64 | — | 0.63 | — | (0.48) |
| 5/31/2013 (h) | $10.00 | (0.07) | 0.47 | — | 0.40 | (0.12) | (0.23) |
| Class R4 |
| 5/31/2017 | $10.08 | 0.02 | 1.05 | 0.00 (c) | 1.07 | (0.13) | (0.10) |
| 5/31/2016 | $10.21 | (0.01) | (0.02) (f) | — | (0.03) | — | (0.10) |
| 5/31/2015 (j) | $10.13 | (0.02) | 0.31 | — | 0.29 | (0.03) | (0.18) |
| Class R5 |
| 5/31/2017 | $10.10 | 0.03 | 1.03 | 0.00 (c) | 1.06 | (0.13) | (0.10) |
| 5/31/2016 | $10.22 | 0.00 (c) | (0.02) (f) | — | (0.02) | — | (0.10) |
| 5/31/2015 | $10.29 | (0.01) | 0.15 | 0.01 | 0.15 | (0.04) | (0.18) |
| 5/31/2014 | $10.07 | 0.07 | 0.63 | — | 0.70 | — | (0.48) |
| 5/31/2013 (h) | $10.00 | (0.03) | 0.48 | — | 0.45 | (0.15) | (0.23) |
The accompanying Notes to Financial Statements are an integral part of this statement.
| 20 | Columbia Adaptive Risk Allocation Fund | Annual Report 2017 |
Total
distributions to
shareholders | Net
asset
value,
end of
period | Total
return | Total gross
expense
ratio to
average
net assets(a) | Total net
expense
ratio to
average
net assets(a),(b) | Net investment
income (loss)
ratio to
average
net assets | Portfolio
turnover | Net
assets,
end of
period
(000’s) |
| |
| (0.20) | $10.83 | 10.35% (d) | 0.99% | 0.99% (e) | (0.07%) | 396% | $100,790 |
| (0.10) | $10.01 | (0.55%) | 1.15% | 1.07% (e) | (0.32%) | 254% | $140,291 |
| (0.18) | $10.17 | 1.13% (g) | 1.23% | 1.06% | (0.35%) | 256% | $169,978 |
| (0.48) | $10.24 | 7.07% | 2.01% | 0.75% | 0.14% | 303% | $7,281 |
| (0.37) | $10.06 | 4.15% | 2.97% (i) | 0.60% (i) | (0.42%) (i) | 76% | $8,139 |
| |
| (0.13) | $10.55 | 9.59% (d) | 1.74% | 1.74% (e) | (0.77%) | 396% | $95,199 |
| (0.10) | $9.75 | (1.26%) | 1.90% | 1.82% (e) | (1.09%) | 254% | $61,386 |
| (0.18) | $9.98 | 0.48% (g) | 1.98% | 1.81% | (1.11%) | 256% | $52,406 |
| (0.48) | $10.11 | 6.07% | 2.76% | 1.50% | (0.65%) | 303% | $416 |
| (0.33) | $10.03 | 3.43% | 3.69% (i) | 1.33% (i) | (1.19%) (i) | 76% | $1,387 |
| |
| (0.21) | $10.85 | 10.43% (d) | 0.95% | 0.95% | 0.01% | 396% | $3 |
| (0.10) | $10.03 | (0.45%) | 1.04% | 0.97% | (0.24%) | 254% | $3 |
| (0.20) | $10.18 | 1.25% (g) | 1.10% | 0.84% | (0.27%) | 256% | $3 |
| (0.48) | $10.25 | 7.18% | 1.79% | 0.63% | 0.35% | 303% | $3 |
| (0.37) | $10.06 | 4.13% | 2.90% (i) | 0.63% (i) | (0.37%) (i) | 76% | $3 |
| |
| (0.18) | $10.75 | 10.15% (d) | 1.22% | 1.22% (e) | (0.25%) | 396% | $5,900 |
| (0.10) | $9.93 | (0.75%) | 1.38% | 1.34% (e) | (0.57%) | 254% | $861 |
| (0.18) | $10.11 | 0.87% (g) | 1.48% | 1.32% | (0.83%) | 256% | $146 |
| (0.48) | $10.20 | 6.77% | 2.26% | 1.00% | (0.14%) | 303% | $3 |
| (0.35) | $10.05 | 3.90% | 3.14% (i) | 0.87% (i) | (0.74%) (i) | 76% | $3 |
| |
| (0.23) | $10.92 | 10.75% (d) | 0.74% | 0.74% (e) | 0.20% | 396% | $11,580 |
| (0.10) | $10.08 | (0.25%) | 0.90% | 0.82% (e) | (0.08%) | 254% | $10,908 |
| (0.21) | $10.21 | 2.87% | 0.99% (i) | 0.82% (i) | (0.30%) (i) | 256% | $11,110 |
| |
| (0.23) | $10.93 | 10.69% (d) | 0.73% | 0.73% | 0.24% | 396% | $7,177 |
| (0.10) | $10.10 | (0.15%) | 0.79% | 0.73% | 0.03% | 254% | $1,628 |
| (0.22) | $10.22 | 1.48% (g) | 0.86% | 0.69% | (0.14%) | 256% | $1,647 |
| (0.48) | $10.29 | 7.47% | 1.54% | 0.38% | 0.68% | 303% | $26 |
| (0.38) | $10.07 | 4.37% | 2.66% (i) | 0.38% (i) | (0.25%) (i) | 76% | $3 |
Columbia Adaptive Risk Allocation Fund | Annual Report 2017
| 21 |
Financial Highlights (continued)
| Year ended | Net asset value,
beginning of
period | Net
investment
income
(loss) | Net
realized
and
unrealized
gain (loss) | Increase
from payment
by affiliate | Total from
investment
operations | Distributions
from net
investment
income | Distributions
from net
realized
gains |
| Class T(k) |
| 5/31/2017 | $10.02 | (0.02) | 1.05 | 0.00 (c) | 1.03 | (0.10) | (0.10) |
| 5/31/2016 | $10.18 | (0.03) | (0.03) (f) | — | (0.06) | — | (0.10) |
| 5/31/2015 | $10.25 | (0.04) | 0.14 | 0.01 | 0.11 | (0.00) (c) | (0.18) |
| 5/31/2014 | $10.06 | 0.05 | 0.62 | — | 0.67 | — | (0.48) |
| 5/31/2013 (h) | $10.00 | (0.04) | 0.47 | — | 0.43 | (0.14) | (0.23) |
| Class Y |
| 5/31/2017 | $10.11 | 0.03 | 1.05 | 0.00 (c) | 1.08 | (0.14) | (0.10) |
| 5/31/2016 | $10.23 | 0.00 (c) | (0.02) (f) | — | (0.02) | — | (0.10) |
| 5/31/2015 (l) | $10.15 | (0.02) | 0.32 | — | 0.30 | (0.04) | (0.18) |
| Class Z |
| 5/31/2017 | $10.08 | 0.05 | 1.01 | 0.00 (c) | 1.06 | (0.13) | (0.10) |
| 5/31/2016 | $10.21 | (0.01) | (0.02) (f) | — | (0.03) | — | (0.10) |
| 5/31/2015 | $10.28 | (0.02) | 0.15 | 0.01 | 0.14 | (0.03) | (0.18) |
| 5/31/2014 | $10.07 | 0.04 | 0.65 | — | 0.69 | — | (0.48) |
| 5/31/2013 (h) | $10.00 | (0.02) | 0.47 | — | 0.45 | (0.15) | (0.23) |
| Notes to Financial Highlights |
| (a) | In addition to the fees and expenses that the Fund bears directly, the Fund indirectly bears a pro rata share of the fees and expenses of any other funds in which it invests. Such indirect expenses are not included in the Fund’s reported expense ratios. |
| (b) | Total net expenses include the impact of certain fee waivers/expense reimbursements made by the Investment Manager and certain of its affiliates, if applicable. |
| (c) | Rounds to zero. |
| (d) | The Fund received a payment from an affiliate. Had the Fund not received this payment, the total return would have been lower by 0.02%. |
| (e) | The benefits derived from expense reductions had an impact of less than 0.01%. |
| (f) | Calculation of the net gain (loss) per share (both realized and unrealized) does not correlate to the aggregate realized and unrealized gain (loss) presented in the Statement of Operations due to the timing of subscriptions and redemptions of Fund shares in relation to fluctuations in the market value of the portfolio. |
| (g) | The Fund received a payment from an affiliate. Had the Fund not received this payment, the total return would have been lower by 0.07%. |
| (h) | Based on operations from June 19, 2012 (fund commencement of operations) through the stated period end. |
| (i) | Annualized. |
| (j) | Class R4 shares commenced operations on October 1, 2014. Per share data and total return reflect activity from that date. |
| (k) | Effective March 27, 2017, Class W shares were renamed Class T shares. |
| (l) | Class Y shares commenced operations on October 1, 2014. Per share data and total return reflect activity from that date. |
The accompanying Notes to Financial Statements are an integral part of this statement.
| 22 | Columbia Adaptive Risk Allocation Fund | Annual Report 2017 |
Total
distributions to
shareholders | Net
asset
value,
end of
period | Total
return | Total gross
expense
ratio to
average
net assets(a) | Total net
expense
ratio to
average
net assets(a),(b) | Net investment
income (loss)
ratio to
average
net assets | Portfolio
turnover | Net
assets,
end of
period
(000’s) |
| |
| (0.20) | $10.85 | 10.43% (d) | 0.99% | 0.99% (e) | (0.17%) | 396% | $2,313 |
| (0.10) | $10.02 | (0.55%) | 1.14% | 1.08% | (0.31%) | 254% | $383,552 |
| (0.18) | $10.18 | 1.13% (g) | 1.25% | 0.96% | (0.37%) | 256% | $174,418 |
| (0.48) | $10.25 | 7.18% | 2.01% | 0.75% | 0.62% | 303% | $183,246 |
| (0.37) | $10.06 | 4.15% | 2.90% (i) | 0.62% (i) | (0.42%) (i) | 76% | $3 |
| |
| (0.24) | $10.95 | 10.85% (d) | 0.67% | 0.67% | 0.29% | 396% | $3 |
| (0.10) | $10.11 | (0.15%) | 0.76% | 0.69% | 0.02% | 254% | $2 |
| (0.22) | $10.23 | 2.98% | 0.85% (i) | 0.65% (i) | (0.28%) (i) | 256% | $3 |
| |
| (0.23) | $10.91 | 10.64% (d) | 0.73% | 0.73% (e) | 0.46% | 396% | $1,810,897 |
| (0.10) | $10.08 | (0.25%) | 0.90% | 0.82% (e) | (0.06%) | 254% | $25,871 |
| (0.21) | $10.21 | 1.37% (g) | 0.99% | 0.78% | (0.17%) | 256% | $21,494 |
| (0.48) | $10.28 | 7.37% | 1.76% | 0.50% | 0.41% | 303% | $6,470 |
| (0.38) | $10.07 | 4.39% | 2.66% (i) | 0.35% (i) | (0.17%) (i) | 76% | $5,156 |
Columbia Adaptive Risk Allocation Fund | Annual Report 2017
| 23 |
Notes to Financial Statements
May 31, 2017
Note 1. Organization
Columbia Adaptive Risk Allocation Fund (the Fund), a series of Columbia Funds Series Trust I (the Trust), is a non-diversified fund. The Trust is registered under the Investment Company Act of 1940, as amended (the 1940 Act), as an open-end management investment company organized as a Massachusetts business trust.
Effective March 27, 2017, the Fund invests significantly in Class Y shares of affiliated funds managed by Columbia Management Investment Advisers, LLC (the Investment Manager), a wholly-owned subsidiary of Ameriprise Financial, Inc. (Ameriprise Financial), or its affiliates. Prior to March 27, 2017, the Fund invested significantly in Class I shares of affiliated funds. The Fund invests in shares of third-party advised (unaffiliated) funds, including exchange-traded funds (collectively, Underlying Funds).
For information on the Underlying Funds, please refer to the Fund’s current prospectus and the prospectuses of the Underlying Funds, which are available, free of charge, from the Securities and Exchange Commission website, www.sec.gov.
Fund shares
The Trust may issue an unlimited number of shares (without par value). Although all share classes generally have identical voting, dividend and liquidation rights, each share class votes separately when required by the Trust’s organizational documents or by law. Different share classes pay different distribution amounts to the extent the expenses of such share classes differ, and distributions in liquidation will be proportional to the net asset value of each share class. Each share class has its own expense and sales charge structure. The Fund offers each of the share classes identified below.
Class A shares are subject to a maximum front-end sales charge of 5.75% based on the initial investment amount. Class A shares purchased without an initial sales charge in accounts aggregating $1 million to $50 million at the time of purchase are subject to a contingent deferred sales charge (CDSC) if the shares are sold within 18 months after purchase, charged as follows: 1.00% CDSC if redeemed within 12 months after purchase, and 0.50% CDSC if redeemed more than 12, but less than 18, months after purchase.
Class C shares are subject to a 1.00% CDSC on shares redeemed within 12 months after purchase.
Class K shares are not subject to sales charges; however, this share class is closed to new investors.
Class R shares are not subject to sales charges and are generally available only to certain retirement plans and other investors as described in the Fund’s prospectus.
Class R4 shares are not subject to sales charges and are generally available only to omnibus retirement plans and certain investors as described in the Fund’s prospectus.
Class R5 shares are not subject to sales charges and are generally available only to investors purchasing through authorized investment professionals and omnibus retirement plans.
Class T shares are subject to a maximum front-end sales charge of 2.50% per transaction and must be purchased through financial intermediaries that, by written agreement with Columbia Management Investment Distributors, Inc., are specifically authorized to sell Class T shares. Prior to March 27, 2017, Class T shares were known as Class W shares, were not subject to sales charges, and were generally available only to investors purchasing through authorized investment programs managed by investment professionals, including discretionary managed accounts.
Class Y shares are not subject to sales charges or distribution and service (12b-1) fees, and are available to institutional and certain other investors as described in the Fund’s prospectus.
Class Z shares are not subject to sales charges and are generally available only to eligible investors, which are subject to different investment minimums as described in the Fund’s prospectus.
| 24 | Columbia Adaptive Risk Allocation Fund | Annual Report 2017 |
Notes to Financial Statements (continued)
May 31, 2017
Note 2. Summary of significant accounting policies
Basis of preparation
The Fund is an investment company that applies the accounting and reporting guidance in the Financial Accounting Standards Board (FASB) Accounting Standards Codification Topic 946, Financial Services - Investment Companies (ASC 946). The financial statements are prepared in accordance with U.S. generally accepted accounting principles (GAAP), which requires management to make certain estimates and assumptions that affect the reported amounts of assets and liabilities, the disclosure of contingent assets and liabilities at the date of the financial statements and the reported amounts of income and expenses during the reporting period. Actual results could differ from those estimates.
The following is a summary of significant accounting policies followed by the Fund in the preparation of its financial statements.
Security valuation
All equity securities and exchange-traded funds are valued at the close of business of the New York Stock Exchange. Equity securities and exchange-traded funds are valued at the last quoted sales price on the principal exchange or market on which they trade, except for securities traded on the NASDAQ Stock Market, which are valued at the NASDAQ official close price. Unlisted securities or listed securities for which there were no sales during the day are valued at the mean of the latest quoted bid and ask prices on such exchanges or markets.
Debt securities generally are valued by pricing services approved by the Board of Trustees based upon market transactions for normal, institutional-size trading units of similar securities. The services may use various pricing techniques that take into account, as applicable, factors such as yield, quality, coupon rate, maturity, type of issue, trading characteristics and other data, as well as approved independent broker-dealer quotes. Debt securities for which quotations are not readily available or not believed to be reflective of market value may also be valued based upon a bid quote from an approved independent broker-dealer. Debt securities maturing in 60 days or less are valued primarily at amortized cost value, unless this method results in a valuation that management believes does not approximate market value.
Asset- and mortgage-backed securities are generally valued by pricing services, which utilize pricing models that incorporate the securities’ cash flow and loan performance data. These models also take into account available market data, including trades, market quotations, and benchmark yield curves for identical or similar securities. Factors used to identify similar securities may include, but are not limited to, issuer, collateral type, vintage, prepayment speeds, collateral performance, credit ratings, credit enhancement and expected life. Asset-backed securities for which quotations are readily available may also be valued based upon an over-the-counter or exchange bid quote from an approved independent broker-dealer.
Investments in the Underlying Funds are valued at the net asset value of the applicable class of the Underlying Fund determined as of the close of the New York Stock Exchange on the valuation date.
Forward foreign currency exchange contracts are marked-to-market based upon foreign currency exchange rates provided by a pricing service.
Futures and options on futures contracts are valued based upon the settlement price at the close of regular trading on their principal exchanges or, in the absence of transactions, at the mean of the latest quoted bid and ask prices.
Option contracts are valued at the mean of the latest quoted bid and ask prices on their primary exchanges. Option contracts, including over-the-counter option contracts, with no readily available market quotations are valued using quotes obtained from independent brokers as of the close of the New York Stock Exchange.
Swap transactions are valued through an independent pricing service or broker, or if neither is available, through an internal model based upon observable inputs.
Columbia Adaptive Risk Allocation Fund | Annual Report 2017
| 25 |
Notes to Financial Statements (continued)
May 31, 2017
Investments for which market quotations are not readily available, or that have quotations which management believes are not reflective of market value or reliable, are valued at fair value as determined in good faith under procedures approved by and under the general supervision of the Board of Trustees. If a security or class of securities (such as foreign securities) is valued at fair value, such value is likely to be different from the quoted or published price for the security.
The determination of fair value often requires significant judgment. To determine fair value, management may use assumptions including but not limited to future cash flows and estimated risk premiums. Multiple inputs from various sources may be used to determine fair value.
GAAP requires disclosure regarding the inputs and valuation techniques used to measure fair value and any changes in valuation inputs or techniques. In addition, investments shall be disclosed by major category. This information is disclosed following the Fund’s Portfolio of Investments.
Foreign currency transactions and translations
The values of all assets and liabilities denominated in foreign currencies are generally translated into U.S. dollars at exchange rates determined at the close of regular trading on the New York Stock Exchange. Net realized and unrealized gains (losses) on foreign currency transactions and translations include gains (losses) arising from the fluctuation in exchange rates between trade and settlement dates on securities transactions, gains (losses) arising from the disposition of foreign currency and currency gains (losses) between the accrual and payment dates on dividends, interest income and foreign withholding taxes.
For financial statement purposes, the Fund does not distinguish that portion of gains (losses) on investments which is due to changes in foreign exchange rates from that which is due to changes in market prices of the investments. Such fluctuations are included with the net realized and unrealized gains (losses) on investments in the Statement of Operations.
Derivative instruments
The Fund invests in certain derivative instruments, as detailed below, to meet its investment objectives. Derivatives are instruments whose values depend on, or are derived from, in whole or in part, the value of one or more securities, currencies, commodities, indices, or other assets or instruments. Derivatives may be used to increase investment flexibility (including to maintain cash reserves while maintaining desired exposure to certain assets), for risk management (hedging) purposes, to facilitate trading, to reduce transaction costs and to pursue higher investment returns. The Fund may also use derivative instruments to mitigate certain investment risks, such as foreign currency exchange rate risk, interest rate risk and credit risk. Derivatives may involve various risks, including the potential inability of the counterparty to fulfill its obligations under the terms of the contract, the potential for an illiquid secondary market (making it difficult for the Fund to sell or terminate, including at favorable prices) and the potential for market movements which may expose the Fund to gains or losses in excess of the amount shown in the Statement of Assets and Liabilities. The notional amounts of derivative instruments, if applicable, are not recorded in the financial statements.
A derivative instrument may suffer a marked-to-market loss if the value of the contract decreases due to an unfavorable change in the market rates or values of the underlying instrument. Losses can also occur if the counterparty does not perform its obligations under the contract. The Fund’s risk of loss from counterparty credit risk on over-the-counter derivatives is generally limited to the aggregate unrealized gain netted against any collateral held by the Fund and the amount of any variation margin held by the counterparty, plus any replacement costs or related amounts. With exchange-traded or centrally cleared derivatives, there is reduced counterparty credit risk to the Fund since the clearinghouse or central counterparty (CCP) provides some protection in the case of clearing member default. The clearinghouse or CCP stands between the buyer and the seller of the contract; therefore, additional counterparty credit risk is failure of the clearinghouse or CCP. However, credit risk still exists in exchange-traded or centrally cleared derivatives with respect to initial and variation margin that is held in a broker’s customer account. While brokers are required to segregate customer margin from their own assets, in the event that a broker becomes insolvent or goes into bankruptcy and at that time there is a shortfall in the aggregate amount of margin held by the broker for all its clients, U.S. bankruptcy laws will typically allocate that shortfall on a pro-rata basis across all the broker’s customers (including the Fund), potentially resulting in losses to the Fund.
| 26 | Columbia Adaptive Risk Allocation Fund | Annual Report 2017 |
Notes to Financial Statements (continued)
May 31, 2017
In order to better define its contractual rights and to secure rights that will help the Fund mitigate its counterparty risk, the Fund may enter into an International Swaps and Derivatives Association, Inc. Master Agreement (ISDA Master Agreement) or similar agreement with its derivatives contract counterparties. An ISDA Master Agreement is an agreement between the Fund and a counterparty that governs over-the-counter derivatives and typically contains, among other things, collateral posting terms and netting provisions in the event of a default and/or termination event. Under an ISDA Master Agreement, the Fund may, under certain circumstances, offset with the counterparty certain derivative instrument’s payables and/or receivables with collateral held and/or posted and create one single net payment. The provisions of the ISDA Master Agreement typically permit a single net payment in the event of default (close-out netting), including the bankruptcy or insolvency of the counterparty. Note, however, that bankruptcy or insolvency laws of a particular jurisdiction may impose restrictions on or prohibitions against the right of offset or netting in bankruptcy, insolvency or other events.
Collateral (margin) requirements differ by type of derivative. Margin requirements are established by the clearinghouse or CCP for exchange-traded and centrally cleared derivatives. Brokers can ask for margin in excess of the minimum in certain circumstances. Collateral terms are contract specific for over-the-counter derivatives. For over-the-counter derivatives traded under an ISDA Master Agreement, the collateral requirements are typically calculated by netting the marked-to-market amount for each transaction under such agreement and comparing that amount to the value of any variation margin currently pledged by the Fund and/or the counterparty. Generally, the amount of collateral due from or to a party has to exceed a minimum transfer amount threshold (e.g., $250,000) before a transfer has to be made. To the extent amounts due to the Fund from its counterparties are not fully collateralized, contractually or otherwise, the Fund bears the risk of loss from counterparty nonperformance. The Fund attempts to mitigate counterparty risk by only entering into agreements with counterparties that it believes have the financial resources to honor their obligations and by monitoring the financial stability of those counterparties.
Certain ISDA Master Agreements allow counterparties of over-the-counter derivatives transactions to terminate derivatives contracts prior to maturity in the event the Fund’s net asset value declines by a stated percentage over a specified time period or if the Fund fails to meet certain terms of the ISDA Master Agreement, which would cause the Fund to accelerate payment of any net liability owed to the counterparty. The Fund also has termination rights if the counterparty fails to meet certain terms of the ISDA Master Agreement. In addition to considering counterparty credit risk, the Fund would consider terminating the derivatives contracts based on whether termination would result in a net liability owed from the counterparty.
For financial reporting purposes, the Fund does not offset derivative assets and derivative liabilities that are subject to netting arrangements in the Statement of Assets and Liabilities.
Forward foreign currency exchange contracts
Forward foreign currency exchange contracts are over-the-counter agreements between two parties to buy and sell a currency at a set price on a future date. The Fund utilized forward foreign currency exchange contracts to hedge the currency exposure associated with some or all of the Fund’s securities, to shift foreign currency exposure back to U.S. dollars, to shift U.S. dollar exposure to achieve a representative weighted mix of major currencies in its benchmark, and/or to recover an underweight country exposure in its portfolio and to generate total return through long and short positions versus the U.S. dollar. These instruments may be used for other purposes in future periods.
The values of forward foreign currency exchange contracts fluctuate daily with changes in foreign currency exchange rates. Changes in the value of these contracts are recorded as unrealized appreciation or depreciation until the contract is exercised or has expired. The Fund will realize a gain or loss when the forward foreign currency exchange contract is closed or expires.
The use of forward foreign currency exchange contracts does not eliminate fluctuations in the prices of the Fund’s portfolio securities. The risks of forward foreign currency exchange contracts include movement in the values of the foreign currencies relative to the U.S. dollar (or other foreign currencies) and the possibility that counterparties will not complete their contractual obligations, which may be in excess of the amount reflected, if any, in the Statement of Assets and Liabilities.
Columbia Adaptive Risk Allocation Fund | Annual Report 2017
| 27 |
Notes to Financial Statements (continued)
May 31, 2017
Futures contracts
Futures contracts are exchange-traded and represent commitments for the future purchase or sale of an asset at a specified price on a specified date. The Fund bought and sold futures contracts to manage the duration and yield curve exposure of the Fund versus the benchmark, to manage exposure to movements in interest rates, to manage exposure to the securities market and to maintain appropriate equity market exposure while keeping sufficient cash to accommodate daily redemptions. These instruments may be used for other purposes in future periods. Upon entering into futures contracts, the Fund bears risks that it may not achieve the anticipated benefits of the futures contracts and may realize a loss. Additional risks include counterparty credit risk, the possibility of an illiquid market, and that a change in the value of the contract or option may not correlate with changes in the value of the underlying asset.
Upon entering into a futures contract, the Fund deposits cash or securities with the broker, known as a futures commission merchant (FCM), in an amount sufficient to meet the initial margin requirement. The initial margin deposit must be maintained at an established level over the life of the contract. Cash deposited as initial margin is recorded in the Statement of Assets and Liabilities as margin deposits. Securities deposited as initial margin are designated in the Portfolio of Investments. Subsequent payments (variation margin) are made or received by the Fund each day. The variation margin payments are equal to the daily change in the contract value and are recorded as variation margin receivable or payable and are offset in unrealized gains or losses. The Fund recognizes a realized gain or loss when the contract is closed or expires. Futures contracts involve, to varying degrees, risk of loss in excess of the variation margin disclosed in the Statement of Assets and Liabilities.
Options contracts
Options are contracts which entitle the holder to purchase or sell securities or other identified assets at a specified price, or in the case of index option contracts, to receive or pay the difference between the index value and the strike price of the index option contract. Option contracts can be either exchange-traded or over-the-counter. The Fund purchased option contracts to decrease the Fund’s exposure to equity market risk and to increase return on investments. These instruments may be used for other purposes in future periods. Completion of transactions for option contracts traded in the over-the-counter market depends upon the performance of the other party. Cash collateral may be collected or posted by the Fund to secure certain over-the-counter option contract trades. Cash collateral held or posted by the Fund for such option contract trades must be returned to the broker or the Fund upon closure, exercise or expiration of the contract.
Options contracts purchased are recorded as investments. When the Fund writes an options contract, the premium received is recorded as an asset and an amount equivalent to the premium is recorded as a liability in the Statement of Assets and Liabilities and is subsequently adjusted to reflect the current fair value of the option written. Changes in the fair value of the written option are recorded as unrealized appreciation or depreciation until the contract is exercised or has expired. The Fund will realize a gain or loss when the option contract is closed or expires. When option contracts are exercised, the proceeds on sales for a written call or purchased put option contract, or the purchase cost for a written put or purchased call option contract, is adjusted by the amount of premium received or paid.
For over-the-counter options purchased, the Fund bears the risk of loss of the amount of the premiums paid plus the positive change in market values net of any collateral held by the Fund should the counterparty fail to perform under the contracts. Option contracts written by the Fund do not typically give rise to significant counterparty credit risk, as options written generally obligate the Fund and not the counterparty to perform. The risk in writing a call option contract is that the Fund gives up the opportunity for profit if the market price of the security increases above the strike price and the option contract is exercised. The risk in writing a put option contract is that the Fund may incur a loss if the market price of the security decreases below the strike price and the option contract is exercised. Exercise of a written option could result in the Fund purchasing or selling a security or foreign currency when it otherwise would not, or at a price different from the current market value. In purchasing and writing options, the Fund bears the risk of an unfavorable change in the value of the underlying instrument or the risk that the Fund may not be able to enter into a closing transaction due to an illiquid market.
Swap contracts
Swap contracts are negotiated in the over-the-counter market and may be entered into as a bilateral contract or centrally cleared (centrally cleared swap contract). In a centrally cleared swap contract, immediately following execution of the swap contract with a broker, the swap contract is novated to a central counterparty (the CCP) and the CCP becomes the Fund’s
| 28 | Columbia Adaptive Risk Allocation Fund | Annual Report 2017 |
Notes to Financial Statements (continued)
May 31, 2017
counterparty to the centrally cleared swap contract. The Fund is required to deposit initial margin with the futures commission merchant (FCM), which pledges it through to the CCP in the form of cash or securities in an amount that varies depending on the size and risk profile of the particular swap contract. Securities deposited as initial margin are designated in the Portfolio of Investments and cash deposited is recorded in the Statement of Assets and Liabilities as margin deposits. Unlike a bilateral swap contract, for centrally cleared swap contracts, the Fund has minimal credit exposure to the FCM because the CCP stands between the Fund and the relevant buyer/seller on the other side of the contract. Swap contracts are marked-to-market daily and changes in value are recorded as unrealized appreciation (depreciation). The daily change in valuation of centrally cleared swap contracts, if any, is recorded as a receivable or payable for variation margin in the Statement of Assets and Liabilities.
Entering into these contracts involves, to varying degrees, elements of interest, liquidity and counterparty credit risk in excess of the amounts recognized in the Statement of Assets and Liabilities. Such risks involve the possibility that there may be unfavorable changes in interest rates, market conditions or other conditions, it may be difficult to initiate a swap transaction or liquidate a position at an advantageous time or price which may result in significant losses, and that the FCM or CCP may not fulfill its obligation under the contract.
Credit default swap contracts
The Fund entered into credit default swap contracts to increase or decrease its credit exposure to an index and to manage credit risk exposure. These instruments may be used for other purposes in future periods. Credit default swap contracts are agreements in which one party pays fixed periodic payments to a counterparty in consideration for an agreement from the counterparty to make a specific payment should a specified credit event(s) take place. Although specified credit events are contract specific, credit events are generally defined as bankruptcy, failure to pay, restructuring, obligation acceleration, obligation default, or repudiation/moratorium.
As the purchaser of a credit default swap contract, the Fund purchases protection by paying a periodic interest rate on the notional amount to the counterparty. The interest amount is accrued daily as a component of unrealized appreciation (depreciation) and is recorded as a realized loss upon payment. If a credit event as specified in the contract occurs, the Fund may have the option either to deliver the reference obligation to the seller in exchange for a cash payment of its par amount, or to receive a net cash settlement equal to the par amount less an agreed-upon value of the reference obligation as of the date of the credit event. The difference between the value of the obligation or cash delivered and the notional amount received will be recorded as a realized gain (loss).
As the seller of a credit default swap contract, the Fund sells protection to a buyer and will generally receive a periodic interest rate on a notional amount. The interest amount is accrued daily as a component of unrealized appreciation (depreciation) and is recorded as a realized gain upon receipt of the payment. If a credit event as specified in the contract with the counterparty occurs, the Fund may either be required to accept the reference obligation from the buyer in exchange for a cash payment of its notional amount, or to pay the buyer a net cash settlement equal to the notional amount less an agreed-upon value of the reference obligation (recovery value) as of the date of the credit event. The difference between the value of the obligation or cash received and the notional amount paid will be recorded as a realized gain (loss). The maximum potential amount of undiscounted future payments the Fund could be required to make as the seller of protection under a credit default swap contract is equal to the notional amount of the reference obligation. These potential amounts may be partially offset by any recovery values of the respective reference obligations or premiums received upon entering into the agreement. The notional amounts and market values of all credit default swap contracts in which the Fund is the seller of protection, if any, are disclosed in the Credit Default Swap Contracts Outstanding schedule following the Portfolio of Investments.
As a protection seller, the Fund bears the risk of loss from the credit events specified in the contract with the counterparty. For credit default swap contracts on credit indices, quoted market prices and resulting market values serve as an indicator of the current status of the payment/performance risk. Increasing market values, in absolute terms when compared to the notional amount of the swap, represent a deterioration of the reference entity’s credit soundness and a greater likelihood or risk of default or other credit event occurring as defined under the terms of the contract.
Columbia Adaptive Risk Allocation Fund | Annual Report 2017
| 29 |
Notes to Financial Statements (continued)
May 31, 2017
Any premium paid or received by the Fund upon entering into a credit default swap contract is recorded as an asset or liability, respectively, and amortized daily as a component of realized gain (loss) in the Statement of Operations. Credit default swap contracts are valued daily, and the change in value is recorded as unrealized appreciation (depreciation) until the termination of the swap, at which time a realized gain (loss) is recorded.
Credit default swap contracts can involve greater risks than if a fund had invested in the reference obligation directly since, in addition to general market risks, credit default swaps are subject to counterparty credit risk, leverage risk, hedging risk, correlation risk and liquidity risk.
Total return swap contracts
The Fund entered into total return swap contracts to manage long or short exposure to the total return on a specified reference security in return for periodic payments based on a fixed or variable interest rate. These instruments may be used for other purposes in future periods. Total return swap contracts may be used to obtain exposure to an underlying reference security, instrument, or other asset or index or market without owning, taking physical custody of, or short selling any such security, instrument or asset in a market.
Total return swap contracts are valued daily, and the change in value is recorded as unrealized appreciation (depreciation) until the termination of the swap, at which time the Fund will realize a gain (loss). Periodic payments received (or made) by the Fund over the term of the contract are recorded as realized gains (losses). Total return swap contracts are subject to the risk associated with the investment in the underlying reference security, instrument or asset. The risk in the case of short total return swap contracts is unlimited based on the potential for unlimited increases in the market value of the underlying reference security, instrument or asset. This risk may be offset if the Fund holds any of the underlying reference security, instrument or asset. The risk in the case of long total return swap contracts is limited to the current notional amount of the total return swap contract.
Effects of derivative transactions in the financial statements
The following tables are intended to provide additional information about the effect of derivatives on the financial statements of the Fund, including: the fair value of derivatives by risk category and the location of those fair values in the Statement of Assets and Liabilities; and the impact of derivative transactions over the period in the Statement of Operations, including realized and unrealized gains (losses). The derivative instrument schedules following the Portfolio of Investments present additional information regarding derivative instruments outstanding at the end of the period, if any.
The following table is a summary of the fair value of derivative instruments (not considered to be hedging instruments for accounting disclosure purposes) at May 31, 2017:
| | Asset derivatives | |
Risk exposure
category | Statement
of assets and liabilities
location | Fair value ($) |
| Credit risk | Net assets — unrealized appreciation on swap contracts | 3,884,200* |
| Equity risk | Net assets — unrealized appreciation on futures contracts | 9,326,881* |
| Foreign exchange risk | Unrealized appreciation on forward foreign currency exchange contracts | 101,438 |
| Interest rate risk | Net assets — unrealized appreciation on futures contracts | 5,953,737* |
| Total | | 19,266,256 |
| | Liability derivatives | |
Risk exposure
category | Statement
of assets and liabilities
location | Fair value ($) |
| Credit risk | Premiums received on outstanding swap contracts | 2,188,171 |
| Foreign exchange risk | Unrealized depreciation on forward foreign currency exchange contracts | 13,962,912 |
| Interest rate risk | Net assets — unrealized depreciation on futures contracts | 1,080* |
| Total | | 16,152,163 |
| 30 | Columbia Adaptive Risk Allocation Fund | Annual Report 2017 |
Notes to Financial Statements (continued)
May 31, 2017
| * | Includes cumulative appreciation (depreciation) as reported in the tables following the Portfolio of Investments. Only the current day’s variation margin is reported in receivables or payables in the Statement of Assets and Liabilities. |
The following table indicates the effect of derivative instruments (not considered to be hedging instruments for accounting disclosure purposes) in the Statement of Operations for the year ended May 31, 2017:
| Amount of realized gain (loss) on derivatives recognized in income |
| Risk exposure category | Forward
foreign
currency
exchange
contracts
($) | Futures
contracts
($) | Options
contracts
purchased
($) | Swap
contracts
($) | Total
($) |
| Credit risk | — | — | — | 17,028,434 | 17,028,434 |
| Equity risk | — | 95,289,201 | (3,569,335) | 11,522,538 | 103,242,404 |
| Foreign exchange risk | 13,186,881 | (4,833) | — | — | 13,182,048 |
| Interest rate risk | — | 508,827 | (206,279) | — | 302,548 |
| Total | 13,186,881 | 95,793,195 | (3,775,614) | 28,550,972 | 133,755,434 |
| Change in unrealized appreciation (depreciation) on derivatives recognized in income |
| Risk exposure category | Forward
foreign
currency
exchange
contracts
($) | Futures
contracts
($) | Swap
contracts
($) | Total
($) |
| Credit risk | — | — | 3,884,200 | 3,884,200 |
| Equity risk | — | 4,168,966 | (2,292,503) | 1,876,463 |
| Foreign exchange risk | (14,193,154) | — | — | (14,193,154) |
| Interest rate risk | — | 5,740,500 | — | 5,740,500 |
| Total | (14,193,154) | 9,909,466 | 1,591,697 | (2,691,991) |
The following table is a summary of the average outstanding volume by derivative instrument for the year ended May 31, 2017:
| Derivative instrument | Average notional
amounts ($)* |
| Futures contracts — long | 1,201,749,586 |
| Futures contracts — short | 15,141,547 |
| Credit default swap contracts — sell protection | 337,948,121 |
| Derivative instrument | Average market
value ($)** |
| Options contracts — purchased | 122,538 |
| Derivative instrument | Average unrealized
appreciation ($) | Average unrealized
depreciation ($) |
| Forward foreign currency exchange contracts | 4,615,524* | (4,460,023)* |
| Total return swap contracts | 1,058,491*** | (19,921)*** |
| * | Based on the ending quarterly outstanding amounts for the year ended May 31, 2017. |
| ** | Based on the ending daily outstanding amounts for the year ended May 31, 2017. |
| *** | Based on the ending monthly outstanding amounts for the year ended May 31, 2017. |
Columbia Adaptive Risk Allocation Fund | Annual Report 2017
| 31 |
Notes to Financial Statements (continued)
May 31, 2017
Asset- and mortgage-backed securities
The Fund may invest in asset-backed and mortgage-backed securities. The maturity dates shown represent the original maturity of the underlying obligation. Actual maturity may vary based upon prepayment activity on these obligations. All, or a portion, of the obligation may be prepaid at any time because the underlying asset may be prepaid. As a result, decreasing market interest rates could result in an increased level of prepayment. An increased prepayment rate will have the effect of shortening the maturity of the security. Unless otherwise noted, the coupon rates presented are fixed rates.
Delayed delivery securities
The Fund may trade securities on other than normal settlement terms, including securities purchased or sold on a “when-issued” or "forward commitment" basis. This may increase risk to the Fund since the other party to the transaction may fail to deliver, which could cause the Fund to subsequently invest at less advantageous prices. The Fund designates cash or liquid securities in an amount equal to the delayed delivery commitment.
To be announced securities
The Fund may trade securities on a To Be Announced (TBA) basis. As with other delayed-delivery transactions, a seller agrees to issue a TBA security at a future date. However, the seller does not specify the particular securities to be delivered. Instead, the Fund agrees to accept any security that meets specified terms.
In some cases, Master Securities Forward Transaction Agreements (MSFTAs) may be used to govern transactions of certain forward-settling agency mortgage-backed securities, such as delayed-delivery and TBAs, between the Fund and counterparty. The MSFTA maintains provisions for, among other things, initiation and confirmation, payment and transfer, events of default, termination, and maintenance of collateral relating to such transactions.
Mortgage dollar roll transactions
The Fund may enter into mortgage “dollar rolls” in which the Fund sells securities for delivery in the current month and simultaneously contracts with the same counterparty to repurchase similar but not identical securities (same type, coupon and maturity) on a specified future date. During the roll period, the Fund loses the right to receive principal and interest paid on the securities sold. However, the Fund will benefit because it receives negotiated amounts in the form of reductions of the purchase price for the future purchase plus the interest earned on the cash proceeds of the securities sold until the settlement date of the forward purchase. The Fund records the incremental difference between the forward purchase and sale of each forward roll as a realized gain or loss. Unless any realized gains exceed the income, capital appreciation, and gain or loss due to mortgage prepayments that would have been realized on the securities sold as part of the mortgage dollar roll, the use of this technique will diminish the investment performance of the Fund compared to what the performance would have been without the use of mortgage dollar rolls. All cash proceeds will be invested in instruments that are permissible investments for the Fund. The Fund identifies cash or liquid securities in an amount equal to the forward purchase price.
For financial reporting and tax purposes, the Fund treats “to be announced” mortgage dollar rolls as two separate transactions, one involving the purchase of a security and a separate transaction involving a sale. These transactions may increase the Fund’s portfolio turnover rate. The Fund does not currently enter into mortgage dollar rolls that are accounted for as financing transactions.
Mortgage dollar rolls involve the risk that the market value of the securities the Fund is obligated to repurchase may decline below the repurchase price, or that the counterparty may default on its obligations.
Treasury inflation protected securities
The Fund may invest in treasury inflation protected securities (TIPS). The principal amount of TIPS is adjusted periodically and is increased for inflation or decreased for deflation based on a monthly published index. These adjustments are recorded as interest income in the Statement of Operations. Coupon payments are based on the adjusted principal at the time the interest is paid.
| 32 | Columbia Adaptive Risk Allocation Fund | Annual Report 2017 |
Notes to Financial Statements (continued)
May 31, 2017
Offsetting of assets and liabilities
The following table presents the Fund’s gross and net amount of assets and liabilities available for offset under netting arrangements as well as any related collateral received or pledged by the Fund as of May 31, 2017:
| | Barclays ($) | Citi ($) | Credit
Suisse ($) | HSBC ($) | Morgan
Stanley ($) | Standard
Chartered ($) | Total ($) | | |
| Assets | | | | | | | | | |
| Centrally cleared credit default swap contracts (a) | - | - | - | - | 9,461 | - | 9,461 | | |
| Forward foreign currency exchange contracts | 32,679 | 42,962 | 11,636 | - | - | 14,162 | 101,439 | | |
| Total assets | 32,679 | 42,962 | 11,636 | - | 9,461 | 14,162 | 110,900 | | |
| Liabilities | | | | | | | | | |
| Centrally cleared credit default swap contracts (a) | - | - | - | - | 188,854 | - | 188,854 | | |
| Forward foreign currency exchange contracts | 7,826,238 | 4,018,957 | 1,403,361 | 323,100 | - | 391,256 | 13,962,912 | | |
| OTC credit default swap contracts (b) | 1,641,969 | - | - | - | - | - | 1,641,969 | | |
| Total liabilities | 9,468,207 | 4,018,957 | 1,403,361 | 323,100 | 188,854 | 391,256 | 15,793,735 | | |
| Total financial and derivative net assets | (9,435,528) | (3,975,995) | (1,391,725) | (323,100) | (179,393) | (377,094) | (15,682,835) | | |
| Total collateral received (pledged) (c) | (4,860,000) | - | - | - | (179,393) | - | (5,039,393) | | |
| Net amount (d) | (4,575,528) | (3,975,995) | (1,391,725) | (323,100) | - | (377,094) | (10,643,442) | | |
| (a) | Centrally cleared swaps are included within payable/receivable for variation margin on the Statement of Assets and Liabilities. |
| (b) | Over-the-Counter Swap Contracts are presented at market value plus periodic payments receivable (payable), which is comprised of unrealized appreciation, unrealized depreciation, premiums paid and premiums received. |
| (c) | In some instances, the actual collateral received and/or pledged may be more than the amount shown due to overcollateralization. |
| (d) | Represents the net amount due from/(to) counterparties in the event of default. |
Security transactions
Security transactions are accounted for on the trade date. Cost is determined and gains (losses) are based upon the specific identification method for both financial statement and federal income tax purposes.
Income recognition
Interest income is recorded on an accrual basis. Market premiums and discounts, including original issue discounts, are amortized and accreted, respectively, over the expected life of the security on all debt securities, unless otherwise noted. The Fund classifies gains and losses realized on prepayments received on mortgage-backed securities as adjustments to interest income.
The Fund may place a debt security on non-accrual status and reduce related interest income when it becomes probable that the interest will not be collected and the amount of uncollectible interest can be reasonably estimated. A defaulted debt security is removed from non-accrual status when the issuer resumes interest payments or when collectibility of interest is reasonably assured.
The Fund may receive distributions from holdings in equity securities, business development companies (BDCs), exchange-traded funds, other regulated investment companies (RICs), and real estate investment trusts (REITs), which report information on the tax character of their distributions annually. These distributions are allocated to dividend income, capital gain and return of capital based on actual information reported. Return of capital is recorded as a reduction of the cost basis of securities held. If the Fund no longer owns the applicable securities, return of capital is recorded as a realized gain. With respect to REITs, to the extent actual information has not yet been reported, estimates for return of capital are made by the Fund’s management. Management’s estimates are subsequently adjusted when the actual character of the distributions is disclosed by the REITs, which could result in a proportionate change in return of capital to shareholders.
Income and capital gain distributions from the Underlying Funds, if any, are recorded on the ex-dividend date.
Columbia Adaptive Risk Allocation Fund | Annual Report 2017
| 33 |
Notes to Financial Statements (continued)
May 31, 2017
Expenses
General expenses of the Trust are allocated to the Fund and other funds of the Trust based upon relative net assets or other expense allocation methodologies determined by the nature of the expense. Expenses directly attributable to the Fund are charged to the Fund. Expenses directly attributable to a specific class of shares are charged to that share class.
Determination of class net asset value
All income, expenses (other than class-specific expenses, which are charged to that share class, as shown in the Statement of Operations) and realized and unrealized gains (losses) are allocated to each class of the Fund on a daily basis, based on the relative net assets of each class, for purposes of determining the net asset value of each class.
Federal income tax status
The Fund intends to qualify each year as a regulated investment company under Subchapter M of the Internal Revenue Code, as amended, and will distribute substantially all of its taxable income (including net short-term capital gains), if any, for its tax year, and as such will not be subject to federal income taxes. In addition, the Fund intends to distribute in each calendar year substantially all of its net investment income, capital gains and certain other amounts, if any, such that the Fund should not be subject to federal excise tax. Therefore, no federal income or excise tax provision is recorded.
Distributions to shareholders
Distributions from net investment income, if any, are declared and paid annually. Net realized capital gains, if any, are distributed along with the income distribution. Income distributions and capital gain distributions are determined in accordance with federal income tax regulations, which may differ from GAAP.
Guarantees and indemnifications
Under the Trust’s organizational documents and, in some cases, by contract, its officers and trustees are indemnified against certain liabilities arising out of the performance of their duties to the Trust or its funds. In addition, certain of the Fund’s contracts with its service providers contain general indemnification clauses. The Fund’s maximum exposure under these arrangements is unknown since the amount of any future claims that may be made against the Fund cannot be determined, and the Fund has no historical basis for predicting the likelihood of any such claims.
Investment company reporting modernization
In October 2016, the U.S. Securities and Exchange Commission adopted new rules and forms, and amendments to certain current rules and forms, to modernize reporting and disclosure of information by registered investment companies. The amendments to Regulation S-X will require standardized, enhanced disclosure about derivatives in investment company financial statements, and will also change the rules governing the form and content of such financial statements. The amendments to Regulation S-X take effect on August 1, 2017. At this time, management is assessing the anticipated impact of these regulatory developments.
Note 3. Fees and other transactions with affiliates
Management services fees
The Fund entered into a Management Agreement with the Investment Manager. Under the Management Agreement, the Investment Manager provides the Fund with investment research and advice, as well as administrative and accounting services. The management services fee is an annual fee that is a blend of (i) a fee that declines from 0.06% to 0.03%, depending on asset levels, on assets invested in affiliated mutual funds, exchange-traded funds and closed-end funds that pay an investment advisory fee to the Investment Manager, (ii) a fee that declines from 0.16% to 0.13%, depending on asset levels, on assets invested in exchange-traded funds and mutual funds that are not managed by the Investment Manager or its affiliates and (iii) a fee that declines from 0.76% to 0.63%, depending on asset levels, on assets invested in securities, instruments and other assets not described above, including affiliated mutual funds, exchange-traded funds and closed-end funds advised by the Investment Manager that do not pay an investment advisory fee, third party closed-end funds, derivatives and individual securities. The effective management services fee rate for the year ended May 31, 2017 was 0.61% of the Fund’s average daily net assets.
| 34 | Columbia Adaptive Risk Allocation Fund | Annual Report 2017 |
Notes to Financial Statements (continued)
May 31, 2017
In addition to the fees and expenses which the Fund bears directly, the Fund indirectly bears a pro rata share of the fees and expenses of the Underlying Funds (also referred to as "acquired funds") in which the Fund invests. Because the Underlying Funds have varied expense and fee levels and the Fund may own different proportions of Underlying Funds at different times, the amount of fees and expenses incurred indirectly by the Fund will vary.
Compensation of board members
Members of the Board of Trustees, who are not officers or employees of the Investment Manager or Ameriprise Financial, are compensated for their services to the Fund as disclosed in the Statement of Operations. These members of the Board of Trustees may participate in a Deferred Compensation Plan (the Plan) which may be terminated at any time. Obligations of the Plan will be paid solely out of the Fund’s assets, and all amounts payable under the Plan constitute a general unsecured obligation of the Fund.
Compensation of Chief Compliance Officer
The Board of Trustees has appointed a Chief Compliance Officer to the Fund in accordance with federal securities regulations. A portion of the Chief Compliance Officer’s total compensation is allocated to the Fund, along with other affiliated funds governed by the Board of Trustees, based on relative net assets. The total amount allocated to all affiliated funds governed by the Board of Trustees will not exceed $40,000 annually.
Transfer agency fees
Under a Transfer and Dividend Disbursing Agent Agreement, Columbia Management Investment Services Corp. (the Transfer Agent), an affiliate of the Investment Manager and a wholly-owned subsidiary of Ameriprise Financial, is responsible for providing transfer agency services to the Fund. The Transfer Agent has contracted with Boston Financial Data Services (BFDS) to serve as sub-transfer agent. The Transfer Agent pays the fees of BFDS for services as sub-transfer agent and BFDS is not entitled to reimbursement for such fees from the Fund (with the exception of out-of-pocket fees).
The Fund pays the Transfer Agent a monthly transfer agency fee based on the number or the average value of accounts, depending on the type of account. In addition, prior to October 1, 2016, the Transfer Agent also received sub-transfer agency fees based on a percentage of the average aggregate value of the Fund’s shares maintained in omnibus accounts (other than omnibus accounts for which American Enterprise Investment Services Inc. is the broker of record or accounts where the beneficial shareholder is a customer of Ameriprise Financial Services, Inc., for which the Transfer Agent receives a per account fee). Effective October 1, 2016, the Fund pays the Transfer Agent a fee for shareholder services based on the number of accounts or on a percentage of the average aggregate value of the Fund’s shares maintained in omnibus accounts up to the lesser of the amount charged by the financial intermediary or a cap established by the Board of Trustees from time to time.
The Transfer Agent also receives compensation from the Fund for various shareholder services and reimbursements for certain out-of-pocket fees. Effective January 1, 2017, total transfer agency fees for Class K and Class R5 shares are subject to an annual limitation of not more than 0.075% of the average daily net assets attributable to each share class. Total transfer agency fees for Class Y shares are subject to an annual limitation of not more than 0.025% of the average daily net assets attributable to Class Y shares. Prior to January 1, 2017, total transfer agency fees for Class K and Class R5 shares were subject to an annual limitation of not more than 0.05% of the average daily net assets attributable to each share class and Class Y shares did not pay transfer agency fees.
Columbia Adaptive Risk Allocation Fund | Annual Report 2017
| 35 |
Notes to Financial Statements (continued)
May 31, 2017
For the year ended May 31, 2017, the Fund’s effective transfer agency fee rates as a percentage of average daily net assets of each class were as follows:
| | Effective rate (%) |
| Class A | 0.08 |
| Class C | 0.08 |
| Class K | 0.061 |
| Class R | 0.06 |
| Class R4 | 0.08 |
| Class R5 | 0.064 |
| Class T | 0.08 |
| Class Y | 0.010 |
| Class Z | 0.05 |
An annual minimum account balance fee of $20 may apply to certain accounts with a value below the applicable share class’s initial minimum investment requirements to reduce the impact of small accounts on transfer agency fees. These minimum account balance fees are remitted to the Fund and recorded as part of expense reductions in the Statement of Operations. For the year ended May 31, 2017, these minimum account balance fees reduced total expenses of the Fund by $40.
Plan administration fees
Under a Plan Administration Services Agreement with the Transfer Agent, the Fund pays an annual fee at a rate of 0.25% of the Fund’s average daily net assets attributable to Class K shares for the provision of various administrative, recordkeeping, communication and educational services.
Distribution and service fees
The Fund has an agreement with Columbia Management Investment Distributors, Inc. (the Distributor), an affiliate of the Investment Manager and a wholly-owned subsidiary of Ameriprise Financial, for distribution and shareholder services. The Board of Trustees has approved, and the Fund has adopted, distribution and shareholder service plans (the Plans) applicable to certain share classes, which set the distribution and service fees for the Fund. These fees are calculated daily and are intended to compensate the Distributor and/or eligible selling and/or servicing agents for selling shares of the Fund and providing services to investors.
Under the Plans, the Fund pays a monthly service fee to the Distributor at the maximum annual rate of 0.25% of the average daily net assets attributable to Class A, Class C and Class T shares of the Fund. Also under the Plans, the Fund pays a monthly distribution fee to the Distributor at the maximum annual rates of 0.10%, 0.75%, 0.50% and 0.25% of the average daily net assets attributable to Class A, Class C, Class R and Class T shares of the Fund, respectively.
Although the Fund may pay distribution and service fees up to a maximum annual rate of 0.35% of the Fund’s average daily net assets attributable to Class A shares (comprised of up to 0.10% for distribution services and up to 0.25% for shareholder liaison services), the Fund currently limits such fees to an aggregate fee of not more than 0.25% of the Fund’s average daily net assets attributable to Class A shares.
Although the Fund may pay a distribution fee up to 0.25% of the Fund’s average daily net assets attributable to Class T shares and a service fee of up to 0.25% of the Fund’s average daily net assets attributable to Class T shares, the aggregate fee shall not exceed 0.25% of the Fund’s average daily net assets attributable to Class T shares.
| 36 | Columbia Adaptive Risk Allocation Fund | Annual Report 2017 |
Notes to Financial Statements (continued)
May 31, 2017
Sales charges (unaudited)
Sales charges, including front-end charges and CDSCs, received by the Distributor for distributing Fund shares for the year ended May 31, 2017, if any, are listed below:
| | Amount ($) |
| Class A | 809,265 |
| Class C | 15,339 |
Expenses waived/reimbursed by the Investment Manager and its affiliates
The Investment Manager and certain of its affiliates have contractually agreed to waive fees and/or reimburse expenses (excluding certain fees and expenses described below) for the period(s) disclosed below, so that the Fund’s net operating expenses, including indirect expenses of the Underlying Funds, after giving effect to fees waived/expenses reimbursed and any balance credits and/or overdraft charges from the Fund’s custodian, do not exceed the following annual rate(s) as a percentage of the class’ average daily net assets:
| | August 1, 2017
through
September 30, 2018 | October 1, 2016
through
July 31, 2017 | prior to
October 1, 2016 |
| Class A | 1.25% | 1.25% | 1.24% |
| Class C | 2.00 | 2.00 | 1.99 |
| Class K | 1.25 | 1.22 | 1.17 |
| Class R | 1.50 | 1.50 | 1.49 |
| Class R4 | 1.00 | 1.00 | 0.99 |
| Class R5 | 1.00 | 0.97 | 0.92 |
| Class T | 1.25 | 1.25 | 1.24 |
| Class Y | 0.95 | 0.92 | 0.87 |
| Class Z | 1.00 | 1.00 | 0.99 |
Under the agreement governing these fee waivers and/or expense reimbursement arrangements, the following fees and expenses are excluded from the waiver/reimbursement commitment, and therefore will be paid by the Fund, if applicable: taxes (including foreign transaction taxes), transaction costs and brokerage commissions, costs related to any securities lending program, dividend and interest expenses associated with securities sold short, inverse floater program fees and expenses, transaction charges and interest on borrowed money, interest, infrequent and/or unusual expenses and any other expenses the exclusion of which is specifically approved by the Board of Trustees. This agreement may be modified or amended only with approval from the Investment Manager, certain of its affiliates and the Fund. Any fees waived and/or expenses reimbursed under the expense reimbursement arrangements described above are not recoverable by the Investment Manager or its affiliates in future periods.
Note 4. Federal tax information
The timing and character of income and capital gain distributions are determined in accordance with income tax regulations, which may differ from GAAP because of temporary or permanent book to tax differences.
At May 31, 2017, these differences are primarily due to differing treatment for deferral/reversal of wash sale losses, re-characterization of distributions for investments, derivative investments, tax straddles, trustees’ deferred compensation, foreign currency transactions, distribution reclassifications, investments in partnerships, TIPS holding and Swap holdings. To the extent these differences are permanent, reclassifications are made among the components of the Fund’s net assets in the Statement of Assets and Liabilities. Temporary differences do not require reclassifications.
In the Statement of Assets and Liabilities the following reclassifications were made:
Columbia Adaptive Risk Allocation Fund | Annual Report 2017
| 37 |
Notes to Financial Statements (continued)
May 31, 2017
Undistributed net
investment
income ($) | Accumulated
net realized
gain ($) | Paid in
capital ($) |
| 15,494,566 | (15,494,566) | — |
Net investment income (loss) and net realized gains (losses), as disclosed in the Statement of Operations, and net assets were not affected by this reclassification.
The tax character of distributions paid during the years indicated was as follows:
| May 31, 2017 | May 31, 2016 |
Ordinary
income ($) | Long-term
capital gains ($) | Total ($) | Ordinary
income (S) | Long-term
capital gains ($) | Total ($) |
| 27,628,170 | — | 27,628,170 | 690,550 | 3,646,994 | 4,337,544 |
Short-term capital gain distributions, if any, are considered ordinary income distributions for tax purposes.
At May 31, 2017, the components of distributable earnings on a tax basis were as follows:
Undistributed
ordinary income ($) | Undistributed
long-term
capital gains ($) | Capital loss
carryforwards ($) | Net unrealized
appreciation ($) |
| 45,062,238 | 59,875,258 | — | 5,673,151 |
At May 31, 2017, the cost of investments for federal income tax purposes along with the aggregate gross unrealized appreciation and depreciation based on that cost was:
Federal
tax cost ($) | Gross unrealized
appreciation ($) | Gross unrealized
(depreciation) ($) | Net unrealized
appreciation ($) |
| 1,766,541,250 | 8,549,492 | (2,876,341) | 5,673,151 |
The following capital loss carryforwards, determined at May 31, 2017, may be available to reduce taxable income arising from future net realized gains on investments, if any, to the extent permitted by the Internal Revenue Code. Capital loss carryforwards with no expiration are required to be utilized prior to any capital losses which carry an expiration date. As a result of this ordering rule, capital loss carryforwards which carry an expiration date may be more likely to expire unused. In addition, for the year ended May 31, 2017, capital loss carryforwards utilized, expired unused and permanently lost were as follows:
| 2018 ($) | 2019 ($) | No expiration
short-term ($) | No expiration
long-term ($) | Total ($) | Utilized ($) | Expired ($) | Permanently
lost ($) |
| — | — | — | — | — | 4,136,989 | — | — |
Management of the Fund has concluded that there are no significant uncertain tax positions in the Fund that would require recognition in the financial statements. However, management’s conclusion may be subject to review and adjustment at a later date based on factors including, but not limited to, new tax laws, regulations, and administrative interpretations (including relevant court decisions). Generally, the Fund’s federal tax returns for the prior three fiscal years remain subject to examination by the Internal Revenue Service.
Note 5. Portfolio information
The cost of purchases and proceeds from sales of securities, excluding short-term investments and derivatives, if any, aggregated to $2,915,692,331 and $2,696,822,057, respectively, for the year ended May 31, 2017, of which $1,151,543,237 and $1,159,156,450, respectively, were U.S. government securities. The amount of purchase and sale activity impacts the portfolio turnover rate reported in the Financial Highlights.
Note 6. Payments by affiliates
During the year ended May 31, 2017, the Investment Manager reimbursed the Fund $344,293 for a loss on a trading error.
| 38 | Columbia Adaptive Risk Allocation Fund | Annual Report 2017 |
Notes to Financial Statements (continued)
May 31, 2017
Note 7. Affiliated money market fund
The Fund invests in Columbia Short-Term Cash Fund, an affiliated money market fund established for the exclusive use by the Fund and other affiliated funds (the Affiliated MMF). The income earned by the Fund from such investments is included as Dividends - affiliated issuers in the Statement of Operations. As an investing fund, the Fund indirectly bears its proportionate share of the expenses of the Affiliated MMF. Effective October 1, 2016, the Affiliated MMF prices its shares with a floating net asset value (NAV) and no longer seeks to maintain a stable NAV. In addition, the Board of Trustees of the Affiliated MMF may impose a fee on redemptions (sometimes referred to as a liquidity fee) or temporarily suspend redemptions (sometimes referred to as imposing a redemption gate) in the event its liquidity falls below regulatory limits.
Note 8. Line of credit
The Fund has access to a revolving credit facility with a syndicate of banks led by Citibank, N.A., HSBC Bank USA, N.A. and JPMorgan Chase Bank, N.A. whereby the Fund may borrow for the temporary funding of shareholder redemptions or for other temporary or emergency purposes. The credit facility agreement, which is a collective agreement between the Fund and certain other funds managed by the Investment Manager, severally and not jointly, permits collective borrowings up to $1 billion. Interest is charged to each participating fund based on its borrowings at a rate equal to the higher of (i) the overnight federal funds rate plus 1.00% or (ii) the one-month LIBOR rate plus 1.00%. Each borrowing under the credit facility matures no later than 60 days after the date of borrowing. The Fund also pays a commitment fee equal to its pro rata share of the amount of the credit facility at a rate of 0.15% per annum. The commitment fee is included in other expenses in the Statement of Operations.
The Fund had no borrowings during the year ended May 31, 2017.
Note 9. Significant risks
Commodity-related investment risk
The value of commodities investments will generally be affected by overall market movements and factors specific to a particular industry or commodity, which may include demand for the commodity, weather, embargoes, tariffs, and economic health, political, international, regulatory and other developments. Exposure to commodities and commodities markets may subject the value of the Fund’s investments to greater volatility than other types of investments. Commodities investments may also subject the Fund to counterparty risk and liquidity risk. The Fund may make commodity-related investments through one or more wholly-owned subsidiaries organized outside the U.S. that are generally not subject to U.S. laws (including securities laws) and their protections.
Credit risk
Credit risk is the risk that the value of debt securities in the Fund’s portfolio may decline because the issuer may default and fail to pay interest or repay principal when due. Rating agencies assign credit ratings to debt securities to indicate their credit risk. Lower rated or unrated debt securities held by the Fund may present increased credit risk as compared to higher-rated debt securities.
Derivatives risk
Losses involving derivative instruments may be substantial, because a relatively small price movement in the underlying security(ies), commodity, currency or index or other instrument or asset may result in a substantial loss for the Fund. In addition to the potential for increased losses, the use of derivative instruments may lead to increased volatility within the Fund. Derivatives will typically increase the Fund’s exposure to principal risks to which it is otherwise exposed, and may expose the Fund to additional risks, including correlation risk, counterparty risk, hedging risk, leverage risk and liquidity risk.
Interest rate risk
Interest rate risk is the risk of losses attributable to changes in interest rates. In general, if prevailing interest rates rise, the values of debt securities tend to fall, and if interest rates fall, the values of debt securities tend to rise. Actions by governments and central banking authorities can result in increases in interest rates. Increasing interest rates may negatively
Columbia Adaptive Risk Allocation Fund | Annual Report 2017
| 39 |
Notes to Financial Statements (continued)
May 31, 2017
affect the value of debt securities held by the Fund, resulting in a negative impact on the Fund’s performance and net asset value per share. In general, the longer the maturity or duration of a debt security, the greater its sensitivity to changes in interest rates.
Leverage risk
Leverage occurs when the Fund increases its assets available for investment using borrowings, short sales, derivatives, or similar instruments or techniques. The use of leverage may make any change in the Fund’s net asset value even greater and thus result in increased volatility of returns. Because short sales involve borrowing securities and then selling them, the Fund’s short sales effectively leverage the Fund’s assets. The Fund’s assets that are used as collateral to secure the Fund’s obligations to return the securities sold short may decrease in value while the short positions are outstanding, which may force the Fund to use its other assets to increase the collateral. Leverage can create an interest expense that may lower the Fund’s overall returns. Leverage presents the opportunity for increased net income and capital gains, but also exaggerates the Fund’s risk of loss. There can be no guarantee that a leveraging strategy will be successful.
Liquidity risk
Liquidity risk is the risk associated with a lack of marketability of investments which may make it difficult to sell the investment at a desirable time or price. Changing regulatory, market or other conditions or environments (for example, the interest rate or credit environments) may adversely affect the liquidity of the Fund’s investments. The Fund may have to accept a lower selling price for the holding, sell other investments, or forego another, more appealing investment opportunity. Generally, the less liquid the market at the time the Fund sells a portfolio investment, the greater the risk of loss or decline of value to the Fund. A less liquid market can lead to an increase in Fund redemptions, which may negatively impact Fund performance and net asset value per share, including, for example, if the Fund is forced to sell securities in a down market.
Non-diversification risk
A non-diversified fund is permitted to invest a greater percentage of its total assets in fewer issuers than a diversified fund. The Fund may, therefore, have a greater risk of loss from a few issuers than a similar fund that invests more broadly.
Shareholder concentration risk
At May 31, 2017, affiliated shareholders of record owned 90.3% of the outstanding shares of the Fund in one or more accounts. Subscription and redemption activity by concentrated accounts may have a significant effect on the operations of the Fund. In the case of a large redemption, the Fund may be forced to sell investments at inopportune times, including its liquid or more liquid positions, resulting in Fund losses and the Fund holding a higher percentage of less liquid or illiquid securities. Large redemptions could result in decreased economies of scale and increased operating expenses for non-redeeming Fund shareholders.
Note 10. Subsequent events
Management has evaluated the events and transactions that have occurred through the date the financial statements were issued and noted no items requiring adjustment of the financial statements or additional disclosure.
Note 11. Information regarding pending and settled legal proceedings
Ameriprise Financial and certain of its affiliates have historically been involved in a number of legal, arbitration and regulatory proceedings, including routine litigation, class actions, and governmental actions, concerning matters arising in connection with the conduct of their business activities. Ameriprise Financial believes that the Funds are not currently the subject of, and that neither Ameriprise Financial nor any of its affiliates are the subject of, any pending legal, arbitration or regulatory proceedings that are likely to have a material adverse effect on the Funds or the ability of Ameriprise Financial or its affiliates to perform under their contracts with the Funds. Ameriprise Financial is required to make quarterly (10-Q), annual (10-K) and, as necessary, 8-K filings with the Securities and Exchange Commission (SEC) on legal and regulatory matters that relate to Ameriprise Financial and its affiliates. Copies of these filings may be obtained by accessing the SEC website at www.sec.gov.
| 40 | Columbia Adaptive Risk Allocation Fund | Annual Report 2017 |
Notes to Financial Statements (continued)
May 31, 2017
There can be no assurance that these matters, or the adverse publicity associated with them, will not result in increased Fund redemptions, reduced sale of Fund shares or other adverse consequences to the Funds. Further, although we believe proceedings are not likely to have a material adverse effect on the Funds or the ability of Ameriprise Financial or its affiliates to perform under their contracts with the Funds, these proceedings are subject to uncertainties and, as such, we are unable to estimate the possible loss or range of loss that may result. An adverse outcome in one or more of these proceedings could result in adverse judgments, settlements, fines, penalties or other relief that could have a material adverse effect on the consolidated financial condition or results of operations of Ameriprise Financial.
Columbia Adaptive Risk Allocation Fund | Annual Report 2017
| 41 |
Report of Independent Registered Public Accounting Firm
To the Trustees of Columbia Funds Series Trust I and the Shareholders of Columbia Adaptive Risk Allocation Fund
In our opinion, the accompanying statement of assets and liabilities, including the portfolio of investments, and the related statements of operations and of changes in net assets and the financial highlights present fairly, in all material respects, the financial position of Columbia Adaptive Risk Allocation Fund (the “Fund”, a series of Columbia Funds Series Trust I) as of May 31, 2017, the results of its operations for the year then ended, the changes in its net assets for each of the two years in the period then ended and the financial highlights for each of the four years in the period then ended and for the period June 19, 2012 (commencement of operations) through May 31, 2013, in conformity with accounting principles generally accepted in the United States of America. These financial statements and financial highlights (hereafter referred to as “financial statements”) are the responsibility of the Fund’s management. Our responsibility is to express an opinion on these financial statements based on our audits. We conducted our audits of these financial statements in accordance with the standards of the Public Company Accounting Oversight Board (United States). Those standards require that we plan and perform the audit to obtain reasonable assurance about whether the financial statements are free of material misstatement. An audit includes examining, on a test basis, evidence supporting the amounts and disclosures in the financial statements, assessing the accounting principles used and significant estimates made by management, and evaluating the overall financial statement presentation. We believe that our audits, which included confirmation of securities as of May 31, 2017 by correspondence with the custodian, brokers and transfer agent, provide a reasonable basis for our opinion.
PricewaterhouseCoopers LLP
Minneapolis, MN
July 21, 2017
| 42 | Columbia Adaptive Risk Allocation Fund | Annual Report 2017 |
Federal Income Tax Information
(Unaudited)
The Fund hereby designates the following tax attributes for the fiscal year ended May 31, 2017. Shareholders will be notified in early 2018 of the amounts for use in preparing 2017 income tax returns.
Capital
gain
dividend | |
| $62,869,021 | |
Capital gain dividend. The Fund designates as a capital gain dividend the amount reflected above, or if subsequently determined to be different, the net capital gain of such fiscal period.
Columbia Adaptive Risk Allocation Fund | Annual Report 2017
| 43 |
Shareholders elect the Board that oversees the Fund’s operations. The Board appoints officers who are responsible for day-to-day business decisions based on policies set by the Board. The following table provides basic biographical information about the Fund’s Trustees, including their principal occupations during the past five years, although specific titles for individuals may have varied over the period. The year set forth beneath Length of Service in the table below is the year in which the Trustee was first appointed or elected as Trustee to any Fund currently in the Columbia Funds Complex or a predecessor thereof. Under current Board policy, members serve terms of indefinite duration.
Independent trustees
| Name, address, year of birth | Position held with the Trust and length of service | Principal occupation(s) during the past five years and other relevant professional experience | Number of Funds in the Columbia Fund Complex overseen | Other directorships held by Trustee during the past five years |
Janet Langford Carrig
c/o Columbia Management
Investment Advisers, LLC
225 Franklin Street
Mail Drop BX32 05228
Boston, MA 02110
1957 | Trustee
1996 | Senior Vice President, General Counsel and Corporate Secretary, ConocoPhillips (independent energy company) since September 2007 | 57 | None |
Douglas A. Hacker
c/o Columbia Management
Investment Advisers, LLC
225 Franklin Street
Mail Drop BX32 05228
Boston, MA 02110
1955 | Trustee and Chairman of the Board
1996 | Independent business executive since May 2006; Executive Vice President — Strategy of United Airlines from December 2002 to May 2006; President of UAL Loyalty Services (airline marketing company) from September 2001 to December 2002; Executive Vice President and Chief Financial Officer of United Airlines from July 1999 to September 2001 | 57 | Spartan Nash Company, (food distributor); Nash Finch Company (food distributor) from 2005 to 2013; Aircastle Limited (aircraft leasing); SeaCube Container Leasing Ltd. (container leasing) from 2010 to 2013; and Travelport Worldwide Limited (travel information technology) |
Nancy T. Lukitsh
c/o Columbia Management
Investment Advisers, LLC
225 Franklin Street
Mail Drop BX32 05228
Boston, MA 02110
1956 | Trustee
2011 | Senior Vice President, Partner and Director of Marketing, Wellington Management Company, LLP (investment adviser) from 1997 to 2010; Chair, Wellington Management Portfolios (commingled non-U.S. investment pools) from 2007 to 2010; Director, Wellington Trust Company, NA and other Wellington affiliates from 1997 to 2010 | 57 | None |
David M. Moffett
c/o Columbia Management
Investment Advisers, LLC
225 Franklin Street
Mail Drop BX32 05228
Boston, MA 02110
1952 | Trustee
2011 | Retired. Consultant to Bridgewater and Associates | 57 | Director, CSX Corporation; Genworth Financial, Inc. (financial and insurance products and services); PayPal Holdings Inc. (payment and data processing services); Trustee, University of Oklahoma Foundation; former Director, eBay Inc. (online trading community), 2007-2015; and former Director, CIT Bank, CIT Group Inc. (commercial and consumer finance), 2010-2016 |
| 44 | Columbia Adaptive Risk Allocation Fund | Annual Report 2017 |
TRUSTEES AND OFFICERS (continued)
Independent trustees (continued)
| Name, address, year of birth | Position held with the Trust and length of service | Principal occupation(s) during the past five years and other relevant professional experience | Number of Funds in the Columbia Fund Complex overseen | Other directorships held by Trustee during the past five years |
Charles R. Nelson
c/o Columbia Management
Investment Advisers, LLC
225 Franklin Street
Mail Drop BX32 05228
Boston, MA 02110
1942 | Trustee
1981 | Retired. Professor Emeritus, University of Washington since 2011; Professor of Economics, University of Washington from 1976 to 2011; Ford and Louisa Van Voorhis Professor of Political Economy, University of Washington from 1993 to 2011; Adjunct Professor of Statistics, University of Washington from 1980 to 2011; Associate Editor, Journal of Money, Credit and Banking from September 1993 to 2008; consultant on econometric and statistical matters | 57 | None |
John J. Neuhauser
c/o Columbia Management
Investment Advisers, LLC
225 Franklin Street
Mail Drop BX32 05228
Boston, MA 02110
1943 | Trustee
1984 | President, Saint Michael’s College since August 2007; Director or Trustee of several non-profit organizations, including University of Vermont Medical Center; Academic Vice President and Dean of Faculties, Boston College from August 1999 to October 2005; University Professor, Boston College from November 2005 to August 2007 | 57 | Liberty All-Star Equity Fund and Liberty All- Star Growth Fund (closed-end funds) |
Patrick J. Simpson
c/o Columbia Management
Investment Advisers, LLC
225 Franklin Street
Mail Drop BX32 05228
Boston, MA 02110
1944 | Trustee
2000 | Of Counsel, Perkins Coie LLP (law firm) since 2015; Partner, Perkins Coie LLP from 1988 to 2014 | 57 | None |
Anne-Lee Verville
c/o Columbia Management
Investment Advisers, LLC
225 Franklin Street
Mail Drop BX32 05228
Boston, MA 02110
1945 | Trustee
1998 | Retired. General Manager, Global Education Industry from 1994 to 1997, President – Application Systems Division from 1991 to 1994, Chief Financial Officer – US Marketing & Services from 1988 to 1991, and Chief Information Officer from 1987 to 1988, IBM Corporation (computer and technology) | 57 | Enesco Group, Inc. (producer of giftware and home and garden decor products) from 2001 to 2006 |
Columbia Adaptive Risk Allocation Fund | Annual Report 2017
| 45 |
TRUSTEES AND OFFICERS (continued)
Consultants to the independent trustees*
| Name, address, year of birth | Position held with the Trust and length of service | Principal occupation(s) during the past five years and other relevant professional experience | Number of Funds in the Columbia Funds complex overseen | Other directorships held by Trustee during the past five years |
J. Kevin Connaughton
c/o Columbia
Management Investment
Advisers, LLC,
225 Franklin Street
Mail Drop BX32 05228,
Boston, MA 02110
1964 | Independent Trustee Consultant
2016 | Independent Trustee Consultant, Columbia Funds since March 2016; Managing Director and General Manager of Mutual Fund Products, Columbia Management Investment Advisers, LLC from May 2010 to February 2015; President, Columbia Funds from 2009 to 2015; and senior officer of Columbia Funds and affiliated funds from 2003 to 2015 | 57 | Board of Governors, Gateway Healthcare since January 2016; Trustee, New Century Portfolios since March 2015; and Director, The Autism Project since March 2015 |
Natalie A. Trunow
c/o Columbia
Management Investment
Advisers, LLC,
225 Franklin Street
Mail Drop BX32 05228,
Boston, MA 02110
1967 | Independent Trustee Consultant
2016 | Independent Trustee Consultant, Columbia Funds since September 2016; Chief Executive Officer, Millennial Partners (investment consulting services to institutions) since January 2016; Director of Investments, Casey Family Programs from April 2016 to September 2016; Senior Vice President and Chief Investment Officer, Calvert Investments from August 2008 to January 2016; Section Head and Portfolio Manager, General Motors Asset Management from June 1997 to August 2008 | 57 | Healthcare Services for Children with Special Needs |
| * | J. Kevin Connaughton was appointed consultant to the Independent Trustees effective March 1, 2016. Natalie A. Trunow was appointed consultant to the Independent Trustees effective September 1, 2016. Shareholders of the Funds are expected to be asked to elect each of Mr. Connaughton and Ms. Trunow as a Trustee at a future shareholder meeting. |
Interested trustee affiliated with Investment Manager*
| Name, address, year of birth | Position held with the Trust and length of service | Principal occupation(s) during the past five years and other relevant professional experience | Number of Funds in the Columbia Funds Complex overseen | Other directorships held by Trustee during the past five years |
William F. Truscott
c/o Columbia Management
Investment Advisers, LLC
225 Franklin Street
Boston, MA 02110
1960 | Trustee
2012 | Chairman of the Board and President, Columbia Management Investment Advisers, LLC since May 2010 and February 2012, respectively; Chief Executive Officer, Global Asset Management, Ameriprise Financial, Inc. since September 2012 (previously Chief Executive Officer, U.S. Asset Management & President, Annuities, May 2010-September 2012); Director and Chief Executive Officer, Columbia Management Investment Distributors, Inc. since May 2010 and February 2012, respectively; Chairman of the Board and Chief Executive Officer, RiverSource Distributors, Inc. since 2006; Director, Threadneedle Asset Management Holdings, SARL since 2014; President and Chief Executive Officer, Ameriprise Certificate Company, 2006-August 2012 | 179 | Chairman of the Board, Columbia Management Investment Advisers, LLC since May 2010; Director, Columbia Management Investment Distributors, Inc. since May 2010; former Director, Ameriprise Certificate Company, 2006 - January 2013 |
| * | Interested person (as defined under the 1940 Act) by reason of being an officer, director, security holder and/or employee of the Investment Manager or Ameriprise Financial. |
The Statement of Additional Information has additional information about the Fund’s Board members and is available,
without charge, upon request by calling 800.345.6611; contacting your financial intermediary; or visiting
investor.columbiathreadneedleus.com.
| 46 | Columbia Adaptive Risk Allocation Fund | Annual Report 2017 |
TRUSTEES AND OFFICERS (continued)
The Board has appointed officers who are responsible for day-to-day business decisions based on policies it has established. The officers serve at the pleasure of the Board. The following table provides basic information about the Officers of the Fund, including principal occupations during the past five years, although their specific titles may have varied over the period. In addition to Mr. Truscott, who is Senior Vice President, the Fund’s other officers are:
Fund officers
Name,
address and
year of birth | Position and year
first appointed to
position for any Fund
in the Columbia
Funds complex or a
predecessor thereof | Principal occupation(s) during past five years |
Christopher O. Petersen
5228 Ameriprise
Financial Center
Minneapolis, MN 55474
Born 1970 | President and Principal Executive Officer (2015) | Vice President and Lead Chief Counsel, Ameriprise Financial, Inc. since January 2015 (previously, Vice President and Chief Counsel, January 2010 - December 2014; officer of Columbia Funds and affiliated funds since 2007. |
Michael G. Clarke
225 Franklin Street
Boston, MA 02110
Born 1969 | Treasurer (2011), Chief Financial Officer (2009) and Chief Accounting Officer (2015) | Vice President — Mutual Fund Administration, Columbia Management Investment Advisers, LLC, since May 2010; senior officer of Columbia Funds and affiliated funds since 2002. |
Paul B. Goucher
100 Park Avenue
New York, NY 10017
Born 1968 | Senior Vice President (2011) and Assistant Secretary (2008) | Senior Vice President and Assistant General Counsel, Ameriprise Financial, Inc. since January 2017 (previously Vice President and Lead Chief Counsel, November 2008 - January 2017 and January 2013 - January 2017, respectively; and Chief Counsel, January 2010 - January 2013); Vice President, Chief Legal Officer and Assistant Secretary, Columbia Management Investment Advisers, LLC since May 2010. |
Thomas P. McGuire
225 Franklin Street
Boston, MA 02110
Born 1972 | Senior Vice President and Chief Compliance Officer (2012) | Vice President — Asset Management Compliance, Ameriprise Financial, Inc., since May 2010; Chief Compliance Officer, Ameriprise Certificate Company since September 2010. |
Colin Moore
225 Franklin Street
Boston, MA 02110
Born 1958 | Senior Vice President (2010) | Executive Vice President and Global Chief Investment Officer, Ameriprise Financial, Inc., since July 2013; Executive Vice President and Global Chief Investment Officer, Columbia Management Investment Advisers, LLC since July 2013 (previously Director and Global Chief Investment Officer, 2010 - 2013). |
Ryan C. Larrenaga
225 Franklin Street
Boston, MA 02110
Born 1970 | Senior Vice President (2017), Chief Legal Officer (2017) and Secretary (2015) | Vice President and Group Counsel, Ameriprise Financial, Inc. since August 2011; officer of Columbia Funds and affiliated funds since 2005. |
Michael E. DeFao
225 Franklin Street
Boston, MA 02110
Born 1968 | Vice President (2011) and Assistant Secretary (2010) | Vice President and Chief Counsel, Ameriprise Financial, Inc. since May 2010. |
Amy Johnson
5228 Ameriprise
Financial Center
Minneapolis, MN 55474
Born 1965 | Vice President (2006) | Managing Director and Global Head of Operations, Columbia Management Investment Advisers, LLC since April 2016 (previously Managing Director and Chief Operating Officer, 2010 - 2016). |
Lyn Kephart-Strong
5228 Ameriprise
Financial Center
Minneapolis, MN 55474
Born 1960 | Vice President (2015) | President, Columbia Management Investment Services Corp. since October 2014; Vice President & Resolution Officer, Ameriprise Trust Company since August 2009. |
Columbia Adaptive Risk Allocation Fund | Annual Report 2017
| 47 |
The Fund mails one shareholder report to each shareholder address. If you would like more than one report, please call shareholder services at 800.345.6611 and additional reports will be sent to you.
Proxy voting policies and procedures
The policy of the Board of Trustees is to vote the proxies of the companies in which the Fund holds investments consistent with the procedures as stated in the Statement of Additional Information (SAI). You may obtain a copy of the SAI without charge by calling 800.345.6611; contacting your financial intermediary; visiting investor.columbiathreadneedleus.com; or searching the website of the Securities and Exchange Commission (SEC) at sec.gov. Information regarding how the Fund voted proxies relating to portfolio securities is filed with the SEC by August 31st for the most recent 12-month period ending June 30th of that year, and is available without charge by visiting investor.columbiathreadneedleus.com, or searching the website of the SEC at sec.gov.
Quarterly schedule of investments
The Fund files a complete schedule of portfolio holdings with the SEC for the first and third quarters of each fiscal year on Form N-Q. The Fund’s Form N-Q is available on the SEC’s website at sec.gov and may be reviewed and copied at the SEC’s Public Reference Room in Washington, D.C. Information on the operation of the Public Reference Room may be obtained by calling 800.SEC.0330. The Fund’s complete schedule of portfolio holdings, as filed on Form N-Q, can also be obtained without charge, upon request, by calling 800.345.6611.
Additional Fund information
For more information about the Fund, please visit investor.columbiathreadneedleus.com or call 800.345.6611. Customer Service Representatives are available to answer your questions Monday through Friday from 8 a.m. to 7 p.m. Eastern time.
You may obtain the current net asset value (NAV) of Fund shares at no cost by calling 800.345.6611 or by sending an e-mail to serviceinquiries@columbiathreadneedle.com.
Fund investment manager
Columbia Management Investment Advisers, LLC
225 Franklin Street
Boston, MA 02110
Fund distributor
Columbia Management Investment Distributors, Inc.
225 Franklin Street
Boston, MA 02110
Fund transfer agent
Columbia Management Investment Services Corp.
P.O. Box 8081
Boston, MA 02266-8081
| 48 | Columbia Adaptive Risk Allocation Fund | Annual Report 2017 |
[THIS PAGE INTENTIONALLY LEFT BLANK]
Columbia Adaptive Risk Allocation Fund
P.O. Box 8081
Boston, MA 02266-8081
Please read and consider the investment objectives, risks, charges and expenses for any fund carefully before investing. For a prospectus and summary prospectus, which contains this and other important information about the Fund, go to
investor.columbiathreadneedleus.com. The Fund is distributed by Columbia Management Investment Distributors, Inc., member FINRA, and managed by Columbia Management Investment Advisers, LLC.
Columbia Threadneedle Investments (Columbia Threadneedle) is the global brand name of the Columbia and Threadneedle group of companies. All rights reserved. Columbia Management Investment Distributors, Inc., 225 Franklin Street, Boston, MA 02110-2804
© 2017 Columbia Management Investment Advisers, LLC.
investor.columbiathreadneedleus.com

Annual Report
May 31, 2017
Columbia Alternative Beta Fund
Not FDIC Insured • No bank guarantee • May lose value
Dear Shareholders,
The current outlook for financial markets is clouded by two primary concerns: the high valuation of equities and the direction of interest rates. Following the U.S. presidential election, U.S. equities rallied based on the assumption that the new administration’s policies would stimulate growth quickly. Unfortunately it’s unclear whether those measures will get passed, much less passed quickly. In fixed income, uncertainty stems from the possibility that interest rates won’t rise as rapidly as expected if the administration’s proposed growth policies are not implemented.
Given this uncertainty, investors value a consistent approach more than ever. Investors want strong, repeatable risk-adjusted returns. Consistency — not surprises. As a leading global asset manager, we believe our consistent, collaborative investment approach enables us to deliver the dependable experience your portfolio demands. So, how do we strive to deliver a consistent investment experience?
Better insights
Your portfolio benefits from the investment insights uncovered by our talented investment teams around the world.
Better decisions
Our collaborative, interactive environment enables our investment teams to construct portfolios that take advantage of the best investment ideas.
Better outcomes
We aim to deliver a consistent experience, which means fewer surprises, dependable insights, and products designed to do the thing you want.
Whether you’re trying to save money to help your children go to college or for your own retirement, it’s the consistency of the return that is most essential. People who chase higher returns are usually also the first to sell when that investment goes through a bad patch. We try to combat this behavioral tendency by offering strategies that aim for a more consistent return. Our goal is for investors to panic less during periods of volatility, which can have a significant effect on their long-term results.
Nothing is more important to us than making sure those who have entrusted us to protect and grow their assets can do what matters most to them: build a nest egg, leave a legacy, and live confidently — now and throughout retirement. It’s why our talented professionals around the world work together to uncover uncommon opportunities and why our process encourages challenge and debate around our most compelling ideas to ensure better informed investment decisions, which hopefully lead to better outcomes for you.
Your success is our priority. Talk to your financial advisor about how working with Columbia Threadneedle Investments may help you position your portfolio for consistent, sustainable outcomes, no matter the market conditions.
Sincerely,
Christopher O. Petersen
President, Columbia Funds
There is no guarantee that investment objectives will be achieved or that any particular investment will be profitable.
Columbia Funds are distributed by Columbia Management Investment Distributors, Inc., member FINRA, and managed by Columbia Management Investment Advisers, LLC.
© 2017 Columbia Management Investment Advisers, LLC. All rights reserved.
Columbia Alternative Beta Fund | Annual Report 2017
Columbia Alternative Beta Fund | Annual Report 2017
Investment objective
Columbia Alternative Beta Fund (the Fund) seeks to provide shareholders with absolute (positive) returns over a complete market cycle.
Portfolio management
Jeffrey Knight, CFA
Co-lead manager
Managed Fund since 2015
William Landes, Ph.D.
Co-lead manager
Managed Fund since 2015
Marc Khalamayzer, CFA
Co-manager
Managed Fund since 2015
Joshua Kutin, CFA
Co-manager
Managed Fund since 2015
| Average annual total returns (%) (for the period ended May 31, 2017) |
| | | Inception | 1 Year | Life |
| Class A | Excluding sales charges | 01/28/15 | -0.28 | -2.34 |
| | Including sales charges | | -6.06 | -4.78 |
| Class C | Excluding sales charges | 01/28/15 | -1.03 | -3.06 |
| | Including sales charges | | -2.02 | -3.06 |
| Class R | 01/28/15 | -0.50 | -2.58 |
| Class R4 | 01/28/15 | -0.06 | -2.10 |
| Class R5 | 01/28/15 | -0.02 | -2.06 |
| Class T | Excluding sales charges | 01/28/15 | -0.28 | -2.38 |
| | Including sales charges | | -2.76 | -3.45 |
| Class Y | 01/28/15 | 0.21 | -1.95 |
| Class Z | 01/28/15 | 0.05 | -2.14 |
| Citi One-Month U.S. Treasury Bill Index | | 0.36 | 0.20 |
| HFRX Global Hedge Fund Index | | 5.96 | 0.58* |
*From January 31, 2015.
Returns for Class A are shown with and without the maximum initial sales charge of 5.75%. Returns for Class C are shown with and without the 1.00% contingent deferred sales charge (CDSC) for the first year only. The returns for Class T shares are shown with and without the maximum initial sales charge of 2.50% per transaction. Prior to March 27, 2017, Class T shares were known as Class W shares and were sold without a sales charge. The Fund’s other classes are not subject to sales charges and have limited eligibility. Please see the Fund’s prospectus for details. Performance for different share classes will vary based on differences in sales charges and fees associated with each class. All results shown assume reinvestment of distributions during the period. Returns do not reflect the deduction of taxes that a shareholder may pay on Fund distributions or on the redemption of Fund shares. Performance results reflect the effect of any fee waivers or reimbursements of Fund expenses by Columbia Management Investment Advisers, LLC and/or any of its affiliates. Absent these fee waivers or expense reimbursement arrangements, performance results would have been lower.
The performance information shown represents past performance and is not a guarantee of future results. The investment return and principal value of your investment will fluctuate so that your shares, when redeemed, may be worth more or less than their original cost. Current performance may be lower or higher than the performance information shown. You may obtain performance information current to the most recent month-end by contacting your financial intermediary, visiting investor.columbiathreadneedleus.com or calling 800.345.6611.
The Citi One-Month U.S. Treasury Bill Index is an unmanaged index that represents the performance of one-month Treasury bills and reflects reinvestment of all distributions and changes in market prices.
HFRX Global Hedge Fund Index is designed to be representative of the overall composition of the hedge fund universe.
Indices are not available for investment, are not professionally managed and do not reflect sales charges, fees, brokerage commissions, taxes or other expenses of investing. Securities in the Fund may not match those in an index.
| 2 | Columbia Alternative Beta Fund | Annual Report 2017 |
Fund at a Glance (continued)
Performance of a hypothetical $10,000 investment (January 28, 2015 — May 31, 2017)
The chart above shows the change in value of a hypothetical $10,000 investment in Class A shares of Columbia Alternative Beta Fund during the stated time period, and does not reflect the deduction of taxes that a shareholder may pay on Fund distributions or on the redemption of Fund shares.
*From January 31, 2015.
| Portfolio breakdown (%) (at May 31, 2017) |
| Money Market Funds | 100.0 |
| Total | 100.0 |
Percentages indicated are based upon total investments. The Fund’s portfolio composition is subject to change.
| Market exposure through derivatives investments (% of notional exposure) (at May 31, 2017)(a) |
| | Long | Short | Net |
| Fixed Income Derivative Contracts | 20.8 | - | 20.8 |
| Commodities Derivative Contracts | 25.1 | - | 25.1 |
| Equity Derivative Contracts | 36.0 | (0.3) | 35.7 |
| Foreign Currency Derivative Contracts | 19.7 | (1.3) | 18.4 |
| Total Notional Market Value of Derivative Contracts | 101.6 | (1.6) | 100.0 |
(a) The Fund has market exposure (long and/or short) to fixed income, commodity and equity asset classes and foreign currency through its investments in derivatives. The notional exposure of a financial instrument is the nominal or face amount that is used to calculate payments made on that instrument and/or changes in value for the instrument. The notional exposure is a hypothetical underlying quantity upon which payment obligations are computed. Notional exposures provide a gauge for how the Fund may behave given changes in individual markets. For a description of the Fund’s investments in derivatives, see Investments in derivatives following the Consolidated Portfolio of Investments, and Note 2 to the Notes to Consolidated Financial Statements.
Columbia Alternative Beta Fund | Annual Report 2017
| 3 |
Manager Discussion of Fund Performance
Effective October 1, 2016, the Fund was renamed Columbia Alternative Beta Fund; the HFRX Global Hedge Fund Index was added as a benchmark for performance comparison purposes; and the Fund was repositioned as described below.
For the 12-month period that ended May 31, 2017, the Fund’s Class A shares returned -0.28% excluding sales charges. During the same time period, the Citi One-Month U.S. Treasury Bill Index returned 0.36% and the HFRX Global Hedge Fund Index returned 5.96%. As an absolute return fund, it employs a benchmark agnostic strategy and thus comparisons to the Citi One-Month U.S. Treasury Bill Index and the HFRX Global Hedge Fund Index are for information purposes only. This multi-strategy, multi-asset class risk premia Fund accesses various alternative beta investment strategies that offer return opportunities typically not available from traditional investments.
Global equities and higher risk fixed-income securities advanced during period
Global equities advanced at a swift pace during the period, driven in large part by increased expectations for economic growth leading up to and following the U.S. elections, which, if realized, could, in turn, help foster an extension of the business cycle. Inflation expectations also rose for much of the period. The U.S. equity market, as measured by the S&P 500 Index, enjoyed a 109-day streak without a 1% decline during the annual period, its longest stretch in nearly 22 years. Another broad measure for U.S. equity performance, the Russell 3000 Index, gained 17.69% for the 12-month period ended May 31, 2017. U.S. equity markets flirted with new highs. International developed market equities, as measured by the 16.44% return of the MSCI EAFE Index, posted double-digit gains but modestly trailed their U.S. counterparts, pressured somewhat by a strengthening U.S. dollar. Emerging market equities, as represented by the 27.41% return of the MSCI Emerging Markets Index, outperformed U.S. equities, boosted by optimism about economic growth and the diminishing risk of populism in Europe following the French election results. Within fixed-income markets, corporate bonds and emerging market debt were among the best performing sectors, with high-yield corporate bonds leading the way.
Commodity positions hampered Fund results
Effective October 1, 2016, the Fund was 100% allocated to alternative beta strategies. Alternative beta strategies represent those strategies associated with the systematic risks embedded in capital markets and are driven primarily by: 1) academically-supported forms of risk premia (e.g. value, momentum, quality, etc.) and 2) investor-based behavioral biases, industry needs, structures and constraints (e.g. short volatility, commodity curve, etc.). In implementing these alternative beta strategies, the Fund maintains a multi-asset class, multi-style portfolio invested across specific risk premia styles in equity, fixed-income, credit, currency and commodity holdings. This absolute return fund is managed to a 7.5% volatility target relying on risk parity and risk targeting concepts.
During the period, the primary detractor from the Fund’s performance was its commodity suite of positions, which lost ground in three of the four styles represented within the Fund. Conversely, the Fund’s returns were buoyed by holdings in the equity and currency asset classes, specifically equity quality, equity low beta and currency value risk premia, which contributed positively. The Fund’s short volatility positions focused on global equity, global currency and U.S. Treasuries also contributed positively to returns. As alternative beta positions typically perform with little correlation to one another, this disparate performance among asset classes and styles is to be expected and indeed is the primary rationale for holding such a broadly diversified portfolio. When combined judiciously, we believe alternative beta holdings can produce a close-to-market-neutral profile, which makes them potentially attractive investment portfolio diversifiers.
Changes based in shift to stand-alone alternative beta strategy
As mentioned earlier, effective October 1, 2016, the Fund was renamed and repositioned from one that brought together multiple alternative investment strategies to one focused solely on alternative beta strategies, wherein all of the Fund’s assets were allocated to its existing alternative beta component. More specifically, the Fund’s principal investment strategies now align solely with the alternative beta strategy, which seeks to capitalize on inefficiencies and behavioral biases present within the equity, fixed-income, credit, commodities and currency markets. The Fund employs a number of strategies, such as carry, curve, low beta, momentum, value and volatility risk premia, which may include long/short security positions, derivatives and other instruments and assets.
| 4 | Columbia Alternative Beta Fund | Annual Report 2017 |
Manager Discussion of Fund Performance (continued)
With the goal of providing investors with exposure to assets that have a low market correlation, the Fund’s investment objective, fundamental policies and portfolio management team remained unchanged. The Fund remained an absolute return-focused portfolio that seeks to meet its performance target irrespective of global macro conditions. As such, the Fund invests in positions that tend to exhibit little market directionality.
Derivatives usage
The Fund utilizes derivatives for both hedging and non-hedging purposes, including, for example, seeking to enhance returns or as a substitute for a position in an underlying asset or index. During the period, the Fund used total return swap positions to more efficiently and cost effectively manage its exposures. These flexible structures, which allow for direct and highly versatile portfolio management applications, added value to the Fund’s results during the period.
Market risk may affect a single issuer, sector of the economy, industry or the market as a whole. Alternative investments cover a broad range of strategies and structures designed to be low or non-correlated to traditional equity and fixed-income markets and involve substantial risks and are more volatile than traditional investments, making them more suitable for investors with an above average-tolerance for risk. The Fund’s use of leverage allows for investment exposure in excess of net assets, thereby magnifying volatility of returns and risk of loss. Commodity investments may be affected by the overall market and industry- and commodity-specific factors, and may be more volatile and less liquid than other investments. Investing in derivatives is a specialized activity that involves special risks that subject the Fund to significant loss potential, including when used as leverage, and may result in greater fluctuation in fund value. Foreign investments subject the Fund to risks, including political, economic, market, social and others within a particular country, as well as to currency instabilities and less stringent financial and accounting standards generally applicable to U.S. issuers. The sales price the Fund (or its underlying investments) could receive for any particular investment may differ from the Fund’s (or underlying investments’) valuation of the investment. As a non-diversified fund, fewer investments could have a greater effect on performance. See the Fund’s prospectus for more information on these and other risks.
The views expressed in this report reflect the current views of the respective parties. These views are not guarantees of future performance and involve certain risks, uncertainties and assumptions that are difficult to predict, so actual outcomes and results may differ significantly from the views expressed. These views are subject to change at any time based upon economic, market or other conditions and the respective parties disclaim any responsibility to update such views. These views may not be relied on as investment advice and, because investment decisions for a Columbia fund are based on numerous factors, may not be relied on as an indication of trading intent on behalf of any particular Columbia fund. References to specific securities should not be construed as a recommendation or investment advice.
Columbia Alternative Beta Fund | Annual Report 2017
| 5 |
Understanding Your Fund’s Expenses
(Unaudited)
As an investor, you incur two types of costs. There are transaction costs, which generally include sales charges on purchases and may include redemption fees. There are also ongoing costs, which generally include management fees, distribution and/or service fees, and other fund expenses. The following information is intended to help you understand your ongoing costs (in dollars) of investing in the Fund and to help you compare these costs with the ongoing costs of investing in other mutual funds.
Analyzing your Fund’s expenses
To illustrate these ongoing costs, we have provided examples and calculated the expenses paid by investors in each share class of the Fund during the period. The actual and hypothetical information in the table is based on an initial investment of $1,000 at the beginning of the period indicated and held for the entire period. Expense information is calculated two ways and each method provides you with different information. The amount listed in the “Actual” column is calculated using the Fund’s actual operating expenses and total return for the period. You may use the Actual information, together with the amount invested, to estimate the expenses that you paid over the period. Simply divide your account value by $1,000 (for example, an $8,600 account value divided by $1,000 = 8.6), then multiply the results by the expenses paid during the period under the “Actual” column. The amount listed in the “Hypothetical” column assumes a 5% annual rate of return before expenses (which is not the Fund’s actual return) and then applies the Fund’s actual expense ratio for the period to the hypothetical return. You should not use the hypothetical account values and expenses to estimate either your actual account balance at the end of the period or the expenses you paid during the period. See “Compare with other funds” below for details on how to use the hypothetical data.
Compare with other funds
Since all mutual funds are required to include the same hypothetical calculations about expenses in shareholder reports, you can use this information to compare the ongoing cost of investing in the Fund with other funds. To do so, compare the hypothetical example with the 5% hypothetical examples that appear in the shareholder reports of other funds. As you compare hypothetical examples of other funds, it is important to note that hypothetical examples are meant to highlight the ongoing costs of investing in a fund only and do not reflect any transaction costs, such as sales charges, or redemption or exchange fees. Therefore, the hypothetical calculations are useful in comparing ongoing costs only, and will not help you determine the relative total costs of owning different funds. If transaction costs were included in these calculations, your costs would be higher.
| December 1, 2016 — May 31, 2017 |
| | Account value at the
beginning of the
period ($) | Account value at the
end of the
period ($) | Expenses paid during
the period ($) | Fund’s annualized
expense ratio (%) |
| | Actual | Hypothetical | Actual | Hypothetical | Actual | Hypothetical | Actual |
| Class A | 1,000.00 | 1,000.00 | 1,036.80 | 1,018.60 | 6.45 | 6.39 | 1.27 |
| Class C | 1,000.00 | 1,000.00 | 1,031.50 | 1,014.81 | 10.28 | 10.20 | 2.03 |
| Class R | 1,000.00 | 1,000.00 | 1,035.80 | 1,017.30 | 7.77 | 7.70 | 1.53 |
| Class R4 | 1,000.00 | 1,000.00 | 1,037.80 | 1,019.80 | 5.23 | 5.19 | 1.03 |
| Class R5 | 1,000.00 | 1,000.00 | 1,038.20 | 1,020.54 | 4.47 | 4.43 | 0.88 |
| Class T (formerly Class W) | 1,000.00 | 1,000.00 | 1,035.70 | 1,018.60 | 6.45 | 6.39 | 1.27 |
| Class Y | 1,000.00 | 1,000.00 | 1,039.50 | 1,020.54 | 4.47 | 4.43 | 0.88 |
| Class Z | 1,000.00 | 1,000.00 | 1,039.00 | 1,019.60 | 5.44 | 5.39 | 1.07 |
Expenses paid during the period are equal to the annualized expense ratio for each class as indicated above, multiplied by the average account value over the period and then multiplied by the number of days in the Fund’s most recent fiscal half year and divided by 365.
Expenses do not include fees and expenses incurred indirectly by the Fund from its investment in underlying funds, including affiliated and non-affiliated pooled investment vehicles, such as mutual funds and exchange-traded funds.
Had Columbia Management Investment Advisers, LLC and/or certain of its affiliates not waived/reimbursed certain fees and expenses, account value at the end of the period would have been reduced.
| 6 | Columbia Alternative Beta Fund | Annual Report 2017 |
Consolidated Portfolio of Investments
May 31, 2017
(Percentages represent value of investments compared to net assets)
| Money Market Funds 97.9% |
| | Shares | Value ($) |
| Columbia Short-Term Cash Fund, 0.916%(a),(b) | 538,647,376 | 538,647,376 |
Total Money Market Funds
(Cost $538,647,094) | 538,647,376 |
Total Investments
(Cost: $538,647,094) | 538,647,376 |
| Other Assets & Liabilities, Net | | 11,655,438 |
| Net Assets | 550,302,814 |
At May 31, 2017, securities and/or cash totaling $7,987,000 were pledged as collateral.
Investments in derivatives
| Forward foreign currency exchange contracts open at May 31, 2017 |
| Counterparty | Exchange
date | Currency to
be delivered | Currency to
be received | Unrealized
appreciation ($) | Unrealized
depreciation ($) |
| Barclays | 6/20/2017 | 6,550,000 EUR | 7,157,398 USD | — | (207,932) |
| Deutsche Bank | 6/20/2017 | 13,031,000 AUD | 9,612,718 USD | — | (67,075) |
| JPMorgan | 6/20/2017 | 14,624,000 CAD | 10,682,908 USD | — | (146,766) |
| Standard Chartered | 6/20/2017 | 2,041,400,000 JPY | 17,954,373 USD | — | (493,683) |
| Total | | | | — | (915,456) |
Futures contracts outstanding at May 31, 2017
| Short futures contracts outstanding |
| Contract description | Number of
contracts | Trading
currency | Notional market
value ($) | Expiration date | Unrealized
appreciation ($) | Unrealized
depreciation ($) |
| S&P 500 E-mini | (90) | USD | (10,849,950) | 06/2017 | — | (285,198) |
| Total return swap contracts outstanding at May 31, 2017 |
| Counterparty | Fund receives | Fund pays | Expiration
date | Notional
currency | Notional
amount | Premium
paid
($) | Premium
received
($) | Unrealized
appreciation
($) | Unrealized
depreciation
($) |
| Barclays | Total return on Barclays TrendStar+ Alt Roll 2 Index(1) | Fixed rate of 0.600% | 11/30/2017 | USD | 48,552,261 | 9,484 | — | 93,413 | — |
| Barclays | Total return on Atlantic High Yield Investment Grade Spread BetaBarclays Credit Index(2) | Fixed rate of 0.400% | 11/30/2017 | USD | 148,157,109 | 66,516 | — | 58,659 | — |
| Barclays | Total return on Barclays TrendStar+ Alt Roll 2 Index(1) | Fixed rate of 0.600% | 11/30/2017 | USD | 29,123,825 | 9,476 | — | 52,247 | — |
| Barclays | Total return on Barclays TrendStar+ Alt Roll 2 Index(1) | Fixed rate of 0.600% | 11/30/2017 | USD | 10,109,134 | 3,304 | — | 18,120 | — |
| Barclays | Total return on Barclays TrendStar+ Alt Roll 2 Index(1) | Fixed rate of 0.600% | 11/30/2017 | USD | 4,143,726 | 1,154 | — | 7,628 | — |
The accompanying Notes to Consolidated Financial Statements are an integral part of this statement.
Columbia Alternative Beta Fund | Annual Report 2017
| 7 |
Consolidated Portfolio of Investments (continued)
May 31, 2017
| Total return swap contracts outstanding at May 31, 2017 (continued) |
| Counterparty | Fund receives | Fund pays | Expiration
date | Notional
currency | Notional
amount | Premium
paid
($) | Premium
received
($) | Unrealized
appreciation
($) | Unrealized
depreciation
($) |
| Barclays | Total return on Barclays TrendStar+ Alt Roll 2 Index(1) | Fixed rate of 0.600% | 11/30/2017 | USD | 2,527,158 | 498 | — | 4,858 | — |
| Barclays | Total return on Barclays Backwardation Excess Return Index(3) | Fixed rate of 0.250% | 11/30/2017 | USD | 1,798,329 | — | — | 4,448 | — |
| Barclays | Total return on Barclays TrendStar+ Alt Roll 2 Index(1) | Fixed rate of 0.600% | 11/30/2017 | USD | 1,950,978 | 405 | — | 3,730 | — |
| Barclays | Total return on Barclays TrendStar+ Alt Roll 2 Index(1) | Fixed rate of 0.600% | 11/30/2017 | USD | 3,402,661 | 1,180 | — | 3,563 | — |
| Barclays | Total return on Barclays Dualis Excess Return Index(4) | Fixed rate of 0.580% | 11/30/2017 | USD | 3,019,885 | — | — | 2,587 | — |
| Barclays | Total return on Barclays TrendStar+ Alt Roll 2 Index(1) | Fixed rate of 0.600% | 11/30/2017 | USD | 1,306,259 | 386 | — | 2,382 | — |
| Barclays | Total return on Atlantic High Yield Investment Grade Spread BetaBarclays Credit Index(2) | Fixed rate of 0.400% | 11/30/2017 | USD | 5,847,475 | 4,077 | — | 863 | — |
| Barclays | Total return on Atlantic High Yield Investment Grade Spread BetaBarclays Credit Index(2) | Fixed rate of 0.400% | 11/30/2017 | USD | 24,568,345 | 19,896 | — | 862 | — |
| Barclays | Total return on Atlantic High Yield Investment Grade Spread BetaBarclays Credit Index(2) | Fixed rate of 0.400% | 11/30/2017 | USD | 21,320,774 | 17,332 | — | 682 | — |
| Barclays | Total return on Atlantic High Yield Investment Grade Spread BetaBarclays Credit Index(2) | Fixed rate of 0.400% | 11/30/2017 | USD | 4,333,810 | 3,205 | — | 457 | — |
| Barclays | Total return on Barclays Dualis Excess Return Index(4) | Fixed rate of 0.580% | 11/30/2017 | USD | 738,136 | — | — | — | (256) |
| Barclays | Total return on Barclays Dualis Excess Return Index(4) | Fixed rate of 0.580% | 11/30/2017 | USD | 2,186,010 | — | — | — | (759) |
The accompanying Notes to Consolidated Financial Statements are an integral part of this statement.
| 8 | Columbia Alternative Beta Fund | Annual Report 2017 |
Consolidated Portfolio of Investments (continued)
May 31, 2017
| Total return swap contracts outstanding at May 31, 2017 (continued) |
| Counterparty | Fund receives | Fund pays | Expiration
date | Notional
currency | Notional
amount | Premium
paid
($) | Premium
received
($) | Unrealized
appreciation
($) | Unrealized
depreciation
($) |
| Barclays | Total return on Barclays Dualis Excess Return Index(4) | Fixed rate of 0.580% | 11/30/2017 | USD | 2,188,158 | — | — | — | (760) |
| Barclays | Total return on Barclays Dualis Excess Return Index(4) | Fixed rate of 0.580% | 11/30/2017 | USD | 3,304,312 | — | — | — | (1,148) |
| Barclays | Total return on Barclays Dualis Excess Return Index(4) | Fixed rate of 0.580% | 11/30/2017 | USD | 11,954,326 | — | — | — | (4,152) |
| Barclays | Total return on Atlantic High Yield Investment Grade Spread BetaBarclays Credit Index(2) | Fixed rate of 0.400% | 11/30/2017 | USD | 3,305,493 | 2,865 | — | — | (5,534) |
| Barclays | Total return on Barclays Dualis Excess Return Index(4) | Fixed rate of 0.580% | 11/30/2017 | USD | 16,707,227 | — | — | — | (5,803) |
| Barclays | Total return on Barclays Hedging Insights Index(3) | Fixed rate of 0.150% | 11/30/2017 | USD | 1,440,806 | — | — | — | (9,079) |
| Barclays | Total return on Barclays Hedging Insights Index(3) | Fixed rate of 0.150% | 11/30/2017 | USD | 2,297,453 | — | — | — | (14,477) |
| Barclays | Total return on Barclays Hedging Insights Index(3) | Fixed rate of 0.150% | 11/30/2017 | USD | 2,306,050 | — | — | — | (14,531) |
| Barclays | Total return on Barclays Hedging Insights Index(3) | Fixed rate of 0.150% | 11/30/2017 | USD | 2,419,403 | — | — | — | (15,245) |
| Barclays | Total return on Barclays Hedging Insights Index(3) | Fixed rate of 0.150% | 11/30/2017 | USD | 2,505,767 | — | — | — | (15,789) |
| Barclays | Total return on Barclays Hedging Insights Index(3) | Fixed rate of 0.150% | 11/30/2017 | USD | 3,892,428 | — | — | — | (20,155) |
| Barclays | Total return on Barclays Hedging Insights Index(3) | Fixed rate of 0.150% | 11/30/2017 | USD | 3,357,616 | — | — | — | (21,157) |
| Barclays | Total return on Barclays Hedging Insights Index(3) | Fixed rate of 0.150% | 11/30/2017 | USD | 3,413,793 | — | — | — | (21,511) |
| Barclays | Total return on Barclays Hedging Insights Index(3) | Fixed rate of 0.150% | 11/30/2017 | USD | 3,444,580 | — | — | — | (21,705) |
The accompanying Notes to Consolidated Financial Statements are an integral part of this statement.
Columbia Alternative Beta Fund | Annual Report 2017
| 9 |
Consolidated Portfolio of Investments (continued)
May 31, 2017
| Total return swap contracts outstanding at May 31, 2017 (continued) |
| Counterparty | Fund receives | Fund pays | Expiration
date | Notional
currency | Notional
amount | Premium
paid
($) | Premium
received
($) | Unrealized
appreciation
($) | Unrealized
depreciation
($) |
| Barclays | Total return on Barclays Dualis Excess Return Index(4) | Fixed rate of 0.580% | 11/30/2017 | USD | 72,498,694 | — | — | — | (25,182) |
| Barclays | Total return on Barclays Hedging Insights Index(3) | Fixed rate of 0.150% | 11/30/2017 | USD | 2,458,970 | — | — | — | (25,265) |
| Barclays | Total return on Barclays Hedging Insights Index(3) | Fixed rate of 0.150% | 11/30/2017 | USD | 4,132,897 | — | — | — | (26,042) |
| Barclays | Total return on Barclays Backwardation Excess Return Index(3) | Fixed rate of 0.250% | 11/30/2017 | USD | 2,065,237 | — | — | — | (32,188) |
| Barclays | Total return on Barclays Backwardation Excess Return Index(3) | Fixed rate of 0.250% | 11/30/2017 | USD | 4,536,070 | — | — | — | (70,698) |
| Barclays | Total return on Barclays Hedging Insights Index(3) | Fixed rate of 0.150% | 11/30/2017 | USD | 11,353,720 | — | — | — | (71,542) |
| Barclays | Total return on Barclays Backwardation Excess Return Index(3) | Fixed rate of 0.250% | 11/30/2017 | USD | 5,368,639 | — | — | — | (83,675) |
| Barclays | Total return on Barclays Hedging Insights Index(3) | Fixed rate of 0.150% | 11/30/2017 | USD | 20,973,156 | — | — | — | (132,156) |
| Barclays | Total return on Barclays Hedging Insights Index(3) | Fixed rate of 0.150% | 11/30/2017 | USD | 52,977,964 | — | — | — | (333,825) |
| Barclays | Total return on Barclays Backwardation Excess Return Index(3) | Fixed rate of 0.250% | 11/30/2017 | USD | 29,474,679 | — | — | — | (459,388) |
| Citi | Total return on Citi Commodities Liquidity Navigator Index(3) | Fixed rate of 0.290% | 11/30/2017 | USD | 3,697,165 | — | — | — | (3,169) |
| Citi | Total return on Citi Commodities Liquidity Navigator Index(3) | Fixed rate of 0.290% | 11/30/2017 | USD | 5,709,554 | — | — | — | (4,894) |
| Citi | Total return on Citi Commodities Liquidity Navigator Index(3) | Fixed rate of 0.290% | 11/30/2017 | USD | 6,492,230 | — | — | — | (5,565) |
The accompanying Notes to Consolidated Financial Statements are an integral part of this statement.
| 10 | Columbia Alternative Beta Fund | Annual Report 2017 |
Consolidated Portfolio of Investments (continued)
May 31, 2017
| Total return swap contracts outstanding at May 31, 2017 (continued) |
| Counterparty | Fund receives | Fund pays | Expiration
date | Notional
currency | Notional
amount | Premium
paid
($) | Premium
received
($) | Unrealized
appreciation
($) | Unrealized
depreciation
($) |
| Citi | Total return on Citi Commodities Liquidity Navigator Index(3) | Fixed rate of 0.290% | 11/30/2017 | USD | 5,197,328 | — | — | — | (10,741) |
| Citi | Total return on Citi Commodities Liquidity Navigator Index(3) | Fixed rate of 0.290% | 11/30/2017 | USD | 31,639,790 | — | — | — | (27,120) |
| Citi | Total return on Citi Commodities Liquidity Navigator Index(3) | Fixed rate of 0.290% | 11/30/2017 | USD | 35,502,126 | — | — | — | (30,430) |
| Citi | Total return on Citi Commodities Liquidity Navigator Index(3) | Fixed rate of 0.290% | 11/30/2017 | USD | 220,418,806 | — | — | — | (188,929) |
| Deutsche Bank | Total return on Deutsche Bank Equity Low Beta Turnover Control Factor Index - USD Excess Return(5) | Fixed rate of 0.000% | 11/30/2017 | USD | 15,947,764 | 3,924 | — | 374,929 | — |
| Deutsche Bank | Total return on Deutsche Bank Equity Low Beta Turnover Control Factor Index - USD Excess Return(5) | Fixed rate of 0.000% | 11/30/2017 | USD | 12,594,565 | 2,231 | — | 296,964 | — |
| Deutsche Bank | Total return on Deutsche Bank Equity Low Beta Turnover Control Factor Index - USD Excess Return(5) | Fixed rate of 0.000% | 11/30/2017 | USD | 3,575,510 | 881 | — | 84,058 | — |
| Deutsche Bank | Total return on Deutsche Bank Equity Low Beta Turnover Control Factor Index - USD Excess Return(5) | Fixed rate of 0.000% | 11/30/2017 | USD | 997,314 | 223 | — | 23,469 | — |
| Deutsche Bank | Total return on Deutsche Bank Equity Low Beta Turnover Control Factor Index - USD Excess Return(5) | Fixed rate of 0.000% | 11/30/2017 | USD | 1,302,551 | 363 | — | 18,389 | — |
| Deutsche Bank | Total return on Deutsche Bank Equity Sector Neutral Quality Factor Index - USD Excess Return(5) | Fixed rate of 0.000% | 11/30/2017 | USD | 3,405,155 | 1,265 | — | 17,706 | — |
The accompanying Notes to Consolidated Financial Statements are an integral part of this statement.
Columbia Alternative Beta Fund | Annual Report 2017
| 11 |
Consolidated Portfolio of Investments (continued)
May 31, 2017
| Total return swap contracts outstanding at May 31, 2017 (continued) |
| Counterparty | Fund receives | Fund pays | Expiration
date | Notional
currency | Notional
amount | Premium
paid
($) | Premium
received
($) | Unrealized
appreciation
($) | Unrealized
depreciation
($) |
| Deutsche Bank | Total return on Deutsche Bank Equity Sector Neutral Quality Factor Index - USD Excess Return(5) | Fixed rate of 0.000% | 11/30/2017 | USD | 65,390,388 | 418 | — | 17,595 | — |
| Deutsche Bank | Total return on Deutsche Bank Equity Sector Neutral Quality Factor Index - USD Excess Return(5) | Fixed rate of 0.000% | 11/30/2017 | USD | 2,273,482 | 591 | — | 35 | — |
| Deutsche Bank | Total return on Deutsche Bank Equity Sector Neutral Quality Factor Index - USD Excess Return(5) | Fixed rate of 0.000% | 11/30/2017 | USD | 1,001,591 | 296 | — | — | (20) |
| Deutsche Bank | Total return on Deutsche Bank Equity Sector Neutral Quality Factor Index - USD Excess Return(5) | Fixed rate of 0.000% | 11/30/2017 | USD | 3,269,519 | 1,060 | — | — | (160) |
| Deutsche Bank | Total return on Deutsche Bank Equity Sector Neutral Quality Factor Index - USD Excess Return(5) | Fixed rate of 0.000% | 11/30/2017 | USD | 8,295,989 | 2,707 | — | — | (422) |
| Deutsche Bank | Total return on Deutsche Bank Currency Valuation - USD Excess Return(6) | Fixed rate of 0.000% | 11/30/2017 | USD | 640,564 | — | — | — | (1,194) |
| Deutsche Bank | Total return on Deutsche Bank Haven Plus - USD Excess Return(6) | Fixed rate of 0.000% | 11/30/2017 | USD | 579,385 | — | — | — | (3,839) |
| Deutsche Bank | Total return on Deutsche Bank Currency Valuation - USD Excess Return(6) | Fixed rate of 0.000% | 11/30/2017 | USD | 2,422,856 | — | — | — | (4,515) |
| Deutsche Bank | Total return on Deutsche Bank Currency Valuation - USD Excess Return(6) | Fixed rate of 0.000% | 11/30/2017 | USD | 3,472,176 | — | — | — | (6,471) |
| Deutsche Bank | Total return on Deutsche Bank Currency Valuation - USD Excess Return(6) | Fixed rate of 0.000% | 11/30/2017 | USD | 3,627,090 | — | — | — | (6,759) |
| Deutsche Bank | Total return on Deutsche Bank Currency Valuation - USD Excess Return(6) | Fixed rate of 0.000% | 11/30/2017 | USD | 3,727,368 | — | — | — | (6,946) |
The accompanying Notes to Consolidated Financial Statements are an integral part of this statement.
| 12 | Columbia Alternative Beta Fund | Annual Report 2017 |
Consolidated Portfolio of Investments (continued)
May 31, 2017
| Total return swap contracts outstanding at May 31, 2017 (continued) |
| Counterparty | Fund receives | Fund pays | Expiration
date | Notional
currency | Notional
amount | Premium
paid
($) | Premium
received
($) | Unrealized
appreciation
($) | Unrealized
depreciation
($) |
| Deutsche Bank | Total return on Deutsche Bank Equity Risk-Adjusted Momentum Factor Index - USD Excess Return(7) | Fixed rate of 0.000% | 11/30/2017 | USD | 1,588,246 | 478 | — | — | (9,342) |
| Deutsche Bank | Total return on Deutsche Bank Currency Valuation - USD Excess Return(6) | Fixed rate of 0.000% | 11/30/2017 | USD | 7,351,535 | — | — | — | (13,700) |
| Deutsche Bank | Total return on Deutsche Bank Equity Risk-Adjusted Momentum Factor Index - USD Excess Return(7) | Fixed rate of 0.000% | 11/30/2017 | USD | 2,706,196 | 1,005 | — | — | (15,953) |
| Deutsche Bank | Total return on Deutsche Bank Equity Risk-Adjusted Momentum Factor Index - USD Excess Return(7) | Fixed rate of 0.000% | 11/30/2017 | USD | 2,742,891 | 725 | — | — | (16,032) |
| Deutsche Bank | Total return on Deutsche Bank Equity Risk-Adjusted Momentum Factor Index - USD Excess Return(7) | Fixed rate of 0.000% | 11/30/2017 | USD | 3,077,835 | 871 | — | — | (18,047) |
| Deutsche Bank | Total return on Deutsche Bank Haven Plus - USD Excess Return(6) | Fixed rate of 0.000% | 11/30/2017 | USD | 3,570,125 | — | — | — | (23,654) |
| Deutsche Bank | Total return on Deutsche Bank Equity Risk-Adjusted Momentum Factor Index - USD Excess Return(7) | Fixed rate of 0.000% | 11/30/2017 | USD | 4,093,631 | 1,333 | — | — | (24,178) |
| Deutsche Bank | Total return on Deutsche Bank Equity Sector Neutral Value Factor Index - USD Excess Return(5) | Fixed rate of 0.000% | 11/30/2017 | USD | 2,009,807 | 746 | — | — | (24,201) |
| Deutsche Bank | Total return on Deutsche Bank Currency Valuation - USD Excess Return(6) | Fixed rate of 0.000% | 11/30/2017 | USD | 13,085,583 | — | — | — | (24,386) |
| Deutsche Bank | Total return on Deutsche Bank Currency Valuation - USD Excess Return(6) | Fixed rate of 0.000% | 11/30/2017 | USD | 13,669,038 | — | — | — | (25,473) |
The accompanying Notes to Consolidated Financial Statements are an integral part of this statement.
Columbia Alternative Beta Fund | Annual Report 2017
| 13 |
Consolidated Portfolio of Investments (continued)
May 31, 2017
| Total return swap contracts outstanding at May 31, 2017 (continued) |
| Counterparty | Fund receives | Fund pays | Expiration
date | Notional
currency | Notional
amount | Premium
paid
($) | Premium
received
($) | Unrealized
appreciation
($) | Unrealized
depreciation
($) |
| Deutsche Bank | Total return on Deutsche Bank Haven Plus - USD Excess Return(6) | Fixed rate of 0.000% | 11/30/2017 | USD | 4,525,412 | — | — | — | (29,984) |
| Deutsche Bank | Total return on Deutsche Bank Equity Sector Neutral Value Factor Index - USD Excess Return(5) | Fixed rate of 0.000% | 11/30/2017 | USD | 2,200,716 | 652 | — | — | (30,752) |
| Deutsche Bank | Total return on Deutsche Bank Haven Plus - USD Excess Return(6) | Fixed rate of 0.000% | 11/30/2017 | USD | 5,218,582 | — | — | — | (34,577) |
| Deutsche Bank | Total return on Deutsche Bank Equity Sector Neutral Value Factor Index - USD Excess Return(5) | Fixed rate of 0.000% | 11/30/2017 | USD | 2,626,661 | 683 | — | — | (36,609) |
| Deutsche Bank | Total return on Deutsche Bank Currency Valuation - USD Excess Return(6) | Fixed rate of 0.000% | 11/30/2017 | USD | 23,898,502 | — | — | — | (44,536) |
| Deutsche Bank | Total return on Deutsche Bank Equity Sector Neutral Value Factor Index - USD Excess Return(5) | Fixed rate of 0.000% | 11/30/2017 | USD | 4,020,323 | 1,124 | — | — | (56,112) |
| Deutsche Bank | Total return on Deutsche Bank Haven Plus - USD Excess Return(6) | Fixed rate of 0.000% | 11/30/2017 | USD | 18,104,244 | — | — | — | (81,285) |
| Deutsche Bank | Total return on Deutsche Bank Haven Plus - USD Excess Return(6) | Fixed rate of 0.000% | 11/30/2017 | USD | 19,493,693 | — | — | — | (129,158) |
| Deutsche Bank | Total return on Deutsche Bank Currency Valuation - USD Excess Return(6) | Fixed rate of 0.000% | 11/30/2017 | USD | 70,479,131 | — | — | — | (131,342) |
| Deutsche Bank | Total return on Deutsche Bank Equity Sector Neutral Value Factor Index - USD Excess Return(5) | Fixed rate of 0.000% | 11/30/2017 | USD | 12,225,370 | 3,966 | — | — | (171,178) |
| Deutsche Bank | Total return on Deutsche Bank Equity Sector Neutral Value Factor Index - USD Excess Return(5) | Fixed rate of 0.000% | 11/30/2017 | USD | 12,281,415 | 3,958 | — | — | (171,937) |
The accompanying Notes to Consolidated Financial Statements are an integral part of this statement.
| 14 | Columbia Alternative Beta Fund | Annual Report 2017 |
Consolidated Portfolio of Investments (continued)
May 31, 2017
| Total return swap contracts outstanding at May 31, 2017 (continued) |
| Counterparty | Fund receives | Fund pays | Expiration
date | Notional
currency | Notional
amount | Premium
paid
($) | Premium
received
($) | Unrealized
appreciation
($) | Unrealized
depreciation
($) |
| Deutsche Bank | Total return on Deutsche Bank Equity Risk-Adjusted Momentum Factor Index - USD Excess Return(7) | Fixed rate of 0.000% | 11/30/2017 | USD | 50,353,729 | 483 | — | — | (281,484) |
| Deutsche Bank | Total return on Deutsche Bank Equity Sector Neutral Value Factor Index - USD Excess Return(5) | Fixed rate of 0.000% | 11/30/2017 | USD | 86,227,716 | 330 | — | — | (1,179,708) |
| Goldman Sachs International | Total return on Goldman Sachs RP Equity World Long Short Series 37 Excess Return(5) | Fixed rate of 0.000% | 11/30/2017 | USD | 204,829,332 | — | — | 536,819 | — |
| Goldman Sachs International | Total return on Goldman Sachs RP Equity World Long Short Series 37 Excess Return(5) | Fixed rate of 0.000% | 11/30/2017 | USD | 39,057,155 | — | — | 431,091 | — |
| Goldman Sachs International | Total return on Goldman Sachs RP Equity World Long Short Series 37 Excess Return(5) | Fixed rate of 0.000% | 11/30/2017 | USD | 31,435,617 | — | — | 346,977 | — |
| Goldman Sachs International | Total return on Goldman Sachs FX Time Series Momentum Index C0038(8) | Fixed rate of 0.220% | 11/30/2017 | USD | 74,106,632 | — | — | 247,304 | — |
| Goldman Sachs International | Total return on Goldman Sachs Volatility Carry US Series 30 Excess Return Strategy(9) | Fixed rate of 0.300% | 11/30/2017 | USD | 30,307,087 | — | — | 213,845 | — |
| Goldman Sachs International | Total return on Goldman Sachs RP Equity World Long Short Series 37 Excess Return(5) | Fixed rate of 0.000% | 11/30/2017 | USD | 12,185,801 | — | — | 134,500 | — |
| Goldman Sachs International | Total return on Goldman Sachs RP Equity World Long Short Series 37 Excess Return(5) | Fixed rate of 0.000% | 11/30/2017 | USD | 9,550,588 | — | — | 105,414 | — |
| Goldman Sachs International | Total return on Goldman Sachs FX Time Series Momentum Index C0038(8) | Fixed rate of 0.220% | 11/30/2017 | USD | 26,925,921 | — | — | 101,836 | — |
The accompanying Notes to Consolidated Financial Statements are an integral part of this statement.
Columbia Alternative Beta Fund | Annual Report 2017
| 15 |
Consolidated Portfolio of Investments (continued)
May 31, 2017
| Total return swap contracts outstanding at May 31, 2017 (continued) |
| Counterparty | Fund receives | Fund pays | Expiration
date | Notional
currency | Notional
amount | Premium
paid
($) | Premium
received
($) | Unrealized
appreciation
($) | Unrealized
depreciation
($) |
| Goldman Sachs International | Total return on Goldman Sachs FX Time Series Momentum Index C0038(8) | Fixed rate of 0.220% | 11/30/2017 | USD | 29,027,780 | — | — | 96,870 | — |
| Goldman Sachs International | Total return on Goldman Sachs FX Time Series Momentum Index C0038(8) | Fixed rate of 0.220% | 11/30/2017 | USD | 20,408,745 | — | — | 77,191 | — |
| Goldman Sachs International | Total return on Goldman Sachs RP Equity World Long Short Series 37 Excess Return(5) | Fixed rate of 0.000% | 11/30/2017 | USD | 5,246,501 | — | — | 71,067 | — |
| Goldman Sachs International | Total return on Goldman Sachs RP Equity World Long Short Series 37 Excess Return(5) | Fixed rate of 0.000% | 11/30/2017 | USD | 6,121,956 | — | — | 67,571 | — |
| Goldman Sachs International | Total return on Goldman Sachs FX Time Series Momentum Index C0038(8) | Fixed rate of 0.220% | 11/30/2017 | USD | 16,211,008 | — | — | 61,312 | — |
| Goldman Sachs International | Total return on Goldman Sachs RP Equity World Long Short Series 37 Excess Return(5) | Fixed rate of 0.000% | 11/30/2017 | USD | 4,787,780 | — | — | 55,059 | — |
| Goldman Sachs International | Total return on Goldman Sachs FX EM & G10 3 Month Valuation Index C0114(8) | Fixed rate of 0.180% | 11/30/2017 | USD | 62,810,638 | — | — | 51,984 | — |
| Goldman Sachs International | Total return on Goldman Sachs Momentum Risk Premium Basket Index RP17(10) | Fixed rate of 0.310% | 11/30/2017 | USD | 24,454,495 | — | — | 48,224 | — |
| Goldman Sachs International | Total return on Goldman Sachs TY Volatility Carry X5 Index Class E(11) | Fixed rate of 0.230% | 11/30/2017 | USD | 8,209,429 | — | — | 37,591 | — |
| Goldman Sachs International | Total return on Goldman Sachs TY Volatility Carry X5 Index Class E(11) | Fixed rate of 0.230% | 11/30/2017 | USD | 7,558,756 | — | — | 34,609 | — |
The accompanying Notes to Consolidated Financial Statements are an integral part of this statement.
| 16 | Columbia Alternative Beta Fund | Annual Report 2017 |
Consolidated Portfolio of Investments (continued)
May 31, 2017
| Total return swap contracts outstanding at May 31, 2017 (continued) |
| Counterparty | Fund receives | Fund pays | Expiration
date | Notional
currency | Notional
amount | Premium
paid
($) | Premium
received
($) | Unrealized
appreciation
($) | Unrealized
depreciation
($) |
| Goldman Sachs International | Total return on Goldman Sachs RP Equity World Long Short Series 37 Excess Return(5) | Fixed rate of 0.000% | 11/30/2017 | USD | 3,004,797 | — | — | 29,961 | — |
| Goldman Sachs International | Total return on Goldman Sachs RP Equity World Long Short Series 37 Excess Return(5) | Fixed rate of 0.000% | 11/30/2017 | USD | 2,617,859 | — | — | 28,894 | — |
| Goldman Sachs International | Total return on Goldman Sachs FX Vol Carry Basket Index(12) | Fixed rate of 0.280% | 11/30/2017 | USD | 4,364,141 | — | — | 26,317 | — |
| Goldman Sachs International | Total return on Goldman Sachs Equity Volatility Carry Series 28 Excess Retrun Strategy(13) | Fixed rate of 0.300% | 11/30/2017 | USD | 6,319,012 | — | — | 25,932 | — |
| Goldman Sachs International | Total return on Goldman Sachs FX Time Series Momentum Index C0038(8) | Fixed rate of 0.220% | 11/30/2017 | USD | 6,603,446 | — | — | 24,975 | — |
| Goldman Sachs International | Total return on Goldman Sachs Volatility Carry US Series 30 Excess Return Strategy(9) | Fixed rate of 0.300% | 11/30/2017 | USD | 3,515,591 | — | — | 24,805 | — |
| Goldman Sachs International | Total return on Goldman Sachs Equity Volatility Carry Series 28 Excess Retrun Strategy(13) | Fixed rate of 0.300% | 11/30/2017 | USD | 5,754,655 | — | — | 23,616 | — |
| Goldman Sachs International | Total return on Goldman Sachs TY Volatility Carry X5 Index Class E(11) | Fixed rate of 0.230% | 11/30/2017 | USD | 5,016,898 | — | — | 22,971 | — |
| Goldman Sachs International | Total return on Goldman Sachs Volatility Carry US Series 30 Excess Return Strategy(9) | Fixed rate of 0.300% | 11/30/2017 | USD | 2,377,982 | — | — | 17,837 | — |
| Goldman Sachs International | Total return on Goldman Sachs FX Time Series Momentum Index C0038(8) | Fixed rate of 0.220% | 11/30/2017 | USD | 5,211,039 | — | — | 17,390 | — |
The accompanying Notes to Consolidated Financial Statements are an integral part of this statement.
Columbia Alternative Beta Fund | Annual Report 2017
| 17 |
Consolidated Portfolio of Investments (continued)
May 31, 2017
| Total return swap contracts outstanding at May 31, 2017 (continued) |
| Counterparty | Fund receives | Fund pays | Expiration
date | Notional
currency | Notional
amount | Premium
paid
($) | Premium
received
($) | Unrealized
appreciation
($) | Unrealized
depreciation
($) |
| Goldman Sachs International | Total return on Goldman Sachs Momentum Risk Premium Basket Index RP17(10) | Fixed rate of 0.310% | 11/30/2017 | USD | 8,760,602 | — | — | 17,276 | — |
| Goldman Sachs International | Total return on Goldman Sachs Rates and Bonds Time Series Momentum Index C0205(14) | Fixed rate of -0.180% | 11/30/2017 | USD | 24,363,156 | — | — | 14,940 | — |
| Goldman Sachs International | Total return on Goldman Sachs FX Time Series Momentum Index C0038(8) | Fixed rate of 0.220% | 11/30/2017 | USD | 3,895,961 | — | — | 14,735 | — |
| Goldman Sachs International | Total return on Goldman Sachs FX Vol Carry Basket Index(12) | Fixed rate of 0.280% | 11/30/2017 | USD | 2,434,343 | — | — | 14,680 | — |
| Goldman Sachs International | Total return on Goldman Sachs Curve Index C0210(14) | Fixed rate of -0.020% | 11/30/2017 | USD | 24,427,035 | — | — | 14,298 | — |
| Goldman Sachs International | Total return on Goldman Sachs FX Time Series Momentum Index C0038(8) | Fixed rate of 0.220% | 11/30/2017 | USD | 3,732,468 | — | — | 14,117 | — |
| Goldman Sachs International | Total return on Goldman Sachs Curve Index C0210(14) | Fixed rate of -0.020% | 11/30/2017 | USD | 21,157,163 | — | — | 12,387 | — |
| Goldman Sachs International | Total return on Goldman Sachs Rates and Bonds Time Series Momentum Index C0205(14) | Fixed rate of -0.180% | 11/30/2017 | USD | 20,149,498 | — | — | 12,353 | — |
| Goldman Sachs International | Total return on Goldman Sachs Rates and Bonds Time Series Momentum Index C0205(14) | Fixed rate of -0.180% | 11/30/2017 | USD | 19,639,480 | — | — | 12,040 | — |
| Goldman Sachs International | Total return on Goldman Sachs FX Time Series Momentum Index C0038(8) | Fixed rate of 0.220% | 11/30/2017 | USD | 3,498,716 | — | — | 11,676 | — |
The accompanying Notes to Consolidated Financial Statements are an integral part of this statement.
| 18 | Columbia Alternative Beta Fund | Annual Report 2017 |
Consolidated Portfolio of Investments (continued)
May 31, 2017
| Total return swap contracts outstanding at May 31, 2017 (continued) |
| Counterparty | Fund receives | Fund pays | Expiration
date | Notional
currency | Notional
amount | Premium
paid
($) | Premium
received
($) | Unrealized
appreciation
($) | Unrealized
depreciation
($) |
| Goldman Sachs International | Total return on Goldman Sachs FX Vol Carry Basket Index(12) | Fixed rate of 0.280% | 11/30/2017 | USD | 1,904,068 | — | — | 11,482 | — |
| Goldman Sachs International | Total return on Goldman Sachs TY Volatility Carry X5 Index Class E(11) | Fixed rate of 0.230% | 11/30/2017 | USD | 2,321,262 | — | — | 10,628 | — |
| Goldman Sachs International | Total return on Goldman Sachs FX Time Series Momentum Index C0038(8) | Fixed rate of 0.220% | 11/30/2017 | USD | 2,815,208 | — | — | 9,395 | — |
| Goldman Sachs International | Total return on Goldman Sachs Rates and Bonds Time Series Momentum Index C0205(14) | Fixed rate of -0.180% | 11/30/2017 | USD | 14,722,709 | — | — | 9,025 | — |
| Goldman Sachs International | Total return on Goldman Sachs Equity Volatility Carry Series 28 Excess Retrun Strategy(13) | Fixed rate of 0.300% | 11/30/2017 | USD | 1,943,362 | — | — | 7,975 | — |
| Goldman Sachs International | Total return on Goldman Sachs Equity Volatility Carry Series 28 Excess Retrun Strategy(13) | Fixed rate of 0.300% | 11/30/2017 | USD | 1,630,326 | — | — | 6,690 | — |
| Goldman Sachs International | Total return on Goldman Sachs Curve Index C0210(14) | Fixed rate of -0.020% | 11/30/2017 | USD | 4,247,129 | — | — | 5,406 | — |
| Goldman Sachs International | Total return on Goldman Sachs TY Volatility Carry X5 Index Class E(11) | Fixed rate of 0.230% | 11/30/2017 | USD | 23,795,973 | — | — | 4,719 | — |
| Goldman Sachs International | Total return on Goldman Sachs FX Time Series Momentum Index C0038(8) | Fixed rate of 0.220% | 11/30/2017 | USD | 3,476,517 | — | — | 4,459 | — |
| Goldman Sachs International | Total return on Goldman Sachs FX Vol Carry Basket Index(12) | Fixed rate of 0.280% | 11/30/2017 | USD | 8,104,265 | — | — | 4,087 | — |
| Goldman Sachs International | Total return on Goldman Sachs FX EM & G10 3 Month Valuation Index C0114(8) | Fixed rate of 0.180% | 11/30/2017 | USD | 4,168,147 | — | — | 3,450 | — |
The accompanying Notes to Consolidated Financial Statements are an integral part of this statement.
Columbia Alternative Beta Fund | Annual Report 2017
| 19 |
Consolidated Portfolio of Investments (continued)
May 31, 2017
| Total return swap contracts outstanding at May 31, 2017 (continued) |
| Counterparty | Fund receives | Fund pays | Expiration
date | Notional
currency | Notional
amount | Premium
paid
($) | Premium
received
($) | Unrealized
appreciation
($) | Unrealized
depreciation
($) |
| Goldman Sachs International | Total return on Goldman Sachs FX Vol Carry Basket Index(12) | Fixed rate of 0.280% | 11/30/2017 | USD | 6,785,809 | — | — | 3,422 | — |
| Goldman Sachs International | Total return on Goldman Sachs Momentum Risk Premium Basket Index RP17(10) | Fixed rate of 0.310% | 11/30/2017 | USD | 1,702,695 | — | — | 3,358 | — |
| Goldman Sachs International | Total return on Goldman Sachs FX EM & G10 3 Month Valuation Index C0114(8) | Fixed rate of 0.180% | 11/30/2017 | USD | 3,494,629 | — | — | 2,892 | — |
| Goldman Sachs International | Total return on Goldman Sachs Curve Index C0210(14) | Fixed rate of -0.020% | 11/30/2017 | USD | 4,715,783 | — | — | 2,762 | — |
| Goldman Sachs International | Total return on Goldman Sachs Rates and Bonds Time Series Momentum Index C0205(14) | Fixed rate of -0.180% | 11/30/2017 | USD | 2,903,252 | — | — | 2,748 | — |
| Goldman Sachs International | Total return on Goldman Sachs FX Time Series Momentum Index C0038(8) | Fixed rate of 0.220% | 11/30/2017 | USD | 3,510,663 | — | — | 2,534 | — |
| Goldman Sachs International | Total return on Goldman Sachs Rates and Bonds Time Series Momentum Index C0205(14) | Fixed rate of -0.180% | 11/30/2017 | USD | 4,044,624 | — | — | 2,480 | — |
| Goldman Sachs International | Total return on Goldman Sachs Rates and Bonds Time Series Momentum Index C0205(14) | Fixed rate of -0.180% | 11/30/2017 | USD | 3,989,085 | — | — | 2,446 | — |
| Goldman Sachs International | Total return on Goldman Sachs Rates and Bonds Time Series Momentum Index C0205(14) | Fixed rate of -0.180% | 11/30/2017 | USD | 3,950,176 | — | — | 2,422 | — |
| Goldman Sachs International | Total return on Goldman Sachs TY Volatility Carry X5 Index Class E(11) | Fixed rate of 0.210% | 11/30/2017 | USD | 1,296,243 | — | — | 2,413 | — |
The accompanying Notes to Consolidated Financial Statements are an integral part of this statement.
| 20 | Columbia Alternative Beta Fund | Annual Report 2017 |
Consolidated Portfolio of Investments (continued)
May 31, 2017
| Total return swap contracts outstanding at May 31, 2017 (continued) |
| Counterparty | Fund receives | Fund pays | Expiration
date | Notional
currency | Notional
amount | Premium
paid
($) | Premium
received
($) | Unrealized
appreciation
($) | Unrealized
depreciation
($) |
| Goldman Sachs International | Total return on Goldman Sachs FX EM & G10 3 Month Valuation Index C0114(8) | Fixed rate of 0.180% | 11/30/2017 | USD | 2,777,747 | — | — | 2,299 | — |
| Goldman Sachs International | Total return on Goldman Sachs Curve Index C0210(14) | Fixed rate of -0.020% | 11/30/2017 | USD | 3,535,719 | — | — | 2,070 | — |
| Goldman Sachs International | Total return on Goldman Sachs Rates and Bonds Time Series Momentum Index C0205(14) | Fixed rate of -0.180% | 11/30/2017 | USD | 2,966,466 | — | — | 1,819 | — |
| Goldman Sachs International | Total return on Goldman Sachs Curve Index C0210(14) | Fixed rate of -0.020% | 11/30/2017 | USD | 2,397,394 | — | — | 1,403 | — |
| Goldman Sachs International | Total return on Goldman Sachs FX EM & G10 3 Month Valuation Index C0114(8) | Fixed rate of 0.180% | 11/30/2017 | USD | 1,632,415 | — | — | 1,351 | — |
| Goldman Sachs International | Total return on Goldman Sachs FX EM & G10 3 Month Valuation Index C0114(8) | Fixed rate of 0.180% | 11/30/2017 | USD | 1,540,495 | — | — | 1,275 | — |
| Goldman Sachs International | Total return on Goldman Sachs FX Time Series Momentum Index C0038(8) | Fixed rate of 0.220% | 11/30/2017 | USD | 300,891 | — | — | 1,138 | — |
| Goldman Sachs International | Total return on Goldman Sachs Curve Index C0210(14) | Fixed rate of -0.020% | 11/30/2017 | USD | 1,601,818 | — | — | 938 | — |
| Goldman Sachs International | Total return on Goldman Sachs FX Time Series Momentum Index C0038(8) | Fixed rate of 0.220% | 11/30/2017 | USD | 1,300,944 | — | — | 665 | — |
| Goldman Sachs International | Total return on Goldman Sachs Rates and Bonds Time Series Momentum Index C0205(14) | Fixed rate of -0.180% | 11/30/2017 | USD | 1,900,441 | — | — | 639 | — |
The accompanying Notes to Consolidated Financial Statements are an integral part of this statement.
Columbia Alternative Beta Fund | Annual Report 2017
| 21 |
Consolidated Portfolio of Investments (continued)
May 31, 2017
| Total return swap contracts outstanding at May 31, 2017 (continued) |
| Counterparty | Fund receives | Fund pays | Expiration
date | Notional
currency | Notional
amount | Premium
paid
($) | Premium
received
($) | Unrealized
appreciation
($) | Unrealized
depreciation
($) |
| Goldman Sachs International | Total return on Goldman Sachs Rates and Bonds Time Series Momentum Index C0205(14) | Fixed rate of -0.180% | 11/30/2017 | USD | 2,279,670 | — | — | — | (879) |
| Goldman Sachs International | Total return on Goldman Sachs FX EM & G10 3 Month Valuation Index C0114(8) | Fixed rate of 0.180% | 11/30/2017 | USD | 3,791,106 | — | — | — | (1,759) |
| Goldman Sachs International | Total return on Goldman Sachs FX EM & G10 3 Month Carry Index C0115(8) | Fixed rate of 0.260% | 11/30/2017 | USD | 1,424,995 | — | — | — | (2,432) |
| Goldman Sachs International | Total return on Goldman Sachs Commodity Volatility Carry Series 18 Excess Return Strategy(15) | Fixed rate of 0.350% | 11/30/2017 | USD | 1,882,692 | — | — | — | (4,261) |
| Goldman Sachs International | Total return on Goldman Sachs FX EM & G10 3 Month Valuation Index C0114(8) | Fixed rate of 0.180% | 11/30/2017 | USD | 1,920,558 | — | — | — | (5,429) |
| Goldman Sachs International | Total return on Goldman Sachs FX EM & G10 3 Month Valuation Index C0114(8) | Fixed rate of 0.180% | 11/30/2017 | USD | 2,325,539 | — | — | — | (6,574) |
| Goldman Sachs International | Total return on Goldman Sachs Commodity Volatility Carry Series 18 Excess Return Strategy(15) | Fixed rate of 0.350% | 11/30/2017 | USD | 1,202,385 | — | — | — | (9,179) |
| Goldman Sachs International | Total return on Goldman Sachs Curve Index RP09(3) | Fixed rate of 0.110% | 11/30/2017 | USD | 1,506,831 | — | — | — | (9,225) |
| Goldman Sachs International | Total return on Goldman Sachs Commodity Volatility Carry Series 18 Excess Return Strategy(15) | Fixed rate of 0.350% | 11/30/2017 | USD | 1,345,187 | — | — | — | (11,101) |
| Goldman Sachs International | Total return on Goldman Sachs FX EM & G10 3 Month Valuation Index C0114(8) | Fixed rate of 0.180% | 11/30/2017 | USD | 4,056,401 | — | — | — | (11,466) |
The accompanying Notes to Consolidated Financial Statements are an integral part of this statement.
| 22 | Columbia Alternative Beta Fund | Annual Report 2017 |
Consolidated Portfolio of Investments (continued)
May 31, 2017
| Total return swap contracts outstanding at May 31, 2017 (continued) |
| Counterparty | Fund receives | Fund pays | Expiration
date | Notional
currency | Notional
amount | Premium
paid
($) | Premium
received
($) | Unrealized
appreciation
($) | Unrealized
depreciation
($) |
| Goldman Sachs International | Total return on Goldman Sachs Curve Index RP09(3) | Fixed rate of 0.110% | 11/30/2017 | USD | 2,307,113 | — | — | — | (14,125) |
| Goldman Sachs International | Total return on Goldman Sachs Rates and Bonds Time Series Momentum Index C0205(14) | Fixed rate of -0.180% | 11/30/2017 | USD | 42,745,914 | — | — | — | (16,491) |
| Goldman Sachs International | Total return on Goldman Sachs Commodity Volatility Carry Series 18 Excess Return Strategy(15) | Fixed rate of 0.350% | 11/30/2017 | USD | 8,314,123 | — | — | — | (18,816) |
| Goldman Sachs International | Total return on Goldman Sachs Curve Index RP09(3) | Fixed rate of 0.110% | 11/30/2017 | USD | 4,089,609 | — | — | — | (18,827) |
| Goldman Sachs International | Total return on Goldman Sachs FX EM & G10 3 Month Carry Index C0115(8) | Fixed rate of 0.260% | 11/30/2017 | USD | 1,687,864 | — | — | — | (20,044) |
| Goldman Sachs International | Total return on Goldman Sachs Curve Index RP09(3) | Fixed rate of 0.110% | 11/30/2017 | USD | 3,478,915 | — | — | — | (21,299) |
| Goldman Sachs International | Total return on Goldman Sachs Commodity Volatility Carry Series 18 Excess Return Strategy(15) | Fixed rate of 0.350% | 11/30/2017 | USD | 9,811,004 | — | — | — | (22,203) |
| Goldman Sachs International | Total return on Goldman Sachs Curve Index C0210(14) | Fixed rate of -0.020% | 11/30/2017 | USD | 145,503,569 | — | — | — | (24,177) |
| Goldman Sachs International | Total return on Goldman Sachs Commodity Volatility Carry Series 18 Excess Return Strategy(15) | Fixed rate of 0.350% | 11/30/2017 | USD | 2,931,769 | — | — | — | (24,194) |
| Goldman Sachs International | Total return on Goldman Sachs Curve Index RP09(3) | Fixed rate of 0.110% | 11/30/2017 | USD | 4,008,940 | — | — | — | (24,544) |
| Goldman Sachs International | Total return on Goldman Sachs FX EM & G10 3 Month Carry Index C0115(8) | Fixed rate of 0.260% | 11/30/2017 | USD | 14,949,720 | — | — | — | (25,512) |
The accompanying Notes to Consolidated Financial Statements are an integral part of this statement.
Columbia Alternative Beta Fund | Annual Report 2017
| 23 |
Consolidated Portfolio of Investments (continued)
May 31, 2017
| Total return swap contracts outstanding at May 31, 2017 (continued) |
| Counterparty | Fund receives | Fund pays | Expiration
date | Notional
currency | Notional
amount | Premium
paid
($) | Premium
received
($) | Unrealized
appreciation
($) | Unrealized
depreciation
($) |
| Goldman Sachs International | Total return on Goldman Sachs FX EM & G10 3 Month Valuation Index C0114(8) | Fixed rate of 0.180% | 11/30/2017 | USD | 10,703,423 | — | — | — | (30,253) |
| Goldman Sachs International | Total return on Goldman Sachs Commodity Volatility Carry Series 18 Excess Return Strategy(15) | Fixed rate of 0.350% | 11/30/2017 | USD | 4,046,047 | — | — | — | (33,390) |
| Goldman Sachs International | Total return on Goldman Sachs FX EM & G10 3 Month Valuation Index C0114(8) | Fixed rate of 0.180% | 11/30/2017 | USD | 12,817,815 | — | — | — | (36,232) |
| Goldman Sachs International | Total return on Goldman Sachs FX EM & G10 3 Month Carry Index C0115(8) | Fixed rate of 0.260% | 11/30/2017 | USD | 2,801,632 | — | — | — | (40,652) |
| Goldman Sachs International | Total return on Goldman Sachs FX EM & G10 3 Month Carry Index C0115(8) | Fixed rate of 0.260% | 11/30/2017 | USD | 17,098,426 | — | — | — | (47,488) |
| Goldman Sachs International | Total return on Goldman Sachs FX EM & G10 3 Month Valuation Index C0114(8) | Fixed rate of 0.180% | 11/30/2017 | USD | 17,491,724 | — | — | — | (49,443) |
| Goldman Sachs International | Total return on Goldman Sachs FX EM & G10 3 Month Carry Index C0115(8) | Fixed rate of 0.260% | 11/30/2017 | USD | 3,423,493 | — | — | — | (49,675) |
| Goldman Sachs International | Total return on Goldman Sachs FX EM & G10 3 Month Carry Index C0115(8) | Fixed rate of 0.260% | 11/30/2017 | USD | 3,609,864 | — | — | — | (62,204) |
| Goldman Sachs International | Total return on Goldman Sachs FX EM & G10 3 Month Carry Index C0115(8) | Fixed rate of 0.260% | 11/30/2017 | USD | 42,483,532 | — | — | — | (72,500) |
| Goldman Sachs International | Total return on Goldman Sachs Curve Index RP09(3) | Fixed rate of 0.110% | 11/30/2017 | USD | 20,822,629 | — | — | — | (127,477) |
| Goldman Sachs International | Total return on Goldman Sachs Curve Index RP09(3) | Fixed rate of 0.110% | 11/30/2017 | USD | 24,946,062 | — | — | — | (152,726) |
| Goldman Sachs International | Total return on Goldman Sachs FX EM & G10 3 Month Carry Index C0115(8) | Fixed rate of 0.260% | 11/30/2017 | USD | 10,592,670 | — | — | — | (153,700) |
The accompanying Notes to Consolidated Financial Statements are an integral part of this statement.
| 24 | Columbia Alternative Beta Fund | Annual Report 2017 |
Consolidated Portfolio of Investments (continued)
May 31, 2017
| Total return swap contracts outstanding at May 31, 2017 (continued) |
| Counterparty | Fund receives | Fund pays | Expiration
date | Notional
currency | Notional
amount | Premium
paid
($) | Premium
received
($) | Unrealized
appreciation
($) | Unrealized
depreciation
($) |
| Goldman Sachs International | Total return on Goldman Sachs FX EM & G10 3 Month Carry Index C0115(8) | Fixed rate of 0.260% | 11/30/2017 | USD | 11,755,473 | — | — | — | (170,574) |
| Goldman Sachs International | Total return on Goldman Sachs Curve Index RP09(3) | Fixed rate of 0.110% | 11/30/2017 | USD | 145,413,167 | — | — | — | (179,873) |
| Goldman Sachs International | Total return on Goldman Sachs FX EM & G10 3 Month Carry Index C0115(8) | Fixed rate of 0.260% | 11/30/2017 | USD | 14,616,090 | �� | — | — | (212,082) |
| JPMorgan | Total return on J.P. Morgan Equity Risk Premium Global Multi-Factor (Long/Short) USD Index, Series 1(5) | Fixed rate of 0.000% | 11/30/2017 | USD | 60,795,711 | — | — | 627,561 | — |
| JPMorgan | Total return on J.P. Morgan Equity Risk Premium Global Multi-Factor (Long/Short) USD Index, Series 1(5) | Fixed rate of -0.100% | 11/30/2017 | USD | 18,368,065 | — | — | 191,185 | — |
| JPMorgan | Total return on J.P. Morgan Equity Risk Premium Global Multi-Factor (Long/Short) USD Index, Series 1(5) | Fixed rate of -0.100% | 11/30/2017 | USD | 11,937,230 | — | — | 124,216 | — |
| JPMorgan | Total return on J.P. Morgan Equity Risk Premium Global Multi-Factor (Long/Short) USD Index, Series 1(5) | Fixed rate of 0.000% | 11/30/2017 | USD | 6,554,999 | — | — | 67,664 | — |
| JPMorgan | Total return on J.P. Morgan Equity Risk Premium Global Multi-Factor (Long/Short) USD Index, Series 1(5) | Fixed rate of 0.000% | 11/30/2017 | USD | 5,877,617 | — | — | 60,671 | — |
| JPMorgan | Total return on J.P. Morgan Equity Risk Premium Global Multi-Factor (Long/Short) USD Index, Series 1(5) | Fixed rate of 0.000% | 11/30/2017 | USD | 4,972,909 | — | — | 51,333 | — |
The accompanying Notes to Consolidated Financial Statements are an integral part of this statement.
Columbia Alternative Beta Fund | Annual Report 2017
| 25 |
Consolidated Portfolio of Investments (continued)
May 31, 2017
| Total return swap contracts outstanding at May 31, 2017 (continued) |
| Counterparty | Fund receives | Fund pays | Expiration
date | Notional
currency | Notional
amount | Premium
paid
($) | Premium
received
($) | Unrealized
appreciation
($) | Unrealized
depreciation
($) |
| JPMorgan | Total return on J.P. Morgan Equity Risk Premium Global Multi-Factor (Long/Short) USD Index, Series 1(5) | Fixed rate of -0.100% | 11/30/2017 | USD | 2,897,617 | — | — | 32,761 | — |
| JPMorgan | Total return on J.P. Morgan Equity Risk Premium Global Multi-Factor (Long/Short) USD Index, Series 1(5) | Fixed rate of -0.100% | 11/30/2017 | USD | 2,430,736 | — | — | 30,650 | — |
| JPMorgan | Total return on J.P. Morgan Equity Risk Premium Global Multi-Factor (Long/Short) USD Index, Series 1(5) | Fixed rate of 0.000% | 11/30/2017 | USD | 2,304,702 | — | — | 23,790 | — |
| JPMorgan | Total return on J.P. Morgan Equity Risk Premium Global Multi-Factor (Long/Short) USD Index, Series 1(5) | Fixed rate of 0.000% | 11/30/2017 | USD | 2,101,117 | — | — | 21,689 | — |
| Morgan Stanley | Total return on Morgan Stanley Cube Global Momentum Index(5) | Fixed rate of -0.200% | 11/30/2017 | USD | 20,809,200 | — | — | 574,006 | — |
| Morgan Stanley | Total return on Morgan Stanley VolNet PremiumPlus2 Index(16) | Fixed rate of 0.800% | 11/30/2017 | USD | 28,115,149 | — | — | 376,258 | — |
| Morgan Stanley | Total return on Morgan Stanley Cube Global Momentum Index(5) | Fixed rate of -0.200% | 11/30/2017 | USD | 10,606,223 | — | — | 292,565 | — |
| Morgan Stanley | Total return on Morgan Stanley Cube Equity Factors Risk Parity Global Index(5) | Fixed rate of -0.150% | 11/30/2017 | USD | 63,035,721 | — | — | 243,111 | — |
| Morgan Stanley | Total return on Morgan Stanley Cube Global Quality Index(5) | Fixed rate of -0.200% | 11/30/2017 | USD | 21,204,861 | — | — | 242,550 | — |
| Morgan Stanley | Total return on Morgan Stanley Cube Equity Factors Risk Parity Global Index(5) | Fixed rate of -0.150% | 11/30/2017 | USD | 50,323,993 | — | — | 194,085 | — |
| Morgan Stanley | Total return on Morgan Stanley Cube Equity Factors Risk Parity Global Index(5) | Fixed rate of -0.150% | 11/30/2017 | USD | 47,616,982 | — | — | 183,645 | — |
The accompanying Notes to Consolidated Financial Statements are an integral part of this statement.
| 26 | Columbia Alternative Beta Fund | Annual Report 2017 |
Consolidated Portfolio of Investments (continued)
May 31, 2017
| Total return swap contracts outstanding at May 31, 2017 (continued) |
| Counterparty | Fund receives | Fund pays | Expiration
date | Notional
currency | Notional
amount | Premium
paid
($) | Premium
received
($) | Unrealized
appreciation
($) | Unrealized
depreciation
($) |
| Morgan Stanley | Total return on Morgan Stanley Cube Global Momentum Index(5) | Fixed rate of -0.200% | 11/30/2017 | USD | 3,848,827 | — | — | 106,167 | — |
| Morgan Stanley | Total return on Morgan Stanley Cube Equity Factors Risk Parity Global Index(5) | Fixed rate of -0.150% | 11/30/2017 | USD | 20,148,956 | — | — | 77,709 | — |
| Morgan Stanley | Total return on Morgan Stanley Cube Global Quality Index(5) | Fixed rate of -0.200% | 11/30/2017 | USD | 5,400,828 | — | — | 61,777 | — |
| Morgan Stanley | Total return on Morgan Stanley Cube Global Quality Index(5) | Fixed rate of -0.200% | 11/30/2017 | USD | 3,222,441 | — | — | 36,860 | — |
| Morgan Stanley | Total return on Morgan Stanley Cube Global Momentum Index(5) | Fixed rate of -0.200% | 11/30/2017 | USD | 1,199,040 | — | — | 32,352 | — |
| Morgan Stanley | Total return on Morgan Stanley Cube Global Momentum Index(5) | Fixed rate of -0.200% | 11/30/2017 | USD | 1,111,687 | — | — | 30,665 | — |
| Morgan Stanley | Total return on Morgan Stanley Cube Equity Factors Risk Parity Global Index(5) | Fixed rate of -0.150% | 11/30/2017 | USD | 5,954,528 | — | — | 22,965 | — |
| Morgan Stanley | Total return on Morgan Stanley Cube Global Volatility Index(5) | Fixed rate of -0.200% | 11/30/2017 | USD | 27,585,933 | — | — | 19,413 | — |
| Morgan Stanley | Total return on Morgan Stanley Cube Equity Factors Risk Parity Global Index(5) | Fixed rate of -0.150% | 11/30/2017 | USD | 3,910,901 | — | — | 15,083 | — |
| Morgan Stanley | Total return on Morgan Stanley Cube Global Quality Index(5) | Fixed rate of -0.200% | 11/30/2017 | USD | 1,294,900 | — | — | 14,812 | — |
| Morgan Stanley | Total return on Morgan Stanley Cube Global Volatility Index(5) | Fixed rate of -0.200% | 11/30/2017 | USD | 19,542,760 | — | — | 13,753 | — |
| Morgan Stanley | Total return on Morgan Stanley Cube Equity Factors Risk Parity Global Index(5) | Fixed rate of -0.150% | 11/30/2017 | USD | 3,111,298 | — | — | 11,999 | — |
The accompanying Notes to Consolidated Financial Statements are an integral part of this statement.
Columbia Alternative Beta Fund | Annual Report 2017
| 27 |
Consolidated Portfolio of Investments (continued)
May 31, 2017
| Total return swap contracts outstanding at May 31, 2017 (continued) |
| Counterparty | Fund receives | Fund pays | Expiration
date | Notional
currency | Notional
amount | Premium
paid
($) | Premium
received
($) | Unrealized
appreciation
($) | Unrealized
depreciation
($) |
| Morgan Stanley | Total return on Morgan Stanley Cube Equity Factors Risk Parity Global Index(5) | Fixed rate of -0.150% | 11/30/2017 | USD | 2,263,063 | — | — | 8,728 | — |
| Morgan Stanley | Total return on Morgan Stanley Cube Equity Factors Risk Parity Global Index(5) | Fixed rate of -0.150% | 11/30/2017 | USD | 2,301,396 | — | — | 7,568 | — |
| Morgan Stanley | Total return on Morgan Stanley Cube Global Volatility Index(5) | Fixed rate of -0.200% | 11/30/2017 | USD | 6,369,010 | — | — | 4,482 | — |
| Morgan Stanley | Total return on Morgan Stanley Cube Global Volatility Index(5) | Fixed rate of -0.200% | 11/30/2017 | USD | 5,231,139 | — | — | 3,681 | — |
| Morgan Stanley | Total return on Morgan Stanley Cube Global Quality Index(5) | Fixed rate of -0.200% | 11/30/2017 | USD | 1,009,729 | — | — | 1,507 | — |
| Morgan Stanley | Total return on Morgan Stanley Cube Global Volatility Index(5) | Fixed rate of -0.200% | 11/30/2017 | USD | 2,005,290 | — | — | 1,411 | — |
| Morgan Stanley | Total return on Morgan Stanley Cube Global Volatility Index(5) | Fixed rate of -0.200% | 11/30/2017 | USD | 1,504,838 | — | — | 1,058 | — |
| Morgan Stanley | Total return on Morgan Stanley Cube Equity Factors Risk Parity Global Index(5) | Fixed rate of -0.150% | 11/30/2017 | USD | 2,806,180 | — | — | 357 | — |
| Morgan Stanley | Total return on Morgan Stanley Cube Global Volatility Index(5) | Fixed rate of -0.200% | 11/30/2017 | USD | 1,004,549 | — | — | — | (205) |
| Morgan Stanley | Total return on Morgan Stanley Cube Global Value Index(5) | Fixed rate of -0.200% | 11/30/2017 | USD | 1,298,967 | — | — | — | (7,537) |
| Morgan Stanley | Total return on Morgan Stanley Cube Global Volatility Index(5) | Fixed rate of -0.200% | 11/30/2017 | USD | 1,661,141 | — | — | — | (9,162) |
| Morgan Stanley | Total return on Morgan Stanley Cube Global Value Index(5) | Fixed rate of -0.200% | 11/30/2017 | USD | 1,305,127 | — | — | — | (14,319) |
| Morgan Stanley | Total return on Morgan Stanley Cube Global Value Index(5) | Fixed rate of -0.200% | 11/30/2017 | USD | 1,485,534 | — | — | — | (16,298) |
The accompanying Notes to Consolidated Financial Statements are an integral part of this statement.
| 28 | Columbia Alternative Beta Fund | Annual Report 2017 |
Consolidated Portfolio of Investments (continued)
May 31, 2017
| Total return swap contracts outstanding at May 31, 2017 (continued) |
| Counterparty | Fund receives | Fund pays | Expiration
date | Notional
currency | Notional
amount | Premium
paid
($) | Premium
received
($) | Unrealized
appreciation
($) | Unrealized
depreciation
($) |
| Morgan Stanley | Total return on Morgan Stanley Cube Global Value Index(5) | Fixed rate of -0.200% | 11/30/2017 | USD | 2,067,913 | — | — | — | (22,687) |
| Morgan Stanley | Total return on Morgan Stanley Cube Global Value Index(5) | Fixed rate of -0.200% | 11/30/2017 | USD | 3,996,866 | — | — | — | (39,935) |
| Morgan Stanley | Total return on Morgan Stanley Cube Global Value Index(5) | Fixed rate of -0.200% | 11/30/2017 | USD | 6,298,655 | — | — | — | (69,103) |
| Morgan Stanley | Total return on Morgan Stanley Cube Global Value Index(5) | Fixed rate of -0.200% | 11/30/2017 | USD | 7,067,134 | — | — | — | (77,534) |
| Morgan Stanley | Total return on Morgan Stanley Cube Global Value Index(5) | Fixed rate of -0.200% | 11/30/2017 | USD | 41,234,501 | — | — | — | (452,384) |
| Total | | | | | | 170,091 | — | 8,116,585 | (6,726,794) |
| (1) | Underlying assets of this index include interest rate swaps of 2 year and 10 year durations and a short domestic future. |
| (2) | Underlying assets of this index include credit default swaps on high yield, investment grade, and foreign indices. |
| (3) | Underlying assets of this index include long/short domestic commodity futures. |
| (4) | Underlying assets of this index include long/short foreign and domestic commodity futures. |
| (5) | Underlying assets of this index include long/short foreign and domestic equities. |
| (6) | Underlying assets of this index include long/short foreign currencies. |
| (7) | Underlying assets of this index include long/short puts and calls on a domestic index. |
| (8) | Underlying assets of this index include forward foreign currency exchange contracts. |
| (9) | Underlying assets of this index include long/short puts and calls on a domestic index. |
| (10) | Underlying assets of this index include long/short foreign and domestic commodity futures. |
| (11) | Underlying assets of this index include long futures on treasuries and short options on treasuries. |
| (12) | Underlying assets of this index include short foreign currency options and long/short currency futures. |
| (13) | Underlying assets of this index include options on foreign and domestic indices and an exchange traded fund. |
| (14) | Underlying assets of this index include foreign and domestic bond futures. |
| (15) | Underlying assets of this index include short commodity futures, short options on commodity futures and long/short options on an exchange traded fund. |
| (16) | Underlying assets of this index include a short cap variance swap. |
The accompanying Notes to Consolidated Financial Statements are an integral part of this statement.
Columbia Alternative Beta Fund | Annual Report 2017
| 29 |
Consolidated Portfolio of Investments (continued)
May 31, 2017
Notes to Consolidated Portfolio of Investments
| (a) | The rate shown is the seven-day current annualized yield at May 31, 2017. |
| (b) | As defined in the Investment Company Act of 1940, an affiliated company is one in which the Fund owns 5% or more of the company’s outstanding voting securities, or a company which is under common ownership or control with the Fund. Holdings and transactions in these affiliated companies during the year ended May 31, 2017 are as follows: |
| Issuer | Beginning
shares | Shares
purchased | Shares
sold | Ending
shares | Capital gain
distributions ($) | Realized gain
(loss) ($) | Dividends —
affiliated
issuers ($) | Value ($) |
| Columbia Commodity Strategy Fund, Class I Shares | 991,950 | 431,217 | (1,423,167) | — | — | (187,181) | — | — |
| Columbia Real Estate Equity Fund, Class I Shares | 83,504 | 92,930 | (176,434) | — | 12,989 | (16,744) | 23,823 | — |
| Columbia Short-Term Cash Fund, 0.916% | 93,039,309 | 697,507,231 | (251,899,164) | 538,647,376 | — | (49) | 1,869,514 | 538,647,376 |
| Total | 94,114,763 | 698,031,378 | (253,498,765) | 538,647,376 | 12,989 | (203,974) | 1,893,337 | 538,648,376 |
Currency Legend
| AUD | Australian Dollar |
| CAD | Canada Dollar |
| EUR | Euro |
| JPY | Japanese Yen |
| USD | US Dollar |
Fair value measurements
The Fund categorizes its fair value measurements according to a three-level hierarchy that maximizes the use of observable inputs and minimizes the use of unobservable inputs by prioritizing that the most observable input be used when available. Observable inputs are those that market participants would use in pricing an investment based on market data obtained from sources independent of the reporting entity. Unobservable inputs are those that reflect the Fund’s assumptions about the information market participants would use in pricing an investment. An investment’s level within the fair value hierarchy is based on the lowest level of any input that is deemed significant to the asset’s or liability’s fair value measurement. The input levels are not necessarily an indication of the risk or liquidity associated with investments at that level. For example, certain U.S. government securities are generally high quality and liquid, however, they are reflected as Level 2 because the inputs used to determine fair value may not always be quoted prices in an active market.
Fair value inputs are summarized in the three broad levels listed below:
| • | Level 1 – Valuations based on quoted prices for investments in active markets that the Fund has the ability to access at the measurement date (including NAV for open-end mutual funds). Valuation adjustments are not applied to Level 1 investments. |
| • | Level 2 – Valuations based on other significant observable inputs (including quoted prices for similar securities, interest rates, prepayment speeds, credit risks, etc.). |
| • | Level 3 – Valuations based on significant unobservable inputs (including the Fund’s own assumptions and judgment in determining the fair value of investments). |
Inputs that are used in determining fair value of an investment may include price information, credit data, volatility statistics, and other factors. These inputs can be either observable or unobservable. The availability of observable inputs can vary between investments, and is affected by various factors such as the type of investment, and the volume and level of activity for that investment or similar investments in the marketplace. The inputs will be considered by the Investment Manager, along with any other relevant factors in the calculation of an investment’s fair value. The Fund uses prices and inputs that are current as of the measurement date, which may include periods of market dislocations. During these periods, the availability of prices and inputs may be reduced for many investments. This condition could cause an investment to be reclassified between the various levels within the hierarchy.
Certain investments that have been measured at fair value using the net asset value (NAV) per share (or its equivalent) are not categorized in the fair value hierarchy. The fair value amounts presented in the table are intended to reconcile the fair value hierarchy to the amounts presented in the Consolidated Portfolio of Investments. The Columbia Short-Term Cash Fund seeks to provide shareholders with maximum current income consistent with liquidity and stability of principal. Columbia Short-Term Cash Fund prices its shares with a floating NAV and no longer seeks to maintain a stable NAV.
Investments falling into the Level 3 category are primarily supported by quoted prices from brokers and dealers participating in the market for those investments. However, these may be classified as Level 3 investments due to lack of market transparency and corroboration to support these quoted prices. Additionally, valuation models may be used as the pricing source for any remaining investments classified as Level 3. These models may rely on one or more significant unobservable inputs and/or significant assumptions by the Investment Manager. Inputs used in valuations may include, but are not limited to, financial statement analysis, capital account balances, discount rates and estimated cash flows, and comparable company data.
Under the direction of the Fund’s Board of Trustees (the Board), the Investment Manager’s Valuation Committee (the Committee) is responsible for overseeing the valuation procedures approved by the Board. The Committee consists of voting and non-voting members from various groups within the Investment Manager’s organization, including operations and accounting, trading and investments, compliance, risk management and legal.
The Committee meets at least monthly to review and approve valuation matters, which may include a description of specific valuation determinations, data regarding pricing information received from approved pricing vendors and brokers and the results of Board-approved valuation control policies and procedures (the Policies). The Policies address, among other things, instances when market quotations are or are not readily available, including recommendations of third party pricing vendors and a determination of appropriate pricing
The accompanying Notes to Consolidated Financial Statements are an integral part of this statement.
| 30 | Columbia Alternative Beta Fund | Annual Report 2017 |
Consolidated Portfolio of Investments (continued)
May 31, 2017
Fair value measurements (continued)
methodologies; events that require specific valuation determinations and assessment of fair value techniques; securities with a potential for stale pricing, including those that are illiquid, restricted, or in default; and the effectiveness of third party pricing vendors, including periodic reviews of vendors. The Committee meets more frequently, as needed, to discuss additional valuation matters, which may include the need to review back-testing results, review time-sensitive information or approve related valuation actions. The Committee reports to the Board, with members of the Committee meeting with the Board at each of its regularly scheduled meetings to discuss valuation matters and actions during the period, similar to those described earlier.
For investments categorized as Level 3, the Committee monitors information similar to that described above, which may include: (i) data specific to the issuer or comparable issuers, (ii) general market or specific sector news and (iii) quoted prices and specific or similar security transactions. The Committee considers this data and any changes from prior periods in order to assess the reasonableness of observable and unobservable inputs, any assumptions or internal models used to value those securities and changes in fair value. This data is also used to corroborate, when available, information received from approved pricing vendors and brokers. Various factors impact the frequency of monitoring this information (which may occur as often as daily). However, the Committee may determine that changes to inputs, assumptions and models are not required as a result of the monitoring procedures performed.
The following table is a summary of the inputs used to value the Fund’s investments at May 31, 2017:
| | Level 1
quoted prices
in active
markets for
identical
assets ($) | Level 2
other
significant
observable
inputs ($) | Level 3
significant
unobservable
inputs ($) | Investments
measured at
net asset
value ($) | Total ($) |
| Investments | | | | | |
| Money Market Funds | — | — | — | 538,647,376 | 538,647,376 |
| Total Investments | — | — | — | 538,647,376 | 538,647,376 |
| Derivatives | | | | | |
| Asset | | | | | |
| Swap Contracts | — | — | 8,116,585 | — | 8,116,585 |
| Liability | | | | | |
| Forward Foreign Currency Exchange Contracts | — | (915,456) | — | — | (915,456) |
| Futures Contracts | (285,198) | — | — | — | (285,198) |
| Swap Contracts | — | — | (6,726,794) | — | (6,726,794) |
| Total | (285,198) | (915,456) | 1,389,791 | 538,647,376 | 538,836,513 |
See the Consolidated Portfolio of Investments for all investment classifications not indicated in the table.
Derivative instruments are valued at unrealized appreciation (depreciation).
There were no transfers of financial assets between levels during the period.
The Fund does not hold any significant investments (greater than one percent of net assets) categorized as Level 3.
The Fund’s assets assigned to the Level 3 category are valued utilizing the valuation technique deemed the most appropriate in the circumstances. Certain swap contracts classified as Level 3 securities are valued using the market approach and utilize single market quotations from broker dealers, which includes the value of the underlying customized basket(s). The appropriateness of fair values for these securities is monitored on an ongoing basis which may include results of back testing and other control procedures. Significant increases (decreases) to any of these inputs would result in a significantly higher (lower) valuation measurement.
The accompanying Notes to Consolidated Financial Statements are an integral part of this statement.
Columbia Alternative Beta Fund | Annual Report 2017
| 31 |
Consolidated Statement of Assets and Liabilities
May 31, 2017
| Assets | |
| Investments, at cost | |
| Affiliated issuers, at cost | $538,647,094 |
| Total investments, at cost | 538,647,094 |
| Investments, at value | |
| Affiliated issuers, at value | 538,647,376 |
| Total investments, at value | 538,647,376 |
| Cash | 706,000 |
| Cash collateral held at broker | 7,573,000 |
| Margin deposits | 414,000 |
| Unrealized appreciation on swap contracts | 8,116,585 |
| Premiums paid on outstanding swap contracts | 170,091 |
| Receivable for: | |
| Capital shares sold | 3,677,854 |
| Dividends | 407,207 |
| Due from broker | 1,034,448 |
| Prepaid expenses | 201 |
| Trustees’ deferred compensation plan | 11,857 |
| Total assets | 560,758,619 |
| Liabilities | |
| Unrealized depreciation on forward foreign currency exchange contracts | 915,456 |
| Unrealized depreciation on swap contracts | 6,726,794 |
| Payable for: | |
| Investments purchased | 498,201 |
| Capital shares purchased | 931,444 |
| Variation margin for futures contracts | 1,800 |
| Due to broker | 1,197,528 |
| Management services fees | 11,216 |
| Distribution and/or service fees | 74 |
| Transfer agent fees | 81,021 |
| Compensation of board members | 672 |
| Compensation of chief compliance officer | 27 |
| Other expenses | 79,715 |
| Trustees’ deferred compensation plan | 11,857 |
| Total liabilities | 10,455,805 |
| Net assets applicable to outstanding capital stock | $550,302,814 |
| Represented by | |
| Paid in capital | 553,653,757 |
| Undistributed net investment income | 14,227,555 |
| Accumulated net realized loss | (17,767,917) |
| Unrealized appreciation (depreciation) on: | |
| Investments - affiliated issuers | 282 |
| Forward foreign currency exchange contracts | (915,456) |
| Futures contracts | (285,198) |
| Swap contracts | 1,389,791 |
| Total - representing net assets applicable to outstanding capital stock | $550,302,814 |
The accompanying Notes to Consolidated Financial Statements are an integral part of this statement.
| 32 | Columbia Alternative Beta Fund | Annual Report 2017 |
Consolidated Statement of Assets and Liabilities (continued)
May 31, 2017
| Class A | |
| Net assets | $5,581,607 |
| Shares outstanding | 596,379 |
| Net asset value per share | $9.36 |
| Maximum offering price per share(a) | $9.93 |
| Class C | |
| Net assets | $1,099,936 |
| Shares outstanding | 118,602 |
| Net asset value per share | $9.27 |
| Class R | |
| Net assets | $9,325 |
| Shares outstanding | 1,000 |
| Net asset value per share | $9.33 |
| Class R4 | |
| Net assets | $551,521 |
| Shares outstanding | 58,753 |
| Net asset value per share | $9.39 |
| Class R5 | |
| Net assets | $23,445 |
| Shares outstanding | 2,495 |
| Net asset value per share(b) | $9.39 |
| Class T(c) | |
| Net assets | $913,193 |
| Shares outstanding | 97,693 |
| Net asset value per share | $9.35 |
| Maximum offering price per share(d) | $9.59 |
| Class Y | |
| Net assets | $21,559,409 |
| Shares outstanding | 2,291,482 |
| Net asset value per share | $9.41 |
| Class Z | |
| Net assets | $520,564,378 |
| Shares outstanding | 55,519,649 |
| Net asset value per share | $9.38 |
| (a) | The maximum offering price per share is calculated by dividing the net asset value per share by 1.0 minus the maximum sales charge of 5.75% for Class A. |
| (b) | Net asset value per share rounds to this amount due to fractional shares outstanding. |
| (c) | Effective March 27, 2017, Class W shares were renamed Class T shares. |
| (d) | The maximum offering price per share is calculated by dividing the net asset value per share by 1.0 minus the maximum sales charge of 2.50% for Class T. |
The accompanying Notes to Consolidated Financial Statements are an integral part of this statement.
Columbia Alternative Beta Fund | Annual Report 2017
| 33 |
Consolidated Statement of Operations
Year Ended May 31, 2017
| Net investment income | |
| Income: | |
| Dividends — unaffiliated issuers | $15,940 |
| Dividends — affiliated issuers | 1,893,337 |
| Total income | 1,909,277 |
| Expenses: | |
| Management services fees | 3,554,808 |
| Distribution and/or service fees | |
| Class A | 34,800 |
| Class C | 16,453 |
| Class R | 46 |
| Class T(a) | 489,200 |
| Transfer agent fees | |
| Class A | 28,067 |
| Class C | 3,330 |
| Class I(b) | 678 |
| Class R | 18 |
| Class R4 | 1,710 |
| Class R5 | 15 |
| Class T(a) | 389,231 |
| Class Y | 588 |
| Class Z | 207,062 |
| Compensation of board members | 23,609 |
| Custodian fees | 27,326 |
| Printing and postage fees | 79,685 |
| Registration fees | 158,846 |
| Audit fees | 51,080 |
| Legal fees | 9,725 |
| Compensation of chief compliance officer | 144 |
| Other | 31,674 |
| Total expenses | 5,108,095 |
| Fees waived or expenses reimbursed by Investment Manager and its affiliates | (818,752) |
| Total net expenses | 4,289,343 |
| Net investment loss | (2,380,066) |
| Realized and unrealized gain (loss) — net | |
| Net realized gain (loss) on: | |
| Investments — unaffiliated issuers | 872,394 |
| Investments — affiliated issuers | (203,974) |
| Capital gain distributions from underlying affiliated funds | 12,989 |
| Foreign currency translations | 10,348 |
| Forward foreign currency exchange contracts | 521,494 |
| Swap contracts | 4,013,917 |
| Net realized gain | 5,227,168 |
| Net change in unrealized appreciation (depreciation) on: | |
| Investments — unaffiliated issuers | 172,256 |
| Investments — affiliated issuers | 669,045 |
| Forward foreign currency exchange contracts | (911,301) |
| Futures contracts | (285,198) |
| Swap contracts | 1,054,124 |
| Net change in unrealized appreciation (depreciation) | 698,926 |
| Net realized and unrealized gain | 5,926,094 |
| Net increase in net assets resulting from operations | $3,546,028 |
| (a) | Effective March 27, 2017, Class W shares were renamed Class T shares. |
| (b) | Effective March 27, 2017, Class I shares were redeemed or exchanged for Class Y shares. |
The accompanying Notes to Consolidated Financial Statements are an integral part of this statement.
| 34 | Columbia Alternative Beta Fund | Annual Report 2017 |
Consolidated Statement of Changes in Net Assets
| | Year Ended
May 31, 2017 | Year Ended
May 31, 2016 |
| Operations | | |
| Net investment income (loss) | $(2,380,066) | $466,034 |
| Net realized gain (loss) | 5,227,168 | (4,513,083) |
| Net change in unrealized appreciation (depreciation) | 698,926 | (2,424,842) |
| Net increase (decrease) in net assets resulting from operations | 3,546,028 | (6,471,891) |
| Distributions to shareholders | | |
| Net investment income | | |
| Class A | (69,437) | (111,301) |
| Class C | (2,054) | (3,424) |
| Class I(a) | (130,658) | (182,360) |
| Class R | (32) | (44) |
| Class R4 | (5,310) | (7,948) |
| Class R5 | (572) | (78) |
| Class T(b) | (1,461,744) | (688,958) |
| Class Y | (58) | (81) |
| Class Z | (15,068) | (5,611) |
| Total distributions to shareholders | (1,684,933) | (999,805) |
| Increase in net assets from capital stock activity | 334,043,572 | 45,354,149 |
| Total increase in net assets | 335,904,667 | 37,882,453 |
| Net assets at beginning of year | 214,398,147 | 176,515,694 |
| Net assets at end of year | $550,302,814 | $214,398,147 |
| Undistributed net investment income | $14,227,555 | $876,959 |
| (a) | Effective March 27, 2017, Class I shares were redeemed or exchanged for Class Y shares. |
| (b) | Effective March 27, 2017, Class W shares were renamed Class T shares. |
The accompanying Notes to Consolidated Financial Statements are an integral part of this statement.
Columbia Alternative Beta Fund | Annual Report 2017
| 35 |
Consolidated Statement of Changes in Net Assets (continued)
| | Year Ended | Year Ended |
| | May 31, 2017 | May 31, 2016 |
| | Shares | Dollars ($) | Shares | Dollars ($) |
| Capital stock activity |
| Class A | | | | |
| Subscriptions | 306,867 | 2,842,707 | 2,457,215 | 23,500,707 |
| Distributions reinvested | 7,702 | 69,395 | 11,784 | 111,243 |
| Redemptions | (1,688,704) | (15,571,317) | (952,381) | (8,922,663) |
| Net increase (decrease) | (1,374,135) | (12,659,215) | 1,516,618 | 14,689,287 |
| Class C | | | | |
| Subscriptions | 24,091 | 222,445 | 162,526 | 1,549,976 |
| Distributions reinvested | 228 | 2,042 | 362 | 3,408 |
| Redemptions | (147,767) | (1,356,311) | (15,673) | (147,665) |
| Net increase (decrease) | (123,448) | (1,131,824) | 147,215 | 1,405,719 |
| Class I(a) | | | | |
| Distributions reinvested | 14,447 | 130,600 | 19,289 | 182,279 |
| Redemptions | (2,291,506) | (21,539,897) | — | — |
| Net increase (decrease) | (2,277,059) | (21,409,297) | 19,289 | 182,279 |
| Class R4 | | | | |
| Subscriptions | 30,379 | 282,580 | 116,664 | 1,119,304 |
| Distributions reinvested | 582 | 5,258 | 832 | 7,850 |
| Redemptions | (79,166) | (730,905) | (11,538) | (107,865) |
| Net increase (decrease) | (48,205) | (443,067) | 105,958 | 1,019,289 |
| Class R5 | | | | |
| Subscriptions | 15,298 | 139,471 | — | — |
| Distributions reinvested | 57 | 516 | — | — |
| Redemptions | (13,860) | (127,124) | — | — |
| Net increase | 1,495 | 12,863 | — | — |
| Class T(b) | | | | |
| Subscriptions | 30,502,808 | 280,253,189 | 8,593,180 | 80,645,108 |
| Distributions reinvested | 162,231 | 1,461,702 | 73,054 | 688,900 |
| Redemptions | (48,351,190) | (447,017,034) | (2,478,236) | (23,456,091) |
| Net increase (decrease) | (17,686,151) | (165,302,143) | 6,187,998 | 57,877,917 |
| Class Y | | | | |
| Subscriptions | 2,290,482 | 21,530,498 | — | — |
| Net increase | 2,290,482 | 21,530,498 | — | — |
| Class Z | | | | |
| Subscriptions | 57,606,542 | 536,261,796 | 414,721 | 3,884,973 |
| Distributions reinvested | 1,655 | 14,923 | 573 | 5,411 |
| Redemptions | (2,454,556) | (22,830,962) | (3,568,786) | (33,710,726) |
| Net increase (decrease) | 55,153,641 | 513,445,757 | (3,153,492) | (29,820,342) |
| Total net increase | 35,936,620 | 334,043,572 | 4,823,586 | 45,354,149 |
| (a) | Effective March 27, 2017, Class I shares were redeemed or exchanged for Class Y shares. |
| (b) | Effective March 27, 2017, Class W shares were renamed Class T shares. |
The accompanying Notes to Consolidated Financial Statements are an integral part of this statement.
| 36 | Columbia Alternative Beta Fund | Annual Report 2017 |
[THIS PAGE INTENTIONALLY LEFT BLANK]
Columbia Alternative Beta Fund | Annual Report 2017
| 37 |
Consolidated Financial Highlights
The following table is intended to help you understand the Fund’s financial performance. Certain information reflects financial results for a single share of a class held for the periods shown. Per share net investment income (loss) amounts are calculated based on average shares outstanding during the period. Total return assumes reinvestment of all dividends and distributions, if any. Total return does not reflect payment of sales charges, if any. Total return and portfolio turnover are not annualized for periods of less than one year. The portfolio turnover rate is calculated without regard to purchase and sales transactions of short-term instruments and certain derivatives, if any. If such transactions were included, the Fund’s portfolio turnover rate may be higher.
| Year ended | Net asset value,
beginning of
period | Net
investment
income
(loss) | Net
realized
and
unrealized
gain (loss) | Total from
investment
operations | Distributions
from net
investment
income |
| Class A |
| 5/31/2017 | $9.43 | (0.09) | 0.06 | (0.03) | (0.04) |
| 5/31/2016 | $9.85 | 0.05 | (0.41) | (0.36) | (0.06) |
| 5/31/2015 (c) | $10.00 | (0.05) | (0.10) | (0.15) | — |
| Class C |
| 5/31/2017 | $9.38 | (0.16) | 0.06 | (0.10) | (0.01) |
| 5/31/2016 | $9.83 | (0.03) | (0.40) | (0.43) | (0.02) |
| 5/31/2015 (e) | $10.00 | (0.07) | (0.10) | (0.17) | — |
| Class R |
| 5/31/2017 | $9.41 | (0.10) | 0.05 | (0.05) | (0.03) |
| 5/31/2016 | $9.84 | 0.01 | (0.40) | (0.39) | (0.04) |
| 5/31/2015 (f) | $10.00 | (0.05) | (0.11) | (0.16) | — |
| Class R4 |
| 5/31/2017 | $9.45 | (0.06) | 0.05 | (0.01) | (0.05) |
| 5/31/2016 | $9.86 | 0.19 | (0.53) | (0.34) | (0.07) |
| 5/31/2015 (g) | $10.00 | (0.04) | (0.10) | (0.14) | — |
| Class R5 |
| 5/31/2017 | $9.45 | (0.03) | 0.03 | 0.00 | (0.06) |
| 5/31/2016 | $9.86 | 0.07 | (0.40) | (0.33) | (0.08) |
| 5/31/2015 (h) | $10.00 | (0.03) | (0.11) | (0.14) | — |
The accompanying Notes to Consolidated Financial Statements are an integral part of this statement.
| 38 | Columbia Alternative Beta Fund | Annual Report 2017 |
Total
distributions to
shareholders | Net
asset
value,
end of
period | Total
return | Total gross
expense
ratio to
average
net assets(a) | Total net
expense
ratio to
average
net assets(a),(b) | Net investment
income (loss)
ratio to
average
net assets | Portfolio
turnover | Net
assets,
end of
period
(000’s) |
| |
| (0.04) | $9.36 | (0.28%) | 1.61% | 1.41% | (0.95%) | 71% | $5,582 |
| (0.06) | $9.43 | (3.67%) | 2.09% | 1.39% | 0.49% | 32% | $18,579 |
| — | $9.85 | (1.50%) | 2.08% (d) | 1.50% (d) | (1.42%) (d) | 28% | $4,470 |
| |
| (0.01) | $9.27 | (1.03%) | 2.36% | 2.16% | (1.68%) | 71% | $1,100 |
| (0.02) | $9.38 | (4.42%) | 2.84% | 2.14% | (0.34%) | 32% | $2,272 |
| — | $9.83 | (1.70%) | 2.83% (d) | 2.25% (d) | (2.18%) (d) | 28% | $932 |
| |
| (0.03) | $9.33 | (0.50%) | 1.89% | 1.63% | (1.10%) | 71% | $9 |
| (0.04) | $9.41 | (3.92%) | 2.33% | 1.64% | 0.09% | 32% | $9 |
| — | $9.84 | (1.60%) | 2.33% (d) | 1.73% (d) | (1.59%) (d) | 28% | $10 |
| |
| (0.05) | $9.39 | (0.06%) | 1.36% | 1.15% | (0.66%) | 71% | $552 |
| (0.07) | $9.45 | (3.42%) | 1.83% | 1.12% | 2.03% | 32% | $1,010 |
| — | $9.86 | (1.40%) | 1.80% (d) | 1.23% (d) | (1.09%) (d) | 28% | $10 |
| |
| (0.06) | $9.39 | (0.02%) | 1.21% | 0.93% | (0.33%) | 71% | $23 |
| (0.08) | $9.45 | (3.37%) | 1.62% | 1.04% | 0.69% | 32% | $9 |
| — | $9.86 | (1.40%) | 1.63% (d) | 1.17% (d) | (1.03%) (d) | 28% | $10 |
Columbia Alternative Beta Fund | Annual Report 2017
| 39 |
Consolidated Financial Highlights (continued)
| Year ended | Net asset value,
beginning of
period | Net
investment
income
(loss) | Net
realized
and
unrealized
gain (loss) | Total from
investment
operations | Distributions
from net
investment
income |
| Class T(i) |
| 5/31/2017 | $9.42 | (0.09) | 0.06 | (0.03) | (0.04) |
| 5/31/2016 | $9.84 | 0.02 | (0.38) | (0.36) | (0.06) |
| 5/31/2015 (j) | $10.00 | (0.05) | (0.11) | (0.16) | — |
| Class Y |
| 5/31/2017 | $9.45 | (0.01) | 0.03 | 0.02 | (0.06) |
| 5/31/2016 | $9.86 | 0.07 | (0.40) | (0.33) | (0.08) |
| 5/31/2015 (k) | $10.00 | (0.03) | (0.11) | (0.14) | — |
| Class Z |
| 5/31/2017 | $9.43 | (0.03) | 0.03 | 0.00 | (0.05) |
| 5/31/2016 | $9.86 | (0.06) | (0.30) | (0.36) | (0.07) |
| 5/31/2015 (l) | $10.00 | (0.04) | (0.10) | (0.14) | — |
| Notes to Consolidated Financial Highlights |
| (a) | In addition to the fees and expenses that the Fund bears directly, the Fund indirectly bears a pro rata share of the fees and expenses of any other funds in which it invests. Such indirect expenses are not included in the Fund’s reported expense ratios. |
| (b) | Total net expenses include the impact of certain fee waivers/expense reimbursements made by the Investment Manager and certain of its affiliates, if applicable. |
| (c) | Class A shares commenced operations on January 28, 2015. Per share data and total return reflect activity from that date. |
| (d) | Annualized. |
| (e) | Class C shares commenced operations on January 28, 2015. Per share data and total return reflect activity from that date. |
| (f) | Class R shares commenced operations on January 28, 2015. Per share data and total return reflect activity from that date. |
| (g) | Class R4 shares commenced operations on January 28, 2015. Per share data and total return reflect activity from that date. |
| (h) | Class R5 shares commenced operations on January 28, 2015. Per share data and total return reflect activity from that date. |
| (i) | Effective March 27, 2017, Class W shares were renamed Class T shares. |
| (j) | Class T shares commenced operations on January 28, 2015. Per share data and total return reflect activity from that date. |
| (k) | Class Y shares commenced operations on January 28, 2015. Per share data and total return reflect activity from that date. |
| (l) | Class Z shares commenced operations on January 28, 2015. Per share data and total return reflect activity from that date. |
The accompanying Notes to Consolidated Financial Statements are an integral part of this statement.
| 40 | Columbia Alternative Beta Fund | Annual Report 2017 |
Total
distributions to
shareholders | Net
asset
value,
end of
period | Total
return | Total gross
expense
ratio to
average
net assets(a) | Total net
expense
ratio to
average
net assets(a),(b) | Net investment
income (loss)
ratio to
average
net assets | Portfolio
turnover | Net
assets,
end of
period
(000’s) |
| |
| (0.04) | $9.35 | (0.28%) | 1.61% | 1.39% | (0.93%) | 71% | $913 |
| (0.06) | $9.42 | (3.68%) | 2.09% | 1.38% | 0.24% | 32% | $167,528 |
| — | $9.84 | (1.60%) | 2.07% (d) | 1.48% (d) | (1.35%) (d) | 28% | $114,125 |
| |
| (0.06) | $9.41 | 0.21% | 1.18% | 0.88% | (0.07%) | 71% | $21,559 |
| (0.08) | $9.45 | (3.34%) | 1.57% | 0.99% | 0.72% | 32% | $9 |
| — | $9.86 | (1.40%) | 1.58% (d) | 1.12% (d) | (0.98%) (d) | 28% | $10 |
| |
| (0.05) | $9.38 | 0.05% | 1.36% | 1.08% | (0.28%) | 71% | $520,564 |
| (0.07) | $9.43 | (3.63%) | 1.84% | 1.12% | (0.56%) | 32% | $3,450 |
| — | $9.86 | (1.40%) | 1.83% (d) | 1.23% (d) | (1.09%) (d) | 28% | $34,686 |
Columbia Alternative Beta Fund | Annual Report 2017
| 41 |
Notes to Consolidated Financial Statements
May 31, 2017
Note 1. Organization
Columbia Alternative Beta Fund (formerly known as Columbia Adaptive Alternatives Fund) (the Fund), a series of Columbia Funds Series Trust I (the Trust), is a non-diversified fund. The Trust is registered under the Investment Company Act of 1940, as amended (the 1940 Act), as an open-end management investment company organized as a Massachusetts business trust.
Effective October 1, 2016, Columbia Adaptive Alternatives Fund was renamed Columbia Alternative Beta Fund.
Prior to October 1, 2016, the Fund invested significantly in Class I shares of affiliated funds managed by Columbia Management Investment Advisers, LLC (the Investment Manager), a wholly-owned subsidiary of Ameriprise Financial, Inc. (Ameriprise Financial), or its affiliates as well as third-party advised (unaffiliated) funds, including exchange-traded funds (collectively, Underlying Funds).
Basis for consolidation
CAAF Offshore Fund, Ltd. (the Subsidiary) is a Cayman Islands exempted company and wholly-owned subsidiary of the Fund. The Subsidiary acts as an investment vehicle in order to effect certain investment strategies consistent with the Fund’s investment objective and policies as stated in its current prospectus and statement of additional information. In accordance with the Memorandum and Articles of Association of the Subsidiary (the Articles), the Fund owns the sole issued share of the Subsidiary and retains all rights associated with such share, including the right to receive notice of, attend and vote at general meetings of the Subsidiary, rights in a winding-up or repayment of capital and the right to participate in the profits or assets of the Subsidiary. The consolidated financial statements (financial statements) include the accounts of the consolidated Fund and the respective Subsidiary. Subsequent references to the Fund within the Notes to Consolidated Financial Statements collectively refer to the Fund and the Subsidiary. All intercompany transactions and balances have been eliminated in the consolidation process.
At May 31, 2017, the Subsidiary financial statement information is as follows:
| | CAAF Offshore Fund, Ltd. |
| % of consolidated fund net assets | 17.88% |
| Net assets | $98,384,481 |
| Net investment loss | (357,901) |
| Net realized loss | (6,569,300) |
| Net change in unrealized appreciation (depreciation) | (2,154,504) |
The financial statements present the portfolio holdings, financial position and results of operations of the Fund and the Subsidiary on a consolidated basis.
Fund shares
The Trust may issue an unlimited number of shares (without par value). Although all share classes generally have identical voting, dividend and liquidation rights, each share class votes separately when required by the Trust’s organizational documents or by law. Different share classes pay different distribution amounts to the extent the expenses of such share classes differ, and distributions in liquidation will be proportional to the net asset value of each share class. Each share class has its own expense and sales charge structure. The Fund offers each of the share classes identified below.
Class A shares are subject to a maximum front-end sales charge of 5.75% based on the initial investment amount. Class A shares purchased without an initial sales charge in accounts aggregating $1 million to $50 million at the time of purchase are subject to a contingent deferred sales charge (CDSC) if the shares are sold within 18 months after purchase, charged as follows: 1.00% CDSC if redeemed within 12 months after purchase, and 0.50% CDSC if redeemed more than 12, but less than 18, months after purchase.
Class C shares are subject to a 1.00% CDSC on shares redeemed within 12 months after purchase.
| 42 | Columbia Alternative Beta Fund | Annual Report 2017 |
Notes to Consolidated Financial Statements (continued)
May 31, 2017
Effective March 27, 2017, Class I shares of the Fund are no longer offered for sale. Class I shares, when available, were not subject to sales charges or distribution and service (12b-1) fees, and were made available only to the Columbia Family of Funds. On March 27, 2017, Class I shares were redeemed or exchanged for Class Y shares of the Fund in a tax free transaction that had no impact on the fees and expenses paid by shareholders.
Class R shares are not subject to sales charges and are generally available only to certain retirement plans and other investors as described in the Fund’s prospectus.
Class R4 shares are not subject to sales charges and are generally available only to omnibus retirement plans and certain investors as described in the Fund’s prospectus.
Class R5 shares are not subject to sales charges and are generally available only to investors purchasing through authorized investment professionals and omnibus retirement plans.
Class T shares are subject to a maximum front-end sales charge of 2.50% per transaction and must be purchased through financial intermediaries that, by written agreement with Columbia Management Investment Distributors, Inc., are specifically authorized to sell Class T shares. Prior to March 27, 2017, Class T shares were known as Class W shares, were not subject to sales charges, and were generally available only to investors purchasing through authorized investment programs managed by investment professionals, including discretionary managed accounts.
Class Y shares are not subject to sales charges or distribution and service (12b-1) fees, and are available to institutional and certain other investors as described in the Fund’s prospectus. On March 27, 2017, Class I shares were redeemed or exchanged for Class Y shares of the Fund in a tax free transaction that had no impact on the fees and expenses paid by shareholders. Class I shares of the Fund are no longer offered for sale.
Class Z shares are not subject to sales charges and are generally available only to eligible investors, which are subject to different investment minimums as described in the Fund’s prospectus.
Note 2. Summary of significant accounting policies
Basis of preparation
The Fund is an investment company that applies the accounting and reporting guidance in the Financial Accounting Standards Board (FASB) Accounting Standards Codification Topic 946, Financial Services - Investment Companies (ASC 946). The financial statements are prepared in accordance with U.S. generally accepted accounting principles (GAAP), which requires management to make certain estimates and assumptions that affect the reported amounts of assets and liabilities, the disclosure of contingent assets and liabilities at the date of the financial statements and the reported amounts of income and expenses during the reporting period. Actual results could differ from those estimates.
The following is a summary of significant accounting policies followed by the Fund in the preparation of its financial statements.
Security valuation
Investments in open-end investment companies, including money market funds, are valued at their latest net asset value.
Forward foreign currency exchange contracts are marked-to-market based upon foreign currency exchange rates provided by a pricing service.
Futures and options on futures contracts are valued based upon the settlement price at the close of regular trading on their principal exchanges or, in the absence of transactions, at the mean of the latest quoted bid and ask prices.
Swap transactions are valued through an independent pricing service or broker, or if neither is available, through an internal model based upon observable inputs.
Columbia Alternative Beta Fund | Annual Report 2017
| 43 |
Notes to Consolidated Financial Statements (continued)
May 31, 2017
Investments for which market quotations are not readily available, or that have quotations which management believes are not reflective of market value or reliable, are valued at fair value as determined in good faith under procedures approved by and under the general supervision of the Board of Trustees. If a security or class of securities (such as foreign securities) is valued at fair value, such value is likely to be different from the quoted or published price for the security.
The determination of fair value often requires significant judgment. To determine fair value, management may use assumptions including but not limited to future cash flows and estimated risk premiums. Multiple inputs from various sources may be used to determine fair value.
GAAP requires disclosure regarding the inputs and valuation techniques used to measure fair value and any changes in valuation inputs or techniques. In addition, investments shall be disclosed by major category. This information is disclosed following the Fund’s Consolidated Portfolio of Investments.
Foreign currency transactions and translations
The values of all assets and liabilities denominated in foreign currencies are generally translated into U.S. dollars at exchange rates determined at the close of regular trading on the New York Stock Exchange. Net realized and unrealized gains (losses) on foreign currency transactions and translations include gains (losses) arising from the fluctuation in exchange rates between trade and settlement dates on securities transactions, gains (losses) arising from the disposition of foreign currency and currency gains (losses) between the accrual and payment dates on dividends, interest income and foreign withholding taxes.
For financial statement purposes, the Fund does not distinguish that portion of gains (losses) on investments which is due to changes in foreign exchange rates from that which is due to changes in market prices of the investments. Such fluctuations are included with the net realized and unrealized gains (losses) on investments in the Consolidated Statement of Operations.
Derivative instruments
The Fund invests in certain derivative instruments, as detailed below, to meet its investment objectives. Derivatives are instruments whose values depend on, or are derived from, in whole or in part, the value of one or more securities, currencies, commodities, indices, or other assets or instruments. Derivatives may be used to increase investment flexibility (including to maintain cash reserves while maintaining desired exposure to certain assets), for risk management (hedging) purposes, to facilitate trading, to reduce transaction costs and to pursue higher investment returns. The Fund may also use derivative instruments to mitigate certain investment risks, such as foreign currency exchange rate risk, interest rate risk and credit risk. Derivatives may involve various risks, including the potential inability of the counterparty to fulfill its obligations under the terms of the contract, the potential for an illiquid secondary market (making it difficult for the Fund to sell or terminate, including at favorable prices) and the potential for market movements which may expose the Fund to gains or losses in excess of the amount shown in the Consolidated Statement of Assets and Liabilities. The notional amounts of derivative instruments, if applicable, are not recorded in the financial statements.
A derivative instrument may suffer a marked-to-market loss if the value of the contract decreases due to an unfavorable change in the market rates or values of the underlying instrument. Losses can also occur if the counterparty does not perform its obligations under the contract. The Fund’s risk of loss from counterparty credit risk on over-the-counter derivatives is generally limited to the aggregate unrealized gain netted against any collateral held by the Fund and the amount of any variation margin held by the counterparty, plus any replacement costs or related amounts. With exchange-traded or centrally cleared derivatives, there is reduced counterparty credit risk to the Fund since the clearinghouse or central counterparty (CCP) provides some protection in the case of clearing member default. The clearinghouse or CCP stands between the buyer and the seller of the contract; therefore, additional counterparty credit risk is failure of the clearinghouse or CCP. However, credit risk still exists in exchange-traded or centrally cleared derivatives with respect to initial and variation margin that is held in a broker’s customer account. While brokers are required to segregate customer margin from their own assets, in the event that a broker becomes insolvent or goes into bankruptcy and at that time there is a shortfall in the aggregate amount of margin held by the broker for all its clients, U.S. bankruptcy laws will typically allocate that shortfall on a pro-rata basis across all the broker’s customers (including the Fund), potentially resulting in losses to the Fund.
| 44 | Columbia Alternative Beta Fund | Annual Report 2017 |
Notes to Consolidated Financial Statements (continued)
May 31, 2017
In order to better define its contractual rights and to secure rights that will help the Fund mitigate its counterparty risk, the Fund may enter into an International Swaps and Derivatives Association, Inc. Master Agreement (ISDA Master Agreement) or similar agreement with its derivatives contract counterparties. An ISDA Master Agreement is an agreement between the Fund and a counterparty that governs over-the-counter derivatives and typically contains, among other things, collateral posting terms and netting provisions in the event of a default and/or termination event. Under an ISDA Master Agreement, the Fund may, under certain circumstances, offset with the counterparty certain derivative instrument’s payables and/or receivables with collateral held and/or posted and create one single net payment. The provisions of the ISDA Master Agreement typically permit a single net payment in the event of default (close-out netting), including the bankruptcy or insolvency of the counterparty. Note, however, that bankruptcy or insolvency laws of a particular jurisdiction may impose restrictions on or prohibitions against the right of offset or netting in bankruptcy, insolvency or other events.
Collateral (margin) requirements differ by type of derivative. Margin requirements are established by the clearinghouse or CCP for exchange-traded and centrally cleared derivatives. Brokers can ask for margin in excess of the minimum in certain circumstances. Collateral terms are contract specific for over-the-counter derivatives. For over-the-counter derivatives traded under an ISDA Master Agreement, the collateral requirements are typically calculated by netting the marked-to-market amount for each transaction under such agreement and comparing that amount to the value of any variation margin currently pledged by the Fund and/or the counterparty. Generally, the amount of collateral due from or to a party has to exceed a minimum transfer amount threshold (e.g., $250,000) before a transfer has to be made. To the extent amounts due to the Fund from its counterparties are not fully collateralized, contractually or otherwise, the Fund bears the risk of loss from counterparty nonperformance. The Fund attempts to mitigate counterparty risk by only entering into agreements with counterparties that it believes have the financial resources to honor their obligations and by monitoring the financial stability of those counterparties.
Certain ISDA Master Agreements allow counterparties of over-the-counter derivatives transactions to terminate derivatives contracts prior to maturity in the event the Fund’s net asset value declines by a stated percentage over a specified time period or if the Fund fails to meet certain terms of the ISDA Master Agreement, which would cause the Fund to accelerate payment of any net liability owed to the counterparty. The Fund also has termination rights if the counterparty fails to meet certain terms of the ISDA Master Agreement. In addition to considering counterparty credit risk, the Fund would consider terminating the derivatives contracts based on whether termination would result in a net liability owed from the counterparty.
For financial reporting purposes, the Fund does not offset derivative assets and derivative liabilities that are subject to netting arrangements in the Consolidated Statement of Assets and Liabilities.
Forward foreign currency exchange contracts
Forward foreign currency exchange contracts are over-the-counter agreements between two parties to buy and sell a currency at a set price on a future date. The Fund utilized forward foreign currency exchange contracts to hedge the currency exposure associated with some or all of the Fund’s securities. These instruments may be used for other purposes in future periods.
The values of forward foreign currency exchange contracts fluctuate daily with changes in foreign currency exchange rates. Changes in the value of these contracts are recorded as unrealized appreciation or depreciation until the contract is exercised or has expired. The Fund will realize a gain or loss when the forward foreign currency exchange contract is closed or expires.
The use of forward foreign currency exchange contracts does not eliminate fluctuations in the prices of the Fund’s portfolio securities. The risks of forward foreign currency exchange contracts include movement in the values of the foreign currencies relative to the U.S. dollar (or other foreign currencies) and the possibility that counterparties will not complete their contractual obligations, which may be in excess of the amount reflected, if any, in the Consolidated Statement of Assets and Liabilities.
Futures contracts
Futures contracts are exchange-traded and represent commitments for the future purchase or sale of an asset at a specified price on a specified date. The Fund bought and sold futures contracts to manage exposure to the securities market. These instruments may be used for other purposes in future periods. Upon entering into futures contracts, the Fund bears risks that
Columbia Alternative Beta Fund | Annual Report 2017
| 45 |
Notes to Consolidated Financial Statements (continued)
May 31, 2017
it may not achieve the anticipated benefits of the futures contracts and may realize a loss. Additional risks include counterparty credit risk, the possibility of an illiquid market, and that a change in the value of the contract or option may not correlate with changes in the value of the underlying asset.
Upon entering into a futures contract, the Fund deposits cash or securities with the broker, known as a futures commission merchant (FCM), in an amount sufficient to meet the initial margin requirement. The initial margin deposit must be maintained at an established level over the life of the contract. Cash deposited as initial margin is recorded in the Consolidated Statement of Assets and Liabilities as margin deposits. Securities deposited as initial margin are designated in the Consolidated Portfolio of Investments. Subsequent payments (variation margin) are made or received by the Fund each day. The variation margin payments are equal to the daily change in the contract value and are recorded as variation margin receivable or payable and are offset in unrealized gains or losses. The Fund recognizes a realized gain or loss when the contract is closed or expires. Futures contracts involve, to varying degrees, risk of loss in excess of the variation margin disclosed in the Consolidated Statement of Assets and Liabilities.
Swap contracts
Swap contracts are negotiated in the over-the-counter market and may be entered into as a bilateral contract or centrally cleared (centrally cleared swap contract). In a centrally cleared swap contract, immediately following execution of the swap contract with a broker, the swap contract is novated to a central counterparty (the CCP) and the CCP becomes the Fund’s counterparty to the centrally cleared swap contract. The Fund is required to deposit initial margin with the futures commission merchant (FCM), which pledges it through to the CCP in the form of cash or securities in an amount that varies depending on the size and risk profile of the particular swap contract. Securities deposited as initial margin are designated in the Consolidated Portfolio of Investments and cash deposited is recorded in the Consolidated Statement of Assets and Liabilities as margin deposits. Unlike a bilateral swap contract, for centrally cleared swap contracts, the Fund has minimal credit exposure to the FCM because the CCP stands between the Fund and the relevant buyer/seller on the other side of the contract. Swap contracts are marked-to-market daily and changes in value are recorded as unrealized appreciation (depreciation). The daily change in valuation of centrally cleared swap contracts, if any, is recorded as a receivable or payable for variation margin in the Consolidated Statement of Assets and Liabilities.
Entering into these contracts involves, to varying degrees, elements of interest, liquidity and counterparty credit risk in excess of the amounts recognized in the Consolidated Statement of Assets and Liabilities. Such risks involve the possibility that there may be unfavorable changes in interest rates, market conditions or other conditions, it may be difficult to initiate a swap transaction or liquidate a position at an advantageous time or price which may result in significant losses, and that the FCM or CCP may not fulfill its obligation under the contract.
Total return swap contracts
The Fund entered into total return swap contracts to manage long or short exposure to the total return on a reference security index in return for periodic payments based on a fixed or variable interest rate. These instruments may be used for other purposes in future periods. Total return swap contracts may be used to obtain exposure to an underlying reference security, instrument, or other asset or index or market without owning, taking physical custody of, or short selling any such security, instrument or asset in a market.
Total return swap contracts are valued daily, and the change in value is recorded as unrealized appreciation (depreciation) until the termination of the swap, at which time the Fund will realize a gain (loss). Periodic payments received (or made) by the Fund over the term of the contract are recorded as realized gains (losses). Total return swap contracts are subject to the risk associated with the investment in the underlying reference security, instrument or asset. The risk in the case of short total return swap contracts is unlimited based on the potential for unlimited increases in the market value of the underlying reference security, instrument or asset. This risk may be offset if the Fund holds any of the underlying reference security, instrument or asset. The risk in the case of long total return swap contracts is limited to the current notional amount of the total return swap contract.
| 46 | Columbia Alternative Beta Fund | Annual Report 2017 |
Notes to Consolidated Financial Statements (continued)
May 31, 2017
Effects of derivative transactions in the financial statements
The following tables are intended to provide additional information about the effect of derivatives on the financial statements of the Fund, including: the fair value of derivatives by risk category and the location of those fair values in the Consolidated Statement of Assets and Liabilities; and the impact of derivative transactions over the period in the Consolidated Statement of Operations, including realized and unrealized gains (losses). The derivative instrument schedules following the Consolidated Portfolio of Investments present additional information regarding derivative instruments outstanding at the end of the period, if any.
The following table is a summary of the fair value of derivative instruments (not considered to be hedging instruments for accounting disclosure purposes) at May 31, 2017:
| | Asset derivatives | |
Risk exposure
category | Consolidated statement
of assets and liabilities
location | Fair value ($) |
| Credit risk | Net assets — unrealized appreciation on swap contracts | 61,523* |
| Credit risk | Premiums paid on outstanding swap contracts | 113,891 |
| Equity risk | Net assets — unrealized appreciation on swap contracts | 6,771,285* |
| Equity risk | Premiums paid on outstanding swap contracts | 30,313 |
| Foreign exchange risk | Net assets — unrealized appreciation on swap contracts | 808,836* |
| Interest rate risk | Net assets — unrealized appreciation on swap contracts | 399,048* |
| Interest rate risk | Premiums paid on outstanding swap contracts | 25,887 |
| Commodity-related investment risk | Net assets — unrealized appreciation on swap contracts | 75,893* |
| Total | | 8,286,676 |
| | Liability derivatives | |
Risk exposure
category | Consolidated statement
of assets and liabilities
location | Fair value ($) |
| Credit risk | Net assets — unrealized depreciation on swap contracts | 5,534* |
| Equity risk | Net assets — unrealized depreciation on futures contracts | 285,198* |
| Equity risk | Net assets — unrealized depreciation on swap contracts | 2,745,299* |
| Foreign exchange risk | Unrealized depreciation on forward foreign currency exchange contracts | 915,456 |
| Foreign exchange risk | Net assets — unrealized depreciation on swap contracts | 1,565,838* |
| Interest rate risk | Net assets — unrealized depreciation on swap contracts | 41,547* |
| Commodity-related investment risk | Net assets — unrealized depreciation on swap contracts | 2,368,576* |
| Total | | 7,927,448 |
| * | Includes cumulative appreciation (depreciation) as reported in the tables following the Consolidated Portfolio of Investments. Only the current day’s variation margin is reported in receivables or payables in the Consolidated Statement of Assets and Liabilities. |
Columbia Alternative Beta Fund | Annual Report 2017
| 47 |
Notes to Consolidated Financial Statements (continued)
May 31, 2017
The following table indicates the effect of derivative instruments (not considered to be hedging instruments for accounting disclosure purposes) in the Consolidated Statement of Operations for the year ended May 31, 2017:
| Amount of realized gain (loss) on derivatives recognized in income |
| Risk exposure category | Forward
foreign
currency
exchange
contracts
($) | Swap
contracts
($) | Total
($) |
| Commodity-related investment risk | — | (5,099,459) | (5,099,459) |
| Credit risk | — | 4,902,018 | 4,902,018 |
| Equity risk | — | 1,758,145 | 1,758,145 |
| Foreign exchange risk | 521,494 | 5,243,827 | 5,765,321 |
| Interest rate risk | — | (2,790,614) | (2,790,614) |
| Total | 521,494 | 4,013,917 | 4,535,411 |
| Change in unrealized appreciation (depreciation) on derivatives recognized in income |
| Risk exposure category | Forward
foreign
currency
exchange
contracts
($) | Futures
contracts
($) | Swap
contracts
($) | Total
($) |
| Commodity-related investment risk | — | — | (2,600,926) | (2,600,926) |
| Credit risk | — | — | 132,256 | 132,256 |
| Equity risk | — | (285,198) | 4,114,121 | 3,828,923 |
| Foreign exchange risk | (911,301) | — | (906,630) | (1,817,931) |
| Interest rate risk | — | — | 315,303 | 315,303 |
| Total | (911,301) | (285,198) | 1,054,124 | (142,375) |
The following table is a summary of the average outstanding volume by derivative instrument for the year ended May 31, 2017:
| Derivative instrument | Average notional
amounts ($)* |
| Futures contracts — short | 2,712,488 |
| Derivative instrument | Average unrealized
appreciation ($)* | Average unrealized
depreciation ($)* |
| Forward foreign currency exchange contracts | 45,490 | 284,418 |
| Total return swap contracts | 6,806,042 | 5,018,013 |
| * | Based on the ending quarterly outstanding amounts for the year ended May 31, 2017. |
| 48 | Columbia Alternative Beta Fund | Annual Report 2017 |
Notes to Consolidated Financial Statements (continued)
May 31, 2017
Offsetting of assets and liabilities
The following table presents the Fund’s gross and net amount of assets and liabilities available for offset under netting arrangements as well as any related collateral received or pledged by the Fund as of May 31, 2017:
| | Barclays
($)(a) | Barclays
($)(a) | Citi
($) | Deutsche
Bank
($) | Goldman
Sachs
International
($)(a) | Goldman
Sachs
International
($)(a) | JPMorgan
($) | Morgan
Stanley
($)(a) | Morgan
Stanley
($)(a) | Standard
Chartered($) | Total
($) |
| Assets | | | | | | | | | | | |
| OTC total return swap contracts (b) | 247,464 | 7,035 | - | 833,145 | 3,149,996 | 68,858 | 1,231,520 | 2,202,309 | 376,258 | - | 8,116,585 |
| Total assets | 247,464 | 7,035 | - | 833,145 | 3,149,996 | 68,858 | 1,231,520 | 2,202,309 | 376,258 | - | 8,116,585 |
| Liabilities | | | | | | | | | | | |
| Forward foreign currency exchange contracts | 207,932 | - | - | 67,075 | - | - | 146,766 | - | - | 493,683 | 915,456 |
| OTC total return swap contracts (b) | 5,534 | 1,426,488 | 270,848 | 2,603,954 | 1,039,566 | 671,240 | - | 709,164 | - | - | 6,726,794 |
| Total liabilities | 213,466 | 1,426,488 | 270,848 | 2,671,029 | 1,039,566 | 671,240 | 146,766 | 709,164 | - | 493,683 | 7,642,250 |
| Total financial and derivative net assets | 33,998 | (1,419,453) | (270,848) | (1,837,884) | 2,110,430 | (602,382) | 1,084,754 | 1,493,145 | 376,258 | (493,683) | 474,335 |
| Total collateral received (pledged) (c) | 33,998 | (1,419,453) | (270,848) | (1,837,884) | 1,290,000 | (602,382) | 830,000 | 720,000 | 345,000 | - | (911,569) |
| Net amount (d) | - | - | - | - | 820,430 | - | 254,754 | 773,145 | 31,258 | (493,683) | 1,385,904 |
| (a) | Exposure can only be netted across transactions governed under the same master agreement with the same legal entity. |
| (b) | Over-the-Counter Swap Contracts are presented at market value plus periodic payments receivable (payable), which is comprised of unrealized appreciation, unrealized depreciation, premiums paid and premiums received. |
| (c) | In some instances, the actual collateral received and/or pledged may be more than the amount shown due to overcollateralization. |
| (d) | Represents the net amount due from/(to) counterparties in the event of default. |
Security transactions
Security transactions are accounted for on the trade date. Cost is determined and gains (losses) are based upon the specific identification method for both financial statement and federal income tax purposes.
Income recognition
Income and capital gain distributions from the Underlying Funds, if any, are recorded on the ex-dividend date.
Expenses
General expenses of the Trust are allocated to the Fund and other funds of the Trust based upon relative net assets or other expense allocation methodologies determined by the nature of the expense. Expenses directly attributable to the Fund are charged to the Fund. Expenses directly attributable to a specific class of shares are charged to that share class.
Determination of class net asset value
All income, expenses (other than class-specific expenses, which are charged to that share class, as shown in the Consolidated Statement of Operations) and realized and unrealized gains (losses) are allocated to each class of the Fund on a daily basis, based on the relative net assets of each class, for purposes of determining the net asset value of each class.
Federal income tax status
The Fund intends to qualify each year as a regulated investment company under Subchapter M of the Internal Revenue Code, as amended, and will distribute substantially all of its taxable income (including net short-term capital gains), if any, for its tax year, and as such will not be subject to federal income taxes. In addition, the Fund intends to distribute in each calendar year substantially all of its net investment income, capital gains and certain other amounts, if any, such that the Fund should not be subject to federal excise tax. Therefore, no federal income or excise tax provision is recorded.
Columbia Alternative Beta Fund | Annual Report 2017
| 49 |
Notes to Consolidated Financial Statements (continued)
May 31, 2017
Distributions to shareholders
Distributions from net investment income, if any, are declared and paid annually. Net realized capital gains, if any, are distributed along with the income distribution. Income distributions and capital gain distributions are determined in accordance with federal income tax regulations, which may differ from GAAP.
Guarantees and indemnifications
Under the Trust’s organizational documents and, in some cases, by contract, its officers and trustees are indemnified against certain liabilities arising out of the performance of their duties to the Trust or its funds. In addition, certain of the Fund’s contracts with its service providers contain general indemnification clauses. The Fund’s maximum exposure under these arrangements is unknown since the amount of any future claims that may be made against the Fund cannot be determined, and the Fund has no historical basis for predicting the likelihood of any such claims.
Investment company reporting modernization
In October 2016, the U.S. Securities and Exchange Commission adopted new rules and forms, and amendments to certain current rules and forms, to modernize reporting and disclosure of information by registered investment companies. The amendments to Regulation S-X will require standardized, enhanced disclosure about derivatives in investment company financial statements, and will also change the rules governing the form and content of such financial statements. The amendments to Regulation S-X take effect on August 1, 2017. At this time, management is assessing the anticipated impact of these regulatory developments.
Note 3. Fees and other transactions with affiliates
Management services fees
The Fund entered into a Management Agreement with the Investment Manager, a wholly-owned subsidiary of Ameriprise Financial. Under the Management Agreement, the Investment Manager provides the Fund with investment research and advice, as well as administrative and accounting services. Effective October 1, 2016, the management services fee is an annual fee that is equal to a percentage of the Fund’s average daily net assets that declines from 0.96% to 0.93% as the Fund’s net assets increase. Prior to October 1, 2016, the management services fee was equal to a percentage of the Fund’s average daily net assets that declined from 1.33% to 1.30% as the Fund’s net assets increased.
Effective October 1, 2016, the Investment Manager has contractually agreed to waive 0.21% of the management fee through September 30, 2019. Prior to October 1, 2016, the Investment Manager contractually agreed to waive 0.10% of the management fee. The effective management fee rate, net of fee waivers, for the year ended May 31, 2017 was 0.86% of the Fund’s average daily net assets.
Prior to October 1, 2016, in addition to the fees and expenses which the Fund bears directly, the Fund indirectly bears a pro rata share of the fees and expenses of the Underlying Funds in which the Fund invests. Because the Underlying Funds have varied expense and fee levels and the Fund may own different proportions of Underlying Funds at different times, the amount of fees and expenses incurred indirectly by the Fund will vary. These expenses are not reflected in the expenses shown in the Consolidated Statement of Operations and are not included in the ratios to average net assets shown in the Consolidated Financial Highlights.
Subadvisory agreement
The Fund’s Board of Trustees has approved a subadvisory agreement between the Investment Manager and Threadneedle International Limited (Threadneedle), an affiliate of the Investment Manager and an indirect wholly-owned subsidiary of Ameriprise Financial. As of May 31, 2017, Threadneedle is not providing services to the Fund pursuant to the subadvisory agreement.
| 50 | Columbia Alternative Beta Fund | Annual Report 2017 |
Notes to Consolidated Financial Statements (continued)
May 31, 2017
Compensation of board members
Members of the Board of Trustees, who are not officers or employees of the Investment Manager or Ameriprise Financial, are compensated for their services to the Fund as disclosed in the Consolidated Statement of Operations. These members of the Board of Trustees may participate in a Deferred Compensation Plan (the Plan) which may be terminated at any time. Obligations of the Plan will be paid solely out of the Fund’s assets, and all amounts payable under the Plan constitute a general unsecured obligation of the Fund.
Compensation of Chief Compliance Officer
The Board of Trustees has appointed a Chief Compliance Officer to the Fund in accordance with federal securities regulations. A portion of the Chief Compliance Officer’s total compensation is allocated to the Fund, along with other affiliated funds governed by the Board of Trustees, based on relative net assets. The total amount allocated to all affiliated funds governed by the Board of Trustees will not exceed $40,000 annually.
Transfer agency fees
Under a Transfer and Dividend Disbursing Agent Agreement, Columbia Management Investment Services Corp. (the Transfer Agent), an affiliate of the Investment Manager and a wholly-owned subsidiary of Ameriprise Financial, is responsible for providing transfer agency services to the Fund. The Transfer Agent has contracted with Boston Financial Data Services (BFDS) to serve as sub-transfer agent. The Transfer Agent pays the fees of BFDS for services as sub-transfer agent and BFDS is not entitled to reimbursement for such fees from the Fund (with the exception of out-of-pocket fees).
The Fund pays the Transfer Agent a monthly transfer agency fee based on the number or the average value of accounts, depending on the type of account. In addition, prior to October 1, 2016, the Transfer Agent also received sub-transfer agency fees based on a percentage of the average aggregate value of the Fund’s shares maintained in omnibus accounts (other than omnibus accounts for which American Enterprise Investment Services Inc. is the broker of record or accounts where the beneficial shareholder is a customer of Ameriprise Financial Services, Inc., for which the Transfer Agent receives a per account fee). Effective October 1, 2016, the Fund pays the Transfer Agent a fee for shareholder services based on the number of accounts or on a percentage of the average aggregate value of the Fund’s shares maintained in omnibus accounts up to the lesser of the amount charged by the financial intermediary or a cap established by the Board of Trustees from time to time.
The Transfer Agent also receives compensation from the Fund for various shareholder services and reimbursements for certain out-of-pocket fees. Effective January 1, 2017, total transfer agency fees for Class R5 shares are subject to an annual limitation of not more than 0.075% of the average daily net assets attributable to Class R5 shares. Total transfer agency fees for Class I, prior to March 27, 2017 were, and Class Y shares are subject to an annual limitation of not more than 0.025% of the average daily net assets attributable to each share class. Prior to January 1, 2017, total transfer agency fees for Class R5 shares were subject to an annual limitation of not more than 0.05% of the average daily net assets attributable to Class R5 shares and Class I and Class Y shares did not pay transfer agency fees.
For the year ended May 31, 2017, the Fund’s effective transfer agency fee rates as a percentage of average daily net assets of each class were as follows:
| | Effective rate (%) |
| Class A | 0.20 |
| Class C | 0.20 |
| Class I | 0.004 (a),(b) |
| Class R | 0.19 |
| Class R4 | 0.20 |
| Class R5 | 0.045 |
| Class T | 0.20 |
| Class Y | 0.015 |
| Class Z | 0.20 |
Columbia Alternative Beta Fund | Annual Report 2017
| 51 |
Notes to Consolidated Financial Statements (continued)
May 31, 2017
| (a) | Annualized. |
| (b) | Effective March 27, 2017, Class I shares were redeemed or exchanged for Class Y shares. |
An annual minimum account balance fee of $20 may apply to certain accounts with a value below the applicable share class’s initial minimum investment requirements to reduce the impact of small accounts on transfer agency fees. These minimum account balance fees are remitted to the Fund and recorded as part of expense reductions in the Consolidated Statement of Operations. For the year ended May 31, 2017, no minimum account balance fees were charged by the Fund.
Distribution and service fees
The Fund has an agreement with Columbia Management Investment Distributors, Inc. (the Distributor), an affiliate of the Investment Manager and a wholly-owned subsidiary of Ameriprise Financial, for distribution and shareholder services. The Board of Trustees has approved, and the Fund has adopted, distribution and shareholder service plans (the Plans) applicable to certain share classes, which set the distribution and service fees for the Fund. These fees are calculated daily and are intended to compensate the Distributor and/or eligible selling and/or servicing agents for selling shares of the Fund and providing services to investors.
Under the Plans, the Fund pays a monthly service fee to the Distributor at the maximum annual rate of 0.25% of the average daily net assets attributable to Class A, Class C and Class T shares of the Fund. Also under the Plans, the Fund pays a monthly distribution fee to the Distributor at the maximum annual rates of 0.75%, 0.50% and 0.25% of the average daily net assets attributable to Class C, Class R and Class T shares of the Fund, respectively.
Although the Fund may pay a distribution fee up to 0.25% of the Fund’s average daily net assets attributable to Class T shares and a service fee of up to 0.25% of the Fund’s average daily net assets attributable to Class T shares, the aggregate fee shall not exceed 0.25% of the Fund’s average daily net assets attributable to Class T shares.
Sales charges (unaudited)
Sales charges, including front-end charges and CDSCs, received by the Distributor for distributing Fund shares for the year ended May 31, 2017, if any, are listed below:
| | Amount ($) |
| Class A | 17,959 |
| Class C | 487 |
Expenses waived/reimbursed by the Investment Manager and its affiliates
Effective October 1, 2016, the Investment Manager and certain of its affiliates have contractually agreed to waive fees and/or reimburse expenses (excluding certain fees and expenses described below) for the period disclosed below, so that the Fund’s net operating expenses, after giving effect to fees waived/expenses reimbursed and any balance credits and/or overdraft charges from the Fund’s custodian, do not exceed the following annual rates as a percentage of the class’ average daily net assets:
| | October 1, 2016
through
September 30, 2017 |
| Class A | 1.380% |
| Class C | 2.130 |
| Class R | 1.630 |
| Class R4 | 1.130 |
| Class R5 | 1.010 |
| Class T | 1.380 |
| Class Y | 0.960 |
| Class Z | 1.130 |
| 52 | Columbia Alternative Beta Fund | Annual Report 2017 |
Notes to Consolidated Financial Statements (continued)
May 31, 2017
Under the agreement governing these fee waivers and/or expense reimbursement arrangements, the following fees and expenses are excluded from the waiver/reimbursement commitment, and therefore will be paid by the Fund, if applicable: taxes (including foreign transaction taxes), expenses associated with investments in affiliated and non-affiliated pooled investment vehicles (including mutual funds and exchange-traded funds), transaction costs and brokerage commissions, costs related to any securities lending program, dividend and interest expenses associated with securities sold short, inverse floater program fees and expenses, transaction charges and interest on borrowed money, interest, infrequent and/or unusual expenses and any other expenses the exclusion of which is specifically approved by the Board of Trustees. This agreement may be modified or amended only with approval from the Investment Manager, certain of its affiliates and the Fund. Any fees waived and/or expenses reimbursed under the expense reimbursement arrangements described above are not recoverable by the Investment Manager or its affiliates in future periods. Reflected in the cap commitments is the Investment Manager’s contractual agreement to waive 0.21% of its management fee, with this waiver agreement in effect through September 30, 2019, unless sooner terminated at the sole discretion of the Board of Trustees.
Prior to October 1, 2016, the Investment Manager and certain of its affiliates had contractually agreed to waive fees and/or reimburse expenses (excluding certain fees and expenses described below) for the period disclosed below, so that the Fund’s net operating expenses, including indirect expenses of the Underlying Funds, after giving effect to fees waived/expenses reimbursed and any balance credits and/or overdraft charges from the Fund’s custodian, did not exceed the following annual rates as a percentage of the class’ average daily net assets:
| | Prior to
October 1, 2016 |
| Class A | 2.85% |
| Class C | 3.60 |
| Class I | 2.45 |
| Class R | 3.10 |
| Class R4 | 2.60 |
| Class R5 | 2.50 |
| Class W | 2.85 |
| Class Y | 2.45 |
| Class Z | 2.60 |
Under the agreement governing these fee waivers and/or expense reimbursement arrangements, the following fees and expenses were excluded from the waiver/reimbursement commitment, and therefore were paid by the Fund, if applicable: taxes (including foreign transaction taxes), transaction costs and brokerage commissions, costs related to any securities lending program, dividend and interest expenses associated with securities sold short by the Fund and an unaffiliated mutual fund directly invested in by the Fund since November 24, 2015 through September 27, 2016, inverse floater program fees and expenses, transaction charges and interest on borrowed money, interest, infrequent and/or unusual expenses and any other expenses the exclusion of which is specifically approved by the Board of Trustees. This agreement may be modified or amended only with approval from the Investment Manager, certain of its affiliates and the Fund. Any fees waived and/or expenses reimbursed under the expense reimbursement arrangements described above were not recoverable by the Investment Manager or its affiliates in future periods. The annual rates in the table above included the contractual waiver of 0.10% of the management fee through September 30, 2016, as described above.
Note 4. Federal tax information
The timing and character of income and capital gain distributions are determined in accordance with income tax regulations, which may differ from GAAP because of temporary or permanent book to tax differences.
At May 31, 2017, these differences are primarily due to differing treatment for re-characterization of distributions for investments, derivative investments, swap investments, capital loss carryforwards, trustees’ deferred compensation and foreign currency transactions. To the extent these differences are permanent, reclassifications are made among the components of the Fund’s net assets in the Consolidated Statement of Assets and Liabilities. Temporary differences do not require reclassifications.
Columbia Alternative Beta Fund | Annual Report 2017
| 53 |
Notes to Consolidated Financial Statements (continued)
May 31, 2017
In the Consolidated Statement of Assets and Liabilities the following reclassifications were made:
Undistributed net
investment
income ($) | Accumulated
net realized
(loss) ($) | Paid in
capital ($) |
| 17,415,595 | (15,261,128) | (2,154,467) |
Net investment income (loss) and net realized gains (losses), as disclosed in the Consolidated Statement of Operations, and net assets were not affected by this reclassification.
The tax character of distributions paid during the years indicated was as follows:
| May 31, 2017 | May 31, 2016 |
Ordinary
income ($) | Long-term
capital gains ($) | Total ($) | Ordinary
income (S) | Long-term
capital gains ($) | Total ($) |
| 1,684,933 | — | 1,684,933 | 999,805 | — | 999,805 |
Short-term capital gain distributions, if any, are considered ordinary income distributions for tax purposes.
At May 31, 2017, the components of distributable earnings on a tax basis were as follows:
Undistributed
ordinary income ($) | Undistributed
long-term
capital gains ($) | Capital loss
carryforwards ($) | Net unrealized
(depreciation) ($) |
| 15,422,020 | — | (10,185,772) | (10,470,201) |
At May 31, 2017, the cost of investments for federal income tax purposes along with the aggregate gross unrealized appreciation and depreciation based on that cost was:
Federal
tax cost ($) | Gross unrealized
appreciation ($) | Gross unrealized
(depreciation) ($) | Net unrealized
(depreciation) ($) |
| 550,709,106 | 318 | (10,470,519) | (10,470,201) |
The following capital loss carryforwards, determined at May 31, 2017, may be available to reduce taxable income arising from future net realized gains on investments, if any, to the extent permitted by the Internal Revenue Code. Capital loss carryforwards with no expiration are required to be utilized prior to any capital losses which carry an expiration date. As a result of this ordering rule, capital loss carryforwards which carry an expiration date may be more likely to expire unused. In addition, for the year ended May 31, 2017, capital loss carryforwards utilized, expired unused and permanently lost were as follows:
| 2018 ($) | 2019 ($) | No expiration
short-term ($) | No expiration
long-term ($) | Total ($) | Utilized ($) | Expired ($) | Permanently
lost ($) |
| — | — | 9,504,956 | 680,816 | 10,185,772 | — | — | — |
Management of the Fund has concluded that there are no significant uncertain tax positions in the Fund that would require recognition in the financial statements. However, management’s conclusion may be subject to review and adjustment at a later date based on factors including, but not limited to, new tax laws, regulations, and administrative interpretations (including relevant court decisions). Generally, the Fund’s federal tax returns for the prior three fiscal years remain subject to examination by the Internal Revenue Service.
Note 5. Portfolio information
The cost of purchases and proceeds from sales of securities, excluding short-term investments and derivatives, if any, aggregated to $28,556,875 and $150,451,477, respectively, for the year ended May 31, 2017. The amount of purchase and sale activity impacts the portfolio turnover rate reported in the Consolidated Financial Highlights.
| 54 | Columbia Alternative Beta Fund | Annual Report 2017 |
Notes to Consolidated Financial Statements (continued)
May 31, 2017
Note 6. Affiliated money market fund
The Fund invests significantly in Columbia Short-Term Cash Fund, an affiliated money market fund established for the exclusive use by the Fund and other affiliated funds (the Affiliated MMF). The income earned by the Fund from such investments is included as Dividends - affiliated issuers in the Consolidated Statement of Operations. As an investing fund, the Fund indirectly bears its proportionate share of the expenses of the Affiliated MMF. Effective October 1, 2016, the Affiliated MMF prices its shares with a floating net asset value (NAV) and no longer seeks to maintain a stable NAV. In addition, the Board of Trustees of the Affiliated MMF may impose a fee on redemptions (sometimes referred to as a liquidity fee) or temporarily suspend redemptions (sometimes referred to as imposing a redemption gate) in the event its liquidity falls below regulatory limits.
Note 7. Line of credit
The Fund has access to a revolving credit facility with a syndicate of banks led by Citibank, N.A., HSBC Bank USA, N.A. and JPMorgan Chase Bank, N.A. whereby the Fund may borrow for the temporary funding of shareholder redemptions or for other temporary or emergency purposes. The credit facility agreement, which is a collective agreement between the Fund and certain other funds managed by the Investment Manager, severally and not jointly, permits collective borrowings up to $1 billion. Interest is charged to each participating fund based on its borrowings at a rate equal to the higher of (i) the overnight federal funds rate plus 1.00% or (ii) the one-month LIBOR rate plus 1.00%. Each borrowing under the credit facility matures no later than 60 days after the date of borrowing. The Fund also pays a commitment fee equal to its pro rata share of the amount of the credit facility at a rate of 0.15% per annum. The commitment fee is included in other expenses in the Consolidated Statement of Operations.
The Fund had no borrowings during the year ended May 31, 2017.
Note 8. Significant risks
Derivatives risk
Losses involving derivative instruments may be substantial, because a relatively small price movement in the underlying security(ies), commodity, currency or index or other instrument or asset may result in a substantial loss for the Fund. In addition to the potential for increased losses, the use of derivative instruments may lead to increased volatility within the Fund. Derivatives will typically increase the Fund’s exposure to principal risks to which it is otherwise exposed, and may expose the Fund to additional risks, including correlation risk, counterparty risk, hedging risk, leverage risk and liquidity risk.
Non-diversification risk
A non-diversified fund is permitted to invest a greater percentage of its total assets in fewer issuers than a diversified fund. The Fund may, therefore, have a greater risk of loss from a few issuers than a similar fund that invests more broadly.
Shareholder concentration risk
At May 31, 2017, affiliated shareholders of record owned 99.6% of the outstanding shares of the Fund in one or more accounts. Subscription and redemption activity by concentrated accounts may have a significant effect on the operations of the Fund. In the case of a large redemption, the Fund may be forced to sell investments at inopportune times, including its liquid or more liquid positions, resulting in Fund losses and the Fund holding a higher percentage of less liquid or illiquid securities. Large redemptions could result in decreased economies of scale and increased operating expenses for non-redeeming Fund shareholders.
Note 9. Subsequent events
Management has evaluated the events and transactions that have occurred through the date the financial statements were issued and noted no items requiring adjustment of the financial statements or additional disclosure.
Columbia Alternative Beta Fund | Annual Report 2017
| 55 |
Notes to Consolidated Financial Statements (continued)
May 31, 2017
Note 10. Information regarding pending and settled legal proceedings
Ameriprise Financial and certain of its affiliates have historically been involved in a number of legal, arbitration and regulatory proceedings, including routine litigation, class actions, and governmental actions, concerning matters arising in connection with the conduct of their business activities. Ameriprise Financial believes that the Funds are not currently the subject of, and that neither Ameriprise Financial nor any of its affiliates are the subject of, any pending legal, arbitration or regulatory proceedings that are likely to have a material adverse effect on the Funds or the ability of Ameriprise Financial or its affiliates to perform under their contracts with the Funds. Ameriprise Financial is required to make quarterly (10-Q), annual (10-K) and, as necessary, 8-K filings with the Securities and Exchange Commission (SEC) on legal and regulatory matters that relate to Ameriprise Financial and its affiliates. Copies of these filings may be obtained by accessing the SEC website at www.sec.gov.
There can be no assurance that these matters, or the adverse publicity associated with them, will not result in increased Fund redemptions, reduced sale of Fund shares or other adverse consequences to the Funds. Further, although we believe proceedings are not likely to have a material adverse effect on the Funds or the ability of Ameriprise Financial or its affiliates to perform under their contracts with the Funds, these proceedings are subject to uncertainties and, as such, we are unable to estimate the possible loss or range of loss that may result. An adverse outcome in one or more of these proceedings could result in adverse judgments, settlements, fines, penalties or other relief that could have a material adverse effect on the consolidated financial condition or results of operations of Ameriprise Financial.
| 56 | Columbia Alternative Beta Fund | Annual Report 2017 |
Report of Independent Registered Public Accounting Firm
To the Trustees of Columbia Funds Series Trust I and the Shareholders of Columbia Alternative Beta Fund (formerly known as Columbia Adaptive Alternatives Fund)
In our opinion, the accompanying consolidated statement of assets and liabilities, including the consolidated portfolio of investments, and the related consolidated statements of operations and of changes in net assets and the consolidated financial highlights present fairly, in all material respects, the financial position of Columbia Alternative Beta Fund (formerly known as Columbia Adaptive Alternatives Fund) (the “Fund”, a series of Columbia Funds Series Trust I) and its subsidiary as of May 31, 2017, the results of their operations for the year then ended, the changes in their net assets for each of the two years in the period then ended and the financial highlights for each of the two years in the period then ended and for the period January 28, 2015 (commencement of operations) through May 31, 2015, in conformity with accounting principles generally accepted in the United States of America. These financial statements and financial highlights (hereafter referred to as “financial statements”) are the responsibility of the Fund’s management. Our responsibility is to express an opinion on these financial statements based on our audits. We conducted our audits of these financial statements in accordance with the standards of the Public Company Accounting Oversight Board (United States). Those standards require that we plan and perform the audit to obtain reasonable assurance about whether the financial statements are free of material misstatement. An audit includes examining, on a test basis, evidence supporting the amounts and disclosures in the financial statements, assessing the accounting principles used and significant estimates made by management, and evaluating the overall financial statement presentation. We believe that our audits, which included confirmation of securities as of May 31, 2017 by correspondence with the custodian, brokers and transfer agent, provide a reasonable basis for our opinion.
PricewaterhouseCoopers LLP
Minneapolis, MN
July 21, 2017
Columbia Alternative Beta Fund | Annual Report 2017
| 57 |
Shareholders elect the Board that oversees the Fund’s operations. The Board appoints officers who are responsible for day-to-day business decisions based on policies set by the Board. The following table provides basic biographical information about the Fund’s Trustees, including their principal occupations during the past five years, although specific titles for individuals may have varied over the period. The year set forth beneath Length of Service in the table below is the year in which the Trustee was first appointed or elected as Trustee to any Fund currently in the Columbia Funds Complex or a predecessor thereof. Under current Board policy, members serve terms of indefinite duration.
Independent trustees
| Name, address, year of birth | Position held with the Trust and length of service | Principal occupation(s) during the past five years and other relevant professional experience | Number of Funds in the Columbia Fund Complex overseen | Other directorships held by Trustee during the past five years |
Janet Langford Carrig
c/o Columbia Management
Investment Advisers, LLC
225 Franklin Street
Mail Drop BX32 05228
Boston, MA 02110
1957 | Trustee
1996 | Senior Vice President, General Counsel and Corporate Secretary, ConocoPhillips (independent energy company) since September 2007 | 57 | None |
Douglas A. Hacker
c/o Columbia Management
Investment Advisers, LLC
225 Franklin Street
Mail Drop BX32 05228
Boston, MA 02110
1955 | Trustee and Chairman of the Board
1996 | Independent business executive since May 2006; Executive Vice President — Strategy of United Airlines from December 2002 to May 2006; President of UAL Loyalty Services (airline marketing company) from September 2001 to December 2002; Executive Vice President and Chief Financial Officer of United Airlines from July 1999 to September 2001 | 57 | Spartan Nash Company, (food distributor); Nash Finch Company (food distributor) from 2005 to 2013; Aircastle Limited (aircraft leasing); SeaCube Container Leasing Ltd. (container leasing) from 2010 to 2013; and Travelport Worldwide Limited (travel information technology) |
Nancy T. Lukitsh
c/o Columbia Management
Investment Advisers, LLC
225 Franklin Street
Mail Drop BX32 05228
Boston, MA 02110
1956 | Trustee
2011 | Senior Vice President, Partner and Director of Marketing, Wellington Management Company, LLP (investment adviser) from 1997 to 2010; Chair, Wellington Management Portfolios (commingled non-U.S. investment pools) from 2007 to 2010; Director, Wellington Trust Company, NA and other Wellington affiliates from 1997 to 2010 | 57 | None |
David M. Moffett
c/o Columbia Management
Investment Advisers, LLC
225 Franklin Street
Mail Drop BX32 05228
Boston, MA 02110
1952 | Trustee
2011 | Retired. Consultant to Bridgewater and Associates | 57 | Director, CSX Corporation; Genworth Financial, Inc. (financial and insurance products and services); PayPal Holdings Inc. (payment and data processing services); Trustee, University of Oklahoma Foundation; former Director, eBay Inc. (online trading community), 2007-2015; and former Director, CIT Bank, CIT Group Inc. (commercial and consumer finance), 2010-2016 |
| 58 | Columbia Alternative Beta Fund | Annual Report 2017 |
TRUSTEES AND OFFICERS (continued)
Independent trustees (continued)
| Name, address, year of birth | Position held with the Trust and length of service | Principal occupation(s) during the past five years and other relevant professional experience | Number of Funds in the Columbia Fund Complex overseen | Other directorships held by Trustee during the past five years |
Charles R. Nelson
c/o Columbia Management
Investment Advisers, LLC
225 Franklin Street
Mail Drop BX32 05228
Boston, MA 02110
1942 | Trustee
1981 | Retired. Professor Emeritus, University of Washington since 2011; Professor of Economics, University of Washington from 1976 to 2011; Ford and Louisa Van Voorhis Professor of Political Economy, University of Washington from 1993 to 2011; Adjunct Professor of Statistics, University of Washington from 1980 to 2011; Associate Editor, Journal of Money, Credit and Banking from September 1993 to 2008; consultant on econometric and statistical matters | 57 | None |
John J. Neuhauser
c/o Columbia Management
Investment Advisers, LLC
225 Franklin Street
Mail Drop BX32 05228
Boston, MA 02110
1943 | Trustee
1984 | President, Saint Michael’s College since August 2007; Director or Trustee of several non-profit organizations, including University of Vermont Medical Center; Academic Vice President and Dean of Faculties, Boston College from August 1999 to October 2005; University Professor, Boston College from November 2005 to August 2007 | 57 | Liberty All-Star Equity Fund and Liberty All- Star Growth Fund (closed-end funds) |
Patrick J. Simpson
c/o Columbia Management
Investment Advisers, LLC
225 Franklin Street
Mail Drop BX32 05228
Boston, MA 02110
1944 | Trustee
2000 | Of Counsel, Perkins Coie LLP (law firm) since 2015; Partner, Perkins Coie LLP from 1988 to 2014 | 57 | None |
Anne-Lee Verville
c/o Columbia Management
Investment Advisers, LLC
225 Franklin Street
Mail Drop BX32 05228
Boston, MA 02110
1945 | Trustee
1998 | Retired. General Manager, Global Education Industry from 1994 to 1997, President – Application Systems Division from 1991 to 1994, Chief Financial Officer – US Marketing & Services from 1988 to 1991, and Chief Information Officer from 1987 to 1988, IBM Corporation (computer and technology) | 57 | Enesco Group, Inc. (producer of giftware and home and garden decor products) from 2001 to 2006 |
Columbia Alternative Beta Fund | Annual Report 2017
| 59 |
TRUSTEES AND OFFICERS (continued)
Consultants to the independent trustees*
| Name, address, year of birth | Position held with the Trust and length of service | Principal occupation(s) during the past five years and other relevant professional experience | Number of Funds in the Columbia Funds complex overseen | Other directorships held by Trustee during the past five years |
J. Kevin Connaughton
c/o Columbia
Management Investment
Advisers, LLC,
225 Franklin Street
Mail Drop BX32 05228,
Boston, MA 02110
1964 | Independent Trustee Consultant
2016 | Independent Trustee Consultant, Columbia Funds since March 2016; Managing Director and General Manager of Mutual Fund Products, Columbia Management Investment Advisers, LLC from May 2010 to February 2015; President, Columbia Funds from 2009 to 2015; and senior officer of Columbia Funds and affiliated funds from 2003 to 2015 | 57 | Board of Governors, Gateway Healthcare since January 2016; Trustee, New Century Portfolios since March 2015; and Director, The Autism Project since March 2015 |
Natalie A. Trunow
c/o Columbia
Management Investment
Advisers, LLC,
225 Franklin Street
Mail Drop BX32 05228,
Boston, MA 02110
1967 | Independent Trustee Consultant
2016 | Independent Trustee Consultant, Columbia Funds since September 2016; Chief Executive Officer, Millennial Partners (investment consulting services to institutions) since January 2016; Director of Investments, Casey Family Programs from April 2016 to September 2016; Senior Vice President and Chief Investment Officer, Calvert Investments from August 2008 to January 2016; Section Head and Portfolio Manager, General Motors Asset Management from June 1997 to August 2008 | 57 | Healthcare Services for Children with Special Needs |
| * | J. Kevin Connaughton was appointed consultant to the Independent Trustees effective March 1, 2016. Natalie A. Trunow was appointed consultant to the Independent Trustees effective September 1, 2016. Shareholders of the Funds are expected to be asked to elect each of Mr. Connaughton and Ms. Trunow as a Trustee at a future shareholder meeting. |
Interested trustee affiliated with Investment Manager*
| Name, address, year of birth | Position held with the Trust and length of service | Principal occupation(s) during the past five years and other relevant professional experience | Number of Funds in the Columbia Funds Complex overseen | Other directorships held by Trustee during the past five years |
William F. Truscott
c/o Columbia Management
Investment Advisers, LLC
225 Franklin Street
Boston, MA 02110
1960 | Trustee
2012 | Chairman of the Board and President, Columbia Management Investment Advisers, LLC since May 2010 and February 2012, respectively; Chief Executive Officer, Global Asset Management, Ameriprise Financial, Inc. since September 2012 (previously Chief Executive Officer, U.S. Asset Management & President, Annuities, May 2010-September 2012); Director and Chief Executive Officer, Columbia Management Investment Distributors, Inc. since May 2010 and February 2012, respectively; Chairman of the Board and Chief Executive Officer, RiverSource Distributors, Inc. since 2006; Director, Threadneedle Asset Management Holdings, SARL since 2014; President and Chief Executive Officer, Ameriprise Certificate Company, 2006-August 2012 | 179 | Chairman of the Board, Columbia Management Investment Advisers, LLC since May 2010; Director, Columbia Management Investment Distributors, Inc. since May 2010; former Director, Ameriprise Certificate Company, 2006 - January 2013 |
| * | Interested person (as defined under the 1940 Act) by reason of being an officer, director, security holder and/or employee of the Investment Manager or Ameriprise Financial. |
The Statement of Additional Information has additional information about the Fund’s Board members and is available,
without charge, upon request by calling 800.345.6611; contacting your financial intermediary; or visiting
investor.columbiathreadneedleus.com.
| 60 | Columbia Alternative Beta Fund | Annual Report 2017 |
TRUSTEES AND OFFICERS (continued)
The Board has appointed officers who are responsible for day-to-day business decisions based on policies it has established. The officers serve at the pleasure of the Board. The following table provides basic information about the Officers of the Fund, including principal occupations during the past five years, although their specific titles may have varied over the period. In addition to Mr. Truscott, who is Senior Vice President, the Fund’s other officers are:
Fund officers
Name,
address and
year of birth | Position and year
first appointed to
position for any Fund
in the Columbia
Funds complex or a
predecessor thereof | Principal occupation(s) during past five years |
Christopher O. Petersen
5228 Ameriprise
Financial Center
Minneapolis, MN 55474
Born 1970 | President and Principal Executive Officer (2015) | Vice President and Lead Chief Counsel, Ameriprise Financial, Inc. since January 2015 (previously, Vice President and Chief Counsel, January 2010 - December 2014; officer of Columbia Funds and affiliated funds since 2007. |
Michael G. Clarke
225 Franklin Street
Boston, MA 02110
Born 1969 | Treasurer (2011), Chief Financial Officer (2009) and Chief Accounting Officer (2015) | Vice President — Mutual Fund Administration, Columbia Management Investment Advisers, LLC, since May 2010; senior officer of Columbia Funds and affiliated funds since 2002. |
Paul B. Goucher
100 Park Avenue
New York, NY 10017
Born 1968 | Senior Vice President (2011) and Assistant Secretary (2008) | Senior Vice President and Assistant General Counsel, Ameriprise Financial, Inc. since January 2017 (previously Vice President and Lead Chief Counsel, November 2008 - January 2017 and January 2013 - January 2017, respectively; and Chief Counsel, January 2010 - January 2013); Vice President, Chief Legal Officer and Assistant Secretary, Columbia Management Investment Advisers, LLC since May 2010. |
Thomas P. McGuire
225 Franklin Street
Boston, MA 02110
Born 1972 | Senior Vice President and Chief Compliance Officer (2012) | Vice President — Asset Management Compliance, Ameriprise Financial, Inc., since May 2010; Chief Compliance Officer, Ameriprise Certificate Company since September 2010. |
Colin Moore
225 Franklin Street
Boston, MA 02110
Born 1958 | Senior Vice President (2010) | Executive Vice President and Global Chief Investment Officer, Ameriprise Financial, Inc., since July 2013; Executive Vice President and Global Chief Investment Officer, Columbia Management Investment Advisers, LLC since July 2013 (previously Director and Global Chief Investment Officer, 2010 - 2013). |
Ryan C. Larrenaga
225 Franklin Street
Boston, MA 02110
Born 1970 | Senior Vice President (2017), Chief Legal Officer (2017) and Secretary (2015) | Vice President and Group Counsel, Ameriprise Financial, Inc. since August 2011; officer of Columbia Funds and affiliated funds since 2005. |
Michael E. DeFao
225 Franklin Street
Boston, MA 02110
Born 1968 | Vice President (2011) and Assistant Secretary (2010) | Vice President and Chief Counsel, Ameriprise Financial, Inc. since May 2010. |
Amy Johnson
5228 Ameriprise
Financial Center
Minneapolis, MN 55474
Born 1965 | Vice President (2006) | Managing Director and Global Head of Operations, Columbia Management Investment Advisers, LLC since April 2016 (previously Managing Director and Chief Operating Officer, 2010 - 2016). |
Lyn Kephart-Strong
5228 Ameriprise
Financial Center
Minneapolis, MN 55474
Born 1960 | Vice President (2015) | President, Columbia Management Investment Services Corp. since October 2014; Vice President & Resolution Officer, Ameriprise Trust Company since August 2009. |
Columbia Alternative Beta Fund | Annual Report 2017
| 61 |
The Fund mails one shareholder report to each shareholder address. If you would like more than one report, please call shareholder services at 800.345.6611 and additional reports will be sent to you.
Proxy voting policies and procedures
The policy of the Board of Trustees is to vote the proxies of the companies in which the Fund holds investments consistent with the procedures as stated in the Statement of Additional Information (SAI). You may obtain a copy of the SAI without charge by calling 800.345.6611; contacting your financial intermediary; visiting investor.columbiathreadneedleus.com; or searching the website of the Securities and Exchange Commission (SEC) at sec.gov. Information regarding how the Fund voted proxies relating to portfolio securities is filed with the SEC by August 31st for the most recent 12-month period ending June 30th of that year, and is available without charge by visiting investor.columbiathreadneedleus.com, or searching the website of the SEC at sec.gov.
Quarterly schedule of investments
The Fund files a complete schedule of portfolio holdings with the SEC for the first and third quarters of each fiscal year on Form N-Q. The Fund’s Form N-Q is available on the SEC’s website at sec.gov and may be reviewed and copied at the SEC’s Public Reference Room in Washington, D.C. Information on the operation of the Public Reference Room may be obtained by calling 800.SEC.0330. The Fund’s complete schedule of portfolio holdings, as filed on Form N-Q, can also be obtained without charge, upon request, by calling 800.345.6611.
Additional Fund information
For more information about the Fund, please visit investor.columbiathreadneedleus.com or call 800.345.6611. Customer Service Representatives are available to answer your questions Monday through Friday from 8 a.m. to 7 p.m. Eastern time.
You may obtain the current net asset value (NAV) of Fund shares at no cost by calling 800.345.6611 or by sending an e-mail to serviceinquiries@columbiathreadneele.com.
Fund investment manager
Columbia Management Investment Advisers, LLC
225 Franklin Street
Boston, MA 02110
Fund distributor
Columbia Management Investment Distributors, Inc.
225 Franklin Street
Boston, MA 02110
Fund transfer agent
Columbia Management Investment Services Corp.
P.O. Box 8081
Boston, MA 02266-8081
| 62 | Columbia Alternative Beta Fund | Annual Report 2017 |
[THIS PAGE INTENTIONALLY LEFT BLANK]
[THIS PAGE INTENTIONALLY LEFT BLANK]
[THIS PAGE INTENTIONALLY LEFT BLANK]
Columbia Alternative Beta Fund
P.O. Box 8081
Boston, MA 02266-8081
Please read and consider the investment objectives, risks, charges and expenses for any fund carefully before investing. For a prospectus and summary prospectus, which contains this and other important information about the Fund, go to
investor.columbiathreadneedleus.com. The Fund is distributed by Columbia Management Investment Distributors, Inc., member FINRA, and managed by Columbia Management Investment Advisers, LLC.
Columbia Threadneedle Investments (Columbia Threadneedle) is the global brand name of the Columbia and Threadneedle group of companies. All rights reserved. Columbia Management Investment Distributors, Inc., 225 Franklin Street, Boston, MA 02110-2804
© 2017 Columbia Management Investment Advisers, LLC.
investor.columbiathreadneedleus.com

Annual Report
May 31, 2017
Columbia Diversified Absolute Return Fund
Not FDIC Insured • No bank guarantee • May lose value
Dear Shareholders,
The current outlook for financial markets is clouded by two primary concerns: the high valuation of equities and the direction of interest rates. Following the U.S. presidential election, U.S. equities rallied based on the assumption that the new administration’s policies would stimulate growth quickly. Unfortunately it’s unclear whether those measures will get passed, much less passed quickly. In fixed income, uncertainty stems from the possibility that interest rates won’t rise as rapidly as expected if the administration’s proposed growth policies are not implemented.
Given this uncertainty, investors value a consistent approach more than ever. Investors want strong, repeatable risk-adjusted returns. Consistency — not surprises. As a leading global asset manager, we believe our consistent, collaborative investment approach enables us to deliver the dependable experience your portfolio demands. So, how do we strive to deliver a consistent investment experience?
Better insights
Your portfolio benefits from the investment insights uncovered by our talented investment teams around the world.
Better decisions
Our collaborative, interactive environment enables our investment teams to construct portfolios that take advantage of the best investment ideas.
Better outcomes
We aim to deliver a consistent experience, which means fewer surprises, dependable insights, and products designed to do the thing you want.
Whether you’re trying to save money to help your children go to college or for your own retirement, it’s the consistency of the return that is most essential. People who chase higher returns are usually also the first to sell when that investment goes through a bad patch. We try to combat this behavioral tendency by offering strategies that aim for a more consistent return. Our goal is for investors to panic less during periods of volatility, which can have a significant effect on their long-term results.
Nothing is more important to us than making sure those who have entrusted us to protect and grow their assets can do what matters most to them: build a nest egg, leave a legacy, and live confidently — now and throughout retirement. It’s why our talented professionals around the world work together to uncover uncommon opportunities and why our process encourages challenge and debate around our most compelling ideas to ensure better informed investment decisions, which hopefully lead to better outcomes for you.
Your success is our priority. Talk to your financial advisor about how working with Columbia Threadneedle Investments may help you position your portfolio for consistent, sustainable outcomes, no matter the market conditions.
Sincerely,
Christopher O. Petersen
President, Columbia Funds
There is no guarantee that investment objectives will be achieved or that any particular investment will be profitable.
Columbia Funds are distributed by Columbia Management Investment Distributors, Inc., member FINRA, and managed by Columbia Management Investment Advisers, LLC.
© 2017 Columbia Management Investment Advisers, LLC. All rights reserved.
Columbia Diversified Absolute Return Fund | Annual Report 2017
Columbia Diversified Absolute Return Fund | Annual Report 2017
Investment objective
Columbia Diversified Absolute Return Fund (the Fund) seeks to provide shareholders with absolute (positive) returns.
Portfolio management
Jeffrey Knight, CFA
Lead manager
Managed Fund since 2015
Brian Virginia
Co-manager
Managed Fund since 2015
Joshua Kutin, CFA
Co-manager
Managed Fund since 2015
Alexander Wilkinson*
Co-manager
Managed Fund since January 2017
*Effective January 27, 2017, Alexander Wilkinson was added as portfolio manager of the Fund. On that same date, Kent Peterson and William Landes no longer serve as portfolio managers of the Fund.
| Average annual total returns (%) (for the period ended May 31, 2017) |
| | | Inception | 1 Year | Life |
| Class A | Excluding sales charges | 02/19/15 | -0.62 | -1.60 |
| | Including sales charges | | -6.37 | -4.13 |
| Class C | Excluding sales charges | 02/19/15 | -1.36 | -2.33 |
| | Including sales charges | | -2.35 | -2.33 |
| Class R4 | 02/19/15 | -0.52 | -1.39 |
| Class R5 | 02/19/15 | -0.21 | -1.21 |
| Class T | Excluding sales charges | 02/19/15 | 1.14 | -0.79 |
| | Including sales charges | | -1.42 | -1.90 |
| Class Y * | 03/01/17 | -0.10 | -1.37 |
| Class Z | 02/19/15 | 0.10 | -1.12 |
| Citi One-Month U.S. Treasury Bill Index | | 0.36 | 0.20 |
Returns for Class A are shown with and without the maximum initial sales charge of 5.75% Returns for Class C are shown with and without the 1.00% contingent deferred sales charge for the first year only. Returns for Class T are shown with and without the maximum applicable sales charge of 2.50% per transaction. Prior to March 27, 2017, Class T shares were known as Class W shares and were sold without a sales charge. The Fund’s other classes are not subject to sales charges and have limited eligibility. Please see the Fund’s prospectus for details. Performance for different share classes will vary based on differences in sales charges and fees associated with each class. All results shown assume reinvestment of distributions during the period. Returns do not reflect the deduction of taxes that a shareholder may pay on Fund distributions or on the redemption of Fund shares. Performance results reflect the effect of any fee waivers or reimbursements of Fund expenses by Columbia Management Investment Advisers, LLC and/or any of its affiliates. Absent these fee waivers or expense reimbursement arrangements, performance results would have been lower.
The performance information shown represents past performance and is not a guarantee of future results. The investment return and principal value of your investment will fluctuate so that your shares, when redeemed, may be worth more or less than their original cost. Current performance may be lower or higher than the performance information shown. You may obtain performance information current to the most recent month-end by contacting your financial intermediary, visiting investor.columbiathreadneedleus.com or calling 800.345.6611.
| * | The returns shown for periods prior to the share class inception date (including returns for the Life of the Fund, if shown, which are since Fund inception) include the returns of the Fund’s oldest share class. Since the Fund launched more than one share class at its inception, Class A shares were used. These returns are adjusted to reflect any higher class-related operating expenses of the newer share classes, as applicable. Please visit investor.columbiathreadneedleus.com/investment-products/mutual-funds/appended-performance for more information. |
The Citi One-Month U.S. Treasury Bill Index, an unmanaged index, is representative of the performance of one-month Treasury bills.
Indices are not available for investment, are not professionally managed and do not reflect sales charges, fees, brokerage commissions, taxes or other expenses of investing. Securities in the Fund may not match those in an index.
| 2 | Columbia Diversified Absolute Return Fund | Annual Report 2017 |
Fund at a Glance (continued)
Performance of a hypothetical $10,000 investment (February 19, 2015 — May 31, 2017)
The chart above shows the change in value of a hypothetical $10,000 investment in Class A shares of Columbia Diversified Absolute Return Fund during the stated time period, and does not reflect the deduction of taxes that a shareholder may pay on Fund distributions or on the redemption of Fund shares.
| Portfolio breakdown — long positions (%) (at May 31, 2017) |
| Common Stocks | 42.9 |
| Corporate Bonds & Notes | 15.2 |
| Exchange-Traded Funds | 5.7 |
| Short-Term Investments Segregated in Connection with Open Derivatives Contracts(a) | 60.5 |
| Total | 124.3 |
| (a) | Includes investments in Money Market Funds (amounting to $38.7 million) which have been segregated to cover obligations relating to the Fund’s investment in derivatives which provide exposure to multiple markets. For a description of the Fund’s investments in derivatives, see Investments in Derivatives following the Consolidated Portfolio of Investments and Note 2 to the Notes to Consolidated Financial Statements. |
Percentages indicated are based upon total investments, net of investments sold short. The Fund’s portfolio composition is subject to change.
| Portfolio breakdown — short positions (%) (at May 31, 2017) |
| Common Stocks | (24.3) |
Percentages indicated are based upon total investments, net of investments sold short. The Fund’s portfolio composition is subject to change.
| Market exposure through derivatives investments (% of notional exposure) (at May 31, 2017)(a) |
| | Long | Short | Net |
| Fixed Income Derivative Contracts | 143.5 | (41.9) | 101.6 |
| Equity Derivative Contracts | 62.3 | (59.7) | 2.6 |
| Foreign Currency Derivative Contracts | 216.2 | (220.4) | (4.2) |
| Total Notional Market Value of Derivative Contracts | 422.0 | (322.0) | 100.0 |
(a) The Fund has market exposure (long and/or short) to fixed income, equity asset classes and foreign currency through its investments in derivatives. The notional exposure of a financial instrument is the nominal or face amount that is used to calculate payments made on that instrument and/or changes in value for the instrument. The notional exposure is a hypothetical underlying quantity upon which payment obligations are computed. Notional exposures provide a gauge for how the Fund may behave given changes in individual markets. For a description of the Fund’s investments in derivatives, see Investments in derivatives following the Consolidated Portfolio of Investments, and Note 2 to the Notes to Consolidated Financial Statements.
Columbia Diversified Absolute Return Fund | Annual Report 2017
| 3 |
Manager Discussion of Fund Performance
At May 31, 2017, approximately 99.2% of the Fund’s shares were owned in the aggregate by affiliated funds-of-funds managed by Columbia Management Investment Advisers, LLC (the Investment Manager). As a result of asset allocation decisions by the Investment Manager, it is possible that the Fund may experience relatively large purchases or redemptions from affiliated funds-of-funds. The Investment Manager seeks to minimize the impact of these transactions by structuring them over a reasonable period of time. The Fund may experience increased expenses as it buys and sells securities as a result of purchases or redemptions by affiliated funds-of-funds.
For the 12-month period that ended May 31, 2017, the Fund’s Class A shares returned -0.62% excluding sales charge. To compare, the Citi One-Month U.S. Treasury Bill Index returned 0.36% over the same period. As an absolute return fund, the Fund employs a benchmark agnostic strategy and thus comparisons to the Citi One-Month U.S. Treasury Bill Index are for information purposes only. This Fund is a diversified portfolio that invests across global asset classes using both traditional and alternative investment strategies.
Global equities and higher risk fixed-income securities advanced during period
Global equities advanced at a swift pace during the 12-month period ended May 31, 2017, driven in large part by increased expectations for economic growth leading up to and following the U.S. elections. These expectations, if realized, could in turn help foster an extension of the business cycle. Inflation expectations also rose for much of the period. The U.S. equity market, as measured by the S&P 500 Index, enjoyed a 109-day streak without a 1% decline during the period, its longest stretch in nearly 22 years. Another broad measure for U.S. equity performance, the Russell 3000 Index, gained 17.69% for the 12-month period ended May 31, 2017. U.S. equity markets flirted with new highs. International developed market equities, as measured by the 16.44% return of the MSCI EAFE Index, posted double-digit gains but modestly trailed their U.S. counterparts, pressured somewhat by a strengthening U.S. dollar. Emerging market equities, as represented by the 27.41% return of the MSCI Emerging Markets Index, actually outperformed U.S. equities, boosted by optimism about economic growth and the diminishing risk of populism in Europe following the French election results. Within fixed-income markets, corporate bonds and emerging market debt were among the best performing sectors, with high-yield corporate bonds leading the way.
Alternative beta strategies posted most negative absolute returns
The Fund invests in three core strategies — alpha, which is intended to have a relatively low correlation to market movements and is derived from active management; tactical beta, which seeks opportunities to earn returns from price movements of broad markets; and alternative beta, which seeks to generate returns with relatively low correlation to overall market movements by employing a systematic, rules-based approach. During the period, the alternative beta strategy component posted the largest negative absolute return, followed by the alpha strategy component, which also posted a negative absolute return. The tactical beta strategy contributed positively to Fund results during the period.
Within the alpha strategies sleeve, which is comprised of five internally managed hedge fund portfolios, the equity long/short alpha strategy and the fixed-income absolute return strategy posted the biggest negative absolute returns. The G10 currency and managed futures strategies performed best and contributed positively to Fund returns. Within the tactical beta sleeve, the adaptive defensive risk allocation strategy and tactical beta strategies contributed positively to the Fund’s absolute returns.
Flexible portfolio structure enabled changes
The Fund features a flexible portfolio structure that employs both fundamental and quantitative methods to identify market opportunities and can dynamically reallocate as market conditions change. During the period, there were several material changes in the Fund’s allocation. In February 2017, we discontinued the global alpha opportunities strategy and replaced it with the global tactical asset allocation strategy. In March 2017, we began implementation of a strategic equity hedge overlay in an effort to more precisely manage the Fund’s overall market direction risk. In May 2017, we added a fixed-income absolute return strategy. Also, within the sleeves’ various internally-managed hedge fund portfolios, there were portfolio manager changes during the period. Given the changes made, the Fund’s portfolio turnover rate for the 12-month period was 135%.
| 4 | Columbia Diversified Absolute Return Fund | Annual Report 2017 |
Manager Discussion of Fund Performance (continued)
At the end of the period, we favored a neutral stance toward equities, given our tactical view that the upside opportunities for stocks — particularly U.S. stocks — seemed modest in comparison with the downside risks. At the end of May 2017, we believed ongoing strength in growth and profits had been largely priced into valuations by investors, so delivery of these outcomes was not expected to drive prices higher by any significant degree in the near term. Downside surprises, however, may spur volatility-induced price declines.
Derivatives usage
The Fund utilizes derivatives for both hedging and non-hedging purposes, including, for example, seeking to enhance returns or as a substitute for a position in an underlying asset or index. During the period, the Fund used futures, options and swaps to more efficiently and cost effectively manage its exposures. These flexible structures, which allow for direct and highly versatile portfolio management applications, detracted from the Fund’s results during the period. Also, the underlying managers of hedge fund strategies employed derivatives and similar instruments as part of their underlying strategies to hedge market exposure and/or to gain implicit leverage, subject to the constraints of the Investment Company Act of 1940.
Absolute return funds are not designed to outperform stocks and bonds in strong markets. Market risk may affect a single issuer, sector of the economy, industry or the market as a whole. Alternative investments involve substantial risks and are more volatile than traditional investments, making them more suitable for investors with an above-average tolerance for risk. Foreign investments subject the Fund to risks, including political, economic, market, social and others within a particular country, as well as to currency instabilities and less stringent financial and accounting standards generally applicable to U.S. issuers. The Fund’s investment in other funds subjects it to the investment performance (positive or negative), risks and expenses of these underlying funds. ETFs trade like stocks, are subject to investment risk and will fluctuate in market value. Investment products, including shares of mutual funds, are not federally or FDIC-insured, are not deposits or obligations of, or guaranteed by any financial institution. The Fund employs multiple strategies independently of one another, which may result in contradicting trades (i.e., with no net benefit to the fund) while increasing transaction costs. Commodity investments may be affected by the overall market and industry- and commodity-specific factors, and may be more volatile and less liquid than other investments. Investing in derivatives is a specialized activity that involves special risks that subject the Fund to significant loss potential, including when used as leverage, and may result in greater fluctuation in Fund value. The Fund’s use of leverage subjects additional Fund assets to the risk of loss. The sales price the Fund (or its underlying investments) could receive for any particular investment may differ from the Fund’s (or underlying investments’) valuation of the investment. Short positions (where the underlying asset is not owned) can create unlimited risk. See the Fund’s prospectus for more information on these and other risks.
The views expressed in this report reflect the current views of the respective parties. These views are not guarantees of future performance and involve certain risks, uncertainties and assumptions that are difficult to predict, so actual outcomes and results may differ significantly from the views expressed. These views are subject to change at any time based upon economic, market or other conditions and the respective parties disclaim any responsibility to update such views. These views may not be relied on as investment advice and, because investment decisions for a Columbia fund are based on numerous factors, may not be relied on as an indication of trading intent on behalf of any particular Columbia fund. References to specific securities should not be construed as a recommendation or investment advice.
Columbia Diversified Absolute Return Fund | Annual Report 2017
| 5 |
Understanding Your Fund’s Expenses
(Unaudited)
As an investor, you incur two types of costs. There are transaction costs, which generally include sales charges on purchases and may include redemption fees. There are also ongoing costs, which generally include management fees, distribution and/or service fees, and other fund expenses. The following information is intended to help you understand your ongoing costs (in dollars) of investing in the Fund and to help you compare these costs with the ongoing costs of investing in other mutual funds.
Analyzing your Fund’s expenses
To illustrate these ongoing costs, we have provided examples and calculated the expenses paid by investors in each share class of the Fund during the period. The actual and hypothetical information in the table is based on an initial investment of $1,000 at the beginning of the period indicated and held for the entire period. Expense information is calculated two ways and each method provides you with different information. The amount listed in the “Actual” column is calculated using the Fund’s actual operating expenses and total return for the period. You may use the Actual information, together with the amount invested, to estimate the expenses that you paid over the period. Simply divide your account value by $1,000 (for example, an $8,600 account value divided by $1,000 = 8.6), then multiply the results by the expenses paid during the period under the “Actual” column. The amount listed in the “Hypothetical” column assumes a 5% annual rate of return before expenses (which is not the Fund’s actual return) and then applies the Fund’s actual expense ratio for the period to the hypothetical return. You should not use the hypothetical account values and expenses to estimate either your actual account balance at the end of the period or the expenses you paid during the period. See “Compare with other funds” below for details on how to use the hypothetical data.
Compare with other funds
Since all mutual funds are required to include the same hypothetical calculations about expenses in shareholder reports, you can use this information to compare the ongoing cost of investing in the Fund with other funds. To do so, compare the hypothetical example with the 5% hypothetical examples that appear in the shareholder reports of other funds. As you compare hypothetical examples of other funds, it is important to note that hypothetical examples are meant to highlight the ongoing costs of investing in a fund only and do not reflect any transaction costs, such as sales charges, or redemption or exchange fees. Therefore, the hypothetical calculations are useful in comparing ongoing costs only, and will not help you determine the relative total costs of owning different funds. If transaction costs were included in these calculations, your costs would be higher.
| December 1, 2016 – May 31, 2017 |
| | Account value at the
beginning of the
period ($) | Account value at the
end of the
period ($) | Expenses paid during
the period ($) | Fund’s annualized
expense ratio (%) |
| | Actual | Hypothetical | Actual | Hypothetical | Actual | Hypothetical | Actual |
| Class A | 1,000.00 | 1,000.00 | 1,024.70 | 1,013.86 | 11.21 | 11.15 | 2.22 |
| Class C | 1,000.00 | 1,000.00 | 1,020.60 | 1,010.17 | 14.91 | 14.83 | 2.96 |
| Class R4 | 1,000.00 | 1,000.00 | 1,024.60 | 1,015.16 | 9.89 | 9.85 | 1.96 |
| Class R5 | 1,000.00 | 1,000.00 | 1,027.70 | 1,015.91 | 9.15 | 9.10 | 1.81 |
| Class T (formerly Class W) | 1,000.00 | 1,000.00 | 1,042.90 | 1,013.96 | 11.21 | 11.05 | 2.20 |
| Class Y | 1,000.00 | 1,000.00 | 1,003.10 (a) | 1,016.26 | 4.30 (a) | 8.75 | 1.74 (a) |
| Class Z | 1,000.00 | 1,000.00 | 1,031.00 | 1,015.16 | 9.92 | 9.85 | 1.96 |
| (a) | Based on operations from March 1, 2017 (commencement of operations) through the stated period end. |
Expenses paid during the period are equal to the annualized expense ratio for each class as indicated above, multiplied by the average account value over the period and then multiplied by the number of days in the Fund’s most recent fiscal half year and divided by 365.
Expenses do not include fees and expenses incurred indirectly by the Fund from its investment in underlying funds, including affiliated and non-affiliated pooled investment vehicles, such as mutual funds and exchange-traded funds.
Had Columbia Management Investment Advisers, LLC and/or certain of its affiliates not waived/reimbursed certain fees and expenses, account value at the end of the period would have been reduced.
| 6 | Columbia Diversified Absolute Return Fund | Annual Report 2017 |
Consolidated Portfolio of Investments
May 31, 2017
(Percentages represent value of investments compared to net assets)
| Common Stocks 34.6% |
| Issuer | Shares | Value ($) |
| Consumer Discretionary 4.9% |
| Automobiles 0.1% |
| General Motors Co.(a) | 2,430 | 82,450 |
| Hotels, Restaurants & Leisure 1.0% |
| Darden Restaurants, Inc.(a) | 2,737 | 243,402 |
| International Game Technology PLC(a) | 7,779 | 138,077 |
| Norwegian Cruise Line Holdings Ltd.(a),(b) | 2,622 | 131,021 |
| Starbucks Corp.(a) | 2,928 | 186,250 |
| Yum China Holdings, Inc.(a),(b) | 2,280 | 87,575 |
| Total | | 786,325 |
| Household Durables 0.4% |
| Mohawk Industries, Inc.(a),(b) | 635 | 151,955 |
| Newell Brands, Inc.(a) | 2,706 | 143,283 |
| Total | | 295,238 |
| Internet & Direct Marketing Retail 1.2% |
| Amazon.com, Inc.(a),(b) | 444 | 441,611 |
| Ctrip.com International Ltd., ADR(a),(b) | 3,103 | 169,579 |
| Expedia, Inc.(a) | 1,246 | 179,150 |
| Liberty Interactive Corp., Class A(b) | 7,205 | 169,029 |
| Total | | 959,369 |
| Media 1.0% |
| 21st Century Fox, Inc., Class A(a) | 4,842 | 131,315 |
| Comcast Corp., Class A | 8,842 | 368,623 |
| DISH Network Corp., Class A(a),(b) | 3,347 | 213,438 |
| Liberty Global PLC, Class A(a),(b) | 2,901 | 88,713 |
| Total | | 802,089 |
| Multiline Retail 0.2% |
| Kohl’s Corp.(a) | 3,633 | 139,616 |
| Specialty Retail 0.9% |
| Burlington Stores, Inc.(a),(b) | 1,188 | 116,246 |
| Foot Locker, Inc.(a) | 1,882 | 111,810 |
| Home Depot, Inc. (The)(a) | 2,302 | 353,380 |
| TJX Companies, Inc. (The)(a) | 1,426 | 107,249 |
| Total | | 688,685 |
| Common Stocks (continued) |
| Issuer | Shares | Value ($) |
| Textiles, Apparel & Luxury Goods 0.1% |
| PVH Corp.(a) | 779 | 82,535 |
| Sequential Brands Group, Inc.(b) | 7,087 | 22,749 |
| Total | | 105,284 |
| Total Consumer Discretionary | 3,859,056 |
| Consumer Staples 3.2% |
| Beverages 0.6% |
| Coca-Cola European Partners PLC(a) | 1,452 | 59,590 |
| Molson Coors Brewing Co., Class B(a) | 1,154 | 109,388 |
| PepsiCo, Inc.(a) | 2,683 | 313,562 |
| Total | | 482,540 |
| Food & Staples Retailing 0.3% |
| SYSCO Corp.(a) | 2,407 | 131,326 |
| Wal-Mart Stores, Inc.(a) | 918 | 72,155 |
| Total | | 203,481 |
| Food Products 1.0% |
| Hershey Co. (The)(a) | 1,577 | 181,781 |
| Lamb Weston Holdings, Inc.(a) | 2,094 | 97,182 |
| Mondelez International, Inc., Class A(a) | 3,063 | 142,705 |
| Pilgrim’s Pride Corp.(a),(b) | 9,171 | 213,409 |
| Tyson Foods, Inc., Class A(a) | 3,082 | 176,722 |
| Total | | 811,799 |
| Household Products 0.3% |
| Energizer Holdings, Inc.(a) | 1,483 | 79,489 |
| Procter & Gamble Co. (The) | 1,748 | 153,981 |
| Total | | 233,470 |
| Personal Products 0.3% |
| Estee Lauder Companies, Inc. (The), Class A(a) | 1,762 | 165,875 |
| Nu Skin Enterprises, Inc., Class A(a) | 771 | 42,312 |
| Total | | 208,187 |
| Tobacco 0.7% |
| Altria Group, Inc.(a) | 3,067 | 231,375 |
| Philip Morris International, Inc.(a) | 2,909 | 348,498 |
| Total | | 579,873 |
| Total Consumer Staples | 2,519,350 |
The accompanying Notes to Consolidated Financial Statements are an integral part of this statement.
Columbia Diversified Absolute Return Fund | Annual Report 2017
| 7 |
Consolidated Portfolio of Investments (continued)
May 31, 2017
| Common Stocks (continued) |
| Issuer | Shares | Value ($) |
| Energy 2.0% |
| Energy Equipment & Services 0.5% |
| Baker Hughes, Inc.(a) | 2,756 | 151,993 |
| Halliburton Co.(a) | 1,604 | 72,485 |
| Oceaneering International, Inc.(a) | 1,204 | 29,354 |
| Schlumberger Ltd.(a) | 1,623 | 112,945 |
| Superior Energy Services, Inc.(a),(b) | 2,160 | 22,399 |
| Total | | 389,176 |
| Oil, Gas & Consumable Fuels 1.5% |
| BP PLC, ADR(a) | 3,453 | 124,826 |
| Cabot Oil & Gas Corp.(a) | 1,938 | 43,004 |
| Canadian Natural Resources Ltd. | 2,789 | 80,491 |
| Cimarex Energy Co.(a) | 432 | 46,466 |
| Continental Resources, Inc.(a),(b) | 1,025 | 38,540 |
| Devon Energy Corp.(a) | 2,312 | 78,562 |
| EOG Resources, Inc.(a) | 727 | 65,655 |
| Exxon Mobil Corp.(a) | 936 | 75,348 |
| Hess Corp.(a) | 1,567 | 71,910 |
| Marathon Petroleum Corp.(a) | 830 | 43,193 |
| Noble Energy, Inc.(a) | 3,163 | 90,746 |
| Phillips 66(a) | 167 | 12,710 |
| RSP Permian, Inc.(a),(b) | 1,542 | 54,880 |
| Suncor Energy, Inc.(a) | 4,681 | 146,562 |
| Valero Energy Corp.(a) | 790 | 48,561 |
| World Fuel Services Corp.(a) | 3,979 | 140,618 |
| WPX Energy, Inc.(a),(b) | 1,157 | 12,519 |
| Total | | 1,174,591 |
| Total Energy | 1,563,767 |
| Financials 4.2% |
| Banks 1.5% |
| Bank of America Corp.(a) | 11,167 | 250,253 |
| BB&T Corp.(a) | 2,540 | 105,791 |
| Citigroup, Inc.(a) | 4,095 | 247,911 |
| Citizens Financial Group, Inc.(a) | 3,718 | 126,784 |
| Fifth Third Bancorp(a) | 5,256 | 124,777 |
| PacWest Bancorp(a) | 2,490 | 116,208 |
| Wells Fargo & Co.(a) | 4,119 | 210,646 |
| Total | | 1,182,370 |
| Common Stocks (continued) |
| Issuer | Shares | Value ($) |
| Capital Markets 1.0% |
| Bank of New York Mellon Corp. (The)(a) | 3,000 | 141,360 |
| Goldman Sachs Group, Inc. (The)(a) | 531 | 112,179 |
| Intercontinental Exchange, Inc.(a) | 1,887 | 113,578 |
| Invesco Ltd.(a) | 2,907 | 92,152 |
| Morgan Stanley(a) | 2,368 | 98,840 |
| S&P Global, Inc.(a) | 1,686 | 240,778 |
| Total | | 798,887 |
| Consumer Finance 0.1% |
| Navient Corp.(a) | 3,784 | 54,603 |
| Diversified Financial Services 0.2% |
| Berkshire Hathaway, Inc., Class B(a),(b) | 891 | 147,264 |
| Insurance 1.2% |
| American International Group, Inc.(a) | 2,396 | 152,458 |
| Hanover Insurance Group, Inc. (The)(a) | 1,923 | 160,359 |
| Hartford Financial Services Group, Inc. (The)(a) | 2,900 | 143,231 |
| MetLife, Inc.(a) | 1,841 | 93,136 |
| Prudential Financial, Inc.(a) | 2,348 | 246,188 |
| Reinsurance Group of America, Inc.(a) | 1,630 | 202,951 |
| Total | | 998,323 |
| Thrifts & Mortgage Finance 0.2% |
| MGIC Investment Corp.(a),(b) | 12,441 | 131,626 |
| Total Financials | 3,313,073 |
| Health Care 4.6% |
| Biotechnology 1.1% |
| AbbVie, Inc.(a) | 1,622 | 107,084 |
| ACADIA Pharmaceuticals, Inc.(a),(b) | 765 | 19,668 |
| Alexion Pharmaceuticals, Inc.(a),(b) | 1,583 | 155,182 |
| Biogen, Inc.(a),(b) | 242 | 59,960 |
| BioMarin Pharmaceutical, Inc.(a),(b) | 701 | 61,436 |
| Celgene Corp.(a),(b) | 1,052 | 120,359 |
| Puma Biotechnology, Inc.(a),(b) | 1,178 | 90,117 |
| Spark Therapeutics, Inc.(a),(b) | 429 | 21,849 |
| TESARO, Inc.(a),(b) | 409 | 61,068 |
| Vertex Pharmaceuticals, Inc.(a),(b) | 1,504 | 185,894 |
| Total | | 882,617 |
The accompanying Notes to Consolidated Financial Statements are an integral part of this statement.
| 8 | Columbia Diversified Absolute Return Fund | Annual Report 2017 |
Consolidated Portfolio of Investments (continued)
May 31, 2017
| Common Stocks (continued) |
| Issuer | Shares | Value ($) |
| Health Care Equipment & Supplies 0.7% |
| Edwards Lifesciences Corp.(a),(b) | 504 | 57,995 |
| Hologic, Inc.(a),(b) | 571 | 24,730 |
| Medtronic PLC(a) | 1,890 | 159,289 |
| Quotient Ltd.(a),(b) | 4,068 | 30,225 |
| Zimmer Biomet Holdings, Inc.(a) | 2,127 | 253,560 |
| Total | | 525,799 |
| Health Care Providers & Services 1.1% |
| Aetna, Inc.(a) | 706 | 102,271 |
| Centene Corp.(a),(b) | 2,592 | 188,257 |
| CIGNA Corp.(a) | 1,202 | 193,799 |
| Humana, Inc.(a) | 519 | 120,543 |
| WellCare Health Plans, Inc.(a),(b) | 1,674 | 287,593 |
| Total | | 892,463 |
| Life Sciences Tools & Services 0.3% |
| Illumina, Inc.(a),(b) | 374 | 66,333 |
| Thermo Fisher Scientific, Inc.(a) | 948 | 163,805 |
| Total | | 230,138 |
| Pharmaceuticals 1.4% |
| Allergan PLC(a) | 728 | 162,890 |
| Eli Lilly & Co.(a) | 2,590 | 206,086 |
| Jazz Pharmaceuticals PLC(a),(b) | 481 | 70,015 |
| Mallinckrodt PLC(a),(b) | 4,078 | 175,884 |
| Merck & Co., Inc. | 4,112 | 267,732 |
| Pfizer, Inc. | 7,666 | 250,295 |
| Total | | 1,132,902 |
| Total Health Care | 3,663,919 |
| Industrials 3.5% |
| Aerospace & Defense 0.4% |
| Boeing Co. (The)(a) | 1,042 | 195,510 |
| L-3 Communications Corp. | 998 | 168,253 |
| Total | | 363,763 |
| Airlines 0.4% |
| Southwest Airlines Co.(a) | 2,377 | 142,834 |
| United Continental Holdings, Inc.(a),(b) | 2,457 | 195,749 |
| Total | | 338,583 |
| Common Stocks (continued) |
| Issuer | Shares | Value ($) |
| Construction & Engineering 0.3% |
| Chicago Bridge & Iron Co. NV(a) | 6,286 | 118,931 |
| Jacobs Engineering Group, Inc.(a) | 1,716 | 89,953 |
| Total | | 208,884 |
| Industrial Conglomerates 0.2% |
| Carlisle Companies, Inc.(a) | 1,594 | 161,520 |
| Machinery 1.4% |
| Crane Co.(a) | 2,556 | 198,294 |
| Cummins, Inc.(a) | 1,217 | 191,921 |
| Gardner Denver Holdings, Inc.(b) | 3,804 | 87,226 |
| Ingersoll-Rand PLC(a) | 2,227 | 199,539 |
| Oshkosh Corp.(a) | 2,638 | 166,511 |
| REV Group, Inc.(a) | 4,350 | 116,797 |
| Xylem, Inc.(a) | 2,793 | 145,627 |
| Total | | 1,105,915 |
| Professional Services 0.3% |
| ManpowerGroup, Inc.(a) | 2,509 | 255,592 |
| Road & Rail 0.3% |
| Norfolk Southern Corp.(a) | 1,857 | 230,324 |
| Trading Companies & Distributors 0.2% |
| HD Supply Holdings, Inc.(a),(b) | 3,734 | 150,667 |
| Total Industrials | 2,815,248 |
| Information Technology 8.2% |
| Communications Equipment 0.6% |
| Cisco Systems, Inc.(a) | 7,707 | 243,002 |
| F5 Networks, Inc.(a),(b) | 1,764 | 226,021 |
| Total | | 469,023 |
| Electronic Equipment, Instruments & Components 0.3% |
| Zebra Technologies Corp., Class A(a),(b) | 2,231 | 232,783 |
| Internet Software & Services 1.5% |
| Akamai Technologies, Inc.(a),(b) | 2,252 | 106,182 |
| Alphabet, Inc., Class A(a),(b) | 600 | 592,254 |
| Facebook, Inc., Class A(a),(b) | 1,387 | 210,075 |
| VeriSign, Inc.(a),(b) | 2,610 | 235,317 |
| Total | | 1,143,828 |
The accompanying Notes to Consolidated Financial Statements are an integral part of this statement.
Columbia Diversified Absolute Return Fund | Annual Report 2017
| 9 |
Consolidated Portfolio of Investments (continued)
May 31, 2017
| Common Stocks (continued) |
| Issuer | Shares | Value ($) |
| IT Services 1.4% |
| Booz Allen Hamilton Holdings Corp.(a) | 4,109 | 162,059 |
| Leidos Holdings, Inc. | 2,513 | 139,622 |
| MasterCard, Inc., Class A(a) | 1,821 | 223,765 |
| Total System Services, Inc.(a) | 2,615 | 155,723 |
| Visa, Inc., Class A(a) | 4,090 | 389,491 |
| Total | | 1,070,660 |
| Semiconductors & Semiconductor Equipment 1.3% |
| Broadcom Ltd.(a) | 1,356 | 324,735 |
| Micron Technology, Inc.(a),(b) | 11,560 | 355,701 |
| ON Semiconductor Corp.(a),(b) | 13,289 | 205,714 |
| Skyworks Solutions, Inc.(a) | 1,620 | 172,416 |
| Total | | 1,058,566 |
| Software 1.6% |
| Activision Blizzard, Inc.(a) | 2,773 | 162,442 |
| Electronic Arts, Inc.(a),(b) | 2,401 | 272,105 |
| Microsoft Corp.(a) | 6,071 | 423,999 |
| Salesforce.com, Inc.(a),(b) | 3,120 | 279,677 |
| Workday, Inc., Class A(a),(b) | 1,613 | 161,268 |
| Total | | 1,299,491 |
| Technology Hardware, Storage & Peripherals 1.5% |
| Apple, Inc.(a) | 5,223 | 797,865 |
| Electronics for Imaging, Inc.(a),(b) | 4,687 | 222,258 |
| HP, Inc.(a) | 9,896 | 185,649 |
| Total | | 1,205,772 |
| Total Information Technology | 6,480,123 |
| Materials 1.5% |
| Chemicals 0.9% |
| Albemarle Corp.(a) | 138 | 15,677 |
| Cabot Corp.(a) | 3,937 | 205,629 |
| Dow Chemical Co. (The)(a) | 1,990 | 123,300 |
| Eastman Chemical Co.(a) | 905 | 72,500 |
| EI du Pont de Nemours & Co.(a) | 889 | 70,160 |
| LyondellBasell Industries NV, Class A(a) | 737 | 59,343 |
| Monsanto Co.(a) | 457 | 53,661 |
| PPG Industries, Inc.(a) | 916 | 97,426 |
| Total | | 697,696 |
| Common Stocks (continued) |
| Issuer | Shares | Value ($) |
| Containers & Packaging 0.3% |
| International Paper Co.(a) | 1,611 | 85,190 |
| Packaging Corp. of America(a) | 695 | 71,001 |
| Sealed Air Corp.(a) | 1,346 | 59,789 |
| Total | | 215,980 |
| Metals & Mining 0.1% |
| Newmont Mining Corp.(a) | 761 | 25,988 |
| Steel Dynamics, Inc.(a) | 1,731 | 58,837 |
| Total | | 84,825 |
| Paper & Forest Products 0.2% |
| Domtar Corp.(a) | 5,678 | 206,566 |
| Total Materials | 1,205,067 |
| Real Estate 0.7% |
| Equity Real Estate Investment Trusts (REITS) 0.7% |
| Care Capital Properties, Inc.(a) | 5,878 | 154,533 |
| Equinix, Inc.(a) | 502 | 221,387 |
| Equity LifeStyle Properties, Inc.(a) | 854 | 72,077 |
| Hospitality Properties Trust(a) | 3,578 | 103,476 |
| Total | | 551,473 |
| Total Real Estate | 551,473 |
| Telecommunication Services 0.1% |
| Diversified Telecommunication Services 0.1% |
| CenturyLink, Inc.(a) | 4,906 | 122,405 |
| Total Telecommunication Services | 122,405 |
| Utilities 1.7% |
| Electric Utilities 0.5% |
| American Electric Power Co., Inc.(a) | 1,589 | 114,058 |
| Edison International(a) | 1,444 | 117,787 |
| Entergy Corp.(a) | 1,290 | 101,987 |
| PG&E Corp.(a) | 1,004 | 68,654 |
| Total | | 402,486 |
| Gas Utilities 0.2% |
| Atmos Energy Corp.(a) | 583 | 48,570 |
| National Fuel Gas Co.(a) | 1,338 | 75,945 |
| Total | | 124,515 |
| Independent Power and Renewable Electricity Producers 0.3% |
| AES Corp. (The)(a) | 16,910 | 197,509 |
The accompanying Notes to Consolidated Financial Statements are an integral part of this statement.
| 10 | Columbia Diversified Absolute Return Fund | Annual Report 2017 |
Consolidated Portfolio of Investments (continued)
May 31, 2017
| Common Stocks (continued) |
| Issuer | Shares | Value ($) |
| Multi-Utilities 0.7% |
| Ameren Corp.(a) | 1,463 | 83,025 |
| CenterPoint Energy, Inc.(a) | 8,012 | 229,223 |
| DTE Energy Co.(a) | 851 | 93,202 |
| NiSource, Inc.(a) | 3,474 | 90,567 |
| SCANA Corp.(a) | 1,333 | 90,911 |
| Total | | 586,928 |
| Total Utilities | 1,311,438 |
Total Common Stocks
(Cost $24,397,283) | 27,404,919 |
| Corporate Bonds & Notes 12.3% |
| Issuer | Coupon
Rate | | Principal
Amount ($) | Value ($) |
| Banking 8.8% |
| Bank of America Corp.(c) |
| 12/31/2049 | 8.125% | | 370,000 | 385,629 |
| Junior Subordinated |
| 12/31/2049 | 8.000% | | 380,000 | 392,350 |
| BankBoston Capital Trust IV(c) |
| Junior Subordinated |
| 06/08/2028 | 1.706% | | 425,000 | 400,881 |
| Citigroup, Inc.(c) |
| Junior Subordinated |
| 12/31/2049 | 5.800% | | 560,000 | 581,491 |
| JPMorgan Chase & Co.(c) |
| Junior Subordinated |
| 04/29/2049 | 7.900% | | 385,000 | 399,466 |
| 12/31/2049 | 5.300% | | 575,000 | 599,110 |
| JPMorgan Chase Capital XXI(c) |
| Junior Subordinated |
| 02/02/2037 | 2.120% | | 323,000 | 297,905 |
| JPMorgan Chase Capital XXIII(c) |
| Junior Subordinated |
| 05/15/2047 | 2.182% | | 430,000 | 395,973 |
| KeyCorp Capital I(c) |
| Junior Subordinated |
| 07/01/2028 | 1.888% | | 445,000 | 405,098 |
| MBNA Capital B(c) |
| Junior Subordinated |
| 02/01/2027 | 1.970% | | 3,000 | 2,848 |
| Mellon Capital IV(c) |
| Junior Subordinated |
| 06/29/2049 | 4.000% | | 114,000 | 99,974 |
| NB Capital Trust III(c) |
| Junior Subordinated |
| 01/15/2027 | 1.708% | | 430,000 | 403,847 |
| Corporate Bonds & Notes (continued) |
| Issuer | Coupon
Rate | | Principal
Amount ($) | Value ($) |
| NTC Capital I(c) |
| Junior Subordinated |
| 01/15/2027 | 1.678% | | 141,000 | 131,998 |
| NTC Capital II(c) |
| Junior Subordinated |
| 04/15/2027 | 1.748% | | 106,000 | 99,509 |
| Royal Bank of Scotland Group PLC(c) |
| 05/15/2023 | 2.652% | | 555,000 | 555,154 |
| State Street Corp.(c) |
| 06/15/2037 | 2.131% | | 435,000 | 405,677 |
| SunTrust Capital I(c) |
| Junior Subordinated |
| 05/15/2027 | 1.850% | | 435,000 | 405,165 |
| SunTrust Capital III(c) |
| Junior Subordinated |
| 03/15/2028 | 1.781% | | 215,000 | 197,906 |
| Wachovia Capital Trust II(c) |
| Junior Subordinated |
| 01/15/2027 | 1.658% | | 425,000 | 403,005 |
| Wells Fargo & Co.(c) |
| Junior Subordinated |
| 03/29/2049 | 7.980% | | 380,000 | 394,348 |
| Total | 6,957,334 |
| Diversified Manufacturing 1.0% |
| General Electric Co.(c) |
| Junior Subordinated |
| 12/31/2049 | 5.000% | | 740,000 | 785,297 |
| Electric 0.5% |
| NextEra Energy Capital Holdings, Inc.(c) |
| Junior Subordinated |
| 09/01/2067 | 7.300% | | 390,000 | 394,828 |
| Life Insurance 0.5% |
| Genworth Holdings, Inc. |
| 05/22/2018 | 6.515% | | 390,000 | 391,179 |
| Midstream 0.4% |
| Enterprise Products Operating LLC(c) |
| Junior Subordinated |
| 08/01/2066 | 4.877% | | 287,000 | 287,683 |
| Property & Casualty 0.5% |
| Chubb Corp. (The)(c) |
| Junior Subordinated |
| 04/15/2037 | 3.408% | | 405,000 | 402,558 |
| Transportation Services 0.6% |
| Hertz Corp. (The) |
| 04/01/2018 | 4.250% | | 225,000 | 229,324 |
The accompanying Notes to Consolidated Financial Statements are an integral part of this statement.
Columbia Diversified Absolute Return Fund | Annual Report 2017
| 11 |
Consolidated Portfolio of Investments (continued)
May 31, 2017
| Corporate Bonds & Notes (continued) |
| Issuer | Coupon
Rate | | Principal
Amount ($) | Value ($) |
| Hertz Corp. (The)(d),(e) |
| 06/01/2022 | 7.625% | | 286,000 | 286,000 |
| Total | 515,324 |
Total Corporate Bonds & Notes
(Cost $9,779,813) | 9,734,203 |
| Exchange-Traded Funds 4.7% |
| | Shares | Value ($) |
| iPath Bloomberg Commodity Index Total Return ETN(b) | 21,162 | 479,954 |
| iShares iBoxx $ High Yield Corporate Bond ETF | 7,219 | 639,965 |
| iShares iBoxx $ Investment Grade Corporate Bond ETF | 3,341 | 401,755 |
| iShares JPMorgan USD Emerging Markets Bond ETF | 2,773 | 320,642 |
| iShares TIPS Bond ETF | 11,165 | 1,280,402 |
| Vanguard Mortgage-Backed Securities ETF | 4,537 | 239,962 |
| Vanguard REIT ETF | 3,883 | 319,144 |
Total Exchange-Traded Funds
(Cost $3,594,220) | 3,681,824 |
|
| Money Market Funds 48.9% |
| | |
| Columbia Short-Term Cash Fund, 0.916%(f),(g) | 38,686,183 | 38,686,183 |
Total Money Market Funds
(Cost $38,686,157) | 38,686,183 |
Total Investments
(Cost $76,457,473) | 79,507,129 |
|
| Investments Sold Short (19.7) |
|
| Common Stocks (19.7)% |
| Issuer | Shares | Value ($) |
| Consumer Discretionary (2.5)% |
| Auto Components (0.1)% |
| Autoliv, Inc. | (613) | (67,994) |
| Automobiles (0.1)% |
| Tesla Motors, Inc.(b) | (225) | (76,727) |
| Distributors (0.1)% |
| Pool Corp. | (505) | (60,161) |
| Hotels, Restaurants & Leisure (0.5)% |
| Dunkin’ Brands Group, Inc. | (933) | (54,590) |
| Las Vegas Sands Corp. | (1,221) | (72,198) |
| Marriott International, Inc., Class A | (588) | (63,298) |
| Investments Sold Short (continued) |
|
| Common Stocks (continued) |
| Issuer | Shares | Value ($) |
| McDonald’s Corp. | (599) | (90,383) |
| Wyndham Worldwide Corp. | (770) | (77,762) |
| Total | | (358,231) |
| Internet & Direct Marketing Retail (0.2)% |
| Netflix, Inc.(b) | (732) | (119,367) |
| Leisure Products (0.1)% |
| Hasbro, Inc. | (864) | (90,945) |
| Media (0.3)% |
| Discovery Communications, Inc., Class A(b) | (1,533) | (40,625) |
| New York Times Co. (The) | (3,120) | (54,912) |
| Omnicom Group, Inc. | (731) | (61,199) |
| Pearson PLC | (6,244) | (56,508) |
| Walt Disney Co. (The) | (316) | (34,109) |
| Total | | (247,353) |
| Multiline Retail (0.1)% |
| Nordstrom, Inc. | (926) | (38,707) |
| Target Corp. | (1,189) | (65,573) |
| Total | | (104,280) |
| Specialty Retail (0.4)% |
| Best Buy Co., Inc. | (1,058) | (62,834) |
| CarMax, Inc.(b) | (2,343) | (147,211) |
| DSW, Inc., Class A | (2,041) | (34,350) |
| Tiffany & Co. | (571) | (49,654) |
| Tractor Supply Co. | (751) | (41,418) |
| Total | | (335,467) |
| Textiles, Apparel & Luxury Goods (0.6)% |
| Carter’s, Inc. | (835) | (68,604) |
| Columbia Sportswear Co. | (1,049) | (56,940) |
| Hanesbrands, Inc. | (2,583) | (53,339) |
| Michael Kors Holdings Ltd.(b) | (1,214) | (40,280) |
| Nike, Inc., Class B | (1,315) | (69,682) |
| Ralph Lauren Corp. | (791) | (53,630) |
| Under Armour, Inc., Class A(b) | (3,447) | (66,044) |
| VF Corp. | (1,362) | (73,276) |
| Total | | (481,795) |
| Total Consumer Discretionary | (1,942,320) |
The accompanying Notes to Consolidated Financial Statements are an integral part of this statement.
| 12 | Columbia Diversified Absolute Return Fund | Annual Report 2017 |
Consolidated Portfolio of Investments (continued)
May 31, 2017
| Investments Sold Short (continued) |
|
| Common Stocks (continued) |
| Issuer | Shares | Value ($) |
| Consumer Staples (1.9)% |
| Beverages (0.6)% |
| Brown-Forman Corp., Class B | (2,083) | (108,212) |
| Coca-Cola Co. (The) | (4,312) | (196,066) |
| Monster Beverage Corp.(b) | (2,550) | (128,928) |
| Total | | (433,206) |
| Food Products (0.6)% |
| B&G Foods, Inc. | (1,069) | (43,348) |
| Campbell Soup Co. | (1,201) | (69,238) |
| ConAgra Foods, Inc. | (2,082) | (80,240) |
| McCormick & Co., Inc. | (726) | (75,613) |
| Mead Johnson Nutrition Co. | (962) | (86,022) |
| TreeHouse Foods, Inc.(b) | (1,240) | (95,703) |
| Total | | (450,164) |
| Household Products (0.4)% |
| Church & Dwight Co., Inc. | (2,021) | (104,405) |
| Clorox Co. (The) | (758) | (102,883) |
| Kimberly-Clark Corp. | (1,032) | (133,882) |
| Total | | (341,170) |
| Personal Products (0.2)% |
| Coty, Inc., Class A | (4,902) | (92,844) |
| Edgewell Personal Care Co.(b) | (750) | (54,855) |
| Total | | (147,699) |
| Tobacco (0.1)% |
| Reynolds American, Inc. | (1,602) | (107,734) |
| Total Consumer Staples | (1,479,973) |
| Energy (1.2)% |
| Energy Equipment & Services (0.1)% |
| Core Laboratories NV | (196) | (20,039) |
| Ensco PLC, Class A | (2,081) | (12,985) |
| National Oilwell Varco, Inc. | (1,239) | (40,478) |
| Noble Corp. PLC | (2,051) | (8,307) |
| Rowan Companies PLC, Class A(b) | (1,424) | (17,145) |
| SEACOR Holdings, Inc.(b) | (407) | (24,913) |
| Total | | (123,867) |
| Investments Sold Short (continued) |
|
| Common Stocks (continued) |
| Issuer | Shares | Value ($) |
| Oil, Gas & Consumable Fuels (1.1)% |
| Apache Corp. | (640) | (29,926) |
| Cenovus Energy, Inc. | (3,257) | (29,053) |
| Cheniere Energy, Inc.(b) | (3,237) | (157,707) |
| Chevron Corp. | (750) | (77,610) |
| ConocoPhillips | (738) | (32,981) |
| Enbridge, Inc. | (438) | (16,867) |
| Kosmos Energy Ltd.(b) | (9,893) | (59,358) |
| Marathon Oil Corp. | (1,855) | (24,152) |
| Murphy Oil Corp. | (807) | (19,699) |
| Occidental Petroleum Corp. | (758) | (44,669) |
| ONEOK, Inc. | (652) | (32,391) |
| Royal Dutch Shell PLC, ADR, Class A | (2,450) | (133,305) |
| Southwestern Energy Co.(b) | (2,927) | (17,738) |
| Total SA, ADR | (2,641) | (138,124) |
| Williams Companies, Inc. (The) | (1,117) | (31,946) |
| Total | | (845,526) |
| Total Energy | (969,393) |
| Financials (1.9)% |
| Banks (0.4)% |
| Bank of Montreal | (1,059) | (71,101) |
| Cullen/Frost Bankers, Inc. | (688) | (63,062) |
| First Horizon National Corp. | (4,511) | (76,417) |
| People’s United Financial, Inc. | (3,373) | (55,891) |
| Synovus Financial Corp. | (2,039) | (83,354) |
| Total | | (349,825) |
| Capital Markets (0.7)% |
| Affiliated Managers Group, Inc. | (571) | (87,848) |
| CBOE Holdings, Inc. | (1,108) | (95,698) |
| Factset Research Systems, Inc. | (225) | (37,280) |
| Franklin Resources, Inc. | (1,251) | (52,279) |
| Janus Henderson Group PLC(b) | (2,290) | (71,621) |
| Legg Mason, Inc. | (1,333) | (49,148) |
| Northern Trust Corp. | (1,047) | (91,550) |
| Thomson Reuters Corp. | (1,227) | (53,571) |
| Total | | (538,995) |
The accompanying Notes to Consolidated Financial Statements are an integral part of this statement.
Columbia Diversified Absolute Return Fund | Annual Report 2017
| 13 |
Consolidated Portfolio of Investments (continued)
May 31, 2017
| Investments Sold Short (continued) |
|
| Common Stocks (continued) |
| Issuer | Shares | Value ($) |
| Insurance (0.6)% |
| Everest Re Group Ltd. | (230) | (58,570) |
| Markel Corp.(b) | (100) | (97,725) |
| Principal Financial Group, Inc. | (829) | (52,152) |
| Travelers Companies, Inc. (The) | (625) | (78,031) |
| Unum Group | (1,353) | (60,858) |
| Willis Towers Watson PLC | (446) | (65,397) |
| WR Berkley Corp. | (1,368) | (94,378) |
| Total | | (507,111) |
| Thrifts & Mortgage Finance (0.2)% |
| New York Community Bancorp, Inc. | (2,335) | (30,168) |
| TFS Financial Corp. | (5,314) | (83,005) |
| Total | | (113,173) |
| Total Financials | (1,509,104) |
| Health Care (2.6)% |
| Biotechnology (0.3)% |
| Amgen, Inc. | (375) | (58,215) |
| Incyte Corp., Ltd.(b) | (414) | (53,543) |
| Ionis Pharmaceuticals, Inc.(b) | (1,478) | (67,678) |
| United Therapeutics Corp.(b) | (404) | (48,839) |
| Total | | (228,275) |
| Health Care Equipment & Supplies (0.7)% |
| ABIOMED, Inc.(b) | (868) | (119,289) |
| Baxter International, Inc. | (1,286) | (76,273) |
| Becton Dickinson and Co. | (191) | (36,143) |
| Hill-Rom Holdings, Inc. | (735) | (56,860) |
| Intuitive Surgical, Inc.(b) | (85) | (77,748) |
| Stryker Corp. | (552) | (78,914) |
| Varian Medical Systems, Inc.(b) | (1,030) | (101,990) |
| Total | | (547,217) |
| Health Care Providers & Services (0.4)% |
| DaVita, Inc.(b) | (519) | (34,389) |
| Envision Healthcare Corp(b) | (1,485) | (81,096) |
| Lifepoint Hospitals, Inc.(b) | (1,021) | (62,077) |
| McKesson Corp. | (455) | (74,206) |
| Quest Diagnostics, Inc. | (728) | (79,184) |
| Total | | (330,952) |
| Investments Sold Short (continued) |
|
| Common Stocks (continued) |
| Issuer | Shares | Value ($) |
| Health Care Technology (0.2)% |
| Cerner Corp.(b) | (1,197) | (78,224) |
| Inovalon Holdings, Inc.(b) | (7,751) | (105,414) |
| Total | | (183,638) |
| Life Sciences Tools & Services (0.3)% |
| Bruker Corp. | (1,317) | (35,836) |
| PerkinElmer, Inc. | (1,119) | (70,564) |
| QIAGEN NV | (1,613) | (54,147) |
| Quintiles IMS Holdings, Inc.(b) | (625) | (54,025) |
| Waters Corp.(b) | (197) | (35,385) |
| Total | | (249,957) |
| Pharmaceuticals (0.7)% |
| Astrazeneca PLC, ADR | (2,178) | (74,901) |
| Endo International PLC(b) | (2,541) | (33,490) |
| Glaxosmithkline PLC, ADR | (833) | (36,844) |
| Mylan NV(b) | (1,544) | (60,185) |
| Novartis AG, ADR | (630) | (51,515) |
| Novo Nordisk A/S, ADR | (1,297) | (54,954) |
| Perrigo Co. PLC | (753) | (54,856) |
| Roche Holding AG, ADR | (3,084) | (106,028) |
| Sanofi, ADR | (1,700) | (84,303) |
| Total | | (557,076) |
| Total Health Care | (2,097,115) |
| Industrials (2.5)% |
| Aerospace & Defense (0.2)% |
| Huntington Ingalls Industries, Inc. | (211) | (41,316) |
| Triumph Group, Inc. | (1,968) | (64,157) |
| Wesco Aircraft Holdings, Inc.(b) | (4,068) | (39,256) |
| Total | | (144,729) |
| Air Freight & Logistics (0.2)% |
| C.H. Robinson Worldwide, Inc. | (1,254) | (84,031) |
| Fedex Corp. | (329) | (63,773) |
| Total | | (147,804) |
The accompanying Notes to Consolidated Financial Statements are an integral part of this statement.
| 14 | Columbia Diversified Absolute Return Fund | Annual Report 2017 |
Consolidated Portfolio of Investments (continued)
May 31, 2017
| Investments Sold Short (continued) |
|
| Common Stocks (continued) |
| Issuer | Shares | Value ($) |
| Airlines (0.2)% |
| Copa Holdings SA, Class A | (527) | (59,572) |
| Spirit Airlines, Inc.(b) | (1,501) | (79,703) |
| Total | | (139,275) |
| Building Products (0.3)% |
| Armstrong World Industries, Inc.(b) | (3,268) | (136,112) |
| Johnson Controls International PLC | (2,267) | (94,670) |
| Total | | (230,782) |
| Commercial Services & Supplies (0.1)% |
| Clean Harbors, Inc.(b) | (1,718) | (100,348) |
| Construction & Engineering (0.1)% |
| Fluor Corp. | (1,238) | (55,537) |
| Electrical Equipment (0.1)% |
| Emerson Electric Co. | (2,065) | (122,083) |
| Industrial Conglomerates (0.5)% |
| 3M Co. | (648) | (132,497) |
| General Electric Co. | (3,485) | (95,419) |
| Roper Technologies, Inc. | (602) | (136,774) |
| Total | | (364,690) |
| Machinery (0.5)% |
| Flowserve Corp. | (3,151) | (152,823) |
| Kennametal, Inc. | (1,069) | (41,124) |
| Parker-Hannifin Corp. | (706) | (111,174) |
| Wabtec Corp. | (1,362) | (111,344) |
| Total | | (416,465) |
| Professional Services (0.1)% |
| IHS Markit Ltd.(b) | (1,587) | (72,764) |
| Road & Rail (0.0)% |
| Avis Budget Group, Inc.(b) | (1,528) | (34,976) |
| Trading Companies & Distributors (0.2)% |
| Air Lease Corp. | (4,105) | (151,557) |
| Total Industrials | (1,981,010) |
| Investments Sold Short (continued) |
|
| Common Stocks (continued) |
| Issuer | Shares | Value ($) |
| Information Technology (4.5)% |
| Communications Equipment (0.4)% |
| EchoStar Corp., Class A(b) | (2,337) | (138,000) |
| Juniper Networks, Inc. | (4,866) | (142,720) |
| Total | | (280,720) |
| Electronic Equipment, Instruments & Components (0.7)% |
| Avnet, Inc. | (2,314) | (84,877) |
| Dolby Laboratories, Inc., Class A | (2,084) | (105,013) |
| IPG Photonics Corp.(b) | (618) | (85,927) |
| Trimble, Inc.(b) | (3,182) | (114,679) |
| VeriFone Systems, Inc.(b) | (6,731) | (123,110) |
| Vishay Intertechnology, Inc. | (4,875) | (79,706) |
| Total | | (593,312) |
| Internet Software & Services (0.2)% |
| eBay, Inc.(b) | (2,656) | (91,101) |
| Zillow Group, Inc., Class A(b) | (2,170) | (95,241) |
| Total | | (186,342) |
| IT Services (1.5)% |
| Accenture PLC, Class A | (1,333) | (165,919) |
| Automatic Data Processing, Inc. | (871) | (89,164) |
| Conduent, Inc.(b) | (7,809) | (128,146) |
| DXC Technology Co.(b) | (514) | (39,845) |
| Global Payments, Inc. | (2,909) | (266,493) |
| International Business Machines Corp. | (1,163) | (177,509) |
| Paychex, Inc. | (1,723) | (102,053) |
| Teradata Corp.(b) | (3,620) | (98,681) |
| Wex, Inc.(b) | (923) | (94,294) |
| Total | | (1,162,104) |
| Semiconductors & Semiconductor Equipment (0.6)% |
| Advanced Micro Devices, Inc.(b) | (3,011) | (33,693) |
| ASML Holding NV | (352) | (46,461) |
| Intel Corp. | (6,289) | (227,096) |
| QUALCOMM, Inc. | (875) | (50,111) |
| Teradyne, Inc. | (2,911) | (103,486) |
| Total | | (460,847) |
The accompanying Notes to Consolidated Financial Statements are an integral part of this statement.
Columbia Diversified Absolute Return Fund | Annual Report 2017
| 15 |
Consolidated Portfolio of Investments (continued)
May 31, 2017
| Investments Sold Short (continued) |
|
| Common Stocks (continued) |
| Issuer | Shares | Value ($) |
| Software (0.8)% |
| Autodesk, Inc.(b) | (1,102) | (123,171) |
| CA, Inc. | (4,772) | (151,606) |
| Intuit, Inc. | (918) | (129,107) |
| Oracle Corp. | (4,858) | (220,505) |
| Total | | (624,389) |
| Technology Hardware, Storage & Peripherals (0.3)% |
| Hewlett Packard Enterprise Co. | (5,984) | (112,559) |
| Xerox Corp. | (19,215) | (135,850) |
| Total | | (248,409) |
| Total Information Technology | (3,556,123) |
| Materials (1.1)% |
| Chemicals (0.6)% |
| Agrium, Inc. | (543) | (50,135) |
| Axalta Coating Systems Ltd.(b) | (1,774) | (55,526) |
| Ecolab, Inc. | (607) | (80,634) |
| International Flavors & Fragrances, Inc. | (539) | (74,323) |
| Platform Specialty Products Corp.(b) | (11,113) | (138,690) |
| WR Grace & Co. | (1,356) | (97,212) |
| Total | | (496,520) |
| Construction Materials (0.1)% |
| Vulcan Materials Co. | (733) | (91,369) |
| Containers & Packaging (0.2)% |
| AptarGroup, Inc. | (936) | (79,569) |
| Sonoco Products Co. | (1,460) | (74,037) |
| Total | | (153,606) |
| Metals & Mining (0.2)% |
| Alcoa Corp. | (1,530) | (50,398) |
| ArcelorMittal, Registered Shares(b) | (1,478) | (32,279) |
| BHP Billiton Ltd., ADR | (1,140) | (40,003) |
| Total | | (122,680) |
| Total Materials | (864,175) |
| Real Estate (0.1)% |
| Equity Real Estate Investment Trusts (REITS) (0.1)% |
| Life Storage, Inc. | (968) | (72,503) |
| Total Real Estate | (72,503) |
| Investments Sold Short (continued) |
|
| Common Stocks (continued) |
| Issuer | Shares | Value ($) |
| Telecommunication Services (0.2)% |
| Diversified Telecommunication Services (0.1)% |
| Telefonica SA, ADR | (4,770) | (53,519) |
| Verizon Communications, Inc. | (794) | (37,032) |
| Total | | (90,551) |
| Wireless Telecommunication Services (0.1)% |
| Rogers Communications, Inc. | (1,756) | (81,900) |
| Total Telecommunication Services | (172,451) |
| Utilities (1.2)% |
| Electric Utilities (0.3)% |
| PPL Corp. | (2,642) | (105,442) |
| Southern Co. (The) | (2,232) | (112,962) |
| Total | | (218,404) |
| Independent Power and Renewable Electricity Producers (0.3)% |
| Calpine Corp.(b) | (9,860) | (126,701) |
| NRG Energy, Inc. | (7,322) | (117,591) |
| Total | | (244,292) |
| Multi-Utilities (0.5)% |
| Consolidated Edison, Inc. | (1,635) | (135,362) |
| Dominion Energy, Inc. | (1,329) | (107,343) |
| Sempra Energy | (1,157) | (134,779) |
| Total | | (377,484) |
| Water Utilities (0.1)% |
| Aqua America, Inc. | (2,429) | (79,404) |
| Total Utilities | (919,584) |
Total Common Stocks
(Proceeds $14,498,707) | (15,563,751) |
Total Investments Sold Short
(Proceeds $14,498,707) | (15,563,751) |
| Total Investments, Net of Investments Sold Short | 63,943,378 |
| Other Assets & Liabilities, Net | | 15,211,338 |
| Net Assets | 79,154,716 |
The accompanying Notes to Consolidated Financial Statements are an integral part of this statement.
| 16 | Columbia Diversified Absolute Return Fund | Annual Report 2017 |
Consolidated Portfolio of Investments (continued)
May 31, 2017
At May 31, 2017, securities and/or cash totaling $32,684,047 were pledged as collateral.
Investments in derivatives
| Forward foreign currency exchange contracts open at May 31, 2017 |
| Counterparty | Exchange
date | Currency to
be delivered | Currency to
be received | Unrealized
appreciation ($) | Unrealized
depreciation ($) |
| Barclays | 6/14/2017 | 5,278,000 NZD | 3,736,138 USD | — | (2,374) |
| Barclays | 6/14/2017 | 2,456,645 USD | 1,908,000 GBP | 2,703 | — |
| Barclays | 6/14/2017 | 3,685,654 USD | 5,278,000 NZD | 52,858 | — |
| BNP Paribas | 6/14/2017 | 4,736,000 GBP | 6,133,949 USD | 29,404 | — |
| BNP Paribas | 6/14/2017 | 6,151,788 USD | 4,736,000 GBP | — | (47,243) |
| BNP Paribas | 6/14/2017 | 3,687,743 USD | 409,420,000 JPY | 11,130 | — |
| BNP Paribas | 7/21/2017 | 100,000 CAD | 74,103 USD | 9 | — |
| BNP Paribas | 7/21/2017 | 2,800,000 NOK | 334,460 USD | 2,815 | — |
| BNP Paribas | 7/21/2017 | 100,000 NZD | 70,009 USD | — | (769) |
| BNP Paribas | 7/21/2017 | 1,881,554 SEK | 216,842 USD | — | (262) |
| BNP Paribas | 7/21/2017 | 299,096 USD | 400,000 AUD | — | (2,102) |
| BNP Paribas | 7/21/2017 | 308,935 USD | 300,000 CHF | 1,818 | — |
| BNP Paribas | 7/21/2017 | 877,327 USD | 781,474 EUR | 2,873 | — |
| BNP Paribas | 7/21/2017 | 1,917,297 USD | 213,587,121 JPY | 15,582 | — |
| BNP Paribas | 7/21/2017 | 607,568 USD | 844,270 SGD | 2,971 | — |
| Citi | 6/14/2017 | 54,307,000 SEK | 6,162,719 USD | — | (90,178) |
| Citi | 6/14/2017 | 2,542,893 USD | 22,097,000 SEK | 1,352 | — |
| Credit Suisse | 7/21/2017 | 500,000 AUD | 373,790 USD | 2,548 | — |
| Credit Suisse | 7/21/2017 | 700,000 CHF | 720,676 USD | — | (4,415) |
| Credit Suisse | 7/21/2017 | 992,104 EUR | 1,113,572 USD | — | (3,866) |
| Credit Suisse | 7/21/2017 | 200,000 GBP | 259,975 USD | 1,880 | — |
| Credit Suisse | 7/21/2017 | 37,700,000 JPY | 338,344 USD | — | (2,826) |
| Credit Suisse | 7/21/2017 | 4,500,000 SEK | 518,582 USD | — | (652) |
| Credit Suisse | 7/21/2017 | 844,270 SGD | 607,452 USD | — | (3,087) |
| Credit Suisse | 7/21/2017 | 780,905 USD | 6,537,087 NOK | — | (6,624) |
| Credit Suisse | 7/21/2017 | 70,024 USD | 100,000 NZD | 754 | — |
| Deutsche Bank | 6/14/2017 | 51,000 AUD | 38,091 USD | 203 | — |
| Deutsche Bank | 6/14/2017 | 41,000 AUD | 30,437 USD | — | (22) |
| Deutsche Bank | 6/14/2017 | 20,912,000 NOK | 2,509,892 USD | 34,400 | — |
| Deutsche Bank | 6/14/2017 | 294,000 NOK | 34,494 USD | — | (309) |
| Deutsche Bank | 6/14/2017 | 6,125,940 USD | 8,298,000 AUD | 38,662 | — |
| Deutsche Bank | 6/14/2017 | 23,873 USD | 32,000 AUD | — | (100) |
| Deutsche Bank | 6/14/2017 | 2,458,610 USD | 21,206,000 NOK | 51,685 | — |
| Deutsche Bank | 7/21/2017 | 100,000 CAD | 74,104 USD | 9 | — |
| Deutsche Bank | 7/21/2017 | 124,287,121 JPY | 1,115,934 USD | — | (8,816) |
| Deutsche Bank | 7/21/2017 | 6,937,087 NOK | 828,722 USD | 7,062 | — |
| Deutsche Bank | 7/21/2017 | 700,000 NZD | 490,091 USD | — | (5,358) |
| Deutsche Bank | 7/21/2017 | 970,840 USD | 1,298,400 AUD | — | (6,799) |
| Deutsche Bank | 7/21/2017 | 514,920 USD | 500,000 CHF | 3,003 | — |
| Deutsche Bank | 7/21/2017 | 236,409 USD | 210,630 EUR | 830 | — |
| Deutsche Bank | 7/21/2017 | 129,995 USD | 100,000 GBP | — | (947) |
| Deutsche Bank | 7/21/2017 | 1,127,284 USD | 9,781,554 SEK | 1,363 | — |
| Deutsche Bank | 7/21/2017 | 1,151,576 USD | 1,600,000 SGD | 5,473 | — |
| HSBC | 6/14/2017 | 5,316,000 NZD | 3,659,109 USD | — | (106,319) |
| HSBC | 6/14/2017 | 3,677,130 USD | 5,316,000 NZD | 88,298 | — |
| HSBC | 7/21/2017 | 898,400 AUD | 671,841 USD | 4,794 | — |
| HSBC | 7/21/2017 | 200,000 CAD | 148,236 USD | 47 | — |
| HSBC | 7/21/2017 | 300,000 CHF | 308,969 USD | — | (1,784) |
| HSBC | 7/21/2017 | 4,400,000 JPY | 39,507 USD | — | (312) |
| HSBC | 7/21/2017 | 1,700,000 NOK | 203,197 USD | 1,841 | — |
| HSBC | 7/21/2017 | 200,000 NZD | 140,040 USD | — | (1,517) |
| HSBC | 7/21/2017 | 600,000 SGD | 431,847 USD | — | (2,046) |
| HSBC | 7/21/2017 | 520,040 USD | 400,000 GBP | — | (3,850) |
The accompanying Notes to Consolidated Financial Statements are an integral part of this statement.
Columbia Diversified Absolute Return Fund | Annual Report 2017
| 17 |
Consolidated Portfolio of Investments (continued)
May 31, 2017
Investments in derivatives (continued)
| Forward foreign currency exchange contracts open at May 31, 2017 (continued) |
| Counterparty | Exchange
date | Currency to
be delivered | Currency to
be received | Unrealized
appreciation ($) | Unrealized
depreciation ($) |
| HSBC | 7/21/2017 | 288,287 USD | 2,500,000 SEK | 176 | — |
| Morgan Stanley | 6/14/2017 | 5,994,000 CHF | 6,169,882 USD | — | (23,924) |
| Morgan Stanley | 7/21/2017 | 100,000 CHF | 102,985 USD | — | (599) |
| Morgan Stanley | 7/21/2017 | 18,000,000 JPY | 161,595 USD | — | (1,298) |
| Morgan Stanley | 7/21/2017 | 1,100,000 SEK | 126,781 USD | — | (143) |
| Standard Chartered | 6/14/2017 | 3,221,000 EUR | 3,626,846 USD | 6,114 | — |
| Standard Chartered | 6/14/2017 | 2,243,000 EUR | 2,458,530 USD | — | (62,830) |
| Standard Chartered | 6/14/2017 | 3,654,948 USD | 3,265,000 EUR | 15,244 | — |
| State Street | 7/21/2017 | 200,000 CAD | 148,215 USD | 26 | — |
| State Street | 7/21/2017 | 100,000 NOK | 11,947 USD | 102 | — |
| State Street | 7/21/2017 | 102,995 USD | 100,000 CHF | 589 | — |
| State Street | 7/21/2017 | 244,258 USD | 27,200,000 JPY | 1,891 | — |
| State Street | 7/21/2017 | 630,442 USD | 900,000 NZD | 6,564 | — |
| State Street | 7/21/2017 | 935,627 USD | 1,300,000 SGD | 4,475 | — |
| UBS | 6/14/2017 | 5,021,000 CAD | 3,721,014 USD | 3,203 | — |
| UBS | 6/14/2017 | 3,677,906 USD | 5,021,000 CAD | 39,906 | — |
| UBS | 7/21/2017 | 300,000 AUD | 224,320 USD | 1,574 | — |
| UBS | 7/21/2017 | 200,000 CAD | 148,207 USD | 18 | — |
| UBS | 7/21/2017 | 300,000 GBP | 390,051 USD | 2,909 | — |
| UBS | 7/21/2017 | 91,734,000 JPY | 823,546 USD | — | (6,610) |
| UBS | 7/21/2017 | 4,800,000 SEK | 553,014 USD | — | (835) |
| UBS | 7/21/2017 | 2,300,000 SGD | 1,655,081 USD | — | (8,177) |
| UBS | 7/21/2017 | 205,997 USD | 200,000 CHF | 1,174 | — |
| UBS | 7/21/2017 | 597,244 USD | 5,000,000 NOK | — | (5,023) |
| Total | | | | 450,332 | (412,016) |
Futures contracts outstanding at May 31, 2017
| Long futures contracts outstanding |
| Contract description | Number of
contracts | Trading
currency | Notional market
value ($) | Expiration date | Unrealized
appreciation ($) | Unrealized
depreciation ($) |
| 10-Year Mini JGB | 10 | JPY | 1,360,090 | 06/2017 | 3,862 | — |
| 10-Year Mini JGB | 15 | JPY | 2,040,136 | 06/2017 | — | (4,925) |
| 3-Month Euro Euribor | 12 | EUR | 3,380,495 | 12/2017 | 809 | — |
| 90-Day Sterling | 21 | GBP | 3,370,007 | 12/2017 | 1,996 | — |
| Australian 10-Year Bond | 46 | AUD | 4,500,889 | 06/2017 | 154,289 | — |
| Banker’s Acceptance | 19 | CAD | 3,482,548 | 12/2017 | — | (1,114) |
| CAC40 Index | 5 | EUR | 295,806 | 06/2017 | — | (4,798) |
| Canadian Government 10-Year Bond | 31 | CAD | 3,338,091 | 09/2017 | 25,715 | — |
| Canadian Government 10-Year Bond | 4 | CAD | 430,721 | 09/2017 | — | (7) |
| DAX Index | 1 | EUR | 354,922 | 06/2017 | 16,799 | — |
| EURO STOXX 50 | 11 | EUR | 439,039 | 06/2017 | 26,529 | — |
| Euro-Bund | 44 | EUR | 8,023,051 | 06/2017 | 31,558 | — |
| Euro-Bund | 8 | EUR | 1,458,737 | 06/2017 | — | (2,820) |
| FTSE 100 Index | 4 | GBP | 386,948 | 06/2017 | 12,533 | — |
| FTSE/MIB Index | 1 | EUR | 116,593 | 06/2017 | 8,682 | — |
| Hang Seng Index | 2 | HKD | 326,992 | 06/2017 | 2,907 | — |
| IBEX 35 Index | 2 | EUR | 243,913 | 06/2017 | — | (1,345) |
| Long Gilt | 12 | GBP | 1,978,132 | 09/2017 | 8,018 | — |
| Mini MSCI Emerging Markets Index | 16 | USD | 803,040 | 06/2017 | 46,565 | — |
| MSCI Singapore IX ETS | 15 | SGD | 385,990 | 06/2017 | — | (4,888) |
| OMXS30 Index | 25 | SEK | 471,155 | 06/2017 | — | (3,011) |
| S&P 500 E-mini | 12 | USD | 1,446,660 | 06/2017 | 23,370 | — |
| S&P/TSE 60 Index | 6 | CAD | 804,027 | 06/2017 | — | (14,433) |
The accompanying Notes to Consolidated Financial Statements are an integral part of this statement.
| 18 | Columbia Diversified Absolute Return Fund | Annual Report 2017 |
Consolidated Portfolio of Investments (continued)
May 31, 2017
| Long futures contracts outstanding (continued) |
| Contract description | Number of
contracts | Trading
currency | Notional market
value ($) | Expiration date | Unrealized
appreciation ($) | Unrealized
depreciation ($) |
| SPI 200 Index | 3 | AUD | 319,883 | 06/2017 | 707 | — |
| SPI 200 Index | 5 | AUD | 533,139 | 06/2017 | — | (7,210) |
| TOPIX Index | 6 | JPY | 850,564 | 06/2017 | 13,610 | — |
| TOPIX Index | 2 | JPY | 283,522 | 06/2017 | — | (786) |
| U.S. Treasury 10-Year Note | 14 | USD | 1,768,156 | 09/2017 | 10,258 | — |
| U.S. Treasury 10-Year Note | 4 | USD | 505,188 | 09/2017 | — | (8) |
| U.S. Treasury 5-Year Note | 28 | USD | 3,312,750 | 09/2017 | 6,759 | — |
| Total | | | 47,011,184 | | 394,966 | (45,345) |
| Short futures contracts outstanding |
| Contract description | Number of
contracts | Trading
currency | Notional market
value ($) | Expiration date | Unrealized
appreciation ($) | Unrealized
depreciation ($) |
| 10-Year Mini JGB | (9) | JPY | (1,224,081) | 06/2017 | — | (3,453) |
| Euro CHF 3-Month ICE | (13) | CHF | (3,381,033) | 12/2017 | — | (687) |
| EURO STOXX 50 | (16) | EUR | (638,602) | 06/2017 | — | (27,016) |
| Long Gilt | (30) | GBP | (4,945,331) | 09/2017 | — | (19,709) |
| S&P 500 E-mini | (74) | USD | (8,921,070) | 06/2017 | — | (73,529) |
| S&P/TSE 60 Index | (6) | CAD | (804,027) | 06/2017 | 9,163 | — |
| U.S. Treasury 10-Year Note | (34) | USD | (4,294,094) | 09/2017 | — | (25,033) |
| Total | | | (24,208,238) | | 9,163 | (149,427) |
Credit default swap contracts outstanding at May 31, 2017
| Buy protection |
| Counterparty | Reference
entity | Expiration
date | Pay
fixed
rate
(%) | Notional
currency | Notional
amount | Market
value
($) | Periodic
payments
receivable
(payable)
($) | Premium
paid
($) | Premium
received
($) | Unrealized
appreciation
($) | Unrealized
depreciation
($) |
| Barclays | Goldman Sachs Group, Inc. | 6/20/2022 | 1.000 | USD | 675,545 | (9,129) | (1,370) | — | (9,319) | — | (1,180) |
| Goldman Sachs International | Morgan Stanley | 6/20/2022 | 1.000 | USD | 675,000 | (10,432) | (1,369) | — | (10,281) | — | (1,520) |
| Total | | | | | | | | — | (19,600) | — | (2,700) |
Cleared credit default swap contracts outstanding at May 31, 2017
| Buy protection |
| Counterparty | Reference
entity | Expiration
date | Pay fixed
rate (%) | Notional
currency | Notional
amount | Unrealized
appreciation ($) | Unrealized
depreciation ($) |
| Morgan Stanley | Markit CDX North America High Yield Index, Series 28 | 6/20/2022 | 5.000 | USD | 3,215,000 | — | (27,169) |
Credit default swap contracts outstanding at May 31, 2017
| Sell protection |
| Counterparty | Reference
entity | Expiration
date | Receive
fixed
rate
(%) | Implied
credit
spread
(%)* | Notional
currency | Notional
amount | Market
value
($) | Periodic
payments
receivable
(payable)
($) | Premium
paid
($) | Premium
received
($) | Unrealized
appreciation
($) | Unrealized
depreciation
($) |
| Barclays | Frontier Communications Corp. | 6/20/2019 | 5.000 | 3.072 | USD | 450,000 | 17,159 | 4,562 | 18,757 | — | 2,964 | — |
| Barclays | iStar, Inc. | 6/20/2020 | 5.000 | 1.575 | USD | 115,000 | 11,571 | 1,166 | 13,092 | — | — | (355) |
| Barclays | Valeant Pharmaceuticals International, Inc. | 6/20/2019 | 5.000 | 4.063 | USD | 450,000 | 8,212 | 4,563 | 5,988 | — | 6,787 | — |
The accompanying Notes to Consolidated Financial Statements are an integral part of this statement.
Columbia Diversified Absolute Return Fund | Annual Report 2017
| 19 |
Consolidated Portfolio of Investments (continued)
May 31, 2017
| Sell protection (continued) |
| Counterparty | Reference
entity | Expiration
date | Receive
fixed
rate
(%) | Implied
credit
spread
(%)* | Notional
currency | Notional
amount | Market
value
($) | Periodic
payments
receivable
(payable)
($) | Premium
paid
($) | Premium
received
($) | Unrealized
appreciation
($) | Unrealized
depreciation
($) |
| Barclays | Weatherford International Ltd. | 6/20/2020 | 1.000 | 2.414 | USD | 115,000 | (4,727) | 233 | — | (4,258) | — | (236) |
| Barclays | Whiting Petroleum Corp. | 6/20/2020 | 5.000 | 3.211 | USD | 340,000 | 16,939 | 3,447 | 19,034 | — | 1,352 | — |
| Barclays | Whiting Petroleum Corp. | 6/20/2020 | 5.000 | 3.211 | USD | 340,000 | 16,939 | 3,447 | 20,432 | — | — | (46) |
| Citi | Freeport-McMoRan, Inc. | 6/20/2020 | 1.000 | 1.678 | USD | 225,000 | (4,489) | 456 | — | (3,978) | — | (55) |
| Citi | Verizon Communications, Inc. | 6/20/2022 | 1.000 | 0.775 | USD | 450,000 | 4,875 | 913 | 4,908 | — | 880 | — |
| Credit Suisse | DISH DBS Corp. | 6/20/2020 | 5.000 | 1.255 | USD | 225,000 | 25,039 | 2,281 | 26,124 | — | 1,196 | — |
| Goldman Sachs International | Anadarko Petroleum Corp. | 6/20/2020 | 1.000 | 0.55 | USD | 450,000 | 6,031 | — | 6,031 | — | — | — |
| Goldman Sachs International | Canadian Natural Resources Ltd. | 6/20/2020 | 1.000 | 0.5 | USD | 225,000 | 3,355 | — | 3,355 | — | — | — |
| Goldman Sachs International | DISH DBS Corp. | 6/20/2022 | 5.000 | 2.604 | USD | 450,000 | 49,753 | 4,563 | 46,279 | — | 8,037 | — |
| Goldman Sachs International | NRG Energy, Inc. | 6/20/2020 | 5.000 | 1.748 | USD | 115,000 | 11,009 | 1,166 | 12,392 | — | — | (217) |
| Goldman Sachs International | Sprint Communications, Inc. | 6/20/2020 | 5.000 | 1.557 | USD | 115,000 | 11,711 | 1,166 | 12,392 | — | 485 | — |
| Goldman Sachs International | Targa Resources Partners LP/Finance Corp. | 6/20/2020 | 1.000 | 1.445 | USD | 340,000 | (4,408) | 689 | 4,033 | — | — | (7,752) |
| Goldman Sachs International | Verizon Communications, Inc. | 6/20/2019 | 1.000 | 0.38 | USD | 225,000 | 2,836 | — | 2,836 | — | — | — |
| Goldman Sachs International | Weatherford International Ltd. | 6/20/2020 | 1.000 | 2.414 | USD | 115,000 | (4,727) | — | — | (4,891) | 164 | — |
| JPMorgan | Ally Financial, Inc. | 6/20/2020 | 5.000 | 1.329 | USD | 115,000 | 12,473 | 1,166 | 12,704 | — | 935 | — |
| JPMorgan | Avis Budget Car Rental LLC/Finance, Inc. | 6/20/2020 | 5.000 | 2.942 | USD | 340,000 | 20,250 | 3,447 | 21,946 | — | 1,751 | — |
| JPMorgan | Calpine Corp. | 6/20/2020 | 5.000 | 1.912 | USD | 115,000 | 10,404 | 1,166 | 11,661 | — | — | (91) |
| JPMorgan | CenturyLink, Inc. | 6/20/2020 | 1.000 | 1.215 | USD | 115,000 | (738) | 234 | — | — | — | (504) |
| JPMorgan | CSC Holdings LLC | 6/20/2020 | 5.000 | 0.873 | USD | 115,000 | 14,176 | 1,166 | 14,666 | — | 676 | — |
| JPMorgan | Hertz Corp. (The) | 6/20/2019 | 5.000 | 6.185 | USD | 450,000 | (10,171) | 4,563 | — | (8,743) | 3,135 | — |
| JPMorgan | Navient Corp. | 6/20/2020 | 5.000 | 2.088 | USD | 340,000 | 28,913 | 3,447 | 33,402 | — | — | (1,042) |
| JPMorgan | Pactiv Corp. | 6/20/2020 | 5.000 | 1.205 | USD | 115,000 | 12,934 | 1,166 | 14,665 | — | — | (565) |
| JPMorgan | Rite Aid Corp. | 6/20/2020 | 5.000 | 1.635 | USD | 340,000 | 33,814 | 3,447 | 33,423 | — | 3,838 | — |
| JPMorgan | Simon Property Group L.P. | 6/20/2022 | 1.000 | 0.98 | USD | 450,000 | 423 | 913 | 212 | — | 1,124 | — |
| JPMorgan | United Rentals North America, Inc. | 6/20/2020 | 5.000 | 0.95 | USD | 115,000 | 13,909 | 1,166 | 14,590 | — | 485 | — |
| Morgan Stanley | Canadian Natural Resources Ltd. | 6/20/2022 | 1.000 | 1.2 | USD | 450,000 | (4,309) | 913 | — | (3,152) | — | (244) |
| Total | | | | | | | | | 352,922 | (25,022) | 33,809 | (11,107) |
| * | Implied credit spreads, represented in absolute terms, utilized in determining the market value of credit default swap agreements on corporate or sovereign issues as of period end serve as an indicator of the current status of the payment/performance risk and represent the likelihood or risk of default for the credit derivative. The implied credit spread of a particular referenced entity reflects the cost of buying/selling protection and may include upfront payments required to be made to enter into the agreement. Wider credit spreads represent a deterioration of the referenced entity’s credit soundness and a greater likelihood or risk of default or other credit event occurring as defined under the terms of the agreement. |
Notes to Consolidated Portfolio of Investments
| (a) | This security or a portion of this security has been pledged as collateral in connection with securities sold short. |
| (b) | Non-income producing investment. |
| (c) | Variable rate security. |
| (d) | Represents privately placed and other securities and instruments exempt from SEC registration (collectively, private placements), such as Section 4(a)(2) and Rule 144A eligible securities, which are often sold only to qualified institutional buyers. The Fund may invest in private placements determined to be liquid as well as those determined to be illiquid. Private placements may be determined to be liquid under guidelines established by the Fund’s Board of Trustees. At May 31, 2017, the value of these securities amounted to $286,000 which represents 0.36% of net assets. |
| (e) | Represents a security purchased on a when-issued basis. |
| (f) | The rate shown is the seven-day current annualized yield at May 31, 2017. |
The accompanying Notes to Consolidated Financial Statements are an integral part of this statement.
| 20 | Columbia Diversified Absolute Return Fund | Annual Report 2017 |
Consolidated Portfolio of Investments (continued)
May 31, 2017
Notes to Consolidated Portfolio of Investments (continued)
| (g) | As defined in the Investment Company Act of 1940, an affiliated company is one in which the Fund owns 5% or more of the company’s outstanding voting securities, or a company which is under common ownership or control with the Fund. Holdings and transactions in these affiliated companies during the year ended May 31, 2017 are as follows: |
| Issuer | Beginning
shares | Shares
purchased | Shares
sold | Ending
shares | Realized gain
(loss) ($) | Dividends —
affiliated
issuers($) | Value ($) |
| Columbia Short-Term Cash Fund, 0.916% | 84,043,686 | 76,973,520 | (122,331,023) | 38,686,183 | (57) | 319,838 | 38,686,183 |
Abbreviation Legend
| ADR | American Depositary Receipt |
Currency Legend
| AUD | Australian Dollar |
| CAD | Canada Dollar |
| CHF | Swiss Franc |
| EUR | Euro |
| GBP | British Pound |
| HKD | Hong Kong Dollar |
| JPY | Japanese Yen |
| NOK | Norwegian Krone |
| NZD | New Zealand Dollar |
| SEK | Swedish Krona |
| SGD | Singapore Dollar |
| USD | US Dollar |
Fair value measurements
The Fund categorizes its fair value measurements according to a three-level hierarchy that maximizes the use of observable inputs and minimizes the use of unobservable inputs by prioritizing that the most observable input be used when available. Observable inputs are those that market participants would use in pricing an investment based on market data obtained from sources independent of the reporting entity. Unobservable inputs are those that reflect the Fund’s assumptions about the information market participants would use in pricing an investment. An investment’s level within the fair value hierarchy is based on the lowest level of any input that is deemed significant to the asset’s or liability’s fair value measurement. The input levels are not necessarily an indication of the risk or liquidity associated with investments at that level. For example, certain U.S. government securities are generally high quality and liquid, however, they are reflected as Level 2 because the inputs used to determine fair value may not always be quoted prices in an active market.
Fair value inputs are summarized in the three broad levels listed below:
| • | Level 1 – Valuations based on quoted prices for investments in active markets that the Fund has the ability to access at the measurement date (including NAV for open-end mutual funds). Valuation adjustments are not applied to Level 1 investments. |
| • | Level 2 – Valuations based on other significant observable inputs (including quoted prices for similar securities, interest rates, prepayment speeds, credit risks, etc.). |
| • | Level 3 – Valuations based on significant unobservable inputs (including the Fund’s own assumptions and judgment in determining the fair value of investments). |
Inputs that are used in determining fair value of an investment may include price information, credit data, volatility statistics, and other factors. These inputs can be either observable or unobservable. The availability of observable inputs can vary between investments, and is affected by various factors such as the type of investment, and the volume and level of activity for that investment or similar investments in the marketplace. The inputs will be considered by the Investment Manager, along with any other relevant factors in the calculation of an investment’s fair value. The Fund uses prices and inputs that are current as of the measurement date, which may include periods of market dislocations. During these periods, the availability of prices and inputs may be reduced for many investments. This condition could cause an investment to be reclassified between the various levels within the hierarchy.
Certain investments that have been measured at fair value using the net asset value (NAV) per share (or its equivalent) are not categorized in the fair value hierarchy. The fair value amounts presented in the table are intended to reconcile the fair value hierarchy to the amounts presented in the Consolidated Portfolio of Investments. The Columbia Short-Term Cash Fund seeks to provide shareholders with maximum current income consistent with liquidity and stability of principal. Columbia Short-Term Cash Fund prices its shares with a floating NAV and no longer seeks to maintain a stable NAV.
Investments falling into the Level 3 category are primarily supported by quoted prices from brokers and dealers participating in the market for those investments. However, these may be classified as Level 3 investments due to lack of market transparency and corroboration to support these quoted prices. Additionally, valuation models may be used as the pricing source for any remaining investments classified as Level 3. These models may rely on one or more significant unobservable inputs and/or significant assumptions by the Investment Manager. Inputs used in valuations may include, but are not limited to, financial statement analysis, capital account balances, discount rates and estimated cash flows, and comparable company data.
The accompanying Notes to Consolidated Financial Statements are an integral part of this statement.
Columbia Diversified Absolute Return Fund | Annual Report 2017
| 21 |
Consolidated Portfolio of Investments (continued)
May 31, 2017
Fair value measurements (continued)
Under the direction of the Fund’s Board of Trustees (the Board), the Investment Manager’s Valuation Committee (the Committee) is responsible for overseeing the valuation procedures approved by the Board. The Committee consists of voting and non-voting members from various groups within the Investment Manager’s organization, including operations and accounting, trading and investments, compliance, risk management and legal.
The Committee meets at least monthly to review and approve valuation matters, which may include a description of specific valuation determinations, data regarding pricing information received from approved pricing vendors and brokers and the results of Board-approved valuation control policies and procedures (the Policies). The Policies address, among other things, instances when market quotations are or are not readily available, including recommendations of third party pricing vendors and a determination of appropriate pricing methodologies; events that require specific valuation determinations and assessment of fair value techniques; securities with a potential for stale pricing, including those that are illiquid, restricted, or in default; and the effectiveness of third party pricing vendors, including periodic reviews of vendors. The Committee meets more frequently, as needed, to discuss additional valuation matters, which may include the need to review back-testing results, review time-sensitive information or approve related valuation actions. The Committee reports to the Board, with members of the Committee meeting with the Board at each of its regularly scheduled meetings to discuss valuation matters and actions during the period, similar to those described earlier.
For investments categorized as Level 3, the Committee monitors information similar to that described above, which may include: (i) data specific to the issuer or comparable issuers, (ii) general market or specific sector news and (iii) quoted prices and specific or similar security transactions. The Committee considers this data and any changes from prior periods in order to assess the reasonableness of observable and unobservable inputs, any assumptions or internal models used to value those securities and changes in fair value. This data is also used to corroborate, when available, information received from approved pricing vendors and brokers. Various factors impact the frequency of monitoring this information (which may occur as often as daily). However, the Committee may determine that changes to inputs, assumptions and models are not required as a result of the monitoring procedures performed.
The following table is a summary of the inputs used to value the Fund’s investments at May 31, 2017:
| | Level 1
quoted prices
in active
markets for
identical
assets ($) | Level 2
other
significant
observable
inputs ($) | Level 3
significant
unobservable
inputs ($) | Investments
measured at
net asset
value ($) | Total ($) |
| Investments | | | | | |
| Common Stocks | | | | | |
| Consumer Discretionary | 3,859,056 | — | — | — | 3,859,056 |
| Consumer Staples | 2,519,350 | — | — | — | 2,519,350 |
| Energy | 1,563,767 | — | — | — | 1,563,767 |
| Financials | 3,313,073 | — | — | — | 3,313,073 |
| Health Care | 3,663,919 | — | — | — | 3,663,919 |
| Industrials | 2,815,248 | — | — | — | 2,815,248 |
| Information Technology | 6,480,123 | — | — | — | 6,480,123 |
| Materials | 1,205,067 | — | — | — | 1,205,067 |
| Real Estate | 551,473 | — | — | — | 551,473 |
| Telecommunication Services | 122,405 | — | — | — | 122,405 |
| Utilities | 1,311,438 | — | — | — | 1,311,438 |
| Total Common Stocks | 27,404,919 | — | — | — | 27,404,919 |
| Corporate Bonds & Notes | — | 9,734,203 | — | — | 9,734,203 |
| Exchange-Traded Funds | 3,681,824 | — | — | — | 3,681,824 |
| Money Market Funds | — | — | — | 38,686,183 | 38,686,183 |
| Total Investments | 31,086,743 | 9,734,203 | — | 38,686,183 | 79,507,129 |
| Investments Sold Short | | | | | |
| Common Stocks | | | | | |
| Consumer Discretionary | (1,942,320) | — | — | — | (1,942,320) |
| Consumer Staples | (1,479,973) | — | — | — | (1,479,973) |
| Energy | (969,393) | — | — | — | (969,393) |
| Financials | (1,509,104) | — | — | — | (1,509,104) |
| Health Care | (2,097,115) | — | — | — | (2,097,115) |
| Industrials | (1,981,010) | — | — | — | (1,981,010) |
| Information Technology | (3,556,123) | — | — | — | (3,556,123) |
| Materials | (864,175) | — | — | — | (864,175) |
| Real Estate | (72,503) | — | — | — | (72,503) |
The accompanying Notes to Consolidated Financial Statements are an integral part of this statement.
| 22 | Columbia Diversified Absolute Return Fund | Annual Report 2017 |
Consolidated Portfolio of Investments (continued)
May 31, 2017
Fair value measurements (continued)
| | Level 1
quoted prices
in active
markets for
identical
assets ($) | Level 2
other
significant
observable
inputs ($) | Level 3
significant
unobservable
inputs ($) | Investments
measured at
net asset
value ($) | Total ($) |
| Telecommunication Services | (172,451) | — | — | — | (172,451) |
| Utilities | (919,584) | — | — | — | (919,584) |
| Total Common Stocks | (15,563,751) | — | — | — | (15,563,751) |
| Total Investments Sold Short | (15,563,751) | — | — | — | (15,563,751) |
| Total Investments, Net of Investments Sold Short | 15,522,992 | 9,734,203 | — | 38,686,183 | 63,943,378 |
| Derivatives | | | | | |
| Asset | | | | | |
| Forward Foreign Currency Exchange Contracts | — | 450,332 | — | — | 450,332 |
| Futures Contracts | 404,129 | — | — | — | 404,129 |
| Swap Contracts | — | 33,809 | — | — | 33,809 |
| Liability | | | | | |
| Forward Foreign Currency Exchange Contracts | — | (412,016) | — | — | (412,016) |
| Futures Contracts | (194,772) | — | — | — | (194,772) |
| Swap Contracts | — | (40,976) | — | — | (40,976) |
| Total | 15,732,349 | 9,765,352 | — | 38,686,183 | 64,183,884 |
See the Consolidated Portfolio of Investments for all investment classifications not indicated in the table.
The Fund’s assets assigned to the Level 2 input category are generally valued using the market approach, in which a security’s value is determined through reference to prices and information from market transactions for similar or identical assets.
Derivative instruments are valued at unrealized appreciation (depreciation).
There were no transfers of financial assets between levels during the period.
The accompanying Notes to Consolidated Financial Statements are an integral part of this statement.
Columbia Diversified Absolute Return Fund | Annual Report 2017
| 23 |
Consolidated Statement of Assets and Liabilities
May 31, 2017
| Assets | |
| Investments, at cost | |
| Unaffiliated issuers, at cost | $37,771,316 |
| Affiliated issuers, at cost | 38,686,157 |
| Total investments, at cost | 76,457,473 |
| Investments, at value | |
| Unaffiliated issuers, at value | 40,820,946 |
| Affiliated issuers, at value | 38,686,183 |
| Total investments, at value | 79,507,129 |
| Foreign currency (identified cost $12) | 12 |
| Cash collateral held at broker | 5,616,596 |
| Margin deposits | 1,627,806 |
| Unrealized appreciation on forward foreign currency exchange contracts | 450,332 |
| Unrealized appreciation on swap contracts | 33,809 |
| Premiums paid on outstanding swap contracts | 352,922 |
| Receivable for: | |
| Investments sold | 8,235,553 |
| Investments sold on a delayed delivery basis | 215,239 |
| Capital shares sold | 9,215 |
| Dividends | 81,710 |
| Interest | 65,356 |
| Foreign tax reclaims | 2,861 |
| Variation margin for futures contracts | 30,685 |
| Expense reimbursement due from Investment Manager | 990 |
| Prepaid expenses | 139 |
| Trustees’ deferred compensation plan | 8,094 |
| Other assets | 12,846 |
| Total assets | 96,251,294 |
| Liabilities | |
| Securities sold short, at value (proceeds $14,498,707) | 15,563,751 |
| Unrealized depreciation on forward foreign currency exchange contracts | 412,016 |
| Unrealized depreciation on swap contracts | 13,807 |
| Premiums received on outstanding swap contracts | 44,622 |
| Payable for: | |
| Investments purchased | 359,742 |
| Investments purchased on a delayed delivery basis | 501,000 |
| Capital shares purchased | 34,178 |
| Dividends and interest on securities sold short | 44,931 |
| Variation margin for futures contracts | 35,839 |
| Variation margin for swap contracts | 1,772 |
| Management services fees | 2,565 |
| Distribution and/or service fees | 2 |
| Transfer agent fees | 2,287 |
| Compensation of board members | 225 |
| Compensation of chief compliance officer | 6 |
| Other expenses | 71,741 |
| Trustees’ deferred compensation plan | 8,094 |
| Total liabilities | 17,096,578 |
| Net assets applicable to outstanding capital stock | $79,154,716 |
The accompanying Notes to Consolidated Financial Statements are an integral part of this statement.
| 24 | Columbia Diversified Absolute Return Fund | Annual Report 2017 |
Consolidated Statement of Assets and Liabilities (continued)
May 31, 2017
| Represented by | |
| Paid in capital | $82,305,498 |
| Excess of distributions over net investment income | (974,061) |
| Accumulated net realized loss | (4,418,113) |
| Unrealized appreciation (depreciation) on: | |
| Investments - unaffiliated issuers | 3,049,630 |
| Investments - affiliated issuers | 26 |
| Foreign currency translations | 18,760 |
| Forward foreign currency exchange contracts | 38,316 |
| Futures contracts | 209,357 |
| Securities sold short | (1,065,044) |
| Swap contracts | (7,167) |
| Foreign capital gains tax | (2,486) |
| Total - representing net assets applicable to outstanding capital stock | $79,154,716 |
| Class A | |
| Net assets | $77,109 |
| Shares outstanding | 8,075 |
| Net asset value per share | $9.55 |
| Maximum offering price per share(a) | $10.13 |
| Class C | |
| Net assets | $13,418 |
| Shares outstanding | 1,426 |
| Net asset value per share | $9.41 |
| Class R4 | |
| Net assets | $9,594 |
| Shares outstanding | 1,000 |
| Net asset value per share | $9.59 |
| Class R5 | |
| Net assets | $9,631 |
| Shares outstanding | 1,000 |
| Net asset value per share | $9.63 |
| Class T(b) | |
| Net assets | $110,126 |
| Shares outstanding | 11,316 |
| Net asset value per share | $9.73 |
| Maximum offering price per share(c) | $9.98 |
| Class Y | |
| Net assets | $78,485,010 |
| Shares outstanding | 8,169,247 |
| Net asset value per share | $9.61 |
| Class Z | |
| Net assets | $449,828 |
| Shares outstanding | 46,636 |
| Net asset value per share | $9.65 |
| (a) | The maximum offering price per share is calculated by dividing the net asset value per share by 1.0 minus the maximum sales charge of 5.75% for Class A. |
| (b) | Effective March 27, 2017, Class W shares were renamed Class T shares. |
| (c) | The maximum offering price per share is calculated by dividing the net asset value per share by 1.0 minus the maximum sales charge of 2.50% for Class T. |
The accompanying Notes to Consolidated Financial Statements are an integral part of this statement.
Columbia Diversified Absolute Return Fund | Annual Report 2017
| 25 |
Consolidated Statement of Operations
Year Ended May 31, 2017
| Net investment income | |
| Income: | |
| Dividends — unaffiliated issuers | $1,023,119 |
| Dividends — affiliated issuers | 319,838 |
| Interest | 121,591 |
| Foreign taxes withheld | (1,963) |
| Total income | 1,462,585 |
| Expenses: | |
| Management services fees | 1,158,838 |
| Distribution and/or service fees | |
| Class A | 357 |
| Class C | 142 |
| Class T(a) | 27,871 |
| Transfer agent fees | |
| Class A | 790 |
| Class C | 72 |
| Class I(b) | 2,026 |
| Class R4 | 50 |
| Class R5 | 5 |
| Class T(a) | 85,826 |
| Class Y(c) | 1,647 |
| Class Z | 580 |
| Compensation of board members | 19,986 |
| Custodian fees | 66,346 |
| Printing and postage fees | 20,865 |
| Registration fees | 91,357 |
| Audit fees | 83,495 |
| Legal fees | 3,089 |
| Dividends and interest on securities sold short | 627,933 |
| Compensation of chief compliance officer | 43 |
| Other | 29,888 |
| Total expenses | 2,221,206 |
| Fees waived or expenses reimbursed by Investment Manager and its affiliates | (354,486) |
| Total net expenses | 1,866,720 |
| Net investment loss | (404,135) |
The accompanying Notes to Consolidated Financial Statements are an integral part of this statement.
| 26 | Columbia Diversified Absolute Return Fund | Annual Report 2017 |
Consolidated Statement of Operations (continued)
Year Ended May 31, 2017
| Realized and unrealized gain (loss) — net | |
| Net realized gain (loss) on: | |
| Investments — unaffiliated issuers | $3,001,748 |
| Investments — affiliated issuers | (57) |
| Foreign currency translations | 18,784 |
| Forward foreign currency exchange contracts | 45,746 |
| Futures contracts | 478,587 |
| Options purchased | (17,506) |
| Securities sold short | (3,894,173) |
| Swap contracts | (2,136,235) |
| Net realized loss | (2,503,106) |
| Net change in unrealized appreciation (depreciation) on: | |
| Investments — unaffiliated issuers | 1,892,588 |
| Investments — affiliated issuers | 26 |
| Foreign currency translations | 26,047 |
| Forward foreign currency exchange contracts | (37,464) |
| Futures contracts | (174,915) |
| Options purchased | 15,980 |
| Securities sold short | (27,407) |
| Swap contracts | 615,520 |
| Foreign capital gains tax | (2,486) |
| Net change in unrealized appreciation (depreciation) | 2,307,889 |
| Net realized and unrealized loss | (195,217) |
| Net decrease in net assets resulting from operations | $(599,352) |
| (a) | Effective March 27, 2017, Class W shares were renamed Class T shares. |
| (b) | Effective March 27, 2017, Class I shares were redeemed or exchanged for Class Y shares. |
| (c) | Class Y shares are based on operations from March 1, 2017 (commencement of operations) through the stated period end. |
The accompanying Notes to Consolidated Financial Statements are an integral part of this statement.
Columbia Diversified Absolute Return Fund | Annual Report 2017
| 27 |
Consolidated Statement of Changes in Net Assets
| | Year Ended
May 31, 2017 | Year Ended
May 31, 2016 |
| Operations | | |
| Net investment loss | $(404,135) | $(1,259,139) |
| Net realized loss | (2,503,106) | (2,120,772) |
| Net change in unrealized appreciation (depreciation) | 2,307,889 | (699,242) |
| Net decrease in net assets resulting from operations | (599,352) | (4,079,153) |
| Distributions to shareholders | | |
| Net investment income | | |
| Class A | — | (518) |
| Class C | — | (9) |
| Class I(a) | — | (440,917) |
| Class R4 | — | (36) |
| Class R5 | — | (36) |
| Class T(b) | — | (132,341) |
| Class Z | — | (2,746) |
| Net realized gains | | |
| Class A | — | (1,079) |
| Class C | — | (61) |
| Class I(a) | — | (711,822) |
| Class R4 | — | (61) |
| Class R5 | — | (61) |
| Class T(b) | — | (277,711) |
| Class Z | — | (4,640) |
| Total distributions to shareholders | — | (1,572,038) |
| Increase (decrease) in net assets from capital stock activity | (74,626,837) | 51,696,990 |
| Total increase (decrease) in net assets | (75,226,189) | 46,045,799 |
| Net assets at beginning of year | 154,380,905 | 108,335,106 |
| Net assets at end of year | $79,154,716 | $154,380,905 |
| Excess of distributions over net investment income | $(974,061) | $(903,351) |
| (a) | Effective March 27, 2017, Class I shares were redeemed or exchanged for Class Y shares. |
| (b) | Effective March 27, 2017, Class W shares were renamed Class T shares. |
The accompanying Notes to Consolidated Financial Statements are an integral part of this statement.
| 28 | Columbia Diversified Absolute Return Fund | Annual Report 2017 |
Consolidated Statement of Changes in Net Assets (continued)
| | Year Ended | Year Ended |
| | May 31, 2017 (a) | May 31, 2016 |
| | Shares | Dollars ($) | Shares | Dollars ($) |
| Capital stock activity |
| Class A | | | | |
| Subscriptions | 11,047 | 105,354 | 20,554 | 202,447 |
| Distributions reinvested | — | — | 155 | 1,507 |
| Redemptions | (24,670) | (231,892) | (130) | (1,269) |
| Net increase (decrease) | (13,623) | (126,538) | 20,579 | 202,685 |
| Class C | | | | |
| Subscriptions | 1,472 | 13,776 | — | — |
| Redemptions | (1,046) | (9,611) | — | — |
| Net increase | 426 | 4,165 | — | — |
| Class I(b) | | | | |
| Subscriptions | 207,955 | 1,987,019 | 1,630,984 | 15,949,695 |
| Distributions reinvested | — | — | 118,584 | 1,152,640 |
| Redemptions | (11,773,004) | (112,389,158) | (819,583) | (7,962,439) |
| Net increase (decrease) | (11,565,049) | (110,402,139) | 929,985 | 9,139,896 |
| Class T(c) | | | | |
| Subscriptions | 97,080 | 930,095 | 4,872,747 | 47,428,065 |
| Distributions reinvested | — | — | 42,264 | 409,961 |
| Redemptions | (4,431,332) | (42,513,562) | (570,443) | (5,485,481) |
| Net increase (decrease) | (4,334,252) | (41,583,467) | 4,344,568 | 42,352,545 |
| Class Y(b) | | | | |
| Subscriptions | 8,327,304 | 79,277,140 | — | — |
| Redemptions | (158,057) | (1,514,846) | — | — |
| Net increase | 8,169,247 | 77,762,294 | — | — |
| Class Z | | | | |
| Subscriptions | 24,757 | 234,528 | 591 | 5,708 |
| Distributions reinvested | — | — | 751 | 7,288 |
| Redemptions | (54,722) | (515,680) | (1,137) | (11,132) |
| Net increase (decrease) | (29,965) | (281,152) | 205 | 1,864 |
| Total net increase (decrease) | (7,773,216) | (74,626,837) | 5,295,337 | 51,696,990 |
| (a) | Class Y shares are based on operations from March 1, 2017 (commencement of operations) through the stated period end. |
| (b) | Effective March 27, 2017, Class I shares were redeemed or exchanged for Class Y shares. |
| (c) | Effective March 27, 2017, Class W shares were renamed Class T shares. |
The accompanying Notes to Consolidated Financial Statements are an integral part of this statement.
Columbia Diversified Absolute Return Fund | Annual Report 2017
| 29 |
Consolidated Financial Highlights
The following table is intended to help you understand the Fund’s financial performance. Certain information reflects financial results for a single share of a class held for the periods shown. Per share net investment income (loss) amounts are calculated based on average shares outstanding during the period. Total return assumes reinvestment of all dividends and distributions, if any. Total return does not reflect payment of sales charges, if any. Total return and portfolio turnover are not annualized for periods of less than one year. The portfolio turnover rate is calculated without regard to purchase and sales transactions of short-term instruments and certain derivatives, if any. If such transactions were included, the Fund’s portfolio turnover rate may be higher.
| Year ended | Net asset value,
beginning of
period | Net
investment
income
(loss) | Net
realized
and
unrealized
gain (loss) | Total from
investment
operations | Distributions
from net
investment
income | Distributions
from net
realized
gains |
| Class A |
| 5/31/2017 | $9.61 | (0.08) | 0.02 (c) | (0.06) | — | — |
| 5/31/2016 | $10.10 | (0.13) | (0.27) | (0.40) | (0.03) | (0.06) |
| 5/31/2015 (e) | $10.00 | (0.03) | 0.13 | 0.10 | — | — |
| Class C |
| 5/31/2017 | $9.54 | (0.15) | 0.02 (c) | (0.13) | — | — |
| 5/31/2016 | $10.08 | (0.19) | (0.28) | (0.47) | (0.01) | (0.06) |
| 5/31/2015 (e) | $10.00 | (0.05) | 0.13 | 0.08 | — | — |
| Class R4 |
| 5/31/2017 | $9.64 | (0.06) | 0.01 (c) | (0.05) | — | — |
| 5/31/2016 | $10.11 | (0.09) | (0.28) | (0.37) | (0.04) | (0.06) |
| 5/31/2015 (e) | $10.00 | (0.02) | 0.13 | 0.11 | — | — |
| Class R5 |
| 5/31/2017 | $9.65 | (0.04) | 0.02 (c) | (0.02) | — | — |
| 5/31/2016 | $10.11 | (0.09) | (0.27) | (0.36) | (0.04) | (0.06) |
| 5/31/2015 (e) | $10.00 | (0.02) | 0.13 | 0.11 | — | — |
| Class T(g) |
| 5/31/2017 | $9.62 | (0.05) | 0.16 (c) | 0.11 | — | — |
| 5/31/2016 | $10.10 | (0.13) | (0.26) | (0.39) | (0.03) | (0.06) |
| 5/31/2015 (e) | $10.00 | (0.03) | 0.13 | 0.10 | — | — |
| Class Y |
| 5/31/2017 (h) | $9.58 | (0.01) | 0.04 (c) | 0.03 | — | — |
The accompanying Notes to Consolidated Financial Statements are an integral part of this statement.
| 30 | Columbia Diversified Absolute Return Fund | Annual Report 2017 |
Total
distributions to
shareholders | Net
asset
value,
end of
period | Total
return | Total gross
expense
ratio to
average
net assets(a) | Total net
expense
ratio to
average
net assets(a),(b) | Net investment
income (loss)
ratio to
average
net assets | Portfolio
turnover | Net
assets,
end of
period
(000’s) |
| |
| — | $9.55 | (0.62%) | 3.15% (d) | 2.31% (d) | (0.84%) | 135% | $77 |
| (0.09) | $9.61 | (3.96%) | 3.03% (d) | 2.22% (d) | (1.31%) | 196% | $209 |
| — | $10.10 | 1.00% | 2.11% (d),(f) | 1.99% (d),(f) | (1.04%) (f) | 60% | $11 |
| |
| — | $9.41 | (1.36%) | 3.89% (d) | 3.05% (d) | (1.62%) | 135% | $13 |
| (0.07) | $9.54 | (4.68%) | 3.78% (d) | 2.97% (d) | (2.00%) | 196% | $10 |
| — | $10.08 | 0.80% | 2.89% (d),(f) | 2.75% (d),(f) | (1.80%) (f) | 60% | $10 |
| |
| — | $9.59 | (0.52%) | 2.88% (d) | 2.03% (d) | (0.59%) | 135% | $10 |
| (0.10) | $9.64 | (3.69%) | 2.77% (d) | 1.97% (d) | (0.99%) | 196% | $10 |
| — | $10.11 | 1.10% | 1.89% (d),(f) | 1.74% (d),(f) | (0.79%) (f) | 60% | $10 |
| |
| — | $9.63 | (0.21%) | 2.20% (d) | 1.89% (d) | (0.46%) | 135% | $10 |
| (0.10) | $9.65 | (3.59%) | 2.02% (d) | 1.85% (d) | (0.88%) | 196% | $10 |
| — | $10.11 | 1.10% | 1.89% (d),(f) | 1.74% (d),(f) | (0.80%) (f) | 60% | $10 |
| |
| — | $9.73 | 1.14% | 3.15% (d) | 2.31% (d) | (0.51%) | 135% | $110 |
| (0.09) | $9.62 | (3.87%) | 3.03% (d) | 2.22% (d) | (1.24%) | 196% | $41,796 |
| — | $10.10 | 1.00% | 2.14% (d),(f) | 2.00% (d),(f) | (1.05%) (f) | 60% | $10 |
| |
| — | $9.61 | 0.31% | 2.29% (d),(f) | 1.74% (d),(f) | (0.30%) (f) | 135% | $78,485 |
Columbia Diversified Absolute Return Fund | Annual Report 2017
| 31 |
Consolidated Financial Highlights (continued)
| Year ended | Net asset value,
beginning of
period | Net
investment
income
(loss) | Net
realized
and
unrealized
gain (loss) | Total from
investment
operations | Distributions
from net
investment
income | Distributions
from net
realized
gains |
| Class Z |
| 5/31/2017 | $9.64 | (0.02) | 0.03 (c) | 0.01 | — | — |
| 5/31/2016 | $10.11 | (0.10) | (0.27) | (0.37) | (0.04) | (0.06) |
| 5/31/2015 (e) | $10.00 | (0.02) | 0.13 | 0.11 | — | — |
| Notes to Consolidated Financial Highlights |
| (a) | In addition to the fees and expenses that the Fund bears directly, the Fund indirectly bears a pro rata share of the fees and expenses of any other funds in which it invests. Such indirect expenses are not included in the Fund’s reported expense ratios. |
| (b) | Total net expenses include the impact of certain fee waivers/expense reimbursements made by the Investment Manager and certain of its affiliates, if applicable. |
| (c) | Calculation of the net gain (loss) per share (both realized and unrealized) does not correlate to the aggregate realized and unrealized gain (loss) presented in the Consolidated Statement of Operations due to the timing of subscriptions and redemptions of Fund shares in relation to fluctuations in the market value of the portfolio. |
| (d) | Ratios include dividends and interest on securities sold short. If dividends and interest on securities sold short had been excluded, expenses would have been lower by: |
| Class | 05/31/2017 | 05/31/2016 | 05/31/2015 |
| Class A | 0.67% | 0.53% | 0.41% |
| Class C | 0.66% | 0.50% | 0.42% |
| Class R4 | 0.64% | 0.50% | 0.42% |
| Class R5 | 0.64% | 0.50% | 0.42% |
| Class T | 0.66% | 0.60% | 0.42% |
| Class Y | 0.57% | —% | —% |
| Class Z | 0.66% | 0.50% | 0.44% |
| (e) | Based on operations from February 19, 2015 (fund commencement of operations) through the stated period end. |
| (f) | Annualized. |
| (g) | Effective March 27, 2017, Class W shares were renamed Class T shares. |
| (h) | Class Y shares commenced operations on March 1, 2017. Per share data and total return reflect activity from that date. |
The accompanying Notes to Consolidated Financial Statements are an integral part of this statement.
| 32 | Columbia Diversified Absolute Return Fund | Annual Report 2017 |
Total
distributions to
shareholders | Net
asset
value,
end of
period | Total
return | Total gross
expense
ratio to
average
net assets(a) | Total net
expense
ratio to
average
net assets(a),(b) | Net investment
income (loss)
ratio to
average
net assets | Portfolio
turnover | Net
assets,
end of
period
(000’s) |
| |
| — | $9.65 | 0.10% | 2.90% (d) | 2.05% (d) | (0.54%) | 135% | $450 |
| (0.10) | $9.64 | (3.69%) | 2.77% (d) | 1.97% (d) | (0.99%) | 196% | $738 |
| — | $10.11 | 1.10% | 1.91% (d),(f) | 1.75% (d),(f) | (0.74%) (f) | 60% | $772 |
Columbia Diversified Absolute Return Fund | Annual Report 2017
| 33 |
Notes to Consolidated Financial Statements
May 31, 2017
Note 1. Organization
Columbia Diversified Absolute Return Fund (the Fund), a series of Columbia Funds Series Trust I (the Trust), is a diversified fund. The Trust is registered under the Investment Company Act of 1940, as amended (the 1940 Act), as an open-end management investment company organized as a Massachusetts business trust.
Basis for consolidation
CDARF1 Offshore Fund, Ltd., CDARF2 Offshore Fund, Ltd. and CDARF3 Offshore Fund, Ltd. (each, a Subsidiary) are each a Cayman Islands exempted company and wholly-owned subsidiary of the Fund. Each Subsidiary acts as an investment vehicle in order to effect certain investment strategies consistent with the Fund’s investment objective and policies as stated in its current prospectus and statement of additional information. In accordance with the Memorandum and Articles of Association of the Subsidiary (the Articles), the Fund owns the sole issued share of each Subsidiary and retains all rights associated with such share, including the right to receive notice of, attend and vote at general meetings of the Subsidiaries, rights in a winding-up or repayment of capital and the right to participate in the profits or assets of the Subsidiaries. The consolidated financial statements (financial statements) include the accounts of the consolidated Fund and each respective Subsidiary. Subsequent references to the Fund within the Notes to Consolidated Financial Statements collectively refer to the Fund and each Subsidiary. All intercompany transactions and balances have been eliminated in the consolidation process.
At May 31, 2017, each Subsidiary’s financial statement information is as follows:
| | CDARF1 Offshore Fund, Ltd. | CDARF2 Offshore Fund, Ltd. | CDARF3 Offshore Fund, Ltd. |
| % of consolidated fund net assets | 0.12% | 3.74% | 3.36% |
| Net assets | $96,518 | $2,960,534 | $2,662,205 |
| Net investment loss | (4,513) | (32,591) | (48,347) |
| Net realized gain (loss) | — | 85,091 | (1,874,112) |
| Net change in unrealized appreciation (depreciation) | — | (165,653) | 512,311 |
The financial statements present the portfolio holdings, financial position and results of operations of the Fund and the Subsidiary on a consolidated basis.
Fund shares
The Trust may issue an unlimited number of shares (without par value). Although all share classes generally have identical voting, dividend and liquidation rights, each share class votes separately when required by the Trust’s organizational documents or by law. Different share classes pay different distribution amounts to the extent the expenses of such share classes differ, and distributions in liquidation will be proportional to the net asset value of each share class. Each share class has its own expense and sales charge structure. The Fund offers each of the share classes identified below.
Class A shares are subject to a maximum front-end sales charge of 5.75% based on the initial investment amount. Class A shares purchased without an initial sales charge in accounts aggregating $1 million to $50 million at the time of purchase are subject to a contingent deferred sales charge (CDSC) if the shares are sold within 18 months after purchase, charged as follows: 1.00% CDSC if redeemed within 12 months after purchase, and 0.50% CDSC if redeemed more than 12, but less than 18, months after purchase.
Class C shares are subject to a 1.00% CDSC on shares redeemed within 12 months after purchase.
Effective March 27, 2017, Class I shares of the Fund are no longer offered for sale. Class I shares, when available, were not subject to sales charges or distribution and service (12b-1) fees, and were made available only to the Columbia Family of Funds. On March 27, 2017, Class I shares were redeemed or exchanged for Class Y shares of the Fund in a tax free transaction that had no impact on the fees and expenses paid by shareholders.
Class R4 shares are not subject to sales charges and are generally available only to omnibus retirement plans and certain investors as described in the Fund’s prospectus.
Class R5 shares are not subject to sales charges and are generally available only to investors purchasing through authorized investment professionals and omnibus retirement plans.
| 34 | Columbia Diversified Absolute Return Fund | Annual Report 2017 |
Notes to Consolidated Financial Statements (continued)
May 31, 2017
Class T shares are subject to a maximum front-end sales charge of 2.50% per transaction and must be purchased through financial intermediaries that, by written agreement with Columbia Management Investment Distributors, Inc., are specifically authorized to sell Class T shares. Prior to March 27, 2017, Class T shares were known as Class W shares, were not subject to sales charges, and were generally available only to investors purchasing through authorized investment programs managed by investment professionals, including discretionary managed accounts.
Class Y shares are not subject to sales charges or distribution and service (12b-1) fees, and are available to institutional and certain other investors as described in the Fund’s prospectus. Class Y shares commenced operations on March 1, 2017. On March 27, 2017, Class I shares were redeemed or exchanged for Class Y shares of the Fund in a tax free transaction that had no impact on the fees and expenses paid by shareholders. Class I shares of the Fund are no longer offered for sale.
Class Z shares are not subject to sales charges and are generally available only to eligible investors, which are subject to different investment minimums as described in the Fund’s prospectus.
Note 2. Summary of significant accounting policies
Basis of preparation
The Fund is an investment company that applies the accounting and reporting guidance in the Financial Accounting Standards Board (FASB) Accounting Standards Codification Topic 946, Financial Services - Investment Companies (ASC 946). The financial statements are prepared in accordance with U.S. generally accepted accounting principles (GAAP), which requires management to make certain estimates and assumptions that affect the reported amounts of assets and liabilities, the disclosure of contingent assets and liabilities at the date of the financial statements and the reported amounts of income and expenses during the reporting period. Actual results could differ from those estimates.
The following is a summary of significant accounting policies followed by the Fund in the preparation of its financial statements.
Security valuation
All equity securities and exchange-traded funds are valued at the close of business of the New York Stock Exchange. Equity securities and exchange-traded funds are valued at the last quoted sales price on the principal exchange or market on which they trade, except for securities traded on the NASDAQ Stock Market, which are valued at the NASDAQ official close price. Unlisted securities or listed securities for which there were no sales during the day are valued at the mean of the latest quoted bid and ask prices on such exchanges or markets.
Debt securities generally are valued by pricing services approved by the Board of Trustees based upon market transactions for normal, institutional-size trading units of similar securities. The services may use various pricing techniques that take into account, as applicable, factors such as yield, quality, coupon rate, maturity, type of issue, trading characteristics and other data, as well as approved independent broker-dealer quotes. Debt securities for which quotations are not readily available or not believed to be reflective of market value may also be valued based upon a bid quote from an approved independent broker-dealer. Debt securities maturing in 60 days or less are valued primarily at amortized cost value, unless this method results in a valuation that management believes does not approximate market value.
Foreign equity securities are valued based on the closing price on the foreign exchange in which such securities are primarily traded. If any foreign equity security closing prices are not readily available, the securities are valued at the mean of the latest quoted bid and ask prices on such exchanges or markets. Foreign currency exchange rates are generally determined at 4:00 p.m. Eastern (U.S.) time. Many securities markets and exchanges outside the U.S. close prior to the close of the New York Stock Exchange; therefore, the closing prices for securities in such markets or on such exchanges may not fully reflect events that occur after such close but before the close of the New York Stock Exchange. In those situations, foreign securities will be fair valued pursuant to a policy adopted by the Board of Trustees, including, if available, utilizing a third party pricing service to determine these fair values. The third party pricing service takes into account multiple factors, including, but not limited to, movements in the U.S. securities markets, certain depositary receipts, futures contracts and foreign exchange rates that have occurred subsequent to the close of the foreign exchange or market, to determine a good faith estimate that reasonably reflects the current market conditions as of the close of the New York Stock Exchange. The fair value of a security is likely to be different from the quoted or published price, if available.
Columbia Diversified Absolute Return Fund | Annual Report 2017
| 35 |
Notes to Consolidated Financial Statements (continued)
May 31, 2017
Investments in open-end investment companies, including money market funds, are valued at their latest net asset value.
Forward foreign currency exchange contracts are marked-to-market based upon foreign currency exchange rates provided by a pricing service.
Futures and options on futures contracts are valued based upon the settlement price at the close of regular trading on their principal exchanges or, in the absence of transactions, at the mean of the latest quoted bid and ask prices.
Swap transactions are valued through an independent pricing service or broker, or if neither is available, through an internal model based upon observable inputs.
Investments for which market quotations are not readily available, or that have quotations which management believes are not reflective of market value or reliable, are valued at fair value as determined in good faith under procedures approved by and under the general supervision of the Board of Trustees. If a security or class of securities (such as foreign securities) is valued at fair value, such value is likely to be different from the quoted or published price for the security.
The determination of fair value often requires significant judgment. To determine fair value, management may use assumptions including but not limited to future cash flows and estimated risk premiums. Multiple inputs from various sources may be used to determine fair value.
GAAP requires disclosure regarding the inputs and valuation techniques used to measure fair value and any changes in valuation inputs or techniques. In addition, investments shall be disclosed by major category. This information is disclosed following the Fund’s Consolidated Portfolio of Investments.
Foreign currency transactions and translations
The values of all assets and liabilities denominated in foreign currencies are generally translated into U.S. dollars at exchange rates determined at the close of regular trading on the New York Stock Exchange. Net realized and unrealized gains (losses) on foreign currency transactions and translations include gains (losses) arising from the fluctuation in exchange rates between trade and settlement dates on securities transactions, gains (losses) arising from the disposition of foreign currency and currency gains (losses) between the accrual and payment dates on dividends, interest income and foreign withholding taxes.
For financial statement purposes, the Fund does not distinguish that portion of gains (losses) on investments which is due to changes in foreign exchange rates from that which is due to changes in market prices of the investments. Such fluctuations are included with the net realized and unrealized gains (losses) on investments in the Consolidated Statement of Operations.
Derivative instruments
The Fund invests in certain derivative instruments, as detailed below, to meet its investment objectives. Derivatives are instruments whose values depend on, or are derived from, in whole or in part, the value of one or more securities, currencies, commodities, indices, or other assets or instruments. Derivatives may be used to increase investment flexibility (including to maintain cash reserves while maintaining desired exposure to certain assets), for risk management (hedging) purposes, to facilitate trading, to reduce transaction costs and to pursue higher investment returns. The Fund may also use derivative instruments to mitigate certain investment risks, such as foreign currency exchange rate risk, interest rate risk and credit risk. Derivatives may involve various risks, including the potential inability of the counterparty to fulfill its obligations under the terms of the contract, the potential for an illiquid secondary market (making it difficult for the Fund to sell or terminate, including at favorable prices) and the potential for market movements which may expose the Fund to gains or losses in excess of the amount shown in the Consolidated Statement of Assets and Liabilities. The notional amounts of derivative instruments, if applicable, are not recorded in the financial statements.
A derivative instrument may suffer a marked-to-market loss if the value of the contract decreases due to an unfavorable change in the market rates or values of the underlying instrument. Losses can also occur if the counterparty does not perform its obligations under the contract. The Fund’s risk of loss from counterparty credit risk on over-the-counter derivatives is generally limited to the aggregate unrealized gain netted against any collateral held by the Fund and the amount of any variation margin held by the counterparty, plus any replacement costs or related amounts. With exchange-traded or centrally
| 36 | Columbia Diversified Absolute Return Fund | Annual Report 2017 |
Notes to Consolidated Financial Statements (continued)
May 31, 2017
cleared derivatives, there is reduced counterparty credit risk to the Fund since the clearinghouse or central counterparty (CCP) provides some protection in the case of clearing member default. The clearinghouse or CCP stands between the buyer and the seller of the contract; therefore, additional counterparty credit risk is failure of the clearinghouse or CCP. However, credit risk still exists in exchange-traded or centrally cleared derivatives with respect to initial and variation margin that is held in a broker’s customer account. While brokers are required to segregate customer margin from their own assets, in the event that a broker becomes insolvent or goes into bankruptcy and at that time there is a shortfall in the aggregate amount of margin held by the broker for all its clients, U.S. bankruptcy laws will typically allocate that shortfall on a pro-rata basis across all the broker’s customers (including the Fund), potentially resulting in losses to the Fund.
In order to better define its contractual rights and to secure rights that will help the Fund mitigate its counterparty risk, the Fund may enter into an International Swaps and Derivatives Association, Inc. Master Agreement (ISDA Master Agreement) or similar agreement with its derivatives contract counterparties. An ISDA Master Agreement is an agreement between the Fund and a counterparty that governs over-the-counter derivatives and typically contains, among other things, collateral posting terms and netting provisions in the event of a default and/or termination event. Under an ISDA Master Agreement, the Fund may, under certain circumstances, offset with the counterparty certain derivative instrument’s payables and/or receivables with collateral held and/or posted and create one single net payment. The provisions of the ISDA Master Agreement typically permit a single net payment in the event of default (close-out netting), including the bankruptcy or insolvency of the counterparty. Note, however, that bankruptcy or insolvency laws of a particular jurisdiction may impose restrictions on or prohibitions against the right of offset or netting in bankruptcy, insolvency or other events.
Collateral (margin) requirements differ by type of derivative. Margin requirements are established by the clearinghouse or CCP for exchange-traded and centrally cleared derivatives. Brokers can ask for margin in excess of the minimum in certain circumstances. Collateral terms are contract specific for over-the-counter derivatives. For over-the-counter derivatives traded under an ISDA Master Agreement, the collateral requirements are typically calculated by netting the marked-to-market amount for each transaction under such agreement and comparing that amount to the value of any variation margin currently pledged by the Fund and/or the counterparty. Generally, the amount of collateral due from or to a party has to exceed a minimum transfer amount threshold (e.g., $250,000) before a transfer has to be made. To the extent amounts due to the Fund from its counterparties are not fully collateralized, contractually or otherwise, the Fund bears the risk of loss from counterparty nonperformance. The Fund attempts to mitigate counterparty risk by only entering into agreements with counterparties that it believes have the financial resources to honor their obligations and by monitoring the financial stability of those counterparties.
Certain ISDA Master Agreements allow counterparties of over-the-counter derivatives transactions to terminate derivatives contracts prior to maturity in the event the Fund’s net asset value declines by a stated percentage over a specified time period or if the Fund fails to meet certain terms of the ISDA Master Agreement, which would cause the Fund to accelerate payment of any net liability owed to the counterparty. The Fund also has termination rights if the counterparty fails to meet certain terms of the ISDA Master Agreement. In addition to considering counterparty credit risk, the Fund would consider terminating the derivatives contracts based on whether termination would result in a net liability owed from the counterparty.
For financial reporting purposes, the Fund does not offset derivative assets and derivative liabilities that are subject to netting arrangements in the Consolidated Statement of Assets and Liabilities.
Forward foreign currency exchange contracts
Forward foreign currency exchange contracts are over-the-counter agreements between two parties to buy and sell a currency at a set price on a future date. The Fund utilized forward foreign currency exchange contracts to hedge the currency exposure associated with some or all of the Fund’s securities, to shift foreign currency exposure back to U.S. dollars, to shift investment exposure from one currency to another, to shift U.S. dollar exposure to achieve a representative weighted mix of major currencies in its benchmark, to recover an underweight country exposure in its portfolio or to generate total return through long and short positions versus the U.S. dollar. These instruments may be used for other purposes in future periods.
The values of forward foreign currency exchange contracts fluctuate daily with changes in foreign currency exchange rates. Changes in the value of these contracts are recorded as unrealized appreciation or depreciation until the contract is exercised or has expired. The Fund will realize a gain or loss when the forward foreign currency exchange contract is closed or expires.
Columbia Diversified Absolute Return Fund | Annual Report 2017
| 37 |
Notes to Consolidated Financial Statements (continued)
May 31, 2017
The use of forward foreign currency exchange contracts does not eliminate fluctuations in the prices of the Fund’s portfolio securities. The risks of forward foreign currency exchange contracts include movement in the values of the foreign currencies relative to the U.S. dollar (or other foreign currencies) and the possibility that counterparties will not complete their contractual obligations, which may be in excess of the amount reflected, if any, in the Consolidated Statement of Assets and Liabilities.
Futures contracts
Futures contracts are exchange-traded and represent commitments for the future purchase or sale of an asset at a specified price on a specified date. The Fund bought and sold futures contracts to produce incremental earnings, to manage the duration and yield curve exposure of the Fund versus the benchmark, to manage exposure to movements in interest rates and to manage exposure to the securities market. These instruments may be used for other purposes in future periods. Upon entering into futures contracts, the Fund bears risks that it may not achieve the anticipated benefits of the futures contracts and may realize a loss. Additional risks include counterparty credit risk, the possibility of an illiquid market, and that a change in the value of the contract or option may not correlate with changes in the value of the underlying asset.
Upon entering into a futures contract, the Fund deposits cash or securities with the broker, known as a futures commission merchant (FCM), in an amount sufficient to meet the initial margin requirement. The initial margin deposit must be maintained at an established level over the life of the contract. Cash deposited as initial margin is recorded in the Consolidated Statement of Assets and Liabilities as margin deposits. Securities deposited as initial margin are designated in the Consolidated Portfolio of Investments. Subsequent payments (variation margin) are made or received by the Fund each day. The variation margin payments are equal to the daily change in the contract value and are recorded as variation margin receivable or payable and are offset in unrealized gains or losses. The Fund recognizes a realized gain or loss when the contract is closed or expires. Futures contracts involve, to varying degrees, risk of loss in excess of the variation margin disclosed in the Consolidated Statement of Assets and Liabilities.
Options contracts
Options are contracts which entitle the holder to purchase or sell securities or other identified assets at a specified price, or in the case of index option contracts, to receive or pay the difference between the index value and the strike price of the index option contract. Option contracts can be either exchange-traded or over-the-counter. The Fund purchased and wrote option contracts to manage exposure to fluctuations in interest rates and to hedge the fair value of the Fund’s investments. These instruments may be used for other purposes in future periods. Completion of transactions for option contracts traded in the over-the-counter market depends upon the performance of the other party. Cash collateral may be collected or posted by the Fund to secure certain over-the-counter option contract trades. Cash collateral held or posted by the Fund for such option contract trades must be returned to the broker or the Fund upon closure, exercise or expiration of the contract.
Options contracts purchased are recorded as investments. When the Fund writes an options contract, the premium received is recorded as an asset and an amount equivalent to the premium is recorded as a liability in the Consolidated Statement of Assets and Liabilities and is subsequently adjusted to reflect the current fair value of the option written. Changes in the fair value of the written option are recorded as unrealized appreciation or depreciation until the contract is exercised or has expired. The Fund will realize a gain or loss when the option contract is closed or expires. When option contracts are exercised, the proceeds on sales for a written call or purchased put option contract, or the purchase cost for a written put or purchased call option contract, is adjusted by the amount of premium received or paid.
For over-the-counter options purchased, the Fund bears the risk of loss of the amount of the premiums paid plus the positive change in market values net of any collateral held by the Fund should the counterparty fail to perform under the contracts. Option contracts written by the Fund do not typically give rise to significant counterparty credit risk, as options written generally obligate the Fund and not the counterparty to perform. The risk in writing a call option contract is that the Fund gives up the opportunity for profit if the market price of the security increases above the strike price and the option contract is exercised. The risk in writing a put option contract is that the Fund may incur a loss if the market price of the security decreases below the strike price and the option contract is exercised. Exercise of a written option could result in the Fund purchasing or selling a security or foreign currency when it otherwise would not, or at a price different from the current market value. In purchasing and writing options, the Fund bears the risk of an unfavorable change in the value of the underlying instrument or the risk that the Fund may not be able to enter into a closing transaction due to an illiquid market.
| 38 | Columbia Diversified Absolute Return Fund | Annual Report 2017 |
Notes to Consolidated Financial Statements (continued)
May 31, 2017
Interest rate swaption contracts
Interest rate swaption contracts entered into by the Fund typically represent an option that gives the purchaser the right, but not the obligation, to enter into an interest rate swap contract on a future date. Each interest rate swaption agreement will specify if the buyer is entitled to receive the fixed or floating rate if the interest rate is exercised. Changes in the value of a purchased interest rate swaption contracts are reported as unrealized appreciation or depreciation on options in the Consolidated Statement of Assets and Liabilities. Gain or loss is recognized in the Consolidated Statement of Operations when the interest rate swaption contract is closed or expires.
When the Fund writes an interest rate swaption contract, the premium received is recorded as an asset and an amount equivalent to the premium is recorded as a liability in the Consolidated Statement of Assets and Liabilities and is subsequently adjusted to reflect the current fair value of the interest rate swaption contract written. Premiums received from writing interest rate swaption contracts that expire unexercised are recorded by the Fund on the expiration date as realized gains from options written in the Consolidated Statement of Operations. The difference between the premium and the amount paid on effecting a closing purchase transaction, including brokerage commissions, is also recorded as realized gain, or if the premium is less than the amount paid for the closing purchase, as realized loss. These amounts are reflected as net realized gain (loss) on options written in the Consolidated Statement of Operations.
Swap contracts
Swap contracts are negotiated in the over-the-counter market and may be entered into as a bilateral contract or centrally cleared (centrally cleared swap contract). In a centrally cleared swap contract, immediately following execution of the swap contract with a broker, the swap contract is novated to a central counterparty (the CCP) and the CCP becomes the Fund’s counterparty to the centrally cleared swap contract. The Fund is required to deposit initial margin with the futures commission merchant (FCM), which pledges it through to the CCP in the form of cash or securities in an amount that varies depending on the size and risk profile of the particular swap contract. Securities deposited as initial margin are designated in the Consolidated Portfolio of Investments and cash deposited is recorded in the Consolidated Statement of Assets and Liabilities as margin deposits. Unlike a bilateral swap contract, for centrally cleared swap contracts, the Fund has minimal credit exposure to the FCM because the CCP stands between the Fund and the relevant buyer/seller on the other side of the contract. Swap contracts are marked-to-market daily and changes in value are recorded as unrealized appreciation (depreciation). The daily change in valuation of centrally cleared swap contracts, if any, is recorded as a receivable or payable for variation margin in the Consolidated Statement of Assets and Liabilities.
Entering into these contracts involves, to varying degrees, elements of interest, liquidity and counterparty credit risk in excess of the amounts recognized in the Consolidated Statement of Assets and Liabilities. Such risks involve the possibility that there may be unfavorable changes in interest rates, market conditions or other conditions, it may be difficult to initiate a swap transaction or liquidate a position at an advantageous time or price which may result in significant losses, and that the FCM or CCP may not fulfill its obligation under the contract.
Credit default swap contracts
The Fund entered into credit default swap contracts to increase or decrease its credit exposure to an index, increase or decrease its credit exposure to a single issuer of debt securities, increase or decrease its credit exposure to a specific debt security or a basket of debt securities, as a protection buyer to reduce overall credit exposure and to manage credit risk exposure. These instruments may be used for other purposes in future periods. Credit default swap contracts are agreements in which one party pays fixed periodic payments to a counterparty in consideration for an agreement from the counterparty to make a specific payment should a specified credit event(s) take place. Although specified credit events are contract specific, credit events are generally defined as bankruptcy, failure to pay, restructuring, obligation acceleration, obligation default, or repudiation/moratorium.
As the purchaser of a credit default swap contract, the Fund purchases protection by paying a periodic interest rate on the notional amount to the counterparty. The interest amount is accrued daily as a component of unrealized appreciation (depreciation) and is recorded as a realized loss upon payment. If a credit event as specified in the contract occurs, the Fund may have the option either to deliver the reference obligation to the seller in exchange for a cash payment of its par amount,
Columbia Diversified Absolute Return Fund | Annual Report 2017
| 39 |
Notes to Consolidated Financial Statements (continued)
May 31, 2017
or to receive a net cash settlement equal to the par amount less an agreed-upon value of the reference obligation as of the date of the credit event. The difference between the value of the obligation or cash delivered and the notional amount received will be recorded as a realized gain (loss).
As the seller of a credit default swap contract, the Fund sells protection to a buyer and will generally receive a periodic interest rate on a notional amount. The interest amount is accrued daily as a component of unrealized appreciation (depreciation) and is recorded as a realized gain upon receipt of the payment. If a credit event as specified in the contract with the counterparty occurs, the Fund may either be required to accept the reference obligation from the buyer in exchange for a cash payment of its notional amount, or to pay the buyer a net cash settlement equal to the notional amount less an agreed-upon value of the reference obligation (recovery value) as of the date of the credit event. The difference between the value of the obligation or cash received and the notional amount paid will be recorded as a realized gain (loss). The maximum potential amount of undiscounted future payments the Fund could be required to make as the seller of protection under a credit default swap contract is equal to the notional amount of the reference obligation. These potential amounts may be partially offset by any recovery values of the respective reference obligations or premiums received upon entering into the agreement. The notional amounts and market values of all credit default swap contracts in which the Fund is the seller of protection, if any, are disclosed in the Credit Default Swap Contracts Outstanding schedule following the Portfolio of Investments.
As a protection seller, the Fund bears the risk of loss from the credit events specified in the contract with the counterparty. For credit default swap contracts on credit indices, quoted market prices and resulting market values serve as an indicator of the current status of the payment/performance risk. Increasing market values, in absolute terms when compared to the notional amount of the swap, represent a deterioration of the reference entity’s credit soundness and a greater likelihood or risk of default or other credit event occurring as defined under the terms of the contract.
Any premium paid or received by the Fund upon entering into a credit default swap contract is recorded as an asset or liability, respectively, and amortized daily as a component of realized gain (loss) in the Consolidated Statement of Operations. Credit default swap contracts are valued daily, and the change in value is recorded as unrealized appreciation (depreciation) until the termination of the swap, at which time a realized gain (loss) is recorded.
Credit default swap contracts can involve greater risks than if a fund had invested in the reference obligation directly since, in addition to general market risks, credit default swaps are subject to counterparty credit risk, leverage risk, hedging risk, correlation risk and liquidity risk.
Interest rate swap contracts
The Fund entered into interest rate swap transactions which may include inflation rate swap contracts [to produce incremental earnings, to manage interest rate and market risk exposure to produce incremental earnings, to gain exposure to or protect itself from market rate changes, to synthetically add or subtract principal exposure to a market, to manage long or short exposure to an inflation index, to manage long or short exposure to the total return on a reference index in return for periodic payments based on a fixed or variable interest rate and to hedge the portfolio risk associated with some or all of the Fund’s securities]. These instruments may be used for other purposes in future periods. An interest rate swap is an agreement between two parties where there are two flows and payments are made between the two counterparties and the payments are dependent upon changes in an interest rate, inflation rate or inflation index calculated on a nominal amount. Interest rate swaps are agreements between two parties that involve the exchange of one type of interest rate for another type of interest rate cash flow on specified dates in the future, based on a predetermined, specified notional amount. Certain interest rate swaps are considered forward-starting, whereby the accrual for the exchange of cash flows does not begin until a specified date in the future. The net cash flow for a standard interest rate swap transaction is generally the difference between a floating market interest rate versus a fixed interest rate.
Interest rate swaps are valued daily and unrealized appreciation (depreciation) is recorded. Certain interest rate swaps may accrue periodic interest on a daily basis as a component of unrealized appreciation (depreciation); the Fund will realize a gain or loss upon the payment or receipt of accrued interest. The Fund will realize a gain or a loss when the interest rate swap is terminated.
| 40 | Columbia Diversified Absolute Return Fund | Annual Report 2017 |
Notes to Consolidated Financial Statements (continued)
May 31, 2017
Total return swap contracts
The Fund entered into total return swap contracts to manage long or short exposure to the total return on a specified reference security in return for periodic payments based on a fixed or variable interest rate, to manage long or short exposure to the total return on a basket of reference securities in return for periodic payments based on a fixed or variable interest rate and to manage long or short exposure to the total return on a reference security index in return for periodic payments based on a fixed or variable interest rate. These instruments may be used for other purposes in future periods. Total return swap contracts may be used to obtain exposure to an underlying reference security, instrument, or other asset or index or market without owning, taking physical custody of, or short selling any such security, instrument or asset in a market.
Total return swap contracts are valued daily, and the change in value is recorded as unrealized appreciation (depreciation) until the termination of the swap, at which time the Fund will realize a gain (loss). Periodic payments received (or made) by the Fund over the term of the contract are recorded as realized gains (losses). Total return swap contracts are subject to the risk associated with the investment in the underlying reference security, instrument or asset. The risk in the case of short total return swap contracts is unlimited based on the potential for unlimited increases in the market value of the underlying reference security, instrument or asset. This risk may be offset if the Fund holds any of the underlying reference security, instrument or asset. The risk in the case of long total return swap contracts is limited to the current notional amount of the total return swap contract.
Effects of derivative transactions in the financial statements
The following tables are intended to provide additional information about the effect of derivatives on the financial statements of the Fund, including: the fair value of derivatives by risk category and the location of those fair values in the Consolidated Statement of Assets and Liabilities; and the impact of derivative transactions over the period in the Consolidated Statement of Operations, including realized and unrealized gains (losses). The derivative instrument schedules following the Consolidated Portfolio of Investments present additional information regarding derivative instruments outstanding at the end of the period, if any.
The following table is a summary of the fair value of derivative instruments (not considered to be hedging instruments for accounting disclosure purposes) at May 31, 2017:
| | Asset derivatives | |
Risk exposure
category | Consolidated statement
of assets and liabilities
location | Fair value ($) |
| Credit risk | Net assets — unrealized appreciation on swap contracts | 33,809* |
| Credit risk | Premiums paid on outstanding swap contracts | 352,922 |
| Equity risk | Net assets — unrealized appreciation on futures contracts | 160,865* |
| Foreign exchange risk | Unrealized appreciation on forward foreign currency exchange contracts | 450,332 |
| Interest rate risk | Net assets — unrealized appreciation on futures contracts | 243,264* |
| Total | | 1,241,192 |
| | Liability derivatives | |
Risk exposure
category | Consolidated statement
of assets and liabilities
location | Fair value ($) |
| Credit risk | Net assets — unrealized depreciation on swap contracts | 40,976* |
| Credit risk | Premiums received on outstanding swap contracts | 44,622 |
| Equity risk | Net assets — unrealized depreciation on futures contracts | 137,016* |
| Foreign exchange risk | Unrealized depreciation on forward foreign currency exchange contracts | 412,016 |
| Interest rate risk | Net assets — unrealized depreciation on futures contracts | 57,756* |
| Total | | 692,386 |
| * | Includes cumulative appreciation (depreciation) as reported in the tables following the Consolidated Portfolio of Investments. Only the current day’s variation margin is reported in receivables or payables in the Consolidated Statement of Assets and Liabilities. |
Columbia Diversified Absolute Return Fund | Annual Report 2017
| 41 |
Notes to Consolidated Financial Statements (continued)
May 31, 2017
The following table indicates the effect of derivative instruments (not considered to be hedging instruments for accounting disclosure purposes) in the Consolidated Statement of Operations for the year ended May 31, 2017:
| Amount of realized gain (loss) on derivatives recognized in income |
| Risk exposure category | Forward
foreign
currency
exchange
contracts
($) | Futures
contracts
($) | Options
contracts
purchased
($) | Swap
contracts
($) | Total
($) |
| Credit risk | — | — | — | (70,087) | (70,087) |
| Equity risk | — | 1,212,617 | — | (1,874,140) | (661,523) |
| Foreign exchange risk | 45,746 | — | — | — | 45,746 |
| Interest rate risk | — | (734,030) | (17,506) | (192,008) | (943,544) |
| Total | 45,746 | 478,587 | (17,506) | (2,136,235) | (1,629,408) |
| |
| Change in unrealized appreciation (depreciation) on derivatives recognized in income |
| Risk exposure category | Forward
foreign
currency
exchange
contracts
($) | Futures
contracts
($) | Options
contracts
purchased
($) | Swap
contracts
($) | Total
($) |
| Credit risk | — | — | — | (23,228) | (23,228) |
| Equity risk | — | (315,866) | — | 512,311 | 196,445 |
| Foreign exchange risk | (37,464) | — | — | — | (37,464) |
| Interest rate risk | — | 140,951 | 15,980 | 126,437 | 283,368 |
| Total | (37,464) | (174,915) | 15,980 | 615,520 | 419,121 |
The following table is a summary of the average outstanding volume by derivative instrument for the year ended May 31, 2017:
| Derivative instrument | Average notional
amounts ($)* |
| Futures contracts — long | 41,261,808 |
| Futures contracts — short | 29,321,776 |
| Credit default swap contracts — buy protection | 1,641,386 |
| Credit default swap contracts — sell protection | 1,951,250 |
| Derivative instrument | Average market
value ($)* |
| Options contracts — purchased | 44 |
| Derivative instrument | Average unrealized
appreciation ($)* | Average unrealized
depreciation ($)* |
| Forward foreign currency exchange contracts | 2,431,559 | (2,366,896) |
| Interest rate swap contracts | — | (40,102) |
| Total return swap contracts | — | (151,315) |
| * | Based on the ending quarterly outstanding amounts for the year ended May 31, 2017. |
Delayed delivery securities
The Fund may trade securities on other than normal settlement terms, including securities purchased or sold on a “when-issued” or "forward commitment" basis. This may increase risk to the Fund since the other party to the transaction may fail to deliver, which could cause the Fund to subsequently invest at less advantageous prices. The Fund designates cash or liquid securities in an amount equal to the delayed delivery commitment.
| 42 | Columbia Diversified Absolute Return Fund | Annual Report 2017 |
Notes to Consolidated Financial Statements (continued)
May 31, 2017
Short Sales
The Fund may sell a security it does not own in anticipation of a decline in the fair value of the security. When the Fund sells a security short, it must borrow the security sold short and deliver it to the broker-dealer through which it made the short sale. The Fund is required to maintain a margin account with the broker and to pledge assets to the broker as collateral for the borrowed security. Securities pledged as collateral are designated in the Consolidated Portfolio of Investments. In addition, collateral is recorded as cash collateral held at broker in the Consolidated Statement of Assets and Liabilities. The Fund can purchase the same security at the current market price and deliver it to the broker to close out the short sale. The Fund is obligated to pay the broker a fee for borrowing the security. The fee is included in "Dividends and interest on securities sold short" in the Consolidated Statement of Operations and a short position is reported as a liability at fair value in the Consolidated Statement of Assets and Liabilities. The Fund must also pay the broker for any dividends accrued (recognized on ex-date) on the borrowed security. This amount is recorded as an expense in the Consolidated Statement of Operations. The Fund will record a gain if the security declines in value, and will realize a loss if the security appreciates. Such gain, limited to the price at which the Fund sold the security short, or such loss, potentially unlimited in size because the short position loses value as the market price of the security sold short increases, will be recognized upon the termination of a short sale.
Columbia Diversified Absolute Return Fund | Annual Report 2017
| 43 |
Offsetting of assets and liabilities
The following table presents the Fund’s gross and net amount of assets and liabilities available for offset under netting arrangements as well as any related collateral received or pledged by the Fund as of May 31, 2017:
| | Barclays
($) | BNP
Paribas
($) | Citi
($) | Credit
Suisse
($) | Deutsche
Bank
($) | Goldman
Sachs
International
($) | HSBC
($) | JPMorgan
($)(a) | JPMorgan
($)(a) | Morgan
Stanley
($)(a) | Morgan
Stanley
($)(a) | Standard
Chartered($) | State
Street
($) | UBS
($) | Total
($) |
| Assets | | | | | | | | | | | | | | | |
| Forward foreign currency exchange contracts | 55,561 | 66,602 | 1,352 | 5,182 | 142,690 | - | 95,156 | - | - | - | - | 21,358 | 13,647 | 48,784 | 450,332 |
| OTC credit default swap contracts (b) | 88,005 | - | 5,788 | 27,320 | - | 91,590 | - | - | 164,380 | - | - | - | - | - | 377,083 |
| Total assets | 143,566 | 66,602 | 7,140 | 32,502 | 142,690 | 91,590 | 95,156 | - | 164,380 | - | - | 21,358 | 13,647 | 48,784 | 827,415 |
| Liabilities | | | | | | | | | | | | | | | |
| Centrally cleared credit default swap contracts (c) | - | - | - | - | - | - | - | - | - | 1,772 | - | - | - | - | 1,772 |
| Forward foreign currency exchange contracts | 2,374 | 50,376 | 90,178 | 21,470 | 22,351 | - | 115,828 | - | - | - | 25,964 | 62,830 | - | 20,645 | 412,016 |
| OTC credit default swap contracts (b) | 14,993 | - | 4,033 | - | - | 20,247 | - | - | 6,112 | - | 3,396 | - | - | - | 48,781 |
| Securities borrowed | - | - | - | - | - | - | - | 15,563,751 | - | - | - | - | - | - | 15,563,751 |
| Total liabilities | 17,367 | 50,376 | 94,211 | 21,470 | 22,351 | 20,247 | 115,828 | 15,563,751 | 6,112 | 1,772 | 29,360 | 62,830 | - | 20,645 | 16,026,320 |
| Total financial and derivative net assets | 126,199 | 16,226 | (87,071) | 11,032 | 120,339 | 71,343 | (20,672) | (15,563,751) | 158,268 | (1,772) | (29,360) | (41,472) | 13,647 | 28,139 | (15,198,905) |
| Total collateral received (pledged) (d) | - | - | - | - | - | - | - | (15,563,751) | - | (1,772) | - | - | - | - | (15,565,523) |
| Net amount (e) | 126,199 | 16,226 | (87,071) | 11,032 | 120,339 | 71,343 | (20,672) | - | 158,268 | - | (29,360) | (41,472) | 13,647 | 28,139 | 366,618 |
| (a) | Exposure can only be netted across transactions governed under the same master agreement with the same legal entity. |
| (b) | Over-the-Counter Swap Contracts are presented at market value plus periodic payments receivable (payable), which is comprised of unrealized appreciation, unrealized depreciation, premiums paid and premiums received. |
| (c) | Centrally cleared swaps are included within payable/receivable for variation margin on the Statement of Assets and Liabilities. |
| (d) | In some instances, the actual collateral received and/or pledged may be more than the amount shown due to overcollateralization. |
| (e) | Represents the net amount due from/(to) counterparties in the event of default. |
Notes to Consolidated Financial Statements (continued)
May 31, 2017
| 44 | Columbia Diversified Absolute Return Fund | Annual Report 2017 |
Notes to Consolidated Financial Statements (continued)
May 31, 2017
Security transactions
Security transactions are accounted for on the trade date. Cost is determined and gains (losses) are based upon the specific identification method for both financial statement and federal income tax purposes.
Income recognition
Interest income is recorded on an accrual basis. Market premiums and discounts, including original issue discounts, are amortized and accreted, respectively, over the expected life of the security on all debt securities, unless otherwise noted.
The Fund may place a debt security on non-accrual status and reduce related interest income when it becomes probable that the interest will not be collected and the amount of uncollectible interest can be reasonably estimated. A defaulted debt security is removed from non-accrual status when the issuer resumes interest payments or when collectibility of interest is reasonably assured.
Corporate actions and dividend income are generally recorded net of any non-reclaimable tax withholdings, on the ex-dividend date or upon receipt of ex-dividend notification in the case of certain foreign securities.
The Fund may receive distributions from holdings in equity securities, business development companies (BDCs), exchange-traded funds, other regulated investment companies (RICs), and real estate investment trusts (REITs), which report information on the tax character of their distributions annually. These distributions are allocated to dividend income, capital gain and return of capital based on actual information reported. Return of capital is recorded as a reduction of the cost basis of securities held. If the Fund no longer owns the applicable securities, return of capital is recorded as a realized gain. With respect to REITs, to the extent actual information has not yet been reported, estimates for return of capital are made by the Fund’s management. Management’s estimates are subsequently adjusted when the actual character of the distributions is disclosed by the REITs, which could result in a proportionate change in return of capital to shareholders.
Awards from class action litigation are recorded as a reduction of cost basis if the Fund still owns the applicable securities on the payment date. If the Fund no longer owns the applicable securities, the proceeds are recorded as realized gains.
Expenses
General expenses of the Trust are allocated to the Fund and other funds of the Trust based upon relative net assets or other expense allocation methodologies determined by the nature of the expense. Expenses directly attributable to the Fund are charged to the Fund. Expenses directly attributable to a specific class of shares are charged to that share class.
Determination of class net asset value
All income, expenses (other than class-specific expenses, which are charged to that share class, as shown in the Consolidated Statement of Operations) and realized and unrealized gains (losses) are allocated to each class of the Fund on a daily basis, based on the relative net assets of each class, for purposes of determining the net asset value of each class.
Federal income tax status
The Fund intends to qualify each year as a regulated investment company under Subchapter M of the Internal Revenue Code, as amended, and will distribute substantially all of its taxable income (including net short-term capital gains), if any, for its tax year, and as such will not be subject to federal income taxes. In addition, the Fund intends to distribute in each calendar year substantially all of its net investment income, capital gains and certain other amounts, if any, such that the Fund should not be subject to federal excise tax. Therefore, no federal income or excise tax provision is recorded.
Foreign taxes
The Fund may be subject to foreign taxes on income, gains on investments or currency repatriation, a portion of which may be recoverable. The Fund will accrue such taxes and recoveries, as applicable, based upon its current interpretation of tax rules and regulations that exist in the markets in which it invests.
Columbia Diversified Absolute Return Fund | Annual Report 2017
| 45 |
Notes to Consolidated Financial Statements (continued)
May 31, 2017
Realized gains in certain countries may be subject to foreign taxes at the Fund level, based on statutory rates. The Fund accrues for such foreign taxes on realized and unrealized gains at the appropriate rate for each jurisdiction, as applicable. The amount, if any, is disclosed as a liability on the Consolidated Statement of Assets and Liabilities.
Distributions to shareholders
Distributions from net investment income, if any, are declared and paid annually. Net realized capital gains, if any, are distributed along with the income distribution. Income distributions and capital gain distributions are determined in accordance with federal income tax regulations, which may differ from GAAP.
Guarantees and indemnifications
Under the Trust’s organizational documents and, in some cases, by contract, its officers and trustees are indemnified against certain liabilities arising out of the performance of their duties to the Trust or its funds. In addition, certain of the Fund’s contracts with its service providers contain general indemnification clauses. The Fund’s maximum exposure under these arrangements is unknown since the amount of any future claims that may be made against the Fund cannot be determined, and the Fund has no historical basis for predicting the likelihood of any such claims.
Investment company reporting modernization
In October 2016, the U.S. Securities and Exchange Commission adopted new rules and forms, and amendments to certain current rules and forms, to modernize reporting and disclosure of information by registered investment companies. The amendments to Regulation S-X will require standardized, enhanced disclosure about derivatives in investment company financial statements, and will also change the rules governing the form and content of such financial statements. The amendments to Regulation S-X take effect on August 1, 2017. At this time, management is assessing the anticipated impact of these regulatory developments.
Note 3. Fees and other transactions with affiliates
Management services fees
The Fund entered into a Management Agreement with Columbia Management Investment Advisers, LLC (the Investment Manager), a wholly-owned subsidiary of Ameriprise Financial, Inc. (Ameriprise Financial). Under the Management Agreement, the Investment Manager provides the Fund with investment research and advice, as well as administrative and accounting services. The management services fee is an annual fee that is equal to a percentage of the Fund’s average daily net assets that declines from 1.18% to 1.03% as the Fund’s net assets increase. The effective management services fee rate for the year ended May 31, 2017 was 1.18% of the Fund’s average daily net assets.
Subadvisory agreement
The Fund’s Board of Trustees has approved a subadvisory agreement between the Investment Manager and Threadneedle International Limited (Threadneedle), an affiliate of the Investment Manager and an indirect wholly-owned subsidiary of Ameriprise Financial. As of May 31, 2017, Threadneedle is not providing services to the Fund pursuant to the subadvisory agreement.
Compensation of board members
Members of the Board of Trustees, who are not officers or employees of the Investment Manager or Ameriprise Financial, are compensated for their services to the Fund as disclosed in the Consolidated Statement of Operations. These members of the Board of Trustees may participate in a Deferred Compensation Plan (the Plan) which may be terminated at any time. Obligations of the Plan will be paid solely out of the Fund’s assets, and all amounts payable under the Plan constitute a general unsecured obligation of the Fund.
| 46 | Columbia Diversified Absolute Return Fund | Annual Report 2017 |
Notes to Consolidated Financial Statements (continued)
May 31, 2017
Compensation of Chief Compliance Officer
The Board of Trustees has appointed a Chief Compliance Officer to the Fund in accordance with federal securities regulations. A portion of the Chief Compliance Officer’s total compensation is allocated to the Fund, along with other affiliated funds governed by the Board of Trustees, based on relative net assets. The total amount allocated to all affiliated funds governed by the Board of Trustees will not exceed $40,000 annually.
Transfer agency fees
Under a Transfer and Dividend Disbursing Agent Agreement, Columbia Management Investment Services Corp. (the Transfer Agent), an affiliate of the Investment Manager and a wholly-owned subsidiary of Ameriprise Financial, is responsible for providing transfer agency services to the Fund. The Transfer Agent has contracted with Boston Financial Data Services (BFDS) to serve as sub-transfer agent. The Transfer Agent pays the fees of BFDS for services as sub-transfer agent and BFDS is not entitled to reimbursement for such fees from the Fund (with the exception of out-of-pocket fees).
The Fund pays the Transfer Agent a monthly transfer agency fee based on the number or the average value of accounts, depending on the type of account. In addition, prior to October 1, 2016, the Transfer Agent also received sub-transfer agency fees based on a percentage of the average aggregate value of the Fund’s shares maintained in omnibus accounts (other than omnibus accounts for which American Enterprise Investment Services Inc. is the broker of record or accounts where the beneficial shareholder is a customer of Ameriprise Financial Services, Inc., for which the Transfer Agent receives a per account fee). Effective October 1, 2016, the Fund pays the Transfer Agent a fee for shareholder services based on the number of accounts or on a percentage of the average aggregate value of the Fund’s shares maintained in omnibus accounts up to the lesser of the amount charged by the financial intermediary or a cap established by the Board of Trustees from time to time.
The Transfer Agent also receives compensation from the Fund for various shareholder services and reimbursements for certain out-of-pocket fees. Effective January 1, 2017, total transfer agency fees for Class R5 shares are subject to an annual limitation of not more than 0.075% of the average daily net assets attributable to Class R5 shares. Total transfer agency fees for Class I shares were subject to an annual limitation of not more than 0.025% of the average daily net assets attributable to Class I shares. Prior to January 1, 2017, total transfer agency fees for Class R5 shares were subject to an annual limitation of not more than 0.05% of the average daily net assets attributable to Class R5 shares and Class I shares did not pay transfer agency fees. Total transfer agency fees for Class Y shares are subject to an annual limitation of not more than 0.025% of the average daily net assets attributable to Class Y shares.
For the year ended May 31, 2017, the Fund’s effective transfer agency fee rates as a percentage of average daily net assets of each class were as follows:
| | Effective rate (%) |
| Class A | 0.74 |
| Class C | 0.74 |
| Class I | 0.003 (a),(b) |
| Class R4 | 0.74 |
| Class R5 | 0.050 |
| Class T | 0.74 |
| Class Y | 0.011 (a) |
| Class Z | 0.74 |
| (a) | Annualized. |
| (b) | Effective March 27, 2017, Class I shares were redeemed or exchanged for Class Y shares. |
An annual minimum account balance fee of $20 may apply to certain accounts with a value below the applicable share class’s initial minimum investment requirements to reduce the impact of small accounts on transfer agency fees. These minimum account balance fees are remitted to the Fund and recorded as part of expense reductions in the Consolidated Statement of Operations. For the year ended May 31, 2017, no minimum account balance fees were charged by the Fund.
Columbia Diversified Absolute Return Fund | Annual Report 2017
| 47 |
Notes to Consolidated Financial Statements (continued)
May 31, 2017
Distribution and service fees
The Fund has an agreement with Columbia Management Investment Distributors, Inc. (the Distributor), an affiliate of the Investment Manager and a wholly-owned subsidiary of Ameriprise Financial, for distribution and shareholder services. The Board of Trustees has approved, and the Fund has adopted, distribution and shareholder service plans (the Plans) applicable to certain share classes, which set the distribution and service fees for the Fund. These fees are calculated daily and are intended to compensate the Distributor and/or eligible selling and/or servicing agents for selling shares of the Fund and providing services to investors.
Under the Plans, the Fund pays a monthly service fee to the Distributor at the maximum annual rate of 0.25% of the average daily net assets attributable to Class A, Class C and Class T shares of the Fund. Also under the Plans, the Fund pays a monthly distribution fee to the Distributor at the maximum annual rates of 0.75% and 0.25% of the average daily net assets attributable to Class C and Class T shares of the Fund, respectively.
Although the Fund may pay a distribution fee up to 0.25% of the Fund’s average daily net assets attributable to Class T shares and a service fee of up to 0.25% of the Fund’s average daily net assets attributable to Class T shares, the aggregate fee shall not exceed 0.25% of the Fund’s average daily net assets attributable to Class T shares.
Sales charges (unaudited)
Sales charges, including front-end charges and CDSCs, received by the Distributor for distributing Fund shares for the year ended May 31, 2017, if any, are listed below:
Expenses waived/reimbursed by the Investment Manager and its affiliates
The Investment Manager and certain of its affiliates have contractually agreed to waive fees and/or reimburse expenses (excluding certain fees and expenses described below) for the period(s) disclosed below, so that the Fund’s net operating expenses, including indirect expenses of the Underlying Funds, after giving effect to fees waived/expenses reimbursed and any balance credits and/or overdraft charges from the Fund’s custodian, do not exceed the following annual rate(s) as a percentage of the class’ average daily net assets:
| | October 1, 2016
through
September 30, 2017 | Prior to
October 1, 2016 |
| Class A | 1.650% | 1.71% |
| Class C | 2.400 | 2.46 |
| Class R4 | 1.400 | 1.46 |
| Class R5 | 1.250 | 1.36 |
| Class T | 1.650 | 1.71 |
| Class Y | 1.200* | - |
| Class Z | 1.400 | 1.46 |
*Expense cap rate is contractual from March 1, 2017 (the commencement of operations of Class Y shares) through September 30, 2017.
Under the agreement governing these fee waivers and/or expense reimbursement arrangements, the following fees and expenses are excluded from the waiver/reimbursement commitment, and therefore will be paid by the Fund, if applicable: taxes (including foreign transaction taxes), transaction costs and brokerage commissions, costs related to any securities lending program, dividend and interest expenses associated with securities sold short, inverse floater program fees and expenses, transaction charges and interest on borrowed money, interest, infrequent and/or unusual expenses and any other expenses the exclusion of which is specifically approved by the Board of Trustees. This agreement may be modified or amended only with approval from the Investment Manager, certain of its affiliates and the Fund. Any fees waived and/or expenses reimbursed under the expense reimbursement arrangements described above are not recoverable by the Investment Manager or its affiliates in future periods.
| 48 | Columbia Diversified Absolute Return Fund | Annual Report 2017 |
Notes to Consolidated Financial Statements (continued)
May 31, 2017
Note 4. Federal tax information
The timing and character of income and capital gain distributions are determined in accordance with income tax regulations, which may differ from GAAP because of temporary or permanent book to tax differences.
At May 31, 2017, these differences are primarily due to differing treatment for deferral/reversal of wash sale losses, re-characterization of distributions for investments, derivative investments, tax straddles, swap investments, late-year ordinary losses, capital loss carryforwards, trustees’ deferred compensation, foreign currency transactions, non-deductible expenses, net operating loss reclassification, investments in partnerships, investments in commodity subsidiaries and constructive sales of appreciated financial positions. To the extent these differences are permanent, reclassifications are made among the components of the Fund’s net assets in the Consolidated Statement of Assets and Liabilities. Temporary differences do not require reclassifications.
In the Consolidated Statement of Assets and Liabilities the following reclassifications were made:
Excess of distributions
over net investment
income ($) | Accumulated
net realized
(loss) ($) | Paid in
capital ($) |
| 333,425 | (106,305) | (227,120) |
Net investment income (loss) and net realized gains (losses), as disclosed in the Consolidated Statement of Operations, and net assets were not affected by this reclassification.
The tax character of distributions paid during the years indicated was as follows:
| May 31, 2017 | May 31, 2016 |
Ordinary
income ($) | Long-term
capital gains ($) | Total ($) | Ordinary
income (S) | Long-term
capital gains ($) | Total ($) |
| — | — | — | 1,391,405 | 180,633 | 1,572,038 |
Short-term capital gain distributions, if any, are considered ordinary income distributions for tax purposes.
At May 31, 2017, the components of distributable earnings on a tax basis were as follows:
Undistributed
ordinary income ($) | Undistributed
long-term
capital gains ($) | Capital loss
carryforwards ($) | Net unrealized
appreciation ($) |
| — | — | (2,667,641) | 679,118 |
At May 31, 2017, the cost of investments for federal income tax purposes along with the aggregate gross unrealized appreciation and depreciation based on that cost was:
Federal
tax cost ($) | Gross unrealized
appreciation ($) | Gross unrealized
(depreciation) ($) | Net unrealized
appreciation ($) |
| 79,951,868 | 3,560,116 | (2,880,998) | 679,118 |
The following capital loss carryforwards, determined at May 31, 2017, may be available to reduce taxable income arising from future net realized gains on investments, if any, to the extent permitted by the Internal Revenue Code. Capital loss carryforwards with no expiration are required to be utilized prior to any capital losses which carry an expiration date. As a result of this ordering rule, capital loss carryforwards which carry an expiration date may be more likely to expire unused. In addition, for the year ended May 31, 2017, capital loss carryforwards utilized, expired unused and permanently lost were as follows:
| 2018 ($) | 2019 ($) | No expiration
short-term ($) | No expiration
long-term ($) | Total ($) | Utilized ($) | Expired ($) | Permanently
lost ($) |
| — | — | 1,675,808 | 991,833 | 2,667,641 | — | — | — |
Columbia Diversified Absolute Return Fund | Annual Report 2017
| 49 |
Notes to Consolidated Financial Statements (continued)
May 31, 2017
Under current tax rules, regulated investment companies can elect to treat certain late-year ordinary losses incurred and post-October capital losses (capital losses realized after October 31) as arising on the first day of the following taxable year. As of May 31, 2017, the Fund will elect to treat the following late-year ordinary losses and post-October capital losses as arising on June 1, 2017.
Late year
ordinary losses ($) | Post-October
capital losses ($) |
| 289,807 | — |
Management of the Fund has concluded that there are no significant uncertain tax positions in the Fund that would require recognition in the financial statements. However, management’s conclusion may be subject to review and adjustment at a later date based on factors including, but not limited to, new tax laws, regulations, and administrative interpretations (including relevant court decisions). Generally, the Fund’s federal tax returns for the prior three fiscal years remain subject to examination by the Internal Revenue Service.
Note 5. Portfolio information
The cost of purchases and proceeds from sales of securities, excluding short-term investments and derivatives, if any, aggregated to $94,793,840 and $114,698,235, respectively, for the year ended May 31, 2017, of which $0 and $73,905, respectively, were U.S. government securities. The amount of purchase and sale activity impacts the portfolio turnover rate reported in the Consolidated Financial Highlights.
Note 6. Affiliated money market fund
The Fund invests significantly in Columbia Short-Term Cash Fund, an affiliated money market fund established for the exclusive use by the Fund and other affiliated funds (the Affiliated MMF). The income earned by the Fund from such investments is included as Dividends - affiliated issuers in the Consolidated Statement of Operations. As an investing fund, the Fund indirectly bears its proportionate share of the expenses of the Affiliated MMF. Effective October 1, 2016, the Affiliated MMF prices its shares with a floating net asset value (NAV) and no longer seeks to maintain a stable NAV. In addition, the Board of Trustees of the Affiliated MMF may impose a fee on redemptions (sometimes referred to as a liquidity fee) or temporarily suspend redemptions (sometimes referred to as imposing a redemption gate) in the event its liquidity falls below regulatory limits.
Note 7. Line of credit
The Fund has access to a revolving credit facility with a syndicate of banks led by Citibank, N.A., HSBC Bank USA, N.A. and JPMorgan Chase Bank, N.A. whereby the Fund may borrow for the temporary funding of shareholder redemptions or for other temporary or emergency purposes. The credit facility agreement, which is a collective agreement between the Fund and certain other funds managed by the Investment Manager, severally and not jointly, permits collective borrowings up to $1 billion. Interest is charged to each participating fund based on its borrowings at a rate equal to the higher of (i) the overnight federal funds rate plus 1.00% or (ii) the one-month LIBOR rate plus 1.00%. Each borrowing under the credit facility matures no later than 60 days after the date of borrowing. The Fund also pays a commitment fee equal to its pro rata share of the amount of the credit facility at a rate of 0.15% per annum. The commitment fee is included in other expenses in the Consolidated Statement of Operations.
The Fund had no borrowings during the year ended May 31, 2017.
Note 8. Significant risks
Derivatives risk
Losses involving derivative instruments may be substantial, because a relatively small price movement in the underlying security(ies), commodity, currency or index or other instrument or asset may result in a substantial loss for the Fund. In addition to the potential for increased losses, the use of derivative instruments may lead to increased volatility within the Fund. Derivatives will typically increase the Fund’s exposure to principal risks to which it is otherwise exposed, and may expose the Fund to additional risks, including correlation risk, counterparty risk, hedging risk, leverage risk and liquidity risk.
| 50 | Columbia Diversified Absolute Return Fund | Annual Report 2017 |
Notes to Consolidated Financial Statements (continued)
May 31, 2017
Shareholder concentration risk
At May 31, 2017, affiliated shareholders of record owned 99.8% of the outstanding shares of the Fund in one or more accounts. Subscription and redemption activity by concentrated accounts may have a significant effect on the operations of the Fund. In the case of a large redemption, the Fund may be forced to sell investments at inopportune times, including its liquid or more liquid positions, resulting in Fund losses and the Fund holding a higher percentage of less liquid or illiquid securities. Large redemptions could result in decreased economies of scale and increased operating expenses for non-redeeming Fund shareholders.
Short Selling Risk
Leverage occurs when the Fund increases its assets available for investment using borrowings, short sales, derivatives, or similar instruments or techniques. Because short sales involve borrowing securities and then selling them, the Fund’s short sales effectively leverage the Fund’s assets. The Fund’s assets that are used as collateral to secure the Fund’s obligations to return the securities sold short may decrease in value while the short positions are outstanding, which may force the Fund to use its other assets to increase the collateral. Leverage can create an interest expense that may lower the Fund’s overall returns. Leverage presents the opportunity for increased net income and capital gains, but may also exaggerate the Fund’s volatility and risk of loss. There can be no guarantee that a leveraging strategy will be successful.
Note 9. Subsequent events
Management has evaluated the events and transactions that have occurred through the date the financial statements were issued and noted no items requiring adjustment of the financial statements or additional disclosure.
Note 10. Information regarding pending and settled legal proceedings
Ameriprise Financial and certain of its affiliates have historically been involved in a number of legal, arbitration and regulatory proceedings, including routine litigation, class actions, and governmental actions, concerning matters arising in connection with the conduct of their business activities. Ameriprise Financial believes that the Funds are not currently the subject of, and that neither Ameriprise Financial nor any of its affiliates are the subject of, any pending legal, arbitration or regulatory proceedings that are likely to have a material adverse effect on the Funds or the ability of Ameriprise Financial or its affiliates to perform under their contracts with the Funds. Ameriprise Financial is required to make quarterly (10-Q), annual (10-K) and, as necessary, 8-K filings with the Securities and Exchange Commission (SEC) on legal and regulatory matters that relate to Ameriprise Financial and its affiliates. Copies of these filings may be obtained by accessing the SEC website at www.sec.gov.
There can be no assurance that these matters, or the adverse publicity associated with them, will not result in increased Fund redemptions, reduced sale of Fund shares or other adverse consequences to the Funds. Further, although we believe proceedings are not likely to have a material adverse effect on the Funds or the ability of Ameriprise Financial or its affiliates to perform under their contracts with the Funds, these proceedings are subject to uncertainties and, as such, we are unable to estimate the possible loss or range of loss that may result. An adverse outcome in one or more of these proceedings could result in adverse judgments, settlements, fines, penalties or other relief that could have a material adverse effect on the consolidated financial condition or results of operations of Ameriprise Financial.
Columbia Diversified Absolute Return Fund | Annual Report 2017
| 51 |
Report of Independent Registered Public Accounting Firm
To the Trustees of Columbia Funds Series Trust I and the Shareholders of Columbia Diversified Absolute Return Fund
In our opinion, the accompanying consolidated statement of assets and liabilities, including the consolidated portfolio of investments, and the related consolidated statements of operations and of changes in net assets and the consolidated financial highlights present fairly, in all material respects, the financial position of Columbia Diversified Absolute Return Fund (the “Fund”, a series of Columbia Funds Series Trust I) and its subsidiaries as of May 31, 2017, the results of their operations for the year then ended, the changes in their net assets for each of the two years in the period then ended and the financial highlights for each of the two years in the period then ended and for the period February 19, 2015 (commencement of operations) through May 31, 2015, in conformity with accounting principles generally accepted in the United States of America. These financial statements and financial highlights (hereafter referred to as “financial statements”) are the responsibility of the Fund’s management. Our responsibility is to express an opinion on these financial statements based on our audits. We conducted our audits of these financial statements in accordance with the standards of the Public Company Accounting Oversight Board (United States). Those standards require that we plan and perform the audit to obtain reasonable assurance about whether the financial statements are free of material misstatement. An audit includes examining, on a test basis, evidence supporting the amounts and disclosures in the financial statements, assessing the accounting principles used and significant estimates made by management, and evaluating the overall financial statement presentation. We believe that our audits, which included confirmation of securities as of May 31, 2017 by correspondence with the custodian, brokers and transfer agent, provide a reasonable basis for our opinion.
PricewaterhouseCoopers LLP
Minneapolis, MN
July 21, 2017
Shareholders elect the Board that oversees the Fund’s operations. The Board appoints officers who are responsible for day-to-day business decisions based on policies set by the Board. The following table provides basic biographical information about the Fund’s Trustees, including their principal occupations during the past five years, although specific titles for individuals may have varied over the period. The year set forth beneath Length of Service in the table below is the year in which the Trustee was first appointed or elected as Trustee to any Fund currently in the Columbia Funds Complex or a predecessor thereof. Under current Board policy, members serve terms of indefinite duration.
Independent trustees
| Name, address, year of birth | Position held with the Trust and length of service | Principal occupation(s) during the past five years and other relevant professional experience | Number of Funds in the Columbia Fund Complex overseen | Other directorships held by Trustee during the past five years |
Janet Langford Carrig
c/o Columbia Management
Investment Advisers, LLC
225 Franklin Street
Mail Drop BX32 05228
Boston, MA 02110
1957 | Trustee
1996 | Senior Vice President, General Counsel and Corporate Secretary, ConocoPhillips (independent energy company) since September 2007 | 57 | None |
Douglas A. Hacker
c/o Columbia Management
Investment Advisers, LLC
225 Franklin Street
Mail Drop BX32 05228
Boston, MA 02110
1955 | Trustee and Chairman of the Board
1996 | Independent business executive since May 2006; Executive Vice President — Strategy of United Airlines from December 2002 to May 2006; President of UAL Loyalty Services (airline marketing company) from September 2001 to December 2002; Executive Vice President and Chief Financial Officer of United Airlines from July 1999 to September 2001 | 57 | Spartan Nash Company, (food distributor); Nash Finch Company (food distributor) from 2005 to 2013; Aircastle Limited (aircraft leasing); SeaCube Container Leasing Ltd. (container leasing) from 2010 to 2013; and Travelport Worldwide Limited (travel information technology) |
Nancy T. Lukitsh
c/o Columbia Management
Investment Advisers, LLC
225 Franklin Street
Mail Drop BX32 05228
Boston, MA 02110
1956 | Trustee
2011 | Senior Vice President, Partner and Director of Marketing, Wellington Management Company, LLP (investment adviser) from 1997 to 2010; Chair, Wellington Management Portfolios (commingled non-U.S. investment pools) from 2007 to 2010; Director, Wellington Trust Company, NA and other Wellington affiliates from 1997 to 2010 | 57 | None |
David M. Moffett
c/o Columbia Management
Investment Advisers, LLC
225 Franklin Street
Mail Drop BX32 05228
Boston, MA 02110
1952 | Trustee
2011 | Retired. Consultant to Bridgewater and Associates | 57 | Director, CSX Corporation; Genworth Financial, Inc. (financial and insurance products and services); PayPal Holdings Inc. (payment and data processing services); Trustee, University of Oklahoma Foundation; former Director, eBay Inc. (online trading community), 2007-2015; and former Director, CIT Bank, CIT Group Inc. (commercial and consumer finance), 2010-2016 |
Columbia Diversified Absolute Return Fund | Annual Report 2017
| 53 |
TRUSTEES AND OFFICERS (continued)
Independent trustees (continued)
| Name, address, year of birth | Position held with the Trust and length of service | Principal occupation(s) during the past five years and other relevant professional experience | Number of Funds in the Columbia Fund Complex overseen | Other directorships held by Trustee during the past five years |
Charles R. Nelson
c/o Columbia Management
Investment Advisers, LLC
225 Franklin Street
Mail Drop BX32 05228
Boston, MA 02110
1942 | Trustee
1981 | Retired. Professor Emeritus, University of Washington since 2011; Professor of Economics, University of Washington from 1976 to 2011; Ford and Louisa Van Voorhis Professor of Political Economy, University of Washington from 1993 to 2011; Adjunct Professor of Statistics, University of Washington from 1980 to 2011; Associate Editor, Journal of Money, Credit and Banking from September 1993 to 2008; consultant on econometric and statistical matters | 57 | None |
John J. Neuhauser
c/o Columbia Management
Investment Advisers, LLC
225 Franklin Street
Mail Drop BX32 05228
Boston, MA 02110
1943 | Trustee
1984 | President, Saint Michael’s College since August 2007; Director or Trustee of several non-profit organizations, including University of Vermont Medical Center; Academic Vice President and Dean of Faculties, Boston College from August 1999 to October 2005; University Professor, Boston College from November 2005 to August 2007 | 57 | Liberty All-Star Equity Fund and Liberty All- Star Growth Fund (closed-end funds) |
Patrick J. Simpson
c/o Columbia Management
Investment Advisers, LLC
225 Franklin Street
Mail Drop BX32 05228
Boston, MA 02110
1944 | Trustee
2000 | Of Counsel, Perkins Coie LLP (law firm) since 2015; Partner, Perkins Coie LLP from 1988 to 2014 | 57 | None |
Anne-Lee Verville
c/o Columbia Management
Investment Advisers, LLC
225 Franklin Street
Mail Drop BX32 05228
Boston, MA 02110
1945 | Trustee
1998 | Retired. General Manager, Global Education Industry from 1994 to 1997, President – Application Systems Division from 1991 to 1994, Chief Financial Officer – US Marketing & Services from 1988 to 1991, and Chief Information Officer from 1987 to 1988, IBM Corporation (computer and technology) | 57 | Enesco Group, Inc. (producer of giftware and home and garden decor products) from 2001 to 2006 |
| 54 | Columbia Diversified Absolute Return Fund | Annual Report 2017 |
TRUSTEES AND OFFICERS (continued)
Consultants to the Independent Trustees*
| Name, address, year of birth | Position held with the Trust and length of service | Principal occupation(s) during the past five years and other relevant professional experience | Number of Funds in the Columbia Funds complex overseen | Other directorships held by Trustee during the past five years |
J. Kevin Connaughton
c/o Columbia
Management Investment
Advisers, LLC,
225 Franklin Street
Mail Drop BX32 05228,
Boston, MA 02110
1964 | Independent Trustee Consultant
2016 | Independent Trustee Consultant, Columbia Funds since March 2016; Managing Director and General Manager of Mutual Fund Products, Columbia Management Investment Advisers, LLC from May 2010 to February 2015; President, Columbia Funds from 2009 to 2015; and senior officer of Columbia Funds and affiliated funds from 2003 to 2015 | 57 | Board of Governors, Gateway Healthcare since January 2016; Trustee, New Century Portfolios since March 2015; and Director, The Autism Project since March 2015 |
Natalie A. Trunow
c/o Columbia
Management Investment
Advisers, LLC,
225 Franklin Street
Mail Drop BX32 05228,
Boston, MA 02110
1967 | Independent Trustee Consultant
2016 | Independent Trustee Consultant, Columbia Funds since September 2016; Chief Executive Officer, Millennial Partners (investment consulting services to institutions) since January 2016; Director of Investments, Casey Family Programs from April 2016 to September 2016; Senior Vice President and Chief Investment Officer, Calvert Investments from August 2008 to January 2016; Section Head and Portfolio Manager, General Motors Asset Management from June 1997 to August 2008 | 57 | Healthcare Services for Children with Special Needs |
| * | J. Kevin Connaughton was appointed consultant to the Independent Trustees effective March 1, 2016. Natalie A. Trunow was appointed consultant to the Independent Trustees effective September 1, 2016. Shareholders of the Funds are expected to be asked to elect each of Mr. Connaughton and Ms. Trunow as a Trustee at a future shareholder meeting. |
Interested trustee affiliated with Investment Manager*
| Name, address, year of birth | Position held with the Trust and length of service | Principal occupation(s) during the past five years and other relevant professional experience | Number of Funds in the Columbia Funds Complex overseen | Other directorships held by Trustee during the past five years |
William F. Truscott
c/o Columbia Management
Investment Advisers, LLC
225 Franklin Street
Boston, MA 02110
1960 | Trustee
2012 | Chairman of the Board and President, Columbia Management Investment Advisers, LLC since May 2010 and February 2012, respectively; Chief Executive Officer, Global Asset Management, Ameriprise Financial, Inc. since September 2012 (previously Chief Executive Officer, U.S. Asset Management & President, Annuities, May 2010-September 2012); Director and Chief Executive Officer, Columbia Management Investment Distributors, Inc. since May 2010 and February 2012, respectively; Chairman of the Board and Chief Executive Officer, RiverSource Distributors, Inc. since 2006; Director, Threadneedle Asset Management Holdings, SARL since 2014; President and Chief Executive Officer, Ameriprise Certificate Company, 2006-August 2012 | 179 | Chairman of the Board, Columbia Management Investment Advisers, LLC since May 2010; Director, Columbia Management Investment Distributors, Inc. since May 2010; former Director, Ameriprise Certificate Company, 2006 - January 2013 |
| * | Interested person (as defined under the 1940 Act) by reason of being an officer, director, security holder and/or employee of the Investment Manager or Ameriprise Financial. |
The Statement of Additional Information has additional information about the Fund’s Board members and is available,
without charge, upon request by calling 800.345.6611; contacting your financial intermediary; or visiting
investor.columbiathreadneedleus.com.
Columbia Diversified Absolute Return Fund | Annual Report 2017
| 55 |
TRUSTEES AND OFFICERS (continued)
The Board has appointed officers who are responsible for day-to-day business decisions based on policies it has established. The officers serve at the pleasure of the Board. The following table provides basic information about the Officers of the Fund, including principal occupations during the past five years, although their specific titles may have varied over the period. In addition to Mr. Truscott, who is Senior Vice President, the Fund’s other officers are:
Fund officers
Name,
address and
year of birth | Position and year
first appointed to
position for any Fund
in the Columbia
Funds complex or a
predecessor thereof | Principal occupation(s) during past five years |
Christopher O. Petersen
5228 Ameriprise
Financial Center
Minneapolis, MN 55474
Born 1970 | President and Principal Executive Officer (2015) | Vice President and Lead Chief Counsel, Ameriprise Financial, Inc. since January 2015 (previously, Vice President and Chief Counsel, January 2010 - December 2014; officer of Columbia Funds and affiliated funds since 2007. |
Michael G. Clarke
225 Franklin Street
Boston, MA 02110
Born 1969 | Treasurer (2011), Chief Financial Officer (2009) and Chief Accounting Officer (2015) | Vice President — Mutual Fund Administration, Columbia Management Investment Advisers, LLC, since May 2010; senior officer of Columbia Funds and affiliated funds since 2002. |
Paul B. Goucher
100 Park Avenue
New York, NY 10017
Born 1968 | Senior Vice President (2011) and Assistant Secretary (2008) | Senior Vice President and Assistant General Counsel, Ameriprise Financial, Inc. since January 2017 (previously Vice President and Lead Chief Counsel, November 2008 - January 2017 and January 2013 - January 2017, respectively; and Chief Counsel, January 2010 - January 2013); Vice President, Chief Legal Officer and Assistant Secretary, Columbia Management Investment Advisers, LLC since May 2010. |
Thomas P. McGuire
225 Franklin Street
Boston, MA 02110
Born 1972 | Senior Vice President and Chief Compliance Officer (2012) | Vice President — Asset Management Compliance, Ameriprise Financial, Inc., since May 2010; Chief Compliance Officer, Ameriprise Certificate Company since September 2010. |
Colin Moore
225 Franklin Street
Boston, MA 02110
Born 1958 | Senior Vice President (2010) | Executive Vice President and Global Chief Investment Officer, Ameriprise Financial, Inc., since July 2013; Executive Vice President and Global Chief Investment Officer, Columbia Management Investment Advisers, LLC since July 2013 (previously Director and Global Chief Investment Officer, 2010 - 2013). |
Ryan C. Larrenaga
225 Franklin Street
Boston, MA 02110
Born 1970 | Senior Vice President (2017), Chief Legal Officer (2017) and Secretary (2015) | Vice President and Group Counsel, Ameriprise Financial, Inc. since August 2011; officer of Columbia Funds and affiliated funds since 2005. |
Michael E. DeFao
225 Franklin Street
Boston, MA 02110
Born 1968 | Vice President (2011) and Assistant Secretary (2010) | Vice President and Chief Counsel, Ameriprise Financial, Inc. since May 2010. |
Amy Johnson
5228 Ameriprise
Financial Center
Minneapolis, MN 55474
Born 1965 | Vice President (2006) | Managing Director and Global Head of Operations, Columbia Management Investment Advisers, LLC since April 2016 (previously Managing Director and Chief Operating Officer, 2010 - 2016). |
Lyn Kephart-Strong
5228 Ameriprise
Financial Center
Minneapolis, MN 55474
Born 1960 | Vice President (2015) | President, Columbia Management Investment Services Corp. since October 2014; Vice President & Resolution Officer, Ameriprise Trust Company since August 2009. |
| 56 | Columbia Diversified Absolute Return Fund | Annual Report 2017 |
The Fund mails one shareholder report to each shareholder address. If you would like more than one report, please call shareholder services at 800.345.6611 and additional reports will be sent to you.
Proxy voting policies and procedures
The policy of the Board of Trustees is to vote the proxies of the companies in which the Fund holds investments consistent with the procedures as stated in the Statement of Additional Information (SAI). You may obtain a copy of the SAI without charge by calling 800.345.6611; contacting your financial intermediary; visiting investor.columbiathreadneedleus.com; or searching the website of the Securities and Exchange Commission (SEC) at sec.gov. Information regarding how the Fund voted proxies relating to portfolio securities is filed with the SEC by August 31st for the most recent 12-month period ending June 30th of that year, and is available without charge by visiting investor.columbiathreadneedleus.com, or searching the website of the SEC at sec.gov.
Quarterly schedule of investments
The Fund files a complete schedule of portfolio holdings with the SEC for the first and third quarters of each fiscal year on Form N-Q. The Fund’s Form N-Q is available on the SEC’s website at sec.gov and may be reviewed and copied at the SEC’s Public Reference Room in Washington, D.C. Information on the operation of the Public Reference Room may be obtained by calling 800.SEC.0330. The Fund’s complete schedule of portfolio holdings, as filed on Form N-Q, can also be obtained without charge, upon request, by calling 800.345.6611.
Additional Fund information
For more information about the Fund, please visit investor.columbiathreadneedleus.com or call 800.345.6611. Customer Service Representatives are available to answer your questions Monday through Friday from 8 a.m. to 7 p.m. Eastern time.
You may obtain the current net asset value (NAV) of Fund shares at no cost by calling 800.345.6611 or by sending an e-mail to serviceinquiries@columbiathreadneedle.com.
Fund investment manager
Columbia Management Investment Advisers, LLC
225 Franklin Street
Boston, MA 02110
Fund distributor
Columbia Management Investment Distributors, Inc.
225 Franklin Street
Boston, MA 02110
Fund transfer agent
Columbia Management Investment Services Corp.
P.O. Box 8081
Boston, MA 02266-8081
Columbia Diversified Absolute Return Fund | Annual Report 2017
| 57 |
Columbia Diversified Absolute Return Fund
P.O. Box 8081
Boston, MA 02266-8081
Please read and consider the investment objectives, risks, charges and expenses for any fund carefully before investing. For a prospectus and summary prospectus, which contains this and other important information about the Fund, go to
investor.columbiathreadneedleus.com. The Fund is distributed by Columbia Management Investment Distributors, Inc., member FINRA, and managed by Columbia Management Investment Advisers, LLC.
Columbia Threadneedle Investments (Columbia Threadneedle) is the global brand name of the Columbia and Threadneedle group of companies. All rights reserved. Columbia Management Investment Distributors, Inc., 225 Franklin Street, Boston, MA 02110-2804
© 2017 Columbia Management Investment Advisers, LLC.
investor.columbiathreadneedleus.com
Item 2. Code of Ethics.
| | (a) | The registrant has adopted a code of ethics that applies to the registrant’s principal executive officer, principal financial officer, principal accounting officer or controller, or persons performing similar functions, regardless of whether these individuals are employed by the registrant or a third party. |
| | (b) | During the period covered by this report, there were not any amendments to a provision of the code of ethics adopted in 2(a) above. |
| | (c) | During the period covered by this report, there were no waivers, including any implicit waivers, from a provision of the code of ethics described in 2(a) above that relates to one or more of the items set forth in paragraph (b) of this item’s instructions. |
Item 3. Audit Committee Financial Expert.
The registrant’s Board of Trustees has determined that Douglas A. Hacker, David M. Moffett and Anne-Lee Verville, each of whom are members of the registrant’s Board of Trustees and Audit Committee, each qualify as an audit committee financial expert. Mr. Hacker, Mr. Moffett and Ms. Verville are each independent trustees, as defined in paragraph (a)(2) of this item’s instructions.
Item 4. Principal Accountant Fees and Services.
Fee information below is disclosed for the three series of the registrant whose reports to stockholders are included in this annual filing.
(a) Audit Fees. Aggregate Audit Fees billed by the principal accountant for professional services rendered during the fiscal years ended May 31, 2017 and May 31, 2016 are approximately as follows:
| | |
| 2017 | | 2016 |
| $186,700 | | $167,700 |
Audit Fees include amounts related to the audit of the registrant’s annual financial statements or services that are normally provided by the accountant in connection with statutory and regulatory filings or engagements for those fiscal years.
(b) Audit-Related Fees. Aggregate Audit-Related Fees billed to the registrant by the principal accountant for professional services rendered during the fiscal years ended May 31, 2017 and May 31, 2016 are approximately as follows:
Audit-Related Fees include amounts for assurance and related services by the principal accountant that are reasonably related to the performance of the audit of the registrant’s financial statements and are not reported in Audit Fees above. In fiscal years 2017 and 2016, Audit-Related Fees consist of agreed-upon procedures performed for semi-annual shareholder reports. Fiscal year 2017 also includes agreed-upon procedures related to issuance of consents and review of Form N-1A.
During the fiscal years ended May 31, 2017 and May 31, 2016, there were no Audit-Related Fees billed by the registrant’s principal accountant to the registrant’s investment adviser (not including any sub-adviser whose role is primarily portfolio management and is subcontracted with or overseen by another investment adviser) and any entity controlling, controlled by, or under common control with the adviser that provides ongoing services to the registrant for an engagement that related directly to the operations and financial reporting of the registrant.
(c) Tax Fees. Aggregate Tax Fees billed by the principal accountant to the registrant for professional services rendered during the fiscal years ended May 31, 2017 and May 31, 2016 are approximately as follows:
Tax Fees include amounts for the review of annual tax returns, the review of required shareholder distribution calculations and typically include amounts for professional services by the principal accountant for tax compliance, tax advice and tax planning. Fiscal year 2017 and 2016 also include Tax Fees for foreign tax filings.
During the fiscal years ended May 31, 2017 and May 31, 2016, there were no Tax Fees billed by the registrant’s principal accountant to the registrant’s investment adviser (not including any sub-adviser whose role is primarily portfolio management and is subcontracted with or overseen by another investment adviser) and any entity controlling, controlled by, or under common control with the adviser that provides ongoing services to the registrant for an engagement that related directly to the operations and financial reporting of the registrant.
(d) All Other Fees. Aggregate All Other Fees billed by the principal accountant to the registrant for professional services rendered during the fiscal years ended May 31, 2017 and May 31, 2016 are approximately as follows:
All Other Fees include amounts for products and services provided by the principal accountant, other than the services reported in paragraphs (a) through (c) above.
Aggregate All Other Fees billed by the registrant’s principal accountant to the registrant’s investment adviser (not including any sub-adviser whose role is primarily portfolio management and is subcontracted with or overseen by another investment adviser) and any entity controlling, controlled by, or under common control with the adviser that provides ongoing services to the registrant for an engagement that related directly to the operations and financial reporting of the registrant during the fiscal years ended May 31, 2017 and May 31, 2016 are approximately as follows:
| | |
| 2017 | | 2016 |
| $242,500 | | $335,000 |
In fiscal years 2017 and 2016, All Other Fees primarily consists of fees billed for internal control examinations of the registrant’s transfer agent and investment adviser.
(e)(1) Audit Committee Pre-Approval Policies and Procedures
The registrant’s Audit Committee is required to pre-approve the engagement of the registrant’s independent auditors to provide audit and non-audit services to the registrant and non-audit services to its investment adviser (excluding any sub-adviser whose role is primarily portfolio management and is sub-contracted or overseen by another investment adviser (the “Adviser”) or any entity controlling, controlled by or under common control with the Adviser that provides ongoing services to the Fund (a “Control Affiliate”) if the engagement relates directly to the operations and financial reporting of the registrant.
The Audit Committee has adopted a Policy for Engagement of Independent Auditors for Audit and Non-Audit Services (the “Policy”). The Policy sets forth the understanding of the Audit Committee regarding the engagement of the registrant’s independent accountants to provide (i) audit and permissible audit-related, tax and other services to the registrant (“Fund Services”); (ii) non-audit services to the registrant’s Adviser and any Control Affiliates, that relates directly to the operations and financial reporting of a Fund (“Fund-related Adviser Services”); and (iii) certain other audit and non-audit services to the registrant’s Adviser and its Control Affiliates. A service will require specific pre-approval by the Audit Committee if it is to be provided by the Fund’s independent auditor; provided, however, that pre-approval of non-audit services to the Fund, the Adviser or Control Affiliates may be waived if certain de minimis requirements set forth in the SEC’s rules are met.
Under the Policy, the Audit Committee may delegate pre-approval authority to any pre-designated member or members who are independent board members. The member(s) to whom such authority is delegated must report, for informational purposes only, any pre-approval decisions to the Audit Committee at its next regular meeting. The Audit Committee’s responsibilities with respect to the pre-approval of services performed by the independent auditor may not be delegated to management.
On an annual basis, at a regularly scheduled Audit Committee meeting, the Fund’s Treasurer or other Fund officer shall submit to the Audit Committee a schedule of the types of Fund Services and Fund-related Adviser Services that are subject to specific pre- approval. This schedule will provide a description of each type of service that is subject to specific pre-approval, along with total projected fees for each service. The pre-approval will generally cover a one-year period. The Audit Committee will review and approve the types of services and the projected fees for the next one-year period and may add to, or subtract from, the list of pre-approved services from time to time, based on subsequent determinations. This specific approval acknowledges that the Audit Committee is in agreement with the specific types of services that the independent auditor will be permitted to perform and the projected fees for each service.
The Fund’s Treasurer or other Fund officer shall report to the Audit Committee at each of its regular meetings regarding all Fund Services or Fund-related Adviser Services provided since the last such report was rendered, including a description of the services, by category, with forecasted fees for the annual reporting period, proposed changes requiring specific pre-approval and a description of services provided by the independent auditor, by category, with actual fees during the current reporting period.
*****
(e)(2) 100% of the services performed for items (b) through (d) above during 2017 and 2016 were pre-approved by the registrant’s Audit Committee.
(f) Not applicable.
(g) The aggregate non-audit fees billed by the registrant’s accountant for services rendered to the registrant, and rendered to the registrant’s investment adviser (not including any sub-adviser whose role is primarily portfolio management and is subcontracted with or overseen by another investment adviser), and any entity controlling, controlled by, or under common control with the adviser that provides ongoing services to the registrant during the fiscal years ended May 31, 2017 and May 31, 2016 are approximately as follows:
| | |
| 2017 | | 2016 |
| $271,800 | | $367,600 |
(h) The registrant’s Audit Committee of the Board of Directors has considered whether the provision of non-audit services that were rendered to the registrant’s adviser (not including any sub-adviser whose role is primarily portfolio management and is subcontracted with or overseen by another investment adviser), and any entity controlling, controlled by, or under common control with the investment adviser that provides ongoing services to the registrant that were not pre-approved pursuant to paragraph (c)(7)(ii) of Rule 2-01 of Regulation S-X, is compatible with maintaining the principal accountant’s independence.
Item 5. Audit Committee of Listed Registrants.
Not applicable.
Item 6. Investments
| | (a) | The registrant’s “Schedule I – Investments in securities of unaffiliated issuers” (as set forth in 17 CFR 210.12-12) is included in Item 1 of this Form N-CSR. |
Item 7. Disclosure of Proxy Voting Policies and Procedures for Closed-End Management Investment Companies.
Not applicable.
Item 8. Portfolio Managers of Closed-End Management Investment Companies.
Not applicable.
Item 9. Purchases of Equity Securities by Closed-End Management Investment Company and Affiliated Purchasers.
Not applicable.
Item 10. Submission of Matters to a Vote of Security Holders.
There were no material changes to the procedures by which shareholders may recommend nominees to the registrant’s board of directors.
Item 11. Controls and Procedures.
| | (a) | The registrant’s principal executive officer and principal financial officer, based on their evaluation of the registrant’s disclosure controls and procedures as of a date within 90 days of the filing of this report, have concluded that such controls and procedures are adequately designed to ensure that material information required to be disclosed by the registrant in Form N-CSR is accumulated and communicated to the registrant’s management, including the principal executive officer and principal financial officer, or persons performing similar functions, as appropriate to allow timely decisions regarding required disclosure. |
| | (b) | There was no change in the registrant’s internal control over financial reporting that occurred during the registrant’s second fiscal quarter of the period covered by this report that has materially affected, or is reasonably likely to materially affect, the registrant’s internal control over financial reporting. |
Item 12. Exhibits.
(a)(1) Code of ethics required to be disclosed under Item 2 of Form N-CSR attached hereto as Exhibit 99.CODE ETH.
(a)(2) Certifications pursuant to Rule 30a-2(a) under the Investment Company Act of 1940 (17 CFR 270.30a-2(a)) attached hereto as Exhibit 99.CERT.
(a)(3) Not applicable.
(b) Certification pursuant to Rule 30a-2(b) under the Investment Company Act of 1940 (17 CFR 270.30a-2(b)) attached hereto as Exhibit 99.906CERT.
SIGNATURES
Pursuant to the requirements of the Securities Exchange Act of 1934 and the Investment Company Act of 1940, the registrant has duly caused this report to be signed on its behalf by the undersigned, thereunto duly authorized.
| | |
| (registrant) Columbia Funds Series Trust I |
| |
| By (Signature and Title) | | /s/ Christopher O. Petersen |
| | Christopher O. Petersen, President and Principal Executive Officer |
|
| Date July 21, 2017 |
Pursuant to the requirements of the Securities Exchange Act of 1934 and the Investment Company Act of 1940, this report has been signed below by the following persons on behalf of the registrant and in the capacities and on the dates indicated.
| | |
| By (Signature and Title) | | /s/ Christopher O. Petersen |
| | Christopher O. Petersen, President and Principal Executive Officer |
|
| Date July 21, 2017 |
| |
| By (Signature and Title) | | /s/ Michael G. Clarke |
| | Michael G. Clarke, Treasurer and Chief Financial Officer |
|
| Date July 21, 2017 |