UNITED STATES
SECURITIES AND EXCHANGE COMMISSION
Washington, D.C. 20549
FORM N-CSR
CERTIFIED SHAREHOLDER REPORT OF REGISTERED
MANAGEMENT INVESTMENT COMPANIES
Investment Company Act file number 811-04367
Columbia Funds Series Trust I
(Exact name of registrant as specified in charter)
225 Franklin Street
Boston, Massachusetts 02110
(Address of principal executive offices) (Zip code)
Ryan Larrenaga
c/o Columbia Management Investment Advisers, LLC
225 Franklin Street
Boston, MA 02110
(Name and address of agent for service)
Registrant’s telephone number, including area code: (800) 345-6611
Date of fiscal year end: October 31
Date of reporting period: October 31, 2017
Form N-CSR is to be used by management investment companies to file reports with the Commission not later than 10 days after the transmission to stockholders of any report that is required to be transmitted to stockholders under Rule 30e-1 under the Investment Company Act of 1940 (17 CFR 270.30e-1). The Commission may use the information provided on Form N-CSR in its regulatory, disclosure review, inspection, and policymaking roles.
A registrant is required to disclose the information specified by Form N-CSR, and the Commission will make this information public. A registrant is not required to respond to the collection of information contained in Form N-CSR unless the Form displays a currently valid Office of Management and Budget (“OMB”) control number. Please direct comments concerning the accuracy of the information collection burden estimate and any suggestions for reducing the burden to Secretary, Securities and Exchange Commission, 450 Fifth Street, NW, Washington, DC 20549-0609. The OMB has reviewed this collection of information under the clearance requirements of 44 U.S.C. § 3507.
Item 1. Reports to Stockholders.

Annual Report
October 31, 2017
Columbia California Tax-Exempt Fund
Not FDIC Insured • No bank guarantee • May lose value
Dear Shareholders,
The current outlook for financial markets is clouded by two primary concerns: the high valuation of equities and the direction of interest rates. Following the U.S. presidential election, U.S. equities rallied based on the assumption that the new administration’s policies would stimulate growth quickly. Unfortunately it’s unclear whether those measures will get passed, much less passed quickly. In fixed income, uncertainty stems from the possibility that interest rates won’t rise as rapidly as expected if the administration’s proposed growth policies are not implemented.
Given this uncertainty, investors value a consistent approach more than ever. Investors want strong, repeatable risk-adjusted returns. Consistency — not surprises. As a leading global asset manager, we believe our consistent, collaborative investment approach enables us to deliver the dependable experience your portfolio demands. So, how do we strive to deliver a consistent investment experience?
Better insights
Your portfolio benefits from the investment insights uncovered by our talented investment teams around the world.
Better decisions
Our collaborative, interactive environment enables our investment teams to construct portfolios that take advantage of the best investment ideas.
Better outcomes
We aim to deliver a consistent experience, which means fewer surprises, dependable insights, and products designed to do the thing you want.
Whether you’re trying to save money to help your children go to college or for your own retirement, it’s the consistency of the return that is most essential. People who chase higher returns are usually also the first to sell when that investment goes through a bad patch. We try to combat this behavioral tendency by offering strategies that aim for a more consistent return. Our goal is for investors to panic less during periods of volatility, which can have a significant effect on their long-term results.
Nothing is more important to us than making sure those who have entrusted us to protect and grow their assets can do what matters most to them: build a nest egg, leave a legacy, and live confidently — now and throughout retirement. It’s why our talented professionals around the world work together to uncover uncommon opportunities and why our process encourages challenge and debate around our most compelling ideas to ensure better informed investment decisions, which hopefully lead to better outcomes for you.
Your success is our priority. Talk to your financial advisor about how working with Columbia Threadneedle Investments may help you position your portfolio for consistent, sustainable outcomes, no matter the market conditions.
Sincerely,
Christopher O. Petersen
President, Columbia Funds
Investors should consider the investment objectives, risks, charges and expenses of a mutual fund carefully before investing. For a free prospectus and summary prospectus, which contains this and other important information about a fund, visit investor.columbiathreadneedleus.com. The prospectus should be read carefully before investing.
Columbia Funds are distributed by Columbia Management Investment Distributors, Inc., member FINRA, and managed by Columbia Management Investment Advisers, LLC.
© 2017 Columbia Management Investment Advisers, LLC. All rights reserved.
Columbia California Tax-Exempt Fund | Annual Report 2017
Columbia California Tax-Exempt Fund | Annual Report 2017
Investment objective
Columbia California Tax-Exempt Fund (the Fund) seeks total return, consisting of current income exempt from federal income tax and California individual income tax and of capital appreciation, consistent with moderate fluctuation of principal.
Portfolio management
Catherine Stienstra
Co-manager
Managed Fund since 2010
Anders Myhran, CFA
Co-manager
Managed Fund since 2016
| Average annual total returns (%) (for the period ended October 31, 2017) |
| | | Inception | 1 Year | 5 Years | 10 Years |
| Class A | Excluding sales charges | 06/16/86 | 1.49 | 3.68 | 4.89 |
| | Including sales charges | | -1.61 | 3.05 | 4.57 |
| Class C | Excluding sales charges | 08/01/97 | 1.03 | 3.22 | 4.41 |
| | Including sales charges | | 0.06 | 3.22 | 4.41 |
| Class R4* | 03/19/13 | 1.75 | 3.92 | 5.01 |
| Class R5* | 03/01/16 | 1.75 | 3.75 | 4.92 |
| Class Y* | 03/01/17 | 1.67 | 3.72 | 4.91 |
| Class Z | 09/19/05 | 1.74 | 3.91 | 5.14 |
| Bloomberg Barclays California Municipal Bond Index | | 2.18 | 3.40 | 4.74 |
| Bloomberg Barclays Municipal Bond Index | | 2.19 | 3.00 | 4.50 |
Returns for Class A are shown with and without the maximum initial sales charge of 3.00%. Returns for Class C are shown with and without the 1.00% contingent deferred sales charge for the first year only. The Fund’s other classes are not subject to sales charges and have limited eligibility. Effective November 1, 2017, Class R4, Class R5, Class Y and Class Z shares were renamed Advisor Class, Institutional 2 Class, Institutional 3 Class and Institutional Class shares, respectively. Please see the Fund’s prospectus for details. Performance for different share classes will vary based on differences in sales charges and fees associated with each class. All results shown assume reinvestment of distributions during the period. Returns do not reflect the deduction of taxes that a shareholder may pay on Fund distributions or on the redemption of Fund shares. Performance results reflect the effect of any fee waivers or reimbursements of Fund expenses by Columbia Management Investment Advisers, LLC and/or any of its affiliates. Absent these fee waivers or expense reimbursement arrangements, performance results would have been lower.
The performance information shown represents past performance and is not a guarantee of future results. The investment return and principal value of your investment will fluctuate so that your shares, when redeemed, may be worth more or less than their original cost. Current performance may be lower or higher than the performance information shown. You may obtain performance information current to the most recent month-end by contacting your financial intermediary, visiting investor.columbiathreadneedleus.com or calling 800.345.6611.
| * | The returns shown for periods prior to the share class inception date (including returns for the Life of the Fund, if shown, which are since Fund inception) include the returns of the Fund’s oldest share class. These returns are adjusted to reflect any higher class-related operating expenses of the newer share classes, as applicable. Please visit investor.columbiathreadneedleus.com/investment-products/mutual-funds/appended-performance for more information. |
The Bloomberg Barclays California Municipal Bond Index is a subset of the Bloomberg Barclays Municipal Bond Index consisting solely of bonds issued by obligors located in the state of California.
The Bloomberg Barclays Municipal Bond Index is an unmanaged index considered representative of the broad market for investment-grade, tax-exempt bonds with a maturity of at least one year.
Indices are not available for investment, are not professionally managed and do not reflect sales charges, fees brokerage commissions, taxes or other expenses of investing. Securities in the Fund may not match those in an index.
| 2 | Columbia California Tax-Exempt Fund | Annual Report 2017 |
Fund at a Glance (continued)
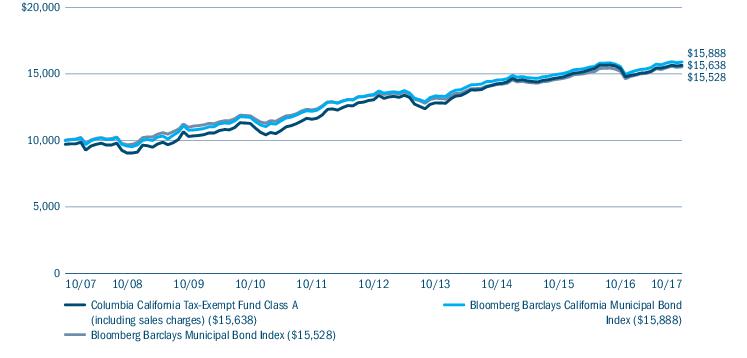
Performance of a hypothetical $10,000 investment (October 31, 2007 — October 31, 2017)
The chart above shows the change in value of a hypothetical $10,000 investment in Class A shares of Columbia California Tax-Exempt Fund during the stated time period, and does not reflect the deduction of taxes that a shareholder may pay on Fund distributions or on the redemption of Fund shares.
| Quality breakdown (%) (at October 31, 2017) |
| AAA rating | 0.6 |
| AA rating | 26.8 |
| A rating | 40.1 |
| BBB rating | 23.1 |
| BB rating | 2.0 |
| B rating | 0.6 |
| Not rated | 6.8 |
| Total | 100.0 |
Percentages indicated are based upon total fixed income investments (excluding Money Market Funds).
Bond ratings apply to the underlying holdings of the Fund and not the Fund itself and are divided into categories ranging from highest to lowest credit quality, determined by using the middle rating of Moody’s, S&P and Fitch, after dropping the highest and lowest available ratings. When ratings are available from only two rating agencies, the lower rating is used. When a rating is available from only one rating agency, that rating is used. When a bond is not rated by any rating agency, it is designated as “Not rated.” Credit quality ratings assigned by a rating agency are subjective opinions, not statements of fact, and are subject to change, including daily. The ratings assigned by credit rating agencies are but one of the considerations that the Investment Manager and/or Fund’s subadviser incorporates into its credit analysis process, along with such other issuer-specific factors as cash flows, capital structure and leverage ratios, ability to de-leverage (repay) through free cash flow, quality of management, market positioning and access to capital, as well as such security-specific factors as the terms of the security (e.g., interest rate and time to maturity) and the amount and type of any collateral.
Columbia California Tax-Exempt Fund | Annual Report 2017
| 3 |
Manager Discussion of Fund Performance
For the 12-month period that ended October 31, 2017, the Fund’s Class A shares returned 1.49% excluding sales charges. The Fund’s Class Z shares returned 1.74% for the same time period. The Fund’s benchmark, the Bloomberg Barclays California Municipal Bond Index, returned 2.18%, and the broad Bloomberg Barclays Municipal Bond Index, returned 2.19% for the same period. While duration and yield curve positioning proved effective, credit quality positioning, sector allocation and security selection overall produced mixed results.
Tax-exempt bond market posted modest gains amid mixed macro backdrop
The tax-exempt fixed-income market overall posted modest gains during the period amid mixed macro influences. The defining event of the period, though it came early on, was likely the U.S. presidential election. The market euphoria following the surprise results, driven by overnight re-evaluations around regulation, fiscal spending, inflation and pro-economic growth policies regarding health care, infrastructure spending and tax reform, sent equities higher and bond prices lower. Municipal bond yields were already under pressure from record new issue supply when the post-election sell-off in November 2016 sent the market into its worst month of total return since 2008. However, as often happens, financial markets got a little ahead of themselves and conditions started to reverse in December 2016. The Federal Reserve (the Fed) raised the targeted federal funds rate near the end of 2016, and markets barely blinked. This relative calm, along with an ongoing search for yield and Washington D.C. gridlock, tempered concerns about the potential for accelerating economic growth and higher inflation and produced all but two months of positive total returns within the municipal bond market from December 2016 through October 2017, even as the Fed raised interest rates twice more — in March and June 2017. Market concerns about broad tax reform also ebbed, given proposals actively under consideration by Congress at the end of the period.
The municipal bond market was aided by subdued supply in the first ten months of 2017, down approximately 18% on a year over year basis, with less refunding, which was greeted by steady demand from investors, as evidenced by about $15 billion of mutual fund inflows. Despite unfunded liabilities and budgetary stress in some notable credits, municipal bond market fundamentals also remained sound, as the U.S. economy remained in a phase of steady, albeit gradual, improvement. It is also well worth noting that independent ratings agency Moody’s considered California one of the nation’s leading state economies, with the technology sector leading its expansion and supported by a high-quality labor force and robust income growth propelling strong real estate demand.
Overall, AAA-rated municipal bond yields rose across all maturities during the period. Lower quality municipal bonds generally outperformed their higher quality counterparts. During the period, municipal bonds significantly outperformed U.S. Treasuries.
Security selection, sector allocation and credit quality positioning generated mixed results
The primary detractor from relative performance was issue selection among resource recovery revenue bonds and state general obligation bonds. Resource recovery revenue bonds are municipal bonds used to construct a waste processing or recycling center. The coupons and principal on a resource recovery revenue bond are secured by the fees paid by users of the center and/or by the sale of the recycled products. On the positive side, security selection among local general obligation bonds and within the education and hospital sectors proved particularly effective during the period. Also boosting relative results was having overweights to the special tax and hospital sectors, which each outperformed the benchmark during the period, and having an underweight to the state general obligations sector, which lagged the benchmark during the period. It is worth noting that the Fund did not hold any Puerto Rico bonds during the period.
From a credit quality perspective, issue selection among bonds rated A and Baa1 dampened relative results, which was partially offset by the positive contributions made by having underweight allocations to bonds rated AAA and AA, overweight allocations to bonds rated A and BBB and exposure to non-rated securities.
Duration and yield curve positioning overall added value
The Fund benefited from its combined duration and yield curve positioning. The Fund had a longer duration than the benchmark, which helped as longer maturity tax-exempt bonds modestly outperformed shorter term tax-exempt maturities during the period. For similar reasons, having an overweight relative to the benchmark in bonds with maturities of 10 to 20 years and a relative underweight in bonds with shorter maturities contributed positively.
| 4 | Columbia California Tax-Exempt Fund | Annual Report 2017 |
Manager Discussion of Fund Performance (continued)
Fundamental analysis drove portfolio changes
We adjusted the Fund’s duration during the period as market conditions shifted, ending the period with a longer duration relative to that of the benchmark than the Fund had at the start of the period. Heading into the November 2016 U.S. elections, we were particularly cautious. We then used the post-election sell-off in the market to purchase longer maturity bonds as we sought to lock in higher yields. We subsequently reduced the Fund’s duration ahead of tax season and then extended after it appeared that the typical seasonal pattern of increased supply did not play out as we expected. The longer duration was maintained during the summer months as we believed this would be a strong period for the market based on technical, or supply/demand, factors.
We increased the Fund’s exposure to BBB securities as we sought to buoy the Fund’s income. From a sector perspective, we increased the Fund’s exposure to hospital, alternative minimum tax airport and toll facilities bonds based on our expectation that the alternative minimum tax might be repealed with tax reform. We also added to the Fund’s positions in the education, continuing care retirement communities (CCRC) and charter schools sectors. We reduced the Fund’s exposure to pre-refunded bonds and state general obligation bonds. (Pre-refunded bonds, also known as advance refunded bonds, are subject to a procedure in which a bond issuer floats a second bond at a lower interest rate, and the proceeds from the sale of the second bond are invested, usually in Treasury securities, which in turn, are held in escrow collateralizing the first bond. Advance refunded bonds no longer represent the credit risk profile of the original borrower, and given the high credit quality of the escrow account they often increase in value — sometimes significantly.)
As always, the Fund’s emphasis remains on generating both a high level of income generally exempt from federal income tax and California state and local taxes as well as capital appreciation, consistent with moderate fluctuation of principal.
Fixed-income securities present issuer default risk. The Fund invests substantially in municipal securities and will be affected by tax, legislative, regulatory, demographic or political changes, as well as changes impacting a state’s financial, economic or other conditions. A relatively small number of tax-exempt issuers may necessitate the Fund investing more heavily in a single issuer and, therefore, be more exposed to the risk of loss than a fund that invests more broadly. The value of the Fund’s portfolio may be more volatile than a more geographically diversified fund. Prepayment and extension risk exists because the timing of payments on a loan, bond or other investment may accelerate when interest rates fall or decelerate when interest rates rise which may reduce investment opportunities and potential returns. A rise in interest rates may result in a price decline of fixed-income instruments held by the Fund, negatively impacting its performance and NAV. Falling rates may result in the Fund investing in lower yielding debt instruments, lowering the Fund’s income and yield. These risks may be heightened for longer maturity and duration securities. Non-investment-grade (high-yield or junk) securities present greater price volatility and more risk to principal and income than higher rated securities. Market risk may affect a single issuer, sector of the economy, industry or the market as a whole. Federal and state tax rules apply to capital gain distributions and any gains or losses on sales. Income may be subject to state or local taxes. Liquidity risk is associated with the difficulty of selling underlying investments at a desirable time or price. See the Fund’s prospectus for more information on these and other risks.
The views expressed in this report reflect the current views of the respective parties. These views are not guarantees of future performance and involve certain risks, uncertainties and assumptions that are difficult to predict, so actual outcomes and results may differ significantly from the views expressed. These views are subject to change at any time based upon economic, market or other conditions and the respective parties disclaim any responsibility to update such views. These views may not be relied on as investment advice and, because investment decisions for a Columbia fund are based on numerous factors, may not be relied on as an indication of trading intent on behalf of any particular Columbia fund. References to specific securities should not be construed as a recommendation or investment advice.
Columbia California Tax-Exempt Fund | Annual Report 2017
| 5 |
Understanding Your Fund’s Expenses
(Unaudited)
As an investor, you incur two types of costs. There are transaction costs, which generally include sales charges on purchases and may include redemption fees. There are also ongoing costs, which generally include management fees, distribution and/or service fees, and other fund expenses. The following information is intended to help you understand your ongoing costs (in dollars) of investing in the Fund and to help you compare these costs with the ongoing costs of investing in other mutual funds.
Analyzing your Fund’s expenses
To illustrate these ongoing costs, we have provided examples and calculated the expenses paid by investors in each share class of the Fund during the period. The actual and hypothetical information in the table is based on an initial investment of $1,000 at the beginning of the period indicated and held for the entire period. Expense information is calculated two ways and each method provides you with different information. The amount listed in the “Actual” column is calculated using the Fund’s actual operating expenses and total return for the period. You may use the Actual information, together with the amount invested, to estimate the expenses that you paid over the period. Simply divide your account value by $1,000 (for example, an $8,600 account value divided by $1,000 = 8.6), then multiply the results by the expenses paid during the period under the “Actual” column. The amount listed in the “Hypothetical” column assumes a 5% annual rate of return before expenses (which is not the Fund’s actual return) and then applies the Fund’s actual expense ratio for the period to the hypothetical return. You should not use the hypothetical account values and expenses to estimate either your actual account balance at the end of the period or the expenses you paid during the period. See “Compare with other funds” below for details on how to use the hypothetical data.
Compare with other funds
Since all mutual funds are required to include the same hypothetical calculations about expenses in shareholder reports, you can use this information to compare the ongoing cost of investing in the Fund with other funds. To do so, compare the hypothetical example with the 5% hypothetical examples that appear in the shareholder reports of other funds. As you compare hypothetical examples of other funds, it is important to note that hypothetical examples are meant to highlight the ongoing costs of investing in a fund only and do not reflect any transaction costs, such as sales charges, or redemption or exchange fees. Therefore, the hypothetical calculations are useful in comparing ongoing costs only, and will not help you determine the relative total costs of owning different funds. If transaction costs were included in these calculations, your costs would be higher.
| May 1, 2017 — October 31, 2017 |
| | Account value at the
beginning of the
period ($) | Account value at the
end of the
period ($) | Expenses paid during
the period ($) | Fund’s annualized
expense ratio (%) |
| | Actual | Hypothetical | Actual | Hypothetical | Actual | Hypothetical | Actual |
| Class A | 1,000.00 | 1,000.00 | 1,029.70 | 1,021.30 | 4.24 | 4.22 | 0.82 |
| Class C | 1,000.00 | 1,000.00 | 1,027.40 | 1,019.01 | 6.56 | 6.53 | 1.27 |
| Class R4 | 1,000.00 | 1,000.00 | 1,031.10 | 1,022.57 | 2.95 | 2.94 | 0.57 |
| Class R5 | 1,000.00 | 1,000.00 | 1,031.00 | 1,022.63 | 2.90 | 2.89 | 0.56 |
| Class Y | 1,000.00 | 1,000.00 | 1,031.30 | 1,022.88 | 2.64 | 2.63 | 0.51 |
| Class Z | 1,000.00 | 1,000.00 | 1,031.00 | 1,022.57 | 2.95 | 2.94 | 0.57 |
Expenses paid during the period are equal to the annualized expense ratio for each class as indicated above, multiplied by the average account value over the period and then multiplied by the number of days in the Fund’s most recent fiscal half year and divided by 365.
Expenses do not include fees and expenses incurred indirectly by the Fund from its investment in underlying funds, including affiliated and non-affiliated pooled investment vehicles, such as mutual funds and exchange-traded funds.
Had Columbia Management Investment Advisers, LLC and/or certain of its affiliates not waived/reimbursed certain fees and expenses, account value at the end of the period would have been reduced.
| 6 | Columbia California Tax-Exempt Fund | Annual Report 2017 |
Portfolio of Investments
October 31, 2017
(Percentages represent value of investments compared to net assets)
| Floating Rate Notes 0.4% |
| Issue Description | Effective
Yield | | Principal
Amount ($) | Value ($) |
| Variable Rate Demand Notes 0.4% |
| State of California(a),(b) |
| Unlimited General Obligation Bonds |
| Kindergarten |
| VRDN Series 2013A2 (State Street) |
| 05/01/2034 | 0.800% | | 2,350,000 | 2,350,000 |
Total Floating Rate Notes
(Cost $2,350,000) | 2,350,000 |
|
| Municipal Bonds 98.5% |
| Issue Description | Coupon
Rate | | Principal
Amount ($) | Value ($) |
| Airport 7.9% |
| City of Fresno Airport(c) |
| Refunding Revenue Bonds |
| Series 2013B AMT (BAM) |
| 07/01/2028 | 5.000% | | 500,000 | 559,450 |
| 07/01/2030 | 5.125% | | 1,050,000 | 1,173,501 |
| City of Los Angeles Department of Airports(c) |
| Revenue Bonds |
| Los Angeles International Airport |
| Subordinated Series 2017 AMT |
| 05/15/2041 | 5.000% | | 1,500,000 | 1,715,925 |
| Subordinated Series 2017A AMT |
| 05/15/2047 | 5.000% | | 1,250,000 | 1,439,188 |
| County of Orange Airport |
| Revenue Bonds |
| Series 2009A |
| 07/01/2039 | 5.250% | | 2,500,000 | 2,650,025 |
| County of Sacramento Airport System |
| Refunding Revenue Bonds |
| Subordinated Series 2016B |
| 07/01/2041 | 5.000% | | 5,500,000 | 6,306,465 |
| Revenue Bonds |
| Senior Series 2009B |
| 07/01/2039 | 5.750% | | 3,000,000 | 3,096,240 |
| County of Sacramento Airport System(c) |
| Revenue Bonds |
| Senior Series 2008B (AGM) AMT |
| 07/01/2039 | 5.250% | | 1,000,000 | 1,022,910 |
| Norman Y. Mineta San Jose International Airport(c) |
| Refunding Revenue Bonds |
| Series 2017A AMT |
| 03/01/2047 | 5.000% | | 3,000,000 | 3,414,330 |
| San Diego County Regional Airport Authority(c) |
| Revenue Bonds |
| Subordinated Series 2017B AMT |
| 07/01/2047 | 5.000% | | 1,000,000 | 1,149,470 |
| Municipal Bonds (continued) |
| Issue Description | Coupon
Rate | | Principal
Amount ($) | Value ($) |
| San Francisco City & County Airport Commission - San Francisco International Airport(c) |
| Refunding Revenue Bonds |
| 2nd Series 2008-34E (AGM) AMT |
| 05/01/2025 | 5.750% | | 1,500,000 | 1,534,260 |
| 2nd Series 2011F AMT |
| 05/01/2029 | 5.000% | | 5,210,000 | 5,774,503 |
| Revenue Bonds |
| San Francisco International Airport |
| Series 2016 AMT |
| 05/01/2041 | 5.000% | | 3,305,000 | 3,800,221 |
| Series 2014A AMT |
| 05/01/2044 | 5.000% | | 6,000,000 | 6,707,340 |
| Total | 40,343,828 |
| Charter Schools 4.2% |
| California Municipal Finance Authority(d) |
| Revenue Bonds |
| Julian Charter School Project |
| Series 2015A |
| 03/01/2045 | 5.625% | | 3,000,000 | 3,036,540 |
| California School Finance Authority(d) |
| Refunding Revenue Bonds |
| Aspire Public Schools |
| Series 2016 |
| 08/01/2041 | 5.000% | | 1,750,000 | 1,916,740 |
| 08/01/2046 | 5.000% | | 2,250,000 | 2,440,597 |
| Revenue Bonds |
| Alliance College-Ready Public Schools |
| Series 2015 |
| 07/01/2035 | 5.000% | | 3,010,000 | 3,343,117 |
| 07/01/2045 | 5.000% | | 1,705,000 | 1,861,161 |
| Green Dot Public School Project |
| Series 2015A |
| 08/01/2035 | 5.000% | | 1,510,000 | 1,644,269 |
| KIPP LA Projects |
| Series 2014A |
| 07/01/2044 | 5.125% | | 1,000,000 | 1,122,310 |
| Series 2015A |
| 07/01/2045 | 5.000% | | 1,000,000 | 1,129,350 |
| Series 2017 |
| 07/01/2047 | 5.000% | | 1,500,000 | 1,686,990 |
| River Springs Charter School Project |
| Series 2015 |
| 07/01/2046 | 6.375% | | 3,000,000 | 3,152,520 |
| 07/01/2046 | 6.375% | | 420,000 | 441,353 |
| Total | 21,774,947 |
The accompanying Notes to Financial Statements are an integral part of this statement.
Columbia California Tax-Exempt Fund | Annual Report 2017
| 7 |
Portfolio of Investments (continued)
October 31, 2017
| Municipal Bonds (continued) |
| Issue Description | Coupon
Rate | | Principal
Amount ($) | Value ($) |
| Health Services 1.2% |
| California Municipal Finance Authority |
| Refunding Revenue Bonds |
| Harbor Regional Center Project |
| Series 2015 |
| 11/01/2039 | 5.000% | | 2,000,000 | 2,243,240 |
| Inland Regional Center Project |
| Series 2015 |
| 06/15/2045 | 5.000% | | 3,500,000 | 3,777,865 |
| Total | 6,021,105 |
| Higher Education 7.4% |
| California Educational Facilities Authority |
| Refunding Revenue Bonds |
| Loma Linda University |
| Series 2017A |
| 04/01/2047 | 5.000% | | 4,250,000 | 4,801,097 |
| University of the Pacific |
| Series 2015 |
| 11/01/2036 | 5.000% | | 2,000,000 | 2,282,540 |
| Revenue Bonds |
| California Lutheran University |
| Series 2008 |
| 10/01/2038 | 5.750% | | 3,000,000 | 3,115,530 |
| Chapman University |
| Series 2011 |
| 04/01/2031 | 5.000% | | 4,375,000 | 4,841,069 |
| Series 2015 |
| 04/01/2040 | 5.000% | | 2,500,000 | 2,808,875 |
| Loyola Marymount University |
| Series 2010A |
| 10/01/2040 | 5.125% | | 1,250,000 | 1,332,225 |
| California Municipal Finance Authority |
| Refunding Revenue Bonds |
| Azusa Pacific University |
| Series 2015B |
| 04/01/2041 | 5.000% | | 4,500,000 | 4,867,065 |
| Biola University |
| Series 2017 |
| 10/01/2039 | 5.000% | | 1,000,000 | 1,162,010 |
| Revenue Bonds |
| Biola University |
| Series 2013 |
| 10/01/2038 | 5.000% | | 1,000,000 | 1,088,950 |
| 10/01/2042 | 5.000% | | 2,360,000 | 2,563,314 |
| California Statewide Communities Development Authority(d) |
| Refunding Revenue Bonds |
| California Baptist University |
| Series 2017A |
| 11/01/2041 | 5.000% | | 1,875,000 | 2,024,137 |
| Municipal Bonds (continued) |
| Issue Description | Coupon
Rate | | Principal
Amount ($) | Value ($) |
| California Statewide Communities Development Authority |
| Revenue Bonds |
| California Baptist University |
| Series 2014A |
| 11/01/2043 | 6.375% | | 3,000,000 | 3,480,540 |
| Lancer Plaza Project |
| Series 2013 |
| 11/01/2033 | 5.625% | | 1,400,000 | 1,582,294 |
| 11/01/2043 | 5.875% | | 1,875,000 | 2,111,869 |
| Total | 38,061,515 |
| Hospital 14.0% |
| California Health Facilities Financing Authority |
| Refunding Revenue Bonds |
| El Camino Hospital |
| Series 2015A |
| 02/01/2040 | 5.000% | | 5,000,000 | 5,595,950 |
| Sutter Health |
| Series 2017A |
| 11/15/2048 | 4.000% | | 3,000,000 | 3,122,400 |
| Revenue Bonds |
| Dignity Health |
| Series 2009E |
| 07/01/2025 | 5.625% | | 1,125,000 | 1,208,688 |
| Series 2011A |
| 03/01/2041 | 5.250% | | 3,000,000 | 3,253,020 |
| El Camino Hospital |
| Series 2017 |
| 02/01/2047 | 5.000% | | 4,000,000 | 4,555,800 |
| Kaiser Permanente |
| Subordinated Series 2017A-2 |
| 11/01/2044 | 4.000% | | 7,000,000 | 7,347,690 |
| Lucile Packard Stanford Hospital |
| Series 2016 |
| 08/15/2055 | 5.000% | | 1,000,000 | 1,135,340 |
| Lucile Salter Packard Children’s Hospital |
| Series 2017 |
| 11/15/2056 | 5.000% | | 1,000,000 | 1,147,960 |
| St. Joseph Health System |
| Series 2009A |
| 07/01/2029 | 5.500% | | 1,500,000 | 1,607,565 |
| Series 2013A |
| 07/01/2037 | 5.000% | | 2,000,000 | 2,268,120 |
| Sutter Health Obligation Group |
| Series 2011B |
| 08/15/2031 | 5.875% | | 1,815,000 | 2,041,494 |
| California Municipal Finance Authority |
| Refunding Revenue Bonds |
| Community Medical Centers |
| Series 2015A |
| 02/01/2040 | 5.000% | | 2,000,000 | 2,217,420 |
The accompanying Notes to Financial Statements are an integral part of this statement.
| 8 | Columbia California Tax-Exempt Fund | Annual Report 2017 |
Portfolio of Investments (continued)
October 31, 2017
| Municipal Bonds (continued) |
| Issue Description | Coupon
Rate | | Principal
Amount ($) | Value ($) |
| Series 2017A |
| 02/01/2042 | 4.000% | | 2,000,000 | 2,038,680 |
| 02/01/2047 | 5.000% | | 2,000,000 | 2,232,120 |
| California Public Finance Authority |
| Refunding Revenue Bonds |
| Henry Mayo Newhall Memorial Hospital |
| Series 2017 |
| 10/15/2047 | 5.000% | | 4,000,000 | 4,389,960 |
| California Statewide Communities Development Authority |
| Refunding Revenue Bonds |
| Adventist Health System West |
| Series 2015 |
| 03/01/2035 | 5.000% | | 3,850,000 | 4,411,522 |
| Huntington Memorial Hospital |
| Series 2014B |
| 07/01/2044 | 5.000% | | 1,000,000 | 1,120,820 |
| Redlands Community Hospital OB |
| Series 2016 |
| 10/01/2046 | 5.000% | | 1,000,000 | 1,109,370 |
| Revenue Bonds |
| Henry Mayo Newhall Memorial Hospital |
| Series 2014A (AGM) |
| 10/01/2043 | 5.250% | | 3,120,000 | 3,489,845 |
| Loma Linda University Medical Center |
| Series 2014 |
| 12/01/2054 | 5.500% | | 3,660,000 | 4,021,535 |
| Sutter Health |
| Series 2011A |
| 08/15/2042 | 6.000% | | 2,000,000 | 2,249,300 |
| California Statewide Communities Development Authority(d) |
| Revenue Bonds |
| Loma Linda University Medical Center |
| Series 2016A |
| 12/01/2056 | 5.250% | | 500,000 | 543,485 |
| City of Torrance |
| Revenue Bonds |
| Torrance Memorial Medical Center |
| Series 2010A |
| 09/01/2030 | 5.000% | | 3,000,000 | 3,217,170 |
| Kaweah Delta Health Care District |
| Revenue Bonds |
| Series 2015B |
| 06/01/2040 | 5.000% | | 4,770,000 | 5,253,392 |
| Palomar Health |
| Refunding Revenue Bonds |
| Series 2016 |
| 11/01/2039 | 5.000% | | 2,000,000 | 2,205,480 |
| Total | 71,784,126 |
| Municipal Bonds (continued) |
| Issue Description | Coupon
Rate | | Principal
Amount ($) | Value ($) |
| Investor Owned 0.2% |
| City of Chula Vista |
| Revenue Bonds |
| San Diego Gas & Electric Co. |
| Series 2004D |
| 01/01/2034 | 5.875% | | 1,000,000 | 1,069,540 |
| Local Appropriation 2.5% |
| Anaheim Public Financing Authority |
| Refunding Revenue Bonds |
| Series 2014A |
| 05/01/2046 | 5.000% | | 1,000,000 | 1,146,490 |
| City & County of San Francisco |
| Certificate of Participation |
| Moscone Convention Center Expansion |
| Series 2017 |
| 04/01/2038 | 4.000% | | 5,000,000 | 5,274,000 |
| City of Modesto |
| Certificate of Participation |
| Community Center Refinancing Project |
| Series 1993A (AMBAC) |
| 11/01/2023 | 5.000% | | 1,560,000 | 1,628,687 |
| Sacramento City Schools Joint Powers Financing Authority |
| Refunding Revenue Bonds |
| Series 2006A (BAM) |
| 03/01/2040 | 5.000% | | 2,000,000 | 2,251,080 |
| San Mateo County Board of Education |
| Refunding Certificate of Participation |
| Series 2009 |
| 06/01/2035 | 5.250% | | 2,000,000 | 2,086,260 |
| Victor Elementary School District |
| Certificate of Participation |
| School Construction Refinancing Project |
| Series 1996 (NPFGC) |
| 05/01/2018 | 6.450% | | 635,000 | 651,605 |
| Total | 13,038,122 |
| Local General Obligation 7.6% |
| Central Unified School District |
| Unlimited General Obligation Bonds |
| Election 2016 |
| Series 2017A |
| 08/01/2047 | 4.000% | | 1,500,000 | 1,567,740 |
| Central Valley Schools Financing Authority |
| General Obligation Refunding Revenue Bonds |
| School District Program |
| Series 1998A (NPFGC) |
| 02/01/2018 | 6.450% | | 85,000 | 86,031 |
The accompanying Notes to Financial Statements are an integral part of this statement.
Columbia California Tax-Exempt Fund | Annual Report 2017
| 9 |
Portfolio of Investments (continued)
October 31, 2017
| Municipal Bonds (continued) |
| Issue Description | Coupon
Rate | | Principal
Amount ($) | Value ($) |
| Chabot-Las Positas Community College District |
| Unlimited General Obligation Bonds |
| Election 2016 |
| Series 2017A |
| 08/01/2042 | 4.000% | | 2,250,000 | 2,387,992 |
| Conejo Valley Unified School District(e) |
| Unlimited General Obligation Bonds |
| Series 2015A (AGM) |
| 08/01/2029 | 0.000% | | 1,650,000 | 1,080,008 |
| 08/01/2030 | 0.000% | | 1,000,000 | 614,460 |
| East Side Union High School District |
| Unlimited General Obligation Refunding Bonds |
| Series 2003B (NPFGC) |
| 08/01/2026 | 5.250% | | 2,010,000 | 2,385,609 |
| Glendale Unified School District(e) |
| Unlimited General Obligation Refunding Bonds |
| Series 2015B |
| 09/01/2031 | 0.000% | | 1,900,000 | 1,171,103 |
| 09/01/2032 | 0.000% | | 1,000,000 | 584,070 |
| Long Beach Unified School District(e) |
| Unlimited General Obligation Bonds |
| Series 2015D-1 |
| 08/01/2032 | 0.000% | | 1,500,000 | 878,970 |
| Los Angeles Unified School District |
| Unlimited General Obligation Bonds |
| Series 2009D |
| 01/01/2034 | 5.000% | | 750,000 | 797,055 |
| Manteca Unified School District(e) |
| Unlimited General Obligation Bonds |
| Capital Appreciation-Election of 2004 |
| Series 2006 (NPFGC) |
| 08/01/2032 | 0.000% | | 5,440,000 | 3,304,038 |
| Marin Healthcare District |
| Unlimited General Obligation Bonds |
| Election 2013 |
| Series 2017A |
| 08/01/2047 | 4.000% | | 2,500,000 | 2,640,475 |
| Monterey Peninsula Community College District(e) |
| Unlimited General Obligation Refunding Bonds |
| Series 2016 |
| 08/01/2032 | 0.000% | | 3,500,000 | 2,208,325 |
| 08/01/2033 | 0.000% | | 2,000,000 | 1,203,080 |
| Oakland Unified School District/Alameda County |
| Unlimited General Obligation Bonds |
| Election of 2006 |
| Series 2012A |
| 08/01/2022 | 5.000% | | 750,000 | 833,333 |
| Series 2015A |
| 08/01/2040 | 5.000% | | 1,000,000 | 1,158,260 |
| Municipal Bonds (continued) |
| Issue Description | Coupon
Rate | | Principal
Amount ($) | Value ($) |
| Pomona Unified School District(e) |
| Unlimited General Obligation Bonds |
| Series 2016G (AGM) |
| 08/01/2033 | 0.000% | | 1,000,000 | 579,040 |
| 08/01/2034 | 0.000% | | 1,610,000 | 891,618 |
| Poway Unified School District(e) |
| Unlimited General Obligation Bonds |
| Improvement District No. 2007-1-A |
| Series 2009 |
| 08/01/2030 | 0.000% | | 2,295,000 | 1,552,476 |
| Riverside Community College District(e) |
| Unlimited General Obligation Bonds |
| Election of 2004 |
| Series 2015E |
| 08/01/2030 | 0.000% | | 600,000 | 386,136 |
| 08/01/2031 | 0.000% | | 1,000,000 | 606,060 |
| Rocklin Unified School District(e) |
| Unlimited General Obligation Bonds |
| Capital Appreciation |
| Series 1995C (NPFGC) |
| 07/01/2020 | 0.000% | | 2,580,000 | 2,351,799 |
| San Diego Unified School District(e) |
| Unlimited General Obligation Bonds |
| Capital Appreciation Bonds |
| Series 2016I |
| 07/01/2034 | 0.000% | | 5,000,000 | 2,710,150 |
| San Gorgonio Memorial Health Care District |
| Unlimited General Obligation Refunding Bonds |
| Series 2014 |
| 08/01/2039 | 5.000% | | 4,000,000 | 4,415,760 |
| Sierra Kings Health Care District |
| Unlimited General Obligation Refunding Bonds |
| Series 2015 |
| 08/01/2037 | 5.000% | | 1,500,000 | 1,674,075 |
| Simi Valley Unified School District |
| Refunding Certificate of Participation |
| Capital Improvement Projects |
| Series 1998 (AMBAC) |
| 08/01/2022 | 5.250% | | 925,000 | 1,016,658 |
| Total | 39,084,321 |
| Multi-Family 2.6% |
| California Municipal Finance Authority(f) |
| Refunding Revenue Bonds |
| Caritas Projects |
| Series 2017A |
| 08/15/2042 | 4.000% | | 1,000,000 | 1,008,800 |
| California Municipal Finance Authority |
| Revenue Bonds |
| Bowles Hall Foundation |
| Series 2015A |
| 06/01/2050 | 5.000% | | 1,250,000 | 1,356,525 |
The accompanying Notes to Financial Statements are an integral part of this statement.
| 10 | Columbia California Tax-Exempt Fund | Annual Report 2017 |
Portfolio of Investments (continued)
October 31, 2017
| Municipal Bonds (continued) |
| Issue Description | Coupon
Rate | | Principal
Amount ($) | Value ($) |
| Caritas Affordable Housing |
| Senior Series 2014 |
| 08/15/2049 | 5.250% | | 3,500,000 | 3,833,235 |
| Subordinated Series 2014 |
| 08/15/2049 | 5.875% | | 1,000,000 | 1,102,250 |
| California Statewide Communities Development Authority |
| Refunding Revenue Bonds |
| CHF Irvine LLC |
| Series 2016 |
| 05/15/2040 | 5.000% | | 1,000,000 | 1,139,920 |
| University of California Irvine East Campus Apartments |
| Series 2012 |
| 05/15/2031 | 5.125% | | 2,000,000 | 2,182,280 |
| Revenue Bonds |
| Series 2017 |
| 05/15/2047 | 5.000% | | 2,500,000 | 2,860,650 |
| Total | 13,483,660 |
| Municipal Power 0.8% |
| City of Riverside Electric |
| Revenue Bonds |
| Series 2008D (AGM) |
| 10/01/2028 | 5.000% | | 1,325,000 | 1,371,229 |
| City of Vernon Electric System |
| Revenue Bonds |
| Series 2012A |
| 08/01/2030 | 5.000% | | 1,000,000 | 1,103,670 |
| Unrefunded Revenue Bonds |
| Series 2009A |
| 08/01/2021 | 5.125% | | 1,340,000 | 1,417,935 |
| Total | 3,892,834 |
| Other Bond Issue 0.8% |
| City of Long Beach Marina System |
| Revenue Bonds |
| Series 2015 |
| 05/15/2040 | 5.000% | | 2,000,000 | 2,213,940 |
| San Diego County Regional Airport Authority |
| Revenue Bonds |
| Consolidated Rental Car Facility Project |
| Series 2014A |
| 07/01/2044 | 5.000% | | 1,500,000 | 1,693,455 |
| Total | 3,907,395 |
| Ports 2.1% |
| Port Commission of the City & County of San Francisco |
| Revenue Bonds |
| Series 2010A |
| 03/01/2040 | 5.125% | | 5,000,000 | 5,377,650 |
| Municipal Bonds (continued) |
| Issue Description | Coupon
Rate | | Principal
Amount ($) | Value ($) |
| Port of Los Angeles(c) |
| Refunding Revenue Bonds |
| Series 2014A AMT |
| 08/01/2044 | 5.000% | | 5,000,000 | 5,587,050 |
| Total | 10,964,700 |
| Prepaid Gas 0.3% |
| M-S-R Energy Authority |
| Revenue Bonds |
| Series 2009B |
| 11/01/2034 | 7.000% | | 1,000,000 | 1,427,860 |
| Refunded / Escrowed 7.2% |
| California State Public Works Board |
| Prerefunded 03/01/20 Revenue Bonds |
| Various Capital Projects |
| Subordinated Series 2010A-1 |
| 03/01/2035 | 6.000% | | 2,750,000 | 3,058,495 |
| City of Newport Beach |
| Prerefunded 12/01/21 Revenue Bonds |
| Hoag Memorial Hospital Presbyterian |
| Series 2011 |
| 12/01/2040 | 6.000% | | 1,000,000 | 1,183,560 |
| City of Pomona |
| Refunding Revenue Bonds |
| Series 1990B Escrowed to Maturity (GNMA / FHLMC) |
| 08/01/2023 | 7.500% | | 585,000 | 690,347 |
| City of Redding Electric System(g) |
| Revenue Bonds |
| Series 1992 Escrowed to Maturity (NPFGC) |
| 07/01/2022 | 11.049% | | 245,000 | 305,581 |
| County of Riverside(c) |
| Revenue Bonds |
| Series 1989A Escrowed to Maturity (GNMA) AMT |
| 05/01/2021 | 7.800% | | 2,500,000 | 3,041,350 |
| Imperial Irrigation District Electric System |
| Prerefunded 11/01/20 Revenue Bonds |
| Series 2011A |
| 11/01/2031 | 6.250% | | 1,000,000 | 1,150,790 |
| Oakland Unified School District/Alameda County |
| Prerefunded 08/01/21 Unlimited General Obligation Bonds |
| Election of 2012 |
| Series 2013 |
| 08/01/2030 | 6.250% | | 1,095,000 | 1,296,568 |
| Prerefunded 08/01/22 Unlimited General Obligation Bonds |
| Election of 2006 |
| Series 2012A |
| 08/01/2032 | 5.500% | | 1,500,000 | 1,786,035 |
The accompanying Notes to Financial Statements are an integral part of this statement.
Columbia California Tax-Exempt Fund | Annual Report 2017
| 11 |
Portfolio of Investments (continued)
October 31, 2017
| Municipal Bonds (continued) |
| Issue Description | Coupon
Rate | | Principal
Amount ($) | Value ($) |
| San Francisco City & County Redevelopment Agency |
| Prerefunded 08/01/19 Tax Allocation Bonds |
| Mission Bay North Redevelopment Project |
| Series 2009C |
| 08/01/2029 | 6.000% | | 1,035,000 | 1,124,010 |
| 08/01/2039 | 6.500% | | 2,625,000 | 2,873,430 |
| Mission Bay South Redevelopment Project |
| Series 2009D |
| 08/01/2029 | 6.375% | | 1,000,000 | 1,092,480 |
| San Joaquin Hills Transportation Corridor Agency(e) |
| Revenue Bonds |
| Senior Lien |
| Series 1993 Escrowed to Maturity |
| 01/01/2020 | 0.000% | | 12,000,000 | 11,683,320 |
| Santee CDC Successor Agency |
| Prerefunded 02/01/21 Tax Allocation Bonds |
| Santee Community Redevelopment Project |
| Series 2011A |
| 08/01/2031 | 7.000% | | 1,000,000 | 1,184,150 |
| State of California |
| Prerefunded 08/01/18 Unlimited General Obligation Bonds |
| Series 2008 |
| 08/01/2034 | 5.000% | | 1,315,000 | 1,354,134 |
| Union City Community Redevelopment Agency |
| Prerefunded 12/01/21 Subordinated Tax Allocation Bonds |
| Lien-Community Redevelopment Project |
| Series 2011 |
| 12/01/2033 | 6.875% | | 1,500,000 | 1,830,600 |
| Yorba Linda Redevelopment Agency Successor |
| Prerefunded 09/01/21 Subordinated Tax Allocation Bonds |
| Lien-Redevelopment Project |
| Series 2011A |
| 09/01/2026 | 6.000% | | 1,000,000 | 1,176,280 |
| 09/01/2032 | 6.500% | | 2,000,000 | 2,389,840 |
| Total | 37,220,970 |
| Resource Recovery 0.1% |
| California Municipal Finance Authority(c),(d),(h) |
| Revenue Bonds |
| UTS Renewable Energy-Waste Water Facilities |
| Series 2011 AMT |
| 12/01/2032 | 0.000% | | 2,745,000 | 411,750 |
| Retirement Communities 5.5% |
| ABAG Finance Authority for Nonprofit Corps. |
| Refunding Revenue Bonds |
| Episcopal Senior Communities |
| Series 2011 |
| 07/01/2031 | 6.000% | | 2,200,000 | 2,466,266 |
| Municipal Bonds (continued) |
| Issue Description | Coupon
Rate | | Principal
Amount ($) | Value ($) |
| California Health Facilities Financing Authority |
| Refunding Revenue Bonds |
| California-Nevada Methodist Homes |
| Series 2015 |
| 07/01/2045 | 5.000% | | 3,000,000 | 3,399,180 |
| Northern California Presbyterian Homes |
| Series 2015 |
| 07/01/2039 | 5.000% | | 2,565,000 | 2,934,565 |
| 07/01/2044 | 5.000% | | 700,000 | 796,215 |
| California Municipal Finance Authority |
| Refunding Revenue Bonds |
| Retirement Housing Foundation |
| Series 2017 |
| 11/15/2031 | 5.000% | | 1,500,000 | 1,849,350 |
| California Statewide Communities Development Authority |
| Refunding Revenue Bonds |
| 899 Charleston Project |
| Series 2014A |
| 11/01/2049 | 5.375% | | 1,885,000 | 2,020,437 |
| American Baptist Homes West |
| Series 2015 |
| 10/01/2045 | 5.000% | | 3,155,000 | 3,454,473 |
| Episcopal Communities and Services |
| Series 2012 |
| 05/15/2042 | 5.000% | | 4,235,000 | 4,634,911 |
| Front Porch Communities and Services |
| Series 2017 |
| 04/01/2047 | 5.000% | | 250,000 | 281,988 |
| Revenue Bonds |
| American Baptist Homes West |
| Series 2010 |
| 10/01/2039 | 6.250% | | 1,500,000 | 1,604,160 |
| Covenant Retirement Communities, Inc. |
| Series 2013 |
| 12/01/2036 | 5.625% | | 2,000,000 | 2,305,380 |
| Eskaton Properties, Inc. |
| Series 2012 |
| 11/15/2034 | 5.250% | | 1,250,000 | 1,364,650 |
| City of La Verne |
| Refunding Certificate of Participation |
| Brethren Hillcrest Homes |
| Series 2014 |
| 05/15/2036 | 5.000% | | 1,100,000 | 1,161,424 |
| Total | 28,272,999 |
| Sales Tax 1.1% |
| Riverside County Transportation Commission |
| Revenue Bonds |
| Limited Tax |
| Series 2010A |
| 06/01/2032 | 5.000% | | 5,000,000 | 5,469,250 |
The accompanying Notes to Financial Statements are an integral part of this statement.
| 12 | Columbia California Tax-Exempt Fund | Annual Report 2017 |
Portfolio of Investments (continued)
October 31, 2017
| Municipal Bonds (continued) |
| Issue Description | Coupon
Rate | | Principal
Amount ($) | Value ($) |
| Special Property Tax 13.8% |
| Bakersfield Redevelopment Agency |
| Tax Allocation Bonds |
| Old Town Kern Pioneer |
| Series 2009A |
| 08/01/2029 | 7.500% | | 1,505,000 | 1,588,994 |
| Southeast Bakersfield |
| Series 2009B |
| 08/01/2029 | 7.250% | | 705,000 | 743,726 |
| Carson Redevelopment Agency Successor Agency |
| Tax Allocation Bonds |
| Housing |
| Series 2010A |
| 10/01/2030 | 5.000% | | 5,000,000 | 5,440,250 |
| Cerritos Public Financing Authority |
| Tax Allocation Bonds |
| Los Coyotes Redevelopment Project Loan |
| Series 1993A (AMBAC) |
| 11/01/2023 | 6.500% | | 2,000,000 | 2,415,800 |
| Chino Public Financing Authority |
| Refunding Special Tax Bonds |
| Series 2012 |
| 09/01/2030 | 5.000% | | 2,500,000 | 2,683,600 |
| 09/01/2038 | 5.000% | | 625,000 | 659,475 |
| Chula Vista Municipal Financing Authority |
| Refunding Special Tax Bonds |
| Series 2015A |
| 09/01/2035 | 5.000% | | 2,460,000 | 2,730,280 |
| 09/01/2036 | 5.000% | | 2,435,000 | 2,697,225 |
| City of Carson |
| Special Assessment Bonds |
| Assessment District No. 92-1 |
| Series 1992 |
| 09/02/2022 | 7.375% | | 65,000 | 66,099 |
| City of Irvine |
| Special Tax Bonds |
| Community Facilities District 2013-3 |
| Series 2014 |
| 09/01/2039 | 5.000% | | 750,000 | 816,840 |
| 09/01/2044 | 5.000% | | 1,025,000 | 1,111,807 |
| City of Palo Alto |
| Refunding & Improvement Special Assessment Bonds |
| Limited Obligation-University Ave. |
| Series 2012 |
| 09/02/2029 | 5.000% | | 800,000 | 885,496 |
| City of Yucaipa |
| Refunding Special Tax Bonds |
| Community Facilities District No. 98-1 |
| Series 2011 |
| 09/01/2030 | 5.375% | | 1,500,000 | 1,637,595 |
| Municipal Bonds (continued) |
| Issue Description | Coupon
Rate | | Principal
Amount ($) | Value ($) |
| Corona-Norco Unified School District |
| Refunding Special Tax Bonds |
| Community Facilities District #98-1 |
| Series 2013 |
| 09/01/2032 | 5.000% | | 1,300,000 | 1,449,123 |
| Elk Grove Unified School District(e) |
| Refunding Special Tax Bonds |
| Capital Appreciation-Community Facilities District No. 1 |
| Series 1995 (AMBAC) |
| 12/01/2018 | 0.000% | | 2,720,000 | 2,661,846 |
| Elk Grove Unified School District |
| Refunding Special Tax Bonds |
| Community Facilities District No. 1 |
| Series 1995 (AMBAC) |
| 12/01/2024 | 6.500% | | 3,000,000 | 3,481,770 |
| Inglewood Redevelopment Agency Successor Agency |
| Refunding Tax Allocation Bonds |
| Merged Redevelopment Project |
| Series 1998A (AMBAC) |
| 05/01/2023 | 5.250% | | 2,100,000 | 2,280,138 |
| Inland Valley Development Agency |
| Refunding Tax Allocation Bonds |
| Series 2014A |
| 09/01/2044 | 5.000% | | 5,000,000 | 5,551,150 |
| Jurupa Public Financing Authority |
| Refunding Special Tax Bonds |
| Series 2014A |
| 09/01/2042 | 5.000% | | 1,000,000 | 1,127,920 |
| Los Angeles Community Redevelopment Agency |
| Tax Allocation Bonds |
| Hollywood Redevelopment Project |
| Series 1998C (NPFGC) |
| 07/01/2018 | 5.375% | | 1,665,000 | 1,704,627 |
| Mountain View Shoreline Regional Park Community |
| Tax Allocation Bonds |
| Series 2011A |
| 08/01/2035 | 5.625% | | 1,300,000 | 1,479,361 |
| 08/01/2040 | 5.750% | | 2,000,000 | 2,288,880 |
| Oakdale Public Financing Authority |
| Tax Allocation Bonds |
| Central City Redevelopment Project |
| Series 2004 |
| 06/01/2033 | 5.375% | | 1,500,000 | 1,500,345 |
| Pittsburg Successor Agency Redevelopment Agency(e) |
| Tax Allocation Bonds |
| Los Medanos Community Development Project |
| Series 1999 (AMBAC) |
| 08/01/2024 | 0.000% | | 2,100,000 | 1,766,457 |
The accompanying Notes to Financial Statements are an integral part of this statement.
Columbia California Tax-Exempt Fund | Annual Report 2017
| 13 |
Portfolio of Investments (continued)
October 31, 2017
| Municipal Bonds (continued) |
| Issue Description | Coupon
Rate | | Principal
Amount ($) | Value ($) |
| Poway Unified School District |
| Special Tax Bonds |
| Community Facilities District No. 6-4S Ranch |
| Series 2012 |
| 09/01/2031 | 5.000% | | 1,355,000 | 1,482,993 |
| Poway Unified School District Public Financing Authority |
| Special Tax Refunding Bonds |
| Series 2015B (BAM) |
| 09/01/2035 | 5.000% | | 1,435,000 | 1,638,210 |
| Riverside County Public Financing Authority |
| Tax Allocation Bonds |
| Series 2017A (BAM) |
| 10/01/2040 | 4.000% | | 1,250,000 | 1,319,113 |
| Riverside Public Financing Authority |
| Unrefunded Revenue Bonds |
| Multiple Loans |
| Series 1991A |
| 02/01/2018 | 8.000% | | 5,000 | 5,072 |
| San Diego Redevelopment Agency Successor Agency(e) |
| Tax Allocation Bonds |
| Capital Appreciation |
| Series 2001 (AGM) |
| 09/01/2020 | 0.000% | | 3,630,000 | 3,475,761 |
| San Francisco City & County Redevelopment Agency |
| Tax Allocation Bonds |
| Mission Bay South Redevelopment Project |
| Series 2014A |
| 08/01/2043 | 5.000% | | 1,000,000 | 1,133,050 |
| San Francisco Redevelopment Projects |
| Series 2009B |
| 08/01/2028 | 6.125% | | 1,010,000 | 1,094,072 |
| 08/01/2032 | 6.500% | | 500,000 | 545,490 |
| Series 2011B |
| 08/01/2026 | 6.125% | | 500,000 | 576,455 |
| 08/01/2031 | 6.250% | | 2,600,000 | 3,009,656 |
| 08/01/2041 | 6.625% | | 1,600,000 | 1,861,104 |
| Santa Monica Redevelopment Agency |
| Tax Allocation Bonds |
| Earthquake Recovery Redevelopment |
| Series 2011 |
| 07/01/2036 | 5.875% | | 1,250,000 | 1,445,675 |
| Sulphur Springs Union School District |
| Unrefunded Special Tax Bonds |
| Community Facilities District |
| Series 2012 |
| 09/01/2030 | 5.000% | | 640,000 | 705,005 |
| 09/01/2031 | 5.000% | | 685,000 | 753,596 |
| 09/01/2033 | 5.000% | | 505,000 | 552,223 |
| Municipal Bonds (continued) |
| Issue Description | Coupon
Rate | | Principal
Amount ($) | Value ($) |
| Temecula Redevelopment Agency |
| Tax Allocation Bonds |
| Housing Redevelopment Project No. 1 |
| Series 2011A |
| 08/01/2039 | 7.000% | | 2,100,000 | 2,482,620 |
| Total | 70,848,899 |
| State Appropriated 6.3% |
| California State Public Works Board |
| Refunding Revenue Bonds |
| Various Capital Projects |
| Series 2012G |
| 11/01/2029 | 5.000% | | 2,500,000 | 2,880,700 |
| 11/01/2037 | 5.000% | | 6,825,000 | 7,790,601 |
| Revenue Bonds |
| Judicial Council Projects |
| Series 2011D |
| 12/01/2031 | 5.000% | | 5,100,000 | 5,743,518 |
| Series 2013A |
| 03/01/2032 | 5.000% | | 1,500,000 | 1,713,360 |
| 03/01/2038 | 5.000% | | 2,500,000 | 2,831,375 |
| Series 2014B |
| 10/01/2039 | 5.000% | | 1,000,000 | 1,153,690 |
| Various Capital Projects |
| Series 2011A |
| 10/01/2031 | 5.125% | | 5,000,000 | 5,631,550 |
| Various Correctional Facilities |
| Series 2014A |
| 09/01/2039 | 5.000% | | 3,895,000 | 4,486,962 |
| Total | 32,231,756 |
| State General Obligation 7.4% |
| State of California |
| Unlimited General Obligation Bonds |
| Various Purpose |
| Series 2009 |
| 10/01/2029 | 5.000% | | 3,000,000 | 3,216,210 |
| 04/01/2031 | 5.750% | | 2,750,000 | 2,934,525 |
| 04/01/2035 | 6.000% | | 4,000,000 | 4,277,120 |
| 04/01/2038 | 6.000% | | 10,500,000 | 11,218,200 |
| 11/01/2039 | 5.500% | | 4,965,000 | 5,393,331 |
| Series 2010 |
| 03/01/2030 | 5.250% | | 1,000,000 | 1,091,820 |
| 03/01/2033 | 6.000% | | 4,000,000 | 4,452,640 |
| 03/01/2040 | 5.500% | | 4,800,000 | 5,263,536 |
| Unrefunded Unlimited General Obligation Bonds |
| Series 2004 |
| 04/01/2029 | 5.300% | | 2,000 | 2,007 |
| Total | 37,849,389 |
The accompanying Notes to Financial Statements are an integral part of this statement.
| 14 | Columbia California Tax-Exempt Fund | Annual Report 2017 |
Portfolio of Investments (continued)
October 31, 2017
| Municipal Bonds (continued) |
| Issue Description | Coupon
Rate | | Principal
Amount ($) | Value ($) |
| Tobacco 0.2% |
| Golden State Tobacco Securitization Corp. |
| Refunding Revenue Bonds |
| Series 2017A-1 |
| 06/01/2029 | 5.000% | | 1,000,000 | 1,164,530 |
| Turnpike / Bridge / Toll Road 4.1% |
| Bay Area Toll Authority |
| Refunding Revenue Bonds |
| Subordinated Series 2017 |
| 04/01/2042 | 4.000% | | 3,500,000 | 3,705,520 |
| Foothill-Eastern Transportation Corridor Agency |
| Refunding Revenue Bonds |
| Series 2014A |
| 01/15/2046 | 5.750% | | 2,850,000 | 3,313,210 |
| Foothill-Eastern Transportation Corridor Agency(e) |
| Refunding Revenue Bonds |
| Series 2015 |
| 01/15/2033 | 0.000% | | 5,000,000 | 2,606,950 |
| Riverside County Transportation Commission(e) |
| Revenue Bonds |
| Capital Appreciation-Senior Lien |
| Series 2013B |
| 06/01/2032 | 0.000% | | 2,055,000 | 1,113,029 |
| 06/01/2033 | 0.000% | | 2,940,000 | 1,512,895 |
| Senior Lien |
| Series 2013B |
| 06/01/2029 | 0.000% | | 2,500,000 | 1,574,975 |
| Riverside County Transportation Commission |
| Revenue Bonds |
| Senior Lien |
| Series 2013A |
| 06/01/2048 | 5.750% | | 1,500,000 | 1,679,385 |
| Municipal Bonds (continued) |
| Issue Description | Coupon
Rate | | Principal
Amount ($) | Value ($) |
| San Joaquin Hills Transportation Corridor Agency |
| Refunding Revenue Bonds |
| Senior Lien |
| Series 2014A |
| 01/15/2044 | 5.000% | | 5,000,000 | 5,513,750 |
| Total | 21,019,714 |
| Water & Sewer 1.2% |
| City of Riverside Sewer |
| Refunding Revenue Bonds |
| Series 2015A |
| 08/01/2040 | 5.000% | | 3,185,000 | 3,653,099 |
| City of Tulare Sewer |
| Refunding Revenue Bonds |
| Series 2015 (AGM) |
| 11/15/2041 | 5.000% | | 2,000,000 | 2,302,220 |
| Total | 5,955,319 |
Total Municipal Bonds
(Cost $471,802,884) | 505,298,529 |
| Money Market Funds 0.0% |
| | Shares | Value ($) |
| Dreyfus Tax-Exempt Cash Management Fund, Institutional Shares, 0.680%(i) | 128,988 | 128,988 |
Total Money Market Funds
(Cost $128,988) | 128,988 |
Total Investments
(Cost: $474,281,872) | 507,777,517 |
| Other Assets & Liabilities, Net | | 5,432,297 |
| Net Assets | 513,209,814 |
Notes to Portfolio of Investments
| (a) | The Fund is entitled to receive principal and interest from the guarantor after a day or a week’s notice or upon maturity. The maturity date disclosed represents the final maturity. |
| (b) | Represents a variable rate demand note where the coupon rate adjusts on specified dates (generally daily or weekly) using the prevailing money market rate. |
| (c) | Income from this security may be subject to alternative minimum tax. |
| (d) | Represents privately placed and other securities and instruments exempt from SEC registration (collectively, private placements), such as Section 4(a)(2) and Rule 144A eligible securities, which are often sold only to qualified institutional buyers. The Fund may invest in private placements determined to be liquid as well as those determined to be illiquid. Private placements may be determined to be liquid under guidelines established by the Fund’s Board of Trustees. At October 31, 2017, the value of these securities amounted to $24,754,319, which represents 4.82% of net assets. |
| (e) | Zero coupon bond. |
| (f) | Represents a security purchased on a when-issued basis. |
| (g) | Represents a step bond where the coupon rate adjusts according to a schedule for a series of periods, typically lower for an initial period and then increasing to a higher coupon rate thereafter. |
| (h) | Represents securities that have defaulted on payment of interest. The Fund has stopped accruing interest on these securities. At October 31, 2017, the value of these securities amounted to $411,750, which represents 0.08% of net assets. |
| (i) | The rate shown is the seven-day current annualized yield at October 31, 2017. |
The accompanying Notes to Financial Statements are an integral part of this statement.
Columbia California Tax-Exempt Fund | Annual Report 2017
| 15 |
Portfolio of Investments (continued)
October 31, 2017
Abbreviation Legend
| AGM | Assured Guaranty Municipal Corporation |
| AMBAC | Ambac Assurance Corporation |
| AMT | Alternative Minimum Tax |
| BAM | Build America Mutual Assurance Co. |
| FHLMC | Federal Home Loan Mortgage Corporation |
| GNMA | Government National Mortgage Association |
| NPFGC | National Public Finance Guarantee Corporation |
| VRDN | Variable Rate Demand Note |
Fair value measurements
The Fund categorizes its fair value measurements according to a three-level hierarchy that maximizes the use of observable inputs and minimizes the use of unobservable inputs by prioritizing that the most observable input be used when available. Observable inputs are those that market participants would use in pricing an investment based on market data obtained from sources independent of the reporting entity. Unobservable inputs are those that reflect the Fund’s assumptions about the information market participants would use in pricing an investment. An investment’s level within the fair value hierarchy is based on the lowest level of any input that is deemed significant to the asset’s or liability’s fair value measurement. The input levels are not necessarily an indication of the risk or liquidity associated with investments at that level. For example, certain U.S. government securities are generally high quality and liquid, however, they are reflected as Level 2 because the inputs used to determine fair value may not always be quoted prices in an active market.
Fair value inputs are summarized in the three broad levels listed below:
| • | Level 1 – Valuations based on quoted prices for investments in active markets that the Fund has the ability to access at the measurement date. Valuation adjustments are not applied to Level 1 investments. |
| • | Level 2 – Valuations based on other significant observable inputs (including quoted prices for similar securities, interest rates, prepayment speeds, credit risks, etc.). |
| • | Level 3 – Valuations based on significant unobservable inputs (including the Fund’s own assumptions and judgment in determining the fair value of investments). |
Inputs that are used in determining fair value of an investment may include price information, credit data, volatility statistics, and other factors. These inputs can be either observable or unobservable. The availability of observable inputs can vary between investments, and is affected by various factors such as the type of investment, and the volume and level of activity for that investment or similar investments in the marketplace. The inputs will be considered by the Investment Manager, along with any other relevant factors in the calculation of an investment’s fair value. The Fund uses prices and inputs that are current as of the measurement date, which may include periods of market dislocations. During these periods, the availability of prices and inputs may be reduced for many investments. This condition could cause an investment to be reclassified between the various levels within the hierarchy.
Investments falling into the Level 3 category are primarily supported by quoted prices from brokers and dealers participating in the market for those investments. However, these may be classified as Level 3 investments due to lack of market transparency and corroboration to support these quoted prices. Additionally, valuation models may be used as the pricing source for any remaining investments classified as Level 3. These models may rely on one or more significant unobservable inputs and/or significant assumptions by the Investment Manager. Inputs used in valuations may include, but are not limited to, financial statement analysis, capital account balances, discount rates and estimated cash flows, and comparable company data.
Under the direction of the Fund’s Board of Trustees (the Board), the Investment Manager’s Valuation Committee (the Committee) is responsible for overseeing the valuation procedures approved by the Board. The Committee consists of voting and non-voting members from various groups within the Investment Manager’s organization, including operations and accounting, trading and investments, compliance, risk management and legal.
The Committee meets at least monthly to review and approve valuation matters, which may include a description of specific valuation determinations, data regarding pricing information received from approved pricing vendors and brokers and the results of Board-approved valuation control policies and procedures (the Policies). The Policies address, among other things, instances when market quotations are or are not readily available, including recommendations of third party pricing vendors and a determination of appropriate pricing methodologies; events that require specific valuation determinations and assessment of fair value techniques; securities with a potential for stale pricing, including those that are illiquid, restricted, or in default; and the effectiveness of third party pricing vendors, including periodic reviews of vendors. The Committee meets more frequently, as needed, to discuss additional valuation matters, which may include the need to review back-testing results, review time-sensitive information or approve related valuation actions. The Committee reports to the Board, with members of the Committee meeting with the Board at each of its regularly scheduled meetings to discuss valuation matters and actions during the period, similar to those described earlier.
For investments categorized as Level 3, the Committee monitors information similar to that described above, which may include: (i) data specific to the issuer or comparable issuers, (ii) general market or specific sector news and (iii) quoted prices and specific or similar security transactions. The Committee considers this data and any changes from prior periods in order to assess the reasonableness of observable and unobservable inputs, any assumptions or internal models used to value those securities and changes in fair value. This data is also used to corroborate, when available, information received from approved pricing vendors and brokers. Various factors impact the frequency of monitoring this information (which may occur as often as daily). However, the Committee may determine that changes to inputs, assumptions and models are not required as a result of the monitoring procedures performed.
The following table is a summary of the inputs used to value the Fund’s investments at October 31, 2017:
The accompanying Notes to Financial Statements are an integral part of this statement.
| 16 | Columbia California Tax-Exempt Fund | Annual Report 2017 |
Portfolio of Investments (continued)
October 31, 2017
Fair value measurements (continued)
| | Level 1
quoted prices in active
markets for identical
assets ($) | Level 2
other significant
observable inputs ($) | Level 3
significant
unobservable inputs ($) | Total ($) |
| Investments | | | | |
| Floating Rate Notes | — | 2,350,000 | — | 2,350,000 |
| Municipal Bonds | — | 505,298,529 | — | 505,298,529 |
| Money Market Funds | 128,988 | — | — | 128,988 |
| Total Investments | 128,988 | 507,648,529 | — | 507,777,517 |
See the Portfolio of Investments for all investment classifications not indicated in the table.
The Fund’s assets assigned to the Level 2 input category are generally valued using the market approach, in which a security’s value is determined through reference to prices and information from market transactions for similar or identical assets.
There were no transfers of financial assets between levels during the period.
The accompanying Notes to Financial Statements are an integral part of this statement.
Columbia California Tax-Exempt Fund | Annual Report 2017
| 17 |
Statement of Assets and Liabilities
October 31, 2017
| Assets | |
| Investments in unaffiliated issuers, at cost | $474,281,872 |
| Investments in unaffiliated issuers, at value | 507,777,517 |
| Cash | 12,299 |
| Receivable for: | |
| Investments sold | 225,500 |
| Capital shares sold | 2,428,399 |
| Regulatory settlements (Note 6) | 312,081 |
| Interest | 5,914,458 |
| Prepaid expenses | 2,839 |
| Trustees’ deferred compensation plan | 79,628 |
| Total assets | 516,752,721 |
| Liabilities | |
| Payable for: | |
| Investments purchased on a delayed delivery basis | 1,012,850 |
| Capital shares purchased | 792,154 |
| Distributions to shareholders | 1,542,202 |
| Management services fees | 6,537 |
| Distribution and/or service fees | 3,209 |
| Transfer agent fees | 28,892 |
| Compensation of board members | 30,316 |
| Compensation of chief compliance officer | 20 |
| Other expenses | 47,099 |
| Trustees’ deferred compensation plan | 79,628 |
| Total liabilities | 3,542,907 |
| Net assets applicable to outstanding capital stock | $513,209,814 |
| Represented by | |
| Paid in capital | 477,676,856 |
| Undistributed net investment income | 402,525 |
| Accumulated net realized gain | 1,634,788 |
| Unrealized appreciation (depreciation) on: | |
| Investments - unaffiliated issuers | 33,495,645 |
| Total - representing net assets applicable to outstanding capital stock | $513,209,814 |
The accompanying Notes to Financial Statements are an integral part of this statement.
| 18 | Columbia California Tax-Exempt Fund | Annual Report 2017 |
Statement of Assets and Liabilities (continued)
October 31, 2017
| Class A | |
| Net assets | $339,354,050 |
| Shares outstanding | 43,977,396 |
| Net asset value per share | $7.72 |
| Maximum offering price per share(a) | $7.96 |
| Class C | |
| Net assets | $46,521,143 |
| Shares outstanding | 6,027,711 |
| Net asset value per share | $7.72 |
| Class R4 | |
| Net assets | $3,231,062 |
| Shares outstanding | 418,598 |
| Net asset value per share | $7.72 |
| Class R5 | |
| Net assets | $77,869 |
| Shares outstanding | 10,074 |
| Net asset value per share | $7.73 |
| Class Y | |
| Net assets | $3,186,947 |
| Shares outstanding | 410,799 |
| Net asset value per share | $7.76 |
| Class Z | |
| Net assets | $120,838,743 |
| Shares outstanding | 15,653,633 |
| Net asset value per share | $7.72 |
| (a) | The maximum offering price per share is calculated by dividing the net asset value per share by 1.0 minus the maximum sales charge of 3.00% for Class A shares. |
The accompanying Notes to Financial Statements are an integral part of this statement.
Columbia California Tax-Exempt Fund | Annual Report 2017
| 19 |
Statement of Operations
Year Ended October 31, 2017
| Net investment income | |
| Income: | |
| Dividends — unaffiliated issuers | $3,988 |
| Interest | 22,907,039 |
| Total income | 22,911,027 |
| Expenses: | |
| Management services fees | 2,411,432 |
| Distribution and/or service fees | |
| Class A | 867,098 |
| Class B(a) | 658 |
| Class C | 494,522 |
| Transfer agent fees | |
| Class A | 285,733 |
| Class B(a) | 57 |
| Class C | 40,785 |
| Class R4 | 1,135 |
| Class R5 | 519 |
| Class Y(b) | 48 |
| Class Z | 97,760 |
| Compensation of board members | 31,329 |
| Custodian fees | 4,623 |
| Printing and postage fees | 31,005 |
| Registration fees | 25,287 |
| Audit fees | 31,925 |
| Legal fees | 14,791 |
| Compensation of chief compliance officer | 222 |
| Other | (2,181) |
| Total expenses | 4,336,748 |
| Fees waived or expenses reimbursed by Investment Manager and its affiliates | (75,096) |
| Fees waived by distributor | |
| Class C | (148,406) |
| Expense reduction | (420) |
| Total net expenses | 4,112,826 |
| Net investment income | 18,798,201 |
| Realized and unrealized gain (loss) — net | |
| Net realized gain (loss) on: | |
| Investments — unaffiliated issuers | 2,292,212 |
| Net realized gain | 2,292,212 |
| Net change in unrealized appreciation (depreciation) on: | |
| Investments — unaffiliated issuers | (14,628,267) |
| Net change in unrealized appreciation (depreciation) | (14,628,267) |
| Net realized and unrealized loss | (12,336,055) |
| Net increase in net assets resulting from operations | $6,462,146 |
| (a) | Effective July 17, 2017, Class B shares were automatically converted to Class A shares. |
| (b) | Class Y shares are based on operations from March 1, 2017 (commencement of operations) through the stated period end. |
The accompanying Notes to Financial Statements are an integral part of this statement.
| 20 | Columbia California Tax-Exempt Fund | Annual Report 2017 |
Statement of Changes in Net Assets
| | Year Ended
October 31, 2017 (a) | Year Ended
October 31, 2016 (b) |
| Operations | | |
| Net investment income | $18,798,201 | $19,999,242 |
| Net realized gain | 2,292,212 | 3,344,475 |
| Net change in unrealized appreciation (depreciation) | (14,628,267) | 1,598,559 |
| Net increase in net assets resulting from operations | 6,462,146 | 24,942,276 |
| Distributions to shareholders | | |
| Net investment income | | |
| Class A | (12,539,569) | (13,937,637) |
| Class B(c) | (1,944) | (3,769) |
| Class C | (1,565,900) | (1,567,080) |
| Class R4 | (54,996) | (16,967) |
| Class R5 | (31,011) | (9,513) |
| Class Y | (13,192) | — |
| Class Z | (4,596,446) | (4,409,285) |
| Net realized gains | | |
| Class A | (2,430,270) | (2,050,395) |
| Class B(c) | (779) | (910) |
| Class C | (347,347) | (243,033) |
| Class R4 | (5,881) | (665) |
| Class R5 | (8,670) | — |
| Class Z | (764,897) | (595,377) |
| Total distributions to shareholders | (22,360,902) | (22,834,631) |
| Increase (decrease) in net assets from capital stock activity | (33,464,567) | 38,808,159 |
| Total increase (decrease) in net assets | (49,363,323) | 40,915,804 |
| Net assets at beginning of year | 562,573,137 | 521,657,333 |
| Net assets at end of year | $513,209,814 | $562,573,137 |
| Undistributed net investment income | $402,525 | $407,385 |
| (a) | Class Y shares are based on operations from March 1, 2017 (commencement of operations) through the stated period end. |
| (b) | Class R5 shares are based on operations from March 1, 2016 (commencement of operations) through the stated period end. |
| (c) | Effective July 17, 2017, Class B shares were automatically converted to Class A shares. |
The accompanying Notes to Financial Statements are an integral part of this statement.
Columbia California Tax-Exempt Fund | Annual Report 2017
| 21 |
Statement of Changes in Net Assets (continued)
| | Year Ended | Year Ended |
| | October 31, 2017 (a) | October 31, 2016 (b) |
| | Shares | Dollars ($) | Shares | Dollars ($) |
| Capital stock activity |
| Class A(c) | | | | |
| Subscriptions (d) | 3,957,900 | 30,367,387 | 5,768,824 | 46,251,142 |
| Distributions reinvested | 1,626,928 | 12,423,874 | 1,600,916 | 12,796,334 |
| Redemptions | (10,172,978) | (77,679,469) | (5,753,148) | (46,263,137) |
| Net increase (decrease) | (4,588,150) | (34,888,208) | 1,616,592 | 12,784,339 |
| Class B(c) | | | | |
| Subscriptions | 76 | 581 | 2,319 | 18,508 |
| Distributions reinvested | 231 | 1,752 | 421 | 3,357 |
| Redemptions (d) | (15,663) | (120,163) | (8,611) | (68,217) |
| Net decrease | (15,356) | (117,830) | (5,871) | (46,352) |
| Class C | | | | |
| Subscriptions | 938,044 | 7,182,268 | 1,986,190 | 15,954,144 |
| Distributions reinvested | 163,113 | 1,245,574 | 136,650 | 1,092,996 |
| Redemptions | (1,940,048) | (14,868,904) | (797,901) | (6,392,364) |
| Net increase (decrease) | (838,891) | (6,441,062) | 1,324,939 | 10,654,776 |
| Class R4 | | | | |
| Subscriptions | 363,577 | 2,808,130 | 116,357 | 940,995 |
| Distributions reinvested | 7,858 | 60,345 | 2,137 | 17,165 |
| Redemptions | (81,470) | (621,768) | (5,071) | (40,711) |
| Net increase | 289,965 | 2,246,707 | 113,423 | 917,449 |
| Class R5 | | | | |
| Subscriptions | 4,402 | 33,365 | 169,675 | 1,381,189 |
| Distributions reinvested | 5,159 | 39,244 | 1,155 | 9,255 |
| Redemptions | (169,162) | (1,305,541) | (1,155) | (9,255) |
| Net increase (decrease) | (159,601) | (1,232,932) | 169,675 | 1,381,189 |
| Class Y | | | | |
| Subscriptions | 411,114 | 3,201,728 | — | — |
| Distributions reinvested | 1,666 | 12,932 | — | — |
| Redemptions | (1,981) | (15,392) | — | — |
| Net increase | 410,799 | 3,199,268 | — | — |
| Class Z | | | | |
| Subscriptions | 5,916,743 | 45,191,723 | 3,811,989 | 30,690,415 |
| Distributions reinvested | 273,760 | 2,095,923 | 172,140 | 1,377,822 |
| Redemptions | (5,673,586) | (43,518,156) | (2,365,297) | (18,951,479) |
| Net increase | 516,917 | 3,769,490 | 1,618,832 | 13,116,758 |
| Total net increase (decrease) | (4,384,317) | (33,464,567) | 4,837,590 | 38,808,159 |
| (a) | Class Y shares are based on operations from March 1, 2017 (commencement of operations) through the stated period end. |
| (b) | Class R5 shares are based on operations from March 1, 2016 (commencement of operations) through the stated period end. |
| (c) | Effective July 17, 2017, Class B shares were automatically converted to Class A shares. |
| (d) | Includes conversions of Class B shares to Class A shares, if any. |
The accompanying Notes to Financial Statements are an integral part of this statement.
| 22 | Columbia California Tax-Exempt Fund | Annual Report 2017 |
[THIS PAGE INTENTIONALLY LEFT BLANK]
Columbia California Tax-Exempt Fund | Annual Report 2017
| 23 |
The following table is intended to help you understand the Fund’s financial performance. Certain information reflects financial results for a single share of a class held for the periods shown. Per share net investment income (loss) amounts are calculated based on average shares outstanding during the period. Total return assumes reinvestment of all dividends and distributions, if any. Total return does not reflect payment of sales charges, if any. Total return and portfolio turnover are not annualized for periods of less than one year. The portfolio turnover rate is calculated without regard to purchase and sales transactions of short-term instruments and certain derivatives, if any. If such transactions were included, the Fund’s portfolio turnover rate may be higher.
| Year ended | Net asset value,
beginning of
period | Net
investment
income | Net
realized
and
unrealized
gain (loss) | Total from
investment
operations | Distributions
from net
investment
income | Distributions
from net
realized
gains |
| Class A |
| 10/31/2017 | $7.94 | 0.28 | (0.17) | 0.11 | (0.28) | (0.05) |
| 10/31/2016 | $7.90 | 0.29 | 0.08 | 0.37 | (0.29) | (0.04) |
| 10/31/2015 | $7.99 | 0.30 | (0.05) | 0.25 | (0.30) | (0.04) |
| 10/31/2014 | $7.54 | 0.31 | 0.51 | 0.82 | (0.31) | (0.06) |
| 10/31/2013 | $7.99 | 0.31 | (0.45) | (0.14) | (0.30) | (0.01) |
| Class C |
| 10/31/2017 | $7.94 | 0.24 | (0.17) | 0.07 | (0.24) | (0.05) |
| 10/31/2016 | $7.90 | 0.25 | 0.09 | 0.34 | (0.26) | (0.04) |
| 10/31/2015 | $7.99 | 0.27 | (0.06) | 0.21 | (0.26) | (0.04) |
| 10/31/2014 | $7.54 | 0.28 | 0.51 | 0.79 | (0.28) | (0.06) |
| 10/31/2013 | $7.99 | 0.27 | (0.44) | (0.17) | (0.27) | (0.01) |
| Class R4 |
| 10/31/2017 | $7.94 | 0.29 | (0.16) | 0.13 | (0.30) | (0.05) |
| 10/31/2016 | $7.90 | 0.31 | 0.08 | 0.39 | (0.31) | (0.04) |
| 10/31/2015 | $7.99 | 0.32 | (0.05) | 0.27 | (0.32) | (0.04) |
| 10/31/2014 | $7.55 | 0.33 | 0.50 | 0.83 | (0.33) | (0.06) |
| 10/31/2013 (g) | $7.97 | 0.20 | (0.42) | (0.22) | (0.20) | — |
| Class R5 |
| 10/31/2017 | $7.95 | 0.30 | (0.17) | 0.13 | (0.30) | (0.05) |
| 10/31/2016 (i) | $7.96 | 0.21 | (0.01) (j) | 0.20 | (0.21) | — |
| Class Y |
| 10/31/2017 (k) | $7.63 | 0.20 | 0.13 (j) | 0.33 | (0.20) | — |
The accompanying Notes to Financial Statements are an integral part of this statement.
| 24 | Columbia California Tax-Exempt Fund | Annual Report 2017 |
Total
distributions to
shareholders | Proceeds from
regulatory
settlements | Net
asset
value,
end of
period | Total
return | Total gross
expense
ratio to
average
net assets(a) | Total net
expense
ratio to
average
net assets(a),(b) | Net investment
income
ratio to
average
net assets | Portfolio
turnover | Net
assets,
end of
period
(000’s) |
| |
| (0.33) | — | $7.72 | 1.49% | 0.82% (c) | 0.81% (c),(d) | 3.61% | 17% | $339,354 |
| (0.33) | — | $7.94 | 4.78% | 0.87% | 0.81% (d) | 3.62% | 13% | $385,410 |
| (0.34) | 0.00 (e) | $7.90 | 3.16% (f) | 0.88% | 0.79% (d) | 3.81% | 12% | $370,795 |
| (0.37) | — | $7.99 | 11.22% | 0.88% | 0.79% (d) | 4.05% | 14% | $359,825 |
| (0.31) | — | $7.54 | (1.80%) | 0.87% | 0.78% (d) | 3.91% | 14% | $357,344 |
| |
| (0.29) | — | $7.72 | 1.03% | 1.57% (c) | 1.26% (c),(d) | 3.16% | 17% | $46,521 |
| (0.30) | — | $7.94 | 4.31% | 1.62% | 1.26% (d) | 3.16% | 13% | $54,502 |
| (0.30) | 0.00 (e) | $7.90 | 2.70% (f) | 1.63% | 1.24% (d) | 3.36% | 12% | $43,775 |
| (0.34) | — | $7.99 | 10.72% | 1.63% | 1.24% (d) | 3.59% | 14% | $41,962 |
| (0.28) | — | $7.54 | (2.24%) | 1.62% | 1.23% (d) | 3.46% | 14% | $39,465 |
| |
| (0.35) | — | $7.72 | 1.75% | 0.57% (c) | 0.56% (c),(d) | 3.82% | 17% | $3,231 |
| (0.35) | — | $7.94 | 5.04% | 0.63% | 0.57% (d) | 3.87% | 13% | $1,021 |
| (0.36) | 0.00 (e) | $7.90 | 3.42% (f) | 0.63% | 0.54% (d) | 4.05% | 12% | $120 |
| (0.39) | — | $7.99 | 11.35% | 0.62% | 0.54% (d) | 4.25% | 14% | $22 |
| (0.20) | — | $7.55 | (2.75%) | 0.60% (h) | 0.53% (d),(h) | 4.32% (h) | 14% | $2 |
| |
| (0.35) | — | $7.73 | 1.75% | 0.55% (c) | 0.53% (c) | 3.95% | 17% | $78 |
| (0.21) | — | $7.95 | 2.45% | 0.55% (h) | 0.52% (h) | 4.01% (h) | 13% | $1,349 |
| |
| (0.20) | — | $7.76 | 4.34% | 0.52% (h) | 0.51% (h) | 3.93% (h) | 17% | $3,187 |
Columbia California Tax-Exempt Fund | Annual Report 2017
| 25 |
Financial Highlights (continued)
| Year ended | Net asset value,
beginning of
period | Net
investment
income | Net
realized
and
unrealized
gain (loss) | Total from
investment
operations | Distributions
from net
investment
income | Distributions
from net
realized
gains |
| Class Z |
| 10/31/2017 | $7.94 | 0.30 | (0.17) | 0.13 | (0.30) | (0.05) |
| 10/31/2016 | $7.90 | 0.31 | 0.08 | 0.39 | (0.31) | (0.04) |
| 10/31/2015 | $7.99 | 0.32 | (0.05) | 0.27 | (0.32) | (0.04) |
| 10/31/2014 | $7.55 | 0.33 | 0.50 | 0.83 | (0.33) | (0.06) |
| 10/31/2013 | $8.00 | 0.33 | (0.45) | (0.12) | (0.32) | (0.01) |
| Notes to Financial Highlights |
| (a) | In addition to the fees and expenses that the Fund bears directly, the Fund indirectly bears a pro rata share of the fees and expenses of any other funds in which it invests. Such indirect expenses are not included in the Fund’s reported expense ratios. |
| (b) | Total net expenses include the impact of certain fee waivers/expense reimbursements made by the Investment Manager and certain of its affiliates, if applicable. |
| (c) | Expenses have been reduced due to a reimbursement of expenses overbilled by a third party. If the reimbursement had been excluded, the expense ratios would have been higher by the percentages shown for each class in the table below. All fee waivers and expense reimbursements by the Investment Manager and its affiliates were applied before giving effect to this third party reimbursement. |
| | Class A | Class C | Class R5 | Class Z |
| 10/31/2017 | 0.01 % | 0.01 % | 0.01 % | 0.01 % |
| (d) | The benefits derived from expense reductions had an impact of less than 0.01%. |
| (e) | Rounds to zero. |
| (f) | The Fund received proceeds from regulatory settlements. Had the Fund not received these proceeds, the total return would have been lower by 0.06%. |
| (g) | Class R4 shares commenced operations on March 19, 2013. Per share data and total return reflect activity from that date. |
| (h) | Annualized. |
| (i) | Class R5 shares commenced operations on March 1, 2016. Per share data and total return reflect activity from that date. |
| (j) | Calculation of the net gain (loss) per share (both realized and unrealized) does not correlate to the aggregate realized and unrealized gain (loss) presented in the Statement of Operations due to the timing of subscriptions and redemptions of Fund shares in relation to fluctuations in the market value of the portfolio. |
| (k) | Class Y shares commenced operations on March 1, 2017. Per share data and total return reflect activity from that date. |
The accompanying Notes to Financial Statements are an integral part of this statement.
| 26 | Columbia California Tax-Exempt Fund | Annual Report 2017 |
Total
distributions to
shareholders | Proceeds from
regulatory
settlements | Net
asset
value,
end of
period | Total
return | Total gross
expense
ratio to
average
net assets(a) | Total net
expense
ratio to
average
net assets(a),(b) | Net investment
income
ratio to
average
net assets | Portfolio
turnover | Net
assets,
end of
period
(000’s) |
| |
| (0.35) | — | $7.72 | 1.74% | 0.57% (c) | 0.56% (c),(d) | 3.86% | 17% | $120,839 |
| (0.35) | — | $7.94 | 5.04% | 0.62% | 0.56% (d) | 3.87% | 13% | $120,169 |
| (0.36) | 0.00 (e) | $7.90 | 3.42% (f) | 0.63% | 0.54% (d) | 4.06% | 12% | $106,799 |
| (0.39) | — | $7.99 | 11.35% | 0.63% | 0.54% (d) | 4.30% | 14% | $75,032 |
| (0.33) | — | $7.55 | (1.54%) | 0.62% | 0.53% (d) | 4.16% | 14% | $70,850 |
Columbia California Tax-Exempt Fund | Annual Report 2017
| 27 |
Notes to Financial Statements
October 31, 2017
Note 1. Organization
Columbia California Tax-Exempt Fund (the Fund), a series of Columbia Funds Series Trust I (the Trust), is a non-diversified fund. The Trust is registered under the Investment Company Act of 1940, as amended (the 1940 Act), as an open-end management investment company organized as a Massachusetts business trust.
Fund shares
The Trust may issue an unlimited number of shares (without par value). Although all share classes generally have identical voting, dividend and liquidation rights, each share class votes separately when required by the Trust’s organizational documents or by law. Different share classes pay different distribution amounts to the extent the expenses of such share classes differ, and distributions in liquidation will be proportional to the net asset value of each share class. Each share class has its own expense and sales charge structure. The Fund offers each of the share classes identified below.
Class A shares are subject to a maximum front-end sales charge of 3.00% based on the initial investment amount. Class A shares purchased without an initial sales charge are subject to a contingent deferred sales charge (CDSC) of 0.75% on certain investments of $500,000 or more if redeemed within 12 months after purchase.
Class B shares of the Fund are no longer offered for sale. When available, Class B shares were subject to a maximum CDSC of 5.00% based upon the holding period after purchase. Effective July 17, 2017, Class B shares were automatically converted to Class A shares without a CDSC. On August 4, 2017, the capital owned by Columbia Management Investment Advisers, LLC in Class B shares was redeemed without a CDSC.
Class C shares are subject to a 1.00% CDSC on shares redeemed within 12 months after purchase.
Class R4 shares are not subject to sales charges and are generally available only to omnibus retirement plans and certain investors as described in the Fund’s prospectus. Effective November 1, 2017, Class R4 shares were renamed Advisor Class shares.
Class R5 shares are not subject to sales charges and are generally available only to investors purchasing through authorized investment professionals and omnibus retirement plans as described in the Fund’s prospectus. Effective November 1, 2017, Class R5 shares were renamed Institutional 2 Class shares.
Class Y shares are not subject to sales charges and are available to institutional and certain other investors as described in the Fund’s prospectus. Class Y shares commenced operations on March 1, 2017. Effective November 1, 2017, Class Y shares were renamed Institutional 3 Class shares.
Class Z shares are not subject to sales charges and are generally available only to eligible investors, which are subject to different investment minimums as described in the Fund’s prospectus. Effective November 1, 2017, Class Z shares were renamed Institutional Class shares.
Note 2. Summary of significant accounting policies
Basis of preparation
The Fund is an investment company that applies the accounting and reporting guidance in the Financial Accounting Standards Board (FASB) Accounting Standards Codification Topic 946, Financial Services - Investment Companies (ASC 946). The financial statements are prepared in accordance with U.S. generally accepted accounting principles (GAAP), which requires management to make certain estimates and assumptions that affect the reported amounts of assets and liabilities, the disclosure of contingent assets and liabilities at the date of the financial statements and the reported amounts of income and expenses during the reporting period. Actual results could differ from those estimates. The Fund received a reimbursement for expenses overbilled by a third party. Such reimbursement is included as an offset to other expenses on the Statement of Operations. All fee waivers and expense reimbursements by Columbia Management Investment Advisers, LLC and its affiliates were applied before giving effect to the third party reimbursement.
The following is a summary of significant accounting policies followed by the Fund in the preparation of its financial statements.
| 28 | Columbia California Tax-Exempt Fund | Annual Report 2017 |
Notes to Financial Statements (continued)
October 31, 2017
Security valuation
Debt securities generally are valued by pricing services approved by the Board of Trustees based upon market transactions for normal, institutional-size trading units of similar securities. The services may use various pricing techniques that take into account, as applicable, factors such as yield, quality, coupon rate, maturity, type of issue, trading characteristics and other data, as well as approved independent broker-dealer quotes. Debt securities for which quotations are not readily available or not believed to be reflective of market value may also be valued based upon a bid quote from an approved independent broker-dealer. Debt securities maturing in 60 days or less are valued primarily at amortized cost value, unless this method results in a valuation that management believes does not approximate market value.
Investments in open-end investment companies, including money market funds, are valued at their latest net asset value.
Investments for which market quotations are not readily available, or that have quotations which management believes are not reflective of market value or reliable, are valued at fair value as determined in good faith under procedures approved by and under the general supervision of the Board of Trustees. If a security or class of securities (such as foreign securities) is valued at fair value, such value is likely to be different from the quoted or published price for the security.
The determination of fair value often requires significant judgment. To determine fair value, management may use assumptions including but not limited to future cash flows and estimated risk premiums. Multiple inputs from various sources may be used to determine fair value.
GAAP requires disclosure regarding the inputs and valuation techniques used to measure fair value and any changes in valuation inputs or techniques. In addition, investments shall be disclosed by major category. This information is disclosed following the Fund’s Portfolio of Investments.
Delayed delivery securities
The Fund may trade securities on other than normal settlement terms, including securities purchased or sold on a “when-issued” or "forward commitment" basis. This may increase risk to the Fund since the other party to the transaction may fail to deliver, which could cause the Fund to subsequently invest at less advantageous prices. The Fund designates cash or liquid securities in an amount equal to the delayed delivery commitment.
Security transactions
Security transactions are accounted for on the trade date. Cost is determined and gains (losses) are based upon the specific identification method for both financial statement and federal income tax purposes.
Income recognition
Interest income is recorded on an accrual basis. Market premiums and discounts, including original issue discounts, are amortized and accreted, respectively, over the expected life of the security on all debt securities, unless otherwise noted.
The Fund may place a debt security on non-accrual status and reduce related interest income when it becomes probable that the interest will not be collected and the amount of uncollectible interest can be reasonably estimated. A defaulted debt security is removed from non-accrual status when the issuer resumes interest payments or when collectibility of interest is reasonably assured.
Dividend income is recorded on the ex-dividend date.
Expenses
General expenses of the Trust are allocated to the Fund and other funds of the Trust based upon relative net assets or other expense allocation methodologies determined by the nature of the expense. Expenses directly attributable to the Fund are charged to the Fund. Expenses directly attributable to a specific class of shares are charged to that share class.
Columbia California Tax-Exempt Fund | Annual Report 2017
| 29 |
Notes to Financial Statements (continued)
October 31, 2017
Determination of class net asset value
All income, expenses (other than class-specific expenses, which are charged to that share class, as shown in the Statement of Operations) and realized and unrealized gains (losses) are allocated to each class of the Fund on a daily basis, based on the relative net assets of each class, for purposes of determining the net asset value of each class.
Federal income tax status
The Fund intends to qualify each year as a regulated investment company under Subchapter M of the Internal Revenue Code, as amended, and will distribute substantially all of its net tax-exempt and investment company taxable income and net capital gain, if any, for its tax year, and as such will not be subject to federal income taxes. In addition, the Fund intends to distribute in each calendar year substantially all of its ordinary income, capital gain net income and certain other amounts, if any, such that the Fund should not be subject to federal excise tax. Therefore, no federal income or excise tax provision is recorded.
Distributions to shareholders
Distributions from net investment income, if any, are declared daily and paid monthly. Net realized capital gains, if any, are distributed at least annually. Income distributions and capital gain distributions are determined in accordance with federal income tax regulations, which may differ from GAAP.
Guarantees and indemnifications
Under the Trust’s organizational documents and, in some cases, by contract, its officers and trustees are indemnified against certain liabilities arising out of the performance of their duties to the Trust or its funds. In addition, certain of the Fund’s contracts with its service providers contain general indemnification clauses. The Fund’s maximum exposure under these arrangements is unknown since the amount of any future claims that may be made against the Fund cannot be determined, and the Fund has no historical basis for predicting the likelihood of any such claims.
Recent accounting pronouncement
Accounting Standards Update 2017-08 Premium Amortization on Purchased Callable Debt Securities
In March 2017, the Financial Accounting Standards Board issued Accounting Standards Update (ASU) No. 2017-08 Premium Amortization on Purchased Callable Debt Securities. ASU No. 2017-08 updates the accounting standards to shorten the amortization period for certain purchased callable debt securities, held at a premium, to be amortized to the earliest call date. The update applies to securities with explicit, noncontingent call features that are callable at fixed prices and on preset dates. The standard is effective for annual periods beginning after December 15, 2018 and interim periods within those fiscal years. At this time, management is evaluating the implication of this guidance and the impact it will have on the financial statement amounts and footnote disclosures, if any.
Note 3. Fees and other transactions with affiliates
Management services fees
The Fund has entered into a Management Agreement with Columbia Management Investment Advisers, LLC (the Investment Manager), a wholly-owned subsidiary of Ameriprise Financial, Inc. (Ameriprise Financial). Under the Management Agreement, the Investment Manager provides the Fund with investment research and advice, as well as administrative and accounting services. The management services fee is an annual fee that is equal to a percentage of the Fund’s daily net assets that declines from 0.47% to 0.31% as the Fund’s net assets increase. The effective management services fee rate for the year ended October 31, 2017 was 0.47% of the Fund’s average daily net assets.
Compensation of board members
Members of the Board of Trustees, who are not officers or employees of the Investment Manager or Ameriprise Financial, are compensated for their services to the Fund as disclosed in the Statement of Operations. These members of the Board of Trustees may participate in a Deferred Compensation Plan (the Plan) which may be terminated at any time. Obligations of the Plan will be paid solely out of the Fund’s assets, and all amounts payable under the Plan constitute a general unsecured obligation of the Fund.
| 30 | Columbia California Tax-Exempt Fund | Annual Report 2017 |
Notes to Financial Statements (continued)
October 31, 2017
Compensation of Chief Compliance Officer
The Board of Trustees has appointed a Chief Compliance Officer to the Fund in accordance with federal securities regulations. A portion of the Chief Compliance Officer’s total compensation is allocated to the Fund, along with other affiliated funds governed by the Board of Trustees, based on relative net assets. The total amount allocated to all affiliated funds governed by the Board of Trustees will not exceed $40,000 annually.
Transfer agency fees
Under a Transfer and Dividend Disbursing Agent Agreement, Columbia Management Investment Services Corp. (the Transfer Agent), an affiliate of the Investment Manager and a wholly-owned subsidiary of Ameriprise Financial, is responsible for providing transfer agency services to the Fund. The Transfer Agent has contracted with DST Asset Manager Solutions, Inc. (DST) to serve as sub-transfer agent. The Transfer Agent pays the fees of DST for services as sub-transfer agent and DST is not entitled to reimbursement for such fees from the Fund (with the exception of out-of-pocket fees).
The Fund pays the Transfer Agent a monthly transfer agency fee based on the number or the average value of accounts, depending on the type of account. In addition, the Fund pays the Transfer Agent a fee for shareholder services based on the number of accounts or on a percentage of the average aggregate value of the Fund’s shares maintained in omnibus accounts up to the lesser of the amount charged by the financial intermediary or a cap established by the Board of Trustees from time to time.
The Transfer Agent also receives compensation from the Fund for various shareholder services and reimbursements for certain out-of-pocket fees. Effective August 1, 2017, total transfer agency fees for Class R5 and Class Y shares are subject to an annual limitation of not more than 0.07% and 0.02%, respectively, of the average daily net assets attributable to each share class. From January 1, 2017 to July 31, 2017, these limitations were 0.075% for Class R5 shares and 0.025% for Class Y shares; and prior to January 1, 2017, the limitation was 0.05% for Class R5 shares.
For the year ended October 31, 2017, the Fund’s effective transfer agency fee rates as a percentage of average daily net assets of each class were as follows:
| | Effective rate (%) |
| Class A | 0.08 |
| Class B | 0.07 (a),(b) |
| Class C | 0.08 |
| Class R4 | 0.08 |
| Class R5 | 0.07 |
| Class Y | 0.01 (c) |
| Class Z | 0.08 |
| (a) | Effective July 17, 2017, Class B shares were automatically converted to Class A shares. |
| (b) | Unannualized. |
| (c) | Annualized. |
The Fund and certain other associated investment companies have severally, but not jointly, guaranteed the performance and observance of all the terms and conditions of a lease entered into by Seligman Data Corp. (SDC), the former transfer agent, including the payment of rent by SDC (the Guaranty). SDC was the legacy Seligman funds’ former transfer agent.
The lease and the Guaranty expire in January 2019. At October 31, 2017, the Fund’s total potential future obligation over the life of the Guaranty is $16,627. The liability remaining at October 31, 2017 for non-recurring charges associated with the lease amounted to $8,285 and is recorded as a part of the payable for other expenses in the Statement of Assets and Liabilities.
An annual minimum account balance fee of $20 may apply to certain accounts with a value below the applicable share class’s initial minimum investment requirements to reduce the impact of small accounts on transfer agency fees. These minimum account balance fees are remitted to the Fund and recorded as part of expense reductions in the Statement of Operations. For the year ended October 31, 2017, these minimum account balance fees reduced total expenses of the Fund by $420.
Columbia California Tax-Exempt Fund | Annual Report 2017
| 31 |
Notes to Financial Statements (continued)
October 31, 2017
Distribution and service fees
The Fund has entered into an agreement with Columbia Management Investment Distributors, Inc. (the Distributor), an affiliate of the Investment Manager and a wholly-owned subsidiary of Ameriprise Financial, for distribution and shareholder services. The Board of Trustees has approved, and the Fund has adopted, distribution and shareholder service plans (the Plans) applicable to certain share classes, which set the distribution and service fees for the Fund. These fees are calculated daily and are intended to compensate the Distributor and/or eligible selling and/or servicing agents for selling shares of the Fund and providing services to investors.
Under the Plans, the Fund pays a monthly service fee to the Distributor at the maximum annual rate of 0.25% of the average daily net assets attributable to Class A, Class B and Class C shares of the Fund. Also under the Plans, the Fund pays a monthly distribution fee to the Distributor at the maximum annual rates of 0.75% of the average daily net assets attributable to Class B and Class C shares of the Fund. As a result of all Class B shares of the Fund being redeemed or converted to Class A shares, August 4, 2017 was the last day the Fund paid a service fee or distribution fee for Class B shares.
The Distributor has voluntarily agreed to waive a portion of the distribution fee for Class C shares so that the distribution fee does not exceed 0.45% annually of the average daily net assets attributable to Class C shares. This arrangement may be modified or terminated by the Distributor at any time.
Sales charges (unaudited)
Sales charges, including front-end charges and CDSCs, received by the Distributor for distributing Fund shares for the year ended October 31, 2017, if any, are listed below:
| | Amount ($) |
| Class A | 96,530 |
| Class C | 20,081 |
Expenses waived/reimbursed by the Investment Manager and its affiliates
The Investment Manager and certain of its affiliates have contractually agreed to waive fees and/or reimburse expenses (excluding certain fees and expenses described below) for the period(s) disclosed below, unless sooner terminated at the sole discretion of the Board of Trustees, so that the Fund’s net operating expenses, after giving effect to fees waived/expenses reimbursed and any balance credits and/or overdraft charges from the Fund’s custodian, do not exceed the following annual rate(s) as a percentage of the class’ average daily net assets:
| | March 1, 2017
through
February 28, 2018 | Prior to
March 1, 2017 |
| Class A | 0.82% | 0.82% |
| Class C | 1.57 | 1.57 |
| Class R4 | 0.57 | 0.57 |
| Class R5 | 0.575 | 0.52 |
| Class Y | 0.525 | — |
| Class Z | 0.57 | 0.57 |
Under the agreement governing these fee waivers and/or expense reimbursement arrangements, the following fees and expenses are excluded from the waiver/reimbursement commitment, and therefore will be paid by the Fund, if applicable: taxes (including foreign transaction taxes), expenses associated with investments in affiliated and non-affiliated pooled investment vehicles (including mutual funds and exchange-traded funds), transaction costs and brokerage commissions, costs related to any securities lending program, dividend expenses associated with securities sold short, inverse floater program fees and expenses, transaction charges and interest on borrowed money, interest, infrequent and/or unusual expenses and any other expenses the exclusion of which is specifically approved by the Board of Trustees. This agreement may be modified or amended only with approval from the Investment Manager, certain of its affiliates and the Fund. In addition to the contractual agreement, the Investment Manager and certain of its affiliates have voluntarily agreed to waive fees and/or reimburse Fund expenses (excluding certain fees and expenses described above) so that Fund level
| 32 | Columbia California Tax-Exempt Fund | Annual Report 2017 |
Notes to Financial Statements (continued)
October 31, 2017
expenses (expenses directly attributable to the Fund and not to a specific share class) are waived proportionately across all share classes, but the Fund’s net operating expenses shall not exceed the contractual annual rates listed in the table above. This arrangement may be revised or discontinued at any time. Any fees waived and/or expenses reimbursed under the expense reimbursement arrangements described above are not recoverable by the Investment Manager or its affiliates in future periods. Class C distribution fees waived by the Distributor, as discussed above, are in addition to the waiver/reimbursement commitment under the agreement.
Note 4. Federal tax information
The timing and character of income and capital gain distributions are determined in accordance with income tax regulations, which may differ from GAAP because of temporary or permanent book to tax differences.
At October 31, 2017, these differences are primarily due to differing treatment for deferral/reversal of wash sale losses, tax straddles, trustees’ deferred compensation, distributions and principal and/or interest from fixed income securities. To the extent these differences are permanent, reclassifications are made among the components of the Fund’s net assets in the Statement of Assets and Liabilities. Temporary differences do not require reclassifications.
In the Statement of Assets and Liabilities the following reclassifications were made:
Undistributed net
investment
income ($) | Accumulated
net realized
gain ($) | Paid in
capital ($) |
| (3) | 2 | 1 |
Net investment income (loss) and net realized gains (losses), as disclosed in the Statement of Operations, and net assets were not affected by this reclassification.
The tax character of distributions paid during the years indicated was as follows:
| Year Ended October 31, 2017 | Year Ended October 31, 2016 |
Ordinary
income ($) | Tax-exempt
income ($) | Long-term
capital gains ($) | Total ($) | Ordinary
income ($) | Tax-exempt
income ($) | Long-term
capital gains ($) | Total ($) |
| 3,613 | 18,799,445 | 3,557,844 | 22,360,902 | 16,125 | 19,928,128 | 2,890,379 | 22,834,632 |
Short-term capital gain distributions, if any, are considered ordinary income distributions for tax purposes.
At October 31, 2017, the components of distributable earnings on a tax basis were as follows:
Undistributed
ordinary income ($) | Undistributed tax-
exempt income ($) | Undistributed
long-term
capital gains ($) | Capital loss
carryforwards ($) | Net unrealized
appreciation ($) |
| — | 2,239,461 | 2,396,869 | — | 32,548,795 |
At October 31, 2017, the cost of all investments for federal income tax purposes along with the aggregate gross unrealized appreciation and depreciation based on that cost was:
Federal
tax cost ($) | Gross unrealized
appreciation ($) | Gross unrealized
(depreciation) ($) | Net unrealized
appreciation ($) |
| 475,228,722 | 35,042,123 | (2,493,328) | 32,548,795 |
Tax cost of investments and unrealized appreciation/(depreciation) may also include timing differences that do not constitute adjustments to tax basis.
Management of the Fund has concluded that there are no significant uncertain tax positions in the Fund that would require recognition in the financial statements. However, management’s conclusion may be subject to review and adjustment at a later date based on factors including, but not limited to, new tax laws, regulations, and administrative interpretations (including relevant court decisions). Generally, the Fund’s federal tax returns for the prior three fiscal years remain subject to examination by the Internal Revenue Service.
Columbia California Tax-Exempt Fund | Annual Report 2017
| 33 |
Notes to Financial Statements (continued)
October 31, 2017
Note 5. Portfolio information
The cost of purchases and proceeds from sales of securities, excluding short-term investments and derivatives, if any, aggregated to $84,585,584 and $111,968,505, respectively, for the year ended October 31, 2017. The amount of purchase and sale activity impacts the portfolio turnover rate reported in the Financial Highlights.
Note 6. Regulatory settlements
During the year ended October 31, 2015, the Fund recorded a receivable of $312,081 as a result of a regulatory settlement proceeding brought by the Securities and Exchange Commission against a third party relating to market timing and/or late trading of mutual funds. This amount represented the Fund’s portion of the proceeds from the settlement (neither the Fund nor the Investment Manager were a party to the proceeding) and is disclosed as a receivable on the Statement of Assets and Liabilities.
Note 7. Line of credit
The Fund has access to a revolving credit facility with a syndicate of banks led by Citibank, N.A., HSBC Bank USA, N.A. and JPMorgan Chase Bank, N.A. whereby the Fund may borrow for the temporary funding of shareholder redemptions or for other temporary or emergency purposes. The credit facility, which is a collective agreement between the Fund and certain other funds managed by the Investment Manager, severally and not jointly, permits collective borrowings up to $1 billion. Interest is charged to each participating fund based on its borrowings at a rate equal to the higher of (i) the overnight federal funds rate plus 1.00% or (ii) the one-month LIBOR rate plus 1.00%. Each borrowing under the credit facility matures no later than 60 days after the date of borrowing. The Fund also pays a commitment fee equal to its pro rata share of the amount of the credit facility at a rate of 0.15% per annum. The commitment fee is included in other expenses in the Statement of Operations.
The Fund had no borrowings during the year ended October 31, 2017.
Note 8. Significant risks
Credit risk
Credit risk is the risk that the value of debt securities in the Fund’s portfolio may decline because the issuer may default and fail to pay interest or repay principal when due. Rating agencies assign credit ratings to debt securities to indicate their credit risk. Lower rated or unrated debt securities held by the Fund may present increased credit risk as compared to higher-rated debt securities.
Geographic concentration risk
Because the Fund invests substantially in municipal securities issued by the state identified in the Fund’s name and political sub-divisions of that state, the Fund will be particularly affected by adverse tax, legislative, regulatory, demographic or political changes as well as changes impacting the state’s financial, economic or other condition and prospects. In addition, because of the relatively small number of issuers of tax-exempt securities in the state, the Fund may invest a higher percentage of assets in a single issuer and, therefore, be more exposed to the risk of loss than a fund that invests more broadly. The value of municipal and other securities owned by the Fund also may be adversely affected by future changes in federal or state income tax laws.
Interest rate risk
Interest rate risk is the risk of losses attributable to changes in interest rates. In general, if prevailing interest rates rise, the values of debt securities tend to fall, and if interest rates fall, the values of debt securities tend to rise. Actions by governments and central banking authorities can result in increases in interest rates. Increasing interest rates may negatively affect the value of debt securities held by the Fund, resulting in a negative impact on the Fund’s performance and net asset value per share. In general, the longer the maturity or duration of a debt security, the greater its sensitivity to changes in interest rates.
| 34 | Columbia California Tax-Exempt Fund | Annual Report 2017 |
Notes to Financial Statements (continued)
October 31, 2017
Liquidity risk
Liquidity risk is the risk associated with a lack of marketability of investments which may make it difficult to sell the investment at a desirable time or price. Changing regulatory, market or other conditions or environments (for example, the interest rate or credit environments) may adversely affect the liquidity of the Fund’s investments. The Fund may have to accept a lower selling price for the holding, sell other investments, or forego another, more appealing investment opportunity. Generally, the less liquid the market at the time the Fund sells a portfolio investment, the greater the risk of loss or decline of value to the Fund. A less liquid market can lead to an increase in Fund redemptions, which may negatively impact Fund performance and net asset value per share, including, for example, if the Fund is forced to sell securities in a down market.
Non-diversification risk
A non-diversified fund is permitted to invest a greater percentage of its total assets in fewer issuers than a diversified fund. The Fund may, therefore, have a greater risk of loss from a few issuers than a similar fund that invests more broadly.
Shareholder concentration risk
At October 31, 2017, one unaffiliated shareholder of record owned 22.6% of the outstanding shares of the Fund in one or more accounts. The Fund has no knowledge about whether any portion of those shares was owned beneficially. Affiliated shareholders of record owned 27.1% of the outstanding shares of the Fund in one or more accounts. Subscription and redemption activity by concentrated accounts may have a significant effect on the operations of the Fund. In the case of a large redemption, the Fund may be forced to sell investments at inopportune times, including its liquid positions, which may result in Fund losses and the Fund holding a higher percentage of less liquid positions. Large redemptions could result in decreased economies of scale and increased operating expenses for non-redeeming Fund shareholders.
Note 9. Subsequent events
Management has evaluated the events and transactions that have occurred through the date the financial statements were issued. Other than as noted in Note 1 above, there were no items requiring adjustment of the financial statements or additional disclosure.
Note 10. Information regarding pending and settled legal proceedings
Ameriprise Financial and certain of its affiliates have historically been involved in a number of legal, arbitration and regulatory proceedings, including routine litigation, class actions, and governmental actions, concerning matters arising in connection with the conduct of their business activities. Ameriprise Financial believes that the Fund is not currently the subject of, and that neither Ameriprise Financial nor any of its affiliates are the subject of, any pending legal, arbitration or regulatory proceedings that are likely to have a material adverse effect on the Fund or the ability of Ameriprise Financial or its affiliates to perform under their contracts with the Fund. Ameriprise Financial is required to make quarterly (10-Q), annual (10-K) and, as necessary, 8-K filings with the Securities and Exchange Commission (SEC) on legal and regulatory matters that relate to Ameriprise Financial and its affiliates. Copies of these filings may be obtained by accessing the SEC website at www.sec.gov.
There can be no assurance that these matters, or the adverse publicity associated with them, will not result in increased Fund redemptions, reduced sale of Fund shares or other adverse consequences to the Fund. Further, although we believe proceedings are not likely to have a material adverse effect on the Fund or the ability of Ameriprise Financial or its affiliates to perform under their contracts with the Fund, these proceedings are subject to uncertainties and, as such, we are unable to estimate the possible loss or range of loss that may result. An adverse outcome in one or more of these proceedings could result in adverse judgments, settlements, fines, penalties or other relief that could have a material adverse effect on the consolidated financial condition or results of operations of Ameriprise Financial.
Columbia California Tax-Exempt Fund | Annual Report 2017
| 35 |
Report of Independent Registered Public Accounting Firm
To the Trustees of Columbia Funds Series Trust I and the Shareholders of Columbia California Tax-Exempt Fund
In our opinion, the accompanying statement of assets and liabilities, including the portfolio of investments, and the related statements of operations and of changes in net assets and the financial highlights present fairly, in all material respects, the financial position of Columbia California Tax-Exempt Fund (the “Fund”, a series of Columbia Funds Series Trust I) as of October 31, 2017, the results of its operations for the year then ended, the changes in its net assets for each of the two years in the period then ended and the financial highlights for each of the periods indicated therein, in conformity with accounting principles generally accepted in the United States of America. These financial statements and financial highlights (hereafter referred to as “financial statements”) are the responsibility of the Fund’s management. Our responsibility is to express an opinion on these financial statements based on our audits. We conducted our audits of these financial statements in accordance with the standards of the Public Company Accounting Oversight Board (United States). Those standards require that we plan and perform the audit to obtain reasonable assurance about whether the financial statements are free of material misstatement. An audit includes examining, on a test basis, evidence supporting the amounts and disclosures in the financial statements, assessing the accounting principles used and significant estimates made by management, and evaluating the overall financial statement presentation. We believe that our audits, which included confirmation of securities as of October 31, 2017 by correspondence with the custodian and brokers, provide a reasonable basis for our opinion.
/s/ PricewaterhouseCoopers LLP
Minneapolis, MN
December 21, 2017
| 36 | Columbia California Tax-Exempt Fund | Annual Report 2017 |
Federal Income Tax Information
(Unaudited)
The Fund hereby designates the following tax attributes for the fiscal year ended October 31, 2017. Shareholders will be notified in early 2018 of the amounts for use in preparing 2017 income tax returns.
Capital
gain
dividend | Exempt-
interest
dividends |
| $2,706,006 | 99.98% |
Capital gain dividend. The Fund designates as a capital gain dividend the amount reflected above, or if subsequently determined to be different, the net capital gain of such fiscal period.
Exempt-interest dividends. The percentage of net investment income distributed during the fiscal year that qualifies as exempt-interest dividends for federal income tax purposes. A portion of the income may be subject to federal alternative minimum tax.
Columbia California Tax-Exempt Fund | Annual Report 2017
| 37 |
Shareholders elect the Board that oversees the Fund’s operations. The Board appoints officers who are responsible for day-to-day business decisions based on policies set by the Board. The following table provides basic biographical information about the Fund’s Trustees, including their principal occupations during the past five years, although specific titles for individuals may have varied over the period. The year set forth beneath Length of Service in the table below is the year in which the Trustee was first appointed or elected as Trustee to any Fund currently in the Columbia Funds Complex or a predecessor thereof. Under current Board policy, members serve terms of indefinite duration.
Independent trustees
| Name, address, year of birth | Position held with the Trust and length of service | Principal occupation(s) during the past five years and other relevant professional experience | Number of Funds in the Columbia Fund Complex overseen | Other directorships held by Trustee during the past five years |
Janet Langford Carrig
c/o Columbia Management
Investment Advisers, LLC
225 Franklin Street
Mail Drop BX32 05228
Boston, MA 02110
1957 | Trustee
1996 | Senior Vice President, General Counsel and Corporate Secretary, ConocoPhillips (independent energy company) since September 2007 | 66 | None |
Douglas A. Hacker
c/o Columbia Management
Investment Advisers, LLC
225 Franklin Street
Mail Drop BX32 05228
Boston, MA 02110
1955 | Trustee and Chairman of the Board
1996 | Independent business executive since May 2006; Executive Vice President — Strategy of United Airlines from December 2002 to May 2006; President of UAL Loyalty Services (airline marketing company) from September 2001 to December 2002; Executive Vice President and Chief Financial Officer of United Airlines from July 1999 to September 2001 | 66 | Spartan Nash Company, (food distributor); Nash Finch Company (food distributor) from 2005 to 2013; Aircastle Limited (aircraft leasing); SeaCube Container Leasing Ltd. (container leasing) from 2010 to 2013; and Travelport Worldwide Limited (travel information technology) |
Nancy T. Lukitsh
c/o Columbia Management
Investment Advisers, LLC
225 Franklin Street
Mail Drop BX32 05228
Boston, MA 02110
1956 | Trustee
2011 | Senior Vice President, Partner and Director of Marketing, Wellington Management Company, LLP (investment adviser) from 1997 to 2010; Chair, Wellington Management Portfolios (commingled non-U.S. investment pools) from 2007 to 2010; Director, Wellington Trust Company, NA and other Wellington affiliates from 1997 to 2010 | 66 | None |
David M. Moffett
c/o Columbia Management
Investment Advisers, LLC
225 Franklin Street
Mail Drop BX32 05228
Boston, MA 02110
1952 | Trustee
2011 | Retired. Consultant to Bridgewater and Associates | 66 | Director, CSX Corporation; Genworth Financial, Inc. (financial and insurance products and services); PayPal Holdings Inc. (payment and data processing services); Trustee, University of Oklahoma Foundation; former Director, eBay Inc. (online trading community), 2007-2015; and former Director, CIT Bank, CIT Group Inc. (commercial and consumer finance), 2010-2016 |
| 38 | Columbia California Tax-Exempt Fund | Annual Report 2017 |
TRUSTEES AND OFFICERS (continued)
Independent trustees (continued)
| Name, address, year of birth | Position held with the Trust and length of service | Principal occupation(s) during the past five years and other relevant professional experience | Number of Funds in the Columbia Fund Complex overseen | Other directorships held by Trustee during the past five years |
Charles R. Nelson
c/o Columbia Management
Investment Advisers, LLC
225 Franklin Street
Mail Drop BX32 05228
Boston, MA 02110
1942 | Trustee
1981 | Retired. Professor Emeritus, University of Washington since 2011; Professor of Economics, University of Washington from 1976 to 2011; Ford and Louisa Van Voorhis Professor of Political Economy, University of Washington from 1993 to 2011; Adjunct Professor of Statistics, University of Washington from 1980 to 2011; Associate Editor, Journal of Money, Credit and Banking from September 1993 to 2008; consultant on econometric and statistical matters | 66 | None |
John J. Neuhauser
c/o Columbia Management
Investment Advisers, LLC
225 Franklin Street
Mail Drop BX32 05228
Boston, MA 02110
1943 | Trustee
1984 | President, Saint Michael’s College since August 2007; Director or Trustee of several non-profit organizations, including University of Vermont Medical Center; Academic Vice President and Dean of Faculties, Boston College from August 1999 to October 2005; University Professor, Boston College from November 2005 to August 2007 | 66 | Liberty All-Star Equity Fund and Liberty All- Star Growth Fund (closed-end funds) |
Patrick J. Simpson
c/o Columbia Management
Investment Advisers, LLC
225 Franklin Street
Mail Drop BX32 05228
Boston, MA 02110
1944 | Trustee
2000 | Of Counsel, Perkins Coie LLP (law firm) since 2015; Partner, Perkins Coie LLP from 1988 to 2014 | 66 | None |
Anne-Lee Verville
c/o Columbia Management
Investment Advisers, LLC
225 Franklin Street
Mail Drop BX32 05228
Boston, MA 02110
1945 | Trustee
1998 | Retired. General Manager, Global Education Industry from 1994 to 1997, President – Application Systems Division from 1991 to 1994, Chief Financial Officer – US Marketing & Services from 1988 to 1991, and Chief Information Officer from 1987 to 1988, IBM Corporation (computer and technology) | 66 | Enesco Group, Inc. (producer of giftware and home and garden decor products) from 2001 to 2006 |
Columbia California Tax-Exempt Fund | Annual Report 2017
| 39 |
TRUSTEES AND OFFICERS (continued)
Consultants to the Independent Trustees*
| Name, address, year of birth | Position held with the Trust and length of service | Principal occupation(s) during the past five years and other relevant professional experience | Number of Funds in the Columbia Funds complex overseen | Other directorships held by Trustee during the past five years |
J. Kevin Connaughton
c/o Columbia
Management Investment
Advisers, LLC,
225 Franklin Street
Mail Drop BX32 05228,
Boston, MA 02110
1964 | Independent Trustee Consultant
2016 | Independent Trustee Consultant, Columbia Funds since March 2016; Managing Director and General Manager of Mutual Fund Products, Columbia Management Investment Advisers, LLC from May 2010 to February 2015; President, Columbia Funds from 2009 to 2015; and senior officer of Columbia Funds and affiliated funds from 2003 to 2015 | 66 | Board of Governors, Gateway Healthcare since January 2016; Trustee, New Century Portfolios since March 2015; and Director, The Autism Project since March 2015 |
Natalie A. Trunow
c/o Columbia
Management Investment
Advisers, LLC,
225 Franklin Street
Mail Drop BX32 05228,
Boston, MA 02110
1967 | Independent Trustee Consultant
2016 | Independent Trustee Consultant, Columbia Funds since September 2016; Chief Executive Officer, Millennial Partners (investment consulting services to institutions) since January 2016; Director of Investments, Casey Family Programs from April 2016 to September 2016; Senior Vice President and Chief Investment Officer, Calvert Investments from August 2008 to January 2016; Section Head and Portfolio Manager, General Motors Asset Management from June 1997 to August 2008 | 66 | Healthcare Services for Children with Special Needs |
| * | J. Kevin Connaughton was appointed consultant to the Independent Trustees effective March 1, 2016. Natalie A. Trunow was appointed consultant to the Independent Trustees effective September 1, 2016. Shareholders of the Funds are expected to be asked to elect each of Mr. Connaughton and Ms. Trunow as a Trustee at a future shareholder meeting. |
Interested trustee affiliated with Investment Manager*
| Name, address, year of birth | Position held with the Trust and length of service | Principal occupation(s) during the past five years and other relevant professional experience | Number of Funds in the Columbia Funds Complex overseen | Other directorships held by Trustee during the past five years |
William F. Truscott
c/o Columbia Management
Investment Advisers, LLC
225 Franklin Street
Boston, MA 02110
1960 | Trustee
2012 | Chairman of the Board and President, Columbia Management Investment Advisers, LLC since May 2010 and February 2012, respectively; Chief Executive Officer, Global Asset Management, Ameriprise Financial, Inc. since September 2012 (previously Chief Executive Officer, U.S. Asset Management & President, Annuities, May 2010-September 2012); Director and Chief Executive Officer, Columbia Management Investment Distributors, Inc. since May 2010 and February 2012, respectively; Chairman of the Board and Chief Executive Officer, RiverSource Distributors, Inc. since 2006; Director, Threadneedle Asset Management Holdings, SARL since 2014; President and Chief Executive Officer, Ameriprise Certificate Company, 2006-August 2012 | 189 | Chairman of the Board, Columbia Management Investment Advisers, LLC since May 2010; Director, Columbia Management Investment Distributors, Inc. since May 2010; former Director, Ameriprise Certificate Company, 2006 - January 2013 |
| * | Interested person (as defined under the 1940 Act) by reason of being an officer, director, security holder and/or employee of the Investment Manager or Ameriprise Financial. |
The Statement of Additional Information has additional information about the Fund’s Board members and is available,
without charge, upon request by calling 800.345.6611, contacting your financial intermediary or visiting
investor.columbiathreadneedleus.com.
| 40 | Columbia California Tax-Exempt Fund | Annual Report 2017 |
TRUSTEES AND OFFICERS (continued)
The Board has appointed officers who are responsible for day-to-day business decisions based on policies it has established. The officers serve at the pleasure of the Board. The following table provides basic information about the Officers of the Fund, including principal occupations during the past five years, although their specific titles may have varied over the period. In addition to Mr. Truscott, who is Senior Vice President, the Fund’s other officers are:
Fund officers
Name,
address and
year of birth | Position and year
first appointed to
position for any Fund
in the Columbia
Funds complex or a
predecessor thereof | Principal occupation(s) during past five years |
Christopher O. Petersen
5228 Ameriprise
Financial Center
Minneapolis, MN 55474
Born 1970 | President and Principal Executive Officer (2015) | Vice President and Lead Chief Counsel, Ameriprise Financial, Inc. since January 2015 (previously, Vice President and Chief Counsel, January 2010 - December 2014; officer of Columbia Funds and affiliated funds since 2007. |
Michael G. Clarke
225 Franklin Street
Boston, MA 02110
Born 1969 | Treasurer (2011), Chief Financial Officer (2009) and Chief Accounting Officer (2015) | Vice President — Mutual Fund Administration, Columbia Management Investment Advisers, LLC, since May 2010; senior officer of Columbia Funds and affiliated funds since 2002. |
Paul B. Goucher
100 Park Avenue
New York, NY 10017
Born 1968 | Senior Vice President (2011) and Assistant Secretary (2008) | Senior Vice President and Assistant General Counsel, Ameriprise Financial, Inc. since January 2017 (previously Vice President and Lead Chief Counsel, November 2008 - January 2017 and January 2013 - January 2017, respectively; and Chief Counsel, January 2010 - January 2013); Vice President, Chief Legal Officer and Assistant Secretary, Columbia Management Investment Advisers, LLC since May 2010. |
Thomas P. McGuire
225 Franklin Street
Boston, MA 02110
Born 1972 | Senior Vice President and Chief Compliance Officer (2012) | Vice President — Asset Management Compliance, Ameriprise Financial, Inc., since May 2010; Chief Compliance Officer, Ameriprise Certificate Company since September 2010. |
Colin Moore
225 Franklin Street
Boston, MA 02110
Born 1958 | Senior Vice President (2010) | Executive Vice President and Global Chief Investment Officer, Ameriprise Financial, Inc., since July 2013; Executive Vice President and Global Chief Investment Officer, Columbia Management Investment Advisers, LLC since July 2013 (previously Director and Global Chief Investment Officer, 2010 - 2013). |
Ryan C. Larrenaga
225 Franklin Street
Boston, MA 02110
Born 1970 | Senior Vice President (2017), Chief Legal Officer (2017) and Secretary (2015) | Vice President and Group Counsel, Ameriprise Financial, Inc. since August 2011; officer of Columbia Funds and affiliated funds since 2005. |
Michael E. DeFao
225 Franklin Street
Boston, MA 02110
Born 1968 | Vice President (2011) and Assistant Secretary (2010) | Vice President and Chief Counsel, Ameriprise Financial, Inc. since May 2010. |
Amy Johnson
5228 Ameriprise
Financial Center
Minneapolis, MN 55474
Born 1965 | Vice President (2006) | Managing Director and Global Head of Operations, Columbia Management Investment Advisers, LLC since April 2016 (previously Managing Director and Chief Operating Officer, 2010 - 2016). |
Lyn Kephart-Strong
5228 Ameriprise
Financial Center
Minneapolis, MN 55474
Born 1960 | Vice President (2015) | President, Columbia Management Investment Services Corp. since October 2014; Vice President & Resolution Officer, Ameriprise Trust Company since August 2009. |
Columbia California Tax-Exempt Fund | Annual Report 2017
| 41 |
Board Consideration and Approval of Management
Agreement
On June 14, 2017, the Board of Trustees (the Board) and the Trustees who are not interested persons (as defined in the Investment Company Act of 1940) (the Independent Trustees) of Columbia Funds Series Trust I (the Trust) unanimously approved the continuation of the Management Agreement (the Management Agreement) with Columbia Management Investment Advisers, LLC (the Investment Manager) with respect to Columbia California Tax-Exempt Fund (the Fund), a series of the Trust. As detailed below, the Board’s Advisory Fees and Expenses Committee (the Committee) and the Board met on multiple occasions to review and discuss, both among themselves and with the management team of the Investment Manager, materials provided by the Investment Manager and others before determining to approve the continuation of the Management Agreement.
In connection with their deliberations regarding the continuation of the Management Agreement, the Committee and the Board evaluated materials requested from the Investment Manager regarding the Fund and the Management Agreement, and discussed these materials with representatives of the Investment Manager at Committee meetings held on March 27, 2017, April 26, 2017 and June 13, 2017 and at Board meetings held on March 28, 2017 and June 14, 2017. In addition, the Board considers matters bearing on the Management Agreement at most of its other meetings throughout the year and meets regularly with senior management of the Trust and the Investment Manager. Through the Board’s Investment Oversight Committees, Trustees also meet with selected portfolio managers of the funds the Trustees oversee and other investment personnel at various times throughout the year. The Committee and the Board also consulted with its independent fee consultant, Fund counsel and the Independent Trustees’ independent legal counsel, who advised on various matters with respect to the Committee’s and the Board’s considerations and otherwise assisted the Committee and the Board in their deliberations. On June 13, 2017, the Committee recommended that the Board approve the continuation of the Management Agreement. On June 14, 2017, the Board, including the Independent Trustees, voting separately, unanimously approved the continuation of the Management Agreement for the Fund.
The Committee and the Board considered all information that they, their legal counsel or the Investment Manager believed reasonably necessary to evaluate and to determine whether to recommend for approval or approve the continuation of the Management Agreement. The information and factors considered by the Committee and the Board in recommending for approval or approving the continuation of the Management Agreement for the Fund included the following:
| • | Information on the investment performance of the Fund relative to the performance of a group of mutual funds determined to be comparable to the Fund by an independent third-party data provider, as well as performance relative to benchmarks; |
| • | Information on the Fund’s management fees and total expenses, including information comparing the Fund’s expenses to those of a group of comparable mutual funds, as determined by the independent third-party data provider; |
| • | The Investment Manager’s agreement to contractually limit or cap total operating expenses for the Fund through February 28, 2018 so that total operating expenses (excluding certain fees and expenses, such as transaction costs and certain other investment related expenses, interest, taxes, acquired fund fees and expenses, and infrequent and/or unusual expenses) would not exceed a specified annual rate, as a percentage of the Fund’s net assets; |
| • | The terms and conditions of the Management Agreement; |
| • | The current and proposed terms and conditions of other agreements and arrangements with affiliates of the Investment Manager relating to the operations of the Fund, including agreements with respect to the provision of distribution, transfer agency and shareholder services to the Fund; |
| • | Descriptions of various functions performed by the Investment Manager under the Management Agreement, including portfolio management and portfolio trading practices; |
| • | Information regarding the management fees of similarly-managed portfolios of other clients of the Investment Manager, including institutional separate accounts; |
| • | Information regarding the reputation, regulatory history and resources of the Investment Manager, including information regarding senior management, portfolio managers and other personnel; |
| 42 | Columbia California Tax-Exempt Fund | Annual Report 2017 |
Board Consideration and Approval of Management
Agreement (continued)
| • | Information regarding the capabilities of the Investment Manager with respect to compliance monitoring services, including an assessment of the Investment Manager’s compliance system by the Fund’s Chief Compliance Officer; and |
| • | The profitability to the Investment Manager and its affiliates from their relationships with the Fund. |
Nature, extent and quality of services provided under the Management Agreement
The Committee and the Board considered the nature, extent and quality of services provided to the Fund by the Investment Manager and its affiliates under the Management Agreement and under separate agreements for the provision of transfer agency and shareholder services, and the resources dedicated to the Fund and the other Columbia Funds by the Investment Manager and its affiliates. The Committee and the Board considered, among other things, the Investment Manager’s ability to attract, motivate and retain highly qualified research, advisory and supervisory investment professionals (including compensation programs for personnel involved in fund management, reputation and other attributes), the portfolio management services provided by those investment professionals, and the quality of the Investment Manager’s investment research capabilities and trade execution services. The Committee and the Board also considered the potential benefits to shareholders of investing in a mutual fund that is part of a fund complex offering exposure to a variety of asset classes and investment disciplines and providing a variety of fund and shareholder services.
The Committee and the Board also considered the professional experience and qualifications of the senior personnel of the Investment Manager, which included consideration of the Investment Manager’s experience with similarly-structured funds. The Committee and the Board noted the compliance programs of and the compliance-related resources provided to the Fund by the Investment Manager and its affiliates, and considered the Investment Manager’s ability to provide administrative services to the Fund and coordinate the activities of the Fund’s other service providers. After reviewing these and related factors, the Committee and the Board concluded, within the context of their overall conclusions, that the nature, extent and quality of the services provided to the Fund under the Management Agreement supported the continuation of the Management Agreement.
Investment performance
The Committee and the Board reviewed information about the performance of the Fund over various time periods, including performance information relative to benchmarks and information that compared the performance of the Fund to the performance of a group of comparable mutual funds as determined by the independent third-party data provider, and data provided by the independent fee consultant. The Committee and the Board also reviewed a description of the third party’s methodology for identifying the Fund’s peer groups for purposes of performance and expense comparisons. Although the Fund’s performance lagged that of a relevant peer group for certain (although not necessarily all) periods, the Committee and the Board concluded that other factors relevant to performance were sufficient, in light of other considerations, to warrant continuation of the Management Agreement. Those factors included one or more of the following: (i) that the Fund’s performance, although lagging in certain recent periods, was stronger over the longer term; (ii) that the underperformance was attributable, to a significant extent, to investment decisions that were reasonable and consistent with the Fund’s investment strategy and policies and that the Fund was performing within a reasonable range of expectations, given those investment decisions, market conditions and the Fund’s investment strategy; (iii) that the Fund’s performance was competitive when compared to other relevant performance benchmarks or peer groups; and (iv) that the Investment Manager had taken or was taking steps designed to help improve the Fund’s investment performance, including, but not limited to, replacing portfolio managers, enhancing the resources supporting the portfolio managers, or modifying investment strategies.
The Committee and the Board noted that, through December 31, 2016, the Fund’s performance was in the seventy-third, forty-ninth and thirtieth percentile (where the best performance would be in the first percentile) of its category selected by the independent third-party data provider for the purposes of performance comparisons for the one-, three- and five-year periods, respectively.
The Committee and the Board also considered the Investment Manager’s performance and reputation generally, the Investment Manager’s historical responsiveness to Board concerns about performance, and the Investment Manager’s willingness to take steps intended to improve performance. After reviewing these and related factors, the Committee and the Board concluded, within the context of their overall conclusions, that the performance of the Fund and the Investment Manager was sufficient, in light of other considerations, to warrant the continuation of the Management Agreement.
Columbia California Tax-Exempt Fund | Annual Report 2017
| 43 |
Board Consideration and Approval of Management
Agreement (continued)
Investment management fee rates and other expenses
The Committee and the Board considered the management fees charged to the Fund under the Management Agreement as well as the total expenses incurred by the Fund. In assessing the reasonableness of the fees under the Management Agreement, the Committee and the Board considered, among other information, the Fund’s total expense ratio as a percentage of average daily net assets. The Committee and the Board considered data provided by the independent third-party data provider and the independent fee consultant. The Committee and the Board noted that, as of December 31, 2016, the Fund’s actual management fee and net total expense ratio are ranked in the second and third quintiles, respectively, (where the lowest fees and expenses would be in the first quintile) against the Fund’s expense universe as determined by the independent third-party data provider for purposes of expense comparison. The Committee and the Board also took into account the fee waiver and expense limitation arrangements agreed to by the Investment Manager, as noted above.
The Committee and the Board also received and considered information about the management fees charged by the Investment Manager to institutional separate accounts. In considering the fees charged to those accounts, the Committee and the Board took into account, among other things, the Investment Manager’s representations about the differences between managing mutual funds as compared to other types of accounts, including differences in the services provided, differences in the risk profile of such business for the Investment Manager and the additional resources required to manage mutual funds effectively. The Committee and the Board also received and considered information about the fees charged by the Investment Manager for sub-advisory services it provides to comparable unaffiliated funds. In evaluating the Fund’s management fees, the Committee and the Board also took into account the demands, complexity and quality of the investment management of the Fund.
After reviewing these and related factors, the Committee and the Board concluded, within the context of their overall conclusions, that the management fee rates and expenses of the Fund, in light of other considerations, warranted the continuation of the Management Agreement.
Costs of services provided and profitability
The Committee and the Board also took note of the costs the Investment Manager and its affiliates incur in connection with the services provided and the profitability to the Investment Manager and its affiliates from their relationships with the Fund.
The Committee and the Board also considered the compensation directly or indirectly received by the Investment Manager’s affiliates in connection with their relationships with the Fund. The Committee and the Board reviewed information provided by management as to the profitability to the Investment Manager and its affiliates of their relationships with the Fund, information about the allocation of expenses used to calculate profitability, and comparisons of profitability levels realized in 2016 to profitability levels realized in 2015. When reviewing profitability, the Committee and the Board also considered court cases in which adviser profitability was an issue in whole or in part, the performance of similarly managed funds, the performance of the Fund, and the expense ratio of the Fund. In addition, the Committee and the Board considered information provided by the Investment Manager regarding the Investment Manager’s financial condition and comparing its profitability to that of other asset management firms that are, or are subsidiaries of, publicly traded companies. In this regard, the Committee and the Board also considered data provided by the independent fee consultant.
After reviewing these and related factors, the Committee and the Board concluded, within the context of their overall conclusions, that the costs of services provided and the profitability to the Investment Manager and its affiliates from their relationships with the Fund supported the continuation of the Management Agreement.
Economies of scale
The Committee and the Board considered the potential existence of economies of scale in the provision by the Investment Manager of services to the Fund, to groups of related funds, and to the Investment Manager’s investment advisory clients as a whole, and whether those economies of scale were shared with the Fund through breakpoints in investment management fees or other means, such as expense limitation arrangements and additional investments by the Investment Manager in investment, trading, compliance and other resources. The Committee and the Board noted that the management fee schedules for the Fund contained breakpoints that would reduce the fee rate on assets above specified threshold levels.
| 44 | Columbia California Tax-Exempt Fund | Annual Report 2017 |
Board Consideration and Approval of Management
Agreement (continued)
In considering these matters, the Committee and the Board also considered the costs of the services provided and the profitability to the Investment Manager and its affiliates from their relationships with the Fund, as discussed above. After reviewing these and related factors, the Committee and the Board concluded, within the context of their overall conclusions, that the extent to which any economies of scale were expected to be shared with the Fund supported the continuation of the Management Agreement.
Other benefits to the Investment Manager
The Committee and the Board received and considered information regarding “fall-out” or ancillary benefits received by the Investment Manager and its affiliates as a result of their relationships with the Fund, such as the engagement of the Investment Manager’s affiliates to provide distribution, transfer agency and shareholder services to the Fund. In this regard, among other matters, the Committee and the Board considered that the Fund’s distributor retains a portion of the distribution fees from the Fund and receives a portion of the sales charges on sales or redemptions of certain classes of shares of the Fund. The Committee and the Board also considered the benefits of research made available to the Investment Manager by reason of brokerage commissions generated by the Fund’s securities transactions, and reviewed information about the Investment Manager’s practices with respect to allocating portfolio transactions for brokerage and research services. The Committee and the Board recognized that the Investment Manager’s profitability would be somewhat lower without these benefits.
Conclusion
The Committee and the Board reviewed all of the above considerations in reaching their decisions to recommend or approve the continuation of the Management Agreement. In their deliberations, the Trustees did not identify any particular information that was all-important or controlling, and individual Trustees may have attributed different weights to the various factors. Based on their evaluation of all factors that they deemed to be material, including those factors described above, and assisted by the advice of independent legal counsel, the Board, including the Independent Trustees, voting separately, unanimously approved the continuation of the Management Agreement.
Columbia California Tax-Exempt Fund | Annual Report 2017
| 45 |
The Fund mails one shareholder report to each shareholder address. If you would like more than one report, please call shareholder services at 800.345.6611 and additional reports will be sent to you.
Proxy voting policies and procedures
The policy of the Board of Trustees is to vote the proxies of the companies in which the Fund holds investments consistent with the procedures as stated in the Statement of Additional Information (SAI). You may obtain a copy of the SAI without charge by calling 800.345.6611; contacting your financial intermediary; visiting investor.columbiathreadneedleus.com; or searching the website of the Securities and Exchange Commission (SEC) at sec.gov. Information regarding how the Fund voted proxies relating to portfolio securities is filed with the SEC by August 31st for the most recent 12-month period ending June 30th of that year, and is available without charge by visiting investor.columbiathreadneedleus.com, or searching the website of the SEC at sec.gov.
Quarterly schedule of investments
The Fund files a complete schedule of portfolio holdings with the SEC for the first and third quarters of each fiscal year on Form N-Q. The Fund’s Form N-Q is available on the SEC’s website at sec.gov and may be reviewed and copied at the SEC’s Public Reference Room in Washington, D.C. Information on the operation of the Public Reference Room may be obtained by calling 800.SEC.0330. The Fund’s complete schedule of portfolio holdings, as filed on Form N-Q, can also be obtained without charge, upon request, by calling 800.345.6611.
Additional Fund information
For more information about the Fund, please visit investor.columbiathreadneedleus.com or call 800.345.6611. Customer Service Representatives are available to answer your questions Monday through Friday from 8 a.m. to 7 p.m. Eastern time.
Fund investment manager
Columbia Management Investment Advisers, LLC
225 Franklin Street
Boston, MA 02110
Fund distributor
Columbia Management Investment Distributors, Inc.
225 Franklin Street
Boston, MA 02110
Fund transfer agent
Columbia Management Investment Services Corp.
P.O. Box 8081
Boston, MA 02266-8081
| 46 | Columbia California Tax-Exempt Fund | Annual Report 2017 |
[THIS PAGE INTENTIONALLY LEFT BLANK]
[THIS PAGE INTENTIONALLY LEFT BLANK]
[THIS PAGE INTENTIONALLY LEFT BLANK]
Columbia California Tax-Exempt Fund
P.O. Box 8081
Boston, MA 02266-8081
Please read and consider the investment objectives, risks, charges and expenses for any fund carefully before investing. For a prospectus and summary prospectus, which contains this and other important information about the Fund, go to
investor.columbiathreadneedleus.com. The Fund is distributed by Columbia Management Investment Distributors, Inc., member FINRA, and managed by Columbia Management Investment Advisers, LLC.
Columbia Threadneedle Investments (Columbia Threadneedle) is the global brand name of the Columbia and Threadneedle group of companies. All rights reserved. Columbia Management Investment Distributors, Inc., 225 Franklin Street, Boston, MA 02110-2804
© 2017 Columbia Management Investment Advisers, LLC.
investor.columbiathreadneedleus.com

Annual Report
October 31, 2017
Columbia AMT-Free Intermediate Muni Bond Fund
Not FDIC Insured • No bank guarantee • May lose value
Dear Shareholders,
The current outlook for financial markets is clouded by two primary concerns: the high valuation of equities and the direction of interest rates. Following the U.S. presidential election, U.S. equities rallied based on the assumption that the new administration’s policies would stimulate growth quickly. Unfortunately it’s unclear whether those measures will get passed, much less passed quickly. In fixed income, uncertainty stems from the possibility that interest rates won’t rise as rapidly as expected if the administration’s proposed growth policies are not implemented.
Given this uncertainty, investors value a consistent approach more than ever. Investors want strong, repeatable risk-adjusted returns. Consistency — not surprises. As a leading global asset manager, we believe our consistent, collaborative investment approach enables us to deliver the dependable experience your portfolio demands. So, how do we strive to deliver a consistent investment experience?
Better insights
Your portfolio benefits from the investment insights uncovered by our talented investment teams around the world.
Better decisions
Our collaborative, interactive environment enables our investment teams to construct portfolios that take advantage of the best investment ideas.
Better outcomes
We aim to deliver a consistent experience, which means fewer surprises, dependable insights, and products designed to do the thing you want.
Whether you’re trying to save money to help your children go to college or for your own retirement, it’s the consistency of the return that is most essential. People who chase higher returns are usually also the first to sell when that investment goes through a bad patch. We try to combat this behavioral tendency by offering strategies that aim for a more consistent return. Our goal is for investors to panic less during periods of volatility, which can have a significant effect on their long-term results.
Nothing is more important to us than making sure those who have entrusted us to protect and grow their assets can do what matters most to them: build a nest egg, leave a legacy, and live confidently — now and throughout retirement. It’s why our talented professionals around the world work together to uncover uncommon opportunities and why our process encourages challenge and debate around our most compelling ideas to ensure better informed investment decisions, which hopefully lead to better outcomes for you.
Your success is our priority. Talk to your financial advisor about how working with Columbia Threadneedle Investments may help you position your portfolio for consistent, sustainable outcomes, no matter the market conditions.
Sincerely,
Christopher O. Petersen
President, Columbia Funds
Investors should consider the investment objectives, risks, charges and expenses of a mutual fund carefully before investing. For a free prospectus and summary prospectus, which contains this and other important information about a fund, visit investor.columbiathreadneedleus.com. The prospectus should be read carefully before investing.
Columbia Funds are distributed by Columbia Management Investment Distributors, Inc., member FINRA, and managed by Columbia Management Investment Advisers, LLC.
© 2017 Columbia Management Investment Advisers, LLC. All rights reserved.
Columbia AMT-Free Intermediate Muni Bond Fund | Annual Report 2017
Columbia AMT-Free Intermediate Muni Bond Fund | Annual Report 2017
Investment objective
Columbia AMT-Free Intermediate Muni Bond Fund (the Fund) seeks current income exempt from federal income tax, consistent with preservation of principal.
Portfolio management
Brian McGreevy
Co-manager
Managed Fund since 2009
Paul Fuchs, CFA
Co-manager
Managed Fund since 2012
Effective December 29, 2017, Mr. McGreevy will no longer manage the Fund. Paul Fuchs will continue as co-portfolio manager of the Fund and on December 29, 2017, Deborah Vargo will be added as a co-portfolio manager of the Fund.
| Average annual total returns (%) (for the period ended October 31, 2017) |
| | | Inception | 1 Year | 5 Years | 10 Years |
| Class A | Excluding sales charges | 11/25/02 | 1.39 | 2.23 | 3.70 |
| | Including sales charges | | -1.64 | 1.61 | 3.38 |
| Class C | Excluding sales charges | 11/25/02 | 0.64 | 1.69 | 3.32 |
| | Including sales charges | | -0.34 | 1.69 | 3.32 |
| Class R4* | 03/19/13 | 1.50 | 2.41 | 3.89 |
| Class R5* | 11/08/12 | 1.67 | 2.53 | 3.95 |
| Class T* | Excluding sales charges | 04/03/17 | 1.24 | 2.15 | 3.63 |
| | Including sales charges | | -1.25 | 1.64 | 3.37 |
| Class V | Excluding sales charges | 06/26/00 | 1.44 | 2.28 | 3.75 |
| | Including sales charges | | -3.34 | 1.29 | 3.25 |
| Class Y* | 03/01/17 | 1.56 | 2.43 | 3.91 |
| Class Z | 06/14/93 | 1.50 | 2.42 | 3.90 |
| Bloomberg Barclays 3-15 Year Blend Municipal Bond Index | | 2.05 | 2.70 | 4.39 |
Returns for Class A are shown with and without the maximum initial sales charge of 3.00%. Returns for Class C are shown with and without the 1.00% contingent deferred sales charge (CDSC) for the first year only. Returns for Class T shares are shown with and without the maximum initial sales charge of 2.50% per transaction. Returns for Class V are shown with and without the maximum initial sales charge of 4.75%. The Fund’s other classes are not subject to sales charges and have limited eligibility. Effective November 1, 2017, Class R4, Class R5, Class Y and Class Z shares were renamed Advisor Class, Institutional 2 Class, Institutional 3 Class and Institutional Class shares, respectively. Please see the Fund’s prospectus for details. Performance for different share classes will vary based on differences in sales charges and fees associated with each class. All results shown assume reinvestment of distributions during the period. Returns do not reflect the deduction of taxes that a shareholder may pay on Fund distributions or on the redemption of Fund shares. Performance results reflect the effect of any fee waivers or reimbursements of Fund expenses by Columbia Management Investment Advisers, LLC and/or any of its affiliates. Absent these fee waivers or expense reimbursement arrangements, performance results would have been lower.
The performance information shown represents past performance and is not a guarantee of future results. The investment return and principal value of your investment will fluctuate so that your shares, when redeemed, may be worth more or less than their original cost. Current performance may be lower or higher than the performance information shown. You may obtain performance information current to the most recent month-end by contacting your financial intermediary, visiting investor.columbiathreadneedleus.com or calling 800.345.6611.
| * | The returns shown for periods prior to the share class inception date (including returns for the Life of the Fund, if shown, which are since Fund inception) include the returns of the Fund’s oldest share class. These returns are adjusted to reflect any higher class-related operating expenses of the newer share classes, as applicable. Please visit investor.columbiathreadneedleus.com/investment-products/mutual-funds/appended-performance for more information. |
The Bloomberg Barclays 3–15 Year Blend Municipal Bond Index is an unmanaged index that tracks the performance of municipal bonds issued after December 31, 1990, with remaining maturities between 2 and 17 years and at least $7 million in principal amount outstanding.
Indices are not available for investment, are not professionally managed and do not reflect sales charges, fees, brokerage commissions, taxes or other expenses of investing. Securities in the Fund may not match those in an index.
| 2 | Columbia AMT-Free Intermediate Muni Bond Fund | Annual Report 2017 |
Fund at a Glance (continued)
Performance of a hypothetical $10,000 investment (October 31, 2007 — October 31, 2017)
The chart above shows the change in value of a hypothetical $10,000 investment in Class A shares of Columbia AMT-Free Intermediate Muni Bond Fund during the stated time period, and does not reflect the deduction of taxes that a shareholder may pay on Fund distributions or on the redemption of Fund shares.
| Quality breakdown (%) (at October 31, 2017) |
| AAA rating | 4.9 |
| AA rating | 33.0 |
| A rating | 43.4 |
| BBB rating | 12.5 |
| BB rating | 1.4 |
| CCC rating | 0.0 (a) |
| Not rated | 4.8 |
| Total | 100.0 |
Percentages indicated are based upon total fixed income investments (excluding Money Market Funds).
Bond ratings apply to the underlying holdings of the Fund and not the Fund itself and are divided into categories ranging from highest to lowest credit quality, determined by using the middle rating of Moody’s, S&P and Fitch, after dropping the highest and lowest available ratings. When ratings are available from only two rating agencies, the lower rating is used. When a rating is available from only one rating agency, that rating is used. When a bond is not rated by any rating agency, it is designated as “Not rated.” Credit quality ratings assigned by a rating agency are subjective opinions, not statements of fact, and are subject to change, including daily. The ratings assigned by credit rating agencies are but one of the considerations that the Investment Manager and/or Fund’s subadviser incorporates into its credit analysis process, along with such other issuer-specific factors as cash flows, capital structure and leverage ratios, ability to de-leverage (repay) through free cash flow, quality of management, market positioning and access to capital, as well as such security-specific factors as the terms of the security (e.g., interest rate and time to maturity) and the amount and type of any collateral.
Top Ten States/Territories (%)
(at October 31, 2017) |
| California | 17.9 |
| Texas | 12.3 |
| New York | 11.5 |
| Illinois | 8.5 |
| Florida | 7.7 |
| Pennsylvania | 3.8 |
| Colorado | 2.8 |
| North Carolina | 2.7 |
| Massachusetts | 2.6 |
| District of Columbia | 2.3 |
Percentages indicated are based upon total investments (excluding Money Market Funds).
For further detail about these holdings, please refer to the section entitled “Portfolio of Investments.”
Fund holdings are as of the date given, are subject to change at any time, and are not recommendations to buy or sell any security.
Columbia AMT-Free Intermediate Muni Bond Fund | Annual Report 2017
| 3 |
Manager Discussion of Fund Performance
The Fund’s Class A shares returned 1.39% excluding sales charges during the 12-month period ended October 31, 2017. The Class Z shares of the Fund returned 1.50% for the same time period. The Fund’s benchmark, the Bloomberg Barclays 3-15 Year Blend Municipal Bond Index, returned 2.05% for the same 12 months. The Fund’s underperformance was largely the result of its below-average interest-rate sensitivity, a headwind at a time of falling yields.
Market overview
Despite a rocky start, municipal bonds posted positive returns during the 12 months ended October 31, 2017. The market initially sold off in the early weeks of the period after the surprising results of the U.S. presidential election raised the prospects of higher growth, tax reform and reduced regulation under a new administration. In the U.S. Treasury market, the yield on the 10-year note rose from 1.79% on the Friday before the election to 2.60% by mid-December. (Prices and yields move in opposite directions). Municipal bond yields followed Treasuries higher in that interval, with yields on AAA-rated, 10-year issues rising by 0.75 percentage points. The sharp sell-off fueled redemptions from municipal bond funds, exacerbating the downturn.
As 2017 progressed, the fear of higher rates began to abate once it became apparent that Congress and the Trump administration would be unable to enact their policy proposals as quickly as originally expected. Investors initially anticipated action on health care and tax reform early in the presidential term, which increased expectations for stronger growth and raised the possibility of higher interest rates. Yields started falling modestly in March 2017 when these developments failed to come to fruition, and the combination of a lower new-issue supply and renewed inflows into mutual funds augmented the positive tone in the market. As of October 31, 2017, the year-to-date new-issue supply stood 15-20% below the level reached in the first ten months of 2016. At the same time, demand remained strong as older bonds matured or were called away and investors redeployed the cash back into the tax-exempt area. The ensuing recovery in municipal bonds enabled the asset class to finish in positive territory for the full year.
Pension issues continued to dominate the headlines, with Illinois and Chicago struggling to adopt budgets and several other states, including New Jersey, Connecticut, Pennsylvania and Kentucky, experiencing wider credit spreads as fears of credit-rating downgrades began to emerge. After a drawn-out budget negotiation in Illinois, the Illinois state government approved budget and revenue packages in late July. This favorable development sparked a rally in the bonds of the state and City of Chicago, and both finished among the top performers in the benchmark for the full 12 months. However, the State of Connecticut continued to struggle with budget issues before eventually passing its budget four months late. Additionally, the City of Hartford explored the possibility of bankruptcy after its debt was downgraded to below investment grade by the rating agencies. At the sector level, hospital bonds produced returns slightly better than the index, albeit with greater volatility than in past years due to the potential changes to the Affordable Care Act (ACA).
Contributors and detractors
The Fund modestly underperformed its benchmark due to its slightly shorter duration profile and higher weighting in bonds with shorter maturities. (Duration is a measure of interest-rate sensitivity.) While this aspect of our positioning helped results early in the period when rates were rising, it proved to be a detractor for the full year given the subsequent recovery in the market.
Transportation was the best performing sector for the Fund, with returns that exceeded the benchmark components. Bonds with dedicated revenue streams that lack the pension issues faced by the issuers of general obligation (GO) debt generally outperformed, including those issued to finance toll roads. The Fund’s overweight in zero-coupon bonds, which performed well during the rally due to their longer durations, also aided results. The Fund had an equal-weighting in Chicago GOs, but we added value by being overweight in longer term issues.
We held a position in the Virgin Islands early in the period, which hurt performance once the Virgin Island bonds started to reflect the potential for a debt restructuring due to its budget problems and similarities to Puerto Rico. We exited the position in the first quarter of 2017, and we had no weighting at the close of the period. The Fund’s exposure to bonds with shorter maturities than the benchmark was a drag on results given that the front end of the yield curve lagged during the rally. We used these holdings to maintain liquidity in the portfolio, cover redemptions and fund new purchases of longer maturity issues.
| 4 | Columbia AMT-Free Intermediate Muni Bond Fund | Annual Report 2017 |
Manager Discussion of Fund Performance (continued)
Fund positioning
Yield spreads stood at tight levels at the close of the period, as the resolution of the budget difficulties in Illinois and Chicago took some of the anxiety out of the market. However, pension concerns remained a potential driver of performance in Connecticut, Pennsylvania, New Jersey and a few large metropolitan areas. The rating agencies have been quicker to downgrade if they do not see progress being made around pension funding and reform. We are therefore monitoring these developments closely, and we are watching to see if lower current rates lead to increased supply by improving the refinancing possibilities for some issuers.
We maintained a cautious outlook throughout the period, with a slightly short to neutral duration positioning. Our expectation was for higher volatility caused by the debate about changes to the ACA, tax-reform discussions and their potential impact on the municipal tax exemption, and the U.S. Federal Reserve’s desire to raise interest rates. We favored securities with limited pension issues or where yield spreads provided attractive compensation for the associated risks. We saw compelling values in the transportation and toll-road sectors, as well as in the bonds of some lower rated student housing and continuing care retirement communities. We also identified value in lower coupon issues, which offered greater yield spreads than bonds with traditional 5% coupons.
Fixed-income securities present issuer default risk. The Fund invests substantially in municipal securities and will be affected by tax, legislative, regulatory, demographic or political changes, as well as changes impacting a state’s financial, economic or other conditions. A relatively small number of tax-exempt issuers may necessitate the Fund investing more heavily in a single issuer and, therefore, be more exposed to the risk of loss than a fund that invests more broadly. Prepayment and extension risk exists because the timing of payments on a loan, bond or other investment may accelerate when interest rates fall or decelerate when interest rates rise which may reduce investment opportunities and potential returns. A rise in interest rates may result in a price decline of fixed-income instruments held by the Fund, negatively impacting its performance and NAV. Falling rates may result in the Fund investing in lower yielding debt instruments, lowering the Fund’s income and yield. These risks may be heightened for longer maturity and duration securities. Non-investment-grade (high-yield or junk) securities present greater price volatility and more risk to principal and income than higher rated securities. Market risk may affect a single issuer, sector of the economy, industry or the market as a whole. Federal and state tax rules apply to capital gain distributions and any gains or losses on sales. Income may be subject to state, local or alternative minimum taxes. Liquidity risk is associated with the difficulty of selling underlying investments at a desirable time or price. See the Fund’s prospectus for more information on these and other risks.
The views expressed in this report reflect the current views of the respective parties. These views are not guarantees of future performance and involve certain risks, uncertainties and assumptions that are difficult to predict, so actual outcomes and results may differ significantly from the views expressed. These views are subject to change at any time based upon economic, market or other conditions and the respective parties disclaim any responsibility to update such views. These views may not be relied on as investment advice and, because investment decisions for a Columbia fund are based on numerous factors, may not be relied on as an indication of trading intent on behalf of any particular Columbia fund. References to specific securities should not be construed as a recommendation or investment advice.
Columbia AMT-Free Intermediate Muni Bond Fund | Annual Report 2017
| 5 |
Understanding Your Fund’s Expenses
(Unaudited)
As an investor, you incur two types of costs. There are transaction costs, which generally include sales charges on purchases and may include redemption fees. There are also ongoing costs, which generally include management fees, distribution and/or service fees, and other fund expenses. The following information is intended to help you understand your ongoing costs (in dollars) of investing in the Fund and to help you compare these costs with the ongoing costs of investing in other mutual funds.
Analyzing your Fund’s expenses
To illustrate these ongoing costs, we have provided examples and calculated the expenses paid by investors in each share class of the Fund during the period. The actual and hypothetical information in the table is based on an initial investment of $1,000 at the beginning of the period indicated and held for the entire period. Expense information is calculated two ways and each method provides you with different information. The amount listed in the “Actual” column is calculated using the Fund’s actual operating expenses and total return for the period. You may use the Actual information, together with the amount invested, to estimate the expenses that you paid over the period. Simply divide your account value by $1,000 (for example, an $8,600 account value divided by $1,000 = 8.6), then multiply the results by the expenses paid during the period under the “Actual” column. The amount listed in the “Hypothetical” column assumes a 5% annual rate of return before expenses (which is not the Fund’s actual return) and then applies the Fund’s actual expense ratio for the period to the hypothetical return. You should not use the hypothetical account values and expenses to estimate either your actual account balance at the end of the period or the expenses you paid during the period. See “Compare with other funds” below for details on how to use the hypothetical data.
Compare with other funds
Since all mutual funds are required to include the same hypothetical calculations about expenses in shareholder reports, you can use this information to compare the ongoing cost of investing in the Fund with other funds. To do so, compare the hypothetical example with the 5% hypothetical examples that appear in the shareholder reports of other funds. As you compare hypothetical examples of other funds, it is important to note that hypothetical examples are meant to highlight the ongoing costs of investing in a fund only and do not reflect any transaction costs, such as sales charges, or redemption or exchange fees. Therefore, the hypothetical calculations are useful in comparing ongoing costs only, and will not help you determine the relative total costs of owning different funds. If transaction costs were included in these calculations, your costs would be higher.
| May 1, 2017 — October 31, 2017 |
| | Account value at the
beginning of the
period ($) | Account value at the
end of the
period ($) | Expenses paid during
the period ($) | Fund’s annualized
expense ratio (%) |
| | Actual | Hypothetical | Actual | Hypothetical | Actual | Hypothetical | Actual |
| Class A | 1,000.00 | 1,000.00 | 1,021.40 | 1,021.50 | 4.02 | 4.02 | 0.78 |
| Class C | 1,000.00 | 1,000.00 | 1,017.10 | 1,018.19 | 7.35 | 7.35 | 1.43 |
| Class R4 | 1,000.00 | 1,000.00 | 1,021.50 | 1,022.52 | 2.99 | 2.99 | 0.58 |
| Class R5 | 1,000.00 | 1,000.00 | 1,022.80 | 1,022.88 | 2.63 | 2.63 | 0.51 |
| Class T | 1,000.00 | 1,000.00 | 1,020.20 | 1,021.25 | 4.27 | 4.27 | 0.83 |
| Class V (formerly Class T) | 1,000.00 | 1,000.00 | 1,021.70 | 1,021.76 | 3.76 | 3.76 | 0.73 |
| Class Y | 1,000.00 | 1,000.00 | 1,022.00 | 1,023.08 | 2.42 | 2.42 | 0.47 |
| Class Z | 1,000.00 | 1,000.00 | 1,021.50 | 1,022.52 | 2.99 | 2.99 | 0.58 |
Expenses paid during the period are equal to the annualized expense ratio for each class as indicated above, multiplied by the average account value over the period and then multiplied by the number of days in the Fund’s most recent fiscal half year and divided by 365.
Expenses do not include fees and expenses incurred indirectly by the Fund from its investment in underlying funds, including affiliated and non-affiliated pooled investment vehicles, such as mutual funds and exchange-traded funds.
Had Columbia Management Investment Advisers, LLC and/or certain of its affiliates not waived/reimbursed certain fees and expenses, account value at the end of the period would have been reduced.
| 6 | Columbia AMT-Free Intermediate Muni Bond Fund | Annual Report 2017 |
Portfolio of Investments
October 31, 2017
(Percentages represent value of investments compared to net assets)
| Floating Rate Notes 1.0% |
| Issue Description | Effective
Yield | | Principal
Amount ($) | Value ($) |
| New York 0.6% |
| New York City Transitional Finance Authority(a),(b) |
| Subordinated Revenue Bonds |
| Future Tax Secured |
| VRDN Series 2016 (JPMorgan Chase Bank) |
| 02/01/2045 | 0.900% | | 5,000,000 | 5,000,000 |
| New York City Water & Sewer System(a),(b) |
| Revenue Bonds |
| 2nd General Resolution |
| VRDN Series 2012 (State Street Bank and Trust Co.) |
| 06/15/2032 | 0.920% | | 3,750,000 | 3,750,000 |
| VRDN Series 2016BB (State Street Bank and Trust Co.) |
| 06/15/2049 | 0.920% | | 3,000,000 | 3,000,000 |
| Total | 11,750,000 |
| Utah 0.4% |
| City of Murray(a),(b) |
| Revenue Bonds |
| IHC Health Services, Inc. |
| VRDN Series 2005A (JPMorgan Chase Bank NA) |
| 05/15/2037 | 0.900% | | 2,000,000 | 2,000,000 |
| City of Murray(b) |
| Revenue Bonds |
| IHC Health Services, Inc. |
| VRDN Series 2005B |
| 05/15/2037 | 0.900% | | 5,130,000 | 5,130,000 |
| Total | 7,130,000 |
Total Floating Rate Notes
(Cost $18,880,000) | 18,880,000 |
|
| Municipal Bonds 97.6% |
| Issue Description | Coupon
Rate | | Principal
Amount ($) | Value ($) |
| Alabama 0.8% |
| Alabama Federal Aid Highway Finance Authority |
| Revenue Bonds |
| Series 2017A |
| 09/01/2026 | 5.000% | | 5,000,000 | 6,181,200 |
| Alabama Public School & College Authority |
| Refunding Revenue Bonds |
| Series 2009A |
| 05/01/2019 | 5.000% | | 10,000,000 | 10,572,900 |
| Total | 16,754,100 |
| Alaska 1.1% |
| City of Valdez |
| Refunding Revenue Bonds |
| BP Pipelines, Inc. Project |
| Series 2003B |
| 01/01/2021 | 5.000% | | 19,460,000 | 21,512,057 |
| Municipal Bonds (continued) |
| Issue Description | Coupon
Rate | | Principal
Amount ($) | Value ($) |
| Arizona 0.2% |
| La Paz County Industrial Development Authority |
| Revenue Bonds |
| Charter School Solutions - Harmony Public |
| Series 2016 |
| 02/15/2026 | 5.000% | | 1,250,000 | 1,400,975 |
| 02/15/2036 | 5.000% | | 2,800,000 | 3,007,928 |
| Total | 4,408,903 |
| Arkansas 0.6% |
| Pulaski County Public Facilities Board |
| Revenue Bonds |
| Series 2014 |
| 12/01/2029 | 5.000% | | 4,695,000 | 5,370,141 |
| 12/01/2031 | 5.000% | | 5,185,000 | 5,885,597 |
| Total | 11,255,738 |
| California 17.7% |
| California Educational Facilities Authority |
| Revenue Bonds |
| Chapman University |
| Series 2015 |
| 04/01/2028 | 5.000% | | 1,000,000 | 1,172,640 |
| 04/01/2029 | 5.000% | | 1,650,000 | 1,923,900 |
| 04/01/2030 | 5.000% | | 1,700,000 | 1,966,033 |
| California Health Facilities Financing Authority |
| Refunding Revenue Bonds |
| El Camino Hospital |
| Series 2015A |
| 02/01/2029 | 5.000% | | 1,485,000 | 1,724,070 |
| Revenue Bonds |
| El Camino Hospital |
| Series 2017 |
| 02/01/2034 | 5.000% | | 1,750,000 | 2,041,900 |
| Sutter Health Obligation Group |
| Series 2016A |
| 11/15/2033 | 5.000% | | 5,000,000 | 5,853,300 |
| California Infrastructure & Economic Development Bank |
| Refunding Revenue Bonds |
| Pacific Gas and Electric |
| Series 2017B |
| 11/01/2026 | 1.750% | | 500,000 | 500,435 |
| California Municipal Finance Authority |
| Refunding Revenue Bonds |
| Biola University |
| Series 2017 |
| 10/01/2033 | 5.000% | | 625,000 | 737,956 |
| 10/01/2034 | 5.000% | | 570,000 | 670,331 |
| Retirement Housing Foundation |
| Series 2017 |
| 11/15/2032 | 5.000% | | 850,000 | 1,051,017 |
The accompanying Notes to Financial Statements are an integral part of this statement.
Columbia AMT-Free Intermediate Muni Bond Fund | Annual Report 2017
| 7 |
Portfolio of Investments (continued)
October 31, 2017
| Municipal Bonds (continued) |
| Issue Description | Coupon
Rate | | Principal
Amount ($) | Value ($) |
| California School Finance Authority(c) |
| Refunding Revenue Bonds |
| Aspire Public Schools |
| Series 2016 |
| 08/01/2036 | 5.000% | | 2,085,000 | 2,313,495 |
| California State Public Works Board |
| Refunding Revenue Bonds |
| Various Capital Projects |
| Series 2012G |
| 11/01/2028 | 5.000% | | 5,510,000 | 6,366,144 |
| Revenue Bonds |
| Various Capital Projects |
| Series 2011A |
| 10/01/2022 | 5.250% | | 3,395,000 | 3,874,374 |
| Series 2012A |
| 04/01/2028 | 5.000% | | 10,000,000 | 11,392,800 |
| Series 2013I |
| 11/01/2028 | 5.250% | | 9,225,000 | 10,991,956 |
| 11/01/2029 | 5.000% | | 5,000,000 | 5,834,550 |
| 11/01/2031 | 5.500% | | 2,930,000 | 3,508,675 |
| Various Correctional Facilities |
| Series 2014A |
| 09/01/2031 | 5.000% | | 15,350,000 | 17,997,875 |
| California Statewide Communities Development Authority |
| Revenue Bonds |
| Henry Mayo Newhall Memorial |
| Series 2014A (AGM) |
| 10/01/2034 | 5.000% | | 5,000,000 | 5,604,600 |
| Series 2017 |
| 05/15/2033 | 5.000% | | 1,350,000 | 1,589,625 |
| 05/15/2034 | 5.000% | | 1,000,000 | 1,172,030 |
| 05/15/2035 | 5.000% | | 2,200,000 | 2,568,500 |
| City of Tulare Sewer |
| Refunding Revenue Bonds |
| Series 2015 (AGM) |
| 11/15/2030 | 5.000% | | 1,910,000 | 2,264,840 |
| 11/15/2031 | 5.000% | | 1,000,000 | 1,183,380 |
| 11/15/2032 | 5.000% | | 1,610,000 | 1,893,682 |
| City of Vernon Electric System |
| Unrefunded Revenue Bonds |
| Series 2009A |
| 08/01/2021 | 5.125% | | 5,110,000 | 5,407,198 |
| Del Mar Race Track Authority |
| Refunding Revenue Bonds |
| Series 2015 |
| 10/01/2035 | 5.000% | | 1,665,000 | 1,825,656 |
| Foothill-Eastern Transportation Corridor Agency |
| Subordinated Refunding Revenue Bonds |
| Series 2014B-3 |
| 01/15/2053 | 5.500% | | 9,000,000 | 10,220,490 |
| Municipal Bonds (continued) |
| Issue Description | Coupon
Rate | | Principal
Amount ($) | Value ($) |
| Golden State Tobacco Securitization Corp. |
| Asset-Backed Refunding Revenue Bonds |
| Series 2015A |
| 06/01/2033 | 5.000% | | 5,250,000 | 6,111,735 |
| Refunding Revenue Bonds |
| Series 2017A-1 |
| 06/01/2024 | 5.000% | | 5,000,000 | 5,826,600 |
| Hartnell Community College District(d) |
| Unlimited General Obligation Refunding Bonds |
| Capital Appreciation Serial Bonds |
| Series 2015A |
| 08/01/2035 | 0.000% | | 2,650,000 | 1,351,182 |
| La Quinta Redevelopment Agency Successor Agency |
| Refunding Tax Allocation Bonds |
| Redevelopment Project |
| Subordinated Series 2013A |
| 09/01/2029 | 5.000% | | 5,000,000 | 5,732,550 |
| Los Angeles County Sanitation Districts Financing Authority |
| Subordinated Refunding Revenue Bonds |
| Capital Projects - District #14 |
| Series 2015 |
| 10/01/2033 | 5.000% | | 4,000,000 | 4,742,280 |
| Manteca Unified School District(d) |
| Unlimited General Obligation Bonds |
| Capital Appreciation-Election of 2004 |
| Series 2006 (NPFGC) |
| 08/01/2024 | 0.000% | | 5,000,000 | 4,310,900 |
| Monrovia Unified School District |
| Unlimited General Obligation Refunding Bonds |
| Series 2005 (NPFGC) |
| 08/01/2021 | 5.250% | | 5,600,000 | 6,299,160 |
| Oakland Unified School District/Alameda County |
| Prerefunded 08/01/19 Unlimited General Obligation Bonds |
| Election of 2006 |
| Series 2009A |
| 08/01/2029 | 6.125% | | 14,500,000 | 15,778,320 |
| Pico Rivera Water Authority |
| Revenue Bonds |
| Water System Project |
| Series 1999A (NPFGC) |
| 05/01/2029 | 5.500% | | 3,000,000 | 3,578,250 |
| Rancho Santiago Community College District(d) |
| Unlimited General Obligation Bonds |
| Capital Appreciation-Election of 2002 |
| Series 2006C (AGM) |
| 09/01/2031 | 0.000% | | 28,000,000 | 18,397,120 |
| San Francisco City & County Airports Commission - San Francisco International Airport |
| Revenue Bonds |
| Series 2010A |
| 05/01/2029 | 4.900% | | 5,000,000 | 5,363,000 |
The accompanying Notes to Financial Statements are an integral part of this statement.
| 8 | Columbia AMT-Free Intermediate Muni Bond Fund | Annual Report 2017 |
Portfolio of Investments (continued)
October 31, 2017
| Municipal Bonds (continued) |
| Issue Description | Coupon
Rate | | Principal
Amount ($) | Value ($) |
| San Joaquin Hills Transportation Corridor Agency(d) |
| Revenue Bonds |
| Senior Lien |
| Series 1993 Escrowed to Maturity |
| 01/01/2025 | 0.000% | | 22,405,000 | 19,677,863 |
| San Jose Financing Authority |
| Refunding Revenue Bonds |
| Civic Center Project |
| Series 2013A |
| 06/01/2029 | 5.000% | | 12,000,000 | 13,981,440 |
| San Mateo County Community College District(d) |
| Unlimited General Obligation Bonds |
| Capital Appreciation-Election of 2005 |
| Series 2006A (NPFGC) |
| 09/01/2020 | 0.000% | | 9,310,000 | 8,963,575 |
| Simi Valley Unified School District |
| Unlimited General Obligation Refunding Bonds |
| Series 2017 |
| 08/01/2025 | 5.000% | | 2,400,000 | 2,966,664 |
| Southern California Public Power Authority |
| Revenue Bonds |
| Project No. 1 |
| Series 2007A |
| 11/01/2022 | 5.250% | | 2,500,000 | 2,875,575 |
| Windy Point/Windy Flats Project |
| Series 2010-1 |
| 07/01/2028 | 5.000% | | 10,000,000 | 10,971,000 |
| 07/01/2030 | 5.000% | | 15,875,000 | 17,377,092 |
| State of California |
| Prerefunded 07/01/19 Unlimited General Obligation Bonds |
| Series 2009A |
| 07/01/2020 | 5.000% | | 12,500,000 | 13,318,500 |
| Unlimited General Obligation Bonds |
| Series 2015 |
| 03/01/2033 | 5.000% | | 5,000,000 | 5,836,000 |
| Various Purpose |
| Series 2009 |
| 10/01/2022 | 5.250% | | 25,000,000 | 26,959,250 |
| Series 2010 |
| 03/01/2025 | 5.000% | | 1,000,000 | 1,087,060 |
| Series 2011 |
| 09/01/2031 | 5.000% | | 10,000,000 | 11,345,900 |
| Unlimited General Obligation Refunding Bonds |
| Various Purpose |
| Series 2017 |
| 11/01/2028 | 5.000% | | 8,225,000 | 10,198,260 |
| Municipal Bonds (continued) |
| Issue Description | Coupon
Rate | | Principal
Amount ($) | Value ($) |
| Tustin Community Facilities District |
| Refunding Special Tax Bonds |
| Legacy Villages of Columbus #06-1 |
| Series 2015 |
| 09/01/2031 | 5.000% | | 1,000,000 | 1,149,150 |
| 09/01/2033 | 5.000% | | 1,250,000 | 1,433,600 |
| West Contra Costa Unified School District(d) |
| Unlimited General Obligation Bonds |
| Series 2005 (NPFGC) |
| 08/01/2020 | 0.000% | | 7,285,000 | 6,953,970 |
| Total | 346,237,448 |
| Colorado 2.8% |
| Board of Governors of Colorado State University System |
| Refunding Revenue Bonds |
| Series 2013A |
| 03/01/2031 | 5.000% | | 4,560,000 | 5,595,302 |
| City & County of Denver Airport System |
| Revenue Bonds |
| Series 2012B |
| 11/15/2032 | 5.000% | | 10,000,000 | 11,440,700 |
| Colorado Health Facilities Authority |
| Refunding Revenue Bonds |
| Covenant Retirement Communities |
| Series 2012A |
| 12/01/2027 | 5.000% | | 4,000,000 | 4,376,280 |
| Series 2015 |
| 12/01/2026 | 5.000% | | 1,860,000 | 2,102,432 |
| 12/01/2028 | 5.000% | | 1,000,000 | 1,108,220 |
| 12/01/2030 | 5.000% | | 1,400,000 | 1,533,840 |
| Evangelical Lutheran Good Samaritan Society |
| Series 2017 |
| 06/01/2030 | 5.000% | | 2,000,000 | 2,302,100 |
| NCMC, Inc. Project |
| Series 2016 |
| 05/15/2027 | 5.000% | | 1,440,000 | 1,718,381 |
| Revenue Bonds |
| Adventist Health Systems/Sunbelt |
| Series 2016 |
| 11/15/2036 | 5.000% | | 3,025,000 | 3,662,065 |
| Park Creek Metropolitan District |
| Refunding Tax Allocation Bonds |
| Limited Property Tax |
| Series 2015 |
| 12/01/2032 | 5.000% | | 1,500,000 | 1,654,920 |
| Regional Transportation District |
| Certificate of Participation |
| Series 2015 |
| 06/01/2027 | 5.000% | | 2,925,000 | 3,482,681 |
| Prerefunded 06/01/20 Certificate of Participation |
| Series 2010A |
| 06/01/2025 | 5.000% | | 9,135,000 | 9,997,253 |
The accompanying Notes to Financial Statements are an integral part of this statement.
Columbia AMT-Free Intermediate Muni Bond Fund | Annual Report 2017
| 9 |
Portfolio of Investments (continued)
October 31, 2017
| Municipal Bonds (continued) |
| Issue Description | Coupon
Rate | | Principal
Amount ($) | Value ($) |
| Unrefunded Certificate of Participation |
| Series 2010A |
| 06/01/2025 | 5.000% | | 865,000 | 942,262 |
| University of Colorado Hospital Authority |
| Revenue Bonds |
| Series 2012A |
| 11/15/2027 | 5.000% | | 3,750,000 | 4,323,562 |
| Total | 54,239,998 |
| Connecticut 0.4% |
| Connecticut State Development Authority |
| Refunding Revenue Bonds |
| Connecticut Light & Power Co. Project |
| Series 2011 |
| 09/01/2028 | 4.375% | | 1,615,000 | 1,768,861 |
| Connecticut State Health & Educational Facility Authority |
| Revenue Bonds |
| Trinity College |
| Series 1998F (NPFGC) |
| 07/01/2021 | 5.500% | | 695,000 | 757,828 |
| Harbor Point Infrastructure Improvement District |
| Tax Allocation Bonds |
| Harbor Point Project |
| Series 2010A |
| 04/01/2022 | 7.000% | | 4,984,000 | 5,330,488 |
| Total | 7,857,177 |
| District of Columbia 2.2% |
| District of Columbia |
| Refunding Revenue Bonds |
| Children’s Hospital |
| Series 2015 |
| 07/15/2030 | 5.000% | | 3,000,000 | 3,508,440 |
| Friendship Public Charter School |
| Series 2016 |
| 06/01/2036 | 5.000% | | 3,000,000 | 3,280,440 |
| Metropolitan Washington Airports Authority |
| Revenue Bonds |
| Series 2009C |
| 10/01/2025 | 5.250% | | 8,920,000 | 9,252,270 |
| Metropolitan Washington Airports Authority Dulles Toll Road(d) |
| Revenue Bonds |
| Capital Appreciation-2nd Senior Lien |
| Series 2009B (AGM) |
| 10/01/2024 | 0.000% | | 20,980,000 | 17,405,428 |
| 10/01/2025 | 0.000% | | 7,500,000 | 5,990,475 |
| 10/01/2026 | 0.000% | | 5,000,000 | 3,847,850 |
| Total | 43,284,903 |
| Municipal Bonds (continued) |
| Issue Description | Coupon
Rate | | Principal
Amount ($) | Value ($) |
| Florida 7.6% |
| Capital Trust Agency, Inc.(e) |
| Revenue Bonds |
| Atlantic Housing Foundation |
| Subordinated Series 2008B |
| 07/15/2032 | 0.000% | | 1,835,000 | 1,376,250 |
| Central Florida Expressway Authority |
| Refunding Revenue Bonds |
| Senior Lien |
| Series 2016B |
| 07/01/2031 | 4.000% | | 2,000,000 | 2,167,420 |
| Series 2016A |
| 07/01/2031 | 4.000% | | 12,000,000 | 13,004,520 |
| Citizens Property Insurance Corp. |
| Revenue Bonds |
| Senior Secured |
| Series 2012A-1 |
| 06/01/2021 | 5.000% | | 16,965,000 | 19,103,099 |
| City of Lakeland |
| Refunding Revenue Bonds |
| 1st Mortgage-Carpenters Home Estates |
| Series 2008 |
| 01/01/2019 | 5.875% | | 935,000 | 964,228 |
| City of Port St. Lucie Utility System |
| Refunding Revenue Bonds |
| Series 2016 |
| 09/01/2028 | 5.000% | | 1,200,000 | 1,437,408 |
| County of Miami-Dade Aviation |
| Prerefunded 10/01/20 Revenue Bonds |
| Miami International |
| Series 2010 |
| 10/01/2025 | 5.500% | | 1,450,000 | 1,625,784 |
| Refunding Revenue Bonds |
| Series 2014B |
| 10/01/2032 | 5.000% | | 6,620,000 | 7,641,996 |
| Unrefunded Revenue Bonds |
| Miami International |
| Series 2010 |
| 10/01/2025 | 5.500% | | 4,550,000 | 5,091,859 |
| County of Miami-Dade Rickenbacker Causeway |
| Revenue Bonds |
| Series 2014 |
| 10/01/2029 | 5.000% | | 500,000 | 579,250 |
| 10/01/2031 | 5.000% | | 600,000 | 692,214 |
| 10/01/2033 | 5.000% | | 1,215,000 | 1,396,752 |
| County of Miami-Dade Water & Sewer System |
| Refunding Revenue Bonds |
| System |
| Series 2008B (AGM) |
| 10/01/2021 | 5.250% | | 20,000,000 | 22,906,000 |
The accompanying Notes to Financial Statements are an integral part of this statement.
| 10 | Columbia AMT-Free Intermediate Muni Bond Fund | Annual Report 2017 |
Portfolio of Investments (continued)
October 31, 2017
| Municipal Bonds (continued) |
| Issue Description | Coupon
Rate | | Principal
Amount ($) | Value ($) |
| Florida Development Finance Corp.(c) |
| Revenue Bonds |
| Miami Arts Charter School Project |
| Series 2014A |
| 06/15/2034 | 5.875% | | 1,665,000 | 1,638,010 |
| Florida Municipal Power Agency |
| Refunding Revenue Bonds |
| Series 2016A |
| 10/01/2030 | 5.000% | | 2,750,000 | 3,281,712 |
| Series 2017A |
| 10/01/2027 | 5.000% | | 5,000,000 | 6,150,700 |
| Hillsborough County Aviation Authority |
| Revenue Bonds |
| Tampa International Airport |
| Subordinated Series 2015B |
| 10/01/2031 | 5.000% | | 1,600,000 | 1,839,344 |
| 10/01/2032 | 5.000% | | 2,300,000 | 2,634,673 |
| Lee County School Board (The) |
| Refunding Certificate of Participation |
| Series 2014A |
| 08/01/2028 | 5.000% | | 2,000,000 | 2,337,000 |
| Miami-Dade County Expressway Authority |
| Refunding Revenue Bonds |
| Series 2016A |
| 07/01/2029 | 5.000% | | 2,175,000 | 2,568,283 |
| Mid-Bay Bridge Authority |
| Refunding Revenue Bonds |
| Series 2015A |
| 10/01/2030 | 5.000% | | 2,150,000 | 2,463,900 |
| Orange County Health Facilities Authority |
| Refunding Revenue Bonds |
| Orlando Health, Inc. |
| Series 2016A |
| 10/01/2035 | 5.000% | | 3,000,000 | 3,408,960 |
| Orange County School Board |
| Prerefunded 08/01/22 Certificate of Participation |
| Series 2012B |
| 08/01/2026 | 5.000% | | 6,500,000 | 7,548,255 |
| Refunding Certificate of Participation |
| Series 2016C |
| 08/01/2033 | 5.000% | | 8,500,000 | 9,984,780 |
| Pasco County School Board |
| Refunding Certificate of Participation |
| Series 2015A |
| 08/01/2026 | 5.000% | | 4,620,000 | 5,533,004 |
| 08/01/2027 | 5.000% | | 2,500,000 | 2,982,275 |
| Sarasota County Health Facilities Authority |
| Prerefunded 01/01/18 Refunding Revenue Bonds |
| Village On The Isle Project |
| Series 2007 |
| 01/01/2027 | 5.500% | | 4,000,000 | 4,028,640 |
| Municipal Bonds (continued) |
| Issue Description | Coupon
Rate | | Principal
Amount ($) | Value ($) |
| School Board of Miami-Dade County (The) |
| Refunding Certificate of Participation |
| Series 2015A |
| 05/01/2030 | 5.000% | | 2,500,000 | 2,893,400 |
| School District of Broward County |
| Refunding Certificate of Participation |
| Series 2012A |
| 07/01/2025 | 5.000% | | 5,280,000 | 6,019,781 |
| Southeast Overtown Park West Community Redevelopment Agency(c) |
| Tax Allocation Bonds |
| Series 2014A-1 |
| 03/01/2030 | 5.000% | | 2,925,000 | 3,248,505 |
| Sterling Hill Community Development District(e) |
| Special Assessment Bonds |
| Series 2003B |
| 11/01/2010 | 5.500% | | 137,787 | 96,451 |
| Volusia County Educational Facility Authority |
| Revenue Bonds |
| Series 2015B |
| 10/15/2030 | 5.000% | | 1,510,000 | 1,732,046 |
| Total | 148,376,499 |
| Georgia 1.9% |
| Bartow County Development Authority |
| Refunding Revenue Bonds |
| Georgia Power Co. Plant Bowen Project |
| Series 2017 |
| 09/01/2029 | 2.050% | | 3,600,000 | 3,594,420 |
| Burke County Development Authority |
| Refunding Revenue Bonds |
| Georgia Power Company Plant Vogtle |
| Series 2017 |
| 12/01/2049 | 1.850% | | 4,000,000 | 3,990,120 |
| City of Atlanta Department of Aviation |
| Subordinated Refunding Revenue Bonds |
| General Lien |
| Series 2014 |
| 01/01/2032 | 5.000% | | 2,000,000 | 2,338,680 |
| City of Atlanta Water & Wastewater |
| Refunding Revenue Bonds |
| Series 2015 |
| 11/01/2030 | 5.000% | | 2,500,000 | 2,966,175 |
| DeKalb County Hospital Authority |
| Revenue Bonds |
| DeKalb Medical Center, Inc. Project |
| Series 2010 |
| 09/01/2030 | 6.000% | | 5,000,000 | 5,480,900 |
| Fulton County Development Authority |
| Refunding Revenue Bonds |
| Spelman College |
| Series 2015 |
| 06/01/2032 | 5.000% | | 3,630,000 | 4,217,697 |
The accompanying Notes to Financial Statements are an integral part of this statement.
Columbia AMT-Free Intermediate Muni Bond Fund | Annual Report 2017
| 11 |
Portfolio of Investments (continued)
October 31, 2017
| Municipal Bonds (continued) |
| Issue Description | Coupon
Rate | | Principal
Amount ($) | Value ($) |
| Gainesville & Hall County Development Authority |
| Refunding Revenue Bonds |
| Riverside Military Academy |
| Series 2017 |
| 03/01/2037 | 5.000% | | 2,000,000 | 2,148,940 |
| Georgia State Road & Tollway Authority(c),(d) |
| Revenue Bonds |
| I-75 S Express Lanes Project |
| Series 2014 |
| 06/01/2024 | 0.000% | | 625,000 | 429,725 |
| 06/01/2034 | 0.000% | | 3,750,000 | 1,282,838 |
| Monroe County Development Authority |
| Refunding Revenue Bonds |
| Georgia Power Co.-Scherer |
| 1st Series 2017 |
| 07/01/2049 | 2.050% | | 1,500,000 | 1,497,675 |
| Richmond County Hospital Authority |
| Refunding Revenue Bonds |
| University Health Services, Inc. Project |
| Series 2016 |
| 01/01/2027 | 5.000% | | 2,000,000 | 2,405,060 |
| 01/01/2028 | 5.000% | | 950,000 | 1,129,322 |
| State of Georgia |
| Unlimited General Obligation Bonds |
| Series 2012A |
| 07/01/2031 | 4.000% | | 5,000,000 | 5,417,550 |
| Total | 36,899,102 |
| Idaho 0.2% |
| Idaho Health Facilities Authority |
| Revenue Bonds |
| Terraces of Boise Project |
| Series 2014A |
| 10/01/2024 | 7.000% | | 2,980,000 | 3,142,976 |
| Series 2014B-1 |
| 10/01/2022 | 6.500% | | 800,000 | 800,824 |
| Total | 3,943,800 |
| Illinois 8.4% |
| Chicago Midway International Airport |
| Refunding Revenue Bonds |
| 2nd Lien |
| Series 2014B |
| 01/01/2029 | 5.000% | | 6,150,000 | 7,068,502 |
| Series 2016B |
| 01/01/2035 | 4.000% | | 3,500,000 | 3,658,655 |
| Chicago O’Hare International Airport |
| General Obligation Refunding Bonds |
| Senior Lien |
| Series 2016B |
| 01/01/2033 | 5.000% | | 2,000,000 | 2,312,740 |
| Municipal Bonds (continued) |
| Issue Description | Coupon
Rate | | Principal
Amount ($) | Value ($) |
| Refunding Revenue Bonds |
| General Senior Lien |
| Series 2013B |
| 01/01/2028 | 5.250% | | 11,180,000 | 12,912,341 |
| Passenger Facility Charge |
| Series 2012A |
| 01/01/2028 | 5.000% | | 2,590,000 | 2,915,434 |
| 01/01/2029 | 5.000% | | 2,500,000 | 2,805,600 |
| 01/01/2030 | 5.000% | | 3,000,000 | 3,355,230 |
| Chicago Park District |
| Unlimited General Obligation Refunding Bonds |
| Limited Tax |
| Series 2014B |
| 01/01/2029 | 5.000% | | 2,500,000 | 2,794,875 |
| Chicago Transit Authority |
| Revenue Bonds |
| Series 2011 |
| 12/01/2029 | 5.250% | | 7,485,000 | 8,187,318 |
| 12/01/2030 | 5.250% | | 1,925,000 | 2,101,734 |
| City of Chicago |
| Revenue Bonds |
| Asphalt Operating Services - Recovery Zone Facility |
| Series 2010 |
| 12/01/2018 | 6.125% | | 1,400,000 | 1,403,122 |
| Unlimited General Obligation Bonds |
| Series 2002B |
| 01/01/2027 | 5.125% | | 3,155,000 | 3,456,302 |
| Series 2015A |
| 01/01/2023 | 5.000% | | 5,000,000 | 5,477,400 |
| Unlimited General Obligation Refunding Bonds |
| Project |
| Series 2014A |
| 01/01/2030 | 5.250% | | 3,000,000 | 3,214,740 |
| 01/01/2032 | 5.250% | | 3,845,000 | 4,081,314 |
| City of Chicago Wastewater Transmission |
| Refunding Revenue Bonds |
| Second Lien |
| Series 2017B |
| 01/01/2033 | 5.000% | | 7,085,000 | 7,953,054 |
| City of Chicago Waterworks |
| Refunding Revenue Bonds |
| 2nd Lien |
| Series 2016 |
| 11/01/2027 | 5.000% | | 1,250,000 | 1,460,888 |
| Illinois Finance Authority |
| Refunding Revenue Bonds |
| Rush University Medical Center |
| Series 2015A |
| 11/15/2032 | 5.000% | | 10,000,000 | 11,255,700 |
The accompanying Notes to Financial Statements are an integral part of this statement.
| 12 | Columbia AMT-Free Intermediate Muni Bond Fund | Annual Report 2017 |
Portfolio of Investments (continued)
October 31, 2017
| Municipal Bonds (continued) |
| Issue Description | Coupon
Rate | | Principal
Amount ($) | Value ($) |
| Illinois Municipal Electric Agency |
| Refunding Revenue Bonds |
| Series 2015A |
| 02/01/2030 | 5.000% | | 12,060,000 | 14,143,244 |
| Illinois State Toll Highway Authority |
| Revenue Bonds |
| Series 2014C |
| 01/01/2032 | 5.000% | | 9,600,000 | 11,035,872 |
| Unrefunded Revenue Bonds |
| Senior Series 2016A |
| 12/01/2031 | 4.000% | | 12,000,000 | 12,862,800 |
| Kane Cook & DuPage Counties School District No. U-46 Elgin |
| Unlimited General Obligation Refunding Bonds |
| Series 2015D |
| 01/01/2032 | 5.000% | | 1,800,000 | 2,057,742 |
| 01/01/2033 | 5.000% | | 2,000,000 | 2,277,780 |
| Railsplitter Tobacco Settlement Authority |
| Revenue Bonds |
| Series 2010 |
| 06/01/2019 | 5.000% | | 5,000,000 | 5,293,300 |
| 06/01/2021 | 5.250% | | 12,000,000 | 13,527,120 |
| State of Illinois |
| Unlimited General Obligation Bonds |
| Series 2013 |
| 07/01/2026 | 5.500% | | 10,100,000 | 11,161,914 |
| Series 2014 |
| 02/01/2031 | 5.250% | | 5,000,000 | 5,382,250 |
| Total | 164,156,971 |
| Indiana 0.6% |
| City of Indianapolis Thermal Energy System |
| Refunding Revenue Bonds |
| 1st Lien |
| Series 2014A |
| 10/01/2032 | 5.000% | | 1,400,000 | 1,592,346 |
| Indiana Finance Authority |
| Revenue Bonds |
| 1st Lien-CWA Authority, Inc. |
| Series 2011A |
| 10/01/2025 | 5.250% | | 1,750,000 | 1,999,952 |
| 2nd Lien-CWA Authority, Inc. |
| Series 2011B |
| 10/01/2023 | 5.250% | | 7,035,000 | 8,019,689 |
| Total | 11,611,987 |
| Kentucky 1.0% |
| Kentucky Municipal Power Agency |
| Refunding Revenue Bonds |
| Series 2015A |
| 09/01/2029 | 5.000% | | 4,000,000 | 4,578,480 |
| Municipal Bonds (continued) |
| Issue Description | Coupon
Rate | | Principal
Amount ($) | Value ($) |
| Louisville & Jefferson County Metropolitan Sewer District |
| Prerefunded 05/15/19 Revenue Bonds |
| Series 2009A |
| 05/15/2021 | 5.000% | | 7,445,000 | 7,882,543 |
| 05/15/2022 | 5.000% | | 7,825,000 | 8,284,875 |
| Total | 20,745,898 |
| Louisiana 1.1% |
| Louisiana Office Facilities Corp. |
| Refunding Revenue Bonds |
| State Capital |
| Series 2010A |
| 05/01/2020 | 5.000% | | 4,290,000 | 4,661,085 |
| Louisiana State Citizens Property Insurance Corp. |
| Refunding Revenue Bonds |
| Series 2015 (AGM) |
| 06/01/2022 | 5.000% | | 2,000,000 | 2,299,160 |
| New Orleans Aviation Board |
| Revenue Bonds |
| Consolidated Rental Car |
| Series 2009A |
| 01/01/2025 | 6.000% | | 4,250,000 | 4,439,932 |
| Parish of St. Charles |
| Revenue Bonds |
| Valero Energy Corp. |
| Series 2010 |
| 12/01/2040 | 4.000% | | 9,320,000 | 9,886,470 |
| Total | 21,286,647 |
| Maryland 0.1% |
| County of Howard |
| Refunding Revenue Bonds |
| Columbia Vantage House Corp. |
| Series 2017 |
| 04/01/2036 | 5.000% | | 1,000,000 | 1,037,210 |
| Maryland Health & Higher Educational Facilities Authority |
| Refunding Revenue Bonds |
| Meritus Medical Center Issue |
| Series 2015 |
| 07/01/2028 | 5.000% | | 1,300,000 | 1,485,393 |
| Total | 2,522,603 |
| Massachusetts 2.6% |
| Massachusetts Bay Transportation Authority(d) |
| Refunding Revenue Bonds |
| Series 2016A |
| 07/01/2029 | 0.000% | | 10,000,000 | 7,100,700 |
| Massachusetts Bay Transportation Authority |
| Unrefunded Revenue Bonds |
| General Transportation |
| Series 1991 (NPFGC) |
| 03/01/2021 | 7.000% | | 2,395,000 | 2,679,286 |
The accompanying Notes to Financial Statements are an integral part of this statement.
Columbia AMT-Free Intermediate Muni Bond Fund | Annual Report 2017
| 13 |
Portfolio of Investments (continued)
October 31, 2017
| Municipal Bonds (continued) |
| Issue Description | Coupon
Rate | | Principal
Amount ($) | Value ($) |
| Massachusetts Clean Water Trust (The) |
| Revenue Bonds |
| MWRA Program |
| Subordinated Series 1999A |
| 08/01/2019 | 6.000% | | 2,500,000 | 2,712,275 |
| Massachusetts Development Finance Agency |
| Refunding Revenue Bonds |
| Boston Medical Center |
| Series 2016E |
| 07/01/2033 | 5.000% | | 1,000,000 | 1,131,180 |
| Emerson College |
| Series 2017A |
| 01/01/2034 | 5.000% | | 1,000,000 | 1,165,470 |
| Lahey Clinic Obligation |
| Series 2015F |
| 08/15/2031 | 5.000% | | 2,490,000 | 2,873,211 |
| 08/15/2032 | 5.000% | | 4,120,000 | 4,732,273 |
| 08/15/2033 | 5.000% | | 4,845,000 | 5,528,678 |
| Revenue Bonds |
| Dana-Farber Cancer Institute |
| Series 2016 |
| 12/01/2034 | 5.000% | | 1,000,000 | 1,160,740 |
| UMass Boston Student Housing Project |
| Series 2016 |
| 10/01/2032 | 5.000% | | 1,300,000 | 1,455,571 |
| Massachusetts Health & Educational Facilities Authority |
| Revenue Bonds |
| Boston College |
| Series 2008M-1 |
| 06/01/2024 | 5.500% | | 2,670,000 | 3,263,755 |
| Massachusetts Port Authority |
| Revenue Bonds |
| Series 2010A |
| 07/01/2025 | 5.000% | | 1,500,000 | 1,645,245 |
| Massachusetts Water Pollution Abatement Trust (The) |
| Prerefunded 08/01/19 Revenue Bonds |
| State Revolving Fund |
| Series 2009-14 |
| 08/01/2024 | 5.000% | | 12,530,000 | 13,373,144 |
| Massachusetts Water Resources Authority |
| Refunding Revenue Bonds |
| Green Bonds |
| Series 2016C |
| 08/01/2036 | 4.000% | | 2,000,000 | 2,146,420 |
| Total | 50,967,948 |
| Municipal Bonds (continued) |
| Issue Description | Coupon
Rate | | Principal
Amount ($) | Value ($) |
| Michigan 1.6% |
| City of Detroit Sewage Disposal System |
| Refunding Revenue Bonds |
| Senior Lien |
| Series 2012A |
| 07/01/2026 | 5.250% | | 2,000,000 | 2,265,120 |
| 07/01/2027 | 5.250% | | 1,500,000 | 1,668,600 |
| Michigan Finance Authority |
| Refunding Revenue Bonds |
| McLaren Health Care Corp. |
| Series 2015 |
| 05/15/2029 | 5.000% | | 1,800,000 | 2,077,596 |
| Senior Lien - Great Lakes Water Authority |
| Series 2014C-6 |
| 07/01/2033 | 5.000% | | 800,000 | 891,864 |
| Series 2014H-1 |
| 10/01/2026 | 5.000% | | 3,300,000 | 3,816,252 |
| Trinity Health Credit |
| Series 2017 |
| 12/01/2031 | 5.000% | | 2,500,000 | 2,930,075 |
| Revenue Bonds |
| Local Government Loan Program - Great Lakes Water Authority |
| Series 2015 |
| 07/01/2033 | 5.000% | | 5,000,000 | 5,603,600 |
| Senior Lien - Great Lakes Water Authority |
| Series 2014C-3 (AGM) |
| 07/01/2032 | 5.000% | | 1,000,000 | 1,132,210 |
| Royal Oak Hospital Finance Authority |
| Refunding Revenue Bonds |
| William Beaumont Hospital |
| Series 2014D |
| 09/01/2032 | 5.000% | | 4,075,000 | 4,567,545 |
| State of Michigan Trunk Line |
| Revenue Bonds |
| Series 2011 |
| 11/15/2027 | 5.000% | | 1,000,000 | 1,131,120 |
| 11/15/2028 | 5.000% | | 1,000,000 | 1,130,280 |
| 11/15/2029 | 5.000% | | 1,205,000 | 1,359,975 |
| Wayne County Airport Authority |
| Refunding Revenue Bonds |
| Series 2017C |
| 12/01/2027 | 5.000% | | 1,000,000 | 1,229,540 |
| 12/01/2028 | 5.000% | | 900,000 | 1,094,004 |
| Total | 30,897,781 |
The accompanying Notes to Financial Statements are an integral part of this statement.
| 14 | Columbia AMT-Free Intermediate Muni Bond Fund | Annual Report 2017 |
Portfolio of Investments (continued)
October 31, 2017
| Municipal Bonds (continued) |
| Issue Description | Coupon
Rate | | Principal
Amount ($) | Value ($) |
| Minnesota 1.2% |
| City of Maple Grove |
| Refunding Revenue Bonds |
| Maple Grove Hospital Corp. |
| Series 2017 |
| 05/01/2029 | 5.000% | | 2,720,000 | 3,174,022 |
| 05/01/2030 | 5.000% | | 850,000 | 982,736 |
| City of St. Cloud |
| Refunding Revenue Bonds |
| Centracare Health |
| Series 2016A |
| 05/01/2027 | 5.000% | | 1,785,000 | 2,159,725 |
| County of Rice(c) |
| Revenue Bonds |
| Shattuck-St. Mary’s School |
| Series 2015A |
| 08/01/2022 | 5.000% | | 745,000 | 773,057 |
| Dakota County Community Development Agency |
| Revenue Bonds |
| Sanctuary at West St. Paul Project |
| Series 2015 |
| 08/01/2030 | 5.750% | | 1,075,000 | 1,079,064 |
| Housing & Redevelopment Authority of The City of St. Paul |
| Prerefunded 11/15/20 Revenue Bonds |
| HealthEast Care System Project |
| Series 2015 |
| 11/15/2028 | 5.250% | | 1,500,000 | 1,675,815 |
| Refunding Revenue Bonds |
| Fairview Health Services |
| Series 2017 |
| 11/15/2029 | 5.000% | | 1,050,000 | 1,259,160 |
| 11/15/2035 | 4.000% | | 755,000 | 797,189 |
| HealthPartners Obligation Group |
| Series 2015 |
| 07/01/2028 | 5.000% | | 6,400,000 | 7,518,528 |
| Sartell-St. Stephen Independent School District No. 748(d) |
| Unlimited General Obligation Bonds |
| School Building |
| Series 2016B (School District Credit Enhancement Program) |
| 02/01/2030 | 0.000% | | 2,065,000 | 1,433,957 |
| 02/01/2031 | 0.000% | | 2,190,000 | 1,457,007 |
| Woodbury Housing & Redevelopment Authority |
| Revenue Bonds |
| St. Therese of Woodbury |
| Series 2014 |
| 12/01/2034 | 5.000% | | 1,000,000 | 1,038,590 |
| Total | 23,348,850 |
| Municipal Bonds (continued) |
| Issue Description | Coupon
Rate | | Principal
Amount ($) | Value ($) |
| Mississippi 0.2% |
| State of Mississippi |
| Revenue Bonds |
| Series 2015E |
| 10/15/2029 | 5.000% | | 3,500,000 | 4,146,870 |
| Missouri 1.1% |
| Health & Educational Facilities Authority of the State of Missouri |
| Refunding Revenue Bonds |
| CoxHealth |
| Series 2015A |
| 11/15/2028 | 5.000% | | 6,210,000 | 7,275,698 |
| Revenue Bonds |
| Lutheran Senior Services |
| Series 2014 |
| 02/01/2026 | 5.000% | | 1,300,000 | 1,463,618 |
| 02/01/2029 | 5.000% | | 5,975,000 | 6,579,311 |
| Kirkwood Industrial Development Authority |
| Refunding Revenue Bonds |
| Aberdeen Heights Project |
| Series 2017 |
| 05/15/2037 | 5.250% | | 2,695,000 | 2,843,872 |
| Missouri Joint Municipal Electric Utility Commission |
| Refunding Revenue Bonds |
| Prairie State Project |
| Series 2015A |
| 12/01/2029 | 5.000% | | 2,000,000 | 2,334,280 |
| Poplar Bluff Regional Transportation Development District |
| Revenue Bonds |
| Series 2012 |
| 12/01/2026 | 3.250% | | 385,000 | 396,092 |
| St. Louis County Industrial Development Authority |
| Refunding Revenue Bonds |
| St. Andrew’s Resources for Seniors Obligated Group |
| Series 2015 |
| 12/01/2025 | 5.000% | | 1,565,000 | 1,675,583 |
| Total | 22,568,454 |
| Nebraska 0.7% |
| Public Power Generation Agency |
| Refunding Revenue Bonds |
| Whelan Energy Center Unit |
| Series 2015 |
| 01/01/2027 | 5.000% | | 11,865,000 | 13,935,205 |
| Nevada 2.0% |
| Carson City |
| Refunding Revenue Bonds |
| Carson Tahoe Regional Medical Center |
| Series 2012 |
| 09/01/2027 | 5.000% | | 3,250,000 | 3,584,750 |
The accompanying Notes to Financial Statements are an integral part of this statement.
Columbia AMT-Free Intermediate Muni Bond Fund | Annual Report 2017
| 15 |
Portfolio of Investments (continued)
October 31, 2017
| Municipal Bonds (continued) |
| Issue Description | Coupon
Rate | | Principal
Amount ($) | Value ($) |
| City of Sparks(c) |
| Tax Anticipation Revenue Bonds |
| Senior Sales |
| Series 2008A |
| 06/15/2020 | 6.500% | | 2,700,000 | 2,745,576 |
| Clark County School District |
| Limited General Obligation Bonds |
| Series 2015D |
| 06/15/2030 | 4.000% | | 9,360,000 | 10,184,616 |
| County of Clark |
| Limited General Obligation Refunding Bonds |
| Transportation |
| Series 2009A |
| 12/01/2028 | 5.000% | | 10,740,000 | 11,562,147 |
| County of Clark Department of Aviation |
| Subordinated Revenue Bonds |
| System Lien |
| Series 2009C (AGM) |
| 07/01/2025 | 5.000% | | 8,190,000 | 8,699,664 |
| County of Washoe |
| Refunding Revenue Bonds |
| Sierra Pacific Power |
| Series 2016B |
| 03/01/2036 | 3.000% | | 3,000,000 | 3,138,720 |
| Total | 39,915,473 |
| New Hampshire 0.4% |
| New Hampshire Health & Education Facilities Authority Act |
| Revenue Bonds |
| University System |
| Series 2009A |
| 07/01/2023 | 5.000% | | 8,370,000 | 8,859,394 |
| New Jersey 1.7% |
| Essex County Improvement Authority |
| Refunding Revenue Bonds |
| County Guaranteed Project Consolidation |
| Series 2004 (NPFGC) |
| 10/01/2026 | 5.500% | | 750,000 | 951,413 |
| Freehold Regional High School District |
| Unlimited General Obligation Refunding Bonds |
| Series 2001 (NPFGC) |
| 03/01/2020 | 5.000% | | 1,205,000 | 1,305,846 |
| Hudson County Improvement Authority |
| Refunding Revenue Bonds |
| Hudson County Lease Project |
| Series 2010 (AGM) |
| 10/01/2024 | 5.375% | | 2,000,000 | 2,399,500 |
| Manalapan-Englishtown Regional Board of Education |
| Unlimited General Obligation Refunding Bonds |
| Series 2004 (NPFGC) |
| 12/01/2020 | 5.750% | | 1,325,000 | 1,490,055 |
| Municipal Bonds (continued) |
| Issue Description | Coupon
Rate | | Principal
Amount ($) | Value ($) |
| New Jersey Economic Development Authority |
| Refunding Revenue Bonds |
| New Jersey American Water Co. |
| Series 2010A |
| 06/01/2023 | 4.450% | | 1,000,000 | 1,059,750 |
| School Facilities-Construction |
| Series 2009AA |
| 12/15/2020 | 5.250% | | 1,000,000 | 1,048,890 |
| Subordinated Series 2017A |
| 07/01/2029 | 3.125% | | 3,475,000 | 3,419,748 |
| Revenue Bonds |
| MSU Student Housing Project-Provident |
| Series 2010 |
| 06/01/2021 | 5.000% | | 1,000,000 | 1,061,820 |
| New Jersey Economic Development Authority(d) |
| Revenue Bonds |
| Capital Appreciation-Motor Vehicle Surcharges |
| Series 2004 (NPFGC) |
| 07/01/2021 | 0.000% | | 1,255,000 | 1,157,060 |
| New Jersey Transportation Trust Fund Authority |
| Revenue Bonds |
| Transportation System |
| Series 2006A |
| 12/15/2020 | 5.250% | | 1,000,000 | 1,094,610 |
| Series 2006A (AGM) |
| 12/15/2021 | 5.500% | | 4,700,000 | 5,329,330 |
| 12/15/2022 | 5.250% | | 4,000,000 | 4,587,520 |
| New Jersey Turnpike Authority |
| Refunding Revenue Bonds |
| Series 2017B |
| 01/01/2029 | 5.000% | | 5,880,000 | 7,192,004 |
| Robbinsville Board of Education |
| Unlimited General Obligation Refunding Bonds |
| Series 2005 (AGM) |
| 01/01/2028 | 5.250% | | 500,000 | 622,210 |
| Total | 32,719,756 |
| New Mexico 0.2% |
| County of Bernalillo |
| Refunding Revenue Bonds |
| Series 1998 |
| 04/01/2027 | 5.250% | | 3,000,000 | 3,646,950 |
| New York 10.8% |
| Buffalo & Erie County Industrial Land Development Corp. |
| Revenue Bonds |
| Catholic Health System |
| Series 2015 |
| 07/01/2024 | 5.000% | | 700,000 | 822,276 |
| 07/01/2025 | 5.000% | | 1,000,000 | 1,185,600 |
The accompanying Notes to Financial Statements are an integral part of this statement.
| 16 | Columbia AMT-Free Intermediate Muni Bond Fund | Annual Report 2017 |
Portfolio of Investments (continued)
October 31, 2017
| Municipal Bonds (continued) |
| Issue Description | Coupon
Rate | | Principal
Amount ($) | Value ($) |
| City of New York |
| Subordinated Unlimited General Obligation Bonds |
| Series 2008B-1 |
| 09/01/2022 | 5.250% | | 7,200,000 | 7,449,912 |
| County of Nassau |
| Limited General Obligation Bonds |
| Series 2014A |
| 04/01/2027 | 5.000% | | 12,025,000 | 14,091,376 |
| Hudson Yards Infrastructure Corp. |
| Refunding Revenue Bonds |
| Series 2017A |
| 02/15/2034 | 5.000% | | 5,000,000 | 5,920,750 |
| Long Island Power Authority |
| Refunding Revenue Bonds |
| Series 2016B |
| 09/01/2030 | 5.000% | | 1,535,000 | 1,826,619 |
| Revenue Bonds |
| Series 2012B |
| 09/01/2026 | 5.000% | | 5,000,000 | 5,734,450 |
| Nassau County Local Economic Assistance Corp. |
| Refunding Revenue Bonds |
| Catholic Health Services |
| Series 2011 |
| 07/01/2020 | 5.000% | | 9,390,000 | 10,213,973 |
| New York City Transitional Finance Authority |
| Unrefunded Revenue Bonds |
| Future Tax Secured |
| Series 2009 |
| 05/01/2027 | 5.000% | | 7,355,000 | 7,779,825 |
| New York City Transitional Finance Authority Future Tax Secured |
| Subordinated Revenue Bonds |
| Future Tax |
| Series 2016E-1 |
| 02/01/2032 | 5.000% | | 13,000,000 | 15,323,230 |
| New York Counties Tobacco Trust VI |
| Tobacco Settlement Pass-Through Bonds |
| Series 2016 |
| 06/01/2045 | 5.000% | | 890,000 | 935,568 |
| New York State Dormitory Authority |
| Prerefunded 05/01/19 Revenue Bonds |
| North Shore-Long Island Jewish Obligation Group |
| Series 2009A |
| 05/01/2030 | 5.250% | | 4,750,000 | 5,041,935 |
| Prerefunded 07/01/19 Revenue Bonds |
| Mount Sinai School of Medicine |
| Series 2009 |
| 07/01/2026 | 5.500% | | 14,635,000 | 15,675,988 |
| 07/01/2027 | 5.500% | | 10,675,000 | 11,434,313 |
| Refunding Revenue Bonds |
| Consolidated Service Contract |
| Series 2009A |
| 07/01/2024 | 5.000% | | 3,500,000 | 3,722,600 |
| Municipal Bonds (continued) |
| Issue Description | Coupon
Rate | | Principal
Amount ($) | Value ($) |
| General Purpose |
| Series 2017A |
| 02/15/2027 | 5.000% | | 10,000,000 | 12,406,200 |
| North Shore - Long Island Jewish Obligation Group |
| Series 2015A |
| 05/01/2031 | 5.000% | | 9,830,000 | 11,401,227 |
| Revenue Bonds |
| St. John’s University |
| Series 2007C (NPFGC) |
| 07/01/2023 | 5.250% | | 3,245,000 | 3,878,002 |
| State University Educational Facilities |
| 3rd General Series 2005A (NPFGC) |
| 05/15/2022 | 5.500% | | 6,730,000 | 7,935,343 |
| Upstate Community-State Supported |
| Series 2005B (NPFGC) |
| 07/01/2021 | 5.500% | | 6,345,000 | 7,297,829 |
| New York State Thruway Authority |
| Revenue Bonds |
| General |
| 2nd Series 2005B (AMBAC) |
| 04/01/2020 | 5.500% | | 10,840,000 | 11,962,048 |
| Series 2012I |
| 01/01/2024 | 5.000% | | 8,500,000 | 9,770,580 |
| Junior Lien |
| Series 2016A |
| 01/01/2033 | 5.000% | | 1,000,000 | 1,163,490 |
| New York State Urban Development Corp. |
| Refunding Revenue Bonds |
| Service Contract |
| Series 2008B |
| 01/01/2019 | 5.000% | | 4,000,000 | 4,104,760 |
| 01/01/2020 | 5.000% | | 10,460,000 | 10,733,215 |
| Revenue Bonds |
| State Personal Income Tax-State Facilities |
| Series 2004A-2 (NPFGC) |
| 03/15/2020 | 5.500% | | 20,000,000 | 22,017,600 |
| Port Authority of New York & New Jersey |
| Revenue Bonds |
| Consolidated 154th |
| Series 2009 |
| 09/01/2026 | 4.750% | | 1,000,000 | 1,048,200 |
| Total | 210,876,909 |
| North Carolina 2.7% |
| North Carolina Eastern Municipal Power Agency |
| Prerefunded 01/01/19 Revenue Bonds |
| Series 2009B |
| 01/01/2026 | 5.000% | | 21,105,000 | 22,051,559 |
The accompanying Notes to Financial Statements are an integral part of this statement.
Columbia AMT-Free Intermediate Muni Bond Fund | Annual Report 2017
| 17 |
Portfolio of Investments (continued)
October 31, 2017
| Municipal Bonds (continued) |
| Issue Description | Coupon
Rate | | Principal
Amount ($) | Value ($) |
| North Carolina Medical Care Commission |
| Refunding Revenue Bonds |
| Presbyterian Homes |
| Series 2016C |
| 10/01/2031 | 4.000% | | 1,000,000 | 1,040,310 |
| North Carolina Municipal Power Agency No. 1 |
| Refunding Revenue Bonds |
| Series 2015A |
| 01/01/2031 | 5.000% | | 2,000,000 | 2,342,940 |
| State of North Carolina |
| Refunding Revenue Bonds |
| Series 2014B |
| 06/01/2025 | 5.000% | | 10,000,000 | 12,186,700 |
| Series 2017B |
| 05/01/2027 | 5.000% | | 10,000,000 | 12,485,200 |
| University of North Carolina At Wilmington |
| Refunding Revenue Bonds |
| Student Housing Projects |
| Series 2016 |
| 06/01/2031 | 4.000% | | 2,040,000 | 2,210,952 |
| 06/01/2032 | 4.000% | | 500,000 | 538,745 |
| Total | 52,856,406 |
| Ohio 1.8% |
| American Municipal Power, Inc. |
| Refunding Revenue Bonds |
| Series 2015A |
| 02/15/2032 | 5.250% | | 12,000,000 | 13,588,680 |
| Revenue Bonds |
| AMP Fremont Energy Center Project |
| Series 2012 |
| 02/15/2024 | 5.000% | | 2,000,000 | 2,262,800 |
| Columbus City School District |
| Unlimited General Obligation Refunding Bonds |
| School Facilities Construction & Improvement |
| Series 2016 |
| 12/01/2031 | 5.000% | | 3,000,000 | 3,586,140 |
| Mason City School District |
| Unlimited General Obligation Refunding Bonds |
| Series 2005 (NPFGC) |
| 12/01/2019 | 5.250% | | 2,250,000 | 2,438,123 |
| Ohio Turnpike & Infrastructure Commission |
| Refunding Revenue Bonds |
| Series 1998A (NPFGC) |
| 02/15/2021 | 5.500% | | 2,000,000 | 2,272,100 |
| State of Ohio |
| Refunding Revenue Bonds |
| Cleveland Clinic Health System |
| Series 2011 |
| 01/01/2025 | 5.000% | | 3,750,000 | 4,167,525 |
| Municipal Bonds (continued) |
| Issue Description | Coupon
Rate | | Principal
Amount ($) | Value ($) |
| Series 2017 |
| 01/01/2029 | 5.000% | | 5,000,000 | 6,162,550 |
| Total | 34,477,918 |
| Oklahoma 0.2% |
| Chickasaw Nation(c),(f) |
| Revenue Bonds |
| Health System |
| Series 2007 |
| 12/01/2017 | 5.375% | | 360,000 | 360,946 |
| Norman Regional Hospital Authority |
| Refunding Revenue Bonds |
| Series 2016 |
| 09/01/2027 | 5.000% | | 2,000,000 | 2,345,460 |
| 09/01/2028 | 5.000% | | 1,575,000 | 1,833,646 |
| Total | 4,540,052 |
| Oregon 0.5% |
| Hospital Facilities Authority of Multnomah County |
| Refunding Revenue Bonds |
| Mirabella at South Waterfront |
| Series 2014A |
| 10/01/2034 | 5.125% | | 1,000,000 | 1,059,280 |
| Multnomah & Clackamas Counties School District No. 10JT Gresham-Barlow(d) |
| Unlimited General Obligation Bonds |
| Series 2017A |
| 06/15/2033 | 0.000% | | 7,160,000 | 4,032,226 |
| Oregon Health & Science University |
| Refunding Revenue Bonds |
| Series 2016B |
| 07/01/2034 | 5.000% | | 3,500,000 | 4,091,535 |
| Total | 9,183,041 |
| Pennsylvania 3.7% |
| County of Westmoreland(d) |
| Unlimited General Obligation Bonds |
| Capital Appreciation |
| Series 1997 Escrowed to Maturity (NPFGC) |
| 12/01/2018 | 0.000% | | 1,000,000 | 982,400 |
| Cumberland County Municipal Authority |
| Refunding Revenue Bonds |
| Diakon Lutheran Ministries |
| Series 2015 |
| 01/01/2027 | 5.000% | | 2,500,000 | 2,837,300 |
| 01/01/2028 | 5.000% | | 3,840,000 | 4,323,725 |
| Delaware River Joint Toll Bridge Commission |
| Revenue Bonds |
| Series 2017 |
| 07/01/2033 | 5.000% | | 2,250,000 | 2,656,035 |
The accompanying Notes to Financial Statements are an integral part of this statement.
| 18 | Columbia AMT-Free Intermediate Muni Bond Fund | Annual Report 2017 |
Portfolio of Investments (continued)
October 31, 2017
| Municipal Bonds (continued) |
| Issue Description | Coupon
Rate | | Principal
Amount ($) | Value ($) |
| Delaware River Port Authority |
| Refunding Revenue Bonds |
| Port District Project |
| Series 2012 |
| 01/01/2027 | 5.000% | | 1,835,000 | 2,018,500 |
| Elizabeth Forward School District(d) |
| Unlimited General Obligation Bonds |
| Capital Appreciation |
| Series 1994B Escrowed to Maturity (NPFGC) |
| 09/01/2021 | 0.000% | | 2,210,000 | 2,083,080 |
| Lancaster County Solid Waste Management Authority |
| Revenue Bonds |
| Series 2013A |
| 12/15/2029 | 5.250% | | 3,100,000 | 3,535,550 |
| Northampton County General Purpose Authority |
| Prerefunded 08/15/18 Revenue Bonds |
| Saint Luke’s Hospital Project |
| Series 2008A |
| 08/15/2021 | 5.125% | | 3,715,000 | 3,832,543 |
| Refunding Revenue Bonds |
| St. Luke’s University Health Network |
| Series 2016 |
| 08/15/2026 | 5.000% | | 3,770,000 | 4,482,115 |
| 08/15/2027 | 5.000% | | 1,745,000 | 2,057,146 |
| Pennsylvania Turnpike Commission(g) |
| Prerefunded 12/01/20 Revenue Bonds |
| Capital Appreciation |
| Subordinated Series 2010B-2 |
| 12/01/2024 | 5.350% | | 20,000,000 | 22,463,800 |
| Pennsylvania Turnpike Commission |
| Prerefunded 12/01/20 Revenue Bonds |
| Series 2011A |
| 12/01/2031 | 5.625% | | 1,460,000 | 1,649,581 |
| Subordinated Series 2011A |
| 12/01/2031 | 5.625% | | 4,875,000 | 5,508,019 |
| Revenue Bonds |
| Series 2015B |
| 12/01/2030 | 5.000% | | 525,000 | 617,542 |
| Series 2016A-1 |
| 12/01/2035 | 5.000% | | 3,500,000 | 4,017,475 |
| 12/01/2036 | 5.000% | | 3,250,000 | 3,719,917 |
| Series 2017A-1 |
| 12/01/2028 | 5.000% | | 1,500,000 | 1,812,960 |
| 12/01/2029 | 5.000% | | 1,650,000 | 1,982,920 |
| Unrefunded Revenue Bonds |
| Subordinated Series 2011A |
| 12/01/2031 | 5.625% | | 1,815,000 | 2,008,860 |
| Total | 72,589,468 |
| Municipal Bonds (continued) |
| Issue Description | Coupon
Rate | | Principal
Amount ($) | Value ($) |
| Rhode Island 0.5% |
| Rhode Island Commerce Corp. |
| Prerefunded 06/15/19 Revenue Bonds |
| Grant Anticipation-Department of Transportation |
| Series 2009A (AGM) |
| 06/15/2021 | 5.250% | | 2,000,000 | 2,131,500 |
| Rhode Island Depositors Economic Protection Corp. |
| Revenue Bonds |
| Series 1993A Escrowed to Maturity (AGM) |
| 08/01/2021 | 5.750% | | 2,165,000 | 2,508,456 |
| Rhode Island Health & Educational Building Corp. |
| Prerefunded 03/01/20 Revenue Bonds |
| New England Institute of Technology |
| Series 2010 |
| 03/01/2024 | 5.000% | | 1,145,000 | 1,243,573 |
| Prerefunded 05/15/19 Revenue Bonds |
| Hospital Financing-Lifespan Obligation |
| Series 2009A (AGM) |
| 05/15/2030 | 6.250% | | 500,000 | 539,275 |
| Prerefunded 09/15/19 Revenue Bonds |
| University of Rhode Island |
| Series 2009A (AGM) |
| 09/15/2024 | 4.750% | | 1,000,000 | 1,066,190 |
| Rhode Island Turnpike & Bridge Authority |
| Refunding Revenue Bonds |
| Series 2016A |
| 10/01/2033 | 5.000% | | 1,300,000 | 1,505,647 |
| 10/01/2034 | 4.000% | | 525,000 | 558,547 |
| Total | 9,553,188 |
| South Carolina 2.0% |
| Beaufort-Jasper Water & Sewer Authority |
| Refunding Revenue Bonds |
| Series 2016B |
| 03/01/2025 | 5.000% | | 1,000,000 | 1,213,460 |
| County of Florence |
| Refunding Revenue Bonds |
| McLeod Regional Medical Center Project |
| Series 2014 |
| 11/01/2031 | 5.000% | | 3,250,000 | 3,731,228 |
| 11/01/2032 | 5.000% | | 5,000,000 | 5,712,900 |
| County of Greenwood |
| Refunding Revenue Bonds |
| Self Regional Healthcare |
| Series 2012B |
| 10/01/2031 | 5.000% | | 5,000,000 | 5,520,800 |
| Greenville County School District |
| Refunding Revenue Bonds |
| Building Equity Sooner |
| Series 2005 |
| 12/01/2018 | 5.500% | | 5,000,000 | 5,237,300 |
The accompanying Notes to Financial Statements are an integral part of this statement.
Columbia AMT-Free Intermediate Muni Bond Fund | Annual Report 2017
| 19 |
Portfolio of Investments (continued)
October 31, 2017
| Municipal Bonds (continued) |
| Issue Description | Coupon
Rate | | Principal
Amount ($) | Value ($) |
| South Carolina Jobs-Economic Development Authority |
| Revenue Bonds |
| Lutheran Homes of South Carolina Obligation Group |
| Series 2013 |
| 05/01/2028 | 5.000% | | 3,500,000 | 3,692,395 |
| York Preparatory Academy Project |
| Series 2014A |
| 11/01/2033 | 7.000% | | 590,000 | 633,400 |
| South Carolina Jobs-Economic Development Authority(c) |
| Revenue Bonds |
| Series 2015A |
| 08/15/2025 | 4.500% | | 410,000 | 414,547 |
| South Carolina Public Service Authority |
| Refunding Revenue Bonds |
| Series 2015A |
| 12/01/2026 | 5.000% | | 7,000,000 | 8,175,230 |
| Series 2016A |
| 12/01/2030 | 5.000% | | 4,000,000 | 4,643,840 |
| Total | 38,975,100 |
| South Dakota 0.5% |
| South Dakota Health & Educational Facilities Authority |
| Prerefunded 09/01/20 Revenue Bonds |
| Regional Health |
| Series 2011 |
| 09/01/2021 | 5.000% | | 1,000,000 | 1,104,250 |
| Refunding Revenue Bonds |
| Sanford Obligated Group |
| Series 2015 |
| 11/01/2026 | 5.000% | | 1,000,000 | 1,199,320 |
| 11/01/2027 | 5.000% | | 530,000 | 630,578 |
| Revenue Bonds |
| Regional Health |
| Series 2011 Escrowed to Maturity |
| 09/01/2020 | 5.000% | | 1,250,000 | 1,380,313 |
| Series 2017 |
| 09/01/2029 | 5.000% | | 1,700,000 | 2,025,159 |
| 09/01/2030 | 5.000% | | 2,250,000 | 2,661,930 |
| Total | 9,001,550 |
| Tennessee 0.1% |
| Chattanooga Health Educational & Housing Facility Board |
| Refunding Revenue Bonds |
| Student Housing - CDFI Phase I |
| Series 2015 |
| 10/01/2029 | 5.000% | | 1,000,000 | 1,142,210 |
| 10/01/2030 | 5.000% | | 500,000 | 555,370 |
| Total | 1,697,580 |
| Municipal Bonds (continued) |
| Issue Description | Coupon
Rate | | Principal
Amount ($) | Value ($) |
| Texas 12.1% |
| Austin Convention Enterprises, Inc. |
| Refunding Revenue Bonds |
| Convention Center 1st Tier |
| Series 2017 |
| 01/01/2028 | 5.000% | | 1,850,000 | 2,186,737 |
| Austin Independent School District |
| Unlimited General Obligation Bonds |
| Permanent School Fund Guaranteed |
| Series 2017 |
| 08/01/2027 | 5.000% | | 2,960,000 | 3,645,240 |
| 08/01/2028 | 5.000% | | 3,085,000 | 3,766,075 |
| Central Texas Regional Mobility Authority |
| Prerefunded 01/01/21 Revenue Bonds |
| Senior Lien |
| Series 2011 |
| 01/01/2031 | 5.750% | | 15,230,000 | 17,339,050 |
| Refunding Subordinated Revenue Bonds |
| Series 2016 |
| 01/01/2028 | 5.000% | | 1,000,000 | 1,169,070 |
| 01/01/2029 | 5.000% | | 1,680,000 | 1,949,338 |
| 01/01/2030 | 5.000% | | 2,045,000 | 2,358,335 |
| Revenue Bonds |
| Senior Lien |
| Series 2010 |
| 01/01/2020 | 5.750% | | 1,250,000 | 1,365,187 |
| Series 2010 Escrowed to Maturity |
| 01/01/2019 | 5.750% | | 565,000 | 594,883 |
| Series 2015A |
| 01/01/2030 | 5.000% | | 1,550,000 | 1,790,622 |
| Central Texas Turnpike System |
| Subordinated Refunding Revenue Bonds |
| Series 2015C |
| 08/15/2031 | 5.000% | | 7,500,000 | 8,537,850 |
| 08/15/2032 | 5.000% | | 6,000,000 | 6,802,500 |
| 08/15/2034 | 5.000% | | 10,240,000 | 11,528,704 |
| City of Arlington |
| Refunding Special Tax Bonds |
| Senior Lien |
| Series 2017 (AGM) |
| 02/15/2030 | 5.000% | | 1,000,000 | 1,169,170 |
| 02/15/2031 | 5.000% | | 1,000,000 | 1,163,380 |
| City of Austin Airport System |
| Revenue Bonds |
| Series 2017A |
| 11/15/2034 | 5.000% | | 800,000 | 931,312 |
| 11/15/2035 | 5.000% | | 1,000,000 | 1,160,700 |
The accompanying Notes to Financial Statements are an integral part of this statement.
| 20 | Columbia AMT-Free Intermediate Muni Bond Fund | Annual Report 2017 |
Portfolio of Investments (continued)
October 31, 2017
| Municipal Bonds (continued) |
| Issue Description | Coupon
Rate | | Principal
Amount ($) | Value ($) |
| City of Houston |
| Refunding Revenue Bonds |
| Convention & Entertainment |
| Series 2015 |
| 09/01/2027 | 5.000% | | 1,215,000 | 1,411,222 |
| 09/01/2029 | 5.000% | | 1,500,000 | 1,721,895 |
| Convention & Entertainment Facilities |
| Series 2014 |
| 09/01/2030 | 5.000% | | 1,000,000 | 1,143,900 |
| City of Houston Airport System |
| Subordinated Refunding Revenue Bonds |
| Lien |
| Series 2012B |
| 07/01/2028 | 5.000% | | 7,000,000 | 7,990,850 |
| City of Houston Combined Utility System |
| Refunding Revenue Bonds |
| Combination 1st Lien |
| Series 2017B |
| 11/15/2034 | 5.000% | | 2,710,000 | 3,238,938 |
| 11/15/2035 | 5.000% | | 4,055,000 | 4,834,695 |
| First Lien |
| Series 2016B |
| 11/15/2034 | 5.000% | | 10,000,000 | 11,780,500 |
| City of Lubbock |
| Limited General Obligation Notes |
| CTFS Obligation |
| Series 2016 |
| 02/15/2033 | 4.000% | | 1,000,000 | 1,075,130 |
| 02/15/2034 | 4.000% | | 1,000,000 | 1,069,820 |
| City of San Antonio Electric & Gas Systems |
| Revenue Bonds |
| Series 2017 |
| 02/01/2029 | 5.000% | | 1,000,000 | 1,234,520 |
| 02/01/2030 | 5.000% | | 1,820,000 | 2,230,792 |
| Clifton Higher Education Finance Corp. |
| Revenue Bonds |
| International Leadership |
| Series 2015 |
| 08/15/2035 | 5.500% | | 11,500,000 | 12,291,545 |
| Dallas/Fort Worth International Airport |
| Refunding Revenue Bonds |
| Series 2012B |
| 11/01/2028 | 5.000% | | 21,380,000 | 23,565,036 |
| Duncanville Independent School District(d) |
| Unlimited General Obligation Refunding Bonds |
| Capital Appreciation |
| Series 2005 (Permanent School Fund Guarantee) |
| 02/15/2022 | 0.000% | | 2,000,000 | 1,867,480 |
| Municipal Bonds (continued) |
| Issue Description | Coupon
Rate | | Principal
Amount ($) | Value ($) |
| Harris County Industrial Development Corp. |
| Revenue Bonds |
| Deer Park Refining Project |
| Series 2008 |
| 05/01/2018 | 4.700% | | 12,000,000 | 12,186,480 |
| Harris County-Houston Sports Authority |
| Refunding Revenue Bonds |
| 2nd Lien |
| Series 2014C |
| 11/15/2032 | 5.000% | | 500,000 | 565,710 |
| Houston Higher Education Finance Corp. |
| Prerefunded 05/15/21 Revenue Bonds |
| Cosmos Foundation, Inc. |
| Series 2011 |
| 05/15/2031 | 6.500% | | 535,000 | 628,609 |
| 05/15/2031 | 6.500% | | 465,000 | 546,361 |
| Lower Colorado River Authority |
| Refunding Revenue Bonds |
| LCRA Transmission Services Corp. |
| Series 2011 |
| 05/15/2027 | 5.000% | | 11,195,000 | 12,344,055 |
| New Hope Cultural Education Facilities Finance Corp. |
| Revenue Bonds |
| Cardinal Bay, Inc. - Village on the Park |
| Series 2016 |
| 07/01/2036 | 4.000% | | 1,250,000 | 1,273,813 |
| NCCD-College Station Properties LLC |
| Series 2015 |
| 07/01/2035 | 5.000% | | 4,000,000 | 3,981,160 |
| Series 2015A |
| 07/01/2030 | 5.000% | | 7,800,000 | 7,878,624 |
| New Hope Cultural Education Facilities Finance Corp.(c) |
| Revenue Bonds |
| Jubilee Academic Center Project |
| Series 2017 |
| 08/15/2027 | 4.250% | | 615,000 | 620,043 |
| 08/15/2037 | 5.000% | | 530,000 | 533,821 |
| North Harris County Regional Water Authority |
| Prerefunded 12/15/18 Revenue Bonds |
| Senior Lien |
| Series 2008 |
| 12/15/2020 | 5.250% | | 4,415,000 | 4,619,238 |
| North Texas Tollway Authority |
| Prerefunded 01/01/18 Revenue Bonds |
| System-1st Tier |
| Series 2008 |
| 01/01/2022 | 6.000% | | 12,280,000 | 12,378,977 |
| Refunding Revenue Bonds |
| 2nd Tier |
| Series 2015A |
| 01/01/2032 | 5.000% | | 16,800,000 | 19,277,328 |
The accompanying Notes to Financial Statements are an integral part of this statement.
Columbia AMT-Free Intermediate Muni Bond Fund | Annual Report 2017
| 21 |
Portfolio of Investments (continued)
October 31, 2017
| Municipal Bonds (continued) |
| Issue Description | Coupon
Rate | | Principal
Amount ($) | Value ($) |
| Series 2016A |
| 01/01/2027 | 5.000% | | 2,550,000 | 2,985,030 |
| System-2nd Tier |
| 01/01/2031 | 5.000% | | 1,415,000 | 1,621,958 |
| Unrefunded Revenue Bonds |
| System-1st Tier |
| Series 2008 |
| 01/01/2022 | 6.000% | | 1,720,000 | 1,734,018 |
| North Texas Tollway Authority(h) |
| Refunding Revenue Bonds |
| 1st Tier |
| Series 2017A |
| 01/01/2034 | 5.000% | | 1,000,000 | 1,172,290 |
| Sam Rayburn Municipal Power Agency |
| Refunding Revenue Bonds |
| Series 2012 |
| 10/01/2021 | 5.000% | | 2,300,000 | 2,575,977 |
| San Juan Higher Education Finance Authority |
| Prerefunded 08/15/20 Revenue Bonds |
| Idea Public Schools |
| Series 2010A |
| 08/15/2024 | 5.750% | | 1,590,000 | 1,781,563 |
| Texas City Industrial Development Corp. |
| Refunding Revenue Bonds |
| Arco Pipe Line Co. Project |
| Series 1990 |
| 10/01/2020 | 7.375% | | 3,000,000 | 3,514,710 |
| Uptown Development Authority |
| Prerefunded 09/01/19 Tax Allocation Bonds |
| Infrastructure Improvement Facilities |
| Series 2009 |
| 09/01/2022 | 5.000% | | 750,000 | 801,293 |
| West Harris County Regional Water Authority |
| Revenue Bonds |
| Series 2009 |
| 12/15/2025 | 5.000% | | 1,000,000 | 1,074,690 |
| Total | 237,010,224 |
| Utah 0.2% |
| Salt Lake City Corp. Airport |
| Revenue Bonds |
| Series 2017B |
| 07/01/2031 | 5.000% | | 750,000 | 900,083 |
| 07/01/2032 | 5.000% | | 1,000,000 | 1,192,580 |
| 07/01/2033 | 5.000% | | 1,000,000 | 1,186,040 |
| Total | 3,278,703 |
| Municipal Bonds (continued) |
| Issue Description | Coupon
Rate | | Principal
Amount ($) | Value ($) |
| Vermont 0.7% |
| Vermont Educational & Health Buildings Financing Agency |
| Refunding Revenue Bonds |
| University of Vermont Medical Center |
| Series 2016A |
| 12/01/2033 | 5.000% | | 12,445,000 | 14,234,342 |
| Virgin Islands, U.S. 0.0% |
| Virgin Islands Water & Power Authority - Electric System(f) |
| Refunding Revenue Bonds |
| Series 2012A |
| 07/01/2021 | 4.000% | | 455,000 | 302,611 |
| Virginia 0.1% |
| Dulles Town Center Community Development Authority |
| Refunding Special Assessment Bonds |
| Dulles Town Center Project |
| Series 2012 |
| 03/01/2026 | 4.250% | | 1,000,000 | 1,003,880 |
| Virginia Gateway Community Development Authority |
| Refunding Special Assessment Bonds |
| Series 2012 |
| 03/01/2030 | 5.000% | | 1,500,000 | 1,526,760 |
| Total | 2,530,640 |
| Washington 2.0% |
| King County Public Hospital District No. 4 |
| Revenue Bonds |
| Series 2015A |
| 12/01/2025 | 5.000% | | 2,960,000 | 3,005,347 |
| 12/01/2030 | 5.750% | | 2,820,000 | 2,867,179 |
| Port of Seattle |
| Refunding Revenue Bonds |
| Intermediate Lien |
| Series 2016 |
| 02/01/2027 | 5.000% | | 1,000,000 | 1,213,460 |
| State of Washington |
| Prerefunded 08/01/19 Unlimited General Obligation Bonds |
| Motor Vehicle Fuel Tax |
| Series 2010B |
| 08/01/2026 | 5.000% | | 18,270,000 | 19,482,945 |
| Unlimited General Obligation Bonds |
| Series 2015A-1 |
| 08/01/2030 | 5.000% | | 8,720,000 | 10,463,913 |
| Washington State Housing Finance Commission |
| Revenue Bonds |
| Heron’s Key |
| Series 2015A |
| 07/01/2030 | 6.500% | | 320,000 | 336,496 |
| 07/01/2035 | 6.750% | | 1,090,000 | 1,153,231 |
| Total | 38,522,571 |
The accompanying Notes to Financial Statements are an integral part of this statement.
| 22 | Columbia AMT-Free Intermediate Muni Bond Fund | Annual Report 2017 |
Portfolio of Investments (continued)
October 31, 2017
| Municipal Bonds (continued) |
| Issue Description | Coupon
Rate | | Principal
Amount ($) | Value ($) |
| West Virginia 0.2% |
| West Virginia Hospital Finance Authority |
| Revenue Bonds |
| Charleston Area Medical Center, Inc. |
| Series 1993A Escrowed to Maturity |
| 09/01/2023 | 6.500% | | 3,515,000 | 4,068,577 |
| Wisconsin 1.1% |
| Public Finance Authority |
| Refunding Revenue Bonds |
| Celanese Project |
| Series 2016D |
| 11/01/2030 | 4.050% | | 1,485,000 | 1,522,600 |
| Public Finance Authority(c) |
| Refunding Revenue Bonds |
| Mary’s Woods at Marylhurst |
| Series 2017 |
| 05/15/2037 | 5.250% | | 1,000,000 | 1,081,790 |
| State of Wisconsin |
| Revenue Bonds |
| Series 2009A |
| 05/01/2022 | 5.000% | | 1,000,000 | 1,057,910 |
| 05/01/2023 | 5.125% | | 14,000,000 | 14,834,540 |
| Wisconsin Health & Educational Facilities Authority |
| Refunding Revenue Bonds |
| ProHealth Care, Inc. Obligated Group |
| Series 2015 |
| 08/15/2031 | 5.000% | | 1,000,000 | 1,132,670 |
| Municipal Bonds (continued) |
| Issue Description | Coupon
Rate | | Principal
Amount ($) | Value ($) |
| Rogers Memorial Hospital, Inc. |
| Series 2014A |
| 07/01/2034 | 5.000% | | 2,500,000 | 2,744,425 |
| Total | 22,373,935 |
Total Municipal Bonds
(Cost $1,806,986,878) | 1,912,173,327 |
| Money Market Funds 0.0% |
| | Shares | Value ($) |
| Dreyfus Tax-Exempt Cash Management Fund, Institutional Shares, 0.680%(i) | 102,986 | 102,986 |
Total Money Market Funds
(Cost $102,986) | 102,986 |
Total Investments
(Cost $1,825,969,864) | 1,931,156,313 |
| Other Assets & Liabilities, Net | | 27,219,623 |
| Net Assets | $1,958,375,936 |
Notes to Portfolio of Investments
| (a) | The Fund is entitled to receive principal and interest from the guarantor after a day or a week’s notice or upon maturity. The maturity date disclosed represents the final maturity. |
| (b) | Represents a variable rate demand note where the coupon rate adjusts on specified dates (generally daily or weekly) using the prevailing money market rate. |
| (c) | Represents privately placed and other securities and instruments exempt from SEC registration (collectively, private placements), such as Section 4(a)(2) and Rule 144A eligible securities, which are often sold only to qualified institutional buyers. The Fund may invest in private placements determined to be liquid as well as those determined to be illiquid. Private placements may be determined to be liquid under guidelines established by the Fund’s Board of Trustees. At October 31, 2017, the value of these securities amounted to $15,442,353, which represents 0.79% of net assets. |
| (d) | Zero coupon bond. |
| (e) | Represents securities that have defaulted on payment of interest. The Fund has stopped accruing interest on these securities. At October 31, 2017, the value of these securities amounted to $1,472,701, which represents 0.08% of net assets. |
| (f) | Municipal obligations include debt obligations issued by or on behalf of territories, possessions, or sovereign nations within the territorial boundaries of the United States. At October 31, 2017, the value of these securities amounted to $663,557, which represents 0.03% of net assets. |
| (g) | Represents a step bond where the coupon rate adjusts according to a schedule for a series of periods, typically lower for an initial period and then increasing to a higher coupon rate thereafter. |
| (h) | Represents a security purchased on a when-issued basis. |
| (i) | The rate shown is the seven-day current annualized yield at October 31, 2017. |
Abbreviation Legend
| AGM | Assured Guaranty Municipal Corporation |
| AMBAC | Ambac Assurance Corporation |
| NPFGC | National Public Finance Guarantee Corporation |
The accompanying Notes to Financial Statements are an integral part of this statement.
Columbia AMT-Free Intermediate Muni Bond Fund | Annual Report 2017
| 23 |
Portfolio of Investments (continued)
October 31, 2017
Abbreviation Legend (continued)
| VRDN | Variable Rate Demand Note |
Fair value measurements
The Fund categorizes its fair value measurements according to a three-level hierarchy that maximizes the use of observable inputs and minimizes the use of unobservable inputs by prioritizing that the most observable input be used when available. Observable inputs are those that market participants would use in pricing an investment based on market data obtained from sources independent of the reporting entity. Unobservable inputs are those that reflect the Fund’s assumptions about the information market participants would use in pricing an investment. An investment’s level within the fair value hierarchy is based on the lowest level of any input that is deemed significant to the asset’s or liability’s fair value measurement. The input levels are not necessarily an indication of the risk or liquidity associated with investments at that level. For example, certain U.S. government securities are generally high quality and liquid, however, they are reflected as Level 2 because the inputs used to determine fair value may not always be quoted prices in an active market.
Fair value inputs are summarized in the three broad levels listed below:
| • | Level 1 – Valuations based on quoted prices for investments in active markets that the Fund has the ability to access at the measurement date. Valuation adjustments are not applied to Level 1 investments. |
| • | Level 2 – Valuations based on other significant observable inputs (including quoted prices for similar securities, interest rates, prepayment speeds, credit risks, etc.). |
| • | Level 3 – Valuations based on significant unobservable inputs (including the Fund’s own assumptions and judgment in determining the fair value of investments). |
Inputs that are used in determining fair value of an investment may include price information, credit data, volatility statistics, and other factors. These inputs can be either observable or unobservable. The availability of observable inputs can vary between investments, and is affected by various factors such as the type of investment, and the volume and level of activity for that investment or similar investments in the marketplace. The inputs will be considered by the Investment Manager, along with any other relevant factors in the calculation of an investment’s fair value. The Fund uses prices and inputs that are current as of the measurement date, which may include periods of market dislocations. During these periods, the availability of prices and inputs may be reduced for many investments. This condition could cause an investment to be reclassified between the various levels within the hierarchy.
Investments falling into the Level 3 category are primarily supported by quoted prices from brokers and dealers participating in the market for those investments. However, these may be classified as Level 3 investments due to lack of market transparency and corroboration to support these quoted prices. Additionally, valuation models may be used as the pricing source for any remaining investments classified as Level 3. These models may rely on one or more significant unobservable inputs and/or significant assumptions by the Investment Manager. Inputs used in valuations may include, but are not limited to, financial statement analysis, capital account balances, discount rates and estimated cash flows, and comparable company data.
Under the direction of the Fund’s Board of Trustees (the Board), the Investment Manager’s Valuation Committee (the Committee) is responsible for overseeing the valuation procedures approved by the Board. The Committee consists of voting and non-voting members from various groups within the Investment Manager’s organization, including operations and accounting, trading and investments, compliance, risk management and legal.
The Committee meets at least monthly to review and approve valuation matters, which may include a description of specific valuation determinations, data regarding pricing information received from approved pricing vendors and brokers and the results of Board-approved valuation control policies and procedures (the Policies). The Policies address, among other things, instances when market quotations are or are not readily available, including recommendations of third party pricing vendors and a determination of appropriate pricing methodologies; events that require specific valuation determinations and assessment of fair value techniques; securities with a potential for stale pricing, including those that are illiquid, restricted, or in default; and the effectiveness of third party pricing vendors, including periodic reviews of vendors. The Committee meets more frequently, as needed, to discuss additional valuation matters, which may include the need to review back-testing results, review time-sensitive information or approve related valuation actions. The Committee reports to the Board, with members of the Committee meeting with the Board at each of its regularly scheduled meetings to discuss valuation matters and actions during the period, similar to those described earlier.
For investments categorized as Level 3, the Committee monitors information similar to that described above, which may include: (i) data specific to the issuer or comparable issuers, (ii) general market or specific sector news and (iii) quoted prices and specific or similar security transactions. The Committee considers this data and any changes from prior periods in order to assess the reasonableness of observable and unobservable inputs, any assumptions or internal models used to value those securities and changes in fair value. This data is also used to corroborate, when available, information received from approved pricing vendors and brokers. Various factors impact the frequency of monitoring this information (which may occur as often as daily). However, the Committee may determine that changes to inputs, assumptions and models are not required as a result of the monitoring procedures performed.
The following table is a summary of the inputs used to value the Fund’s investments at October 31, 2017:
| | Level 1
quoted prices in active
markets for identical
assets ($) | Level 2
other significant
observable inputs ($) | Level 3
significant
unobservable inputs ($) | Total ($) |
| Investments | | | | |
| Floating Rate Notes | — | 18,880,000 | — | 18,880,000 |
| Municipal Bonds | — | 1,912,173,327 | — | 1,912,173,327 |
| Money Market Funds | 102,986 | — | — | 102,986 |
| Total Investments | 102,986 | 1,931,053,327 | — | 1,931,156,313 |
See the Portfolio of Investments for all investment classifications not indicated in the table.
The Fund’s assets assigned to the Level 2 input category are generally valued using the market approach, in which a security’s value is determined through reference to prices and information from market transactions for similar or identical assets.
There were no transfers of financial assets between levels during the period.
The accompanying Notes to Financial Statements are an integral part of this statement.
| 24 | Columbia AMT-Free Intermediate Muni Bond Fund | Annual Report 2017 |
Statement of Assets and Liabilities
October 31, 2017
| Assets | |
| Investments in unaffiliated issuers, at cost | $1,825,969,864 |
| Investments in unaffiliated issuers, at value | 1,931,156,313 |
| Cash | 7,559,780 |
| Receivable for: | |
| Investments sold | 3,120,221 |
| Capital shares sold | 1,599,452 |
| Regulatory settlements (Note 6) | 485,268 |
| Interest | 24,974,352 |
| Expense reimbursement due from Investment Manager | 449 |
| Prepaid expenses | 11,041 |
| Trustees’ deferred compensation plan | 241,551 |
| Other assets | 10,735 |
| Total assets | 1,969,159,162 |
| Liabilities | |
| Payable for: | |
| Investments purchased on a delayed delivery basis | 1,171,450 |
| Capital shares purchased | 3,696,371 |
| Distributions to shareholders | 5,059,917 |
| Management services fees | 24,801 |
| Distribution and/or service fees | 2,139 |
| Transfer agent fees | 197,802 |
| Compensation of board members | 338,954 |
| Compensation of chief compliance officer | 82 |
| Other expenses | 50,159 |
| Trustees’ deferred compensation plan | 241,551 |
| Total liabilities | 10,783,226 |
| Net assets applicable to outstanding capital stock | $1,958,375,936 |
| Represented by | |
| Paid in capital | 1,852,542,715 |
| Undistributed net investment income | 2,334,113 |
| Accumulated net realized loss | (1,687,341) |
| Unrealized appreciation (depreciation) on: | |
| Investments - unaffiliated issuers | 105,186,449 |
| Total - representing net assets applicable to outstanding capital stock | $1,958,375,936 |
The accompanying Notes to Financial Statements are an integral part of this statement.
Columbia AMT-Free Intermediate Muni Bond Fund | Annual Report 2017
| 25 |
Statement of Assets and Liabilities (continued)
October 31, 2017
| Class A | |
| Net assets | $189,260,417 |
| Shares outstanding | 17,959,272 |
| Net asset value per share | $10.54 |
| Maximum offering price per share(a) | $10.87 |
| Class C | |
| Net assets | $44,950,511 |
| Shares outstanding | 4,264,910 |
| Net asset value per share | $10.54 |
| Class R4 | |
| Net assets | $17,306,024 |
| Shares outstanding | 1,643,462 |
| Net asset value per share | $10.53 |
| Class R5 | |
| Net assets | $12,401,461 |
| Shares outstanding | 1,178,214 |
| Net asset value per share | $10.53 |
| Class T | |
| Net assets | $10,096 |
| Shares outstanding | 959 |
| Net asset value per share | $10.53 |
| Maximum offering price per share(b) | $10.80 |
| Class V(c) | |
| Net assets | $13,370,683 |
| Shares outstanding | 1,268,838 |
| Net asset value per share | $10.54 |
| Maximum offering price per share(d) | $11.07 |
| Class Y | |
| Net assets | $1,865,283 |
| Shares outstanding | 176,733 |
| Net asset value per share | $10.55 |
| Class Z | |
| Net assets | $1,679,211,461 |
| Shares outstanding | 159,270,519 |
| Net asset value per share | $10.54 |
| (a) | The maximum offering price per share is calculated by dividing the net asset value per share by 1.0 minus the maximum sales charge of 3.00% for Class A shares. |
| (b) | The maximum offering price per share is calculated by dividing the net asset value per share by 1.0 minus the maximum sales charge of 2.50% for Class T shares. |
| (c) | Prior to January 24, 2017, Class V shares were known as Class T shares. |
| (d) | The maximum offering price per share is calculated by dividing the net asset value per share by 1.0 minus the maximum sales charge of 4.75% for Class V shares. |
The accompanying Notes to Financial Statements are an integral part of this statement.
| 26 | Columbia AMT-Free Intermediate Muni Bond Fund | Annual Report 2017 |
Statement of Operations
Year Ended October 31, 2017
| Net investment income | |
| Income: | |
| Dividends — unaffiliated issuers | $16,119 |
| Interest | 77,785,285 |
| Total income | 77,801,404 |
| Expenses: | |
| Management services fees | 9,519,597 |
| Distribution and/or service fees | |
| Class A | 417,368 |
| Class B(a) | 697 |
| Class C | 429,322 |
| Class T(b) | 15 |
| Class V(c) | 20,260 |
| Transfer agent fees | |
| Class A | 337,473 |
| Class B(a) | 146 |
| Class C | 81,638 |
| Class R4 | 19,615 |
| Class R5 | 5,935 |
| Class T(b) | 8 |
| Class V(c) | 21,586 |
| Class Y(d) | 46 |
| Class Z | 2,849,425 |
| Compensation of board members | 94,916 |
| Custodian fees | 13,878 |
| Printing and postage fees | 37,883 |
| Registration fees | 145,597 |
| Audit fees | 33,635 |
| Legal fees | 59,170 |
| Compensation of chief compliance officer | 895 |
| Other | (79,153) |
| Total expenses | 14,009,952 |
| Fees waived or expenses reimbursed by Investment Manager and its affiliates | (1,306,973) |
| Expense reduction | (420) |
| Total net expenses | 12,702,559 |
| Net investment income | 65,098,845 |
| Realized and unrealized gain (loss) — net | |
| Net realized gain (loss) on: | |
| Investments — unaffiliated issuers | 4,241,459 |
| Net realized gain | 4,241,459 |
| Net change in unrealized appreciation (depreciation) on: | |
| Investments — unaffiliated issuers | (48,655,281) |
| Net change in unrealized appreciation (depreciation) | (48,655,281) |
| Net realized and unrealized loss | (44,413,822) |
| Net increase in net assets resulting from operations | $20,685,023 |
| (a) | Effective July 17, 2017, Class B shares were automatically converted to Class A shares. |
| (b) | Class T shares are based on operations from April 3, 2017 (commencement of operations) through the stated period end. |
| (c) | Prior to January 24, 2017, Class V shares were known as Class T shares. |
| (d) | Class Y shares are based on operations from March 1, 2017 (commencement of operations) through the stated period end. |
The accompanying Notes to Financial Statements are an integral part of this statement.
Columbia AMT-Free Intermediate Muni Bond Fund | Annual Report 2017
| 27 |
Statement of Changes in Net Assets
| | Year Ended
October 31, 2017 (a),(b) | Year Ended
October 31, 2016 |
| Operations | | |
| Net investment income | $65,098,845 | $73,267,996 |
| Net realized gain | 4,241,459 | 2,926,895 |
| Net change in unrealized appreciation (depreciation) | (48,655,281) | 1,641,990 |
| Net increase in net assets resulting from operations | 20,685,023 | 77,836,881 |
| Distributions to shareholders | | |
| Net investment income | | |
| Class A | (6,239,197) | (7,198,893) |
| Class B(c) | (1,954) | (5,552) |
| Class C | (1,181,887) | (1,350,483) |
| Class R4 | (407,834) | (157,007) |
| Class R5 | (335,530) | (249,006) |
| Class T | (166) | — |
| Class V(d) | (409,838) | (429,633) |
| Class Y | (7,625) | — |
| Class Z | (56,513,374) | (63,675,977) |
| Total distributions to shareholders | (65,097,405) | (73,066,551) |
| Increase (decrease) in net assets from capital stock activity | (422,610,896) | 264,881,920 |
| Total increase (decrease) in net assets | (467,023,278) | 269,652,250 |
| Net assets at beginning of year | 2,425,399,214 | 2,155,746,964 |
| Net assets at end of year | $1,958,375,936 | $2,425,399,214 |
| Undistributed net investment income | $2,334,113 | $2,332,764 |
| (a) | Class T shares are based on operations from April 3, 2017 (commencement of operations) through the stated period end. |
| (b) | Class Y shares are based on operations from March 1, 2017 (commencement of operations) through the stated period end. |
| (c) | Effective July 17, 2017, Class B shares were automatically converted to Class A shares. |
| (d) | Prior to January 24, 2017, Class V shares were known as Class T shares. |
The accompanying Notes to Financial Statements are an integral part of this statement.
| 28 | Columbia AMT-Free Intermediate Muni Bond Fund | Annual Report 2017 |
Statement of Changes in Net Assets (continued)
| | Year Ended | Year Ended |
| | October 31, 2017 (a),(b) | October 31, 2016 |
| | Shares | Dollars ($) | Shares | Dollars ($) |
| Capital stock activity |
| Class A(c) | | | | |
| Subscriptions (d) | 2,570,293 | 26,877,782 | 5,760,798 | 62,298,226 |
| Distributions reinvested | 519,825 | 5,446,309 | 552,353 | 5,978,857 |
| Redemptions | (8,171,580) | (85,202,656) | (5,099,783) | (55,156,978) |
| Net increase (decrease) | (5,081,462) | (52,878,565) | 1,213,368 | 13,120,105 |
| Class B(c) | | | | |
| Subscriptions | 1,120 | 11,989 | 8,113 | 87,840 |
| Distributions reinvested | 85 | 887 | 331 | 3,573 |
| Redemptions (d) | (15,677) | (164,915) | (22,713) | (245,627) |
| Net decrease | (14,472) | (152,039) | (14,269) | (154,214) |
| Class C | | | | |
| Subscriptions | 585,715 | 6,131,549 | 1,385,776 | 14,989,421 |
| Distributions reinvested | 89,604 | 939,219 | 94,404 | 1,022,014 |
| Redemptions | (1,985,921) | (20,806,435) | (938,916) | (10,165,555) |
| Net increase (decrease) | (1,310,602) | (13,735,667) | 541,264 | 5,845,880 |
| Class R4 | | | | |
| Subscriptions | 1,383,396 | 14,462,243 | 635,100 | 6,882,632 |
| Distributions reinvested | 38,763 | 406,969 | 14,472 | 156,685 |
| Redemptions | (556,307) | (5,777,312) | (150,716) | (1,620,628) |
| Net increase | 865,852 | 9,091,900 | 498,856 | 5,418,689 |
| Class R5 | | | | |
| Subscriptions | 736,314 | 7,677,576 | 1,121,172 | 12,151,359 |
| Distributions reinvested | 31,984 | 335,207 | 23,005 | 248,664 |
| Redemptions | (421,378) | (4,375,122) | (791,660) | (8,558,970) |
| Net increase | 346,920 | 3,637,661 | 352,517 | 3,841,053 |
| Class T | | | | |
| Subscriptions | 959 | 10,000 | — | — |
| Net increase | 959 | 10,000 | — | — |
| Class V(e) | | | | |
| Subscriptions | 6,802 | 71,333 | 4,291 | 46,430 |
| Distributions reinvested | 27,858 | 292,067 | 27,649 | 299,218 |
| Redemptions | (78,106) | (817,942) | (55,164) | (597,488) |
| Net decrease | (43,446) | (454,542) | (23,224) | (251,840) |
| Class Y | | | | |
| Subscriptions | 184,037 | 1,957,117 | — | — |
| Distributions reinvested | 701 | 7,407 | — | — |
| Redemptions | (8,005) | (85,094) | — | — |
| Net increase | 176,733 | 1,879,430 | — | — |
| Class Z | | | | |
| Subscriptions | 28,400,360 | 296,799,286 | 47,084,746 | 509,343,454 |
| Distributions reinvested | 549,071 | 5,761,964 | 513,772 | 5,563,905 |
| Redemptions | (64,397,697) | (672,570,324) | (25,659,009) | (277,845,112) |
| Net increase (decrease) | (35,448,266) | (370,009,074) | 21,939,509 | 237,062,247 |
| Total net increase (decrease) | (40,507,784) | (422,610,896) | 24,508,021 | 264,881,920 |
| (a) | Class T shares are based on operations from April 3, 2017 (commencement of operations) through the stated period end. |
| (b) | Class Y shares are based on operations from March 1, 2017 (commencement of operations) through the stated period end. |
| (c) | Effective July 17, 2017, Class B shares were automatically converted to Class A shares. |
| (d) | Includes conversions of Class B shares to Class A shares, if any. |
| (e) | Prior to January 24, 2017, Class V shares were known as Class T shares. |
The accompanying Notes to Financial Statements are an integral part of this statement.
Columbia AMT-Free Intermediate Muni Bond Fund | Annual Report 2017
| 29 |
The following table is intended to help you understand the Fund’s financial performance. Certain information reflects financial results for a single share of a class held for the periods shown. Per share net investment income (loss) amounts are calculated based on average shares outstanding during the period. Total return assumes reinvestment of all dividends and distributions, if any. Total return does not reflect payment of sales charges, if any. Total return and portfolio turnover are not annualized for periods of less than one year. The portfolio turnover rate is calculated without regard to purchase and sales transactions of short-term instruments and certain derivatives, if any. If such transactions were included, the Fund’s portfolio turnover rate may be higher.
| Year ended | Net asset value,
beginning of
period | Net
investment
income | Net
realized
and
unrealized
gain (loss) | Total from
investment
operations | Distributions
from net
investment
income |
| Class A |
| 10/31/2017 | $10.71 | 0.31 | (0.17) | 0.14 | (0.31) |
| 10/31/2016 | $10.68 | 0.32 | 0.03 | 0.35 | (0.32) |
| 10/31/2015 | $10.81 | 0.34 | (0.13) | 0.21 | (0.34) |
| 10/31/2014 | $10.54 | 0.36 | 0.27 | 0.63 | (0.36) |
| 10/31/2013 | $11.03 | 0.34 | (0.49) | (0.15) | (0.34) |
| Class C |
| 10/31/2017 | $10.72 | 0.25 | (0.19) | 0.06 | (0.24) |
| 10/31/2016 | $10.68 | 0.25 | 0.04 | 0.29 | (0.25) |
| 10/31/2015 | $10.82 | 0.27 | (0.14) | 0.13 | (0.27) |
| 10/31/2014 | $10.54 | 0.30 | 0.28 | 0.58 | (0.30) |
| 10/31/2013 | $11.03 | 0.32 | (0.49) | (0.17) | (0.32) |
| Class R4 |
| 10/31/2017 | $10.71 | 0.33 | (0.18) | 0.15 | (0.33) |
| 10/31/2016 | $10.67 | 0.34 | 0.04 | 0.38 | (0.34) |
| 10/31/2015 | $10.81 | 0.36 | (0.14) | 0.22 | (0.36) |
| 10/31/2014 | $10.53 | 0.38 | 0.27 | 0.65 | (0.37) |
| 10/31/2013 (g) | $10.93 | 0.23 | (0.41) | (0.18) | (0.22) |
| Class R5 |
| 10/31/2017 | $10.70 | 0.34 | (0.17) | 0.17 | (0.34) |
| 10/31/2016 | $10.66 | 0.35 | 0.04 | 0.39 | (0.35) |
| 10/31/2015 | $10.80 | 0.37 | (0.14) | 0.23 | (0.37) |
| 10/31/2014 | $10.52 | 0.39 | 0.28 | 0.67 | (0.39) |
| 10/31/2013 (i) | $11.07 | 0.37 | (0.56) | (0.19) | (0.36) |
The accompanying Notes to Financial Statements are an integral part of this statement.
| 30 | Columbia AMT-Free Intermediate Muni Bond Fund | Annual Report 2017 |
Total
distributions to
shareholders | Proceeds from
regulatory
settlements | Net
asset
value,
end of
period | Total
return | Total gross
expense
ratio to
average
net assets(a) | Total net
expense
ratio to
average
net assets(a),(b) | Net investment
income
ratio to
average
net assets | Portfolio
turnover | Net
assets,
end of
period
(000’s) |
| |
| (0.31) | — | $10.54 | 1.39% | 0.84% (c) | 0.77% (c),(d) | 2.99% | 11% | $189,260 |
| (0.32) | — | $10.71 | 3.28% | 0.86% | 0.77% (d) | 2.95% | 6% | $246,873 |
| (0.34) | 0.00 (e) | $10.68 | 2.00% (f) | 0.87% | 0.75% (d) | 3.19% | 15% | $233,125 |
| (0.36) | — | $10.81 | 6.03% | 0.87% | 0.75% (d) | 3.34% | 9% | $220,673 |
| (0.34) | — | $10.54 | (1.39%) | 0.86% | 0.74% (d) | 3.14% | 15% | $201,053 |
| |
| (0.24) | — | $10.54 | 0.64% | 1.49% (c) | 1.42% (c),(d) | 2.34% | 11% | $44,951 |
| (0.25) | — | $10.72 | 2.70% | 1.51% | 1.42% (d) | 2.29% | 6% | $59,746 |
| (0.27) | 0.00 (e) | $10.68 | 1.24% (f) | 1.52% | 1.40% (d) | 2.54% | 15% | $53,774 |
| (0.30) | — | $10.82 | 5.60% | 1.52% | 1.26% (d) | 2.83% | 9% | $52,507 |
| (0.32) | — | $10.54 | (1.58%) | 1.51% | 0.94% (d) | 2.94% | 15% | $51,706 |
| |
| (0.33) | — | $10.53 | 1.50% | 0.63% | 0.58% (d) | 3.16% | 11% | $17,306 |
| (0.34) | — | $10.71 | 3.58% | 0.66% | 0.57% (d) | 3.15% | 6% | $8,325 |
| (0.36) | 0.00 (e) | $10.67 | 2.11% (f) | 0.67% | 0.55% (d) | 3.42% | 15% | $2,975 |
| (0.37) | — | $10.81 | 6.31% | 0.67% | 0.55% (d) | 3.55% | 9% | $336 |
| (0.22) | — | $10.53 | (1.61%) | 0.65% (h) | 0.54% (d),(h) | 3.66% (h) | 15% | $306 |
| |
| (0.34) | — | $10.53 | 1.67% | 0.54% (c) | 0.50% (c) | 3.26% | 11% | $12,401 |
| (0.35) | — | $10.70 | 3.68% | 0.53% | 0.48% | 3.23% | 6% | $8,895 |
| (0.37) | 0.00 (e) | $10.66 | 2.20% (f) | 0.53% | 0.45% | 3.50% | 15% | $5,106 |
| (0.39) | — | $10.80 | 6.44% | 0.53% | 0.47% | 3.62% | 9% | $2,088 |
| (0.36) | — | $10.52 | (1.73%) | 0.52% (h) | 0.45% (h) | 3.62% (h) | 15% | $62 |
Columbia AMT-Free Intermediate Muni Bond Fund | Annual Report 2017
| 31 |
Financial Highlights (continued)
| Year ended | Net asset value,
beginning of
period | Net
investment
income | Net
realized
and
unrealized
gain (loss) | Total from
investment
operations | Distributions
from net
investment
income |
| Class T |
| 10/31/2017 (j) | $10.43 | 0.17 | 0.10 (k) | 0.27 | (0.17) |
| Class V(l) |
| 10/31/2017 | $10.71 | 0.32 | (0.17) | 0.15 | (0.32) |
| 10/31/2016 | $10.68 | 0.33 | 0.02 | 0.35 | (0.32) |
| 10/31/2015 | $10.81 | 0.35 | (0.13) | 0.22 | (0.35) |
| 10/31/2014 | $10.54 | 0.36 | 0.27 | 0.63 | (0.36) |
| 10/31/2013 | $11.03 | 0.35 | (0.50) | (0.15) | (0.34) |
| Class Y |
| 10/31/2017 (m) | $10.43 | 0.22 | 0.13 (k) | 0.35 | (0.23) |
| Class Z |
| 10/31/2017 | $10.72 | 0.33 | (0.18) | 0.15 | (0.33) |
| 10/31/2016 | $10.69 | 0.34 | 0.03 | 0.37 | (0.34) |
| 10/31/2015 | $10.82 | 0.36 | (0.13) | 0.23 | (0.36) |
| 10/31/2014 | $10.54 | 0.38 | 0.28 | 0.66 | (0.38) |
| 10/31/2013 | $11.04 | 0.36 | (0.50) | (0.14) | (0.36) |
| Notes to Financial Highlights |
| (a) | In addition to the fees and expenses that the Fund bears directly, the Fund indirectly bears a pro rata share of the fees and expenses of any other funds in which it invests. Such indirect expenses are not included in the Fund’s reported expense ratios. |
| (b) | Total net expenses include the impact of certain fee waivers/expense reimbursements made by the Investment Manager and certain of its affiliates, if applicable. |
| (c) | Expenses have been reduced due to a reimbursement of expenses overbilled by a third party. If the reimbursement had been excluded, the expense ratios would have been higher by the percentages shown for each class in the table below. All fee waivers and expense reimbursements by the Investment Manager and its affiliates were applied before giving effect to this third party reimbursement. |
| | Class A | Class C | Class R5 | Class V | Class Z |
| 10/31/2017 | 0.01 % | 0.01 % | 0.01 % | 0.01 % | 0.01 % |
| (d) | The benefits derived from expense reductions had an impact of less than 0.01%. |
| (e) | Rounds to zero. |
| (f) | The Fund received proceeds from regulatory settlements. Had the Fund not received these proceeds, the total return would have been lower by 0.02%. |
| (g) | Class R4 shares commenced operations on March 19, 2013. Per share data and total return reflect activity from that date. |
| (h) | Annualized. |
| (i) | Class R5 shares commenced operations on November 8, 2012. Per share data and total return reflect activity from that date. |
| (j) | Class T shares commenced operations on April 3, 2017. Per share data and total return reflect activity from that date. |
| (k) | Calculation of the net gain (loss) per share (both realized and unrealized) does not correlate to the aggregate realized and unrealized gain (loss) presented in the Statement of Operations due to the timing of subscriptions and redemptions of Fund shares in relation to fluctuations in the market value of the portfolio. |
| (l) | Prior to January 24, 2017, Class V shares were known as Class T shares. |
| (m) | Class Y shares commenced operations on March 1, 2017. Per share data and total return reflect activity from that date. |
The accompanying Notes to Financial Statements are an integral part of this statement.
| 32 | Columbia AMT-Free Intermediate Muni Bond Fund | Annual Report 2017 |
Total
distributions to
shareholders | Proceeds from
regulatory
settlements | Net
asset
value,
end of
period | Total
return | Total gross
expense
ratio to
average
net assets(a) | Total net
expense
ratio to
average
net assets(a),(b) | Net investment
income
ratio to
average
net assets | Portfolio
turnover | Net
assets,
end of
period
(000’s) |
| |
| (0.17) | — | $10.53 | 2.63% | 0.89% (h) | 0.83% (d),(h) | 2.86% (h) | 11% | $10 |
| |
| (0.32) | — | $10.54 | 1.44% | 0.79% (c) | 0.72% (c),(d) | 3.03% | 11% | $13,371 |
| (0.32) | — | $10.71 | 3.33% | 0.81% | 0.72% (d) | 3.00% | 6% | $14,060 |
| (0.35) | 0.00 (e) | $10.68 | 2.05% (f) | 0.82% | 0.70% (d) | 3.24% | 15% | $14,263 |
| (0.36) | — | $10.81 | 6.09% | 0.82% | 0.70% (d) | 3.39% | 9% | $15,341 |
| (0.34) | — | $10.54 | (1.34%) | 0.81% | 0.69% (d) | 3.19% | 15% | $16,759 |
| |
| (0.23) | — | $10.55 | 3.35% | 0.51% (h) | 0.47% (h) | 3.25% (h) | 11% | $1,865 |
| |
| (0.33) | — | $10.54 | 1.50% | 0.63% (c) | 0.57% (c),(d) | 3.18% | 11% | $1,679,211 |
| (0.34) | — | $10.72 | 3.48% | 0.66% | 0.57% (d) | 3.15% | 6% | $2,087,345 |
| (0.36) | 0.00 (e) | $10.69 | 2.20% (f) | 0.67% | 0.55% (d) | 3.39% | 15% | $1,846,198 |
| (0.38) | — | $10.82 | 6.34% | 0.67% | 0.55% (d) | 3.54% | 9% | $1,803,380 |
| (0.36) | — | $10.54 | (1.28%) | 0.66% | 0.54% (d) | 3.33% | 15% | $1,889,934 |
Columbia AMT-Free Intermediate Muni Bond Fund | Annual Report 2017
| 33 |
Notes to Financial Statements
October 31, 2017
Note 1. Organization
Columbia AMT-Free Intermediate Muni Bond Fund (the Fund), a series of Columbia Funds Series Trust I (the Trust), is a diversified fund. The Trust is registered under the Investment Company Act of 1940, as amended (the 1940 Act), as an open-end management investment company organized as a Massachusetts business trust.
Fund shares
The Trust may issue an unlimited number of shares (without par value). Although all share classes generally have identical voting, dividend and liquidation rights, each share class votes separately when required by the Trust’s organizational documents or by law. Different share classes pay different distribution amounts to the extent the expenses of such share classes differ, and distributions in liquidation will be proportional to the net asset value of each share class. Each share class has its own expense and sales charge structure. The Fund offers each of the share classes identified below.
Class A shares are subject to a maximum front-end sales charge of 3.00% based on the initial investment amount. Class A shares purchased without an initial sales charge are subject to a contingent deferred sales charge (CDSC) of 0.75% on certain investments of $500,000 or more if redeemed within 12 months after purchase.
Class B shares of the Fund are no longer offered for sale. When available, Class B shares were subject to a maximum CDSC of 3.00% based upon the holding period after purchase. Effective July 17, 2017, Class B shares were automatically converted to Class A shares without a CDSC. On August 4, 2017, the capital owned by Columbia Management Investment Advisers, LLC in Class B shares was redeemed without a CDSC.
Class C shares are subject to a 1.00% CDSC on shares redeemed within 12 months after purchase.
Class R4 shares are not subject to sales charges and are generally available only to omnibus retirement plans and certain investors as described in the Fund’s prospectus. Effective November 1, 2017, Class R4 shares were renamed Advisor Class shares.
Class R5 shares are not subject to sales charges and are generally available only to investors purchasing through authorized investment professionals and omnibus retirement plans as described in the Fund’s prospectus. Effective November 1, 2017, Class R5 shares were renamed Institutional 2 Class shares.
Class T shares are subject to a maximum front-end sales charge of 2.50% per transaction and must be purchased through financial intermediaries that, by written agreement with Columbia Management Investment Distributors, Inc., are specifically authorized to sell Class T shares. Class T shares commenced operations on April 3, 2017.
Class V shares are subject to a maximum front-end sales charge of 4.75% based on the investment amount. Class V shares purchased without an initial sales charge in accounts aggregating $1 million to $50 million at the time of purchase are subject to a CDSC if the shares are sold within 18 months after purchase, charged as follows: 1.00% CDSC if redeemed within 12 months after purchase, and 0.50% CDSC if redeemed more than 12, but less than 18, months after purchase. Class V shares are available only to investors who received (and who have continuously held) Class V shares in connection with previous fund reorganizations. Prior to January 24, 2017, Class V shares were known as Class T shares. Class V shares have no relation to, or connection with, the Fund’s current Class T shares.
Class Y shares are not subject to sales charges and are available to institutional and certain other investors as described in the Fund’s prospectus. Class Y shares commenced operations on March 1, 2017. Effective November 1, 2017, Class Y shares were renamed Institutional 3 Class shares.
Class Z shares are not subject to sales charges and are generally available only to eligible investors, which are subject to different investment minimums as described in the Fund’s prospectus. Effective November 1, 2017, Class Z shares were renamed Institutional Class shares.
| 34 | Columbia AMT-Free Intermediate Muni Bond Fund | Annual Report 2017 |
Notes to Financial Statements (continued)
October 31, 2017
Note 2. Summary of significant accounting policies
Basis of preparation
The Fund is an investment company that applies the accounting and reporting guidance in the Financial Accounting Standards Board (FASB) Accounting Standards Codification Topic 946, Financial Services - Investment Companies (ASC 946). The financial statements are prepared in accordance with U.S. generally accepted accounting principles (GAAP), which requires management to make certain estimates and assumptions that affect the reported amounts of assets and liabilities, the disclosure of contingent assets and liabilities at the date of the financial statements and the reported amounts of income and expenses during the reporting period. Actual results could differ from those estimates. The Fund received a reimbursement for expenses overbilled by a third party. Such reimbursement is included as an offset to other expenses on the Statement of Operations. All fee waivers and expense reimbursements by Columbia Management Investment Advisers, LLC and its affiliates were applied before giving effect to the third party reimbursement.
The following is a summary of significant accounting policies followed by the Fund in the preparation of its financial statements.
Security valuation
Debt securities generally are valued by pricing services approved by the Board of Trustees based upon market transactions for normal, institutional-size trading units of similar securities. The services may use various pricing techniques that take into account, as applicable, factors such as yield, quality, coupon rate, maturity, type of issue, trading characteristics and other data, as well as approved independent broker-dealer quotes. Debt securities for which quotations are not readily available or not believed to be reflective of market value may also be valued based upon a bid quote from an approved independent broker-dealer. Debt securities maturing in 60 days or less are valued primarily at amortized cost value, unless this method results in a valuation that management believes does not approximate market value.
Investments in open-end investment companies, including money market funds, are valued at their latest net asset value.
Investments for which market quotations are not readily available, or that have quotations which management believes are not reflective of market value or reliable, are valued at fair value as determined in good faith under procedures approved by and under the general supervision of the Board of Trustees. If a security or class of securities (such as foreign securities) is valued at fair value, such value is likely to be different from the quoted or published price for the security.
The determination of fair value often requires significant judgment. To determine fair value, management may use assumptions including but not limited to future cash flows and estimated risk premiums. Multiple inputs from various sources may be used to determine fair value.
GAAP requires disclosure regarding the inputs and valuation techniques used to measure fair value and any changes in valuation inputs or techniques. In addition, investments shall be disclosed by major category. This information is disclosed following the Fund’s Portfolio of Investments.
Delayed delivery securities
The Fund may trade securities on other than normal settlement terms, including securities purchased or sold on a “when-issued” or "forward commitment" basis. This may increase risk to the Fund since the other party to the transaction may fail to deliver, which could cause the Fund to subsequently invest at less advantageous prices. The Fund designates cash or liquid securities in an amount equal to the delayed delivery commitment.
Security transactions
Security transactions are accounted for on the trade date. Cost is determined and gains (losses) are based upon the specific identification method for both financial statement and federal income tax purposes.
Income recognition
Interest income is recorded on an accrual basis. Market premiums and discounts, including original issue discounts, are amortized and accreted, respectively, over the expected life of the security on all debt securities, unless otherwise noted.
Columbia AMT-Free Intermediate Muni Bond Fund | Annual Report 2017
| 35 |
Notes to Financial Statements (continued)
October 31, 2017
The Fund may place a debt security on non-accrual status and reduce related interest income when it becomes probable that the interest will not be collected and the amount of uncollectible interest can be reasonably estimated. A defaulted debt security is removed from non-accrual status when the issuer resumes interest payments or when collectibility of interest is reasonably assured.
Dividend income is recorded on the ex-dividend date.
Expenses
General expenses of the Trust are allocated to the Fund and other funds of the Trust based upon relative net assets or other expense allocation methodologies determined by the nature of the expense. Expenses directly attributable to the Fund are charged to the Fund. Expenses directly attributable to a specific class of shares are charged to that share class.
Determination of class net asset value
All income, expenses (other than class-specific expenses, which are charged to that share class, as shown in the Statement of Operations) and realized and unrealized gains (losses) are allocated to each class of the Fund on a daily basis, based on the relative net assets of each class, for purposes of determining the net asset value of each class.
Federal income tax status
The Fund intends to qualify each year as a regulated investment company under Subchapter M of the Internal Revenue Code, as amended, and will distribute substantially all of its net tax-exempt and investment company taxable income and net capital gain, if any, for its tax year, and as such will not be subject to federal income taxes. In addition, the Fund intends to distribute in each calendar year substantially all of its ordinary income, capital gain net income and certain other amounts, if any, such that the Fund should not be subject to federal excise tax. Therefore, no federal income or excise tax provision is recorded.
Distributions to shareholders
Distributions from net investment income, if any, are declared daily and paid monthly. Net realized capital gains, if any, are distributed at least annually. Income distributions and capital gain distributions are determined in accordance with federal income tax regulations, which may differ from GAAP.
Guarantees and indemnifications
Under the Trust’s organizational documents and, in some cases, by contract, its officers and trustees are indemnified against certain liabilities arising out of the performance of their duties to the Trust or its funds. In addition, certain of the Fund’s contracts with its service providers contain general indemnification clauses. The Fund’s maximum exposure under these arrangements is unknown since the amount of any future claims that may be made against the Fund cannot be determined, and the Fund has no historical basis for predicting the likelihood of any such claims.
Recent accounting pronouncement
Accounting Standards Update 2017-08 Premium Amortization on Purchased Callable Debt Securities
In March 2017, the Financial Accounting Standards Board issued Accounting Standards Update (ASU) No. 2017-08 Premium Amortization on Purchased Callable Debt Securities. ASU No. 2017-08 updates the accounting standards to shorten the amortization period for certain purchased callable debt securities, held at a premium, to be amortized to the earliest call date. The update applies to securities with explicit, noncontingent call features that are callable at fixed prices and on preset dates. The standard is effective for annual periods beginning after December 15, 2018 and interim periods within those fiscal years. At this time, management is evaluating the implication of this guidance and the impact it will have on the financial statement amounts and footnote disclosures, if any.
| 36 | Columbia AMT-Free Intermediate Muni Bond Fund | Annual Report 2017 |
Notes to Financial Statements (continued)
October 31, 2017
Note 3. Fees and other transactions with affiliates
Management services fees
The Fund has entered into a Management Agreement with Columbia Management Investment Advisers, LLC (the Investment Manager), a wholly-owned subsidiary of Ameriprise Financial, Inc. (Ameriprise Financial). Under the Management Agreement, the Investment Manager provides the Fund with investment research and advice, as well as administrative and accounting services. The management services fee is an annual fee that is equal to a percentage of the Fund’s daily net assets that declines from 0.48% to 0.29% as the Fund’s net assets increase. The effective management services fee rate for the year ended October 31, 2017 was 0.46% of the Fund’s average daily net assets.
Compensation of board members
Members of the Board of Trustees, who are not officers or employees of the Investment Manager or Ameriprise Financial, are compensated for their services to the Fund as disclosed in the Statement of Operations. These members of the Board of Trustees may participate in a Deferred Compensation Plan (the Plan) which may be terminated at any time. Obligations of the Plan will be paid solely out of the Fund’s assets, and all amounts payable under the Plan constitute a general unsecured obligation of the Fund.
Compensation of Chief Compliance Officer
The Board of Trustees has appointed a Chief Compliance Officer to the Fund in accordance with federal securities regulations. A portion of the Chief Compliance Officer’s total compensation is allocated to the Fund, along with other affiliated funds governed by the Board of Trustees, based on relative net assets. The total amount allocated to all affiliated funds governed by the Board of Trustees will not exceed $40,000 annually.
Transactions with affiliates
For the year ended October 31, 2017, the Fund engaged in purchase and/or sale transactions with affiliates and/or accounts that have a common investment manager (or affiliated investment managers), common directors/trustees, and/or common officers. Those purchase and sale transactions complied with provisions of Rule 17a-7 under the 1940 Act and were $2,258,267 and $0, respectively.
Transfer agency fees
Under a Transfer and Dividend Disbursing Agent Agreement, Columbia Management Investment Services Corp. (the Transfer Agent), an affiliate of the Investment Manager and a wholly-owned subsidiary of Ameriprise Financial, is responsible for providing transfer agency services to the Fund. The Transfer Agent has contracted with DST Asset Manager Solutions, Inc. (DST) to serve as sub-transfer agent. The Transfer Agent pays the fees of DST for services as sub-transfer agent and DST is not entitled to reimbursement for such fees from the Fund (with the exception of out-of-pocket fees).
The Fund pays the Transfer Agent a monthly transfer agency fee based on the number or the average value of accounts, depending on the type of account. In addition, the Fund pays the Transfer Agent a fee for shareholder services based on the number of accounts or on a percentage of the average aggregate value of the Fund’s shares maintained in omnibus accounts up to the lesser of the amount charged by the financial intermediary or a cap established by the Board of Trustees from time to time.
The Transfer Agent also receives compensation from the Fund for various shareholder services and reimbursements for certain out-of-pocket fees. Effective August 1, 2017, total transfer agency fees for Class R5 and Class Y shares are subject to an annual limitation of not more than 0.07% and 0.02%, respectively, of the average daily net assets attributable to each share class. From January 1, 2017 to July 31, 2017, these limitations were 0.075% for Class R5 shares and 0.025% for Class Y shares; and prior to January 1, 2017, the limitation was 0.05% for Class R5 shares.
Columbia AMT-Free Intermediate Muni Bond Fund | Annual Report 2017
| 37 |
Notes to Financial Statements (continued)
October 31, 2017
For the year ended October 31, 2017, the Fund’s effective transfer agency fee rates as a percentage of average daily net assets of each class were as follows:
| | Effective rate (%) |
| Class A | 0.16 |
| Class B | 0.14 (a),(b) |
| Class C | 0.16 |
| Class R4 | 0.15 |
| Class R5 | 0.06 |
| Class T | 0.13 (c) |
| Class V | 0.16 |
| Class Y | 0.02 (c) |
| Class Z | 0.16 |
| (a) | Effective July 17, 2017, Class B shares were automatically converted to Class A shares. |
| (b) | Unannualized. |
| (c) | Annualized. |
An annual minimum account balance fee of $20 may apply to certain accounts with a value below the applicable share class’s initial minimum investment requirements to reduce the impact of small accounts on transfer agency fees. These minimum account balance fees are remitted to the Fund and recorded as part of expense reductions in the Statement of Operations. For the year ended October 31, 2017, these minimum account balance fees reduced total expenses of the Fund by $420.
Distribution and service fees
The Fund has entered into an agreement with Columbia Management Investment Distributors, Inc. (the Distributor), an affiliate of the Investment Manager and a wholly-owned subsidiary of Ameriprise Financial, for distribution and shareholder services. The Board of Trustees has approved, and the Fund has adopted, distribution and shareholder service plans (the Plans) applicable to certain share classes, which set the distribution and service fees for the Fund. These fees are calculated daily and are intended to compensate the Distributor and/or eligible selling and/or servicing agents for selling shares of the Fund and providing services to investors.
Under the Plans, the Fund pays a monthly service fee to the Distributor at the maximum annual rate of 0.20% of the average daily net assets attributable to Class A, Class B and Class C shares of the Fund. The Fund pays a monthly service fee to the Distributor at the maximum annual rate of 0.25% of the average daily net assets attributable to Class T shares of the Fund. Also under the Plans, the Fund pays a monthly distribution fee to the Distributor at the maximum annual rates of 0.65% of the average daily net assets attributable to Class B and Class C shares of the Fund. As a result of all Class B shares of the Fund being redeemed or converted to Class A shares, August 4, 2017 was the last day the Fund paid a service fee or distribution fee for Class B shares.
Shareholder services fees
The Fund has adopted a shareholder services plan that permits it to pay for certain services provided to Class V shareholders by their selling and/or servicing agents. The Fund may pay shareholder servicing fees up to an aggregate annual rate of 0.40% of the Fund’s average daily net assets attributable to Class V shares (comprised of up to 0.20% for shareholder liaison services and up to 0.20% for administrative support services). These fees are currently limited to an aggregate annual rate of not more than 0.15% of the Fund’s average daily net assets attributable to Class V shares.
| 38 | Columbia AMT-Free Intermediate Muni Bond Fund | Annual Report 2017 |
Notes to Financial Statements (continued)
October 31, 2017
Sales charges (unaudited)
Sales charges, including front-end charges and CDSCs, received by the Distributor for distributing Fund shares for the year ended October 31, 2017, if any, are listed below:
| | Amount ($) |
| Class A | 69,417 |
| Class C | 4,431 |
| Class V | 485 |
Expenses waived/reimbursed by the Investment Manager and its affiliates
The Investment Manager and certain of its affiliates have contractually agreed to waive fees and/or reimburse expenses (excluding certain fees and expenses described below) for the period(s) disclosed below, unless sooner terminated at the sole discretion of the Board of Trustees, so that the Fund’s net operating expenses, after giving effect to fees waived/expenses reimbursed and any balance credits and/or overdraft charges from the Fund’s custodian, do not exceed the following annual rate(s) as a percentage of the class’ average daily net assets:
| | March 1, 2017
through
February 28, 2018 | Prior to
March 1, 2017 |
| Class A | 0.78% | 0.78% |
| Class C | 1.43 | 1.43 |
| Class R4 | 0.58 | 0.58 |
| Class R5 | 0.525 | 0.49 |
| Class T | 0.83* | - |
| Class V | 0.73 | 0.73 |
| Class Y | 0.475 | - |
| Class Z | 0.58 | 0.58 |
* Expense cap rate is contractual from April 3, 2017 (the commencement of operations of Class T shares) through February 28, 2018.
Under the agreement governing these fee waivers and/or expense reimbursement arrangements, the following fees and expenses are excluded from the waiver/reimbursement commitment, and therefore will be paid by the Fund, if applicable: taxes (including foreign transaction taxes), expenses associated with investments in affiliated and non-affiliated pooled investment vehicles (including mutual funds and exchange-traded funds), transaction costs and brokerage commissions, costs related to any securities lending program, dividend expenses associated with securities sold short, inverse floater program fees and expenses, transaction charges and interest on borrowed money, interest, infrequent and/or unusual expenses and any other expenses the exclusion of which is specifically approved by the Board of Trustees. This agreement may be modified or amended only with approval from the Investment Manager, certain of its affiliates and the Fund. In addition to the contractual agreement, the Investment Manager and certain of its affiliates have voluntarily agreed to waive fees and/or reimburse Fund expenses (excluding certain fees and expenses described above) so that Fund level expenses (expenses directly attributable to the Fund and not to a specific share class) are waived proportionately across all share classes, but the Fund’s net operating expenses shall not exceed the contractual annual rates listed in the table above. This arrangement may be revised or discontinued at any time. Any fees waived and/or expenses reimbursed under the expense reimbursement arrangements described above are not recoverable by the Investment Manager or its affiliates in future periods.
Note 4. Federal tax information
The timing and character of income and capital gain distributions are determined in accordance with income tax regulations, which may differ from GAAP because of temporary or permanent book to tax differences.
At October 31, 2017, these differences are primarily due to differing treatment for tax straddles, capital loss carryforwards, trustees’ deferred compensation and distributions. To the extent these differences are permanent, reclassifications are made among the components of the Fund’s net assets in the Statement of Assets and Liabilities. Temporary differences do not require reclassifications.
Columbia AMT-Free Intermediate Muni Bond Fund | Annual Report 2017
| 39 |
Notes to Financial Statements (continued)
October 31, 2017
In the Statement of Assets and Liabilities the following reclassifications were made:
Undistributed net
investment
income ($) | Accumulated
net realized
(loss) ($) | Paid in
capital ($) |
| (91) | 832,864 | (832,773) |
Net investment income (loss) and net realized gains (losses), as disclosed in the Statement of Operations, and net assets were not affected by this reclassification.
The tax character of distributions paid during the years indicated was as follows:
| Year Ended October 31, 2017 | Year Ended October 31, 2016 |
Ordinary
income ($) | Tax-exempt
income ($) | Long-term
capital gains ($) | Total ($) | Ordinary
income ($) | Tax-exempt
income ($) | Long-term
capital gains ($) | Total ($) |
| 785,209 | 64,312,196 | — | 65,097,405 | 181,886 | 72,884,665 | — | 73,066,551 |
Short-term capital gain distributions, if any, are considered ordinary income distributions for tax purposes.
At October 31, 2017, the components of distributable earnings on a tax basis were as follows:
Undistributed
ordinary income ($) | Undistributed tax-
exempt income ($) | Undistributed
long-term
capital gains ($) | Capital loss
carryforwards ($) | Net unrealized
appreciation ($) |
| — | 7,976,517 | — | (1,684,697) | 105,183,805 |
At October 31, 2017, the cost of all investments for federal income tax purposes along with the aggregate gross unrealized appreciation and depreciation based on that cost was:
Federal
tax cost ($) | Gross unrealized
appreciation ($) | Gross unrealized
(depreciation) ($) | Net unrealized
appreciation ($) |
| 1,825,972,508 | 108,323,524 | (3,139,719) | 105,183,805 |
Tax cost of investments and unrealized appreciation/(depreciation) may also include timing differences that do not constitute adjustments to tax basis.
The following capital loss carryforwards, determined at October 31, 2017, may be available to reduce taxable income arising from future net realized gains on investments, if any, to the extent permitted by the Internal Revenue Code. Capital loss carryforwards with no expiration are required to be utilized prior to any capital losses which carry an expiration date. As a result of this ordering rule, capital loss carryforwards which carry an expiration date may be more likely to expire unused. In addition, for the year ended October 31, 2017, capital loss carryforwards utilized, expired unused and permanently lost, if any, were as follows:
| 2018 ($) | 2019 ($) | No expiration
short-term ($) | No expiration
long-term ($) | Total ($) | Utilized ($) | Expired ($) | Permanently
lost ($) |
| 62,558 | — | 1,622,139 | — | 1,684,697 | 4,168,576 | 832,773 | — |
Management of the Fund has concluded that there are no significant uncertain tax positions in the Fund that would require recognition in the financial statements. However, management’s conclusion may be subject to review and adjustment at a later date based on factors including, but not limited to, new tax laws, regulations, and administrative interpretations (including relevant court decisions). Generally, the Fund’s federal tax returns for the prior three fiscal years remain subject to examination by the Internal Revenue Service.
Note 5. Portfolio information
The cost of purchases and proceeds from sales of securities, excluding short-term investments and derivatives, if any, aggregated to $226,486,271 and $600,566,590, respectively, for the year ended October 31, 2017. The amount of purchase and sale activity impacts the portfolio turnover rate reported in the Financial Highlights.
| 40 | Columbia AMT-Free Intermediate Muni Bond Fund | Annual Report 2017 |
Notes to Financial Statements (continued)
October 31, 2017
Note 6. Regulatory settlements
During the year ended October 31, 2015, the Fund recorded a receivable of $485,268 as a result of a regulatory settlement proceeding brought by the Securities and Exchange Commission against a third party relating to market timing and/or late trading of mutual funds. This amount represented the Fund’s portion of the proceeds from the settlement (neither the Fund nor the Investment Manager were a party to the proceeding) and is disclosed as a receivable on the Statement of Assets and Liabilities.
Note 7. Line of credit
The Fund has access to a revolving credit facility with a syndicate of banks led by Citibank, N.A., HSBC Bank USA, N.A. and JPMorgan Chase Bank, N.A. whereby the Fund may borrow for the temporary funding of shareholder redemptions or for other temporary or emergency purposes. The credit facility, which is a collective agreement between the Fund and certain other funds managed by the Investment Manager, severally and not jointly, permits collective borrowings up to $1 billion. Interest is charged to each participating fund based on its borrowings at a rate equal to the higher of (i) the overnight federal funds rate plus 1.00% or (ii) the one-month LIBOR rate plus 1.00%. Each borrowing under the credit facility matures no later than 60 days after the date of borrowing. The Fund also pays a commitment fee equal to its pro rata share of the amount of the credit facility at a rate of 0.15% per annum. The commitment fee is included in other expenses in the Statement of Operations.
The Fund had no borrowings during the year ended October 31, 2017.
Note 8. Significant risks
Credit risk
Credit risk is the risk that the value of debt securities in the Fund’s portfolio may decline because the issuer may default and fail to pay interest or repay principal when due. Rating agencies assign credit ratings to debt securities to indicate their credit risk. Lower rated or unrated debt securities held by the Fund may present increased credit risk as compared to higher-rated debt securities.
Interest rate risk
Interest rate risk is the risk of losses attributable to changes in interest rates. In general, if prevailing interest rates rise, the values of debt securities tend to fall, and if interest rates fall, the values of debt securities tend to rise. Actions by governments and central banking authorities can result in increases in interest rates. Increasing interest rates may negatively affect the value of debt securities held by the Fund, resulting in a negative impact on the Fund’s performance and net asset value per share. In general, the longer the maturity or duration of a debt security, the greater its sensitivity to changes in interest rates.
Liquidity risk
Liquidity risk is the risk associated with a lack of marketability of investments which may make it difficult to sell the investment at a desirable time or price. Changing regulatory, market or other conditions or environments (for example, the interest rate or credit environments) may adversely affect the liquidity of the Fund’s investments. The Fund may have to accept a lower selling price for the holding, sell other investments, or forego another, more appealing investment opportunity. Generally, the less liquid the market at the time the Fund sells a portfolio investment, the greater the risk of loss or decline of value to the Fund. A less liquid market can lead to an increase in Fund redemptions, which may negatively impact Fund performance and net asset value per share, including, for example, if the Fund is forced to sell securities in a down market.
Municipal securities risk
Securities issued by a particular state and its instrumentalities are subject to the risk of unfavorable developments in such state. A municipal security can be significantly affected by adverse tax, legislative, regulatory, demographic or political changes as well as changes in a particular state’s (state and its instrumentalities’) financial, economic or other condition and prospects.
Columbia AMT-Free Intermediate Muni Bond Fund | Annual Report 2017
| 41 |
Notes to Financial Statements (continued)
October 31, 2017
Shareholder concentration risk
At October 31, 2017, one unaffiliated shareholder of record owned 76.4% of the outstanding shares of the Fund in one or more accounts. The Fund has no knowledge about whether any portion of those shares was owned beneficially. Subscription and redemption activity by concentrated accounts may have a significant effect on the operations of the Fund. In the case of a large redemption, the Fund may be forced to sell investments at inopportune times, including its liquid positions, which may result in Fund losses and the Fund holding a higher percentage of less liquid positions. Large redemptions could result in decreased economies of scale and increased operating expenses for non-redeeming Fund shareholders.
Note 9. Subsequent events
Management has evaluated the events and transactions that have occurred through the date the financial statements were issued. Other than as noted in Note 1 above, there were no items requiring adjustment of the financial statements or additional disclosure.
Note 10. Information regarding pending and settled legal proceedings
Ameriprise Financial and certain of its affiliates have historically been involved in a number of legal, arbitration and regulatory proceedings, including routine litigation, class actions, and governmental actions, concerning matters arising in connection with the conduct of their business activities. Ameriprise Financial believes that the Fund is not currently the subject of, and that neither Ameriprise Financial nor any of its affiliates are the subject of, any pending legal, arbitration or regulatory proceedings that are likely to have a material adverse effect on the Fund or the ability of Ameriprise Financial or its affiliates to perform under their contracts with the Fund. Ameriprise Financial is required to make quarterly (10-Q), annual (10-K) and, as necessary, 8-K filings with the Securities and Exchange Commission (SEC) on legal and regulatory matters that relate to Ameriprise Financial and its affiliates. Copies of these filings may be obtained by accessing the SEC website at www.sec.gov.
There can be no assurance that these matters, or the adverse publicity associated with them, will not result in increased Fund redemptions, reduced sale of Fund shares or other adverse consequences to the Fund. Further, although we believe proceedings are not likely to have a material adverse effect on the Fund or the ability of Ameriprise Financial or its affiliates to perform under their contracts with the Fund, these proceedings are subject to uncertainties and, as such, we are unable to estimate the possible loss or range of loss that may result. An adverse outcome in one or more of these proceedings could result in adverse judgments, settlements, fines, penalties or other relief that could have a material adverse effect on the consolidated financial condition or results of operations of Ameriprise Financial.
| 42 | Columbia AMT-Free Intermediate Muni Bond Fund | Annual Report 2017 |
Report of Independent Registered Public Accounting Firm
To the Trustees of Columbia Funds Series Trust I and the Shareholders of Columbia AMT-Free Intermediate Muni Bond Fund
In our opinion, the accompanying statement of assets and liabilities, including the portfolio of investments, and the related statements of operations and of changes in net assets and the financial highlights present fairly, in all material respects, the financial position of Columbia AMT-Free Intermediate Muni Bond Fund (the “Fund”, a series of Columbia Funds Series Trust I) as of October 31, 2017, the results of its operations for the year then ended, the changes in its net assets for each of the two years in the period then ended and the financial highlights for each of the periods indicated therein, in conformity with accounting principles generally accepted in the United States of America. These financial statements and financial highlights (hereafter referred to as “financial statements”) are the responsibility of the Fund’s management. Our responsibility is to express an opinion on these financial statements based on our audits. We conducted our audits of these financial statements in accordance with the standards of the Public Company Accounting Oversight Board (United States). Those standards require that we plan and perform the audit to obtain reasonable assurance about whether the financial statements are free of material misstatement. An audit includes examining, on a test basis, evidence supporting the amounts and disclosures in the financial statements, assessing the accounting principles used and significant estimates made by management, and evaluating the overall financial statement presentation. We believe that our audits, which included confirmation of securities as of October 31, 2017 by correspondence with the custodian and brokers, provide a reasonable basis for our opinion.
/s/ PricewaterhouseCoopers LLP
Minneapolis, MN
December 21, 2017
Columbia AMT-Free Intermediate Muni Bond Fund | Annual Report 2017
| 43 |
Federal Income Tax Information
(Unaudited)
The Fund hereby designates the following tax attributes for the fiscal year ended October 31, 2017. Shareholders will be notified in early 2018 of the amounts for use in preparing 2017 income tax returns.
Exempt-
interest
dividends | |
| 98.79% | |
Exempt-interest dividends. The percentage of net investment income distributed during the fiscal year that qualifies as exempt-interest dividends for federal income tax purposes.
| 44 | Columbia AMT-Free Intermediate Muni Bond Fund | Annual Report 2017 |
Shareholders elect the Board that oversees the Fund’s operations. The Board appoints officers who are responsible for day-to-day business decisions based on policies set by the Board. The following table provides basic biographical information about the Fund’s Trustees, including their principal occupations during the past five years, although specific titles for individuals may have varied over the period. The year set forth beneath Length of Service in the table below is the year in which the Trustee was first appointed or elected as Trustee to any Fund currently in the Columbia Funds Complex or a predecessor thereof. Under current Board policy, members serve terms of indefinite duration.
Independent trustees
| Name, address, year of birth | Position held with the Trust and length of service | Principal occupation(s) during the past five years and other relevant professional experience | Number of Funds in the Columbia Fund Complex overseen | Other directorships held by Trustee during the past five years |
Janet Langford Carrig
c/o Columbia Management
Investment Advisers, LLC
225 Franklin Street
Mail Drop BX32 05228
Boston, MA 02110
1957 | Trustee
1996 | Senior Vice President, General Counsel and Corporate Secretary, ConocoPhillips (independent energy company) since September 2007 | 66 | None |
Douglas A. Hacker
c/o Columbia Management
Investment Advisers, LLC
225 Franklin Street
Mail Drop BX32 05228
Boston, MA 02110
1955 | Trustee and Chairman of the Board
1996 | Independent business executive since May 2006; Executive Vice President — Strategy of United Airlines from December 2002 to May 2006; President of UAL Loyalty Services (airline marketing company) from September 2001 to December 2002; Executive Vice President and Chief Financial Officer of United Airlines from July 1999 to September 2001 | 66 | Spartan Nash Company, (food distributor); Nash Finch Company (food distributor) from 2005 to 2013; Aircastle Limited (aircraft leasing); SeaCube Container Leasing Ltd. (container leasing) from 2010 to 2013; and Travelport Worldwide Limited (travel information technology) |
Nancy T. Lukitsh
c/o Columbia Management
Investment Advisers, LLC
225 Franklin Street
Mail Drop BX32 05228
Boston, MA 02110
1956 | Trustee
2011 | Senior Vice President, Partner and Director of Marketing, Wellington Management Company, LLP (investment adviser) from 1997 to 2010; Chair, Wellington Management Portfolios (commingled non-U.S. investment pools) from 2007 to 2010; Director, Wellington Trust Company, NA and other Wellington affiliates from 1997 to 2010 | 66 | None |
David M. Moffett
c/o Columbia Management
Investment Advisers, LLC
225 Franklin Street
Mail Drop BX32 05228
Boston, MA 02110
1952 | Trustee
2011 | Retired. Consultant to Bridgewater and Associates | 66 | Director, CSX Corporation; Genworth Financial, Inc. (financial and insurance products and services); PayPal Holdings Inc. (payment and data processing services); Trustee, University of Oklahoma Foundation; former Director, eBay Inc. (online trading community), 2007-2015; and former Director, CIT Bank, CIT Group Inc. (commercial and consumer finance), 2010-2016 |
Columbia AMT-Free Intermediate Muni Bond Fund | Annual Report 2017
| 45 |
TRUSTEES AND OFFICERS (continued)
Independent trustees (continued)
| Name, address, year of birth | Position held with the Trust and length of service | Principal occupation(s) during the past five years and other relevant professional experience | Number of Funds in the Columbia Fund Complex overseen | Other directorships held by Trustee during the past five years |
Charles R. Nelson
c/o Columbia Management
Investment Advisers, LLC
225 Franklin Street
Mail Drop BX32 05228
Boston, MA 02110
1942 | Trustee
1981 | Retired. Professor Emeritus, University of Washington since 2011; Professor of Economics, University of Washington from 1976 to 2011; Ford and Louisa Van Voorhis Professor of Political Economy, University of Washington from 1993 to 2011; Adjunct Professor of Statistics, University of Washington from 1980 to 2011; Associate Editor, Journal of Money, Credit and Banking from September 1993 to 2008; consultant on econometric and statistical matters | 66 | None |
John J. Neuhauser
c/o Columbia Management
Investment Advisers, LLC
225 Franklin Street
Mail Drop BX32 05228
Boston, MA 02110
1943 | Trustee
1984 | President, Saint Michael’s College since August 2007; Director or Trustee of several non-profit organizations, including University of Vermont Medical Center; Academic Vice President and Dean of Faculties, Boston College from August 1999 to October 2005; University Professor, Boston College from November 2005 to August 2007 | 66 | Liberty All-Star Equity Fund and Liberty All- Star Growth Fund (closed-end funds) |
Patrick J. Simpson
c/o Columbia Management
Investment Advisers, LLC
225 Franklin Street
Mail Drop BX32 05228
Boston, MA 02110
1944 | Trustee
2000 | Of Counsel, Perkins Coie LLP (law firm) since 2015; Partner, Perkins Coie LLP from 1988 to 2014 | 66 | None |
Anne-Lee Verville
c/o Columbia Management
Investment Advisers, LLC
225 Franklin Street
Mail Drop BX32 05228
Boston, MA 02110
1945 | Trustee
1998 | Retired. General Manager, Global Education Industry from 1994 to 1997, President – Application Systems Division from 1991 to 1994, Chief Financial Officer – US Marketing & Services from 1988 to 1991, and Chief Information Officer from 1987 to 1988, IBM Corporation (computer and technology) | 66 | Enesco Group, Inc. (producer of giftware and home and garden decor products) from 2001 to 2006 |
| 46 | Columbia AMT-Free Intermediate Muni Bond Fund | Annual Report 2017 |
TRUSTEES AND OFFICERS (continued)
Consultants to the Independent Trustees*
| Name, address, year of birth | Position held with the Trust and length of service | Principal occupation(s) during the past five years and other relevant professional experience | Number of Funds in the Columbia Funds complex overseen | Other directorships held by Trustee during the past five years |
J. Kevin Connaughton
c/o Columbia
Management Investment
Advisers, LLC,
225 Franklin Street
Mail Drop BX32 05228,
Boston, MA 02110
1964 | Independent Trustee Consultant
2016 | Independent Trustee Consultant, Columbia Funds since March 2016; Managing Director and General Manager of Mutual Fund Products, Columbia Management Investment Advisers, LLC from May 2010 to February 2015; President, Columbia Funds from 2009 to 2015; and senior officer of Columbia Funds and affiliated funds from 2003 to 2015 | 66 | Board of Governors, Gateway Healthcare since January 2016; Trustee, New Century Portfolios since March 2015; and Director, The Autism Project since March 2015 |
Natalie A. Trunow
c/o Columbia
Management Investment
Advisers, LLC,
225 Franklin Street
Mail Drop BX32 05228,
Boston, MA 02110
1967 | Independent Trustee Consultant
2016 | Independent Trustee Consultant, Columbia Funds since September 2016; Chief Executive Officer, Millennial Partners (investment consulting services to institutions) since January 2016; Director of Investments, Casey Family Programs from April 2016 to September 2016; Senior Vice President and Chief Investment Officer, Calvert Investments from August 2008 to January 2016; Section Head and Portfolio Manager, General Motors Asset Management from June 1997 to August 2008 | 66 | Healthcare Services for Children with Special Needs |
| * | J. Kevin Connaughton was appointed consultant to the Independent Trustees effective March 1, 2016. Natalie A. Trunow was appointed consultant to the Independent Trustees effective September 1, 2016. Shareholders of the Funds are expected to be asked to elect each of Mr. Connaughton and Ms. Trunow as a Trustee at a future shareholder meeting. |
Interested trustee affiliated with Investment Manager*
| Name, address, year of birth | Position held with the Trust and length of service | Principal occupation(s) during the past five years and other relevant professional experience | Number of Funds in the Columbia Funds Complex overseen | Other directorships held by Trustee during the past five years |
William F. Truscott
c/o Columbia Management
Investment Advisers, LLC
225 Franklin Street
Boston, MA 02110
1960 | Trustee
2012 | Chairman of the Board and President, Columbia Management Investment Advisers, LLC since May 2010 and February 2012, respectively; Chief Executive Officer, Global Asset Management, Ameriprise Financial, Inc. since September 2012 (previously Chief Executive Officer, U.S. Asset Management & President, Annuities, May 2010-September 2012); Director and Chief Executive Officer, Columbia Management Investment Distributors, Inc. since May 2010 and February 2012, respectively; Chairman of the Board and Chief Executive Officer, RiverSource Distributors, Inc. since 2006; Director, Threadneedle Asset Management Holdings, SARL since 2014; President and Chief Executive Officer, Ameriprise Certificate Company, 2006-August 2012 | 189 | Chairman of the Board, Columbia Management Investment Advisers, LLC since May 2010; Director, Columbia Management Investment Distributors, Inc. since May 2010; former Director, Ameriprise Certificate Company, 2006 - January 2013 |
| * | Interested person (as defined under the 1940 Act) by reason of being an officer, director, security holder and/or employee of the Investment Manager or Ameriprise Financial. |
The Statement of Additional Information has additional information about the Fund’s Board members and is available,
without charge, upon request by calling 800.345.6611, contacting your financial intermediary or visiting
investor.columbiathreadneedleus.com.
Columbia AMT-Free Intermediate Muni Bond Fund | Annual Report 2017
| 47 |
TRUSTEES AND OFFICERS (continued)
The Board has appointed officers who are responsible for day-to-day business decisions based on policies it has established. The officers serve at the pleasure of the Board. The following table provides basic information about the Officers of the Fund, including principal occupations during the past five years, although their specific titles may have varied over the period. In addition to Mr. Truscott, who is Senior Vice President, the Fund’s other officers are:
Fund officers
Name,
address and
year of birth | Position and year
first appointed to
position for any Fund
in the Columbia
Funds complex or a
predecessor thereof | Principal occupation(s) during past five years |
Christopher O. Petersen
5228 Ameriprise
Financial Center
Minneapolis, MN 55474
Born 1970 | President and Principal Executive Officer (2015) | Vice President and Lead Chief Counsel, Ameriprise Financial, Inc. since January 2015 (previously, Vice President and Chief Counsel, January 2010 - December 2014; officer of Columbia Funds and affiliated funds since 2007. |
Michael G. Clarke
225 Franklin Street
Boston, MA 02110
Born 1969 | Treasurer (2011), Chief Financial Officer (2009) and Chief Accounting Officer (2015) | Vice President — Mutual Fund Administration, Columbia Management Investment Advisers, LLC, since May 2010; senior officer of Columbia Funds and affiliated funds since 2002. |
Paul B. Goucher
100 Park Avenue
New York, NY 10017
Born 1968 | Senior Vice President (2011) and Assistant Secretary (2008) | Senior Vice President and Assistant General Counsel, Ameriprise Financial, Inc. since January 2017 (previously Vice President and Lead Chief Counsel, November 2008 - January 2017 and January 2013 - January 2017, respectively; and Chief Counsel, January 2010 - January 2013); Vice President, Chief Legal Officer and Assistant Secretary, Columbia Management Investment Advisers, LLC since May 2010. |
Thomas P. McGuire
225 Franklin Street
Boston, MA 02110
Born 1972 | Senior Vice President and Chief Compliance Officer (2012) | Vice President — Asset Management Compliance, Ameriprise Financial, Inc., since May 2010; Chief Compliance Officer, Ameriprise Certificate Company since September 2010. |
Colin Moore
225 Franklin Street
Boston, MA 02110
Born 1958 | Senior Vice President (2010) | Executive Vice President and Global Chief Investment Officer, Ameriprise Financial, Inc., since July 2013; Executive Vice President and Global Chief Investment Officer, Columbia Management Investment Advisers, LLC since July 2013 (previously Director and Global Chief Investment Officer, 2010 - 2013). |
Ryan C. Larrenaga
225 Franklin Street
Boston, MA 02110
Born 1970 | Senior Vice President (2017), Chief Legal Officer (2017) and Secretary (2015) | Vice President and Group Counsel, Ameriprise Financial, Inc. since August 2011; officer of Columbia Funds and affiliated funds since 2005. |
Michael E. DeFao
225 Franklin Street
Boston, MA 02110
Born 1968 | Vice President (2011) and Assistant Secretary (2010) | Vice President and Chief Counsel, Ameriprise Financial, Inc. since May 2010. |
Amy Johnson
5228 Ameriprise
Financial Center
Minneapolis, MN 55474
Born 1965 | Vice President (2006) | Managing Director and Global Head of Operations, Columbia Management Investment Advisers, LLC since April 2016 (previously Managing Director and Chief Operating Officer, 2010 - 2016). |
Lyn Kephart-Strong
5228 Ameriprise
Financial Center
Minneapolis, MN 55474
Born 1960 | Vice President (2015) | President, Columbia Management Investment Services Corp. since October 2014; Vice President & Resolution Officer, Ameriprise Trust Company since August 2009. |
| 48 | Columbia AMT-Free Intermediate Muni Bond Fund | Annual Report 2017 |
Board Consideration and Approval of Management
Agreement
On June 14, 2017, the Board of Trustees (the Board) and the Trustees who are not interested persons (as defined in the Investment Company Act of 1940) (the Independent Trustees) of Columbia Funds Series Trust I (the Trust) unanimously approved the continuation of the Management Agreement (the Management Agreement) with Columbia Management Investment Advisers, LLC (the Investment Manager) with respect to Columbia AMT-Free Intermediate Muni Bond Fund (the Fund), a series of the Trust. As detailed below, the Board’s Advisory Fees and Expenses Committee (the Committee) and the Board met on multiple occasions to review and discuss, both among themselves and with the management team of the Investment Manager, materials provided by the Investment Manager and others before determining to approve the continuation of the Management Agreement.
In connection with their deliberations regarding the continuation of the Management Agreement, the Committee and the Board evaluated materials requested from the Investment Manager regarding the Fund and the Management Agreement, and discussed these materials with representatives of the Investment Manager at Committee meetings held on March 27, 2017, April 26, 2017 and June 13, 2017 and at Board meetings held on March 28, 2017 and June 14, 2017. In addition, the Board considers matters bearing on the Management Agreement at most of its other meetings throughout the year and meets regularly with senior management of the Trust and the Investment Manager. Through the Board’s Investment Oversight Committees, Trustees also meet with selected portfolio managers of the funds the Trustees oversee and other investment personnel at various times throughout the year. The Committee and the Board also consulted with its independent fee consultant, Fund counsel and the Independent Trustees’ independent legal counsel, who advised on various matters with respect to the Committee’s and the Board’s considerations and otherwise assisted the Committee and the Board in their deliberations. On June 13, 2017, the Committee recommended that the Board approve the continuation of the Management Agreement. On June 14, 2017, the Board, including the Independent Trustees, voting separately, unanimously approved the continuation of the Management Agreement for the Fund.
The Committee and the Board considered all information that they, their legal counsel or the Investment Manager believed reasonably necessary to evaluate and to determine whether to recommend for approval or approve the continuation of the Management Agreement. The information and factors considered by the Committee and the Board in recommending for approval or approving the continuation of the Management Agreement for the Fund included the following:
| • | Information on the investment performance of the Fund relative to the performance of a group of mutual funds determined to be comparable to the Fund by an independent third-party data provider, as well as performance relative to benchmarks; |
| • | Information on the Fund’s management fees and total expenses, including information comparing the Fund’s expenses to those of a group of comparable mutual funds, as determined by the independent third-party data provider; |
| • | The Investment Manager’s agreement to contractually limit or cap total operating expenses for the Fund through February 28, 2018 so that total operating expenses (excluding certain fees and expenses, such as transaction costs and certain other investment related expenses, interest, taxes, acquired fund fees and expenses, and infrequent and/or unusual expenses) would not exceed a specified annual rate, as a percentage of the Fund’s net assets; |
| • | The terms and conditions of the Management Agreement; |
| • | The current and proposed terms and conditions of other agreements and arrangements with affiliates of the Investment Manager relating to the operations of the Fund, including agreements with respect to the provision of distribution, transfer agency and shareholder services to the Fund; |
| • | Descriptions of various functions performed by the Investment Manager under the Management Agreement, including portfolio management and portfolio trading practices; |
| • | Information regarding the management fees of similarly-managed portfolios of other clients of the Investment Manager, including institutional separate accounts; |
| • | Information regarding the reputation, regulatory history and resources of the Investment Manager, including information regarding senior management, portfolio managers and other personnel; |
Columbia AMT-Free Intermediate Muni Bond Fund | Annual Report 2017
| 49 |
Board Consideration and Approval of Management
Agreement (continued)
| • | Information regarding the capabilities of the Investment Manager with respect to compliance monitoring services, including an assessment of the Investment Manager’s compliance system by the Fund’s Chief Compliance Officer; and |
| • | The profitability to the Investment Manager and its affiliates from their relationships with the Fund. |
Nature, extent and quality of services provided under the Management Agreement
The Committee and the Board considered the nature, extent and quality of services provided to the Fund by the Investment Manager and its affiliates under the Management Agreement and under separate agreements for the provision of transfer agency and shareholder services, and the resources dedicated to the Fund and the other Columbia Funds by the Investment Manager and its affiliates. The Committee and the Board considered, among other things, the Investment Manager’s ability to attract, motivate and retain highly qualified research, advisory and supervisory investment professionals (including compensation programs for personnel involved in fund management, reputation and other attributes), the portfolio management services provided by those investment professionals, and the quality of the Investment Manager’s investment research capabilities and trade execution services. The Committee and the Board also considered the potential benefits to shareholders of investing in a mutual fund that is part of a fund complex offering exposure to a variety of asset classes and investment disciplines and providing a variety of fund and shareholder services.
The Committee and the Board also considered the professional experience and qualifications of the senior personnel of the Investment Manager, which included consideration of the Investment Manager’s experience with similarly-structured funds. The Committee and the Board noted the compliance programs of and the compliance-related resources provided to the Fund by the Investment Manager and its affiliates, and considered the Investment Manager’s ability to provide administrative services to the Fund and coordinate the activities of the Fund’s other service providers. After reviewing these and related factors, the Committee and the Board concluded, within the context of their overall conclusions, that the nature, extent and quality of the services provided to the Fund under the Management Agreement supported the continuation of the Management Agreement.
Investment performance
The Committee and the Board reviewed information about the performance of the Fund over various time periods, including performance information relative to benchmarks and information that compared the performance of the Fund to the performance of a group of comparable mutual funds as determined by the independent third-party data provider, and data provided by the independent fee consultant. The Committee and the Board also reviewed a description of the third party’s methodology for identifying the Fund’s peer groups for purposes of performance and expense comparisons.
The Committee and the Board noted that, through December 31, 2016, the Fund’s performance was in the forty-eighth, thirty-fifth and forty-first percentile (where the best performance would be in the first percentile) of its category selected by the independent third-party data provider for the purposes of performance comparisons for the one-, three- and five-year periods, respectively.
The Committee and the Board also considered the Investment Manager’s performance and reputation generally, the Investment Manager’s historical responsiveness to Board concerns about performance, and the Investment Manager’s willingness to take steps intended to improve performance. After reviewing these and related factors, the Committee and the Board concluded, within the context of their overall conclusions, that the performance of the Fund and the Investment Manager was sufficient, in light of other considerations, to warrant the continuation of the Management Agreement.
Investment management fee rates and other expenses
The Committee and the Board considered the management fees charged to the Fund under the Management Agreement as well as the total expenses incurred by the Fund. In assessing the reasonableness of the fees under the Management Agreement, the Committee and the Board considered, among other information, the Fund’s total expense ratio as a percentage of average daily net assets. The Committee and the Board considered data provided by the independent third-party data provider and the independent fee consultant. The Committee and the Board noted that, as of December 31, 2016, the Fund’s actual management fee and net total expense ratio are ranked in the third and fourth quintiles, respectively,
| 50 | Columbia AMT-Free Intermediate Muni Bond Fund | Annual Report 2017 |
Board Consideration and Approval of Management
Agreement (continued)
(where the lowest fees and expenses would be in the first quintile) against the Fund’s expense universe as determined by the independent third-party data provider for purposes of expense comparison. The Committee and the Board also took into account the fee waiver and expense limitation arrangements agreed to by the Investment Manager, as noted above.
The Committee and the Board also received and considered information about the management fees charged by the Investment Manager to institutional separate accounts. In considering the fees charged to those accounts, the Committee and the Board took into account, among other things, the Investment Manager’s representations about the differences between managing mutual funds as compared to other types of accounts, including differences in the services provided, differences in the risk profile of such business for the Investment Manager and the additional resources required to manage mutual funds effectively. The Committee and the Board also received and considered information about the fees charged by the Investment Manager for sub-advisory services it provides to comparable unaffiliated funds. In evaluating the Fund’s management fees, the Committee and the Board also took into account the demands, complexity and quality of the investment management of the Fund.
After reviewing these and related factors, the Committee and the Board concluded, within the context of their overall conclusions, that the management fee rates and expenses of the Fund, in light of other considerations, warranted the continuation of the Management Agreement.
Costs of services provided and profitability
The Committee and the Board also took note of the costs the Investment Manager and its affiliates incur in connection with the services provided and the profitability to the Investment Manager and its affiliates from their relationships with the Fund.
The Committee and the Board also considered the compensation directly or indirectly received by the Investment Manager’s affiliates in connection with their relationships with the Fund. The Committee and the Board reviewed information provided by management as to the profitability to the Investment Manager and its affiliates of their relationships with the Fund, information about the allocation of expenses used to calculate profitability, and comparisons of profitability levels realized in 2016 to profitability levels realized in 2015. When reviewing profitability, the Committee and the Board also considered court cases in which adviser profitability was an issue in whole or in part, the performance of similarly managed funds, the performance of the Fund, and the expense ratio of the Fund. In addition, the Committee and the Board considered information provided by the Investment Manager regarding the Investment Manager’s financial condition and comparing its profitability to that of other asset management firms that are, or are subsidiaries of, publicly traded companies. In this regard, the Committee and the Board also considered data provided by the independent fee consultant.
After reviewing these and related factors, the Committee and the Board concluded, within the context of their overall conclusions, that the costs of services provided and the profitability to the Investment Manager and its affiliates from their relationships with the Fund supported the continuation of the Management Agreement.
Economies of scale
The Committee and the Board considered the potential existence of economies of scale in the provision by the Investment Manager of services to the Fund, to groups of related funds, and to the Investment Manager’s investment advisory clients as a whole, and whether those economies of scale were shared with the Fund through breakpoints in investment management fees or other means, such as expense limitation arrangements and additional investments by the Investment Manager in investment, trading, compliance and other resources. The Committee and the Board noted that the management fee schedules for the Fund contained breakpoints that would reduce the fee rate on assets above specified threshold levels.
In considering these matters, the Committee and the Board also considered the costs of the services provided and the profitability to the Investment Manager and its affiliates from their relationships with the Fund, as discussed above. After reviewing these and related factors, the Committee and the Board concluded, within the context of their overall conclusions, that the extent to which any economies of scale were expected to be shared with the Fund supported the continuation of the Management Agreement.
Columbia AMT-Free Intermediate Muni Bond Fund | Annual Report 2017
| 51 |
Board Consideration and Approval of Management
Agreement (continued)
Other benefits to the Investment Manager
The Committee and the Board received and considered information regarding “fall-out” or ancillary benefits received by the Investment Manager and its affiliates as a result of their relationships with the Fund, such as the engagement of the Investment Manager’s affiliates to provide distribution, transfer agency and shareholder services to the Fund. In this regard, among other matters, the Committee and the Board considered that the Fund’s distributor retains a portion of the distribution fees from the Fund and receives a portion of the sales charges on sales or redemptions of certain classes of shares of the Fund. The Committee and the Board also considered the benefits of research made available to the Investment Manager by reason of brokerage commissions generated by the Fund’s securities transactions, and reviewed information about the Investment Manager’s practices with respect to allocating portfolio transactions for brokerage and research services. The Committee and the Board recognized that the Investment Manager’s profitability would be somewhat lower without these benefits.
Conclusion
The Committee and the Board reviewed all of the above considerations in reaching their decisions to recommend or approve the continuation of the Management Agreement. In their deliberations, the Trustees did not identify any particular information that was all-important or controlling, and individual Trustees may have attributed different weights to the various factors. Based on their evaluation of all factors that they deemed to be material, including those factors described above, and assisted by the advice of independent legal counsel, the Board, including the Independent Trustees, voting separately, unanimously approved the continuation of the Management Agreement.
| 52 | Columbia AMT-Free Intermediate Muni Bond Fund | Annual Report 2017 |
The Fund mails one shareholder report to each shareholder address. If you would like more than one report, please call shareholder services at 800.345.6611 and additional reports will be sent to you.
Proxy voting policies and procedures
The policy of the Board of Trustees is to vote the proxies of the companies in which the Fund holds investments consistent with the procedures as stated in the Statement of Additional Information (SAI). You may obtain a copy of the SAI without charge by calling 800.345.6611; contacting your financial intermediary; visiting investor.columbiathreadneedleus.com; or searching the website of the Securities and Exchange Commission (SEC) at sec.gov. Information regarding how the Fund voted proxies relating to portfolio securities is filed with the SEC by August 31st for the most recent 12-month period ending June 30th of that year, and is available without charge by visiting investor.columbiathreadneedleus.com, or searching the website of the SEC at sec.gov.
Quarterly schedule of investments
The Fund files a complete schedule of portfolio holdings with the SEC for the first and third quarters of each fiscal year on Form N-Q. The Fund’s Form N-Q is available on the SEC’s website at sec.gov and may be reviewed and copied at the SEC’s Public Reference Room in Washington, D.C. Information on the operation of the Public Reference Room may be obtained by calling 800.SEC.0330. The Fund’s complete schedule of portfolio holdings, as filed on Form N-Q, can also be obtained without charge, upon request, by calling 800.345.6611.
Additional Fund information
For more information about the Fund, please visit investor.columbiathreadneedleus.com or call 800.345.6611. Customer Service Representatives are available to answer your questions Monday through Friday from 8 a.m. to 7 p.m. Eastern time.
Fund investment manager
Columbia Management Investment Advisers, LLC
225 Franklin Street
Boston, MA 02110
Fund distributor
Columbia Management Investment Distributors, Inc.
225 Franklin Street
Boston, MA 02110
Fund transfer agent
Columbia Management Investment Services Corp.
P.O. Box 8081
Boston, MA 02266-8081
Columbia AMT-Free Intermediate Muni Bond Fund | Annual Report 2017
| 53 |
Columbia AMT-Free Intermediate Muni Bond Fund
P.O. Box 8081
Boston, MA 02266-8081
Please read and consider the investment objectives, risks, charges and expenses for any fund carefully before investing. For a prospectus and summary prospectus, which contains this and other important information about the Fund, go to
investor.columbiathreadneedleus.com. The Fund is distributed by Columbia Management Investment Distributors, Inc., member FINRA, and managed by Columbia Management Investment Advisers, LLC.
Columbia Threadneedle Investments (Columbia Threadneedle) is the global brand name of the Columbia and Threadneedle group of companies. All rights reserved. Columbia Management Investment Distributors, Inc., 225 Franklin Street, Boston, MA 02110-2804
© 2017 Columbia Management Investment Advisers, LLC.
investor.columbiathreadneedleus.com

Annual Report
October 31, 2017
Columbia AMT-Free Massachusetts Intermediate Muni Bond Fund
Not FDIC Insured • No bank guarantee • May lose value
Dear Shareholders,
The current outlook for financial markets is clouded by two primary concerns: the high valuation of equities and the direction of interest rates. Following the U.S. presidential election, U.S. equities rallied based on the assumption that the new administration’s policies would stimulate growth quickly. Unfortunately it’s unclear whether those measures will get passed, much less passed quickly. In fixed income, uncertainty stems from the possibility that interest rates won’t rise as rapidly as expected if the administration’s proposed growth policies are not implemented.
Given this uncertainty, investors value a consistent approach more than ever. Investors want strong, repeatable risk-adjusted returns. Consistency — not surprises. As a leading global asset manager, we believe our consistent, collaborative investment approach enables us to deliver the dependable experience your portfolio demands. So, how do we strive to deliver a consistent investment experience?
Better insights
Your portfolio benefits from the investment insights uncovered by our talented investment teams around the world.
Better decisions
Our collaborative, interactive environment enables our investment teams to construct portfolios that take advantage of the best investment ideas.
Better outcomes
We aim to deliver a consistent experience, which means fewer surprises, dependable insights, and products designed to do the thing you want.
Whether you’re trying to save money to help your children go to college or for your own retirement, it’s the consistency of the return that is most essential. People who chase higher returns are usually also the first to sell when that investment goes through a bad patch. We try to combat this behavioral tendency by offering strategies that aim for a more consistent return. Our goal is for investors to panic less during periods of volatility, which can have a significant effect on their long-term results.
Nothing is more important to us than making sure those who have entrusted us to protect and grow their assets can do what matters most to them: build a nest egg, leave a legacy, and live confidently — now and throughout retirement. It’s why our talented professionals around the world work together to uncover uncommon opportunities and why our process encourages challenge and debate around our most compelling ideas to ensure better informed investment decisions, which hopefully lead to better outcomes for you.
Your success is our priority. Talk to your financial advisor about how working with Columbia Threadneedle Investments may help you position your portfolio for consistent, sustainable outcomes, no matter the market conditions.
Sincerely,
Christopher O. Petersen
President, Columbia Funds
Investors should consider the investment objectives, risks, charges and expenses of a mutual fund carefully before investing. For a free prospectus and summary prospectus, which contains this and other important information about a fund, visit investor.columbiathreadneedleus.com. The prospectus should be read carefully before investing.
Columbia Funds are distributed by Columbia Management Investment Distributors, Inc., member FINRA, and managed by Columbia Management Investment Advisers, LLC.
© 2017 Columbia Management Investment Advisers, LLC. All rights reserved.
Columbia AMT-Free Massachusetts Intermediate Muni Bond Fund | Annual Report 2017
Columbia AMT-Free Massachusetts Intermediate Muni Bond Fund | Annual Report 2017
Investment objective
Columbia AMT-Free Massachusetts Intermediate Muni Bond Fund (the Fund) seeks as high a level of current interest income exempt from federal income tax and, to the extent possible, from Massachusetts individual income tax, as is consistent with relative stability of principal.
Portfolio management
Brian McGreevy
Co-portfolio manager
Managed Fund since 2009
Paul Fuchs, CFA
Co-portfolio manager
Managed Fund since 2012
Effective December 29, 2017, Mr. McGreevy will no longer manage the Fund. Paul Fuchs will continue as co-portfolio manager of the Fund and on December 29, 2017, Deborah Vargo will be added as a co-portfolio manager of the Fund.
| Average annual total returns (%) (for the period ended October 31, 2017) |
| | | Inception | 1 Year | 5 Years | 10 Years |
| Class A | Excluding sales charges | 12/09/02 | 0.95 | 1.70 | 3.43 |
| | Including sales charges | | -2.11 | 1.08 | 3.12 |
| Class C | Excluding sales charges | 12/09/02 | 0.50 | 1.25 | 3.00 |
| | Including sales charges | | -0.48 | 1.25 | 3.00 |
| Class R4* | 03/19/13 | 1.20 | 1.95 | 3.69 |
| Class R5* | 03/01/16 | 1.28 | 1.98 | 3.70 |
| Class V | Excluding sales charges | 06/26/00 | 1.05 | 1.80 | 3.53 |
| | Including sales charges | | -3.73 | 0.80 | 3.03 |
| Class Y* | 03/01/17 | 1.26 | 1.96 | 3.70 |
| Class Z | 06/14/93 | 1.20 | 1.95 | 3.69 |
| Bloomberg Barclays 3-15 Year Blend Municipal Bond Index | | 2.05 | 2.70 | 4.39 |
Returns for Class A are shown with and without the maximum initial sales charge of 3.00%. Returns for Class C are shown with and without the 1.00% contingent deferred sales charge (CDSC) for the first year only. Returns for Class V are shown with and without the maximum initial sales charge of 4.75%. The Fund’s other classes are not subject to sales charges and have limited eligibility. Effective November 1, 2017, Class R4, Class R5, Class Y and Class Z shares were renamed Advisor Class, Institutional 2 Class, Institutional 3 Class and Institutional Class shares, respectively. Please see the Fund’s prospectus for details. Performance for different share classes will vary based on differences in sales charges and fees associated with each class. All results shown assume reinvestment of distributions during the period. Returns do not reflect the deduction of taxes that a shareholder may pay on Fund distributions or on the redemption of Fund shares. Performance results reflect the effect of any fee waivers or reimbursements of Fund expenses by Columbia Management Investment Advisers, LLC and/or any of its affiliates. Absent these fee waivers or expense reimbursement arrangements, performance results would have been lower.
The performance information shown represents past performance and is not a guarantee of future results. The investment return and principal value of your investment will fluctuate so that your shares, when redeemed, may be worth more or less than their original cost. Current performance may be lower or higher than the performance information shown. You may obtain performance information current to the most recent month-end by contacting your financial intermediary, visiting investor.columbiathreadneedleus.com or calling 800.345.6611.
| * | The returns shown for periods prior to the share class inception date (including returns for the Life of the Fund, if shown, which are since Fund inception) include the returns of the Fund’s oldest share class. These returns are adjusted to reflect any higher class-related operating expenses of the newer share classes, as applicable. Please visit investor.columbiathreadneedleus.com/investment-products/mutual-funds/appended-performance for more information. |
The Bloomberg Barclays 3–15 Year Blend Municipal Bond Index is an unmanaged index that tracks the performance of municipal bonds issued after December 31, 1990, with remaining maturities between 2 and 17 years and at least $7 million in principal amount outstanding.
Indices are not available for investment, are not professionally managed and do not reflect sales charges, fees, brokerage commissions, taxes or other expenses of investing. Securities in the Fund may not match those in an index.
| 2 | Columbia AMT-Free Massachusetts Intermediate Muni Bond Fund | Annual Report 2017 |
Fund at a Glance (continued)
Performance of a hypothetical $10,000 investment (October 31, 2007 — October 31, 2017)
The chart above shows the change in value of a hypothetical $10,000 investment in Class A shares of Columbia AMT-Free Massachusetts Intermediate Muni Bond Fund during the stated time period, and does not reflect the deduction of taxes that a shareholder may pay on Fund distributions or on the redemption of Fund shares.
| Quality breakdown (%) (at October 31, 2017) |
| AAA rating | 5.2 |
| AA rating | 44.1 |
| A rating | 28.7 |
| BBB rating | 18.4 |
| Not rated | 3.6 |
| Total | 100.0 |
Percentages indicated are based upon total fixed income investments (excluding Money Market Funds).
Bond ratings apply to the underlying holdings of the Fund and not the Fund itself and are divided into categories ranging from highest to lowest credit quality, determined by using the middle rating of Moody’s, S&P and Fitch, after dropping the highest and lowest available ratings. When ratings are available from only two rating agencies, the lower rating is used. When a rating is available from only one rating agency, that rating is used. When a bond is not rated by any rating agency, it is designated as “Not rated.” Credit quality ratings assigned by a rating agency are subjective opinions, not statements of fact, and are subject to change, including daily. The ratings assigned by credit rating agencies are but one of the considerations that the Investment Manager and/or Fund’s subadviser incorporates into its credit analysis process, along with such other issuer-specific factors as cash flows, capital structure and leverage ratios, ability to de-leverage (repay) through free cash flow, quality of management, market positioning and access to capital, as well as such security-specific factors as the terms of the security (e.g., interest rate and time to maturity) and the amount and type of any collateral.
Columbia AMT-Free Massachusetts Intermediate Muni Bond Fund | Annual Report 2017
| 3 |
Manager Discussion of Fund Performance
The Fund’s Class A shares returned 0.95% excluding sales charges during the 12-month period ended October 31, 2017. The Class Z shares of the Fund returned 1.20% for the same time period. By comparison, the Fund’s benchmark, the Bloomberg Barclays 3-15 Year Blend Municipal Bond Index, which is national in scope, returned 2.05% during the 12-month period. Massachusetts’ bond market lagged the United States as a whole, contributing to the Fund’s underperformance relative to the national benchmark.
Market overview
Despite a rocky start, municipal bonds posted positive returns in the past 12 months. The market initially sold off in the early weeks of the period after the surprising results of the U.S. presidential election raised the prospects of higher growth, tax reform and reduced regulation under a new administration. In the U.S. Treasury market, the yield on the 10-year note rose from 1.79% on the Friday before the election to 2.60% by mid-December. (Prices and yields move in opposite directions). Municipal bond yields followed Treasuries higher in that interval, with yields on AAA-rated, 10-year issues rising by 0.75 percentage points. The sharp sell-off fueled redemptions from municipal bond funds, exacerbating the downturn.
As 2017 progressed, the fear of higher rates began to abate once it became apparent that Congress and the Trump administration would be unable to enact their policy proposals as quickly as originally expected. Investors initially anticipated action on health care and tax reform early in the presidential term, which increased expectations for stronger growth and raised the possibility of higher interest rates. Yields started falling modestly in March 2017 when these developments failed to come to fruition, and the combination of a lower new issue supply and renewed inflows into mutual funds augmented the positive tone in the market. As of October 31, 2017, the year-to-date new-issue supply stood 15-20% below the level reached in the first ten months of 2016. At the same time, demand remained strong as older bonds matured or were called away and investors redeployed the cash back into the tax-exempt area. The ensuing recovery in municipal bonds enabled the asset class to finish in positive territory for the full year
Pension issues continued to dominate the headlines, with Illinois and Chicago struggling to adopt budgets and several other states, including New Jersey, Connecticut, Pennsylvania and Kentucky, experiencing wider credit spreads as fears of credit-rating downgrades began to emerge. After a drawn-out budget negotiation in Illinois, the state government approved budget and revenue packages in late July. While this favorable development provided some comfort to the market, the State of Connecticut continued to struggle with budget issues before eventually passing its budget four months late. Additionally, the City of Hartford explored the possibility of bankruptcy after its debt was downgraded below investment grade by the rating agencies. At the sector level, hospital bonds produced returns slightly better than the index, albeit with greater volatility than in past years due to the potential changes to the Affordable Care Act (ACA).
Massachusetts underperformed the national benchmark
The Massachusetts economy continued to perform well, with strong job creation and a robust housing market. The large presence of technology and health care companies provided exposure to two of the nation’s fastest-growing sectors, creating a positive underpinning for the employment market. The financial industry also made a large contribution to the expansion, with the strong performance of the U.S. equity market boosting revenues for banks and investment management firms.
Despite this favorable backdrop, the Commonwealth’s municipal bonds lagged the broader national benchmark. The market is heavily comprised of state general obligation (GO) debt that is highly rated by all three of the major rating agencies. These bonds produced returns much lower than both national GO debt and the U.S. market as a whole. At a time in which yield spreads on lower rated bonds compressed (indicating outperformance), Massachusetts GOs had little to no room to contract given that they were already trading at levels commensurate with their high quality.
Contributors and detractors
The Fund underperformed during the period, as it was unable keep pace with the national benchmark given the weak relative performance for Massachusetts. The Fund’s duration was slightly shorter than the benchmark, which also was a headwind in a rising market. (Duration is a measure of interest-rate sensitivity.) Positions in bonds with maturities of two years and below generally detracted from performance due in part to the minimal contribution from yield. Accordingly, we took advantage of any pick-up in issuance to reinvest the portfolio’s shorter term holdings into higher yielding market segments.
| 4 | Columbia AMT-Free Massachusetts Intermediate Muni Bond Fund | Annual Report 2017 |
Manager Discussion of Fund Performance (continued)
The Fund’s allocations to hospital- and education-related issues provided exposure to two of the better performing sectors during the period. Both areas made meaningful contributions, as they are the Fund’s two largest sector weights due to the high representation of these issuers in Massachusetts. In addition, our positions in these sectors benefitted from having a longer maturity profile than their benchmark counterparts at a time in which longer term bonds outperformed.
Fund positioning
Our strategy remained consistent during the period, with a close to neutral duration and an emphasis on the lower quality tiers of the investment grade market. We invested in various issues in the education, land bank and retirement community sectors, and we reduced the Fund’s weighting in shorter maturity, lower yielding issues and state GO bonds. In addition, we eliminated all exposure to the Virgin Islands.
Massachusetts’ municipal market remains vibrant, with good credit fundamentals and strong demand from tax-sensitive investors. We have slight concerns about the current funding status of Massachusetts’ public employee pension system, but we believe that the strength of the Massachusetts economy more than offsets the slightly below-average funding status. However, we are carefully following the Trump Administration’s efforts to pass tax reform due to the possible implications for health care and education issuers.
Fixed-income securities present issuer default risk. The Fund invests substantially in municipal securities and will be affected by tax, legislative, regulatory, demographic or political changes, as well as changes impacting a state’s financial, economic or other conditions. A relatively small number of tax-exempt issuers may necessitate the Fund investing more heavily in a single issuer and, therefore, be more exposed to the risk of loss than a fund that invests more broadly. The value of the Fund’s portfolio may be more volatile than a more geographically diversified fund. Prepayment and extension risk exists because the timing of payments on a loan, bond or other investment may accelerate when interest rates fall or decelerate when interest rates rise which may reduce investment opportunities and potential returns. A rise in interest rates may result in a price decline of fixed-income instruments held by the Fund, negatively impacting its performance and NAV. Falling rates may result in the Fund investing in lower yielding debt instruments, lowering the Fund’s income and yield. These risks may be heightened for longer maturity and duration securities. Non-investment-grade (high-yield or junk) securities present greater price volatility and more risk to principal and income than higher rated securities. Market risk may affect a single issuer, sector of the economy, industry or the market as a whole. Federal and state tax rules apply to capital gain distributions and any gains or losses on sales. Income may be subject to state or local taxes. Liquidity risk is associated with the difficulty of selling underlying investments at a desirable time or price. See the Fund’s prospectus for more information on these and other risks.
The views expressed in this report reflect the current views of the respective parties. These views are not guarantees of future performance and involve certain risks, uncertainties and assumptions that are difficult to predict, so actual outcomes and results may differ significantly from the views expressed. These views are subject to change at any time based upon economic, market or other conditions and the respective parties disclaim any responsibility to update such views. These views may not be relied on as investment advice and, because investment decisions for a Columbia fund are based on numerous factors, may not be relied on as an indication of trading intent on behalf of any particular Columbia fund. References to specific securities should not be construed as a recommendation or investment advice.
Columbia AMT-Free Massachusetts Intermediate Muni Bond Fund | Annual Report 2017
| 5 |
Understanding Your Fund’s Expenses
(Unaudited)
As an investor, you incur two types of costs. There are transaction costs, which generally include sales charges on purchases and may include redemption fees. There are also ongoing costs, which generally include management fees, distribution and/or service fees, and other fund expenses. The following information is intended to help you understand your ongoing costs (in dollars) of investing in the Fund and to help you compare these costs with the ongoing costs of investing in other mutual funds.
Analyzing your Fund’s expenses
To illustrate these ongoing costs, we have provided examples and calculated the expenses paid by investors in each share class of the Fund during the period. The actual and hypothetical information in the table is based on an initial investment of $1,000 at the beginning of the period indicated and held for the entire period. Expense information is calculated two ways and each method provides you with different information. The amount listed in the “Actual” column is calculated using the Fund’s actual operating expenses and total return for the period. You may use the Actual information, together with the amount invested, to estimate the expenses that you paid over the period. Simply divide your account value by $1,000 (for example, an $8,600 account value divided by $1,000 = 8.6), then multiply the results by the expenses paid during the period under the “Actual” column. The amount listed in the “Hypothetical” column assumes a 5% annual rate of return before expenses (which is not the Fund’s actual return) and then applies the Fund’s actual expense ratio for the period to the hypothetical return. You should not use the hypothetical account values and expenses to estimate either your actual account balance at the end of the period or the expenses you paid during the period. See “Compare with other funds” below for details on how to use the hypothetical data.
Compare with other funds
Since all mutual funds are required to include the same hypothetical calculations about expenses in shareholder reports, you can use this information to compare the ongoing cost of investing in the Fund with other funds. To do so, compare the hypothetical example with the 5% hypothetical examples that appear in the shareholder reports of other funds. As you compare hypothetical examples of other funds, it is important to note that hypothetical examples are meant to highlight the ongoing costs of investing in a fund only and do not reflect any transaction costs, such as sales charges, or redemption or exchange fees. Therefore, the hypothetical calculations are useful in comparing ongoing costs only, and will not help you determine the relative total costs of owning different funds. If transaction costs were included in these calculations, your costs would be higher.
| May 1, 2017 — October 31, 2017 |
| | Account value at the
beginning of the
period ($) | Account value at the
end of the
period ($) | Expenses paid during
the period ($) | Fund’s annualized
expense ratio (%) |
| | Actual | Hypothetical | Actual | Hypothetical | Actual | Hypothetical | Actual |
| Class A | 1,000.00 | 1,000.00 | 1,017.30 | 1,021.35 | 4.16 | 4.17 | 0.81 |
| Class C | 1,000.00 | 1,000.00 | 1,015.00 | 1,019.06 | 6.47 | 6.48 | 1.26 |
| Class R4 | 1,000.00 | 1,000.00 | 1,018.60 | 1,022.63 | 2.88 | 2.89 | 0.56 |
| Class R5 | 1,000.00 | 1,000.00 | 1,018.80 | 1,022.93 | 2.57 | 2.58 | 0.50 |
| Class V (formerly Class T) | 1,000.00 | 1,000.00 | 1,017.80 | 1,021.86 | 3.65 | 3.66 | 0.71 |
| Class Y | 1,000.00 | 1,000.00 | 1,019.10 | 1,023.19 | 2.32 | 2.32 | 0.45 |
| Class Z | 1,000.00 | 1,000.00 | 1,018.60 | 1,022.63 | 2.88 | 2.89 | 0.56 |
Expenses paid during the period are equal to the annualized expense ratio for each class as indicated above, multiplied by the average account value over the period and then multiplied by the number of days in the Fund’s most recent fiscal half year and divided by 365.
Expenses do not include fees and expenses incurred indirectly by the Fund from its investment in underlying funds, including affiliated and non-affiliated pooled investment vehicles, such as mutual funds and exchange-traded funds.
Had Columbia Management Investment Advisers, LLC and/or certain of its affiliates not waived/reimbursed certain fees and expenses, account value at the end of the period would have been reduced.
| 6 | Columbia AMT-Free Massachusetts Intermediate Muni Bond Fund | Annual Report 2017 |
Portfolio of Investments
October 31, 2017
(Percentages represent value of investments compared to net assets)
| Floating Rate Notes 1.2% |
| Issue Description | Effective
Yield | | Principal
Amount ($) | Value ($) |
| Variable Rate Demand Notes 1.2% |
| Massachusetts Health & Educational Facilities Authority(a),(b) |
| Revenue Bonds |
| Partners Health |
| VRDN Series 2009P-2 (JPMorgan Chase Bank) |
| 07/01/2027 | 0.900% | | 3,000,000 | 3,000,000 |
Total Floating Rate Notes
(Cost $3,000,000) | 3,000,000 |
|
| Municipal Bonds 96.5% |
| Issue Description | Coupon
Rate | | Principal
Amount ($) | Value ($) |
| Airport 1.3% |
| Massachusetts Port Authority |
| Refunding Revenue Bonds |
| Series 2014C |
| 07/01/2031 | 5.000% | | 1,900,000 | 2,238,333 |
| Revenue Bonds |
| Series 2015A |
| 07/01/2026 | 5.000% | | 600,000 | 726,816 |
| 07/01/2027 | 5.000% | | 300,000 | 360,813 |
| Total | 3,325,962 |
| Assisted Living 0.6% |
| Massachusetts Development Finance Agency |
| Refunding Revenue Bonds |
| 1st Mortgage-VOA Concord |
| Series 2007 |
| 11/01/2017 | 5.000% | | 100,000 | 100,004 |
| 11/01/2027 | 5.125% | | 1,500,000 | 1,500,225 |
| Total | 1,600,229 |
| Charter Schools 2.0% |
| Massachusetts Development Finance Agency |
| Refunding Revenue Bonds |
| International Charter School |
| Series 2015 |
| 04/15/2025 | 5.000% | | 500,000 | 570,275 |
| 04/15/2033 | 5.000% | | 1,335,000 | 1,467,178 |
| Revenue Bonds |
| Foxborough Regional Charter School |
| Series 2010A |
| 07/01/2030 | 6.375% | | 2,600,000 | 2,793,258 |
| Total | 4,830,711 |
| Municipal Bonds (continued) |
| Issue Description | Coupon
Rate | | Principal
Amount ($) | Value ($) |
| Higher Education 19.2% |
| Massachusetts Development Finance Agency |
| Refunding Revenue Bonds |
| Babson College |
| Series 2015A |
| 10/01/2025 | 5.000% | | 600,000 | 719,952 |
| 10/01/2026 | 5.000% | | 200,000 | 240,306 |
| Berklee College of Music |
| Series 2016 |
| 10/01/2028 | 5.000% | | 325,000 | 392,152 |
| Boston University |
| Series 2006BB2 |
| 10/01/2037 | 4.000% | | 2,120,000 | 2,233,738 |
| College of the Holy Cross |
| Series 2016A |
| 09/01/2034 | 5.000% | | 500,000 | 593,255 |
| Emerson College |
| Series 2017A |
| 01/01/2033 | 5.000% | | 1,500,000 | 1,747,905 |
| 01/01/2034 | 5.000% | | 1,000,000 | 1,165,470 |
| Simmons College |
| Series 2015K-1 |
| 10/01/2026 | 5.000% | | 3,005,000 | 3,548,424 |
| 10/01/2028 | 5.000% | | 1,100,000 | 1,272,326 |
| Tufts University |
| Series 2015Q |
| 08/15/2030 | 5.000% | | 1,000,000 | 1,182,060 |
| Western New England University |
| Series 2015 |
| 09/01/2032 | 5.000% | | 500,000 | 557,755 |
| 09/01/2033 | 5.000% | | 1,225,000 | 1,358,464 |
| 09/01/2034 | 5.000% | | 1,285,000 | 1,420,221 |
| Worcester Polytechnic Institute |
| Series 2016 |
| 09/01/2032 | 5.000% | | 880,000 | 1,031,254 |
| 09/01/2033 | 5.000% | | 700,000 | 817,334 |
| 09/01/2034 | 5.000% | | 500,000 | 581,265 |
| Series 2017 |
| 09/01/2035 | 5.000% | | 230,000 | 270,402 |
| 09/01/2037 | 5.000% | | 290,000 | 338,244 |
| Revenue Bonds |
| Bentley University |
| Series 2016 |
| 07/01/2035 | 4.000% | | 1,000,000 | 1,060,860 |
| 07/01/2036 | 4.000% | | 1,000,000 | 1,052,340 |
| Berklee College of Music |
| Series 2016 |
| 10/01/2033 | 5.000% | | 1,150,000 | 1,354,286 |
| Brandeis University |
| Series 2010O-2 |
| 10/01/2024 | 5.000% | | 5,000,000 | 5,368,250 |
The accompanying Notes to Financial Statements are an integral part of this statement.
Columbia AMT-Free Massachusetts Intermediate Muni Bond Fund | Annual Report 2017
| 7 |
Portfolio of Investments (continued)
October 31, 2017
| Municipal Bonds (continued) |
| Issue Description | Coupon
Rate | | Principal
Amount ($) | Value ($) |
| Massachusetts College-Pharmacy & Allied Health |
| Series 2013 |
| 07/01/2025 | 5.000% | | 675,000 | 775,501 |
| Merrimack College |
| Series 2012A |
| 07/01/2027 | 5.000% | | 1,075,000 | 1,182,135 |
| Simmons College |
| Series 2013J |
| 10/01/2024 | 5.250% | | 500,000 | 588,980 |
| 10/01/2025 | 5.500% | | 450,000 | 532,467 |
| Unrefunded Revenue Bonds |
| Suffolk University |
| Series 2009 |
| 07/01/2024 | 6.000% | | 745,000 | 799,616 |
| Massachusetts Health & Educational Facilities Authority |
| Refunding Revenue Bonds |
| Berklee College of Music |
| Series 2007 |
| 10/01/2032 | 5.000% | | 170,000 | 170,564 |
| Revenue Bonds |
| Boston College |
| Series 2008M-1 |
| 06/01/2024 | 5.500% | | 3,000,000 | 3,667,140 |
| Massachusetts Institute of Technology |
| Series 2002K |
| 07/01/2022 | 5.500% | | 1,000,000 | 1,185,460 |
| Northeastern University |
| Series 2008T-1 |
| 10/01/2028 | 5.000% | | 1,750,000 | 2,004,222 |
| Series 2008T-2 |
| 10/01/2029 | 5.000% | | 4,045,000 | 4,608,145 |
| Massachusetts State College Building Authority |
| Revenue Bonds |
| Series 2012A |
| 05/01/2029 | 5.000% | | 3,000,000 | 3,439,500 |
| Total | 47,259,993 |
| Hospital 19.0% |
| Massachusetts Development Finance Agency |
| Refunding Revenue Bonds |
| Boston Medical Center |
| Series 2016E |
| 07/01/2033 | 5.000% | | 2,000,000 | 2,262,360 |
| Caregroup |
| Series 2015H-1 |
| 07/01/2030 | 5.000% | | 1,170,000 | 1,349,724 |
| Series 2016I |
| 07/01/2033 | 5.000% | | 3,000,000 | 3,465,270 |
| Municipal Bonds (continued) |
| Issue Description | Coupon
Rate | | Principal
Amount ($) | Value ($) |
| Lahey Clinic Obligation |
| Series 2015F |
| 08/15/2031 | 5.000% | | 3,000,000 | 3,461,700 |
| 08/15/2034 | 5.000% | | 2,250,000 | 2,559,105 |
| Partners HealthCare System |
| Series 2015 |
| 07/01/2032 | 5.000% | | 2,795,000 | 3,210,784 |
| Series 2016 |
| 07/01/2031 | 5.000% | | 3,000,000 | 3,533,070 |
| South Shore Hospital |
| Series 2016I |
| 07/01/2029 | 5.000% | | 2,000,000 | 2,327,980 |
| 07/01/2030 | 5.000% | | 1,400,000 | 1,619,114 |
| UMass Memorial Health Care |
| Series 2016I |
| 07/01/2030 | 5.000% | | 2,295,000 | 2,635,280 |
| Revenue Bonds |
| Baystate Medical Center |
| Series 2014N |
| 07/01/2028 | 5.000% | | 1,000,000 | 1,152,510 |
| 07/01/2034 | 5.000% | | 1,500,000 | 1,687,020 |
| Berkshire Health System |
| Series 2012G |
| 10/01/2026 | 5.000% | | 1,200,000 | 1,338,816 |
| Children’s Hospital |
| Series 2014P |
| 10/01/2031 | 5.000% | | 1,200,000 | 1,403,868 |
| Dana-Farber Cancer Institute |
| Series 2016 |
| 12/01/2032 | 5.000% | | 2,000,000 | 2,340,580 |
| Milford Regional Medical Center |
| Series 2014F |
| 07/15/2026 | 5.000% | | 315,000 | 346,396 |
| Southcoast Health System Obligation Group |
| Series 2013 |
| 07/01/2027 | 5.000% | | 1,050,000 | 1,191,351 |
| UMass Memorial Health Care Obligation |
| Series 2011H |
| 07/01/2026 | 5.125% | | 2,000,000 | 2,190,000 |
| Unrefunded Revenue Bonds |
| Boston Medical Center |
| Series 2012 |
| 07/01/2027 | 5.250% | | 1,850,000 | 2,066,542 |
| Massachusetts Health & Educational Facilities Authority |
| Revenue Bonds |
| Milford Regional Medical Center |
| Series 2007E |
| 07/15/2022 | 5.000% | | 1,500,000 | 1,504,320 |
The accompanying Notes to Financial Statements are an integral part of this statement.
| 8 | Columbia AMT-Free Massachusetts Intermediate Muni Bond Fund | Annual Report 2017 |
Portfolio of Investments (continued)
October 31, 2017
| Municipal Bonds (continued) |
| Issue Description | Coupon
Rate | | Principal
Amount ($) | Value ($) |
| Partners HealthCare System |
| Series 2010J-2 |
| 07/01/2022 | 5.000% | | 5,000,000 | 5,314,550 |
| Total | 46,960,340 |
| Human Service Provider 0.3% |
| Massachusetts Development Finance Agency |
| Revenue Bonds |
| Evergreen Center, Inc. |
| Series 2005 |
| 01/01/2020 | 5.500% | | 855,000 | 855,949 |
| Joint Power Authority 3.8% |
| Berkshire Wind Power Cooperative Corp. |
| Revenue Bonds |
| Series 2010-1 |
| 07/01/2024 | 5.250% | | 3,785,000 | 4,099,533 |
| 07/01/2025 | 5.000% | | 2,000,000 | 2,152,900 |
| Massachusetts Clean Energy Cooperative Corp. |
| Revenue Bonds |
| Municipal Lighting Plant Cooperative |
| Series 2013 |
| 07/01/2027 | 5.000% | | 2,720,000 | 3,158,002 |
| Total | 9,410,435 |
| Local General Obligation 0.9% |
| City of Fall River |
| Limited General Obligation Refunding Bonds |
| State Qualified |
| Series 2012 |
| 03/01/2021 | 4.000% | | 335,000 | 363,813 |
| Town of Braintree |
| Limited General Obligation Refunding Bonds |
| Series 2015 |
| 05/15/2027 | 5.000% | | 1,000,000 | 1,232,900 |
| 05/15/2028 | 5.000% | | 600,000 | 742,572 |
| Total | 2,339,285 |
| Multi-Family 1.5% |
| Massachusetts Development Finance Agency |
| Revenue Bonds |
| UMass Boston Student Housing Project |
| Series 2016 |
| 10/01/2033 | 5.000% | | 1,235,000 | 1,376,766 |
| 10/01/2034 | 5.000% | | 2,000,000 | 2,221,500 |
| Total | 3,598,266 |
| Municipal Power 0.3% |
| Guam Power Authority(c) |
| Refunding Revenue Bonds |
| Series 2012A (AGM) |
| 10/01/2024 | 5.000% | | 630,000 | 710,149 |
| Municipal Bonds (continued) |
| Issue Description | Coupon
Rate | | Principal
Amount ($) | Value ($) |
| Other Bond Issue 4.9% |
| Boston Housing Authority |
| Revenue Bonds |
| Capital Fund Program |
| Series 2008 (AGM) |
| 04/01/2020 | 5.000% | | 2,135,000 | 2,170,078 |
| 04/01/2023 | 5.000% | | 1,865,000 | 1,895,474 |
| 04/01/2024 | 5.000% | | 3,260,000 | 3,313,008 |
| Martha’s Vineyard Land Bank |
| Refunding Revenue Bonds |
| Green Bonds |
| Series 2014 |
| 05/01/2029 | 5.000% | | 1,000,000 | 1,169,360 |
| 05/01/2031 | 5.000% | | 1,000,000 | 1,160,970 |
| Series 2017 (BAM) |
| 05/01/2034 | 5.000% | | 500,000 | 586,620 |
| 05/01/2035 | 5.000% | | 500,000 | 585,265 |
| Massachusetts Development Finance Agency |
| Revenue Bonds |
| Broad Institute |
| Series 2011A |
| 04/01/2023 | 5.250% | | 1,000,000 | 1,129,680 |
| Total | 12,010,455 |
| Pool / Bond Bank 3.3% |
| Massachusetts Clean Water Trust (The) |
| Refunding Revenue Bonds |
| Pool Program |
| Series 2006 |
| 08/01/2020 | 5.250% | | 3,000,000 | 3,330,780 |
| Revenue Bonds |
| Pool Program |
| Series 2005-11 |
| 08/01/2019 | 5.250% | | 4,465,000 | 4,786,346 |
| Total | 8,117,126 |
| Prep School 0.7% |
| Massachusetts Development Finance Agency |
| Refunding Revenue Bonds |
| Dexter Southfield |
| Series 2015 |
| 05/01/2030 | 5.000% | | 1,035,000 | 1,179,765 |
| Revenue Bonds |
| Park School |
| Series 2012 |
| 09/01/2020 | 5.000% | | 150,000 | 163,359 |
| 09/01/2021 | 5.000% | | 330,000 | 368,132 |
| Total | 1,711,256 |
The accompanying Notes to Financial Statements are an integral part of this statement.
Columbia AMT-Free Massachusetts Intermediate Muni Bond Fund | Annual Report 2017
| 9 |
Portfolio of Investments (continued)
October 31, 2017
| Municipal Bonds (continued) |
| Issue Description | Coupon
Rate | | Principal
Amount ($) | Value ($) |
| Refunded / Escrowed 6.2% |
| Massachusetts Development Finance Agency |
| Prerefunded 05/01/19 Revenue Bonds |
| Dominion Energy Brayton 1 |
| Series 2009 |
| 12/01/2042 | 5.750% | | 3,460,000 | 3,693,965 |
| Prerefunded 07/01/22 Revenue Bonds |
| Boston Medical Center |
| Series 2012 |
| 07/01/2027 | 5.250% | | 1,845,000 | 2,163,669 |
| Revenue Bonds |
| Noble & Greenough School |
| Series 2011 Escrowed to Maturity |
| 04/01/2021 | 4.000% | | 1,500,000 | 1,632,180 |
| Massachusetts State College Building Authority(d) |
| Revenue Bonds |
| Capital Appreciation |
| Senior Series 1999A Escrowed to Maturity (NPFGC) |
| 05/01/2028 | 0.000% | | 4,000,000 | 3,139,800 |
| Massachusetts Water Pollution Abatement Trust (The) |
| Prerefunded 08/01/19 Revenue Bonds |
| State Revolving Fund |
| Series 2009-14 |
| 08/01/2024 | 5.000% | | 3,100,000 | 3,308,599 |
| Puerto Rico Highway & Transportation Authority(c) |
| Refunding Revenue Bonds |
| Series 2005BB Escrowed to Maturity (AGM) |
| 07/01/2022 | 5.250% | | 1,075,000 | 1,246,441 |
| Total | 15,184,654 |
| Retirement Communities 0.6% |
| Massachusetts Development Finance Agency |
| Refunding Revenue Bonds |
| 1st Mortgage-Berkshire Retirement Community |
| Series 2015 |
| 07/01/2031 | 5.000% | | 1,250,000 | 1,431,950 |
| Sales Tax 6.2% |
| Massachusetts Bay Transportation Authority(d) |
| Refunding Revenue Bonds |
| Series 2016A |
| 07/01/2029 | 0.000% | | 3,000,000 | 2,130,210 |
| Massachusetts Bay Transportation Authority |
| Revenue Bonds |
| Senior Series 2005B (NPFGC) |
| 07/01/2023 | 5.500% | | 2,890,000 | 3,499,645 |
| Senior Series 2006A |
| 07/01/2022 | 5.250% | | 3,500,000 | 4,097,625 |
| Senior Series 2008B |
| 07/01/2023 | 5.000% | | 910,000 | 1,076,339 |
| Municipal Bonds (continued) |
| Issue Description | Coupon
Rate | | Principal
Amount ($) | Value ($) |
| Massachusetts School Building Authority |
| Revenue Bonds |
| Senior Series 2011B |
| 10/15/2027 | 5.000% | | 4,000,000 | 4,541,920 |
| Total | 15,345,739 |
| Single Family 0.8% |
| Massachusetts Housing Finance Agency |
| Refunding Revenue Bonds |
| Series 2016-181 |
| 12/01/2044 | 4.000% | | 1,730,000 | 1,853,436 |
| Special Non Property Tax 0.4% |
| Territory of Guam(c) |
| Revenue Bonds |
| Series 2011A |
| 01/01/2031 | 5.000% | | 950,000 | 1,000,911 |
| Special Property Tax 1.8% |
| Metropolitan Boston Transit Parking Corp. |
| Revenue Bonds |
| Series 2011 |
| 07/01/2025 | 5.000% | | 3,210,000 | 3,611,443 |
| 07/01/2027 | 5.000% | | 775,000 | 871,332 |
| Total | 4,482,775 |
| State Appropriated 0.8% |
| Massachusetts Development Finance Agency |
| Revenue Bonds |
| Visual & Performing Arts Project |
| Series 2000 |
| 08/01/2021 | 6.000% | | 1,750,000 | 1,914,097 |
| State General Obligation 12.6% |
| Commonwealth of Massachusetts |
| Limited General Obligation Bonds |
| Series 2016I |
| 12/01/2030 | 5.000% | | 3,000,000 | 3,635,700 |
| Limited General Obligation Refunding Bonds |
| Series 2003D (AMBAC) |
| 10/01/2019 | 5.500% | | 5,000,000 | 5,412,500 |
| Series 2003D (NPFGC) |
| 10/01/2020 | 5.500% | | 2,500,000 | 2,803,825 |
| Series 2004B |
| 08/01/2020 | 5.250% | | 3,000,000 | 3,324,750 |
| Series 2006B (AGM) |
| 09/01/2022 | 5.250% | | 4,000,000 | 4,694,320 |
| Series 2016A |
| 07/01/2032 | 5.000% | | 2,500,000 | 2,981,925 |
| Unlimited General Obligation Refunding Bonds |
| Series 2004C (AMBAC) |
| 12/01/2024 | 5.500% | | 5,000,000 | 6,224,600 |
The accompanying Notes to Financial Statements are an integral part of this statement.
| 10 | Columbia AMT-Free Massachusetts Intermediate Muni Bond Fund | Annual Report 2017 |
Portfolio of Investments (continued)
October 31, 2017
| Municipal Bonds (continued) |
| Issue Description | Coupon
Rate | | Principal
Amount ($) | Value ($) |
| Series 2004C (NPFGC) |
| 12/01/2019 | 5.500% | | 1,900,000 | 2,069,423 |
| Total | 31,147,043 |
| Student Loan 2.0% |
| Massachusetts Educational Financing Authority |
| Revenue Bonds |
| Issue I |
| Series 2010A |
| 01/01/2022 | 5.500% | | 4,625,000 | 4,972,106 |
| Turnpike / Bridge / Toll Road 2.0% |
| Massachusetts Transportation Trust Fund Metropolitan Highway System |
| Revenue Bonds |
| Senior Series 2010B |
| 01/01/2022 | 5.000% | | 2,180,000 | 2,355,904 |
| 01/01/2032 | 5.000% | | 2,400,000 | 2,579,208 |
| Total | 4,935,112 |
| Water & Sewer 5.3% |
| Massachusetts Water Resources Authority |
| Refunding Revenue Bonds |
| General |
| Series 2007B (AGM / TCRS) |
| 08/01/2023 | 5.250% | | 5,500,000 | 6,618,095 |
| Series 2012B |
| 08/01/2028 | 5.000% | | 5,000,000 | 5,793,900 |
| Municipal Bonds (continued) |
| Issue Description | Coupon
Rate | | Principal
Amount ($) | Value ($) |
| Springfield Water & Sewer Commission |
| Refunding Revenue Bonds |
| General |
| Series 2012C |
| 07/15/2026 | 5.000% | | 365,000 | 434,117 |
| Series 2014C |
| 07/15/2024 | 5.000% | | 260,000 | 315,598 |
| Total | 13,161,710 |
Total Municipal Bonds
(Cost $224,873,631) | 238,159,689 |
| Money Market Funds 0.5% |
| | Shares | Value ($) |
| Dreyfus Tax-Exempt Cash Management Fund, Institutional Shares, 0.680%(e) | 1,083,215 | 1,083,215 |
Total Money Market Funds
(Cost $1,083,215) | 1,083,215 |
Total Investments
(Cost: $228,956,846) | 242,242,904 |
| Other Assets & Liabilities, Net | | 4,493,016 |
| Net Assets | 246,735,920 |
Notes to Portfolio of Investments
| (a) | The Fund is entitled to receive principal and interest from the guarantor after a day or a week’s notice or upon maturity. The maturity date disclosed represents the final maturity. |
| (b) | Represents a variable rate demand note where the coupon rate adjusts on specified dates (generally daily or weekly) using the prevailing money market rate. |
| (c) | Municipal obligations include debt obligations issued by or on behalf of territories, possessions, or sovereign nations within the territorial boundaries of the United States. At October 31, 2017, the value of these securities amounted to $2,957,501, which represents 1.20% of net assets. |
| (d) | Zero coupon bond. |
| (e) | The rate shown is the seven-day current annualized yield at October 31, 2017. |
Abbreviation Legend
| AGM | Assured Guaranty Municipal Corporation |
| AMBAC | Ambac Assurance Corporation |
| BAM | Build America Mutual Assurance Co. |
| NPFGC | National Public Finance Guarantee Corporation |
| TCRS | Transferable Custody Receipts |
| VRDN | Variable Rate Demand Note |
Fair value measurements
The Fund categorizes its fair value measurements according to a three-level hierarchy that maximizes the use of observable inputs and minimizes the use of unobservable inputs by prioritizing that the most observable input be used when available. Observable inputs are those that market participants would use in pricing an investment based on market data obtained from sources independent of the reporting entity. Unobservable inputs are those that reflect the Fund’s assumptions about the information market participants would use in
The accompanying Notes to Financial Statements are an integral part of this statement.
Columbia AMT-Free Massachusetts Intermediate Muni Bond Fund | Annual Report 2017
| 11 |
Portfolio of Investments (continued)
October 31, 2017
Fair value measurements (continued)
pricing an investment. An investment’s level within the fair value hierarchy is based on the lowest level of any input that is deemed significant to the asset’s or liability’s fair value measurement. The input levels are not necessarily an indication of the risk or liquidity associated with investments at that level. For example, certain U.S. government securities are generally high quality and liquid, however, they are reflected as Level 2 because the inputs used to determine fair value may not always be quoted prices in an active market.
Fair value inputs are summarized in the three broad levels listed below:
| • | Level 1 – Valuations based on quoted prices for investments in active markets that the Fund has the ability to access at the measurement date. Valuation adjustments are not applied to Level 1 investments. |
| • | Level 2 – Valuations based on other significant observable inputs (including quoted prices for similar securities, interest rates, prepayment speeds, credit risks, etc.). |
| • | Level 3 – Valuations based on significant unobservable inputs (including the Fund’s own assumptions and judgment in determining the fair value of investments). |
Inputs that are used in determining fair value of an investment may include price information, credit data, volatility statistics, and other factors. These inputs can be either observable or unobservable. The availability of observable inputs can vary between investments, and is affected by various factors such as the type of investment, and the volume and level of activity for that investment or similar investments in the marketplace. The inputs will be considered by the Investment Manager, along with any other relevant factors in the calculation of an investment’s fair value. The Fund uses prices and inputs that are current as of the measurement date, which may include periods of market dislocations. During these periods, the availability of prices and inputs may be reduced for many investments. This condition could cause an investment to be reclassified between the various levels within the hierarchy.
Investments falling into the Level 3 category are primarily supported by quoted prices from brokers and dealers participating in the market for those investments. However, these may be classified as Level 3 investments due to lack of market transparency and corroboration to support these quoted prices. Additionally, valuation models may be used as the pricing source for any remaining investments classified as Level 3. These models may rely on one or more significant unobservable inputs and/or significant assumptions by the Investment Manager. Inputs used in valuations may include, but are not limited to, financial statement analysis, capital account balances, discount rates and estimated cash flows, and comparable company data.
Under the direction of the Fund’s Board of Trustees (the Board), the Investment Manager’s Valuation Committee (the Committee) is responsible for overseeing the valuation procedures approved by the Board. The Committee consists of voting and non-voting members from various groups within the Investment Manager’s organization, including operations and accounting, trading and investments, compliance, risk management and legal.
The Committee meets at least monthly to review and approve valuation matters, which may include a description of specific valuation determinations, data regarding pricing information received from approved pricing vendors and brokers and the results of Board-approved valuation control policies and procedures (the Policies). The Policies address, among other things, instances when market quotations are or are not readily available, including recommendations of third party pricing vendors and a determination of appropriate pricing methodologies; events that require specific valuation determinations and assessment of fair value techniques; securities with a potential for stale pricing, including those that are illiquid, restricted, or in default; and the effectiveness of third party pricing vendors, including periodic reviews of vendors. The Committee meets more frequently, as needed, to discuss additional valuation matters, which may include the need to review back-testing results, review time-sensitive information or approve related valuation actions. The Committee reports to the Board, with members of the Committee meeting with the Board at each of its regularly scheduled meetings to discuss valuation matters and actions during the period, similar to those described earlier.
For investments categorized as Level 3, the Committee monitors information similar to that described above, which may include: (i) data specific to the issuer or comparable issuers, (ii) general market or specific sector news and (iii) quoted prices and specific or similar security transactions. The Committee considers this data and any changes from prior periods in order to assess the reasonableness of observable and unobservable inputs, any assumptions or internal models used to value those securities and changes in fair value. This data is also used to corroborate, when available, information received from approved pricing vendors and brokers. Various factors impact the frequency of monitoring this information (which may occur as often as daily). However, the Committee may determine that changes to inputs, assumptions and models are not required as a result of the monitoring procedures performed.
The following table is a summary of the inputs used to value the Fund’s investments at October 31, 2017:
| | Level 1
quoted prices in active
markets for identical
assets ($) | Level 2
other significant
observable inputs ($) | Level 3
significant
unobservable inputs ($) | Total ($) |
| Investments | | | | |
| Floating Rate Notes | — | 3,000,000 | — | 3,000,000 |
| Municipal Bonds | — | 238,159,689 | — | 238,159,689 |
| Money Market Funds | 1,083,215 | — | — | 1,083,215 |
| Total Investments | 1,083,215 | 241,159,689 | — | 242,242,904 |
See the Portfolio of Investments for all investment classifications not indicated in the table.
The Fund’s assets assigned to the Level 2 input category are generally valued using the market approach, in which a security’s value is determined through reference to prices and information from market transactions for similar or identical assets.
There were no transfers of financial assets between levels during the period.
The accompanying Notes to Financial Statements are an integral part of this statement.
| 12 | Columbia AMT-Free Massachusetts Intermediate Muni Bond Fund | Annual Report 2017 |
Statement of Assets and Liabilities
October 31, 2017
| Assets | |
| Investments in unaffiliated issuers, at cost | $228,956,846 |
| Investments in unaffiliated issuers, at value | 242,242,904 |
| Cash | 2,338,596 |
| Receivable for: | |
| Capital shares sold | 150,926 |
| Interest | 2,793,190 |
| Expense reimbursement due from Investment Manager | 518 |
| Prepaid expenses | 1,385 |
| Trustees’ deferred compensation plan | 57,502 |
| Other assets | 988 |
| Total assets | 247,586,009 |
| Liabilities | |
| Payable for: | |
| Capital shares purchased | 130,763 |
| Distributions to shareholders | 600,731 |
| Management services fees | 3,178 |
| Distribution and/or service fees | 343 |
| Transfer agent fees | 25,023 |
| Compensation of chief compliance officer | 10 |
| Other expenses | 32,539 |
| Trustees’ deferred compensation plan | 57,502 |
| Total liabilities | 850,089 |
| Net assets applicable to outstanding capital stock | $246,735,920 |
| Represented by | |
| Paid in capital | 232,888,349 |
| Excess of distributions over net investment income | (8,158) |
| Accumulated net realized gain | 569,671 |
| Unrealized appreciation (depreciation) on: | |
| Investments - unaffiliated issuers | 13,286,058 |
| Total - representing net assets applicable to outstanding capital stock | $246,735,920 |
The accompanying Notes to Financial Statements are an integral part of this statement.
Columbia AMT-Free Massachusetts Intermediate Muni Bond Fund | Annual Report 2017
| 13 |
Statement of Assets and Liabilities (continued)
October 31, 2017
| Class A | |
| Net assets | $18,511,984 |
| Shares outstanding | 1,743,333 |
| Net asset value per share | $10.62 |
| Maximum offering price per share(a) | $10.95 |
| Class C | |
| Net assets | $7,469,919 |
| Shares outstanding | 703,634 |
| Net asset value per share | $10.62 |
| Class R4 | |
| Net assets | $3,501,603 |
| Shares outstanding | 330,036 |
| Net asset value per share | $10.61 |
| Class R5 | |
| Net assets | $9,647 |
| Shares outstanding | 907 |
| Net asset value per share | $10.64 |
| Class V(b) | |
| Net assets | $17,933,556 |
| Shares outstanding | 1,688,951 |
| Net asset value per share | $10.62 |
| Maximum offering price per share(c) | $11.15 |
| Class Y | |
| Net assets | $109,777 |
| Shares outstanding | 10,289 |
| Net asset value per share | $10.67 |
| Class Z | |
| Net assets | $199,199,434 |
| Shares outstanding | 18,760,012 |
| Net asset value per share | $10.62 |
| (a) | The maximum offering price per share is calculated by dividing the net asset value per share by 1.0 minus the maximum sales charge of 3.00% for Class A shares. |
| (b) | Prior to January 24, 2017, Class V shares were known as Class T shares. |
| (c) | The maximum offering price per share is calculated by dividing the net asset value per share by 1.0 minus the maximum sales charge of 4.75% for Class V shares. |
The accompanying Notes to Financial Statements are an integral part of this statement.
| 14 | Columbia AMT-Free Massachusetts Intermediate Muni Bond Fund | Annual Report 2017 |
Statement of Operations
Year Ended October 31, 2017
| Net investment income | |
| Income: | |
| Dividends — unaffiliated issuers | $4,795 |
| Interest | 9,056,372 |
| Total income | 9,061,167 |
| Expenses: | |
| Management services fees | 1,209,330 |
| Distribution and/or service fees | |
| Class A | 49,870 |
| Class B(a) | 79 |
| Class C | 88,773 |
| Class V(b) | 26,998 |
| Transfer agent fees | |
| Class A | 31,981 |
| Class B(a) | 13 |
| Class C | 14,298 |
| Class R4 | 5,798 |
| Class R5 | 6 |
| Class V(b) | 28,535 |
| Class Y(c) | 4 |
| Class Z | 328,974 |
| Compensation of board members | 23,239 |
| Custodian fees | 2,915 |
| Printing and postage fees | 14,640 |
| Registration fees | 31,100 |
| Audit fees | 32,488 |
| Legal fees | 7,355 |
| Compensation of chief compliance officer | 111 |
| Other | (37,309) |
| Total expenses | 1,859,198 |
| Fees waived or expenses reimbursed by Investment Manager and its affiliates | (311,514) |
| Fees waived by distributor | |
| Class C | (26,642) |
| Expense reduction | (160) |
| Total net expenses | 1,520,882 |
| Net investment income | 7,540,285 |
| Realized and unrealized gain (loss) — net | |
| Net realized gain (loss) on: | |
| Investments — unaffiliated issuers | 594,731 |
| Net realized gain | 594,731 |
| Net change in unrealized appreciation (depreciation) on: | |
| Investments — unaffiliated issuers | (6,297,286) |
| Net change in unrealized appreciation (depreciation) | (6,297,286) |
| Net realized and unrealized loss | (5,702,555) |
| Net increase in net assets resulting from operations | $1,837,730 |
| (a) | Effective July 17, 2017, Class B shares were automatically converted to Class A shares. |
| (b) | Prior to January 24, 2017, Class V shares were known as Class T shares. |
| (c) | Class Y shares are based on operations from March 1, 2017 (commencement of operations) through the stated period end. |
The accompanying Notes to Financial Statements are an integral part of this statement.
Columbia AMT-Free Massachusetts Intermediate Muni Bond Fund | Annual Report 2017
| 15 |
Statement of Changes in Net Assets
| | Year Ended
October 31, 2017 (a) | Year Ended
October 31, 2016 |
| Operations | | |
| Net investment income | $7,540,285 | $8,813,229 |
| Net realized gain | 594,731 | 1,781,950 |
| Net change in unrealized appreciation (depreciation) | (6,297,286) | (3,252,034) |
| Net increase in net assets resulting from operations | 1,837,730 | 7,343,145 |
| Distributions to shareholders | | |
| Net investment income | | |
| Class A | (544,909) | (717,974) |
| Class B(b) | (157) | (214) |
| Class C | (202,778) | (230,616) |
| Class R4 | (108,403) | (104,230) |
| Class R5 | (293) | (205) |
| Class V(c) | (508,930) | (551,997) |
| Class Y | (527) | — |
| Class Z | (6,163,067) | (7,180,005) |
| Net realized gains | | |
| Class A | (163,084) | (850) |
| Class B(b) | (65) | — |
| Class C | (63,634) | (331) |
| Class R4 | (21,971) | (108) |
| Class R5 | (61) | — |
| Class V(c) | (114,602) | (669) |
| Class Z | (1,439,281) | (8,104) |
| Total distributions to shareholders | (9,331,762) | (8,795,303) |
| Increase (decrease) in net assets from capital stock activity | (41,475,364) | 6,500,304 |
| Total increase (decrease) in net assets | (48,969,396) | 5,048,146 |
| Net assets at beginning of year | 295,705,316 | 290,657,170 |
| Net assets at end of year | $246,735,920 | $295,705,316 |
| Excess of distributions over net investment income | $(8,158) | $(19,354) |
| (a) | Class Y shares are based on operations from March 1, 2017 (commencement of operations) through the stated period end. |
| (b) | Effective July 17, 2017, Class B shares were automatically converted to Class A shares. |
| (c) | Prior to January 24, 2017, Class V shares were known as Class T shares. |
The accompanying Notes to Financial Statements are an integral part of this statement.
| 16 | Columbia AMT-Free Massachusetts Intermediate Muni Bond Fund | Annual Report 2017 |
Statement of Changes in Net Assets (continued)
| | Year Ended | Year Ended |
| | October 31, 2017 (a) | October 31, 2016 (b) |
| | Shares | Dollars ($) | Shares | Dollars ($) |
| Capital stock activity |
| Class A(c) | | | | |
| Subscriptions (d) | 543,332 | 5,764,010 | 866,200 | 9,536,816 |
| Distributions reinvested | 58,803 | 619,101 | 57,640 | 635,045 |
| Redemptions | (1,377,530) | (14,464,743) | (563,151) | (6,207,831) |
| Net increase (decrease) | (775,395) | (8,081,632) | 360,689 | 3,964,030 |
| Class B(c) | | | | |
| Distributions reinvested | 21 | 220 | 20 | 214 |
| Redemptions (d) | (987) | (10,891) | (1) | (11) |
| Net increase (decrease) | (966) | (10,671) | 19 | 203 |
| Class C | | | | |
| Subscriptions | 77,292 | 814,053 | 144,462 | 1,593,534 |
| Distributions reinvested | 21,250 | 223,877 | 17,403 | 191,726 |
| Redemptions | (343,155) | (3,635,879) | (109,516) | (1,202,952) |
| Net increase (decrease) | (244,613) | (2,597,949) | 52,349 | 582,308 |
| Class R4 | | | | |
| Subscriptions | 168,660 | 1,764,767 | 156,771 | 1,724,772 |
| Distributions reinvested | 12,338 | 130,019 | 9,449 | 104,029 |
| Redemptions | (200,856) | (2,115,771) | (87,269) | (959,498) |
| Net increase (decrease) | (19,858) | (220,985) | 78,951 | 869,303 |
| Class R5 | | | | |
| Subscriptions | — | — | 907 | 10,000 |
| Net increase | — | — | 907 | 10,000 |
| Class V(e) | | | | |
| Subscriptions | 32,910 | 347,975 | 50,171 | 551,114 |
| Distributions reinvested | 29,293 | 309,014 | 24,084 | 265,359 |
| Redemptions | (91,842) | (971,689) | (111,092) | (1,223,438) |
| Net decrease | (29,639) | (314,700) | (36,837) | (406,965) |
| Class Y | | | | |
| Subscriptions | 10,263 | 109,955 | — | — |
| Distributions reinvested | 30 | 323 | — | — |
| Redemptions | (4) | (44) | — | — |
| Net increase | 10,289 | 110,234 | — | — |
| Class Z | | | | |
| Subscriptions | 2,307,256 | 24,324,231 | 2,813,666 | 31,012,986 |
| Distributions reinvested | 51,257 | 541,600 | 30,903 | 340,528 |
| Redemptions | (5,242,745) | (55,225,492) | (2,714,423) | (29,872,089) |
| Net increase (decrease) | (2,884,232) | (30,359,661) | 130,146 | 1,481,425 |
| Total net increase (decrease) | (3,944,414) | (41,475,364) | 586,224 | 6,500,304 |
| (a) | Class Y shares are based on operations from March 1, 2017 (commencement of operations) through the stated period end. |
| (b) | Class R5 shares are based on operations from March 1, 2016 (commencement of operations) through the stated period end. |
| (c) | Effective July 17, 2017, Class B shares were automatically converted to Class A shares. |
| (d) | Includes conversions of Class B shares to Class A shares, if any. |
| (e) | Prior to January 24, 2017, Class V shares were known as Class T shares. |
The accompanying Notes to Financial Statements are an integral part of this statement.
Columbia AMT-Free Massachusetts Intermediate Muni Bond Fund | Annual Report 2017
| 17 |
The following table is intended to help you understand the Fund’s financial performance. Certain information reflects financial results for a single share of a class held for the periods shown. Per share net investment income (loss) amounts are calculated based on average shares outstanding during the period. Total return assumes reinvestment of all dividends and distributions, if any. Total return does not reflect payment of sales charges, if any. Total return and portfolio turnover are not annualized for periods of less than one year. The portfolio turnover rate is calculated without regard to purchase and sales transactions of short-term instruments and certain derivatives, if any. If such transactions were included, the Fund’s portfolio turnover rate may be higher.
| Year ended | Net asset value,
beginning of
period | Net
investment
income | Net
realized
and
unrealized
gain (loss) | Total from
investment
operations | Distributions
from net
investment
income | Distributions
from net
realized
gains |
| Class A |
| 10/31/2017 | $10.88 | 0.29 | (0.19) | 0.10 | (0.29) | (0.07) |
| 10/31/2016 | $10.93 | 0.31 | (0.05) | 0.26 | (0.31) | (0.00) (e) |
| 10/31/2015 | $11.01 | 0.32 | (0.08) | 0.24 | (0.32) | — |
| 10/31/2014 | $10.84 | 0.33 | 0.17 | 0.50 | (0.33) | — |
| 10/31/2013 | $11.34 | 0.32 | (0.50) | (0.18) | (0.31) | (0.01) |
| Class C |
| 10/31/2017 | $10.88 | 0.24 | (0.19) | 0.05 | (0.24) | (0.07) |
| 10/31/2016 | $10.93 | 0.26 | (0.05) | 0.21 | (0.26) | (0.00) (e) |
| 10/31/2015 | $11.01 | 0.27 | (0.08) | 0.19 | (0.27) | — |
| 10/31/2014 | $10.84 | 0.28 | 0.17 | 0.45 | (0.28) | — |
| 10/31/2013 | $11.34 | 0.27 | (0.49) | (0.22) | (0.27) | (0.01) |
| Class R4 |
| 10/31/2017 | $10.87 | 0.32 | (0.20) | 0.12 | (0.31) | (0.07) |
| 10/31/2016 | $10.92 | 0.33 | (0.05) | 0.28 | (0.33) | (0.00) (e) |
| 10/31/2015 | $11.01 | 0.35 | (0.09) | 0.26 | (0.35) | — |
| 10/31/2014 | $10.83 | 0.35 | 0.18 | 0.53 | (0.35) | — |
| 10/31/2013 (f) | $11.19 | 0.21 | (0.36) | (0.15) | (0.21) | — |
| Class R5 |
| 10/31/2017 | $10.90 | 0.32 | (0.19) | 0.13 | (0.32) | (0.07) |
| 10/31/2016 (h) | $11.03 | 0.23 | (0.13) | 0.10 | (0.23) | — |
| Class V(i) |
| 10/31/2017 | $10.88 | 0.30 | (0.19) | 0.11 | (0.30) | (0.07) |
| 10/31/2016 | $10.93 | 0.32 | (0.05) | 0.27 | (0.32) | (0.00) (e) |
| 10/31/2015 | $11.02 | 0.33 | (0.09) | 0.24 | (0.33) | — |
| 10/31/2014 | $10.84 | 0.34 | 0.18 | 0.52 | (0.34) | — |
| 10/31/2013 | $11.34 | 0.33 | (0.50) | (0.17) | (0.32) | (0.01) |
| Class Y |
| 10/31/2017 (j) | $10.56 | 0.22 | 0.11 (k) | 0.33 | (0.22) | — |
The accompanying Notes to Financial Statements are an integral part of this statement.
| 18 | Columbia AMT-Free Massachusetts Intermediate Muni Bond Fund | Annual Report 2017 |
Total
distributions to
shareholders | Net
asset
value,
end of
period | Total
return | Total gross
expense
ratio to
average
net assets(a) | Total net
expense
ratio to
average
net assets(a),(b) | Net investment
income
ratio to
average
net assets | Portfolio
turnover | Net
assets,
end of
period
(000’s) |
| |
| (0.36) | $10.62 | 0.95% | 0.90% (c) | 0.78% (c),(d) | 2.74% | 5% | $18,512 |
| (0.31) | $10.88 | 2.34% | 0.96% | 0.81% (d) | 2.77% | 16% | $27,398 |
| (0.32) | $10.93 | 2.21% | 0.97% | 0.81% (d) | 2.93% | 8% | $23,583 |
| (0.33) | $11.01 | 4.65% | 0.96% | 0.81% (d) | 2.99% | 3% | $22,540 |
| (0.32) | $10.84 | (1.58%) | 0.95% | 0.79% (d) | 2.86% | 7% | $25,699 |
| |
| (0.31) | $10.62 | 0.50% | 1.66% (c) | 1.24% (c),(d) | 2.29% | 5% | $7,470 |
| (0.26) | $10.88 | 1.88% | 1.71% | 1.26% (d) | 2.32% | 16% | $10,315 |
| (0.27) | $10.93 | 1.76% | 1.72% | 1.26% (d) | 2.48% | 8% | $9,790 |
| (0.28) | $11.01 | 4.20% | 1.71% | 1.24% (d) | 2.56% | 3% | $10,366 |
| (0.28) | $10.84 | (1.97%) | 1.70% | 1.19% (d) | 2.46% | 7% | $11,244 |
| |
| (0.38) | $10.61 | 1.20% | 0.66% (c) | 0.54% (c),(d) | 2.98% | 5% | $3,502 |
| (0.33) | $10.87 | 2.60% | 0.71% | 0.56% (d) | 3.02% | 16% | $3,804 |
| (0.35) | $10.92 | 2.38% | 0.72% | 0.56% (d) | 3.19% | 8% | $2,959 |
| (0.35) | $11.01 | 5.01% | 0.71% | 0.56% (d) | 3.26% | 3% | $122 |
| (0.21) | $10.83 | (1.32%) | 0.68% (g) | 0.56% (d),(g) | 3.19% (g) | 7% | $60 |
| |
| (0.39) | $10.64 | 1.28% | 0.56% (c) | 0.47% (c) | 3.05% | 5% | $10 |
| (0.23) | $10.90 | 0.86% | 0.59% (g) | 0.47% (g) | 3.07% (g) | 16% | $10 |
| |
| (0.37) | $10.62 | 1.05% | 0.81% (c) | 0.69% (c),(d) | 2.83% | 5% | $17,934 |
| (0.32) | $10.88 | 2.45% | 0.86% | 0.71% (d) | 2.88% | 16% | $18,697 |
| (0.33) | $10.93 | 2.22% | 0.87% | 0.71% (d) | 3.03% | 8% | $19,185 |
| (0.34) | $11.02 | 4.85% | 0.86% | 0.71% (d) | 3.10% | 3% | $21,345 |
| (0.33) | $10.84 | (1.48%) | 0.85% | 0.69% (d) | 2.96% | 7% | $23,131 |
| |
| (0.22) | $10.67 | 3.10% | 0.55% (g) | 0.45% (g) | 3.21% (g) | 5% | $110 |
Columbia AMT-Free Massachusetts Intermediate Muni Bond Fund | Annual Report 2017
| 19 |
Financial Highlights (continued)
| Year ended | Net asset value,
beginning of
period | Net
investment
income | Net
realized
and
unrealized
gain (loss) | Total from
investment
operations | Distributions
from net
investment
income | Distributions
from net
realized
gains |
| Class Z |
| 10/31/2017 | $10.88 | 0.32 | (0.20) | 0.12 | (0.31) | (0.07) |
| 10/31/2016 | $10.93 | 0.33 | (0.05) | 0.28 | (0.33) | (0.00) (e) |
| 10/31/2015 | $11.02 | 0.35 | (0.09) | 0.26 | (0.35) | — |
| 10/31/2014 | $10.84 | 0.35 | 0.18 | 0.53 | (0.35) | — |
| 10/31/2013 | $11.34 | 0.34 | (0.49) | (0.15) | (0.34) | (0.01) |
| Notes to Financial Highlights |
| (a) | In addition to the fees and expenses that the Fund bears directly, the Fund indirectly bears a pro rata share of the fees and expenses of any other funds in which it invests. Such indirect expenses are not included in the Fund’s reported expense ratios. |
| (b) | Total net expenses include the impact of certain fee waivers/expense reimbursements made by the Investment Manager and certain of its affiliates, if applicable. |
| (c) | Expenses have been reduced due to a reimbursement of expenses overbilled by a third party. If the reimbursement had been excluded, the expense ratios would have been higher by the percentages shown for each class in the table below. All fee waivers and expense reimbursements by the Investment Manager and its affiliates were applied before giving effect to this third party reimbursement. |
| | Class A | Class C | Class R4 | Class R5 | Class V | Class Z |
| 10/31/2017 | 0.03 % | 0.02 % | 0.02 % | 0.02 % | 0.02 % | 0.02 % |
| (d) | The benefits derived from expense reductions had an impact of less than 0.01%. |
| (e) | Rounds to zero. |
| (f) | Class R4 shares commenced operations on March 19, 2013. Per share data and total return reflect activity from that date. |
| (g) | Annualized. |
| (h) | Class R5 shares commenced operations on March 1, 2016. Per share data and total return reflect activity from that date. |
| (i) | Prior to January 24, 2017, Class V shares were known as Class T shares. |
| (j) | Class Y shares commenced operations on March 1, 2017. Per share data and total return reflect activity from that date. |
| (k) | Calculation of the net gain (loss) per share (both realized and unrealized) does not correlate to the aggregate realized and unrealized gain (loss) presented in the Statement of Operations due to the timing of subscriptions and redemptions of Fund shares in relation to fluctuations in the market value of the portfolio. |
The accompanying Notes to Financial Statements are an integral part of this statement.
| 20 | Columbia AMT-Free Massachusetts Intermediate Muni Bond Fund | Annual Report 2017 |
Total
distributions to
shareholders | Net
asset
value,
end of
period | Total
return | Total gross
expense
ratio to
average
net assets(a) | Total net
expense
ratio to
average
net assets(a),(b) | Net investment
income
ratio to
average
net assets | Portfolio
turnover | Net
assets,
end of
period
(000’s) |
| |
| (0.38) | $10.62 | 1.20% | 0.66% (c) | 0.54% (c),(d) | 2.98% | 5% | $199,199 |
| (0.33) | $10.88 | 2.60% | 0.71% | 0.56% (d) | 3.03% | 16% | $235,472 |
| (0.35) | $10.93 | 2.38% | 0.72% | 0.56% (d) | 3.18% | 8% | $235,129 |
| (0.35) | $11.02 | 5.00% | 0.71% | 0.56% (d) | 3.24% | 3% | $240,304 |
| (0.35) | $10.84 | (1.33%) | 0.70% | 0.54% (d) | 3.10% | 7% | $257,624 |
Columbia AMT-Free Massachusetts Intermediate Muni Bond Fund | Annual Report 2017
| 21 |
Notes to Financial Statements
October 31, 2017
Note 1. Organization
Columbia AMT-Free Massachusetts Intermediate Muni Bond Fund (the Fund), a series of Columbia Funds Series Trust I (the Trust), is a non-diversified fund. The Trust is registered under the Investment Company Act of 1940, as amended (the 1940 Act), as an open-end management investment company organized as a Massachusetts business trust.
Fund shares
The Trust may issue an unlimited number of shares (without par value). Although all share classes generally have identical voting, dividend and liquidation rights, each share class votes separately when required by the Trust’s organizational documents or by law. Different share classes pay different distribution amounts to the extent the expenses of such share classes differ, and distributions in liquidation will be proportional to the net asset value of each share class. Each share class has its own expense and sales charge structure. The Fund offers each of the share classes identified below.
Class A shares are subject to a maximum front-end sales charge of 3.00% based on the initial investment amount. Class A shares purchased without an initial sales charge are subject to a contingent deferred sales charge (CDSC) of 0.75% on certain investments of $500,000 or more if redeemed within 12 months after purchase.
Class B shares of the Fund are no longer offered for sale. When available, Class B shares were subject to a maximum CDSC of 3.00% based upon the holding period after purchase. Effective July 17, 2017, Class B shares were automatically converted to Class A shares without a CDSC. On August 4, 2017, the capital owned by Columbia Management Investment Advisers, LLC in Class B shares was redeemed without a CDSC.
Class C shares are subject to a 1.00% CDSC on shares redeemed within 12 months after purchase.
Class R4 shares are not subject to sales charges and are generally available only to omnibus retirement plans and certain investors as described in the Fund’s prospectus. Effective November 1, 2017, Class R4 shares were renamed Advisor Class shares.
Class R5 shares are not subject to sales charges and are generally available only to investors purchasing through authorized investment professionals and omnibus retirement plans as described in the Fund’s prospectus. Effective November 1, 2017, Class R5 shares were renamed Institutional 2 Class shares.
Class V shares are subject to a maximum front-end sales charge of 4.75% based on the investment amount. Class V shares purchased without an initial sales charge in accounts aggregating $1 million to $50 million at the time of purchase are subject to a CDSC if the shares are sold within 18 months after purchase, charged as follows: 1.00% CDSC if redeemed within 12 months after purchase, and 0.50% CDSC if redeemed more than 12, but less than 18, months after purchase. Class V shares are available only to investors who received (and who have continuously held) Class V shares in connection with previous fund reorganizations. Prior to January 24, 2017, Class V shares were known as Class T shares.
Class Y shares are not subject to sales charges and are available to institutional and certain other investors as described in the Fund’s prospectus. Class Y shares commenced operations on March 1, 2017. Effective November 1, 2017, Class Y shares were renamed Institutional 3 Class shares.
Class Z shares are not subject to sales charges and are generally available only to eligible investors, which are subject to different investment minimums as described in the Fund’s prospectus. Effective November 1, 2017, Class Z shares were renamed Institutional Class shares.
Note 2. Summary of significant accounting policies
Basis of preparation
The Fund is an investment company that applies the accounting and reporting guidance in the Financial Accounting Standards Board (FASB) Accounting Standards Codification Topic 946, Financial Services - Investment Companies (ASC 946). The financial statements are prepared in accordance with U.S. generally accepted accounting principles (GAAP), which requires management to make certain estimates and assumptions that affect the reported amounts of assets and liabilities, the disclosure of contingent assets and liabilities at the date of the financial statements and the reported amounts of income
| 22 | Columbia AMT-Free Massachusetts Intermediate Muni Bond Fund | Annual Report 2017 |
Notes to Financial Statements (continued)
October 31, 2017
and expenses during the reporting period. Actual results could differ from those estimates. The Fund received a reimbursement for expenses overbilled by a third party. Such reimbursement is included as an offset to other expenses on the Statement of Operations. All fee waivers and expense reimbursements by Columbia Management Investment Advisers, LLC and its affiliates were applied before giving effect to the third party reimbursement.
The following is a summary of significant accounting policies followed by the Fund in the preparation of its financial statements.
Security valuation
Debt securities generally are valued by pricing services approved by the Board of Trustees based upon market transactions for normal, institutional-size trading units of similar securities. The services may use various pricing techniques that take into account, as applicable, factors such as yield, quality, coupon rate, maturity, type of issue, trading characteristics and other data, as well as approved independent broker-dealer quotes. Debt securities for which quotations are not readily available or not believed to be reflective of market value may also be valued based upon a bid quote from an approved independent broker-dealer. Debt securities maturing in 60 days or less are valued primarily at amortized cost value, unless this method results in a valuation that management believes does not approximate market value.
Investments in open-end investment companies, including money market funds, are valued at their latest net asset value.
Investments for which market quotations are not readily available, or that have quotations which management believes are not reflective of market value or reliable, are valued at fair value as determined in good faith under procedures approved by and under the general supervision of the Board of Trustees. If a security or class of securities (such as foreign securities) is valued at fair value, such value is likely to be different from the quoted or published price for the security.
The determination of fair value often requires significant judgment. To determine fair value, management may use assumptions including but not limited to future cash flows and estimated risk premiums. Multiple inputs from various sources may be used to determine fair value.
GAAP requires disclosure regarding the inputs and valuation techniques used to measure fair value and any changes in valuation inputs or techniques. In addition, investments shall be disclosed by major category. This information is disclosed following the Fund’s Portfolio of Investments.
Security transactions
Security transactions are accounted for on the trade date. Cost is determined and gains (losses) are based upon the specific identification method for both financial statement and federal income tax purposes.
Income recognition
Interest income is recorded on an accrual basis. Market premiums and discounts, including original issue discounts, are amortized and accreted, respectively, over the expected life of the security on all debt securities, unless otherwise noted.
The Fund may place a debt security on non-accrual status and reduce related interest income when it becomes probable that the interest will not be collected and the amount of uncollectible interest can be reasonably estimated. A defaulted debt security is removed from non-accrual status when the issuer resumes interest payments or when collectibility of interest is reasonably assured.
Dividend income is recorded on the ex-dividend date.
Expenses
General expenses of the Trust are allocated to the Fund and other funds of the Trust based upon relative net assets or other expense allocation methodologies determined by the nature of the expense. Expenses directly attributable to the Fund are charged to the Fund. Expenses directly attributable to a specific class of shares are charged to that share class.
Columbia AMT-Free Massachusetts Intermediate Muni Bond Fund | Annual Report 2017
| 23 |
Notes to Financial Statements (continued)
October 31, 2017
Determination of class net asset value
All income, expenses (other than class-specific expenses, which are charged to that share class, as shown in the Statement of Operations) and realized and unrealized gains (losses) are allocated to each class of the Fund on a daily basis, based on the relative net assets of each class, for purposes of determining the net asset value of each class.
Federal income tax status
The Fund intends to qualify each year as a regulated investment company under Subchapter M of the Internal Revenue Code, as amended, and will distribute substantially all of its net tax-exempt and investment company taxable income and net capital gain, if any, for its tax year, and as such will not be subject to federal income taxes. In addition, the Fund intends to distribute in each calendar year substantially all of its ordinary income, capital gain net income and certain other amounts, if any, such that the Fund should not be subject to federal excise tax. Therefore, no federal income or excise tax provision is recorded.
Distributions to shareholders
Distributions from net investment income, if any, are declared daily and paid monthly. Net realized capital gains, if any, are distributed at least annually. Income distributions and capital gain distributions are determined in accordance with federal income tax regulations, which may differ from GAAP.
Guarantees and indemnifications
Under the Trust’s organizational documents and, in some cases, by contract, its officers and trustees are indemnified against certain liabilities arising out of the performance of their duties to the Trust or its funds. In addition, certain of the Fund’s contracts with its service providers contain general indemnification clauses. The Fund’s maximum exposure under these arrangements is unknown since the amount of any future claims that may be made against the Fund cannot be determined, and the Fund has no historical basis for predicting the likelihood of any such claims.
Recent accounting pronouncement
Accounting Standards Update 2017-08 Premium Amortization on Purchased Callable Debt Securities
In March 2017, the Financial Accounting Standards Board issued Accounting Standards Update (ASU) No. 2017-08 Premium Amortization on Purchased Callable Debt Securities. ASU No. 2017-08 updates the accounting standards to shorten the amortization period for certain purchased callable debt securities, held at a premium, to be amortized to the earliest call date. The update applies to securities with explicit, noncontingent call features that are callable at fixed prices and on preset dates. The standard is effective for annual periods beginning after December 15, 2018 and interim periods within those fiscal years. At this time, management is evaluating the implication of this guidance and the impact it will have on the financial statement amounts and footnote disclosures, if any.
Note 3. Fees and other transactions with affiliates
Management services fees
The Fund has entered into a Management Agreement with Columbia Management Investment Advisers, LLC (the Investment Manager), a wholly-owned subsidiary of Ameriprise Financial, Inc. (Ameriprise Financial). Under the Management Agreement, the Investment Manager provides the Fund with investment research and advice, as well as administrative and accounting services. The management services fee is an annual fee that is equal to a percentage of the Fund’s daily net assets that declines from 0.47% to 0.31% as the Fund’s net assets increase. The effective management services fee rate for the year ended October 31, 2017 was 0.47% of the Fund’s average daily net assets.
Compensation of board members
Members of the Board of Trustees, who are not officers or employees of the Investment Manager or Ameriprise Financial, are compensated for their services to the Fund as disclosed in the Statement of Operations. These members of the Board of Trustees may participate in a Deferred Compensation Plan (the Plan) which may be terminated at any time. Obligations of the Plan will be paid solely out of the Fund’s assets, and all amounts payable under the Plan constitute a general unsecured obligation of the Fund.
| 24 | Columbia AMT-Free Massachusetts Intermediate Muni Bond Fund | Annual Report 2017 |
Notes to Financial Statements (continued)
October 31, 2017
Compensation of Chief Compliance Officer
The Board of Trustees has appointed a Chief Compliance Officer to the Fund in accordance with federal securities regulations. A portion of the Chief Compliance Officer’s total compensation is allocated to the Fund, along with other affiliated funds governed by the Board of Trustees, based on relative net assets. The total amount allocated to all affiliated funds governed by the Board of Trustees will not exceed $40,000 annually.
Transfer agency fees
Under a Transfer and Dividend Disbursing Agent Agreement, Columbia Management Investment Services Corp. (the Transfer Agent), an affiliate of the Investment Manager and a wholly-owned subsidiary of Ameriprise Financial, is responsible for providing transfer agency services to the Fund. The Transfer Agent has contracted with DST Asset Manager Solutions, Inc. (DST) to serve as sub-transfer agent. The Transfer Agent pays the fees of DST for services as sub-transfer agent and DST is not entitled to reimbursement for such fees from the Fund (with the exception of out-of-pocket fees).
The Fund pays the Transfer Agent a monthly transfer agency fee based on the number or the average value of accounts, depending on the type of account. In addition, the Fund pays the Transfer Agent a fee for shareholder services based on the number of accounts or on a percentage of the average aggregate value of the Fund’s shares maintained in omnibus accounts up to the lesser of the amount charged by the financial intermediary or a cap established by the Board of Trustees from time to time.
The Transfer Agent also receives compensation from the Fund for various shareholder services and reimbursements for certain out-of-pocket fees. Effective August 1, 2017, total transfer agency fees for Class R5 and Class Y shares are subject to an annual limitation of not more than 0.07% and 0.02%, respectively, of the average daily net assets attributable to each share class. From January 1, 2017 to July 31, 2017, these limitations were 0.075% for Class R5 shares and 0.025% for Class Y shares; and prior to January 1, 2017, the limitation was 0.05% for Class R5 shares.
For the year ended October 31, 2017, the Fund’s effective transfer agency fee rates as a percentage of average daily net assets of each class were as follows:
| | Effective rate (%) |
| Class A | 0.16 |
| Class B | 0.12 (a),(b) |
| Class C | 0.16 |
| Class R4 | 0.16 |
| Class R5 | 0.07 |
| Class V | 0.16 |
| Class Y | 0.02 (c) |
| Class Z | 0.16 |
| (a) | Effective July 17, 2017, Class B shares were automatically converted to Class A shares. |
| (b) | Unannualized. |
| (c) | Annualized. |
An annual minimum account balance fee of $20 may apply to certain accounts with a value below the applicable share class’s initial minimum investment requirements to reduce the impact of small accounts on transfer agency fees. These minimum account balance fees are remitted to the Fund and recorded as part of expense reductions in the Statement of Operations. For the year ended October 31, 2017, these minimum account balance fees reduced total expenses of the Fund by $160.
Distribution and service fees
The Fund has entered into an agreement with Columbia Management Investment Distributors, Inc. (the Distributor), an affiliate of the Investment Manager and a wholly-owned subsidiary of Ameriprise Financial, for distribution and shareholder services. The Board of Trustees has approved, and the Fund has adopted, distribution and shareholder service plans (the
Columbia AMT-Free Massachusetts Intermediate Muni Bond Fund | Annual Report 2017
| 25 |
Notes to Financial Statements (continued)
October 31, 2017
Plans) applicable to certain share classes, which set the distribution and service fees for the Fund. These fees are calculated daily and are intended to compensate the Distributor and/or eligible selling and/or servicing agents for selling shares of the Fund and providing services to investors.
Under the Plans, the Fund pays a monthly service fee to the Distributor at the maximum annual rate of 0.25% of the average daily net assets attributable to Class A, Class B and Class C shares of the Fund. Also under the Plans, the Fund pays a monthly distribution fee to the Distributor at the maximum annual rates of 0.75% of the average daily net assets attributable to Class B and Class C shares of the Fund. As a result of all Class B shares of the Fund being redeemed or converted to Class A shares, August 4, 2017 was the last day the Fund paid a service fee or distribution fee for Class B shares.
The Distributor has voluntarily agreed to waive a portion of the distribution fee for Class C shares so that the distribution fee does not exceed 0.45% annually of the average daily net assets attributable to Class C shares. This arrangement may be modified or terminated by the Distributor at any time.
Shareholder services fees
The Fund has adopted a shareholder services plan that permits it to pay for certain services provided to Class V shareholders by their selling and/or servicing agents. The Fund may pay shareholder servicing fees up to an aggregate annual rate of 0.40% of the Fund’s average daily net assets attributable to Class V shares (comprised of up to 0.20% for shareholder liaison services and up to 0.20% for administrative support services). These fees are currently limited to an aggregate annual rate of not more than 0.15% of the Fund’s average daily net assets attributable to Class V shares.
Sales charges (unaudited)
Sales charges, including front-end charges and CDSCs, received by the Distributor for distributing Fund shares for the year ended October 31, 2017, if any, are listed below:
| | Amount ($) |
| Class A | 6,883 |
| Class C | 2,996 |
Expenses waived/reimbursed by the Investment Manager and its affiliates
The Investment Manager and certain of its affiliates have contractually agreed to waive fees and/or reimburse expenses (excluding certain fees and expenses described below) for the period(s) disclosed below, unless sooner terminated at the sole discretion of the Board of Trustees, so that the Fund’s net operating expenses, after giving effect to fees waived/expenses reimbursed and any balance credits and/or overdraft charges from the Fund’s custodian, do not exceed the following annual rate(s) as a percentage of the class’ average daily net assets:
| | March 1, 2017
through
February 28, 2018 | Prior to
March 1, 2017 |
| Class A | 0.81% | 0.81% |
| Class C | 1.56 | 1.56 |
| Class R4 | 0.56 | 0.56 |
| Class R5 | 0.505 | 0.47 |
| Class V | 0.71 | 0.71 |
| Class Y | 0.455 | - |
| Class Z | 0.56 | 0.56 |
Under the agreement governing these fee waivers and/or expense reimbursement arrangements, the following fees and expenses are excluded from the waiver/reimbursement commitment, and therefore will be paid by the Fund, if applicable: taxes (including foreign transaction taxes), expenses associated with investments in affiliated and non-affiliated pooled investment vehicles (including mutual funds and exchange-traded funds), transaction costs and brokerage commissions, costs related to any securities lending program, dividend expenses associated with securities sold short, inverse floater program fees and expenses, transaction charges and interest on borrowed money, interest, infrequent and/or
| 26 | Columbia AMT-Free Massachusetts Intermediate Muni Bond Fund | Annual Report 2017 |
Notes to Financial Statements (continued)
October 31, 2017
unusual expenses and any other expenses the exclusion of which is specifically approved by the Board of Trustees. This agreement may be modified or amended only with approval from the Investment Manager, certain of its affiliates and the Fund. Any fees waived and/or expenses reimbursed under the expense reimbursement arrangements described above are not recoverable by the Investment Manager or its affiliates in future periods. Class C distribution fees waived by the Distributor, as discussed above, are in addition to the waiver/reimbursement commitment under the agreement.
Note 4. Federal tax information
The timing and character of income and capital gain distributions are determined in accordance with income tax regulations, which may differ from GAAP because of temporary or permanent book to tax differences.
At October 31, 2017, these differences are primarily due to differing treatment for trustees’ deferred compensation, principal and/or interest of fixed income securities and distributions. To the extent these differences are permanent, reclassifications are made among the components of the Fund’s net assets in the Statement of Assets and Liabilities. Temporary differences do not require reclassifications.
In the Statement of Assets and Liabilities the following reclassifications were made:
Excess of distributions
over net investment
income ($) | Accumulated
net realized
gain ($) | Paid in
capital ($) |
| (25) | 26 | (1) |
Net investment income (loss) and net realized gains (losses), as disclosed in the Statement of Operations, and net assets were not affected by this reclassification.
The tax character of distributions paid during the years indicated was as follows:
| Year Ended October 31, 2017 | Year Ended October 31, 2016 |
Ordinary
income ($) | Tax-exempt
income ($) | Long-term
capital gains ($) | Total ($) | Ordinary
income ($) | Tax-exempt
income ($) | Long-term
capital gains ($) | Total ($) |
| 12,799 | 7,516,265 | 1,802,698 | 9,331,762 | 10,513 | 8,774,728 | 10,062 | 8,795,303 |
Short-term capital gain distributions, if any, are considered ordinary income distributions for tax purposes.
At October 31, 2017, the components of distributable earnings on a tax basis were as follows:
Undistributed
ordinary income ($) | Undistributed tax-
exempt income ($) | Undistributed
long-term
capital gains ($) | Capital loss
carryforwards ($) | Net unrealized
appreciation ($) |
| — | 640,575 | 569,671 | — | 13,295,558 |
At October 31, 2017, the cost of all investments for federal income tax purposes along with the aggregate gross unrealized appreciation and depreciation based on that cost was:
Federal
tax cost ($) | Gross unrealized
appreciation ($) | Gross unrealized
(depreciation) ($) | Net unrealized
appreciation ($) |
| 228,947,346 | 13,638,361 | (342,803) | 13,295,558 |
Management of the Fund has concluded that there are no significant uncertain tax positions in the Fund that would require recognition in the financial statements. However, management’s conclusion may be subject to review and adjustment at a later date based on factors including, but not limited to, new tax laws, regulations, and administrative interpretations (including relevant court decisions). Generally, the Fund’s federal tax returns for the prior three fiscal years remain subject to examination by the Internal Revenue Service.
Columbia AMT-Free Massachusetts Intermediate Muni Bond Fund | Annual Report 2017
| 27 |
Notes to Financial Statements (continued)
October 31, 2017
Note 5. Portfolio information
The cost of purchases and proceeds from sales of securities, excluding short-term investments and derivatives, if any, aggregated to $12,899,205 and $56,445,260, respectively, for the year ended October 31, 2017. The amount of purchase and sale activity impacts the portfolio turnover rate reported in the Financial Highlights.
Note 6. Line of credit
The Fund has access to a revolving credit facility with a syndicate of banks led by Citibank, N.A., HSBC Bank USA, N.A. and JPMorgan Chase Bank, N.A. whereby the Fund may borrow for the temporary funding of shareholder redemptions or for other temporary or emergency purposes. The credit facility, which is a collective agreement between the Fund and certain other funds managed by the Investment Manager, severally and not jointly, permits collective borrowings up to $1 billion. Interest is charged to each participating fund based on its borrowings at a rate equal to the higher of (i) the overnight federal funds rate plus 1.00% or (ii) the one-month LIBOR rate plus 1.00%. Each borrowing under the credit facility matures no later than 60 days after the date of borrowing. The Fund also pays a commitment fee equal to its pro rata share of the amount of the credit facility at a rate of 0.15% per annum. The commitment fee is included in other expenses in the Statement of Operations.
The Fund had no borrowings during the year ended October 31, 2017.
Note 7. Significant risks
Credit risk
Credit risk is the risk that the value of debt securities in the Fund’s portfolio may decline because the issuer may default and fail to pay interest or repay principal when due. Rating agencies assign credit ratings to debt securities to indicate their credit risk. Lower rated or unrated debt securities held by the Fund may present increased credit risk as compared to higher-rated debt securities.
Geographic concentration risk
Because the Fund invests substantially in municipal securities issued by the state identified in the Fund’s name and political sub-divisions of that state, the Fund will be particularly affected by adverse tax, legislative, regulatory, demographic or political changes as well as changes impacting the state’s financial, economic or other condition and prospects. In addition, because of the relatively small number of issuers of tax-exempt securities in the state, the Fund may invest a higher percentage of assets in a single issuer and, therefore, be more exposed to the risk of loss than a fund that invests more broadly. The value of municipal and other securities owned by the Fund also may be adversely affected by future changes in federal or state income tax laws.
Interest rate risk
Interest rate risk is the risk of losses attributable to changes in interest rates. In general, if prevailing interest rates rise, the values of debt securities tend to fall, and if interest rates fall, the values of debt securities tend to rise. Actions by governments and central banking authorities can result in increases in interest rates. Increasing interest rates may negatively affect the value of debt securities held by the Fund, resulting in a negative impact on the Fund’s performance and net asset value per share. In general, the longer the maturity or duration of a debt security, the greater its sensitivity to changes in interest rates.
Liquidity risk
Liquidity risk is the risk associated with a lack of marketability of investments which may make it difficult to sell the investment at a desirable time or price. Changing regulatory, market or other conditions or environments (for example, the interest rate or credit environments) may adversely affect the liquidity of the Fund’s investments. The Fund may have to accept a lower selling price for the holding, sell other investments, or forego another, more appealing investment opportunity. Generally, the less liquid the market at the time the Fund sells a portfolio investment, the greater the risk of loss or decline of value to the Fund. A less liquid market can lead to an increase in Fund redemptions, which may negatively impact Fund performance and net asset value per share, including, for example, if the Fund is forced to sell securities in a down market.
| 28 | Columbia AMT-Free Massachusetts Intermediate Muni Bond Fund | Annual Report 2017 |
Notes to Financial Statements (continued)
October 31, 2017
Non-diversification risk
A non-diversified fund is permitted to invest a greater percentage of its total assets in fewer issuers than a diversified fund. The Fund may, therefore, have a greater risk of loss from a few issuers than a similar fund that invests more broadly.
Shareholder concentration risk
At October 31, 2017, one unaffiliated shareholder of record owned 76.7% of the outstanding shares of the Fund in one or more accounts. The Fund has no knowledge about whether any portion of those shares was owned beneficially. Subscription and redemption activity by concentrated accounts may have a significant effect on the operations of the Fund. In the case of a large redemption, the Fund may be forced to sell investments at inopportune times, including its liquid positions, which may result in Fund losses and the Fund holding a higher percentage of less liquid positions. Large redemptions could result in decreased economies of scale and increased operating expenses for non-redeeming Fund shareholders.
Note 8. Subsequent events
Management has evaluated the events and transactions that have occurred through the date the financial statements were issued. Other than as noted in Note 1 above, there were no items requiring adjustment of the financial statements or additional disclosure.
Note 9. Information regarding pending and settled legal proceedings
Ameriprise Financial and certain of its affiliates have historically been involved in a number of legal, arbitration and regulatory proceedings, including routine litigation, class actions, and governmental actions, concerning matters arising in connection with the conduct of their business activities. Ameriprise Financial believes that the Fund is not currently the subject of, and that neither Ameriprise Financial nor any of its affiliates are the subject of, any pending legal, arbitration or regulatory proceedings that are likely to have a material adverse effect on the Fund or the ability of Ameriprise Financial or its affiliates to perform under their contracts with the Fund. Ameriprise Financial is required to make quarterly (10-Q), annual (10-K) and, as necessary, 8-K filings with the Securities and Exchange Commission (SEC) on legal and regulatory matters that relate to Ameriprise Financial and its affiliates. Copies of these filings may be obtained by accessing the SEC website at www.sec.gov.
There can be no assurance that these matters, or the adverse publicity associated with them, will not result in increased Fund redemptions, reduced sale of Fund shares or other adverse consequences to the Fund. Further, although we believe proceedings are not likely to have a material adverse effect on the Fund or the ability of Ameriprise Financial or its affiliates to perform under their contracts with the Fund, these proceedings are subject to uncertainties and, as such, we are unable to estimate the possible loss or range of loss that may result. An adverse outcome in one or more of these proceedings could result in adverse judgments, settlements, fines, penalties or other relief that could have a material adverse effect on the consolidated financial condition or results of operations of Ameriprise Financial.
Columbia AMT-Free Massachusetts Intermediate Muni Bond Fund | Annual Report 2017
| 29 |
Report of Independent Registered Public Accounting Firm
To the Trustees of Columbia Funds Series Trust I and the Shareholders of Columbia AMT-Free Massachusetts Intermediate Muni Bond Fund
In our opinion, the accompanying statement of assets and liabilities, including the portfolio of investments, and the related statements of operations and of changes in net assets and the financial highlights present fairly, in all material respects, the financial position of Columbia AMT-Free Massachusetts Intermediate Muni Bond Fund (the “Fund”, a series of Columbia Funds Series Trust I) as of October 31, 2017, the results of its operations for the year then ended, the changes in its net assets for each of the two years in the period then ended and the financial highlights for each of the periods indicated therein, in conformity with accounting principles generally accepted in the United States of America. These financial statements and financial highlights (hereafter referred to as “financial statements”) are the responsibility of the Fund’s management. Our responsibility is to express an opinion on these financial statements based on our audits. We conducted our audits of these financial statements in accordance with the standards of the Public Company Accounting Oversight Board (United States). Those standards require that we plan and perform the audit to obtain reasonable assurance about whether the financial statements are free of material misstatement. An audit includes examining, on a test basis, evidence supporting the amounts and disclosures in the financial statements, assessing the accounting principles used and significant estimates made by management, and evaluating the overall financial statement presentation. We believe that our audits, which included confirmation of securities as of October 31, 2017 by correspondence with the custodian and brokers, provide a reasonable basis for our opinion.
/s/ PricewaterhouseCoopers LLP
Minneapolis, MN
December 21, 2017
| 30 | Columbia AMT-Free Massachusetts Intermediate Muni Bond Fund | Annual Report 2017 |
Federal Income Tax Information
(Unaudited)
The Fund hereby designates the following tax attributes for the fiscal year ended October 31, 2017. Shareholders will be notified in early 2018 of the amounts for use in preparing 2017 income tax returns.
Capital
gain
dividend | Exempt-
interest
dividends |
| $624,496 | 99.83% |
Capital gain dividend. The Fund designates as a capital gain dividend the amount reflected above, or if subsequently determined to be different, the net capital gain of such fiscal period.
Exempt-interest dividends. The percentage of net investment income distributed during the fiscal year that qualifies as exempt-interest dividends for federal income tax purposes. A portion of the income may be subject to federal alternative minimum tax.
Columbia AMT-Free Massachusetts Intermediate Muni Bond Fund | Annual Report 2017
| 31 |
Shareholders elect the Board that oversees the Fund’s operations. The Board appoints officers who are responsible for day-to-day business decisions based on policies set by the Board. The following table provides basic biographical information about the Fund’s Trustees, including their principal occupations during the past five years, although specific titles for individuals may have varied over the period. The year set forth beneath Length of Service in the table below is the year in which the Trustee was first appointed or elected as Trustee to any Fund currently in the Columbia Funds Complex or a predecessor thereof. Under current Board policy, members serve terms of indefinite duration.
Independent trustees
| Name, address, year of birth | Position held with the Trust and length of service | Principal occupation(s) during the past five years and other relevant professional experience | Number of Funds in the Columbia Fund Complex overseen | Other directorships held by Trustee during the past five years |
Janet Langford Carrig
c/o Columbia Management
Investment Advisers, LLC
225 Franklin Street
Mail Drop BX32 05228
Boston, MA 02110
1957 | Trustee
1996 | Senior Vice President, General Counsel and Corporate Secretary, ConocoPhillips (independent energy company) since September 2007 | 66 | None |
Douglas A. Hacker
c/o Columbia Management
Investment Advisers, LLC
225 Franklin Street
Mail Drop BX32 05228
Boston, MA 02110
1955 | Trustee and Chairman of the Board
1996 | Independent business executive since May 2006; Executive Vice President — Strategy of United Airlines from December 2002 to May 2006; President of UAL Loyalty Services (airline marketing company) from September 2001 to December 2002; Executive Vice President and Chief Financial Officer of United Airlines from July 1999 to September 2001 | 66 | Spartan Nash Company, (food distributor); Nash Finch Company (food distributor) from 2005 to 2013; Aircastle Limited (aircraft leasing); SeaCube Container Leasing Ltd. (container leasing) from 2010 to 2013; and Travelport Worldwide Limited (travel information technology) |
Nancy T. Lukitsh
c/o Columbia Management
Investment Advisers, LLC
225 Franklin Street
Mail Drop BX32 05228
Boston, MA 02110
1956 | Trustee
2011 | Senior Vice President, Partner and Director of Marketing, Wellington Management Company, LLP (investment adviser) from 1997 to 2010; Chair, Wellington Management Portfolios (commingled non-U.S. investment pools) from 2007 to 2010; Director, Wellington Trust Company, NA and other Wellington affiliates from 1997 to 2010 | 66 | None |
David M. Moffett
c/o Columbia Management
Investment Advisers, LLC
225 Franklin Street
Mail Drop BX32 05228
Boston, MA 02110
1952 | Trustee
2011 | Retired. Consultant to Bridgewater and Associates | 66 | Director, CSX Corporation; Genworth Financial, Inc. (financial and insurance products and services); PayPal Holdings Inc. (payment and data processing services); Trustee, University of Oklahoma Foundation; former Director, eBay Inc. (online trading community), 2007-2015; and former Director, CIT Bank, CIT Group Inc. (commercial and consumer finance), 2010-2016 |
| 32 | Columbia AMT-Free Massachusetts Intermediate Muni Bond Fund | Annual Report 2017 |
TRUSTEES AND OFFICERS (continued)
Independent trustees (continued)
| Name, address, year of birth | Position held with the Trust and length of service | Principal occupation(s) during the past five years and other relevant professional experience | Number of Funds in the Columbia Fund Complex overseen | Other directorships held by Trustee during the past five years |
Charles R. Nelson
c/o Columbia Management
Investment Advisers, LLC
225 Franklin Street
Mail Drop BX32 05228
Boston, MA 02110
1942 | Trustee
1981 | Retired. Professor Emeritus, University of Washington since 2011; Professor of Economics, University of Washington from 1976 to 2011; Ford and Louisa Van Voorhis Professor of Political Economy, University of Washington from 1993 to 2011; Adjunct Professor of Statistics, University of Washington from 1980 to 2011; Associate Editor, Journal of Money, Credit and Banking from September 1993 to 2008; consultant on econometric and statistical matters | 66 | None |
John J. Neuhauser
c/o Columbia Management
Investment Advisers, LLC
225 Franklin Street
Mail Drop BX32 05228
Boston, MA 02110
1943 | Trustee
1984 | President, Saint Michael’s College since August 2007; Director or Trustee of several non-profit organizations, including University of Vermont Medical Center; Academic Vice President and Dean of Faculties, Boston College from August 1999 to October 2005; University Professor, Boston College from November 2005 to August 2007 | 66 | Liberty All-Star Equity Fund and Liberty All- Star Growth Fund (closed-end funds) |
Patrick J. Simpson
c/o Columbia Management
Investment Advisers, LLC
225 Franklin Street
Mail Drop BX32 05228
Boston, MA 02110
1944 | Trustee
2000 | Of Counsel, Perkins Coie LLP (law firm) since 2015; Partner, Perkins Coie LLP from 1988 to 2014 | 66 | None |
Anne-Lee Verville
c/o Columbia Management
Investment Advisers, LLC
225 Franklin Street
Mail Drop BX32 05228
Boston, MA 02110
1945 | Trustee
1998 | Retired. General Manager, Global Education Industry from 1994 to 1997, President – Application Systems Division from 1991 to 1994, Chief Financial Officer – US Marketing & Services from 1988 to 1991, and Chief Information Officer from 1987 to 1988, IBM Corporation (computer and technology) | 66 | Enesco Group, Inc. (producer of giftware and home and garden decor products) from 2001 to 2006 |
Columbia AMT-Free Massachusetts Intermediate Muni Bond Fund | Annual Report 2017
| 33 |
TRUSTEES AND OFFICERS (continued)
Consultants to the Independent Trustees*
| Name, address, year of birth | Position held with the Trust and length of service | Principal occupation(s) during the past five years and other relevant professional experience | Number of Funds in the Columbia Funds complex overseen | Other directorships held by Trustee during the past five years |
J. Kevin Connaughton
c/o Columbia
Management Investment
Advisers, LLC,
225 Franklin Street
Mail Drop BX32 05228,
Boston, MA 02110
1964 | Independent Trustee Consultant
2016 | Independent Trustee Consultant, Columbia Funds since March 2016; Managing Director and General Manager of Mutual Fund Products, Columbia Management Investment Advisers, LLC from May 2010 to February 2015; President, Columbia Funds from 2009 to 2015; and senior officer of Columbia Funds and affiliated funds from 2003 to 2015 | 66 | Board of Governors, Gateway Healthcare since January 2016; Trustee, New Century Portfolios since March 2015; and Director, The Autism Project since March 2015 |
Natalie A. Trunow
c/o Columbia
Management Investment
Advisers, LLC,
225 Franklin Street
Mail Drop BX32 05228,
Boston, MA 02110
1967 | Independent Trustee Consultant
2016 | Independent Trustee Consultant, Columbia Funds since September 2016; Chief Executive Officer, Millennial Partners (investment consulting services to institutions) since January 2016; Director of Investments, Casey Family Programs from April 2016 to September 2016; Senior Vice President and Chief Investment Officer, Calvert Investments from August 2008 to January 2016; Section Head and Portfolio Manager, General Motors Asset Management from June 1997 to August 2008 | 66 | Healthcare Services for Children with Special Needs |
| * | J. Kevin Connaughton was appointed consultant to the Independent Trustees effective March 1, 2016. Natalie A. Trunow was appointed consultant to the Independent Trustees effective September 1, 2016. Shareholders of the Funds are expected to be asked to elect each of Mr. Connaughton and Ms. Trunow as a Trustee at a future shareholder meeting. |
Interested trustee affiliated with Investment Manager*
| Name, address, year of birth | Position held with the Trust and length of service | Principal occupation(s) during the past five years and other relevant professional experience | Number of Funds in the Columbia Funds Complex overseen | Other directorships held by Trustee during the past five years |
William F. Truscott
c/o Columbia Management
Investment Advisers, LLC
225 Franklin Street
Boston, MA 02110
1960 | Trustee
2012 | Chairman of the Board and President, Columbia Management Investment Advisers, LLC since May 2010 and February 2012, respectively; Chief Executive Officer, Global Asset Management, Ameriprise Financial, Inc. since September 2012 (previously Chief Executive Officer, U.S. Asset Management & President, Annuities, May 2010-September 2012); Director and Chief Executive Officer, Columbia Management Investment Distributors, Inc. since May 2010 and February 2012, respectively; Chairman of the Board and Chief Executive Officer, RiverSource Distributors, Inc. since 2006; Director, Threadneedle Asset Management Holdings, SARL since 2014; President and Chief Executive Officer, Ameriprise Certificate Company, 2006-August 2012 | 189 | Chairman of the Board, Columbia Management Investment Advisers, LLC since May 2010; Director, Columbia Management Investment Distributors, Inc. since May 2010; former Director, Ameriprise Certificate Company, 2006 - January 2013 |
| * | Interested person (as defined under the 1940 Act) by reason of being an officer, director, security holder and/or employee of the Investment Manager or Ameriprise Financial. |
The Statement of Additional Information has additional information about the Fund’s Board members and is available,
without charge, upon request by calling 800.345.6611, contacting your financial intermediary or visiting
investor.columbiathreadneedleus.com.
| 34 | Columbia AMT-Free Massachusetts Intermediate Muni Bond Fund | Annual Report 2017 |
TRUSTEES AND OFFICERS (continued)
The Board has appointed officers who are responsible for day-to-day business decisions based on policies it has established. The officers serve at the pleasure of the Board. The following table provides basic information about the Officers of the Fund, including principal occupations during the past five years, although their specific titles may have varied over the period. In addition to Mr. Truscott, who is Senior Vice President, the Fund’s other officers are:
Fund officers
Name,
address and
year of birth | Position and year
first appointed to
position for any Fund
in the Columbia
Funds complex or a
predecessor thereof | Principal occupation(s) during past five years |
Christopher O. Petersen
5228 Ameriprise
Financial Center
Minneapolis, MN 55474
Born 1970 | President and Principal Executive Officer (2015) | Vice President and Lead Chief Counsel, Ameriprise Financial, Inc. since January 2015 (previously, Vice President and Chief Counsel, January 2010 - December 2014; officer of Columbia Funds and affiliated funds since 2007. |
Michael G. Clarke
225 Franklin Street
Boston, MA 02110
Born 1969 | Treasurer (2011), Chief Financial Officer (2009) and Chief Accounting Officer (2015) | Vice President — Mutual Fund Administration, Columbia Management Investment Advisers, LLC, since May 2010; senior officer of Columbia Funds and affiliated funds since 2002. |
Paul B. Goucher
100 Park Avenue
New York, NY 10017
Born 1968 | Senior Vice President (2011) and Assistant Secretary (2008) | Senior Vice President and Assistant General Counsel, Ameriprise Financial, Inc. since January 2017 (previously Vice President and Lead Chief Counsel, November 2008 - January 2017 and January 2013 - January 2017, respectively; and Chief Counsel, January 2010 - January 2013); Vice President, Chief Legal Officer and Assistant Secretary, Columbia Management Investment Advisers, LLC since May 2010. |
Thomas P. McGuire
225 Franklin Street
Boston, MA 02110
Born 1972 | Senior Vice President and Chief Compliance Officer (2012) | Vice President — Asset Management Compliance, Ameriprise Financial, Inc., since May 2010; Chief Compliance Officer, Ameriprise Certificate Company since September 2010. |
Colin Moore
225 Franklin Street
Boston, MA 02110
Born 1958 | Senior Vice President (2010) | Executive Vice President and Global Chief Investment Officer, Ameriprise Financial, Inc., since July 2013; Executive Vice President and Global Chief Investment Officer, Columbia Management Investment Advisers, LLC since July 2013 (previously Director and Global Chief Investment Officer, 2010 - 2013). |
Ryan C. Larrenaga
225 Franklin Street
Boston, MA 02110
Born 1970 | Senior Vice President (2017), Chief Legal Officer (2017) and Secretary (2015) | Vice President and Group Counsel, Ameriprise Financial, Inc. since August 2011; officer of Columbia Funds and affiliated funds since 2005. |
Michael E. DeFao
225 Franklin Street
Boston, MA 02110
Born 1968 | Vice President (2011) and Assistant Secretary (2010) | Vice President and Chief Counsel, Ameriprise Financial, Inc. since May 2010. |
Amy Johnson
5228 Ameriprise
Financial Center
Minneapolis, MN 55474
Born 1965 | Vice President (2006) | Managing Director and Global Head of Operations, Columbia Management Investment Advisers, LLC since April 2016 (previously Managing Director and Chief Operating Officer, 2010 - 2016). |
Lyn Kephart-Strong
5228 Ameriprise
Financial Center
Minneapolis, MN 55474
Born 1960 | Vice President (2015) | President, Columbia Management Investment Services Corp. since October 2014; Vice President & Resolution Officer, Ameriprise Trust Company since August 2009. |
Columbia AMT-Free Massachusetts Intermediate Muni Bond Fund | Annual Report 2017
| 35 |
Board Consideration and Approval of Management
Agreement
On June 14, 2017, the Board of Trustees (the Board) and the Trustees who are not interested persons (as defined in the Investment Company Act of 1940) (the Independent Trustees) of Columbia Funds Series Trust I (the Trust) unanimously approved the continuation of the Management Agreement (the Management Agreement) with Columbia Management Investment Advisers, LLC (the Investment Manager) with respect to Columbia AMT-Free Massachusetts Intermediate Muni Bond Fund (the Fund), a series of the Trust. As detailed below, the Board’s Advisory Fees and Expenses Committee (the Committee) and the Board met on multiple occasions to review and discuss, both among themselves and with the management team of the Investment Manager, materials provided by the Investment Manager and others before determining to approve the continuation of the Management Agreement.
In connection with their deliberations regarding the continuation of the Management Agreement, the Committee and the Board evaluated materials requested from the Investment Manager regarding the Fund and the Management Agreement, and discussed these materials with representatives of the Investment Manager at Committee meetings held on March 27, 2017, April 26, 2017 and June 13, 2017 and at Board meetings held on March 28, 2017 and June 14, 2017. In addition, the Board considers matters bearing on the Management Agreement at most of its other meetings throughout the year and meets regularly with senior management of the Trust and the Investment Manager. Through the Board’s Investment Oversight Committees, Trustees also meet with selected portfolio managers of the funds the Trustees oversee and other investment personnel at various times throughout the year. The Committee and the Board also consulted with its independent fee consultant, Fund counsel and the Independent Trustees’ independent legal counsel, who advised on various matters with respect to the Committee’s and the Board’s considerations and otherwise assisted the Committee and the Board in their deliberations. On June 13, 2017, the Committee recommended that the Board approve the continuation of the Management Agreement. On June 14, 2017, the Board, including the Independent Trustees, voting separately, unanimously approved the continuation of the Management Agreement for the Fund.
The Committee and the Board considered all information that they, their legal counsel or the Investment Manager believed reasonably necessary to evaluate and to determine whether to recommend for approval or approve the continuation of the Management Agreement. The information and factors considered by the Committee and the Board in recommending for approval or approving the continuation of the Management Agreement for the Fund included the following:
| • | Information on the investment performance of the Fund relative to the performance of a group of mutual funds determined to be comparable to the Fund by an independent third-party data provider, as well as performance relative to benchmarks; |
| • | Information on the Fund’s management fees and total expenses, including information comparing the Fund’s expenses to those of a group of comparable mutual funds, as determined by the independent third-party data provider; |
| • | The Investment Manager’s agreement to contractually limit or cap total operating expenses for the Fund through February 28, 2018 so that total operating expenses (excluding certain fees and expenses, such as transaction costs and certain other investment related expenses, interest, taxes, acquired fund fees and expenses, and infrequent and/or unusual expenses) would not exceed a specified annual rate, as a percentage of the Fund’s net assets; |
| • | The terms and conditions of the Management Agreement; |
| • | The current and proposed terms and conditions of other agreements and arrangements with affiliates of the Investment Manager relating to the operations of the Fund, including agreements with respect to the provision of distribution, transfer agency and shareholder services to the Fund; |
| • | Descriptions of various functions performed by the Investment Manager under the Management Agreement, including portfolio management and portfolio trading practices; |
| • | Information regarding the management fees of similarly-managed portfolios of other clients of the Investment Manager, including institutional separate accounts; |
| • | Information regarding the reputation, regulatory history and resources of the Investment Manager, including information regarding senior management, portfolio managers and other personnel; |
| 36 | Columbia AMT-Free Massachusetts Intermediate Muni Bond Fund | Annual Report 2017 |
Board Consideration and Approval of Management
Agreement (continued)
| • | Information regarding the capabilities of the Investment Manager with respect to compliance monitoring services, including an assessment of the Investment Manager’s compliance system by the Fund’s Chief Compliance Officer; and |
| • | The profitability to the Investment Manager and its affiliates from their relationships with the Fund. |
Nature, extent and quality of services provided under the Management Agreement
The Committee and the Board considered the nature, extent and quality of services provided to the Fund by the Investment Manager and its affiliates under the Management Agreement and under separate agreements for the provision of transfer agency and shareholder services, and the resources dedicated to the Fund and the other Columbia Funds by the Investment Manager and its affiliates. The Committee and the Board considered, among other things, the Investment Manager’s ability to attract, motivate and retain highly qualified research, advisory and supervisory investment professionals (including compensation programs for personnel involved in fund management, reputation and other attributes), the portfolio management services provided by those investment professionals, and the quality of the Investment Manager’s investment research capabilities and trade execution services. The Committee and the Board also considered the potential benefits to shareholders of investing in a mutual fund that is part of a fund complex offering exposure to a variety of asset classes and investment disciplines and providing a variety of fund and shareholder services.
The Committee and the Board also considered the professional experience and qualifications of the senior personnel of the Investment Manager, which included consideration of the Investment Manager’s experience with similarly-structured funds. The Committee and the Board noted the compliance programs of and the compliance-related resources provided to the Fund by the Investment Manager and its affiliates, and considered the Investment Manager’s ability to provide administrative services to the Fund and coordinate the activities of the Fund’s other service providers. After reviewing these and related factors, the Committee and the Board concluded, within the context of their overall conclusions, that the nature, extent and quality of the services provided to the Fund under the Management Agreement supported the continuation of the Management Agreement.
Investment performance
The Committee and the Board reviewed information about the performance of the Fund over various time periods, including performance information relative to benchmarks and information that compared the performance of the Fund to the performance of a group of comparable mutual funds as determined by the independent third-party data provider, and data provided by the independent fee consultant. The Committee and the Board also reviewed a description of the third party’s methodology for identifying the Fund’s peer groups for purposes of performance and expense comparisons. Although the Fund’s performance lagged that of a relevant peer group for certain (although not necessarily all) periods, the Committee and the Board concluded that other factors relevant to performance were sufficient, in light of other considerations, to warrant continuation of the Management Agreement. Those factors included one or more of the following: (i) that the Fund’s performance, although lagging in certain recent periods, was stronger over the longer term; (ii) that the underperformance was attributable, to a significant extent, to investment decisions that were reasonable and consistent with the Fund’s investment strategy and policies and that the Fund was performing within a reasonable range of expectations, given those investment decisions, market conditions and the Fund’s investment strategy; (iii) that the Fund’s performance was competitive when compared to other relevant performance benchmarks or peer groups; and (iv) that the Investment Manager had taken or was taking steps designed to help improve the Fund’s investment performance, including, but not limited to, replacing portfolio managers, enhancing the resources supporting the portfolio managers, or modifying investment strategies.
The Committee and the Board noted that, through December 31, 2016, the Fund’s performance was in the ninety-seventh, fifty-fourth and seventy-fourth percentile (where the best performance would be in the first percentile) of its category selected by the independent third-party data provider for the purposes of performance comparisons for the one-, three- and five-year periods, respectively.
The Committee and the Board also considered the Investment Manager’s performance and reputation generally, the Investment Manager’s historical responsiveness to Board concerns about performance, and the Investment Manager’s willingness to take steps intended to improve performance. After reviewing these and related factors, the Committee and the Board concluded, within the context of their overall conclusions, that the performance of the Fund and the Investment Manager was sufficient, in light of other considerations, to warrant the continuation of the Management Agreement.
Columbia AMT-Free Massachusetts Intermediate Muni Bond Fund | Annual Report 2017
| 37 |
Board Consideration and Approval of Management
Agreement (continued)
Investment management fee rates and other expenses
The Committee and the Board considered the management fees charged to the Fund under the Management Agreement as well as the total expenses incurred by the Fund. In assessing the reasonableness of the fees under the Management Agreement, the Committee and the Board considered, among other information, the Fund’s total expense ratio as a percentage of average daily net assets. The Committee and the Board considered data provided by the independent third-party data provider and the independent fee consultant. The Committee and the Board noted that, as of December 31, 2016, the Fund’s actual management fee and net total expense ratio are ranked in the second and first quintiles, respectively, (where the lowest fees and expenses would be in the first quintile) against the Fund’s expense universe as determined by the independent third-party data provider for purposes of expense comparison. The Committee and the Board also took into account the fee waiver and expense limitation arrangements agreed to by the Investment Manager, as noted above.
The Committee and the Board also received and considered information about the management fees charged by the Investment Manager to institutional separate accounts. In considering the fees charged to those accounts, the Committee and the Board took into account, among other things, the Investment Manager’s representations about the differences between managing mutual funds as compared to other types of accounts, including differences in the services provided, differences in the risk profile of such business for the Investment Manager and the additional resources required to manage mutual funds effectively. The Committee and the Board also received and considered information about the fees charged by the Investment Manager for sub-advisory services it provides to comparable unaffiliated funds. In evaluating the Fund’s management fees, the Committee and the Board also took into account the demands, complexity and quality of the investment management of the Fund.
After reviewing these and related factors, the Committee and the Board concluded, within the context of their overall conclusions, that the management fee rates and expenses of the Fund, in light of other considerations, warranted the continuation of the Management Agreement.
Costs of services provided and profitability
The Committee and the Board also took note of the costs the Investment Manager and its affiliates incur in connection with the services provided and the profitability to the Investment Manager and its affiliates from their relationships with the Fund.
The Committee and the Board also considered the compensation directly or indirectly received by the Investment Manager’s affiliates in connection with their relationships with the Fund. The Committee and the Board reviewed information provided by management as to the profitability to the Investment Manager and its affiliates of their relationships with the Fund, information about the allocation of expenses used to calculate profitability, and comparisons of profitability levels realized in 2016 to profitability levels realized in 2015. When reviewing profitability, the Committee and the Board also considered court cases in which adviser profitability was an issue in whole or in part, the performance of similarly managed funds, the performance of the Fund, and the expense ratio of the Fund. In addition, the Committee and the Board considered information provided by the Investment Manager regarding the Investment Manager’s financial condition and comparing its profitability to that of other asset management firms that are, or are subsidiaries of, publicly traded companies. In this regard, the Committee and the Board also considered data provided by the independent fee consultant.
After reviewing these and related factors, the Committee and the Board concluded, within the context of their overall conclusions, that the costs of services provided and the profitability to the Investment Manager and its affiliates from their relationships with the Fund supported the continuation of the Management Agreement.
Economies of scale
The Committee and the Board considered the potential existence of economies of scale in the provision by the Investment Manager of services to the Fund, to groups of related funds, and to the Investment Manager’s investment advisory clients as a whole, and whether those economies of scale were shared with the Fund through breakpoints in investment management fees or other means, such as expense limitation arrangements and additional investments by the Investment Manager in investment, trading, compliance and other resources. The Committee and the Board noted that the management fee schedules for the Fund contained breakpoints that would reduce the fee rate on assets above specified threshold levels.
| 38 | Columbia AMT-Free Massachusetts Intermediate Muni Bond Fund | Annual Report 2017 |
Board Consideration and Approval of Management
Agreement (continued)
In considering these matters, the Committee and the Board also considered the costs of the services provided and the profitability to the Investment Manager and its affiliates from their relationships with the Fund, as discussed above. After reviewing these and related factors, the Committee and the Board concluded, within the context of their overall conclusions, that the extent to which any economies of scale were expected to be shared with the Fund supported the continuation of the Management Agreement.
Other benefits to the Investment Manager
The Committee and the Board received and considered information regarding “fall-out” or ancillary benefits received by the Investment Manager and its affiliates as a result of their relationships with the Fund, such as the engagement of the Investment Manager’s affiliates to provide distribution, transfer agency and shareholder services to the Fund. In this regard, among other matters, the Committee and the Board considered that the Fund’s distributor retains a portion of the distribution fees from the Fund and receives a portion of the sales charges on sales or redemptions of certain classes of shares of the Fund. The Committee and the Board also considered the benefits of research made available to the Investment Manager by reason of brokerage commissions generated by the Fund’s securities transactions, and reviewed information about the Investment Manager’s practices with respect to allocating portfolio transactions for brokerage and research services. The Committee and the Board recognized that the Investment Manager’s profitability would be somewhat lower without these benefits.
Conclusion
The Committee and the Board reviewed all of the above considerations in reaching their decisions to recommend or approve the continuation of the Management Agreement. In their deliberations, the Trustees did not identify any particular information that was all-important or controlling, and individual Trustees may have attributed different weights to the various factors. Based on their evaluation of all factors that they deemed to be material, including those factors described above, and assisted by the advice of independent legal counsel, the Board, including the Independent Trustees, voting separately, unanimously approved the continuation of the Management Agreement.
Columbia AMT-Free Massachusetts Intermediate Muni Bond Fund | Annual Report 2017
| 39 |
The Fund mails one shareholder report to each shareholder address. If you would like more than one report, please call shareholder services at 800.345.6611 and additional reports will be sent to you.
Proxy voting policies and procedures
The policy of the Board of Trustees is to vote the proxies of the companies in which the Fund holds investments consistent with the procedures as stated in the Statement of Additional Information (SAI). You may obtain a copy of the SAI without charge by calling 800.345.6611; contacting your financial intermediary; visiting investor.columbiathreadneedleus.com; or searching the website of the Securities and Exchange Commission (SEC) at sec.gov. Information regarding how the Fund voted proxies relating to portfolio securities is filed with the SEC by August 31st for the most recent 12-month period ending June 30th of that year, and is available without charge by visiting investor.columbiathreadneedleus.com, or searching the website of the SEC at sec.gov.
Quarterly schedule of investments
The Fund files a complete schedule of portfolio holdings with the SEC for the first and third quarters of each fiscal year on Form N-Q. The Fund’s Form N-Q is available on the SEC’s website at sec.gov and may be reviewed and copied at the SEC’s Public Reference Room in Washington, D.C. Information on the operation of the Public Reference Room may be obtained by calling 800.SEC.0330. The Fund’s complete schedule of portfolio holdings, as filed on Form N-Q, can also be obtained without charge, upon request, by calling 800.345.6611.
Additional Fund information
For more information about the Fund, please visit investor.columbiathreadneedleus.com or call 800.345.6611. Customer Service Representatives are available to answer your questions Monday through Friday from 8 a.m. to 7 p.m. Eastern time.
Fund investment manager
Columbia Management Investment Advisers, LLC
225 Franklin Street
Boston, MA 02110
Fund distributor
Columbia Management Investment Distributors, Inc.
225 Franklin Street
Boston, MA 02110
Fund transfer agent
Columbia Management Investment Services Corp.
P.O. Box 8081
Boston, MA 02266-8081
| 40 | Columbia AMT-Free Massachusetts Intermediate Muni Bond Fund | Annual Report 2017 |
[THIS PAGE INTENTIONALLY LEFT BLANK]
Columbia AMT-Free Massachusetts Intermediate Muni Bond Fund
P.O. Box 8081
Boston, MA 02266-8081
Please read and consider the investment objectives, risks, charges and expenses for any fund carefully before investing. For a prospectus and summary prospectus, which contains this and other important information about the Fund, go to
investor.columbiathreadneedleus.com. The Fund is distributed by Columbia Management Investment Distributors, Inc., member FINRA, and managed by Columbia Management Investment Advisers, LLC.
Columbia Threadneedle Investments (Columbia Threadneedle) is the global brand name of the Columbia and Threadneedle group of companies. All rights reserved. Columbia Management Investment Distributors, Inc., 225 Franklin Street, Boston, MA 02110-2804
© 2017 Columbia Management Investment Advisers, LLC.
investor.columbiathreadneedleus.com

Annual Report
October 31, 2017
Columbia New York Tax-Exempt Fund
Not FDIC Insured • No bank guarantee • May lose value
Dear Shareholders,
The current outlook for financial markets is clouded by two primary concerns: the high valuation of equities and the direction of interest rates. Following the U.S. presidential election, U.S. equities rallied based on the assumption that the new administration’s policies would stimulate growth quickly. Unfortunately it’s unclear whether those measures will get passed, much less passed quickly. In fixed income, uncertainty stems from the possibility that interest rates won’t rise as rapidly as expected if the administration’s proposed growth policies are not implemented.
Given this uncertainty, investors value a consistent approach more than ever. Investors want strong, repeatable risk-adjusted returns. Consistency — not surprises. As a leading global asset manager, we believe our consistent, collaborative investment approach enables us to deliver the dependable experience your portfolio demands. So, how do we strive to deliver a consistent investment experience?
Better insights
Your portfolio benefits from the investment insights uncovered by our talented investment teams around the world.
Better decisions
Our collaborative, interactive environment enables our investment teams to construct portfolios that take advantage of the best investment ideas.
Better outcomes
We aim to deliver a consistent experience, which means fewer surprises, dependable insights, and products designed to do the thing you want.
Whether you’re trying to save money to help your children go to college or for your own retirement, it’s the consistency of the return that is most essential. People who chase higher returns are usually also the first to sell when that investment goes through a bad patch. We try to combat this behavioral tendency by offering strategies that aim for a more consistent return. Our goal is for investors to panic less during periods of volatility, which can have a significant effect on their long-term results.
Nothing is more important to us than making sure those who have entrusted us to protect and grow their assets can do what matters most to them: build a nest egg, leave a legacy, and live confidently — now and throughout retirement. It’s why our talented professionals around the world work together to uncover uncommon opportunities and why our process encourages challenge and debate around our most compelling ideas to ensure better informed investment decisions, which hopefully lead to better outcomes for you.
Your success is our priority. Talk to your financial advisor about how working with Columbia Threadneedle Investments may help you position your portfolio for consistent, sustainable outcomes, no matter the market conditions.
Sincerely,
Christopher O. Petersen
President, Columbia Funds
Investors should consider the investment objectives, risks, charges and expenses of a mutual fund carefully before investing. For a free prospectus and summary prospectus, which contains this and other important information about a fund, visit investor.columbiathreadneedleus.com. The prospectus should be read carefully before investing.
Columbia Funds are distributed by Columbia Management Investment Distributors, Inc., member FINRA, and managed by Columbia Management Investment Advisers, LLC.
© 2017 Columbia Management Investment Advisers, LLC. All rights reserved.
Columbia New York Tax-Exempt Fund | Annual Report 2017
Columbia New York Tax-Exempt Fund | Annual Report 2017
Investment objective
Columbia New York Tax-Exempt Fund (the Fund) seeks total return, consisting of current income exempt from federal income tax and New York individual income tax and of capital appreciation, consistent with moderate fluctuation of principal.
Portfolio management
Catherine Stienstra
Co-manager
Managed Fund since 2010
Anders Myhran, CFA
Co-manager
Managed Fund since 2016
| Average annual total returns (%) (for the period ended October 31, 2017) |
| | | Inception | 1 Year | 5 Years | 10 Years |
| Class A | Excluding sales charges | 09/26/86 | 1.59 | 2.96 | 4.55 |
| | Including sales charges | | -1.41 | 2.34 | 4.23 |
| Class C | Excluding sales charges | 08/01/97 | 1.13 | 2.50 | 4.08 |
| | Including sales charges | | 0.15 | 2.50 | 4.08 |
| Class R4* | 03/19/13 | 1.84 | 3.20 | 4.67 |
| Class R5* | 11/08/12 | 1.98 | 3.25 | 4.70 |
| Class Y* | 03/01/17 | 1.78 | 3.00 | 4.57 |
| Class Z* | 09/01/11 | 1.84 | 3.22 | 4.71 |
| Bloomberg Barclays New York Municipal Bond Index | | 2.17 | 2.99 | 4.44 |
| Bloomberg Barclays Municipal Bond Index | | 2.19 | 3.00 | 4.50 |
Returns for Class A are shown with and without the maximum initial sales charge of 3.00%. Returns for Class C are shown with and without the 1.00% contingent deferred slaes charge for the first year only. The Fund’s other classes are not subject to sales charges and have limited eligibility. Effective November 1, 2017, Class R4, Class R5, Class Y and Class Z shares were renamed Advisor Class, Institutional 2 Class, Institutional 3 Class and Institutional Class shares, respectively. Please see the Fund’s prospectus for details. Performance for different share classes will vary based on differences in sales charges and fees associated with each class. All results shown assume reinvestment of distributions during the period. Returns do not reflect the deduction of taxes that a shareholder may pay on Fund distributions or on the redemption of Fund shares. Performance results reflect the effect of any fee waivers or reimbursements of Fund expenses by Columbia Management Investment Advisers, LLC and/or any of its affiliates. Absent these fee waivers or expense reimbursement arrangements, performance results would have been lower.
The performance information shown represents past performance and is not a guarantee of future results. The investment return and principal value of your investment will fluctuate so that your shares, when redeemed, may be worth more or less than their original cost. Current performance may be lower or higher than the performance information shown. You may obtain performance information current to the most recent month-end by contacting your financial intermediary, visiting investor.columbiathreadneedleus.com or calling 800.345.6611.
| * | The returns shown for periods prior to the share class inception date (including returns for the Life of the Fund, if shown, which are since Fund inception) include the returns of the Fund’s oldest share class. These returns are adjusted to reflect any higher class-related operating expenses of the newer share classes, as applicable. Please visit investor.columbiathreadneedleus.com/investment-products/mutual-funds/appended-performance for more information. |
The Bloomberg Barclays New York Municipal Bond Index is a subset of the Barclays Municipal Bond Index consisting solely of bonds issued by obligors located in the state of New York.
The Bloomberg Barclays Municipal Bond Index is an unmanaged index considered representative of the broad market for investment-grade, tax-exempt bonds with a maturity of at least one year.
Indices are not available for investment, are not professionally managed and do not reflect sales charges, fees, brokerage commissions, taxes or other expenses of investing. Securities in the Fund may not match those in an index.
| 2 | Columbia New York Tax-Exempt Fund | Annual Report 2017 |
Fund at a Glance (continued)
Performance of a hypothetical $10,000 investment (October 31, 2007 — October 31, 2017)
The chart above shows the change in value of a hypothetical $10,000 investment in Class A shares of Columbia New York Tax-Exempt Fund during the stated time period, and does not reflect the deduction of taxes that a shareholder may pay on Fund distributions or on the redemption of Fund shares.
| Quality breakdown (%) (at October 31, 2017) |
| AAA rating | 1.3 |
| AA rating | 38.7 |
| A rating | 37.3 |
| BBB rating | 13.2 |
| BB rating | 1.9 |
| Not rated | 7.6 |
| Total | 100.0 |
Percentages indicated are based upon total fixed income investments (excluding Money Market Funds).
Bond ratings apply to the underlying holdings of the Fund and not the Fund itself and are divided into categories ranging from highest to lowest credit quality, determined by using the middle rating of Moody’s, S&P and Fitch, after dropping the highest and lowest available ratings. When ratings are available from only two rating agencies, the lower rating is used. When a rating is available from only one rating agency, that rating is used. When a bond is not rated by any rating agency, it is designated as “Not rated.” Credit quality ratings assigned by a rating agency are subjective opinions, not statements of fact, and are subject to change, including daily. The ratings assigned by credit rating agencies are but one of the considerations that the Investment Manager and/or Fund’s subadviser incorporates into its credit analysis process, along with such other issuer-specific factors as cash flows, capital structure and leverage ratios, ability to de-leverage (repay) through free cash flow, quality of management, market positioning and access to capital, as well as such security-specific factors as the terms of the security (e.g., interest rate and time to maturity) and the amount and type of any collateral.
Columbia New York Tax-Exempt Fund | Annual Report 2017
| 3 |
Manager Discussion of Fund Performance
For the 12-month period that ended October 31, 2017, the Fund’s Class A shares returned 1.59% excluding sales charges. The Fund’s Class Z shares returned 1.84% for the same period. The Fund’s benchmark, the Bloomberg Barclays New York Municipal Bond Index, returned 2.17%, and the broad Bloomberg Barclays Municipal Bond Index returned 2.19% for the same period. While duration and yield curve positioning proved effective, credit quality positioning, sector allocation and security selection overall produced mixed results.
Tax-exempt bond market posted modest gains amid mixed macro backdrop
The tax-exempt fixed income market overall posted modest gains during the period amid mixed macro influences. The defining event of the period, though it came early on, was likely the U.S. presidential election. The market euphoria following the surprise results, driven by overnight re-evaluations around regulation, fiscal spending, inflation and pro-economic growth policies regarding health care, infrastructure spending and tax reform, sent equities higher and bond prices lower. Municipal bond yields were already under pressure from record new issue supply when the post-election sell-off in November 2016 sent the market into its worst month of total return since 2008. However, as often happens, financial markets got a little ahead of themselves and conditions started to reverse in December 2016. The Federal Reserve (the Fed) raised the targeted federal funds rate near the end of 2016, and markets barely blinked. This relative calm, along with an ongoing search for yield and Washington D.C. gridlock, tempered concerns about the potential for accelerating economic growth and higher inflation and produced positive returns in the municipal bond market in all but two months from December 2016 through October 2017, even as the Fed raised interest rates twice more — in March and June 2017. Market concerns about broad tax reform also ebbed, given proposals actively under consideration by Congress at the end of the period.
The municipal bond market was aided by subdued supply in the first ten months of 2017, down approximately 18% on a year-over-year basis, with less refunding, which was greeted by steady demand from investors, as evidenced by about $15 billion of mutual fund inflows. Despite unfunded liabilities and budgetary stress in some notable credits, municipal bond market fundamentals also remained sound, as the U.S. economy remained in a phase of steady, albeit gradual, improvement. It is also well worth noting that while New York State’s budget remained highly dependent on personal income taxes and capital gains, and its debt burden remained high, in our view, its financial and economic performance during the period was solid. New York State has well-funded pensions, healthy reserves and enacted a fiscal year 2018 budget that is conservative, holding spending growth to less than 2%.
Overall, AAA-rated municipal bond yields rose across all maturities during the period. Lower quality municipal bonds generally outperformed their higher quality counterparts. During the period, municipal bonds significantly outperformed U.S. Treasuries.
Security selection, sector allocation and credit quality positioning generated mixed results
The primary detractor from relative performance was issue selection among tobacco bonds, industrial development revenue bonds and pollution control revenue bonds. Having an overweight relative to the benchmark in the pre-refunded sector also hurt. (Pre-refunded bonds, also known as advance refunded bonds, involves a procedure in which a bond issuer floats a second bond at a lower interest rate, and the proceeds from the sale of the second bond are invested, usually in Treasury securities, which in turn, are held in escrow collateralizing the first bond. Advance refunded bonds no longer represent the credit risk profile of the original borrower, and given the high credit quality of the escrow account they often increase in value — sometimes significantly.)
On the positive side, security selection among local general obligation bonds and within the education and hospital sectors proved particularly effective during the period. Also boosting relative results was having an underweight to the local general obligations sector, which lagged the benchmark during the period. It is worth noting that the Fund did not hold any Puerto Rico bonds during the period.
From a credit quality perspective, issue selection among bonds rated A and Baa2 dampened relative results, partially offset by the positive contributions made by having underweight allocations to bonds rated AAA and AA, overweight allocations to bonds rated A and BBB and exposure to non-rated securities.
| 4 | Columbia New York Tax-Exempt Fund | Annual Report 2017 |
Manager Discussion of Fund Performance (continued)
Duration and yield curve positioning overall added value
The Fund benefited from its combined duration and yield curve positioning. The Fund had a longer duration than the benchmark, which helped as longer maturity tax-exempt bonds modestly outperformed shorter term maturities during the period. For similar reasons, having an overweight relative to the benchmark in bonds with maturities of 10 to 20 years and a relative underweight in bonds with shorter maturities contributed positively.
Fundamental analysis drove portfolio changes
We adjusted the Fund’s duration during the period as market conditions shifted, ending the period with a longer duration relative to that of the benchmark than the Fund had at the start of the period. Heading into the November 2016 U.S. elections, we were particularly cautious. We then used the post-election sell-off in the market to purchase longer maturity bonds as we sought to lock in higher yields. We subsequently reduced the Fund’s duration ahead of tax season and then extended again after it appeared that the typical seasonal pattern of increased supply did not play out. The longer duration was maintained during the summer months as we believed this would be a strong period for the market based on technical, or supply/demand, factors. In the last few months of the period, we modestly shortened the Fund’s duration ahead of a potential increase in supply and on caution regarding potentially higher rates heading into the end of 2017.
We decreased the Fund’s exposure to bonds rated A and BBB and increased the Fund’s exposure to AA-rated securities. We also modestly increased the Fund’s allocation to non-investment-grade securities as we sought to buoy the Fund’s income. From a sector perspective, we increased the Fund’s exposure to transportation bonds subject to the alternative minimum tax based on the possibility that the alternative minimum tax might be repealed with tax reform. We also added to the Fund’s positions in the local general obligation sector. We reduced the Fund’s exposure to the special tax sector.
As always, the Fund’s emphasis remains on generating both a high level of income generally exempt from federal income tax and New York state and local taxes as well as capital appreciation, consistent with moderate fluctuation of principal.
Fixed-income securities present issuer default risk. The Fund invests substantially in municipal securities and will be affected by tax, legislative, regulatory, demographic or political changes, as well as changes impacting a state’s financial, economic or other conditions. A relatively small number of tax-exempt issuers may necessitate the Fund investing more heavily in a single issuer and, therefore, be more exposed to the risk of loss than a fund that invests more broadly. The value of the Fund’s portfolio may be more volatile than a more geographically diversified fund. Prepayment and extension risk exists because the timing of payments on a loan, bond or other investment may accelerate when interest rates fall or decelerate when interest rates rise which may reduce investment opportunities and potential returns. A rise in interest rates may result in a price decline of fixed-income instruments held by the Fund, negatively impacting its performance and NAV. Falling rates may result in the Fund investing in lower yielding debt instruments, lowering the Fund’s income and yield. These risks may be heightened for longer maturity and duration securities. Non-investment-grade (high-yield or junk) securities present greater price volatility and more risk to principal and income than higher rated securities. Market risk may affect a single issuer, sector of the economy, industry or the market as a whole. Federal and state tax rules apply to capital gain distributions and any gains or losses on sales. Income may be subject to state or local taxes. Liquidity risk is associated with the difficulty of selling underlying investments at a desirable time or price. See the Fund’s prospectus for more information on these and other risks.
The views expressed in this report reflect the current views of the respective parties. These views are not guarantees of future performance and involve certain risks, uncertainties and assumptions that are difficult to predict, so actual outcomes and results may differ significantly from the views expressed. These views are subject to change at any time based upon economic, market or other conditions and the respective parties disclaim any responsibility to update such views. These views may not be relied on as investment advice and, because investment decisions for a Columbia fund are based on numerous factors, may not be relied on as an indication of trading intent on behalf of any particular Columbia fund. References to specific securities should not be construed as a recommendation or investment advice.
Columbia New York Tax-Exempt Fund | Annual Report 2017
| 5 |
Understanding Your Fund’s Expenses
(Unaudited)
As an investor, you incur two types of costs. There are transaction costs, which generally include sales charges on purchases and may include redemption fees. There are also ongoing costs, which generally include management fees, distribution and/or service fees, and other fund expenses. The following information is intended to help you understand your ongoing costs (in dollars) of investing in the Fund and to help you compare these costs with the ongoing costs of investing in other mutual funds.
Analyzing your Fund’s expenses
To illustrate these ongoing costs, we have provided examples and calculated the expenses paid by investors in each share class of the Fund during the period. The actual and hypothetical information in the table is based on an initial investment of $1,000 at the beginning of the period indicated and held for the entire period. Expense information is calculated two ways and each method provides you with different information. The amount listed in the “Actual” column is calculated using the Fund’s actual operating expenses and total return for the period. You may use the Actual information, together with the amount invested, to estimate the expenses that you paid over the period. Simply divide your account value by $1,000 (for example, an $8,600 account value divided by $1,000 = 8.6), then multiply the results by the expenses paid during the period under the “Actual” column. The amount listed in the “Hypothetical” column assumes a 5% annual rate of return before expenses (which is not the Fund’s actual return) and then applies the Fund’s actual expense ratio for the period to the hypothetical return. You should not use the hypothetical account values and expenses to estimate either your actual account balance at the end of the period or the expenses you paid during the period. See “Compare with other funds” below for details on how to use the hypothetical data.
Compare with other funds
Since all mutual funds are required to include the same hypothetical calculations about expenses in shareholder reports, you can use this information to compare the ongoing cost of investing in the Fund with other funds. To do so, compare the hypothetical example with the 5% hypothetical examples that appear in the shareholder reports of other funds. As you compare hypothetical examples of other funds, it is important to note that hypothetical examples are meant to highlight the ongoing costs of investing in a fund only and do not reflect any transaction costs, such as sales charges, or redemption or exchange fees. Therefore, the hypothetical calculations are useful in comparing ongoing costs only, and will not help you determine the relative total costs of owning different funds. If transaction costs were included in these calculations, your costs would be higher.
| May 1, 2017 — October 31, 2017 |
| | Account value at the
beginning of the
period ($) | Account value at the
end of the
period ($) | Expenses paid during
the period ($) | Fund’s annualized
expense ratio (%) |
| | Actual | Hypothetical | Actual | Hypothetical | Actual | Hypothetical | Actual |
| Class A | 1,000.00 | 1,000.00 | 1,024.10 | 1,021.40 | 4.13 | 4.12 | 0.80 |
| Class C | 1,000.00 | 1,000.00 | 1,021.80 | 1,019.11 | 6.44 | 6.43 | 1.25 |
| Class R4 | 1,000.00 | 1,000.00 | 1,025.40 | 1,022.68 | 2.84 | 2.83 | 0.55 |
| Class R5 | 1,000.00 | 1,000.00 | 1,025.40 | 1,022.68 | 2.84 | 2.83 | 0.55 |
| Class Y | 1,000.00 | 1,000.00 | 1,025.70 | 1,022.93 | 2.58 | 2.58 | 0.50 |
| Class Z | 1,000.00 | 1,000.00 | 1,026.80 | 1,022.68 | 2.84 | 2.83 | 0.55 |
Expenses paid during the period are equal to the annualized expense ratio for each class as indicated above, multiplied by the average account value over the period and then multiplied by the number of days in the Fund’s most recent fiscal half year and divided by 365.
Expenses do not include fees and expenses incurred indirectly by the Fund from its investment in underlying funds, including affiliated and non-affiliated pooled investment vehicles, such as mutual funds and exchange-traded funds.
Had Columbia Management Investment Advisers, LLC and/or certain of its affiliates not waived/reimbursed certain fees and expenses, account value at the end of the period would have been reduced.
| 6 | Columbia New York Tax-Exempt Fund | Annual Report 2017 |
Portfolio of Investments
October 31, 2017
(Percentages represent value of investments compared to net assets)
| Floating Rate Notes 1.1% |
| Issue Description | Effective
Yield | | Principal
Amount ($) | Value ($) |
| Variable Rate Demand Notes 1.1% |
| New York City Water & Sewer System(a),(b) |
| Revenue Bonds |
| 2nd General Resolution |
| VRDN Series 2016BB (State Street Bank and Trust Co.) |
| 06/15/2049 | 0.920% | | 2,300,000 | 2,300,000 |
Total Floating Rate Notes
(Cost $2,300,000) | 2,300,000 |
|
| Municipal Bonds 96.5% |
| Issue Description | Coupon
Rate | | Principal
Amount ($) | Value ($) |
| Air Transportation 2.7% |
| New York City Industrial Development Agency(c) |
| Refunding Revenue Bonds |
| Trips Obligated Group |
| Senior Series 2012A AMT |
| 07/01/2028 | 5.000% | | 2,000,000 | 2,154,740 |
| New York Transportation Development Corp.(c) |
| Refunding Revenue Bonds |
| American Airlines, Inc. |
| Series 2016 AMT |
| 08/01/2031 | 5.000% | | 1,500,000 | 1,600,560 |
| Port Authority of New York & New Jersey |
| Revenue Bonds |
| JFK International Air Terminal |
| Series 2010 |
| 12/01/2042 | 6.000% | | 2,000,000 | 2,217,240 |
| Total | 5,972,540 |
| Airport 1.4% |
| New York Transportation Development Corp.(c) |
| Revenue Bonds |
| LaGuardia Airport Terminal B Redevelopment Project |
| Series 2016 AMT |
| 07/01/2046 | 4.000% | | 3,000,000 | 3,058,830 |
| Charter Schools 1.3% |
| Build NYC Resource Corp. |
| Revenue Bonds |
| Bronx Charter School for Excellence |
| Series 2013 |
| 04/01/2033 | 5.000% | | 1,000,000 | 1,059,190 |
| International Leadership Charter School |
| Series 2013 |
| 07/01/2033 | 5.750% | | 1,500,000 | 1,465,095 |
| Municipal Bonds (continued) |
| Issue Description | Coupon
Rate | | Principal
Amount ($) | Value ($) |
| Build NYC Resource Corp.(d) |
| Revenue Bonds |
| International Leadership Charter School |
| Series 2016 |
| 07/01/2046 | 6.250% | | 265,000 | 258,086 |
| Total | 2,782,371 |
| Health Services 0.8% |
| New York State Dormitory Authority |
| Refunding Revenue Bonds |
| Icahn School of Medicine at Mount Sinai |
| Series 2015 |
| 07/01/2040 | 5.000% | | 1,500,000 | 1,675,680 |
| Higher Education 6.9% |
| Build NYC Resource Corp. |
| Refunding Revenue Bonds |
| City University of New York-Queens |
| Series 2014A |
| 06/01/2043 | 5.000% | | 1,000,000 | 1,131,360 |
| Manhattan College Project |
| Series 2017 |
| 08/01/2042 | 4.000% | | 750,000 | 780,083 |
| Geneva Development Corp. |
| Refunding Revenue Bonds |
| Hobart & William Smith College |
| Series 2012 |
| 09/01/2025 | 5.000% | | 295,000 | 340,253 |
| New York State Dormitory Authority |
| Refunding Revenue Bonds |
| New School |
| Series 2015A |
| 07/01/2050 | 5.000% | | 1,500,000 | 1,711,695 |
| Pratt Institute |
| Series 2015A |
| 07/01/2044 | 5.000% | | 1,000,000 | 1,102,790 |
| Series 2016 |
| 07/01/2039 | 5.000% | | 1,000,000 | 1,138,460 |
| Series 2016A |
| 07/01/2041 | 5.000% | | 500,000 | 574,545 |
| St. John’s University |
| Series 2015A |
| 07/01/2037 | 5.000% | | 1,000,000 | 1,145,560 |
| Teachers College |
| Series 2017 |
| 07/01/2033 | 4.000% | | 500,000 | 537,745 |
| The New School Project |
| Series 2016A |
| 07/01/2028 | 5.000% | | 500,000 | 599,980 |
The accompanying Notes to Financial Statements are an integral part of this statement.
Columbia New York Tax-Exempt Fund | Annual Report 2017
| 7 |
Portfolio of Investments (continued)
October 31, 2017
| Municipal Bonds (continued) |
| Issue Description | Coupon
Rate | | Principal
Amount ($) | Value ($) |
| Revenue Bonds |
| Consolidated City University System 5th General Resolution |
| Series 2008B |
| 07/01/2027 | 5.000% | | 1,000,000 | 1,026,120 |
| Manhattan Marymount College |
| Series 2009 |
| 07/01/2029 | 5.250% | | 1,500,000 | 1,571,535 |
| St. John’s University |
| Series 2007C (NPFGC) |
| 07/01/2026 | 5.250% | | 1,205,000 | 1,509,636 |
| Series 2012A |
| 07/01/2027 | 5.000% | | 240,000 | 273,972 |
| State University Dormitory Facilities |
| Series 2011A |
| 07/01/2031 | 5.000% | | 1,000,000 | 1,120,500 |
| Niagara Area Development Corp. |
| Revenue Bonds |
| Niagara University Project |
| Series 2012A |
| 05/01/2035 | 5.000% | | 500,000 | 551,515 |
| Total | 15,115,749 |
| Hospital 10.8% |
| Buffalo & Erie County Industrial Land Development Corp. |
| Revenue Bonds |
| Catholic Health System |
| Series 2015 |
| 07/01/2040 | 5.000% | | 1,000,000 | 1,092,290 |
| Build NYC Resource Corp. |
| Refunding Revenue Bonds |
| New York Methodist Hospital Project |
| Series 2014 |
| 07/01/2029 | 5.000% | | 225,000 | 256,347 |
| 07/01/2030 | 5.000% | | 180,000 | 204,019 |
| Dutchess County Local Development Corp. |
| Revenue Bonds |
| Health Quest Systems, Inc. |
| Series 2016B |
| 07/01/2041 | 4.000% | | 2,000,000 | 2,071,180 |
| Series 2014A |
| 07/01/2044 | 5.000% | | 1,000,000 | 1,109,110 |
| Monroe County Industrial Development Corp. |
| Refunding Revenue Bonds |
| Rochester General Hospital |
| Series 2013A |
| 12/01/2032 | 5.000% | | 1,350,000 | 1,489,401 |
| Revenue Bonds |
| Unity Hospital-Rochester Project |
| Series 2010 (FHA) |
| 08/15/2035 | 5.750% | | 2,000,000 | 2,272,200 |
| Municipal Bonds (continued) |
| Issue Description | Coupon
Rate | | Principal
Amount ($) | Value ($) |
| Nassau County Local Economic Assistance Corp. |
| Revenue Bonds |
| Catholic Health Services-Long Island |
| Series 2014 |
| 07/01/2032 | 5.000% | | 750,000 | 835,650 |
| New York State Dormitory Authority |
| Refunding Revenue Bonds |
| North Shore - Long Island Jewish Obligation Group |
| Series 2015A |
| 05/01/2037 | 5.000% | | 2,000,000 | 2,275,840 |
| NYU Hospitals Center |
| Series 2014 |
| 07/01/2036 | 5.000% | | 1,000,000 | 1,147,920 |
| Series 2016 |
| 07/01/2040 | 4.000% | | 1,000,000 | 1,045,480 |
| Revenue Bonds |
| Mount Sinai Hospital |
| Series 2010A |
| 07/01/2026 | 5.000% | | 2,275,000 | 2,492,331 |
| Series 2011A |
| 07/01/2041 | 5.000% | | 2,000,000 | 2,173,120 |
| Unrefunded Revenue Bonds |
| University of Rochester |
| Series 2009 |
| 07/01/2039 | 5.125% | | 130,000 | 138,068 |
| New York State Dormitory Authority(d) |
| Refunding Revenue Bonds |
| Orange Regional Medical Center |
| Series 2017 |
| 12/01/2037 | 5.000% | | 400,000 | 433,884 |
| Suffolk County Economic Development Corp. |
| Unrefunded Revenue Bonds |
| Catholic Health Services |
| Series 2011 |
| 07/01/2028 | 5.000% | | 2,990,000 | 3,300,182 |
| Westchester County Healthcare Corp. |
| Unrefunded Revenue Bonds |
| Senior Lien |
| Series 2010C-2 |
| 11/01/2037 | 6.125% | | 205,000 | 226,769 |
| Westchester County Local Development Corp. |
| Refunding Revenue Bonds |
| Westchester Medical Center |
| Series 2016 |
| 11/01/2037 | 3.750% | | 1,000,000 | 958,860 |
| Total | 23,522,651 |
The accompanying Notes to Financial Statements are an integral part of this statement.
| 8 | Columbia New York Tax-Exempt Fund | Annual Report 2017 |
Portfolio of Investments (continued)
October 31, 2017
| Municipal Bonds (continued) |
| Issue Description | Coupon
Rate | | Principal
Amount ($) | Value ($) |
| Human Service Provider 0.5% |
| Dutchess County Local Development Corp. |
| Revenue Bonds |
| Anderson Center Services, Inc. Project |
| Series 2010 |
| 10/01/2030 | 6.000% | | 1,000,000 | 1,023,760 |
| Independent Power 0.3% |
| Suffolk County Industrial Development Agency(c) |
| Revenue Bonds |
| Nissequogue Cogen Partners Facility |
| Series 1998 AMT |
| 01/01/2023 | 5.500% | | 700,000 | 700,287 |
| Local Appropriation 1.1% |
| New York State Dormitory Authority(e) |
| Revenue Bonds |
| Capital Appreciation-Court Facilities-Westchester |
| Series 1998 |
| 08/01/2019 | 0.000% | | 1,200,000 | 1,174,152 |
| Suffolk County Judicial Facilities Agency |
| Revenue Bonds |
| H. Lee Dennison Building |
| Series 2013 |
| 11/01/2025 | 5.000% | | 1,000,000 | 1,151,660 |
| Total | 2,325,812 |
| Local General Obligation 6.6% |
| City of New York |
| Subordinated Unlimited General Obligation Bonds |
| Series 2009I-1 |
| 04/01/2027 | 5.125% | | 1,500,000 | 1,582,500 |
| Unlimited General Obligation Bonds |
| Series 2016B1 |
| 12/01/2032 | 5.000% | | 500,000 | 597,385 |
| Series 2017B-1 |
| 10/01/2041 | 4.000% | | 1,000,000 | 1,060,490 |
| Unlimited General Obligation Refunding Bonds |
| Fiscal 2015 |
| Series 2014A |
| 08/01/2031 | 5.000% | | 500,000 | 587,325 |
| City of Syracuse(c) |
| Unlimited General Obligation Bonds |
| Airport Terminal Security Access Improvement |
| Series 2011 AMT |
| 11/01/2036 | 5.000% | | 1,750,000 | 1,853,162 |
| County of Erie |
| Limited General Obligation Bonds |
| Public Improvement |
| Series 2015A |
| 09/15/2028 | 5.000% | | 275,000 | 327,726 |
| Municipal Bonds (continued) |
| Issue Description | Coupon
Rate | | Principal
Amount ($) | Value ($) |
| County of Nassau |
| Limited General Obligation Bonds |
| Series 2017B |
| 04/01/2037 | 5.000% | | 2,000,000 | 2,302,860 |
| Limited General Obligation Refunding Bonds |
| Series 2016A |
| 01/01/2038 | 5.000% | | 1,000,000 | 1,143,830 |
| Mount Sinai Union Free School District |
| Unlimited General Obligation Refunding Bonds |
| Series 1992 (AMBAC) |
| 02/15/2019 | 6.200% | | 1,005,000 | 1,070,255 |
| New York State Dormitory Authority |
| Refunding Revenue Bonds |
| School Districts Bond Financing Program |
| Series 2016 |
| 10/01/2033 | 5.000% | | 560,000 | 655,133 |
| Revenue Bonds |
| School Districts Bond Financing Program |
| Series 2013F |
| 10/01/2021 | 5.000% | | 1,000,000 | 1,139,500 |
| Sullivan West Central School District |
| Unlimited General Obligation Refunding Bonds |
| Series 2012 |
| 04/15/2024 | 5.000% | | 500,000 | 595,380 |
| Town of Oyster Bay |
| Limited General Obligation Bonds |
| BAN Series 2016C |
| 06/01/2018 | 4.000% | | 1,500,000 | 1,516,275 |
| Total | 14,431,821 |
| Multi-Family 3.2% |
| Albany Capital Resource Corp. |
| Refunding Revenue Bonds |
| Empire Commons Student Housing |
| Series 2016 |
| 05/01/2031 | 5.000% | | 350,000 | 404,432 |
| Revenue Bonds |
| Empire Commons Student Housing |
| Series 2016 |
| 05/01/2032 | 5.000% | | 400,000 | 464,496 |
| Amherst Development Corp. |
| Refunding Revenue Bonds |
| University of Buffalo Student Housing |
| Series 2017 (AGM) |
| 10/01/2045 | 5.000% | | 500,000 | 581,005 |
| Housing Development Corp. |
| Revenue Bonds |
| Gateway Apartments |
| Series 2009A |
| 09/15/2025 | 4.500% | | 165,000 | 172,448 |
| Series 2009C-1 |
| 11/01/2034 | 5.500% | | 500,000 | 519,875 |
The accompanying Notes to Financial Statements are an integral part of this statement.
Columbia New York Tax-Exempt Fund | Annual Report 2017
| 9 |
Portfolio of Investments (continued)
October 31, 2017
| Municipal Bonds (continued) |
| Issue Description | Coupon
Rate | | Principal
Amount ($) | Value ($) |
| Series 2009M |
| 11/01/2045 | 5.150% | | 1,250,000 | 1,276,775 |
| New York State Housing Finance Agency |
| Revenue Bonds |
| Green Bond |
| Series 2017H |
| 11/01/2047 | 3.650% | | 1,360,000 | 1,357,049 |
| Onondaga Civic Development Corp. |
| Revenue Bonds |
| Upstate Properties Development, Inc. |
| Series 2011 |
| 12/01/2041 | 5.250% | | 1,945,000 | 2,201,273 |
| Total | 6,977,353 |
| Municipal Power 3.7% |
| Long Island Power Authority |
| Refunding Revenue Bonds |
| Series 2014A |
| 09/01/2044 | 5.000% | | 1,000,000 | 1,129,900 |
| Series 2016B |
| 09/01/2036 | 5.000% | | 1,000,000 | 1,157,470 |
| Revenue Bonds |
| Electric System General Purpose |
| Series 2015B |
| 09/01/2026 | 5.000% | | 1,030,000 | 1,233,919 |
| 09/01/2045 | 5.000% | | 1,380,000 | 1,567,169 |
| Series 2009A |
| 04/01/2023 | 5.000% | | 750,000 | 784,208 |
| Series 2012A |
| 09/01/2037 | 5.000% | | 2,000,000 | 2,207,900 |
| Total | 8,080,566 |
| Other Bond Issue 0.5% |
| New York City Trust for Cultural Resources |
| Refunding Revenue Bonds |
| Alvin Ailey Dance Foundation |
| Series 2016 |
| 07/01/2041 | 4.000% | | 1,075,000 | 1,112,388 |
| Other Industrial Development Bond 1.3% |
| New York Liberty Development Corp. |
| Revenue Bonds |
| Goldman Sachs Headquarters |
| Series 2007 |
| 10/01/2037 | 5.500% | | 260,000 | 343,905 |
| Onondaga County Industrial Development Agency(c) |
| Revenue Bonds |
| Bristol-Meyers Squibb Co. Project |
| Series 1994 AMT |
| 03/01/2024 | 5.750% | | 2,000,000 | 2,386,060 |
| Total | 2,729,965 |
| Municipal Bonds (continued) |
| Issue Description | Coupon
Rate | | Principal
Amount ($) | Value ($) |
| Other Revenue 1.0% |
| Brooklyn Arena Local Development Corp. |
| Refunding Revenue Bonds |
| Barclays Center Project |
| Series 2016A |
| 07/15/2042 | 5.000% | | 2,000,000 | 2,232,520 |
| Pool / Bond Bank 1.0% |
| New York State Dormitory Authority |
| Unrefunded Revenue Bonds |
| School Districts Bond Financing Program |
| Series 2009 (AGM) |
| 10/01/2036 | 5.125% | | 15,000 | 16,072 |
| New York State Environmental Facilities Corp. |
| Revenue Bonds |
| Series 2009A |
| 06/15/2034 | 5.000% | | 2,000,000 | 2,120,180 |
| Total | 2,136,252 |
| Ports 5.6% |
| Port Authority of New York & New Jersey(c) |
| Refunding Revenue Bonds |
| 193rd Series 2015 AMT |
| 10/15/2035 | 5.000% | | 3,135,000 | 3,609,169 |
| 195th Series 2016 AMT |
| 04/01/2036 | 5.000% | | 2,000,000 | 2,307,400 |
| Consolidated 186th |
| Series 2014 AMT |
| 10/15/2044 | 5.000% | | 1,000,000 | 1,126,660 |
| Port Authority of New York & New Jersey |
| Revenue Bonds |
| Consolidated 85th |
| Series 1993 |
| 03/01/2028 | 5.375% | | 2,000,000 | 2,447,580 |
| Consolidated 93rd |
| Series 1994 |
| 06/01/2094 | 6.125% | | 2,250,000 | 2,797,605 |
| Total | 12,288,414 |
| Prep School 1.3% |
| Build NYC Resource Corp. |
| Refunding Revenue Bonds |
| Series 2015 |
| 06/01/2033 | 5.000% | | 500,000 | 575,755 |
| 06/01/2035 | 5.000% | | 700,000 | 800,912 |
| New York State Dormitory Authority |
| Revenue Bonds |
| Convent-Sacred Heart |
| Series 2011 (AGM) |
| 11/01/2035 | 5.625% | | 750,000 | 850,357 |
The accompanying Notes to Financial Statements are an integral part of this statement.
| 10 | Columbia New York Tax-Exempt Fund | Annual Report 2017 |
Portfolio of Investments (continued)
October 31, 2017
| Municipal Bonds (continued) |
| Issue Description | Coupon
Rate | | Principal
Amount ($) | Value ($) |
| Rensselaer County Industrial Development Agency |
| Refunding Revenue Bonds |
| Emma Willard School Project |
| Series 2015A |
| 01/01/2036 | 5.000% | | 500,000 | 574,085 |
| Total | 2,801,109 |
| Recreation 2.4% |
| Build NYC Resource Corp. |
| Refunding Revenue Bonds |
| YMCA of Greater New York Project |
| Series 2015 |
| 08/01/2040 | 5.000% | | 900,000 | 1,014,948 |
| Revenue Bonds |
| YMCA of Greater New York Project |
| Series 2012 |
| 08/01/2032 | 5.000% | | 500,000 | 549,025 |
| New York City Industrial Development Agency |
| Revenue Bonds |
| Pilot-Queens Baseball Stadium |
| Series 2006 (AMBAC) |
| 01/01/2024 | 5.000% | | 500,000 | 501,515 |
| Pilot-Yankee Stadium |
| Series 2009 (AGM) |
| 03/01/2049 | 7.000% | | 250,000 | 268,592 |
| New York City Trust for Cultural Resources |
| Refunding Revenue Bonds |
| American Museum of Natural History |
| Series 2014S |
| 07/01/2041 | 5.000% | | 2,000,000 | 2,245,040 |
| Museum of Modern Art |
| Series 2016S |
| 04/01/2031 | 4.000% | | 500,000 | 560,860 |
| Total | 5,139,980 |
| Refunded / Escrowed 12.4% |
| Albany Industrial Development Agency |
| Prerefunded 11/15/17 Revenue Bonds |
| St. Peters Hospital Project |
| Series 2008A |
| 11/15/2027 | 5.250% | | 1,000,000 | 1,001,550 |
| Long Island Power Authority |
| Prerefunded 05/01/19 Revenue Bonds |
| Series 2008A |
| 05/01/2033 | 6.000% | | 1,000,000 | 1,072,560 |
| Metropolitan Transportation Authority |
| Prerefunded 11/15/18 Revenue Bonds |
| Series 2009A |
| 11/15/2026 | 5.300% | | 700,000 | 730,576 |
| Prerefunded 11/15/19 Revenue Bonds |
| Series 2009B |
| 11/15/2034 | 5.000% | | 1,000,000 | 1,077,470 |
| Municipal Bonds (continued) |
| Issue Description | Coupon
Rate | | Principal
Amount ($) | Value ($) |
| Nassau County Industrial Development Agency |
| Prerefunded 05/01/20 Revenue Bonds |
| New York Institute of Technology Project |
| Series 2000A |
| 03/01/2026 | 4.750% | | 1,210,000 | 1,308,119 |
| Nassau County Interim Finance Authority |
| Prerefunded 05/15/19 Revenue Bonds |
| Sales Tax Secured |
| Series 2009 |
| 11/15/2024 | 5.000% | | 235,000 | 248,921 |
| New York City Trust for Cultural Resources |
| Revenue Bonds |
| Lincoln Center |
| Escrowed to Maturity Series 2008C |
| 12/01/2018 | 5.250% | | 750,000 | 783,750 |
| New York City Water & Sewer System |
| Prerefunded 06/15/18 Revenue Bonds |
| Fiscal 2009 |
| Series 2008A |
| 06/15/2040 | 5.750% | | 230,000 | 236,698 |
| New York State Dormitory Authority |
| Prerefunded 03/01/19 Revenue Bonds |
| Teacher’s College |
| Series 2009 |
| 03/01/2039 | 5.500% | | 500,000 | 529,040 |
| Prerefunded 03/15/19 Revenue Bonds |
| Education |
| Series 2008B |
| 03/15/2036 | 5.750% | | 500,000 | 531,580 |
| Series 2009A |
| 03/15/2028 | 5.000% | | 1,545,000 | 1,626,870 |
| Prerefunded 05/01/19 Revenue Bonds |
| North Shore-Long Island Jewish Obligation Group |
| Series 2009A |
| 05/01/2037 | 5.500% | | 2,000,000 | 2,130,320 |
| Prerefunded 07/01/18 Revenue Bonds |
| Rochester Institute of Technology |
| Series 2008A |
| 07/01/2033 | 6.000% | | 1,000,000 | 1,032,780 |
| Prerefunded 07/01/19 Revenue Bonds |
| Mount Sinai School of Medicine |
| Series 2009 |
| 07/01/2039 | 5.125% | | 1,000,000 | 1,064,970 |
| Pratt Institute |
| Series 2009C (AGM) |
| 07/01/2039 | 5.125% | | 1,000,000 | 1,064,970 |
| University of Rochester |
| Series 2009 |
| 07/01/2039 | 5.125% | | 870,000 | 926,524 |
The accompanying Notes to Financial Statements are an integral part of this statement.
Columbia New York Tax-Exempt Fund | Annual Report 2017
| 11 |
Portfolio of Investments (continued)
October 31, 2017
| Municipal Bonds (continued) |
| Issue Description | Coupon
Rate | | Principal
Amount ($) | Value ($) |
| Prerefunded 07/01/20 Revenue Bonds |
| New York University Hospital Center |
| Series 2011A |
| 07/01/2031 | 5.750% | | 800,000 | 894,016 |
| The New School |
| Series 2010 |
| 07/01/2040 | 5.500% | | 1,500,000 | 1,666,485 |
| Prerefunded 10/01/19 Revenue Bonds |
| School Districts Bond Financing Program |
| Series 2009 (AGM) |
| 10/01/2036 | 5.125% | | 985,000 | 1,060,264 |
| Prerefunded 12/01/18 Revenue Bonds |
| Orange Regional Medical Center |
| Series 2008 |
| 12/01/2029 | 6.125% | | 900,000 | 948,438 |
| New York State Thruway Authority Highway & Bridge Trust Fund |
| Prerefunded 04/01/19 Revenue Bonds |
| Series 2009A-1 |
| 04/01/2029 | 5.000% | | 1,000,000 | 1,054,560 |
| Onondaga Civic Development Corp. |
| Prerefunded 07/01/19 Revenue Bonds |
| St. Joseph’s Hospital Health Center Project |
| Series 2014 |
| 07/01/2031 | 5.125% | | 1,000,000 | 1,065,820 |
| Saratoga County Industrial Development Agency |
| Prerefunded 12/01/17 Revenue Bonds |
| Saratoga Hospital Project |
| Series 2007B |
| 12/01/2032 | 5.250% | | 500,000 | 501,745 |
| Suffolk County Economic Development Corp. |
| Prerefunded 07/01/21 Revenue Bonds |
| Catholic Health Services |
| Series 2011 |
| 07/01/2028 | 5.000% | | 510,000 | 576,315 |
| Triborough Bridge & Tunnel Authority |
| Prerefunded 01/01/22 Revenue Bonds |
| General Purpose |
| Series 1999B |
| 01/01/2030 | 5.500% | | 1,800,000 | 2,065,788 |
| Westchester County Healthcare Corp. |
| Prerefunded 11/01/20 Revenue Bonds |
| Senior Lien |
| Series 2010C |
| 11/01/2037 | 6.125% | | 1,645,000 | 1,879,149 |
| Total | 27,079,278 |
| Resource Recovery 0.9% |
| Build NYC Resource Corp.(c),(d) |
| Refunding Revenue Bonds |
| Pratt Paper, Inc. Project |
| Series 2014 AMT |
| 01/01/2035 | 5.000% | | 750,000 | 804,000 |
| Municipal Bonds (continued) |
| Issue Description | Coupon
Rate | | Principal
Amount ($) | Value ($) |
| Jefferson County Industrial Development Agency(c) |
| Revenue Bonds |
| Green Bonds |
| Series 2014 AMT |
| 01/01/2024 | 5.250% | | 1,280,000 | 1,206,490 |
| Total | 2,010,490 |
| Retirement Communities 3.6% |
| Brookhaven Local Development Corp. |
| Refunding Revenue Bonds |
| Jeffersons Ferry Project |
| Series 2016 |
| 11/01/2036 | 5.250% | | 750,000 | 852,413 |
| New York State Dormitory Authority |
| Revenue Bonds |
| Miriam Osborn Memorial Home Association |
| Series 2012 |
| 07/01/2029 | 5.000% | | 1,000,000 | 1,044,300 |
| Suffolk County Economic Development Corp. |
| Refunding Revenue Bonds |
| Peconic Landing Southold |
| Series 2010 |
| 12/01/2040 | 6.000% | | 1,225,000 | 1,335,728 |
| Tompkins County Development Corp. |
| Refunding Revenue Bonds |
| Kendal at Ithaca, Inc. Project |
| Series 2014 |
| 07/01/2044 | 5.000% | | 1,800,000 | 1,906,452 |
| Ulster County Capital Resource Corp.(d),(e) |
| Refunding Revenue Bonds |
| Alliance Senior Living Co. |
| Series 2014A |
| 09/15/2044 | 0.000% | | 1,100,000 | 1,005,092 |
| Ulster County Industrial Development Agency |
| Revenue Bonds |
| Series 2007A |
| 09/15/2042 | 6.000% | | 1,750,000 | 1,738,677 |
| Total | 7,882,662 |
| Sales Tax 0.0% |
| Nassau County Interim Finance Authority |
| Unrefunded Revenue Bonds |
| Sales Tax Secured |
| Series 2009 |
| 11/15/2024 | 5.000% | | 15,000 | 15,863 |
| Single Family 0.9% |
| State of New York Mortgage Agency |
| Refunding Revenue Bonds |
| Series 2016-195 |
| 10/01/2046 | 4.000% | | 1,810,000 | 1,958,999 |
The accompanying Notes to Financial Statements are an integral part of this statement.
| 12 | Columbia New York Tax-Exempt Fund | Annual Report 2017 |
Portfolio of Investments (continued)
October 31, 2017
| Municipal Bonds (continued) |
| Issue Description | Coupon
Rate | | Principal
Amount ($) | Value ($) |
| Special Non Property Tax 2.8% |
| Metropolitan Transportation Authority(e) |
| Refunding Revenue Bonds |
| Series 2012A |
| 11/15/2032 | 0.000% | | 2,500,000 | 1,597,675 |
| New York City Transitional Finance Authority |
| Refunded Revenue Bonds |
| Future Tax Secured |
| Subordinated Series 2012B |
| 11/01/2030 | 5.000% | | 500,000 | 581,335 |
| New York City Transitional Finance Authority Building Aid |
| Revenue Bonds |
| Fiscal 2009 |
| Series 2009S-3 |
| 01/15/2022 | 5.000% | | 1,000,000 | 1,046,460 |
| Series 2009S-5 |
| 01/15/2032 | 5.000% | | 1,000,000 | 1,043,140 |
| New York Convention Center Development Corp. |
| Refunding Revenue Bonds |
| Hotel Unit Fee Secured |
| Series 2015 |
| 11/15/2045 | 5.000% | | 1,500,000 | 1,716,255 |
| Total | 5,984,865 |
| Special Property Tax 1.8% |
| Glen Cove Local Economic Assistance Corp. |
| Refunding Revenue Bonds |
| Garview Point Public Improvement Project |
| Series 2016 |
| 01/01/2056 | 5.000% | | 1,000,000 | 1,018,340 |
| Hudson Yards Infrastructure Corp. |
| Refunding Revenue Bonds |
| Series 2017A |
| 02/15/2042 | 5.000% | | 2,500,000 | 2,917,950 |
| Total | 3,936,290 |
| State Appropriated 1.5% |
| Erie County Industrial Development Agency (The) |
| Revenue Bonds |
| School District of Buffalo Project |
| Series 2011A |
| 05/01/2032 | 5.250% | | 1,000,000 | 1,122,940 |
| New York State Dormitory Authority |
| Revenue Bonds |
| Consolidated City University System 2nd Generation |
| Series 1993A |
| 07/01/2020 | 6.000% | | 2,000,000 | 2,197,300 |
| Total | 3,320,240 |
| Municipal Bonds (continued) |
| Issue Description | Coupon
Rate | | Principal
Amount ($) | Value ($) |
| Student Loan 0.0% |
| State of New York Mortgage Agency |
| Revenue Bonds |
| New York State Higher Education Finance |
| Series 2009 |
| 11/01/2026 | 4.750% | | 75,000 | 77,836 |
| Tobacco 2.4% |
| Chautauqua Tobacco Asset Securitization Corp. |
| Refunding Revenue Bonds |
| Series 2014 |
| 06/01/2034 | 5.000% | | 1,000,000 | 1,054,360 |
| New York Counties Tobacco Trust VI |
| Refunding Revenue Bonds |
| Tobacco Settlement Pass-Through |
| Series 2016 |
| 06/01/2051 | 5.000% | | 2,000,000 | 2,063,280 |
| TSASC, Inc. |
| Refunding Revenue Bonds |
| Series 2017A |
| 06/01/2041 | 5.000% | | 2,000,000 | 2,204,680 |
| Total | 5,322,320 |
| Transportation 7.3% |
| Metropolitan Transportation Authority |
| Refunding Revenue Bonds |
| Series 2015F |
| 11/15/2033 | 5.000% | | 2,500,000 | 2,948,450 |
| Revenue Bonds |
| Green Bonds |
| Series 2016A-1 |
| 11/15/2041 | 5.000% | | 1,000,000 | 1,143,950 |
| Series 2005B (AMBAC) |
| 11/15/2023 | 5.250% | | 1,250,000 | 1,504,338 |
| Series 2011D |
| 11/15/2036 | 5.000% | | 1,000,000 | 1,126,940 |
| Series 2012E |
| 11/15/2031 | 5.000% | | 2,000,000 | 2,297,440 |
| Transportation |
| Series 2010D |
| 11/15/2034 | 5.000% | | 1,350,000 | 1,488,024 |
| Series 2014B |
| 11/15/2044 | 5.000% | | 2,000,000 | 2,284,220 |
| Series 2015B |
| 11/15/2040 | 5.000% | | 1,675,000 | 1,926,233 |
| Transportation Program |
| Subordinated Series 2015A-1 |
| 11/15/2045 | 5.000% | | 1,000,000 | 1,142,690 |
| Total | 15,862,285 |
The accompanying Notes to Financial Statements are an integral part of this statement.
Columbia New York Tax-Exempt Fund | Annual Report 2017
| 13 |
Portfolio of Investments (continued)
October 31, 2017
| Municipal Bonds (continued) |
| Issue Description | Coupon
Rate | | Principal
Amount ($) | Value ($) |
| Turnpike / Bridge / Toll Road 6.2% |
| New York State Thruway Authority |
| Revenue Bonds |
| General |
| Series 2012I |
| 01/01/2032 | 5.000% | | 2,000,000 | 2,253,880 |
| Junior Lien |
| Series 2016A |
| 01/01/2037 | 4.000% | | 4,165,000 | 4,335,640 |
| Series 2014J |
| 01/01/2041 | 5.000% | | 3,000,000 | 3,349,560 |
| Triborough Bridge & Tunnel Authority |
| Refunding Revenue Bonds |
| General Purpose |
| Series 2016A |
| 11/15/2041 | 5.000% | | 3,000,000 | 3,505,440 |
| Total | 13,444,520 |
| Water & Sewer 4.3% |
| New York City Water & Sewer System |
| Refunding Revenue Bonds |
| 2nd General Resolution |
| Series 2016 |
| 06/15/2033 | 4.000% | | 1,570,000 | 1,723,310 |
| Series 2011AA |
| 06/15/2044 | 5.000% | | 1,000,000 | 1,113,860 |
| Municipal Bonds (continued) |
| Issue Description | Coupon
Rate | | Principal
Amount ($) | Value ($) |
| Revenue Bonds |
| Series 2008CC |
| 06/15/2034 | 5.000% | | 3,500,000 | 3,587,535 |
| Series 2009EE |
| 06/15/2040 | 5.250% | | 500,000 | 531,290 |
| Unrefunded Revenue Bonds |
| Fiscal 2009 |
| Series 2008A |
| 06/15/2040 | 5.750% | | 770,000 | 792,084 |
| Niagara Falls Public Water Authority |
| Revenue Bonds |
| Series 2013A |
| 07/15/2029 | 5.000% | | 1,000,000 | 1,141,780 |
| Rensselaer County Water Service & Sewer Authority |
| Revenue Bonds |
| Water Service |
| Series 2008 |
| 09/01/2038 | 5.250% | | 535,000 | 544,780 |
| Total | 9,434,639 |
Total Municipal Bonds
(Cost $199,441,520) | 210,438,335 |
Total Investments
(Cost: $201,741,520) | 212,738,335 |
| Other Assets & Liabilities, Net | | 5,212,518 |
| Net Assets | 217,950,853 |
Notes to Portfolio of Investments
| (a) | The Fund is entitled to receive principal and interest from the guarantor after a day or a week’s notice or upon maturity. The maturity date disclosed represents the final maturity. |
| (b) | Represents a variable rate demand note where the coupon rate adjusts on specified dates (generally daily or weekly) using the prevailing money market rate. |
| (c) | Income from this security may be subject to alternative minimum tax. |
| (d) | Represents privately placed and other securities and instruments exempt from SEC registration (collectively, private placements), such as Section 4(a)(2) and Rule 144A eligible securities, which are often sold only to qualified institutional buyers. The Fund may invest in private placements determined to be liquid as well as those determined to be illiquid. Private placements may be determined to be liquid under guidelines established by the Fund’s Board of Trustees. At October 31, 2017, the value of these securities amounted to $2,501,062, which represents 1.15% of net assets. |
| (e) | Zero coupon bond. |
Abbreviation Legend
| AGM | Assured Guaranty Municipal Corporation |
| AMBAC | Ambac Assurance Corporation |
| AMT | Alternative Minimum Tax |
| BAN | Bond Anticipation Note |
| FHA | Federal Housing Authority |
| NPFGC | National Public Finance Guarantee Corporation |
| VRDN | Variable Rate Demand Note |
The accompanying Notes to Financial Statements are an integral part of this statement.
| 14 | Columbia New York Tax-Exempt Fund | Annual Report 2017 |
Portfolio of Investments (continued)
October 31, 2017
Fair value measurements
The Fund categorizes its fair value measurements according to a three-level hierarchy that maximizes the use of observable inputs and minimizes the use of unobservable inputs by prioritizing that the most observable input be used when available. Observable inputs are those that market participants would use in pricing an investment based on market data obtained from sources independent of the reporting entity. Unobservable inputs are those that reflect the Fund’s assumptions about the information market participants would use in pricing an investment. An investment’s level within the fair value hierarchy is based on the lowest level of any input that is deemed significant to the asset’s or liability’s fair value measurement. The input levels are not necessarily an indication of the risk or liquidity associated with investments at that level. For example, certain U.S. government securities are generally high quality and liquid, however, they are reflected as Level 2 because the inputs used to determine fair value may not always be quoted prices in an active market.
Fair value inputs are summarized in the three broad levels listed below:
| • | Level 1 – Valuations based on quoted prices for investments in active markets that the Fund has the ability to access at the measurement date. Valuation adjustments are not applied to Level 1 investments. |
| • | Level 2 – Valuations based on other significant observable inputs (including quoted prices for similar securities, interest rates, prepayment speeds, credit risks, etc.). |
| • | Level 3 – Valuations based on significant unobservable inputs (including the Fund’s own assumptions and judgment in determining the fair value of investments). |
Inputs that are used in determining fair value of an investment may include price information, credit data, volatility statistics, and other factors. These inputs can be either observable or unobservable. The availability of observable inputs can vary between investments, and is affected by various factors such as the type of investment, and the volume and level of activity for that investment or similar investments in the marketplace. The inputs will be considered by the Investment Manager, along with any other relevant factors in the calculation of an investment’s fair value. The Fund uses prices and inputs that are current as of the measurement date, which may include periods of market dislocations. During these periods, the availability of prices and inputs may be reduced for many investments. This condition could cause an investment to be reclassified between the various levels within the hierarchy.
Investments falling into the Level 3 category are primarily supported by quoted prices from brokers and dealers participating in the market for those investments. However, these may be classified as Level 3 investments due to lack of market transparency and corroboration to support these quoted prices. Additionally, valuation models may be used as the pricing source for any remaining investments classified as Level 3. These models may rely on one or more significant unobservable inputs and/or significant assumptions by the Investment Manager. Inputs used in valuations may include, but are not limited to, financial statement analysis, capital account balances, discount rates and estimated cash flows, and comparable company data.
Under the direction of the Fund’s Board of Trustees (the Board), the Investment Manager’s Valuation Committee (the Committee) is responsible for overseeing the valuation procedures approved by the Board. The Committee consists of voting and non-voting members from various groups within the Investment Manager’s organization, including operations and accounting, trading and investments, compliance, risk management and legal.
The Committee meets at least monthly to review and approve valuation matters, which may include a description of specific valuation determinations, data regarding pricing information received from approved pricing vendors and brokers and the results of Board-approved valuation control policies and procedures (the Policies). The Policies address, among other things, instances when market quotations are or are not readily available, including recommendations of third party pricing vendors and a determination of appropriate pricing methodologies; events that require specific valuation determinations and assessment of fair value techniques; securities with a potential for stale pricing, including those that are illiquid, restricted, or in default; and the effectiveness of third party pricing vendors, including periodic reviews of vendors. The Committee meets more frequently, as needed, to discuss additional valuation matters, which may include the need to review back-testing results, review time-sensitive information or approve related valuation actions. The Committee reports to the Board, with members of the Committee meeting with the Board at each of its regularly scheduled meetings to discuss valuation matters and actions during the period, similar to those described earlier.
For investments categorized as Level 3, the Committee monitors information similar to that described above, which may include: (i) data specific to the issuer or comparable issuers, (ii) general market or specific sector news and (iii) quoted prices and specific or similar security transactions. The Committee considers this data and any changes from prior periods in order to assess the reasonableness of observable and unobservable inputs, any assumptions or internal models used to value those securities and changes in fair value. This data is also used to corroborate, when available, information received from approved pricing vendors and brokers. Various factors impact the frequency of monitoring this information (which may occur as often as daily). However, the Committee may determine that changes to inputs, assumptions and models are not required as a result of the monitoring procedures performed.
The following table is a summary of the inputs used to value the Fund’s investments at October 31, 2017:
| | Level 1
quoted prices in active
markets for identical
assets ($) | Level 2
other significant
observable inputs ($) | Level 3
significant
unobservable inputs ($) | Total ($) |
| Investments | | | | |
| Floating Rate Notes | — | 2,300,000 | — | 2,300,000 |
| Municipal Bonds | — | 210,438,335 | — | 210,438,335 |
| Total Investments | — | 212,738,335 | — | 212,738,335 |
See the Portfolio of Investments for all investment classifications not indicated in the table.
The Fund’s assets assigned to the Level 2 input category are generally valued using the market approach, in which a security’s value is determined through reference to prices and information from market transactions for similar or identical assets.
There were no transfers of financial assets between levels during the period.
The accompanying Notes to Financial Statements are an integral part of this statement.
Columbia New York Tax-Exempt Fund | Annual Report 2017
| 15 |
Statement of Assets and Liabilities
October 31, 2017
| Assets | |
| Investments in unaffiliated issuers, at cost | $201,741,520 |
| Investments in unaffiliated issuers, at value | 212,738,335 |
| Cash | 3,017,098 |
| Receivable for: | |
| Capital shares sold | 720,602 |
| Interest | 3,118,160 |
| Expense reimbursement due from Investment Manager | 14 |
| Prepaid expenses | 1,197 |
| Trustees’ deferred compensation plan | 48,555 |
| Total assets | 219,643,961 |
| Liabilities | |
| Payable for: | |
| Capital shares purchased | 1,008,713 |
| Distributions to shareholders | 578,956 |
| Management services fees | 2,811 |
| Distribution and/or service fees | 1,466 |
| Transfer agent fees | 9,357 |
| Compensation of board members | 139 |
| Compensation of chief compliance officer | 8 |
| Other expenses | 43,103 |
| Trustees’ deferred compensation plan | 48,555 |
| Total liabilities | 1,693,108 |
| Net assets applicable to outstanding capital stock | $217,950,853 |
| Represented by | |
| Paid in capital | 206,233,491 |
| Undistributed net investment income | 650,454 |
| Accumulated net realized gain | 70,093 |
| Unrealized appreciation (depreciation) on: | |
| Investments - unaffiliated issuers | 10,996,815 |
| Total - representing net assets applicable to outstanding capital stock | $217,950,853 |
| Class A | |
| Net assets | $134,601,553 |
| Shares outstanding | 18,058,620 |
| Net asset value per share | $7.45 |
| Maximum offering price per share(a) | $7.68 |
| Class C | |
| Net assets | $27,971,984 |
| Shares outstanding | 3,754,664 |
| Net asset value per share | $7.45 |
| Class R4 | |
| Net assets | $2,518,084 |
| Shares outstanding | 338,357 |
| Net asset value per share | $7.44 |
| Class R5 | |
| Net assets | $6,497,482 |
| Shares outstanding | 874,592 |
| Net asset value per share | $7.43 |
| Class Y | |
| Net assets | $105,061 |
| Shares outstanding | 14,104 |
| Net asset value per share | $7.45 |
| Class Z | |
| Net assets | $46,256,689 |
| Shares outstanding | 6,210,621 |
| Net asset value per share | $7.45 |
The accompanying Notes to Financial Statements are an integral part of this statement.
| 16 | Columbia New York Tax-Exempt Fund | Annual Report 2017 |
Statement of Assets and Liabilities (continued)
October 31, 2017
| (a) | The maximum offering price per share is calculated by dividing the net asset value per share by 1.0 minus the maximum sales charge of 3.00% for Class A shares. |
The accompanying Notes to Financial Statements are an integral part of this statement.
Columbia New York Tax-Exempt Fund | Annual Report 2017
| 17 |
Statement of Operations
Year Ended October 31, 2017
| Net investment income | |
| Income: | |
| Interest | $8,776,264 |
| Total income | 8,776,264 |
| Expenses: | |
| Management services fees | 1,028,510 |
| Distribution and/or service fees | |
| Class A | 370,617 |
| Class B(a) | 981 |
| Class C | 290,216 |
| Transfer agent fees | |
| Class A | 106,303 |
| Class B(a) | 73 |
| Class C | 20,775 |
| Class R4 | 679 |
| Class R5 | 2,112 |
| Class Y(b) | 3 |
| Class Z | 26,276 |
| Compensation of board members | 22,493 |
| Custodian fees | 2,804 |
| Printing and postage fees | 22,554 |
| Registration fees | 24,222 |
| Audit fees | 32,488 |
| Legal fees | 6,243 |
| Compensation of chief compliance officer | 96 |
| Other | 18,250 |
| Total expenses | 1,975,695 |
| Fees waived or expenses reimbursed by Investment Manager and its affiliates | (122,135) |
| Fees waived by distributor | |
| Class C | (87,092) |
| Fees waived by transfer agent | |
| Class R5 | (443) |
| Class Y(b) | (3) |
| Expense reduction | (160) |
| Total net expenses | 1,765,862 |
| Net investment income | 7,010,402 |
| Realized and unrealized gain (loss) — net | |
| Net realized gain (loss) on: | |
| Investments — unaffiliated issuers | 409,274 |
| Net realized gain | 409,274 |
| Net change in unrealized appreciation (depreciation) on: | |
| Investments — unaffiliated issuers | (4,506,392) |
| Net change in unrealized appreciation (depreciation) | (4,506,392) |
| Net realized and unrealized loss | (4,097,118) |
| Net increase in net assets resulting from operations | $2,913,284 |
| (a) | Effective July 17, 2017, Class B shares were automatically converted to Class A shares. |
| (b) | Class Y shares are based on operations from March 1, 2017 (commencement of operations) through the stated period end. |
The accompanying Notes to Financial Statements are an integral part of this statement.
| 18 | Columbia New York Tax-Exempt Fund | Annual Report 2017 |
Statement of Changes in Net Assets
| | Year Ended
October 31, 2017 (a) | Year Ended
October 31, 2016 |
| Operations | | |
| Net investment income | $7,010,402 | $6,767,469 |
| Net realized gain | 409,274 | 197,700 |
| Net change in unrealized appreciation (depreciation) | (4,506,392) | 1,626,192 |
| Net increase in net assets resulting from operations | 2,913,284 | 8,591,361 |
| Distributions to shareholders | | |
| Net investment income | | |
| Class A | (4,691,145) | (5,224,520) |
| Class B(b) | (2,379) | (5,046) |
| Class C | (788,155) | (669,262) |
| Class R4 | (34,265) | (4,119) |
| Class R5 | (120,187) | (3,456) |
| Class Y | (513) | — |
| Class Z | (1,264,946) | (736,314) |
| Net realized gains | | |
| Class A | (235,506) | (373,161) |
| Class B(b) | (199) | (655) |
| Class C | (39,875) | (48,551) |
| Class R4 | (445) | (102) |
| Class R5 | (520) | (26) |
| Class Z | (32,751) | (43,669) |
| Total distributions to shareholders | (7,210,886) | (7,108,881) |
| Increase (decrease) in net assets from capital stock activity | (14,179,137) | 51,199,867 |
| Total increase (decrease) in net assets | (18,476,739) | 52,682,347 |
| Net assets at beginning of year | 236,427,592 | 183,745,245 |
| Net assets at end of year | $217,950,853 | $236,427,592 |
| Undistributed net investment income | $650,454 | $541,642 |
| (a) | Class Y shares are based on operations from March 1, 2017 (commencement of operations) through the stated period end. |
| (b) | Effective July 17, 2017, Class B shares were automatically converted to Class A shares. |
The accompanying Notes to Financial Statements are an integral part of this statement.
Columbia New York Tax-Exempt Fund | Annual Report 2017
| 19 |
Statement of Changes in Net Assets (continued)
| | Year Ended | Year Ended |
| | October 31, 2017 (a) | October 31, 2016 |
| | Shares | Dollars ($) | Shares | Dollars ($) |
| Capital stock activity |
| Class A(b) | | | | |
| Subscriptions (c) | 1,941,575 | 14,363,560 | 5,795,791 | 44,303,703 |
| Distributions reinvested | 575,053 | 4,248,591 | 620,952 | 4,738,843 |
| Redemptions | (8,123,570) | (59,661,667) | (2,362,101) | (18,062,839) |
| Net increase (decrease) | (5,606,942) | (41,049,516) | 4,054,642 | 30,979,707 |
| Class B(b) | | | | |
| Subscriptions | 163 | 1,201 | 241 | 1,839 |
| Distributions reinvested | 19 | 138 | 285 | 2,169 |
| Redemptions (c) | (20,124) | (150,052) | (20,395) | (153,891) |
| Net decrease | (19,942) | (148,713) | (19,869) | (149,883) |
| Class C | | | | |
| Subscriptions | 674,249 | 4,974,906 | 1,672,997 | 12,783,341 |
| Distributions reinvested | 87,453 | 646,379 | 69,162 | 528,007 |
| Redemptions | (1,011,697) | (7,491,898) | (292,720) | (2,230,912) |
| Net increase (decrease) | (249,995) | (1,870,613) | 1,449,439 | 11,080,436 |
| Class R4 | | | | |
| Subscriptions | 310,382 | 2,307,386 | 32,428 | 250,650 |
| Distributions reinvested | 4,626 | 34,345 | 501 | 3,837 |
| Redemptions | (15,037) | (110,379) | — | — |
| Net increase | 299,971 | 2,231,352 | 32,929 | 254,487 |
| Class R5 | | | | |
| Subscriptions | 887,417 | 6,541,450 | 49,897 | 385,310 |
| Distributions reinvested | 16,199 | 120,343 | 405 | 3,095 |
| Redemptions | (80,710) | (600,842) | — | — |
| Net increase | 822,906 | 6,060,951 | 50,302 | 388,405 |
| Class Y | | | | |
| Subscriptions | 14,974 | 111,587 | — | — |
| Distributions reinvested | 38 | 279 | — | — |
| Redemptions | (908) | (6,772) | — | — |
| Net increase | 14,104 | 105,094 | — | — |
| Class Z | | | | |
| Subscriptions | 4,017,550 | 29,462,507 | 1,370,822 | 10,481,242 |
| Distributions reinvested | 119,342 | 883,974 | 58,794 | 449,662 |
| Redemptions | (1,335,606) | (9,854,173) | (299,596) | (2,284,189) |
| Net increase | 2,801,286 | 20,492,308 | 1,130,020 | 8,646,715 |
| Total net increase (decrease) | (1,938,612) | (14,179,137) | 6,697,463 | 51,199,867 |
| (a) | Class Y shares are based on operations from March 1, 2017 (commencement of operations) through the stated period end. |
| (b) | Effective July 17, 2017, Class B shares were automatically converted to Class A shares. |
| (c) | Includes conversions of Class B shares to Class A shares, if any. |
The accompanying Notes to Financial Statements are an integral part of this statement.
| 20 | Columbia New York Tax-Exempt Fund | Annual Report 2017 |
[THIS PAGE INTENTIONALLY LEFT BLANK]
Columbia New York Tax-Exempt Fund | Annual Report 2017
| 21 |
The following table is intended to help you understand the Fund’s financial performance. Certain information reflects financial results for a single share of a class held for the periods shown. Per share net investment income (loss) amounts are calculated based on average shares outstanding during the period. Total return assumes reinvestment of all dividends and distributions, if any. Total return does not reflect payment of sales charges, if any. Total return and portfolio turnover are not annualized for periods of less than one year. The portfolio turnover rate is calculated without regard to purchase and sales transactions of short-term instruments and certain derivatives, if any. If such transactions were included, the Fund’s portfolio turnover rate may be higher.
| Year ended | Net asset value,
beginning of
period | Net
investment
income | Net
realized
and
unrealized
gain (loss) | Total from
investment
operations | Distributions
from net
investment
income | Distributions
from net
realized
gains |
| Class A |
| 10/31/2017 | $7.58 | 0.24 | (0.13) | 0.11 | (0.23) | (0.01) |
| 10/31/2016 | $7.50 | 0.24 | 0.10 | 0.34 | (0.24) | (0.02) |
| 10/31/2015 | $7.51 | 0.27 | (0.01) | 0.26 | (0.27) | — |
| 10/31/2014 | $7.21 | 0.27 | 0.35 | 0.62 | (0.27) | (0.05) |
| 10/31/2013 | $7.76 | 0.27 | (0.51) | (0.24) | (0.27) | (0.04) |
| Class C |
| 10/31/2017 | $7.58 | 0.20 | (0.12) | 0.08 | (0.20) | (0.01) |
| 10/31/2016 | $7.50 | 0.21 | 0.09 | 0.30 | (0.20) | (0.02) |
| 10/31/2015 | $7.51 | 0.24 | (0.02) | 0.22 | (0.23) | — |
| 10/31/2014 | $7.21 | 0.24 | 0.35 | 0.59 | (0.24) | (0.05) |
| 10/31/2013 | $7.76 | 0.23 | (0.51) | (0.28) | (0.23) | (0.04) |
| Class R4 |
| 10/31/2017 | $7.57 | 0.26 | (0.13) | 0.13 | (0.25) | (0.01) |
| 10/31/2016 | $7.49 | 0.25 | 0.11 | 0.36 | (0.26) | (0.02) |
| 10/31/2015 | $7.50 | 0.29 | (0.02) | 0.27 | (0.28) | — |
| 10/31/2014 | $7.20 | 0.29 | 0.35 | 0.64 | (0.29) | (0.05) |
| 10/31/2013 (d) | $7.63 | 0.18 | (0.43) | (0.25) | (0.18) | — |
| Class R5 |
| 10/31/2017 | $7.55 | 0.26 | (0.12) | 0.14 | (0.25) | (0.01) |
| 10/31/2016 | $7.48 | 0.25 | 0.10 | 0.35 | (0.26) | (0.02) |
| 10/31/2015 | $7.49 | 0.29 | (0.01) | 0.28 | (0.29) | — |
| 10/31/2014 | $7.20 | 0.29 | 0.34 | 0.63 | (0.29) | (0.05) |
| 10/31/2013 (f) | $7.79 | 0.28 | (0.55) | (0.27) | (0.28) | (0.04) |
| Class Y |
| 10/31/2017 (g) | $7.33 | 0.17 | 0.12 (h) | 0.29 | (0.17) | — |
The accompanying Notes to Financial Statements are an integral part of this statement.
| 22 | Columbia New York Tax-Exempt Fund | Annual Report 2017 |
Total
distributions to
shareholders | Net
asset
value,
end of
period | Total
return | Total gross
expense
ratio to
average
net assets(a) | Total net
expense
ratio to
average
net assets(a),(b) | Net investment
income
ratio to
average
net assets | Portfolio
turnover | Net
assets,
end of
period
(000’s) |
| |
| (0.24) | $7.45 | 1.59% | 0.85% | 0.79% (c) | 3.21% | 7% | $134,602 |
| (0.26) | $7.58 | 4.53% | 0.91% | 0.80% (c) | 3.17% | 9% | $179,419 |
| (0.27) | $7.50 | 3.46% | 0.92% | 0.78% (c) | 3.60% | 11% | $147,143 |
| (0.32) | $7.51 | 8.80% | 0.92% | 0.78% (c) | 3.73% | 11% | $147,024 |
| (0.31) | $7.21 | (3.20%) | 0.91% | 0.78% (c) | 3.57% | 15% | $145,384 |
| |
| (0.21) | $7.45 | 1.13% | 1.60% | 1.24% (c) | 2.76% | 7% | $27,972 |
| (0.22) | $7.58 | 4.07% | 1.66% | 1.25% (c) | 2.69% | 9% | $30,350 |
| (0.23) | $7.50 | 3.00% | 1.67% | 1.23% (c) | 3.15% | 11% | $19,165 |
| (0.29) | $7.51 | 8.32% | 1.66% | 1.23% (c) | 3.28% | 11% | $16,578 |
| (0.27) | $7.21 | (3.64%) | 1.66% | 1.23% (c) | 3.12% | 15% | $16,254 |
| |
| (0.26) | $7.44 | 1.84% | 0.59% | 0.55% (c) | 3.46% | 7% | $2,518 |
| (0.28) | $7.57 | 4.80% | 0.66% | 0.56% (c) | 3.32% | 9% | $291 |
| (0.28) | $7.49 | 3.72% | 0.67% | 0.53% (c) | 3.86% | 11% | $41 |
| (0.34) | $7.50 | 9.09% | 0.65% | 0.53% (c) | 3.95% | 11% | $10 |
| (0.18) | $7.20 | (3.35%) | 0.69% (e) | 0.53% (c),(e) | 3.88% (e) | 15% | $2 |
| |
| (0.26) | $7.43 | 1.98% | 0.59% | 0.54% | 3.46% | 7% | $6,497 |
| (0.28) | $7.55 | 4.71% | 0.60% | 0.51% | 3.33% | 9% | $390 |
| (0.29) | $7.48 | 3.76% | 0.58% | 0.49% | 3.89% | 11% | $10 |
| (0.34) | $7.49 | 8.98% | 0.62% | 0.49% | 4.13% | 11% | $10 |
| (0.32) | $7.20 | (3.52%) | 0.62% (e) | 0.50% (e) | 3.85% (e) | 15% | $2 |
| |
| (0.17) | $7.45 | 4.00% | 0.54% (e) | 0.50% (e) | 3.62% (e) | 7% | $105 |
Columbia New York Tax-Exempt Fund | Annual Report 2017
| 23 |
Financial Highlights (continued)
| Year ended | Net asset value,
beginning of
period | Net
investment
income | Net
realized
and
unrealized
gain (loss) | Total from
investment
operations | Distributions
from net
investment
income | Distributions
from net
realized
gains |
| Class Z |
| 10/31/2017 | $7.58 | 0.26 | (0.13) | 0.13 | (0.25) | (0.01) |
| 10/31/2016 | $7.50 | 0.26 | 0.10 | 0.36 | (0.26) | (0.02) |
| 10/31/2015 | $7.51 | 0.29 | (0.02) | 0.27 | (0.28) | — |
| 10/31/2014 | $7.21 | 0.29 | 0.35 | 0.64 | (0.29) | (0.05) |
| 10/31/2013 | $7.76 | 0.29 | (0.51) | (0.22) | (0.29) | (0.04) |
| Notes to Financial Highlights |
| (a) | In addition to the fees and expenses that the Fund bears directly, the Fund indirectly bears a pro rata share of the fees and expenses of any other funds in which it invests. Such indirect expenses are not included in the Fund’s reported expense ratios. |
| (b) | Total net expenses include the impact of certain fee waivers/expense reimbursements made by the Investment Manager and certain of its affiliates, if applicable. |
| (c) | The benefits derived from expense reductions had an impact of less than 0.01%. |
| (d) | Class R4 shares commenced operations on March 19, 2013. Per share data and total return reflect activity from that date. |
| (e) | Annualized. |
| (f) | Class R5 shares commenced operations on November 8, 2012. Per share data and total return reflect activity from that date. |
| (g) | Class Y shares commenced operations on March 1, 2017. Per share data and total return reflect activity from that date. |
| (h) | Calculation of the net gain (loss) per share (both realized and unrealized) does not correlate to the aggregate realized and unrealized gain (loss) presented in the Statement of Operations due to the timing of subscriptions and redemptions of Fund shares in relation to fluctuations in the market value of the portfolio. |
The accompanying Notes to Financial Statements are an integral part of this statement.
| 24 | Columbia New York Tax-Exempt Fund | Annual Report 2017 |
Total
distributions to
shareholders | Net
asset
value,
end of
period | Total
return | Total gross
expense
ratio to
average
net assets(a) | Total net
expense
ratio to
average
net assets(a),(b) | Net investment
income
ratio to
average
net assets | Portfolio
turnover | Net
assets,
end of
period
(000’s) |
| |
| (0.26) | $7.45 | 1.84% | 0.60% | 0.55% (c) | 3.48% | 7% | $46,257 |
| (0.28) | $7.58 | 4.79% | 0.66% | 0.55% (c) | 3.40% | 9% | $25,827 |
| (0.28) | $7.50 | 3.72% | 0.67% | 0.53% (c) | 3.85% | 11% | $17,088 |
| (0.34) | $7.51 | 9.07% | 0.67% | 0.53% (c) | 3.98% | 11% | $13,961 |
| (0.33) | $7.21 | (2.96%) | 0.65% | 0.53% (c) | 3.86% | 15% | $7,791 |
Columbia New York Tax-Exempt Fund | Annual Report 2017
| 25 |
Notes to Financial Statements
October 31, 2017
Note 1. Organization
Columbia New York Tax-Exempt Fund (the Fund), a series of Columbia Funds Series Trust I (the Trust), is a non-diversified fund. The Trust is registered under the Investment Company Act of 1940, as amended (the 1940 Act), as an open-end management investment company organized as a Massachusetts business trust.
Fund shares
The Trust may issue an unlimited number of shares (without par value). Although all share classes generally have identical voting, dividend and liquidation rights, each share class votes separately when required by the Trust’s organizational documents or by law. Different share classes pay different distribution amounts to the extent the expenses of such share classes differ, and distributions in liquidation will be proportional to the net asset value of each share class. Each share class has its own expense and sales charge structure. The Fund offers each of the share classes identified below.
Class A shares are subject to a maximum front-end sales charge of 3.00% based on the initial investment amount. Class A shares purchased without an initial sales charge are subject to a contingent deferred sales charge (CDSC) of 0.75% on certain investments of $500,000 or more if redeemed within 12 months after purchase.
Class B shares of the Fund are no longer offered for sale. When available, Class B shares were subject to a maximum CDSC of 5.00% based upon the holding period after purchase. Effective July 17, 2017, Class B shares were automatically converted to Class A shares without a CDSC. On August 4, 2017, the capital owned by Columbia Management Investment Advisers, LLC in Class B shares was redeemed without a CDSC.
Class C shares are subject to a 1.00% CDSC on shares redeemed within 12 months after purchase.
Class R4 shares are not subject to sales charges and are generally available only to omnibus retirement plans and certain investors as described in the Fund’s prospectus. Effective November 1, 2017, Class R4 shares were renamed Advisor Class shares.
Class R5 shares are not subject to sales charges and are generally available only to investors purchasing through authorized investment professionals and omnibus retirement plans as described in the Fund’s prospectus. Effective November 1, 2017, Class R5 shares were renamed Institutional 2 Class shares.
Class Y shares are not subject to sales charges and are available to institutional and certain other investors as described in the Fund’s prospectus. Class Y shares commenced operations on March 1, 2017. Effective November 1, 2017, Class Y shares were renamed Institutional 3 Class shares.
Class Z shares are not subject to sales charges and are generally available only to eligible investors, which are subject to different investment minimums as described in the Fund’s prospectus. Effective November 1, 2017, Class Z shares were renamed Institutional Class shares.
Note 2. Summary of significant accounting policies
Basis of preparation
The Fund is an investment company that applies the accounting and reporting guidance in the Financial Accounting Standards Board (FASB) Accounting Standards Codification Topic 946, Financial Services - Investment Companies (ASC 946). The financial statements are prepared in accordance with U.S. generally accepted accounting principles (GAAP), which requires management to make certain estimates and assumptions that affect the reported amounts of assets and liabilities, the disclosure of contingent assets and liabilities at the date of the financial statements and the reported amounts of income and expenses during the reporting period. Actual results could differ from those estimates.
The following is a summary of significant accounting policies followed by the Fund in the preparation of its financial statements.
| 26 | Columbia New York Tax-Exempt Fund | Annual Report 2017 |
Notes to Financial Statements (continued)
October 31, 2017
Security valuation
Debt securities generally are valued by pricing services approved by the Board of Trustees based upon market transactions for normal, institutional-size trading units of similar securities. The services may use various pricing techniques that take into account, as applicable, factors such as yield, quality, coupon rate, maturity, type of issue, trading characteristics and other data, as well as approved independent broker-dealer quotes. Debt securities for which quotations are not readily available or not believed to be reflective of market value may also be valued based upon a bid quote from an approved independent broker-dealer. Debt securities maturing in 60 days or less are valued primarily at amortized cost value, unless this method results in a valuation that management believes does not approximate market value.
Investments for which market quotations are not readily available, or that have quotations which management believes are not reflective of market value or reliable, are valued at fair value as determined in good faith under procedures approved by and under the general supervision of the Board of Trustees. If a security or class of securities (such as foreign securities) is valued at fair value, such value is likely to be different from the quoted or published price for the security.
The determination of fair value often requires significant judgment. To determine fair value, management may use assumptions including but not limited to future cash flows and estimated risk premiums. Multiple inputs from various sources may be used to determine fair value.
GAAP requires disclosure regarding the inputs and valuation techniques used to measure fair value and any changes in valuation inputs or techniques. In addition, investments shall be disclosed by major category. This information is disclosed following the Fund’s Portfolio of Investments.
Security transactions
Security transactions are accounted for on the trade date. Cost is determined and gains (losses) are based upon the specific identification method for both financial statement and federal income tax purposes.
Income recognition
Interest income is recorded on an accrual basis. Market premiums and discounts, including original issue discounts, are amortized and accreted, respectively, over the expected life of the security on all debt securities, unless otherwise noted.
The Fund may place a debt security on non-accrual status and reduce related interest income when it becomes probable that the interest will not be collected and the amount of uncollectible interest can be reasonably estimated. A defaulted debt security is removed from non-accrual status when the issuer resumes interest payments or when collectibility of interest is reasonably assured.
Expenses
General expenses of the Trust are allocated to the Fund and other funds of the Trust based upon relative net assets or other expense allocation methodologies determined by the nature of the expense. Expenses directly attributable to the Fund are charged to the Fund. Expenses directly attributable to a specific class of shares are charged to that share class.
Determination of class net asset value
All income, expenses (other than class-specific expenses, which are charged to that share class, as shown in the Statement of Operations) and realized and unrealized gains (losses) are allocated to each class of the Fund on a daily basis, based on the relative net assets of each class, for purposes of determining the net asset value of each class.
Federal income tax status
The Fund intends to qualify each year as a regulated investment company under Subchapter M of the Internal Revenue Code, as amended, and will distribute substantially all of its net tax-exempt and investment company taxable income and net capital gain, if any, for its tax year, and as such will not be subject to federal income taxes. In addition, the Fund intends to distribute in each calendar year substantially all of its ordinary income, capital gain net income and certain other amounts, if any, such that the Fund should not be subject to federal excise tax. Therefore, no federal income or excise tax provision is recorded.
Columbia New York Tax-Exempt Fund | Annual Report 2017
| 27 |
Notes to Financial Statements (continued)
October 31, 2017
Distributions to shareholders
Distributions from net investment income, if any, are declared daily and paid monthly. Net realized capital gains, if any, are distributed at least annually. Income distributions and capital gain distributions are determined in accordance with federal income tax regulations, which may differ from GAAP.
Guarantees and indemnifications
Under the Trust’s organizational documents and, in some cases, by contract, its officers and trustees are indemnified against certain liabilities arising out of the performance of their duties to the Trust or its funds. In addition, certain of the Fund’s contracts with its service providers contain general indemnification clauses. The Fund’s maximum exposure under these arrangements is unknown since the amount of any future claims that may be made against the Fund cannot be determined, and the Fund has no historical basis for predicting the likelihood of any such claims.
Recent accounting pronouncement
Accounting Standards Update 2017-08 Premium Amortization on Purchased Callable Debt Securities
In March 2017, the Financial Accounting Standards Board issued Accounting Standards Update (ASU) No. 2017-08 Premium Amortization on Purchased Callable Debt Securities. ASU No. 2017-08 updates the accounting standards to shorten the amortization period for certain purchased callable debt securities, held at a premium, to be amortized to the earliest call date. The update applies to securities with explicit, noncontingent call features that are callable at fixed prices and on preset dates. The standard is effective for annual periods beginning after December 15, 2018 and interim periods within those fiscal years. At this time, management is evaluating the implication of this guidance and the impact it will have on the financial statement amounts and footnote disclosures, if any.
Note 3. Fees and other transactions with affiliates
Management services fees
The Fund has entered into a Management Agreement with Columbia Management Investment Advisers, LLC (the Investment Manager), a wholly-owned subsidiary of Ameriprise Financial, Inc. (Ameriprise Financial). Under the Management Agreement, the Investment Manager provides the Fund with investment research and advice, as well as administrative and accounting services. The management services fee is an annual fee that is equal to a percentage of the Fund’s daily net assets that declines from 0.47% to 0.31% as the Fund’s net assets increase. The effective management services fee rate for the year ended October 31, 2017 was 0.47% of the Fund’s average daily net assets.
Compensation of board members
Members of the Board of Trustees, who are not officers or employees of the Investment Manager or Ameriprise Financial, are compensated for their services to the Fund as disclosed in the Statement of Operations. These members of the Board of Trustees may participate in a Deferred Compensation Plan (the Plan) which may be terminated at any time. Obligations of the Plan will be paid solely out of the Fund’s assets, and all amounts payable under the Plan constitute a general unsecured obligation of the Fund.
Compensation of Chief Compliance Officer
The Board of Trustees has appointed a Chief Compliance Officer to the Fund in accordance with federal securities regulations. A portion of the Chief Compliance Officer’s total compensation is allocated to the Fund, along with other affiliated funds governed by the Board of Trustees, based on relative net assets. The total amount allocated to all affiliated funds governed by the Board of Trustees will not exceed $40,000 annually.
| 28 | Columbia New York Tax-Exempt Fund | Annual Report 2017 |
Notes to Financial Statements (continued)
October 31, 2017
Transfer agency fees
Under a Transfer and Dividend Disbursing Agent Agreement, Columbia Management Investment Services Corp. (the Transfer Agent), an affiliate of the Investment Manager and a wholly-owned subsidiary of Ameriprise Financial, is responsible for providing transfer agency services to the Fund. The Transfer Agent has contracted with DST Asset Manager Solutions, Inc. (DST) to serve as sub-transfer agent. The Transfer Agent pays the fees of DST for services as sub-transfer agent and DST is not entitled to reimbursement for such fees from the Fund (with the exception of out-of-pocket fees).
The Fund pays the Transfer Agent a monthly transfer agency fee based on the number or the average value of accounts, depending on the type of account. In addition, the Fund pays the Transfer Agent a fee for shareholder services based on the number of accounts or on a percentage of the average aggregate value of the Fund’s shares maintained in omnibus accounts up to the lesser of the amount charged by the financial intermediary or a cap established by the Board of Trustees from time to time.
The Transfer Agent also receives compensation from the Fund for various shareholder services and reimbursements for certain out-of-pocket fees. Effective August 1, 2017, total transfer agency fees for Class R5 and Class Y shares are subject to an annual limitation of not more than 0.07% and 0.02%, respectively, of the average daily net assets attributable to each share class. From January 1, 2017 to July 31, 2017, these limitations were 0.075% for Class R5 shares and 0.025% for Class Y shares. Prior to January 1, 2017, the limitation was 0.05% for Class R5 shares. In addition, effective March 1, 2017 through February 28, 2018, Class R5 shares are subject to a contractual transfer agency fee annual limitation of not more than 0.05% and Class Y shares are subject to a contractual transfer agency fee annual limitation of not more than 0.00% of the average daily net assets attributable to each share class.
For the year ended October 31, 2017, the Fund’s effective transfer agency fee rates as a percentage of average daily net assets of each class were as follows:
| | Effective rate (%) |
| Class A | 0.07 |
| Class B | 0.06 (a),(b) |
| Class C | 0.07 |
| Class R4 | 0.07 |
| Class R5 | 0.05 |
| Class Y | 0.00 (c) |
| Class Z | 0.07 |
| (a) | Effective July 17, 2017, Class B shares were automatically converted to Class A shares. |
| (b) | Unannualized. |
| (c) | Annualized. |
The Fund and certain other associated investment companies have severally, but not jointly, guaranteed the performance and observance of all the terms and conditions of a lease entered into by Seligman Data Corp. (SDC), the former transfer agent, including the payment of rent by SDC (the Guaranty). SDC was the legacy Seligman funds’ former transfer agent.
The lease and the Guaranty expire in January 2019. At October 31, 2017, the Fund’s total potential future obligation over the life of the Guaranty is $17,684. The liability remaining at October 31, 2017 for non-recurring charges associated with the lease amounted to $7,654 and is recorded as a part of the payable for other expenses in the Statement of Assets and Liabilities.
An annual minimum account balance fee of $20 may apply to certain accounts with a value below the applicable share class’s initial minimum investment requirements to reduce the impact of small accounts on transfer agency fees. These minimum account balance fees are remitted to the Fund and recorded as part of expense reductions in the Statement of Operations. For the year ended October 31, 2017, these minimum account balance fees reduced total expenses of the Fund by $160.
Columbia New York Tax-Exempt Fund | Annual Report 2017
| 29 |
Notes to Financial Statements (continued)
October 31, 2017
Distribution and service fees
The Fund has entered into an agreement with Columbia Management Investment Distributors, Inc. (the Distributor), an affiliate of the Investment Manager and a wholly-owned subsidiary of Ameriprise Financial, for distribution and shareholder services. The Board of Trustees has approved, and the Fund has adopted, distribution and shareholder service plans (the Plans) applicable to certain share classes, which set the distribution and service fees for the Fund. These fees are calculated daily and are intended to compensate the Distributor and/or eligible selling and/or servicing agents for selling shares of the Fund and providing services to investors.
Under the Plans, the Fund pays a monthly service fee to the Distributor at the maximum annual rate of 0.25% of the average daily net assets attributable to Class A, Class B and Class C shares of the Fund. Also under the Plans, the Fund pays a monthly distribution fee to the Distributor at the maximum annual rates of 0.75% of the average daily net assets attributable to Class B and Class C shares of the Fund. As a result of all Class B shares of the Fund being redeemed or converted to Class A shares, August 4, 2017 was the last day the Fund paid a service fee or distribution fee for Class B shares.
The Distributor has voluntarily agreed to waive a portion of the distribution fee for Class C shares so that the distribution fee does not exceed 0.45% annually of the average daily net assets attributable to Class C shares. This arrangement may be modified or terminated by the Distributor at any time.
Sales charges (unaudited)
Sales charges, including front-end charges and CDSCs, received by the Distributor for distributing Fund shares for the year ended October 31, 2017, if any, are listed below:
| | Amount ($) |
| Class A | 62,246 |
| Class C | 4,944 |
Expenses waived/reimbursed by the Investment Manager and its affiliates
The Investment Manager and certain of its affiliates have contractually agreed to waive fees and/or reimburse expenses (excluding certain fees and expenses described below) for the period(s) disclosed below, unless sooner terminated at the sole discretion of the Board of Trustees, so that the Fund’s net operating expenses, after giving effect to fees waived/expenses reimbursed and any balance credits and/or overdraft charges from the Fund’s custodian, do not exceed the following annual rate(s) as a percentage of the class’ average daily net assets:
| | March 1, 2017
through
February 28, 2018 | Prior to
March 1, 2017 |
| Class A | 0.80% | 0.81% |
| Class C | 1.55 | 1.56 |
| Class R4 | 0.55 | 0.56 |
| Class R5 | 0.55 | 0.51 |
| Class Y | 0.50 | — |
| Class Z | 0.55 | 0.56 |
Under the agreement governing these fee waivers and/or expense reimbursement arrangements, the following fees and expenses are excluded from the waiver/reimbursement commitment, and therefore will be paid by the Fund, if applicable: taxes (including foreign transaction taxes), expenses associated with investments in affiliated and non-affiliated pooled investment vehicles (including mutual funds and exchange-traded funds), transaction costs and brokerage commissions, costs related to any securities lending program, dividend expenses associated with securities sold short, inverse floater program fees and expenses, transaction charges and interest on borrowed money, interest, infrequent and/or unusual expenses and any other expenses the exclusion of which is specifically approved by the Board of Trustees. This agreement may be modified or amended only with approval from the Investment Manager, certain of its affiliates and the Fund. In addition to the contractual agreement, the Investment Manager and certain of its affiliates have voluntarily agreed to waive fees and/or reimburse Fund expenses (excluding certain fees and expenses described above) so that Fund level
| 30 | Columbia New York Tax-Exempt Fund | Annual Report 2017 |
Notes to Financial Statements (continued)
October 31, 2017
expenses (expenses directly attributable to the Fund and not to a specific share class) are waived proportionately across all share classes, but the Fund’s net operating expenses shall not exceed the contractual annual rates listed in the table above. This arrangement may be revised or discontinued at any time. Reflected in the contractual cap commitment, effective March 1, 2017 through February 28, 2018, is the Transfer Agent’s contractual agreement to limit total transfer agency fees to an annual rate of not more than 0.05% for Class R5 and 0.00% for Class Y of the average daily net assets attributable to each share class, unless sooner terminated at the sole discretion of the Board of Trustees. Any fees waived and/or expenses reimbursed under the expense reimbursement arrangements described above are not recoverable by the Investment Manager or its affiliates in future periods. Class C distribution fees waived by the Distributor, as discussed above, are in addition to the waiver/reimbursement commitment under the agreement.
Note 4. Federal tax information
The timing and character of income and capital gain distributions are determined in accordance with income tax regulations, which may differ from GAAP because of temporary or permanent book to tax differences.
At October 31, 2017, these differences are primarily due to differing treatment for deferral/reversal of wash sale losses, tax straddles, trustees’ deferred compensation, distributions and principal and/or interest from fixed income securities. To the extent these differences are permanent, reclassifications are made among the components of the Fund’s net assets in the Statement of Assets and Liabilities. Temporary differences do not require reclassifications.
The Fund did not have any permanent differences; therefore, no reclassifications were made to the Statement of Assets and Liabilities.
The tax character of distributions paid during the years indicated was as follows:
| Year Ended October 31, 2017 | Year Ended October 31, 2016 |
Ordinary
income ($) | Tax-exempt
income ($) | Long-term
capital gains ($) | Total ($) | Ordinary
income ($) | Tax-exempt
income ($) | Long-term
capital gains ($) | Total ($) |
| 26,506 | 6,875,084 | 309,296 | 7,210,886 | 11,970 | 6,630,747 | 466,164 | 7,108,881 |
Short-term capital gain distributions, if any, are considered ordinary income distributions for tax purposes.
At October 31, 2017, the components of distributable earnings on a tax basis were as follows:
Undistributed
ordinary income ($) | Undistributed tax-
exempt income ($) | Undistributed
long-term
capital gains ($) | Capital loss
carryforwards ($) | Net unrealized
appreciation ($) |
| — | 692,391 | 371,159 | — | 11,281,323 |
At October 31, 2017, the cost of all investments for federal income tax purposes along with the aggregate gross unrealized appreciation and depreciation based on that cost was:
Federal
tax cost ($) | Gross unrealized
appreciation ($) | Gross unrealized
(depreciation) ($) | Net unrealized
appreciation ($) |
| 201,457,012 | 12,168,173 | (886,850) | 11,281,323 |
Tax cost of investments and unrealized appreciation/(depreciation) may also include timing differences that do not constitute adjustments to tax basis.
Management of the Fund has concluded that there are no significant uncertain tax positions in the Fund that would require recognition in the financial statements. However, management’s conclusion may be subject to review and adjustment at a later date based on factors including, but not limited to, new tax laws, regulations, and administrative interpretations (including relevant court decisions). Generally, the Fund’s federal tax returns for the prior three fiscal years remain subject to examination by the Internal Revenue Service.
Columbia New York Tax-Exempt Fund | Annual Report 2017
| 31 |
Notes to Financial Statements (continued)
October 31, 2017
Note 5. Portfolio information
The cost of purchases and proceeds from sales of securities, excluding short-term investments and derivatives, if any, aggregated to $14,333,845 and $23,255,476, respectively, for the year ended October 31, 2017. The amount of purchase and sale activity impacts the portfolio turnover rate reported in the Financial Highlights.
Note 6. Line of credit
The Fund has access to a revolving credit facility with a syndicate of banks led by Citibank, N.A., HSBC Bank USA, N.A. and JPMorgan Chase Bank, N.A. whereby the Fund may borrow for the temporary funding of shareholder redemptions or for other temporary or emergency purposes. The credit facility, which is a collective agreement between the Fund and certain other funds managed by the Investment Manager, severally and not jointly, permits collective borrowings up to $1 billion. Interest is charged to each participating fund based on its borrowings at a rate equal to the higher of (i) the overnight federal funds rate plus 1.00% or (ii) the one-month LIBOR rate plus 1.00%. Each borrowing under the credit facility matures no later than 60 days after the date of borrowing. The Fund also pays a commitment fee equal to its pro rata share of the amount of the credit facility at a rate of 0.15% per annum. The commitment fee is included in other expenses in the Statement of Operations.
The Fund had no borrowings during the year ended October 31, 2017.
Note 7. Significant risks
Credit risk
Credit risk is the risk that the value of debt securities in the Fund’s portfolio may decline because the issuer may default and fail to pay interest or repay principal when due. Rating agencies assign credit ratings to debt securities to indicate their credit risk. Lower rated or unrated debt securities held by the Fund may present increased credit risk as compared to higher-rated debt securities.
Geographic concentration risk
Because the Fund invests substantially in municipal securities issued by the state identified in the Fund’s name and political sub-divisions of that state, the Fund will be particularly affected by adverse tax, legislative, regulatory, demographic or political changes as well as changes impacting the state’s financial, economic or other condition and prospects. In addition, because of the relatively small number of issuers of tax-exempt securities in the state, the Fund may invest a higher percentage of assets in a single issuer and, therefore, be more exposed to the risk of loss than a fund that invests more broadly. The value of municipal and other securities owned by the Fund also may be adversely affected by future changes in federal or state income tax laws.
Interest rate risk
Interest rate risk is the risk of losses attributable to changes in interest rates. In general, if prevailing interest rates rise, the values of debt securities tend to fall, and if interest rates fall, the values of debt securities tend to rise. Actions by governments and central banking authorities can result in increases in interest rates. Increasing interest rates may negatively affect the value of debt securities held by the Fund, resulting in a negative impact on the Fund’s performance and net asset value per share. In general, the longer the maturity or duration of a debt security, the greater its sensitivity to changes in interest rates.
Liquidity risk
Liquidity risk is the risk associated with a lack of marketability of investments which may make it difficult to sell the investment at a desirable time or price. Changing regulatory, market or other conditions or environments (for example, the interest rate or credit environments) may adversely affect the liquidity of the Fund’s investments. The Fund may have to accept a lower selling price for the holding, sell other investments, or forego another, more appealing investment opportunity. Generally, the less liquid the market at the time the Fund sells a portfolio investment, the greater the risk of loss or decline of value to the Fund. A less liquid market can lead to an increase in Fund redemptions, which may negatively impact Fund performance and net asset value per share, including, for example, if the Fund is forced to sell securities in a down market.
| 32 | Columbia New York Tax-Exempt Fund | Annual Report 2017 |
Notes to Financial Statements (continued)
October 31, 2017
Non-diversification risk
A non-diversified fund is permitted to invest a greater percentage of its total assets in fewer issuers than a diversified fund. The Fund may, therefore, have a greater risk of loss from a few issuers than a similar fund that invests more broadly.
Shareholder concentration risk
At October 31, 2017, one unaffiliated shareholder of record owned 10.3% of the outstanding shares of the Fund in one or more accounts. The Fund has no knowledge about whether any portion of those shares was owned beneficially. Affiliated shareholders of record owned 30.3% of the outstanding shares of the Fund in one or more accounts. Subscription and redemption activity by concentrated accounts may have a significant effect on the operations of the Fund. In the case of a large redemption, the Fund may be forced to sell investments at inopportune times, including its liquid positions, which may result in Fund losses and the Fund holding a higher percentage of less liquid positions. Large redemptions could result in decreased economies of scale and increased operating expenses for non-redeeming Fund shareholders.
Note 8. Subsequent events
Management has evaluated the events and transactions that have occurred through the date the financial statements were issued. Other than as noted in Note 1 above, there were no items requiring adjustment of the financial statements or additional disclosure.
Note 9. Information regarding pending and settled legal proceedings
Ameriprise Financial and certain of its affiliates have historically been involved in a number of legal, arbitration and regulatory proceedings, including routine litigation, class actions, and governmental actions, concerning matters arising in connection with the conduct of their business activities. Ameriprise Financial believes that the Fund is not currently the subject of, and that neither Ameriprise Financial nor any of its affiliates are the subject of, any pending legal, arbitration or regulatory proceedings that are likely to have a material adverse effect on the Fund or the ability of Ameriprise Financial or its affiliates to perform under their contracts with the Fund. Ameriprise Financial is required to make quarterly (10-Q), annual (10-K) and, as necessary, 8-K filings with the Securities and Exchange Commission (SEC) on legal and regulatory matters that relate to Ameriprise Financial and its affiliates. Copies of these filings may be obtained by accessing the SEC website at www.sec.gov.
There can be no assurance that these matters, or the adverse publicity associated with them, will not result in increased Fund redemptions, reduced sale of Fund shares or other adverse consequences to the Fund. Further, although we believe proceedings are not likely to have a material adverse effect on the Fund or the ability of Ameriprise Financial or its affiliates to perform under their contracts with the Fund, these proceedings are subject to uncertainties and, as such, we are unable to estimate the possible loss or range of loss that may result. An adverse outcome in one or more of these proceedings could result in adverse judgments, settlements, fines, penalties or other relief that could have a material adverse effect on the consolidated financial condition or results of operations of Ameriprise Financial.
Columbia New York Tax-Exempt Fund | Annual Report 2017
| 33 |
Report of Independent Registered Public Accounting Firm
To the Trustees of Columbia Funds Series Trust I and the Shareholders of Columbia New York Tax-Exempt Fund
In our opinion, the accompanying statement of assets and liabilities, including the portfolio of investments, and the related statements of operations and of changes in net assets and the financial highlights present fairly, in all material respects, the financial position of Columbia New York Tax-Exempt Fund (the “Fund”, a series of Columbia Funds Series Trust I) as of October 31, 2017, the results of its operations for the year then ended, the changes in its net assets for each of the two years in the period then ended and the financial highlights for each of the periods indicated therein, in conformity with accounting principles generally accepted in the United States of America. These financial statements and financial highlights (hereafter referred to as “financial statements”) are the responsibility of the Fund’s management. Our responsibility is to express an opinion on these financial statements based on our audits. We conducted our audits of these financial statements in accordance with the standards of the Public Company Accounting Oversight Board (United States). Those standards require that we plan and perform the audit to obtain reasonable assurance about whether the financial statements are free of material misstatement. An audit includes examining, on a test basis, evidence supporting the amounts and disclosures in the financial statements, assessing the accounting principles used and significant estimates made by management, and evaluating the overall financial statement presentation. We believe that our audits, which included confirmation of securities as of October 31, 2017 by correspondence with the custodian, provide a reasonable basis for our opinion.
/s/ PricewaterhouseCoopers LLP
Minneapolis, MN
December 21, 2017
| 34 | Columbia New York Tax-Exempt Fund | Annual Report 2017 |
Federal Income Tax Information
(Unaudited)
The Fund hereby designates the following tax attributes for the fiscal year ended October 31, 2017. Shareholders will be notified in early 2018 of the amounts for use in preparing 2017 income tax returns.
Capital
gain
dividend | Exempt-
interest
dividends |
| $410,817 | 99.62% |
Capital gain dividend. The Fund designates as a capital gain dividend the amount reflected above, or if subsequently determined to be different, the net capital gain of such fiscal period.
Exempt-interest dividends. The percentage of net investment income distributed during the fiscal year that qualifies as exempt-interest dividends for federal income tax purposes. A portion of the income may be subject to federal alternative minimum tax.
Columbia New York Tax-Exempt Fund | Annual Report 2017
| 35 |
Shareholders elect the Board that oversees the Fund’s operations. The Board appoints officers who are responsible for day-to-day business decisions based on policies set by the Board. The following table provides basic biographical information about the Fund’s Trustees, including their principal occupations during the past five years, although specific titles for individuals may have varied over the period. The year set forth beneath Length of Service in the table below is the year in which the Trustee was first appointed or elected as Trustee to any Fund currently in the Columbia Funds Complex or a predecessor thereof. Under current Board policy, members serve terms of indefinite duration.
Independent trustees
| Name, address, year of birth | Position held with the Trust and length of service | Principal occupation(s) during the past five years and other relevant professional experience | Number of Funds in the Columbia Fund Complex overseen | Other directorships held by Trustee during the past five years |
Janet Langford Carrig
c/o Columbia Management
Investment Advisers, LLC
225 Franklin Street
Mail Drop BX32 05228
Boston, MA 02110
1957 | Trustee
1996 | Senior Vice President, General Counsel and Corporate Secretary, ConocoPhillips (independent energy company) since September 2007 | 66 | None |
Douglas A. Hacker
c/o Columbia Management
Investment Advisers, LLC
225 Franklin Street
Mail Drop BX32 05228
Boston, MA 02110
1955 | Trustee and Chairman of the Board
1996 | Independent business executive since May 2006; Executive Vice President — Strategy of United Airlines from December 2002 to May 2006; President of UAL Loyalty Services (airline marketing company) from September 2001 to December 2002; Executive Vice President and Chief Financial Officer of United Airlines from July 1999 to September 2001 | 66 | Spartan Nash Company, (food distributor); Nash Finch Company (food distributor) from 2005 to 2013; Aircastle Limited (aircraft leasing); SeaCube Container Leasing Ltd. (container leasing) from 2010 to 2013; and Travelport Worldwide Limited (travel information technology) |
Nancy T. Lukitsh
c/o Columbia Management
Investment Advisers, LLC
225 Franklin Street
Mail Drop BX32 05228
Boston, MA 02110
1956 | Trustee
2011 | Senior Vice President, Partner and Director of Marketing, Wellington Management Company, LLP (investment adviser) from 1997 to 2010; Chair, Wellington Management Portfolios (commingled non-U.S. investment pools) from 2007 to 2010; Director, Wellington Trust Company, NA and other Wellington affiliates from 1997 to 2010 | 66 | None |
David M. Moffett
c/o Columbia Management
Investment Advisers, LLC
225 Franklin Street
Mail Drop BX32 05228
Boston, MA 02110
1952 | Trustee
2011 | Retired. Consultant to Bridgewater and Associates | 66 | Director, CSX Corporation; Genworth Financial, Inc. (financial and insurance products and services); PayPal Holdings Inc. (payment and data processing services); Trustee, University of Oklahoma Foundation; former Director, eBay Inc. (online trading community), 2007-2015; and former Director, CIT Bank, CIT Group Inc. (commercial and consumer finance), 2010-2016 |
| 36 | Columbia New York Tax-Exempt Fund | Annual Report 2017 |
TRUSTEES AND OFFICERS (continued)
Independent trustees (continued)
| Name, address, year of birth | Position held with the Trust and length of service | Principal occupation(s) during the past five years and other relevant professional experience | Number of Funds in the Columbia Fund Complex overseen | Other directorships held by Trustee during the past five years |
Charles R. Nelson
c/o Columbia Management
Investment Advisers, LLC
225 Franklin Street
Mail Drop BX32 05228
Boston, MA 02110
1942 | Trustee
1981 | Retired. Professor Emeritus, University of Washington since 2011; Professor of Economics, University of Washington from 1976 to 2011; Ford and Louisa Van Voorhis Professor of Political Economy, University of Washington from 1993 to 2011; Adjunct Professor of Statistics, University of Washington from 1980 to 2011; Associate Editor, Journal of Money, Credit and Banking from September 1993 to 2008; consultant on econometric and statistical matters | 66 | None |
John J. Neuhauser
c/o Columbia Management
Investment Advisers, LLC
225 Franklin Street
Mail Drop BX32 05228
Boston, MA 02110
1943 | Trustee
1984 | President, Saint Michael’s College since August 2007; Director or Trustee of several non-profit organizations, including University of Vermont Medical Center; Academic Vice President and Dean of Faculties, Boston College from August 1999 to October 2005; University Professor, Boston College from November 2005 to August 2007 | 66 | Liberty All-Star Equity Fund and Liberty All- Star Growth Fund (closed-end funds) |
Patrick J. Simpson
c/o Columbia Management
Investment Advisers, LLC
225 Franklin Street
Mail Drop BX32 05228
Boston, MA 02110
1944 | Trustee
2000 | Of Counsel, Perkins Coie LLP (law firm) since 2015; Partner, Perkins Coie LLP from 1988 to 2014 | 66 | None |
Anne-Lee Verville
c/o Columbia Management
Investment Advisers, LLC
225 Franklin Street
Mail Drop BX32 05228
Boston, MA 02110
1945 | Trustee
1998 | Retired. General Manager, Global Education Industry from 1994 to 1997, President – Application Systems Division from 1991 to 1994, Chief Financial Officer – US Marketing & Services from 1988 to 1991, and Chief Information Officer from 1987 to 1988, IBM Corporation (computer and technology) | 66 | Enesco Group, Inc. (producer of giftware and home and garden decor products) from 2001 to 2006 |
Columbia New York Tax-Exempt Fund | Annual Report 2017
| 37 |
TRUSTEES AND OFFICERS (continued)
Consultants to the Independent Trustees*
| Name, address, year of birth | Position held with the Trust and length of service | Principal occupation(s) during the past five years and other relevant professional experience | Number of Funds in the Columbia Funds complex overseen | Other directorships held by Trustee during the past five years |
J. Kevin Connaughton
c/o Columbia
Management Investment
Advisers, LLC,
225 Franklin Street
Mail Drop BX32 05228,
Boston, MA 02110
1964 | Independent Trustee Consultant
2016 | Independent Trustee Consultant, Columbia Funds since March 2016; Managing Director and General Manager of Mutual Fund Products, Columbia Management Investment Advisers, LLC from May 2010 to February 2015; President, Columbia Funds from 2009 to 2015; and senior officer of Columbia Funds and affiliated funds from 2003 to 2015 | 66 | Board of Governors, Gateway Healthcare since January 2016; Trustee, New Century Portfolios since March 2015; and Director, The Autism Project since March 2015 |
Natalie A. Trunow
c/o Columbia
Management Investment
Advisers, LLC,
225 Franklin Street
Mail Drop BX32 05228,
Boston, MA 02110
1967 | Independent Trustee Consultant
2016 | Independent Trustee Consultant, Columbia Funds since September 2016; Chief Executive Officer, Millennial Partners (investment consulting services to institutions) since January 2016; Director of Investments, Casey Family Programs from April 2016 to September 2016; Senior Vice President and Chief Investment Officer, Calvert Investments from August 2008 to January 2016; Section Head and Portfolio Manager, General Motors Asset Management from June 1997 to August 2008 | 66 | Healthcare Services for Children with Special Needs |
| * | J. Kevin Connaughton was appointed consultant to the Independent Trustees effective March 1, 2016. Natalie A. Trunow was appointed consultant to the Independent Trustees effective September 1, 2016. Shareholders of the Funds are expected to be asked to elect each of Mr. Connaughton and Ms. Trunow as a Trustee at a future shareholder meeting. |
Interested trustee affiliated with Investment Manager*
| Name, address, year of birth | Position held with the Trust and length of service | Principal occupation(s) during the past five years and other relevant professional experience | Number of Funds in the Columbia Funds Complex overseen | Other directorships held by Trustee during the past five years |
William F. Truscott
c/o Columbia Management
Investment Advisers, LLC
225 Franklin Street
Boston, MA 02110
1960 | Trustee
2012 | Chairman of the Board and President, Columbia Management Investment Advisers, LLC since May 2010 and February 2012, respectively; Chief Executive Officer, Global Asset Management, Ameriprise Financial, Inc. since September 2012 (previously Chief Executive Officer, U.S. Asset Management & President, Annuities, May 2010-September 2012); Director and Chief Executive Officer, Columbia Management Investment Distributors, Inc. since May 2010 and February 2012, respectively; Chairman of the Board and Chief Executive Officer, RiverSource Distributors, Inc. since 2006; Director, Threadneedle Asset Management Holdings, SARL since 2014; President and Chief Executive Officer, Ameriprise Certificate Company, 2006-August 2012 | 189 | Chairman of the Board, Columbia Management Investment Advisers, LLC since May 2010; Director, Columbia Management Investment Distributors, Inc. since May 2010; former Director, Ameriprise Certificate Company, 2006 - January 2013 |
| * | Interested person (as defined under the 1940 Act) by reason of being an officer, director, security holder and/or employee of the Investment Manager or Ameriprise Financial. |
The Statement of Additional Information has additional information about the Fund’s Board members and is available,
without charge, upon request by calling 800.345.6611, contacting your financial intermediary or visiting
investor.columbiathreadneedleus.com.
| 38 | Columbia New York Tax-Exempt Fund | Annual Report 2017 |
TRUSTEES AND OFFICERS (continued)
The Board has appointed officers who are responsible for day-to-day business decisions based on policies it has established. The officers serve at the pleasure of the Board. The following table provides basic information about the Officers of the Fund, including principal occupations during the past five years, although their specific titles may have varied over the period. In addition to Mr. Truscott, who is Senior Vice President, the Fund’s other officers are:
Fund officers
Name,
address and
year of birth | Position and year
first appointed to
position for any Fund
in the Columbia
Funds complex or a
predecessor thereof | Principal occupation(s) during past five years |
Christopher O. Petersen
5228 Ameriprise
Financial Center
Minneapolis, MN 55474
Born 1970 | President and Principal Executive Officer (2015) | Vice President and Lead Chief Counsel, Ameriprise Financial, Inc. since January 2015 (previously, Vice President and Chief Counsel, January 2010 - December 2014; officer of Columbia Funds and affiliated funds since 2007. |
Michael G. Clarke
225 Franklin Street
Boston, MA 02110
Born 1969 | Treasurer (2011), Chief Financial Officer (2009) and Chief Accounting Officer (2015) | Vice President — Mutual Fund Administration, Columbia Management Investment Advisers, LLC, since May 2010; senior officer of Columbia Funds and affiliated funds since 2002. |
Paul B. Goucher
100 Park Avenue
New York, NY 10017
Born 1968 | Senior Vice President (2011) and Assistant Secretary (2008) | Senior Vice President and Assistant General Counsel, Ameriprise Financial, Inc. since January 2017 (previously Vice President and Lead Chief Counsel, November 2008 - January 2017 and January 2013 - January 2017, respectively; and Chief Counsel, January 2010 - January 2013); Vice President, Chief Legal Officer and Assistant Secretary, Columbia Management Investment Advisers, LLC since May 2010. |
Thomas P. McGuire
225 Franklin Street
Boston, MA 02110
Born 1972 | Senior Vice President and Chief Compliance Officer (2012) | Vice President — Asset Management Compliance, Ameriprise Financial, Inc., since May 2010; Chief Compliance Officer, Ameriprise Certificate Company since September 2010. |
Colin Moore
225 Franklin Street
Boston, MA 02110
Born 1958 | Senior Vice President (2010) | Executive Vice President and Global Chief Investment Officer, Ameriprise Financial, Inc., since July 2013; Executive Vice President and Global Chief Investment Officer, Columbia Management Investment Advisers, LLC since July 2013 (previously Director and Global Chief Investment Officer, 2010 - 2013). |
Ryan C. Larrenaga
225 Franklin Street
Boston, MA 02110
Born 1970 | Senior Vice President (2017), Chief Legal Officer (2017) and Secretary (2015) | Vice President and Group Counsel, Ameriprise Financial, Inc. since August 2011; officer of Columbia Funds and affiliated funds since 2005. |
Michael E. DeFao
225 Franklin Street
Boston, MA 02110
Born 1968 | Vice President (2011) and Assistant Secretary (2010) | Vice President and Chief Counsel, Ameriprise Financial, Inc. since May 2010. |
Amy Johnson
5228 Ameriprise
Financial Center
Minneapolis, MN 55474
Born 1965 | Vice President (2006) | Managing Director and Global Head of Operations, Columbia Management Investment Advisers, LLC since April 2016 (previously Managing Director and Chief Operating Officer, 2010 - 2016). |
Lyn Kephart-Strong
5228 Ameriprise
Financial Center
Minneapolis, MN 55474
Born 1960 | Vice President (2015) | President, Columbia Management Investment Services Corp. since October 2014; Vice President & Resolution Officer, Ameriprise Trust Company since August 2009. |
Columbia New York Tax-Exempt Fund | Annual Report 2017
| 39 |
Board Consideration and Approval of Management
Agreement
On June 14, 2017, the Board of Trustees (the Board) and the Trustees who are not interested persons (as defined in the Investment Company Act of 1940) (the Independent Trustees) of Columbia Funds Series Trust I (the Trust) unanimously approved the continuation of the Management Agreement (the Management Agreement) with Columbia Management Investment Advisers, LLC (the Investment Manager) with respect to Columbia New York Tax-Exempt Fund (the Fund), a series of the Trust. As detailed below, the Board’s Advisory Fees and Expenses Committee (the Committee) and the Board met on multiple occasions to review and discuss, both among themselves and with the management team of the Investment Manager, materials provided by the Investment Manager and others before determining to approve the continuation of the Management Agreement.
In connection with their deliberations regarding the continuation of the Management Agreement, the Committee and the Board evaluated materials requested from the Investment Manager regarding the Fund and the Management Agreement, and discussed these materials with representatives of the Investment Manager at Committee meetings held on March 27, 2017, April 26, 2017 and June 13, 2017 and at Board meetings held on March 28, 2017 and June 14, 2017. In addition, the Board considers matters bearing on the Management Agreement at most of its other meetings throughout the year and meets regularly with senior management of the Trust and the Investment Manager. Through the Board’s Investment Oversight Committees, Trustees also meet with selected portfolio managers of the funds the Trustees oversee and other investment personnel at various times throughout the year. The Committee and the Board also consulted with its independent fee consultant, Fund counsel and the Independent Trustees’ independent legal counsel, who advised on various matters with respect to the Committee’s and the Board’s considerations and otherwise assisted the Committee and the Board in their deliberations. On June 13, 2017, the Committee recommended that the Board approve the continuation of the Management Agreement. On June 14, 2017, the Board, including the Independent Trustees, voting separately, unanimously approved the continuation of the Management Agreement for the Fund.
The Committee and the Board considered all information that they, their legal counsel or the Investment Manager believed reasonably necessary to evaluate and to determine whether to recommend for approval or approve the continuation of the Management Agreement. The information and factors considered by the Committee and the Board in recommending for approval or approving the continuation of the Management Agreement for the Fund included the following:
| • | Information on the investment performance of the Fund relative to the performance of a group of mutual funds determined to be comparable to the Fund by an independent third-party data provider, as well as performance relative to benchmarks; |
| • | Information on the Fund’s management fees and total expenses, including information comparing the Fund’s expenses to those of a group of comparable mutual funds, as determined by the independent third-party data provider; |
| • | The Investment Manager’s agreement to contractually limit or cap total operating expenses for the Fund through February 28, 2018 so that total operating expenses (excluding certain fees and expenses, such as transaction costs and certain other investment related expenses, interest, taxes, acquired fund fees and expenses, and infrequent and/or unusual expenses) would not exceed a specified annual rate, as a percentage of the Fund’s net assets; |
| • | The terms and conditions of the Management Agreement; |
| • | The current and proposed terms and conditions of other agreements and arrangements with affiliates of the Investment Manager relating to the operations of the Fund, including agreements with respect to the provision of distribution, transfer agency and shareholder services to the Fund; |
| • | Descriptions of various functions performed by the Investment Manager under the Management Agreement, including portfolio management and portfolio trading practices; |
| • | Information regarding the management fees of similarly-managed portfolios of other clients of the Investment Manager, including institutional separate accounts; |
| • | Information regarding the reputation, regulatory history and resources of the Investment Manager, including information regarding senior management, portfolio managers and other personnel; |
| 40 | Columbia New York Tax-Exempt Fund | Annual Report 2017 |
Board Consideration and Approval of Management
Agreement (continued)
| • | Information regarding the capabilities of the Investment Manager with respect to compliance monitoring services, including an assessment of the Investment Manager’s compliance system by the Fund’s Chief Compliance Officer; and |
| • | The profitability to the Investment Manager and its affiliates from their relationships with the Fund. |
Nature, extent and quality of services provided under the Management Agreement
The Committee and the Board considered the nature, extent and quality of services provided to the Fund by the Investment Manager and its affiliates under the Management Agreement and under separate agreements for the provision of transfer agency and shareholder services, and the resources dedicated to the Fund and the other Columbia Funds by the Investment Manager and its affiliates. The Committee and the Board considered, among other things, the Investment Manager’s ability to attract, motivate and retain highly qualified research, advisory and supervisory investment professionals (including compensation programs for personnel involved in fund management, reputation and other attributes), the portfolio management services provided by those investment professionals, and the quality of the Investment Manager’s investment research capabilities and trade execution services. The Committee and the Board also considered the potential benefits to shareholders of investing in a mutual fund that is part of a fund complex offering exposure to a variety of asset classes and investment disciplines and providing a variety of fund and shareholder services.
The Committee and the Board also considered the professional experience and qualifications of the senior personnel of the Investment Manager, which included consideration of the Investment Manager’s experience with similarly-structured funds. The Committee and the Board noted the compliance programs of and the compliance-related resources provided to the Fund by the Investment Manager and its affiliates, and considered the Investment Manager’s ability to provide administrative services to the Fund and coordinate the activities of the Fund’s other service providers. After reviewing these and related factors, the Committee and the Board concluded, within the context of their overall conclusions, that the nature, extent and quality of the services provided to the Fund under the Management Agreement supported the continuation of the Management Agreement.
Investment performance
The Committee and the Board reviewed information about the performance of the Fund over various time periods, including performance information relative to benchmarks and information that compared the performance of the Fund to the performance of a group of comparable mutual funds as determined by the independent third-party data provider, and data provided by the independent fee consultant. The Committee and the Board also reviewed a description of the third party’s methodology for identifying the Fund’s peer groups for purposes of performance and expense comparisons. Although the Fund’s performance lagged that of a relevant peer group for certain (although not necessarily all) periods, the Committee and the Board concluded that other factors relevant to performance were sufficient, in light of other considerations, to warrant continuation of the Management Agreement. Those factors included one or more of the following: (i) that the Fund’s performance, although lagging in certain recent periods, was stronger over the longer term; (ii) that the underperformance was attributable, to a significant extent, to investment decisions that were reasonable and consistent with the Fund’s investment strategy and policies and that the Fund was performing within a reasonable range of expectations, given those investment decisions, market conditions and the Fund’s investment strategy; (iii) that the Fund’s performance was competitive when compared to other relevant performance benchmarks or peer groups; and (iv) that the Investment Manager had taken or was taking steps designed to help improve the Fund’s investment performance, including, but not limited to, replacing portfolio managers, enhancing the resources supporting the portfolio managers, or modifying investment strategies.
The Committee and the Board noted that, through December 31, 2016, the Fund’s performance was in the fifty-sixth, forty-ninth and thirty-second percentile (where the best performance would be in the first percentile) of its category selected by the independent third-party data provider for the purposes of performance comparisons for the one-, three- and five-year periods, respectively.
The Committee and the Board also considered the Investment Manager’s performance and reputation generally, the Investment Manager’s historical responsiveness to Board concerns about performance, and the Investment Manager’s willingness to take steps intended to improve performance. After reviewing these and related factors, the Committee and the Board concluded, within the context of their overall conclusions, that the performance of the Fund and the Investment Manager was sufficient, in light of other considerations, to warrant the continuation of the Management Agreement.
Columbia New York Tax-Exempt Fund | Annual Report 2017
| 41 |
Board Consideration and Approval of Management
Agreement (continued)
Investment management fee rates and other expenses
The Committee and the Board considered the management fees charged to the Fund under the Management Agreement as well as the total expenses incurred by the Fund. In assessing the reasonableness of the fees under the Management Agreement, the Committee and the Board considered, among other information, the Fund’s total expense ratio as a percentage of average daily net assets. The Committee and the Board considered data provided by the independent third-party data provider and the independent fee consultant. The Committee and the Board noted that, as of December 31, 2016, the Fund’s actual management fee and net total expense ratio are ranked in the first and third quintiles, respectively, (where the lowest fees and expenses would be in the first quintile) against the Fund’s expense universe as determined by the independent third-party data provider for purposes of expense comparison. The Committee and the Board also took into account the fee waiver and expense limitation arrangements agreed to by the Investment Manager, as noted above.
The Committee and the Board also received and considered information about the management fees charged by the Investment Manager to institutional separate accounts. In considering the fees charged to those accounts, the Committee and the Board took into account, among other things, the Investment Manager’s representations about the differences between managing mutual funds as compared to other types of accounts, including differences in the services provided, differences in the risk profile of such business for the Investment Manager and the additional resources required to manage mutual funds effectively. The Committee and the Board also received and considered information about the fees charged by the Investment Manager for sub-advisory services it provides to comparable unaffiliated funds. In evaluating the Fund’s management fees, the Committee and the Board also took into account the demands, complexity and quality of the investment management of the Fund.
After reviewing these and related factors, the Committee and the Board concluded, within the context of their overall conclusions, that the management fee rates and expenses of the Fund, in light of other considerations, warranted the continuation of the Management Agreement.
Costs of services provided and profitability
The Committee and the Board also took note of the costs the Investment Manager and its affiliates incur in connection with the services provided and the profitability to the Investment Manager and its affiliates from their relationships with the Fund.
The Committee and the Board also considered the compensation directly or indirectly received by the Investment Manager’s affiliates in connection with their relationships with the Fund. The Committee and the Board reviewed information provided by management as to the profitability to the Investment Manager and its affiliates of their relationships with the Fund, information about the allocation of expenses used to calculate profitability, and comparisons of profitability levels realized in 2016 to profitability levels realized in 2015. When reviewing profitability, the Committee and the Board also considered court cases in which adviser profitability was an issue in whole or in part, the performance of similarly managed funds, the performance of the Fund, and the expense ratio of the Fund. In addition, the Committee and the Board considered information provided by the Investment Manager regarding the Investment Manager’s financial condition and comparing its profitability to that of other asset management firms that are, or are subsidiaries of, publicly traded companies. In this regard, the Committee and the Board also considered data provided by the independent fee consultant.
After reviewing these and related factors, the Committee and the Board concluded, within the context of their overall conclusions, that the costs of services provided and the profitability to the Investment Manager and its affiliates from their relationships with the Fund supported the continuation of the Management Agreement.
Economies of scale
The Committee and the Board considered the potential existence of economies of scale in the provision by the Investment Manager of services to the Fund, to groups of related funds, and to the Investment Manager’s investment advisory clients as a whole, and whether those economies of scale were shared with the Fund through breakpoints in investment management fees or other means, such as expense limitation arrangements and additional investments by the Investment Manager in investment, trading, compliance and other resources. The Committee and the Board noted that the management fee schedules for the Fund contained breakpoints that would reduce the fee rate on assets above specified threshold levels.
| 42 | Columbia New York Tax-Exempt Fund | Annual Report 2017 |
Board Consideration and Approval of Management
Agreement (continued)
In considering these matters, the Committee and the Board also considered the costs of the services provided and the profitability to the Investment Manager and its affiliates from their relationships with the Fund, as discussed above. After reviewing these and related factors, the Committee and the Board concluded, within the context of their overall conclusions, that the extent to which any economies of scale were expected to be shared with the Fund supported the continuation of the Management Agreement.
Other benefits to the Investment Manager
The Committee and the Board received and considered information regarding “fall-out” or ancillary benefits received by the Investment Manager and its affiliates as a result of their relationships with the Fund, such as the engagement of the Investment Manager’s affiliates to provide distribution, transfer agency and shareholder services to the Fund. In this regard, among other matters, the Committee and the Board considered that the Fund’s distributor retains a portion of the distribution fees from the Fund and receives a portion of the sales charges on sales or redemptions of certain classes of shares of the Fund. The Committee and the Board also considered the benefits of research made available to the Investment Manager by reason of brokerage commissions generated by the Fund’s securities transactions, and reviewed information about the Investment Manager’s practices with respect to allocating portfolio transactions for brokerage and research services. The Committee and the Board recognized that the Investment Manager’s profitability would be somewhat lower without these benefits.
Conclusion
The Committee and the Board reviewed all of the above considerations in reaching their decisions to recommend or approve the continuation of the Management Agreement. In their deliberations, the Trustees did not identify any particular information that was all-important or controlling, and individual Trustees may have attributed different weights to the various factors. Based on their evaluation of all factors that they deemed to be material, including those factors described above, and assisted by the advice of independent legal counsel, the Board, including the Independent Trustees, voting separately, unanimously approved the continuation of the Management Agreement.
Columbia New York Tax-Exempt Fund | Annual Report 2017
| 43 |
The Fund mails one shareholder report to each shareholder address. If you would like more than one report, please call shareholder services at 800.345.6611 and additional reports will be sent to you.
Proxy voting policies and procedures
The policy of the Board of Trustees is to vote the proxies of the companies in which the Fund holds investments consistent with the procedures as stated in the Statement of Additional Information (SAI). You may obtain a copy of the SAI without charge by calling 800.345.6611; contacting your financial intermediary; visiting investor.columbiathreadneedleus.com; or searching the website of the Securities and Exchange Commission (SEC) at sec.gov. Information regarding how the Fund voted proxies relating to portfolio securities is filed with the SEC by August 31st for the most recent 12-month period ending June 30th of that year, and is available without charge by visiting investor.columbiathreadneedleus.com, or searching the website of the SEC at sec.gov.
Quarterly schedule of investments
The Fund files a complete schedule of portfolio holdings with the SEC for the first and third quarters of each fiscal year on Form N-Q. The Fund’s Form N-Q is available on the SEC’s website at sec.gov and may be reviewed and copied at the SEC’s Public Reference Room in Washington, D.C. Information on the operation of the Public Reference Room may be obtained by calling 800.SEC.0330. The Fund’s complete schedule of portfolio holdings, as filed on Form N-Q, can also be obtained without charge, upon request, by calling 800.345.6611.
Additional Fund information
For more information about the Fund, please visit investor.columbiathreadneedleus.com or call 800.345.6611. Customer Service Representatives are available to answer your questions Monday through Friday from 8 a.m. to 7 p.m. Eastern time.
Fund investment manager
Columbia Management Investment Advisers, LLC
225 Franklin Street
Boston, MA 02110
Fund distributor
Columbia Management Investment Distributors, Inc.
225 Franklin Street
Boston, MA 02110
Fund transfer agent
Columbia Management Investment Services Corp.
P.O. Box 8081
Boston, MA 02266-8081
[THIS PAGE INTENTIONALLY LEFT BLANK]
Columbia New York Tax-Exempt Fund
P.O. Box 8081
Boston, MA 02266-8081
Please read and consider the investment objectives, risks, charges and expenses for any fund carefully before investing. For a prospectus and summary prospectus, which contains this and other important information about the Fund, go to
investor.columbiathreadneedleus.com. The Fund is distributed by Columbia Management Investment Distributors, Inc., member FINRA, and managed by Columbia Management Investment Advisers, LLC.
Columbia Threadneedle Investments (Columbia Threadneedle) is the global brand name of the Columbia and Threadneedle group of companies. All rights reserved. Columbia Management Investment Distributors, Inc., 225 Franklin Street, Boston, MA 02110-2804
© 2017 Columbia Management Investment Advisers, LLC.
investor.columbiathreadneedleus.com

Annual Report
October 31, 2017
Columbia AMT-Free New York Intermediate Muni Bond Fund
Not FDIC Insured • No bank guarantee • May lose value
Dear Shareholders,
The current outlook for financial markets is clouded by two primary concerns: the high valuation of equities and the direction of interest rates. Following the U.S. presidential election, U.S. equities rallied based on the assumption that the new administration’s policies would stimulate growth quickly. Unfortunately it’s unclear whether those measures will get passed, much less passed quickly. In fixed income, uncertainty stems from the possibility that interest rates won’t rise as rapidly as expected if the administration’s proposed growth policies are not implemented.
Given this uncertainty, investors value a consistent approach more than ever. Investors want strong, repeatable risk-adjusted returns. Consistency — not surprises. As a leading global asset manager, we believe our consistent, collaborative investment approach enables us to deliver the dependable experience your portfolio demands. So, how do we strive to deliver a consistent investment experience?
Better insights
Your portfolio benefits from the investment insights uncovered by our talented investment teams around the world.
Better decisions
Our collaborative, interactive environment enables our investment teams to construct portfolios that take advantage of the best investment ideas.
Better outcomes
We aim to deliver a consistent experience, which means fewer surprises, dependable insights, and products designed to do the thing you want.
Whether you’re trying to save money to help your children go to college or for your own retirement, it’s the consistency of the return that is most essential. People who chase higher returns are usually also the first to sell when that investment goes through a bad patch. We try to combat this behavioral tendency by offering strategies that aim for a more consistent return. Our goal is for investors to panic less during periods of volatility, which can have a significant effect on their long-term results.
Nothing is more important to us than making sure those who have entrusted us to protect and grow their assets can do what matters most to them: build a nest egg, leave a legacy, and live confidently — now and throughout retirement. It’s why our talented professionals around the world work together to uncover uncommon opportunities and why our process encourages challenge and debate around our most compelling ideas to ensure better informed investment decisions, which hopefully lead to better outcomes for you.
Your success is our priority. Talk to your financial advisor about how working with Columbia Threadneedle Investments may help you position your portfolio for consistent, sustainable outcomes, no matter the market conditions.
Sincerely,
Christopher O. Petersen
President, Columbia Funds
Investors should consider the investment objectives, risks, charges and expenses of a mutual fund carefully before investing. For a free prospectus and summary prospectus, which contains this and other important information about a fund, visit investor.columbiathreadneedleus.com. The prospectus should be read carefully before investing.
Columbia Funds are distributed by Columbia Management Investment Distributors, Inc., member FINRA, and managed by Columbia Management Investment Advisers, LLC.
© 2017 Columbia Management Investment Advisers, LLC. All rights reserved.
Columbia AMT-Free New York Intermediate Muni Bond Fund | Annual Report 2017
Columbia AMT-Free New York Intermediate Muni Bond Fund | Annual Report 2017
Investment objective
Columbia AMT-Free New York Intermediate Muni Bond Fund (the Fund) seeks as high a level of current interest income exempt from federal income tax and, to the extent possible, from New York individual income tax, as is consistent with relative stability of principal.
Portfolio management
Brian McGreevy
Co-manager
Managed Fund since 1998
Paul Fuchs, CFA
Co-manager
Managed Fund since 2012
Effective December 29, 2017, Mr. McGreevy will no longer manage the Fund. Paul Fuchs will continue as portfolio manager of the Fund and on December 29, 2017, Deborah Vargo will be added as a portfolio manager of the Fund.
| Average annual total returns (%) (for the period ended October 31, 2017) |
| | | Inception | 1 Year | 5 Years | 10 Years |
| Class A | Excluding sales charges | 11/25/02 | 1.24 | 1.89 | 3.47 |
| | Including sales charges | | -1.77 | 1.27 | 3.15 |
| Class C | Excluding sales charges | 11/25/02 | 0.78 | 1.44 | 3.03 |
| | Including sales charges | | -0.20 | 1.44 | 3.03 |
| Class R4* | 03/19/13 | 1.49 | 2.14 | 3.72 |
| Class R5* | 03/01/16 | 1.56 | 2.15 | 3.73 |
| Class V | Excluding sales charges | 12/31/91 | 1.33 | 1.99 | 3.57 |
| | Including sales charges | �� | -3.46 | 0.99 | 3.06 |
| Class Y* | 03/01/17 | 1.46 | 2.14 | 3.72 |
| Class Z | 12/31/91 | 1.49 | 2.14 | 3.73 |
| Bloomberg Barclays New York 3-15 Year Blend Municipal Bond Index | | 1.94 | 2.60 | 4.28 |
| Bloomberg Barclays 3-15 Year Blend Municipal Bond Index | | 2.05 | 2.70 | 4.39 |
Returns for Class A are shown with and without the maximum initial sales charge of 3.00%. Returns for Class C are shown with and without the 1.00% contingent deferred sales charge for the first year only. Returns for Class V are shown with and without the maximum initial sales charge of 4.75%. The Fund’s other classes are not subject to sales charges and have limited eligibility. Effective November 1, 2017, Class R4, Class R5, Class Y and Class Z shares were renamed Advisor Class, Institutional 2 Class, Institutional 3 Class and Institutional Class shares, respectively. Please see the Fund’s prospectus for details. Performance for different share classes will vary based on differences in sales charges and fees associated with each class. All results shown assume reinvestment of distributions during the period. Returns do not reflect the deduction of taxes that a shareholder may pay on Fund distributions or on the redemption of Fund shares. Performance results reflect the effect of any fee waivers or reimbursements of Fund expenses by Columbia Management Investment Advisers, LLC and/or any of its affiliates. Absent these fee waivers or expense reimbursement arrangements, performance results would have been lower.
The performance information shown represents past performance and is not a guarantee of future results. The investment return and principal value of your investment will fluctuate so that your shares, when redeemed, may be worth more or less than their original cost. Current performance may be lower or higher than the performance information shown. You may obtain performance information current to the most recent month-end by contacting your financial intermediary, visiting investor.columbiathreadneedleus.com or calling 800.345.6611.
| * | The returns shown for periods prior to the share class inception date (including returns for the Life of the Fund, if shown, which are since Fund inception) include the returns of the Fund’s oldest share class. Since the Fund launched more than one share class at its inception, Class Z shares were used. These returns are adjusted to reflect any higher class-related operating expenses of the newer share classes, as applicable. Please visit investor.columbiathreadneedleus.com/investment-products/mutual-funds/appended-performance for more information. |
The Bloomberg Barclays New York 3-15 Year Blend Municipal Bond Index tracks investment grade bonds from the state of New York and its municipalities.
The Bloomberg Barclays 3-15 Year Blend Municipal Bond Index is an unmanaged index that tracks the performance of municipal bonds issued after December 31, 1990, with remaining maturities between 2 and 17 years and at least $7 million in principal amount outstanding.
Indices are not available for investment, are not professionally managed and do not reflect sales charges, fees, brokerage commissions, taxes or other expenses of investing. Securities in the Fund may not match those in an index.
| 2 | Columbia AMT-Free New York Intermediate Muni Bond Fund | Annual Report 2017 |
Fund at a Glance (continued)
Performance of a hypothetical $10,000 investment (October 31, 2007 — October 31, 2017)
The chart above shows the change in value of a hypothetical $10,000 investment in Class A shares of Columbia AMT-Free New York Intermediate Muni Bond Fund during the stated time period, and does not reflect the deduction of taxes that a shareholder may pay on Fund distributions or on the redemption of Fund shares.
| Quality breakdown (%) (at October 31, 2017) |
| AAA rating | 3.9 |
| AA rating | 36.4 |
| A rating | 48.5 |
| BBB rating | 5.4 |
| BB rating | 0.9 |
| Not rated | 4.9 |
| Total | 100.0 |
Percentages indicated are based upon total fixed income investments (excluding Money Market Funds).
Bond ratings apply to the underlying holdings of the Fund and not the Fund itself and are divided into categories ranging from highest to lowest credit quality, determined by using the middle rating of Moody’s, S&P and Fitch, after dropping the highest and lowest available ratings. When ratings are available from only two rating agencies, the lower rating is used. When a rating is available from only one rating agency, that rating is used. When a bond is not rated by any rating agency, it is designated as “Not rated.” Credit quality ratings assigned by a rating agency are subjective opinions, not statements of fact, and are subject to change, including daily. The ratings assigned by credit rating agencies are but one of the considerations that the Investment Manager and/or Fund’s subadviser incorporates into its credit analysis process, along with such other issuer-specific factors as cash flows, capital structure and leverage ratios, ability to de-leverage (repay) through free cash flow, quality of management, market positioning and access to capital, as well as such security-specific factors as the terms of the security (e.g., interest rate and time to maturity) and the amount and type of any collateral.
Columbia AMT-Free New York Intermediate Muni Bond Fund | Annual Report 2017
| 3 |
Manager Discussion of Fund Performance
The Fund’s Class A shares returned 1.24% excluding sales charges during the 12-month period ended October 31, 2017. The Fund’s Class Z shares returned 1.49% during the same time period. During the same 12-month period, the Bloomberg Barclays New York 3-15 Year Blend Municipal Bond Index (New York benchmark) returned 1.94% and the Bloomberg Barclays 3-15 Year Blend Municipal Bond Index, which is national in scope, returned 2.05%. New York’s bond market slightly lagged the United States as a whole, contributing to the Fund’s modest underperformance relative to the national benchmark.
Market overview
Despite a rocky start, municipal bonds posted positive returns in the past 12 months. The market initially sold off in the early weeks of the period after the surprising results of the U.S. presidential election raised the prospects of higher growth, tax reform and reduced regulation under a new administration. In the U.S. Treasury market, the yield on the 10-year note rose from 1.79% on the Friday before the election to 2.60% by mid-December. (Prices and yields move in opposite directions.) Municipal bond yields followed Treasuries higher in that interval, with yields on AAA-rated, 10-year issues rising by 0.75 percentage points. The sharp sell-off fueled redemptions from municipal bond funds, exacerbating the downturn.
As 2017 progressed, the fear of higher rates began to abate once it became apparent that Congress and the Trump administration would be unable to enact their policy proposals as quickly as originally expected. Investors initially anticipated action on healthcare and tax reform early in the presidential term, which increased expectations for stronger growth and raised the possibility of higher interest rates. Yields started falling modestly in March 2017 when these developments failed to come to fruition, and the combination of lower new issue supply and renewed inflows into mutual funds augmented the positive tone in the market. As of October 31, 2017, year-to-date new issue supply stood 15-20% below the level reached in the first ten months of 2016. At the same time, demand remained strong as older bonds matured or were called away and investors redeployed the cash back into the tax-exempt area. The ensuing recovery in municipal bonds enabled the asset class to finish in positive territory for the full year.
Pension issues continued to dominate the headlines, with Illinois and Chicago struggling to adopt budgets and several other states, including New Jersey, Connecticut, Pennsylvania and Kentucky, experiencing wider credit spreads as fears of credit-rating downgrades began to emerge. After a drawn-out budget negotiation in Illinois, the state government approved budget and revenue packages in late July. While this favorable development provided some comfort to the market, the State of Connecticut continued to struggle with budget issues before eventually passing its budget four months late. Additionally, the City of Hartford explored the possibility of bankruptcy after its debt was downgraded below investment grade by the rating agencies. At the sector level, hospital bonds produced returns slightly better than the New York benchmark, albeit with greater volatility than in past years due to the potential changes to the Affordable Care Act (ACA).
New York’s finances remained strong, but its municipal market lagged
New York continued to benefit from solid economic growth and positive employment trends in comparison to other states in the Northeast, thanks in part to the strength in the technology and financial sectors. However, the state remained hampered by weak population trends and high business costs.
The New York municipal market slightly underperformed the broader national benchmark. Local general obligation (GOs) and transportation-related issues, which account for a large portion of the New York municipal market, trailed their national counterparts. Returns for local New York GOs are largely driven by issues related to New York City. New York City, which accounts for roughly 90% of the benchmark-eligible local GOs, is highly rated by all three of the major rating agencies. At a time in which higher quality bonds lagged, this factor detracted from New York’s relative performance.
Contributors and detractors
The Fund underperformed during the period, as it was unable keep pace with the national benchmark given the weak relative performance for New York. The Fund’s duration was slightly shorter than the New York benchmark, which also was a headwind in a rising market. (Duration is a measure of interest-rate sensitivity). Positions in bonds with maturities of two years and below generally detracted due in part to the minimal contribution from yield. Accordingly, we took advantage of any pick-up in issuance to reinvest the portfolio’s shorter term holdings into higher yielding market segments.
| 4 | Columbia AMT-Free New York Intermediate Muni Bond Fund | Annual Report 2017 |
Manager Discussion of Fund Performance (continued)
The Fund had an overweight in lower rated investment-grade bonds in the single A category. This allocation largely consisted of hospital-, transportation- and education-related securities, which were three of the better performing sectors during the period. These areas made meaningful contributions, as they are three of the Fund’s largest sector weights due to the high representation of these issuers in New York. In addition, our positions in these sectors benefitted from having a longer maturity profile than their New York benchmark counterparts at a time in which longer term bonds outperformed.
Fund positioning
Our strategy remained consistent throughout the period, with a close to neutral duration and an emphasis on the lower quality tiers of the investment-grade market. We invested in various issues in the local GO, tobacco and student housing sectors, while reducing exposure to shorter maturity, lower yielding issues and special non-property tax bonds. In addition, we eliminated all exposure to the Virgin Islands.
New York’s municipal market remained vibrant, with good credit fundamentals and strong demand from tax-sensitive investors. We do not currently have concerns about the current funding status of New York’s public employee pension system, as its funding status is one of the highest in the country. However, we are watching closely the education sector due to the passage of legislation providing free tuition at state universities, which could have an impact on private universities as some will likely lose students to state schools.
Fixed-income securities present issuer default risk. The Fund invests substantially in municipal securities and will be affected by tax, legislative, regulatory, demographic or political changes, as well as changes impacting a state’s financial, economic or other conditions. A relatively small number of tax-exempt issuers may necessitate the Fund investing more heavily in a single issuer and, therefore, be more exposed to the risk of loss than a Fund that invests more broadly. The value of the Fund’s portfolio may be more volatile than a more geographically diversified fund. Prepayment and extension risk exists because the timing of payments on a loan, bond or other investment may accelerate when interest rates fall or decelerate when interest rates rise which may reduce investment opportunities and potential returns. A rise in interest rates may result in a price decline of fixed-income instruments held by the Fund, negatively impacting its performance and NAV. Falling rates may result in the Fund investing in lower yielding debt instruments, lowering the Fund’s income and yield. These risks may be heightened for longer maturity and duration securities. Non-investment-grade (high-yield or junk) securities present greater price volatility and more risk to principal and income than higher rated securities. Market risk may affect a single issuer, sector of the economy, industry or the market as a whole. Federal and state tax rules apply to capital gain distributions and any gains or losses on sales. Income may be subject to state or local taxes. Liquidity risk is associated with the difficulty of selling underlying investments at a desirable time or price. See the Fund’s prospectus for more information on these and other risks.
The views expressed in this report reflect the current views of the respective parties. These views are not guarantees of future performance and involve certain risks, uncertainties and assumptions that are difficult to predict, so actual outcomes and results may differ significantly from the views expressed. These views are subject to change at any time based upon economic, market or other conditions and the respective parties disclaim any responsibility to update such views. These views may not be relied on as investment advice and, because investment decisions for a Columbia fund are based on numerous factors, may not be relied on as an indication of trading intent on behalf of any particular Columbia fund. References to specific securities should not be construed as a recommendation or investment advice.
Columbia AMT-Free New York Intermediate Muni Bond Fund | Annual Report 2017
| 5 |
Understanding Your Fund’s Expenses
(Unaudited)
As an investor, you incur two types of costs. There are transaction costs, which generally include sales charges on purchases and may include redemption fees. There are also ongoing costs, which generally include management fees, distribution and/or service fees, and other fund expenses. The following information is intended to help you understand your ongoing costs (in dollars) of investing in the Fund and to help you compare these costs with the ongoing costs of investing in other mutual funds.
Analyzing your Fund’s expenses
To illustrate these ongoing costs, we have provided examples and calculated the expenses paid by investors in each share class of the Fund during the period. The actual and hypothetical information in the table is based on an initial investment of $1,000 at the beginning of the period indicated and held for the entire period. Expense information is calculated two ways and each method provides you with different information. The amount listed in the “Actual” column is calculated using the Fund’s actual operating expenses and total return for the period. You may use the Actual information, together with the amount invested, to estimate the expenses that you paid over the period. Simply divide your account value by $1,000 (for example, an $8,600 account value divided by $1,000 = 8.6), then multiply the results by the expenses paid during the period under the “Actual” column. The amount listed in the “Hypothetical” column assumes a 5% annual rate of return before expenses (which is not the Fund’s actual return) and then applies the Fund’s actual expense ratio for the period to the hypothetical return. You should not use the hypothetical account values and expenses to estimate either your actual account balance at the end of the period or the expenses you paid during the period. See “Compare with other funds” below for details on how to use the hypothetical data.
Compare with other funds
Since all mutual funds are required to include the same hypothetical calculations about expenses in shareholder reports, you can use this information to compare the ongoing cost of investing in the Fund with other funds. To do so, compare the hypothetical example with the 5% hypothetical examples that appear in the shareholder reports of other funds. As you compare hypothetical examples of other funds, it is important to note that hypothetical examples are meant to highlight the ongoing costs of investing in a fund only and do not reflect any transaction costs, such as sales charges, or redemption or exchange fees. Therefore, the hypothetical calculations are useful in comparing ongoing costs only, and will not help you determine the relative total costs of owning different funds. If transaction costs were included in these calculations, your costs would be higher.
| May 1, 2017 — October 31, 2017 |
| | Account value at the
beginning of the
period ($) | Account value at the
end of the
period ($) | Expenses paid during
the period ($) | Fund’s annualized
expense ratio (%) |
| | Actual | Hypothetical | Actual | Hypothetical | Actual | Hypothetical | Actual |
| Class A | 1,000.00 | 1,000.00 | 1,018.50 | 1,021.66 | 3.86 | 3.86 | 0.75 |
| Class C | 1,000.00 | 1,000.00 | 1,016.20 | 1,019.36 | 6.16 | 6.17 | 1.20 |
| Class R4 | 1,000.00 | 1,000.00 | 1,020.70 | 1,022.93 | 2.57 | 2.58 | 0.50 |
| Class R5 | 1,000.00 | 1,000.00 | 1,021.00 | 1,023.24 | 2.27 | 2.27 | 0.44 |
| Class V (formerly Class T) | 1,000.00 | 1,000.00 | 1,019.90 | 1,022.17 | 3.35 | 3.35 | 0.65 |
| Class Y | 1,000.00 | 1,000.00 | 1,020.30 | 1,023.49 | 2.01 | 2.01 | 0.39 |
| Class Z | 1,000.00 | 1,000.00 | 1,020.70 | 1,022.93 | 2.57 | 2.58 | 0.50 |
Expenses paid during the period are equal to the annualized expense ratio for each class as indicated above, multiplied by the average account value over the period and then multiplied by the number of days in the Fund’s most recent fiscal half year and divided by 365.
Expenses do not include fees and expenses incurred indirectly by the Fund from its investment in underlying funds, including affiliated and non-affiliated pooled investment vehicles, such as mutual funds and exchange-traded funds.
Had Columbia Management Investment Advisers, LLC and/or certain of its affiliates not waived/reimbursed certain fees and expenses, account value at the end of the period would have been reduced.
| 6 | Columbia AMT-Free New York Intermediate Muni Bond Fund | Annual Report 2017 |
Portfolio of Investments
October 31, 2017
(Percentages represent value of investments compared to net assets)
| Floating Rate Notes 2.4% |
| Issue Description | Effective
Yield | | Principal
Amount ($) | Value ($) |
| Local General Obligation 0.5% |
| City of New York(a),(b) |
| Unlimited General Obligation Bonds |
| Subordinated Series 1994H-3 (AGM) (State Street Bank and Trust Co.) |
| 08/01/2020 | 0.930% | | 1,200,000 | 1,200,000 |
| Variable Rate Demand Notes 1.9% |
| City of New York(a),(b) |
| Unlimited General Obligation Bonds |
| Fiscal 2015 |
| VRDN Subordinated Series 2015 (JPMorgan Chase Bank) |
| 06/01/2044 | 0.900% | | 2,100,000 | 2,100,000 |
| New York City Transitional Finance Authority Future Tax Secured(a),(b) |
| Revenue Bonds |
| NYC Recovery |
| VRDN Subordinated Series 20021-C (JPMorgan Chase Bank) |
| 11/01/2022 | 0.900% | | 2,475,000 | 2,475,000 |
| Total | 4,575,000 |
Total Floating Rate Notes
(Cost $5,775,000) | 5,775,000 |
|
| Municipal Bonds 95.5% |
| Issue Description | Coupon
Rate | | Principal
Amount ($) | Value ($) |
| Charter Schools 1.1% |
| Build NYC Resource Corp. |
| Revenue Bonds |
| International Leadership Charter School |
| Series 2013 |
| 07/01/2023 | 5.000% | | 2,085,000 | 2,098,136 |
| Build NYC Resource Corp.(c) |
| Revenue Bonds |
| International Leadership Charter School |
| Series 2016 |
| 07/01/2046 | 6.250% | | 420,000 | 409,042 |
| Total | 2,507,178 |
| Disposal 0.8% |
| Oneida-Herkimer Solid Waste Management Authority |
| Revenue Bonds |
| Series 2011 |
| 04/01/2019 | 5.000% | | 830,000 | 873,359 |
| 04/01/2020 | 5.000% | | 870,000 | 944,725 |
| Total | 1,818,084 |
| Health Services 2.1% |
| New York State Dormitory Authority |
| Refunding Revenue Bonds |
| Icahn School of Medicine at Mount Sinai |
| Series 2015 |
| 07/01/2030 | 5.000% | | 3,400,000 | 3,917,650 |
| Municipal Bonds (continued) |
| Issue Description | Coupon
Rate | | Principal
Amount ($) | Value ($) |
| Revenue Bonds |
| Mount Sinai School of Medicine |
| Series 2010A |
| 07/01/2021 | 5.000% | | 1,000,000 | 1,091,870 |
| Total | 5,009,520 |
| Higher Education 7.8% |
| Albany Capital Resource Corp. |
| Refunding Revenue Bonds |
| Albany College of Pharmacy & Health Services |
| Series 2014 |
| 12/01/2031 | 5.000% | | 500,000 | 559,295 |
| Build NYC Resource Corp. |
| Refunding Revenue Bonds |
| City University of New York-Queens |
| Series 2014A |
| 06/01/2029 | 5.000% | | 225,000 | 266,423 |
| 06/01/2030 | 5.000% | | 300,000 | 354,015 |
| Manhattan College Project |
| Series 2017 |
| 08/01/2033 | 5.000% | | 400,000 | 467,528 |
| County of Saratoga |
| Refunding Revenue Bonds |
| Skidmore College |
| Series 2014B |
| 07/01/2021 | 5.000% | | 200,000 | 225,470 |
| 07/01/2022 | 5.000% | | 220,000 | 253,482 |
| Dutchess County Local Development Corp. |
| Refunding Revenue Bonds |
| Vassar College Project |
| Series 2017 |
| 07/01/2034 | 5.000% | | 500,000 | 592,550 |
| Revenue Bonds |
| Marist College Project |
| Series 2015A |
| 07/01/2029 | 5.000% | | 1,000,000 | 1,178,690 |
| Geneva Development Corp. |
| Refunding Revenue Bonds |
| Hobart & William Smith College |
| Series 2012 |
| 09/01/2024 | 5.000% | | 600,000 | 695,364 |
| 09/01/2025 | 5.000% | | 300,000 | 346,020 |
| Hempstead Town Local Development Corp. |
| Revenue Bonds |
| Hofstra University Project |
| Series 2013 |
| 07/01/2028 | 5.000% | | 1,170,000 | 1,340,843 |
| New York State Dormitory Authority |
| Refunding Revenue Bonds |
| Barnard College |
| Series 2015A |
| 07/01/2030 | 5.000% | | 700,000 | 828,303 |
The accompanying Notes to Financial Statements are an integral part of this statement.
Columbia AMT-Free New York Intermediate Muni Bond Fund | Annual Report 2017
| 7 |
Portfolio of Investments (continued)
October 31, 2017
| Municipal Bonds (continued) |
| Issue Description | Coupon
Rate | | Principal
Amount ($) | Value ($) |
| New School |
| Series 2015A |
| 07/01/2029 | 5.000% | | 450,000 | 530,411 |
| Pratt Institute |
| Series 2015A |
| 07/01/2034 | 5.000% | | 2,000,000 | 2,255,340 |
| St. John’s University |
| Series 2015A |
| 07/01/2030 | 5.000% | | 2,340,000 | 2,747,417 |
| Teachers College |
| Series 2017 |
| 07/01/2029 | 5.000% | | 175,000 | 212,013 |
| 07/01/2030 | 5.000% | | 150,000 | 180,441 |
| Revenue Bonds |
| Cornell University |
| Series 2009A |
| 07/01/2025 | 5.000% | | 1,000,000 | 1,063,250 |
| Culinary Institute of America |
| Series 2012 |
| 07/01/2028 | 5.000% | | 500,000 | 556,555 |
| New York University |
| Series 1998A (NPFGC) |
| 07/01/2020 | 5.750% | | 2,000,000 | 2,235,040 |
| Rochester Institute of Technology |
| Series 2010 |
| 07/01/2021 | 5.000% | | 1,000,000 | 1,099,590 |
| St. John’s University |
| Series 2012A |
| 07/01/2027 | 5.000% | | 470,000 | 536,528 |
| Total | 18,524,568 |
| Hospital 11.1% |
| Buffalo & Erie County Industrial Land Development Corp. |
| Revenue Bonds |
| Catholic Health System |
| Series 2015 |
| 07/01/2027 | 5.000% | | 400,000 | 459,116 |
| 07/01/2028 | 5.000% | | 360,000 | 410,278 |
| Build NYC Resource Corp. |
| Refunding Revenue Bonds |
| New York Methodist Hospital Project |
| Series 2014 |
| 07/01/2028 | 5.000% | | 150,000 | 171,587 |
| 07/01/2029 | 5.000% | | 175,000 | 199,381 |
| County of Saratoga |
| Revenue Bonds |
| Saratoga Hospital Project |
| Series 2013A |
| 12/01/2024 | 5.000% | | 1,085,000 | 1,264,144 |
| 12/01/2025 | 5.000% | | 1,115,000 | 1,292,932 |
| 12/01/2027 | 5.000% | | 1,225,000 | 1,405,173 |
| Municipal Bonds (continued) |
| Issue Description | Coupon
Rate | | Principal
Amount ($) | Value ($) |
| Dutchess County Local Development Corp. |
| Revenue Bonds |
| Series 2014A |
| 07/01/2034 | 5.000% | | 300,000 | 338,109 |
| Monroe County Industrial Development Corp. |
| Refunding Revenue Bonds |
| Highland Hospital Rochester Project |
| Series 2015 |
| 07/01/2025 | 5.000% | | 450,000 | 539,266 |
| 07/01/2026 | 5.000% | | 350,000 | 416,563 |
| Revenue Bonds |
| Rochester General Hospital (The) |
| Series 2017 |
| 12/01/2035 | 5.000% | | 1,000,000 | 1,140,200 |
| Nassau County Local Economic Assistance Corp. |
| Refunding Revenue Bonds |
| Catholic Health Services |
| Series 2011 |
| 07/01/2019 | 5.000% | | 1,840,000 | 1,944,770 |
| 07/01/2020 | 5.000% | | 2,815,000 | 3,062,016 |
| Revenue Bonds |
| Catholic Health Services of Long Island |
| Series 2014 |
| 07/01/2032 | 5.000% | | 1,250,000 | 1,392,750 |
| 07/01/2033 | 5.000% | | 675,000 | 748,649 |
| New York State Dormitory Authority |
| Refunding Revenue Bonds |
| North Shore - Long Island Jewish Obligation Group |
| Series 2015A |
| 05/01/2031 | 5.000% | | 3,000,000 | 3,479,520 |
| NYU Hospitals Center |
| Series 2014 |
| 07/01/2030 | 5.000% | | 1,000,000 | 1,167,250 |
| 07/01/2031 | 5.000% | | 1,000,000 | 1,163,220 |
| Revenue Bonds |
| Memorial Sloan-Kettering Cancer Center |
| Series 2012 |
| 07/01/2027 | 5.000% | | 500,000 | 566,155 |
| Mount Sinai Hospital |
| Series 2010A |
| 07/01/2026 | 5.000% | | 1,725,000 | 1,889,789 |
| Series 2011A |
| 07/01/2031 | 5.000% | | 2,000,000 | 2,197,520 |
| New York State Dormitory Authority(c) |
| Refunding Revenue Bonds |
| Orange Regional Medical Center |
| Series 2017 |
| 12/01/2031 | 5.000% | | 1,000,000 | 1,111,710 |
| Total | 26,360,098 |
The accompanying Notes to Financial Statements are an integral part of this statement.
| 8 | Columbia AMT-Free New York Intermediate Muni Bond Fund | Annual Report 2017 |
Portfolio of Investments (continued)
October 31, 2017
| Municipal Bonds (continued) |
| Issue Description | Coupon
Rate | | Principal
Amount ($) | Value ($) |
| Investor Owned 0.6% |
| New York State Energy Research & Development Authority |
| Refunding Revenue Bonds |
| New York State Electric & Gas |
| Series 1994 |
| 02/01/2029 | 2.000% | | 1,500,000 | 1,520,145 |
| Local Appropriation 1.1% |
| New York State Dormitory Authority |
| Revenue Bonds |
| Municipal Health Facilities |
| Subordinated Series 2001-2 |
| 01/15/2021 | 5.000% | | 2,500,000 | 2,520,825 |
| Local General Obligation 13.7% |
| City of New York |
| Unlimited General Obligation Refunding Bonds |
| Series 2014J |
| 08/01/2030 | 5.000% | | 1,500,000 | 1,760,940 |
| Unlimited Obligation Refunding Notes |
| Series 2016C |
| 08/01/2032 | 5.000% | | 2,000,000 | 2,357,420 |
| Unrefunded Unlimited General Obligation Bonds |
| Subordinated Series 2007D-1 |
| 12/01/2021 | 5.000% | | 810,000 | 812,908 |
| Subordinated Series 2008I-1 |
| 02/01/2023 | 5.000% | | 1,810,000 | 1,828,390 |
| City of Schenectady |
| Limited General Obligation Refunding Bonds |
| Series 2016 (AGM) |
| 05/15/2026 | 5.000% | | 1,000,000 | 1,223,790 |
| City of Syracuse |
| Limited General Obligation Refunding & Public Improvement Bonds |
| Series 2014 |
| 08/15/2023 | 5.000% | | 405,000 | 481,537 |
| Limited General Obligation Refunding Bonds |
| Series 2015A |
| 03/01/2024 | 5.000% | | 1,000,000 | 1,203,230 |
| City of Yonkers |
| Limited General Obligation Bonds |
| Series 2016A (AGM) |
| 11/15/2028 | 5.000% | | 1,780,000 | 2,122,045 |
| Series 2017A (BAM) |
| 09/01/2028 | 5.000% | | 2,090,000 | 2,526,622 |
| County of Allegany |
| Limited General Obligation Refunding Bonds |
| Public Improvement |
| Series 2014 (BAM) |
| 09/15/2028 | 5.000% | | 1,375,000 | 1,616,312 |
| Municipal Bonds (continued) |
| Issue Description | Coupon
Rate | | Principal
Amount ($) | Value ($) |
| County of Erie |
| Limited General Obligation Bonds |
| Public Improvement |
| Series 2012A |
| 04/01/2025 | 5.000% | | 500,000 | 571,475 |
| County of Monroe |
| Limited General Obligation Bonds |
| Series 2016 (BAM) |
| 06/01/2026 | 5.000% | | 2,330,000 | 2,835,517 |
| County of Nassau |
| Limited General Obligation Bonds |
| Series 2017B |
| 04/01/2033 | 5.000% | | 2,000,000 | 2,333,040 |
| Limited General Obligation Refunding Bonds |
| Series 2016A |
| 01/01/2032 | 5.000% | | 1,640,000 | 1,910,731 |
| County of Rockland |
| Limited General Obligation Bonds |
| Series 2014A (AGM) |
| 03/01/2024 | 5.000% | | 1,450,000 | 1,695,195 |
| New York State Dormitory Authority |
| Refunding Revenue Bonds |
| School Districts Bond Financing |
| Series 2013E (AGM) |
| 10/01/2031 | 5.000% | | 500,000 | 580,970 |
| School Districts Financing Program |
| Series 2015B (AGM) |
| 10/01/2027 | 5.000% | | 2,010,000 | 2,426,412 |
| Ramapo Local Development Corp. |
| Refunding Revenue Bonds |
| Guaranteed |
| Series 2013 |
| 03/15/2028 | 5.000% | | 2,180,000 | 2,320,043 |
| Town of Oyster Bay |
| Limited General Obligation Refunding & Public Improvement Bonds |
| Series 2014B |
| 08/15/2023 | 5.000% | | 1,850,000 | 2,126,667 |
| Total | 32,733,244 |
| Multi-Family 2.6% |
| Amherst Development Corp. |
| Refunding Revenue Bonds |
| University of Buffalo Student Housing |
| Series 2017 (AGM) |
| 10/01/2028 | 5.000% | | 730,000 | 898,002 |
| 10/01/2029 | 5.000% | | 1,290,000 | 1,575,413 |
| New York State Dormitory Authority |
| Revenue Bonds |
| Residential Institution for Children |
| Series 2008A-1 |
| 06/01/2033 | 5.000% | | 1,700,000 | 1,736,346 |
The accompanying Notes to Financial Statements are an integral part of this statement.
Columbia AMT-Free New York Intermediate Muni Bond Fund | Annual Report 2017
| 9 |
Portfolio of Investments (continued)
October 31, 2017
| Municipal Bonds (continued) |
| Issue Description | Coupon
Rate | | Principal
Amount ($) | Value ($) |
| Onondaga County Trust for Cultural Resources |
| Refunding Revenue Bonds |
| Abby Lane Housing Corp. Project |
| Series 2017 |
| 05/01/2030 | 5.000% | | 420,000 | 488,972 |
| 05/01/2031 | 5.000% | | 400,000 | 462,824 |
| Tompkins County Development Corp. |
| Revenue Bonds |
| Tompkins Cortland Community College |
| Series 2013 |
| 07/01/2018 | 5.000% | | 1,045,000 | 1,061,156 |
| Total | 6,222,713 |
| Municipal Power 4.8% |
| Long Island Power Authority |
| Refunding Revenue Bonds |
| Series 2014A |
| 09/01/2034 | 5.000% | | 2,000,000 | 2,287,800 |
| Series 2016B |
| 09/01/2030 | 5.000% | | 4,500,000 | 5,354,910 |
| Revenue Bonds |
| Electric System General Purpose |
| Series 2015B |
| 09/01/2032 | 5.000% | | 765,000 | 887,828 |
| Series 2011A |
| 05/01/2021 | 5.000% | | 1,000,000 | 1,122,090 |
| Series 2012B |
| 09/01/2026 | 5.000% | | 1,510,000 | 1,731,804 |
| Total | 11,384,432 |
| Other Bond Issue 1.7% |
| Build NYC Resource Corp. |
| Revenue Bonds |
| Series 2015 |
| 07/01/2029 | 5.000% | | 545,000 | 642,386 |
| 07/01/2031 | 5.000% | | 715,000 | 837,308 |
| New York Liberty Development Corp. |
| Refunding Revenue Bonds |
| 4 World Trade Center Project |
| Series 2011 |
| 11/15/2031 | 5.000% | | 2,350,000 | 2,651,246 |
| Total | 4,130,940 |
| Other Revenue 1.0% |
| Brooklyn Arena Local Development Corp. |
| Refunding Revenue Bonds |
| Barclays Center Project |
| Series 2016A |
| 07/15/2027 | 5.000% | | 2,000,000 | 2,358,260 |
| Municipal Bonds (continued) |
| Issue Description | Coupon
Rate | | Principal
Amount ($) | Value ($) |
| Pool / Bond Bank 2.8% |
| New York State Dormitory Authority |
| Revenue Bonds |
| School Districts Financing Program |
| Series 2012B |
| 10/01/2026 | 5.000% | | 3,000,000 | 3,428,220 |
| Unrefunded Revenue Bonds |
| School Districts Bond Financing Program |
| Series 2009 (AGM) |
| 10/01/2022 | 5.000% | | 180,000 | 192,618 |
| New York State Environmental Facilities Corp. |
| Revenue Bonds |
| Revolving Funds-New York City Municipal Water |
| Series 2008B |
| 06/15/2021 | 5.000% | | 3,000,000 | 3,076,350 |
| Total | 6,697,188 |
| Ports 2.5% |
| Port Authority of New York & New Jersey |
| Refunding Revenue Bonds |
| Consolidated 184th |
| Series 2014 |
| 09/01/2030 | 5.000% | | 2,000,000 | 2,371,420 |
| Revenue Bonds |
| Consolidated 161st |
| Series 2009 |
| 10/15/2031 | 5.000% | | 3,390,000 | 3,640,623 |
| Total | 6,012,043 |
| Prep School 1.3% |
| Build NYC Resource Corp. |
| Refunding Revenue Bonds |
| Horace Mann School Project |
| Series 2014 |
| 07/01/2026 | 5.000% | | 475,000 | 573,354 |
| 07/01/2027 | 5.000% | | 600,000 | 717,552 |
| Series 2015 |
| 06/01/2026 | 5.000% | | 225,000 | 267,725 |
| 06/01/2028 | 5.000% | | 250,000 | 294,045 |
| Rensselaer County Industrial Development Agency |
| Refunding Revenue Bonds |
| Emma Willard School Project |
| Series 2015A |
| 01/01/2034 | 5.000% | | 450,000 | 518,571 |
| 01/01/2035 | 5.000% | | 590,000 | 679,078 |
| Total | 3,050,325 |
The accompanying Notes to Financial Statements are an integral part of this statement.
| 10 | Columbia AMT-Free New York Intermediate Muni Bond Fund | Annual Report 2017 |
Portfolio of Investments (continued)
October 31, 2017
| Municipal Bonds (continued) |
| Issue Description | Coupon
Rate | | Principal
Amount ($) | Value ($) |
| Recreation 0.7% |
| Build NYC Resource Corp. |
| Refunding Revenue Bonds |
| YMCA of Greater New York Project |
| Series 2015 |
| 08/01/2029 | 5.000% | | 430,000 | 500,335 |
| Revenue Bonds |
| YMCA of Greater New York Project |
| Series 2012 |
| 08/01/2032 | 5.000% | | 500,000 | 549,025 |
| New York City Trust for Cultural Resources |
| Refunding Revenue Bonds |
| Museum of Modern Art |
| Series 2016S |
| 04/01/2031 | 4.000% | | 500,000 | 560,860 |
| Total | 1,610,220 |
| Refunded / Escrowed 12.3% |
| City of New York |
| Prerefunded 02/01/18 Unlimited General Obligation Bonds |
| Series 2008I-1 |
| 02/01/2023 | 5.000% | | 190,000 | 191,854 |
| City of Yonkers |
| Prerefunded 03/15/21 Limited General Obligation Notes |
| Series 2015A (AGM) |
| 03/15/2023 | 5.000% | | 1,250,000 | 1,403,738 |
| Elizabeth Forward School District(d) |
| Unlimited General Obligation Bonds |
| Capital Appreciation |
| Series 1994B Escrowed to Maturity (NPFGC) |
| 09/01/2020 | 0.000% | | 2,210,000 | 2,122,042 |
| Long Island Power Authority |
| Prerefunded 04/01/19 Revenue Bonds |
| Series 2009A |
| 04/01/2021 | 5.250% | | 1,000,000 | 1,053,850 |
| 04/01/2022 | 5.500% | | 3,000,000 | 3,168,510 |
| Metropolitan Transportation Authority |
| Prerefunded 11/15/18 Revenue Bonds |
| Series 2008 |
| 11/15/2023 | 6.250% | | 30,000 | 31,603 |
| Prerefunded 11/15/20 Revenue Bonds |
| Transportation |
| Series 2010D |
| 11/15/2028 | 5.250% | | 3,000,000 | 3,359,250 |
| New York State Dormitory Authority |
| Prerefunded 03/01/19 Revenue Bonds |
| Teacher’s College |
| Series 2009 |
| 03/01/2024 | 5.000% | | 1,000,000 | 1,051,490 |
| Municipal Bonds (continued) |
| Issue Description | Coupon
Rate | | Principal
Amount ($) | Value ($) |
| Prerefunded 05/01/19 Revenue Bonds |
| North Shore-Long Island Jewish Obligation Group |
| Series 2009A |
| 05/01/2030 | 5.250% | | 4,000,000 | 4,245,840 |
| Prerefunded 07/01/19 Revenue Bonds |
| Mount Sinai School of Medicine |
| Series 2009 |
| 07/01/2027 | 5.500% | | 4,000,000 | 4,284,520 |
| Prerefunded 07/01/20 Revenue Bonds |
| New York University Hospital Center |
| Series 2011A |
| 07/01/2023 | 5.125% | | 1,000,000 | 1,101,200 |
| Prerefunded 10/01/18 Revenue Bonds |
| School Districts Bond Financing Program |
| Series 2008 (AGM) |
| 10/01/2023 | 5.000% | | 1,370,000 | 1,419,074 |
| New York State Dormitory Authority(d) |
| Revenue Bonds |
| Capital Appreciation-Memorial Sloan-Kettering Cancer Center |
| Series 2003-1 Escrowed to Maturity (NPFGC) |
| 07/01/2025 | 0.000% | | 3,750,000 | 3,234,225 |
| Puerto Rico Highway & Transportation Authority(e) |
| Refunding Revenue Bonds |
| Series 2005BB Escrowed to Maturity (AGM) |
| 07/01/2022 | 5.250% | | 355,000 | 411,615 |
| Triborough Bridge & Tunnel Authority |
| Prerefunded 01/01/22 Revenue Bonds |
| General Purpose |
| Series 1999B |
| 01/01/2030 | 5.500% | | 2,000,000 | 2,295,320 |
| Total | 29,374,131 |
| Retirement Communities 3.1% |
| Brookhaven Local Development Corp. |
| Refunding Revenue Bonds |
| Jeffersons Ferry Project |
| Series 2016 |
| 11/01/2036 | 5.250% | | 750,000 | 852,412 |
| Buffalo & Erie County Industrial Land Development Corp. |
| Refunding Revenue Bonds |
| Orchard Park |
| Series 2015 |
| 11/15/2029 | 5.000% | | 550,000 | 621,319 |
| 11/15/2030 | 5.000% | | 650,000 | 730,854 |
| New York State Dormitory Authority |
| Revenue Bonds |
| Miriam Osborn Memorial Home Association |
| Series 2012 |
| 07/01/2026 | 5.000% | | 740,000 | 776,504 |
| 07/01/2027 | 5.000% | | 700,000 | 733,355 |
The accompanying Notes to Financial Statements are an integral part of this statement.
Columbia AMT-Free New York Intermediate Muni Bond Fund | Annual Report 2017
| 11 |
Portfolio of Investments (continued)
October 31, 2017
| Municipal Bonds (continued) |
| Issue Description | Coupon
Rate | | Principal
Amount ($) | Value ($) |
| Tompkins County Development Corp. |
| Refunding Revenue Bonds |
| Kendal at Ithaca, Inc. Project |
| Series 2014 |
| 07/01/2029 | 5.000% | | 1,000,000 | 1,093,400 |
| 07/01/2034 | 5.000% | | 1,000,000 | 1,073,660 |
| Ulster County Industrial Development Agency |
| Revenue Bonds |
| Series 2007A |
| 09/15/2027 | 6.000% | | 1,615,000 | 1,616,405 |
| Total | 7,497,909 |
| Sales Tax 1.0% |
| Sales Tax Asset Receivable Corp. |
| Refunding Revenue Bonds |
| Fiscal 2015 |
| Series 2014A |
| 10/15/2024 | 5.000% | | 2,000,000 | 2,435,460 |
| Special Non Property Tax 5.7% |
| New York City Transitional Finance Authority |
| Unrefunded Revenue Bonds |
| Future Tax Secured |
| Series 2009 |
| 05/01/2027 | 5.000% | | 3,525,000 | 3,728,604 |
| New York City Transitional Finance Authority Future Tax Secured |
| Subordinated Revenue Bonds |
| Future Tax |
| Series 2016E-1 |
| 02/01/2032 | 5.000% | | 3,000,000 | 3,536,130 |
| New York Convention Center Development Corp. |
| Refunding Revenue Bonds |
| Hotel Unit Fee Secured |
| Series 2015 |
| 11/15/2027 | 5.000% | | 4,120,000 | 4,968,802 |
| New York State Dormitory Authority |
| Refunding Revenue Bonds |
| Education |
| Series 2005B (AMBAC) |
| 03/15/2026 | 5.500% | | 1,000,000 | 1,267,590 |
| Total | 13,501,126 |
| Special Property Tax 0.5% |
| Hudson Yards Infrastructure Corp. |
| Refunding Revenue Bonds |
| Series 2017A |
| 02/15/2033 | 5.000% | | 1,000,000 | 1,189,560 |
| Municipal Bonds (continued) |
| Issue Description | Coupon
Rate | | Principal
Amount ($) | Value ($) |
| State Appropriated 5.0% |
| Erie County Industrial Development Agency (The) |
| Revenue Bonds |
| School District of Buffalo Project |
| Series 2011A |
| 05/01/2030 | 5.250% | | 1,440,000 | 1,629,633 |
| New York State Dormitory Authority |
| Refunding Revenue Bonds |
| Consolidated Service Contract |
| Series 2009A |
| 07/01/2024 | 5.000% | | 3,000,000 | 3,190,800 |
| Revenue Bonds |
| Schools Program |
| Series 2000 |
| 07/01/2020 | 6.250% | | 665,000 | 667,966 |
| State University Educational Facilities |
| 3rd General Series 2005A (NPFGC) |
| 05/15/2021 | 5.500% | | 1,000,000 | 1,145,810 |
| New York State Urban Development Corp. |
| Refunding Revenue Bonds |
| Service Contract |
| Series 2008B |
| 01/01/2026 | 5.000% | | 3,125,000 | 3,205,344 |
| Series 2008C |
| 01/01/2022 | 5.000% | | 2,000,000 | 2,051,960 |
| Total | 11,891,513 |
| Tobacco 2.3% |
| Chautauqua Tobacco Asset Securitization Corp. |
| Refunding Revenue Bonds |
| Series 2014 |
| 06/01/2029 | 5.000% | | 3,000,000 | 3,082,050 |
| TSASC, Inc. |
| Refunding Revenue Bonds |
| Series 2017A |
| 06/01/2031 | 5.000% | | 2,000,000 | 2,303,900 |
| Total | 5,385,950 |
| Transportation 4.1% |
| Metropolitan Transportation Authority |
| Revenue Bonds |
| Series 2005B (AMBAC) |
| 11/15/2024 | 5.250% | | 750,000 | 914,190 |
| Series 2014C |
| 11/15/2029 | 5.000% | | 3,000,000 | 3,583,620 |
| Series 2016C-1 |
| 11/15/2036 | 5.000% | | 3,000,000 | 3,492,420 |
| Transportation |
| Series 2014B |
| 11/15/2022 | 5.000% | | 1,000,000 | 1,163,350 |
The accompanying Notes to Financial Statements are an integral part of this statement.
| 12 | Columbia AMT-Free New York Intermediate Muni Bond Fund | Annual Report 2017 |
Portfolio of Investments (continued)
October 31, 2017
| Municipal Bonds (continued) |
| Issue Description | Coupon
Rate | | Principal
Amount ($) | Value ($) |
| Unrefunded Revenue Bonds |
| Series 2008 |
| 11/15/2023 | 6.250% | | 685,000 | 722,339 |
| Total | 9,875,919 |
| Turnpike / Bridge / Toll Road 4.6% |
| New York State Thruway Authority |
| Refunding Revenue Bonds |
| Series 2014K |
| 01/01/2029 | 5.000% | | 1,850,000 | 2,188,846 |
| 01/01/2032 | 5.000% | | 1,000,000 | 1,165,870 |
| Revenue Bonds |
| Junior Lien |
| Series 2016A |
| 01/01/2033 | 5.000% | | 3,500,000 | 4,072,215 |
| Triborough Bridge & Tunnel Authority |
| Refunding Revenue Bonds |
| General Purpose |
| Series 2011A |
| 01/01/2025 | 5.000% | | 3,000,000 | 3,423,540 |
| Total | 10,850,471 |
| Water & Sewer 1.2% |
| Buffalo Municipal Water Finance Authority |
| Refunding Revenue Bonds |
| Series 2015A |
| 07/01/2028 | 5.000% | | 700,000 | 832,083 |
| Rensselaer County Water Service & Sewer Authority |
| Revenue Bonds |
| Sewer Service |
| Series 2008 |
| 09/01/2028 | 5.100% | | 1,155,000 | 1,178,239 |
| Municipal Bonds (continued) |
| Issue Description | Coupon
Rate | | Principal
Amount ($) | Value ($) |
| Water Service |
| Series 2008 |
| 09/01/2028 | 5.100% | | 570,000 | 581,468 |
| Western Nassau County Water Authority |
| Revenue Bonds |
| Series 2015A |
| 04/01/2027 | 5.000% | | 145,000 | 172,959 |
| 04/01/2028 | 5.000% | | 175,000 | 207,296 |
| Total | 2,972,045 |
Total Municipal Bonds
(Cost $217,407,302) | 227,433,867 |
| Money Market Funds 0.1% |
| | Shares | Value ($) |
| Dreyfus Tax-Exempt Cash Management Fund, Institutional Shares, 0.680%(f) | 340,568 | 340,568 |
Total Money Market Funds
(Cost $340,568) | 340,568 |
Total Investments
(Cost: $223,522,870) | 233,549,435 |
| Other Assets & Liabilities, Net | | 4,663,588 |
| Net Assets | 238,213,023 |
Notes to Portfolio of Investments
| (a) | The Fund is entitled to receive principal and interest from the guarantor after a day or a week’s notice or upon maturity. The maturity date disclosed represents the final maturity. |
| (b) | Represents a variable rate demand note where the coupon rate adjusts on specified dates (generally daily or weekly) using the prevailing money market rate. |
| (c) | Represents privately placed and other securities and instruments exempt from SEC registration (collectively, private placements), such as Section 4(a)(2) and Rule 144A eligible securities, which are often sold only to qualified institutional buyers. The Fund may invest in private placements determined to be liquid as well as those determined to be illiquid. Private placements may be determined to be liquid under guidelines established by the Fund’s Board of Trustees. At October 31, 2017, the value of these securities amounted to $1,520,752, which represents 0.64% of net assets. |
| (d) | Zero coupon bond. |
| (e) | Municipal obligations include debt obligations issued by or on behalf of territories, possessions, or sovereign nations within the territorial boundaries of the United States. At October 31, 2017, the value of these securities amounted to $411,615, which represents 0.17% of net assets. |
| (f) | The rate shown is the seven-day current annualized yield at October 31, 2017. |
Abbreviation Legend
| AGM | Assured Guaranty Municipal Corporation |
| AMBAC | Ambac Assurance Corporation |
| BAM | Build America Mutual Assurance Co. |
| NPFGC | National Public Finance Guarantee Corporation |
The accompanying Notes to Financial Statements are an integral part of this statement.
Columbia AMT-Free New York Intermediate Muni Bond Fund | Annual Report 2017
| 13 |
Portfolio of Investments (continued)
October 31, 2017
Abbreviation Legend (continued)
| VRDN | Variable Rate Demand Note |
Fair value measurements
The Fund categorizes its fair value measurements according to a three-level hierarchy that maximizes the use of observable inputs and minimizes the use of unobservable inputs by prioritizing that the most observable input be used when available. Observable inputs are those that market participants would use in pricing an investment based on market data obtained from sources independent of the reporting entity. Unobservable inputs are those that reflect the Fund’s assumptions about the information market participants would use in pricing an investment. An investment’s level within the fair value hierarchy is based on the lowest level of any input that is deemed significant to the asset’s or liability’s fair value measurement. The input levels are not necessarily an indication of the risk or liquidity associated with investments at that level. For example, certain U.S. government securities are generally high quality and liquid, however, they are reflected as Level 2 because the inputs used to determine fair value may not always be quoted prices in an active market.
Fair value inputs are summarized in the three broad levels listed below:
| • | Level 1 – Valuations based on quoted prices for investments in active markets that the Fund has the ability to access at the measurement date. Valuation adjustments are not applied to Level 1 investments. |
| • | Level 2 – Valuations based on other significant observable inputs (including quoted prices for similar securities, interest rates, prepayment speeds, credit risks, etc.). |
| • | Level 3 – Valuations based on significant unobservable inputs (including the Fund’s own assumptions and judgment in determining the fair value of investments). |
Inputs that are used in determining fair value of an investment may include price information, credit data, volatility statistics, and other factors. These inputs can be either observable or unobservable. The availability of observable inputs can vary between investments, and is affected by various factors such as the type of investment, and the volume and level of activity for that investment or similar investments in the marketplace. The inputs will be considered by the Investment Manager, along with any other relevant factors in the calculation of an investment’s fair value. The Fund uses prices and inputs that are current as of the measurement date, which may include periods of market dislocations. During these periods, the availability of prices and inputs may be reduced for many investments. This condition could cause an investment to be reclassified between the various levels within the hierarchy.
Investments falling into the Level 3 category are primarily supported by quoted prices from brokers and dealers participating in the market for those investments. However, these may be classified as Level 3 investments due to lack of market transparency and corroboration to support these quoted prices. Additionally, valuation models may be used as the pricing source for any remaining investments classified as Level 3. These models may rely on one or more significant unobservable inputs and/or significant assumptions by the Investment Manager. Inputs used in valuations may include, but are not limited to, financial statement analysis, capital account balances, discount rates and estimated cash flows, and comparable company data.
Under the direction of the Fund’s Board of Trustees (the Board), the Investment Manager’s Valuation Committee (the Committee) is responsible for overseeing the valuation procedures approved by the Board. The Committee consists of voting and non-voting members from various groups within the Investment Manager’s organization, including operations and accounting, trading and investments, compliance, risk management and legal.
The Committee meets at least monthly to review and approve valuation matters, which may include a description of specific valuation determinations, data regarding pricing information received from approved pricing vendors and brokers and the results of Board-approved valuation control policies and procedures (the Policies). The Policies address, among other things, instances when market quotations are or are not readily available, including recommendations of third party pricing vendors and a determination of appropriate pricing methodologies; events that require specific valuation determinations and assessment of fair value techniques; securities with a potential for stale pricing, including those that are illiquid, restricted, or in default; and the effectiveness of third party pricing vendors, including periodic reviews of vendors. The Committee meets more frequently, as needed, to discuss additional valuation matters, which may include the need to review back-testing results, review time-sensitive information or approve related valuation actions. The Committee reports to the Board, with members of the Committee meeting with the Board at each of its regularly scheduled meetings to discuss valuation matters and actions during the period, similar to those described earlier.
For investments categorized as Level 3, the Committee monitors information similar to that described above, which may include: (i) data specific to the issuer or comparable issuers, (ii) general market or specific sector news and (iii) quoted prices and specific or similar security transactions. The Committee considers this data and any changes from prior periods in order to assess the reasonableness of observable and unobservable inputs, any assumptions or internal models used to value those securities and changes in fair value. This data is also used to corroborate, when available, information received from approved pricing vendors and brokers. Various factors impact the frequency of monitoring this information (which may occur as often as daily). However, the Committee may determine that changes to inputs, assumptions and models are not required as a result of the monitoring procedures performed.
The following table is a summary of the inputs used to value the Fund’s investments at October 31, 2017:
| | Level 1
quoted prices in active
markets for identical
assets ($) | Level 2
other significant
observable inputs ($) | Level 3
significant
unobservable inputs ($) | Total ($) |
| Investments | | | | |
| Floating Rate Notes | — | 5,775,000 | — | 5,775,000 |
| Municipal Bonds | — | 227,433,867 | — | 227,433,867 |
| Money Market Funds | 340,568 | — | — | 340,568 |
| Total Investments | 340,568 | 233,208,867 | — | 233,549,435 |
See the Portfolio of Investments for all investment classifications not indicated in the table.
The Fund’s assets assigned to the Level 2 input category are generally valued using the market approach, in which a security’s value is determined through reference to prices and information from market transactions for similar or identical assets.
There were no transfers of financial assets between levels during the period.
The accompanying Notes to Financial Statements are an integral part of this statement.
| 14 | Columbia AMT-Free New York Intermediate Muni Bond Fund | Annual Report 2017 |
Statement of Assets and Liabilities
October 31, 2017
| Assets | |
| Investments in unaffiliated issuers, at cost | $223,522,870 |
| Investments in unaffiliated issuers, at value | 233,549,435 |
| Cash | 2,203,934 |
| Receivable for: | |
| Capital shares sold | 226,645 |
| Interest | 3,138,106 |
| Expense reimbursement due from Investment Manager | 920 |
| Prepaid expenses | 1,364 |
| Trustees’ deferred compensation plan | 49,087 |
| Total assets | 239,169,491 |
| Liabilities | |
| Payable for: | |
| Capital shares purchased | 270,448 |
| Distributions to shareholders | 573,896 |
| Management services fees | 3,068 |
| Distribution and/or service fees | 460 |
| Transfer agent fees | 26,188 |
| Compensation of board members | 163 |
| Compensation of chief compliance officer | 10 |
| Other expenses | 33,148 |
| Trustees’ deferred compensation plan | 49,087 |
| Total liabilities | 956,468 |
| Net assets applicable to outstanding capital stock | $238,213,023 |
| Represented by | |
| Paid in capital | 227,886,130 |
| Undistributed net investment income | 212,096 |
| Accumulated net realized gain | 88,232 |
| Unrealized appreciation (depreciation) on: | |
| Investments - unaffiliated issuers | 10,026,565 |
| Total - representing net assets applicable to outstanding capital stock | $238,213,023 |
The accompanying Notes to Financial Statements are an integral part of this statement.
Columbia AMT-Free New York Intermediate Muni Bond Fund | Annual Report 2017
| 15 |
Statement of Assets and Liabilities (continued)
October 31, 2017
| Class A | |
| Net assets | $15,638,923 |
| Shares outstanding | 1,313,047 |
| Net asset value per share | $11.91 |
| Maximum offering price per share(a) | $12.28 |
| Class C | |
| Net assets | $17,014,937 |
| Shares outstanding | 1,428,594 |
| Net asset value per share | $11.91 |
| Class R4 | |
| Net assets | $1,296,393 |
| Shares outstanding | 108,981 |
| Net asset value per share | $11.90 |
| Class R5 | |
| Net assets | $214,981 |
| Shares outstanding | 18,023 |
| Net asset value per share | $11.93 |
| Class V(b) | |
| Net assets | $6,533,205 |
| Shares outstanding | 548,628 |
| Net asset value per share | $11.91 |
| Maximum offering price per share(c) | $12.50 |
| Class Y | |
| Net assets | $334,665 |
| Shares outstanding | 28,000 |
| Net asset value per share | $11.95 |
| Class Z | |
| Net assets | $197,179,919 |
| Shares outstanding | 16,557,925 |
| Net asset value per share | $11.91 |
| (a) | The maximum offering price per share is calculated by dividing the net asset value per share by 1.0 minus the maximum sales charge of 3.00% for Class A shares. |
| (b) | Prior to January 24, 2017, Class V shares were known as Class T shares. |
| (c) | The maximum offering price per share is calculated by dividing the net asset value per share by 1.0 minus the maximum sales charge of 4.75% for Class V shares. |
The accompanying Notes to Financial Statements are an integral part of this statement.
| 16 | Columbia AMT-Free New York Intermediate Muni Bond Fund | Annual Report 2017 |
Statement of Operations
Year Ended October 31, 2017
| Net investment income | |
| Income: | |
| Dividends — unaffiliated issuers | $5,311 |
| Interest | 8,650,707 |
| Total income | 8,656,018 |
| Expenses: | |
| Management services fees | 1,183,001 |
| Distribution and/or service fees | |
| Class A | 45,609 |
| Class B(a) | 120 |
| Class C | 198,779 |
| Class V(b) | 10,047 |
| Transfer agent fees | |
| Class A | 27,425 |
| Class B(a) | 18 |
| Class C | 29,972 |
| Class R4 | 1,872 |
| Class R5 | 133 |
| Class V(b) | 10,045 |
| Class Y(c) | 10 |
| Class Z | 308,128 |
| Compensation of board members | 23,178 |
| Custodian fees | 2,925 |
| Printing and postage fees | 16,138 |
| Registration fees | 25,874 |
| Audit fees | 32,488 |
| Legal fees | 7,198 |
| Compensation of chief compliance officer | 109 |
| Other | (7,274) |
| Total expenses | 1,915,795 |
| Fees waived or expenses reimbursed by Investment Manager and its affiliates | (430,003) |
| Fees waived by distributor | |
| Class C | (59,655) |
| Fees waived by transfer agent | |
| Class R5 | (31) |
| Class Y | (10) |
| Expense reduction | (120) |
| Total net expenses | 1,425,976 |
| Net investment income | 7,230,042 |
| Realized and unrealized gain (loss) — net | |
| Net realized gain (loss) on: | |
| Investments — unaffiliated issuers | 102,528 |
| Net realized gain | 102,528 |
| Net change in unrealized appreciation (depreciation) on: | |
| Investments — unaffiliated issuers | (4,847,359) |
| Net change in unrealized appreciation (depreciation) | (4,847,359) |
| Net realized and unrealized loss | (4,744,831) |
| Net increase in net assets resulting from operations | $2,485,211 |
| (a) | Effective July 17, 2017, Class B shares were automatically converted to Class A shares. |
| (b) | Prior to January 24, 2017, Class V shares were known as Class T shares. |
| (c) | Class Y shares are based on operations from March 1, 2017 (commencement of operations) through the stated period end. |
The accompanying Notes to Financial Statements are an integral part of this statement.
Columbia AMT-Free New York Intermediate Muni Bond Fund | Annual Report 2017
| 17 |
Statement of Changes in Net Assets
| | Year Ended
October 31, 2017 (a) | Year Ended
October 31, 2016 (b) |
| Operations | | |
| Net investment income | $7,230,042 | $8,468,968 |
| Net realized gain | 102,528 | 876,420 |
| Net change in unrealized appreciation (depreciation) | (4,847,359) | (1,711,125) |
| Net increase in net assets resulting from operations | 2,485,211 | 7,634,263 |
| Distributions to shareholders | | |
| Net investment income | | |
| Class A | (493,942) | (801,732) |
| Class B(c) | (238) | (486) |
| Class C | (447,909) | (515,793) |
| Class R4 | (36,585) | (33,340) |
| Class R5 | (5,703) | (356) |
| Class V(d) | (187,400) | (206,884) |
| Class Y | (1,514) | — |
| Class Z | (6,056,635) | (6,886,351) |
| Net realized gains | | |
| Class A | (7,887) | — |
| Class B(c) | (7) | — |
| Class C | (6,700) | — |
| Class R4 | (476) | — |
| Class R5 | (50) | — |
| Class V(d) | (2,028) | — |
| Class Z | (65,762) | — |
| Total distributions to shareholders | (7,312,836) | (8,444,942) |
| Increase (decrease) in net assets from capital stock activity | (50,620,657) | 17,056,634 |
| Total increase (decrease) in net assets | (55,448,282) | 16,245,955 |
| Net assets at beginning of year | 293,661,305 | 277,415,350 |
| Net assets at end of year | $238,213,023 | $293,661,305 |
| Undistributed net investment income | $212,096 | $212,630 |
| (a) | Class Y shares are based on operations from March 1, 2017 (commencement of operations) through the stated period end. |
| (b) | Class R5 shares are based on operations from March 1, 2016 (commencement of operations) through the stated period end. |
| (c) | Effective July 17, 2017, Class B shares were automatically converted to Class A shares. |
| (d) | Prior to January 24, 2017, Class V shares were known as Class T shares. |
The accompanying Notes to Financial Statements are an integral part of this statement.
| 18 | Columbia AMT-Free New York Intermediate Muni Bond Fund | Annual Report 2017 |
Statement of Changes in Net Assets (continued)
| | Year Ended | Year Ended |
| | October 31, 2017 (a) | October 31, 2016 (b) |
| | Shares | Dollars ($) | Shares | Dollars ($) |
| Capital stock activity |
| Class A | | | | |
| Subscriptions (c) | 522,194 | 6,160,607 | 1,082,201 | 13,212,993 |
| Distributions reinvested | 37,576 | 444,401 | 60,869 | 744,775 |
| Redemptions | (1,716,305) | (20,164,940) | (1,427,256) | (17,321,753) |
| Net decrease | (1,156,535) | (13,559,932) | (284,186) | (3,363,985) |
| Class B(d) | | | | |
| Distributions reinvested | 8 | 90 | 23 | 281 |
| Redemptions (c) | (1,992) | (23,573) | — | — |
| Net increase (decrease) | (1,984) | (23,483) | 23 | 281 |
| Class C | | | | |
| Subscriptions | 153,381 | 1,814,068 | 594,386 | 7,275,053 |
| Distributions reinvested | 24,726 | 292,862 | 25,387 | 310,634 |
| Redemptions | (735,795) | (8,710,713) | (270,020) | (3,299,559) |
| Net increase (decrease) | (557,688) | (6,603,783) | 349,753 | 4,286,128 |
| Class R4 | | | | |
| Subscriptions | 81,558 | 961,688 | 102,041 | 1,255,622 |
| Distributions reinvested | 3,111 | 36,767 | 2,702 | 33,032 |
| Redemptions | (109,081) | (1,280,902) | (27,684) | (336,874) |
| Net increase (decrease) | (24,412) | (282,447) | 77,059 | 951,780 |
| Class R5 | | | | |
| Subscriptions | 7,686 | 91,416 | 12,888 | 156,293 |
| Distributions reinvested | 459 | 5,457 | 12 | 149 |
| Redemptions | (3,022) | (36,179) | — | — |
| Net increase | 5,123 | 60,694 | 12,900 | 156,442 |
| Class V(e) | | | | |
| Subscriptions | 3,735 | 44,143 | 1,996 | 24,352 |
| Distributions reinvested | 9,700 | 114,909 | 10,166 | 124,338 |
| Redemptions | (45,784) | (543,062) | (42,885) | (523,704) |
| Net decrease | (32,349) | (384,010) | (30,723) | (375,014) |
| Class Y | | | | |
| Subscriptions | 27,903 | 335,492 | — | — |
| Distributions reinvested | 110 | 1,310 | — | — |
| Redemptions | (13) | (154) | — | — |
| Net increase | 28,000 | 336,648 | — | — |
| Class Z | | | | |
| Subscriptions | 2,674,461 | 31,564,618 | 3,297,115 | 40,311,823 |
| Distributions reinvested | 89,179 | 1,056,922 | 86,560 | 1,058,859 |
| Redemptions | (5,316,232) | (62,785,884) | (2,125,165) | (25,969,680) |
| Net increase (decrease) | (2,552,592) | (30,164,344) | 1,258,510 | 15,401,002 |
| Total net increase (decrease) | (4,292,437) | (50,620,657) | 1,383,336 | 17,056,634 |
| (a) | Class Y shares are based on operations from March 1, 2017 (commencement of operations) through the stated period end. |
| (b) | Class R5 shares are based on operations from March 1, 2016 (commencement of operations) through the stated period end. |
| (c) | Includes conversions of Class B shares to Class A shares, if any. |
| (d) | Effective July 17, 2017, Class B shares were automatically converted to Class A shares. |
| (e) | Prior to January 24, 2017, Class V shares were known as Class T shares. |
The accompanying Notes to Financial Statements are an integral part of this statement.
Columbia AMT-Free New York Intermediate Muni Bond Fund | Annual Report 2017
| 19 |
The following table is intended to help you understand the Fund’s financial performance. Certain information reflects financial results for a single share of a class held for the periods shown. Per share net investment income (loss) amounts are calculated based on average shares outstanding during the period. Total return assumes reinvestment of all dividends and distributions, if any. Total return does not reflect payment of sales charges, if any. Total return and portfolio turnover are not annualized for periods of less than one year. The portfolio turnover rate is calculated without regard to purchase and sales transactions of short-term instruments and certain derivatives, if any. If such transactions were included, the Fund’s portfolio turnover rate may be higher.
| Year ended | Net asset value,
beginning of
period | Net
investment
income | Net
realized
and
unrealized
gain (loss) | Total from
investment
operations | Distributions
from net
investment
income | Distributions
from net
realized
gains |
| Class A |
| 10/31/2017 | $12.09 | 0.32 | (0.18) | 0.14 | (0.32) | (0.00) (c) |
| 10/31/2016 | $12.11 | 0.34 | (0.02) | 0.32 | (0.34) | — |
| 10/31/2015 | $12.21 | 0.36 | (0.10) | 0.26 | (0.36) | — |
| 10/31/2014 | $12.00 | 0.38 | 0.21 | 0.59 | (0.38) | — |
| 10/31/2013 | $12.55 | 0.37 | (0.55) | (0.18) | (0.37) | — |
| Class C |
| 10/31/2017 | $12.09 | 0.27 | (0.18) | 0.09 | (0.27) | (0.00) (c) |
| 10/31/2016 | $12.11 | 0.28 | (0.02) | 0.26 | (0.28) | — |
| 10/31/2015 | $12.20 | 0.30 | (0.09) | 0.21 | (0.30) | — |
| 10/31/2014 | $12.00 | 0.33 | 0.20 | 0.53 | (0.33) | — |
| 10/31/2013 | $12.55 | 0.32 | (0.55) | (0.23) | (0.32) | — |
| Class R4 |
| 10/31/2017 | $12.08 | 0.35 | (0.18) | 0.17 | (0.35) | (0.00) (c) |
| 10/31/2016 | $12.10 | 0.37 | (0.02) | 0.35 | (0.37) | — |
| 10/31/2015 | $12.19 | 0.39 | (0.09) | 0.30 | (0.39) | — |
| 10/31/2014 | $11.99 | 0.41 | 0.20 | 0.61 | (0.41) | — |
| 10/31/2013 (f) | $12.42 | 0.25 | (0.43) | (0.18) | (0.25) | — |
| Class R5 |
| 10/31/2017 | $12.11 | 0.36 | (0.18) | 0.18 | (0.36) | (0.00) (c) |
| 10/31/2016 (h) | $12.23 | 0.25 | (0.12) | 0.13 | (0.25) | — |
| Class V(i) |
| 10/31/2017 | $12.09 | 0.33 | (0.17) | 0.16 | (0.34) | (0.00) (c) |
| 10/31/2016 | $12.11 | 0.35 | (0.02) | 0.33 | (0.35) | — |
| 10/31/2015 | $12.20 | 0.37 | (0.09) | 0.28 | (0.37) | — |
| 10/31/2014 | $11.99 | 0.39 | 0.21 | 0.60 | (0.39) | — |
| 10/31/2013 | $12.55 | 0.38 | (0.56) | (0.18) | (0.38) | — |
The accompanying Notes to Financial Statements are an integral part of this statement.
| 20 | Columbia AMT-Free New York Intermediate Muni Bond Fund | Annual Report 2017 |
Total
distributions to
shareholders | Net
asset
value,
end of
period | Total
return | Total gross
expense
ratio to
average
net assets(a) | Total net
expense
ratio to
average
net assets(a),(b) | Net investment
income
ratio to
average
net assets | Portfolio
turnover | Net
assets,
end of
period
(000’s) |
| |
| (0.32) | $11.91 | 1.24% | 0.91% (d) | 0.74% (d),(e) | 2.70% | 9% | $15,639 |
| (0.34) | $12.09 | 2.63% | 0.95% | 0.75% (e) | 2.76% | 13% | $29,857 |
| (0.36) | $12.11 | 2.15% | 0.96% | 0.75% (e) | 2.95% | 12% | $33,348 |
| (0.38) | $12.21 | 5.01% | 0.96% | 0.75% (e) | 3.17% | 14% | $19,873 |
| (0.37) | $12.00 | (1.49%) | 0.95% | 0.75% (e) | 2.98% | 13% | $18,084 |
| |
| (0.27) | $11.91 | 0.78% | 1.66% (d) | 1.19% (d),(e) | 2.25% | 9% | $17,015 |
| (0.28) | $12.09 | 2.17% | 1.71% | 1.20% (e) | 2.31% | 13% | $24,011 |
| (0.30) | $12.11 | 1.77% | 1.71% | 1.20% (e) | 2.50% | 12% | $19,817 |
| (0.33) | $12.20 | 4.47% | 1.71% | 1.18% (e) | 2.74% | 14% | $18,833 |
| (0.32) | $12.00 | (1.88%) | 1.70% | 1.15% (e) | 2.58% | 13% | $18,498 |
| |
| (0.35) | $11.90 | 1.49% | 0.66% (d) | 0.49% (d),(e) | 2.96% | 9% | $1,296 |
| (0.37) | $12.08 | 2.89% | 0.71% | 0.50% (e) | 3.00% | 13% | $1,611 |
| (0.39) | $12.10 | 2.49% | 0.72% | 0.50% (e) | 3.20% | 12% | $682 |
| (0.41) | $12.19 | 5.19% | 0.72% | 0.50% (e) | 3.39% | 14% | $477 |
| (0.25) | $11.99 | (1.48%) | 0.67% (g) | 0.50% (e),(g) | 3.43% (g) | 13% | $44 |
| |
| (0.36) | $11.93 | 1.56% | 0.58% (d) | 0.42% (d) | 3.02% | 9% | $215 |
| (0.25) | $12.11 | 1.08% | 0.58% (g) | 0.41% (g) | 3.19% (g) | 13% | $156 |
| |
| (0.34) | $11.91 | 1.33% | 0.81% (d) | 0.64% (d),(e) | 2.80% | 9% | $6,533 |
| (0.35) | $12.09 | 2.74% | 0.86% | 0.65% (e) | 2.87% | 13% | $7,022 |
| (0.37) | $12.11 | 2.33% | 0.87% | 0.65% (e) | 3.05% | 12% | $7,406 |
| (0.39) | $12.20 | 5.12% | 0.86% | 0.65% (e) | 3.27% | 14% | $7,744 |
| (0.38) | $11.99 | (1.47%) | 0.85% | 0.65% (e) | 3.08% | 13% | $8,319 |
Columbia AMT-Free New York Intermediate Muni Bond Fund | Annual Report 2017
| 21 |
Financial Highlights (continued)
| Year ended | Net asset value,
beginning of
period | Net
investment
income | Net
realized
and
unrealized
gain (loss) | Total from
investment
operations | Distributions
from net
investment
income | Distributions
from net
realized
gains |
| Class Y |
| 10/31/2017 (j) | $11.81 | 0.24 | 0.14 (k) | 0.38 | (0.24) | — |
| Class Z |
| 10/31/2017 | $12.09 | 0.35 | (0.18) | 0.17 | (0.35) | (0.00) (c) |
| 10/31/2016 | $12.11 | 0.37 | (0.02) | 0.35 | (0.37) | — |
| 10/31/2015 | $12.20 | 0.39 | (0.09) | 0.30 | (0.39) | — |
| 10/31/2014 | $11.99 | 0.41 | 0.21 | 0.62 | (0.41) | — |
| 10/31/2013 | $12.55 | 0.40 | (0.56) | (0.16) | (0.40) | — |
| Notes to Financial Highlights |
| (a) | In addition to the fees and expenses that the Fund bears directly, the Fund indirectly bears a pro rata share of the fees and expenses of any other funds in which it invests. Such indirect expenses are not included in the Fund’s reported expense ratios. |
| (b) | Total net expenses include the impact of certain fee waivers/expense reimbursements made by the Investment Manager and certain of its affiliates, if applicable. |
| (c) | Rounds to zero. |
| (d) | Expenses have been reduced due to a reimbursement of expenses overbilled by a third party. If the reimbursement had been excluded, the expense ratios would have been higher by the percentages shown for each class in the table below. All fee waivers and expense reimbursements by the Investment Manager and its affiliates were applied before giving effect to this third party reimbursement. |
| | Class A | Class C | Class R4 | Class R5 | Class V | Class Z |
| 10/31/2017 | 0.01 % | 0.01 % | 0.01 % | 0.01 % | 0.01 % | 0.01 % |
| (e) | The benefits derived from expense reductions had an impact of less than 0.01%. |
| (f) | Class R4 shares commenced operations on March 19, 2013. Per share data and total return reflect activity from that date. |
| (g) | Annualized. |
| (h) | Class R5 shares commenced operations on March 1, 2016. Per share data and total return reflect activity from that date. |
| (i) | Prior to January 24, 2017, Class V shares were known as Class T shares. |
| (j) | Class Y shares commenced operations on March 1, 2017. Per share data and total return reflect activity from that date. |
| (k) | Calculation of the net gain (loss) per share (both realized and unrealized) does not correlate to the aggregate realized and unrealized gain (loss) presented in the Statement of Operations due to the timing of subscriptions and redemptions of Fund shares in relation to fluctuations in the market value of the portfolio. |
The accompanying Notes to Financial Statements are an integral part of this statement.
| 22 | Columbia AMT-Free New York Intermediate Muni Bond Fund | Annual Report 2017 |
Total
distributions to
shareholders | Net
asset
value,
end of
period | Total
return | Total gross
expense
ratio to
average
net assets(a) | Total net
expense
ratio to
average
net assets(a),(b) | Net investment
income
ratio to
average
net assets | Portfolio
turnover | Net
assets,
end of
period
(000’s) |
| |
| (0.24) | $11.95 | 3.24% | 0.52% (g) | 0.39% (g) | 3.06% (g) | 9% | $335 |
| |
| (0.35) | $11.91 | 1.49% | 0.66% (d) | 0.49% (d),(e) | 2.95% | 9% | $197,180 |
| (0.37) | $12.09 | 2.89% | 0.71% | 0.50% (e) | 3.02% | 13% | $230,980 |
| (0.39) | $12.11 | 2.49% | 0.72% | 0.50% (e) | 3.20% | 12% | $216,139 |
| (0.41) | $12.20 | 5.27% | 0.71% | 0.50% (e) | 3.42% | 14% | $214,517 |
| (0.40) | $11.99 | (1.32%) | 0.70% | 0.50% (e) | 3.22% | 13% | $215,024 |
Columbia AMT-Free New York Intermediate Muni Bond Fund | Annual Report 2017
| 23 |
Notes to Financial Statements
October 31, 2017
Note 1. Organization
Columbia AMT-Free New York Intermediate Muni Bond Fund (the Fund), a series of Columbia Funds Series Trust I (the Trust), is a non-diversified fund. The Trust is registered under the Investment Company Act of 1940, as amended (the 1940 Act), as an open-end management investment company organized as a Massachusetts business trust.
Fund shares
The Trust may issue an unlimited number of shares (without par value). Although all share classes generally have identical voting, dividend and liquidation rights, each share class votes separately when required by the Trust’s organizational documents or by law. Different share classes pay different distribution amounts to the extent the expenses of such share classes differ, and distributions in liquidation will be proportional to the net asset value of each share class. Each share class has its own expense and sales charge structure. The Fund offers each of the share classes identified below.
Class A shares are subject to a maximum front-end sales charge of 3.00% based on the initial investment amount. Class A shares purchased without an initial sales charge are subject to a contingent deferred sales charge (CDSC) of 0.75% on certain investments of $500,000 or more if redeemed within 12 months after purchase.
Class B shares of the Fund are no longer offered for sale. When available, Class B shares were subject to a maximum CDSC of 3.00% based upon the holding period after purchase. Effective July 17, 2017, Class B shares were automatically converted to Class A shares without a CDSC. On August 4, 2017, the capital owned by Columbia Management Investment Advisers, LLC in Class B shares was redeemed without a CDSC.
Class C shares are subject to a 1.00% CDSC on shares redeemed within 12 months after purchase.
Class R4 shares are not subject to sales charges and are generally available only to omnibus retirement plans and certain investors as described in the Fund’s prospectus. Effective November 1, 2017, Class R4 shares were renamed Advisor Class shares.
Class R5 shares are not subject to sales charges and are generally available only to investors purchasing through authorized investment professionals and omnibus retirement plans as described in the Fund’s prospectus. Effective November 1, 2017, Class R5 shares were renamed Institutional 2 Class shares.
Class V shares are subject to a maximum front-end sales charge of 4.75% based on the investment amount. Class V shares purchased without an initial sales charge in accounts aggregating $1 million to $50 million at the time of purchase are subject to a CDSC if the shares are sold within 18 months after purchase, charged as follows: 1.00% CDSC if redeemed within 12 months after purchase, and 0.50% CDSC if redeemed more than 12, but less than 18, months after purchase. Class V shares are available only to investors who received (and who have continuously held) Class V shares in connection with previous fund reorganizations. Prior to January 24, 2017, Class V shares were known as Class T shares.
Class Y shares are not subject to sales charges and are available to institutional and certain other investors as described in the Fund’s prospectus. Class Y shares commenced operations on March 1, 2017. Effective November 1, 2017, Class Y shares were renamed Institutional 3 Class shares.
Class Z shares are not subject to sales charges and are generally available only to eligible investors, which are subject to different investment minimums as described in the Fund’s prospectus. Effective November 1, 2017, Class Z shares were renamed Institutional Class shares.
Note 2. Summary of significant accounting policies
Basis of preparation
The Fund is an investment company that applies the accounting and reporting guidance in the Financial Accounting Standards Board (FASB) Accounting Standards Codification Topic 946, Financial Services - Investment Companies (ASC 946). The financial statements are prepared in accordance with U.S. generally accepted accounting principles (GAAP), which requires management to make certain estimates and assumptions that affect the reported amounts of assets and liabilities, the disclosure of contingent assets and liabilities at the date of the financial statements and the reported amounts of income
| 24 | Columbia AMT-Free New York Intermediate Muni Bond Fund | Annual Report 2017 |
Notes to Financial Statements (continued)
October 31, 2017
and expenses during the reporting period. Actual results could differ from those estimates. The Fund received a reimbursement for expenses overbilled by a third party. Such reimbursement is included as an offset to other expenses on the Statement of Operations. All fee waivers and expense reimbursements by Columbia Management Investment Advisers, LLC and its affiliates were applied before giving effect to the third party reimbursement.
The following is a summary of significant accounting policies followed by the Fund in the preparation of its financial statements.
Security valuation
Debt securities generally are valued by pricing services approved by the Board of Trustees based upon market transactions for normal, institutional-size trading units of similar securities. The services may use various pricing techniques that take into account, as applicable, factors such as yield, quality, coupon rate, maturity, type of issue, trading characteristics and other data, as well as approved independent broker-dealer quotes. Debt securities for which quotations are not readily available or not believed to be reflective of market value may also be valued based upon a bid quote from an approved independent broker-dealer. Debt securities maturing in 60 days or less are valued primarily at amortized cost value, unless this method results in a valuation that management believes does not approximate market value.
Investments in open-end investment companies, including money market funds, are valued at their latest net asset value.
Investments for which market quotations are not readily available, or that have quotations which management believes are not reflective of market value or reliable, are valued at fair value as determined in good faith under procedures approved by and under the general supervision of the Board of Trustees. If a security or class of securities (such as foreign securities) is valued at fair value, such value is likely to be different from the quoted or published price for the security.
The determination of fair value often requires significant judgment. To determine fair value, management may use assumptions including but not limited to future cash flows and estimated risk premiums. Multiple inputs from various sources may be used to determine fair value.
GAAP requires disclosure regarding the inputs and valuation techniques used to measure fair value and any changes in valuation inputs or techniques. In addition, investments shall be disclosed by major category. This information is disclosed following the Fund’s Portfolio of Investments.
Security transactions
Security transactions are accounted for on the trade date. Cost is determined and gains (losses) are based upon the specific identification method for both financial statement and federal income tax purposes.
Income recognition
Interest income is recorded on an accrual basis. Market premiums and discounts, including original issue discounts, are amortized and accreted, respectively, over the expected life of the security on all debt securities, unless otherwise noted.
The Fund may place a debt security on non-accrual status and reduce related interest income when it becomes probable that the interest will not be collected and the amount of uncollectible interest can be reasonably estimated. A defaulted debt security is removed from non-accrual status when the issuer resumes interest payments or when collectibility of interest is reasonably assured.
Dividend income is recorded on the ex-dividend date.
Expenses
General expenses of the Trust are allocated to the Fund and other funds of the Trust based upon relative net assets or other expense allocation methodologies determined by the nature of the expense. Expenses directly attributable to the Fund are charged to the Fund. Expenses directly attributable to a specific class of shares are charged to that share class.
Columbia AMT-Free New York Intermediate Muni Bond Fund | Annual Report 2017
| 25 |
Notes to Financial Statements (continued)
October 31, 2017
Determination of class net asset value
All income, expenses (other than class-specific expenses, which are charged to that share class, as shown in the Statement of Operations) and realized and unrealized gains (losses) are allocated to each class of the Fund on a daily basis, based on the relative net assets of each class, for purposes of determining the net asset value of each class.
Federal income tax status
The Fund intends to qualify each year as a regulated investment company under Subchapter M of the Internal Revenue Code, as amended, and will distribute substantially all of its net tax-exempt and investment company taxable income and net capital gain, if any, for its tax year, and as such will not be subject to federal income taxes. In addition, the Fund intends to distribute in each calendar year substantially all of its ordinary income, capital gain net income and certain other amounts, if any, such that the Fund should not be subject to federal excise tax. Therefore, no federal income or excise tax provision is recorded.
Distributions to shareholders
Distributions from net investment income, if any, are declared daily and paid monthly. Net realized capital gains, if any, are distributed at least annually. Income distributions and capital gain distributions are determined in accordance with federal income tax regulations, which may differ from GAAP.
Guarantees and indemnifications
Under the Trust’s organizational documents and, in some cases, by contract, its officers and trustees are indemnified against certain liabilities arising out of the performance of their duties to the Trust or its funds. In addition, certain of the Fund’s contracts with its service providers contain general indemnification clauses. The Fund’s maximum exposure under these arrangements is unknown since the amount of any future claims that may be made against the Fund cannot be determined, and the Fund has no historical basis for predicting the likelihood of any such claims.
Recent accounting pronouncement
Accounting Standards Update 2017-08 Premium Amortization on Purchased Callable Debt Securities
In March 2017, the Financial Accounting Standards Board issued Accounting Standards Update (ASU) No. 2017-08 Premium Amortization on Purchased Callable Debt Securities. ASU No. 2017-08 updates the accounting standards to shorten the amortization period for certain purchased callable debt securities, held at a premium, to be amortized to the earliest call date. The update applies to securities with explicit, noncontingent call features that are callable at fixed prices and on preset dates. The standard is effective for annual periods beginning after December 15, 2018 and interim periods within those fiscal years. At this time, management is evaluating the implication of this guidance and the impact it will have on the financial statement amounts and footnote disclosures, if any.
Note 3. Fees and other transactions with affiliates
Management services fees
The Fund has entered into a Management Agreement with Columbia Management Investment Advisers, LLC (the Investment Manager), a wholly-owned subsidiary of Ameriprise Financial, Inc. (Ameriprise Financial). Under the Management Agreement, the Investment Manager provides the Fund with investment research and advice, as well as administrative and accounting services. The management services fee is an annual fee that is equal to a percentage of the Fund’s daily net assets that declines from 0.47% to 0.31% as the Fund’s net assets increase. The effective management services fee rate for the year ended October 31, 2017 was 0.47% of the Fund’s average daily net assets.
Compensation of board members
Members of the Board of Trustees, who are not officers or employees of the Investment Manager or Ameriprise Financial, are compensated for their services to the Fund as disclosed in the Statement of Operations. These members of the Board of Trustees may participate in a Deferred Compensation Plan (the Plan) which may be terminated at any time. Obligations of the Plan will be paid solely out of the Fund’s assets, and all amounts payable under the Plan constitute a general unsecured obligation of the Fund.
| 26 | Columbia AMT-Free New York Intermediate Muni Bond Fund | Annual Report 2017 |
Notes to Financial Statements (continued)
October 31, 2017
Compensation of Chief Compliance Officer
The Board of Trustees has appointed a Chief Compliance Officer to the Fund in accordance with federal securities regulations. A portion of the Chief Compliance Officer’s total compensation is allocated to the Fund, along with other affiliated funds governed by the Board of Trustees, based on relative net assets. The total amount allocated to all affiliated funds governed by the Board of Trustees will not exceed $40,000 annually.
Transfer agency fees
Under a Transfer and Dividend Disbursing Agent Agreement, Columbia Management Investment Services Corp. (the Transfer Agent), an affiliate of the Investment Manager and a wholly-owned subsidiary of Ameriprise Financial, is responsible for providing transfer agency services to the Fund. The Transfer Agent has contracted with DST Asset Manager Solutions, Inc. (DST) to serve as sub-transfer agent. The Transfer Agent pays the fees of DST for services as sub-transfer agent and DST is not entitled to reimbursement for such fees from the Fund (with the exception of out-of-pocket fees).
The Fund pays the Transfer Agent a monthly transfer agency fee based on the number or the average value of accounts, depending on the type of account. In addition, the Fund pays the Transfer Agent a fee for shareholder services based on the number of accounts or on a percentage of the average aggregate value of the Fund’s shares maintained in omnibus accounts up to the lesser of the amount charged by the financial intermediary or a cap established by the Board of Trustees from time to time.
The Transfer Agent also receives compensation from the Fund for various shareholder services and reimbursements for certain out-of-pocket fees. Effective August 1, 2017, total transfer agency fees for Class R5 shares and Class Y shares are subject to an annual limitation of not more than 0.07% and 0.02%, respectively, of the average daily net assets attributable to each share class. From January 1, 2017 to July 31, 2017, these limitations were 0.075% for Class R5 shares and 0.025% for Class Y shares. Prior to January 1, 2017, the limitation was 0.05% for Class R5 shares. In addition, effective March 1, 2017 through February 28, 2018, Class R5 shares are subject to a contractual transfer agency fee annual limitation of not more than 0.05% and Class Y shares are subject to a contractual transfer agency fee annual limitation of not more than 0.00% of the average daily net assets attributable to each share class.
For the year ended October 31, 2017, the Fund’s effective transfer agency fee rates as a percentage of average daily net assets of each class were as follows:
| | Effective rate (%) |
| Class A | 0.15 |
| Class B | 0.12 (a),(b) |
| Class C | 0.15 |
| Class R4 | 0.15 |
| Class R5 | 0.05 |
| Class V | 0.15 |
| Class Z | 0.15 |
| (a) | Effective July 17, 2017, Class B shares were automatically converted to Class A shares. |
| (b) | Unannualized. |
An annual minimum account balance fee of $20 may apply to certain accounts with a value below the applicable share class’s initial minimum investment requirements to reduce the impact of small accounts on transfer agency fees. These minimum account balance fees are remitted to the Fund and recorded as part of expense reductions in the Statement of Operations. For the year ended October 31, 2017, these minimum account balance fees reduced total expenses of the Fund by $120.
Distribution and service fees
The Fund has entered into an agreement with Columbia Management Investment Distributors, Inc. (the Distributor), an affiliate of the Investment Manager and a wholly-owned subsidiary of Ameriprise Financial, for distribution and shareholder services. The Board of Trustees has approved, and the Fund has adopted, distribution and shareholder service plans (the
Columbia AMT-Free New York Intermediate Muni Bond Fund | Annual Report 2017
| 27 |
Notes to Financial Statements (continued)
October 31, 2017
Plans) applicable to certain share classes, which set the distribution and service fees for the Fund. These fees are calculated daily and are intended to compensate the Distributor and/or eligible selling and/or servicing agents for selling shares of the Fund and providing services to investors.
Under the Plans, the Fund pays a monthly service fee to the Distributor at the maximum annual rate of 0.25% of the average daily net assets attributable to Class A, Class B and Class C shares of the Fund. Also under the Plans, the Fund pays a monthly distribution fee to the Distributor at the maximum annual rates of 0.75% of the average daily net assets attributable to Class B and Class C shares of the Fund. As a result of all Class B shares of the Fund being redeemed or converted to Class A shares, August 4, 2017 was the last day the Fund paid a service fee or distribution fee for Class B shares.
The Distributor has voluntarily agreed to waive a portion of the distribution fee for Class C shares so that the distribution fee does not exceed 0.45% annually of the average daily net assets attributable to Class C shares. This arrangement may be modified or terminated by the Distributor at any time.
Shareholder services fees
The Fund has adopted a shareholder services plan that permits it to pay for certain services provided to Class V shareholders by their selling and/or servicing agents. The Fund may pay shareholder servicing fees up to an aggregate annual rate of 0.40% of the Fund’s average daily net assets attributable to Class V shares (comprised of up to 0.20% for shareholder liaison services and up to 0.20% for administrative support services). These fees are currently limited to an aggregate annual rate of not more than 0.15% of the Fund’s average daily net assets attributable to Class V shares.
Sales charges (unaudited)
Sales charges, including front-end charges and CDSCs, received by the Distributor for distributing Fund shares for the year ended October 31, 2017, if any, are listed below:
| | Amount ($) |
| Class A | 19,323 |
| Class C | 3,508 |
| Class V | 449 |
Expenses waived/reimbursed by the Investment Manager and its affiliates
The Investment Manager and certain of its affiliates have contractually agreed to waive fees and/or reimburse expenses (excluding certain fees and expenses described below) for the period(s) disclosed below, unless sooner terminated at the sole discretion of the Board of Trustees, so that the Fund’s net operating expenses, after giving effect to fees waived/expenses reimbursed and any balance credits and/or overdraft charges from the Fund’s custodian, do not exceed the following annual rate(s) as a percentage of the class’ average daily net assets:
| | March 1, 2017
through
February 28, 2018 | Prior to
March 1, 2017 |
| Class A | 0.75% | 0.75% |
| Class C | 1.50 | 1.50 |
| Class R4 | 0.50 | 0.50 |
| Class R5 | 0.44 | 0.41 |
| Class V | 0.65 | 0.65 |
| Class Y | 0.39 | — |
| Class Z | 0.50 | 0.50 |
Under the agreement governing these fee waivers and/or expense reimbursement arrangements, the following fees and expenses are excluded from the waiver/reimbursement commitment, and therefore will be paid by the Fund, if applicable: taxes (including foreign transaction taxes), expenses associated with investments in affiliated and non-affiliated pooled investment vehicles (including mutual funds and exchange-traded funds), transaction costs and brokerage commissions, costs related to any securities lending program, dividend expenses associated with securities sold short,
| 28 | Columbia AMT-Free New York Intermediate Muni Bond Fund | Annual Report 2017 |
Notes to Financial Statements (continued)
October 31, 2017
inverse floater program fees and expenses, transaction charges and interest on borrowed money, interest, infrequent and/or unusual expenses and any other expenses the exclusion of which is specifically approved by the Board of Trustees. This agreement may be modified or amended only with approval from the Investment Manager, certain of its affiliates and the Fund. Reflected in the contractual cap commitment, effective March 1, 2017 through February 28, 2018, is the Transfer Agent’s contractual agreement to limit total transfer agency fees to an annual rate of not more than 0.05% for Class R5 and 0.00% for Class Y of the average daily net assets attributable to each share class, unless sooner terminated at the sole discretion of the Board of Trustees. Any fees waived and/or expenses reimbursed under the expense reimbursement arrangements described above are not recoverable by the Investment Manager or its affiliates in future periods. Class C distribution fees waived by the Distributor, as discussed above, are in addition to the waiver/reimbursement commitment under the agreement.
Note 4. Federal tax information
The timing and character of income and capital gain distributions are determined in accordance with income tax regulations, which may differ from GAAP because of temporary or permanent book to tax differences.
At October 31, 2017, these differences are primarily due to differing treatment for trustees’ deferred compensation and distributions. To the extent these differences are permanent, reclassifications are made among the components of the Fund’s net assets in the Statement of Assets and Liabilities. Temporary differences do not require reclassifications.
In the Statement of Assets and Liabilities the following reclassifications were made:
Undistributed net
investment
income ($) | Accumulated
net realized
gain ($) | Paid in
capital ($) |
| (650) | 649 | 1 |
The Fund did not have any permanent differences; therefore, no reclassifications were made to the Statement of Assets and Liabilities.
The tax character of distributions paid during the years indicated was as follows:
| Year Ended October 31, 2017 | Year Ended October 31, 2016 |
Ordinary
income ($) | Tax-exempt
income ($) | Long-term
capital gains ($) | Total ($) | Ordinary
income ($) | Tax-exempt
income ($) | Long-term
capital gains ($) | Total ($) |
| 5,536 | 7,224,390 | 82,910 | 7,312,836 | — | 8,444,942 | — | 8,444,942 |
Short-term capital gain distributions, if any, are considered ordinary income distributions for tax purposes.
At October 31, 2017, the components of distributable earnings on a tax basis were as follows:
Undistributed
ordinary income ($) | Undistributed tax-
exempt income ($) | Undistributed
long-term
capital gains ($) | Capital loss
carryforwards ($) | Net unrealized
appreciation ($) |
| — | 835,079 | 88,232 | — | 10,026,565 |
At October 31, 2017, the cost of all investments for federal income tax purposes along with the aggregate gross unrealized appreciation and depreciation based on that cost was:
Federal
tax cost ($) | Gross unrealized
appreciation ($) | Gross unrealized
(depreciation) ($) | Net unrealized
appreciation ($) |
| 223,522,870 | 10,339,623 | (313,058) | 10,026,565 |
Tax cost of investments and unrealized appreciation/(depreciation) may also include timing differences that do not constitute adjustments to tax basis.
Columbia AMT-Free New York Intermediate Muni Bond Fund | Annual Report 2017
| 29 |
Notes to Financial Statements (continued)
October 31, 2017
Management of the Fund has concluded that there are no significant uncertain tax positions in the Fund that would require recognition in the financial statements. However, management’s conclusion may be subject to review and adjustment at a later date based on factors including, but not limited to, new tax laws, regulations, and administrative interpretations (including relevant court decisions). Generally, the Fund’s federal tax returns for the prior three fiscal years remain subject to examination by the Internal Revenue Service.
Note 5. Portfolio information
The cost of purchases and proceeds from sales of securities, excluding short-term investments and derivatives, if any, aggregated to $21,486,861 and $68,672,380, respectively, for the year ended October 31, 2017. The amount of purchase and sale activity impacts the portfolio turnover rate reported in the Financial Highlights.
Note 6. Line of credit
The Fund has access to a revolving credit facility with a syndicate of banks led by Citibank, N.A., HSBC Bank USA, N.A. and JPMorgan Chase Bank, N.A. whereby the Fund may borrow for the temporary funding of shareholder redemptions or for other temporary or emergency purposes. The credit facility, which is a collective agreement between the Fund and certain other funds managed by the Investment Manager, severally and not jointly, permits collective borrowings up to $1 billion. Interest is charged to each participating fund based on its borrowings at a rate equal to the higher of (i) the overnight federal funds rate plus 1.00% or (ii) the one-month LIBOR rate plus 1.00%. Each borrowing under the credit facility matures no later than 60 days after the date of borrowing. The Fund also pays a commitment fee equal to its pro rata share of the amount of the credit facility at a rate of 0.15% per annum. The commitment fee is included in other expenses in the Statement of Operations.
The Fund had no borrowings during the year ended October 31, 2017.
Note 7. Significant risks
Credit risk
Credit risk is the risk that the value of debt securities in the Fund’s portfolio may decline because the issuer may default and fail to pay interest or repay principal when due. Rating agencies assign credit ratings to debt securities to indicate their credit risk. Lower rated or unrated debt securities held by the Fund may present increased credit risk as compared to higher-rated debt securities.
Geographic concentration risk
Because the Fund invests substantially in municipal securities issued by the state identified in the Fund’s name and political sub-divisions of that state, the Fund will be particularly affected by adverse tax, legislative, regulatory, demographic or political changes as well as changes impacting the state’s financial, economic or other condition and prospects. In addition, because of the relatively small number of issuers of tax-exempt securities in the state, the Fund may invest a higher percentage of assets in a single issuer and, therefore, be more exposed to the risk of loss than a fund that invests more broadly. The value of municipal and other securities owned by the Fund also may be adversely affected by future changes in federal or state income tax laws.
Interest rate risk
Interest rate risk is the risk of losses attributable to changes in interest rates. In general, if prevailing interest rates rise, the values of debt securities tend to fall, and if interest rates fall, the values of debt securities tend to rise. Actions by governments and central banking authorities can result in increases in interest rates. Increasing interest rates may negatively affect the value of debt securities held by the Fund, resulting in a negative impact on the Fund’s performance and net asset value per share. In general, the longer the maturity or duration of a debt security, the greater its sensitivity to changes in interest rates.
| 30 | Columbia AMT-Free New York Intermediate Muni Bond Fund | Annual Report 2017 |
Notes to Financial Statements (continued)
October 31, 2017
Liquidity risk
Liquidity risk is the risk associated with a lack of marketability of investments which may make it difficult to sell the investment at a desirable time or price. Changing regulatory, market or other conditions or environments (for example, the interest rate or credit environments) may adversely affect the liquidity of the Fund’s investments. The Fund may have to accept a lower selling price for the holding, sell other investments, or forego another, more appealing investment opportunity. Generally, the less liquid the market at the time the Fund sells a portfolio investment, the greater the risk of loss or decline of value to the Fund. A less liquid market can lead to an increase in Fund redemptions, which may negatively impact Fund performance and net asset value per share, including, for example, if the Fund is forced to sell securities in a down market.
Non-diversification risk
A non-diversified fund is permitted to invest a greater percentage of its total assets in fewer issuers than a diversified fund. The Fund may, therefore, have a greater risk of loss from a few issuers than a similar fund that invests more broadly.
Shareholder concentration risk
At October 31, 2017, one unaffiliated shareholder of record owned 70.5% of the outstanding shares of the Fund in one or more accounts. The Fund has no knowledge about whether any portion of those shares was owned beneficially. Subscription and redemption activity by concentrated accounts may have a significant effect on the operations of the Fund. In the case of a large redemption, the Fund may be forced to sell investments at inopportune times, including its liquid positions, which may result in Fund losses and the Fund holding a higher percentage of less liquid positions. Large redemptions could result in decreased economies of scale and increased operating expenses for non-redeeming Fund shareholders.
Note 8. Subsequent events
Management has evaluated the events and transactions that have occurred through the date the financial statements were issued. Other than as noted in Note 1 above, there were no items requiring adjustment of the financial statements or additional disclosure.
Note 9. Information regarding pending and settled legal proceedings
Ameriprise Financial and certain of its affiliates have historically been involved in a number of legal, arbitration and regulatory proceedings, including routine litigation, class actions, and governmental actions, concerning matters arising in connection with the conduct of their business activities. Ameriprise Financial believes that the Fund is not currently the subject of, and that neither Ameriprise Financial nor any of its affiliates are the subject of, any pending legal, arbitration or regulatory proceedings that are likely to have a material adverse effect on the Fund or the ability of Ameriprise Financial or its affiliates to perform under their contracts with the Fund. Ameriprise Financial is required to make quarterly (10-Q), annual (10-K) and, as necessary, 8-K filings with the Securities and Exchange Commission (SEC) on legal and regulatory matters that relate to Ameriprise Financial and its affiliates. Copies of these filings may be obtained by accessing the SEC website at www.sec.gov.
There can be no assurance that these matters, or the adverse publicity associated with them, will not result in increased Fund redemptions, reduced sale of Fund shares or other adverse consequences to the Fund. Further, although we believe proceedings are not likely to have a material adverse effect on the Fund or the ability of Ameriprise Financial or its affiliates to perform under their contracts with the Fund, these proceedings are subject to uncertainties and, as such, we are unable to estimate the possible loss or range of loss that may result. An adverse outcome in one or more of these proceedings could result in adverse judgments, settlements, fines, penalties or other relief that could have a material adverse effect on the consolidated financial condition or results of operations of Ameriprise Financial.
Columbia AMT-Free New York Intermediate Muni Bond Fund | Annual Report 2017
| 31 |
Report of Independent Registered Public Accounting Firm
To the Trustees of Columbia Funds Series Trust I and the Shareholders of Columbia AMT-Free New York Intermediate Muni Bond Fund
In our opinion, the accompanying statement of assets and liabilities, including the portfolio of investments, and the related statements of operations and of changes in net assets and the financial highlights present fairly, in all material respects, the financial position of Columbia AMT-Free New York Intermediate Muni Bond Fund (the “Fund”, a series of Columbia Funds Series Trust I) as of October 31, 2017, the results of its operations for the year then ended, the changes in its net assets for each of the two years in the period then ended and the financial highlights for each of the periods indicated therein, in conformity with accounting principles generally accepted in the United States of America. These financial statements and financial highlights (hereafter referred to as “financial statements”) are the responsibility of the Fund’s management. Our responsibility is to express an opinion on these financial statements based on our audits. We conducted our audits of these financial statements in accordance with the standards of the Public Company Accounting Oversight Board (United States). Those standards require that we plan and perform the audit to obtain reasonable assurance about whether the financial statements are free of material misstatement. An audit includes examining, on a test basis, evidence supporting the amounts and disclosures in the financial statements, assessing the accounting principles used and significant estimates made by management, and evaluating the overall financial statement presentation. We believe that our audits, which included confirmation of securities as of October 31, 2017 by correspondence with the custodian and brokers, provide a reasonable basis for our opinion.
/s/ PricewaterhouseCoopers LLP
Minneapolis, MN
December 21, 2017
| 32 | Columbia AMT-Free New York Intermediate Muni Bond Fund | Annual Report 2017 |
Federal Income Tax Information
(Unaudited)
The Fund hereby designates the following tax attributes for the fiscal year ended October 31, 2017. Shareholders will be notified in early 2018 of the amounts for use in preparing 2017 income tax returns.
Capital
gain
dividend | Exempt-
interest
dividends |
| $107,654 | 99.92% |
Capital gain dividend. The Fund designates as a capital gain dividend the amount reflected above, or if subsequently determined to be different, the net capital gain of such fiscal period.
Exempt-interest dividends. The percentage of net investment income distributed during the fiscal year that qualifies as exempt-interest dividends for federal income tax purposes.
Columbia AMT-Free New York Intermediate Muni Bond Fund | Annual Report 2017
| 33 |
Shareholders elect the Board that oversees the Fund’s operations. The Board appoints officers who are responsible for day-to-day business decisions based on policies set by the Board. The following table provides basic biographical information about the Fund’s Trustees, including their principal occupations during the past five years, although specific titles for individuals may have varied over the period. The year set forth beneath Length of Service in the table below is the year in which the Trustee was first appointed or elected as Trustee to any Fund currently in the Columbia Funds Complex or a predecessor thereof. Under current Board policy, members serve terms of indefinite duration.
Independent trustees
| Name, address, year of birth | Position held with the Trust and length of service | Principal occupation(s) during the past five years and other relevant professional experience | Number of Funds in the Columbia Fund Complex overseen | Other directorships held by Trustee during the past five years |
Janet Langford Carrig
c/o Columbia Management
Investment Advisers, LLC
225 Franklin Street
Mail Drop BX32 05228
Boston, MA 02110
1957 | Trustee
1996 | Senior Vice President, General Counsel and Corporate Secretary, ConocoPhillips (independent energy company) since September 2007 | 66 | None |
Douglas A. Hacker
c/o Columbia Management
Investment Advisers, LLC
225 Franklin Street
Mail Drop BX32 05228
Boston, MA 02110
1955 | Trustee and Chairman of the Board
1996 | Independent business executive since May 2006; Executive Vice President — Strategy of United Airlines from December 2002 to May 2006; President of UAL Loyalty Services (airline marketing company) from September 2001 to December 2002; Executive Vice President and Chief Financial Officer of United Airlines from July 1999 to September 2001 | 66 | Spartan Nash Company, (food distributor); Nash Finch Company (food distributor) from 2005 to 2013; Aircastle Limited (aircraft leasing); SeaCube Container Leasing Ltd. (container leasing) from 2010 to 2013; and Travelport Worldwide Limited (travel information technology) |
Nancy T. Lukitsh
c/o Columbia Management
Investment Advisers, LLC
225 Franklin Street
Mail Drop BX32 05228
Boston, MA 02110
1956 | Trustee
2011 | Senior Vice President, Partner and Director of Marketing, Wellington Management Company, LLP (investment adviser) from 1997 to 2010; Chair, Wellington Management Portfolios (commingled non-U.S. investment pools) from 2007 to 2010; Director, Wellington Trust Company, NA and other Wellington affiliates from 1997 to 2010 | 66 | None |
David M. Moffett
c/o Columbia Management
Investment Advisers, LLC
225 Franklin Street
Mail Drop BX32 05228
Boston, MA 02110
1952 | Trustee
2011 | Retired. Consultant to Bridgewater and Associates | 66 | Director, CSX Corporation; Genworth Financial, Inc. (financial and insurance products and services); PayPal Holdings Inc. (payment and data processing services); Trustee, University of Oklahoma Foundation; former Director, eBay Inc. (online trading community), 2007-2015; and former Director, CIT Bank, CIT Group Inc. (commercial and consumer finance), 2010-2016 |
| 34 | Columbia AMT-Free New York Intermediate Muni Bond Fund | Annual Report 2017 |
TRUSTEES AND OFFICERS (continued)
Independent trustees (continued)
| Name, address, year of birth | Position held with the Trust and length of service | Principal occupation(s) during the past five years and other relevant professional experience | Number of Funds in the Columbia Fund Complex overseen | Other directorships held by Trustee during the past five years |
Charles R. Nelson
c/o Columbia Management
Investment Advisers, LLC
225 Franklin Street
Mail Drop BX32 05228
Boston, MA 02110
1942 | Trustee
1981 | Retired. Professor Emeritus, University of Washington since 2011; Professor of Economics, University of Washington from 1976 to 2011; Ford and Louisa Van Voorhis Professor of Political Economy, University of Washington from 1993 to 2011; Adjunct Professor of Statistics, University of Washington from 1980 to 2011; Associate Editor, Journal of Money, Credit and Banking from September 1993 to 2008; consultant on econometric and statistical matters | 66 | None |
John J. Neuhauser
c/o Columbia Management
Investment Advisers, LLC
225 Franklin Street
Mail Drop BX32 05228
Boston, MA 02110
1943 | Trustee
1984 | President, Saint Michael’s College since August 2007; Director or Trustee of several non-profit organizations, including University of Vermont Medical Center; Academic Vice President and Dean of Faculties, Boston College from August 1999 to October 2005; University Professor, Boston College from November 2005 to August 2007 | 66 | Liberty All-Star Equity Fund and Liberty All- Star Growth Fund (closed-end funds) |
Patrick J. Simpson
c/o Columbia Management
Investment Advisers, LLC
225 Franklin Street
Mail Drop BX32 05228
Boston, MA 02110
1944 | Trustee
2000 | Of Counsel, Perkins Coie LLP (law firm) since 2015; Partner, Perkins Coie LLP from 1988 to 2014 | 66 | None |
Anne-Lee Verville
c/o Columbia Management
Investment Advisers, LLC
225 Franklin Street
Mail Drop BX32 05228
Boston, MA 02110
1945 | Trustee
1998 | Retired. General Manager, Global Education Industry from 1994 to 1997, President – Application Systems Division from 1991 to 1994, Chief Financial Officer – US Marketing & Services from 1988 to 1991, and Chief Information Officer from 1987 to 1988, IBM Corporation (computer and technology) | 66 | Enesco Group, Inc. (producer of giftware and home and garden decor products) from 2001 to 2006 |
Columbia AMT-Free New York Intermediate Muni Bond Fund | Annual Report 2017
| 35 |
TRUSTEES AND OFFICERS (continued)
Consultants to the Independent Trustees*
| Name, address, year of birth | Position held with the Trust and length of service | Principal occupation(s) during the past five years and other relevant professional experience | Number of Funds in the Columbia Funds complex overseen | Other directorships held by Trustee during the past five years |
J. Kevin Connaughton
c/o Columbia
Management Investment
Advisers, LLC,
225 Franklin Street
Mail Drop BX32 05228,
Boston, MA 02110
1964 | Independent Trustee Consultant
2016 | Independent Trustee Consultant, Columbia Funds since March 2016; Managing Director and General Manager of Mutual Fund Products, Columbia Management Investment Advisers, LLC from May 2010 to February 2015; President, Columbia Funds from 2009 to 2015; and senior officer of Columbia Funds and affiliated funds from 2003 to 2015 | 66 | Board of Governors, Gateway Healthcare since January 2016; Trustee, New Century Portfolios since March 2015; and Director, The Autism Project since March 2015 |
Natalie A. Trunow
c/o Columbia
Management Investment
Advisers, LLC,
225 Franklin Street
Mail Drop BX32 05228,
Boston, MA 02110
1967 | Independent Trustee Consultant
2016 | Independent Trustee Consultant, Columbia Funds since September 2016; Chief Executive Officer, Millennial Partners (investment consulting services to institutions) since January 2016; Director of Investments, Casey Family Programs from April 2016 to September 2016; Senior Vice President and Chief Investment Officer, Calvert Investments from August 2008 to January 2016; Section Head and Portfolio Manager, General Motors Asset Management from June 1997 to August 2008 | 66 | Healthcare Services for Children with Special Needs |
| * | J. Kevin Connaughton was appointed consultant to the Independent Trustees effective March 1, 2016. Natalie A. Trunow was appointed consultant to the Independent Trustees effective September 1, 2016. Shareholders of the Funds are expected to be asked to elect each of Mr. Connaughton and Ms. Trunow as a Trustee at a future shareholder meeting. |
Interested trustee affiliated with Investment Manager*
| Name, address, year of birth | Position held with the Trust and length of service | Principal occupation(s) during the past five years and other relevant professional experience | Number of Funds in the Columbia Funds Complex overseen | Other directorships held by Trustee during the past five years |
William F. Truscott
c/o Columbia Management
Investment Advisers, LLC
225 Franklin Street
Boston, MA 02110
1960 | Trustee
2012 | Chairman of the Board and President, Columbia Management Investment Advisers, LLC since May 2010 and February 2012, respectively; Chief Executive Officer, Global Asset Management, Ameriprise Financial, Inc. since September 2012 (previously Chief Executive Officer, U.S. Asset Management & President, Annuities, May 2010-September 2012); Director and Chief Executive Officer, Columbia Management Investment Distributors, Inc. since May 2010 and February 2012, respectively; Chairman of the Board and Chief Executive Officer, RiverSource Distributors, Inc. since 2006; Director, Threadneedle Asset Management Holdings, SARL since 2014; President and Chief Executive Officer, Ameriprise Certificate Company, 2006-August 2012 | 189 | Chairman of the Board, Columbia Management Investment Advisers, LLC since May 2010; Director, Columbia Management Investment Distributors, Inc. since May 2010; former Director, Ameriprise Certificate Company, 2006 - January 2013 |
| * | Interested person (as defined under the 1940 Act) by reason of being an officer, director, security holder and/or employee of the Investment Manager or Ameriprise Financial. |
The Statement of Additional Information has additional information about the Fund’s Board members and is available,
without charge, upon request by calling 800.345.6611, contacting your financial intermediary or visiting
investor.columbiathreadneedleus.com.
| 36 | Columbia AMT-Free New York Intermediate Muni Bond Fund | Annual Report 2017 |
TRUSTEES AND OFFICERS (continued)
The Board has appointed officers who are responsible for day-to-day business decisions based on policies it has established. The officers serve at the pleasure of the Board. The following table provides basic information about the Officers of the Fund, including principal occupations during the past five years, although their specific titles may have varied over the period. In addition to Mr. Truscott, who is Senior Vice President, the Fund’s other officers are:
Fund officers
Name,
address and
year of birth | Position and year
first appointed to
position for any Fund
in the Columbia
Funds complex or a
predecessor thereof | Principal occupation(s) during past five years |
Christopher O. Petersen
5228 Ameriprise
Financial Center
Minneapolis, MN 55474
Born 1970 | President and Principal Executive Officer (2015) | Vice President and Lead Chief Counsel, Ameriprise Financial, Inc. since January 2015 (previously, Vice President and Chief Counsel, January 2010 - December 2014; officer of Columbia Funds and affiliated funds since 2007. |
Michael G. Clarke
225 Franklin Street
Boston, MA 02110
Born 1969 | Treasurer (2011), Chief Financial Officer (2009) and Chief Accounting Officer (2015) | Vice President — Mutual Fund Administration, Columbia Management Investment Advisers, LLC, since May 2010; senior officer of Columbia Funds and affiliated funds since 2002. |
Paul B. Goucher
100 Park Avenue
New York, NY 10017
Born 1968 | Senior Vice President (2011) and Assistant Secretary (2008) | Senior Vice President and Assistant General Counsel, Ameriprise Financial, Inc. since January 2017 (previously Vice President and Lead Chief Counsel, November 2008 - January 2017 and January 2013 - January 2017, respectively; and Chief Counsel, January 2010 - January 2013); Vice President, Chief Legal Officer and Assistant Secretary, Columbia Management Investment Advisers, LLC since May 2010. |
Thomas P. McGuire
225 Franklin Street
Boston, MA 02110
Born 1972 | Senior Vice President and Chief Compliance Officer (2012) | Vice President — Asset Management Compliance, Ameriprise Financial, Inc., since May 2010; Chief Compliance Officer, Ameriprise Certificate Company since September 2010. |
Colin Moore
225 Franklin Street
Boston, MA 02110
Born 1958 | Senior Vice President (2010) | Executive Vice President and Global Chief Investment Officer, Ameriprise Financial, Inc., since July 2013; Executive Vice President and Global Chief Investment Officer, Columbia Management Investment Advisers, LLC since July 2013 (previously Director and Global Chief Investment Officer, 2010 - 2013). |
Ryan C. Larrenaga
225 Franklin Street
Boston, MA 02110
Born 1970 | Senior Vice President (2017), Chief Legal Officer (2017) and Secretary (2015) | Vice President and Group Counsel, Ameriprise Financial, Inc. since August 2011; officer of Columbia Funds and affiliated funds since 2005. |
Michael E. DeFao
225 Franklin Street
Boston, MA 02110
Born 1968 | Vice President (2011) and Assistant Secretary (2010) | Vice President and Chief Counsel, Ameriprise Financial, Inc. since May 2010. |
Amy Johnson
5228 Ameriprise
Financial Center
Minneapolis, MN 55474
Born 1965 | Vice President (2006) | Managing Director and Global Head of Operations, Columbia Management Investment Advisers, LLC since April 2016 (previously Managing Director and Chief Operating Officer, 2010 - 2016). |
Lyn Kephart-Strong
5228 Ameriprise
Financial Center
Minneapolis, MN 55474
Born 1960 | Vice President (2015) | President, Columbia Management Investment Services Corp. since October 2014; Vice President & Resolution Officer, Ameriprise Trust Company since August 2009. |
Columbia AMT-Free New York Intermediate Muni Bond Fund | Annual Report 2017
| 37 |
Board Consideration and Approval of Management
Agreement
On June 14, 2017, the Board of Trustees (the Board) and the Trustees who are not interested persons (as defined in the Investment Company Act of 1940) (the Independent Trustees) of Columbia Funds Series Trust I (the Trust) unanimously approved the continuation of the Management Agreement (the Management Agreement) with Columbia Management Investment Advisers, LLC (the Investment Manager) with respect to Columbia AMT-Free New York Intermediate Muni Bond Fund (the Fund), a series of the Trust. As detailed below, the Board’s Advisory Fees and Expenses Committee (the Committee) and the Board met on multiple occasions to review and discuss, both among themselves and with the management team of the Investment Manager, materials provided by the Investment Manager and others before determining to approve the continuation of the Management Agreement.
In connection with their deliberations regarding the continuation of the Management Agreement, the Committee and the Board evaluated materials requested from the Investment Manager regarding the Fund and the Management Agreement, and discussed these materials with representatives of the Investment Manager at Committee meetings held on March 27, 2017, April 26, 2017 and June 13, 2017 and at Board meetings held on March 28, 2017 and June 14, 2017. In addition, the Board considers matters bearing on the Management Agreement at most of its other meetings throughout the year and meets regularly with senior management of the Trust and the Investment Manager. Through the Board’s Investment Oversight Committees, Trustees also meet with selected portfolio managers of the funds the Trustees oversee and other investment personnel at various times throughout the year. The Committee and the Board also consulted with its independent fee consultant, Fund counsel and the Independent Trustees’ independent legal counsel, who advised on various matters with respect to the Committee’s and the Board’s considerations and otherwise assisted the Committee and the Board in their deliberations. On June 13, 2017, the Committee recommended that the Board approve the continuation of the Management Agreement. On June 14, 2017, the Board, including the Independent Trustees, voting separately, unanimously approved the continuation of the Management Agreement for the Fund.
The Committee and the Board considered all information that they, their legal counsel or the Investment Manager believed reasonably necessary to evaluate and to determine whether to recommend for approval or approve the continuation of the Management Agreement. The information and factors considered by the Committee and the Board in recommending for approval or approving the continuation of the Management Agreement for the Fund included the following:
| • | Information on the investment performance of the Fund relative to the performance of a group of mutual funds determined to be comparable to the Fund by an independent third-party data provider, as well as performance relative to benchmarks; |
| • | Information on the Fund’s management fees and total expenses, including information comparing the Fund’s expenses to those of a group of comparable mutual funds, as determined by the independent third-party data provider; |
| • | The Investment Manager’s agreement to contractually limit or cap total operating expenses for the Fund through February 28, 2018 so that total operating expenses (excluding certain fees and expenses, such as transaction costs and certain other investment related expenses, interest, taxes, acquired fund fees and expenses, and infrequent and/or unusual expenses) would not exceed a specified annual rate, as a percentage of the Fund’s net assets; |
| • | The terms and conditions of the Management Agreement; |
| • | The current and proposed terms and conditions of other agreements and arrangements with affiliates of the Investment Manager relating to the operations of the Fund, including agreements with respect to the provision of distribution, transfer agency and shareholder services to the Fund; |
| • | Descriptions of various functions performed by the Investment Manager under the Management Agreement, including portfolio management and portfolio trading practices; |
| • | Information regarding the management fees of similarly-managed portfolios of other clients of the Investment Manager, including institutional separate accounts; |
| • | Information regarding the reputation, regulatory history and resources of the Investment Manager, including information regarding senior management, portfolio managers and other personnel; |
| 38 | Columbia AMT-Free New York Intermediate Muni Bond Fund | Annual Report 2017 |
Board Consideration and Approval of Management
Agreement (continued)
| • | Information regarding the capabilities of the Investment Manager with respect to compliance monitoring services, including an assessment of the Investment Manager’s compliance system by the Fund’s Chief Compliance Officer; and |
| • | The profitability to the Investment Manager and its affiliates from their relationships with the Fund. |
Nature, extent and quality of services provided under the Management Agreement
The Committee and the Board considered the nature, extent and quality of services provided to the Fund by the Investment Manager and its affiliates under the Management Agreement and under separate agreements for the provision of transfer agency and shareholder services, and the resources dedicated to the Fund and the other Columbia Funds by the Investment Manager and its affiliates. The Committee and the Board considered, among other things, the Investment Manager’s ability to attract, motivate and retain highly qualified research, advisory and supervisory investment professionals (including compensation programs for personnel involved in fund management, reputation and other attributes), the portfolio management services provided by those investment professionals, and the quality of the Investment Manager’s investment research capabilities and trade execution services. The Committee and the Board also considered the potential benefits to shareholders of investing in a mutual fund that is part of a fund complex offering exposure to a variety of asset classes and investment disciplines and providing a variety of fund and shareholder services.
The Committee and the Board also considered the professional experience and qualifications of the senior personnel of the Investment Manager, which included consideration of the Investment Manager’s experience with similarly-structured funds. The Committee and the Board noted the compliance programs of and the compliance-related resources provided to the Fund by the Investment Manager and its affiliates, and considered the Investment Manager’s ability to provide administrative services to the Fund and coordinate the activities of the Fund’s other service providers. After reviewing these and related factors, the Committee and the Board concluded, within the context of their overall conclusions, that the nature, extent and quality of the services provided to the Fund under the Management Agreement supported the continuation of the Management Agreement.
Investment performance
The Committee and the Board reviewed information about the performance of the Fund over various time periods, including performance information relative to benchmarks and information that compared the performance of the Fund to the performance of a group of comparable mutual funds as determined by the independent third-party data provider, and data provided by the independent fee consultant. The Committee and the Board also reviewed a description of the third party’s methodology for identifying the Fund’s peer groups for purposes of performance and expense comparisons. Although the Fund’s performance lagged that of a relevant peer group for certain (although not necessarily all) periods, the Committee and the Board concluded that other factors relevant to performance were sufficient, in light of other considerations, to warrant continuation of the Management Agreement. Those factors included one or more of the following: (i) that the Fund’s performance, although lagging in certain recent periods, was stronger over the longer term; (ii) that the underperformance was attributable, to a significant extent, to investment decisions that were reasonable and consistent with the Fund’s investment strategy and policies and that the Fund was performing within a reasonable range of expectations, given those investment decisions, market conditions and the Fund’s investment strategy; (iii) that the Fund’s performance was competitive when compared to other relevant performance benchmarks or peer groups; and (iv) that the Investment Manager had taken or was taking steps designed to help improve the Fund’s investment performance, including, but not limited to, replacing portfolio managers, enhancing the resources supporting the portfolio managers, or modifying investment strategies.
The Committee and the Board noted that, through December 31, 2016, the Fund’s performance was in the seventieth, fortieth and fiftieth percentile (where the best performance would be in the first percentile) of its category selected by the independent third-party data provider for the purposes of performance comparisons for the one-, three- and five-year periods, respectively.
The Committee and the Board also considered the Investment Manager’s performance and reputation generally, the Investment Manager’s historical responsiveness to Board concerns about performance, and the Investment Manager’s willingness to take steps intended to improve performance. After reviewing these and related factors, the Committee and the Board concluded, within the context of their overall conclusions, that the performance of the Fund and the Investment Manager was sufficient, in light of other considerations, to warrant the continuation of the Management Agreement.
Columbia AMT-Free New York Intermediate Muni Bond Fund | Annual Report 2017
| 39 |
Board Consideration and Approval of Management
Agreement (continued)
Investment management fee rates and other expenses
The Committee and the Board considered the management fees charged to the Fund under the Management Agreement as well as the total expenses incurred by the Fund. In assessing the reasonableness of the fees under the Management Agreement, the Committee and the Board considered, among other information, the Fund’s total expense ratio as a percentage of average daily net assets. The Committee and the Board considered data provided by the independent third-party data provider and the independent fee consultant. The Committee and the Board noted that, as of December 31, 2016, the Fund’s actual management fee and net total expense ratio are ranked in the first and third quintiles, respectively, (where the lowest fees and expenses would be in the first quintile) against the Fund’s expense universe as determined by the independent third-party data provider for purposes of expense comparison. The Committee and the Board also took into account the fee waiver and expense limitation arrangements agreed to by the Investment Manager, as noted above.
The Committee and the Board also received and considered information about the management fees charged by the Investment Manager to institutional separate accounts. In considering the fees charged to those accounts, the Committee and the Board took into account, among other things, the Investment Manager’s representations about the differences between managing mutual funds as compared to other types of accounts, including differences in the services provided, differences in the risk profile of such business for the Investment Manager and the additional resources required to manage mutual funds effectively. The Committee and the Board also received and considered information about the fees charged by the Investment Manager for sub-advisory services it provides to comparable unaffiliated funds. In evaluating the Fund’s management fees, the Committee and the Board also took into account the demands, complexity and quality of the investment management of the Fund.
After reviewing these and related factors, the Committee and the Board concluded, within the context of their overall conclusions, that the management fee rates and expenses of the Fund, in light of other considerations, warranted the continuation of the Management Agreement.
Costs of services provided and profitability
The Committee and the Board also took note of the costs the Investment Manager and its affiliates incur in connection with the services provided and the profitability to the Investment Manager and its affiliates from their relationships with the Fund.
The Committee and the Board also considered the compensation directly or indirectly received by the Investment Manager’s affiliates in connection with their relationships with the Fund. The Committee and the Board reviewed information provided by management as to the profitability to the Investment Manager and its affiliates of their relationships with the Fund, information about the allocation of expenses used to calculate profitability, and comparisons of profitability levels realized in 2016 to profitability levels realized in 2015. When reviewing profitability, the Committee and the Board also considered court cases in which adviser profitability was an issue in whole or in part, the performance of similarly managed funds, the performance of the Fund, and the expense ratio of the Fund. In addition, the Committee and the Board considered information provided by the Investment Manager regarding the Investment Manager’s financial condition and comparing its profitability to that of other asset management firms that are, or are subsidiaries of, publicly traded companies. In this regard, the Committee and the Board also considered data provided by the independent fee consultant.
After reviewing these and related factors, the Committee and the Board concluded, within the context of their overall conclusions, that the costs of services provided and the profitability to the Investment Manager and its affiliates from their relationships with the Fund supported the continuation of the Management Agreement.
Economies of scale
The Committee and the Board considered the potential existence of economies of scale in the provision by the Investment Manager of services to the Fund, to groups of related funds, and to the Investment Manager’s investment advisory clients as a whole, and whether those economies of scale were shared with the Fund through breakpoints in investment management fees or other means, such as expense limitation arrangements and additional investments by the Investment Manager in investment, trading, compliance and other resources. The Committee and the Board noted that the management fee schedules for the Fund contained breakpoints that would reduce the fee rate on assets above specified threshold levels.
| 40 | Columbia AMT-Free New York Intermediate Muni Bond Fund | Annual Report 2017 |
Board Consideration and Approval of Management
Agreement (continued)
In considering these matters, the Committee and the Board also considered the costs of the services provided and the profitability to the Investment Manager and its affiliates from their relationships with the Fund, as discussed above. After reviewing these and related factors, the Committee and the Board concluded, within the context of their overall conclusions, that the extent to which any economies of scale were expected to be shared with the Fund supported the continuation of the Management Agreement.
Other benefits to the Investment Manager
The Committee and the Board received and considered information regarding “fall-out” or ancillary benefits received by the Investment Manager and its affiliates as a result of their relationships with the Fund, such as the engagement of the Investment Manager’s affiliates to provide distribution, transfer agency and shareholder services to the Fund. In this regard, among other matters, the Committee and the Board considered that the Fund’s distributor retains a portion of the distribution fees from the Fund and receives a portion of the sales charges on sales or redemptions of certain classes of shares of the Fund. The Committee and the Board also considered the benefits of research made available to the Investment Manager by reason of brokerage commissions generated by the Fund’s securities transactions, and reviewed information about the Investment Manager’s practices with respect to allocating portfolio transactions for brokerage and research services. The Committee and the Board recognized that the Investment Manager’s profitability would be somewhat lower without these benefits.
Conclusion
The Committee and the Board reviewed all of the above considerations in reaching their decisions to recommend or approve the continuation of the Management Agreement. In their deliberations, the Trustees did not identify any particular information that was all-important or controlling, and individual Trustees may have attributed different weights to the various factors. Based on their evaluation of all factors that they deemed to be material, including those factors described above, and assisted by the advice of independent legal counsel, the Board, including the Independent Trustees, voting separately, unanimously approved the continuation of the Management Agreement.
Columbia AMT-Free New York Intermediate Muni Bond Fund | Annual Report 2017
| 41 |
The Fund mails one shareholder report to each shareholder address. If you would like more than one report, please call shareholder services at 800.345.6611 and additional reports will be sent to you.
Proxy voting policies and procedures
The policy of the Board of Trustees is to vote the proxies of the companies in which the Fund holds investments consistent with the procedures as stated in the Statement of Additional Information (SAI). You may obtain a copy of the SAI without charge by calling 800.345.6611; contacting your financial intermediary; visiting investor.columbiathreadneedleus.com; or searching the website of the Securities and Exchange Commission (SEC) at sec.gov. Information regarding how the Fund voted proxies relating to portfolio securities is filed with the SEC by August 31st for the most recent 12-month period ending June 30th of that year, and is available without charge by visiting investor.columbiathreadneedleus.com, or searching the website of the SEC at sec.gov.
Quarterly schedule of investments
The Fund files a complete schedule of portfolio holdings with the SEC for the first and third quarters of each fiscal year on Form N-Q. The Fund’s Form N-Q is available on the SEC’s website at sec.gov and may be reviewed and copied at the SEC’s Public Reference Room in Washington, D.C. Information on the operation of the Public Reference Room may be obtained by calling 800.SEC.0330. The Fund’s complete schedule of portfolio holdings, as filed on Form N-Q, can also be obtained without charge, upon request, by calling 800.345.6611.
Additional Fund information
For more information about the Fund, please visit investor.columbiathreadneedleus.com or call 800.345.6611. Customer Service Representatives are available to answer your questions Monday through Friday from 8 a.m. to 7 p.m. Eastern time.
Fund investment manager
Columbia Management Investment Advisers, LLC
225 Franklin Street
Boston, MA 02110
Fund distributor
Columbia Management Investment Distributors, Inc.
225 Franklin Street
Boston, MA 02110
Fund transfer agent
Columbia Management Investment Services Corp.
P.O. Box 8081
Boston, MA 02266-8081
| 42 | Columbia AMT-Free New York Intermediate Muni Bond Fund | Annual Report 2017 |
[THIS PAGE INTENTIONALLY LEFT BLANK]
[THIS PAGE INTENTIONALLY LEFT BLANK]
[THIS PAGE INTENTIONALLY LEFT BLANK]
Columbia AMT-Free New York Intermediate Muni Bond Fund
P.O. Box 8081
Boston, MA 02266-8081
Please read and consider the investment objectives, risks, charges and expenses for any fund carefully before investing. For a prospectus and summary prospectus, which contains this and other important information about the Fund, go to
investor.columbiathreadneedleus.com. The Fund is distributed by Columbia Management Investment Distributors, Inc., member FINRA, and managed by Columbia Management Investment Advisers, LLC.
Columbia Threadneedle Investments (Columbia Threadneedle) is the global brand name of the Columbia and Threadneedle group of companies. All rights reserved. Columbia Management Investment Distributors, Inc., 225 Franklin Street, Boston, MA 02110-2804
© 2017 Columbia Management Investment Advisers, LLC.
investor.columbiathreadneedleus.com

Annual Report
October 31, 2017
Columbia AMT-Free Connecticut Intermediate Muni Bond Fund
Not FDIC Insured • No bank guarantee • May lose value
Dear Shareholders,
The current outlook for financial markets is clouded by two primary concerns: the high valuation of equities and the direction of interest rates. Following the U.S. presidential election, U.S. equities rallied based on the assumption that the new administration’s policies would stimulate growth quickly. Unfortunately it’s unclear whether those measures will get passed, much less passed quickly. In fixed income, uncertainty stems from the possibility that interest rates won’t rise as rapidly as expected if the administration’s proposed growth policies are not implemented.
Given this uncertainty, investors value a consistent approach more than ever. Investors want strong, repeatable risk-adjusted returns. Consistency — not surprises. As a leading global asset manager, we believe our consistent, collaborative investment approach enables us to deliver the dependable experience your portfolio demands. So, how do we strive to deliver a consistent investment experience?
Better insights
Your portfolio benefits from the investment insights uncovered by our talented investment teams around the world.
Better decisions
Our collaborative, interactive environment enables our investment teams to construct portfolios that take advantage of the best investment ideas.
Better outcomes
We aim to deliver a consistent experience, which means fewer surprises, dependable insights, and products designed to do the thing you want.
Whether you’re trying to save money to help your children go to college or for your own retirement, it’s the consistency of the return that is most essential. People who chase higher returns are usually also the first to sell when that investment goes through a bad patch. We try to combat this behavioral tendency by offering strategies that aim for a more consistent return. Our goal is for investors to panic less during periods of volatility, which can have a significant effect on their long-term results.
Nothing is more important to us than making sure those who have entrusted us to protect and grow their assets can do what matters most to them: build a nest egg, leave a legacy, and live confidently — now and throughout retirement. It’s why our talented professionals around the world work together to uncover uncommon opportunities and why our process encourages challenge and debate around our most compelling ideas to ensure better informed investment decisions, which hopefully lead to better outcomes for you.
Your success is our priority. Talk to your financial advisor about how working with Columbia Threadneedle Investments may help you position your portfolio for consistent, sustainable outcomes, no matter the market conditions.
Sincerely,
Christopher O. Petersen
President, Columbia Funds
Investors should consider the investment objectives, risks, charges and expenses of a mutual fund carefully before investing. For a free prospectus and summary prospectus, which contains this and other important information about a fund, visit investor.columbiathreadneedleus.com. The prospectus should be read carefully before investing.
Columbia Funds are distributed by Columbia Management Investment Distributors, Inc., member FINRA, and managed by Columbia Management Investment Advisers, LLC.
© 2017 Columbia Management Investment Advisers, LLC. All rights reserved.
Columbia AMT-Free Connecticut Intermediate Muni Bond Fund | Annual Report 2017
Columbia AMT-Free Connecticut Intermediate Muni Bond Fund | Annual Report 2017
Investment objective
Columbia AMT-Free Connecticut Intermediate Muni Bond Fund (the Fund) seeks as high a level of current interest income exempt from federal income tax and, to the extent possible, from Connecticut individual income tax, as is consistent with relative stability of principal.
Portfolio management
Brian McGreevy
Co-manager
Managed Fund since 2009
Paul Fuchs, CFA
Co-manager
Managed Fund since October 2012
Effective December 29, 2017, Mr. McGreevy will no longer manage the Fund. Paul Fuchs will continue as co-portfolio manager of the Fund and on December 29, 2017, Deborah Vargo will be added as a co-portfolio manager of the Fund.
| Average annual total returns (%) (for the period ended October 31, 2017) |
| | | Inception | 1 Year | 5 Years | 10 Years |
| Class A | Excluding sales charges | 11/18/02 | 0.28 | 1.53 | 3.05 |
| | Including sales charges | | -2.76 | 0.92 | 2.74 |
| Class C | Excluding sales charges | 11/18/02 | -0.27 | 1.07 | 2.61 |
| | Including sales charges | | -1.24 | 1.07 | 2.61 |
| Class R4* | 03/19/13 | 0.54 | 1.77 | 3.31 |
| Class V | Excluding sales charges | 06/26/00 | 0.28 | 1.62 | 3.15 |
| | Including sales charges | | -4.47 | 0.62 | 2.65 |
| Class Y* | 03/01/17 | 0.59 | 1.80 | 3.32 |
| Class Z | 08/01/94 | 0.44 | 1.77 | 3.30 |
| Bloomberg Barclays 3-15 Year Blend Municipal Bond Index | | 2.05 | 2.70 | 4.39 |
Returns for Class A are shown with and without the maximum initial sales charge of 3.00%. Returns for Class C are shown with and without the 1.00% contingent deferred sales charge (CDSC) for the first year only. Returns for Class V are shown with and without the maximum initial sales charge of 4.75%. The Fund’s other classes are not subject to sales charges and have limited eligibility. Effective November 1, 2017, Class R4, Class Y and Class Z shares were renamed Advisor Class, Institutional 3 Class and Institutional Class shares, respectively. Please see the Fund’s prospectus for details. Performance for different share classes will vary based on differences in sales charges and fees associated with each class. All results shown assume reinvestment of distributions during the period. Returns do not reflect the deduction of taxes that a shareholder may pay on Fund distributions or on the redemption of Fund shares. Performance results reflect the effect of any fee waivers or reimbursements of Fund expenses by Columbia Management Investment Advisers, LLC and/or any of its affiliates. Absent these fee waivers or expense reimbursement arrangements, performance results would have been lower.
The performance information shown represents past performance and is not a guarantee of future results. The investment return and principal value of your investment will fluctuate so that your shares, when redeemed, may be worth more or less than their original cost. Current performance may be lower or higher than the performance information shown. You may obtain performance information current to the most recent month-end by contacting your financial intermediary, visiting investor.columbiathreadneedleus.com or calling 800.345.6611.
| * | The returns shown for periods prior to the share class inception date (including returns for the Life of the Fund, if shown, which are since Fund inception) include the returns of the Fund’s oldest share class. These returns are adjusted to reflect any higher class-related operating expenses of the newer share classes, as applicable. Please visit investor.columbiathreadneedleus.com/investment-products/mutual-funds/appended-performance for more information. |
The Bloomberg Barclays 3–15 Year Blend Municipal Bond Index is an unmanaged index that tracks the performance of municipal bonds issued after December 31, 1990, with remaining maturities between 2 and 17 years and at least $7 million in principal amount outstanding.
Indices are not available for investment, are not professionally managed and do not reflect sales charges, fees, brokerage commissions, taxes or other expenses of investing. Securities in the Fund may not match those in an index.
| 2 | Columbia AMT-Free Connecticut Intermediate Muni Bond Fund | Annual Report 2017 |
Fund at a Glance (continued)
Performance of a hypothetical $10,000 investment (October 31, 2007 — October 31, 2017)
The chart above shows the change in value of a hypothetical $10,000 investment in Class A shares of Columbia AMT-Free Connecticut Intermediate Muni Bond Fund during the stated time period, and does not reflect the deduction of taxes that a shareholder may pay on Fund distributions or on the redemption of Fund shares.
| Quality breakdown (%) (at October 31, 2017) |
| AAA rating | 13.8 |
| AA rating | 22.1 |
| A rating | 55.1 |
| BBB rating | 0.3 |
| BB rating | 0.9 |
| CC rating | 4.3 |
| Not rated | 3.5 |
| Total | 100.0 |
Percentages indicated are based upon total fixed income investments (excluding Money Market Funds).
Bond ratings apply to the underlying holdings of the Fund and not the Fund itself and are divided into categories ranging from highest to lowest credit quality, determined by using the middle rating of Moody’s, S&P and Fitch, after dropping the highest and lowest available ratings. When ratings are available from only two rating agencies, the lower rating is used. When a rating is available from only one rating agency, that rating is used. When a bond is not rated by any rating agency, it is designated as “Not rated.” Credit quality ratings assigned by a rating agency are subjective opinions, not statements of fact, and are subject to change, including daily. The ratings assigned by credit rating agencies are but one of the considerations that the Investment Manager and/or Fund’s subadviser incorporates into its credit analysis process, along with such other issuer-specific factors as cash flows, capital structure and leverage ratios, ability to de-leverage (repay) through free cash flow, quality of management, market positioning and access to capital, as well as such security-specific factors as the terms of the security (e.g., interest rate and time to maturity) and the amount and type of any collateral.
Columbia AMT-Free Connecticut Intermediate Muni Bond Fund | Annual Report 2017
| 3 |
Manager Discussion of Fund Performance
The Fund’s Class A shares returned 0.28% excluding sales charges during the 12-month period ended October 31, 2017. The Fund’s Class Z shares returned 0.44% during the same time period. By comparison, the Fund’s benchmark, the Bloomberg Barclays 3-15 Year Blend Municipal Bond Index, which is national in scope, gained 2.05% for the same 12 months. Connecticut’s bond market lagged the United States as a whole, contributing to the Fund’s underperformance relative to the national benchmark.
Market overview
Despite a rocky start, municipal bonds posted positive returns in the past 12 months. The market initially sold off in the early weeks of the period after the surprising results of the U.S. presidential election raised the prospects of higher growth, tax reform and reduced regulation under a new administration. In the U.S. Treasury market, the yield on the 10-year note rose from 1.79% on the Friday before the election to 2.60% by mid-December. (Prices and yields move in opposite directions). Municipal bond yields followed Treasuries higher in that interval, with yields on AAA-rated, 10-year issues rising by 0.75 percentage points. The sharp sell-off fueled redemptions from municipal bond funds, exacerbating the downturn.
As 2017 progressed, the fear of higher rates began to abate once it became apparent that Congress and the Trump administration would be unable to enact their policy proposals as quickly as originally expected. Investors initially anticipated action on health care and tax reform early in the presidential term, which increased expectations for stronger growth and raised the possibility of higher interest rates. Yields started falling modestly in March 2017 when these developments failed to come to fruition, and the combination of a lower new issue supply and renewed inflows into mutual funds augmented the positive tone in the market. As of October 31, 2017, the year-to-date new-issue supply stood 15-20% below the level reached in the first ten months of 2016. At the same time, demand remained strong as older bonds matured or were called away and investors redeployed the cash back into the tax-exempt area. The ensuing recovery in municipal bonds enabled the asset class to finish in positive territory for the full year.
Pension issues continued to dominate the headlines, with Illinois and Chicago struggling to adopt budgets and several other states, including New Jersey, Connecticut, Pennsylvania and Kentucky, experiencing wider credit spreads as fears of credit-rating downgrades began to emerge. After a drawn-out budget negotiation in Illinois, the state government approved budget and revenue packages in late July. While this favorable development provided some comfort to the market, the ongoing budget issues in Connecticut were a headwind. At the sector level, hospital bonds produced returns slightly better than the benchmark, albeit with greater volatility than in past years due to the potential changes to the Affordable Care Act (ACA).
Weak growth, fiscal woes weighed on Connecticut’s municipal market
Connecticut’s economic growth remained below the national average, with subpar job growth and reduced employment in the struggling public sector. Private industry performed somewhat better, but business costs reduced economic dynamism, which caused corporations to leave the state and contributed to below-average gains in housing prices.
With this backdrop, Connecticut struggled versus the national market for the majority of the year. While most issues experienced tightening yield spreads over the period, spreads on state and local general obligations (GOs) — where the issuers’ budgets are tied to large state budget allotments — widened. As of October 31, the state was rated A1/A+ by Moody’s and Standard & Poor’s, which placed it higher than only Illinois and New Jersey, after the three major rating agencies downgraded Connecticut out of the AA category in May. Further, the state budget, which is normally passed before July 1, was delayed until late October by disagreements between the legislature and the governor. This delay prompted Moody’s to place over 25 cities and towns on negative outlook and put 25 more on review. The city of Hartford also experienced difficulties. The city’s debt was rated below investment grade, as Moody’s dropped its credit rating six notches from A3 to Caa3 in the last two years. Additionally, the mayor hired a bankruptcy specialist to review the possibility of restructuring the city’s debt and other obligations. As a result of these developments, the Connecticut issues in the national benchmark returned almost 0.80 percentage points less than the benchmark as a whole.
| 4 | Columbia AMT-Free Connecticut Intermediate Muni Bond Fund | Annual Report 2017 |
Manager Discussion of Fund Performance (continued)
Contributors and detractors
Consistent with Connecticut’s weak performance, the Fund lagged the national benchmark during the year. Positions in the city of Hartford were the largest detractors from performance. We reduced the Fund’s exposure to Hartford GOs, but the market for the city’s issues was limited for most of the year. The Fund also held a shorter duration than the index, as we maintained a higher cash weighting and a tilt toward more liquid securities in order to offset the credit deterioration that was occurring across the state. (Duration is a measure of interest-rate sensitivity). At a time in which yields fell, this aspect of our positioning detracted.
The Fund’s holdings in state GOs lagged versus their national counterparts, as we had shorter maturity investments in this area. We decreased this position during the year to purchase higher quality bonds such as the AAA rated debt issued by the Connecticut Housing Finance Authority and the Connecticut (State) Revolving Fund.
At the sector level, hospital issues matched the broader benchmark and were the best performing area for the Fund. Housing bonds delivered healthy returns, as well. Fund holdings in higher quality securities that were not tied to the state budget also generated results in line with the average.
Fund positioning
We maintained above-average liquidity and a shorter duration profile to help offset the credit risks in Connecticut. We selectively decreased exposure to issues linked to the state budget, and we focused our new purchases on higher quality issues we believed would not be subject to downgrades if the budget did not pass.
We carefully monitored the budget negotiations throughout the year, and we were pleased that the state passed a budget in October that included resources and money to aid Hartford through its crisis. Prices rebounded on this news late in the period, which we saw as a positive sign. However, we believed the state still faced significant hurdles given its limited capacity for tax or revenue increases and weak growth relative to the rest of the country. We therefore remained cautious on our outlook for the state and its obligations, a stance that was reflected in our preference for higher quality issues.
Fixed-income securities present issuer default risk. The Fund invests substantially in municipal securities and will be affected by tax, legislative, regulatory, demographic or political changes, as well as changes impacting a state’s financial, economic or other conditions. A relatively small number of tax-exempt issuers may necessitate the Fund investing more heavily in a single issuer and, therefore, be more exposed to the risk of loss than a fund that invests more broadly. The value of the Fund’s portfolio may be more volatile than a more geographically diversified fund. Prepayment and extension risk exists because the timing of payments on a loan, bond or other investment may accelerate when interest rates fall or decelerate when interest rates rise which may reduce investment opportunities and potential returns. A rise in interest rates may result in a price decline of fixed-income instruments held by the Fund, negatively impacting its performance and NAV. Falling rates may result in the Fund investing in lower yielding debt instruments, lowering the Fund’s income and yield. These risks may be heightened for longer maturity and duration securities. Non-investment-grade (high-yield or junk) securities present greater price volatility and more risk to principal and income than higher rated securities. Market risk may affect a single issuer, sector of the economy, industry or the market as a whole. Federal and state tax rules apply to capital gain distributions and any gains or losses on sales. Income may be subject to state or local taxes. Liquidity risk is associated with the difficulty of selling underlying investments at a desirable time or price. See the Fund’s prospectus for more information on these and other risks.
The views expressed in this report reflect the current views of the respective parties. These views are not guarantees of future performance and involve certain risks, uncertainties and assumptions that are difficult to predict, so actual outcomes and results may differ significantly from the views expressed. These views are subject to change at any time based upon economic, market or other conditions and the respective parties disclaim any responsibility to update such views. These views may not be relied on as investment advice and, because investment decisions for a Columbia fund are based on numerous factors, may not be relied on as an indication of trading intent on behalf of any particular Columbia fund. References to specific securities should not be construed as a recommendation or investment advice.
Columbia AMT-Free Connecticut Intermediate Muni Bond Fund | Annual Report 2017
| 5 |
Understanding Your Fund’s Expenses
(Unaudited)
As an investor, you incur two types of costs. There are transaction costs, which generally include sales charges on purchases and may include redemption fees. There are also ongoing costs, which generally include management fees, distribution and/or service fees, and other fund expenses. The following information is intended to help you understand your ongoing costs (in dollars) of investing in the Fund and to help you compare these costs with the ongoing costs of investing in other mutual funds.
Analyzing your Fund’s expenses
To illustrate these ongoing costs, we have provided examples and calculated the expenses paid by investors in each share class of the Fund during the period. The actual and hypothetical information in the table is based on an initial investment of $1,000 at the beginning of the period indicated and held for the entire period. Expense information is calculated two ways and each method provides you with different information. The amount listed in the “Actual” column is calculated using the Fund’s actual operating expenses and total return for the period. You may use the Actual information, together with the amount invested, to estimate the expenses that you paid over the period. Simply divide your account value by $1,000 (for example, an $8,600 account value divided by $1,000 = 8.6), then multiply the results by the expenses paid during the period under the “Actual” column. The amount listed in the “Hypothetical” column assumes a 5% annual rate of return before expenses (which is not the Fund’s actual return) and then applies the Fund’s actual expense ratio for the period to the hypothetical return. You should not use the hypothetical account values and expenses to estimate either your actual account balance at the end of the period or the expenses you paid during the period. See “Compare with other funds” below for details on how to use the hypothetical data.
Compare with other funds
Since all mutual funds are required to include the same hypothetical calculations about expenses in shareholder reports, you can use this information to compare the ongoing cost of investing in the Fund with other funds. To do so, compare the hypothetical example with the 5% hypothetical examples that appear in the shareholder reports of other funds. As you compare hypothetical examples of other funds, it is important to note that hypothetical examples are meant to highlight the ongoing costs of investing in a fund only and do not reflect any transaction costs, such as sales charges, or redemption or exchange fees. Therefore, the hypothetical calculations are useful in comparing ongoing costs only, and will not help you determine the relative total costs of owning different funds. If transaction costs were included in these calculations, your costs would be higher.
| May 1, 2017 — October 31, 2017 |
| | Account value at the
beginning of the
period ($) | Account value at the
end of the
period ($) | Expenses paid during
the period ($) | Fund’s annualized
expense ratio (%) |
| | Actual | Hypothetical | Actual | Hypothetical | Actual | Hypothetical | Actual |
| Class A | 1,000.00 | 1,000.00 | 1,010.40 | 1,021.40 | 4.10 | 4.12 | 0.80 |
| Class C | 1,000.00 | 1,000.00 | 1,007.20 | 1,019.06 | 6.44 | 6.48 | 1.26 |
| Class R4 | 1,000.00 | 1,000.00 | 1,010.80 | 1,022.63 | 2.87 | 2.89 | 0.56 |
| Class V (formerly Class T) | 1,000.00 | 1,000.00 | 1,010.00 | 1,021.86 | 3.64 | 3.66 | 0.71 |
| Class Y | 1,000.00 | 1,000.00 | 1,011.30 | 1,023.19 | 2.31 | 2.32 | 0.45 |
| Class Z | 1,000.00 | 1,000.00 | 1,010.80 | 1,022.63 | 2.87 | 2.89 | 0.56 |
Expenses paid during the period are equal to the annualized expense ratio for each class as indicated above, multiplied by the average account value over the period and then multiplied by the number of days in the Fund’s most recent fiscal half year and divided by 365.
Expenses do not include fees and expenses incurred indirectly by the Fund from its investment in underlying funds, including affiliated and non-affiliated pooled investment vehicles, such as mutual funds and exchange-traded funds.
Had Columbia Management Investment Advisers, LLC and/or certain of its affiliates not waived/reimbursed certain fees and expenses, account value at the end of the period would have been reduced.
| 6 | Columbia AMT-Free Connecticut Intermediate Muni Bond Fund | Annual Report 2017 |
Portfolio of Investments
October 31, 2017
(Percentages represent value of investments compared to net assets)
| Municipal Bonds 97.6% |
| Issue Description | Coupon
Rate | | Principal
Amount ($) | Value ($) |
| Higher Education 10.2% |
| Connecticut State Health & Educational Facility Authority |
| Refunding Revenue Bonds |
| Connecticut College |
| Series 2016L |
| 07/01/2033 | 4.000% | | 500,000 | 526,170 |
| Connecticut State University |
| Series 2014O |
| 11/01/2025 | 4.000% | | 2,000,000 | 2,207,700 |
| Quinnipiac University |
| Series 2016M |
| 07/01/2029 | 5.000% | | 2,000,000 | 2,339,700 |
| Yale University |
| Series 2016A-2 |
| 07/01/2042 | 2.000% | | 2,000,000 | 1,951,540 |
| Revenue Bonds |
| Fairfield University |
| Series 2008N |
| 07/01/2022 | 5.000% | | 2,500,000 | 2,561,750 |
| Sacred Heart University |
| Series 2011G |
| 07/01/2020 | 5.000% | | 1,190,000 | 1,285,355 |
| Trinity College |
| Series 1998F (NPFGC) |
| 07/01/2021 | 5.500% | | 355,000 | 387,092 |
| Unrefunded Revenue Bonds |
| Quinnipiac University |
| Series 2008 (NPFGC) |
| 07/01/2028 | 5.000% | | 1,105,000 | 1,132,216 |
| Total | 12,391,523 |
| Hospital 18.0% |
| Connecticut State Health & Educational Facility Authority |
| Revenue Bonds |
| Bridgeport Hospital |
| Series 2012D |
| 07/01/2022 | 5.000% | | 1,400,000 | 1,611,330 |
| Hartford Healthcare |
| Series 2014E |
| 07/01/2034 | 5.000% | | 2,360,000 | 2,640,557 |
| Health System Catholic East |
| Series 2010 |
| 11/15/2029 | 4.750% | | 3,420,000 | 3,631,014 |
| Lawrence & Memorial Hospital |
| Series 2011S |
| 07/01/2031 | 5.000% | | 2,000,000 | 2,156,340 |
| Middlesex Hospital |
| Series 2011N |
| 07/01/2020 | 5.000% | | 1,365,000 | 1,489,925 |
| 07/01/2021 | 5.000% | | 1,000,000 | 1,120,570 |
| Municipal Bonds (continued) |
| Issue Description | Coupon
Rate | | Principal
Amount ($) | Value ($) |
| Trinity Health Corp. |
| Series 2016 |
| 12/01/2032 | 5.000% | | 2,000,000 | 2,334,000 |
| Western Connecticut Health Network |
| Series 2011 |
| 07/01/2019 | 5.000% | | 1,760,000 | 1,864,720 |
| 07/01/2020 | 5.000% | | 1,630,000 | 1,763,953 |
| Yale-New Haven Health |
| Series 2014A |
| 07/01/2031 | 5.000% | | 2,500,000 | 2,885,425 |
| Yale-New Haven Hospital |
| Series 2013N |
| 07/01/2025 | 5.000% | | 300,000 | 346,077 |
| Total | 21,843,911 |
| Investor Owned 4.5% |
| Connecticut State Development Authority |
| Refunding Revenue Bonds |
| Connecticut Light & Power Co. Project |
| Series 2011 |
| 09/01/2028 | 4.375% | | 5,000,000 | 5,476,350 |
| Joint Power Authority 0.9% |
| Connecticut Municipal Electric Energy Cooperative |
| Revenue Bonds |
| Series 2012A |
| 01/01/2027 | 5.000% | | 1,000,000 | 1,114,600 |
| Local General Obligation 22.1% |
| City of Bridgeport |
| Unlimited General Obligation Bonds |
| Series 2014A (AGM) |
| 07/01/2031 | 5.000% | | 1,350,000 | 1,542,577 |
| Unlimited General Obligation Refunding Bonds |
| Series 2004C (NPFGC) |
| 08/15/2021 | 5.500% | | 700,000 | 790,797 |
| City of Danbury |
| Unlimited General Obligation Refunding Bonds |
| Series 2017B |
| 07/15/2029 | 3.000% | | 750,000 | 770,273 |
| City of Hartford |
| Unlimited General Obligation Bonds |
| Series 2011A |
| 04/01/2022 | 5.250% | | 1,325,000 | 1,290,391 |
| Unlimited General Obligation Refunding Bonds |
| Series 2005C (NPFGC) |
| 09/01/2019 | 5.000% | | 1,585,000 | 1,660,066 |
| Series 2013A |
| 04/01/2026 | 5.000% | | 810,000 | 784,112 |
The accompanying Notes to Financial Statements are an integral part of this statement.
Columbia AMT-Free Connecticut Intermediate Muni Bond Fund | Annual Report 2017
| 7 |
Portfolio of Investments (continued)
October 31, 2017
| Municipal Bonds (continued) |
| Issue Description | Coupon
Rate | | Principal
Amount ($) | Value ($) |
| City of Middletown |
| Unlimited General Obligation Bonds |
| Series 2015 |
| 04/01/2026 | 5.000% | | 2,000,000 | 2,474,700 |
| City of New Britain |
| Unrefunded Unlimited General Obligation Bonds |
| Series 2016A (BAM) |
| 03/01/2025 | 5.000% | | 490,000 | 584,595 |
| City of New Haven |
| Unlimited General Obligation Bonds |
| Series 2015 (AGM) |
| 09/01/2027 | 5.000% | | 1,200,000 | 1,400,964 |
| Unlimited General Obligation Refunding Bonds |
| Series 2008 (AGM) |
| 11/01/2018 | 5.000% | | 1,750,000 | 1,811,460 |
| Series 2015B (BAM) |
| 08/15/2027 | 5.000% | | 750,000 | 874,957 |
| City of Norwalk |
| Unlimited General Obligation Refunding Bonds |
| Series 2017B |
| 07/01/2026 | 4.000% | | 750,000 | 858,368 |
| City of Waterbury |
| Unlimited General Obligation Bonds |
| Lot A |
| Series 2015 (BAM) |
| 08/01/2031 | 5.000% | | 500,000 | 585,990 |
| 08/01/2032 | 5.000% | | 500,000 | 582,930 |
| Town of Bloomfield |
| Unlimited General Obligation Refunding Bonds |
| Series 2017 |
| 08/01/2029 | 4.000% | | 450,000 | 509,724 |
| Town of Brookfield |
| Unlimited General Obligation Refunding Bonds |
| Series 2014 |
| 08/01/2025 | 5.000% | | 325,000 | 398,304 |
| Town of Fairfield |
| Unlimited General Obligation Refunding Bonds |
| Series 2008 |
| 01/01/2020 | 5.000% | | 1,000,000 | 1,083,150 |
| 01/01/2022 | 5.000% | | 500,000 | 574,520 |
| Town of Guilford |
| Unlimited General Obligation Refunding Bonds |
| Series 2016A |
| 08/15/2029 | 4.000% | | 450,000 | 501,057 |
| Town of Hamden |
| Unlimited General Obligation Bonds |
| Series 2014A (BAM) |
| 08/15/2023 | 5.000% | | 320,000 | 365,168 |
| Municipal Bonds (continued) |
| Issue Description | Coupon
Rate | | Principal
Amount ($) | Value ($) |
| Town of North Haven |
| Unlimited General Obligation Bonds |
| Series 2007 |
| 07/15/2024 | 4.750% | | 1,150,000 | 1,356,114 |
| 07/15/2025 | 4.750% | | 1,150,000 | 1,370,167 |
| Town of Ridgefield |
| Unlimited General Obligation Refunding Bonds |
| Series 2009 |
| 09/15/2020 | 5.000% | | 2,130,000 | 2,358,229 |
| Town of Stratford |
| Unlimited General Obligation Refunding Bonds |
| Series 2014 |
| 12/15/2032 | 5.000% | | 600,000 | 681,528 |
| Town of Trumbull |
| Unlimited General Obligation Refunding Bonds |
| Series 2009 |
| 09/15/2020 | 4.000% | | 575,000 | 605,216 |
| 09/15/2021 | 4.000% | | 600,000 | 630,390 |
| Series 2017B |
| 09/01/2030 | 4.000% | | 350,000 | 393,131 |
| Total | 26,838,878 |
| Multi-Family 1.7% |
| Bridgeport Housing Authority |
| Revenue Bonds |
| Custodial Receipts Energy Performance |
| Series 2009 |
| 06/01/2022 | 5.000% | | 1,035,000 | 1,032,226 |
| 06/01/2023 | 5.000% | | 1,085,000 | 1,076,928 |
| Total | 2,109,154 |
| Municipal Power 0.3% |
| Guam Power Authority(a) |
| Refunding Revenue Bonds |
| Series 2012A (AGM) |
| 10/01/2024 | 5.000% | | 315,000 | 355,074 |
| Pool / Bond Bank 2.9% |
| State of Connecticut Clean Water Fund - State Revolving Fund |
| Revenue Bonds |
| Green Bond |
| Series 2017A |
| 05/01/2034 | 5.000% | | 3,000,000 | 3,577,410 |
| Prep School 4.4% |
| Connecticut State Health & Educational Facility Authority |
| Revenue Bonds |
| Greenwich Academy |
| Series 2007E (AGM) |
| 03/01/2026 | 5.250% | | 2,770,000 | 3,229,183 |
The accompanying Notes to Financial Statements are an integral part of this statement.
| 8 | Columbia AMT-Free Connecticut Intermediate Muni Bond Fund | Annual Report 2017 |
Portfolio of Investments (continued)
October 31, 2017
| Municipal Bonds (continued) |
| Issue Description | Coupon
Rate | | Principal
Amount ($) | Value ($) |
| Loomis Chaffe School |
| Series 2005F (AMBAC) |
| 07/01/2027 | 5.250% | | 1,670,000 | 2,070,149 |
| Total | 5,299,332 |
| Refunded / Escrowed 3.3% |
| City of Hartford |
| Prerefunded 04/01/21 Unlimited General Obligation Bonds |
| Series 2011A |
| 04/01/2023 | 5.250% | | 1,325,000 | 1,489,737 |
| 04/01/2024 | 5.250% | | 1,325,000 | 1,489,737 |
| City of New Britain |
| Unlimited General Obligation Refunding Bonds |
| Series 2016A Escrowed to Maturity (BAM) |
| 03/01/2025 | 5.000% | | 10,000 | 12,211 |
| Puerto Rico Highway & Transportation Authority(a) |
| Refunding Revenue Bonds |
| Series 2005BB Escrowed to Maturity (AGM) |
| 07/01/2022 | 5.250% | | 895,000 | 1,037,735 |
| Total | 4,029,420 |
| Retirement Communities 0.8% |
| Connecticut State Health & Educational Facility Authority(b) |
| Revenue Bonds |
| Church Home of Hartford, Inc. |
| Series 2016 |
| 09/01/2046 | 5.000% | | 1,000,000 | 1,025,780 |
| Single Family 2.5% |
| Connecticut Housing Finance Authority |
| Refunding Revenue Bonds |
| Series 2016A-1 |
| 11/15/2045 | 4.000% | | 890,000 | 961,022 |
| Subordinated Series 2017C-1 |
| 11/15/2027 | 2.800% | | 1,000,000 | 1,007,390 |
| Subordinated Series 2017D-1 |
| 11/15/2032 | 3.200% | | 1,000,000 | 1,008,150 |
| Total | 2,976,562 |
| Special Non Property Tax 7.8% |
| State of Connecticut Special Tax |
| Revenue Bonds |
| Transportation Infrastructure |
| Series 2009A |
| 12/01/2019 | 4.500% | | 2,600,000 | 2,760,810 |
| Series 2013A |
| 10/01/2026 | 5.000% | | 2,845,000 | 3,260,626 |
| Series 2014A |
| 09/01/2025 | 5.000% | | 2,500,000 | 2,922,625 |
| Municipal Bonds (continued) |
| Issue Description | Coupon
Rate | | Principal
Amount ($) | Value ($) |
| Territory of Guam(a) |
| Revenue Bonds |
| Series 2011A |
| 01/01/2031 | 5.000% | | 550,000 | 579,475 |
| Total | 9,523,536 |
| Special Property Tax 1.8% |
| Harbor Point Infrastructure Improvement District |
| Tax Allocation Bonds |
| Harbor Point Project |
| Series 2010A |
| 04/01/2022 | 7.000% | | 2,016,000 | 2,156,152 |
| State Appropriated 3.1% |
| University of Connecticut |
| Revenue Bonds |
| Series 2009A |
| 02/15/2023 | 5.000% | | 2,000,000 | 2,093,240 |
| Series 2015A |
| 02/15/2029 | 5.000% | | 1,500,000 | 1,720,335 |
| Total | 3,813,575 |
| State General Obligation 3.7% |
| Connecticut Housing Finance Authority |
| Revenue Bonds |
| State Supported Special Obligation |
| Series 2009-10 |
| 06/15/2019 | 5.000% | | 1,000,000 | 1,057,930 |
| State of Connecticut |
| Unlimited General Obligation Bonds |
| Series 2008B |
| 04/15/2022 | 5.000% | | 2,800,000 | 2,844,548 |
| Unlimited General Obligation Refunding Bonds |
| Series 2005B (AMBAC) |
| 06/01/2020 | 5.250% | | 600,000 | 655,620 |
| Total | 4,558,098 |
| Water & Sewer 9.6% |
| Greater New Haven Water Pollution Control Authority |
| Refunding Revenue Bonds |
| Series 2014B |
| 08/15/2031 | 5.000% | | 1,000,000 | 1,157,140 |
| Series 2016A |
| 11/15/2028 | 4.000% | | 150,000 | 167,068 |
| 11/15/2029 | 4.000% | | 500,000 | 550,965 |
| 11/15/2030 | 4.000% | | 400,000 | 438,752 |
| 11/15/2031 | 4.000% | | 100,000 | 109,270 |
| 11/15/2032 | 4.000% | | 440,000 | 476,771 |
The accompanying Notes to Financial Statements are an integral part of this statement.
Columbia AMT-Free Connecticut Intermediate Muni Bond Fund | Annual Report 2017
| 9 |
Portfolio of Investments (continued)
October 31, 2017
| Municipal Bonds (continued) |
| Issue Description | Coupon
Rate | | Principal
Amount ($) | Value ($) |
| South Central Connecticut Regional Water Authority |
| Refunding Revenue Bonds |
| 20th Series 2007A (NPFGC) |
| 08/01/2022 | 5.250% | | 1,370,000 | 1,597,680 |
| 08/01/2023 | 5.250% | | 500,000 | 594,975 |
| 27th Series 2012 |
| 08/01/2029 | 5.000% | | 2,945,000 | 3,376,207 |
| 29th Series 2014 |
| 08/01/2025 | 5.000% | | 500,000 | 586,975 |
| 32nd Series 2016B |
| 08/01/2035 | 4.000% | | 1,750,000 | 1,883,700 |
| Revenue Bonds |
| 18th Series 2003B (NPFGC) |
| 08/01/2029 | 5.250% | | 750,000 | 763,095 |
| Total | 11,702,598 |
Total Municipal Bonds
(Cost $114,293,899) | 118,791,953 |
| Money Market Funds 0.4% |
| | Shares | Value ($) |
| Dreyfus Tax-Exempt Cash Management Fund, Institutional Shares, 0.680%(c) | 479,549 | 479,549 |
Total Money Market Funds
(Cost $479,549) | 479,549 |
Total Investments
(Cost: $114,773,448) | 119,271,502 |
| Other Assets & Liabilities, Net | | 2,413,863 |
| Net Assets | 121,685,365 |
Notes to Portfolio of Investments
| (a) | Municipal obligations include debt obligations issued by or on behalf of territories, possessions, or sovereign nations within the territorial boundaries of the United States. At October 31, 2017, the value of these securities amounted to $1,972,284, which represents 1.62% of net assets. |
| (b) | Represents privately placed and other securities and instruments exempt from SEC registration (collectively, private placements), such as Section 4(a)(2) and Rule 144A eligible securities, which are often sold only to qualified institutional buyers. The Fund may invest in private placements determined to be liquid as well as those determined to be illiquid. Private placements may be determined to be liquid under guidelines established by the Fund’s Board of Trustees. At October 31, 2017, the value of these securities amounted to $1,025,780, which represents 0.84% of net assets. |
| (c) | The rate shown is the seven-day current annualized yield at October 31, 2017. |
Abbreviation Legend
| AGM | Assured Guaranty Municipal Corporation |
| AMBAC | Ambac Assurance Corporation |
| BAM | Build America Mutual Assurance Co. |
| NPFGC | National Public Finance Guarantee Corporation |
Fair value measurements
The Fund categorizes its fair value measurements according to a three-level hierarchy that maximizes the use of observable inputs and minimizes the use of unobservable inputs by prioritizing that the most observable input be used when available. Observable inputs are those that market participants would use in pricing an investment based on market data obtained from sources independent of the reporting entity. Unobservable inputs are those that reflect the Fund’s assumptions about the information market participants would use in pricing an investment. An investment’s level within the fair value hierarchy is based on the lowest level of any input that is deemed significant to the asset’s or liability’s fair value measurement. The input levels are not necessarily an indication of the risk or liquidity associated with investments at that level. For example, certain U.S. government securities are generally high quality and liquid, however, they are reflected as Level 2 because the inputs used to determine fair value may not always be quoted prices in an active market.
Fair value inputs are summarized in the three broad levels listed below:
| • | Level 1 – Valuations based on quoted prices for investments in active markets that the Fund has the ability to access at the measurement date. Valuation adjustments are not applied to Level 1 investments. |
| • | Level 2 – Valuations based on other significant observable inputs (including quoted prices for similar securities, interest rates, prepayment speeds, credit risks, etc.). |
| • | Level 3 – Valuations based on significant unobservable inputs (including the Fund’s own assumptions and judgment in determining the fair value of investments). |
Inputs that are used in determining fair value of an investment may include price information, credit data, volatility statistics, and other factors. These inputs can be either observable or unobservable. The availability of observable inputs can vary between investments, and is affected by various factors such as the type of investment, and the volume and level of activity for that investment or similar investments in the marketplace. The inputs will be considered by the Investment Manager, along with any other relevant factors in the calculation of an investment’s fair value. The Fund uses prices and inputs that are current as of the measurement date, which may include periods of market dislocations. During these periods, the availability of prices and inputs may be reduced for many investments. This condition could cause an investment to be reclassified between the various levels within the hierarchy.
The accompanying Notes to Financial Statements are an integral part of this statement.
| 10 | Columbia AMT-Free Connecticut Intermediate Muni Bond Fund | Annual Report 2017 |
Portfolio of Investments (continued)
October 31, 2017
Fair value measurements (continued)
Investments falling into the Level 3 category are primarily supported by quoted prices from brokers and dealers participating in the market for those investments. However, these may be classified as Level 3 investments due to lack of market transparency and corroboration to support these quoted prices. Additionally, valuation models may be used as the pricing source for any remaining investments classified as Level 3. These models may rely on one or more significant unobservable inputs and/or significant assumptions by the Investment Manager. Inputs used in valuations may include, but are not limited to, financial statement analysis, capital account balances, discount rates and estimated cash flows, and comparable company data.
Under the direction of the Fund’s Board of Trustees (the Board), the Investment Manager’s Valuation Committee (the Committee) is responsible for overseeing the valuation procedures approved by the Board. The Committee consists of voting and non-voting members from various groups within the Investment Manager’s organization, including operations and accounting, trading and investments, compliance, risk management and legal.
The Committee meets at least monthly to review and approve valuation matters, which may include a description of specific valuation determinations, data regarding pricing information received from approved pricing vendors and brokers and the results of Board-approved valuation control policies and procedures (the Policies). The Policies address, among other things, instances when market quotations are or are not readily available, including recommendations of third party pricing vendors and a determination of appropriate pricing methodologies; events that require specific valuation determinations and assessment of fair value techniques; securities with a potential for stale pricing, including those that are illiquid, restricted, or in default; and the effectiveness of third party pricing vendors, including periodic reviews of vendors. The Committee meets more frequently, as needed, to discuss additional valuation matters, which may include the need to review back-testing results, review time-sensitive information or approve related valuation actions. The Committee reports to the Board, with members of the Committee meeting with the Board at each of its regularly scheduled meetings to discuss valuation matters and actions during the period, similar to those described earlier.
For investments categorized as Level 3, the Committee monitors information similar to that described above, which may include: (i) data specific to the issuer or comparable issuers, (ii) general market or specific sector news and (iii) quoted prices and specific or similar security transactions. The Committee considers this data and any changes from prior periods in order to assess the reasonableness of observable and unobservable inputs, any assumptions or internal models used to value those securities and changes in fair value. This data is also used to corroborate, when available, information received from approved pricing vendors and brokers. Various factors impact the frequency of monitoring this information (which may occur as often as daily). However, the Committee may determine that changes to inputs, assumptions and models are not required as a result of the monitoring procedures performed.
The following table is a summary of the inputs used to value the Fund’s investments at October 31, 2017:
| | Level 1
quoted prices in active
markets for identical
assets ($) | Level 2
other significant
observable inputs ($) | Level 3
significant
unobservable inputs ($) | Total ($) |
| Investments | | | | |
| Municipal Bonds | — | 118,791,953 | — | 118,791,953 |
| Money Market Funds | 479,549 | — | — | 479,549 |
| Total Investments | 479,549 | 118,791,953 | — | 119,271,502 |
See the Portfolio of Investments for all investment classifications not indicated in the table.
The Fund’s assets assigned to the Level 2 input category are generally valued using the market approach, in which a security’s value is determined through reference to prices and information from market transactions for similar or identical assets.
There were no transfers of financial assets between levels during the period.
The accompanying Notes to Financial Statements are an integral part of this statement.
Columbia AMT-Free Connecticut Intermediate Muni Bond Fund | Annual Report 2017
| 11 |
Statement of Assets and Liabilities
October 31, 2017
| Assets | |
| Investments in unaffiliated issuers, at cost | $114,773,448 |
| Investments in unaffiliated issuers, at value | 119,271,502 |
| Cash | 1,360,613 |
| Receivable for: | |
| Capital shares sold | 54,891 |
| Interest | 1,385,155 |
| Expense reimbursement due from Investment Manager | 342 |
| Prepaid expenses | 714 |
| Trustees’ deferred compensation plan | 46,963 |
| Total assets | 122,120,180 |
| Liabilities | |
| Payable for: | |
| Capital shares purchased | 51,239 |
| Distributions to shareholders | 291,103 |
| Management services fees | 1,567 |
| Distribution and/or service fees | 162 |
| Transfer agent fees | 12,242 |
| Compensation of board members | 184 |
| Compensation of chief compliance officer | 6 |
| Audit fees | 29,693 |
| Other expenses | 1,656 |
| Trustees’ deferred compensation plan | 46,963 |
| Total liabilities | 434,815 |
| Net assets applicable to outstanding capital stock | $121,685,365 |
| Represented by | |
| Paid in capital | 116,844,918 |
| Undistributed net investment income | 154,700 |
| Accumulated net realized gain | 187,693 |
| Unrealized appreciation (depreciation) on: | |
| Investments - unaffiliated issuers | 4,498,054 |
| Total - representing net assets applicable to outstanding capital stock | $121,685,365 |
The accompanying Notes to Financial Statements are an integral part of this statement.
| 12 | Columbia AMT-Free Connecticut Intermediate Muni Bond Fund | Annual Report 2017 |
Statement of Assets and Liabilities (continued)
October 31, 2017
| Class A | |
| Net assets | $6,423,811 |
| Shares outstanding | 608,555 |
| Net asset value per share | $10.56 |
| Maximum offering price per share(a) | $10.89 |
| Class C | |
| Net assets | $3,914,060 |
| Shares outstanding | 370,872 |
| Net asset value per share | $10.55 |
| Class R4 | |
| Net assets | $510,837 |
| Shares outstanding | 48,462 |
| Net asset value per share | $10.54 |
| Class V(b) | |
| Net assets | $10,456,420 |
| Shares outstanding | 991,937 |
| Net asset value per share | $10.54 |
| Maximum offering price per share(c) | $11.07 |
| Class Y | |
| Net assets | $10,028 |
| Shares outstanding | 948 |
| Net asset value per share | $10.58 |
| Class Z | |
| Net assets | $100,370,209 |
| Shares outstanding | 9,511,446 |
| Net asset value per share | $10.55 |
| (a) | The maximum offering price per share is calculated by dividing the net asset value per share by 1.0 minus the maximum sales charge of 3.00% for Class A shares. |
| (b) | Prior to January 24, 2017, Class V shares were known as Class T shares. |
| (c) | The maximum offering price per share is calculated by dividing the net asset value per share by 1.0 minus the maximum sales charge of 4.75% for Class V shares. |
The accompanying Notes to Financial Statements are an integral part of this statement.
Columbia AMT-Free Connecticut Intermediate Muni Bond Fund | Annual Report 2017
| 13 |
Statement of Operations
Year Ended October 31, 2017
| Net investment income | |
| Income: | |
| Dividends — unaffiliated issuers | $3,536 |
| Interest | 4,661,951 |
| Total income | 4,665,487 |
| Expenses: | |
| Management services fees | 629,541 |
| Distribution and/or service fees | |
| Class A | 19,635 |
| Class B(a) | 75 |
| Class C | 47,776 |
| Class V(b) | 16,176 |
| Transfer agent fees | |
| Class A | 12,559 |
| Class B(a) | 13 |
| Class C | 7,698 |
| Class R4 | 1,164 |
| Class V(b) | 17,086 |
| Class Y(c) | 1 |
| Class Z | 174,929 |
| Compensation of board members | 20,950 |
| Custodian fees | 2,216 |
| Printing and postage fees | 15,142 |
| Registration fees | 18,569 |
| Audit fees | 32,483 |
| Legal fees | 3,843 |
| Compensation of chief compliance officer | 58 |
| Other | (25,691) |
| Total expenses | 994,223 |
| Fees waived or expenses reimbursed by Investment Manager and its affiliates | (201,139) |
| Fees waived by distributor | |
| Class C | (14,338) |
| Expense reduction | (80) |
| Total net expenses | 778,666 |
| Net investment income | 3,886,821 |
| Realized and unrealized gain (loss) — net | |
| Net realized gain (loss) on: | |
| Investments — unaffiliated issuers | 189,179 |
| Net realized gain | 189,179 |
| Net change in unrealized appreciation (depreciation) on: | |
| Investments — unaffiliated issuers | (4,163,278) |
| Net change in unrealized appreciation (depreciation) | (4,163,278) |
| Net realized and unrealized loss | (3,974,099) |
| Net decrease in net assets resulting from operations | $(87,278) |
| (a) | Effective July 17, 2017, Class B shares were automatically converted to Class A shares. |
| (b) | Prior to January 24, 2017, Class V shares were known as Class T shares. |
| (c) | Class Y shares are based on operations from March 1, 2017 (commencement of operations) through the stated period end. |
The accompanying Notes to Financial Statements are an integral part of this statement.
| 14 | Columbia AMT-Free Connecticut Intermediate Muni Bond Fund | Annual Report 2017 |
Statement of Changes in Net Assets
| | Year Ended
October 31, 2017 (a) | Year Ended
October 31, 2016 |
| Operations | | |
| Net investment income | $3,886,821 | $4,557,618 |
| Net realized gain | 189,179 | 590,010 |
| Net change in unrealized appreciation (depreciation) | (4,163,278) | (1,107,943) |
| Net increase (decrease) in net assets resulting from operations | (87,278) | 4,039,685 |
| Distributions to shareholders | | |
| Net investment income | | |
| Class A | (212,452) | (254,935) |
| Class B(b) | (146) | (2,211) |
| Class C | (107,652) | (135,716) |
| Class R4 | (21,180) | (40,115) |
| Class V(c) | (301,809) | (323,350) |
| Class Y | (202) | — |
| Class Z | (3,239,852) | (3,784,693) |
| Net realized gains | | |
| Class A | (39,500) | (15,347) |
| Class B(b) | (37) | (296) |
| Class C | (21,149) | (12,442) |
| Class R4 | (5,090) | (2,456) |
| Class V(c) | (42,593) | (22,614) |
| Class Z | (473,569) | (246,638) |
| Total distributions to shareholders | (4,465,231) | (4,840,813) |
| Increase (decrease) in net assets from capital stock activity | (34,506,941) | 4,518,949 |
| Total increase (decrease) in net assets | (39,059,450) | 3,717,821 |
| Net assets at beginning of year | 160,744,815 | 157,026,994 |
| Net assets at end of year | $121,685,365 | $160,744,815 |
| Undistributed net investment income | $154,700 | $151,191 |
| (a) | Class Y shares are based on operations from March 1, 2017 (commencement of operations) through the stated period end. |
| (b) | Effective July 17, 2017, Class B shares were automatically converted to Class A shares. |
| (c) | Prior to January 24, 2017, Class V shares were known as Class T shares. |
The accompanying Notes to Financial Statements are an integral part of this statement.
Columbia AMT-Free Connecticut Intermediate Muni Bond Fund | Annual Report 2017
| 15 |
Statement of Changes in Net Assets (continued)
| | Year Ended | Year Ended |
| | October 31, 2017 (a) | October 31, 2016 |
| | Shares | Dollars ($) | Shares | Dollars ($) |
| Capital stock activity |
| Class A(b) | | | | |
| Subscriptions (c) | 154,732 | 1,642,887 | 335,086 | 3,685,920 |
| Distributions reinvested | 19,098 | 201,210 | 17,757 | 194,824 |
| Redemptions | (573,715) | (6,047,598) | (85,781) | (941,770) |
| Net increase (decrease) | (399,885) | (4,203,501) | 267,062 | 2,938,974 |
| Class B(b) | | | | |
| Subscriptions | — | — | 54 | 595 |
| Distributions reinvested | — | — | 149 | 1,637 |
| Redemptions (c) | (920) | (10,306) | (13,452) | (147,724) |
| Net decrease | (920) | (10,306) | (13,249) | (145,492) |
| Class C | | | | |
| Subscriptions | 16,198 | 170,196 | 60,354 | 663,978 |
| Distributions reinvested | 10,752 | 113,305 | 10,365 | 113,665 |
| Redemptions | (184,821) | (1,955,180) | (144,425) | (1,586,341) |
| Net decrease | (157,871) | (1,671,679) | (73,706) | (808,698) |
| Class R4 | | | | |
| Subscriptions | 36,619 | 385,017 | 20,024 | 220,112 |
| Distributions reinvested | 2,468 | 25,945 | 3,856 | 42,259 |
| Redemptions | (117,497) | (1,233,880) | (14,349) | (156,244) |
| Net increase (decrease) | (78,410) | (822,918) | 9,531 | 106,127 |
| Class V(d) | | | | |
| Subscriptions | 6,914 | 72,783 | 4,164 | 45,651 |
| Distributions reinvested | 18,712 | 196,995 | 17,230 | 188,778 |
| Redemptions | (97,053) | (1,024,821) | (42,757) | (468,961) |
| Net decrease | (71,427) | (755,043) | (21,363) | (234,532) |
| Class Y | | | | |
| Subscriptions | 949 | 10,013 | — | — |
| Redemptions | (1) | (10) | — | — |
| Net increase | 948 | 10,003 | — | — |
| Class Z | | | | |
| Subscriptions | 1,325,318 | 13,972,291 | 1,564,355 | 17,151,989 |
| Distributions reinvested | 20,768 | 218,941 | 18,857 | 206,857 |
| Redemptions | (3,909,331) | (41,244,729) | (1,340,711) | (14,696,276) |
| Net increase (decrease) | (2,563,245) | (27,053,497) | 242,501 | 2,662,570 |
| Total net increase (decrease) | (3,270,810) | (34,506,941) | 410,776 | 4,518,949 |
| (a) | Class Y shares are based on operations from March 1, 2017 (commencement of operations) through the stated period end. |
| (b) | Effective July 17, 2017, Class B shares were automatically converted to Class A shares. |
| (c) | Includes conversions of Class B shares to Class A shares, if any. |
| (d) | Prior to January 24, 2017, Class V shares were known as Class T shares. |
The accompanying Notes to Financial Statements are an integral part of this statement.
| 16 | Columbia AMT-Free Connecticut Intermediate Muni Bond Fund | Annual Report 2017 |
[THIS PAGE INTENTIONALLY LEFT BLANK]
Columbia AMT-Free Connecticut Intermediate Muni Bond Fund | Annual Report 2017
| 17 |
The following table is intended to help you understand the Fund’s financial performance. Certain information reflects financial results for a single share of a class held for the periods shown. Per share net investment income (loss) amounts are calculated based on average shares outstanding during the period. Total return assumes reinvestment of all dividends and distributions, if any. Total return does not reflect payment of sales charges, if any. Total return and portfolio turnover are not annualized for periods of less than one year. The portfolio turnover rate is calculated without regard to purchase and sales transactions of short-term instruments and certain derivatives, if any. If such transactions were included, the Fund’s portfolio turnover rate may be higher.
| Year ended | Net asset value,
beginning of
period | Net
investment
income | Net
realized
and
unrealized
gain (loss) | Total from
investment
operations | Distributions
from net
investment
income | Distributions
from net
realized
gains |
| Class A |
| 10/31/2017 | $10.86 | 0.29 | (0.26) | 0.03 | (0.29) | (0.04) |
| 10/31/2016 | $10.91 | 0.29 | (0.03) | 0.26 | (0.29) | (0.02) |
| 10/31/2015 | $11.06 | 0.30 | (0.13) | 0.17 | (0.30) | (0.02) |
| 10/31/2014 | $10.85 | 0.31 | 0.21 | 0.52 | (0.31) | — |
| 10/31/2013 | $11.34 | 0.29 | (0.44) | (0.15) | (0.29) | (0.05) |
| Class C |
| 10/31/2017 | $10.86 | 0.24 | (0.27) | (0.03) | (0.24) | (0.04) |
| 10/31/2016 | $10.91 | 0.24 | (0.03) | 0.21 | (0.24) | (0.02) |
| 10/31/2015 | $11.06 | 0.25 | (0.13) | 0.12 | (0.25) | (0.02) |
| 10/31/2014 | $10.85 | 0.26 | 0.21 | 0.47 | (0.26) | — |
| 10/31/2013 | $11.34 | 0.25 | (0.44) | (0.19) | (0.25) | (0.05) |
| Class R4 |
| 10/31/2017 | $10.84 | 0.31 | (0.26) | 0.05 | (0.31) | (0.04) |
| 10/31/2016 | $10.90 | 0.32 | (0.04) | 0.28 | (0.32) | (0.02) |
| 10/31/2015 | $11.05 | 0.33 | (0.13) | 0.20 | (0.33) | (0.02) |
| 10/31/2014 | $10.84 | 0.34 | 0.21 | 0.55 | (0.34) | — |
| 10/31/2013 (e) | $11.19 | 0.20 | (0.35) | (0.15) | (0.20) | — |
| Class V(g) |
| 10/31/2017 | $10.85 | 0.30 | (0.27) | 0.03 | (0.30) | (0.04) |
| 10/31/2016 | $10.90 | 0.30 | (0.03) | 0.27 | (0.30) | (0.02) |
| 10/31/2015 | $11.05 | 0.31 | (0.12) | 0.19 | (0.32) | (0.02) |
| 10/31/2014 | $10.85 | 0.32 | 0.21 | 0.53 | (0.33) | — |
| 10/31/2013 | $11.34 | 0.31 | (0.45) | (0.14) | (0.30) | (0.05) |
| Class Y |
| 10/31/2017 (h) | $10.55 | 0.21 | 0.03 (i) | 0.24 | (0.21) | — |
The accompanying Notes to Financial Statements are an integral part of this statement.
| 18 | Columbia AMT-Free Connecticut Intermediate Muni Bond Fund | Annual Report 2017 |
Total
distributions to
shareholders | Net
asset
value,
end of
period | Total
return | Total gross
expense
ratio to
average
net assets(a) | Total net
expense
ratio to
average
net assets(a),(b) | Net investment
income
ratio to
average
net assets | Portfolio
turnover | Net
assets,
end of
period
(000’s) |
| |
| (0.33) | $10.56 | 0.28% | 0.93% (c) | 0.77% (c),(d) | 2.71% | 6% | $6,424 |
| (0.31) | $10.86 | 2.40% | 0.98% | 0.81% (d) | 2.64% | 12% | $10,952 |
| (0.32) | $10.91 | 1.60% | 0.99% | 0.81% (d) | 2.76% | 6% | $8,090 |
| (0.31) | $11.06 | 4.83% | 0.99% | 0.81% (d) | 2.81% | 12% | $7,711 |
| (0.34) | $10.85 | (1.34%) | 0.97% | 0.80% (d) | 2.67% | 9% | $9,016 |
| |
| (0.28) | $10.55 | (0.27%) | 1.68% (c) | 1.23% (c),(d) | 2.26% | 6% | $3,914 |
| (0.26) | $10.86 | 1.94% | 1.73% | 1.26% (d) | 2.20% | 12% | $5,742 |
| (0.27) | $10.91 | 1.14% | 1.74% | 1.26% (d) | 2.32% | 6% | $6,574 |
| (0.26) | $11.06 | 4.37% | 1.74% | 1.24% (d) | 2.38% | 12% | $6,264 |
| (0.30) | $10.85 | (1.74%) | 1.72% | 1.20% (d) | 2.26% | 9% | $6,977 |
| |
| (0.35) | $10.54 | 0.54% | 0.66% (c) | 0.51% (c),(d) | 2.96% | 6% | $511 |
| (0.34) | $10.84 | 2.56% | 0.73% | 0.56% (d) | 2.89% | 12% | $1,376 |
| (0.35) | $10.90 | 1.86% | 0.74% | 0.56% (d) | 3.04% | 6% | $1,279 |
| (0.34) | $11.05 | 5.13% | 0.74% | 0.56% (d) | 3.08% | 12% | $416 |
| (0.20) | $10.84 | (1.36%) | 0.62% (f) | 0.56% (d),(f) | 2.92% (f) | 9% | $2 |
| |
| (0.34) | $10.54 | 0.28% | 0.83% (c) | 0.68% (c),(d) | 2.80% | 6% | $10,456 |
| (0.32) | $10.85 | 2.50% | 0.88% | 0.71% (d) | 2.75% | 12% | $11,536 |
| (0.34) | $10.90 | 1.72% | 0.89% | 0.71% (d) | 2.87% | 6% | $11,823 |
| (0.33) | $11.05 | 4.93% | 0.89% | 0.71% (d) | 2.91% | 12% | $12,431 |
| (0.35) | $10.85 | (1.25%) | 0.87% | 0.70% (d) | 2.76% | 9% | $13,287 |
| |
| (0.21) | $10.58 | 2.31% | 0.56% (f) | 0.45% (f) | 3.02% (f) | 6% | $10 |
Columbia AMT-Free Connecticut Intermediate Muni Bond Fund | Annual Report 2017
| 19 |
Financial Highlights (continued)
| Year ended | Net asset value,
beginning of
period | Net
investment
income | Net
realized
and
unrealized
gain (loss) | Total from
investment
operations | Distributions
from net
investment
income | Distributions
from net
realized
gains |
| Class Z |
| 10/31/2017 | $10.86 | 0.31 | (0.27) | 0.04 | (0.31) | (0.04) |
| 10/31/2016 | $10.91 | 0.32 | (0.03) | 0.29 | (0.32) | (0.02) |
| 10/31/2015 | $11.06 | 0.33 | (0.13) | 0.20 | (0.33) | (0.02) |
| 10/31/2014 | $10.85 | 0.33 | 0.21 | 0.54 | (0.33) | — |
| 10/31/2013 | $11.34 | 0.32 | (0.44) | (0.12) | (0.32) | (0.05) |
| Notes to Financial Highlights |
| (a) | In addition to the fees and expenses that the Fund bears directly, the Fund indirectly bears a pro rata share of the fees and expenses of any other funds in which it invests. Such indirect expenses are not included in the Fund’s reported expense ratios. |
| (b) | Total net expenses include the impact of certain fee waivers/expense reimbursements made by the Investment Manager and certain of its affiliates, if applicable. |
| (c) | Expenses have been reduced due to a reimbursement of expenses overbilled by a third party. If the reimbursement had been excluded, the expense ratios would have been higher by the percentages shown for each class in the table below. All fee waivers and expense reimbursements by the Investment Manager and its affiliates were applied before giving effect to this third party reimbursement. |
| | Class A | Class C | Class R4 | Class V | Class Z |
| 10/31/2017 | 0.04 % | 0.03 % | 0.05 % | 0.03 % | 0.03 % |
| (d) | The benefits derived from expense reductions had an impact of less than 0.01%. |
| (e) | Class R4 shares commenced operations on March 19, 2013. Per share data and total return reflect activity from that date. |
| (f) | Annualized. |
| (g) | Prior to January 24, 2017, Class V shares were known as Class T shares. |
| (h) | Class Y shares commenced operations on March 1, 2017. Per share data and total return reflect activity from that date. |
| (i) | Calculation of the net gain (loss) per share (both realized and unrealized) does not correlate to the aggregate realized and unrealized gain (loss) presented in the Statement of Operations due to the timing of subscriptions and redemptions of Fund shares in relation to fluctuations in the market value of the portfolio. |
The accompanying Notes to Financial Statements are an integral part of this statement.
| 20 | Columbia AMT-Free Connecticut Intermediate Muni Bond Fund | Annual Report 2017 |
Total
distributions to
shareholders | Net
asset
value,
end of
period | Total
return | Total gross
expense
ratio to
average
net assets(a) | Total net
expense
ratio to
average
net assets(a),(b) | Net investment
income
ratio to
average
net assets | Portfolio
turnover | Net
assets,
end of
period
(000’s) |
| |
| (0.35) | $10.55 | 0.44% | 0.68% (c) | 0.53% (c),(d) | 2.95% | 6% | $100,370 |
| (0.34) | $10.86 | 2.66% | 0.73% | 0.56% (d) | 2.90% | 12% | $131,129 |
| (0.35) | $10.91 | 1.85% | 0.74% | 0.56% (d) | 3.02% | 6% | $129,107 |
| (0.33) | $11.06 | 5.09% | 0.74% | 0.56% (d) | 3.06% | 12% | $137,832 |
| (0.37) | $10.85 | (1.10%) | 0.72% | 0.55% (d) | 2.91% | 9% | $152,543 |
Columbia AMT-Free Connecticut Intermediate Muni Bond Fund | Annual Report 2017
| 21 |
Notes to Financial Statements
October 31, 2017
Note 1. Organization
Columbia AMT-Free Connecticut Intermediate Muni Bond Fund (the Fund), a series of Columbia Funds Series Trust I (the Trust), is a non-diversified fund. The Trust is registered under the Investment Company Act of 1940, as amended (the 1940 Act), as an open-end management investment company organized as a Massachusetts business trust.
Fund shares
The Trust may issue an unlimited number of shares (without par value). Although all share classes generally have identical voting, dividend and liquidation rights, each share class votes separately when required by the Trust’s organizational documents or by law. Different share classes pay different distribution amounts to the extent the expenses of such share classes differ, and distributions in liquidation will be proportional to the net asset value of each share class. Each share class has its own expense and sales charge structure. The Fund offers each of the share classes identified below.
Class A shares are subject to a maximum front-end sales charge of 3.00% based on the initial investment amount. Class A shares purchased without an initial sales charge are subject to a contingent deferred sales charge (CDSC) of 0.75% on certain investments of $500,000 or more if redeemed within 12 months after purchase.
Class B shares of the Fund are no longer offered for sale. When available, Class B shares were subject to a maximum CDSC of 3.00% based upon the holding period after purchase. Effective July 17, 2017, Class B shares were automatically converted to Class A shares without a CDSC. On August 4, 2017, the capital owned by Columbia Management Investment Advisers, LLC in Class B shares was redeemed without a CDSC.
Class C shares are subject to a 1.00% CDSC on shares redeemed within 12 months after purchase.
Class R4 shares are not subject to sales charges and are generally available only to omnibus retirement plans and certain investors as described in the Fund’s prospectus. Effective November 1, 2017, Class R4 shares were renamed Advisor Class shares.
Class V shares are subject to a maximum front-end sales charge of 4.75% based on the investment amount. Class V shares purchased without an initial sales charge in accounts aggregating $1 million to $50 million at the time of purchase are subject to a CDSC if the shares are sold within 18 months after purchase, charged as follows: 1.00% CDSC if redeemed within 12 months after purchase, and 0.50% CDSC if redeemed more than 12, but less than 18, months after purchase. Class V shares are available only to investors who received (and who have continuously held) Class V shares in connection with previous fund reorganizations. Prior to January 24, 2017, Class V shares were known as Class T shares.
Class Y shares are not subject to sales charges and are available to institutional and certain other investors as described in the Fund’s prospectus. Class Y shares commenced operations on March 1, 2017. Effective November 1, 2017, Class Y shares were renamed Institutional 3 Class shares.
Class Z shares are not subject to sales charges and are generally available only to eligible investors, which are subject to different investment minimums as described in the Fund’s prospectus. Effective November 1, 2017, Class Z shares were renamed Institutional Class shares.
Note 2. Summary of significant accounting policies
Basis of preparation
The Fund is an investment company that applies the accounting and reporting guidance in the Financial Accounting Standards Board (FASB) Accounting Standards Codification Topic 946, Financial Services - Investment Companies (ASC 946). The financial statements are prepared in accordance with U.S. generally accepted accounting principles (GAAP), which requires management to make certain estimates and assumptions that affect the reported amounts of assets and liabilities, the disclosure of contingent assets and liabilities at the date of the financial statements and the reported amounts of income and expenses during the reporting period. Actual results could differ from those estimates. The Fund received a reimbursement for expenses overbilled by a third party. Such reimbursement is included as an offset to other expenses on the Statement of Operations. All fee waivers and expense reimbursements by Columbia Management Investment Advisers, LLC and its affiliates were applied before giving effect to the third party reimbursement.
| 22 | Columbia AMT-Free Connecticut Intermediate Muni Bond Fund | Annual Report 2017 |
Notes to Financial Statements (continued)
October 31, 2017
The following is a summary of significant accounting policies followed by the Fund in the preparation of its financial statements.
Security valuation
Debt securities generally are valued by pricing services approved by the Board of Trustees based upon market transactions for normal, institutional-size trading units of similar securities. The services may use various pricing techniques that take into account, as applicable, factors such as yield, quality, coupon rate, maturity, type of issue, trading characteristics and other data, as well as approved independent broker-dealer quotes. Debt securities for which quotations are not readily available or not believed to be reflective of market value may also be valued based upon a bid quote from an approved independent broker-dealer. Debt securities maturing in 60 days or less are valued primarily at amortized cost value, unless this method results in a valuation that management believes does not approximate market value.
Investments in open-end investment companies, including money market funds, are valued at their latest net asset value.
Investments for which market quotations are not readily available, or that have quotations which management believes are not reflective of market value or reliable, are valued at fair value as determined in good faith under procedures approved by and under the general supervision of the Board of Trustees. If a security or class of securities (such as foreign securities) is valued at fair value, such value is likely to be different from the quoted or published price for the security.
The determination of fair value often requires significant judgment. To determine fair value, management may use assumptions including but not limited to future cash flows and estimated risk premiums. Multiple inputs from various sources may be used to determine fair value.
GAAP requires disclosure regarding the inputs and valuation techniques used to measure fair value and any changes in valuation inputs or techniques. In addition, investments shall be disclosed by major category. This information is disclosed following the Fund’s Portfolio of Investments.
Security transactions
Security transactions are accounted for on the trade date. Cost is determined and gains (losses) are based upon the specific identification method for both financial statement and federal income tax purposes.
Income recognition
Interest income is recorded on an accrual basis. Market premiums and discounts, including original issue discounts, are amortized and accreted, respectively, over the expected life of the security on all debt securities, unless otherwise noted.
The Fund may place a debt security on non-accrual status and reduce related interest income when it becomes probable that the interest will not be collected and the amount of uncollectible interest can be reasonably estimated. A defaulted debt security is removed from non-accrual status when the issuer resumes interest payments or when collectibility of interest is reasonably assured.
Dividend income is recorded on the ex-dividend date.
Expenses
General expenses of the Trust are allocated to the Fund and other funds of the Trust based upon relative net assets or other expense allocation methodologies determined by the nature of the expense. Expenses directly attributable to the Fund are charged to the Fund. Expenses directly attributable to a specific class of shares are charged to that share class.
Determination of class net asset value
All income, expenses (other than class-specific expenses, which are charged to that share class, as shown in the Statement of Operations) and realized and unrealized gains (losses) are allocated to each class of the Fund on a daily basis, based on the relative net assets of each class, for purposes of determining the net asset value of each class.
Columbia AMT-Free Connecticut Intermediate Muni Bond Fund | Annual Report 2017
| 23 |
Notes to Financial Statements (continued)
October 31, 2017
Federal income tax status
The Fund intends to qualify each year as a regulated investment company under Subchapter M of the Internal Revenue Code, as amended, and will distribute substantially all of its net tax-exempt and investment company taxable income and net capital gain, if any, for its tax year, and as such will not be subject to federal income taxes. In addition, the Fund intends to distribute in each calendar year substantially all of its ordinary income, capital gain net income and certain other amounts, if any, such that the Fund should not be subject to federal excise tax. Therefore, no federal income or excise tax provision is recorded.
Distributions to shareholders
Distributions from net investment income, if any, are declared daily and paid monthly. Net realized capital gains, if any, are distributed at least annually. Income distributions and capital gain distributions are determined in accordance with federal income tax regulations, which may differ from GAAP.
Guarantees and indemnifications
Under the Trust’s organizational documents and, in some cases, by contract, its officers and trustees are indemnified against certain liabilities arising out of the performance of their duties to the Trust or its funds. In addition, certain of the Fund’s contracts with its service providers contain general indemnification clauses. The Fund’s maximum exposure under these arrangements is unknown since the amount of any future claims that may be made against the Fund cannot be determined, and the Fund has no historical basis for predicting the likelihood of any such claims.
Recent accounting pronouncement
Accounting Standards Update 2017-08 Premium Amortization on Purchased Callable Debt Securities
In March 2017, the Financial Accounting Standards Board issued Accounting Standards Update (ASU) No. 2017-08 Premium Amortization on Purchased Callable Debt Securities. ASU No. 2017-08 updates the accounting standards to shorten the amortization period for certain purchased callable debt securities, held at a premium, to be amortized to the earliest call date. The update applies to securities with explicit, noncontingent call features that are callable at fixed prices and on preset dates. The standard is effective for annual periods beginning after December 15, 2018 and interim periods within those fiscal years. At this time, management is evaluating the implication of this guidance and the impact it will have on the financial statement amounts and footnote disclosures, if any.
Note 3. Fees and other transactions with affiliates
Management services fees
The Fund has entered into a Management Agreement with Columbia Management Investment Advisers, LLC (the Investment Manager), a wholly-owned subsidiary of Ameriprise Financial, Inc. (Ameriprise Financial). Under the Management Agreement, the Investment Manager provides the Fund with investment research and advice, as well as administrative and accounting services. The management services fee is an annual fee that is equal to a percentage of the Fund’s daily net assets that declines from 0.47% to 0.31% as the Fund’s net assets increase. The effective management services fee rate for the year ended October 31, 2017 was 0.47% of the Fund’s average daily net assets.
Compensation of board members
Members of the Board of Trustees, who are not officers or employees of the Investment Manager or Ameriprise Financial, are compensated for their services to the Fund as disclosed in the Statement of Operations. These members of the Board of Trustees may participate in a Deferred Compensation Plan (the Plan) which may be terminated at any time. Obligations of the Plan will be paid solely out of the Fund’s assets, and all amounts payable under the Plan constitute a general unsecured obligation of the Fund.
| 24 | Columbia AMT-Free Connecticut Intermediate Muni Bond Fund | Annual Report 2017 |
Notes to Financial Statements (continued)
October 31, 2017
Compensation of Chief Compliance Officer
The Board of Trustees has appointed a Chief Compliance Officer to the Fund in accordance with federal securities regulations. A portion of the Chief Compliance Officer’s total compensation is allocated to the Fund, along with other affiliated funds governed by the Board of Trustees, based on relative net assets. The total amount allocated to all affiliated funds governed by the Board of Trustees will not exceed $40,000 annually.
Transfer agency fees
Under a Transfer and Dividend Disbursing Agent Agreement, Columbia Management Investment Services Corp. (the Transfer Agent), an affiliate of the Investment Manager and a wholly-owned subsidiary of Ameriprise Financial, is responsible for providing transfer agency services to the Fund. The Transfer Agent has contracted with DST Asset Manager Solutions, Inc. (DST) to serve as sub-transfer agent. The Transfer Agent pays the fees of DST for services as sub-transfer agent and DST is not entitled to reimbursement for such fees from the Fund (with the exception of out-of-pocket fees).
The Fund pays the Transfer Agent a monthly transfer agency fee based on the number or the average value of accounts, depending on the type of account. In addition, the Fund pays the Transfer Agent a fee for shareholder services based on the number of accounts or on a percentage of the average aggregate value of the Fund’s shares maintained in omnibus accounts up to the lesser of the amount charged by the financial intermediary or a cap established by the Board of Trustees from time to time.
The Transfer Agent also receives compensation from the Fund for various shareholder services and reimbursements for certain out-of-pocket fees. Effective August 1, 2017, total transfer agency fees for Class Y shares are subject to an annual limitation of not more than 0.02% of the average daily net assets attributable to Class Y shares. Prior to August 1, 2017, the limitation was 0.025% for Class Y shares.
For the year ended October 31, 2017, the Fund’s effective transfer agency fee rates as a percentage of average daily net assets of each class were as follows:
| | Effective rate (%) |
| Class A | 0.16 |
| Class B | 0.13 (a),(b) |
| Class C | 0.16 |
| Class R4 | 0.16 |
| Class V | 0.16 |
| Class Y | 0.02 (c) |
| Class Z | 0.16 |
| (a) | Effective July 17, 2017, Class B shares were automatically converted to Class A shares. |
| (b) | Unannualized. |
| (c) | Annualized. |
An annual minimum account balance fee of $20 may apply to certain accounts with a value below the applicable share class’s initial minimum investment requirements to reduce the impact of small accounts on transfer agency fees. These minimum account balance fees are remitted to the Fund and recorded as part of expense reductions in the Statement of Operations. For the year ended October 31, 2017, these minimum account balance fees reduced total expenses of the Fund by $80.
Distribution and service fees
The Fund has entered into an agreement with Columbia Management Investment Distributors, Inc. (the Distributor), an affiliate of the Investment Manager and a wholly-owned subsidiary of Ameriprise Financial, for distribution and shareholder services. The Board of Trustees has approved, and the Fund has adopted, distribution and shareholder service plans (the Plans) applicable to certain share classes, which set the distribution and service fees for the Fund. These fees are calculated daily and are intended to compensate the Distributor and/or eligible selling and/or servicing agents for selling shares of the Fund and providing services to investors.
Columbia AMT-Free Connecticut Intermediate Muni Bond Fund | Annual Report 2017
| 25 |
Notes to Financial Statements (continued)
October 31, 2017
Under the Plans, the Fund pays a monthly service fee to the Distributor at the maximum annual rate of 0.25% of the average daily net assets attributable to Class A, Class B and Class C shares of the Fund. Also under the Plans, the Fund pays a monthly distribution fee to the Distributor at the maximum annual rates of 0.75% of the average daily net assets attributable to Class B and Class C shares of the Fund. As a result of all Class B shares of the Fund being redeemed or converted to Class A shares, August 4, 2017 was the last day the Fund paid a service fee or distribution fee for Class B shares.
The Distributor has voluntarily agreed to waive a portion of the distribution fee for Class C shares so that the distribution fee does not exceed 0.45% annually of the average daily net assets attributable to Class C shares. This arrangement may be modified or terminated by the Distributor at any time.
Shareholder services fees
The Fund has adopted a shareholder services plan that permits it to pay for certain services provided to Class V shareholders by their selling and/or servicing agents. The Fund may pay shareholder servicing fees up to an aggregate annual rate of 0.40% of the Fund’s average daily net assets attributable to Class V shares (comprised of up to 0.20% for shareholder liaison services and up to 0.20% for administrative support services). These fees are currently limited to an aggregate annual rate of not more than 0.15% of the Fund’s average daily net assets attributable to Class V shares.
Sales charges (unaudited)
Sales charges, including front-end charges and CDSCs, received by the Distributor for distributing Fund shares for the year ended October 31, 2017, if any, are listed below:
Expenses waived/reimbursed by the Investment Manager and its affiliates
The Investment Manager and certain of its affiliates have contractually agreed to waive fees and/or reimburse expenses (excluding certain fees and expenses described below) for the period(s) disclosed below, unless sooner terminated at the sole discretion of the Board of Trustees, so that the Fund’s net operating expenses, after giving effect to fees waived/expenses reimbursed and any balance credits and/or overdraft charges from the Fund’s custodian, do not exceed the following annual rate(s) as a percentage of the class’ average daily net assets:
| | March 1, 2017
through
February 28, 2018 | Prior to
March 1, 2017 |
| Class A | 0.81% | 0.81% |
| Class C | 1.56 | 1.56 |
| Class R4 | 0.56 | 0.56 |
| Class V | 0.71 | 0.71 |
| Class Y | 0.455 | – |
| Class Z | 0.56 | 0.56 |
Under the agreement governing these fee waivers and/or expense reimbursement arrangements, the following fees and expenses are excluded from the waiver/reimbursement commitment, and therefore will be paid by the Fund, if applicable: taxes (including foreign transaction taxes), expenses associated with investments in affiliated and non-affiliated pooled investment vehicles (including mutual funds and exchange-traded funds), transaction costs and brokerage commissions, costs related to any securities lending program, dividend expenses associated with securities sold short, inverse floater program fees and expenses, transaction charges and interest on borrowed money, interest, infrequent and/or unusual expenses and any other expenses the exclusion of which is specifically approved by the Board of Trustees. This agreement may be modified or amended only with approval from the Investment Manager, certain of its affiliates and the Fund. Any fees waived and/or expenses reimbursed under the expense reimbursement arrangements described above are not recoverable by the Investment Manager or its affiliates in future periods. Class C distribution fees waived by the Distributor, as discussed above, are in addition to the waiver/reimbursement commitment under the agreement.
| 26 | Columbia AMT-Free Connecticut Intermediate Muni Bond Fund | Annual Report 2017 |
Notes to Financial Statements (continued)
October 31, 2017
Note 4. Federal tax information
The timing and character of income and capital gain distributions are determined in accordance with income tax regulations, which may differ from GAAP because of temporary or permanent book to tax differences.
At October 31, 2017, these differences are primarily due to differing treatment for re-characterization of distributions for investments, trustees’ deferred compensation, distributions and market discount sold. To the extent these differences are permanent, reclassifications are made among the components of the Fund’s net assets in the Statement of Assets and Liabilities. Temporary differences do not require reclassifications.
In the Statement of Assets and Liabilities the following reclassifications were made:
Undistributed net
investment
income ($) | Accumulated
net realized
gain ($) | Paid in
capital ($) |
| (19) | 20 | (1) |
Net investment income (loss) and net realized gains (losses), as disclosed in the Statement of Operations, and net assets were not affected by this reclassification.
The tax character of distributions paid during the years indicated was as follows:
| Year Ended October 31, 2017 | Year Ended October 31, 2016 |
Ordinary
income ($) | Tax-exempt
income ($) | Long-term
capital gains ($) | Total ($) | Ordinary
income ($) | Tax-exempt
income ($) | Long-term
capital gains ($) | Total ($) |
| 27,526 | 3,855,767 | 581,938 | 4,465,231 | 302 | 4,540,718 | 299,793 | 4,840,813 |
Short-term capital gain distributions, if any, are considered ordinary income distributions for tax purposes.
At October 31, 2017, the components of distributable earnings on a tax basis were as follows:
Undistributed
ordinary income ($) | Undistributed tax-
exempt income ($) | Undistributed
long-term
capital gains ($) | Capital loss
carryforwards ($) | Net unrealized
appreciation ($) |
| — | 492,765 | 187,693 | — | 4,498,054 |
At October 31, 2017, the cost of all investments for federal income tax purposes along with the aggregate gross unrealized appreciation and depreciation based on that cost was:
Federal
tax cost ($) | Gross unrealized
appreciation ($) | Gross unrealized
(depreciation) ($) | Net unrealized
appreciation ($) |
| 114,773,448 | 4,945,749 | (447,695) | 4,498,054 |
Management of the Fund has concluded that there are no significant uncertain tax positions in the Fund that would require recognition in the financial statements. However, management’s conclusion may be subject to review and adjustment at a later date based on factors including, but not limited to, new tax laws, regulations, and administrative interpretations (including relevant court decisions). Generally, the Fund’s federal tax returns for the prior three fiscal years remain subject to examination by the Internal Revenue Service.
Note 5. Portfolio information
The cost of purchases and proceeds from sales of securities, excluding short-term investments and derivatives, if any, aggregated to $8,164,222 and $37,437,366, respectively, for the year ended October 31, 2017. The amount of purchase and sale activity impacts the portfolio turnover rate reported in the Financial Highlights.
Columbia AMT-Free Connecticut Intermediate Muni Bond Fund | Annual Report 2017
| 27 |
Notes to Financial Statements (continued)
October 31, 2017
Note 6. Line of credit
The Fund has access to a revolving credit facility with a syndicate of banks led by Citibank, N.A., HSBC Bank USA, N.A. and JPMorgan Chase Bank, N.A. whereby the Fund may borrow for the temporary funding of shareholder redemptions or for other temporary or emergency purposes. The credit facility, which is a collective agreement between the Fund and certain other funds managed by the Investment Manager, severally and not jointly, permits collective borrowings up to $1 billion. Interest is charged to each participating fund based on its borrowings at a rate equal to the higher of (i) the overnight federal funds rate plus 1.00% or (ii) the one-month LIBOR rate plus 1.00%. Each borrowing under the credit facility matures no later than 60 days after the date of borrowing. The Fund also pays a commitment fee equal to its pro rata share of the amount of the credit facility at a rate of 0.15% per annum. The commitment fee is included in other expenses in the Statement of Operations.
The Fund had no borrowings during the year ended October 31, 2017.
Note 7. Significant risks
Credit risk
Credit risk is the risk that the value of debt securities in the Fund’s portfolio may decline because the issuer may default and fail to pay interest or repay principal when due. Rating agencies assign credit ratings to debt securities to indicate their credit risk. Lower rated or unrated debt securities held by the Fund may present increased credit risk as compared to higher-rated debt securities.
Geographic concentration risk
Because the Fund invests substantially in municipal securities issued by the state identified in the Fund’s name and political sub-divisions of that state, the Fund will be particularly affected by adverse tax, legislative, regulatory, demographic or political changes as well as changes impacting the state’s financial, economic or other condition and prospects. In addition, because of the relatively small number of issuers of tax-exempt securities in the state, the Fund may invest a higher percentage of assets in a single issuer and, therefore, be more exposed to the risk of loss than a fund that invests more broadly. The value of municipal and other securities owned by the Fund also may be adversely affected by future changes in federal or state income tax laws.
Interest rate risk
Interest rate risk is the risk of losses attributable to changes in interest rates. In general, if prevailing interest rates rise, the values of debt securities tend to fall, and if interest rates fall, the values of debt securities tend to rise. Actions by governments and central banking authorities can result in increases in interest rates. Increasing interest rates may negatively affect the value of debt securities held by the Fund, resulting in a negative impact on the Fund’s performance and net asset value per share. In general, the longer the maturity or duration of a debt security, the greater its sensitivity to changes in interest rates.
Liquidity risk
Liquidity risk is the risk associated with a lack of marketability of investments which may make it difficult to sell the investment at a desirable time or price. Changing regulatory, market or other conditions or environments (for example, the interest rate or credit environments) may adversely affect the liquidity of the Fund’s investments. The Fund may have to accept a lower selling price for the holding, sell other investments, or forego another, more appealing investment opportunity. Generally, the less liquid the market at the time the Fund sells a portfolio investment, the greater the risk of loss or decline of value to the Fund. A less liquid market can lead to an increase in Fund redemptions, which may negatively impact Fund performance and net asset value per share, including, for example, if the Fund is forced to sell securities in a down market.
Non-diversification risk
A non-diversified fund is permitted to invest a greater percentage of its total assets in fewer issuers than a diversified fund. The Fund may, therefore, have a greater risk of loss from a few issuers than a similar fund that invests more broadly.
| 28 | Columbia AMT-Free Connecticut Intermediate Muni Bond Fund | Annual Report 2017 |
Notes to Financial Statements (continued)
October 31, 2017
Shareholder concentration risk
At October 31, 2017, one unaffiliated shareholder of record owned 79.2% of the outstanding shares of the Fund in one or more accounts. The Fund has no knowledge about whether any portion of those shares was owned beneficially. Subscription and redemption activity by concentrated accounts may have a significant effect on the operations of the Fund. In the case of a large redemption, the Fund may be forced to sell investments at inopportune times, including its liquid positions, which may result in Fund losses and the Fund holding a higher percentage of less liquid positions. Large redemptions could result in decreased economies of scale and increased operating expenses for non-redeeming Fund shareholders.
Note 8. Subsequent events
Management has evaluated the events and transactions that have occurred through the date the financial statements were issued. Other than as noted in Note 1 above, there were no items requiring adjustment of the financial statements or additional disclosure.
Note 9. Information regarding pending and settled legal proceedings
Ameriprise Financial and certain of its affiliates have historically been involved in a number of legal, arbitration and regulatory proceedings, including routine litigation, class actions, and governmental actions, concerning matters arising in connection with the conduct of their business activities. Ameriprise Financial believes that the Fund is not currently the subject of, and that neither Ameriprise Financial nor any of its affiliates are the subject of, any pending legal, arbitration or regulatory proceedings that are likely to have a material adverse effect on the Fund or the ability of Ameriprise Financial or its affiliates to perform under their contracts with the Fund. Ameriprise Financial is required to make quarterly (10-Q), annual (10-K) and, as necessary, 8-K filings with the Securities and Exchange Commission (SEC) on legal and regulatory matters that relate to Ameriprise Financial and its affiliates. Copies of these filings may be obtained by accessing the SEC website at www.sec.gov.
There can be no assurance that these matters, or the adverse publicity associated with them, will not result in increased Fund redemptions, reduced sale of Fund shares or other adverse consequences to the Fund. Further, although we believe proceedings are not likely to have a material adverse effect on the Fund or the ability of Ameriprise Financial or its affiliates to perform under their contracts with the Fund, these proceedings are subject to uncertainties and, as such, we are unable to estimate the possible loss or range of loss that may result. An adverse outcome in one or more of these proceedings could result in adverse judgments, settlements, fines, penalties or other relief that could have a material adverse effect on the consolidated financial condition or results of operations of Ameriprise Financial.
Columbia AMT-Free Connecticut Intermediate Muni Bond Fund | Annual Report 2017
| 29 |
Report of Independent Registered Public Accounting Firm
To the Trustees of Columbia Funds Series Trust I and the Shareholders of Columbia AMT-Free Connecticut Intermediate Muni Bond Fund
In our opinion, the accompanying statement of assets and liabilities, including the portfolio of investments, and the related statements of operations and of changes in net assets and the financial highlights present fairly, in all material respects, the financial position of Columbia AMT-Free Connecticut Intermediate Muni Bond Fund (the “Fund”, a series of Columbia Funds Series Trust I) as of October 31, 2017, the results of its operations for the year then ended, the changes in its net assets for each of the two years in the period then ended and the financial highlights for each of the periods indicated therein, in conformity with accounting principles generally accepted in the United States of America. These financial statements and financial highlights (hereafter referred to as “financial statements”) are the responsibility of the Fund’s management. Our responsibility is to express an opinion on these financial statements based on our audits. We conducted our audits of these financial statements in accordance with the standards of the Public Company Accounting Oversight Board (United States). Those standards require that we plan and perform the audit to obtain reasonable assurance about whether the financial statements are free of material misstatement. An audit includes examining, on a test basis, evidence supporting the amounts and disclosures in the financial statements, assessing the accounting principles used and significant estimates made by management, and evaluating the overall financial statement presentation. We believe that our audits, which included confirmation of securities as of October 31, 2017 by correspondence with the custodian and brokers, provide a reasonable basis for our opinion.
/s/ PricewaterhouseCoopers LLP
Minneapolis, MN
December 21, 2017
| 30 | Columbia AMT-Free Connecticut Intermediate Muni Bond Fund | Annual Report 2017 |
Federal Income Tax Information
(Unaudited)
The Fund hereby designates the following tax attributes for the fiscal year ended October 31, 2017. Shareholders will be notified in early 2018 of the amounts for use in preparing 2017 income tax returns.
Capital
gain
dividend | Exempt-
interest
dividends |
| $198,659 | 99.29% |
Capital gain dividend. The Fund designates as a capital gain dividend the amount reflected above, or if subsequently determined to be different, the net capital gain of such fiscal period.
Exempt-interest dividends. The percentage of net investment income distributed during the fiscal year that qualifies as exempt-interest dividends for federal income tax purposes.
Columbia AMT-Free Connecticut Intermediate Muni Bond Fund | Annual Report 2017
| 31 |
Shareholders elect the Board that oversees the Fund’s operations. The Board appoints officers who are responsible for day-to-day business decisions based on policies set by the Board. The following table provides basic biographical information about the Fund’s Trustees, including their principal occupations during the past five years, although specific titles for individuals may have varied over the period. The year set forth beneath Length of Service in the table below is the year in which the Trustee was first appointed or elected as Trustee to any Fund currently in the Columbia Funds Complex or a predecessor thereof. Under current Board policy, members serve terms of indefinite duration.
Independent trustees
| Name, address, year of birth | Position held with the Trust and length of service | Principal occupation(s) during the past five years and other relevant professional experience | Number of Funds in the Columbia Fund Complex overseen | Other directorships held by Trustee during the past five years |
Janet Langford Carrig
c/o Columbia Management
Investment Advisers, LLC
225 Franklin Street
Mail Drop BX32 05228
Boston, MA 02110
1957 | Trustee
1996 | Senior Vice President, General Counsel and Corporate Secretary, ConocoPhillips (independent energy company) since September 2007 | 66 | None |
Douglas A. Hacker
c/o Columbia Management
Investment Advisers, LLC
225 Franklin Street
Mail Drop BX32 05228
Boston, MA 02110
1955 | Trustee and Chairman of the Board
1996 | Independent business executive since May 2006; Executive Vice President — Strategy of United Airlines from December 2002 to May 2006; President of UAL Loyalty Services (airline marketing company) from September 2001 to December 2002; Executive Vice President and Chief Financial Officer of United Airlines from July 1999 to September 2001 | 66 | Spartan Nash Company, (food distributor); Nash Finch Company (food distributor) from 2005 to 2013; Aircastle Limited (aircraft leasing); SeaCube Container Leasing Ltd. (container leasing) from 2010 to 2013; and Travelport Worldwide Limited (travel information technology) |
Nancy T. Lukitsh
c/o Columbia Management
Investment Advisers, LLC
225 Franklin Street
Mail Drop BX32 05228
Boston, MA 02110
1956 | Trustee
2011 | Senior Vice President, Partner and Director of Marketing, Wellington Management Company, LLP (investment adviser) from 1997 to 2010; Chair, Wellington Management Portfolios (commingled non-U.S. investment pools) from 2007 to 2010; Director, Wellington Trust Company, NA and other Wellington affiliates from 1997 to 2010 | 66 | None |
David M. Moffett
c/o Columbia Management
Investment Advisers, LLC
225 Franklin Street
Mail Drop BX32 05228
Boston, MA 02110
1952 | Trustee
2011 | Retired. Consultant to Bridgewater and Associates | 66 | Director, CSX Corporation; Genworth Financial, Inc. (financial and insurance products and services); PayPal Holdings Inc. (payment and data processing services); Trustee, University of Oklahoma Foundation; former Director, eBay Inc. (online trading community), 2007-2015; and former Director, CIT Bank, CIT Group Inc. (commercial and consumer finance), 2010-2016 |
| 32 | Columbia AMT-Free Connecticut Intermediate Muni Bond Fund | Annual Report 2017 |
TRUSTEES AND OFFICERS (continued)
Independent trustees (continued)
| Name, address, year of birth | Position held with the Trust and length of service | Principal occupation(s) during the past five years and other relevant professional experience | Number of Funds in the Columbia Fund Complex overseen | Other directorships held by Trustee during the past five years |
Charles R. Nelson
c/o Columbia Management
Investment Advisers, LLC
225 Franklin Street
Mail Drop BX32 05228
Boston, MA 02110
1942 | Trustee
1981 | Retired. Professor Emeritus, University of Washington since 2011; Professor of Economics, University of Washington from 1976 to 2011; Ford and Louisa Van Voorhis Professor of Political Economy, University of Washington from 1993 to 2011; Adjunct Professor of Statistics, University of Washington from 1980 to 2011; Associate Editor, Journal of Money, Credit and Banking from September 1993 to 2008; consultant on econometric and statistical matters | 66 | None |
John J. Neuhauser
c/o Columbia Management
Investment Advisers, LLC
225 Franklin Street
Mail Drop BX32 05228
Boston, MA 02110
1943 | Trustee
1984 | President, Saint Michael’s College since August 2007; Director or Trustee of several non-profit organizations, including University of Vermont Medical Center; Academic Vice President and Dean of Faculties, Boston College from August 1999 to October 2005; University Professor, Boston College from November 2005 to August 2007 | 66 | Liberty All-Star Equity Fund and Liberty All- Star Growth Fund (closed-end funds) |
Patrick J. Simpson
c/o Columbia Management
Investment Advisers, LLC
225 Franklin Street
Mail Drop BX32 05228
Boston, MA 02110
1944 | Trustee
2000 | Of Counsel, Perkins Coie LLP (law firm) since 2015; Partner, Perkins Coie LLP from 1988 to 2014 | 66 | None |
Anne-Lee Verville
c/o Columbia Management
Investment Advisers, LLC
225 Franklin Street
Mail Drop BX32 05228
Boston, MA 02110
1945 | Trustee
1998 | Retired. General Manager, Global Education Industry from 1994 to 1997, President – Application Systems Division from 1991 to 1994, Chief Financial Officer – US Marketing & Services from 1988 to 1991, and Chief Information Officer from 1987 to 1988, IBM Corporation (computer and technology) | 66 | Enesco Group, Inc. (producer of giftware and home and garden decor products) from 2001 to 2006 |
Columbia AMT-Free Connecticut Intermediate Muni Bond Fund | Annual Report 2017
| 33 |
TRUSTEES AND OFFICERS (continued)
Consultants to the Independent Trustees*
| Name, address, year of birth | Position held with the Trust and length of service | Principal occupation(s) during the past five years and other relevant professional experience | Number of Funds in the Columbia Funds complex overseen | Other directorships held by Trustee during the past five years |
J. Kevin Connaughton
c/o Columbia
Management Investment
Advisers, LLC,
225 Franklin Street
Mail Drop BX32 05228,
Boston, MA 02110
1964 | Independent Trustee Consultant
2016 | Independent Trustee Consultant, Columbia Funds since March 2016; Managing Director and General Manager of Mutual Fund Products, Columbia Management Investment Advisers, LLC from May 2010 to February 2015; President, Columbia Funds from 2009 to 2015; and senior officer of Columbia Funds and affiliated funds from 2003 to 2015 | 66 | Board of Governors, Gateway Healthcare since January 2016; Trustee, New Century Portfolios since March 2015; and Director, The Autism Project since March 2015 |
Natalie A. Trunow
c/o Columbia
Management Investment
Advisers, LLC,
225 Franklin Street
Mail Drop BX32 05228,
Boston, MA 02110
1967 | Independent Trustee Consultant
2016 | Independent Trustee Consultant, Columbia Funds since September 2016; Chief Executive Officer, Millennial Partners (investment consulting services to institutions) since January 2016; Director of Investments, Casey Family Programs from April 2016 to September 2016; Senior Vice President and Chief Investment Officer, Calvert Investments from August 2008 to January 2016; Section Head and Portfolio Manager, General Motors Asset Management from June 1997 to August 2008 | 66 | Healthcare Services for Children with Special Needs |
| * | J. Kevin Connaughton was appointed consultant to the Independent Trustees effective March 1, 2016. Natalie A. Trunow was appointed consultant to the Independent Trustees effective September 1, 2016. Shareholders of the Funds are expected to be asked to elect each of Mr. Connaughton and Ms. Trunow as a Trustee at a future shareholder meeting. |
Interested trustee affiliated with Investment Manager*
| Name, address, year of birth | Position held with the Trust and length of service | Principal occupation(s) during the past five years and other relevant professional experience | Number of Funds in the Columbia Funds Complex overseen | Other directorships held by Trustee during the past five years |
William F. Truscott
c/o Columbia Management
Investment Advisers, LLC
225 Franklin Street
Boston, MA 02110
1960 | Trustee
2012 | Chairman of the Board and President, Columbia Management Investment Advisers, LLC since May 2010 and February 2012, respectively; Chief Executive Officer, Global Asset Management, Ameriprise Financial, Inc. since September 2012 (previously Chief Executive Officer, U.S. Asset Management & President, Annuities, May 2010-September 2012); Director and Chief Executive Officer, Columbia Management Investment Distributors, Inc. since May 2010 and February 2012, respectively; Chairman of the Board and Chief Executive Officer, RiverSource Distributors, Inc. since 2006; Director, Threadneedle Asset Management Holdings, SARL since 2014; President and Chief Executive Officer, Ameriprise Certificate Company, 2006-August 2012 | 189 | Chairman of the Board, Columbia Management Investment Advisers, LLC since May 2010; Director, Columbia Management Investment Distributors, Inc. since May 2010; former Director, Ameriprise Certificate Company, 2006 - January 2013 |
| * | Interested person (as defined under the 1940 Act) by reason of being an officer, director, security holder and/or employee of the Investment Manager or Ameriprise Financial. |
The Statement of Additional Information has additional information about the Fund’s Board members and is available,
without charge, upon request by calling 800.345.6611, contacting your financial intermediary or visiting
investor.columbiathreadneedleus.com.
| 34 | Columbia AMT-Free Connecticut Intermediate Muni Bond Fund | Annual Report 2017 |
TRUSTEES AND OFFICERS (continued)
The Board has appointed officers who are responsible for day-to-day business decisions based on policies it has established. The officers serve at the pleasure of the Board. The following table provides basic information about the Officers of the Fund, including principal occupations during the past five years, although their specific titles may have varied over the period. In addition to Mr. Truscott, who is Senior Vice President, the Fund’s other officers are:
Fund officers
Name,
address and
year of birth | Position and year
first appointed to
position for any Fund
in the Columbia
Funds complex or a
predecessor thereof | Principal occupation(s) during past five years |
Christopher O. Petersen
5228 Ameriprise
Financial Center
Minneapolis, MN 55474
Born 1970 | President and Principal Executive Officer (2015) | Vice President and Lead Chief Counsel, Ameriprise Financial, Inc. since January 2015 (previously, Vice President and Chief Counsel, January 2010 - December 2014; officer of Columbia Funds and affiliated funds since 2007. |
Michael G. Clarke
225 Franklin Street
Boston, MA 02110
Born 1969 | Treasurer (2011), Chief Financial Officer (2009) and Chief Accounting Officer (2015) | Vice President — Mutual Fund Administration, Columbia Management Investment Advisers, LLC, since May 2010; senior officer of Columbia Funds and affiliated funds since 2002. |
Paul B. Goucher
100 Park Avenue
New York, NY 10017
Born 1968 | Senior Vice President (2011) and Assistant Secretary (2008) | Senior Vice President and Assistant General Counsel, Ameriprise Financial, Inc. since January 2017 (previously Vice President and Lead Chief Counsel, November 2008 - January 2017 and January 2013 - January 2017, respectively; and Chief Counsel, January 2010 - January 2013); Vice President, Chief Legal Officer and Assistant Secretary, Columbia Management Investment Advisers, LLC since May 2010. |
Thomas P. McGuire
225 Franklin Street
Boston, MA 02110
Born 1972 | Senior Vice President and Chief Compliance Officer (2012) | Vice President — Asset Management Compliance, Ameriprise Financial, Inc., since May 2010; Chief Compliance Officer, Ameriprise Certificate Company since September 2010. |
Colin Moore
225 Franklin Street
Boston, MA 02110
Born 1958 | Senior Vice President (2010) | Executive Vice President and Global Chief Investment Officer, Ameriprise Financial, Inc., since July 2013; Executive Vice President and Global Chief Investment Officer, Columbia Management Investment Advisers, LLC since July 2013 (previously Director and Global Chief Investment Officer, 2010 - 2013). |
Ryan C. Larrenaga
225 Franklin Street
Boston, MA 02110
Born 1970 | Senior Vice President (2017), Chief Legal Officer (2017) and Secretary (2015) | Vice President and Group Counsel, Ameriprise Financial, Inc. since August 2011; officer of Columbia Funds and affiliated funds since 2005. |
Michael E. DeFao
225 Franklin Street
Boston, MA 02110
Born 1968 | Vice President (2011) and Assistant Secretary (2010) | Vice President and Chief Counsel, Ameriprise Financial, Inc. since May 2010. |
Amy Johnson
5228 Ameriprise
Financial Center
Minneapolis, MN 55474
Born 1965 | Vice President (2006) | Managing Director and Global Head of Operations, Columbia Management Investment Advisers, LLC since April 2016 (previously Managing Director and Chief Operating Officer, 2010 - 2016). |
Lyn Kephart-Strong
5228 Ameriprise
Financial Center
Minneapolis, MN 55474
Born 1960 | Vice President (2015) | President, Columbia Management Investment Services Corp. since October 2014; Vice President & Resolution Officer, Ameriprise Trust Company since August 2009. |
Columbia AMT-Free Connecticut Intermediate Muni Bond Fund | Annual Report 2017
| 35 |
Board Consideration and Approval of Management
Agreement
On June 14, 2017, the Board of Trustees (the Board) and the Trustees who are not interested persons (as defined in the Investment Company Act of 1940) (the Independent Trustees) of Columbia Funds Series Trust I (the Trust) unanimously approved the continuation of the Management Agreement (the Management Agreement) with Columbia Management Investment Advisers, LLC (the Investment Manager) with respect to Columbia AMT-Free Connecticut Intermediate Muni Bond Fund (the Fund), a series of the Trust. As detailed below, the Board’s Advisory Fees and Expenses Committee (the Committee) and the Board met on multiple occasions to review and discuss, both among themselves and with the management team of the Investment Manager, materials provided by the Investment Manager and others before determining to approve the continuation of the Management Agreement.
In connection with their deliberations regarding the continuation of the Management Agreement, the Committee and the Board evaluated materials requested from the Investment Manager regarding the Fund and the Management Agreement, and discussed these materials with representatives of the Investment Manager at Committee meetings held on March 27, 2017, April 26, 2017 and June 13, 2017 and at Board meetings held on March 28, 2017 and June 14, 2017. In addition, the Board considers matters bearing on the Management Agreement at most of its other meetings throughout the year and meets regularly with senior management of the Trust and the Investment Manager. Through the Board’s Investment Oversight Committees, Trustees also meet with selected portfolio managers of the funds the Trustees oversee and other investment personnel at various times throughout the year. The Committee and the Board also consulted with its independent fee consultant, Fund counsel and the Independent Trustees’ independent legal counsel, who advised on various matters with respect to the Committee’s and the Board’s considerations and otherwise assisted the Committee and the Board in their deliberations.
On June 13, 2017, the Committee recommended that the Board approve the continuation of the Management Agreement. On June 14, 2017, the Board, including the Independent Trustees, voting separately, unanimously approved the continuation of the Management Agreement for the Fund.
The Committee and the Board considered all information that they, their legal counsel or the Investment Manager believed reasonably necessary to evaluate and to determine whether to recommend for approval or approve the continuation of the Management Agreement. The information and factors considered by the Committee and the Board in recommending for approval or approving the continuation of the Management Agreement for the Fund included the following:
| • | Information on the investment performance of the Fund relative to the performance of a group of mutual funds determined to be comparable to the Fund by an independent third-party data provider, as well as performance relative to benchmarks; |
| • | Information on the Fund’s management fees and total expenses, including information comparing the Fund’s expenses to those of a group of comparable mutual funds, as determined by the independent third-party data provider; |
| • | The Investment Manager’s agreement to contractually limit or cap total operating expenses for the Fund through February 28, 2018 so that total operating expenses (excluding certain fees and expenses, such as transaction costs and certain other investment related expenses, interest, taxes, acquired fund fees and expenses, and infrequent and/or unusual expenses) would not exceed a specified annual rate, as a percentage of the Fund’s net assets; |
| • | The terms and conditions of the Management Agreement; |
| • | The current and proposed terms and conditions of other agreements and arrangements with affiliates of the Investment Manager relating to the operations of the Fund, including agreements with respect to the provision of distribution, transfer agency and shareholder services to the Fund; |
| • | Descriptions of various functions performed by the Investment Manager under the Management Agreement, including portfolio management and portfolio trading practices; |
| • | Information regarding the management fees of similarly-managed portfolios of other clients of the Investment Manager, including institutional separate accounts; |
| • | Information regarding the reputation, regulatory history and resources of the Investment Manager, including information regarding senior management, portfolio managers and other personnel; |
| 36 | Columbia AMT-Free Connecticut Intermediate Muni Bond Fund | Annual Report 2017 |
Board Consideration and Approval of Management
Agreement (continued)
| • | Information regarding the capabilities of the Investment Manager with respect to compliance monitoring services, including an assessment of the Investment Manager’s compliance system by the Fund’s Chief Compliance Officer; and |
| • | The profitability to the Investment Manager and its affiliates from their relationships with the Fund. |
Nature, extent and quality of services provided under the Management Agreement
The Committee and the Board considered the nature, extent and quality of services provided to the Fund by the Investment Manager and its affiliates under the Management Agreement and under separate agreements for the provision of transfer agency and shareholder services, and the resources dedicated to the Fund and the other Columbia Funds by the Investment Manager and its affiliates. The Committee and the Board considered, among other things, the Investment Manager’s ability to attract, motivate and retain highly qualified research, advisory and supervisory investment professionals (including compensation programs for personnel involved in fund management, reputation and other attributes), the portfolio management services provided by those investment professionals, and the quality of the Investment Manager’s investment research capabilities and trade execution services. The Committee and the Board also considered the potential benefits to shareholders of investing in a mutual fund that is part of a fund complex offering exposure to a variety of asset classes and investment disciplines and providing a variety of fund and shareholder services.
The Committee and the Board also considered the professional experience and qualifications of the senior personnel of the Investment Manager, which included consideration of the Investment Manager’s experience with similarly-structured funds. The Committee and the Board noted the compliance programs of and the compliance-related resources provided to the Fund by the Investment Manager and its affiliates, and considered the Investment Manager’s ability to provide administrative services to the Fund and coordinate the activities of the Fund’s other service providers. After reviewing these and related factors, the Committee and the Board concluded, within the context of their overall conclusions, that the nature, extent and quality of the services provided to the Fund under the Management Agreement supported the continuation of the Management Agreement.
Investment performance
The Committee and the Board reviewed information about the performance of the Fund over various time periods, including performance information relative to benchmarks and information that compared the performance of the Fund to the performance of a group of comparable mutual funds as determined by the independent third-party data provider, and data provided by the independent fee consultant. The Committee and the Board also reviewed a description of the third party’s methodology for identifying the Fund’s peer groups for purposes of performance and expense comparisons. Although the Fund’s performance lagged that of a relevant peer group for certain (although not necessarily all) periods, the Committee and the Board concluded that other factors relevant to performance were sufficient, in light of other considerations, to warrant continuation of the Management Agreement. Those factors included one or more of the following: (i) that the Fund’s performance, although lagging in certain recent periods, was stronger over the longer term; (ii) that the underperformance was attributable, to a significant extent, to investment decisions that were reasonable and consistent with the Fund’s investment strategy and policies and that the Fund was performing within a reasonable range of expectations, given those investment decisions, market conditions and the Fund’s investment strategy; (iii) that the Fund’s performance was competitive when compared to other relevant performance benchmarks or peer groups; and (iv) that the Investment Manager had taken or was taking steps designed to help improve the Fund’s investment performance, including, but not limited to, replacing portfolio managers, enhancing the resources supporting the portfolio managers, or modifying investment strategies.
The Committee and the Board noted that, through December 31, 2016, the Fund’s performance was in the fifty-fourth, seventy-fourth and seventieth percentile (where the best performance would be in the first percentile) of its category selected by the independent third-party data provider for the purposes of performance comparisons for the one-, three- and five-year periods, respectively.
The Committee and the Board also considered the Investment Manager’s performance and reputation generally, the Investment Manager’s historical responsiveness to Board concerns about performance, and the Investment Manager’s willingness to take steps intended to improve performance. After reviewing these and related factors, the Committee and the Board concluded, within the context of their overall conclusions, that the performance of the Fund and the Investment Manager was sufficient, in light of other considerations, to warrant the continuation of the Management Agreement.
Columbia AMT-Free Connecticut Intermediate Muni Bond Fund | Annual Report 2017
| 37 |
Board Consideration and Approval of Management
Agreement (continued)
Investment management fee rates and other expenses
The Committee and the Board considered the management fees charged to the Fund under the Management Agreement as well as the total expenses incurred by the Fund. In assessing the reasonableness of the fees under the Management Agreement, the Committee and the Board considered, among other information, the Fund’s total expense ratio as a percentage of average daily net assets. The Committee and the Board considered data provided by the independent third-party data provider and the independent fee consultant. The Committee and the Board noted that, as of December 31, 2016, the Fund’s actual management fee and net total expense ratio are both ranked in the first quintile (where the lowest fees and expenses would be in the first quintile) against the Fund’s expense universe as determined by the independent third-party data provider for purposes of expense comparison. The Committee and the Board also took into account the fee waiver and expense limitation arrangements agreed to by the Investment Manager, as noted above.
The Committee and the Board also received and considered information about the management fees charged by the Investment Manager to institutional separate accounts. In considering the fees charged to those accounts, the Committee and the Board took into account, among other things, the Investment Manager’s representations about the differences between managing mutual funds as compared to other types of accounts, including differences in the services provided, differences in the risk profile of such business for the Investment Manager and the additional resources required to manage mutual funds effectively. The Committee and the Board also received and considered information about the fees charged by the Investment Manager for sub-advisory services it provides to comparable unaffiliated funds. In evaluating the Fund’s management fees, the Committee and the Board also took into account the demands, complexity and quality of the investment management of the Fund.
After reviewing these and related factors, the Committee and the Board concluded, within the context of their overall conclusions, that the management fee rates and expenses of the Fund, in light of other considerations, warranted the continuation of the Management Agreement.
Costs of services provided and profitability
The Committee and the Board also took note of the costs the Investment Manager and its affiliates incur in connection with the services provided and the profitability to the Investment Manager and its affiliates from their relationships with the Fund.
The Committee and the Board also considered the compensation directly or indirectly received by the Investment Manager’s affiliates in connection with their relationships with the Fund. The Committee and the Board reviewed information provided by management as to the profitability to the Investment Manager and its affiliates of their relationships with the Fund, information about the allocation of expenses used to calculate profitability, and comparisons of profitability levels realized in 2016 to profitability levels realized in 2015. When reviewing profitability, the Committee and the Board also considered court cases in which adviser profitability was an issue in whole or in part, the performance of similarly managed funds, the performance of the Fund, and the expense ratio of the Fund. In addition, the Committee and the Board considered information provided by the Investment Manager regarding the Investment Manager’s financial condition and comparing its profitability to that of other asset management firms that are, or are subsidiaries of, publicly traded companies. In this regard, the Committee and the Board also considered data provided by the independent fee consultant.
After reviewing these and related factors, the Committee and the Board concluded, within the context of their overall conclusions, that the costs of services provided and the profitability to the Investment Manager and its affiliates from their relationships with the Fund supported the continuation of the Management Agreement.
Economies of scale
The Committee and the Board considered the potential existence of economies of scale in the provision by the Investment Manager of services to the Fund, to groups of related funds, and to the Investment Manager’s investment advisory clients as a whole, and whether those economies of scale were shared with the Fund through breakpoints in investment management fees or other means, such as expense limitation arrangements and additional investments by the Investment Manager in investment, trading, compliance and other resources. The Committee and the Board noted that the management fee schedules for the Fund contained breakpoints that would reduce the fee rate on assets above specified threshold levels.
| 38 | Columbia AMT-Free Connecticut Intermediate Muni Bond Fund | Annual Report 2017 |
Board Consideration and Approval of Management
Agreement (continued)
In considering these matters, the Committee and the Board also considered the costs of the services provided and the profitability to the Investment Manager and its affiliates from their relationships with the Fund, as discussed above. After reviewing these and related factors, the Committee and the Board concluded, within the context of their overall conclusions, that the extent to which any economies of scale were expected to be shared with the Fund supported the continuation of the Management Agreement.
Other benefits to the Investment Manager
The Committee and the Board received and considered information regarding “fall-out” or ancillary benefits received by the Investment Manager and its affiliates as a result of their relationships with the Fund, such as the engagement of the Investment Manager’s affiliates to provide distribution, transfer agency and shareholder services to the Fund. In this regard, among other matters, the Committee and the Board considered that the Fund’s distributor retains a portion of the distribution fees from the Fund and receives a portion of the sales charges on sales or redemptions of certain classes of shares of the Fund. The Committee and the Board also considered the benefits of research made available to the Investment Manager by reason of brokerage commissions generated by the Fund’s securities transactions, and reviewed information about the Investment Manager’s practices with respect to allocating portfolio transactions for brokerage and research services. The Committee and the Board recognized that the Investment Manager’s profitability would be somewhat lower without these benefits.
Conclusion
The Committee and the Board reviewed all of the above considerations in reaching their decisions to recommend or approve the continuation of the Management Agreement. In their deliberations, the Trustees did not identify any particular information that was all-important or controlling, and individual Trustees may have attributed different weights to the various factors. Based on their evaluation of all factors that they deemed to be material, including those factors described above, and assisted by the advice of independent legal counsel, the Board, including the Independent Trustees, voting separately, unanimously approved the continuation of the Management Agreement.
Columbia AMT-Free Connecticut Intermediate Muni Bond Fund | Annual Report 2017
| 39 |
The Fund mails one shareholder report to each shareholder address. If you would like more than one report, please call shareholder services at 800.345.6611 and additional reports will be sent to you.
Proxy voting policies and procedures
The policy of the Board of Trustees is to vote the proxies of the companies in which the Fund holds investments consistent with the procedures as stated in the Statement of Additional Information (SAI). You may obtain a copy of the SAI without charge by calling 800.345.6611; contacting your financial intermediary; visiting investor.columbiathreadneedleus.com; or searching the website of the Securities and Exchange Commission (SEC) at sec.gov. Information regarding how the Fund voted proxies relating to portfolio securities is filed with the SEC by August 31st for the most recent 12-month period ending June 30th of that year, and is available without charge by visiting investor.columbiathreadneedleus.com, or searching the website of the SEC at sec.gov.
Quarterly schedule of investments
The Fund files a complete schedule of portfolio holdings with the SEC for the first and third quarters of each fiscal year on Form N-Q. The Fund’s Form N-Q is available on the SEC’s website at sec.gov and may be reviewed and copied at the SEC’s Public Reference Room in Washington, D.C. Information on the operation of the Public Reference Room may be obtained by calling 800.SEC.0330. The Fund’s complete schedule of portfolio holdings, as filed on Form N-Q, can also be obtained without charge, upon request, by calling 800.345.6611.
Additional Fund information
For more information about the Fund, please visit investor.columbiathreadneedleus.com or call 800.345.6611. Customer Service Representatives are available to answer your questions Monday through Friday from 8 a.m. to 7 p.m. Eastern time.
Fund investment manager
Columbia Management Investment Advisers, LLC
225 Franklin Street
Boston, MA 02110
Fund distributor
Columbia Management Investment Distributors, Inc.
225 Franklin Street
Boston, MA 02110
Fund transfer agent
Columbia Management Investment Services Corp.
P.O. Box 8081
Boston, MA 02266-8081
| 40 | Columbia AMT-Free Connecticut Intermediate Muni Bond Fund | Annual Report 2017 |
[THIS PAGE INTENTIONALLY LEFT BLANK]
Columbia AMT-Free Connecticut Intermediate Muni Bond Fund
P.O. Box 8081
Boston, MA 02266-8081
Please read and consider the investment objectives, risks, charges and expenses for any fund carefully before investing. For a prospectus and summary prospectus, which contains this and other important information about the Fund, go to
investor.columbiathreadneedleus.com. The Fund is distributed by Columbia Management Investment Distributors, Inc., member FINRA, and managed by Columbia Management Investment Advisers, LLC.
Columbia Threadneedle Investments (Columbia Threadneedle) is the global brand name of the Columbia and Threadneedle group of companies. All rights reserved. Columbia Management Investment Distributors, Inc., 225 Franklin Street, Boston, MA 02110-2804
© 2017 Columbia Management Investment Advisers, LLC.
investor.columbiathreadneedleus.com
Item 2. Code of Ethics.
| | (a) | The registrant has adopted a code of ethics that applies to the registrant’s principal executive officer, principal financial officer, principal accounting officer or controller, or persons performing similar functions, regardless of whether these individuals are employed by the registrant or a third party. |
| | (b) | During the period covered by this report, there were not any amendments to a provision of the code of ethics adopted in 2(a) above. |
| | (c) | During the period covered by this report, there were no waivers, including any implicit waivers, from a provision of the code of ethics described in 2(a) above that relates to one or more of the items set forth in paragraph (b) of this item’s instructions. |
Item 3. Audit Committee Financial Expert.
The registrant’s Board of Trustees has determined that Douglas A. Hacker, David M. Moffett and Anne-Lee Verville, each of whom are members of the registrant’s Board of Trustees and Audit Committee, each qualify as an audit committee financial expert. Mr. Hacker, Mr. Moffett and Ms. Verville are each independent trustees, as defined in paragraph (a)(2) of this item’s instructions.
Item 4. Principal Accountant Fees and Services.
Fee information below is disclosed for the six series of the registrant whose reports to stockholders are included in this annual filing. One series liquidated on August 25, 2016 and the fees incurred by this series through its liquidation date are included in the response to this Item. One series changed its fiscal year end to August 31.
(a) Audit Fees. Aggregate Audit Fees billed by the principal accountant for professional services rendered during the fiscal years ended October 31, 2017 and October 31, 2016 are approximately as follows:
| | |
| 2017 | | 2016 |
$178,700 | | $163,900 |
Audit Fees include amounts related to the audit of the registrant’s annual financial statements or services that are normally provided by the accountant in connection with statutory and regulatory filings or engagements for those fiscal years.
(b) Audit-Related Fees. Aggregate Audit-Related Fees billed to the registrant by the principal accountant for professional services rendered during the fiscal years ended October 31, 2017 and October 31, 2016 are approximately as follows:
Audit-Related Fees include amounts for assurance and related services by the principal accountant that are reasonably related to the performance of the audit of the registrant’s financial statements and are not reported in Audit Fees above. In fiscal years 2017 and 2016, Audit-Related Fees consist of agreed-upon procedures performed for semi-annual shareholder reports.
During the fiscal years ended October 31, 2017 and October 31, 2016, there were no Audit-Related Fees billed by the registrant’s principal accountant to the registrant’s investment adviser (not including any sub-adviser whose role is primarily portfolio management and is subcontracted with or overseen by another investment adviser) and any entity controlling, controlled by, or under common control with the adviser that provides ongoing services to the registrant for an engagement that related directly to the operations and financial reporting of the registrant.
(c) Tax Fees. Aggregate Tax Fees billed by the principal accountant to the registrant for professional services rendered during the fiscal years ended October 31, 2017 and October 31, 2016 are approximately as follows:
Tax Fees include amounts for the review of annual tax returns, the review of required shareholder distribution calculations and typically include amounts for professional services by the principal accountant for tax compliance, tax advice and tax planning.
During the fiscal years ended October 31, 2017 and October 31, 2016, there were no Tax Fees billed by the registrant’s principal accountant to the registrant’s investment adviser (not including any sub-adviser whose role is primarily portfolio management and is subcontracted with or overseen by another investment adviser) and any entity controlling, controlled by, or under common control with the adviser that provides ongoing services to the registrant for an engagement that related directly to the operations and financial reporting of the registrant.
(d) All Other Fees. Aggregate All Other Fees billed by the principal accountant to the registrant for professional services rendered during the fiscal years ended October 31, 2017 and October 31, 2016 are approximately as follows:
All Other Fees include amounts for products and services provided by the principal accountant, other than the services reported in paragraphs (a) through (c) above.
Aggregate All Other Fees billed by the registrant’s principal accountant to the registrant’s investment adviser (not including any sub-adviser whose role is primarily portfolio management and is subcontracted with or overseen by another investment adviser) and any entity controlling, controlled by, or under common control with the adviser that provides ongoing services to the registrant for an engagement that related directly to the operations and financial reporting of the registrant during the fiscal years ended October 31, 2017 and October 31, 2016 are approximately as follows:
| | |
| 2017 | | 2016 |
$225,000 | | $225,000 |
In fiscal years 2017 and 2016, All Other Fees primarily consists of fees billed for internal control examinations of the registrant’s transfer agent and investment adviser.
(e)(1) Audit Committee Pre-Approval Policies and Procedures
The registrant’s Audit Committee is required to pre-approve the engagement of the registrant’s independent auditors to provide audit and non-audit services to the registrant and non-audit services to its investment adviser (excluding any sub-adviser whose role is primarily portfolio management and is sub-contracted or overseen by another investment adviser (the “Adviser”) or any entity controlling, controlled by or under common control with the Adviser that provides ongoing services to the Fund (a “Control Affiliate”) if the engagement relates directly to the operations and financial reporting of the registrant.
The Audit Committee has adopted a Policy for Engagement of Independent Auditors for Audit and Non-Audit Services (the “Policy”). The Policy sets forth the understanding of the Audit Committee regarding the engagement of the registrant’s independent accountants to provide (i) audit and permissible audit-related, tax and other services to the registrant (“Fund Services”); (ii) non-audit services to the registrant’s Adviser and any Control Affiliates, that relates directly to the operations and financial reporting of a Fund (“Fund-related Adviser Services”); and (iii) certain other audit and non-audit services to the registrant’s Adviser and its Control Affiliates. A service will require specific pre-approval by the Audit Committee if it is to be provided by the Fund’s independent auditor; provided, however, that pre-approval of non-audit services to the Fund, the Adviser or Control Affiliates may be waived if certain de minimis requirements set forth in the SEC’s rules are met.
Under the Policy, the Audit Committee may delegate pre-approval authority to any pre-designated member or members who are independent board members. The member(s) to whom such authority is delegated must report, for informational purposes only, any pre-approval decisions to the Audit Committee at its next regular meeting. The Audit Committee’s responsibilities with respect to the pre-approval of services performed by the independent auditor may not be delegated to management.
On an annual basis, at a regularly scheduled Audit Committee meeting, the Fund’s Treasurer or other Fund officer shall submit to the Audit Committee a schedule of the types of Fund Services and Fund-related Adviser Services that are subject to specific pre-approval. This schedule will provide a description of each type of service that is subject to specific pre-approval, along with total projected fees for each service. The pre-approval will generally cover a one-year period. The Audit Committee will review and approve the types of services and the projected fees for the next one-year period and may add to, or subtract from, the list of pre-approved services from time to time, based on subsequent determinations. This specific approval acknowledges that the Audit Committee is in agreement with the specific types of services that the independent auditor will be permitted to perform and the projected fees for each service.
The Fund’s Treasurer or other Fund officer shall report to the Audit Committee at each of its regular meetings regarding all Fund Services or Fund-related Adviser Services provided since the last such report was rendered, including a description of the services, by category, with forecasted fees for the annual reporting period, proposed changes requiring specific pre-approval and a description of services provided by the independent auditor, by category, with actual fees during the current reporting period.
*****
(e)(2) 100% of the services performed for items (b) through (d) above during 2017 and 2016 were pre-approved by the registrant’s Audit Committee.
(f) Not applicable.
(g) The aggregate non-audit fees billed by the registrant’s accountant for services rendered to the registrant, and rendered to the registrant’s investment adviser (not including any sub-adviser whose role is primarily portfolio management and is subcontracted with or overseen by another investment adviser), and any entity controlling, controlled by, or under common control with the adviser that provides ongoing services to the registrant during the fiscal years ended October 31, 2017 and October 31, 2016 are approximately as follows:
| | |
| 2017 | | 2016 |
$244,800 | | $248,000 |
(h) The registrant’s Audit Committee of the Board of Directors has considered whether the provision of non-audit services that were rendered to the registrant’s adviser (not including any sub-adviser whose role is primarily portfolio management and is subcontracted with or overseen by another investment adviser), and any entity controlling, controlled by, or under common control with the investment adviser that provides ongoing services to the registrant that were not pre-approved pursuant to paragraph (c)(7)(ii) of Rule 2-01 of Regulation S-X, is compatible with maintaining the principal accountant’s independence.
Item 5. Audit Committee of Listed Registrants.
Not applicable.
Item 6. Investments
| | (a) | The registrant’s “Schedule I – Investments in securities of unaffiliated issuers” (as set forth in 17 CFR 210.12-12) is included in Item 1 of this Form N-CSR. |
Item 7. Disclosure of Proxy Voting Policies and Procedures for Closed-End Management Investment Companies.
Not applicable.
Item 8. Portfolio Managers of Closed-End Management Investment Companies.
Not applicable.
Item 9. Purchases of Equity Securities by Closed-End Management Investment Company and Affiliated Purchasers.
Not applicable.
Item 10. Submission of Matters to a Vote of Security Holders.
There were no material changes to the procedures by which shareholders may recommend nominees to the registrant’s board of directors.
Item 11. Controls and Procedures.
| | (a) | The registrant’s principal executive officer and principal financial officers, based on their evaluation of the registrant’s disclosure controls and procedures as of a date within 90 days of the filing of this report, have concluded that such controls and procedures are adequately designed to ensure that material information required to be disclosed by the registrant in Form N-CSR is accumulated and communicated to the registrant’s management, including the principal executive officer and principal financial officer, or persons performing similar functions, as appropriate to allow timely decisions regarding required disclosure. |
| | (b) | There was no change in the registrant’s internal control over financial reporting that occurred during the registrant’s second fiscal quarter of the period covered by this report that has materially affected, or is reasonably likely to materially affect, the registrant’s internal control over financial reporting. |
Item 12. Disclosure of Securities Lending Activities for Closed-End Management Investment Companies
Not applicable.
Item 13. Exhibits.
(a)(1) Code of ethics required to be disclosed under Item 2 of Form N-CSR attached hereto as Exhibit 99.CODE ETH.
(a)(2) Certifications pursuant to Rule 30a-2(a) under the Investment Company Act of 1940 (17 CFR 270.30a-2(a)) attached hereto as Exhibit 99.CERT.
(a)(3) Not applicable.
(b) Certification pursuant to Rule 30a-2(b) under the Investment Company Act of 1940 (17 CFR 270.30a-2(b)) attached hereto as Exhibit 99.906CERT.
SIGNATURES
Pursuant to the requirements of the Securities Exchange Act of 1934 and the Investment Company Act of 1940, the registrant has duly caused this report to be signed on its behalf by the undersigned, thereunto duly authorized.
| | |
| (registrant) | | Columbia Funds Series Trust I |
| | |
| |
| By (Signature and Title) | | /s/ Christopher O. Petersen |
| | Christopher O. Petersen, President and Principal Executive Officer |
| | |
|
| Pursuant to the requirements of the Securities Exchange Act of 1934 and the Investment Company Act of 1940, this report has been signed below by the following persons on behalf of the registrant and in the capacities and on the dates indicated. |
| |
| By (Signature and Title) | | /s/ Christopher O. Petersen |
| | Christopher O. Petersen, President and Principal Executive Officer |
| | |
| |
| By (Signature and Title) | | /s/ Michael G. Clarke |
| | Michael G. Clarke, Treasurer and Chief Financial Officer |