UNITED STATES
SECURITIES AND EXCHANGE COMMISSION
Washington, D.C. 20549
FORM N-CSR
CERTIFIED SHAREHOLDER REPORT OF REGISTERED
MANAGEMENT INVESTMENT COMPANIES
Investment Company Act file number 811-04367
Columbia Funds Series Trust I
(Exact name of registrant as specified in charter)
225 Franklin Street
Boston, Massachusetts 02110
(Address of principal executive offices) (Zip code)
Ryan Larrenaga
c/o Columbia Management Investment Advisers, LLC
225 Franklin Street
Boston, MA 02110
(Name and address of agent for service)
Registrant’s telephone number, including area code: (800) 345-6611
Date of fiscal year end: March 31
Date of reporting period: March 31, 2018
Form N-CSR is to be used by management investment companies to file reports with the Commission not later than 10 days after the transmission to stockholders of any report that is required to be transmitted to stockholders under Rule 30e-1 under the Investment Company Act of 1940 (17 CFR 270.30e-1). The Commission may use the information provided on Form N-CSR in its regulatory, disclosure review, inspection, and policymaking roles.
A registrant is required to disclose the information specified by Form N-CSR, and the Commission will make this information public. A registrant is not required to respond to the collection of information contained in Form N-CSR unless the Form displays a currently valid Office of Management and Budget (“OMB”) control number. Please direct comments concerning the accuracy of the information collection burden estimate and any suggestions for reducing the burden to Secretary, Securities and Exchange Commission, 450 Fifth Street, NW, Washington, DC 20549-0609. The OMB has reviewed this collection of information under the clearance requirements of 44 U.S.C. § 3507.
Item 1. Reports to Stockholders.

Annual Report
March 31, 2018
Columbia Select Large Cap Growth Fund
Not FDIC Insured • No bank guarantee • May lose value
Dear Shareholders,
The year 2017 was an extraordinary year in the financial markets. The S&P 500 Index didn’t experience a single down month and returned over 20%. Continuing this trend, January 2018 marked the fastest start for the index ever. Low volatility, which had been a feature of the U.S. equity market for several years, along with the surge in the S&P 500 Index, drove investor sentiment to very high levels. This arguably set the stage for an overdue correction, which we witnessed in February 2018.
A return to volatility
There have been few periods of market upheaval such as were experienced in the first part of 2018. While investors were taken by surprise by the sudden and pronounced market swings, the return to some level of volatility actually marked a resumption of relatively normal market conditions. Having said that, it’s important to distinguish between a good technical correction where excess enthusiasm in the marketplace is being let out, versus a real change in the underlying fundamentals – things like an underperforming economy or weaker corporate earnings. Our view is that the recent market volatility falls into the former category, and the fundamentals remain strong. We’re continuing to see improvements in global economic activity, and we’re seeing corporate earnings expectations continue to rise – and not just because of tax reform.
Consistency is more important than ever
It’s important to keep in mind that when it comes to long-term investing, it’s the destination, not the journey that matters most. If you have a financial goal that you’ve worked out with your financial advisor, and you have a good asset allocation plan to reach it, it’s a question of sticking with your plan rather than become focused on near-term volatility. Bouts of volatility are normal. After all, it’s hard to cross the ocean without hitting an occasional rough patch. You need to focus on the destination.
One final thought. In weathering volatility, it’s the consistency of the return that is essential. Investors who chase higher returns are usually the first to sell when an investment goes through a bad patch, and they therefore don’t tend to benefit from the recovery. More disciplined investors who perhaps panic less or not at all during periods of volatility, tend to have improved long-term results and are more likely to reach their financial goals. Nothing is more important to us than making sure those who have entrusted us to protect and grow their assets are able to do what matters most to them.
Your success is our priority. Talk to your financial advisor about how working with Columbia Threadneedle Investments may help you position your portfolio for consistent, sustainable outcomes, no matter the market conditions.
Sincerely,
Christopher O. Petersen
President, Columbia Funds
The S&P 500 Index, an unmanaged index, measures the performance of 500 widely held, large-capitalization U.S. stocks and is frequently used as a general measure of market performance. Past performance is no guarantee of future results.
Columbia Funds are distributed by Columbia Management Investment Distributors, Inc., member FINRA, and managed by Columbia Management Investment Advisers, LLC.
© 2018 Columbia Management Investment Advisers, LLC. All rights reserved.
Columbia Select Large Cap Growth Fund | Annual Report 2018
Columbia Select Large Cap Growth Fund | Annual Report 2018
Investment objective
Columbia Select Large Cap Growth Fund (the Fund) seeks long-term capital appreciation.
Portfolio management
Thomas Galvin, CFA
Lead Portfolio Manager
Managed Fund since 2003’
Richard Carter
Portfolio Manager
Managed Fund since 2009
Todd Herget
Portfolio Manager
Managed Fund since 2009
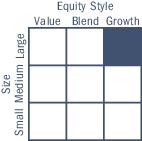
Morningstar style boxTM
The Morningstar Style Box is based on a fund’s portfolio holdings. For equity funds, the vertical axis shows the market capitalization of the stocks owned, and the horizontal axis shows investment style (value, blend, or growth). Information shown is based on the most recent data provided by Morningstar.
© 2018 Morningstar, Inc. All rights reserved. The Morningstar information contained herein: (1) is proprietary to Morningstar and/or its content providers; (2) may not be copied or distributed; and (3) is not warranted to be accurate, complete or timely. Neither Morningstar nor its content providers are responsible for any damages or losses arising from any use of this information.
| Average annual total returns (%) (for the period ended March 31, 2018) |
| | | Inception | 1 Year | 5 Years | 10 Years |
| Class A | Excluding sales charges | 09/28/07 | 23.42 | 14.40 | 10.37 |
| | Including sales charges | | 16.30 | 13.05 | 9.71 |
| Advisor Class* | 11/08/12 | 23.76 | 14.67 | 10.65 |
| Class C | Excluding sales charges | 09/28/07 | 22.55 | 13.55 | 9.55 |
| | Including sales charges | | 21.55 | 13.55 | 9.55 |
| Institutional Class | 10/01/97 | 23.66 | 14.67 | 10.64 |
| Institutional 2 Class* | 11/08/12 | 23.87 | 14.83 | 10.73 |
| Institutional 3 Class* | 11/08/12 | 23.86 | 14.87 | 10.75 |
| Class R | 12/31/04 | 23.09 | 14.09 | 10.09 |
| Class T* | Excluding sales charges | 09/27/10 | 23.43 | 14.40 | 10.36 |
| | Including sales charges | | 20.37 | 13.82 | 10.08 |
| Russell 1000 Growth Index | | 21.25 | 15.53 | 11.34 |
Returns for Class A shares are shown with and without the maximum initial sales charge of 5.75%. Returns for Class C shares are shown with and without the 1.00% contingent deferred sales charge for the first year only. The returns for Class T shares are shown with and without the maximum initial sales charge of 2.50% per transaction. The Fund’s other share classes are not subject to sales charges and have limited eligibility. Effective November 1, 2017, Class R4, Class R5, Class Y and Class Z shares were renamed Advisor Class, Institutional 2 Class, Institutional 3 Class and Institutional Class shares, respectively. Please see the Fund’s prospectus for details. Performance for different share classes will vary based on differences in sales charges and fees associated with each share class. All results shown assume reinvestment of distributions during the period. Returns do not reflect the deduction of taxes that a shareholder may pay on Fund distributions or on the redemption of Fund shares. Performance results reflect the effect of any fee waivers or reimbursements of Fund expenses by Columbia Management Investment Advisers, LLC and/or any of its affiliates. Absent these fee waivers or expense reimbursement arrangements, performance results would have been lower.
The performance information shown represents past performance and is not a guarantee of future results. The investment return and principal value of your investment will fluctuate so that your shares, when redeemed, may be worth more or less than their original cost. Current performance may be lower or higher than the performance information shown. You may obtain performance information current to the most recent month-end by contacting your financial intermediary, visiting columbiathreadneedleus.com/investor/ or calling 800.345.6611.
| * | The returns shown for periods prior to the share class inception date (including returns for the Life of the Fund, if shown, which are since Fund inception) include the returns of the Fund’s oldest share class. These returns are adjusted to reflect any higher class-related operating expenses of the newer share classes, as applicable. Please visit columbiathreadneedleus.com/investor/investment-products/mutual-funds/appended-performance for more information. |
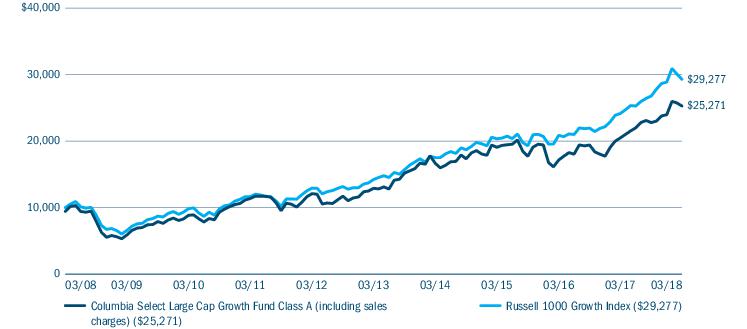
The Russell 1000 Growth Index, an unmanaged index, measures the performance of those Russell 1000 Index companies with higher price-to-book ratios and higher forecasted growth values.
Indices are not available for investment, are not professionally managed and do not reflect sales charges, fees, brokerage commissions, taxes or other expenses of investing. Securities in the Fund may not match those in an index.
| 2 | Columbia Select Large Cap Growth Fund | Annual Report 2018 |
Fund at a Glance (continued)
Performance of a hypothetical $10,000 investment (March 31, 2008 — March 31, 2018)
The chart above shows the change in value of a hypothetical $10,000 investment in Class A shares of Columbia Select Large Cap Growth Fund during the stated time period, and does not reflect the deduction of taxes that a shareholder may pay on Fund distributions or on the redemption of Fund shares.
| Top 10 holdings (%) (at March 31, 2018) |
| Amazon.com, Inc. | 4.6 |
| Booking Holdings, Inc. | 4.5 |
| Facebook, Inc., Class A | 4.2 |
| PayPal Holdings, Inc. | 3.9 |
| Salesforce.com, Inc. | 3.8 |
| NVIDIA Corp. | 3.7 |
| Visa, Inc., Class A | 3.7 |
| Adobe Systems, Inc. | 3.5 |
| Alibaba Group Holding Ltd., ADR | 3.5 |
| Applied Materials, Inc. | 3.4 |
Percentages indicated are based upon total investments (excluding Money Market Funds).
For further detail about these holdings, please refer to the section entitled “Portfolio of Investments.”
Fund holdings are as of the date given, are subject to change at any time, and are not recommendations to buy or sell any security.
| Portfolio breakdown (%) (at March 31, 2018) |
| Common Stocks | 99.6 |
| Money Market Funds | 0.4 |
| Total | 100.0 |
Percentages indicated are based upon total investments. The Fund’s portfolio composition is subject to change.
| Equity sector breakdown (%) (at March 31, 2018) |
| Consumer Discretionary | 19.2 |
| Consumer Staples | 4.7 |
| Energy | 2.0 |
| Financials | 7.2 |
| Health Care | 21.8 |
| Industrials | 2.1 |
| Information Technology | 43.0 |
| Total | 100.0 |
Percentages indicated are based upon total equity investments. The Fund’s portfolio composition is subject to change.
Columbia Select Large Cap Growth Fund | Annual Report 2018
| 3 |
Manager Discussion of Fund Performance
For the 12-month period that ended March 31, 2018, the Fund’s Class A shares returned 23.42%. The Fund outperformed its benchmark, the Russell 1000 Growth Index, which returned 21.25% for the same time period. The Fund’s emphasis on high-quality, high-growth information technology companies aided relative returns and more than offset disappointments in health care, which detracted from relative results.
Confident investors drove equity markets higher
Despite political tumult and rising tensions with North Korea and Iran, investors focused on prospects for stronger economic growth and lower taxes, driving U.S. financial markets higher over the 12-month period ended March 31, 2018. U.S. economic growth picked up, as gross domestic product (GDP) expanded an annualized rate of approximately 3.0% for three consecutive quarters; 3% is the long-term historical average growth rate of GDP. Even though jobs were lost as a result of hurricane disruptions during the third quarter of 2017, unemployment fell to 4.1%, as the U.S. labor market added an average of more than 188,000 new jobs per month during the period. Wage growth failed to keep pace with job growth, but there is hope that lower tax rates will move companies to raise wages more robustly. Global growth and a weaker U.S. dollar boosted exports. Robust manufacturing activity, higher consumer spending and expectations that less stringent regulation in certain industries would further boost growth also supported investor confidence. However, late in the period, U.S. equity markets pulled back sharply, producing the first real correction in over a year. Enthusiasm turned to anxiety as the market contended with heightened rhetoric regarding trade policy and a major security breach from Facebook, which pressured technology companies.
In March 2018, the Federal Reserve raised the target range on its key short-term interest rate, the federal funds rate, to 1.50% - 1.75%, citing solid job and economic growth and progress toward its 2.0% inflation target. The 10-year Treasury closed the period at 2.73%. During the 12-month period ended March 31, 2018, the S&P 500 Index, a broad-based measure of U.S. equity returns, gained 13.99%. The Bloomberg Barclays U.S. Aggregate Bond Index, which tracks returns of U.S. investment-grade government and corporate bonds, gained 1.20%.
Contributors and detractors
The Fund’s positioning in the information technology sector accounted for most of its performance advantage over the benchmark. Consumer discretionary holdings delivered mixed results. Health care, primarily in biotechnology and equipment, and an underweight in industrials detracted from relative results.
In the information technology sector, results across most industries were positive. Emerging market e-commerce firms, software and semiconductor names were especially strong. Emerging market e-commerce leaders Alibaba and MercadoLibre were top contributors to Fund returns, as both posted returns that led the way in the internet software and services industry. Alibaba continued to impress investors, as the firm meaningfully increased its revenue guidance based on expected strength from customer engagement and marketing through its e-commerce channels. Alibaba continued to benefit from accelerated growth from its AliCloud (cloud computing services), which more than doubled over the year. MercadoLibre continued to execute well with accelerated revenue growth, particularly in Brazil and Mexico.
Within software, Adobe, Service Now and Splunk were top contributors, each gaining more than 50% for the 12-month period. Adobe shares moved higher as the firm continued to benefit from the trend to online advertising sales. The strong adoption of Adobe’s creative and experience cloud services is also driving better results for the company. ServiceNow executed well on the strength of its primary information technology service management (ITSM) business line. It increased new product growth as well. Toward the end of the period, Splunk, which specializes in big data applications and security, announced a strong quarter, driven by its security and cloud business lines. The company’s revenue growth accelerated and it raised forward earnings guidance.
In the semiconductor industry, a position in NVIDIA was a notable contributor on strong gains. NVIDIA routinely beat revenues and earnings estimates on strength from the firm’s data center business. In the fourth quarter of 2017, we added a new position in semiconductor equipment company Applied Materials, which we believe is positioned to benefit from several secular growth themes as a leading supplier of tools and equipment necessary to produce semiconductors, memory and displays.
| 4 | Columbia Select Large Cap Growth Fund | Annual Report 2018 |
Manager Discussion of Fund Performance (continued)
In consumer staples, relative outperformance in the sector was driven by positions in energy drink distributor Monster Beverage and retailer Costco, both of which rallied in the double digits. Monster Beverage continued to execute well in its international expansion efforts. Costco pulled back modestly as consumer staples companies sold off following Amazon’s June 2017 announcement that it would acquire organic grocer Whole Foods. Costco shares rebounded later in the year, as enthusiasm for tax reform lifted sentiment across many retailers. The Fund had no exposure to traditional grocers and food products companies, which also benefited results.
In health care, Vertex Pharmaceuticals and genetic sequencing device provider Illumina were bright spots for the year. Vertex, a leader in cystic fibrosis therapies, announced positive results from two of its phase three triple-combo regime trials. Illumina launched its new NovaSeq gene sequencing product line and executed well on its product launch, which beat orders and deliveries estimates. However, Intercept Pharmaceutical, Celgene and Alexion Pharmaceuticals along with DexCom in the health care equipment and supplies industry were notable detractors. DexCom sold off on competitive changes and we exited the position.
At period’s end
We continue to balance the portfolio with established and emerging growth opportunities, focusing on unique business models that offer differentiated products and services that can grow in a variety of different economic environments. We believe that companies offering innovative products have the potential to maintain pricing power and garner incremental market share, which makes them more attractive for the portfolio.
Market risk may affect a single issuer, sector of the economy, industry or the market as a whole. Growth securities, at times, may not perform as well as value securities or the stock market in general and may be out of favor with investors. Foreign investments subject the Fund to risks, including political, economic, market, social and others within a particular country, as well as to currency instabilities and less stringent financial and accounting standards generally applicable to U.S. issuers. Investments in a limited number of companies or sectors subject the Fund to greater risk of loss. The Fund may invest significantly in issuers within a particular sector, which may be negatively affected by market, economic or other conditions, making the Fund more vulnerable to unfavorable developments in the sector.
The views expressed in this report reflect the current views of the respective parties. These views are not guarantees of future performance and involve certain risks, uncertainties and assumptions that are difficult to predict, so actual outcomes and results may differ significantly from the views expressed. These views are subject to change at any time based upon economic, market or other conditions and the respective parties disclaim any responsibility to update such views. These views may not be relied on as investment advice and, because investment decisions for a Columbia fund are based on numerous factors, may not be relied on as an indication of trading intent on behalf of any particular Columbia fund. References to specific securities should not be construed as a recommendation or investment advice.
Columbia Select Large Cap Growth Fund | Annual Report 2018
| 5 |
Understanding Your Fund’s Expenses
(Unaudited)
As an investor, you incur two types of costs. There are transaction costs, which generally include sales charges on purchases and may include redemption fees. There are also ongoing costs, which generally include management fees, distribution and/or service fees, and other fund expenses. The following information is intended to help you understand your ongoing costs (in dollars) of investing in the Fund and to help you compare these costs with the ongoing costs of investing in other mutual funds.
Analyzing your Fund’s expenses
To illustrate these ongoing costs, we have provided examples and calculated the expenses paid by investors in each share class of the Fund during the period. The actual and hypothetical information in the table is based on an initial investment of $1,000 at the beginning of the period indicated and held for the entire period. Expense information is calculated two ways and each method provides you with different information. The amount listed in the “Actual” column is calculated using the Fund’s actual operating expenses and total return for the period. You may use the Actual information, together with the amount invested, to estimate the expenses that you paid over the period. Simply divide your account value by $1,000 (for example, an $8,600 account value divided by $1,000 = 8.6), then multiply the results by the expenses paid during the period under the “Actual” column. The amount listed in the “Hypothetical” column assumes a 5% annual rate of return before expenses (which is not the Fund’s actual return) and then applies the Fund’s actual expense ratio for the period to the hypothetical return. You should not use the hypothetical account values and expenses to estimate either your actual account balance at the end of the period or the expenses you paid during the period. See “Compare with other funds” below for details on how to use the hypothetical data.
Compare with other funds
Since all mutual funds are required to include the same hypothetical calculations about expenses in shareholder reports, you can use this information to compare the ongoing cost of investing in the Fund with other funds. To do so, compare the hypothetical example with the 5% hypothetical examples that appear in the shareholder reports of other funds. As you compare hypothetical examples of other funds, it is important to note that hypothetical examples are meant to highlight the ongoing costs of investing in a fund only and do not reflect any transaction costs, such as sales charges, or redemption or exchange fees. Therefore, the hypothetical calculations are useful in comparing ongoing costs only, and will not help you determine the relative total costs of owning different funds. If transaction costs were included in these calculations, your costs would be higher.
| October 1, 2017 — March 31, 2018 |
| | Account value at the
beginning of the
period ($) | Account value at the
end of the
period ($) | Expenses paid during
the period ($) | Fund’s annualized
expense ratio (%) |
| | Actual | Hypothetical | Actual | Hypothetical | Actual | Hypothetical | Actual |
| Class A | 1,000.00 | 1,000.00 | 1,109.40 | 1,019.44 | 5.65 | 5.41 | 1.08 |
| Advisor Class | 1,000.00 | 1,000.00 | 1,111.30 | 1,020.68 | 4.34 | 4.16 | 0.83 |
| Class C | 1,000.00 | 1,000.00 | 1,105.60 | 1,015.72 | 9.55 | 9.15 | 1.83 |
| Institutional Class | 1,000.00 | 1,000.00 | 1,110.60 | 1,020.68 | 4.34 | 4.16 | 0.83 |
| Institutional 2 Class | 1,000.00 | 1,000.00 | 1,111.50 | 1,021.27 | 3.72 | 3.56 | 0.71 |
| Institutional 3 Class | 1,000.00 | 1,000.00 | 1,111.90 | 1,021.47 | 3.51 | 3.36 | 0.67 |
| Class R | 1,000.00 | 1,000.00 | 1,108.20 | 1,018.20 | 6.95 | 6.66 | 1.33 |
| Class T | 1,000.00 | 1,000.00 | 1,110.10 | 1,019.49 | 5.60 | 5.36 | 1.07 |
Expenses paid during the period are equal to the annualized expense ratio for each class as indicated above, multiplied by the average account value over the period and then multiplied by the number of days in the Fund’s most recent fiscal half year and divided by 365.
Expenses do not include fees and expenses incurred indirectly by the Fund from its investment in underlying funds, including affiliated and non-affiliated pooled investment vehicles, such as mutual funds and exchange-traded funds.
Had Columbia Management Investment Advisers, LLC and/or certain of its affiliates not waived/reimbursed certain fees and expenses, account value at the end of the period would have been reduced.
| 6 | Columbia Select Large Cap Growth Fund | Annual Report 2018 |
Portfolio of Investments
March 31, 2018
(Percentages represent value of investments compared to net assets)
Investments in securities
| Common Stocks 99.6% |
| Issuer | Shares | Value ($) |
| Consumer Discretionary 19.1% |
| Diversified Consumer Services 2.2% |
| New Oriental Education & Technology Group, Inc., ADR | 1,027,166 | 90,031,100 |
| Internet & Direct Marketing Retail 11.1% |
| Amazon.com, Inc.(a) | 128,714 | 186,292,921 |
| Booking Holdings, Inc.(a) | 88,166 | 183,419,665 |
| Ctrip.com International Ltd., ADR(a) | 1,812,557 | 84,501,407 |
| Total | | 454,213,993 |
| Specialty Retail 2.5% |
| Ulta Beauty, Inc.(a) | 499,987 | 102,132,344 |
| Textiles, Apparel & Luxury Goods 3.3% |
| Nike, Inc., Class B | 2,016,288 | 133,962,175 |
| Total Consumer Discretionary | 780,339,612 |
| Consumer Staples 4.7% |
| Beverages 2.5% |
| Monster Beverage Corp.(a) | 1,766,826 | 101,080,115 |
| Food & Staples Retailing 2.2% |
| Costco Wholesale Corp. | 477,690 | 90,011,127 |
| Total Consumer Staples | 191,091,242 |
| Energy 2.0% |
| Oil, Gas & Consumable Fuels 2.0% |
| Pioneer Natural Resources Co. | 475,251 | 81,638,617 |
| Total Energy | 81,638,617 |
| Financials 7.1% |
| Banks 2.7% |
| First Republic Bank | 1,190,087 | 110,213,957 |
| Capital Markets 4.4% |
| Charles Schwab Corp. (The) | 2,231,745 | 116,541,724 |
| MSCI, Inc. | 426,489 | 63,747,311 |
| Total | | 180,289,035 |
| Total Financials | 290,502,992 |
| Common Stocks (continued) |
| Issuer | Shares | Value ($) |
| Health Care 21.7% |
| Biotechnology 9.0% |
| Alexion Pharmaceuticals, Inc.(a) | 1,202,932 | 134,078,801 |
| Celgene Corp.(a) | 1,250,954 | 111,597,606 |
| Vertex Pharmaceuticals, Inc.(a) | 754,245 | 122,926,850 |
| Total | | 368,603,257 |
| Health Care Equipment & Supplies 4.9% |
| Edwards Lifesciences Corp.(a) | 760,380 | 106,088,218 |
| IDEXX Laboratories, Inc.(a) | 489,913 | 93,764,449 |
| Total | | 199,852,667 |
| Health Care Providers & Services 2.0% |
| UnitedHealth Group, Inc. | 374,889 | 80,226,246 |
| Life Sciences Tools & Services 3.3% |
| Illumina, Inc.(a) | 565,963 | 133,804,972 |
| Pharmaceuticals 2.5% |
| Bristol-Myers Squibb Co. | 1,581,682 | 100,041,387 |
| Total Health Care | 882,528,529 |
| Industrials 2.1% |
| Aerospace & Defense 2.1% |
| Northrop Grumman Corp. | 246,538 | 86,071,346 |
| Total Industrials | 86,071,346 |
| Information Technology 42.9% |
| Electronic Equipment, Instruments & Components 2.5% |
| Cognex Corp. | 1,957,047 | 101,746,873 |
| Internet Software & Services 9.5% |
| Alibaba Group Holding Ltd., ADR(a) | 781,321 | 143,403,656 |
| Facebook, Inc., Class A(a) | 1,070,204 | 171,007,897 |
| MercadoLibre, Inc. | 201,138 | 71,683,572 |
| Total | | 386,095,125 |
| IT Services 7.5% |
| PayPal Holdings, Inc.(a) | 2,093,737 | 158,851,826 |
| Visa, Inc., Class A | 1,241,766 | 148,540,049 |
| Total | | 307,391,875 |
The accompanying Notes to Financial Statements are an integral part of this statement.
Columbia Select Large Cap Growth Fund | Annual Report 2018
| 7 |
Portfolio of Investments (continued)
March 31, 2018
| Common Stocks (continued) |
| Issuer | Shares | Value ($) |
| Semiconductors & Semiconductor Equipment 7.1% |
| Applied Materials, Inc. | 2,497,530 | 138,887,644 |
| NVIDIA Corp. | 644,614 | 149,286,156 |
| Total | | 288,173,800 |
| Software 16.3% |
| Activision Blizzard, Inc. | 2,021,526 | 136,372,144 |
| Adobe Systems, Inc.(a) | 667,698 | 144,276,184 |
| Salesforce.com, Inc.(a) | 1,322,784 | 153,839,779 |
| ServiceNow, Inc.(a) | 702,469 | 116,223,496 |
| Splunk, Inc.(a) | 1,144,986 | 112,655,173 |
| Total | | 663,366,776 |
| Total Information Technology | 1,746,774,449 |
Total Common Stocks
(Cost $2,379,294,441) | 4,058,946,787 |
|
| Money Market Funds 0.4% |
| | Shares | Value ($) |
| Columbia Short-Term Cash Fund, 1.738%(b),(c) | 18,213,755 | 18,211,933 |
Total Money Market Funds
(Cost $18,211,933) | 18,211,933 |
Total Investments in Securities
(Cost: $2,397,506,374) | 4,077,158,720 |
| Other Assets & Liabilities, Net | | (1,610,729) |
| Net Assets | 4,075,547,991 |
Notes to Portfolio of Investments
| (a) | Non-income producing investment. |
| (b) | The rate shown is the seven-day current annualized yield at March 31, 2018. |
| (c) | As defined in the Investment Company Act of 1940, an affiliated company is one in which the Fund owns 5% or more of the company’s outstanding voting securities, or a company which is under common ownership or control with the Fund. Holdings and transactions in these affiliated companies during the year ended March 31, 2018 are as follows: |
| Issuer | Beginning
shares | Shares
purchased | Shares
sold | Ending
shares | Realized gain
(loss) —
affiliated
issuers ($) | Net change in
unrealized
appreciation
(depreciation) —
affiliated
issuers ($) | Dividends —
affiliated
issuers ($) | Value —
affiliated
issuers
at end of
period ($) |
| Columbia Short-Term Cash Fund, 1.738% |
| | 116,271,746 | 1,560,974,610 | (1,659,032,601) | 18,213,755 | 17,353 | (11,628) | 650,107 | 18,211,933 |
Abbreviation Legend
| ADR | American Depositary Receipt |
Fair value measurements
The Fund categorizes its fair value measurements according to a three-level hierarchy that maximizes the use of observable inputs and minimizes the use of unobservable inputs by prioritizing that the most observable input be used when available. Observable inputs are those that market participants would use in pricing an investment based on market data obtained from sources independent of the reporting entity. Unobservable inputs are those that reflect the Fund’s assumptions about the information market participants would use in pricing an investment. An investment’s level within the fair value hierarchy is based on the lowest level of any input that is deemed significant to the asset’s or liability’s fair value measurement. The input levels are not necessarily an indication of the risk or liquidity associated with investments at that level. For example, certain U.S. government securities are generally high quality and liquid, however, they are reflected as Level 2 because the inputs used to determine fair value may not always be quoted prices in an active market.
Fair value inputs are summarized in the three broad levels listed below:
| ■ | Level 1 — Valuations based on quoted prices for investments in active markets that the Fund has the ability to access at the measurement date. Valuation adjustments are not applied to Level 1 investments. |
| ■ | Level 2 — Valuations based on other significant observable inputs (including quoted prices for similar securities, interest rates, prepayment speeds, credit risks, etc.). |
| ■ | Level 3 — Valuations based on significant unobservable inputs (including the Fund’s own assumptions and judgment in determining the fair value of investments). |
The accompanying Notes to Financial Statements are an integral part of this statement.
| 8 | Columbia Select Large Cap Growth Fund | Annual Report 2018 |
Portfolio of Investments (continued)
March 31, 2018
Fair value measurements (continued)
Inputs that are used in determining fair value of an investment may include price information, credit data, volatility statistics, and other factors. These inputs can be either observable or unobservable. The availability of observable inputs can vary between investments, and is affected by various factors such as the type of investment, and the volume and level of activity for that investment or similar investments in the marketplace. The inputs will be considered by the Investment Manager, along with any other relevant factors in the calculation of an investment’s fair value. The Fund uses prices and inputs that are current as of the measurement date, which may include periods of market dislocations. During these periods, the availability of prices and inputs may be reduced for many investments. This condition could cause an investment to be reclassified between the various levels within the hierarchy.
Certain investments that have been measured at fair value using the net asset value (NAV) per share (or its equivalent) are not categorized in the fair value hierarchy. The fair value amounts presented in the table are intended to reconcile the fair value hierarchy to the amounts presented in the Portfolio of Investments. The Columbia Short-Term Cash Fund seeks to provide shareholders with maximum current income consistent with liquidity and stability of principal. Columbia Short-Term Cash Fund prices its shares with a floating NAV and no longer seeks to maintain a stable NAV.
Investments falling into the Level 3 category are primarily supported by quoted prices from brokers and dealers participating in the market for those investments. However, these may be classified as Level 3 investments due to lack of market transparency and corroboration to support these quoted prices. Additionally, valuation models may be used as the pricing source for any remaining investments classified as Level 3. These models may rely on one or more significant unobservable inputs and/or significant assumptions by the Investment Manager. Inputs used in valuations may include, but are not limited to, financial statement analysis, capital account balances, discount rates and estimated cash flows, and comparable company data.
Under the direction of the Fund’s Board of Trustees (the Board), the Investment Manager’s Valuation Committee (the Committee) is responsible for overseeing the valuation procedures approved by the Board. The Committee consists of voting and non-voting members from various groups within the Investment Manager’s organization, including operations and accounting, trading and investments, compliance, risk management and legal.
The Committee meets at least monthly to review and approve valuation matters, which may include a description of specific valuation determinations, data regarding pricing information received from approved pricing vendors and brokers and the results of Board-approved valuation control policies and procedures (the Policies). The Policies address, among other things, instances when market quotations are or are not readily available, including recommendations of third party pricing vendors and a determination of appropriate pricing methodologies; events that require specific valuation determinations and assessment of fair value techniques; securities with a potential for stale pricing, including those that are illiquid, restricted, or in default; and the effectiveness of third party pricing vendors, including periodic reviews of vendors. The Committee meets more frequently, as needed, to discuss additional valuation matters, which may include the need to review back-testing results, review time-sensitive information or approve related valuation actions. The Committee reports to the Board, with members of the Committee meeting with the Board at each of its regularly scheduled meetings to discuss valuation matters and actions during the period, similar to those described earlier.
For investments categorized as Level 3, the Committee monitors information similar to that described above, which may include: (i) data specific to the issuer or comparable issuers, (ii) general market or specific sector news and (iii) quoted prices and specific or similar security transactions. The Committee considers this data and any changes from prior periods in order to assess the reasonableness of observable and unobservable inputs, any assumptions or internal models used to value those securities and changes in fair value. This data is also used to corroborate, when available, information received from approved pricing vendors and brokers. Various factors impact the frequency of monitoring this information (which may occur as often as daily). However, the Committee may determine that changes to inputs, assumptions and models are not required as a result of the monitoring procedures performed.
The following table is a summary of the inputs used to value the Fund’s investments at March 31, 2018:
| | Level 1
quoted prices
in active
markets for
identical
assets ($) | Level 2
other
significant
observable
inputs ($) | Level 3
significant
unobservable
inputs ($) | Investments
measured at
net asset
value ($) | Total ($) |
| Investments in Securities | | | | | |
| Common Stocks | | | | | |
| Consumer Discretionary | 780,339,612 | — | — | — | 780,339,612 |
| Consumer Staples | 191,091,242 | — | — | — | 191,091,242 |
| Energy | 81,638,617 | — | — | — | 81,638,617 |
| Financials | 290,502,992 | — | — | — | 290,502,992 |
| Health Care | 882,528,529 | — | — | — | 882,528,529 |
| Industrials | 86,071,346 | — | — | — | 86,071,346 |
| Information Technology | 1,746,774,449 | — | — | — | 1,746,774,449 |
| Total Common Stocks | 4,058,946,787 | — | — | — | 4,058,946,787 |
| Money Market Funds | — | — | — | 18,211,933 | 18,211,933 |
| Total Investments in Securities | 4,058,946,787 | — | — | 18,211,933 | 4,077,158,720 |
See the Portfolio of Investments for all investment classifications not indicated in the table.
There were no transfers of financial assets between levels during the period.
The accompanying Notes to Financial Statements are an integral part of this statement.
Columbia Select Large Cap Growth Fund | Annual Report 2018
| 9 |
Statement of Assets and Liabilities
March 31, 2018
| Assets | |
| Investments in securities, at value | |
| Unaffiliated issuers (cost $2,379,294,441) | $4,058,946,787 |
| Affiliated issuers (cost $18,211,933) | 18,211,933 |
| Receivable for: | |
| Capital shares sold | 2,325,256 |
| Dividends | 1,276,251 |
| Prepaid expenses | 9,077 |
| Trustees’ deferred compensation plan | 227,710 |
| Total assets | 4,080,997,014 |
| Liabilities | |
| Due to custodian | 4,861 |
| Payable for: | |
| Capital shares purchased | 4,606,548 |
| Management services fees | 71,576 |
| Distribution and/or service fees | 6,391 |
| Transfer agent fees | 390,414 |
| Compensation of board members | 895 |
| Compensation of chief compliance officer | 405 |
| Other expenses | 140,223 |
| Trustees’ deferred compensation plan | 227,710 |
| Total liabilities | 5,449,023 |
| Net assets applicable to outstanding capital stock | $4,075,547,991 |
| Represented by | |
| Paid in capital | 2,092,411,438 |
| Excess of distributions over net investment income | (227,710) |
| Accumulated net realized gain | 303,711,917 |
| Unrealized appreciation (depreciation) on: | |
| Investments - unaffiliated issuers | 1,679,652,346 |
| Total - representing net assets applicable to outstanding capital stock | $4,075,547,991 |
The accompanying Notes to Financial Statements are an integral part of this statement.
| 10 | Columbia Select Large Cap Growth Fund | Annual Report 2018 |
Statement of Assets and Liabilities (continued)
March 31, 2018
| Class A | |
| Net assets | $409,344,004 |
| Shares outstanding | 24,178,054 |
| Net asset value per share | $16.93 |
| Maximum sales charge | 5.75% |
| Maximum offering price per share (calculated by dividing the net asset value per share by 1.0 minus the maximum sales charge for Class A shares) | $17.96 |
| Advisor Class | |
| Net assets | $61,176,431 |
| Shares outstanding | 3,406,722 |
| Net asset value per share | $17.96 |
| Class C | |
| Net assets | $128,181,475 |
| Shares outstanding | 8,457,254 |
| Net asset value per share | $15.16 |
| Institutional Class | |
| Net assets | $1,471,336,851 |
| Shares outstanding | 84,296,208 |
| Net asset value per share | $17.45 |
| Institutional 2 Class | |
| Net assets | $753,355,647 |
| Shares outstanding | 41,740,026 |
| Net asset value per share | $18.05 |
| Institutional 3 Class | |
| Net assets | $1,239,699,610 |
| Shares outstanding | 67,985,889 |
| Net asset value per share | $18.23 |
| Class R | |
| Net assets | $12,262,607 |
| Shares outstanding | 772,469 |
| Net asset value per share | $15.87 |
| Class T | |
| Net assets | $191,366 |
| Shares outstanding | 11,305 |
| Net asset value per share | $16.93 |
| Maximum sales charge | 2.50% |
| Maximum offering price per share (calculated by dividing the net asset value per share by 1.0 minus the maximum sales charge per transaction for Class T shares) | $17.36 |
The accompanying Notes to Financial Statements are an integral part of this statement.
Columbia Select Large Cap Growth Fund | Annual Report 2018
| 11 |
Statement of Operations
Year Ended March 31, 2018
| Net investment income | |
| Income: | |
| Dividends — unaffiliated issuers | $23,653,667 |
| Dividends — affiliated issuers | 650,107 |
| Total income | 24,303,774 |
| Expenses: | |
| Management services fees | 27,276,189 |
| Distribution and/or service fees | |
| Class A | 1,083,340 |
| Class C | 1,478,086 |
| Class R | 67,135 |
| Class T | 531 |
| Transfer agent fees | |
| Class A | 677,397 |
| Advisor Class | 61,736 |
| Class C | 230,899 |
| Institutional Class | 3,127,369 |
| Institutional 2 Class | 441,269 |
| Institutional 3 Class | 67,846 |
| Class R | 20,972 |
| Class T | 332 |
| Compensation of board members | 85,381 |
| Custodian fees | 27,943 |
| Printing and postage fees | 230,812 |
| Registration fees | 163,900 |
| Audit fees | 29,757 |
| Legal fees | 112,358 |
| Line of credit interest | 15,514 |
| Compensation of chief compliance officer | 1,663 |
| Other | 196,225 |
| Total expenses | 35,396,654 |
| Fees waived by transfer agent | |
| Institutional 2 Class | (90,106) |
| Institutional 3 Class | (60,929) |
| Expense reduction | (1,500) |
| Total net expenses | 35,244,119 |
| Net investment loss | (10,940,345) |
| Realized and unrealized gain (loss) — net | |
| Net realized gain (loss) on: | |
| Investments — unaffiliated issuers | 503,256,893 |
| Investments — affiliated issuers | 17,353 |
| Net realized gain | 503,274,246 |
| Net change in unrealized appreciation (depreciation) on: | |
| Investments — unaffiliated issuers | 407,184,036 |
| Investments — affiliated issuers | (11,628) |
| Net change in unrealized appreciation (depreciation) | 407,172,408 |
| Net realized and unrealized gain | 910,446,654 |
| Net increase in net assets resulting from operations | $899,506,309 |
The accompanying Notes to Financial Statements are an integral part of this statement.
| 12 | Columbia Select Large Cap Growth Fund | Annual Report 2018 |
Statement of Changes in Net Assets
| | Year Ended
March 31, 2018 | Year Ended
March 31, 2017 |
| Operations | | |
| Net investment loss | $(10,940,345) | $(26,734,586) |
| Net realized gain | 503,274,246 | 764,969,492 |
| Net change in unrealized appreciation (depreciation) | 407,172,408 | 142,463,021 |
| Net increase in net assets resulting from operations | 899,506,309 | 880,697,927 |
| Distributions to shareholders | | |
| Net realized gains | | |
| Class A | (47,766,353) | (110,137,846) |
| Advisor Class | (3,693,351) | (3,068,527) |
| Class C | (18,060,441) | (22,791,768) |
| Class I | — | (19,020,097) |
| Institutional Class | (247,449,095) | (301,763,432) |
| Institutional 2 Class | (78,810,974) | (68,631,157) |
| Institutional 3 Class | (64,665,519) | (2,914,698) |
| Class R | (1,568,180) | (1,905,044) |
| Class T | (23,898) | (1,148,908) |
| Total distributions to shareholders | (462,037,811) | (531,381,477) |
| Decrease in net assets from capital stock activity | (984,247,760) | (1,327,287,342) |
| Total decrease in net assets | (546,779,262) | (977,970,892) |
| Net assets at beginning of year | 4,622,327,253 | 5,600,298,145 |
| Net assets at end of year | $4,075,547,991 | $4,622,327,253 |
| Excess of distributions over net investment income | $(227,710) | $(4,727,661) |
The accompanying Notes to Financial Statements are an integral part of this statement.
Columbia Select Large Cap Growth Fund | Annual Report 2018
| 13 |
Statement of Changes in Net Assets (continued)
| | Year Ended | Year Ended |
| | March 31, 2018 | March 31, 2017 |
| | Shares | Dollars ($) | Shares | Dollars ($) |
| Capital stock activity |
| Class A | | | | |
| Subscriptions | 4,059,938 | 65,799,028 | 10,659,403 | 161,321,147 |
| Distributions reinvested | 2,923,382 | 45,103,498 | 7,797,605 | 106,884,716 |
| Redemptions | (38,545,469) | (598,225,905) | (37,963,635) | (576,299,860) |
| Net decrease | (31,562,149) | (487,323,379) | (19,506,627) | (308,093,997) |
| Advisor Class | | | | |
| Subscriptions | 2,402,901 | 41,675,555 | 699,811 | 11,101,409 |
| Distributions reinvested | 224,577 | 3,691,972 | 212,601 | 3,068,293 |
| Redemptions | (907,725) | (15,584,920) | (1,273,962) | (20,045,845) |
| Net increase (decrease) | 1,719,753 | 29,782,607 | (361,550) | (5,876,143) |
| Class C | | | | |
| Subscriptions | 803,509 | 11,663,354 | 1,345,827 | 18,240,909 |
| Distributions reinvested | 1,113,066 | 15,453,545 | 1,446,769 | 18,136,049 |
| Redemptions | (4,930,488) | (72,123,452) | (7,447,321) | (103,104,330) |
| Net decrease | (3,013,913) | (45,006,553) | (4,654,725) | (66,727,372) |
| Class I | | | | |
| Subscriptions | — | — | 1,391,704 | 22,037,340 |
| Distributions reinvested | — | — | 1,335,435 | 19,019,862 |
| Redemptions | — | — | (15,560,082) | (244,778,684) |
| Net decrease | — | — | (12,832,943) | (203,721,482) |
| Institutional Class | | | | |
| Subscriptions | 23,360,451 | 384,987,755 | 44,701,989 | 682,949,637 |
| Distributions reinvested | 10,923,742 | 173,239,626 | 11,436,740 | 160,939,865 |
| Redemptions | (118,687,696) | (1,944,238,927) | (114,752,639) | (1,772,528,078) |
| Net decrease | (84,403,503) | (1,386,011,546) | (58,613,910) | (928,638,576) |
| Institutional 2 Class | | | | |
| Subscriptions | 3,287,997 | 56,831,501 | 9,663,624 | 153,187,188 |
| Distributions reinvested | 4,796,539 | 78,789,383 | 4,743,907 | 68,612,410 |
| Redemptions | (10,136,547) | (176,309,453) | (11,028,264) | (176,400,837) |
| Net increase (decrease) | (2,052,011) | (40,688,569) | 3,379,267 | 45,398,761 |
| Institutional 3 Class | | | | |
| Subscriptions | 65,144,777 | 1,106,225,506 | 10,571,168 | 170,723,003 |
| Distributions reinvested | 1,943,654 | 32,596,268 | 199,319 | 2,914,464 |
| Redemptions | (10,711,903) | (190,847,830) | (1,090,686) | (17,446,101) |
| Net increase | 56,376,528 | 947,973,944 | 9,679,801 | 156,191,366 |
| Class R | | | | |
| Subscriptions | 138,053 | 2,104,113 | 204,346 | 2,947,496 |
| Distributions reinvested | 108,043 | 1,564,471 | 146,876 | 1,903,934 |
| Redemptions | (435,689) | (6,597,837) | (637,797) | (9,075,908) |
| Net decrease | (189,593) | (2,929,253) | (286,575) | (4,224,478) |
| Class T | | | | |
| Subscriptions | — | — | 39,122 | 599,398 |
| Distributions reinvested | 1,534 | 23,656 | 83,753 | 1,148,664 |
| Redemptions | (4,171) | (68,667) | (905,125) | (13,343,483) |
| Net decrease | (2,637) | (45,011) | (782,250) | (11,595,421) |
| Total net decrease | (63,127,525) | (984,247,760) | (83,979,512) | (1,327,287,342) |
The accompanying Notes to Financial Statements are an integral part of this statement.
| 14 | Columbia Select Large Cap Growth Fund | Annual Report 2018 |
[THIS PAGE INTENTIONALLY LEFT BLANK]
Columbia Select Large Cap Growth Fund | Annual Report 2018
| 15 |
The following table is intended to help you understand the Fund’s financial performance. Certain information reflects financial results for a single share of a class held for the periods shown. Per share net investment income (loss) amounts are calculated based on average shares outstanding during the period. Total return assumes reinvestment of all dividends and distributions, if any. Total return does not reflect payment of sales charges, if any. Total return and portfolio turnover are not annualized for periods of less than one year. The portfolio turnover rate is calculated without regard to purchase and sales transactions of short-term instruments and certain derivatives, if any. If such transactions were included, the Fund’s portfolio turnover rate may be higher.
| | Net asset value,
beginning of
period | Net
investment
income
(loss) | Net
realized
and
unrealized
gain (loss) | Total from
investment
operations | Distributions
from net
realized
gains |
| Class A |
| Year Ended 3/31/2018 | $15.36 | (0.08) | 3.45 | 3.37 | (1.80) |
| Year Ended 3/31/2017 | $14.58 | (0.11) | 2.70 | 2.59 | (1.81) |
| Year Ended 3/31/2016 | $18.49 | (0.12) | (1.45) | (1.57) | (2.34) |
| Year Ended 3/31/2015 | $18.92 | (0.13) | 2.54 | 2.41 | (2.84) |
| Year Ended 3/31/2014 | $15.23 | (0.14) | 4.55 | 4.41 | (0.72) |
| Advisor Class |
| Year Ended 3/31/2018 | $16.18 | (0.05) | 3.66 | 3.61 | (1.83) |
| Year Ended 3/31/2017 | $15.23 | (0.07) | 2.83 | 2.76 | (1.81) |
| Year Ended 3/31/2016 | $19.22 | (0.08) | (1.52) | (1.60) | (2.39) |
| Year Ended 3/31/2015 | $19.55 | (0.10) | 2.66 | 2.56 | (2.89) |
| Year Ended 3/31/2014 | $15.69 | (0.11) | 4.69 | 4.58 | (0.72) |
| Class C |
| Year Ended 3/31/2018 | $13.99 | (0.18) | 3.12 | 2.94 | (1.77) |
| Year Ended 3/31/2017 | $13.53 | (0.21) | 2.48 | 2.27 | (1.81) |
| Year Ended 3/31/2016 | $17.32 | (0.23) | (1.35) | (1.58) | (2.21) |
| Year Ended 3/31/2015 | $17.98 | (0.26) | 2.41 | 2.15 | (2.81) |
| Year Ended 3/31/2014 | $14.61 | (0.27) | 4.36 | 4.09 | (0.72) |
| Institutional Class |
| Year Ended 3/31/2018 | $15.78 | (0.03) | 3.53 | 3.50 | (1.83) |
| Year Ended 3/31/2017 | $14.89 | (0.07) | 2.77 | 2.70 | (1.81) |
| Year Ended 3/31/2016 | $18.84 | (0.08) | (1.48) | (1.56) | (2.39) |
| Year Ended 3/31/2015 | $19.22 | (0.09) | 2.60 | 2.51 | (2.89) |
| Year Ended 3/31/2014 | $15.43 | (0.10) | 4.61 | 4.51 | (0.72) |
The accompanying Notes to Financial Statements are an integral part of this statement.
| 16 | Columbia Select Large Cap Growth Fund | Annual Report 2018 |
Total
distributions to
shareholders | Net
asset
value,
end of
period | Total
return | Total gross
expense
ratio to
average
net assets(a) | Total net
expense
ratio to
average
net assets(a),(b) | Net investment
income (loss)
ratio to
average
net assets | Portfolio
turnover | Net
assets,
end of
period
(000’s) |
| |
| (1.80) | $16.93 | 23.42% | 1.08% (c) | 1.08% (c),(d) | (0.50%) | 44% | $409,344 |
| (1.81) | $15.36 | 19.42% | 1.08% | 1.08% (d) | (0.71%) | 35% | $856,339 |
| (2.34) | $14.58 | (10.08%) | 1.08% | 1.08% (d) | (0.72%) | 56% | $1,097,096 |
| (2.84) | $18.49 | 14.42% | 1.09% (c) | 1.09% (c),(d) | (0.73%) | 47% | $1,466,541 |
| (0.72) | $18.92 | 29.19% | 1.10% (c) | 1.10% (c),(d) | (0.81%) | 53% | $1,525,489 |
| |
| (1.83) | $17.96 | 23.76% | 0.83% (c) | 0.83% (c),(d) | (0.29%) | 44% | $61,176 |
| (1.81) | $16.18 | 19.72% | 0.83% | 0.83% (d) | (0.46%) | 35% | $27,302 |
| (2.39) | $15.23 | (9.89%) | 0.83% | 0.83% (d) | (0.45%) | 56% | $31,199 |
| (2.89) | $19.22 | 14.76% | 0.84% (c) | 0.84% (c),(d) | (0.52%) | 47% | $17,988 |
| (0.72) | $19.55 | 29.42% | 0.85% (c) | 0.85% (c),(d) | (0.59%) | 53% | $12,381 |
| |
| (1.77) | $15.16 | 22.55% | 1.83% (c) | 1.83% (c),(d) | (1.24%) | 44% | $128,181 |
| (1.81) | $13.99 | 18.52% | 1.83% | 1.83% (d) | (1.46%) | 35% | $160,526 |
| (2.21) | $13.53 | (10.79%) | 1.83% | 1.83% (d) | (1.46%) | 56% | $218,181 |
| (2.81) | $17.32 | 13.62% | 1.84% (c) | 1.84% (c),(d) | (1.49%) | 47% | $226,538 |
| (0.72) | $17.98 | 28.23% | 1.85% (c) | 1.85% (c),(d) | (1.56%) | 53% | $186,302 |
| |
| (1.83) | $17.45 | 23.66% | 0.83% (c) | 0.83% (c),(d) | (0.20%) | 44% | $1,471,337 |
| (1.81) | $15.78 | 19.77% | 0.83% | 0.83% (d) | (0.46%) | 35% | $2,661,832 |
| (2.39) | $14.89 | (9.88%) | 0.83% | 0.83% (d) | (0.46%) | 56% | $3,384,999 |
| (2.89) | $18.84 | 14.74% | 0.84% (c) | 0.84% (c),(d) | (0.49%) | 47% | $4,275,296 |
| (0.72) | $19.22 | 29.46% | 0.85% (c) | 0.85% (c),(d) | (0.56%) | 53% | $4,178,590 |
Columbia Select Large Cap Growth Fund | Annual Report 2018
| 17 |
Financial Highlights (continued)
| | Net asset value,
beginning of
period | Net
investment
income
(loss) | Net
realized
and
unrealized
gain (loss) | Total from
investment
operations | Distributions
from net
realized
gains |
| Institutional 2 Class |
| Year Ended 3/31/2018 | $16.25 | (0.02) | 3.66 | 3.64 | (1.84) |
| Year Ended 3/31/2017 | $15.27 | (0.05) | 2.84 | 2.79 | (1.81) |
| Year Ended 3/31/2016 | $19.26 | (0.06) | (1.51) | (1.57) | (2.42) |
| Year Ended 3/31/2015 | $19.59 | (0.06) | 2.64 | 2.58 | (2.91) |
| Year Ended 3/31/2014 | $15.69 | (0.07) | 4.69 | 4.62 | (0.72) |
| Institutional 3 Class |
| Year Ended 3/31/2018 | $16.40 | (0.03) | 3.71 | 3.68 | (1.85) |
| Year Ended 3/31/2017 | $15.39 | (0.04) | 2.86 | 2.82 | (1.81) |
| Year Ended 3/31/2016 | $19.39 | (0.05) | (1.53) | (1.58) | (2.42) |
| Year Ended 3/31/2015 | $19.71 | (0.06) | 2.66 | 2.60 | (2.92) |
| Year Ended 3/31/2014 | $15.77 | (0.07) | 4.73 | 4.66 | (0.72) |
| Class R |
| Year Ended 3/31/2018 | $14.51 | (0.11) | 3.24 | 3.13 | (1.77) |
| Year Ended 3/31/2017 | $13.90 | (0.14) | 2.56 | 2.42 | (1.81) |
| Year Ended 3/31/2016 | $17.74 | (0.16) | (1.38) | (1.54) | (2.30) |
| Year Ended 3/31/2015 | $18.27 | (0.17) | 2.45 | 2.28 | (2.81) |
| Year Ended 3/31/2014 | $14.77 | (0.18) | 4.40 | 4.22 | (0.72) |
| Class T |
| Year Ended 3/31/2018 | $15.36 | (0.08) | 3.45 | 3.37 | (1.80) |
| Year Ended 3/31/2017 | $14.58 | (0.11) | 2.70 | 2.59 | (1.81) |
| Year Ended 3/31/2016 | $18.49 | (0.13) | (1.44) | (1.57) | (2.34) |
| Year Ended 3/31/2015 | $18.92 | (0.13) | 2.54 | 2.41 | (2.84) |
| Year Ended 3/31/2014 | $15.23 | (0.14) | 4.55 | 4.41 | (0.72) |
| Notes to Financial Highlights |
| (a) | In addition to the fees and expenses that the Fund bears directly, the Fund indirectly bears a pro rata share of the fees and expenses of any other funds in which it invests. Such indirect expenses are not included in the Fund’s reported expense ratios. |
| (b) | Total net expenses include the impact of certain fee waivers/expense reimbursements made by the Investment Manager and certain of its affiliates, if applicable. |
| (c) | Ratios include line of credit interest expense which is less than 0.01%. |
| (d) | The benefits derived from expense reductions had an impact of less than 0.01%. |
The accompanying Notes to Financial Statements are an integral part of this statement.
| 18 | Columbia Select Large Cap Growth Fund | Annual Report 2018 |
Total
distributions to
shareholders | Net
asset
value,
end of
period | Total
return | Total gross
expense
ratio to
average
net assets(a) | Total net
expense
ratio to
average
net assets(a),(b) | Net investment
income (loss)
ratio to
average
net assets | Portfolio
turnover | Net
assets,
end of
period
(000’s) |
| |
| (1.84) | $18.05 | 23.87% | 0.73% (c) | 0.72% (c) | (0.14%) | 44% | $753,356 |
| (1.81) | $16.25 | 19.87% | 0.71% | 0.71% | (0.34%) | 35% | $711,730 |
| (2.42) | $15.27 | (9.75%) | 0.70% | 0.70% | (0.33%) | 56% | $617,120 |
| (2.91) | $19.26 | 14.89% | 0.70% (c) | 0.70% (c) | (0.34%) | 47% | $754,744 |
| (0.72) | $19.59 | 29.68% | 0.70% (c) | 0.70% (c) | (0.41%) | 53% | $635,330 |
| |
| (1.85) | $18.23 | 23.86% | 0.68% (c) | 0.68% (c) | (0.20%) | 44% | $1,239,700 |
| (1.81) | $16.40 | 19.91% | 0.67% | 0.67% | (0.22%) | 35% | $190,421 |
| (2.42) | $15.39 | (9.69%) | 0.65% | 0.65% | (0.27%) | 56% | $29,698 |
| (2.92) | $19.39 | 14.91% | 0.65% (c) | 0.65% (c) | (0.30%) | 47% | $27,581 |
| (0.72) | $19.71 | 29.78% | 0.65% (c) | 0.65% (c) | (0.36%) | 53% | $21,274 |
| |
| (1.77) | $15.87 | 23.09% | 1.33% (c) | 1.33% (c),(d) | (0.75%) | 44% | $12,263 |
| (1.81) | $14.51 | 19.13% | 1.33% | 1.33% (d) | (0.96%) | 35% | $13,963 |
| (2.30) | $13.90 | (10.34%) | 1.33% | 1.33% (d) | (0.97%) | 56% | $17,358 |
| (2.81) | $17.74 | 14.16% | 1.34% (c) | 1.34% (c),(d) | (0.99%) | 47% | $23,092 |
| (0.72) | $18.27 | 28.81% | 1.35% (c) | 1.35% (c),(d) | (1.06%) | 53% | $20,300 |
| |
| (1.80) | $16.93 | 23.43% | 1.08% (c) | 1.08% (c),(d) | (0.50%) | 44% | $191 |
| (1.81) | $15.36 | 19.42% | 1.08% | 1.08% (d) | (0.74%) | 35% | $214 |
| (2.34) | $14.58 | (10.07%) | 1.08% | 1.08% (d) | (0.74%) | 56% | $11,608 |
| (2.84) | $18.49 | 14.41% | 1.09% (c) | 1.09% (c),(d) | (0.74%) | 47% | $42,248 |
| (0.72) | $18.92 | 29.19% | 1.11% (c) | 1.11% (c),(d) | (0.81%) | 53% | $38,342 |
Columbia Select Large Cap Growth Fund | Annual Report 2018
| 19 |
Notes to Financial Statements
March 31, 2018
Note 1. Organization
Columbia Select Large Cap Growth Fund (the Fund), a series of Columbia Funds Series Trust I (the Trust), is a diversified fund. The Trust is registered under the Investment Company Act of 1940, as amended (the 1940 Act), as an open-end management investment company organized as a Massachusetts business trust.
Fund shares
The Trust may issue an unlimited number of shares (without par value). Although all share classes generally have identical voting, dividend and liquidation rights, each share class votes separately when required by the Trust’s organizational documents or by law. Different share classes pay different distribution amounts to the extent the expenses of such share classes differ, and distributions in liquidation will be proportional to the net asset value of each share class. Each share class has its own expense and sales charge structure. The Fund offers each of the share classes identified below.
Class A shares are subject to a maximum front-end sales charge of 5.75% based on the initial investment amount. Class A shares purchased without an initial sales charge in accounts aggregating $1 million to $50 million at the time of purchase are subject to a contingent deferred sales charge (CDSC) if the shares are sold within 18 months after purchase, charged as follows: 1.00% CDSC if redeemed within 12 months after purchase, and 0.50% CDSC if redeemed more than 12, but less than 18, months after purchase.
Advisor Class shares are not subject to sales charges and are generally available only to omnibus retirement plans and certain investors as described in the Fund’s prospectus. Prior to November 1, 2017, Advisor Class shares were known as Class R4 shares.
Class C shares are subject to a 1.00% CDSC on shares redeemed within 12 months after purchase.
Institutional Class shares are not subject to sales charges and are generally available only to eligible investors, which are subject to different investment minimums as described in the Fund’s prospectus. Prior to November 1, 2017, Institutional Class shares were known as Class Z shares.
Institutional 2 Class shares are not subject to sales charges and are generally available only to investors purchasing through authorized investment professionals and omnibus retirement plans as described in the Fund’s prospectus. Prior to November 1, 2017, Institutional 2 Class shares were known as Class R5 shares.
Institutional 3 Class shares are not subject to sales charges and are available to institutional and certain other investors as described in the Fund’s prospectus. Prior to November 1, 2017, Institutional 3 Class shares were known as Class Y shares.
Class R shares are not subject to sales charges and are generally available only to certain retirement plans and other investors as described in the Fund’s prospectus.
Class T shares are subject to a maximum front-end sales charge of 2.50% per transaction and must be purchased through financial intermediaries that, by written agreement with Columbia Management Investment Distributors, Inc., are specifically authorized to sell Class T shares.
Note 2. Summary of significant accounting policies
Basis of preparation
The Fund is an investment company that applies the accounting and reporting guidance in the Financial Accounting Standards Board (FASB) Accounting Standards Codification Topic 946, Financial Services - Investment Companies (ASC 946). The financial statements are prepared in accordance with U.S. generally accepted accounting principles (GAAP), which requires management to make certain estimates and assumptions that affect the reported amounts of assets and liabilities, the disclosure of contingent assets and liabilities at the date of the financial statements and the reported amounts of income and expenses during the reporting period. Actual results could differ from those estimates.
The following is a summary of significant accounting policies followed by the Fund in the preparation of its financial statements.
| 20 | Columbia Select Large Cap Growth Fund | Annual Report 2018 |
Notes to Financial Statements (continued)
March 31, 2018
Security valuation
All equity securities are valued at the close of business of the New York Stock Exchange. Equity securities are valued at the last quoted sales price on the principal exchange or market on which they trade, except for securities traded on the NASDAQ Stock Market, which are valued at the NASDAQ official close price. Unlisted securities or listed securities for which there were no sales during the day are valued at the mean of the latest quoted bid and ask prices on such exchanges or markets.
Foreign equity securities are valued based on the closing price on the foreign exchange in which such securities are primarily traded. If any foreign equity security closing prices are not readily available, the securities are valued at the mean of the latest quoted bid and ask prices on such exchanges or markets. Foreign currency exchange rates are generally determined at 4:00 p.m. Eastern (U.S.) time. Many securities markets and exchanges outside the U.S. close prior to the close of the New York Stock Exchange; therefore, the closing prices for securities in such markets or on such exchanges may not fully reflect events that occur after such close but before the close of the New York Stock Exchange. In those situations, foreign securities will be fair valued pursuant to a policy adopted by the Board of Trustees, including, if available, utilizing a third party pricing service to determine these fair values. The third party pricing service takes into account multiple factors, including, but not limited to, movements in the U.S. securities markets, certain depositary receipts, futures contracts and foreign exchange rates that have occurred subsequent to the close of the foreign exchange or market, to determine a good faith estimate that reasonably reflects the current market conditions as of the close of the New York Stock Exchange. The fair value of a security is likely to be different from the quoted or published price, if available.
Investments in open-end investment companies, including money market funds, are valued at their latest net asset value.
Investments for which market quotations are not readily available, or that have quotations which management believes are not reflective of market value or reliable, are valued at fair value as determined in good faith under procedures approved by and under the general supervision of the Board of Trustees. If a security or class of securities (such as foreign securities) is valued at fair value, such value is likely to be different from the quoted or published price for the security.
The determination of fair value often requires significant judgment. To determine fair value, management may use assumptions including but not limited to future cash flows and estimated risk premiums. Multiple inputs from various sources may be used to determine fair value.
GAAP requires disclosure regarding the inputs and valuation techniques used to measure fair value and any changes in valuation inputs or techniques. In addition, investments shall be disclosed by major category. This information is disclosed following the Fund’s Portfolio of Investments.
Security transactions
Security transactions are accounted for on the trade date. Cost is determined and gains (losses) are based upon the specific identification method for both financial statement and federal income tax purposes.
Income recognition
Corporate actions and dividend income are generally recorded net of any non-reclaimable tax withholdings, on the ex-dividend date or upon receipt of ex-dividend notification in the case of certain foreign securities.
The Fund may receive distributions from holdings in equity securities, business development companies (BDCs), exchange-traded funds (ETFs), limited partnerships (LPs), other regulated investment companies (RICs), and real estate investment trusts (REITs), which report information on the tax character of their distributions annually. These distributions are allocated to dividend income, capital gain and return of capital based on actual information reported. Return of capital is recorded as a reduction of the cost basis of securities held. If the Fund no longer owns the applicable securities, return of capital is recorded as a realized gain. With respect to REITs, to the extent actual information has not yet been reported, estimates for return of capital are made by the Fund’s management. Management’s estimates are subsequently adjusted when the actual character of the distributions is disclosed by the REITs, which could result in a proportionate change in return of capital to shareholders.
Awards from class action litigation are recorded as a reduction of cost basis if the Fund still owns the applicable securities on the payment date. If the Fund no longer owns the applicable securities, the proceeds are recorded as realized gains.
Columbia Select Large Cap Growth Fund | Annual Report 2018
| 21 |
Notes to Financial Statements (continued)
March 31, 2018
Expenses
General expenses of the Trust are allocated to the Fund and other funds of the Trust based upon relative net assets or other expense allocation methodologies determined by the nature of the expense. Expenses directly attributable to the Fund are charged to the Fund. Expenses directly attributable to a specific class of shares are charged to that share class.
Determination of class net asset value
All income, expenses (other than class-specific expenses, which are charged to that share class, as shown in the Statement of Operations) and realized and unrealized gains (losses) are allocated to each class of the Fund on a daily basis, based on the relative net assets of each class, for purposes of determining the net asset value of each class.
Federal income tax status
The Fund intends to qualify each year as a regulated investment company under Subchapter M of the Internal Revenue Code, as amended, and will distribute substantially all of its investment company taxable income and net capital gain, if any, for its tax year, and as such will not be subject to federal income taxes. In addition, the Fund intends to distribute in each calendar year substantially all of its ordinary income, capital gain net income and certain other amounts, if any, such that the Fund should not be subject to federal excise tax. Therefore, no federal income or excise tax provision is recorded.
Distributions to shareholders
Distributions from net investment income, if any, are declared and paid each calendar quarter. Net realized capital gains, if any, are distributed at least annually. Income distributions and capital gain distributions are determined in accordance with federal income tax regulations, which may differ from GAAP.
Guarantees and indemnifications
Under the Trust’s organizational documents and, in some cases, by contract, its officers and trustees are indemnified against certain liabilities arising out of the performance of their duties to the Trust or its funds. In addition, certain of the Fund’s contracts with its service providers contain general indemnification clauses. The Fund’s maximum exposure under these arrangements is unknown since the amount of any future claims that may be made against the Fund cannot be determined, and the Fund has no historical basis for predicting the likelihood of any such claims.
Recent accounting pronouncement
Accounting Standards Update 2017-08 Premium Amortization on Purchased Callable Debt Securities
In March 2017, the Financial Accounting Standards Board issued Accounting Standards Update (ASU) No. 2017-08 Premium Amortization on Purchased Callable Debt Securities. ASU No. 2017-08 updates the accounting standards to shorten the amortization period for certain purchased callable debt securities, held at a premium, to be amortized to the earliest call date. The update applies to securities with explicit, noncontingent call features that are callable at fixed prices and on preset dates. The standard is effective for annual periods beginning after December 15, 2018 and interim periods within those fiscal years. At this time, management is evaluating the implication of this guidance and the impact it will have on the financial statement amounts and footnote disclosures, if any.
Note 3. Fees and other transactions with affiliates
Management services fees
The Fund has entered into a Management Agreement with Columbia Management Investment Advisers, LLC (the Investment Manager), a wholly-owned subsidiary of Ameriprise Financial, Inc. (Ameriprise Financial). Under the Management Agreement, the Investment Manager provides the Fund with investment research and advice, as well as administrative and accounting services. The management services fee is an annual fee that is equal to a percentage of the Fund’s daily net assets that declines from 0.77% to 0.57% as the Fund’s net assets increase. The effective management services fee rate for the year ended March 31, 2018 was 0.65% of the Fund’s average daily net assets.
| 22 | Columbia Select Large Cap Growth Fund | Annual Report 2018 |
Notes to Financial Statements (continued)
March 31, 2018
Compensation of board members
Members of the Board of Trustees who are not officers or employees of the Investment Manager or Ameriprise Financial are compensated for their services to the Fund as disclosed in the Statement of Operations. These members of the Board of Trustees may participate in a Deferred Compensation Plan (the Plan) which may be terminated at any time. Obligations of the Plan will be paid solely out of the Fund’s assets, and all amounts payable under the Plan constitute a general unsecured obligation of the Fund.
Compensation of Chief Compliance Officer
The Board of Trustees has appointed a Chief Compliance Officer to the Fund in accordance with federal securities regulations. As disclosed in the Statement of Operations, a portion of the Chief Compliance Officer’s total compensation is allocated to the Fund, along with other allocations to affiliated funds governed by the Board of Trustees, based on relative net assets.
Transactions with affiliates
For the year ended March 31, 2018, the Fund engaged in purchase and/or sale transactions with affiliates and/or accounts that have a common investment manager (or affiliated investment managers), common directors/trustees, and/or common officers. Those purchase and sale transactions complied with provisions of Rule 17a-7 under the 1940 Act and were $0 and $355,029,799, respectively. The sale transactions resulted in a net realized gain of $34,393,105.
Transfer agency fees
Under a Transfer and Dividend Disbursing Agent Agreement, Columbia Management Investment Services Corp. (the Transfer Agent), an affiliate of the Investment Manager and a wholly-owned subsidiary of Ameriprise Financial, is responsible for providing transfer agency services to the Fund. The Transfer Agent has contracted with DST Asset Manager Solutions, Inc. (DST) to serve as sub-transfer agent. The Transfer Agent pays the fees of DST for services as sub-transfer agent and DST is not entitled to reimbursement for such fees from the Fund (with the exception of out-of-pocket fees).
The Fund pays the Transfer Agent a monthly transfer agency fee based on the number or the average value of accounts, depending on the type of account. In addition, the Fund pays the Transfer Agent a fee for shareholder services based on the number of accounts or on a percentage of the average aggregate value of the Fund’s shares maintained in omnibus accounts up to the lesser of the amount charged by the financial intermediary or a cap established by the Board of Trustees from time to time.
The Transfer Agent also receives compensation from the Fund for various shareholder services and reimbursements for certain out-of-pocket fees. Effective August 1, 2017, total transfer agency fees for Institutional 2 Class and Institutional 3 Class shares are subject to an annual limitation of not more than 0.07% and 0.02%, respectively, of the average daily net assets attributable to each share class. Prior to August 1, 2017, these limitations were 0.075% for Institutional 2 Class shares and 0.025% for Institutional 3 Class shares.
For the year ended March 31, 2018, the Fund’s effective transfer agency fee rates as a percentage of average daily net assets of each class were as follows:
| | Effective rate (%) |
| Class A | 0.16 |
| Advisor Class | 0.16 |
| Class C | 0.16 |
| Institutional Class | 0.16 |
| Institutional 2 Class | 0.05 |
| Institutional 3 Class | 0.00 |
| Class R | 0.16 |
| Class T | 0.16 |
Columbia Select Large Cap Growth Fund | Annual Report 2018
| 23 |
Notes to Financial Statements (continued)
March 31, 2018
An annual minimum account balance fee of $20 may apply to certain accounts with a value below the applicable share class’s initial minimum investment requirements to reduce the impact of small accounts on transfer agency fees. These minimum account balance fees are remitted to the Fund and recorded as part of expense reductions in the Statement of Operations. For the year ended March 31, 2018, these minimum account balance fees reduced total expenses of the Fund by $1,500.
Distribution and service fees
The Fund has entered into an agreement with Columbia Management Investment Distributors, Inc. (the Distributor), an affiliate of the Investment Manager and a wholly-owned subsidiary of Ameriprise Financial, for distribution and shareholder services. The Board of Trustees has approved, and the Fund has adopted, distribution and shareholder service plans (the Plans) applicable to certain share classes, which set the distribution and service fees for the Fund. These fees are calculated daily and are intended to compensate the Distributor and/or eligible selling and/or servicing agents for selling shares of the Fund and providing services to investors.
Under the Plans, the Fund pays a monthly service fee to the Distributor at the maximum annual rate of 0.25% of the average daily net assets attributable to Class A, Class C and Class T shares of the Fund. Also under the Plans, the Fund pays a monthly distribution fee to the Distributor at the maximum annual rates of 0.75%, 0.50% and 0.25% of the average daily net assets attributable to Class C, Class R and Class T shares of the Fund, respectively.
Although the Fund may pay a distribution fee up to 0.25% of the Fund’s average daily net assets attributable to Class T shares and a service fee of up to 0.25% of the Fund’s average daily net assets attributable to Class T shares, the aggregate fee shall not exceed 0.25% of the Fund’s average daily net assets attributable to Class T shares.
Sales charges (unaudited)
Sales charges, including front-end charges and CDSCs, received by the Distributor for distributing Fund shares for the year ended March 31, 2018, if any, are listed below:
| | Amount ($) |
| Class A | 362,556 |
| Class C | 5,576 |
Expenses waived/reimbursed by the Investment Manager and its affiliates
The Investment Manager and certain of its affiliates have contractually agreed to waive fees and/or reimburse expenses (excluding certain fees and expenses described below) for the period(s) disclosed below, unless sooner terminated at the sole discretion of the Board of Trustees, so that the Fund’s net operating expenses, after giving effect to fees waived/expenses reimbursed and any balance credits and/or overdraft charges from the Fund’s custodian, do not exceed the following annual rate(s) as a percentage of the class’ average daily net assets:
| | August 1, 2017
through
July 31, 2018 | Prior to
August 1, 2017 |
| Class A | 1.15% | 1.20% |
| Advisor Class | 0.90 | 0.95 |
| Class C | 1.90 | 1.95 |
| Institutional Class | 0.90 | 0.95 |
| Institutional 2 Class | 0.84 | 0.87 |
| Institutional 3 Class | 0.79 | 0.82 |
| Class R | 1.40 | 1.45 |
| Class T | 1.15 | 1.20 |
Under the agreement governing these fee waivers and/or expense reimbursement arrangements, the following fees and expenses are excluded from the waiver/reimbursement commitment, and therefore will be paid by the Fund, if applicable: taxes (including foreign transaction taxes), expenses associated with investments in affiliated and non-affiliated
| 24 | Columbia Select Large Cap Growth Fund | Annual Report 2018 |
Notes to Financial Statements (continued)
March 31, 2018
pooled investment vehicles (including mutual funds and exchange-traded funds), transaction costs and brokerage commissions, costs related to any securities lending program, dividend expenses associated with securities sold short, inverse floater program fees and expenses, transaction charges and interest on borrowed money, interest, infrequent and/or unusual expenses and any other expenses the exclusion of which is specifically approved by the Board of Trustees. This agreement may be modified or amended only with approval from the Investment Manager, certain of its affiliates and the Fund. Reflected in the contractual cap commitment, effective August 1, 2017 through July 31, 2018, is the Transfer Agent’s contractual agreement to limit total transfer agency fees to an annual rate of not more than 0.04% for Institutional 2 Class and 0.00% for Institutional 3 Class of the average daily net assets attributable to each share class, unless sooner terminated at the sole discretion of the Board of Trustees. Any fees waived and/or expenses reimbursed under the expense reimbursement arrangements described above are not recoverable by the Investment Manager or its affiliates in future periods.
Note 4. Federal tax information
The timing and character of income and capital gain distributions are determined in accordance with income tax regulations, which may differ from GAAP because of temporary or permanent book to tax differences.
At March 31, 2018, these differences were primarily due to differing treatment for deferral/reversal of wash sale losses, trustees’ deferred compensation and net operating loss reclassification. To the extent these differences were permanent, reclassifications were made among the components of the Fund’s net assets in the Statement of Assets and Liabilities. Temporary differences do not require reclassifications.
In the Statement of Assets and Liabilities the following reclassifications were made:
Excess of distributions
over net investment
income ($) | Accumulated
net realized
gain ($) | Paid in
capital ($) |
| 15,440,296 | (15,440,296) | — |
Net investment income (loss) and net realized gains (losses), as disclosed in the Statement of Operations, and net assets were not affected by this reclassification.
The tax character of distributions paid during the years indicated was as follows:
| Year Ended March 31, 2018 | Year Ended March 31, 2017 |
Ordinary
income ($) | Long-term
capital gains ($) | Total ($) | Ordinary
income ($) | Long-term
capital gains ($) | Total ($) |
| 15,595,330 | 446,442,481 | 462,037,811 | — | 531,381,477 | 531,381,477 |
Short-term capital gain distributions, if any, are considered ordinary income distributions for tax purposes.
At March 31, 2018, the components of distributable earnings on a tax basis were as follows:
Undistributed
ordinary income ($) | Undistributed
long-term
capital gains ($) | Capital loss
carryforwards ($) | Net unrealized
appreciation ($) |
| 23,361,598 | 281,109,070 | — | 1,678,893,595 |
At March 31, 2018, the cost of all investments for federal income tax purposes along with the aggregate gross unrealized appreciation and depreciation based on that cost was:
Federal
tax cost ($) | Gross unrealized
appreciation ($) | Gross unrealized
(depreciation) ($) | Net unrealized
appreciation ($) |
| 2,398,265,125 | 1,709,111,873 | (30,218,278) | 1,678,893,595 |
Tax cost of investments and unrealized appreciation/(depreciation) may also include timing differences that do not constitute adjustments to tax basis.
Columbia Select Large Cap Growth Fund | Annual Report 2018
| 25 |
Notes to Financial Statements (continued)
March 31, 2018
Management of the Fund has concluded that there are no significant uncertain tax positions in the Fund that would require recognition in the financial statements. However, management’s conclusion may be subject to review and adjustment at a later date based on factors including, but not limited to, new tax laws, regulations, and administrative interpretations (including relevant court decisions). Generally, the Fund’s federal tax returns for the prior three fiscal years remain subject to examination by the Internal Revenue Service.
Note 5. Portfolio information
The cost of purchases and proceeds from sales of securities, excluding short-term investments and derivatives, if any, aggregated to $1,839,488,133 and $3,186,331,093, respectively, for the year ended March 31, 2018. The amount of purchase and sale activity impacts the portfolio turnover rate reported in the Financial Highlights.
Note 6. Affiliated money market fund
The Fund invests in Columbia Short-Term Cash Fund, an affiliated money market fund established for the exclusive use by the Fund and other affiliated funds (the Affiliated MMF). The income earned by the Fund from such investments is included as Dividends - affiliated issuers in the Statement of Operations. As an investing fund, the Fund indirectly bears its proportionate share of the expenses of the Affiliated MMF. The Affiliated MMF prices its shares with a floating net asset value. In addition, the Board of Trustees of the Affiliated MMF may impose a fee on redemptions (sometimes referred to as a liquidity fee) or temporarily suspend redemptions (sometimes referred to as imposing a redemption gate) in the event its liquidity falls below regulatory limits.
Note 7. Line of credit
The Fund has access to a revolving credit facility with a syndicate of banks led by Citibank, N.A., HSBC Bank USA, N.A. and JPMorgan Chase Bank, N.A. whereby the Fund may borrow for the temporary funding of shareholder redemptions or for other temporary or emergency purposes. The credit facility, which is a collective agreement between the Fund and certain other funds managed by the Investment Manager, severally and not jointly, permits collective borrowings up to $1 billion. Interest is charged to each participating fund based on its borrowings at a rate equal to the higher of (i) the overnight federal funds rate plus 1.00% or (ii) the one-month LIBOR rate plus 1.00%. Each borrowing under the credit facility matures no later than 60 days after the date of borrowing. The Fund also pays a commitment fee equal to its pro rata share of the amount of the credit facility at a rate of 0.15% per annum. The commitment fee is included in other expenses in the Statement of Operations.
For the year ended March 31, 2018, the average daily loan balance outstanding on days when borrowing existed was $55,740,000 at a weighted average interest rate of 2.23%. Interest expense incurred by the Fund is recorded as a line of credit interest expense in the Statement of Operations. The Fund had no outstanding borrowings at March 31, 2018.
Note 8. Significant risks
Health care sector risk
The Fund may be more susceptible to the particular risks that may affect companies in the health care sector than if it were invested in a wider variety of companies in unrelated sectors. Companies in the health care sector are subject to certain risks, including restrictions on government reimbursement for medical expenses, government approval of medical products and services, competitive pricing pressures, and the rising cost of medical products and services (especially for companies dependent upon a relatively limited number of products or services). Performance of such companies may be affected by factors including, government regulation, obtaining and protecting patents (or the failure to do so), product liability and other similar litigation as well as product obsolescence.
Shareholder concentration risk
At March 31, 2018, unaffiliated shareholders of record owned 46.6% of the outstanding shares of the Fund in one or more accounts. The Fund has no knowledge about whether any portion of those shares was owned beneficially. Affiliated shareholders of record owned 13.4% of the outstanding shares of the Fund in one or more accounts. Subscription and redemption activity by concentrated accounts may have a significant effect on the operations of the Fund. In the case of a
| 26 | Columbia Select Large Cap Growth Fund | Annual Report 2018 |
Notes to Financial Statements (continued)
March 31, 2018
large redemption, the Fund may be forced to sell investments at inopportune times, including its liquid positions, which may result in Fund losses and the Fund holding a higher percentage of less liquid positions. Large redemptions could result in decreased economies of scale and increased operating expenses for non-redeeming Fund shareholders.
Technology and technology-related investment risk
The Fund may be more susceptible to the particular risks that may affect companies in the information technology sector, as well as other technology-related sectors (collectively, the technology sectors) than if it were invested in a wider variety of companies in unrelated sectors. Companies in the technology sectors are subject to certain risks, including the risk that new services, equipment or technologies will not be accepted by consumers and businesses or will become rapidly obsolete. Performance of such companies may be affected by factors including obtaining and protecting patents (or the failure to do so) and significant competitive pressures, including aggressive pricing of their products or services, new market entrants, competition for market share and short product cycles due to an accelerated rate of technological developments. Such competitive pressures may lead to limited earnings and/or falling profit margins. As a result, the value of their securities may fall or fail to rise. In addition, many technology sector companies have limited operating histories and prices of these companies’ securities historically have been more volatile than other securities, especially over the short term.
Note 9. Subsequent events
Management has evaluated the events and transactions that have occurred through the date the financial statements were issued and noted no items requiring adjustment of the financial statements or additional disclosure.
Note 10. Information regarding pending and settled legal proceedings
Ameriprise Financial and certain of its affiliates have historically been involved in a number of legal, arbitration and regulatory proceedings, including routine litigation, class actions, and governmental actions, concerning matters arising in connection with the conduct of their business activities. Ameriprise Financial believes that the Fund is not currently the subject of, and that neither Ameriprise Financial nor any of its affiliates are the subject of, any pending legal, arbitration or regulatory proceedings that are likely to have a material adverse effect on the Fund or the ability of Ameriprise Financial or its affiliates to perform under their contracts with the Fund. Ameriprise Financial is required to make quarterly (10-Q), annual (10-K) and, as necessary, 8-K filings with the Securities and Exchange Commission (SEC) on legal and regulatory matters that relate to Ameriprise Financial and its affiliates. Copies of these filings may be obtained by accessing the SEC website at www.sec.gov.
There can be no assurance that these matters, or the adverse publicity associated with them, will not result in increased Fund redemptions, reduced sale of Fund shares or other adverse consequences to the Fund. Further, although we believe proceedings are not likely to have a material adverse effect on the Fund or the ability of Ameriprise Financial or its affiliates to perform under their contracts with the Fund, these proceedings are subject to uncertainties and, as such, we are unable to estimate the possible loss or range of loss that may result. An adverse outcome in one or more of these proceedings could result in adverse judgments, settlements, fines, penalties or other relief that could have a material adverse effect on the consolidated financial condition or results of operations of Ameriprise Financial.
Columbia Select Large Cap Growth Fund | Annual Report 2018
| 27 |
Report of Independent Registered Public Accounting Firm
To the Trustees of Columbia Funds Series Trust I and Shareholders of Columbia Select Large Cap Growth Fund
Opinion on the Financial Statements
We have audited the accompanying statement of assets and liabilities, including the portfolio of investments, of Columbia Select Large Cap Growth Fund (one of the funds constituting Columbia Funds Series Trust I, referred to hereafter as the "Fund") as of March 31, 2018, the related statement of operations for the year ended March 31, 2018, the statement of changes in net assets for each of the two years in the period ended March 31, 2018, including the related notes, and the financial highlights for each of the five years in the period ended March 31, 2018 (collectively referred to as the “financial statements”). In our opinion, the financial statements present fairly, in all material respects, the financial position of the Fund as of March 31, 2018, the results of its operations for the year then ended, the changes in its net assets for each of the two years in the period ended March 31, 2018 and the financial highlights for each of five years in the period ended March 31, 2018 in conformity with accounting principles generally accepted in the United States of America.
Basis for Opinion
These financial statements are the responsibility of the Fund’s management. Our responsibility is to express an opinion on the Fund’s financial statements based on our audits. We are a public accounting firm registered with the Public Company Accounting Oversight Board (United States) (“PCAOB”) and are required to be independent with respect to the Fund in accordance with the U.S. federal securities laws and the applicable rules and regulations of the Securities and Exchange Commission and the PCAOB.
We conducted our audits of these financial statements in accordance with the standards of the PCAOB. Those standards require that we plan and perform the audit to obtain reasonable assurance about whether the financial statements are free of material misstatement, whether due to error or fraud.
Our audits included performing procedures to assess the risks of material misstatement of the financial statements, whether due to error or fraud, and performing procedures that respond to those risks. Such procedures included examining, on a test basis, evidence regarding the amounts and disclosures in the financial statements. Our audits also included evaluating the accounting principles used and significant estimates made by management, as well as evaluating the overall presentation of the financial statements. Our procedures included confirmation of securities owned as of March 31, 2018 by correspondence with the custodian and transfer agent. We believe that our audits provide a reasonable basis for our opinion.
/s/PricewaterhouseCoopers LLP
Minneapolis, Minnesota
May 22, 2018
We have served as auditors of one or more investment companies within the Columbia Funds Complex since 1977.
| 28 | Columbia Select Large Cap Growth Fund | Annual Report 2018 |
Federal Income Tax Information
(Unaudited)
The Fund hereby designates the following tax attributes for the fiscal year ended March 31, 2018. Shareholders will be notified in early 2019 of the amounts for use in preparing 2018 income tax returns.
Qualified
dividend
income | Dividends
received
deduction | Capital
gain
dividend |
| 60.55% | 59.03% | $460,337,219 |
Qualified dividend income. For taxable, non-corporate shareholders, the percentage of ordinary income distributed during the fiscal year that represents qualified dividend income subject to reduced tax rates.
Dividends received deduction. The percentage of ordinary income distributed during the fiscal year that qualifies for the corporate dividends received deduction.
Capital gain dividend. The Fund designates as a capital gain dividend the amount reflected above, or if subsequently determined to be different, the net capital gain of such fiscal period.
Columbia Select Large Cap Growth Fund | Annual Report 2018
| 29 |
Shareholders elect the Board that oversees the Fund’s operations. The Board appoints officers who are responsible for day-to-day business decisions based on policies set by the Board. The following table provides basic biographical information about the Fund’s Trustees, including their principal occupations during the past five years, although specific titles for individuals may have varied over the period. The year set forth beneath Length of Service in the table below is the year in which the Trustee was first appointed or elected as Trustee to any Fund currently in the Columbia Funds Complex or a predecessor thereof. Under current Board policy, members serve terms of indefinite duration.
Independent trustees
| Name, address, year of birth | Position held with the Trust and length of service | Principal occupation(s) during the past five years and other relevant professional experience | Number of Funds in the Columbia Fund Complex overseen | Other directorships held by Trustee during the past five years |
Janet Langford Carrig
c/o Columbia Management
Investment Advisers, LLC
225 Franklin Street
Mail Drop BX32 05228
Boston, MA 02110
1957 | Trustee
1996 | Senior Vice President, General Counsel and Corporate Secretary, ConocoPhillips (independent energy company) since September 2007 | 71 | None |
Douglas A. Hacker
c/o Columbia Management
Investment Advisers, LLC
225 Franklin Street
Mail Drop BX32 05228
Boston, MA 02110
1955 | Trustee and Chairman of the Board
1996 | Independent business executive since May 2006; Executive Vice President — Strategy of United Airlines from December 2002 to May 2006; President of UAL Loyalty Services (airline marketing company) from September 2001 to December 2002; Executive Vice President and Chief Financial Officer of United Airlines from July 1999 to September 2001 | 71 | Spartan Nash Company, (food distributor); Nash Finch Company (food distributor) from 2005 to 2013; Aircastle Limited (aircraft leasing); SeaCube Container Leasing Ltd. (container leasing) from 2010 to 2013; and Travelport Worldwide Limited (travel information technology) |
Nancy T. Lukitsh
c/o Columbia Management
Investment Advisers, LLC
225 Franklin Street
Mail Drop BX32 05228
Boston, MA 02110
1956 | Trustee
2011 | Senior Vice President, Partner and Director of Marketing, Wellington Management Company, LLP (investment adviser) from 1997 to 2010; Chair, Wellington Management Portfolios (commingled non-U.S. investment pools) from 2007 to 2010; Director, Wellington Trust Company, NA and other Wellington affiliates from 1997 to 2010 | 71 | None |
David M. Moffett
c/o Columbia Management
Investment Advisers, LLC
225 Franklin Street
Mail Drop BX32 05228
Boston, MA 02110
1952 | Trustee
2011 | Retired. Consultant to Bridgewater and Associates | 71 | Director, CSX Corporation; Genworth Financial, Inc. (financial and insurance products and services); PayPal Holdings Inc. (payment and data processing services); Trustee, University of Oklahoma Foundation; former Director, eBay Inc. (online trading community), 2007-2015; and former Director, CIT Bank, CIT Group Inc. (commercial and consumer finance), 2010-2016 |
John J. Neuhauser
c/o Columbia Management
Investment Advisers, LLC
225 Franklin Street
Mail Drop BX32 05228
Boston, MA 02110
1943 | Trustee
1984 | President, Saint Michael’s College since August 2007; Director or Trustee of several non-profit organizations, including University of Vermont Medical Center; Academic Vice President and Dean of Faculties, Boston College from August 1999 to October 2005; University Professor, Boston College from November 2005 to August 2007 | 71 | Liberty All-Star Equity Fund and Liberty All- Star Growth Fund (closed-end funds) |
| 30 | Columbia Select Large Cap Growth Fund | Annual Report 2018 |
TRUSTEES AND OFFICERS (continued)
Independent trustees (continued)
| Name, address, year of birth | Position held with the Trust and length of service | Principal occupation(s) during the past five years and other relevant professional experience | Number of Funds in the Columbia Fund Complex overseen | Other directorships held by Trustee during the past five years |
Patrick J. Simpson
c/o Columbia Management
Investment Advisers, LLC
225 Franklin Street
Mail Drop BX32 05228
Boston, MA 02110
1944 | Trustee
2000 | Of Counsel, Perkins Coie LLP (law firm) since 2015; Partner, Perkins Coie LLP from 1988 to 2014 | 71 | None |
Anne-Lee Verville
c/o Columbia Management
Investment Advisers, LLC
225 Franklin Street
Mail Drop BX32 05228
Boston, MA 02110
1945 | Trustee
1998 | Retired. General Manager, Global Education Industry from 1994 to 1997, President – Application Systems Division from 1991 to 1994, Chief Financial Officer – US Marketing & Services from 1988 to 1991, and Chief Information Officer from 1987 to 1988, IBM Corporation (computer and technology) | 71 | Enesco Group, Inc. (producer of giftware and home and garden decor products) from 2001 to 2006 |
Consultants to the Independent Trustees*
| Name, address, year of birth | Position held with the Trust and length of service | Principal occupation(s) during the past five years and other relevant professional experience | Number of Funds in the Columbia Funds complex overseen | Other directorships held by Trustee during the past five years |
J. Kevin Connaughton
c/o Columbia
Management Investment
Advisers, LLC,
225 Franklin Street
Mail Drop BX32 05228,
Boston, MA 02110
1964 | Independent Trustee Consultant
2016 | Independent Trustee Consultant, Columbia Funds since March 2016; Adjunct Professor of Finance, Bentley University since November 2017; Managing Director and General Manager of Mutual Fund Products, Columbia Management Investment Advisers, LLC from May 2010 to February 2015; President, Columbia Funds from 2009 to 2015; and senior officer of Columbia Funds and affiliated funds from 2003 to 2015 | 71 | Director, The Autism Project since March 2015; former Trustee, New Century Portfolios, March 2015-December 2017; formerly on Board of Governors, Gateway Healthcare, January 2016 – December 2017 |
Natalie A. Trunow
c/o Columbia
Management Investment
Advisers, LLC,
225 Franklin Street
Mail Drop BX32 05228,
Boston, MA 02110
1967 | Independent Trustee Consultant
2016 | Independent Trustee Consultant, Columbia Funds since September 2016; Chief Executive Officer, Millennial Portfolio Solutions LLC (asset management and consulting services) since January 2016; Director of Investments, Casey Family Programs from April 2016 to September 2016; Senior Vice President and Chief Investment Officer, Calvert Investments from August 2008 to January 2016; Section Head and Portfolio Manager, General Motors Asset Management from June 1997 to August 2008 | 71 | Director, Health Services for Children with Special Needs, Inc.; Director, Guidewell Financial Solutions |
| * | J. Kevin Connaughton was appointed consultant to the Independent Trustees effective March 1, 2016. Natalie A. Trunow was appointed consultant to the Independent Trustees effective September 1, 2016. Shareholders of the Funds are expected to be asked to elect each of Mr. Connaughton and Ms. Trunow as a Trustee at a future shareholder meeting. |
Columbia Select Large Cap Growth Fund | Annual Report 2018
| 31 |
TRUSTEES AND OFFICERS (continued)
Interested trustee affiliated with Investment Manager*
| Name, address, year of birth | Position held with the Trust and length of service | Principal occupation(s) during the past five years and other relevant professional experience | Number of Funds in the Columbia Funds Complex overseen | Other directorships held by Trustee during the past five years |
William F. Truscott
c/o Columbia Management
Investment Advisers, LLC
225 Franklin Street
Boston, MA 02110
1960 | Trustee
2012 | Chairman of the Board and President, Columbia Management Investment Advisers, LLC since May 2010 and February 2012, respectively; Chief Executive Officer, Global Asset Management, Ameriprise Financial, Inc. since September 2012 (previously Chief Executive Officer, U.S. Asset Management & President, Annuities, May 2010-September 2012); Director and Chief Executive Officer, Columbia Management Investment Distributors, Inc. since May 2010 and February 2012, respectively; Chairman of the Board and Chief Executive Officer, RiverSource Distributors, Inc. since 2006; Director, Threadneedle Asset Management Holdings, SARL since 2014; President and Chief Executive Officer, Ameriprise Certificate Company, 2006-August 2012 | 196 | Chairman of the Board, Columbia Management Investment Advisers, LLC since May 2010; Director, Columbia Management Investment Distributors, Inc. since May 2010; former Director, Ameriprise Certificate Company, 2006 - January 2013 |
| * | Interested person (as defined under the 1940 Act) by reason of being an officer, director, security holder and/or employee of the Investment Manager or Ameriprise Financial. |
The Statement of Additional Information has additional information about the Fund’s Board members and is available, without charge, upon request by calling 800.345.6611, visiting columbiathreadneedleus.com/investor/ or contacting your financial intermediary.
| 32 | Columbia Select Large Cap Growth Fund | Annual Report 2018 |
TRUSTEES AND OFFICERS (continued)
The Board has appointed officers who are responsible for day-to-day business decisions based on policies it has established. The officers serve at the pleasure of the Board. The following table provides basic information about the Officers of the Fund, including principal occupations during the past five years, although their specific titles may have varied over the period. In addition to Mr. Truscott, who is Senior Vice President, the Fund’s other officers are:
Fund officers
Name,
address and
year of birth | Position and year
first appointed to
position for any Fund
in the Columbia
Funds complex or a
predecessor thereof | Principal occupation(s) during past five years |
Christopher O. Petersen
5228 Ameriprise
Financial Center
Minneapolis, MN 55474
Born 1970 | President and Principal Executive Officer (2015) | Vice President and Lead Chief Counsel, Ameriprise Financial, Inc. since January 2015 (previously, Vice President and Chief Counsel, January 2010 - December 2014; officer of Columbia Funds and affiliated funds since 2007. |
Michael G. Clarke
225 Franklin Street
Boston, MA 02110
Born 1969 | Treasurer (2011), Chief Financial Officer (2009) and Chief Accounting Officer (2015) | Vice President — Mutual Fund Administration, Columbia Management Investment Advisers, LLC, since May 2010; senior officer of Columbia Funds and affiliated funds since 2002. |
Paul B. Goucher
100 Park Avenue
New York, NY 10017
Born 1968 | Senior Vice President (2011) and Assistant Secretary (2008) | Senior Vice President and Assistant General Counsel, Ameriprise Financial, Inc. since January 2017 (previously Vice President and Lead Chief Counsel, November 2008 - January 2017 and January 2013 - January 2017, respectively; and Chief Counsel, January 2010 - January 2013); Vice President, Chief Legal Officer and Assistant Secretary, Columbia Management Investment Advisers, LLC since May 2010. |
Thomas P. McGuire
225 Franklin Street
Boston, MA 02110
Born 1972 | Senior Vice President and Chief Compliance Officer (2012) | Vice President — Asset Management Compliance, Ameriprise Financial, Inc., since May 2010; Chief Compliance Officer, Ameriprise Certificate Company since September 2010. |
Colin Moore
225 Franklin Street
Boston, MA 02110
Born 1958 | Senior Vice President (2010) | Executive Vice President and Global Chief Investment Officer, Ameriprise Financial, Inc., since July 2013; Executive Vice President and Global Chief Investment Officer, Columbia Management Investment Advisers, LLC since July 2013 (previously Director and Global Chief Investment Officer, 2010 - 2013). |
Ryan C. Larrenaga
225 Franklin Street
Boston, MA 02110
Born 1970 | Senior Vice President (2017), Chief Legal Officer (2017) and Secretary (2015) | Vice President and Group Counsel, Ameriprise Financial, Inc. since August 2011; officer of Columbia Funds and affiliated funds since 2005. |
Michael E. DeFao
225 Franklin Street
Boston, MA 02110
Born 1968 | Vice President (2011) and Assistant Secretary (2010) | Vice President and Chief Counsel, Ameriprise Financial, Inc. since May 2010. |
Amy Johnson
5228 Ameriprise
Financial Center
Minneapolis, MN 55474
Born 1965 | Vice President (2006) | Managing Director and Global Head of Operations, Columbia Management Investment Advisers, LLC since April 2016 (previously Managing Director and Chief Operating Officer, 2010 - 2016). |
Lyn Kephart-Strong
5228 Ameriprise
Financial Center
Minneapolis, MN 55474
Born 1960 | Vice President (2015) | President, Columbia Management Investment Services Corp. since October 2014; Vice President & Resolution Officer, Ameriprise Trust Company since August 2009. |
Columbia Select Large Cap Growth Fund | Annual Report 2018
| 33 |
The Fund mails one shareholder report to each shareholder address. If you would like more than one report, please call shareholder services at 800.345.6611 and additional reports will be sent to you.
Proxy voting policies and procedures
The policy of the Board of Trustees is to vote the proxies of the companies in which the Fund holds investments consistent with the procedures as stated in the Statement of Additional Information (SAI). You may obtain a copy of the SAI without charge by calling 800.345.6611; contacting your financial intermediary; visiting columbiathreadneedleus.com/investor/; or searching the website of the Securities and Exchange Commission (SEC) at sec.gov. Information regarding how the Fund voted proxies relating to portfolio securities is filed with the SEC by August 31st for the most recent 12-month period ending June 30th of that year, and is available without charge by visiting columbiathreadneedleus.com/investor/, or searching the website of the SEC at sec.gov.
Quarterly schedule of investments
The Fund files a complete schedule of portfolio holdings with the SEC for the first and third quarters of each fiscal year on Form N-Q. The Fund’s Form N-Q is available on the SEC’s website at sec.gov and may be reviewed and copied at the SEC’s Public Reference Room in Washington, D.C. Information on the operation of the Public Reference Room may be obtained by calling 800.SEC.0330. The Fund’s complete schedule of portfolio holdings, as filed on Form N-Q, can also be obtained without charge, upon request, by calling 800.345.6611.
Additional Fund information
For more information about the Fund, please visit columbiathreadneedleus.com/investor/ or call 800.345.6611. Customer Service Representatives are available to answer your questions Monday through Friday from 8 a.m. to 7 p.m. Eastern time.
Fund investment manager
Columbia Management Investment Advisers, LLC
225 Franklin Street
Boston, MA 02110
Fund distributor
Columbia Management Investment Distributors, Inc.
225 Franklin Street
Boston, MA 02110
Fund transfer agent
Columbia Management Investment Services Corp.
P.O. Box 8081
Boston, MA 02266-8081
| 34 | Columbia Select Large Cap Growth Fund | Annual Report 2018 |
[THIS PAGE INTENTIONALLY LEFT BLANK]
[THIS PAGE INTENTIONALLY LEFT BLANK]
[THIS PAGE INTENTIONALLY LEFT BLANK]
Columbia Select Large Cap Growth Fund
P.O. Box 8081
Boston, MA 02266-8081
Please read and consider the investment objectives, risks, charges and expenses for any fund carefully before investing. For a prospectus and summary prospectus, which contains this and other important information about the Fund, go to
columbiathreadneedleus.com/investor/. The Fund is distributed by Columbia Management Investment Distributors, Inc., member FINRA, and managed by Columbia Management Investment Advisers, LLC.
Columbia Threadneedle Investments (Columbia Threadneedle) is the global brand name of the Columbia and Threadneedle group of companies. All rights reserved. Columbia Management Investment Distributors, Inc., 225 Franklin Street, Boston, MA 02110-2804
© 2018 Columbia Management Investment Advisers, LLC.
columbiathreadneedleus .com/investor/

Annual Report
March 31, 2018
Multi-Manager Growth Strategies Fund
Not FDIC Insured • No bank guarantee • May lose value
Dear Shareholders,
The year 2017 was an extraordinary year in the financial markets. The S&P 500 Index didn’t experience a single down month and returned over 20%. Continuing this trend, January 2018 marked the fastest start for the index ever. Low volatility, which had been a feature of the U.S. equity market for several years, along with the surge in the S&P 500 Index, drove investor sentiment to very high levels. This arguably set the stage for an overdue correction, which we witnessed in February 2018.
A return to volatility
There have been few periods of market upheaval such as were experienced in the first part of 2018. While investors were taken by surprise by the sudden and pronounced market swings, the return to some level of volatility actually marked a resumption of relatively normal market conditions. Having said that, it’s important to distinguish between a good technical correction where excess enthusiasm in the marketplace is being let out, versus a real change in the underlying fundamentals – things like an underperforming economy or weaker corporate earnings. Our view is that the recent market volatility falls into the former category, and the fundamentals remain strong. We’re continuing to see improvements in global economic activity, and we’re seeing corporate earnings expectations continue to rise – and not just because of tax reform.
Consistency is more important than ever
It’s important to keep in mind that when it comes to long-term investing, it’s the destination, not the journey that matters most. If you have a financial goal that you’ve worked out with your financial advisor, and you have a good asset allocation plan to reach it, it’s a question of sticking with your plan rather than become focused on near-term volatility. Bouts of volatility are normal. After all, it’s hard to cross the ocean without hitting an occasional rough patch. You need to focus on the destination.
One final thought. In weathering volatility, it’s the consistency of the return that is essential. Investors who chase higher returns are usually the first to sell when an investment goes through a bad patch, and they therefore don’t tend to benefit from the recovery. More disciplined investors who perhaps panic less or not at all during periods of volatility, tend to have improved long-term results and are more likely to reach their financial goals. Nothing is more important to us than making sure those who have entrusted us to protect and grow their assets are able to do what matters most to them.
Your success is our priority. Talk to your financial advisor about how working with Columbia Threadneedle Investments may help you position your portfolio for consistent, sustainable outcomes, no matter the market conditions.
Sincerely,
Christopher O. Petersen
President, Columbia Funds
The S&P 500 Index, an unmanaged index, measures the performance of 500 widely held, large-capitalization U.S. stocks and is frequently used as a general measure of market performance. Past performance is no guarantee of future results.
Columbia Funds are distributed by Columbia Management Investment Distributors, Inc., member FINRA, and managed by Columbia Management Investment Advisers, LLC.
© 2018 Columbia Management Investment Advisers, LLC. All rights reserved.
Multi-Manager Growth Strategies Fund | Annual Report 2018
Multi-Manager Growth Strategies Fund | Annual Report 2018
Investment objective
Multi-Manager Growth Strategies Fund (the Fund) seeks long-term capital appreciation.
Portfolio management
Columbia Management Investment Advisers, LLC
Thomas Galvin, CFA
Richard Carter
Todd Herget
Loomis, Sayles & Company, L.P.
Aziz Hamzaogullari, CFA
Los Angeles Capital Management and Equity Research, Inc.
Thomas Stevens, CFA
Hal Reynolds, CFA
Daniel Allen, CFA
Daniel Arche, CFA
Morningstar style boxTM
The Morningstar Style Box is based on a fund’s portfolio holdings. For equity funds, the vertical axis shows the market capitalization of the stocks owned, and the horizontal axis shows investment style (value, blend, or growth). Information shown is based on the most recent data provided by Morningstar.
© 2018 Morningstar, Inc. All rights reserved. The Morningstar information contained herein: (1) is proprietary to Morningstar and/or its content providers; (2) may not be copied or distributed; and (3) is not warranted to be accurate, complete or timely. Neither Morningstar nor its content providers are responsible for any damages or losses arising from any use of this information.
| Average annual total returns (%) (for the period ended March 31, 2018) |
| | | Inception | 1 Year | 5 Years | Life |
| Class A | 04/20/12 | 20.83 | 14.30 | 13.52 |
| Institutional Class* | 01/03/17 | 21.09 | 14.40 | 13.59 |
| Russell 1000 Growth Index | | 21.25 | 15.53 | 15.07 |
All results shown assume reinvestment of distributions during the period. Returns do not reflect the deduction of taxes that a shareholder may pay on Fund distributions or on the redemption of Fund shares. Performance results reflect the effect of any fee waivers or reimbursements of Fund expenses by Columbia Management Investment Advisers, LLC and/or any of its affiliates. Absent these fee waivers or expense reimbursement arrangements, performance results would have been lower.
The performance information shown represents past performance and is not a guarantee of future results. The investment return and principal value of your investment will fluctuate so that your shares, when redeemed, may be worth more or less than their original cost. Current performance may be lower or higher than the performance information shown. You may obtain performance information current to the most recent month-end by contacting your financial intermediary, visiting columbiathreadneedleus.com/investor/ or calling 800.345.6611.
Effective November 1, 2017, Class Z shares were renamed Institutional Class shares.
| * | The returns shown for periods prior to the share class inception date (including returns for the Life of the Fund, if shown, which are since Fund inception) include the returns of the Fund’s oldest share class. These returns are adjusted to reflect any higher class-related operating expenses of the newer share class, as applicable. Please visit columbiathreadneedleus.com/investor/investment-products/mutual-funds/appended-performance for more information. |
The Russell 1000 Growth Index, an unmanaged index, measures the performance of those Russell 1000 Index companies with higher price-to-book ratios and higher forecasted growth values.
Indices are not available for investment, are not professionally managed and do not reflect sales charges, fees, brokerage commissions, taxes or other expenses of investing. Securities in the Fund may not match those in an index.
| 2 | Multi-Manager Growth Strategies Fund | Annual Report 2018 |
Fund at a Glance (continued)
Performance of a hypothetical $10,000 investment (April 20, 2012 — March 31, 2018)
The chart above shows the change in value of a hypothetical $10,000 investment in Class A shares of Multi-Manager Growth Strategies Fund during the stated time period, and does not reflect the deduction of taxes that a shareholder may pay on Fund distributions or on the redemption of Fund shares.
| Top 10 holdings (%) (at March 31, 2018) |
| Amazon.com, Inc. | 5.6 |
| Facebook, Inc., Class A | 4.7 |
| Visa, Inc., Class A | 4.0 |
| Alibaba Group Holding Ltd., ADR | 3.9 |
| Monster Beverage Corp. | 2.8 |
| Microsoft Corp. | 2.6 |
| Booking Holdings, Inc. | 2.0 |
| Alphabet, Inc., Class A | 1.9 |
| Alphabet, Inc., Class C | 1.8 |
| Oracle Corp. | 1.8 |
Percentages indicated are based upon total investments (excluding Money Market Funds).
For further detail about these holdings, please refer to the section entitled “Portfolio of Investments.”
Fund holdings are as of the date given, are subject to change at any time, and are not recommendations to buy or sell any security.
| Portfolio breakdown (%) (at March 31, 2018) |
| Common Stocks | 98.6 |
| Money Market Funds | 1.4 |
| Total | 100.0 |
Percentages indicated are based upon total investments. The Fund’s portfolio composition is subject to change.
| Equity sector breakdown (%) (at March 31, 2018) |
| Consumer Discretionary | 15.7 |
| Consumer Staples | 7.6 |
| Energy | 2.1 |
| Financials | 6.0 |
| Health Care | 17.4 |
| Industrials | 6.7 |
| Information Technology | 43.8 |
| Materials | 0.6 |
| Real Estate | 0.1 |
| Telecommunication Services | 0.0 (a) |
| Utilities | 0.0 (a) |
| Total | 100.0 |
Percentages indicated are based upon total equity investments. The Fund’s portfolio composition is subject to change.
Multi-Manager Growth Strategies Fund | Annual Report 2018
| 3 |
Manager Discussion of Fund Performance
Columbia Management Investment Advisers, LLC (CMIA) serves as the investment manager for the Fund and attempts to achieve the Fund’s objective by managing a portion of the Fund’s assets and selecting one or more subadvisers to manage other sleeves independently of each other and CMIA. A portion of the Fund’s assets is subadvised by Loomis, Sayles & Company, L.P. (Loomis Sayles) and Los Angeles Capital Management and Equity Research, Inc. (Los Angeles Capital). As of March 31, 2018, CMIA, Loomis Sayles and Los Angeles Capital managed approximately 38.4%, 38.4% and 23.2% of the portfolio, respectively.
For the 12-month period ended March 31, 2018, the Fund’s Class A shares returned 20.83% excluding sales charges. The Fund performed in line with its benchmark, the Russell 1000 Growth Index, which returned 21.25% for the same time period. In the Columbia segment, an emphasis on high-quality, high-growth information technology companies aided relative returns and more than offset disappointments in health care, which detracted from relative results. In the Loomis Sayles segment, stock selection in the consumer discretionary, consumer staples and financials sectors aided relative results. In the Los Angeles Capital segment, an emphasis on growth companies with a high degree of foreign revenue hampered results within the segment in the second half of the period. Stock selection in the technology, financials and real estate sectors also weighed on relative returns.
Confident investors drove equity markets higher
Despite political tumult and rising tensions with North Korea and Iran, investors focused on prospects for stronger economic growth and lower taxes, driving U.S. financial markets higher over the 12-month period ended March 31, 2018. U.S. economic growth picked up, as gross domestic product (GDP) expanded at an annualized rate of approximately 3.0% for three consecutive quarters (3% is the long-term historical average growth rate of GDP). Even though jobs were lost as a result of hurricane disruptions during the third quarter of 2017, unemployment fell to 4.1%, as the U.S. labor market added an average of more than 188,000 new jobs per month during the period. Wage growth failed to keep pace with job growth, but there was hope that lower tax rates would move companies to raise wages more robustly. Global growth and a weaker U.S. dollar boosted exports. Robust manufacturing activity, higher consumer spending and expectations that less stringent regulation in certain industries would further boost growth also supported investor confidence. However, late in the period, U.S. equity markets pulled back sharply, producing the first real correction in over a year. Enthusiasm turned to anxiety as the market contended with heightened rhetoric regarding trade policy and a major security breach from Facebook, which pressured technology companies.
In March 2018, the Federal Reserve raised the target range on its key short-term interest rate, the federal funds rate, to 1.50% - 1.75%, citing solid job and economic growth and progress toward its 2.0% inflation target. The 10-year Treasury closed the period at 2.73%. The S&P 500 Index, a broad-based measure of U.S. equity returns, gained 13.99% for the 12-month period ended March 31, 2018. The Bloomberg Barclays U.S. Aggregate Bond Index, which tracks returns of U.S. investment-grade government and corporate bonds, gained 1.20%.
Contributors and detractors
CMIA: Positioning in the information technology sector accounted for most of the segment’s performance advantage over the benchmark. Consumer discretionary holdings delivered mixed results. Health care, primarily in biotechnology and equipment, and an underweight in industrials detracted from relative results.
In the information technology sector, results across most industries were positive. Emerging market e-commerce firms, software and semiconductor firms were especially strong. Emerging market e-commerce leaders Alibaba and MercadoLibre were top contributors to Fund returns, as both posted returns that led the way in the internet software and services industry. Alibaba continued to impress investors, as the firm meaningfully increased its revenue guidance based on expected strength from customer engagement and marketing through its e-commerce channels. Alibaba continued to benefit from accelerated growth from its AliCloud (cloud computing services), which more than doubled over the year. MercadoLibre continued to execute well with accelerated revenue growth, particularly in Brazil and Mexico.
Within software, Adobe, Service Now and Splunk were top contributors, each gaining more than 50% for the year. Adobe shares moved higher as the firm continued to benefit from the trend to online advertising sales. Strong adoption of Adobe’s creative and experience cloud services also drove results for the company. ServiceNow executed well on the strength of its
| 4 | Multi-Manager Growth Strategies Fund | Annual Report 2018 |
Manager Discussion of Fund Performance (continued)
primary information technology service management (ITSM) business line. It increased new product growth as well. Toward the end of the period, Splunk, which specializes in big data applications and security, announced a strong quarter, driven by its security and cloud business lines. The company’s revenue growth accelerated and it raised forward earnings guidance.
In the semiconductor industry, a position in NVIDIA was a notable contributor on strong gains. NVIDIA routinely beat revenues and earnings estimates on strength from the firm’s data center business. In the fourth quarter of 2017, we added a new position in semiconductor equipment company Applied Materials, which we believed was positioned to benefit from several secular growth themes as a leading supplier of tools and equipment necessary to produce semiconductors, memory and displays.
In consumer staples, relative outperformance in the sector was driven by positions in energy drink distributor Monster Beverage and retailer Costco, both of which rallied in the double digits. Monster Beverage continued to execute well in its international expansion efforts. Costco pulled back modestly as consumer staples companies sold off following Amazon’s June 2017 announcement that it would acquire organic grocer Whole Foods. Costco shares rebounded later in the year, as enthusiasm for tax reform lifted sentiment across many retailers. The segment had no exposure to traditional grocers and food products companies, which also benefited results.
In health care, Vertex Pharmaceuticals and genetic sequencing device provider Illumina were bright spots for the year. Vertex, a leader in cystic fibrosis therapies, announced positive results from two of its phase three triple-combo regime trials. Illumina launched its new NovaSeq gene sequencing product line and executed well on its product launch, which beat orders and deliveries estimates. However, Intercept Pharmaceutical, Celgene and Alexion Pharmaceuticals, along with DexCom in the health care equipment and supplies industry, were notable detractors. DexCom sold off on competitive changes and we exited the position.
Loomis Sayles: Our segment of the Fund’s portfolio outperformed the benchmark, with significant contributions from Amazon and Alibaba (both repeats from last year), Visa, Autodesk and Alphabet (Google). Amazon possesses strong and potentially sustainable competitive advantages in both of its core markets — online retailing and Amazon Web Services. The company reported healthy fundamentals and strong revenue growth for the period. Under the thoughtful leadership of founder Jeff Bezos, Amazon continued rapid investment in key areas that capitalize on its strength, focusing on businesses with high, durable growth prospects and strong financial returns. Alibaba, a leading China e-commerce and consumer-oriented business service company, forms a powerful ecosystem that engages with customers across the entire consumer lifecycle. Alibaba reported revenue growth in excess of 50% for fiscal year 2017 and issued revenue growth guidance just short of that mark for fiscal year 2018. Alibaba continues to execute well on its business model. Visa is the largest payments technology company in the world, with one of the most recognized brands and a massive global network. Visa reported revenue and earnings growth above expectations. The company is also expanding into new payment markets, which are sizeable.
Schlumberger, Proctor and Gamble (P&G) and Merck were the period’s biggest detractors for our segment. Schlumberger is a global energy oil service company, with a powerful brand and respected reputation. The company came under pressure, despite rising oil prices, because of increased supply of North American shale. However, we believed that Schlumberger was well positioned to weather the current environment and had the potential to rebound when market supply/demand normalized. P&G, the world’s largest consumer products company, reported low single-digit growth for the period. Pricing came under pressure in its male grooming and diaper businesses. During the period, P&G management addressed its challenges by refocusing on 10 core brand segments. We believed this had the potential to spur organic sales growth and lift operating profits where the company enjoys the advantage of scale. Merck, a leading global biopharmaceutical company with well-established mature products and sufficient cash flow to fund future growth, took a hit as increased competition in its immuno-oncology business resulted in volatility within the industry. Yet we believed the company had the potential to generate cash flow in excess of market expectations, with a robust pipeline of new drugs and a solid lineup of existing products. At period’s end, Merck shares were selling at a discount to our estimate of their intrinsic value and we believed they represented a compelling risk/reward opportunity.
Los Angeles Capital: Overweights in Bioverativ, Graco and Intuit were our segment’s top contributors to relative performance for the period. Each company exhibited high earnings quality, strong price momentum and positive analyst sentiment as well as favorable defensive characteristics. Underweights in AbbVie, Boeing and Home Depot were the period’s main individual detractors. Our portion of the portfolio did not embrace these companies because they displayed characteristics to us which
Multi-Manager Growth Strategies Fund | Annual Report 2018
| 5 |
Manager Discussion of Fund Performance (continued)
investors were penalizing at the time. All three traded at relatively high valuations and had relatively low levels of foreign revenue compared to their peers. All generated positive returns, but they were underweighted in our segment, relative to the benchmark. During the period we established positions in Adobe Systems and Take-Two Technology. Both exhibited strong long-term price momentum, high earnings quality and positive analyst sentiment. We sold shares of Deere and Baxter International.
At period’s end
CMIA: We continued to balance the portfolio with established and emerging growth opportunities, focusing on unique business models that offer differentiated products and services that we believed could grow in a variety of different economic environments. We believed that companies offering innovative products have the potential to maintain pricing power and garner incremental market share, which makes them more attractive for the portfolio.
Loomis Sayles: We remained committed to our long-term investment approach, which is based on bottom-up, fundamental research and a long-term perspective. At the end of the period, the segment was overweight in the consumer staples, information technology, financials, health care and energy sectors. It had no exposure to the materials, real estate, telecommunication service and utilities sectors.
Los Angeles Capital: At period’s end, our segment was overweight in information technology and health care. The largest underweights were in consumer staples, real estate, consumer cyclicals and biotechnology within the health care sector.
Market risk may affect a single issuer, sector of the economy, industry or the market as a whole. The Fund is managed by multiple advisers independently of one another, which may result in contradicting trades (i.e., with no net benefit to the Fund), while increasing transaction costs. Foreign investments subject the Fund to risks, including political, economic, market, social and others within a particular country, as well as to currency instabilities and less stringent financial and accounting standards generally applicable to U.S. issuers. Risks are enhanced for emerging market issuers. Growth securities, at times, may not perform as well as value securities or the stock market in general and may be out of favor with investors. Investments in a limited number of companies subject the Fund to greater risk of loss. The Fund may invest significantly in issuers within a particular sector, which may be negatively affected by market, economic or other conditions, making the Fund more vulnerable to unfavorable developments in the sector. Quantitative Model Risk: Investments selected using quantitative methods may perform differently from the market as a whole. There can be no assurance that these methodologies will enable the Fund to achieve its objective. See the Fund’s prospectus for more information on these and other risks.
The views expressed in this report reflect the current views of the respective parties. These views are not guarantees of future performance and involve certain risks, uncertainties and assumptions that are difficult to predict, so actual outcomes and results may differ significantly from the views expressed. These views are subject to change at any time based upon economic, market or other conditions and the respective parties disclaim any responsibility to update such views. These views may not be relied on as investment advice and, because investment decisions for a Columbia fund are based on numerous factors, may not be relied on as an indication of trading intent on behalf of any particular Columbia fund. References to specific securities should not be construed as a recommendation or investment advice.
| 6 | Multi-Manager Growth Strategies Fund | Annual Report 2018 |
Understanding Your Fund’s Expenses
(Unaudited)
As an investor, you incur two types of costs. There are transaction costs, which may include redemption fees. There are also ongoing costs, which generally include management fees, distribution and/or service fees, and other fund expenses. The following information is intended to help you understand your ongoing costs (in dollars) of investing in the Fund and to help you compare these costs with the ongoing costs of investing in other mutual funds.
Analyzing your Fund’s expenses
To illustrate these ongoing costs, we have provided examples and calculated the expenses paid by investors in each share class of the Fund during the period. The actual and hypothetical information in the table is based on an initial investment of $1,000 at the beginning of the period indicated and held for the entire period. Expense information is calculated two ways and each method provides you with different information. The amount listed in the “Actual” column is calculated using the Fund’s actual operating expenses and total return for the period. You may use the Actual information, together with the amount invested, to estimate the expenses that you paid over the period. Simply divide your account value by $1,000 (for example, an $8,600 account value divided by $1,000 = 8.6), then multiply the results by the expenses paid during the period under the “Actual” column. The amount listed in the “Hypothetical” column assumes a 5% annual rate of return before expenses (which is not the Fund’s actual return) and then applies the Fund’s actual expense ratio for the period to the hypothetical return. You should not use the hypothetical account values and expenses to estimate either your actual account balance at the end of the period or the expenses you paid during the period. See “Compare with other funds” below for details on how to use the hypothetical data.
Compare with other funds
Since all mutual funds are required to include the same hypothetical calculations about expenses in shareholder reports, you can use this information to compare the ongoing cost of investing in the Fund with other funds. To do so, compare the hypothetical example with the 5% hypothetical examples that appear in the shareholder reports of other funds. As you compare hypothetical examples of other funds, it is important to note that hypothetical examples are meant to highlight the ongoing costs of investing in a fund only and do not reflect any transaction costs, such as redemption or exchange fees. Therefore, the hypothetical calculations are useful in comparing ongoing costs only, and will not help you determine the relative total costs of owning different funds. If transaction costs were included in these calculations, your costs would be higher.
| October 1, 2017 — March 31, 2018 |
| | Account value at the
beginning of the
period ($) | Account value at the
end of the
period ($) | Expenses paid during
the period ($) | Fund’s annualized
expense ratio (%) |
| | Actual | Hypothetical | Actual | Hypothetical | Actual | Hypothetical | Actual |
| Class A | 1,000.00 | 1,000.00 | 1,080.00 | 1,019.34 | 5.67 | 5.51 | 1.10 |
| Institutional Class | 1,000.00 | 1,000.00 | 1,080.80 | 1,020.63 | 4.33 | 4.21 | 0.84 |
Expenses paid during the period are equal to the annualized expense ratio for each class as indicated above, multiplied by the average account value over the period and then multiplied by the number of days in the Fund’s most recent fiscal half year and divided by 365.
Expenses do not include fees and expenses incurred indirectly by the Fund from its investment in underlying funds, including affiliated and non-affiliated pooled investment vehicles, such as mutual funds and exchange-traded funds.
The Fund is offered only through certain wrap fee programs sponsored and/or managed by Ameriprise Financial, Inc. or its affiliates. Participants in wrap fee programs pay other fees that are not included in the above table. Please refer to the wrap program documents for information about the fees charged.
Multi-Manager Growth Strategies Fund | Annual Report 2018
| 7 |
Portfolio of Investments
March 31, 2018
(Percentages represent value of investments compared to net assets)
Investments in securities
| Common Stocks 98.2% |
| Issuer | Shares | Value ($) |
| Consumer Discretionary 15.4% |
| Auto Components —% |
| BorgWarner, Inc. | 8,694 | 436,700 |
| Delphi Technologies PLC | 2,776 | 132,276 |
| Total | | 568,976 |
| Automobiles 0.1% |
| Thor Industries, Inc. | 10,905 | 1,255,929 |
| Distributors 0.1% |
| Pool Corp. | 11,483 | 1,679,044 |
| Diversified Consumer Services 1.0% |
| Graham Holdings Co., Class B | 556 | 334,851 |
| H&R Block, Inc. | 36,290 | 922,129 |
| New Oriental Education & Technology Group, Inc., ADR | 228,279 | 20,008,654 |
| Total | | 21,265,634 |
| Hotels, Restaurants & Leisure 2.0% |
| Chipotle Mexican Grill, Inc.(a) | 500 | 161,555 |
| Choice Hotels International, Inc. | 26,965 | 2,161,244 |
| Domino’s Pizza, Inc. | 2,225 | 519,671 |
| Hilton Worldwide Holdings, Inc. | 4,955 | 390,256 |
| Las Vegas Sands Corp. | 15,040 | 1,081,376 |
| McDonald’s Corp. | 41,931 | 6,557,170 |
| Starbucks Corp. | 67,856 | 3,928,184 |
| Wynn Resorts Ltd. | 367 | 66,926 |
| Yum China Holdings, Inc. | 314,260 | 13,041,790 |
| Yum! Brands, Inc. | 183,852 | 15,651,321 |
| Total | | 43,559,493 |
| Household Durables 0.2% |
| NVR, Inc.(a) | 1,315 | 3,682,000 |
| Tupperware Brands Corp. | 14,857 | 718,782 |
| Total | | 4,400,782 |
| Internet & Direct Marketing Retail 8.5% |
| Amazon.com, Inc.(a) | 82,151 | 118,900,428 |
| Booking Holdings, Inc.(a) | 19,902 | 41,403,922 |
| Ctrip.com International Ltd., ADR(a) | 368,473 | 17,178,211 |
| Expedia Group, Inc. | 4,715 | 520,583 |
| Common Stocks (continued) |
| Issuer | Shares | Value ($) |
| Liberty Interactive Corp., Class A(a) | 83,820 | 2,109,750 |
| Netflix, Inc.(a) | 12,818 | 3,785,796 |
| Wayfair, Inc., Class A(a) | 2,210 | 149,241 |
| Total | | 184,047,931 |
| Media 0.5% |
| AMC Networks, Inc., Class A(a) | 24,051 | 1,243,437 |
| Cable One, Inc. | 556 | 382,033 |
| Charter Communications, Inc., Class A(a) | 4,988 | 1,552,365 |
| Comcast Corp., Class A | 97,220 | 3,322,007 |
| Discovery, Inc., Class C(a) | 19,890 | 388,253 |
| DISH Network Corp., Class A(a) | 57,036 | 2,161,094 |
| Live Nation Entertainment, Inc.(a) | 27,090 | 1,141,573 |
| Madison Square Garden Co. (The), Class A(a) | 4,522 | 1,111,508 |
| Total | | 11,302,270 |
| Multiline Retail —% |
| Dollar General Corp. | 1,050 | 98,227 |
| Dollar Tree, Inc.(a) | 5,090 | 483,041 |
| Total | | 581,268 |
| Specialty Retail 1.7% |
| AutoZone, Inc.(a) | 100 | 64,869 |
| Burlington Stores, Inc.(a) | 1,820 | 242,333 |
| Gap, Inc. (The) | 2,050 | 63,960 |
| Home Depot, Inc. (The) | 43,329 | 7,722,961 |
| Lowe’s Companies, Inc. | 50,960 | 4,471,740 |
| Michaels Companies, Inc. (The)(a) | 65,985 | 1,300,564 |
| O’Reilly Automotive, Inc.(a) | 5,443 | 1,346,489 |
| Ross Stores, Inc. | 12,730 | 992,686 |
| Sally Beauty Holdings, Inc.(a) | 320 | 5,264 |
| Ulta Beauty, Inc.(a) | 97,696 | 19,956,362 |
| Total | | 36,167,228 |
| Textiles, Apparel & Luxury Goods 1.3% |
| Michael Kors Holdings Ltd.(a) | 14,085 | 874,397 |
| Nike, Inc., Class B | 409,900 | 27,233,756 |
| Skechers U.S.A., Inc., Class A(a) | 3,675 | 142,921 |
| Total | | 28,251,074 |
| Total Consumer Discretionary | 333,079,629 |
The accompanying Notes to Financial Statements are an integral part of this statement.
| 8 | Multi-Manager Growth Strategies Fund | Annual Report 2018 |
Portfolio of Investments (continued)
March 31, 2018
| Common Stocks (continued) |
| Issuer | Shares | Value ($) |
| Consumer Staples 7.4% |
| Beverages 3.9% |
| Coca-Cola Co. (The) | 546,461 | 23,732,801 |
| Constellation Brands, Inc., Class A | 2,089 | 476,125 |
| Monster Beverage Corp.(a) | 1,026,106 | 58,703,525 |
| PepsiCo, Inc. | 9,635 | 1,051,660 |
| Total | | 83,964,111 |
| Food & Staples Retailing 1.0% |
| Costco Wholesale Corp. | 107,556 | 20,266,777 |
| Sprouts Farmers Market, Inc.(a) | 53,525 | 1,256,232 |
| Total | | 21,523,009 |
| Food Products 1.3% |
| Danone SA, ADR | 1,579,531 | 25,714,765 |
| Lamb Weston Holdings, Inc. | 6,410 | 373,190 |
| Pilgrim’s Pride Corp.(a) | 110,221 | 2,712,539 |
| Total | | 28,800,494 |
| Household Products 1.1% |
| Clorox Co. (The) | 6,010 | 799,991 |
| Colgate-Palmolive Co. | 34,093 | 2,443,786 |
| Kimberly-Clark Corp. | 2,745 | 302,307 |
| Procter & Gamble Co. (The) | 264,237 | 20,948,709 |
| Total | | 24,494,793 |
| Personal Products 0.1% |
| Estee Lauder Companies, Inc. (The), Class A | 14,410 | 2,157,465 |
| Tobacco —% |
| Philip Morris International, Inc. | 1,074 | 106,755 |
| Total Consumer Staples | 161,046,627 |
| Energy 2.1% |
| Energy Equipment & Services 1.1% |
| Schlumberger Ltd. | 365,588 | 23,682,791 |
| Oil, Gas & Consumable Fuels 1.0% |
| Cabot Oil & Gas Corp. | 135,358 | 3,245,885 |
| Cheniere Energy, Inc.(a) | 1,380 | 73,761 |
| Cimarex Energy Co. | 3,922 | 366,707 |
| Continental Resources, Inc.(a) | 1,020 | 60,129 |
| EOG Resources, Inc. | 620 | 65,267 |
| EQT Corp. | 5,340 | 253,703 |
| Common Stocks (continued) |
| Issuer | Shares | Value ($) |
| Newfield Exploration Co.(a) | 25,583 | 624,737 |
| Pioneer Natural Resources Co. | 97,855 | 16,809,532 |
| Total | | 21,499,721 |
| Total Energy | 45,182,512 |
| Financials 5.9% |
| Banks 1.2% |
| First Hawaiian, Inc. | 2,650 | 73,749 |
| First Republic Bank | 252,485 | 23,382,636 |
| Signature Bank(a) | 1,101 | 156,287 |
| Western Alliance Bancorp(a) | 43,845 | 2,547,833 |
| Total | | 26,160,505 |
| Capital Markets 4.1% |
| Artisan Partners Asset Management, Inc., Class A | 21,207 | 706,193 |
| Cboe Global Markets, Inc. | 20,860 | 2,380,126 |
| Charles Schwab Corp. (The) | 500,385 | 26,130,105 |
| Factset Research Systems, Inc. | 71,505 | 14,259,527 |
| Intercontinental Exchange, Inc. | 3,490 | 253,095 |
| Invesco Ltd. | 320 | 10,243 |
| Moody’s Corp. | 437 | 70,488 |
| MSCI, Inc. | 86,724 | 12,962,636 |
| S&P Global, Inc. | 10,588 | 2,022,943 |
| SEI Investments Co. | 372,723 | 27,920,680 |
| State Street Corp. | 790 | 78,787 |
| T. Rowe Price Group, Inc. | 7,910 | 854,043 |
| Total | | 87,648,866 |
| Consumer Finance 0.5% |
| American Express Co. | 96,898 | 9,038,646 |
| Capital One Financial Corp. | 25,738 | 2,466,215 |
| Total | | 11,504,861 |
| Insurance 0.1% |
| Assurant, Inc. | 610 | 55,760 |
| Hanover Insurance Group, Inc. (The) | 6,113 | 720,662 |
| Progressive Corp. (The) | 24,707 | 1,505,397 |
| Xl Group Ltd. | 10,360 | 572,494 |
| Total | | 2,854,313 |
| Total Financials | 128,168,545 |
The accompanying Notes to Financial Statements are an integral part of this statement.
Multi-Manager Growth Strategies Fund | Annual Report 2018
| 9 |
Portfolio of Investments (continued)
March 31, 2018
| Common Stocks (continued) |
| Issuer | Shares | Value ($) |
| Health Care 17.1% |
| Biotechnology 5.8% |
| AbbVie, Inc. | 51,590 | 4,882,993 |
| Alexion Pharmaceuticals, Inc.(a) | 205,996 | 22,960,314 |
| Alnylam Pharmaceuticals, Inc.(a) | 6,340 | 755,094 |
| Amgen, Inc. | 82,367 | 14,041,926 |
| Biogen, Inc.(a) | 9,147 | 2,504,632 |
| Celgene Corp.(a) | 270,056 | 24,091,696 |
| Exelixis, Inc.(a) | 37,400 | 828,410 |
| Incyte Corp.(a) | 1,435 | 119,579 |
| Ionis Pharmaceuticals, Inc.(a) | 12,685 | 559,155 |
| Regeneron Pharmaceuticals, Inc.(a) | 76,937 | 26,494,025 |
| Vertex Pharmaceuticals, Inc.(a) | 174,124 | 28,378,729 |
| Total | | 125,616,553 |
| Health Care Equipment & Supplies 3.3% |
| Align Technology, Inc.(a) | 9,307 | 2,337,267 |
| Boston Scientific Corp.(a) | 85,715 | 2,341,734 |
| Cooper Companies, Inc. (The) | 14,970 | 3,425,286 |
| Edwards Lifesciences Corp.(a) | 160,348 | 22,371,753 |
| IDEXX Laboratories, Inc.(a) | 111,046 | 21,253,094 |
| Intuitive Surgical, Inc.(a) | 3,532 | 1,458,115 |
| ResMed, Inc. | 470 | 46,281 |
| Varian Medical Systems, Inc.(a) | 148,318 | 18,191,203 |
| West Pharmaceutical Services, Inc. | 7,500 | 662,175 |
| Total | | 72,086,908 |
| Health Care Providers & Services 1.9% |
| AmerisourceBergen Corp. | 40,132 | 3,459,780 |
| Centene Corp.(a) | 20,037 | 2,141,354 |
| CIGNA Corp. | 760 | 127,482 |
| Express Scripts Holding Co.(a) | 61,870 | 4,273,980 |
| HCA Healthcare, Inc. | 11,781 | 1,142,757 |
| Humana, Inc. | 900 | 241,947 |
| Premier, Inc.(a) | 55,616 | 1,741,337 |
| UnitedHealth Group, Inc. | 127,561 | 27,298,054 |
| WellCare Health Plans, Inc.(a) | 1,790 | 346,598 |
| Total | | 40,773,289 |
| Common Stocks (continued) |
| Issuer | Shares | Value ($) |
| Health Care Technology 0.9% |
| Cerner Corp.(a) | 318,040 | 18,446,320 |
| Veeva Systems Inc., Class A(a) | 24,437 | 1,784,390 |
| Total | | 20,230,710 |
| Life Sciences Tools & Services 1.6% |
| Bruker Corp. | 19,390 | 580,149 |
| Illumina, Inc.(a) | 120,439 | 28,474,188 |
| Mettler-Toledo International, Inc.(a) | 2,913 | 1,675,063 |
| Thermo Fisher Scientific, Inc. | 8,772 | 1,811,067 |
| Waters Corp.(a) | 7,679 | 1,525,433 |
| Total | | 34,065,900 |
| Pharmaceuticals 3.6% |
| Bristol-Myers Squibb Co. | 392,628 | 24,833,721 |
| Eli Lilly & Co. | 9,481 | 733,545 |
| Merck & Co., Inc. | 141,130 | 7,687,351 |
| Novartis AG, ADR | 175,047 | 14,152,550 |
| Novo Nordisk A/S, ADR | 512,342 | 25,232,843 |
| Zoetis, Inc. | 53,890 | 4,500,354 |
| Total | | 77,140,364 |
| Total Health Care | 369,913,724 |
| Industrials 6.6% |
| Aerospace & Defense 1.2% |
| Boeing Co. (The) | 19,050 | 6,246,114 |
| BWX Technologies, Inc. | 2,545 | 161,684 |
| General Dynamics Corp. | 2,914 | 643,702 |
| Hexcel Corp. | 8,720 | 563,225 |
| Northrop Grumman Corp. | 52,081 | 18,182,519 |
| TransDigm Group, Inc. | 100 | 30,694 |
| Total | | 25,827,938 |
| Air Freight & Logistics 1.6% |
| CH Robinson Worldwide, Inc. | 2,440 | 228,652 |
| Expeditors International of Washington, Inc. | 367,857 | 23,285,348 |
| United Parcel Service, Inc., Class B | 115,724 | 12,111,674 |
| Total | | 35,625,674 |
The accompanying Notes to Financial Statements are an integral part of this statement.
| 10 | Multi-Manager Growth Strategies Fund | Annual Report 2018 |
Portfolio of Investments (continued)
March 31, 2018
| Common Stocks (continued) |
| Issuer | Shares | Value ($) |
| Airlines 0.3% |
| American Airlines Group, Inc. | 6,525 | 339,039 |
| Copa Holdings SA, Class A | 17,989 | 2,313,925 |
| Southwest Airlines Co. | 56,205 | 3,219,422 |
| Total | | 5,872,386 |
| Building Products 0.1% |
| Allegion PLC | 12,245 | 1,044,376 |
| AO Smith Corp. | 7,950 | 505,541 |
| Total | | 1,549,917 |
| Commercial Services & Supplies 0.4% |
| Copart, Inc.(a) | 105,794 | 5,388,088 |
| Rollins, Inc. | 23,620 | 1,205,329 |
| Waste Management, Inc. | 30,440 | 2,560,613 |
| Total | | 9,154,030 |
| Construction & Engineering —% |
| Quanta Services, Inc.(a) | 1,545 | 53,071 |
| Electrical Equipment 0.2% |
| AMETEK, Inc. | 25,970 | 1,972,941 |
| Rockwell Automation, Inc. | 9,986 | 1,739,561 |
| Total | | 3,712,502 |
| Industrial Conglomerates 0.2% |
| 3M Co. | 19,806 | 4,347,813 |
| Machinery 2.2% |
| Allison Transmission Holdings, Inc. | 28,300 | 1,105,398 |
| Caterpillar, Inc. | 17,548 | 2,586,224 |
| Cummins, Inc. | 31,619 | 5,125,124 |
| Deere & Co. | 154,272 | 23,961,527 |
| Donaldson Co., Inc. | 24,102 | 1,085,795 |
| Fortive Corp. | 27,328 | 2,118,467 |
| Graco, Inc. | 109,856 | 5,022,616 |
| IDEX Corp. | 7,065 | 1,006,833 |
| Illinois Tool Works, Inc. | 8,256 | 1,293,385 |
| Lincoln Electric Holdings, Inc. | 11,390 | 1,024,530 |
| Toro Co. (The) | 8,860 | 553,307 |
| WABCO Holdings, Inc.(a) | 20,080 | 2,688,110 |
| Total | | 47,571,316 |
| Common Stocks (continued) |
| Issuer | Shares | Value ($) |
| Professional Services 0.1% |
| Dun & Bradstreet Corp. (The) | 6,266 | 733,122 |
| TransUnion (a) | 18,120 | 1,028,854 |
| Total | | 1,761,976 |
| Road & Rail 0.1% |
| CSX Corp. | 1,440 | 80,223 |
| JB Hunt Transport Services, Inc. | 16,340 | 1,914,231 |
| Landstar System, Inc. | 12,222 | 1,340,142 |
| Old Dominion Freight Line, Inc. | 100 | 14,697 |
| Union Pacific Corp. | 100 | 13,443 |
| Total | | 3,362,736 |
| Trading Companies & Distributors 0.2% |
| HD Supply Holdings, Inc.(a) | 44,315 | 1,681,311 |
| Watsco, Inc. | 4,516 | 817,260 |
| WW Grainger, Inc. | 4,259 | 1,202,188 |
| Total | | 3,700,759 |
| Total Industrials | 142,540,118 |
| Information Technology 43.0% |
| Communications Equipment 1.7% |
| Arista Networks, Inc.(a) | 3,455 | 882,061 |
| Cisco Systems, Inc. | 792,510 | 33,990,754 |
| Motorola Solutions, Inc. | 1,015 | 106,880 |
| Palo Alto Networks, Inc.(a) | 6,867 | 1,246,498 |
| Total | | 36,226,193 |
| Electronic Equipment, Instruments & Components 1.2% |
| CDW Corp. | 15,110 | 1,062,384 |
| Cognex Corp. | 406,541 | 21,136,066 |
| Coherent, Inc.(a) | 3,424 | 641,658 |
| IPG Photonics Corp.(a) | 4,176 | 974,595 |
| Trimble Navigation Ltd.(a) | 51,900 | 1,862,172 |
| Universal Display Corp. | 7,990 | 806,990 |
| Zebra Technologies Corp., Class A(a) | 3,685 | 512,915 |
| Total | | 26,996,780 |
| Internet Software & Services 13.0% |
| Alibaba Group Holding Ltd., ADR(a) | 456,382 | 83,764,352 |
| Alphabet, Inc., Class A(a) | 37,898 | 39,305,532 |
| Alphabet, Inc., Class C(a) | 37,981 | 39,188,416 |
| eBay, Inc.(a) | 15,835 | 637,200 |
The accompanying Notes to Financial Statements are an integral part of this statement.
Multi-Manager Growth Strategies Fund | Annual Report 2018
| 11 |
Portfolio of Investments (continued)
March 31, 2018
| Common Stocks (continued) |
| Issuer | Shares | Value ($) |
| Facebook, Inc., Class A(a) | 624,239 | 99,747,150 |
| GoDaddy, Inc., Class A(a) | 23,530 | 1,445,213 |
| IAC/InterActiveCorp (a) | 16,240 | 2,539,611 |
| MercadoLibre, Inc. | 38,625 | 13,765,564 |
| Twitter, Inc.(a) | 24,950 | 723,799 |
| VeriSign, Inc.(a) | 7,000 | 829,920 |
| Total | | 281,946,757 |
| IT Services 7.1% |
| Accenture PLC, Class A | 11,170 | 1,714,595 |
| Alliance Data Systems Corp. | 403 | 85,783 |
| Automatic Data Processing, Inc. | 59,748 | 6,780,203 |
| Broadridge Financial Solutions, Inc. | 580 | 63,620 |
| Cognizant Technology Solutions Corp., Class A | 9,835 | 791,718 |
| Euronet Worldwide, Inc.(a) | 36,537 | 2,883,500 |
| First Data Corp., Class A(a) | 111,290 | 1,780,640 |
| Fiserv, Inc.(a) | 28,240 | 2,013,794 |
| Global Payments, Inc. | 1,900 | 211,888 |
| Jack Henry & Associates, Inc. | 24,987 | 3,022,178 |
| MasterCard, Inc., Class A | 56,251 | 9,852,925 |
| Paychex, Inc. | 1,190 | 73,292 |
| PayPal Holdings, Inc.(a) | 476,681 | 36,165,788 |
| Square, Inc., Class A(a) | 25,231 | 1,241,365 |
| Total System Services, Inc. | 12,380 | 1,067,899 |
| Visa, Inc., Class A | 712,749 | 85,259,035 |
| Worldpay, Inc., Class A(a) | 2,410 | 198,198 |
| Total | | 153,206,421 |
| Semiconductors & Semiconductor Equipment 5.0% |
| Applied Materials, Inc. | 594,842 | 33,079,164 |
| Broadcom Ltd. | 6,051 | 1,425,918 |
| Intel Corp. | 11,475 | 597,618 |
| KLA-Tencor Corp. | 13,422 | 1,463,132 |
| Lam Research Corp. | 14,217 | 2,888,326 |
| Microchip Technology, Inc. | 1,260 | 115,114 |
| Micron Technology, Inc.(a) | 46,739 | 2,436,971 |
| NVIDIA Corp. | 159,145 | 36,856,391 |
| QUALCOMM, Inc. | 404,567 | 22,417,057 |
| Teradyne, Inc. | 10,435 | 476,984 |
| Common Stocks (continued) |
| Issuer | Shares | Value ($) |
| Texas Instruments, Inc. | 23,581 | 2,449,830 |
| Xilinx, Inc. | 62,780 | 4,535,227 |
| Total | | 108,741,732 |
| Software 13.2% |
| Activision Blizzard, Inc. | 385,337 | 25,994,834 |
| Adobe Systems, Inc.(a) | 139,773 | 30,202,150 |
| ANSYS, Inc.(a) | 464 | 72,704 |
| Autodesk, Inc.(a) | 257,052 | 32,280,590 |
| Cadence Design Systems, Inc.(a) | 65,835 | 2,420,753 |
| Citrix Systems, Inc.(a) | 21,058 | 1,954,182 |
| Dell Technologies, Inc. - VMware, Inc., Class V(a) | 8,110 | 593,733 |
| Electronic Arts, Inc.(a) | 30,158 | 3,656,356 |
| Fortinet, Inc.(a) | 6,990 | 374,524 |
| Intuit, Inc. | 34,009 | 5,895,460 |
| Microsoft Corp. | 595,575 | 54,358,130 |
| Oracle Corp. | 849,357 | 38,858,083 |
| Red Hat, Inc.(a) | 970 | 145,025 |
| Salesforce.com, Inc.(a) | 279,171 | 32,467,587 |
| ServiceNow, Inc.(a) | 181,649 | 30,053,827 |
| Splunk, Inc.(a) | 244,507 | 24,057,044 |
| Synopsys, Inc.(a) | 4,150 | 345,446 |
| Take-Two Interactive Software, Inc.(a) | 25,020 | 2,446,456 |
| Workday, Inc., Class A(a) | 550 | 69,911 |
| Total | | 286,246,795 |
| Technology Hardware, Storage & Peripherals 1.8% |
| Apple, Inc. | 204,384 | 34,291,547 |
| NetApp, Inc. | 15,660 | 966,065 |
| Western Digital Corp. | 31,339 | 2,891,650 |
| Total | | 38,149,262 |
| Total Information Technology | 931,513,940 |
| Materials 0.6% |
| Chemicals 0.3% |
| Albemarle Corp. | 2,380 | 220,721 |
| Axalta Coating Systems Ltd.(a) | 1,340 | 40,455 |
| Chemours Co. LLC (The) | 28,683 | 1,397,149 |
| FMC Corp. | 43,368 | 3,320,688 |
| Praxair, Inc. | 699 | 100,866 |
| Sherwin-Williams Co. (The) | 311 | 121,949 |
The accompanying Notes to Financial Statements are an integral part of this statement.
| 12 | Multi-Manager Growth Strategies Fund | Annual Report 2018 |
Portfolio of Investments (continued)
March 31, 2018
| Common Stocks (continued) |
| Issuer | Shares | Value ($) |
| Westlake Chemical Corp. | 7,429 | 825,733 |
| WR Grace & Co. | 100 | 6,123 |
| Total | | 6,033,684 |
| Construction Materials —% |
| Eagle Materials, Inc. | 2,317 | 238,767 |
| Containers & Packaging 0.2% |
| AptarGroup, Inc. | 27,793 | 2,496,645 |
| Avery Dennison Corp. | 7,187 | 763,619 |
| Berry Global Group, Inc.(a) | 1,760 | 96,466 |
| Graphic Packaging Holding Co. | 8,035 | 123,337 |
| Packaging Corp. of America | 1,045 | 117,772 |
| Silgan Holdings, Inc. | 27,250 | 758,912 |
| Total | | 4,356,751 |
| Metals & Mining 0.1% |
| Freeport-McMoRan, Inc.(a) | 90,055 | 1,582,266 |
| Steel Dynamics, Inc. | 22,170 | 980,357 |
| Total | | 2,562,623 |
| Total Materials | 13,191,825 |
| Real Estate 0.1% |
| Equity Real Estate Investment Trusts (REITS) 0.1% |
| American Tower Corp. | 5,235 | 760,855 |
| SBA Communications Corp.(a) | 9,924 | 1,696,210 |
| Total | | 2,457,065 |
| Total Real Estate | 2,457,065 |
| Common Stocks (continued) |
| Issuer | Shares | Value ($) |
| Telecommunication Services —% |
| Diversified Telecommunication Services —% |
| Verizon Communications, Inc. | 570 | 27,257 |
| Total Telecommunication Services | 27,257 |
| Utilities —% |
| Independent Power and Renewable Electricity Producers —% |
| NRG Energy, Inc. | 4,535 | 138,454 |
| Total Utilities | 138,454 |
Total Common Stocks
(Cost $1,651,766,598) | 2,127,259,696 |
|
| Money Market Funds 1.4% |
| | Shares | Value ($) |
| Columbia Short-Term Cash Fund, 1.738%(b),(c) | 29,965,433 | 29,962,437 |
Total Money Market Funds
(Cost $29,963,106) | 29,962,437 |
Total Investments in Securities
(Cost: $1,681,729,704) | 2,157,222,133 |
| Other Assets & Liabilities, Net | | 8,831,514 |
| Net Assets | 2,166,053,647 |
Notes to Portfolio of Investments
| (a) | Non-income producing investment. |
| (b) | The rate shown is the seven-day current annualized yield at March 31, 2018. |
| (c) | As defined in the Investment Company Act of 1940, an affiliated company is one in which the Fund owns 5% or more of the company’s outstanding voting securities, or a company which is under common ownership or control with the Fund. Holdings and transactions in these affiliated companies during the year ended March 31, 2018 are as follows: |
| Issuer | Beginning
shares | Shares
purchased | Shares
sold | Ending
shares | Realized gain
(loss) —
affiliated
issuers ($) | Net change in
unrealized
appreciation
(depreciation) —
affiliated
issuers ($) | Dividends —
affiliated
issuers ($) | Value —
affiliated
issuers
at end of
period ($) |
| Columbia Short-Term Cash Fund, 1.738% |
| | 36,252,202 | 831,643,188 | (837,929,957) | 29,965,433 | (12,559) | (3,331) | 514,710 | 29,962,437 |
Abbreviation Legend
| ADR | American Depositary Receipt |
The accompanying Notes to Financial Statements are an integral part of this statement.
Multi-Manager Growth Strategies Fund | Annual Report 2018
| 13 |
Portfolio of Investments (continued)
March 31, 2018
Fair value measurements
The Fund categorizes its fair value measurements according to a three-level hierarchy that maximizes the use of observable inputs and minimizes the use of unobservable inputs by prioritizing that the most observable input be used when available. Observable inputs are those that market participants would use in pricing an investment based on market data obtained from sources independent of the reporting entity. Unobservable inputs are those that reflect the Fund’s assumptions about the information market participants would use in pricing an investment. An investment’s level within the fair value hierarchy is based on the lowest level of any input that is deemed significant to the asset’s or liability’s fair value measurement. The input levels are not necessarily an indication of the risk or liquidity associated with investments at that level. For example, certain U.S. government securities are generally high quality and liquid, however, they are reflected as Level 2 because the inputs used to determine fair value may not always be quoted prices in an active market.
Fair value inputs are summarized in the three broad levels listed below:
| ■ | Level 1 — Valuations based on quoted prices for investments in active markets that the Fund has the ability to access at the measurement date. Valuation adjustments are not applied to Level 1 investments. |
| ■ | Level 2 — Valuations based on other significant observable inputs (including quoted prices for similar securities, interest rates, prepayment speeds, credit risks, etc.). |
| ■ | Level 3 — Valuations based on significant unobservable inputs (including the Fund’s own assumptions and judgment in determining the fair value of investments). |
Inputs that are used in determining fair value of an investment may include price information, credit data, volatility statistics, and other factors. These inputs can be either observable or unobservable. The availability of observable inputs can vary between investments, and is affected by various factors such as the type of investment, and the volume and level of activity for that investment or similar investments in the marketplace. The inputs will be considered by the Investment Manager, along with any other relevant factors in the calculation of an investment’s fair value. The Fund uses prices and inputs that are current as of the measurement date, which may include periods of market dislocations. During these periods, the availability of prices and inputs may be reduced for many investments. This condition could cause an investment to be reclassified between the various levels within the hierarchy.
Certain investments that have been measured at fair value using the net asset value (NAV) per share (or its equivalent) are not categorized in the fair value hierarchy. The fair value amounts presented in the table are intended to reconcile the fair value hierarchy to the amounts presented in the Portfolio of Investments. The Columbia Short-Term Cash Fund seeks to provide shareholders with maximum current income consistent with liquidity and stability of principal. Columbia Short-Term Cash Fund prices its shares with a floating NAV and no longer seeks to maintain a stable NAV.
Investments falling into the Level 3 category are primarily supported by quoted prices from brokers and dealers participating in the market for those investments. However, these may be classified as Level 3 investments due to lack of market transparency and corroboration to support these quoted prices. Additionally, valuation models may be used as the pricing source for any remaining investments classified as Level 3. These models may rely on one or more significant unobservable inputs and/or significant assumptions by the Investment Manager. Inputs used in valuations may include, but are not limited to, financial statement analysis, capital account balances, discount rates and estimated cash flows, and comparable company data.
Under the direction of the Fund’s Board of Trustees (the Board), the Investment Manager’s Valuation Committee (the Committee) is responsible for overseeing the valuation procedures approved by the Board. The Committee consists of voting and non-voting members from various groups within the Investment Manager’s organization, including operations and accounting, trading and investments, compliance, risk management and legal.
The Committee meets at least monthly to review and approve valuation matters, which may include a description of specific valuation determinations, data regarding pricing information received from approved pricing vendors and brokers and the results of Board-approved valuation control policies and procedures (the Policies). The Policies address, among other things, instances when market quotations are or are not readily available, including recommendations of third party pricing vendors and a determination of appropriate pricing methodologies; events that require specific valuation determinations and assessment of fair value techniques; securities with a potential for stale pricing, including those that are illiquid, restricted, or in default; and the effectiveness of third party pricing vendors, including periodic reviews of vendors. The Committee meets more frequently, as needed, to discuss additional valuation matters, which may include the need to review back-testing results, review time-sensitive information or approve related valuation actions. The Committee reports to the Board, with members of the Committee meeting with the Board at each of its regularly scheduled meetings to discuss valuation matters and actions during the period, similar to those described earlier.
For investments categorized as Level 3, the Committee monitors information similar to that described above, which may include: (i) data specific to the issuer or comparable issuers, (ii) general market or specific sector news and (iii) quoted prices and specific or similar security transactions. The Committee considers this data and any changes from prior periods in order to assess the reasonableness of observable and unobservable inputs, any assumptions or internal models used to value those securities and changes in fair value. This data is also used to corroborate, when available, information received from approved pricing vendors and brokers. Various factors impact the frequency of monitoring this information (which may occur as often as daily). However, the Committee may determine that changes to inputs, assumptions and models are not required as a result of the monitoring procedures performed.
The following table is a summary of the inputs used to value the Fund’s investments at March 31, 2018:
| | Level 1
quoted prices
in active
markets for
identical
assets ($) | Level 2
other
significant
observable
inputs ($) | Level 3
significant
unobservable
inputs ($) | Investments
measured at
net asset
value ($) | Total ($) |
| Investments in Securities | | | | | |
| Common Stocks | | | | | |
| Consumer Discretionary | 333,079,629 | — | — | — | 333,079,629 |
| Consumer Staples | 161,046,627 | — | — | — | 161,046,627 |
| Energy | 45,182,512 | — | — | — | 45,182,512 |
| Financials | 128,168,545 | — | — | — | 128,168,545 |
| Health Care | 369,913,724 | — | — | — | 369,913,724 |
| Industrials | 142,540,118 | — | — | — | 142,540,118 |
| Information Technology | 931,513,940 | — | — | — | 931,513,940 |
| Materials | 13,191,825 | — | — | — | 13,191,825 |
The accompanying Notes to Financial Statements are an integral part of this statement.
| 14 | Multi-Manager Growth Strategies Fund | Annual Report 2018 |
Portfolio of Investments (continued)
March 31, 2018
Fair value measurements (continued)
| | Level 1
quoted prices
in active
markets for
identical
assets ($) | Level 2
other
significant
observable
inputs ($) | Level 3
significant
unobservable
inputs ($) | Investments
measured at
net asset
value ($) | Total ($) |
| Real Estate | 2,457,065 | — | — | — | 2,457,065 |
| Telecommunication Services | 27,257 | — | — | — | 27,257 |
| Utilities | 138,454 | — | — | — | 138,454 |
| Total Common Stocks | 2,127,259,696 | — | — | — | 2,127,259,696 |
| Money Market Funds | — | — | — | 29,962,437 | 29,962,437 |
| Total Investments in Securities | 2,127,259,696 | — | — | 29,962,437 | 2,157,222,133 |
See the Portfolio of Investments for all investment classifications not indicated in the table.
There were no transfers of financial assets between levels during the period.
The accompanying Notes to Financial Statements are an integral part of this statement.
Multi-Manager Growth Strategies Fund | Annual Report 2018
| 15 |
Statement of Assets and Liabilities
March 31, 2018
| Assets | |
| Investments in securities, at value | |
| Unaffiliated issuers (cost $1,651,766,598) | $2,127,259,696 |
| Affiliated issuers (cost $29,963,106) | 29,962,437 |
| Receivable for: | |
| Investments sold | 17,166,305 |
| Capital shares sold | 3,281,002 |
| Dividends | 1,712,177 |
| Foreign tax reclaims | 153,758 |
| Prepaid expenses | 5,274 |
| Trustees’ deferred compensation plan | 69,481 |
| Total assets | 2,179,610,130 |
| Liabilities | |
| Payable for: | |
| Investments purchased | 10,312,937 |
| Capital shares purchased | 2,719,633 |
| Management services fees | 40,254 |
| Distribution and/or service fees | 71 |
| Transfer agent fees | 263,356 |
| Compensation of board members | 513 |
| Compensation of chief compliance officer | 269 |
| Other expenses | 149,969 |
| Trustees’ deferred compensation plan | 69,481 |
| Total liabilities | 13,556,483 |
| Net assets applicable to outstanding capital stock | $2,166,053,647 |
| Represented by | |
| Paid in capital | 1,480,180,284 |
| Excess of distributions over net investment income | (85,624) |
| Accumulated net realized gain | 210,466,558 |
| Unrealized appreciation (depreciation) on: | |
| Investments - unaffiliated issuers | 475,493,098 |
| Investments - affiliated issuers | (669) |
| Total - representing net assets applicable to outstanding capital stock | $2,166,053,647 |
| Class A | |
| Net assets | $10,420,448 |
| Shares outstanding | 692,812 |
| Net asset value per share | $15.04 |
| Institutional Class | |
| Net assets | $2,155,633,199 |
| Shares outstanding | 145,021,328 |
| Net asset value per share | $14.86 |
The accompanying Notes to Financial Statements are an integral part of this statement.
| 16 | Multi-Manager Growth Strategies Fund | Annual Report 2018 |
Statement of Operations
Year Ended March 31, 2018
| Net investment income | |
| Income: | |
| Dividends — unaffiliated issuers | $24,121,286 |
| Dividends — affiliated issuers | 514,710 |
| Foreign taxes withheld | (638,910) |
| Total income | 23,997,086 |
| Expenses: | |
| Management services fees | 17,359,656 |
| Distribution and/or service fees | |
| Class A | 31,224 |
| Transfer agent fees | |
| Class A | 21,120 |
| Institutional Class | 3,534,052 |
| Compensation of board members | 56,360 |
| Custodian fees | 42,676 |
| Printing and postage fees | 357,676 |
| Registration fees | 89,178 |
| Audit fees | 34,633 |
| Legal fees | 67,268 |
| Compensation of chief compliance officer | 1,071 |
| Other | 132,122 |
| Total expenses | 21,727,036 |
| Net investment income | 2,270,050 |
| Realized and unrealized gain (loss) — net | |
| Net realized gain (loss) on: | |
| Investments — unaffiliated issuers | 293,872,112 |
| Investments — affiliated issuers | (12,559) |
| Net realized gain | 293,859,553 |
| Net change in unrealized appreciation (depreciation) on: | |
| Investments — unaffiliated issuers | 215,566,332 |
| Investments — affiliated issuers | (3,331) |
| Net change in unrealized appreciation (depreciation) | 215,563,001 |
| Net realized and unrealized gain | 509,422,554 |
| Net increase in net assets resulting from operations | $511,692,604 |
The accompanying Notes to Financial Statements are an integral part of this statement.
Multi-Manager Growth Strategies Fund | Annual Report 2018
| 17 |
Statement of Changes in Net Assets
| | Year Ended
March 31, 2018 | Year Ended
March 31, 2017 |
| Operations | | |
| Net investment income (loss) | $2,270,050 | $(5,207,161) |
| Net realized gain | 293,859,553 | 275,112,653 |
| Net change in unrealized appreciation (depreciation) | 215,563,001 | 92,407,967 |
| Net increase in net assets resulting from operations | 511,692,604 | 362,313,459 |
| Distributions to shareholders | | |
| Net investment income | | |
| Institutional Class | (3,209,356) | — |
| Net realized gains | | |
| Class A | (591,064) | (156,120,370) |
| Institutional Class | (119,172,214) | — |
| Total distributions to shareholders | (122,972,634) | (156,120,370) |
| Decrease in net assets from capital stock activity | (447,046,244) | (534,982,242) |
| Total decrease in net assets | (58,326,274) | (328,789,153) |
| Net assets at beginning of year | 2,224,379,921 | 2,553,169,074 |
| Net assets at end of year | $2,166,053,647 | $2,224,379,921 |
| Excess of distributions over net investment income | $(85,624) | $(64,818) |
The accompanying Notes to Financial Statements are an integral part of this statement.
| 18 | Multi-Manager Growth Strategies Fund | Annual Report 2018 |
Statement of Changes in Net Assets (continued)
| | Year Ended | Year Ended |
| | March 31, 2018 | March 31, 2017 (a) |
| | Shares | Dollars ($) | Shares | Dollars ($) |
| Capital stock activity |
| Class A | | | | |
| Subscriptions | 30,014 | 401,399 | 37,414,984 | 473,025,857 |
| Distributions reinvested | 43,134 | 590,940 | 13,020,866 | 156,120,177 |
| Redemptions | (658,856) | (9,130,469) | (259,465,558) | (3,363,004,813) |
| Net decrease | (585,708) | (8,138,130) | (209,029,708) | (2,733,858,779) |
| Institutional Class | | | | |
| Subscriptions | 55,198,512 | 759,787,775 | 173,068,712 | 2,222,242,187 |
| Distributions reinvested | 9,009,807 | 122,381,426 | — | — |
| Redemptions | (90,433,025) | (1,321,077,315) | (1,822,678) | (23,365,650) |
| Net increase (decrease) | (26,224,706) | (438,908,114) | 171,246,034 | 2,198,876,537 |
| Total net decrease | (26,810,414) | (447,046,244) | (37,783,674) | (534,982,242) |
| (a) | Institutional Class shares are based on operations from January 3, 2017 (commencement of operations) through the stated period end. |
The accompanying Notes to Financial Statements are an integral part of this statement.
Multi-Manager Growth Strategies Fund | Annual Report 2018
| 19 |
The following table is intended to help you understand the Fund’s financial performance. Certain information reflects financial results for a single share of a class held for the periods shown. Per share net investment income (loss) amounts are calculated based on average shares outstanding during the period. Total return assumes reinvestment of all dividends and distributions, if any. Total return does not reflect payment of sales charges, if any. Total return and portfolio turnover are not annualized for periods of less than one year. The portfolio turnover rate is calculated without regard to purchase and sales transactions of short-term instruments and certain derivatives, if any. If such transactions were included, the Fund’s portfolio turnover rate may be higher.
| | Net asset value,
beginning of
period | Net
investment
income
(loss) | Net
realized
and
unrealized
gain (loss) | Total from
investment
operations | Distributions
from net
investment
income | Distributions
from net
realized
gains |
| Class A |
| Year Ended 3/31/2018 | $13.04 | (0.02) | 2.67 | 2.65 | — | (0.65) |
| Year Ended 3/31/2017 | $12.14 | (0.03) | 1.94 | 1.91 | — | (1.01) |
| Year Ended 3/31/2016 | $13.79 | (0.05) | (0.52) | (0.57) | — | (1.08) |
| Year Ended 3/31/2015 | $13.95 | (0.09) | 1.75 | 1.66 | — | (1.82) |
| Year Ended 3/31/2014 | $10.89 | (0.11) | 3.22 | 3.11 | — | (0.05) |
| Institutional Class |
| Year Ended 3/31/2018 | $12.89 | 0.01 | 2.64 | 2.65 | (0.02) | (0.66) |
| Year Ended 3/31/2017(d) | $11.74 | 0.01 | 1.14 | 1.15 | — | — |
| Notes to Financial Highlights |
| (a) | In addition to the fees and expenses that the Fund bears directly, the Fund indirectly bears a pro rata share of the fees and expenses of any other funds in which it invests. Such indirect expenses are not included in the Fund’s reported expense ratios. |
| (b) | Total net expenses include the impact of certain fee waivers/expense reimbursements made by the Investment Manager and certain of its affiliates, if applicable. |
| (c) | Ratios include line of credit interest expense which is less than 0.01%. |
| (d) | Institutional Class shares commenced operations on January 3, 2017. Per share data and total return reflect activity from that date. |
| (e) | Annualized. |
The accompanying Notes to Financial Statements are an integral part of this statement.
| 20 | Multi-Manager Growth Strategies Fund | Annual Report 2018 |
Total
distributions to
shareholders | Net
asset
value,
end of
period | Total
return | Total gross
expense
ratio to
average
net assets(a) | Total net
expense
ratio to
average
net assets(a),(b) | Net investment
income (loss)
ratio to
average
net assets | Portfolio
turnover | Net
assets,
end of
period
(000’s) |
| |
| (0.65) | $15.04 | 20.83% | 1.13% | 1.13% | (0.17%) | 50% | $10,420 |
| (1.01) | $13.04 | 16.45% | 1.13% | 1.13% | (0.25%) | 48% | $16,678 |
| (1.08) | $12.14 | (4.80%) | 1.12% (c) | 1.12% (c) | (0.39%) | 39% | $2,553,169 |
| (1.82) | $13.79 | 13.24% | 1.16% | 1.16% | (0.64%) | 48% | $1,833,649 |
| (0.05) | $13.95 | 28.62% | 1.19% | 1.19% | (0.87%) | 64% | $1,534,427 |
| |
| (0.68) | $14.86 | 21.09% | 0.85% | 0.85% | 0.09% | 50% | $2,155,633 |
| — | $12.89 | 9.80% | 0.89% (e) | 0.89% (e) | 0.38% (e) | 48% | $2,207,702 |
Multi-Manager Growth Strategies Fund | Annual Report 2018
| 21 |
Notes to Financial Statements
March 31, 2018
Note 1. Organization
Multi-Manager Growth Strategies Fund (the Fund), a series of Columbia Funds Series Trust I (the Trust), is a diversified fund. The Trust is registered under the Investment Company Act of 1940, as amended (the 1940 Act), as an open-end management investment company organized as a Massachusetts business trust.
Fund shares
The Trust may issue an unlimited number of shares (without par value). Although all share classes generally have identical voting, dividend and liquidation rights, each share class votes separately when required by the Trust’s organizational documents or by law. Different share classes pay different distribution amounts to the extent the expenses of such share classes differ, and distributions in liquidation will be proportional to the net asset value of each share class. Each share class has its own expense and sales charge structure. The Fund offers each of the share classes identified below.
Class A shares are not subject to any front-end sales charge or contingent deferred sales charge.
Institutional Class shares are not subject to sales charges and are generally available only to eligible investors, which are subject to different investment minimums as described in the Fund’s prospectus. Prior to November 1, 2017, Institutional Class shares were known as Class Z shares.
Note 2. Summary of significant accounting policies
Basis of preparation
The Fund is an investment company that applies the accounting and reporting guidance in the Financial Accounting Standards Board (FASB) Accounting Standards Codification Topic 946, Financial Services - Investment Companies (ASC 946). The financial statements are prepared in accordance with U.S. generally accepted accounting principles (GAAP), which requires management to make certain estimates and assumptions that affect the reported amounts of assets and liabilities, the disclosure of contingent assets and liabilities at the date of the financial statements and the reported amounts of income and expenses during the reporting period. Actual results could differ from those estimates.
The following is a summary of significant accounting policies followed by the Fund in the preparation of its financial statements.
Security valuation
All equity securities are valued at the close of business of the New York Stock Exchange. Equity securities are valued at the last quoted sales price on the principal exchange or market on which they trade, except for securities traded on the NASDAQ Stock Market, which are valued at the NASDAQ official close price. Unlisted securities or listed securities for which there were no sales during the day are valued at the mean of the latest quoted bid and ask prices on such exchanges or markets.
Foreign equity securities are valued based on the closing price on the foreign exchange in which such securities are primarily traded. If any foreign equity security closing prices are not readily available, the securities are valued at the mean of the latest quoted bid and ask prices on such exchanges or markets. Foreign currency exchange rates are generally determined at 4:00 p.m. Eastern (U.S.) time. Many securities markets and exchanges outside the U.S. close prior to the close of the New York Stock Exchange; therefore, the closing prices for securities in such markets or on such exchanges may not fully reflect events that occur after such close but before the close of the New York Stock Exchange. In those situations, foreign securities will be fair valued pursuant to a policy adopted by the Board of Trustees, including, if available, utilizing a third party pricing service to determine these fair values. The third party pricing service takes into account multiple factors, including, but not limited to, movements in the U.S. securities markets, certain depositary receipts, futures contracts and foreign exchange rates that have occurred subsequent to the close of the foreign exchange or market, to determine a good faith estimate that reasonably reflects the current market conditions as of the close of the New York Stock Exchange. The fair value of a security is likely to be different from the quoted or published price, if available.
Investments in open-end investment companies, including money market funds, are valued at their latest net asset value.
| 22 | Multi-Manager Growth Strategies Fund | Annual Report 2018 |
Notes to Financial Statements (continued)
March 31, 2018
Investments for which market quotations are not readily available, or that have quotations which management believes are not reflective of market value or reliable, are valued at fair value as determined in good faith under procedures approved by and under the general supervision of the Board of Trustees. If a security or class of securities (such as foreign securities) is valued at fair value, such value is likely to be different from the quoted or published price for the security.
The determination of fair value often requires significant judgment. To determine fair value, management may use assumptions including but not limited to future cash flows and estimated risk premiums. Multiple inputs from various sources may be used to determine fair value.
GAAP requires disclosure regarding the inputs and valuation techniques used to measure fair value and any changes in valuation inputs or techniques. In addition, investments shall be disclosed by major category. This information is disclosed following the Fund’s Portfolio of Investments.
Security transactions
Security transactions are accounted for on the trade date. Cost is determined and gains (losses) are based upon the specific identification method for both financial statement and federal income tax purposes.
Income recognition
Corporate actions and dividend income are generally recorded net of any non-reclaimable tax withholdings, on the ex-dividend date or upon receipt of ex-dividend notification in the case of certain foreign securities.
The Fund may receive distributions from holdings in equity securities, business development companies (BDCs), exchange-traded funds (ETFs), limited partnerships (LPs), other regulated investment companies (RICs), and real estate investment trusts (REITs), which report information on the tax character of their distributions annually. These distributions are allocated to dividend income, capital gain and return of capital based on actual information reported. Return of capital is recorded as a reduction of the cost basis of securities held. If the Fund no longer owns the applicable securities, return of capital is recorded as a realized gain. With respect to REITs, to the extent actual information has not yet been reported, estimates for return of capital are made by the Fund’s management. Management’s estimates are subsequently adjusted when the actual character of the distributions is disclosed by the REITs, which could result in a proportionate change in return of capital to shareholders.
Awards from class action litigation are recorded as a reduction of cost basis if the Fund still owns the applicable securities on the payment date. If the Fund no longer owns the applicable securities, the proceeds are recorded as realized gains.
Expenses
General expenses of the Trust are allocated to the Fund and other funds of the Trust based upon relative net assets or other expense allocation methodologies determined by the nature of the expense. Expenses directly attributable to the Fund are charged to the Fund. Expenses directly attributable to a specific class of shares are charged to that share class.
Determination of class net asset value
All income, expenses (other than class-specific expenses, which are charged to that share class, as shown in the Statement of Operations) and realized and unrealized gains (losses) are allocated to each class of the Fund on a daily basis, based on the relative net assets of each class, for purposes of determining the net asset value of each class.
Federal income tax status
The Fund intends to qualify each year as a regulated investment company under Subchapter M of the Internal Revenue Code, as amended, and will distribute substantially all of its investment company taxable income and net capital gain, if any, for its tax year, and as such will not be subject to federal income taxes. In addition, the Fund intends to distribute in each calendar year substantially all of its ordinary income, capital gain net income and certain other amounts, if any, such that the Fund should not be subject to federal excise tax. Therefore, no federal income or excise tax provision is recorded.
Multi-Manager Growth Strategies Fund | Annual Report 2018
| 23 |
Notes to Financial Statements (continued)
March 31, 2018
Foreign taxes
The Fund may be subject to foreign taxes on income, gains on investments or currency repatriation, a portion of which may be recoverable. The Fund will accrue such taxes and recoveries, as applicable, based upon its current interpretation of tax rules and regulations that exist in the markets in which it invests.
Realized gains in certain countries may be subject to foreign taxes at the Fund level, based on statutory rates. The Fund accrues for such foreign taxes on realized and unrealized gains at the appropriate rate for each jurisdiction, as applicable. The amount, if any, is disclosed as a liability on the Statement of Assets and Liabilities.
Distributions to shareholders
Distributions from net investment income, if any, are declared and paid each calendar quarter. Net realized capital gains, if any, are distributed at least annually. Income distributions and capital gain distributions are determined in accordance with federal income tax regulations, which may differ from GAAP.
Guarantees and indemnifications
Under the Trust’s organizational documents and, in some cases, by contract, its officers and trustees are indemnified against certain liabilities arising out of the performance of their duties to the Trust or its funds. In addition, certain of the Fund’s contracts with its service providers contain general indemnification clauses. The Fund’s maximum exposure under these arrangements is unknown since the amount of any future claims that may be made against the Fund cannot be determined, and the Fund has no historical basis for predicting the likelihood of any such claims.
Recent accounting pronouncement
Accounting Standards Update 2017-08 Premium Amortization on Purchased Callable Debt Securities
In March 2017, the Financial Accounting Standards Board issued Accounting Standards Update (ASU) No. 2017-08 Premium Amortization on Purchased Callable Debt Securities. ASU No. 2017-08 updates the accounting standards to shorten the amortization period for certain purchased callable debt securities, held at a premium, to be amortized to the earliest call date. The update applies to securities with explicit, noncontingent call features that are callable at fixed prices and on preset dates. The standard is effective for annual periods beginning after December 15, 2018 and interim periods within those fiscal years. At this time, management is evaluating the implication of this guidance and the impact it will have on the financial statement amounts and footnote disclosures, if any.
Note 3. Fees and other transactions with affiliates
Management services fees
The Fund has entered into a Management Agreement with Columbia Management Investment Advisers, LLC (the Investment Manager), a wholly-owned subsidiary of Ameriprise Financial, Inc. (Ameriprise Financial). Under the Management Agreement, the Investment Manager provides the Fund with investment research and advice, as well as administrative and accounting services. The management services fee is an annual fee that is equal to a percentage of the Fund’s daily net assets that declines from 0.77% to 0.57% as the Fund’s net assets increase. The effective management services fee rate for the year ended March 31, 2018 was 0.68% of the Fund’s average daily net assets.
Subadvisory agreement
The Investment Manager has entered into Subadvisory Agreements with Loomis, Sayles & Company, L.P. and Los Angeles Capital Management and Equity Research, Inc. each of which, together with the Investment Manager, manage a portion of the assets of the Fund. New investments in the Fund, net of any redemptions, are allocated in accordance with the Investment Manager’s determination, subject to the oversight of the Fund’s Board of Trustees. Each subadviser’s proportionate share of investments in the Fund will vary due to market fluctuations. The Investment Manager compensates each subadviser to manage the investment of the Fund’s assets.
| 24 | Multi-Manager Growth Strategies Fund | Annual Report 2018 |
Notes to Financial Statements (continued)
March 31, 2018
Compensation of board members
Members of the Board of Trustees who are not officers or employees of the Investment Manager or Ameriprise Financial are compensated for their services to the Fund as disclosed in the Statement of Operations. These members of the Board of Trustees may participate in a Deferred Compensation Plan (the Plan) which may be terminated at any time. Obligations of the Plan will be paid solely out of the Fund’s assets, and all amounts payable under the Plan constitute a general unsecured obligation of the Fund.
Compensation of Chief Compliance Officer
The Board of Trustees has appointed a Chief Compliance Officer to the Fund in accordance with federal securities regulations. As disclosed in the Statement of Operations, a portion of the Chief Compliance Officer’s total compensation is allocated to the Fund, along with other allocations to affiliated funds governed by the Board of Trustees, based on relative net assets.
Transfer agency fees
Under a Transfer and Dividend Disbursing Agent Agreement, Columbia Management Investment Services Corp. (the Transfer Agent), an affiliate of the Investment Manager and a wholly-owned subsidiary of Ameriprise Financial, is responsible for providing transfer agency services to the Fund. The Transfer Agent has contracted with DST Asset Manager Solutions, Inc. (DST) to serve as sub-transfer agent. The Transfer Agent pays the fees of DST for services as sub-transfer agent and DST is not entitled to reimbursement for such fees from the Fund (with the exception of out-of-pocket fees).
The Fund pays the Transfer Agent a monthly transfer agency fee based on the number or the average value of accounts, depending on the type of account. In addition, the Fund pays the Transfer Agent a fee for shareholder services based on the number of accounts or on a percentage of the average aggregate value of the Fund’s shares maintained in omnibus accounts up to the lesser of the amount charged by the financial intermediary or a cap established by the Board of Trustees from time to time.
The Transfer Agent also receives compensation from the Fund for various shareholder services and reimbursements for certain out-of-pocket fees.
For the year ended March 31, 2018, the Fund’s effective transfer agency fee rates as a percentage of average daily net assets of each class were as follows:
| | Effective rate (%) |
| Class A | 0.17 |
| Institutional Class | 0.14 |
An annual minimum account balance fee of $20 may apply to certain accounts with a value below the applicable share class’s initial minimum investment requirements to reduce the impact of small accounts on transfer agency fees. These minimum account balance fees are remitted to the Fund and recorded as part of expense reductions in the Statement of Operations. For the year ended March 31, 2018, no minimum account balance fees were charged by the Fund.
Distribution and service fees
The Fund has entered into an agreement with Columbia Management Investment Distributors, Inc. (the Distributor), an affiliate of the Investment Manager and a wholly-owned subsidiary of Ameriprise Financial, for distribution and shareholder services. The Board of Trustees has approved, and the Fund has adopted, distribution and shareholder service plans (the Plans) applicable to certain share classes, which set the distribution and service fees for the Fund. These fees are calculated daily and are intended to compensate the Distributor and/or eligible selling and/or servicing agents for selling shares of the Fund and providing services to investors.
Under the Plans, the Fund pays a monthly service fee to the Distributor at the maximum annual rate of 0.25% of the average daily net assets attributable to Class A shares of the Fund and a monthly distribution fee to the Distributor at the maximum annual rate of 0.25% of the average daily net assets attributable to Class A shares. However, the aggregate fee shall not exceed 0.25% of the Fund’s average daily net assets attributable to Class A shares.
Multi-Manager Growth Strategies Fund | Annual Report 2018
| 25 |
Notes to Financial Statements (continued)
March 31, 2018
Expenses waived/reimbursed by the Investment Manager and its affiliates
The Investment Manager and certain of its affiliates have contractually agreed to waive fees and/or reimburse expenses (excluding certain fees and expenses described below) for the period(s) disclosed below, unless sooner terminated at the sole discretion of the Board of Trustees, so that the Fund’s net operating expenses, after giving effect to fees waived/expenses reimbursed and any balance credits and/or overdraft charges from the Fund’s custodian, do not exceed the following annual rate(s) as a percentage of the class’ average daily net assets:
| | August 1, 2017
through
July 31, 2018 | Prior to
August 1, 2017 |
| Class A | 1.15% | 1.20% |
| Institutional Class | 0.90 | 0.95 |
Under the agreement governing these fee waivers and/or expense reimbursement arrangements, the following fees and expenses are excluded from the waiver/reimbursement commitment, and therefore will be paid by the Fund, if applicable: taxes (including foreign transaction taxes), transaction costs and brokerage commissions, costs related to any securities lending program, dividend expenses associated with securities sold short, inverse floater program fees and expenses, transaction charges and interest on borrowed money, interest, infrequent and/or unusual expenses and any other expenses the exclusion of which is specifically approved by the Board of Trustees. This agreement may be modified or amended only with approval from the Investment Manager, certain of its affiliates and the Fund. Any fees waived and/or expenses reimbursed under the expense reimbursement arrangements described above are not recoverable by the Investment Manager or its affiliates in future periods.
Note 4. Federal tax information
The timing and character of income and capital gain distributions are determined in accordance with income tax regulations, which may differ from GAAP because of temporary or permanent book to tax differences.
At March 31, 2018, these differences were primarily due to differing treatment for deferral/reversal of wash sale losses, re-characterization of distributions for investments, trustees’ deferred compensation, distribution reclassifications, non-deductible expenses and earnings and profits distributed to shareholders on the redemption of shares. To the extent these differences were permanent, reclassifications were made among the components of the Fund’s net assets in the Statement of Assets and Liabilities. Temporary differences do not require reclassifications.
In the Statement of Assets and Liabilities the following reclassifications were made:
Excess of distributions
over net investment
income ($) | Accumulated
net realized
gain ($) | Paid in
capital ($) |
| 918,500 | (39,190,957) | 38,272,457 |
Net investment income (loss) and net realized gains (losses), as disclosed in the Statement of Operations, and net assets were not affected by this reclassification.
The tax character of distributions paid during the years indicated was as follows:
| Year Ended March 31, 2018 | Year Ended March 31, 2017 |
Ordinary
income ($) | Long-term
capital gains ($) | Total ($) | Ordinary
income ($) | Long-term
capital gains ($) | Total ($) |
| 9,372,586 | 113,600,048 | 122,972,634 | 6,118,454 | 150,001,916 | 156,120,370 |
Short-term capital gain distributions, if any, are considered ordinary income distributions for tax purposes.
| 26 | Multi-Manager Growth Strategies Fund | Annual Report 2018 |
Notes to Financial Statements (continued)
March 31, 2018
At March 31, 2018, the components of distributable earnings on a tax basis were as follows:
Undistributed
ordinary income ($) | Undistributed
long-term
capital gains ($) | Capital loss
carryforwards ($) | Net unrealized
appreciation ($) |
| 45,147,630 | 172,442,861 | — | 468,368,496 |
At March 31, 2018, the cost of all investments for federal income tax purposes along with the aggregate gross unrealized appreciation and depreciation based on that cost was:
Federal
tax cost ($) | Gross unrealized
appreciation ($) | Gross unrealized
(depreciation) ($) | Net unrealized
appreciation ($) |
| 1,688,853,637 | 501,495,169 | (33,126,673) | 468,368,496 |
Tax cost of investments and unrealized appreciation/(depreciation) may also include timing differences that do not constitute adjustments to tax basis.
Management of the Fund has concluded that there are no significant uncertain tax positions in the Fund that would require recognition in the financial statements. However, management’s conclusion may be subject to review and adjustment at a later date based on factors including, but not limited to, new tax laws, regulations, and administrative interpretations (including relevant court decisions). Generally, the Fund’s federal tax returns for the prior three fiscal years remain subject to examination by the Internal Revenue Service.
Note 5. Portfolio information
The cost of purchases and proceeds from sales of securities, excluding short-term investments and derivatives, if any, aggregated to $1,243,083,704 and $1,806,745,236, respectively, for the year ended March 31, 2018. The amount of purchase and sale activity impacts the portfolio turnover rate reported in the Financial Highlights.
Note 6. Affiliated money market fund
The Fund invests in Columbia Short-Term Cash Fund, an affiliated money market fund established for the exclusive use by the Fund and other affiliated funds (the Affiliated MMF). The income earned by the Fund from such investments is included as Dividends - affiliated issuers in the Statement of Operations. As an investing fund, the Fund indirectly bears its proportionate share of the expenses of the Affiliated MMF. The Affiliated MMF prices its shares with a floating net asset value. In addition, the Board of Trustees of the Affiliated MMF may impose a fee on redemptions (sometimes referred to as a liquidity fee) or temporarily suspend redemptions (sometimes referred to as imposing a redemption gate) in the event its liquidity falls below regulatory limits.
Note 7. Line of credit
The Fund has access to a revolving credit facility with a syndicate of banks led by Citibank, N.A., HSBC Bank USA, N.A. and JPMorgan Chase Bank, N.A. whereby the Fund may borrow for the temporary funding of shareholder redemptions or for other temporary or emergency purposes. The credit facility, which is a collective agreement between the Fund and certain other funds managed by the Investment Manager, severally and not jointly, permits collective borrowings up to $1 billion. Interest is charged to each participating fund based on its borrowings at a rate equal to the higher of (i) the overnight federal funds rate plus 1.00% or (ii) the one-month LIBOR rate plus 1.00%. Each borrowing under the credit facility matures no later than 60 days after the date of borrowing. The Fund also pays a commitment fee equal to its pro rata share of the amount of the credit facility at a rate of 0.15% per annum. The commitment fee is included in other expenses in the Statement of Operations.
The Fund had no borrowings during the year ended March 31, 2018.
Multi-Manager Growth Strategies Fund | Annual Report 2018
| 27 |
Notes to Financial Statements (continued)
March 31, 2018
Note 8. Significant risks
Shareholder concentration risk
At March 31, 2018, affiliated shareholders of record owned 100.0% of the outstanding shares of the Fund in one or more accounts. Subscription and redemption activity by concentrated accounts may have a significant effect on the operations of the Fund. In the case of a large redemption, the Fund may be forced to sell investments at inopportune times, including its liquid positions, which may result in Fund losses and the Fund holding a higher percentage of less liquid positions. Large redemptions could result in decreased economies of scale and increased operating expenses for non-redeeming Fund shareholders.
Technology and technology-related investment risk
The Fund may be more susceptible to the particular risks that may affect companies in the information technology sector, as well as other technology-related sectors (collectively, the technology sectors) than if it were invested in a wider variety of companies in unrelated sectors. Companies in the technology sectors are subject to certain risks, including the risk that new services, equipment or technologies will not be accepted by consumers and businesses or will become rapidly obsolete. Performance of such companies may be affected by factors including obtaining and protecting patents (or the failure to do so) and significant competitive pressures, including aggressive pricing of their products or services, new market entrants, competition for market share and short product cycles due to an accelerated rate of technological developments. Such competitive pressures may lead to limited earnings and/or falling profit margins. As a result, the value of their securities may fall or fail to rise. In addition, many technology sector companies have limited operating histories and prices of these companies’ securities historically have been more volatile than other securities, especially over the short term.
Note 9. Subsequent events
Management has evaluated the events and transactions that have occurred through the date the financial statements were issued and noted no items requiring adjustment of the financial statements or additional disclosure.
Note 10. Information regarding pending and settled legal proceedings
Ameriprise Financial and certain of its affiliates have historically been involved in a number of legal, arbitration and regulatory proceedings, including routine litigation, class actions, and governmental actions, concerning matters arising in connection with the conduct of their business activities. Ameriprise Financial believes that the Fund is not currently the subject of, and that neither Ameriprise Financial nor any of its affiliates are the subject of, any pending legal, arbitration or regulatory proceedings that are likely to have a material adverse effect on the Fund or the ability of Ameriprise Financial or its affiliates to perform under their contracts with the Fund. Ameriprise Financial is required to make quarterly (10-Q), annual (10-K) and, as necessary, 8-K filings with the Securities and Exchange Commission (SEC) on legal and regulatory matters that relate to Ameriprise Financial and its affiliates. Copies of these filings may be obtained by accessing the SEC website at www.sec.gov.
There can be no assurance that these matters, or the adverse publicity associated with them, will not result in increased Fund redemptions, reduced sale of Fund shares or other adverse consequences to the Fund. Further, although we believe proceedings are not likely to have a material adverse effect on the Fund or the ability of Ameriprise Financial or its affiliates to perform under their contracts with the Fund, these proceedings are subject to uncertainties and, as such, we are unable to estimate the possible loss or range of loss that may result. An adverse outcome in one or more of these proceedings could result in adverse judgments, settlements, fines, penalties or other relief that could have a material adverse effect on the consolidated financial condition or results of operations of Ameriprise Financial.
| 28 | Multi-Manager Growth Strategies Fund | Annual Report 2018 |
Report of Independent Registered Public Accounting Firm
To the Trustees of Columbia Funds Series Trust I and Shareholders of Multi-Manager Growth Strategies Fund
Opinion on the Financial Statements
We have audited the accompanying statement of assets and liabilities, including the portfolio of investments, of Multi-Manager Growth Strategies Fund (one of the funds constituting Columbia Funds Series Trust I, referred to hereafter as the "Fund") as of March 31, 2018, the related statement of operations for the year ended March 31, 2018, the statement of changes in net assets for each of the two years in the period ended March 31, 2018, including the related notes, and the financial highlights for each of the periods indicated therein (collectively referred to as the “financial statements”). In our opinion, the financial statements present fairly, in all material respects, the financial position of the Fund as of March 31, 2018, the results of its operations for the year then ended, the changes in its net assets for each of the two years in the period ended March 31, 2018 and the financial highlights for each of the periods indicated therein in conformity with accounting principles generally accepted in the United States of America.
Basis for Opinion
These financial statements are the responsibility of the Fund’s management. Our responsibility is to express an opinion on the Fund’s financial statements based on our audits. We are a public accounting firm registered with the Public Company Accounting Oversight Board (United States) (“PCAOB”) and are required to be independent with respect to the Fund in accordance with the U.S. federal securities laws and the applicable rules and regulations of the Securities and Exchange Commission and the PCAOB.
We conducted our audits of these financial statements in accordance with the standards of the PCAOB. Those standards require that we plan and perform the audit to obtain reasonable assurance about whether the financial statements are free of material misstatement, whether due to error or fraud.
Our audits included performing procedures to assess the risks of material misstatement of the financial statements, whether due to error or fraud, and performing procedures that respond to those risks. Such procedures included examining, on a test basis, evidence regarding the amounts and disclosures in the financial statements. Our audits also included evaluating the accounting principles used and significant estimates made by management, as well as evaluating the overall presentation of the financial statements. Our procedures included confirmation of securities owned as of March 31, 2018 by correspondence with the custodian, transfer agent and brokers; when replies were not received from brokers, we performed other auditing procedures. We believe that our audits provide a reasonable basis for our opinion.
/s/PricewaterhouseCoopers LLP
Minneapolis, Minnesota
May 22, 2018
We have served as auditors of one or more investment companies within the Columbia Funds Complex since 1977.
Multi-Manager Growth Strategies Fund | Annual Report 2018
| 29 |
Federal Income Tax Information
(Unaudited)
The Fund hereby designates the following tax attributes for the fiscal year ended March 31, 2018. Shareholders will be notified in early 2019 of the amounts for use in preparing 2018 income tax returns.
Qualified
dividend
income | Dividends
received
deduction | Capital
gain
dividend |
| 78.58% | 77.19% | $248,339,159 |
Qualified dividend income. For taxable, non-corporate shareholders, the percentage of ordinary income distributed during the fiscal year that represents qualified dividend income subject to reduced tax rates.
Dividends received deduction. The percentage of ordinary income distributed during the fiscal year that qualifies for the corporate dividends received deduction.
Capital gain dividend. The Fund designates as a capital gain dividend the amount reflected above, or if subsequently determined to be different, the net capital gain of such fiscal period.
| 30 | Multi-Manager Growth Strategies Fund | Annual Report 2018 |
Shareholders elect the Board that oversees the Fund’s operations. The Board appoints officers who are responsible for day-to-day business decisions based on policies set by the Board. The following table provides basic biographical information about the Fund’s Trustees, including their principal occupations during the past five years, although specific titles for individuals may have varied over the period. The year set forth beneath Length of Service in the table below is the year in which the Trustee was first appointed or elected as Trustee to any Fund currently in the Columbia Funds Complex or a predecessor thereof. Under current Board policy, members serve terms of indefinite duration.
Independent trustees
| Name, address, year of birth | Position held with the Trust and length of service | Principal occupation(s) during the past five years and other relevant professional experience | Number of Funds in the Columbia Fund Complex overseen | Other directorships held by Trustee during the past five years |
Janet Langford Carrig
c/o Columbia Management
Investment Advisers, LLC
225 Franklin Street
Mail Drop BX32 05228
Boston, MA 02110
1957 | Trustee
1996 | Senior Vice President, General Counsel and Corporate Secretary, ConocoPhillips (independent energy company) since September 2007 | 71 | None |
Douglas A. Hacker
c/o Columbia Management
Investment Advisers, LLC
225 Franklin Street
Mail Drop BX32 05228
Boston, MA 02110
1955 | Trustee and Chairman of the Board
1996 | Independent business executive since May 2006; Executive Vice President — Strategy of United Airlines from December 2002 to May 2006; President of UAL Loyalty Services (airline marketing company) from September 2001 to December 2002; Executive Vice President and Chief Financial Officer of United Airlines from July 1999 to September 2001 | 71 | Spartan Nash Company, (food distributor); Nash Finch Company (food distributor) from 2005 to 2013; Aircastle Limited (aircraft leasing); SeaCube Container Leasing Ltd. (container leasing) from 2010 to 2013; and Travelport Worldwide Limited (travel information technology) |
Nancy T. Lukitsh
c/o Columbia Management
Investment Advisers, LLC
225 Franklin Street
Mail Drop BX32 05228
Boston, MA 02110
1956 | Trustee
2011 | Senior Vice President, Partner and Director of Marketing, Wellington Management Company, LLP (investment adviser) from 1997 to 2010; Chair, Wellington Management Portfolios (commingled non-U.S. investment pools) from 2007 to 2010; Director, Wellington Trust Company, NA and other Wellington affiliates from 1997 to 2010 | 71 | None |
David M. Moffett
c/o Columbia Management
Investment Advisers, LLC
225 Franklin Street
Mail Drop BX32 05228
Boston, MA 02110
1952 | Trustee
2011 | Retired. Consultant to Bridgewater and Associates | 71 | Director, CSX Corporation; Genworth Financial, Inc. (financial and insurance products and services); PayPal Holdings Inc. (payment and data processing services); Trustee, University of Oklahoma Foundation; former Director, eBay Inc. (online trading community), 2007-2015; and former Director, CIT Bank, CIT Group Inc. (commercial and consumer finance), 2010-2016 |
John J. Neuhauser
c/o Columbia Management
Investment Advisers, LLC
225 Franklin Street
Mail Drop BX32 05228
Boston, MA 02110
1943 | Trustee
1984 | President, Saint Michael’s College since August 2007; Director or Trustee of several non-profit organizations, including University of Vermont Medical Center; Academic Vice President and Dean of Faculties, Boston College from August 1999 to October 2005; University Professor, Boston College from November 2005 to August 2007 | 71 | Liberty All-Star Equity Fund and Liberty All- Star Growth Fund (closed-end funds) |
Multi-Manager Growth Strategies Fund | Annual Report 2018
| 31 |
TRUSTEES AND OFFICERS (continued)
Independent trustees (continued)
| Name, address, year of birth | Position held with the Trust and length of service | Principal occupation(s) during the past five years and other relevant professional experience | Number of Funds in the Columbia Fund Complex overseen | Other directorships held by Trustee during the past five years |
Patrick J. Simpson
c/o Columbia Management
Investment Advisers, LLC
225 Franklin Street
Mail Drop BX32 05228
Boston, MA 02110
1944 | Trustee
2000 | Of Counsel, Perkins Coie LLP (law firm) since 2015; Partner, Perkins Coie LLP from 1988 to 2014 | 71 | None |
Anne-Lee Verville
c/o Columbia Management
Investment Advisers, LLC
225 Franklin Street
Mail Drop BX32 05228
Boston, MA 02110
1945 | Trustee
1998 | Retired. General Manager, Global Education Industry from 1994 to 1997, President – Application Systems Division from 1991 to 1994, Chief Financial Officer – US Marketing & Services from 1988 to 1991, and Chief Information Officer from 1987 to 1988, IBM Corporation (computer and technology) | 71 | Enesco Group, Inc. (producer of giftware and home and garden decor products) from 2001 to 2006 |
Consultants to the Independent Trustees*
| Name, address, year of birth | Position held with the Trust and length of service | Principal occupation(s) during the past five years and other relevant professional experience | Number of Funds in the Columbia Funds complex overseen | Other directorships held by Trustee during the past five years |
J. Kevin Connaughton
c/o Columbia
Management Investment
Advisers, LLC,
225 Franklin Street
Mail Drop BX32 05228,
Boston, MA 02110
1964 | Independent Trustee Consultant
2016 | Independent Trustee Consultant, Columbia Funds since March 2016; Adjunct Professor of Finance, Bentley University since November 2017; Managing Director and General Manager of Mutual Fund Products, Columbia Management Investment Advisers, LLC from May 2010 to February 2015; President, Columbia Funds from 2009 to 2015; and senior officer of Columbia Funds and affiliated funds from 2003 to 2015 | 71 | Director, The Autism Project since March 2015; former Trustee, New Century Portfolios, March 2015-December 2017; formerly on Board of Governors, Gateway Healthcare, January 2016 – December 2017 |
Natalie A. Trunow
c/o Columbia
Management Investment
Advisers, LLC,
225 Franklin Street
Mail Drop BX32 05228,
Boston, MA 02110
1967 | Independent Trustee Consultant
2016 | Independent Trustee Consultant, Columbia Funds since September 2016; Chief Executive Officer, Millennial Portfolio Solutions LLC (asset management and consulting services) since January 2016; Director of Investments, Casey Family Programs from April 2016 to September 2016; Senior Vice President and Chief Investment Officer, Calvert Investments from August 2008 to January 2016; Section Head and Portfolio Manager, General Motors Asset Management from June 1997 to August 2008 | 71 | Director, Health Services for Children with Special Needs, Inc.; Director, Guidewell Financial Solutions |
| * | J. Kevin Connaughton was appointed consultant to the Independent Trustees effective March 1, 2016. Natalie A. Trunow was appointed consultant to the Independent Trustees effective September 1, 2016. Shareholders of the Funds are expected to be asked to elect each of Mr. Connaughton and Ms. Trunow as a Trustee at a future shareholder meeting. |
| 32 | Multi-Manager Growth Strategies Fund | Annual Report 2018 |
TRUSTEES AND OFFICERS (continued)
Interested trustee affiliated with Investment Manager*
| Name, address, year of birth | Position held with the Trust and length of service | Principal occupation(s) during the past five years and other relevant professional experience | Number of Funds in the Columbia Funds Complex overseen | Other directorships held by Trustee during the past five years |
William F. Truscott
c/o Columbia Management
Investment Advisers, LLC
225 Franklin Street
Boston, MA 02110
1960 | Trustee
2012 | Chairman of the Board and President, Columbia Management Investment Advisers, LLC since May 2010 and February 2012, respectively; Chief Executive Officer, Global Asset Management, Ameriprise Financial, Inc. since September 2012 (previously Chief Executive Officer, U.S. Asset Management & President, Annuities, May 2010-September 2012); Director and Chief Executive Officer, Columbia Management Investment Distributors, Inc. since May 2010 and February 2012, respectively; Chairman of the Board and Chief Executive Officer, RiverSource Distributors, Inc. since 2006; Director, Threadneedle Asset Management Holdings, SARL since 2014; President and Chief Executive Officer, Ameriprise Certificate Company, 2006-August 2012 | 196 | Chairman of the Board, Columbia Management Investment Advisers, LLC since May 2010; Director, Columbia Management Investment Distributors, Inc. since May 2010; former Director, Ameriprise Certificate Company, 2006 - January 2013 |
| * | Interested person (as defined under the 1940 Act) by reason of being an officer, director, security holder and/or employee of the Investment Manager or Ameriprise Financial. |
The Statement of Additional Information has additional information about the Fund’s Board members and is available, without charge, upon request by calling 800.345.6611, visiting columbiathreadneedleus.com/investor/ or contacting your financial intermediary.
Multi-Manager Growth Strategies Fund | Annual Report 2018
| 33 |
TRUSTEES AND OFFICERS (continued)
The Board has appointed officers who are responsible for day-to-day business decisions based on policies it has established. The officers serve at the pleasure of the Board. The following table provides basic information about the Officers of the Fund, including principal occupations during the past five years, although their specific titles may have varied over the period. In addition to Mr. Truscott, who is Senior Vice President, the Fund’s other officers are:
Fund officers
Name,
address and
year of birth | Position and year
first appointed to
position for any Fund
in the Columbia
Funds complex or a
predecessor thereof | Principal occupation(s) during past five years |
Christopher O. Petersen
5228 Ameriprise
Financial Center
Minneapolis, MN 55474
Born 1970 | President and Principal Executive Officer (2015) | Vice President and Lead Chief Counsel, Ameriprise Financial, Inc. since January 2015 (previously, Vice President and Chief Counsel, January 2010 - December 2014; officer of Columbia Funds and affiliated funds since 2007. |
Michael G. Clarke
225 Franklin Street
Boston, MA 02110
Born 1969 | Treasurer (2011), Chief Financial Officer (2009) and Chief Accounting Officer (2015) | Vice President — Mutual Fund Administration, Columbia Management Investment Advisers, LLC, since May 2010; senior officer of Columbia Funds and affiliated funds since 2002. |
Paul B. Goucher
100 Park Avenue
New York, NY 10017
Born 1968 | Senior Vice President (2011) and Assistant Secretary (2008) | Senior Vice President and Assistant General Counsel, Ameriprise Financial, Inc. since January 2017 (previously Vice President and Lead Chief Counsel, November 2008 - January 2017 and January 2013 - January 2017, respectively; and Chief Counsel, January 2010 - January 2013); Vice President, Chief Legal Officer and Assistant Secretary, Columbia Management Investment Advisers, LLC since May 2010. |
Thomas P. McGuire
225 Franklin Street
Boston, MA 02110
Born 1972 | Senior Vice President and Chief Compliance Officer (2012) | Vice President — Asset Management Compliance, Ameriprise Financial, Inc., since May 2010; Chief Compliance Officer, Ameriprise Certificate Company since September 2010. |
Colin Moore
225 Franklin Street
Boston, MA 02110
Born 1958 | Senior Vice President (2010) | Executive Vice President and Global Chief Investment Officer, Ameriprise Financial, Inc., since July 2013; Executive Vice President and Global Chief Investment Officer, Columbia Management Investment Advisers, LLC since July 2013 (previously Director and Global Chief Investment Officer, 2010 - 2013). |
Ryan C. Larrenaga
225 Franklin Street
Boston, MA 02110
Born 1970 | Senior Vice President (2017), Chief Legal Officer (2017) and Secretary (2015) | Vice President and Group Counsel, Ameriprise Financial, Inc. since August 2011; officer of Columbia Funds and affiliated funds since 2005. |
Michael E. DeFao
225 Franklin Street
Boston, MA 02110
Born 1968 | Vice President (2011) and Assistant Secretary (2010) | Vice President and Chief Counsel, Ameriprise Financial, Inc. since May 2010. |
Amy Johnson
5228 Ameriprise
Financial Center
Minneapolis, MN 55474
Born 1965 | Vice President (2006) | Managing Director and Global Head of Operations, Columbia Management Investment Advisers, LLC since April 2016 (previously Managing Director and Chief Operating Officer, 2010 - 2016). |
Lyn Kephart-Strong
5228 Ameriprise
Financial Center
Minneapolis, MN 55474
Born 1960 | Vice President (2015) | President, Columbia Management Investment Services Corp. since October 2014; Vice President & Resolution Officer, Ameriprise Trust Company since August 2009. |
| 34 | Multi-Manager Growth Strategies Fund | Annual Report 2018 |
The Fund mails one shareholder report to each shareholder address. If you would like more than one report, please call shareholder services at 800.345.6611 and additional reports will be sent to you.
Proxy voting policies and procedures
The policy of the Board of Trustees is to vote the proxies of the companies in which the Fund holds investments consistent with the procedures as stated in the Statement of Additional Information (SAI). You may obtain a copy of the SAI without charge by calling 800.345.6611; contacting your financial intermediary; visiting columbiathreadneedleus.com/investor/; or searching the website of the Securities and Exchange Commission (SEC) at sec.gov. Information regarding how the Fund voted proxies relating to portfolio securities is filed with the SEC by August 31st for the most recent 12-month period ending June 30th of that year, and is available without charge by visiting columbiathreadneedleus.com/investor/, or searching the website of the SEC at sec.gov.
Quarterly schedule of investments
The Fund files a complete schedule of portfolio holdings with the SEC for the first and third quarters of each fiscal year on Form N-Q. The Fund’s Form N-Q is available on the SEC’s website at sec.gov and may be reviewed and copied at the SEC’s Public Reference Room in Washington, D.C. Information on the operation of the Public Reference Room may be obtained by calling 800.SEC.0330. The Fund’s complete schedule of portfolio holdings, as filed on Form N-Q, can also be obtained without charge, upon request, by calling 800.345.6611.
Additional Fund information
For more information about the Fund, please visit columbiathreadneedleus.com/investor/ or call 800.345.6611. Customer Service Representatives are available to answer your questions Monday through Friday from 8 a.m. to 7 p.m. Eastern time.
Fund investment manager
Columbia Management Investment Advisers, LLC
225 Franklin Street
Boston, MA 02110
Fund distributor
Columbia Management Investment Distributors, Inc.
225 Franklin Street
Boston, MA 02110
Fund transfer agent
Columbia Management Investment Services Corp.
P.O. Box 8081
Boston, MA 02266-8081
Multi-Manager Growth Strategies Fund | Annual Report 2018
| 35 |
[THIS PAGE INTENTIONALLY LEFT BLANK]
[THIS PAGE INTENTIONALLY LEFT BLANK]
Multi-Manager Growth Strategies Fund
P.O. Box 8081
Boston, MA 02266-8081
Please read and consider the investment objectives, risks, charges and expenses for any fund carefully before investing. For a prospectus and summary prospectus, which contains this and other important information about the Fund, go to
columbiathreadneedleus.com/investor/. The Fund is distributed by Columbia Management Investment Distributors, Inc., member FINRA, and managed by Columbia Management Investment Advisers, LLC.
Columbia Threadneedle Investments (Columbia Threadneedle) is the global brand name of the Columbia and Threadneedle group of companies. All rights reserved. Columbia Management Investment Distributors, Inc., 225 Franklin Street, Boston, MA 02110-2804
© 2018 Columbia Management Investment Advisers, LLC.
columbiathreadneedleus .com/investor/

Annual Report
March 31, 2018
Columbia Pacific/Asia Fund
Not FDIC Insured • No bank guarantee • May lose value
Dear Shareholders,
The year 2017 was an extraordinary year in the financial markets. The S&P 500 Index didn’t experience a single down month and returned over 20%. Continuing this trend, January 2018 marked the fastest start for the index ever. Low volatility, which had been a feature of the U.S. equity market for several years, along with the surge in the S&P 500 Index, drove investor sentiment to very high levels. This arguably set the stage for an overdue correction, which we witnessed in February 2018.
A return to volatility
There have been few periods of market upheaval such as were experienced in the first part of 2018. While investors were taken by surprise by the sudden and pronounced market swings, the return to some level of volatility actually marked a resumption of relatively normal market conditions. Having said that, it’s important to distinguish between a good technical correction where excess enthusiasm in the marketplace is being let out, versus a real change in the underlying fundamentals – things like an underperforming economy or weaker corporate earnings. Our view is that the recent market volatility falls into the former category, and the fundamentals remain strong. We’re continuing to see improvements in global economic activity, and we’re seeing corporate earnings expectations continue to rise – and not just because of tax reform.
Consistency is more important than ever
It’s important to keep in mind that when it comes to long-term investing, it’s the destination, not the journey that matters most. If you have a financial goal that you’ve worked out with your financial advisor, and you have a good asset allocation plan to reach it, it’s a question of sticking with your plan rather than become focused on near-term volatility. Bouts of volatility are normal. After all, it’s hard to cross the ocean without hitting an occasional rough patch. You need to focus on the destination.
One final thought. In weathering volatility, it’s the consistency of the return that is essential. Investors who chase higher returns are usually the first to sell when an investment goes through a bad patch, and they therefore don’t tend to benefit from the recovery. More disciplined investors who perhaps panic less or not at all during periods of volatility, tend to have improved long-term results and are more likely to reach their financial goals. Nothing is more important to us than making sure those who have entrusted us to protect and grow their assets are able to do what matters most to them.
Your success is our priority. Talk to your financial advisor about how working with Columbia Threadneedle Investments may help you position your portfolio for consistent, sustainable outcomes, no matter the market conditions.
Sincerely,
Christopher O. Petersen
President, Columbia Funds
The S&P 500 Index, an unmanaged index, measures the performance of 500 widely held, large-capitalization U.S. stocks and is frequently used as a general measure of market performance. Past performance is no guarantee of future results.
Columbia Funds are distributed by Columbia Management Investment Distributors, Inc., member FINRA, and managed by Columbia Management Investment Advisers, LLC.
© 2018 Columbia Management Investment Advisers, LLC. All rights reserved.
Columbia Pacific/Asia Fund | Annual Report 2018
Columbia Pacific/Asia Fund | Annual Report 2018
Investment objective
Columbia Pacific/Asia Fund (the Fund) seeks long-term capital appreciation.
Portfolio management
Daisuke Nomoto, CMA (SAAJ)
Lead Portfolio Manager
Managed Fund since 2008
Jasmine (Weili) Huang, CFA, CPA (U.S. and China), CFM
Co-Portfolio Manager
Managed Fund since 2008
Christine Seng, CFA
Co-Portfolio Manager
Managed Fund since 2014
Morningstar style boxTM
The Morningstar Style Box is based on a fund’s portfolio holdings. For equity funds, the vertical axis shows the market capitalization of the stocks owned, and the horizontal axis shows investment style (value, blend, or growth). Information shown is based on the most recent data provided by Morningstar.
© 2018 Morningstar, Inc. All rights reserved. The Morningstar information contained herein: (1) is proprietary to Morningstar and/or its content providers; (2) may not be copied or distributed; and (3) is not warranted to be accurate, complete or timely. Neither Morningstar nor its content providers are responsible for any damages or losses arising from any use of this information.
| Average annual total returns (%) (for the period ended March 31, 2018) |
| | | Inception | 1 Year | 5 Years | 10 Years |
| Class A | Excluding sales charges | 03/31/08 | 28.38 | 9.29 | 6.22 |
| | Including sales charges | | 20.98 | 8.01 | 5.60 |
| Advisor Class* | 03/19/13 | 28.58 | 9.53 | 6.51 |
| Class C | Excluding sales charges | 03/31/08 | 27.27 | 8.46 | 5.45 |
| | Including sales charges | | 26.27 | 8.46 | 5.45 |
| Institutional Class | 12/31/92 | 28.76 | 9.58 | 6.52 |
| Institutional 3 Class* | 03/01/17 | 28.82 | 9.62 | 6.54 |
| Class T* | Excluding sales charges | 06/18/12 | 28.33 | 9.31 | 6.27 |
| | Including sales charges | | 25.14 | 8.76 | 6.00 |
| MSCI AC Asia Pacific Index (Net) | | 20.30 | 7.52 | 4.69 |
| MSCI EAFE Index (Net) | | 14.80 | 6.50 | 2.74 |
Returns for Class A shares are shown with and without the maximum initial sales charge of 5.75%. Returns for Class C shares are shown with and without the 1.00% contingent deferred sales charge for the first year only. The returns for Class T shares are shown with and without the maximum initial sales charge of 2.50% per transaction. The Fund’s other share classes are not subject to sales charges and have limited eligibility. Effective November 1, 2017, Class R4, Class Y and Class Z shares were renamed Advisor Class, Institutional 3 Class and Institutional Class shares, respectively. Please see the Fund’s prospectus for details. Performance for different share classes will vary based on differences in sales charges and fees associated with each share class. All results shown assume reinvestment of distributions during the period. Returns do not reflect the deduction of taxes that a shareholder may pay on Fund distributions or on the redemption of Fund shares. Performance results reflect the effect of any fee waivers or reimbursements of Fund expenses by Columbia Management Investment Advisers, LLC and/or any of its affiliates. Absent these fee waivers or expense reimbursement arrangements, performance results would have been lower.
The performance information shown represents past performance and is not a guarantee of future results. The investment return and principal value of your investment will fluctuate so that your shares, when redeemed, may be worth more or less than their original cost. Current performance may be lower or higher than the performance information shown. You may obtain performance information current to the most recent month-end by contacting your financial intermediary, visiting columbiathreadneedleus.com/investor/ or calling 800.345.6611.
| * | The returns shown for periods prior to the share class inception date (including returns for the Life of the Fund, if shown, which are since Fund inception) include the returns of the Fund’s oldest share class. These returns are adjusted to reflect any higher class-related operating expenses of the newer share classes, as applicable. Please visit columbiathreadneedleus.com/investor/investment-products/mutual-funds/appended-performance for more information. |
The MSCI AC Asia Pacific Index (Net) is a free float-adjusted market capitalization weighted index that is designed to measure the equity market performance in 13 developed and emerging markets in the Asia Pacific region.
The MSCI EAFE Index (Net) is a free float-adjusted market capitalization index that is designed to measure the equity market performance of developed markets, excluding the U.S. and Canada. The index is compiled from a composite of securities markets of Europe, Australasia and the Far East and is widely recognized by investors in foreign markets as the measurement index for portfolios of non-North American securities.
Indices are not available for investment, are not professionally managed and do not reflect sales charges, fees, brokerage commissions, taxes (except the MSCI AC Asia Pacific Index (Net) and the MSCI EAFE Index (Net), which reflect reinvested dividends net of withholding taxes) or other expenses of investing. Securities in the Fund may not match those in an index.
| 2 | Columbia Pacific/Asia Fund | Annual Report 2018 |
Fund at a Glance (continued)
Performance of a hypothetical $10,000 investment (March 31, 2008 — March 31, 2018)
The chart above shows the change in value of a hypothetical $10,000 investment in Class A shares of Columbia Pacific/Asia Fund during the stated time period, and does not reflect the deduction of taxes that a shareholder may pay on Fund distributions or on the redemption of Fund shares.
| Top 10 holdings (%) (at March 31, 2018) |
| Tencent Holdings Ltd. (China) | 5.2 |
| Samsung Electronics Co., Ltd. (South Korea) | 4.3 |
| Alibaba Group Holding Ltd., ADR (China) | 3.9 |
| Taiwan Semiconductor Manufacturing Co., Ltd., ADR (Taiwan) | 3.9 |
| DBS Group Holdings Ltd. (Singapore) | 2.8 |
| China Construction Bank Corp., Class H (China) | 2.8 |
| Keyence Corp. (Japan) | 2.5 |
| Ping An Insurance Group Co. of China Ltd., Class H (China) | 2.3 |
| Mitsubishi UFJ Financial Group, Inc. (Japan) | 2.3 |
| Rio Tinto PLC, ADR (United Kingdom) | 2.2 |
Percentages indicated are based upon total investments (excluding Money Market Funds).
For further detail about these holdings, please refer to the section entitled “Portfolio of Investments.”
Fund holdings are as of the date given, are subject to change at any time, and are not recommendations to buy or sell any security.
| Equity sector breakdown (%) (at March 31, 2018) |
| Consumer Discretionary | 9.2 |
| Consumer Staples | 3.1 |
| Financials | 25.6 |
| Health Care | 7.8 |
| Industrials | 14.1 |
| Information Technology | 26.5 |
| Materials | 4.2 |
| Real Estate | 4.5 |
| Telecommunication Services | 2.6 |
| Utilities | 2.4 |
| Total | 100.0 |
Percentages indicated are based upon total equity investments. The Fund’s portfolio composition is subject to change.
Columbia Pacific/Asia Fund | Annual Report 2018
| 3 |
Fund at a Glance (continued)
| Country breakdown (%) (at March 31, 2018) |
| Australia | 5.4 |
| China | 22.4 |
| Hong Kong | 4.6 |
| India | 7.0 |
| Indonesia | 1.8 |
| Japan | 41.5 |
| Singapore | 3.5 |
| South Korea | 4.1 |
| Taiwan | 3.8 |
| Thailand | 0.7 |
| United Kingdom | 2.2 |
| United States(a) | 3.0 |
| Total | 100.0 |
| (a) | Includes investments in Money Market Funds. |
Country breakdown is based primarily on issuer’s place of organization/incorporation. Percentages indicated are based upon total investments. The Fund’s portfolio composition is subject to change.
| 4 | Columbia Pacific/Asia Fund | Annual Report 2018 |
Manager Discussion of Fund Performance
For the 12-month period that ended March 31, 2018, the Fund’s Class A shares returned 28.38% excluding sales charges. The Fund outperformed its benchmark, the MSCI AC Asia Pacific Index (Net), which returned 20.30%, and the broader MSCI EAFE Index (Net), which returned 14.80% for the same 12-month period. Individual stock selection drove the Fund’s performance advantage over its benchmark, aided by sector and country allocation to a lesser extent. Stock selection was strongest in the industrials, financials and real estate sectors and in Japan and China. Stock selection was weakest in energy and materials and in Taiwan.
Rally continued for Asia Pacific equity markets
Asia Pacific equity markets got off to a strong start, propelled by global trade resilience for export-oriented countries and strong domestic demand in many markets. Even though risks regarding North Korea pressured Japan’s equity market, its strong economic fundamentals, coupled with an accommodative monetary policy, helped support share prices. Growth in China remained robust, driven by the information technology sector, especially internet/e-commerce stocks. MSCI’s announcement that it would include onshore domestic equity market A-share stocks in its emerging market index further propelled positive sentiment in China’s onshore and offshore equity markets. Continued efforts by China’s central government to pursue supply-side reform in overcapacity industries, reduce shadow bank lending and encourage financial deleveraging also provided a tailwind for equities. However, late in the period, equity market volatility rose because of tensions over trade issues between the United States and China. Elsewhere in the region, Taiwan tech stocks marginally outperformed the benchmark, despite a slow start for new iPhone products. South Korea’s stock market shook off geopolitical tension with North Korea and pushed to new multi-year highs on the back of earnings upgrades in technology and financials. India, Indonesia and Australia were among the weakest markets for the period. Within the information technology sector, software, semiconductor and internet stocks were industry leaders. Defensive sectors, including utilities and telecommunication services, were relatively lackluster performers. That said, all benchmark components, both by country and by sector, posted positive returns in U.S. dollars for the 12-month period.
Contributors and detractors
The Fund’s performance advantage over its benchmark was driven primarily by individual stock selection, with contributions from sector and country allocation. Stock selection was strongest in the industrials, financials and real estate sectors, and from a country perspective, in Japan and China. Notable contributors included Ping An Insurance, Katitas and Tencent Holdings, the latter in a repeat performance from the previous 12-month period. Ping An is a financial conglomerate with leading positions in China’s life and property and casualty insurance industries. Ping An’s innovation and technology leadership continued to drive strong business growth. Katitas, a newly-listed Japan-based company purchases, renovates and resells detached houses to low-to-middle income buyers. Katitas shares rose given its unique value proposition relative to its peers, an attractive demand/supply trade-off and its solid management team. Tencent Holdings, a Chinese multinational conglomerate that specializes in internet-related services and products, entertainment, artificial intelligence and technology, was once again a top contributor. Despite a sell-off triggered by tariff threats between the United States and China, Tencent shares rose for the period because of a successful launch of certain mobile games to drive revenue and profitability growth. Younger consumers have become a powerful driving force for China’s online economy, which has increased demand for Tencent products and services.
Stock selection was weakest in energy and materials as well as in Taiwan. Notable detractors included Subaru (formerly Fuji Heavy Industries), Largan Precision and Elite Material. Subaru, a Japanese automobile manufacturer, sold off mainly on investor concerns about the Trump Administration’s trade policies and the issue of uncertified workers carrying out vehicle inspections. Largan Precision, a manufacturer of optical lenses modules and optoelectronic components in Taiwan, declined on softer-than-expected demand because of destocking cycles from Chinese smartphone makers and sluggish sales from Apple. Taiwan-based Elite Material supplies materials for iPhones. The stock suffered from sluggish business momentum from Apple.
Currency impact
We typically used currency forward contracts, which are a type of derivative, to keep the Fund’s currency positioning consistent with its benchmark, the MSCI AC Asia Pacific Index (Net). We followed this strategy in many currencies, except when the cost of hedging was particularly high. Overall, currency positioning had a slightly negative effect on results.
Columbia Pacific/Asia Fund | Annual Report 2018
| 5 |
Manager Discussion of Fund Performance (continued)
Portfolio activity and positioning
During the period, we maintained the Fund’s overweight in Japan, where monetary policy is still accommodative and stock valuations are relatively attractive, and also in China and India. In China, the Fund’s holdings were heavily geared towards “new China” sectors, such as internet and health care. There was no exposure to leveraged companies and very limited exposure to cyclical stocks in China. From a sector perspective, the Fund remained overweight in the information technology sector, with an emphasis on asset-light businesses in the internet, software and service areas.
We maintained an underweight in Korea, Taiwan and Australia. In fact, we decreased exposure to Taiwan, particularly in information technology, by selling Largan Precision. We also decreased exposure to South Korea, selling off Lotte Chemical. We eliminated positions in China Mobile, Mitsui Chemicals, Security Bank and others. Positions we initiated included Nintendo, Amano, Hangzhou Hikvision and HDFC Standard Life Insurance.
Market risk may affect a single issuer, sector of the economy, industry or the market as a whole. International investing involves certain risks and volatility due to potential political, economic or currency instabilities and different financial and accounting standards. Risks are enhanced for emerging market issuers. Concentration in the Asia Pacific region, where issuers tend to be less developed than U.S. issuers, presents increased risk of loss than a fund that does not concentrate its investments. Investments in small- and mid-cap companies involve risks and volatility greater than investments in larger, more established companies. The Fund may invest significantly in issuers within a particular sector that may be negatively affected by similar market or other conditions, making the Fund more vulnerable to unfavorable developments in the sector. Investing in derivatives is a specialized activity that involves special risks that subject the Fund to significant loss potential, including when used as leverage, and may result in greater fluctuation in Fund value. See the Fund’s prospectus for more information on these and other risks.
The views expressed in this report reflect the current views of the respective parties. These views are not guarantees of future performance and involve certain risks, uncertainties and assumptions that are difficult to predict, so actual outcomes and results may differ significantly from the views expressed. These views are subject to change at any time based upon economic, market or other conditions and the respective parties disclaim any responsibility to update such views. These views may not be relied on as investment advice and, because investment decisions for a Columbia fund are based on numerous factors, may not be relied on as an indication of trading intent on behalf of any particular Columbia fund. References to specific securities should not be construed as a recommendation or investment advice.
| 6 | Columbia Pacific/Asia Fund | Annual Report 2018 |
Understanding Your Fund’s Expenses
(Unaudited)
As an investor, you incur two types of costs. There are transaction costs, which generally include sales charges on purchases and may include redemption fees. There are also ongoing costs, which generally include management fees, distribution and/or service fees, and other fund expenses. The following information is intended to help you understand your ongoing costs (in dollars) of investing in the Fund and to help you compare these costs with the ongoing costs of investing in other mutual funds.
Analyzing your Fund’s expenses
To illustrate these ongoing costs, we have provided examples and calculated the expenses paid by investors in each share class of the Fund during the period. The actual and hypothetical information in the table is based on an initial investment of $1,000 at the beginning of the period indicated and held for the entire period. Expense information is calculated two ways and each method provides you with different information. The amount listed in the “Actual” column is calculated using the Fund’s actual operating expenses and total return for the period. You may use the Actual information, together with the amount invested, to estimate the expenses that you paid over the period. Simply divide your account value by $1,000 (for example, an $8,600 account value divided by $1,000 = 8.6), then multiply the results by the expenses paid during the period under the “Actual” column. The amount listed in the “Hypothetical” column assumes a 5% annual rate of return before expenses (which is not the Fund’s actual return) and then applies the Fund’s actual expense ratio for the period to the hypothetical return. You should not use the hypothetical account values and expenses to estimate either your actual account balance at the end of the period or the expenses you paid during the period. See “Compare with other funds” below for details on how to use the hypothetical data.
Compare with other funds
Since all mutual funds are required to include the same hypothetical calculations about expenses in shareholder reports, you can use this information to compare the ongoing cost of investing in the Fund with other funds. To do so, compare the hypothetical example with the 5% hypothetical examples that appear in the shareholder reports of other funds. As you compare hypothetical examples of other funds, it is important to note that hypothetical examples are meant to highlight the ongoing costs of investing in a fund only and do not reflect any transaction costs, such as sales charges, or redemption or exchange fees. Therefore, the hypothetical calculations are useful in comparing ongoing costs only, and will not help you determine the relative total costs of owning different funds. If transaction costs were included in these calculations, your costs would be higher.
| October 1, 2017 — March 31, 2018 |
| | Account value at the
beginning of the
period ($) | Account value at the
end of the
period ($) | Expenses paid during
the period ($) | Fund’s annualized
expense ratio (%) |
| | Actual | Hypothetical | Actual | Hypothetical | Actual | Hypothetical | Actual |
| Class A | 1,000.00 | 1,000.00 | 1,095.80 | 1,017.11 | 8.05 | 7.75 | 1.55 |
| Advisor Class | 1,000.00 | 1,000.00 | 1,096.60 | 1,018.35 | 6.76 | 6.51 | 1.30 |
| Class C | 1,000.00 | 1,000.00 | 1,091.20 | 1,013.39 | 11.93 | 11.48 | 2.30 |
| Institutional Class | 1,000.00 | 1,000.00 | 1,097.80 | 1,018.35 | 6.76 | 6.51 | 1.30 |
| Institutional 3 Class | 1,000.00 | 1,000.00 | 1,097.70 | 1,019.29 | 5.77 | 5.56 | 1.11 |
| Class T | 1,000.00 | 1,000.00 | 1,095.30 | 1,017.11 | 8.05 | 7.75 | 1.55 |
Expenses paid during the period are equal to the annualized expense ratio for each class as indicated above, multiplied by the average account value over the period and then multiplied by the number of days in the Fund’s most recent fiscal half year and divided by 365.
Expenses do not include fees and expenses incurred indirectly by the Fund from its investment in underlying funds, including affiliated and non-affiliated pooled investment vehicles, such as mutual funds and exchange-traded funds.
Had Columbia Management Investment Advisers, LLC and/or certain of its affiliates not waived/reimbursed certain fees and expenses, account value at the end of the period would have been reduced.
Columbia Pacific/Asia Fund | Annual Report 2018
| 7 |
Portfolio of Investments
March 31, 2018
(Percentages represent value of investments compared to net assets)
Investments in securities
| Common Stocks 96.4% |
| Issuer | Shares | Value ($) |
| Australia 5.4% |
| Commonwealth Bank of Australia | 34,496 | 1,929,079 |
| CSL Ltd. | 23,641 | 2,848,234 |
| Macquarie Group Ltd. | 60,221 | 4,801,850 |
| Westpac Banking Corp. | 152,910 | 3,386,870 |
| Total | 12,966,033 |
| China 22.3% |
| Alibaba Group Holding Ltd., ADR(a) | 49,598 | 9,103,217 |
| China Construction Bank Corp., Class H | 6,234,000 | 6,511,439 |
| CSPC Pharmaceutical Group Ltd. | 1,448,000 | 3,903,104 |
| Guangdong Investment Ltd. | 2,200,000 | 3,485,387 |
| Hangzhou Hikvision Digital Technology Co., Ltd., Class A | 202,465 | 1,348,001 |
| Kweichow Moutai Co., Ltd., Class A | 35,072 | 3,869,664 |
| Midea Group Co., Ltd., Class A | 241,900 | 2,148,050 |
| New Oriental Education & Technology Group, Inc., ADR | 34,616 | 3,034,092 |
| Nexteer Automotive Group Ltd. | 1,283,000 | 1,961,194 |
| Ping An Insurance Group Co. of China Ltd., Class H | 527,500 | 5,438,883 |
| Tencent Holdings Ltd. | 223,300 | 11,986,648 |
| Wuxi Biologics Cayman, Inc.(a) | 84,000 | 817,496 |
| Total | 53,607,175 |
| Hong Kong 4.5% |
| AIA Group Ltd. | 342,000 | 2,923,648 |
| BOC Hong Kong Holdings Ltd. | 813,000 | 3,988,399 |
| Link REIT (The) | 462,500 | 3,964,422 |
| Total | 10,876,469 |
| India 6.9% |
| Ceat Ltd. | 42,879 | 998,916 |
| Eicher Motors Ltd. | 5,917 | 2,591,567 |
| HDFC Bank Ltd., ADR | 36,721 | 3,626,933 |
| HDFC Standard Life Insurance Co., Ltd. | 303,467 | 2,133,513 |
| Indraprastha Gas Ltd. | 496,383 | 2,144,883 |
| InterGlobe Aviation Ltd. | 163,520 | 3,251,193 |
| UPL Ltd. | 165,004 | 1,859,880 |
| Total | 16,606,885 |
| Indonesia 1.8% |
| PT Bank Rakyat Indonesia Persero Tbk | 16,283,900 | 4,273,540 |
| Common Stocks (continued) |
| Issuer | Shares | Value ($) |
| Japan 41.2% |
| Amano Corp. | 113,600 | 3,035,984 |
| Asahi Intecc Co., Ltd. | 54,600 | 2,198,741 |
| BayCurrent Consulting, Inc. | 44,600 | 1,439,642 |
| Benefit One, Inc. | 54,900 | 1,523,890 |
| Dai-ichi Life Holdings, Inc. | 172,000 | 3,175,374 |
| Daikin Industries Ltd. | 13,900 | 1,544,195 |
| Digital Arts, Inc. | 13,900 | 530,963 |
| Disco Corp. | 6,200 | 1,325,209 |
| Elecom Co., Ltd. | 71,000 | 1,702,297 |
| Fujitec Co., Ltd. | 16,900 | 225,367 |
| Hoya Corp. | 78,800 | 3,980,395 |
| ITOCHU Corp. | 201,900 | 3,942,537 |
| ITOCHU Techno-Solutions Corp. | 60,200 | 1,243,630 |
| JCU Corp. | 66,000 | 1,568,174 |
| Katitas Co., Ltd. | 87,700 | 2,746,723 |
| Keyence Corp. | 9,200 | 5,746,855 |
| KH Neochem Co., Ltd. | 39,700 | 1,151,074 |
| Koito Manufacturing Co., Ltd. | 37,100 | 2,590,850 |
| Komatsu Ltd. | 18,000 | 602,981 |
| M3, Inc. | 58,300 | 2,678,764 |
| Maeda Kosen Co., Ltd. | 82,100 | 1,339,169 |
| MISUMI Group, Inc. | 48,800 | 1,351,548 |
| Mitsubishi Corp. | 55,000 | 1,480,548 |
| Mitsubishi UFJ Financial Group, Inc. | 796,500 | 5,293,234 |
| Nidec Corp. | 24,800 | 3,816,937 |
| Nihon M&A Center, Inc. | 102,000 | 3,532,603 |
| Nintendo Co., Ltd. | 7,200 | 3,198,768 |
| Nippon Telegraph & Telephone Corp. | 62,100 | 2,897,156 |
| Nittoku Engineering Co., Ltd. | 19,101 | 716,677 |
| Open House Co., Ltd. | 31,000 | 1,904,578 |
| ORIX Corp. | 203,390 | 3,644,946 |
| Otsuka Corp. | 50,900 | 2,595,024 |
| Persol Holdings Co., Ltd. | 64,100 | 1,862,535 |
| Pigeon Corp. | 73,200 | 3,307,312 |
| Rheon Automatic Machinery Co., Ltd. | 55,500 | 1,114,451 |
| Rohm Co., Ltd. | 5,800 | 550,541 |
The accompanying Notes to Financial Statements are an integral part of this statement.
| 8 | Columbia Pacific/Asia Fund | Annual Report 2018 |
Portfolio of Investments (continued)
March 31, 2018
| Common Stocks (continued) |
| Issuer | Shares | Value ($) |
| Round One Corp. | 98,100 | 1,556,892 |
| Seria Co., Ltd. | 20,900 | 1,033,393 |
| Shoei Co., Ltd. | 42,600 | 1,639,988 |
| SoftBank Group Corp. | 41,900 | 3,125,374 |
| Solasto Corp. | 57,000 | 1,544,424 |
| Sony Corp. | 75,800 | 3,729,384 |
| Start Today Co., Ltd. | 50,000 | 1,301,374 |
| Subaru Corp. | 38,300 | 1,267,836 |
| Takuma Co., Ltd. | 217,600 | 2,394,369 |
| Total | 99,152,706 |
| Singapore 3.5% |
| DBS Group Holdings Ltd. | 308,800 | 6,522,582 |
| Mapletree Commercial Trust | 1,582,970 | 1,898,951 |
| Total | 8,421,533 |
| South Korea 4.1% |
| Samsung Electronics Co., Ltd. | 4,231 | 9,885,631 |
| Taiwan 3.8% |
| Taiwan Semiconductor Manufacturing Co., Ltd., ADR | 205,881 | 9,009,353 |
| Common Stocks (continued) |
| Issuer | Shares | Value ($) |
| Thailand 0.7% |
| Kasikornbank PCL, Foreign Registered Shares | 254,800 | 1,740,349 |
| United Kingdom 2.2% |
| Rio Tinto PLC, ADR | 100,545 | 5,181,084 |
Total Common Stocks
(Cost $151,296,596) | 231,720,758 |
|
| Money Market Funds 3.0% |
| | Shares | Value ($) |
| Columbia Short-Term Cash Fund, 1.738%(b),(c) | 7,265,339 | 7,264,612 |
Total Money Market Funds
(Cost $7,264,612) | 7,264,612 |
Total Investments in Securities
(Cost $158,561,208) | 238,985,370 |
| Other Assets & Liabilities, Net | | 1,449,080 |
| Net Assets | $240,434,450 |
Investments in derivatives
| Forward foreign currency exchange contracts |
Currency to
be sold | Currency to
be purchased | Counterparty | Settlement
date | Unrealized
appreciation ($) | Unrealized
depreciation ($) |
| 46,035,000 CNY | 7,248,579 USD | Morgan Stanley | 04/26/2018 | — | (74,183) |
| 408,429,000 JPY | 3,863,784 USD | Morgan Stanley | 04/26/2018 | 19,790 | — |
| 7,257,106 USD | 9,279,000 AUD | Morgan Stanley | 04/26/2018 | — | (130,301) |
| 7,225,508 USD | 7,699,215,000 KRW | Morgan Stanley | 04/26/2018 | 20,123 | — |
| 2,416,465 USD | 70,352,000 TWD | Morgan Stanley | 04/26/2018 | 5,104 | — |
| Total | | | | 45,017 | (204,484) |
Notes to Portfolio of Investments
| (a) | Non-income producing investment. |
| (b) | The rate shown is the seven-day current annualized yield at March 31, 2018. |
| (c) | As defined in the Investment Company Act of 1940, an affiliated company is one in which the Fund owns 5% or more of the company’s outstanding voting securities, or a company which is under common ownership or control with the Fund. Holdings and transactions in these affiliated companies during the year ended March 31, 2018 are as follows: |
| Issuer | Beginning
shares | Shares
purchased | Shares
sold | Ending
shares | Realized gain
(loss) —
affiliated
issuers ($) | Net change in
unrealized
appreciation
(depreciation) —
affiliated
issuers ($) | Dividends —
affiliated
issuers ($) | Value —
affiliated
issuers
at end of
period ($) |
| Columbia Short-Term Cash Fund, 1.738% |
| | 3,261,120 | 93,386,933 | (89,382,714) | 7,265,339 | (296) | (166) | 62,772 | 7,264,612 |
The accompanying Notes to Financial Statements are an integral part of this statement.
Columbia Pacific/Asia Fund | Annual Report 2018
| 9 |
Portfolio of Investments (continued)
March 31, 2018
Abbreviation Legend
| ADR | American Depositary Receipt |
Currency Legend
| AUD | Australian Dollar |
| CNY | China Yuan Renminbi |
| JPY | Japanese Yen |
| KRW | South Korean Won |
| TWD | New Taiwan Dollar |
| USD | US Dollar |
Fair value measurements
The Fund categorizes its fair value measurements according to a three-level hierarchy that maximizes the use of observable inputs and minimizes the use of unobservable inputs by prioritizing that the most observable input be used when available. Observable inputs are those that market participants would use in pricing an investment based on market data obtained from sources independent of the reporting entity. Unobservable inputs are those that reflect the Fund’s assumptions about the information market participants would use in pricing an investment. An investment’s level within the fair value hierarchy is based on the lowest level of any input that is deemed significant to the asset’s or liability’s fair value measurement. The input levels are not necessarily an indication of the risk or liquidity associated with investments at that level. For example, certain U.S. government securities are generally high quality and liquid, however, they are reflected as Level 2 because the inputs used to determine fair value may not always be quoted prices in an active market.
Fair value inputs are summarized in the three broad levels listed below:
| ■ | Level 1 — Valuations based on quoted prices for investments in active markets that the Fund has the ability to access at the measurement date. Valuation adjustments are not applied to Level 1 investments. |
| ■ | Level 2 — Valuations based on other significant observable inputs (including quoted prices for similar securities, interest rates, prepayment speeds, credit risks, etc.). |
| ■ | Level 3 — Valuations based on significant unobservable inputs (including the Fund’s own assumptions and judgment in determining the fair value of investments). |
Inputs that are used in determining fair value of an investment may include price information, credit data, volatility statistics, and other factors. These inputs can be either observable or unobservable. The availability of observable inputs can vary between investments, and is affected by various factors such as the type of investment, and the volume and level of activity for that investment or similar investments in the marketplace. The inputs will be considered by the Investment Manager, along with any other relevant factors in the calculation of an investment’s fair value. The Fund uses prices and inputs that are current as of the measurement date, which may include periods of market dislocations. During these periods, the availability of prices and inputs may be reduced for many investments. This condition could cause an investment to be reclassified between the various levels within the hierarchy.
Foreign equity securities actively traded in markets where there is a significant delay in the local close relative to the New York Stock Exchange are classified as Level 2. The values of these securities may include an adjustment to reflect the impact of significant market movements following the close of local trading, as described in Note 2 to the financial statements – Security valuation.
Certain investments that have been measured at fair value using the net asset value (NAV) per share (or its equivalent) are not categorized in the fair value hierarchy. The fair value amounts presented in the table are intended to reconcile the fair value hierarchy to the amounts presented in the Portfolio of Investments. The Columbia Short-Term Cash Fund seeks to provide shareholders with maximum current income consistent with liquidity and stability of principal. Columbia Short-Term Cash Fund prices its shares with a floating NAV and no longer seeks to maintain a stable NAV.
Investments falling into the Level 3 category are primarily supported by quoted prices from brokers and dealers participating in the market for those investments. However, these may be classified as Level 3 investments due to lack of market transparency and corroboration to support these quoted prices. Additionally, valuation models may be used as the pricing source for any remaining investments classified as Level 3. These models may rely on one or more significant unobservable inputs and/or significant assumptions by the Investment Manager. Inputs used in valuations may include, but are not limited to, financial statement analysis, capital account balances, discount rates and estimated cash flows, and comparable company data.
Under the direction of the Fund’s Board of Trustees (the Board), the Investment Manager’s Valuation Committee (the Committee) is responsible for overseeing the valuation procedures approved by the Board. The Committee consists of voting and non-voting members from various groups within the Investment Manager’s organization, including operations and accounting, trading and investments, compliance, risk management and legal.
The Committee meets at least monthly to review and approve valuation matters, which may include a description of specific valuation determinations, data regarding pricing information received from approved pricing vendors and brokers and the results of Board-approved valuation control policies and procedures (the Policies). The Policies address, among other things, instances when market quotations are or are not readily available, including recommendations of third party pricing vendors and a determination of appropriate pricing methodologies; events that require specific valuation determinations and assessment of fair value techniques; securities with a potential for stale pricing, including those that are illiquid, restricted, or in default; and the effectiveness of third party pricing vendors, including periodic reviews of vendors. The Committee meets more frequently, as needed, to discuss additional valuation matters, which may include the need to review back-testing results, review time-sensitive information or approve related valuation actions. The Committee reports to the Board, with members of the Committee meeting with the Board at each of its regularly scheduled meetings to discuss valuation matters and actions during the period, similar to those described earlier.
For investments categorized as Level 3, the Committee monitors information similar to that described above, which may include: (i) data specific to the issuer or comparable issuers, (ii) general market or specific sector news and (iii) quoted prices and specific or similar security transactions. The Committee considers this data and any changes from prior periods in order to assess the reasonableness of observable and unobservable inputs, any assumptions or internal models used to value those securities and changes in fair value. This data is also used to corroborate, when available, information received from approved pricing vendors and brokers. Various factors impact the frequency of monitoring this information (which may occur as often as daily). However, the Committee may determine that changes to inputs, assumptions and models are not required as a result of the monitoring procedures performed.
The accompanying Notes to Financial Statements are an integral part of this statement.
| 10 | Columbia Pacific/Asia Fund | Annual Report 2018 |
Portfolio of Investments (continued)
March 31, 2018
Fair value measurements (continued)
The following table is a summary of the inputs used to value the Fund’s investments at March 31, 2018:
| | Level 1
quoted prices
in active
markets for
identical
assets ($) | Level 2
other
significant
observable
inputs ($) | Level 3
significant
unobservable
inputs ($) | Investments
measured at
net asset
value ($) | Total ($) |
| Investments in Securities | | | | | |
| Common Stocks | | | | | |
| Australia | — | 12,966,033 | — | — | 12,966,033 |
| China | 12,137,309 | 41,469,866 | — | — | 53,607,175 |
| Hong Kong | — | 10,876,469 | — | — | 10,876,469 |
| India | 3,626,933 | 12,979,952 | — | — | 16,606,885 |
| Indonesia | — | 4,273,540 | — | — | 4,273,540 |
| Japan | — | 99,152,706 | — | — | 99,152,706 |
| Singapore | — | 8,421,533 | — | — | 8,421,533 |
| South Korea | — | 9,885,631 | — | — | 9,885,631 |
| Taiwan | 9,009,353 | — | — | — | 9,009,353 |
| Thailand | — | 1,740,349 | — | — | 1,740,349 |
| United Kingdom | 5,181,084 | — | — | — | 5,181,084 |
| Total Common Stocks | 29,954,679 | 201,766,079 | — | — | 231,720,758 |
| Money Market Funds | — | — | — | 7,264,612 | 7,264,612 |
| Total Investments in Securities | 29,954,679 | 201,766,079 | — | 7,264,612 | 238,985,370 |
| Investments in Derivatives | | | | | |
| Asset | | | | | |
| Forward Foreign Currency Exchange Contracts | — | 45,017 | — | — | 45,017 |
| Liability | | | | | |
| Forward Foreign Currency Exchange Contracts | — | (204,484) | — | — | (204,484) |
| Total | 29,954,679 | 201,606,612 | — | 7,264,612 | 238,825,903 |
See the Portfolio of Investments for all investment classifications not indicated in the table.
The Fund’s assets assigned to the Level 2 input category are generally valued using the market approach, in which a security’s value is determined through reference to prices and information from market transactions for similar or identical assets. These assets include certain foreign securities for which a third party statistical pricing service may be employed for purposes of fair market valuation. The model utilized by such third party statistical pricing service takes into account a security’s correlation to available market data including, but not limited to, intraday index, ADR, and exchange-traded fund movements.
Derivative instruments are valued at unrealized appreciation (depreciation).
There were no transfers of financial assets between levels during the period.
The accompanying Notes to Financial Statements are an integral part of this statement.
Columbia Pacific/Asia Fund | Annual Report 2018
| 11 |
Statement of Assets and Liabilities
March 31, 2018
| Assets | |
| Investments in securities, at value | |
| Unaffiliated issuers (cost $151,296,596) | $231,720,758 |
| Affiliated issuers (cost $7,264,612) | 7,264,612 |
| Unrealized appreciation on forward foreign currency exchange contracts | 45,017 |
| Receivable for: | |
| Investments sold | 1,373,974 |
| Capital shares sold | 93,324 |
| Dividends | 1,006,306 |
| Foreign tax reclaims | 54,269 |
| Expense reimbursement due from Investment Manager | 49 |
| Prepaid expenses | 451 |
| Trustees’ deferred compensation plan | 37,239 |
| Total assets | 241,595,999 |
| Liabilities | |
| Unrealized depreciation on forward foreign currency exchange contracts | 204,484 |
| Payable for: | |
| Investments purchased | 751,152 |
| Capital shares purchased | 82,051 |
| Management services fees | 6,147 |
| Distribution and/or service fees | 83 |
| Transfer agent fees | 10,388 |
| Compensation of board members | 752 |
| Compensation of chief compliance officer | 24 |
| Other expenses | 69,229 |
| Trustees’ deferred compensation plan | 37,239 |
| Total liabilities | 1,161,549 |
| Net assets applicable to outstanding capital stock | $240,434,450 |
| Represented by | |
| Paid in capital | 153,149,200 |
| Excess of distributions over net investment income | (2,879,557) |
| Accumulated net realized gain | 9,882,564 |
| Unrealized appreciation (depreciation) on: | |
| Investments - unaffiliated issuers | 80,424,162 |
| Foreign currency translations | 17,548 |
| Forward foreign currency exchange contracts | (159,467) |
| Total - representing net assets applicable to outstanding capital stock | $240,434,450 |
The accompanying Notes to Financial Statements are an integral part of this statement.
| 12 | Columbia Pacific/Asia Fund | Annual Report 2018 |
Statement of Assets and Liabilities (continued)
March 31, 2018
| Class A | |
| Net assets | $6,146,808 |
| Shares outstanding | 531,906 |
| Net asset value per share | $11.56 |
| Maximum sales charge | 5.75% |
| Maximum offering price per share (calculated by dividing the net asset value per share by 1.0 minus the maximum sales charge for Class A shares) | $12.27 |
| Advisor Class | |
| Net assets | $909,152 |
| Shares outstanding | 78,148 |
| Net asset value per share | $11.63 |
| Class C | |
| Net assets | $1,575,832 |
| Shares outstanding | 139,153 |
| Net asset value per share | $11.32 |
| Institutional Class | |
| Net assets | $57,537,591 |
| Shares outstanding | 4,953,520 |
| Net asset value per share | $11.62 |
| Institutional 3 Class | |
| Net assets | $174,261,884 |
| Shares outstanding | 15,166,984 |
| Net asset value per share | $11.49 |
| Class T | |
| Net assets | $3,183 |
| Shares outstanding | 276 |
| Net asset value per share(a) | $11.55 |
| Maximum sales charge | 2.50% |
| Maximum offering price per share (calculated by dividing the net asset value per share by 1.0 minus the maximum sales charge per transaction for Class T shares) | $11.85 |
| (a) | Net asset value per share rounds to this amount due to fractional shares outstanding. |
The accompanying Notes to Financial Statements are an integral part of this statement.
Columbia Pacific/Asia Fund | Annual Report 2018
| 13 |
Statement of Operations
Year Ended March 31, 2018
| Net investment income | |
| Income: | |
| Dividends — unaffiliated issuers | $4,670,918 |
| Dividends — affiliated issuers | 62,772 |
| Foreign taxes withheld | (359,999) |
| Total income | 4,373,691 |
| Expenses: | |
| Management services fees | 2,134,750 |
| Distribution and/or service fees | |
| Class A | 9,528 |
| Class C | 12,041 |
| Class T | 8 |
| Transfer agent fees | |
| Class A | 7,520 |
| Advisor Class | 740 |
| Class C | 2,367 |
| Institutional Class | 101,569 |
| Institutional 3 Class | 14,455 |
| Class T | 5 |
| Compensation of board members | 19,863 |
| Custodian fees | 107,092 |
| Printing and postage fees | 15,719 |
| Registration fees | 87,132 |
| Audit fees | 65,665 |
| Legal fees | 5,898 |
| Compensation of chief compliance officer | 96 |
| Other | 38,132 |
| Total expenses | 2,622,580 |
| Fees waived or expenses reimbursed by Investment Manager and its affiliates | (2,239) |
| Expense reduction | (300) |
| Total net expenses | 2,620,041 |
| Net investment income | 1,753,650 |
| Realized and unrealized gain (loss) — net | |
| Net realized gain (loss) on: | |
| Investments — unaffiliated issuers | 26,722,866 |
| Investments — affiliated issuers | (296) |
| Foreign currency translations | (16,249) |
| Forward foreign currency exchange contracts | (1,526,466) |
| Net realized gain | 25,179,855 |
| Net change in unrealized appreciation (depreciation) on: | |
| Investments — unaffiliated issuers | 28,850,452 |
| Investments — affiliated issuers | (166) |
| Foreign currency translations | 14,023 |
| Forward foreign currency exchange contracts | (67,466) |
| Net change in unrealized appreciation (depreciation) | 28,796,843 |
| Net realized and unrealized gain | 53,976,698 |
| Net increase in net assets resulting from operations | $55,730,348 |
The accompanying Notes to Financial Statements are an integral part of this statement.
| 14 | Columbia Pacific/Asia Fund | Annual Report 2018 |
Statement of Changes in Net Assets
| | Year Ended
March 31, 2018 | Year Ended
March 31, 2017 (a) |
| Operations | | |
| Net investment income | $1,753,650 | $1,889,982 |
| Net realized gain | 25,179,855 | 17,836,353 |
| Net change in unrealized appreciation (depreciation) | 28,796,843 | 6,705,522 |
| Net increase in net assets resulting from operations | 55,730,348 | 26,431,857 |
| Distributions to shareholders | | |
| Net investment income | | |
| Class A | (32,606) | (5,938) |
| Advisor Class | (6,742) | (20) |
| Class C | (719) | (419) |
| Class I | — | (906,768) |
| Institutional Class | (464,736) | (331,750) |
| Institutional 3 Class | (1,895,598) | — |
| Class T | (25) | (6) |
| Net realized gains | | |
| Class A | (310,517) | (134,707) |
| Advisor Class | (43,902) | (322) |
| Class C | (97,336) | (46,349) |
| Class I | — | (7,897,515) |
| Institutional Class | (3,819,203) | (4,046,260) |
| Institutional 3 Class | (12,756,859) | — |
| Class T | (243) | (149) |
| Total distributions to shareholders | (19,428,486) | (13,370,203) |
| Decrease in net assets from capital stock activity | (9,662,201) | (32,702,435) |
| Total increase (decrease) in net assets | 26,639,661 | (19,640,781) |
| Net assets at beginning of year | 213,794,789 | 233,435,570 |
| Net assets at end of year | $240,434,450 | $213,794,789 |
| Excess of distributions over net investment income | $(2,879,557) | $(1,514,377) |
| (a) | Institutional 3 Class shares are based on operations from March 1, 2017 (commencement of operations) through the stated period end. |
The accompanying Notes to Financial Statements are an integral part of this statement.
Columbia Pacific/Asia Fund | Annual Report 2018
| 15 |
Statement of Changes in Net Assets (continued)
| | Year Ended | Year Ended |
| | March 31, 2018 | March 31, 2017 (a) |
| | Shares | Dollars ($) | Shares | Dollars ($) |
| Capital stock activity |
| Class A | | | | |
| Subscriptions | 351,534 | 4,064,615 | 51,603 | 490,688 |
| Distributions reinvested | 30,196 | 336,458 | 15,817 | 140,645 |
| Redemptions | (84,735) | (964,814) | (177,059) | (1,678,515) |
| Net increase (decrease) | 296,995 | 3,436,259 | (109,639) | (1,047,182) |
| Advisor Class | | | | |
| Subscriptions | 77,499 | 915,479 | 1,962 | 18,889 |
| Distributions reinvested | 4,456 | 50,362 | 20 | 177 |
| Redemptions | (6,190) | (68,688) | — | — |
| Net increase | 75,765 | 897,153 | 1,982 | 19,066 |
| Class C | | | | |
| Subscriptions | 82,401 | 934,319 | 2,913 | 27,340 |
| Distributions reinvested | 8,987 | 98,054 | 5,354 | 46,768 |
| Redemptions | (40,973) | (465,436) | (37,532) | (352,300) |
| Net increase (decrease) | 50,415 | 566,937 | (29,265) | (278,192) |
| Class I | | | | |
| Subscriptions | — | — | 286,457 | 2,697,249 |
| Distributions reinvested | — | — | 987,243 | 8,804,120 |
| Redemptions | — | — | (16,932,830) | (165,764,056) |
| Net decrease | — | — | (15,659,130) | (154,262,687) |
| Institutional Class | | | | |
| Subscriptions | 1,560,832 | 18,369,243 | 1,046,837 | 10,012,180 |
| Distributions reinvested | 350,063 | 3,909,975 | 260,972 | 2,328,729 |
| Redemptions | (3,445,416) | (37,171,866) | (3,823,618) | (35,679,701) |
| Net decrease | (1,534,521) | (14,892,648) | (2,515,809) | (23,338,792) |
| Institutional 3 Class | | | | |
| Subscriptions | 2,359,369 | 25,339,405 | 15,124,542 | 146,859,244 |
| Distributions reinvested | 1,214,168 | 13,373,567 | — | — |
| Redemptions | (3,464,303) | (38,382,874) | (66,792) | (653,892) |
| Net increase | 109,234 | 330,098 | 15,057,750 | 146,205,352 |
| Total net decrease | (1,002,112) | (9,662,201) | (3,254,111) | (32,702,435) |
| (a) | Institutional 3 Class shares are based on operations from March 1, 2017 (commencement of operations) through the stated period end. |
The accompanying Notes to Financial Statements are an integral part of this statement.
| 16 | Columbia Pacific/Asia Fund | Annual Report 2018 |
[THIS PAGE INTENTIONALLY LEFT BLANK]
Columbia Pacific/Asia Fund | Annual Report 2018
| 17 |
The following table is intended to help you understand the Fund’s financial performance. Certain information reflects financial results for a single share of a class held for the periods shown. Per share net investment income (loss) amounts are calculated based on average shares outstanding during the period. Total return assumes reinvestment of all dividends and distributions, if any. Total return does not reflect payment of sales charges, if any. Total return and portfolio turnover are not annualized for periods of less than one year. The portfolio turnover rate is calculated without regard to purchase and sales transactions of short-term instruments and certain derivatives, if any. If such transactions were included, the Fund’s portfolio turnover rate may be higher.
| | Net asset value,
beginning of
period | Net
investment
income
(loss) | Net
realized
and
unrealized
gain (loss) | Total from
investment
operations | Distributions
from net
investment
income | Distributions
from net
realized
gains |
| Class A |
| Year Ended 3/31/2018 | $9.80 | 0.04 | 2.69 | 2.73 | (0.09) | (0.88) |
| Year Ended 3/31/2017 | $9.26 | 0.05 | 1.05 | 1.10 | (0.02) | (0.54) |
| Year Ended 3/31/2016 | $9.91 | 0.06 | (0.64) | (0.58) | (0.04) | (0.03) |
| Year Ended 3/31/2015 | $8.92 | 0.10 | 0.98 | 1.08 | (0.09) | — |
| Year Ended 3/31/2014 | $8.93 | 0.11 | 0.08 | 0.19 | (0.20) | — |
| Advisor Class |
| Year Ended 3/31/2018 | $9.86 | 0.05 | 2.71 | 2.76 | (0.11) | (0.88) |
| Year Ended 3/31/2017 | $9.31 | 0.14 | 0.99 | 1.13 | (0.04) | (0.54) |
| Year Ended 3/31/2016 | $9.96 | 0.07 | (0.62) | (0.55) | (0.07) | (0.03) |
| Year Ended 3/31/2015 | $8.96 | 0.12 | 0.98 | 1.10 | (0.10) | — |
| Year Ended 3/31/2014 | $8.98 | 0.12 | 0.09 | 0.21 | (0.23) | — |
| Class C |
| Year Ended 3/31/2018 | $9.63 | (0.04) | 2.62 | 2.58 | (0.01) | (0.88) |
| Year Ended 3/31/2017 | $9.15 | (0.02) | 1.04 | 1.02 | (0.00) (e) | (0.54) |
| Year Ended 3/31/2016 | $9.83 | (0.01) | (0.64) | (0.65) | (0.00) (e) | (0.03) |
| Year Ended 3/31/2015 | $8.86 | 0.03 | 0.97 | 1.00 | (0.03) | — |
| Year Ended 3/31/2014 | $8.87 | 0.03 | 0.09 | 0.12 | (0.13) | — |
| Institutional Class |
| Year Ended 3/31/2018 | $9.84 | 0.07 | 2.70 | 2.77 | (0.11) | (0.88) |
| Year Ended 3/31/2017 | $9.30 | 0.07 | 1.05 | 1.12 | (0.04) | (0.54) |
| Year Ended 3/31/2016 | $9.95 | 0.08 | (0.63) | (0.55) | (0.07) | (0.03) |
| Year Ended 3/31/2015 | $8.95 | 0.12 | 0.99 | 1.11 | (0.11) | — |
| Year Ended 3/31/2014 | $8.96 | 0.11 | 0.10 | 0.21 | (0.22) | — |
| Institutional 3 Class |
| Year Ended 3/31/2018 | $9.75 | 0.09 | 2.66 | 2.75 | (0.13) | (0.88) |
| Year Ended 3/31/2017(f) | $9.51 | 0.12 | 0.12 | 0.24 | — | — |
The accompanying Notes to Financial Statements are an integral part of this statement.
| 18 | Columbia Pacific/Asia Fund | Annual Report 2018 |
Total
distributions to
shareholders | Net
asset
value,
end of
period | Total
return | Total gross
expense
ratio to
average
net assets(a) | Total net
expense
ratio to
average
net assets(a),(b) | Net investment
income (loss)
ratio to
average
net assets | Portfolio
turnover | Net
assets,
end of
period
(000’s) |
| |
| (0.97) | $11.56 | 28.38% | 1.55% | 1.54% (c) | 0.40% | 49% | $6,147 |
| (0.56) | $9.80 | 12.50% | 1.49% (d) | 1.49% (c),(d) | 0.48% | 80% | $2,303 |
| (0.07) | $9.26 | (5.88%) | 1.52% | 1.52% (c) | 0.62% | 73% | $3,190 |
| (0.09) | $9.91 | 12.17% | 1.48% | 1.48% (c) | 1.03% | 60% | $2,496 |
| (0.20) | $8.92 | 2.25% | 1.48% | 1.48% (c) | 1.20% | 88% | $1,847 |
| |
| (0.99) | $11.63 | 28.58% | 1.32% | 1.30% (c) | 0.47% | 49% | $909 |
| (0.58) | $9.86 | 12.82% | 1.27% (d) | 1.27% (c),(d) | 1.53% | 80% | $23 |
| (0.10) | $9.31 | (5.61%) | 1.25% | 1.25% (c) | 0.72% | 73% | $4 |
| (0.10) | $9.96 | 12.42% | 1.26% | 1.26% (c) | 1.28% | 60% | $25 |
| (0.23) | $8.96 | 2.41% | 1.25% | 1.25% (c) | 1.29% | 88% | $3 |
| |
| (0.89) | $11.32 | 27.27% | 2.30% | 2.29% (c) | (0.38%) | 49% | $1,576 |
| (0.54) | $9.63 | 11.79% | 2.24% (d) | 2.24% (c),(d) | (0.25%) | 80% | $854 |
| (0.03) | $9.15 | (6.64%) | 2.27% | 2.27% (c) | (0.13%) | 73% | $1,080 |
| (0.03) | $9.83 | 11.36% | 2.23% | 2.23% (c) | 0.33% | 60% | $368 |
| (0.13) | $8.86 | 1.48% | 2.23% | 2.23% (c) | 0.31% | 88% | $554 |
| |
| (0.99) | $11.62 | 28.76% | 1.29% | 1.28% (c) | 0.67% | 49% | $57,538 |
| (0.58) | $9.84 | 12.72% | 1.24% (d) | 1.24% (c),(d) | 0.73% | 80% | $63,870 |
| (0.10) | $9.30 | (5.61%) | 1.27% | 1.27% (c) | 0.81% | 73% | $83,696 |
| (0.11) | $9.95 | 12.51% | 1.23% | 1.23% (c) | 1.28% | 60% | $78,236 |
| (0.22) | $8.95 | 2.49% | 1.23% | 1.23% (c) | 1.27% | 88% | $75,079 |
| |
| (1.01) | $11.49 | 28.82% | 1.11% | 1.11% | 0.83% | 49% | $174,262 |
| — | $9.75 | 2.52% | 1.12% (g) | 1.12% (g) | 15.80% (g) | 80% | $146,742 |
Columbia Pacific/Asia Fund | Annual Report 2018
| 19 |
Financial Highlights (continued)
| | Net asset value,
beginning of
period | Net
investment
income
(loss) | Net
realized
and
unrealized
gain (loss) | Total from
investment
operations | Distributions
from net
investment
income | Distributions
from net
realized
gains |
| Class T |
| Year Ended 3/31/2018 | $9.80 | 0.05 | 2.67 | 2.72 | (0.09) | (0.88) |
| Year Ended 3/31/2017 | $9.25 | 0.05 | 1.06 | 1.11 | (0.02) | (0.54) |
| Year Ended 3/31/2016 | $9.91 | 0.05 | (0.64) | (0.59) | (0.04) | (0.03) |
| Year Ended 3/31/2015 | $8.91 | 0.09 | 0.99 | 1.08 | (0.08) | — |
| Year Ended 3/31/2014 | $8.92 | 0.10 | 0.09 | 0.19 | (0.20) | — |
| Notes to Financial Highlights |
| (a) | In addition to the fees and expenses that the Fund bears directly, the Fund indirectly bears a pro rata share of the fees and expenses of any other funds in which it invests. Such indirect expenses are not included in the Fund’s reported expense ratios. |
| (b) | Total net expenses include the impact of certain fee waivers/expense reimbursements made by the Investment Manager and certain of its affiliates, if applicable. |
| (c) | The benefits derived from expense reductions had an impact of less than 0.01%. |
| (d) | Expenses have been reduced due to a reimbursement of expenses overbilled by a third party. If the reimbursement had been excluded, the expense ratios would have been higher by the percentages shown for each class in the table below. All fee waivers and expense reimbursements by the Investment Manager and its affiliates were applied before giving effect to this third party reimbursement. |
| Year Ended | Class A | Advisor
Class | Class C | Institutional
Class | Class T |
| 03/31/2017 | 0.01 % | 0.01 % | 0.01 % | 0.01 % | 0.01 % |
| (e) | Rounds to zero. |
| (f) | Institutional 3 Class shares commenced operations on March 1, 2017. Per share data and total return reflect activity from that date. |
| (g) | Annualized. |
The accompanying Notes to Financial Statements are an integral part of this statement.
| 20 | Columbia Pacific/Asia Fund | Annual Report 2018 |
Total
distributions to
shareholders | Net
asset
value,
end of
period | Total
return | Total gross
expense
ratio to
average
net assets(a) | Total net
expense
ratio to
average
net assets(a),(b) | Net investment
income (loss)
ratio to
average
net assets | Portfolio
turnover | Net
assets,
end of
period
(000’s) |
| |
| (0.97) | $11.55 | 28.33% | 1.52% | 1.52% (c) | 0.41% | 49% | $3 |
| (0.56) | $9.80 | 12.64% | 1.49% (d) | 1.49% (c),(d) | 0.50% | 80% | $3 |
| (0.07) | $9.25 | (5.96%) | 1.48% | 1.48% (c) | 0.58% | 73% | $3 |
| (0.08) | $9.91 | 12.27% | 1.50% | 1.50% (c) | 1.00% | 60% | $3 |
| (0.20) | $8.91 | 2.25% | 1.47% | 1.47% (c) | 1.07% | 88% | $3 |
Columbia Pacific/Asia Fund | Annual Report 2018
| 21 |
Notes to Financial Statements
March 31, 2018
Note 1. Organization
Columbia Pacific/Asia Fund (the Fund), a series of Columbia Funds Series Trust I (the Trust), is a diversified fund. The Trust is registered under the Investment Company Act of 1940, as amended (the 1940 Act), as an open-end management investment company organized as a Massachusetts business trust.
Fund shares
The Trust may issue an unlimited number of shares (without par value). Although all share classes generally have identical voting, dividend and liquidation rights, each share class votes separately when required by the Trust’s organizational documents or by law. Different share classes pay different distribution amounts to the extent the expenses of such share classes differ, and distributions in liquidation will be proportional to the net asset value of each share class. Each share class has its own expense and sales charge structure. The Fund offers each of the share classes identified below.
Class A shares are subject to a maximum front-end sales charge of 5.75% based on the initial investment amount. Class A shares purchased without an initial sales charge in accounts aggregating $1 million to $50 million at the time of purchase are subject to a contingent deferred sales charge (CDSC) if the shares are sold within 18 months after purchase, charged as follows: 1.00% CDSC if redeemed within 12 months after purchase, and 0.50% CDSC if redeemed more than 12, but less than 18, months after purchase.
Advisor Class shares are not subject to sales charges and are generally available only to omnibus retirement plans and certain investors as described in the Fund’s prospectus. Prior to November 1, 2017, Advisor Class shares were known as Class R4 shares.
Class C shares are subject to a 1.00% CDSC on shares redeemed within 12 months after purchase.
Institutional Class shares are not subject to sales charges and are generally available only to eligible investors, which are subject to different investment minimums as described in the Fund’s prospectus. Prior to November 1, 2017, Institutional Class shares were known as Class Z shares.
Institutional 3 Class shares are not subject to sales charges and are available to institutional and certain other investors as described in the Fund’s prospectus. Prior to November 1, 2017, Institutional 3 Class shares were known as Class Y shares.
Class T shares are subject to a maximum front-end sales charge of 2.50% per transaction and must be purchased through financial intermediaries that, by written agreement with Columbia Management Investment Distributors, Inc., are specifically authorized to sell Class T shares.
Note 2. Summary of significant accounting policies
Basis of preparation
The Fund is an investment company that applies the accounting and reporting guidance in the Financial Accounting Standards Board (FASB) Accounting Standards Codification Topic 946, Financial Services - Investment Companies (ASC 946). The financial statements are prepared in accordance with U.S. generally accepted accounting principles (GAAP), which requires management to make certain estimates and assumptions that affect the reported amounts of assets and liabilities, the disclosure of contingent assets and liabilities at the date of the financial statements and the reported amounts of income and expenses during the reporting period. Actual results could differ from those estimates.
The following is a summary of significant accounting policies followed by the Fund in the preparation of its financial statements.
Security valuation
All equity securities are valued at the close of business of the New York Stock Exchange. Equity securities are valued at the last quoted sales price on the principal exchange or market on which they trade, except for securities traded on the NASDAQ Stock Market, which are valued at the NASDAQ official close price. Unlisted securities or listed securities for which there were no sales during the day are valued at the mean of the latest quoted bid and ask prices on such exchanges or markets.
| 22 | Columbia Pacific/Asia Fund | Annual Report 2018 |
Notes to Financial Statements (continued)
March 31, 2018
Foreign equity securities are valued based on the closing price on the foreign exchange in which such securities are primarily traded. If any foreign equity security closing prices are not readily available, the securities are valued at the mean of the latest quoted bid and ask prices on such exchanges or markets. Foreign currency exchange rates are generally determined at 4:00 p.m. Eastern (U.S.) time. Many securities markets and exchanges outside the U.S. close prior to the close of the New York Stock Exchange; therefore, the closing prices for securities in such markets or on such exchanges may not fully reflect events that occur after such close but before the close of the New York Stock Exchange. In those situations, foreign securities will be fair valued pursuant to a policy adopted by the Board of Trustees, including, if available, utilizing a third party pricing service to determine these fair values. The third party pricing service takes into account multiple factors, including, but not limited to, movements in the U.S. securities markets, certain depositary receipts, futures contracts and foreign exchange rates that have occurred subsequent to the close of the foreign exchange or market, to determine a good faith estimate that reasonably reflects the current market conditions as of the close of the New York Stock Exchange. The fair value of a security is likely to be different from the quoted or published price, if available.
Investments in open-end investment companies, including money market funds, are valued at their latest net asset value.
Forward foreign currency exchange contracts are marked-to-market based upon foreign currency exchange rates provided by a pricing service.
Investments for which market quotations are not readily available, or that have quotations which management believes are not reflective of market value or reliable, are valued at fair value as determined in good faith under procedures approved by and under the general supervision of the Board of Trustees. If a security or class of securities (such as foreign securities) is valued at fair value, such value is likely to be different from the quoted or published price for the security.
The determination of fair value often requires significant judgment. To determine fair value, management may use assumptions including but not limited to future cash flows and estimated risk premiums. Multiple inputs from various sources may be used to determine fair value.
GAAP requires disclosure regarding the inputs and valuation techniques used to measure fair value and any changes in valuation inputs or techniques. In addition, investments shall be disclosed by major category. This information is disclosed following the Fund’s Portfolio of Investments.
Foreign currency transactions and translations
The values of all assets and liabilities denominated in foreign currencies are generally translated into U.S. dollars at exchange rates determined at the close of regular trading on the New York Stock Exchange. Net realized and unrealized gains (losses) on foreign currency transactions and translations include gains (losses) arising from the fluctuation in exchange rates between trade and settlement dates on securities transactions, gains (losses) arising from the disposition of foreign currency and currency gains (losses) between the accrual and payment dates on dividends, interest income and foreign withholding taxes.
For financial statement purposes, the Fund does not distinguish that portion of gains (losses) on investments which is due to changes in foreign exchange rates from that which is due to changes in market prices of the investments. Such fluctuations are included with the net realized and unrealized gains (losses) on investments in the Statement of Operations.
Derivative instruments
The Fund invests in certain derivative instruments, as detailed below, to meet its investment objectives. Derivatives are instruments whose values depend on, or are derived from, in whole or in part, the value of one or more securities, currencies, commodities, indices, or other assets or instruments. Derivatives may be used to increase investment flexibility (including to maintain cash reserves while maintaining desired exposure to certain assets), for risk management (hedging) purposes, to facilitate trading, to reduce transaction costs and to pursue higher investment returns. The Fund may also use derivative instruments to mitigate certain investment risks, such as foreign currency exchange rate risk, interest rate risk and credit risk. Derivatives may involve various risks, including the potential inability of the counterparty to fulfill its obligations under the terms of the contract, the potential for an illiquid secondary market (making it difficult for the Fund to sell or
Columbia Pacific/Asia Fund | Annual Report 2018
| 23 |
Notes to Financial Statements (continued)
March 31, 2018
terminate, including at favorable prices) and the potential for market movements which may expose the Fund to gains or losses in excess of the amount shown in the Statement of Assets and Liabilities. The notional amounts of derivative instruments, if applicable, are not recorded in the financial statements.
A derivative instrument may suffer a marked-to-market loss if the value of the contract decreases due to an unfavorable change in the market rates or values of the underlying instrument. Losses can also occur if the counterparty does not perform its obligations under the contract. The Fund’s risk of loss from counterparty credit risk on over-the-counter derivatives is generally limited to the aggregate unrealized gain netted against any collateral held by the Fund and the amount of any variation margin held by the counterparty, plus any replacement costs or related amounts. With exchange-traded or centrally cleared derivatives, there is reduced counterparty credit risk to the Fund since the clearinghouse or central counterparty (CCP) provides some protection in the case of clearing member default. The clearinghouse or CCP stands between the buyer and the seller of the contract; therefore, additional counterparty credit risk is failure of the clearinghouse or CCP. However, credit risk still exists in exchange-traded or centrally cleared derivatives with respect to initial and variation margin that is held in a broker’s customer account. While brokers are required to segregate customer margin from their own assets, in the event that a broker becomes insolvent or goes into bankruptcy and at that time there is a shortfall in the aggregate amount of margin held by the broker for all its clients, U.S. bankruptcy laws will typically allocate that shortfall on a pro-rata basis across all the broker’s customers (including the Fund), potentially resulting in losses to the Fund.
In order to better define its contractual rights and to secure rights that will help the Fund mitigate its counterparty risk, the Fund may enter into an International Swaps and Derivatives Association, Inc. Master Agreement (ISDA Master Agreement) or similar agreement with its derivatives contract counterparties. An ISDA Master Agreement is an agreement between the Fund and a counterparty that governs over-the-counter derivatives and typically contains, among other things, collateral posting terms and netting provisions in the event of a default and/or termination event. Under an ISDA Master Agreement, the Fund may, under certain circumstances, offset with the counterparty certain derivative instrument’s payables and/or receivables with collateral held and/or posted and create one single net payment. The provisions of the ISDA Master Agreement typically permit a single net payment in the event of default (close-out netting), including the bankruptcy or insolvency of the counterparty. Note, however, that bankruptcy or insolvency laws of a particular jurisdiction may impose restrictions on or prohibitions against the right of offset or netting in bankruptcy, insolvency or other events.
Collateral (margin) requirements differ by type of derivative. Margin requirements are established by the clearinghouse or CCP for exchange-traded and centrally cleared derivatives. Brokers can ask for margin in excess of the minimum in certain circumstances. Collateral terms are contract specific for over-the-counter derivatives. For over-the-counter derivatives traded under an ISDA Master Agreement, the collateral requirements are typically calculated by netting the marked-to-market amount for each transaction under such agreement and comparing that amount to the value of any variation margin currently pledged by the Fund and/or the counterparty. Generally, the amount of collateral due from or to a party has to exceed a minimum transfer amount threshold (e.g., $250,000) before a transfer has to be made. To the extent amounts due to the Fund from its counterparties are not fully collateralized, contractually or otherwise, the Fund bears the risk of loss from counterparty nonperformance. The Fund attempts to mitigate counterparty risk by only entering into agreements with counterparties that it believes have the financial resources to honor their obligations and by monitoring the financial stability of those counterparties.
Certain ISDA Master Agreements allow counterparties of over-the-counter derivatives transactions to terminate derivatives contracts prior to maturity in the event the Fund’s net asset value declines by a stated percentage over a specified time period or if the Fund fails to meet certain terms of the ISDA Master Agreement, which would cause the Fund to accelerate payment of any net liability owed to the counterparty. The Fund also has termination rights if the counterparty fails to meet certain terms of the ISDA Master Agreement. In addition to considering counterparty credit risk, the Fund would consider terminating the derivatives contracts based on whether termination would result in a net liability owed from the counterparty.
For financial reporting purposes, the Fund does not offset derivative assets and derivative liabilities that are subject to netting arrangements in the Statement of Assets and Liabilities.
| 24 | Columbia Pacific/Asia Fund | Annual Report 2018 |
Notes to Financial Statements (continued)
March 31, 2018
Forward foreign currency exchange contracts
Forward foreign currency exchange contracts are over-the-counter agreements between two parties to buy and sell a currency at a set price on a future date. The Fund utilized forward foreign currency exchange contracts to hedge the currency exposure associated with some or all of the Fund’s securities, to shift investment exposure from one currency to another, to shift U.S. dollar exposure to achieve a representative weighted mix of major currencies in its benchmark and to recover an underweight country exposure in its portfolio. These instruments may be used for other purposes in future periods.
The values of forward foreign currency exchange contracts fluctuate daily with changes in foreign currency exchange rates. Changes in the value of these contracts are recorded as unrealized appreciation or depreciation until the contract is exercised or has expired. The Fund will realize a gain or loss when the forward foreign currency exchange contract is closed or expires.
The use of forward foreign currency exchange contracts does not eliminate fluctuations in the prices of the Fund’s portfolio securities. The risks of forward foreign currency exchange contracts include movement in the values of the foreign currencies relative to the U.S. dollar (or other foreign currencies) and the possibility that counterparties will not complete their contractual obligations, which may be in excess of the amount reflected, if any, in the Statement of Assets and Liabilities.
Effects of derivative transactions in the financial statements
The following tables are intended to provide additional information about the effect of derivatives on the financial statements of the Fund, including: the fair value of derivatives by risk category and the location of those fair values in the Statement of Assets and Liabilities; and the impact of derivative transactions over the period in the Statement of Operations, including realized and unrealized gains (losses). The derivative instrument schedules following the Portfolio of Investments present additional information regarding derivative instruments outstanding at the end of the period, if any.
The following table is a summary of the fair value of derivative instruments (not considered to be hedging instruments for accounting disclosure purposes) at March 31, 2018:
| | Asset derivatives | |
Risk exposure
category | Statement
of assets and liabilities
location | Fair value ($) |
| Foreign exchange risk | Unrealized appreciation on forward foreign currency exchange contracts | 45,017 |
| | Liability derivatives | |
Risk exposure
category | Statement
of assets and liabilities
location | Fair value ($) |
| Foreign exchange risk | Unrealized depreciation on forward foreign currency exchange contracts | 204,484 |
Columbia Pacific/Asia Fund | Annual Report 2018
| 25 |
Notes to Financial Statements (continued)
March 31, 2018
The following table indicates the effect of derivative instruments (not considered to be hedging instruments for accounting disclosure purposes) in the Statement of Operations for the year ended March 31, 2018:
| Amount of realized gain (loss) on derivatives recognized in income |
| Risk exposure category | Forward
foreign
currency
exchange
contracts
($) |
| Foreign exchange risk | (1,526,466) |
| |
| Change in unrealized appreciation (depreciation) on derivatives recognized in income |
| Risk exposure category | Forward
foreign
currency
exchange
contracts
($) |
| Foreign exchange risk | (67,466) |
The following table is a summary of the average outstanding volume by derivative instrument for the year ended March 31, 2018:
| Derivative instrument | Average unrealized
appreciation ($)* | Average unrealized
depreciation ($)* |
| Forward foreign currency exchange contracts | 154,844 | (155,608) |
| * | Based on the ending quarterly outstanding amounts for the year ended March 31, 2018. |
Offsetting of assets and liabilities
The following table presents the Fund’s gross and net amount of assets and liabilities available for offset under netting arrangements as well as any related collateral received or pledged by the Fund as of March 31, 2018:
| | Morgan
Stanley ($) |
| Assets | |
| Forward foreign currency exchange contracts | 45,017 |
| Liabilities | |
| Forward foreign currency exchange contracts | 204,484 |
| Total financial and derivative net assets | (159,467) |
| Total collateral received (pledged) (a) | - |
| Net amount (b) | (159,467) |
| (a) | In some instances, the actual collateral received and/or pledged may be more than the amount shown due to overcollateralization. |
| (b) | Represents the net amount due from/(to) counterparties in the event of default. |
Security transactions
Security transactions are accounted for on the trade date. Cost is determined and gains (losses) are based upon the specific identification method for both financial statement and federal income tax purposes.
Income recognition
Corporate actions and dividend income are generally recorded net of any non-reclaimable tax withholdings, on the ex-dividend date or upon receipt of ex-dividend notification in the case of certain foreign securities.
Awards from class action litigation are recorded as a reduction of cost basis if the Fund still owns the applicable securities on the payment date. If the Fund no longer owns the applicable securities, the proceeds are recorded as realized gains.
| 26 | Columbia Pacific/Asia Fund | Annual Report 2018 |
Notes to Financial Statements (continued)
March 31, 2018
Expenses
General expenses of the Trust are allocated to the Fund and other funds of the Trust based upon relative net assets or other expense allocation methodologies determined by the nature of the expense. Expenses directly attributable to the Fund are charged to the Fund. Expenses directly attributable to a specific class of shares are charged to that share class.
Determination of class net asset value
All income, expenses (other than class-specific expenses, which are charged to that share class, as shown in the Statement of Operations) and realized and unrealized gains (losses) are allocated to each class of the Fund on a daily basis, based on the relative net assets of each class, for purposes of determining the net asset value of each class.
Federal income tax status
The Fund intends to qualify each year as a regulated investment company under Subchapter M of the Internal Revenue Code, as amended, and will distribute substantially all of its investment company taxable income and net capital gain, if any, for its tax year, and as such will not be subject to federal income taxes. In addition, the Fund intends to distribute in each calendar year substantially all of its ordinary income, capital gain net income and certain other amounts, if any, such that the Fund should not be subject to federal excise tax. Therefore, no federal income or excise tax provision is recorded.
Foreign taxes
The Fund may be subject to foreign taxes on income, gains on investments or currency repatriation, a portion of which may be recoverable. The Fund will accrue such taxes and recoveries, as applicable, based upon its current interpretation of tax rules and regulations that exist in the markets in which it invests.
Realized gains in certain countries may be subject to foreign taxes at the Fund level, based on statutory rates. The Fund accrues for such foreign taxes on realized and unrealized gains at the appropriate rate for each jurisdiction, as applicable. The amount, if any, is disclosed as a liability on the Statement of Assets and Liabilities.
Distributions to shareholders
Distributions from net investment income, if any, are declared and paid semi-annually. Net realized capital gains, if any, are distributed at least annually. Income distributions and capital gain distributions are determined in accordance with federal income tax regulations, which may differ from GAAP.
Guarantees and indemnifications
Under the Trust’s organizational documents and, in some cases, by contract, its officers and trustees are indemnified against certain liabilities arising out of the performance of their duties to the Trust or its funds. In addition, certain of the Fund’s contracts with its service providers contain general indemnification clauses. The Fund’s maximum exposure under these arrangements is unknown since the amount of any future claims that may be made against the Fund cannot be determined, and the Fund has no historical basis for predicting the likelihood of any such claims.
Recent accounting pronouncement
Accounting Standards Update 2017-08 Premium Amortization on Purchased Callable Debt Securities
In March 2017, the Financial Accounting Standards Board issued Accounting Standards Update (ASU) No. 2017-08 Premium Amortization on Purchased Callable Debt Securities. ASU No. 2017-08 updates the accounting standards to shorten the amortization period for certain purchased callable debt securities, held at a premium, to be amortized to the earliest call date. The update applies to securities with explicit, noncontingent call features that are callable at fixed prices and on preset dates. The standard is effective for annual periods beginning after December 15, 2018 and interim periods within those fiscal years. At this time, management is evaluating the implication of this guidance and the impact it will have on the financial statement amounts and footnote disclosures, if any.
Columbia Pacific/Asia Fund | Annual Report 2018
| 27 |
Notes to Financial Statements (continued)
March 31, 2018
Note 3. Fees and other transactions with affiliates
Management services fees
The Fund has entered into a Management Agreement with Columbia Management Investment Advisers, LLC (the Investment Manager), a wholly-owned subsidiary of Ameriprise Financial, Inc. (Ameriprise Financial). Under the Management Agreement, the Investment Manager provides the Fund with investment research and advice, as well as administrative and accounting services. The management services fee is an annual fee that is equal to a percentage of the Fund’s daily net assets that declines from 0.95% to 0.72% as the Fund’s net assets increase. The effective management services fee rate for the year ended March 31, 2018 was 0.95% of the Fund’s average daily net assets.
Participating Affiliates
The Investment Manager and its investment advisory affiliates (Participating Affiliates) around the world may coordinate in providing services to their clients. From time to time the Investment Manager (or any affiliated investment subadviser to the Fund, as the case may be) may engage its Participating Affiliates to provide a variety of services such as investment research, investment monitoring, trading and discretionary investment management (including portfolio management) to certain accounts managed by the Investment Manager, including the Fund. These Participating Affiliates will provide services to the Investment Manager (or any affiliated investment subadviser to the Fund as the case may be) either pursuant to subadvisory agreements, personnel-sharing agreements or similar inter-company arrangements and the Fund will pay no additional fees and expenses as a result of any such arrangements.
These Participating Affiliates, like the Investment Manager, are direct or indirect subsidiaries of Ameriprise Financial and are registered with appropriate respective regulators in their home jurisdictions and, where required, the Securities and Exchange Commission and the Commodity Futures Trading Commission in the United States.
Pursuant to some of these arrangements, certain employees of these Participating Affiliates may serve as "associated persons" of the Investment Manager and, in this capacity, subject to the oversight and supervision of the Investment Manager and consistent with the investment objectives, policies and limitations set forth in the Fund’s prospectus and Statement of Additional Information (SAI), may provide such services to the Fund on behalf of the Investment Manager.
Compensation of board members
Members of the Board of Trustees who are not officers or employees of the Investment Manager or Ameriprise Financial are compensated for their services to the Fund as disclosed in the Statement of Operations. These members of the Board of Trustees may participate in a Deferred Compensation Plan (the Plan) which may be terminated at any time. Obligations of the Plan will be paid solely out of the Fund’s assets, and all amounts payable under the Plan constitute a general unsecured obligation of the Fund.
Compensation of Chief Compliance Officer
The Board of Trustees has appointed a Chief Compliance Officer to the Fund in accordance with federal securities regulations. As disclosed in the Statement of Operations, a portion of the Chief Compliance Officer’s total compensation is allocated to the Fund, along with other allocations to affiliated funds governed by the Board of Trustees, based on relative net assets.
Transfer agency fees
Under a Transfer and Dividend Disbursing Agent Agreement, Columbia Management Investment Services Corp. (the Transfer Agent), an affiliate of the Investment Manager and a wholly-owned subsidiary of Ameriprise Financial, is responsible for providing transfer agency services to the Fund. The Transfer Agent has contracted with DST Asset Manager Solutions, Inc. (DST) to serve as sub-transfer agent. The Transfer Agent pays the fees of DST for services as sub-transfer agent and DST is not entitled to reimbursement for such fees from the Fund (with the exception of out-of-pocket fees).
| 28 | Columbia Pacific/Asia Fund | Annual Report 2018 |
Notes to Financial Statements (continued)
March 31, 2018
The Fund pays the Transfer Agent a monthly transfer agency fee based on the number or the average value of accounts, depending on the type of account. In addition, the Fund pays the Transfer Agent a fee for shareholder services based on the number of accounts or on a percentage of the average aggregate value of the Fund’s shares maintained in omnibus accounts up to the lesser of the amount charged by the financial intermediary or a cap established by the Board of Trustees from time to time.
The Transfer Agent also receives compensation from the Fund for various shareholder services and reimbursements for certain out-of-pocket fees. Effective August 1, 2017, total transfer agency fees for Institutional 3 Class shares are subject to an annual limitation of not more than 0.02% of the average daily net assets attributable to Institutional 3 Class shares. Prior to August 1, 2017, the limitation was 0.025% for Institutional 3 Class shares.
For the year ended March 31, 2018, the Fund’s effective transfer agency fee rates as a percentage of average daily net assets of each class were as follows:
| | Effective rate (%) |
| Class A | 0.20 |
| Advisor Class | 0.20 |
| Class C | 0.20 |
| Institutional Class | 0.19 |
| Institutional 3 Class | 0.01 |
| Class T | 0.19 |
An annual minimum account balance fee of $20 may apply to certain accounts with a value below the applicable share class’s initial minimum investment requirements to reduce the impact of small accounts on transfer agency fees. These minimum account balance fees are remitted to the Fund and recorded as part of expense reductions in the Statement of Operations. For the year ended March 31, 2018, these minimum account balance fees reduced total expenses of the Fund by $300.
Distribution and service fees
The Fund has entered into an agreement with Columbia Management Investment Distributors, Inc. (the Distributor), an affiliate of the Investment Manager and a wholly-owned subsidiary of Ameriprise Financial, for distribution and shareholder services. The Board of Trustees has approved, and the Fund has adopted, distribution and shareholder service plans (the Plans) applicable to certain share classes, which set the distribution and service fees for the Fund. These fees are calculated daily and are intended to compensate the Distributor and/or eligible selling and/or servicing agents for selling shares of the Fund and providing services to investors.
Under the Plans, the Fund pays a monthly service fee to the Distributor at the maximum annual rate of 0.25% of the average daily net assets attributable to Class A, Class C and Class T shares of the Fund. Also under the Plans, the Fund pays a monthly distribution fee to the Distributor at the maximum annual rates of 0.75% and 0.25% of the average daily net assets attributable to Class C and Class T shares of the Fund, respectively.
Although the Fund may pay a distribution fee up to 0.25% of the Fund’s average daily net assets attributable to Class T shares and a service fee of up to 0.25% of the Fund’s average daily net assets attributable to Class T shares, the aggregate fee shall not exceed 0.25% of the Fund’s average daily net assets attributable to Class T shares.
Sales charges (unaudited)
Sales charges, including front-end charges and CDSCs, received by the Distributor for distributing Fund shares for the year ended March 31, 2018, if any, are listed below:
Columbia Pacific/Asia Fund | Annual Report 2018
| 29 |
Notes to Financial Statements (continued)
March 31, 2018
Expenses waived/reimbursed by the Investment Manager and its affiliates
The Investment Manager and certain of its affiliates have contractually agreed to waive fees and/or reimburse expenses (excluding certain fees and expenses described below) for the period(s) disclosed below, unless sooner terminated at the sole discretion of the Board of Trustees, so that the Fund’s net operating expenses, after giving effect to fees waived/expenses reimbursed and any balance credits and/or overdraft charges from the Fund’s custodian, do not exceed the following annual rate(s) as a percentage of the class’ average daily net assets:
| | August 1, 2017
through
July 31, 2018 | Prior to
August 1, 2017 |
| Class A | 1.55% | 1.72% |
| Advisor Class | 1.30 | 1.47 |
| Class C | 2.30 | 2.47 |
| Institutional Class | 1.30 | 1.47 |
| Institutional 3 Class | 1.19 | 1.34 |
| Class T | 1.55 | 1.72 |
Under the agreement governing these fee waivers and/or expense reimbursement arrangements, the following fees and expenses are excluded from the waiver/reimbursement commitment, and therefore will be paid by the Fund, if applicable: taxes (including foreign transaction taxes), expenses associated with investments in affiliated and non-affiliated pooled investment vehicles (including mutual funds and exchange-traded funds), transaction costs and brokerage commissions, costs related to any securities lending program, dividend expenses associated with securities sold short, inverse floater program fees and expenses, transaction charges and interest on borrowed money, interest, infrequent and/or unusual expenses and any other expenses the exclusion of which is specifically approved by the Board of Trustees. This agreement may be modified or amended only with approval from the Investment Manager, certain of its affiliates and the Fund. Any fees waived and/or expenses reimbursed under the expense reimbursement arrangements described above are not recoverable by the Investment Manager or its affiliates in future periods.
Note 4. Federal tax information
The timing and character of income and capital gain distributions are determined in accordance with income tax regulations, which may differ from GAAP because of temporary or permanent book to tax differences.
At March 31, 2018, these differences were primarily due to differing treatment for deferral/reversal of wash sale losses, passive foreign investment company (PFIC) holdings, derivative investments, trustees’ deferred compensation, foreign currency transactions and distribution reclassifications. To the extent these differences were permanent, reclassifications were made among the components of the Fund’s net assets in the Statement of Assets and Liabilities. Temporary differences do not require reclassifications.
In the Statement of Assets and Liabilities the following reclassifications were made:
Excess of distributions
over net investment
income ($) | Accumulated
net realized
gain ($) | Paid in
capital ($) |
| (718,404) | 718,404 | — |
Net investment income (loss) and net realized gains (losses), as disclosed in the Statement of Operations, and net assets were not affected by this reclassification.
The tax character of distributions paid during the years indicated was as follows:
| Year Ended March 31, 2018 | Year Ended March 31, 2017 |
Ordinary
income ($) | Long-term
capital gains ($) | Total ($) | Ordinary
income ($) | Long-term
capital gains ($) | Total ($) |
| 2,598,759 | 16,829,727 | 19,428,486 | 1,244,901 | 12,125,302 | 13,370,203 |
| 30 | Columbia Pacific/Asia Fund | Annual Report 2018 |
Notes to Financial Statements (continued)
March 31, 2018
Short-term capital gain distributions, if any, are considered ordinary income distributions for tax purposes.
At March 31, 2018, the components of distributable earnings on a tax basis were as follows:
Undistributed
ordinary income ($) | Undistributed
long-term
capital gains ($) | Capital loss
carryforwards ($) | Net unrealized
appreciation ($) |
| 612,114 | 9,832,956 | — | 76,857,770 |
At March 31, 2018, the cost of all investments for federal income tax purposes along with the aggregate gross unrealized appreciation and depreciation based on that cost was:
Federal
tax cost ($) | Gross unrealized
appreciation ($) | Gross unrealized
(depreciation) ($) | Net unrealized
appreciation ($) |
| 161,968,133 | 77,433,414 | (575,644) | 76,857,770 |
Tax cost of investments and unrealized appreciation/(depreciation) may also include timing differences that do not constitute adjustments to tax basis.
The following capital loss carryforwards, determined at March 31, 2018, may be available to reduce taxable income arising from future net realized gains on investments, if any, to the extent permitted by the Internal Revenue Code. Capital loss carryforwards with no expiration are required to be utilized prior to any capital losses which carry an expiration date. As a result of this ordering rule, capital loss carryforwards which carry an expiration date may be more likely to expire unused. In addition, for the year ended March 31, 2018, capital loss carryforwards utilized, expired unused and permanently lost, if any, were as follows:
| 2019 ($) | No expiration
short-term ($) | No expiration
long-term ($) | Total ($) | Utilized ($) | Expired ($) | Permanently
lost ($) |
| — | — | — | — | 1,786,666 | — | — |
Management of the Fund has concluded that there are no significant uncertain tax positions in the Fund that would require recognition in the financial statements. However, management’s conclusion may be subject to review and adjustment at a later date based on factors including, but not limited to, new tax laws, regulations, and administrative interpretations (including relevant court decisions). Generally, the Fund’s federal tax returns for the prior three fiscal years remain subject to examination by the Internal Revenue Service.
Note 5. Portfolio information
The cost of purchases and proceeds from sales of securities, excluding short-term investments and derivatives, if any, aggregated to $108,885,638 and $142,879,464, respectively, for the year ended March 31, 2018. The amount of purchase and sale activity impacts the portfolio turnover rate reported in the Financial Highlights.
Note 6. Affiliated money market fund
The Fund invests in Columbia Short-Term Cash Fund, an affiliated money market fund established for the exclusive use by the Fund and other affiliated funds (the Affiliated MMF). The income earned by the Fund from such investments is included as Dividends - affiliated issuers in the Statement of Operations. As an investing fund, the Fund indirectly bears its proportionate share of the expenses of the Affiliated MMF. The Affiliated MMF prices its shares with a floating net asset value. In addition, the Board of Trustees of the Affiliated MMF may impose a fee on redemptions (sometimes referred to as a liquidity fee) or temporarily suspend redemptions (sometimes referred to as imposing a redemption gate) in the event its liquidity falls below regulatory limits.
Note 7. Line of credit
The Fund has access to a revolving credit facility with a syndicate of banks led by Citibank, N.A., HSBC Bank USA, N.A. and JPMorgan Chase Bank, N.A. whereby the Fund may borrow for the temporary funding of shareholder redemptions or for other temporary or emergency purposes. The credit facility, which is a collective agreement between the Fund and certain other
Columbia Pacific/Asia Fund | Annual Report 2018
| 31 |
Notes to Financial Statements (continued)
March 31, 2018
funds managed by the Investment Manager, severally and not jointly, permits collective borrowings up to $1 billion. Interest is charged to each participating fund based on its borrowings at a rate equal to the higher of (i) the overnight federal funds rate plus 1.00% or (ii) the one-month LIBOR rate plus 1.00%. Each borrowing under the credit facility matures no later than 60 days after the date of borrowing. The Fund also pays a commitment fee equal to its pro rata share of the amount of the credit facility at a rate of 0.15% per annum. The commitment fee is included in other expenses in the Statement of Operations.
The Fund had no borrowings during the year ended March 31, 2018.
Note 8. Significant risks
Asia Pacific region risk
Because the Fund concentrates its investments in the Asia Pacific region, the Fund may be particularly susceptible to economic, political or regulatory events affecting companies and countries within the Asia Pacific region. Many of the countries in the Asia Pacific region are considered underdeveloped or developing, including from a political economic and/or social perspective, and may have relatively unstable governments and economies based on limited business, industries and/or natural resources or commodities. Events in any one country within the region may impact other countries in the region or the region as a whole. As a result, events in the region will generally have a greater effect on the Fund than if the Fund were more geographically diversified. This could result in increased volatility in the value of the Fund’s investments and losses for the Fund. Also, securities of some companies in the region can be less liquid than U.S. or other foreign securities, potentially making it difficult for the Fund to sell such securities at a desirable time and place.
Financial sector risk
The Fund may be more susceptible to the particular risks that may affect companies in the financial services sector than if it were invested in a wider variety of companies in unrelated sectors. Companies in the financial services sector are subject to certain risks, including the risk of regulatory change, decreased liquidity in credit markets and unstable interest rates. Such companies may have concentrated portfolios, such as a high level of loans to real estate developers, which makes them vulnerable to economic conditions that affect that industry. Performance of such companies may be affected by competitive pressures and exposure to investments or agreements that, under certain circumstances, may lead to losses (e.g., subprime loans). Companies in the financial services sector are subject to extensive governmental regulation that may limit the amount and types of loans and other financial commitments they can make, and interest rates and fees that they may charge. In addition, profitability of such companies is largely dependent upon the availability and the cost of capital.
Foreign securities and emerging market countries risk
Investing in foreign securities may include certain risks and considerations not typically associated with investing in U.S. securities, such as fluctuating currency values and changing local and regional economic, political and social conditions, which may result in greater market volatility. In addition, certain foreign securities may not be as liquid as U.S. securities. Investing in emerging markets may accentuate these risks. These countries are also more likely to experience high levels of inflation, deflation or currency devaluation which could hurt their economies and securities markets. To the extent that the Fund concentrates its investment exposure to any one or a few specific countries, the Fund will be particularly susceptible to the various conditions, events or other factors impacting those countries and may, therefore, have a greater risk than that of a fund which is more geographically diversified.
Shareholder concentration risk
At March 31, 2018, affiliated shareholders of record owned 82.3% of the outstanding shares of the Fund in one or more accounts. Subscription and redemption activity by concentrated accounts may have a significant effect on the operations of the Fund. In the case of a large redemption, the Fund may be forced to sell investments at inopportune times, including its liquid positions, which may result in Fund losses and the Fund holding a higher percentage of less liquid positions. Large redemptions could result in decreased economies of scale and increased operating expenses for non-redeeming Fund shareholders.
| 32 | Columbia Pacific/Asia Fund | Annual Report 2018 |
Notes to Financial Statements (continued)
March 31, 2018
Technology and technology-related investment risk
The Fund may be more susceptible to the particular risks that may affect companies in the information technology sector, as well as other technology-related sectors (collectively, the technology sectors) than if it were invested in a wider variety of companies in unrelated sectors. Companies in the technology sectors are subject to certain risks, including the risk that new services, equipment or technologies will not be accepted by consumers and businesses or will become rapidly obsolete. Performance of such companies may be affected by factors including obtaining and protecting patents (or the failure to do so) and significant competitive pressures, including aggressive pricing of their products or services, new market entrants, competition for market share and short product cycles due to an accelerated rate of technological developments. Such competitive pressures may lead to limited earnings and/or falling profit margins. As a result, the value of their securities may fall or fail to rise. In addition, many technology sector companies have limited operating histories and prices of these companies’ securities historically have been more volatile than other securities, especially over the short term.
Note 9. Subsequent events
Management has evaluated the events and transactions that have occurred through the date the financial statements were issued and noted no items requiring adjustment of the financial statements or additional disclosure.
Note 10. Information regarding pending and settled legal proceedings
Ameriprise Financial and certain of its affiliates have historically been involved in a number of legal, arbitration and regulatory proceedings, including routine litigation, class actions, and governmental actions, concerning matters arising in connection with the conduct of their business activities. Ameriprise Financial believes that the Fund is not currently the subject of, and that neither Ameriprise Financial nor any of its affiliates are the subject of, any pending legal, arbitration or regulatory proceedings that are likely to have a material adverse effect on the Fund or the ability of Ameriprise Financial or its affiliates to perform under their contracts with the Fund. Ameriprise Financial is required to make quarterly (10-Q), annual (10-K) and, as necessary, 8-K filings with the Securities and Exchange Commission (SEC) on legal and regulatory matters that relate to Ameriprise Financial and its affiliates. Copies of these filings may be obtained by accessing the SEC website at www.sec.gov.
There can be no assurance that these matters, or the adverse publicity associated with them, will not result in increased Fund redemptions, reduced sale of Fund shares or other adverse consequences to the Fund. Further, although we believe proceedings are not likely to have a material adverse effect on the Fund or the ability of Ameriprise Financial or its affiliates to perform under their contracts with the Fund, these proceedings are subject to uncertainties and, as such, we are unable to estimate the possible loss or range of loss that may result. An adverse outcome in one or more of these proceedings could result in adverse judgments, settlements, fines, penalties or other relief that could have a material adverse effect on the consolidated financial condition or results of operations of Ameriprise Financial.
Columbia Pacific/Asia Fund | Annual Report 2018
| 33 |
Report of Independent Registered Public Accounting Firm
To the Trustees of Columbia Funds Series Trust I and Shareholders of Columbia Pacific/Asia Fund
Opinion on the Financial Statements
We have audited the accompanying statement of assets and liabilities, including the portfolio of investments, of Columbia Pacific/Asia Fund (one of the funds constituting Columbia Funds Series Trust I, referred to hereafter as the "Fund") as of March 31, 2018, the related statement of operations for the year ended March 31, 2018, the statement of changes in net assets for each of the two years in the period ended March 31, 2018, including the related notes, and the financial highlights for each of the periods indicated therein (collectively referred to as the “financial statements”). In our opinion, the financial statements present fairly, in all material respects, the financial position of the Fund as of March 31, 2018, the results of its operations for the year then ended, the changes in its net assets for each of the two years in the period ended March 31, 2018 and the financial highlights for each of the periods indicated therein in conformity with accounting principles generally accepted in the United States of America.
Basis for Opinion
These financial statements are the responsibility of the Fund’s management. Our responsibility is to express an opinion on the Fund’s financial statements based on our audits. We are a public accounting firm registered with the Public Company Accounting Oversight Board (United States) (“PCAOB”) and are required to be independent with respect to the Fund in accordance with the U.S. federal securities laws and the applicable rules and regulations of the Securities and Exchange Commission and the PCAOB.
We conducted our audits of these financial statements in accordance with the standards of the PCAOB. Those standards require that we plan and perform the audit to obtain reasonable assurance about whether the financial statements are free of material misstatement, whether due to error or fraud.
Our audits included performing procedures to assess the risks of material misstatement of the financial statements, whether due to error or fraud, and performing procedures that respond to those risks. Such procedures included examining, on a test basis, evidence regarding the amounts and disclosures in the financial statements. Our audits also included evaluating the accounting principles used and significant estimates made by management, as well as evaluating the overall presentation of the financial statements. Our procedures included confirmation of securities owned as of March 31, 2018 by correspondence with the custodian, transfer agent and brokers; when replies were not received from brokers, we performed other auditing procedures. We believe that our audits provide a reasonable basis for our opinion.
/s/PricewaterhouseCoopers LLP
Minneapolis, Minnesota
May 22, 2018
We have served as auditors of one or more investment companies within the Columbia Funds Complex since 1977.
| 34 | Columbia Pacific/Asia Fund | Annual Report 2018 |
Federal Income Tax Information
(Unaudited)
The Fund hereby designates the following tax attributes for the fiscal year ended March 31, 2018. Shareholders will be notified in early 2019 of the amounts for use in preparing 2018 income tax returns.
Qualified
dividend
income | Capital
gain
dividend | Foreign
taxes paid
to foreign
countries | Foreign
taxes paid
per share
to foreign
countries | Foreign
source
income | Foreign
source
income per
share |
| 94.99% | $24,299,723 | $350,646 | $0.02 | $4,569,245 | $0.22 |
Qualified dividend income. For taxable, non-corporate shareholders, the percentage of ordinary income distributed during the fiscal year that represents qualified dividend income subject to reduced tax rates.
Capital gain dividend. The Fund designates as a capital gain dividend the amount reflected above, or if subsequently determined to be different, the net capital gain of such fiscal period.
Foreign taxes. The Fund makes the election to pass through to shareholders the foreign taxes paid. Eligible shareholders may claim a foreign tax credit. These taxes, and the corresponding foreign source income, are provided.
Columbia Pacific/Asia Fund | Annual Report 2018
| 35 |
Shareholders elect the Board that oversees the Fund’s operations. The Board appoints officers who are responsible for day-to-day business decisions based on policies set by the Board. The following table provides basic biographical information about the Fund’s Trustees, including their principal occupations during the past five years, although specific titles for individuals may have varied over the period. The year set forth beneath Length of Service in the table below is the year in which the Trustee was first appointed or elected as Trustee to any Fund currently in the Columbia Funds Complex or a predecessor thereof. Under current Board policy, members serve terms of indefinite duration.
Independent trustees
| Name, address, year of birth | Position held with the Trust and length of service | Principal occupation(s) during the past five years and other relevant professional experience | Number of Funds in the Columbia Fund Complex overseen | Other directorships held by Trustee during the past five years |
Janet Langford Carrig
c/o Columbia Management
Investment Advisers, LLC
225 Franklin Street
Mail Drop BX32 05228
Boston, MA 02110
1957 | Trustee
1996 | Senior Vice President, General Counsel and Corporate Secretary, ConocoPhillips (independent energy company) since September 2007 | 71 | None |
Douglas A. Hacker
c/o Columbia Management
Investment Advisers, LLC
225 Franklin Street
Mail Drop BX32 05228
Boston, MA 02110
1955 | Trustee and Chairman of the Board
1996 | Independent business executive since May 2006; Executive Vice President — Strategy of United Airlines from December 2002 to May 2006; President of UAL Loyalty Services (airline marketing company) from September 2001 to December 2002; Executive Vice President and Chief Financial Officer of United Airlines from July 1999 to September 2001 | 71 | Spartan Nash Company, (food distributor); Nash Finch Company (food distributor) from 2005 to 2013; Aircastle Limited (aircraft leasing); SeaCube Container Leasing Ltd. (container leasing) from 2010 to 2013; and Travelport Worldwide Limited (travel information technology) |
Nancy T. Lukitsh
c/o Columbia Management
Investment Advisers, LLC
225 Franklin Street
Mail Drop BX32 05228
Boston, MA 02110
1956 | Trustee
2011 | Senior Vice President, Partner and Director of Marketing, Wellington Management Company, LLP (investment adviser) from 1997 to 2010; Chair, Wellington Management Portfolios (commingled non-U.S. investment pools) from 2007 to 2010; Director, Wellington Trust Company, NA and other Wellington affiliates from 1997 to 2010 | 71 | None |
David M. Moffett
c/o Columbia Management
Investment Advisers, LLC
225 Franklin Street
Mail Drop BX32 05228
Boston, MA 02110
1952 | Trustee
2011 | Retired. Consultant to Bridgewater and Associates | 71 | Director, CSX Corporation; Genworth Financial, Inc. (financial and insurance products and services); PayPal Holdings Inc. (payment and data processing services); Trustee, University of Oklahoma Foundation; former Director, eBay Inc. (online trading community), 2007-2015; and former Director, CIT Bank, CIT Group Inc. (commercial and consumer finance), 2010-2016 |
John J. Neuhauser
c/o Columbia Management
Investment Advisers, LLC
225 Franklin Street
Mail Drop BX32 05228
Boston, MA 02110
1943 | Trustee
1984 | President, Saint Michael’s College since August 2007; Director or Trustee of several non-profit organizations, including University of Vermont Medical Center; Academic Vice President and Dean of Faculties, Boston College from August 1999 to October 2005; University Professor, Boston College from November 2005 to August 2007 | 71 | Liberty All-Star Equity Fund and Liberty All- Star Growth Fund (closed-end funds) |
| 36 | Columbia Pacific/Asia Fund | Annual Report 2018 |
TRUSTEES AND OFFICERS (continued)
Independent trustees (continued)
| Name, address, year of birth | Position held with the Trust and length of service | Principal occupation(s) during the past five years and other relevant professional experience | Number of Funds in the Columbia Fund Complex overseen | Other directorships held by Trustee during the past five years |
Patrick J. Simpson
c/o Columbia Management
Investment Advisers, LLC
225 Franklin Street
Mail Drop BX32 05228
Boston, MA 02110
1944 | Trustee
2000 | Of Counsel, Perkins Coie LLP (law firm) since 2015; Partner, Perkins Coie LLP from 1988 to 2014 | 71 | None |
Anne-Lee Verville
c/o Columbia Management
Investment Advisers, LLC
225 Franklin Street
Mail Drop BX32 05228
Boston, MA 02110
1945 | Trustee
1998 | Retired. General Manager, Global Education Industry from 1994 to 1997, President – Application Systems Division from 1991 to 1994, Chief Financial Officer – US Marketing & Services from 1988 to 1991, and Chief Information Officer from 1987 to 1988, IBM Corporation (computer and technology) | 71 | Enesco Group, Inc. (producer of giftware and home and garden decor products) from 2001 to 2006 |
Consultants to the Independent Trustees*
| Name, address, year of birth | Position held with the Trust and length of service | Principal occupation(s) during the past five years and other relevant professional experience | Number of Funds in the Columbia Funds complex overseen | Other directorships held by Trustee during the past five years |
J. Kevin Connaughton
c/o Columbia
Management Investment
Advisers, LLC,
225 Franklin Street
Mail Drop BX32 05228,
Boston, MA 02110
1964 | Independent Trustee Consultant
2016 | Independent Trustee Consultant, Columbia Funds since March 2016; Adjunct Professor of Finance, Bentley University since November 2017; Managing Director and General Manager of Mutual Fund Products, Columbia Management Investment Advisers, LLC from May 2010 to February 2015; President, Columbia Funds from 2009 to 2015; and senior officer of Columbia Funds and affiliated funds from 2003 to 2015 | 71 | Director, The Autism Project since March 2015; former Trustee, New Century Portfolios, March 2015-December 2017; formerly on Board of Governors, Gateway Healthcare, January 2016 – December 2017 |
Natalie A. Trunow
c/o Columbia
Management Investment
Advisers, LLC,
225 Franklin Street
Mail Drop BX32 05228,
Boston, MA 02110
1967 | Independent Trustee Consultant
2016 | Independent Trustee Consultant, Columbia Funds since September 2016; Chief Executive Officer, Millennial Portfolio Solutions LLC (asset management and consulting services) since January 2016; Director of Investments, Casey Family Programs from April 2016 to September 2016; Senior Vice President and Chief Investment Officer, Calvert Investments from August 2008 to January 2016; Section Head and Portfolio Manager, General Motors Asset Management from June 1997 to August 2008 | 71 | Director, Health Services for Children with Special Needs, Inc.; Director, Guidewell Financial Solutions |
| * | J. Kevin Connaughton was appointed consultant to the Independent Trustees effective March 1, 2016. Natalie A. Trunow was appointed consultant to the Independent Trustees effective September 1, 2016. Shareholders of the Funds are expected to be asked to elect each of Mr. Connaughton and Ms. Trunow as a Trustee at a future shareholder meeting. |
Columbia Pacific/Asia Fund | Annual Report 2018
| 37 |
TRUSTEES AND OFFICERS (continued)
Interested trustee affiliated with Investment Manager*
| Name, address, year of birth | Position held with the Trust and length of service | Principal occupation(s) during the past five years and other relevant professional experience | Number of Funds in the Columbia Funds Complex overseen | Other directorships held by Trustee during the past five years |
William F. Truscott
c/o Columbia Management
Investment Advisers, LLC
225 Franklin Street
Boston, MA 02110
1960 | Trustee
2012 | Chairman of the Board and President, Columbia Management Investment Advisers, LLC since May 2010 and February 2012, respectively; Chief Executive Officer, Global Asset Management, Ameriprise Financial, Inc. since September 2012 (previously Chief Executive Officer, U.S. Asset Management & President, Annuities, May 2010-September 2012); Director and Chief Executive Officer, Columbia Management Investment Distributors, Inc. since May 2010 and February 2012, respectively; Chairman of the Board and Chief Executive Officer, RiverSource Distributors, Inc. since 2006; Director, Threadneedle Asset Management Holdings, SARL since 2014; President and Chief Executive Officer, Ameriprise Certificate Company, 2006-August 2012 | 196 | Chairman of the Board, Columbia Management Investment Advisers, LLC since May 2010; Director, Columbia Management Investment Distributors, Inc. since May 2010; former Director, Ameriprise Certificate Company, 2006 - January 2013 |
| * | Interested person (as defined under the 1940 Act) by reason of being an officer, director, security holder and/or employee of the Investment Manager or Ameriprise Financial. |
The Statement of Additional Information has additional information about the Fund’s Board members and is available, without charge, upon request by calling 800.345.6611, visiting columbiathreadneedleus.com/investor/ or contacting your financial intermediary.
| 38 | Columbia Pacific/Asia Fund | Annual Report 2018 |
TRUSTEES AND OFFICERS (continued)
The Board has appointed officers who are responsible for day-to-day business decisions based on policies it has established. The officers serve at the pleasure of the Board. The following table provides basic information about the Officers of the Fund, including principal occupations during the past five years, although their specific titles may have varied over the period. In addition to Mr. Truscott, who is Senior Vice President, the Fund’s other officers are:
Fund officers
Name,
address and
year of birth | Position and year
first appointed to
position for any Fund
in the Columbia
Funds complex or a
predecessor thereof | Principal occupation(s) during past five years |
Christopher O. Petersen
5228 Ameriprise
Financial Center
Minneapolis, MN 55474
Born 1970 | President and Principal Executive Officer (2015) | Vice President and Lead Chief Counsel, Ameriprise Financial, Inc. since January 2015 (previously, Vice President and Chief Counsel, January 2010 - December 2014; officer of Columbia Funds and affiliated funds since 2007. |
Michael G. Clarke
225 Franklin Street
Boston, MA 02110
Born 1969 | Treasurer (2011), Chief Financial Officer (2009) and Chief Accounting Officer (2015) | Vice President — Mutual Fund Administration, Columbia Management Investment Advisers, LLC, since May 2010; senior officer of Columbia Funds and affiliated funds since 2002. |
Paul B. Goucher
100 Park Avenue
New York, NY 10017
Born 1968 | Senior Vice President (2011) and Assistant Secretary (2008) | Senior Vice President and Assistant General Counsel, Ameriprise Financial, Inc. since January 2017 (previously Vice President and Lead Chief Counsel, November 2008 - January 2017 and January 2013 - January 2017, respectively; and Chief Counsel, January 2010 - January 2013); Vice President, Chief Legal Officer and Assistant Secretary, Columbia Management Investment Advisers, LLC since May 2010. |
Thomas P. McGuire
225 Franklin Street
Boston, MA 02110
Born 1972 | Senior Vice President and Chief Compliance Officer (2012) | Vice President — Asset Management Compliance, Ameriprise Financial, Inc., since May 2010; Chief Compliance Officer, Ameriprise Certificate Company since September 2010. |
Colin Moore
225 Franklin Street
Boston, MA 02110
Born 1958 | Senior Vice President (2010) | Executive Vice President and Global Chief Investment Officer, Ameriprise Financial, Inc., since July 2013; Executive Vice President and Global Chief Investment Officer, Columbia Management Investment Advisers, LLC since July 2013 (previously Director and Global Chief Investment Officer, 2010 - 2013). |
Ryan C. Larrenaga
225 Franklin Street
Boston, MA 02110
Born 1970 | Senior Vice President (2017), Chief Legal Officer (2017) and Secretary (2015) | Vice President and Group Counsel, Ameriprise Financial, Inc. since August 2011; officer of Columbia Funds and affiliated funds since 2005. |
Michael E. DeFao
225 Franklin Street
Boston, MA 02110
Born 1968 | Vice President (2011) and Assistant Secretary (2010) | Vice President and Chief Counsel, Ameriprise Financial, Inc. since May 2010. |
Amy Johnson
5228 Ameriprise
Financial Center
Minneapolis, MN 55474
Born 1965 | Vice President (2006) | Managing Director and Global Head of Operations, Columbia Management Investment Advisers, LLC since April 2016 (previously Managing Director and Chief Operating Officer, 2010 - 2016). |
Lyn Kephart-Strong
5228 Ameriprise
Financial Center
Minneapolis, MN 55474
Born 1960 | Vice President (2015) | President, Columbia Management Investment Services Corp. since October 2014; Vice President & Resolution Officer, Ameriprise Trust Company since August 2009. |
Columbia Pacific/Asia Fund | Annual Report 2018
| 39 |
The Fund mails one shareholder report to each shareholder address. If you would like more than one report, please call shareholder services at 800.345.6611 and additional reports will be sent to you.
Proxy voting policies and procedures
The policy of the Board of Trustees is to vote the proxies of the companies in which the Fund holds investments consistent with the procedures as stated in the Statement of Additional Information (SAI). You may obtain a copy of the SAI without charge by calling 800.345.6611; contacting your financial intermediary; visiting columbiathreadneedleus.com/investor/; or searching the website of the Securities and Exchange Commission (SEC) at sec.gov. Information regarding how the Fund voted proxies relating to portfolio securities is filed with the SEC by August 31st for the most recent 12-month period ending June 30th of that year, and is available without charge by visiting columbiathreadneedleus.com/investor/, or searching the website of the SEC at sec.gov.
Quarterly schedule of investments
The Fund files a complete schedule of portfolio holdings with the SEC for the first and third quarters of each fiscal year on Form N-Q. The Fund’s Form N-Q is available on the SEC’s website at sec.gov and may be reviewed and copied at the SEC’s Public Reference Room in Washington, D.C. Information on the operation of the Public Reference Room may be obtained by calling 800.SEC.0330. The Fund’s complete schedule of portfolio holdings, as filed on Form N-Q, can also be obtained without charge, upon request, by calling 800.345.6611.
Additional Fund information
For more information about the Fund, please visit columbiathreadneedleus.com/investor/ or call 800.345.6611. Customer Service Representatives are available to answer your questions Monday through Friday from 8 a.m. to 7 p.m. Eastern time.
Fund investment manager
Columbia Management Investment Advisers, LLC
225 Franklin Street
Boston, MA 02110
Fund distributor
Columbia Management Investment Distributors, Inc.
225 Franklin Street
Boston, MA 02110
Fund transfer agent
Columbia Management Investment Services Corp.
P.O. Box 8081
Boston, MA 02266-8081
| 40 | Columbia Pacific/Asia Fund | Annual Report 2018 |
[THIS PAGE INTENTIONALLY LEFT BLANK]
Columbia Pacific/Asia Fund
P.O. Box 8081
Boston, MA 02266-8081
Please read and consider the investment objectives, risks, charges and expenses for any fund carefully before investing. For a prospectus and summary prospectus, which contains this and other important information about the Fund, go to
columbiathreadneedleus.com/investor/. The Fund is distributed by Columbia Management Investment Distributors, Inc., member FINRA, and managed by Columbia Management Investment Advisers, LLC.
Columbia Threadneedle Investments (Columbia Threadneedle) is the global brand name of the Columbia and Threadneedle group of companies. All rights reserved. Columbia Management Investment Distributors, Inc., 225 Franklin Street, Boston, MA 02110-2804
© 2018 Columbia Management Investment Advisers, LLC.
columbiathreadneedleus .com/investor/

Annual Report
March 31, 2018
Columbia Solutions Aggressive Portfolio
Not FDIC Insured • No bank guarantee • May lose value
Dear Shareholders,
The year 2017 was an extraordinary year in the financial markets. The S&P 500 Index didn’t experience a single down month and returned over 20%. Continuing this trend, January 2018 marked the fastest start for the index ever. Low volatility, which had been a feature of the U.S. equity market for several years, along with the surge in the S&P 500 Index, drove investor sentiment to very high levels. This arguably set the stage for an overdue correction, which we witnessed in February 2018.
A return to volatility
There have been few periods of market upheaval such as were experienced in the first part of 2018. While investors were taken by surprise by the sudden and pronounced market swings, the return to some level of volatility actually marked a resumption of relatively normal market conditions. Having said that, it’s important to distinguish between a good technical correction where excess enthusiasm in the marketplace is being let out, versus a real change in the underlying fundamentals – things like an underperforming economy or weaker corporate earnings. Our view is that the recent market volatility falls into the former category, and the fundamentals remain strong. We’re continuing to see improvements in global economic activity, and we’re seeing corporate earnings expectations continue to rise – and not just because of tax reform.
Consistency is more important than ever
It’s important to keep in mind that when it comes to long-term investing, it’s the destination, not the journey that matters most. If you have a financial goal that you’ve worked out with your financial advisor, and you have a good asset allocation plan to reach it, it’s a question of sticking with your plan rather than become focused on near-term volatility. Bouts of volatility are normal. After all, it’s hard to cross the ocean without hitting an occasional rough patch. You need to focus on the destination.
One final thought. In weathering volatility, it’s the consistency of the return that is essential. Investors who chase higher returns are usually the first to sell when an investment goes through a bad patch, and they therefore don’t tend to benefit from the recovery. More disciplined investors who perhaps panic less or not at all during periods of volatility, tend to have improved long-term results and are more likely to reach their financial goals. Nothing is more important to us than making sure those who have entrusted us to protect and grow their assets are able to do what matters most to them.
Your success is our priority. Talk to your financial advisor about how working with Columbia Threadneedle Investments may help you position your portfolio for consistent, sustainable outcomes, no matter the market conditions.
Sincerely,
Christopher O. Petersen
President, Columbia Funds
The S&P 500 Index, an unmanaged index, measures the performance of 500 widely held, large-capitalization U.S. stocks and is frequently used as a general measure of market performance. Past performance is no guarantee of future results.
Columbia Funds are distributed by Columbia Management Investment Distributors, Inc., member FINRA, and managed by Columbia Management Investment Advisers, LLC.
© 2018 Columbia Management Investment Advisers, LLC. All rights reserved.
Columbia Solutions Aggressive Portfolio | Annual Report 2018
Columbia Solutions Aggressive Portfolio | Annual Report 2018
Investment objective
Columbia Solutions Aggressive Portfolio (the Fund) pursues consistent total returns by seeking to allocate risks across multiple asset classes.
Portfolio management
Jeffrey Knight, CFA
Lead Portfolio Manager
Managed Fund since October 2017
Joshua Kutin, CFA
Portfolio Manager
Managed Fund since October 2017
Alexander Wilkinson, CFA
Portfolio Manager
Managed Fund since October 2017
| Portfolio breakdown (%) (at March 31, 2018) |
| Foreign Government Obligations | 14.0 |
| Money Market Funds | 59.4 |
| U.S. Treasury Obligations | 26.6 |
| Total | 100.0 |
Percentages indicated are based upon total investments. The Fund’s portfolio composition is subject to change.
| Market exposure through derivatives investments (% of notional exposure) (at March 31, 2018)(a) |
| | Long | Short | Net |
| Fixed Income Derivative Contracts | 53.5 | (2.8) | 50.7 |
| Equity Derivative Contracts | 89.4 | — | 89.4 |
| Foreign Currency Derivative Contracts | 4.6 | (44.7) | (40.1) |
| Total Notional Market Value of Derivative Contracts | 147.5 | (47.5) | 100.0 |
(a) The Fund has market exposure (long and/or short) to fixed income, equity asset classes and foreign currency through its investments in derivatives. The notional exposure of a financial instrument is the nominal or face amount that is used to calculate payments made on that instrument and/or changes in value for the instrument. The notional exposure is a hypothetical underlying quantity upon which payment obligations are computed. Notional exposures provide a gauge for how the Fund may behave given changes in individual markets. For a description of the Fund’s investments in derivatives, see Investments in derivatives following the Portfolio of Investments, and Note 2 to the Notes to Financial Statements.
| 2 | Columbia Solutions Aggressive Portfolio | Annual Report 2018 |
Understanding Your Fund’s Expenses
(Unaudited)
As an investor, you incur two types of costs. There are transaction costs, which may include redemption fees. There are also ongoing costs, which generally include management fees, distribution and/or service fees, and other fund expenses. The following information is intended to help you understand your ongoing costs (in dollars) of investing in the Fund and to help you compare these costs with the ongoing costs of investing in other mutual funds.
Analyzing your Fund’s expenses
To illustrate these ongoing costs, we have provided examples and calculated the expenses paid by investors of the Fund during the period. The actual and hypothetical information in the table is based on an initial investment of $1,000 at the beginning of the period indicated and held for the entire period. Expense information is calculated two ways and each method provides you with different information. The amount listed in the “Actual” column is calculated using the Fund’s actual operating expenses and total return for the period. You may use the Actual information, together with the amount invested, to estimate the expenses that you paid over the period. Simply divide your account value by $1,000 (for example, an $8,600 account value divided by $1,000 = 8.6), then multiply the results by the expenses paid during the period under the “Actual” column. The amount listed in the “Hypothetical” column assumes a 5% annual rate of return before expenses (which is not the Fund’s actual return) and then applies the Fund’s actual expense ratio for the period to the hypothetical return. You should not use the hypothetical account values and expenses to estimate either your actual account balance at the end of the period or the expenses you paid during the period. See “Compare with other funds” below for details on how to use the hypothetical data.
Compare with other funds
Since all mutual funds are required to include the same hypothetical calculations about expenses in shareholder reports, you can use this information to compare the ongoing cost of investing in the Fund with other funds. To do so, compare the hypothetical example with the 5% hypothetical examples that appear in the shareholder reports of other funds. As you compare hypothetical examples of other funds, it is important to note that hypothetical examples are meant to highlight the ongoing costs of investing in a fund only and do not reflect any transaction costs, such as redemption or exchange fees. Therefore, the hypothetical calculations are useful in comparing ongoing costs only, and will not help you determine the relative total costs of owning different funds. If transaction costs were included in these calculations, your costs would be higher.
| October 1, 2017 — March 31, 2018 |
| | Account value at the
beginning of the
period ($) | Account value at the
end of the
period ($) | Expenses paid during
the period ($) | Fund’s annualized
expense ratio (%) |
| | Actual | Hypothetical | Actual | Hypothetical | Actual | Hypothetical | Actual |
| | 1,000.00 | 1,000.00 | 1,015.30 (a) | 1,024.74 | 0.04 (a) | 0.05 | 0.01 (a) |
| (a) | Based on operations from October 24, 2017 (commencement of operations) through the stated period end. |
Expenses paid during the period are equal to the annualized expense ratio as indicated above, multiplied by the average account value over the period and then multiplied by the number of days in the Fund’s most recent fiscal half year and divided by 365.
Expenses do not include fees and expenses incurred indirectly by the Fund from its investment in underlying funds, including affiliated and non-affiliated pooled investment vehicles, such as mutual funds and exchange-traded funds.
Had Columbia Management Investment Advisers, LLC and/or certain of its affiliates not waived/reimbursed certain fees and expenses, account value at the end of the period would have been reduced.
Columbia Solutions Aggressive Portfolio | Annual Report 2018
| 3 |
Portfolio of Investments
March 31, 2018
(Percentages represent value of investments compared to net assets)
Investments in securities
| Foreign Government Obligations(a),(b) 13.0% |
| Issuer | Coupon
Rate | | Principal
Amount ($) | Value ($) |
| Austria 1.4% |
| Republic of Austria Government Bond(c) |
| 11/22/2022 | 3.400% | EUR | 66,000 | 94,439 |
| Belgium 1.6% |
| Kingdom of Belgium Government Bond(c) |
| 06/22/2024 | 2.600% | EUR | 50,000 | 70,670 |
| 06/22/2027 | 0.800% | EUR | 30,000 | 37,451 |
| Total | 108,121 |
| France 2.1% |
| French Republic Government Bond OAT(c) |
| 05/25/2045 | 3.250% | EUR | 50,000 | 85,933 |
| 05/25/2048 | 2.000% | EUR | 37,000 | 50,283 |
| Total | 136,216 |
| Italy 1.5% |
| Italy Buoni Poliennali Del Tesoro(c) |
| 09/01/2046 | 3.250% | EUR | 50,000 | 67,542 |
| 03/01/2047 | 2.700% | EUR | 24,000 | 29,215 |
| Total | 96,757 |
| Mexico 0.7% |
| Mexican Bonos |
| 06/10/2021 | 6.500% | MXN | 800,000 | 43,136 |
| Netherlands 3.7% |
| Netherlands Government Bond(c) |
| 07/15/2027 | 0.750% | EUR | 191,000 | 239,949 |
| Foreign Government Obligations(a),(b) (continued) |
| Issuer | Coupon
Rate | | Principal
Amount ($) | Value ($) |
| Spain 2.0% |
| Spain Government Bond(c) |
| 10/31/2024 | 2.750% | EUR | 95,000 | 133,786 |
Total Foreign Government Obligations
(Cost $811,633) | 852,404 |
|
| U.S. Treasury Obligations 24.8% |
| | | | |
| U.S. Treasury |
| 02/15/2021 | 3.625% | | 500,000 | 517,181 |
| 11/30/2024 | 2.125% | | 452,000 | 436,794 |
| 08/15/2027 | 2.250% | | 350,000 | 335,631 |
| 11/15/2027 | 2.250% | | 330,000 | 316,116 |
| 02/15/2045 | 2.500% | | 20,000 | 18,264 |
Total U.S. Treasury Obligations
(Cost $1,660,766) | 1,623,986 |
| Money Market Funds 55.2% |
| | Shares | Value ($) |
| Columbia Short-Term Cash Fund, 1.738%(d),(e) | 3,619,330 | 3,618,968 |
Total Money Market Funds
(Cost $3,619,210) | 3,618,968 |
Total Investments in Securities
(Cost: $6,091,609) | 6,095,358 |
| Other Assets & Liabilities, Net | | 461,975 |
| Net Assets | 6,557,333 |
At March 31, 2018, securities and/or cash totaling $354,116 were pledged as collateral.
Investments in derivatives
| Forward foreign currency exchange contracts |
Currency to
be sold | Currency to
be purchased | Counterparty | Settlement
date | Unrealized
appreciation ($) | Unrealized
depreciation ($) |
| 1,116,000 JPY | 10,518 USD | HSBC | 04/09/2018 | 25 | — |
| 56,855,000 JPY | 530,548 USD | HSBC | 04/09/2018 | — | (3,980) |
| 807,000 MXN | 42,803 USD | HSBC | 04/09/2018 | — | (1,545) |
| 108,000 NOK | 13,782 USD | HSBC | 04/09/2018 | 2 | — |
| 2,069,000 SEK | 256,495 USD | HSBC | 04/09/2018 | 8,598 | — |
| 35,000 SGD | 26,546 USD | HSBC | 04/09/2018 | — | (151) |
| 196,059 USD | 1,595,000 SEK | HSBC | 04/09/2018 | — | (4,954) |
| 189,000 AUD | 148,111 USD | Morgan Stanley | 04/09/2018 | 2,949 | — |
| 165,000 CHF | 176,862 USD | Morgan Stanley | 04/09/2018 | 4,183 | — |
| 221,000 DKK | 36,735 USD | Morgan Stanley | 04/09/2018 | 242 | — |
| 1,258,000 EUR | 1,556,699 USD | Morgan Stanley | 04/09/2018 | 8,131 | — |
| 38,000 EUR | 46,505 USD | Morgan Stanley | 04/09/2018 | — | (272) |
The accompanying Notes to Financial Statements are an integral part of this statement.
| 4 | Columbia Solutions Aggressive Portfolio | Annual Report 2018 |
Portfolio of Investments (continued)
March 31, 2018
| Forward foreign currency exchange contracts (continued) |
Currency to
be sold | Currency to
be purchased | Counterparty | Settlement
date | Unrealized
appreciation ($) | Unrealized
depreciation ($) |
| 324,000 GBP | 453,821 USD | Morgan Stanley | 04/09/2018 | — | (867) |
| 66,086 USD | 54,000 EUR | Morgan Stanley | 04/09/2018 | 386 | — |
| 75,029 USD | 54,000 GBP | Morgan Stanley | 04/09/2018 | 752 | — |
| Total | | | | 25,268 | (11,769) |
| Long futures contracts |
| Description | Number of
contracts | Expiration
date | Trading
currency | Notional
amount | Value/Unrealized
appreciation ($) | Value/Unrealized
depreciation ($) |
| 10-Year Mini JGB | 7 | 06/2018 | JPY | 105,902,724 | 901 | — |
| Australian 3-Year Bond | 2 | 06/2018 | AUD | 222,348 | 213 | — |
| Euro-Bobl | 1 | 06/2018 | EUR | 132,035 | 1,120 | — |
| Euro-Bund | 2 | 06/2018 | EUR | 319,602 | 5,844 | — |
| Long Gilt | 1 | 06/2018 | GBP | 125,164 | 3,101 | — |
| MSCI EAFE Index | 22 | 06/2018 | USD | 2,200,660 | — | (39,046) |
| MSCI Emerging Markets Index | 14 | 06/2018 | USD | 831,460 | — | (26,980) |
| S&P 500 E-mini | 26 | 06/2018 | USD | 3,435,900 | — | (189,734) |
| S&P/TSX 60 Index | 1 | 06/2018 | CAD | 181,200 | — | (1,731) |
| U.S. Treasury 10-Year Note | 8 | 06/2018 | USD | 973,885 | 7,375 | — |
| U.S. Treasury 5-Year Note | 2 | 06/2018 | USD | 229,314 | 764 | — |
| U.S. Treasury Ultra 10-Year Note | 1 | 06/2018 | USD | 131,263 | 1,846 | — |
| Total | | | | | 21,164 | (257,491) |
| Short futures contracts |
| Description | Number of
contracts | Expiration
date | Trading
currency | Notional
amount | Value/Unrealized
appreciation ($) | Value/Unrealized
depreciation ($) |
| Canadian Government 10-Year Bond | (2) | 06/2018 | CAD | (268,343) | — | (2,426) |
| Cleared credit default swap contracts - sell protection |
Reference
entity | Counterparty | Maturity
date | Receive
fixed
rate
(%) | Payment
frequency | Implied
credit
spread
(%)* | Notional
currency | Notional
amount | Value
($) | Upfront
payments
($) | Upfront
receipts
($) | Unrealized
appreciation
($) | Unrealized
depreciation
($) |
| Markit CDX North America High Yield Index, Series 30 | Morgan Stanley | 06/20/2023 | 5.000 | Quarterly | 3.604% | USD | 516,000 | (212) | — | — | — | (212) |
| Markit CDX North America Investment Grade Index, Series 30 | Morgan Stanley | 06/20/2023 | 1.000 | Quarterly | 0.655% | USD | 209,000 | (195) | — | — | — | (195) |
| Total | | | | | | | | (407) | — | — | — | (407) |
| * | Implied credit spreads, represented in absolute terms, utilized in determining the market value of credit default swap agreements on corporate or sovereign issues as of period end serve as an indicator of the current status of the payment/performance risk and represent the likelihood or risk of default for the credit derivative. The implied credit spread of a particular referenced entity reflects the cost of buying/selling protection and may include upfront payments required to be made to enter into the agreement. Wider credit spreads represent a deterioration of the referenced entity’s credit soundness and a greater likelihood or risk of default or other credit event occurring as defined under the terms of the agreement. |
Notes to Portfolio of Investments
| (a) | Principal amounts are denominated in United States Dollars unless otherwise noted. |
| (b) | Principal and interest may not be guaranteed by the government. |
| (c) | Represents privately placed and other securities and instruments exempt from SEC registration (collectively, private placements), such as Section 4(a)(2) and Rule 144A eligible securities, which are often sold only to qualified institutional buyers. The Fund may invest in private placements determined to be liquid as well as those determined to be illiquid. Private placements may be determined to be liquid under guidelines established by the Fund’s Board of Trustees. At March 31, 2018, the value of these securities amounted to $809,268, which represents 12.34% of net assets. |
| (d) | The rate shown is the seven-day current annualized yield at March 31, 2018. |
The accompanying Notes to Financial Statements are an integral part of this statement.
Columbia Solutions Aggressive Portfolio | Annual Report 2018
| 5 |
Portfolio of Investments (continued)
March 31, 2018
Notes to Portfolio of Investments (continued)
| (e) | As defined in the Investment Company Act of 1940, an affiliated company is one in which the Fund owns 5% or more of the company’s outstanding voting securities, or a company which is under common ownership or control with the Fund. Holdings and transactions in these affiliated companies during the year ended March 31, 2018 are as follows: |
| Issuer | Beginning
shares | Shares
purchased | Shares
sold | Ending
shares | Realized gain
(loss) —
affiliated
issuers ($) | Net change in
unrealized
appreciation
(depreciation) —
affiliated
issuers ($) | Dividends —
affiliated
issuers ($) | Value —
affiliated
issuers
at end of
period ($) |
| Columbia Short-Term Cash Fund, 1.738% |
| | — | 9,217,023 | (5,597,693) | 3,619,330 | (106) | (242) | 24,492 | 3,618,968 |
Currency Legend
| AUD | Australian Dollar |
| CAD | Canada Dollar |
| CHF | Swiss Franc |
| DKK | Danish Krone |
| EUR | Euro |
| GBP | British Pound |
| JPY | Japanese Yen |
| MXN | Mexican Peso |
| NOK | Norwegian Krone |
| SEK | Swedish Krona |
| SGD | Singapore Dollar |
| USD | US Dollar |
Fair value measurements
The Fund categorizes its fair value measurements according to a three-level hierarchy that maximizes the use of observable inputs and minimizes the use of unobservable inputs by prioritizing that the most observable input be used when available. Observable inputs are those that market participants would use in pricing an investment based on market data obtained from sources independent of the reporting entity. Unobservable inputs are those that reflect the Fund’s assumptions about the information market participants would use in pricing an investment. An investment’s level within the fair value hierarchy is based on the lowest level of any input that is deemed significant to the asset’s or liability’s fair value measurement. The input levels are not necessarily an indication of the risk or liquidity associated with investments at that level. For example, certain U.S. government securities are generally high quality and liquid, however, they are reflected as Level 2 because the inputs used to determine fair value may not always be quoted prices in an active market.
Fair value inputs are summarized in the three broad levels listed below:
| ■ | Level 1 — Valuations based on quoted prices for investments in active markets that the Fund has the ability to access at the measurement date. Valuation adjustments are not applied to Level 1 investments. |
| ■ | Level 2 — Valuations based on other significant observable inputs (including quoted prices for similar securities, interest rates, prepayment speeds, credit risks, etc.). |
| ■ | Level 3 — Valuations based on significant unobservable inputs (including the Fund’s own assumptions and judgment in determining the fair value of investments). |
Inputs that are used in determining fair value of an investment may include price information, credit data, volatility statistics, and other factors. These inputs can be either observable or unobservable. The availability of observable inputs can vary between investments, and is affected by various factors such as the type of investment, and the volume and level of activity for that investment or similar investments in the marketplace. The inputs will be considered by the Investment Manager, along with any other relevant factors in the calculation of an investment’s fair value. The Fund uses prices and inputs that are current as of the measurement date, which may include periods of market dislocations. During these periods, the availability of prices and inputs may be reduced for many investments. This condition could cause an investment to be reclassified between the various levels within the hierarchy.
Certain investments that have been measured at fair value using the net asset value (NAV) per share (or its equivalent) are not categorized in the fair value hierarchy. The fair value amounts presented in the table are intended to reconcile the fair value hierarchy to the amounts presented in the Portfolio of Investments. The Columbia Short-Term Cash Fund seeks to provide shareholders with maximum current income consistent with liquidity and stability of principal. Columbia Short-Term Cash Fund prices its shares with a floating NAV and no longer seeks to maintain a stable NAV.
Investments falling into the Level 3 category are primarily supported by quoted prices from brokers and dealers participating in the market for those investments. However, these may be classified as Level 3 investments due to lack of market transparency and corroboration to support these quoted prices. Additionally, valuation models may be used as the pricing source for any remaining investments classified as Level 3. These models may rely on one or more significant unobservable inputs and/or significant assumptions by the Investment Manager. Inputs used in valuations may include, but are not limited to, financial statement analysis, capital account balances, discount rates and estimated cash flows, and comparable company data.
Under the direction of the Fund’s Board of Trustees (the Board), the Investment Manager’s Valuation Committee (the Committee) is responsible for overseeing the valuation procedures approved by the Board. The Committee consists of voting and non-voting members from various groups within the Investment Manager’s organization, including operations and accounting, trading and investments, compliance, risk management and legal.
The accompanying Notes to Financial Statements are an integral part of this statement.
| 6 | Columbia Solutions Aggressive Portfolio | Annual Report 2018 |
Portfolio of Investments (continued)
March 31, 2018
Fair value measurements (continued)
The Committee meets at least monthly to review and approve valuation matters, which may include a description of specific valuation determinations, data regarding pricing information received from approved pricing vendors and brokers and the results of Board-approved valuation control policies and procedures (the Policies). The Policies address, among other things, instances when market quotations are or are not readily available, including recommendations of third party pricing vendors and a determination of appropriate pricing methodologies; events that require specific valuation determinations and assessment of fair value techniques; securities with a potential for stale pricing, including those that are illiquid, restricted, or in default; and the effectiveness of third party pricing vendors, including periodic reviews of vendors. The Committee meets more frequently, as needed, to discuss additional valuation matters, which may include the need to review back-testing results, review time-sensitive information or approve related valuation actions. The Committee reports to the Board, with members of the Committee meeting with the Board at each of its regularly scheduled meetings to discuss valuation matters and actions during the period, similar to those described earlier.
For investments categorized as Level 3, the Committee monitors information similar to that described above, which may include: (i) data specific to the issuer or comparable issuers, (ii) general market or specific sector news and (iii) quoted prices and specific or similar security transactions. The Committee considers this data and any changes from prior periods in order to assess the reasonableness of observable and unobservable inputs, any assumptions or internal models used to value those securities and changes in fair value. This data is also used to corroborate, when available, information received from approved pricing vendors and brokers. Various factors impact the frequency of monitoring this information (which may occur as often as daily). However, the Committee may determine that changes to inputs, assumptions and models are not required as a result of the monitoring procedures performed.
The following table is a summary of the inputs used to value the Fund’s investments at March 31, 2018:
| | Level 1
quoted prices
in active
markets for
identical
assets ($) | Level 2
other
significant
observable
inputs ($) | Level 3
significant
unobservable
inputs ($) | Investments
measured at
net asset
value ($) | Total ($) |
| Investments in Securities | | | | | |
| Foreign Government Obligations | — | 852,404 | — | — | 852,404 |
| U.S. Treasury Obligations | 1,623,986 | — | — | — | 1,623,986 |
| Money Market Funds | — | — | — | 3,618,968 | 3,618,968 |
| Total Investments in Securities | 1,623,986 | 852,404 | — | 3,618,968 | 6,095,358 |
| Investments in Derivatives | | | | | |
| Asset | | | | | |
| Forward Foreign Currency Exchange Contracts | — | 25,268 | — | — | 25,268 |
| Futures Contracts | 21,164 | — | — | — | 21,164 |
| Liability | | | | | |
| Forward Foreign Currency Exchange Contracts | — | (11,769) | — | — | (11,769) |
| Futures Contracts | (259,917) | — | — | — | (259,917) |
| Swap Contracts | — | (407) | — | — | (407) |
| Total | 1,385,233 | 865,496 | — | 3,618,968 | 5,869,697 |
See the Portfolio of Investments for all investment classifications not indicated in the table.
The Fund’s assets assigned to the Level 2 input category are generally valued using the market approach, in which a security’s value is determined through reference to prices and information from market transactions for similar or identical assets.
Derivative instruments are valued at unrealized appreciation (depreciation).
There were no transfers of financial assets between levels during the period.
The accompanying Notes to Financial Statements are an integral part of this statement.
Columbia Solutions Aggressive Portfolio | Annual Report 2018
| 7 |
Statement of Assets and Liabilities
March 31, 2018
| Assets | |
| Investments in securities, at value | |
| Unaffiliated issuers (cost $2,472,399) | $2,476,390 |
| Affiliated issuers (cost $3,619,210) | 3,618,968 |
| Foreign currency (cost $19,776) | 19,730 |
| Margin deposits on: | |
| Futures contracts | 324,164 |
| Swap contracts | 29,952 |
| Unrealized appreciation on forward foreign currency exchange contracts | 25,268 |
| Receivable for: | |
| Dividends | 4,898 |
| Interest | 17,248 |
| Foreign tax reclaims | 830 |
| Variation margin for futures contracts | 89,239 |
| Variation margin for swap contracts | 2,344 |
| Expense reimbursement due from Investment Manager | 421 |
| Trustees’ deferred compensation plan | 3,188 |
| Other assets | 1,141 |
| Total assets | 6,613,781 |
| Liabilities | |
| Unrealized depreciation on forward foreign currency exchange contracts | 11,769 |
| Payable for: | |
| Variation margin for futures contracts | 840 |
| Compensation of board members | 360 |
| Compensation of chief compliance officer | 1 |
| Audit fees | 33,675 |
| Custodian fees | 5,368 |
| Other expenses | 1,247 |
| Trustees’ deferred compensation plan | 3,188 |
| Total liabilities | 56,448 |
| Net assets applicable to outstanding capital stock | $6,557,333 |
| Represented by | |
| Paid in capital | 6,490,782 |
| Excess of distributions over net investment income | (44,194) |
| Accumulated net realized gain | 331,900 |
| Unrealized appreciation (depreciation) on: | |
| Investments - unaffiliated issuers | 3,991 |
| Investments - affiliated issuers | (242) |
| Foreign currency translations | 757 |
| Forward foreign currency exchange contracts | 13,499 |
| Futures contracts | (238,753) |
| Swap contracts | (407) |
| Total - representing net assets applicable to outstanding capital stock | $6,557,333 |
| Shares outstanding | 650,974 |
| Net asset value per share | 10.07 |
The accompanying Notes to Financial Statements are an integral part of this statement.
| 8 | Columbia Solutions Aggressive Portfolio | Annual Report 2018 |
Statement of Operations
For the period from October 24, 2017 (commencement of operations) through March 31, 2018
| Net investment income | |
| Income: | |
| Dividends — affiliated issuers | $24,492 |
| Interest | 18,935 |
| Total income | 43,427 |
| Expenses: | |
| Compensation of board members | 4,165 |
| Custodian fees | 9,393 |
| Printing and postage fees | 823 |
| Audit fees | 33,675 |
| Legal fees | 63 |
| Compensation of chief compliance officer | 1 |
| Other | 3,208 |
| Total expenses | 51,328 |
| Fees waived or expenses reimbursed by Investment Manager and its affiliates | (51,039) |
| Total net expenses | 289 |
| Net investment income | 43,138 |
| Realized and unrealized gain (loss) — net | |
| Net realized gain (loss) on: | |
| Investments — unaffiliated issuers | 14,945 |
| Investments — affiliated issuers | (106) |
| Foreign currency translations | 135 |
| Forward foreign currency exchange contracts | (143,741) |
| Futures contracts | 427,588 |
| Swap contracts | 1,205 |
| Net realized gain | 300,026 |
| Net change in unrealized appreciation (depreciation) on: | |
| Investments — unaffiliated issuers | 3,991 |
| Investments — affiliated issuers | (242) |
| Foreign currency translations | 757 |
| Forward foreign currency exchange contracts | 13,499 |
| Futures contracts | (238,753) |
| Swap contracts | (407) |
| Net change in unrealized appreciation (depreciation) | (221,155) |
| Net realized and unrealized gain | 78,871 |
| Net increase in net assets resulting from operations | $122,009 |
The accompanying Notes to Financial Statements are an integral part of this statement.
Columbia Solutions Aggressive Portfolio | Annual Report 2018
| 9 |
Statement of Changes in Net Assets
| | Year Ended
March 31, 2018 (a) |
| Operations | |
| Net investment income | $43,138 |
| Net realized gain | 300,026 |
| Net change in unrealized appreciation (depreciation) | (221,155) |
| Net increase in net assets resulting from operations | 122,009 |
| Distributions to shareholders | |
| Net realized gains | (55,458) |
| Total distributions to shareholders | (55,458) |
| Increase in net assets from capital stock activity | 6,480,782 |
| Total increase in net assets | 6,547,333 |
| Net assets at beginning of period | 10,000 |
| Net assets at end of period | $6,557,333 |
| Excess of distributions over net investment income | $(44,194) |
| (a) | Based on operations from October 24, 2017 (fund commencement of operations) through the stated period end. |
The accompanying Notes to Financial Statements are an integral part of this statement.
| 10 | Columbia Solutions Aggressive Portfolio | Annual Report 2018 |
Statement of Changes in Net Assets (continued)
| | Year Ended |
| | March 31, 2018 (a) |
| | Shares | Dollars ($) |
| Capital stock activity |
| | | |
| Subscriptions | 706,637 | 7,068,308 |
| Distributions reinvested | 5,387 | 55,374 |
| Redemptions | (62,050) | (642,900) |
| Total net increase | 649,974 | 6,480,782 |
| (a) | Based on operations from October 24, 2017 (fund commencement of operations) through the stated period end. |
The accompanying Notes to Financial Statements are an integral part of this statement.
Columbia Solutions Aggressive Portfolio | Annual Report 2018
| 11 |
The following table is intended to help you understand the Fund’s financial performance. Certain information reflects financial results for a single share held for the periods shown. Per share net investment income (loss) amounts are calculated based on average shares outstanding during the period. Total return assumes reinvestment of all dividends and distributions, if any. Total return does not reflect payment of sales charges, if any. Total return and portfolio turnover are not annualized for periods of less than one year. The portfolio turnover rate is calculated without regard to purchase and sales transactions of short-term instruments and certain derivatives, if any. If such transactions were included, the Fund’s portfolio turnover rate may be higher.
| | Year Ended March 31,
2018 (a) |
| Per share data | |
| Net asset value, beginning of period | $10.00 |
| Income from investment operations: | |
| Net investment income | 0.07 |
| Net realized and unrealized gain | 0.08 |
| Total from investment operations | 0.15 |
| Less distributions to shareholders from: | |
| Net realized gains | (0.08) |
| Total distributions to shareholders | (0.08) |
| Net asset value, end of period | $10.07 |
| Total return | 1.53% |
| Ratios to average net assets | |
| Total gross expenses(b) | 1.10% (c) |
| Total net expenses(b),(d) | 0.01% (c) |
| Net investment income | 1.49% (c) |
| Supplemental data | |
| Portfolio turnover | 24% |
| Net assets, end of period (in thousands) | $6,557 |
| Notes to Financial Highlights |
| (a) | The Fund commenced operations on October 24, 2017. Per share data and total return reflect activity from that date. |
| (b) | In addition to the fees and expenses that the Fund bears directly, the Fund indirectly bears a pro rata share of the fees and expenses of any other funds in which it invests. Such indirect expenses are not included in the Fund’s reported expense ratios. |
| (c) | Annualized. |
| (d) | Total net expenses include the impact of certain fee waivers/expense reimbursements made by the Investment Manager and certain of its affiliates, if applicable. |
The accompanying Notes to Financial Statements are an integral part of this statement.
| 12 | Columbia Solutions Aggressive Portfolio | Annual Report 2018 |
Notes to Financial Statements
March 31, 2018
Note 1. Organization
Columbia Solutions Aggressive Portfolio (the Fund), a series of Columbia Funds Series Trust I (the Trust), is a non-diversified fund. The Trust is registered under the Investment Company Act of 1940, as amended (the 1940 Act), as an open-end management investment company organized as a Massachusetts business trust.
On October 23, 2017, Columbia Management Investment Advisers, LLC (the Investment Manager), a wholly-owned subsidiary of Ameriprise Financial, Inc. (Ameriprise Financial), invested $10,000 in the Fund, which represented the initial capital for the Fund at $10 per share.
These financial statements cover the period from October 24, 2017 (commencement of operations) through March 31, 2018. All references to the year ended March 31, 2018 refer to the period from October 24, 2017 through March 31, 2018.
Fund shares
The Trust may issue an unlimited number of shares (without par value). The Fund is sold only to the Columbia Adaptive Retirement Funds and certain collective investment trusts.
Note 2. Summary of significant accounting policies
Basis of preparation
The Fund is an investment company that applies the accounting and reporting guidance in the Financial Accounting Standards Board (FASB) Accounting Standards Codification Topic 946, Financial Services - Investment Companies (ASC 946). The financial statements are prepared in accordance with U.S. generally accepted accounting principles (GAAP), which requires management to make certain estimates and assumptions that affect the reported amounts of assets and liabilities, the disclosure of contingent assets and liabilities at the date of the financial statements and the reported amounts of income and expenses during the reporting period. Actual results could differ from those estimates.
The following is a summary of significant accounting policies followed by the Fund in the preparation of its financial statements.
Security valuation
Debt securities generally are valued by pricing services approved by the Board of Trustees based upon market transactions for normal, institutional-size trading units of similar securities. The services may use various pricing techniques that take into account, as applicable, factors such as yield, quality, coupon rate, maturity, type of issue, trading characteristics and other data, as well as approved independent broker-dealer quotes. Debt securities for which quotations are not readily available or not believed to be reflective of market value may also be valued based upon a bid quote from an approved independent broker-dealer. Debt securities maturing in 60 days or less are valued primarily at amortized cost value, unless this method results in a valuation that management believes does not approximate market value.
Investments in open-end investment companies, including money market funds, are valued at their latest net asset value.
Forward foreign currency exchange contracts are marked-to-market based upon foreign currency exchange rates provided by a pricing service.
Futures and options on futures contracts are valued based upon the settlement price at the close of regular trading on their principal exchanges or, in the absence of transactions, at the mean of the latest quoted bid and ask prices.
Swap transactions are valued through an independent pricing service or broker, or if neither is available, through an internal model based upon observable inputs.
Investments for which market quotations are not readily available, or that have quotations which management believes are not reflective of market value or reliable, are valued at fair value as determined in good faith under procedures approved by and under the general supervision of the Board of Trustees. If a security or class of securities (such as foreign securities) is valued at fair value, such value is likely to be different from the quoted or published price for the security.
Columbia Solutions Aggressive Portfolio | Annual Report 2018
| 13 |
Notes to Financial Statements (continued)
March 31, 2018
The determination of fair value often requires significant judgment. To determine fair value, management may use assumptions including but not limited to future cash flows and estimated risk premiums. Multiple inputs from various sources may be used to determine fair value.
GAAP requires disclosure regarding the inputs and valuation techniques used to measure fair value and any changes in valuation inputs or techniques. In addition, investments shall be disclosed by major category. This information is disclosed following the Fund’s Portfolio of Investments.
Foreign currency transactions and translations
The values of all assets and liabilities denominated in foreign currencies are generally translated into U.S. dollars at exchange rates determined at the close of regular trading on the New York Stock Exchange. Net realized and unrealized gains (losses) on foreign currency transactions and translations include gains (losses) arising from the fluctuation in exchange rates between trade and settlement dates on securities transactions, gains (losses) arising from the disposition of foreign currency and currency gains (losses) between the accrual and payment dates on dividends, interest income and foreign withholding taxes.
For financial statement purposes, the Fund does not distinguish that portion of gains (losses) on investments which is due to changes in foreign exchange rates from that which is due to changes in market prices of the investments. Such fluctuations are included with the net realized and unrealized gains (losses) on investments in the Statement of Operations.
Derivative instruments
The Fund invests in certain derivative instruments, as detailed below, to meet its investment objectives. Derivatives are instruments whose values depend on, or are derived from, in whole or in part, the value of one or more securities, currencies, commodities, indices, or other assets or instruments. Derivatives may be used to increase investment flexibility (including to maintain cash reserves while maintaining desired exposure to certain assets), for risk management (hedging) purposes, to facilitate trading, to reduce transaction costs and to pursue higher investment returns. The Fund may also use derivative instruments to mitigate certain investment risks, such as foreign currency exchange rate risk, interest rate risk and credit risk. Derivatives may involve various risks, including the potential inability of the counterparty to fulfill its obligations under the terms of the contract, the potential for an illiquid secondary market (making it difficult for the Fund to sell or terminate, including at favorable prices) and the potential for market movements which may expose the Fund to gains or losses in excess of the amount shown in the Statement of Assets and Liabilities. The notional amounts of derivative instruments, if applicable, are not recorded in the financial statements.
A derivative instrument may suffer a marked-to-market loss if the value of the contract decreases due to an unfavorable change in the market rates or values of the underlying instrument. Losses can also occur if the counterparty does not perform its obligations under the contract. The Fund’s risk of loss from counterparty credit risk on over-the-counter derivatives is generally limited to the aggregate unrealized gain netted against any collateral held by the Fund and the amount of any variation margin held by the counterparty, plus any replacement costs or related amounts. With exchange-traded or centrally cleared derivatives, there is reduced counterparty credit risk to the Fund since the clearinghouse or central counterparty (CCP) provides some protection in the case of clearing member default. The clearinghouse or CCP stands between the buyer and the seller of the contract; therefore, additional counterparty credit risk is failure of the clearinghouse or CCP. However, credit risk still exists in exchange-traded or centrally cleared derivatives with respect to initial and variation margin that is held in a broker’s customer account. While brokers are required to segregate customer margin from their own assets, in the event that a broker becomes insolvent or goes into bankruptcy and at that time there is a shortfall in the aggregate amount of margin held by the broker for all its clients, U.S. bankruptcy laws will typically allocate that shortfall on a pro-rata basis across all the broker’s customers (including the Fund), potentially resulting in losses to the Fund.
In order to better define its contractual rights and to secure rights that will help the Fund mitigate its counterparty risk, the Fund may enter into an International Swaps and Derivatives Association, Inc. Master Agreement (ISDA Master Agreement) or similar agreement with its derivatives contract counterparties. An ISDA Master Agreement is an agreement between the Fund and a counterparty that governs over-the-counter derivatives and typically contains, among other things, collateral posting terms and netting provisions in the event of a default and/or termination event. Under an ISDA Master Agreement, the Fund may, under certain circumstances, offset with the counterparty certain derivative instrument’s payables and/or receivables
| 14 | Columbia Solutions Aggressive Portfolio | Annual Report 2018 |
Notes to Financial Statements (continued)
March 31, 2018
with collateral held and/or posted and create one single net payment. The provisions of the ISDA Master Agreement typically permit a single net payment in the event of default (close-out netting), including the bankruptcy or insolvency of the counterparty. Note, however, that bankruptcy or insolvency laws of a particular jurisdiction may impose restrictions on or prohibitions against the right of offset or netting in bankruptcy, insolvency or other events.
Collateral (margin) requirements differ by type of derivative. Margin requirements are established by the clearinghouse or CCP for exchange-traded and centrally cleared derivatives. Brokers can ask for margin in excess of the minimum in certain circumstances. Collateral terms are contract specific for over-the-counter derivatives. For over-the-counter derivatives traded under an ISDA Master Agreement, the collateral requirements are typically calculated by netting the marked-to-market amount for each transaction under such agreement and comparing that amount to the value of any variation margin currently pledged by the Fund and/or the counterparty. Generally, the amount of collateral due from or to a party has to exceed a minimum transfer amount threshold (e.g., $250,000) before a transfer has to be made. To the extent amounts due to the Fund from its counterparties are not fully collateralized, contractually or otherwise, the Fund bears the risk of loss from counterparty nonperformance. The Fund attempts to mitigate counterparty risk by only entering into agreements with counterparties that it believes have the financial resources to honor their obligations and by monitoring the financial stability of those counterparties.
Certain ISDA Master Agreements allow counterparties of over-the-counter derivatives transactions to terminate derivatives contracts prior to maturity in the event the Fund’s net asset value declines by a stated percentage over a specified time period or if the Fund fails to meet certain terms of the ISDA Master Agreement, which would cause the Fund to accelerate payment of any net liability owed to the counterparty. The Fund also has termination rights if the counterparty fails to meet certain terms of the ISDA Master Agreement. In addition to considering counterparty credit risk, the Fund would consider terminating the derivatives contracts based on whether termination would result in a net liability owed from the counterparty.
For financial reporting purposes, the Fund does not offset derivative assets and derivative liabilities that are subject to netting arrangements in the Statement of Assets and Liabilities.
Forward foreign currency exchange contracts
Forward foreign currency exchange contracts are over-the-counter agreements between two parties to buy and sell a currency at a set price on a future date. The Fund utilized forward foreign currency exchange contracts to hedge the currency exposure associated with some or all of the Fund’s securities, to shift foreign currency exposure back to U.S. dollars, to shift U.S. dollar exposure to achieve a representative weighted mix of major currencies in its benchmark, to recover an underweight country exposure in its portfolio and to generate total return through long and short positions versus the U.S. dollar. These instruments may be used for other purposes in future periods.
The values of forward foreign currency exchange contracts fluctuate daily with changes in foreign currency exchange rates. Changes in the value of these contracts are recorded as unrealized appreciation or depreciation until the contract is exercised or has expired. The Fund will realize a gain or loss when the forward foreign currency exchange contract is closed or expires.
The use of forward foreign currency exchange contracts does not eliminate fluctuations in the prices of the Fund’s portfolio securities. The risks of forward foreign currency exchange contracts include movement in the values of the foreign currencies relative to the U.S. dollar (or other foreign currencies) and the possibility that counterparties will not complete their contractual obligations, which may be in excess of the amount reflected, if any, in the Statement of Assets and Liabilities.
Futures contracts
Futures contracts are exchange-traded and represent commitments for the future purchase or sale of an asset at a specified price on a specified date. The Fund bought and sold futures contracts to manage the duration and yield curve exposure of the Fund versus the benchmark, to manage exposure to movements in interest rates, to manage exposure to the securities market and to maintain appropriate equity market exposure while keeping sufficient cash to accommodate daily redemptions. These instruments may be used for other purposes in future periods. Upon entering into futures contracts, the Fund bears risks that it may not achieve the anticipated benefits of the futures contracts and may realize a loss. Additional risks include counterparty credit risk, the possibility of an illiquid market, and that a change in the value of the contract or option may not correlate with changes in the value of the underlying asset.
Columbia Solutions Aggressive Portfolio | Annual Report 2018
| 15 |
Notes to Financial Statements (continued)
March 31, 2018
Upon entering into a futures contract, the Fund deposits cash or securities with the broker, known as a futures commission merchant (FCM), in an amount sufficient to meet the initial margin requirement. The initial margin deposit must be maintained at an established level over the life of the contract. Cash deposited as initial margin is recorded in the Statement of Assets and Liabilities as margin deposits. Securities deposited as initial margin are designated in the Portfolio of Investments. Subsequent payments (variation margin) are made or received by the Fund each day. The variation margin payments are equal to the daily change in the contract value and are recorded as variation margin receivable or payable and are offset in unrealized gains or losses. The Fund recognizes a realized gain or loss when the contract is closed or expires. Futures contracts involve, to varying degrees, risk of loss in excess of the variation margin disclosed in the Statement of Assets and Liabilities.
Swap contracts
Swap contracts are negotiated in the over-the-counter market and may be entered into as a bilateral contract or centrally cleared (centrally cleared swap contract). In a centrally cleared swap contract, immediately following execution of the swap contract with a broker, the swap contract is novated to a central counterparty (the CCP) and the CCP becomes the Fund’s counterparty to the centrally cleared swap contract. The Fund is required to deposit initial margin with the futures commission merchant (FCM), which pledges it through to the CCP in the form of cash or securities in an amount that varies depending on the size and risk profile of the particular swap contract. Securities deposited as initial margin are designated in the Portfolio of Investments and cash deposited is recorded in the Statement of Assets and Liabilities as margin deposits. Unlike a bilateral swap contract, for centrally cleared swap contracts, the Fund has minimal credit exposure to the FCM because the CCP stands between the Fund and the relevant buyer/seller on the other side of the contract. Swap contracts are marked-to-market daily and changes in value are recorded as unrealized appreciation (depreciation). The daily change in valuation of centrally cleared swap contracts, if any, is recorded as a receivable or payable for variation margin in the Statement of Assets and Liabilities.
Entering into these contracts involves, to varying degrees, elements of interest, liquidity and counterparty credit risk in excess of the amounts recognized in the Statement of Assets and Liabilities. Such risks involve the possibility that there may be unfavorable changes in interest rates, market conditions or other conditions, that it may be difficult to initiate a swap transaction or liquidate a position at an advantageous time or price which may result in significant losses, and that the FCM or CCP may not fulfill its obligation under the contract.
Credit default swap contracts
The Fund entered into credit default swap contracts to increase or decrease its credit exposure to an index and to manage credit risk exposure. These instruments may be used for other purposes in future periods. Credit default swap contracts are agreements in which one party pays fixed periodic payments to a counterparty in consideration for an agreement from the counterparty to make a specific payment should a specified credit event(s) take place. Although specified credit events are contract specific, credit events are generally defined as bankruptcy, failure to pay, restructuring, obligation acceleration, obligation default, or repudiation/moratorium.
As the purchaser of a credit default swap contract, the Fund purchases protection by paying a periodic interest rate on the notional amount to the counterparty. The interest amount is accrued daily as a component of unrealized appreciation (depreciation) and is recorded as a realized loss upon payment. If a credit event as specified in the contract occurs, the Fund may have the option either to deliver the reference obligation to the seller in exchange for a cash payment of its par amount, or to receive a net cash settlement equal to the par amount less an agreed-upon value of the reference obligation as of the date of the credit event. The difference between the value of the obligation or cash delivered and the notional amount received will be recorded as a realized gain (loss).
As the seller of a credit default swap contract, the Fund sells protection to a buyer and will generally receive a periodic interest rate on a notional amount. The interest amount is accrued daily as a component of unrealized appreciation (depreciation) and is recorded as a realized gain upon receipt of the payment. If a credit event as specified in the contract with the counterparty occurs, the Fund may either be required to accept the reference obligation from the buyer in exchange for a cash payment of its notional amount, or to pay the buyer a net cash settlement equal to the notional amount less an agreed-upon value of the reference obligation (recovery value) as of the date of the credit event. The difference between the value of the obligation or cash received and the notional amount paid will be recorded as a realized gain (loss). The maximum
| 16 | Columbia Solutions Aggressive Portfolio | Annual Report 2018 |
Notes to Financial Statements (continued)
March 31, 2018
potential amount of undiscounted future payments the Fund could be required to make as the seller of protection under a credit default swap contract is equal to the notional amount of the reference obligation. These potential amounts may be partially offset by any recovery values of the respective reference obligations or upfront receipts upon entering into the agreement. The notional amounts and market values of all credit default swap contracts in which the Fund is the seller of protection, if any, are disclosed in the Credit Default Swap Contracts Outstanding schedule following the Portfolio of Investments.
As a protection seller, the Fund bears the risk of loss from the credit events specified in the contract with the counterparty. For credit default swap contracts on credit indices, quoted market prices and resulting market values serve as an indicator of the current status of the payment/performance risk. Increasing market values, in absolute terms when compared to the notional amount of the swap, represent a deterioration of the reference entity’s credit soundness and a greater likelihood or risk of default or other credit event occurring as defined under the terms of the contract.
Any upfront payments or receipts by the Fund upon entering into a credit default swap contract is recorded as an asset or liability, respectively, and amortized daily as a component of realized gain (loss) in the Statement of Operations. Credit default swap contracts are valued daily, and the change in value is recorded as unrealized appreciation (depreciation) until the termination of the swap, at which time a realized gain (loss) is recorded.
Credit default swap contracts can involve greater risks than if a fund had invested in the reference obligation directly since, in addition to general market risks, credit default swaps are subject to counterparty credit risk, leverage risk, hedging risk, correlation risk and liquidity risk.
Effects of derivative transactions in the financial statements
The following tables are intended to provide additional information about the effect of derivatives on the financial statements of the Fund, including: the fair value of derivatives by risk category and the location of those fair values in the Statement of Assets and Liabilities; and the impact of derivative transactions over the period in the Statement of Operations, including realized and unrealized gains (losses). The derivative instrument schedules following the Portfolio of Investments present additional information regarding derivative instruments outstanding at the end of the period, if any.
The following table is a summary of the fair value of derivative instruments (not considered to be hedging instruments for accounting disclosure purposes) at March 31, 2018:
| | Asset derivatives | |
Risk exposure
category | Statement
of assets and liabilities
location | Fair value ($) |
| Foreign exchange risk | Unrealized appreciation on forward foreign currency exchange contracts | 25,268 |
| Interest rate risk | Net assets — unrealized appreciation on futures contracts | 21,164* |
| Total | | 46,432 |
| | Liability derivatives | |
Risk exposure
category | Statement
of assets and liabilities
location | Fair value ($) |
| Credit risk | Net assets — unrealized depreciation on swap contracts | 407* |
| Equity risk | Net assets — unrealized depreciation on futures contracts | 257,491* |
| Foreign exchange risk | Unrealized depreciation on forward foreign currency exchange contracts | 11,769 |
| Interest rate risk | Net assets — unrealized depreciation on futures contracts | 2,426* |
| Total | | 272,093 |
| * | Includes cumulative appreciation (depreciation) as reported in the tables following the Portfolio of Investments. Only the current day’s variation margin is reported in receivables or payables in the Statement of Assets and Liabilities. |
Columbia Solutions Aggressive Portfolio | Annual Report 2018
| 17 |
Notes to Financial Statements (continued)
March 31, 2018
The following table indicates the effect of derivative instruments (not considered to be hedging instruments for accounting disclosure purposes) in the Statement of Operations for the year ended March 31, 2018:
| Amount of realized gain (loss) on derivatives recognized in income |
| Risk exposure category | Forward
foreign
currency
exchange
contracts
($) | Futures
contracts
($) | Swap
contracts
($) | Total
($) |
| Credit risk | — | — | 1,205 | 1,205 |
| Equity risk | — | 474,267 | — | 474,267 |
| Foreign exchange risk | (143,741) | — | — | (143,741) |
| Interest rate risk | — | (46,679) | — | (46,679) |
| Total | (143,741) | 427,588 | 1,205 | 285,052 |
| |
| Change in unrealized appreciation (depreciation) on derivatives recognized in income |
| Risk exposure category | Forward
foreign
currency
exchange
contracts
($) | Futures
contracts
($) | Swap
contracts
($) | Total
($) |
| Credit risk | — | — | (407) | (407) |
| Equity risk | — | (257,491) | — | (257,491) |
| Foreign exchange risk | 13,499 | — | — | 13,499 |
| Interest rate risk | — | 18,738 | — | 18,738 |
| Total | 13,499 | (238,753) | (407) | (225,661) |
The following table is a summary of the average outstanding volume by derivative instrument for the year ended March 31, 2018:
| Derivative instrument | Average notional
amounts ($)* |
| Futures contracts — long | 10,458,086 |
| Futures contracts — short | 38,031 |
| Credit default swap contracts — sell protection | 1,170,500 |
| Derivative instrument | Average unrealized
appreciation ($)* | Average unrealized
depreciation ($)* |
| Forward foreign currency exchange contracts | 11,290 | (44,175) |
| * | Based on the ending daily outstanding amounts for the year ended March 31, 2018. |
| 18 | Columbia Solutions Aggressive Portfolio | Annual Report 2018 |
Notes to Financial Statements (continued)
March 31, 2018
Offsetting of assets and liabilities
The following table presents the Fund’s gross and net amount of assets and liabilities available for offset under netting arrangements as well as any related collateral received or pledged by the Fund as of March 31, 2018:
| | HSBC ($) | Morgan
Stanley ($) (a) | Morgan
Stanley ($) (a) | Total ($) |
| Assets | | | | |
| Centrally cleared credit default swap contracts (b) | - | - | 2,344 | 2,344 |
| Forward foreign currency exchange contracts | 8,625 | 16,643 | - | 25,268 |
| Total assets | 8,625 | 16,643 | 2,344 | 27,612 |
| Liabilities | | | | |
| Forward foreign currency exchange contracts | 10,630 | 1,139 | - | 11,769 |
| Total financial and derivative net assets | (2,005) | 15,504 | 2,344 | 15,843 |
| Total collateral received (pledged) (c) | - | - | - | - |
| Net amount (d) | (2,005) | 15,504 | 2,344 | 15,843 |
| (a) | Exposure can only be netted across transactions governed under the same master agreement with the same legal entity. |
| (b) | Centrally cleared swaps are included within payable/receivable for variation margin on the Statement of Assets and Liabilities. |
| (c) | In some instances, the actual collateral received and/or pledged may be more than the amount shown due to overcollateralization. |
| (d) | Represents the net amount due from/(to) counterparties in the event of default. |
Security transactions
Security transactions are accounted for on the trade date. Cost is determined and gains (losses) are based upon the specific identification method for both financial statement and federal income tax purposes.
Income recognition
Interest income is recorded on an accrual basis. Market premiums and discounts, including original issue discounts, are amortized and accreted, respectively, over the expected life of the security on all debt securities, unless otherwise noted.
The Fund may place a debt security on non-accrual status and reduce related interest income when it becomes probable that the interest will not be collected and the amount of uncollectible interest can be reasonably estimated. A defaulted debt security is removed from non-accrual status when the issuer resumes interest payments or when collectibility of interest is reasonably assured.
Dividend income is recorded on the ex-dividend date.
Expenses
General expenses of the Trust are allocated to the Fund and other funds of the Trust based upon relative net assets or other expense allocation methodologies determined by the nature of the expense. Expenses directly attributable to the Fund are charged to the Fund.
Federal income tax status
The Fund intends to qualify each year as a regulated investment company under Subchapter M of the Internal Revenue Code, as amended, and will distribute substantially all of its investment company taxable income and net capital gain, if any, for its tax year, and as such will not be subject to federal income taxes. In addition, the Fund intends to distribute in each calendar year substantially all of its ordinary income, capital gain net income and certain other amounts, if any, such that the Fund should not be subject to federal excise tax. Therefore, no federal income or excise tax provision is recorded.
Foreign taxes
The Fund may be subject to foreign taxes on income, gains on investments or currency repatriation, a portion of which may be recoverable. The Fund will accrue such taxes and recoveries, as applicable, based upon its current interpretation of tax rules and regulations that exist in the markets in which it invests.
Columbia Solutions Aggressive Portfolio | Annual Report 2018
| 19 |
Notes to Financial Statements (continued)
March 31, 2018
Realized gains in certain countries may be subject to foreign taxes at the Fund level, based on statutory rates. The Fund accrues for such foreign taxes on realized and unrealized gains at the appropriate rate for each jurisdiction, as applicable. The amount, if any, is disclosed as a liability on the Statement of Assets and Liabilities.
Distributions to shareholders
Distributions from net investment income, if any, are declared and paid annually. Net realized capital gains, if any, are distributed at least annually. Income distributions and capital gain distributions are determined in accordance with federal income tax regulations, which may differ from GAAP.
Guarantees and indemnifications
Under the Trust’s organizational documents and, in some cases, by contract, its officers and trustees are indemnified against certain liabilities arising out of the performance of their duties to the Trust or its funds. In addition, certain of the Fund’s contracts with its service providers contain general indemnification clauses. The Fund’s maximum exposure under these arrangements is unknown since the amount of any future claims that may be made against the Fund cannot be determined, and the Fund has no historical basis for predicting the likelihood of any such claims.
Recent accounting pronouncement
Accounting Standards Update 2017-08 Premium Amortization on Purchased Callable Debt Securities
In March 2017, the Financial Accounting Standards Board issued Accounting Standards Update (ASU) No. 2017-08 Premium Amortization on Purchased Callable Debt Securities. ASU No. 2017-08 updates the accounting standards to shorten the amortization period for certain purchased callable debt securities, held at a premium, to be amortized to the earliest call date. The update applies to securities with explicit, noncontingent call features that are callable at fixed prices and on preset dates. The standard is effective for annual periods beginning after December 15, 2018 and interim periods within those fiscal years. At this time, management is evaluating the implication of this guidance and the impact it will have on the financial statement amounts and footnote disclosures, if any.
Note 3. Fees and other transactions with affiliates
Management services fees
The Fund has entered into a Management Agreement with Columbia Management Investment Advisers, LLC (the Investment Manager), a wholly-owned subsidiary of Ameriprise Financial, Inc. (Ameriprise Financial). Under the Management Agreement, subject to the policies set by the Board of Trustees, the Investment Manager provides the Fund with investment research and advice, as well as administrative and accounting services. The Fund does not pay a management fee for the investment advisory or administrative services provided to the Fund, but it may pay taxes, brokerage commissions and nonadvisory expenses.
Other expenses
Other expenses include offering costs which were incurred prior to the shares of the Fund being offered. Offering costs include printing costs. The Fund amortizes offering costs over a period of 12 months from the commencement of operations.
Compensation of board members
Members of the Board of Trustees who are not officers or employees of the Investment Manager or Ameriprise Financial are compensated for their services to the Fund as disclosed in the Statement of Operations. These members of the Board of Trustees may participate in a Deferred Compensation Plan (the Plan) which may be terminated at any time. Obligations of the Plan will be paid solely out of the Fund’s assets, and all amounts payable under the Plan constitute a general unsecured obligation of the Fund.
| 20 | Columbia Solutions Aggressive Portfolio | Annual Report 2018 |
Notes to Financial Statements (continued)
March 31, 2018
Compensation of Chief Compliance Officer
The Board of Trustees has appointed a Chief Compliance Officer to the Fund in accordance with federal securities regulations. As disclosed in the Statement of Operations, a portion of the Chief Compliance Officer’s total compensation is allocated to the Fund, along with other allocations to affiliated funds governed by the Board of Trustees, based on relative net assets.
Transfer agency fees
The Fund has a Transfer and Dividend Disbursing Agent Agreement with Columbia Management Investment Services Corp. (the Transfer Agent), an affiliate of the Investment Manager and a wholly-owned subsidiary of Ameriprise Financial, under which the Fund does not pay an annual fee to the Transfer Agent.
Distribution and service fees
The Fund has an agreement with Columbia Management Investment Distributors, Inc. (the Distributor), an affiliate of the Investment Manager and a wholly-owned subsidiary of Ameriprise Financial, for distribution and shareholder services. The Fund does not pay the Distributor a fee for the distribution services it provides to the Fund.
Expenses waived/reimbursed by the Investment Manager and its affiliates
The Investment Manager and certain of its affiliates have contractually agreed to waive fees and/or reimburse expenses (excluding certain fees and expenses described below), through July 31, 2019, unless sooner terminated at the sole discretion of the Board of Trustees, so that the Fund’s net operating expenses, after giving effect to fees waived/expenses reimbursed and any balance credits and/or overdraft charges from the Fund’s custodian, do not exceed the annual rate of 0.01% of the Fund’s average daily net assets.
Under the agreement governing this fee waiver and/or expense reimbursement arrangement, the following fees and expenses are excluded from the waiver/reimbursement commitment, and therefore will be paid by the Fund, if applicable: taxes (including foreign transaction taxes), expenses associated with investments in affiliated and non-affiliated pooled investment vehicles (including mutual funds and exchange-traded funds), transaction costs and brokerage commissions, costs related to any securities lending program, dividend expenses associated with securities sold short, inverse floater program fees and expenses, transaction charges and interest on borrowed money, interest, infrequent and/or unusual expenses and any other expenses the exclusion of which is specifically approved by the Board of Trustees. This agreement may be modified or amended only with approval from the Investment Manager, certain of its affiliates and the Fund. Any fees waived and/or expenses reimbursed under the expense reimbursement arrangements described above are not recoverable by the Investment Manager or its affiliates in future periods.
Note 4. Federal tax information
The timing and character of income and capital gain distributions are determined in accordance with income tax regulations, which may differ from GAAP because of temporary or permanent book to tax differences.
At March 31, 2018, these differences were primarily due to differing treatment for derivative investments, tax straddles, trustees’ deferred compensation, foreign currency transactions and net operating loss reclassification. To the extent these differences were permanent, reclassifications were made among the components of the Fund’s net assets in the Statement of Assets and Liabilities. Temporary differences do not require reclassifications.
In the Statement of Assets and Liabilities the following reclassifications were made:
Excess of distributions
over net investment
income ($) | Accumulated
net realized
gain ($) | Paid in
capital ($) |
| (87,332) | 87,332 | — |
Net investment income (loss) and net realized gains (losses), as disclosed in the Statement of Operations, and net assets were not affected by this reclassification.
Columbia Solutions Aggressive Portfolio | Annual Report 2018
| 21 |
Notes to Financial Statements (continued)
March 31, 2018
The tax character of distributions paid during the year ended March 31, 2018 was as follows:
Ordinary
income ($) | Long-term
capital gains ($) | Total ($) |
| 35,155 | 20,303 | 55,458 |
Short-term capital gain distributions, if any, are considered ordinary income distributions for tax purposes.
At March 31, 2018, the components of distributable earnings on a tax basis were as follows:
Undistributed
ordinary income ($) | Undistributed
long-term
capital gains ($) | Capital loss
carryforwards ($) | Net unrealized
(depreciation) ($) |
| 4,936 | 91,285 | — | (30,172) |
At March 31, 2018, the cost of all investments for federal income tax purposes along with the aggregate gross unrealized appreciation and depreciation based on that cost was:
Federal
tax cost ($) | Gross unrealized
appreciation ($) | Gross unrealized
(depreciation) ($) | Net unrealized
(depreciation) ($) |
| 5,899,869 | 17,007 | (47,179) | (30,172) |
Tax cost of investments and unrealized appreciation/(depreciation) may also include timing differences that do not constitute adjustments to tax basis.
Management of the Fund has concluded that there are no significant uncertain tax positions in the Fund that would require recognition in the financial statements. However, management’s conclusion may be subject to review and adjustment at a later date based on factors including, but not limited to, new tax laws, regulations, and administrative interpretations (including relevant court decisions). Generally, the Fund’s federal tax returns for the prior three fiscal years remain subject to examination by the Internal Revenue Service.
Note 5. Portfolio information
The cost of purchases and proceeds from sales of securities, excluding short-term investments and derivatives, if any, aggregated to $2,991,275 and $524,985, respectively, for the year ended March 31, 2018, of which $1,664,460 and $0, respectively, were U.S. government securities. The amount of purchase and sale activity impacts the portfolio turnover rate reported in the Financial Highlights.
Note 6. Affiliated money market fund
The Fund invests significantly in Columbia Short-Term Cash Fund, an affiliated money market fund established for the exclusive use by the Fund and other affiliated funds (the Affiliated MMF). The income earned by the Fund from such investments is included as Dividends - affiliated issuers in the Statement of Operations. As an investing fund, the Fund indirectly bears its proportionate share of the expenses of the Affiliated MMF. The Affiliated MMF prices its shares with a floating net asset value. In addition, the Board of Trustees of the Affiliated MMF may impose a fee on redemptions (sometimes referred to as a liquidity fee) or temporarily suspend redemptions (sometimes referred to as imposing a redemption gate) in the event its liquidity falls below regulatory limits.
Note 7. Line of credit
The Fund has access to a revolving credit facility with a syndicate of banks led by Citibank, N.A., HSBC Bank USA, N.A. and JPMorgan Chase Bank, N.A. whereby the Fund may borrow for the temporary funding of shareholder redemptions or for other temporary or emergency purposes. The credit facility, which is a collective agreement between the Fund and certain other funds managed by the Investment Manager, severally and not jointly, permits collective borrowings up to $1 billion. Interest is charged to each participating fund based on its borrowings at a rate equal to the higher of (i) the overnight federal funds rate
| 22 | Columbia Solutions Aggressive Portfolio | Annual Report 2018 |
Notes to Financial Statements (continued)
March 31, 2018
plus 1.00% or (ii) the one-month LIBOR rate plus 1.00%. Each borrowing under the credit facility matures no later than 60 days after the date of borrowing. The Fund also pays a commitment fee equal to its pro rata share of the amount of the credit facility at a rate of 0.15% per annum. The commitment fee is included in other expenses in the Statement of Operations.
The Fund had no borrowings during the year ended March 31, 2018.
Note 8. Significant risks
Credit risk
Credit risk is the risk that the value of debt securities in the Fund’s portfolio may decline because the issuer may default and fail to pay interest or repay principal when due. Rating agencies assign credit ratings to debt securities to indicate their credit risk. Lower rated or unrated debt securities held by the Fund may present increased credit risk as compared to higher-rated debt securities.
Derivatives risk
Losses involving derivative instruments may be substantial, because a relatively small price movement in the underlying security(ies), commodity, currency or index or other instrument or asset may result in a substantial loss for the Fund. In addition to the potential for increased losses, the use of derivative instruments may lead to increased volatility within the Fund. Derivatives will typically increase the Fund’s exposure to principal risks to which it is otherwise exposed, and may expose the Fund to additional risks, including correlation risk, counterparty risk, hedging risk, leverage risk and liquidity risk.
Interest rate risk
Interest rate risk is the risk of losses attributable to changes in interest rates. In general, if prevailing interest rates rise, the values of debt securities tend to fall, and if interest rates fall, the values of debt securities tend to rise. Actions by governments and central banking authorities can result in increases in interest rates. Increasing interest rates may negatively affect the value of debt securities held by the Fund, resulting in a negative impact on the Fund’s performance and net asset value per share. In general, the longer the maturity or duration of a debt security, the greater its sensitivity to changes in interest rates.
Liquidity risk
Liquidity risk is the risk associated with a lack of marketability of investments which may make it difficult to sell the investment at a desirable time or price. Changing regulatory, market or other conditions or environments (for example, the interest rate or credit environments) may adversely affect the liquidity of the Fund’s investments. The Fund may have to accept a lower selling price for the holding, sell other investments, or forego another, more appealing investment opportunity. Generally, the less liquid the market at the time the Fund sells a portfolio investment, the greater the risk of loss or decline of value to the Fund. A less liquid market can lead to an increase in Fund redemptions, which may negatively impact Fund performance and net asset value per share, including, for example, if the Fund is forced to sell securities in a down market.
Non-diversification risk
A non-diversified fund is permitted to invest a greater percentage of its total assets in fewer issuers than a diversified fund. The Fund may, therefore, have a greater risk of loss from a few issuers than a similar fund that invests more broadly.
Shareholder concentration risk
At March 31, 2018, affiliated shareholders of record owned 100.0% of the outstanding shares of the Fund in one or more accounts. Subscription and redemption activity by concentrated accounts may have a significant effect on the operations of the Fund. In the case of a large redemption, the Fund may be forced to sell investments at inopportune times, including its liquid positions, which may result in Fund losses and the Fund holding a higher percentage of less liquid positions. Large redemptions could result in decreased economies of scale and increased operating expenses for non-redeeming Fund shareholders.
Columbia Solutions Aggressive Portfolio | Annual Report 2018
| 23 |
Notes to Financial Statements (continued)
March 31, 2018
Note 9. Subsequent events
Management has evaluated the events and transactions that have occurred through the date the financial statements were issued and noted no items requiring adjustment of the financial statements or additional disclosure.
Note 10. Information regarding pending and settled legal proceedings
Ameriprise Financial and certain of its affiliates have historically been involved in a number of legal, arbitration and regulatory proceedings, including routine litigation, class actions, and governmental actions, concerning matters arising in connection with the conduct of their business activities. Ameriprise Financial believes that the Fund is not currently the subject of, and that neither Ameriprise Financial nor any of its affiliates are the subject of, any pending legal, arbitration or regulatory proceedings that are likely to have a material adverse effect on the Fund or the ability of Ameriprise Financial or its affiliates to perform under their contracts with the Fund. Ameriprise Financial is required to make quarterly (10-Q), annual (10-K) and, as necessary, 8-K filings with the Securities and Exchange Commission (SEC) on legal and regulatory matters that relate to Ameriprise Financial and its affiliates. Copies of these filings may be obtained by accessing the SEC website at www.sec.gov.
There can be no assurance that these matters, or the adverse publicity associated with them, will not result in increased Fund redemptions, reduced sale of Fund shares or other adverse consequences to the Fund. Further, although we believe proceedings are not likely to have a material adverse effect on the Fund or the ability of Ameriprise Financial or its affiliates to perform under their contracts with the Fund, these proceedings are subject to uncertainties and, as such, we are unable to estimate the possible loss or range of loss that may result. An adverse outcome in one or more of these proceedings could result in adverse judgments, settlements, fines, penalties or other relief that could have a material adverse effect on the consolidated financial condition or results of operations of Ameriprise Financial.
| 24 | Columbia Solutions Aggressive Portfolio | Annual Report 2018 |
Report of Independent Registered Public Accounting Firm
To the Trustees of Columbia Funds Series Trust I and Shareholders of Columbia Solutions Aggressive Portfolio
Opinion on the Financial Statements
We have audited the accompanying statement of assets and liabilities, including the portfolio of investments, of Columbia Solutions Aggressive Portfolio (one of the funds constituting Columbia Funds Series Trust I, referred to hereafter as the "Fund") as of March 31, 2018, the related statements of operations and changes in net assets, including the related notes, and the financial highlights for the period October 24, 2017 (commencement of operations) through March 31, 2018 (collectively referred to as the “financial statements”). In our opinion, the financial statements present fairly, in all material respects, the financial position of the Fund as of March 31, 2018, the results of its operations, changes in its net assets, and the financial highlights for the period October 24, 2017 (commencement of operations) through March 31, 2018 in conformity with accounting principles generally accepted in the United States of America.
Basis for Opinion
These financial statements are the responsibility of the Fund’s management. Our responsibility is to express an opinion on the Fund’s financial statements based on our audit. We are a public accounting firm registered with the Public Company Accounting Oversight Board (United States) (“PCAOB”) and are required to be independent with respect to the Fund in accordance with the U.S. federal securities laws and the applicable rules and regulations of the Securities and Exchange Commission and the PCAOB.
We conducted our audit of these financial statements in accordance with the standards of the PCAOB. Those standards require that we plan and perform the audit to obtain reasonable assurance about whether the financial statements are free of material misstatement, whether due to error or fraud.
Our audit included performing procedures to assess the risks of material misstatement of the financial statements, whether due to error or fraud, and performing procedures that respond to those risks. Such procedures included examining, on a test basis, evidence regarding the amounts and disclosures in the financial statements. Our audit also included evaluating the accounting principles used and significant estimates made by management, as well as evaluating the overall presentation of the financial statements. Our procedures included confirmation of securities owned as of March 31, 2018 by correspondence with the custodian, transfer agent and brokers. We believe that our audit provides a reasonable basis for our opinion.
/s/PricewaterhouseCoopers LLP
Minneapolis, Minnesota
May 22, 2018
We have served as auditors of one or more investment companies within the Columbia Funds Complex since 1977.
Columbia Solutions Aggressive Portfolio | Annual Report 2018
| 25 |
Federal Income Tax Information
(Unaudited)
The Fund hereby designates the following tax attributes for the fiscal year ended March 31, 2018. Shareholders will be notified in early 2019 of the amounts for use in preparing 2018 income tax returns.
Capital
gain
dividend | |
| $117,167 | |
Capital gain dividend. The Fund designates as a capital gain dividend the amount reflected above, or if subsequently determined to be different, the net capital gain of such fiscal period.
| 26 | Columbia Solutions Aggressive Portfolio | Annual Report 2018 |
Shareholders elect the Board that oversees the Fund’s operations. The Board appoints officers who are responsible for day-to-day business decisions based on policies set by the Board. The following table provides basic biographical information about the Fund’s Trustees, including their principal occupations during the past five years, although specific titles for individuals may have varied over the period. The year set forth beneath Length of Service in the table below is the year in which the Trustee was first appointed or elected as Trustee to any Fund currently in the Columbia Funds Complex or a predecessor thereof. Under current Board policy, members serve terms of indefinite duration.
Independent trustees
| Name, address, year of birth | Position held with the Trust and length of service | Principal occupation(s) during the past five years and other relevant professional experience | Number of Funds in the Columbia Fund Complex overseen | Other directorships held by Trustee during the past five years |
Janet Langford Carrig
c/o Columbia Management
Investment Advisers, LLC
225 Franklin Street
Mail Drop BX32 05228
Boston, MA 02110
1957 | Trustee
1996 | Senior Vice President, General Counsel and Corporate Secretary, ConocoPhillips (independent energy company) since September 2007 | 71 | None |
Douglas A. Hacker
c/o Columbia Management
Investment Advisers, LLC
225 Franklin Street
Mail Drop BX32 05228
Boston, MA 02110
1955 | Trustee and Chairman of the Board
1996 | Independent business executive since May 2006; Executive Vice President — Strategy of United Airlines from December 2002 to May 2006; President of UAL Loyalty Services (airline marketing company) from September 2001 to December 2002; Executive Vice President and Chief Financial Officer of United Airlines from July 1999 to September 2001 | 71 | Spartan Nash Company, (food distributor); Nash Finch Company (food distributor) from 2005 to 2013; Aircastle Limited (aircraft leasing); SeaCube Container Leasing Ltd. (container leasing) from 2010 to 2013; and Travelport Worldwide Limited (travel information technology) |
Nancy T. Lukitsh
c/o Columbia Management
Investment Advisers, LLC
225 Franklin Street
Mail Drop BX32 05228
Boston, MA 02110
1956 | Trustee
2011 | Senior Vice President, Partner and Director of Marketing, Wellington Management Company, LLP (investment adviser) from 1997 to 2010; Chair, Wellington Management Portfolios (commingled non-U.S. investment pools) from 2007 to 2010; Director, Wellington Trust Company, NA and other Wellington affiliates from 1997 to 2010 | 71 | None |
David M. Moffett
c/o Columbia Management
Investment Advisers, LLC
225 Franklin Street
Mail Drop BX32 05228
Boston, MA 02110
1952 | Trustee
2011 | Retired. Consultant to Bridgewater and Associates | 71 | Director, CSX Corporation; Genworth Financial, Inc. (financial and insurance products and services); PayPal Holdings Inc. (payment and data processing services); Trustee, University of Oklahoma Foundation; former Director, eBay Inc. (online trading community), 2007-2015; and former Director, CIT Bank, CIT Group Inc. (commercial and consumer finance), 2010-2016 |
John J. Neuhauser
c/o Columbia Management
Investment Advisers, LLC
225 Franklin Street
Mail Drop BX32 05228
Boston, MA 02110
1943 | Trustee
1984 | President, Saint Michael’s College since August 2007; Director or Trustee of several non-profit organizations, including University of Vermont Medical Center; Academic Vice President and Dean of Faculties, Boston College from August 1999 to October 2005; University Professor, Boston College from November 2005 to August 2007 | 71 | Liberty All-Star Equity Fund and Liberty All- Star Growth Fund (closed-end funds) |
Columbia Solutions Aggressive Portfolio | Annual Report 2018
| 27 |
TRUSTEES AND OFFICERS (continued)
Independent trustees (continued)
| Name, address, year of birth | Position held with the Trust and length of service | Principal occupation(s) during the past five years and other relevant professional experience | Number of Funds in the Columbia Fund Complex overseen | Other directorships held by Trustee during the past five years |
Patrick J. Simpson
c/o Columbia Management
Investment Advisers, LLC
225 Franklin Street
Mail Drop BX32 05228
Boston, MA 02110
1944 | Trustee
2000 | Of Counsel, Perkins Coie LLP (law firm) since 2015; Partner, Perkins Coie LLP from 1988 to 2014 | 71 | None |
Anne-Lee Verville
c/o Columbia Management
Investment Advisers, LLC
225 Franklin Street
Mail Drop BX32 05228
Boston, MA 02110
1945 | Trustee
1998 | Retired. General Manager, Global Education Industry from 1994 to 1997, President – Application Systems Division from 1991 to 1994, Chief Financial Officer – US Marketing & Services from 1988 to 1991, and Chief Information Officer from 1987 to 1988, IBM Corporation (computer and technology) | 71 | Enesco Group, Inc. (producer of giftware and home and garden decor products) from 2001 to 2006 |
Consultants to the Independent Trustees*
| Name, address, year of birth | Position held with the Trust and length of service | Principal occupation(s) during the past five years and other relevant professional experience | Number of Funds in the Columbia Funds complex overseen | Other directorships held by Trustee during the past five years |
J. Kevin Connaughton
c/o Columbia
Management Investment
Advisers, LLC,
225 Franklin Street
Mail Drop BX32 05228,
Boston, MA 02110
1964 | Independent Trustee Consultant
2016 | Independent Trustee Consultant, Columbia Funds since March 2016; Adjunct Professor of Finance, Bentley University since November 2017; Managing Director and General Manager of Mutual Fund Products, Columbia Management Investment Advisers, LLC from May 2010 to February 2015; President, Columbia Funds from 2009 to 2015; and senior officer of Columbia Funds and affiliated funds from 2003 to 2015 | 71 | Director, The Autism Project since March 2015; former Trustee, New Century Portfolios, March 2015-December 2017; formerly on Board of Governors, Gateway Healthcare, January 2016 – December 2017 |
Natalie A. Trunow
c/o Columbia
Management Investment
Advisers, LLC,
225 Franklin Street
Mail Drop BX32 05228,
Boston, MA 02110
1967 | Independent Trustee Consultant
2016 | Independent Trustee Consultant, Columbia Funds since September 2016; Chief Executive Officer, Millennial Portfolio Solutions LLC (asset management and consulting services) since January 2016; Director of Investments, Casey Family Programs from April 2016 to September 2016; Senior Vice President and Chief Investment Officer, Calvert Investments from August 2008 to January 2016; Section Head and Portfolio Manager, General Motors Asset Management from June 1997 to August 2008 | 71 | Director, Health Services for Children with Special Needs, Inc.; Director, Guidewell Financial Solutions |
| * | J. Kevin Connaughton was appointed consultant to the Independent Trustees effective March 1, 2016. Natalie A. Trunow was appointed consultant to the Independent Trustees effective September 1, 2016. Shareholders of the Funds are expected to be asked to elect each of Mr. Connaughton and Ms. Trunow as a Trustee at a future shareholder meeting. |
| 28 | Columbia Solutions Aggressive Portfolio | Annual Report 2018 |
TRUSTEES AND OFFICERS (continued)
Interested trustee affiliated with Investment Manager*
| Name, address, year of birth | Position held with the Trust and length of service | Principal occupation(s) during the past five years and other relevant professional experience | Number of Funds in the Columbia Funds Complex overseen | Other directorships held by Trustee during the past five years |
William F. Truscott
c/o Columbia Management
Investment Advisers, LLC
225 Franklin Street
Boston, MA 02110
1960 | Trustee
2012 | Chairman of the Board and President, Columbia Management Investment Advisers, LLC since May 2010 and February 2012, respectively; Chief Executive Officer, Global Asset Management, Ameriprise Financial, Inc. since September 2012 (previously Chief Executive Officer, U.S. Asset Management & President, Annuities, May 2010-September 2012); Director and Chief Executive Officer, Columbia Management Investment Distributors, Inc. since May 2010 and February 2012, respectively; Chairman of the Board and Chief Executive Officer, RiverSource Distributors, Inc. since 2006; Director, Threadneedle Asset Management Holdings, SARL since 2014; President and Chief Executive Officer, Ameriprise Certificate Company, 2006-August 2012 | 196 | Chairman of the Board, Columbia Management Investment Advisers, LLC since May 2010; Director, Columbia Management Investment Distributors, Inc. since May 2010; former Director, Ameriprise Certificate Company, 2006 - January 2013 |
| * | Interested person (as defined under the 1940 Act) by reason of being an officer, director, security holder and/or employee of the Investment Manager or Ameriprise Financial. |
The Statement of Additional Information has additional information about the Fund’s Board members and is available, without charge, upon request by calling 800.345.6611, visiting columbiathreadneedleus.com/investor/ or contacting your financial intermediary.
Columbia Solutions Aggressive Portfolio | Annual Report 2018
| 29 |
TRUSTEES AND OFFICERS (continued)
The Board has appointed officers who are responsible for day-to-day business decisions based on policies it has established. The officers serve at the pleasure of the Board. The following table provides basic information about the Officers of the Fund, including principal occupations during the past five years, although their specific titles may have varied over the period. In addition to Mr. Truscott, who is Senior Vice President, the Fund’s other officers are:
Fund officers
Name,
address and
year of birth | Position and year
first appointed to
position for any Fund
in the Columbia
Funds complex or a
predecessor thereof | Principal occupation(s) during past five years |
Christopher O. Petersen
5228 Ameriprise
Financial Center
Minneapolis, MN 55474
Born 1970 | President and Principal Executive Officer (2015) | Vice President and Lead Chief Counsel, Ameriprise Financial, Inc. since January 2015 (previously, Vice President and Chief Counsel, January 2010 - December 2014; officer of Columbia Funds and affiliated funds since 2007. |
Michael G. Clarke
225 Franklin Street
Boston, MA 02110
Born 1969 | Treasurer (2011), Chief Financial Officer (2009) and Chief Accounting Officer (2015) | Vice President — Mutual Fund Administration, Columbia Management Investment Advisers, LLC, since May 2010; senior officer of Columbia Funds and affiliated funds since 2002. |
Paul B. Goucher
100 Park Avenue
New York, NY 10017
Born 1968 | Senior Vice President (2011) and Assistant Secretary (2008) | Senior Vice President and Assistant General Counsel, Ameriprise Financial, Inc. since January 2017 (previously Vice President and Lead Chief Counsel, November 2008 - January 2017 and January 2013 - January 2017, respectively; and Chief Counsel, January 2010 - January 2013); Vice President, Chief Legal Officer and Assistant Secretary, Columbia Management Investment Advisers, LLC since May 2010. |
Thomas P. McGuire
225 Franklin Street
Boston, MA 02110
Born 1972 | Senior Vice President and Chief Compliance Officer (2012) | Vice President — Asset Management Compliance, Ameriprise Financial, Inc., since May 2010; Chief Compliance Officer, Ameriprise Certificate Company since September 2010. |
Colin Moore
225 Franklin Street
Boston, MA 02110
Born 1958 | Senior Vice President (2010) | Executive Vice President and Global Chief Investment Officer, Ameriprise Financial, Inc., since July 2013; Executive Vice President and Global Chief Investment Officer, Columbia Management Investment Advisers, LLC since July 2013 (previously Director and Global Chief Investment Officer, 2010 - 2013). |
Ryan C. Larrenaga
225 Franklin Street
Boston, MA 02110
Born 1970 | Senior Vice President (2017), Chief Legal Officer (2017) and Secretary (2015) | Vice President and Group Counsel, Ameriprise Financial, Inc. since August 2011; officer of Columbia Funds and affiliated funds since 2005. |
Michael E. DeFao
225 Franklin Street
Boston, MA 02110
Born 1968 | Vice President (2011) and Assistant Secretary (2010) | Vice President and Chief Counsel, Ameriprise Financial, Inc. since May 2010. |
Amy Johnson
5228 Ameriprise
Financial Center
Minneapolis, MN 55474
Born 1965 | Vice President (2006) | Managing Director and Global Head of Operations, Columbia Management Investment Advisers, LLC since April 2016 (previously Managing Director and Chief Operating Officer, 2010 - 2016). |
Lyn Kephart-Strong
5228 Ameriprise
Financial Center
Minneapolis, MN 55474
Born 1960 | Vice President (2015) | President, Columbia Management Investment Services Corp. since October 2014; Vice President & Resolution Officer, Ameriprise Trust Company since August 2009. |
| 30 | Columbia Solutions Aggressive Portfolio | Annual Report 2018 |
Board Consideration and Approval of Management Agreement and Subadvisory Agreement
On August 16, 2017, the Board of Trustees (the Board) and the Trustees who are not interested persons (as defined in the Investment Company Act of 1940) (the Independent Trustees) of Columbia Funds Series Trust I (the Trust) unanimously approved, for an initial two-year term, the Management Agreement (the Management Agreement) with Columbia Management Investment Advisers, LLC (the Investment Manager) and the Subadvisory Agreement (the Subadvisory Agreement) between the Investment Manager and Threadneedle International Limited with respect to Columbia Solutions Aggressive Portfolio (the Fund), a series of the Trust. As detailed below, the Board’s Advisory Fees and Expenses Committee (the Committee) and the Board met to review and discuss, both among themselves and with the management team of the Investment Manager, materials provided by the Investment Manager and others before determining to approve the Management Agreement and the Subadvisory Agreement (collectively, the Agreements).
In connection with their deliberations regarding the proposed Management Agreement and Subadvisory Agreement, the Committee and the Board evaluated materials requested from the Investment Manager regarding the Fund and the Agreements, and discussed these materials, as well as other materials provided by the Investment Manager in connection with the Board’s most recent annual approval of the continuation of the management agreements with respect to other series of the Trust, with representatives of the Investment Manager at the Committee meeting held on August 15, 2017, and at Board meetings held on June 14, 2017 and August 15, 2017.
The Committee and the Board also consulted with Fund counsel and the Independent Trustees’ independent legal counsel, who advised on various matters with respect to the Committee’s and the Board’s considerations and otherwise assisted the Committee and the Board in their deliberations.
The Committee and the Board considered all information that they, their legal counsel or the Investment Manager believed reasonably necessary to evaluate and to determine whether to recommend for approval or approve the Management Agreement and the Subadvisory Agreement. The information and factors considered by the Committee and the Board in recommending for approval or approving the Management Agreement and the Subadvisory Agreement for the Fund included the following:
| • | The Investment Manager’s agreement to contractually limit or cap total operating expenses for the Fund through July 31, 2019 so that total operating expenses (excluding certain fees and expenses, such as transaction costs and certain other investment related expenses, interest, taxes, and infrequent and/or unusual expenses) would not exceed a specified annual rate, as a percentage of the Fund’s net assets; |
| • | The terms and conditions of the Agreements; |
| • | Information on the Fund’s proposed management fees and anticipated total expenses, including the absence of a management fee for the Fund; |
| • | The current and proposed terms and conditions of other agreements and arrangements with affiliates of the Investment Manager relating to the operations of the Fund, including agreements with respect to the provision of distribution, transfer agency and shareholder services to the Fund; |
| • | Descriptions of various functions performed by the Investment Manager and the Subadviser under the Agreements, including portfolio management and portfolio trading practices; |
| • | Information regarding the reputation, regulatory history and resources of the Investment Manager, including information regarding senior management, portfolio managers and other personnel; and |
| • | Information regarding the capabilities of the Investment Manager and the Subadviser with respect to compliance monitoring services, including an assessment of the Investment Manager’s and the Subadviser’s compliance systems by the Fund’s Chief Compliance Officer. |
Nature, extent and quality of services to be provided under the Agreements
The Committee and the Board considered the nature, extent and quality of services to be provided to the Fund by the Investment Manager, the Subadviser and the Investment Manager’s affiliates under the Agreements and under separate agreements for the provision of distribution, transfer agency and shareholder services, and the resources to be dedicated to
Columbia Solutions Aggressive Portfolio | Annual Report 2018
| 31 |
Board Consideration and Approval of Management Agreement and Subadvisory Agreement (continued)
the Fund and the other Columbia Funds by the Investment Manager, the Subadviser and the Investment Manager’s affiliates. The Committee and the Board considered, among other things, the Investment Manager’s ability to attract, motivate and retain highly qualified research, advisory and supervisory investment professionals (including compensation programs for personnel involved in fund management, reputation and other attributes), the portfolio management services provided by those investment professionals, and the quality of the Investment Manager’s and the Subadviser’s investment research capabilities and trade execution services. The Committee and the Board also considered the potential benefits to shareholders of investing in a mutual fund that is part of a fund complex offering exposure to a variety of asset classes and investment disciplines and providing a variety of fund and shareholder services.
The Committee and the Board also considered the professional experience and qualifications of the senior personnel of the Investment Manager and the Subadviser, which included consideration of the Investment Manager’s and the Subadviser’s experience with similarly-structured funds. The Committee and the Board noted the compliance programs of and the compliance-related resources provided to the Fund by the Investment Manager and its affiliates, and considered the Investment Manager’s ability to provide administrative services to the Fund and coordinate the activities of the Fund’s other service providers. The Board also noted that the Board had approved the Subadviser’s code of ethics and compliance program, and that the Chief Compliance Officer of the Funds reports to the Trustees on the Subadviser’s compliance program.
The Committee and the Board also considered the scope of services provided to the Fund by the Investment Manager that would be distinct from and in addition to those provided by the Subadviser in the event that the Investment Manager, in the future, allocated investments to be managed by the Subadviser, including cash flow management, treasury services, risk oversight, investment oversight and Subadviser selection, oversight and transition management.
After reviewing these and related factors, the Committee and the Board concluded, within the context of their overall conclusions, that the expected nature, extent and quality of the services to be provided to the Fund under the Agreements supported the approval of the Agreements.
Investment performance
Because the Fund had not yet commenced operations, the Committee and the Board did not have investment performance to compare to the returns of a group of comparable mutual funds. However, the Committee and the Board expected to consider, in connection with their next review and consideration of the continuation of the Agreements, the investment performance of the Fund in relation to the annualized return for various time periods of both a group of comparable funds, as determined by the independent third-party data provider, and a benchmark.
The Committee and the Board also considered the Investment Manager’s and Subadviser’s performance and reputation generally, the Investment Manager’s historical responsiveness to Board concerns about performance, and the Investment Manager’s willingness to take steps intended to improve performance. After reviewing these and related factors, the Committee and the Board concluded, within the context of their overall conclusions, that the performance of the Investment Manager and the Subadviser were sufficient, in light of other considerations, to warrant the approval of the Agreements.
The Committee and the Board noted that they most recently reviewed the performance of the Columbia Adaptive Risk Allocation Fund, which utilizes an investment approach generally similar to the Fund, in connection with the Board’s most recent annual approval of the continuation of the management agreement with respect to the Columbia Adaptive Risk Allocation Fund at its June 14, 2017 Board meeting, including information about the performance of the Columbia Adaptive Risk Allocation Fund over various time periods, including performance information relative to benchmarks and information that compared the performance of the Columbia Adaptive Risk Allocation Fund to the performance of a group of comparable mutual funds as determined by an independent third party data provider.
Investment management fee rates and other expenses
The Committee and the Board considered the absence of management fees to be charged to the Fund under the Management Agreement and the Subadvisory Agreement, as well as the total expenses expected to be incurred by the Fund. In assessing the reasonableness of the proposed fees under the Agreements, the Committee and the Board considered, among other information, the Fund’s proposed management fee and its expected total expense ratio as a percentage of
| 32 | Columbia Solutions Aggressive Portfolio | Annual Report 2018 |
Board Consideration and Approval of Management Agreement and Subadvisory Agreement (continued)
average daily net assets. The Committee and the Board also noted that the Investment Manager will pay the fees of the Subadviser if and when the Investment Manager allocates assets of the Fund to be managed by the Subadviser. The Committee and the Board noted that the Subadviser was not currently expected to manage any assets under the Subadvisory Agreement, but that the Investment Manager could, in the future, allocate investments to be managed by the Subadviser. The Committee and the Board also took into account the proposed fee waiver and expense limitation arrangements that the Investment Manager and the Subadviser would observe during the Fund’s first year.
After reviewing these and related factors, the Committee and the Board concluded, within the context of their overall conclusions, that the management fee rates and expenses of the Fund supported the approval of the Agreements.
Costs of services to be provided and profitability
The Committee and the Board also took note of the absence of management fees and the proposed fee waiver and expense limitation arrangements, and also noted that the Committee and the Board expected to consider the costs of services and the profitability of the Investment Manager and its affiliates in connection with the Committee’s and the Board’s next review and consideration of the continuation of the Agreements. The Committee and the Board also considered court cases in which adviser profitability was an issue in whole or in part, the performance of similarly managed funds, the expected expense ratio of the Fund, and the implementation of expense limitations with respect to the Fund. In addition, the Committee and the Board considered information provided by the Investment Manager regarding the Investment Manager’s financial condition.
After reviewing these and related factors, the Committee and the Board concluded, within the context of their overall conclusions, that the expected profitability to the Investment Manager and its affiliates from their relationships with the Fund supported the approval of the Agreements.
Economies of scale
The Committee and the Board considered the potential existence of economies of scale in the provision by the Investment Manager of services to the Fund, to groups of related funds, and to the Investment Manager’s investment advisory clients as a whole, and whether those economies of scale were expected to be shared with the Fund through breakpoints in the proposed investment management fees or other means, such as expense limitation arrangements and additional investments by the Investment Manager in investment, trading, compliance and other resources.
After reviewing these and related factors, the Committee and the Board concluded, within the context of their overall conclusions, that the absence of management fees and the proposed fee waiver and expense limitation arrangements supported the approval of the Agreements.
Other benefits to the Investment Manager
The Committee and the Board received and considered information regarding “fall-out” or ancillary benefits to be received by the Investment Manager and its affiliates as a result of their relationships with the Fund, such as the engagement of the Investment Manager’s affiliates to provide distribution, transfer agency and shareholder services to the Fund. The Committee and the Board also considered the benefits of research made available to the Investment Manager by reason of brokerage commissions to be generated by the Fund’s securities transactions, and reviewed information about the Investment Manager’s practices with respect to allocating portfolio transactions for brokerage and research services. The Committee and the Board recognized that the Investment Manager’s profitability would be somewhat lower without these benefits.
Conclusion
The Committee and the Board reviewed all of the above considerations in reaching their decisions to recommend for approval or approve the proposed Agreements. In their deliberations, the Trustees did not identify any particular information that was all-important or controlling, and individual Trustees may have attributed different weights to the various factors. Based on their evaluation of all factors that they deemed to be material, including those factors described above, and assisted by the advice of independent legal counsel, the Board, including the Independent Trustees, voting separately, approved the Agreements.
Columbia Solutions Aggressive Portfolio | Annual Report 2018
| 33 |
The Fund mails one shareholder report to each shareholder address. If you would like more than one report, please call shareholder services at 800.345.6611 and additional reports will be sent to you.
Proxy voting policies and procedures
The policy of the Board of Trustees is to vote the proxies of the companies in which the Fund holds investments consistent with the procedures as stated in the Statement of Additional Information (SAI). You may obtain a copy of the SAI without charge by calling 800.345.6611; contacting your financial intermediary; visiting columbiathreadneedleus.com/investor/; or searching the website of the Securities and Exchange Commission (SEC) at sec.gov. Information regarding how the Fund voted proxies relating to portfolio securities is filed with the SEC by August 31st for the most recent 12-month period ending June 30th of that year, and is available without charge by visiting columbiathreadneedleus.com/investor/, or searching the website of the SEC at sec.gov.
Quarterly schedule of investments
The Fund files a complete schedule of portfolio holdings with the SEC for the first and third quarters of each fiscal year on Form N-Q. The Fund’s Form N-Q is available on the SEC’s website at sec.gov and may be reviewed and copied at the SEC’s Public Reference Room in Washington, D.C. Information on the operation of the Public Reference Room may be obtained by calling 800.SEC.0330. The Fund’s complete schedule of portfolio holdings, as filed on Form N-Q, can also be obtained without charge, upon request, by calling 800.345.6611.
Additional Fund information
For more information about the Fund, please visit columbiathreadneedleus.com/investor/ or call 800.345.6611. Customer Service Representatives are available to answer your questions Monday through Friday from 8 a.m. to 7 p.m. Eastern time.
You may obtain the current net asset value (NAV) of Fund shares at no cost by calling 800.345.6611 or by sending an e-mail to serviceinquiries@columbiathreadneedle.com.
Fund investment manager
Columbia Management Investment Advisers, LLC
225 Franklin Street
Boston, MA 02110
Fund distributor
Columbia Management Investment Distributors, Inc.
225 Franklin Street
Boston, MA 02110
Fund transfer agent
Columbia Management Investment Services Corp.
P.O. Box 8081
Boston, MA 02266-8081
| 34 | Columbia Solutions Aggressive Portfolio | Annual Report 2018 |
[THIS PAGE INTENTIONALLY LEFT BLANK]
[THIS PAGE INTENTIONALLY LEFT BLANK]
[THIS PAGE INTENTIONALLY LEFT BLANK]
Columbia Solutions Aggressive Portfolio
P.O. Box 8081
Boston, MA 02266-8081
Please read and consider the investment objectives, risks, charges and expenses for any fund carefully before investing. For a prospectus, which contains this and other important information about the Fund, go to columbiathreadneedleus.com/investor/. The Fund is distributed by Columbia Management Investment Distributors, Inc., member FINRA, and managed by Columbia Management Investment Advisers, LLC.
Columbia Threadneedle Investments (Columbia Threadneedle) is the global brand name of the Columbia and Threadneedle group of companies. All rights reserved. Columbia Management Investment Distributors, Inc., 225 Franklin Street, Boston, MA 02110-2804
© 2018 Columbia Management Investment Advisers, LLC.
columbiathreadneedleus .com/investor/

Annual Report
March 31, 2018
Columbia Solutions Conservative Portfolio
Not FDIC Insured • No bank guarantee • May lose value
Dear Shareholders,
The year 2017 was an extraordinary year in the financial markets. The S&P 500 Index didn’t experience a single down month and returned over 20%. Continuing this trend, January 2018 marked the fastest start for the index ever. Low volatility, which had been a feature of the U.S. equity market for several years, along with the surge in the S&P 500 Index, drove investor sentiment to very high levels. This arguably set the stage for an overdue correction, which we witnessed in February 2018.
A return to volatility
There have been few periods of market upheaval such as were experienced in the first part of 2018. While investors were taken by surprise by the sudden and pronounced market swings, the return to some level of volatility actually marked a resumption of relatively normal market conditions. Having said that, it’s important to distinguish between a good technical correction where excess enthusiasm in the marketplace is being let out, versus a real change in the underlying fundamentals – things like an underperforming economy or weaker corporate earnings. Our view is that the recent market volatility falls into the former category, and the fundamentals remain strong. We’re continuing to see improvements in global economic activity, and we’re seeing corporate earnings expectations continue to rise – and not just because of tax reform.
Consistency is more important than ever
It’s important to keep in mind that when it comes to long-term investing, it’s the destination, not the journey that matters most. If you have a financial goal that you’ve worked out with your financial advisor, and you have a good asset allocation plan to reach it, it’s a question of sticking with your plan rather than become focused on near-term volatility. Bouts of volatility are normal. After all, it’s hard to cross the ocean without hitting an occasional rough patch. You need to focus on the destination.
One final thought. In weathering volatility, it’s the consistency of the return that is essential. Investors who chase higher returns are usually the first to sell when an investment goes through a bad patch, and they therefore don’t tend to benefit from the recovery. More disciplined investors who perhaps panic less or not at all during periods of volatility, tend to have improved long-term results and are more likely to reach their financial goals. Nothing is more important to us than making sure those who have entrusted us to protect and grow their assets are able to do what matters most to them.
Your success is our priority. Talk to your financial advisor about how working with Columbia Threadneedle Investments may help you position your portfolio for consistent, sustainable outcomes, no matter the market conditions.
Sincerely,
Christopher O. Petersen
President, Columbia Funds
The S&P 500 Index, an unmanaged index, measures the performance of 500 widely held, large-capitalization U.S. stocks and is frequently used as a general measure of market performance. Past performance is no guarantee of future results.
Columbia Funds are distributed by Columbia Management Investment Distributors, Inc., member FINRA, and managed by Columbia Management Investment Advisers, LLC.
© 2018 Columbia Management Investment Advisers, LLC. All rights reserved.
Columbia Solutions Conservative Portfolio | Annual Report 2018
Columbia Solutions Conservative Portfolio | Annual Report 2018
Investment objective
Columbia Solutions Conservative Portfolio (the Fund) pursues consistent total returns by seeking to allocate risks across multiple asset classes.
Portfolio management
Jeffrey Knight, CFA
Lead Portfolio Manager
Managed Fund since October 2017
Joshua Kutin, CFA
Portfolio Manager
Managed Fund since October 2017
Alexander Wilkinson, CFA
Portfolio Manager
Managed Fund since October 2017
| Portfolio breakdown (%) (at March 31, 2018) |
| Foreign Government Obligations | 9.8 |
| Money Market Funds(a) | 71.8 |
| U.S. Treasury Obligations | 18.4 |
| Total | 100.0 |
| (a) | Includes investments in Money Market Funds (amounting to $5.6 million) which have been segregated to cover obligations relating to the Fund’s investment in derivatives which provide exposure to multiple markets. For a description of the Fund’s investments in derivatives, see Investments in derivatives following the Portfolio of Investments and Note 2 to the Notes to Financial Statements. |
Percentages indicated are based upon total investments. The Fund’s portfolio composition is subject to change.
| Market exposure through derivatives investments (% of notional exposure) (at March 31, 2018)(a) |
| | Long | Short | Net |
| Fixed Income Derivative Contracts | 92 | (6.6) | 85.4 |
| Equity Derivative Contracts | 45.3 | — | 45.3 |
| Foreign Currency Derivative Contracts | 3.2 | (33.9) | (30.7) |
| Total Notional Market Value of Derivative Contracts | 140.5 | (40.5) | 100.0 |
(a) The Fund has market exposure (long and/or short) to fixed income, equity asset classes and foreign currency through its investments in derivatives. The notional exposure of a financial instrument is the nominal or face amount that is used to calculate payments made on that instrument and/or changes in value for the instrument. The notional exposure is a hypothetical underlying quantity upon which payment obligations are computed. Notional exposures provide a gauge for how the Fund may behave given changes in individual markets. For a description of the Fund’s investments in derivatives, see Investments in derivatives following the Portfolio of Investments, and Note 2 to the Notes to Financial Statements.
| 2 | Columbia Solutions Conservative Portfolio | Annual Report 2018 |
Understanding Your Fund’s Expenses
(Unaudited)
As an investor, you incur two types of costs. There are transaction costs, which may include redemption fees. There are also ongoing costs, which generally include management fees, distribution and/or service fees, and other fund expenses. The following information is intended to help you understand your ongoing costs (in dollars) of investing in the Fund and to help you compare these costs with the ongoing costs of investing in other mutual funds.
Analyzing your Fund’s expenses
To illustrate these ongoing costs, we have provided examples and calculated the expenses paid by investors of the Fund during the period. The actual and hypothetical information in the table is based on an initial investment of $1,000 at the beginning of the period indicated and held for the entire period. Expense information is calculated two ways and each method provides you with different information. The amount listed in the “Actual” column is calculated using the Fund’s actual operating expenses and total return for the period. You may use the Actual information, together with the amount invested, to estimate the expenses that you paid over the period. Simply divide your account value by $1,000 (for example, an $8,600 account value divided by $1,000 = 8.6), then multiply the results by the expenses paid during the period under the “Actual” column. The amount listed in the “Hypothetical” column assumes a 5% annual rate of return before expenses (which is not the Fund’s actual return) and then applies the Fund’s actual expense ratio for the period to the hypothetical return. You should not use the hypothetical account values and expenses to estimate either your actual account balance at the end of the period or the expenses you paid during the period. See “Compare with other funds” below for details on how to use the hypothetical data.
Compare with other funds
Since all mutual funds are required to include the same hypothetical calculations about expenses in shareholder reports, you can use this information to compare the ongoing cost of investing in the Fund with other funds. To do so, compare the hypothetical example with the 5% hypothetical examples that appear in the shareholder reports of other funds. As you compare hypothetical examples of other funds, it is important to note that hypothetical examples are meant to highlight the ongoing costs of investing in a fund only and do not reflect any transaction costs, such as redemption or exchange fees. Therefore, the hypothetical calculations are useful in comparing ongoing costs only, and will not help you determine the relative total costs of owning different funds. If transaction costs were included in these calculations, your costs would be higher.
| October 1, 2017 — March 31, 2018 |
| | Account value at the
beginning of the
period ($) | Account value at the
end of the
period ($) | Expenses paid during
the period ($) | Fund’s annualized
expense ratio (%) |
| | Actual | Hypothetical | Actual | Hypothetical | Actual | Hypothetical | Actual |
| | 1,000.00 | 1,000.00 | 1,009.00 (a) | 1,024.74 | 0.04 (a) | 0.05 | 0.01 (a) |
| (a) | Based on operations from October 24, 2017 (commencement of operations) through the stated period end. |
Expenses paid during the period are equal to the annualized expense ratio as indicated above, multiplied by the average account value over the period and then multiplied by the number of days in the Fund’s most recent fiscal half year and divided by 365.
Expenses do not include fees and expenses incurred indirectly by the Fund from its investment in underlying funds, including affiliated and non-affiliated pooled investment vehicles, such as mutual funds and exchange-traded funds.
Had Columbia Management Investment Advisers, LLC and/or certain of its affiliates not waived/reimbursed certain fees and expenses, account value at the end of the period would have been reduced.
Columbia Solutions Conservative Portfolio | Annual Report 2018
| 3 |
Portfolio of Investments
March 31, 2018
(Percentages represent value of investments compared to net assets)
Investments in securities
| Foreign Government Obligations(a),(b) 9.5% |
| Issuer | Coupon
Rate | | Principal
Amount ($) | Value ($) |
| Austria 1.2% |
| Republic of Austria Government Bond(c) |
| 11/22/2022 | 3.400% | EUR | 68,000 | 97,301 |
| Belgium 1.3% |
| Kingdom of Belgium Government Bond(c) |
| 06/22/2024 | 2.600% | EUR | 35,000 | 49,469 |
| 06/22/2027 | 0.800% | EUR | 40,000 | 49,934 |
| Total | 99,403 |
| France 1.3% |
| French Republic Government Bond OAT(c) |
| 05/25/2045 | 3.250% | EUR | 30,000 | 51,560 |
| 05/25/2048 | 2.000% | EUR | 38,000 | 51,642 |
| Total | 103,202 |
| Italy 1.0% |
| Italy Buoni Poliennali Del Tesoro(c) |
| 09/01/2046 | 3.250% | EUR | 31,000 | 41,877 |
| 03/01/2047 | 2.700% | EUR | 33,000 | 40,170 |
| Total | 82,047 |
| Mexico 0.1% |
| Mexican Bonos |
| 06/10/2021 | 6.500% | MXN | 200,000 | 10,784 |
| Netherlands 3.0% |
| Netherlands Government Bond(c) |
| 07/15/2027 | 0.750% | EUR | 192,000 | 241,204 |
| Foreign Government Obligations(a),(b) (continued) |
| Issuer | Coupon
Rate | | Principal
Amount ($) | Value ($) |
| Spain 1.6% |
| Spain Government Bond(c) |
| 10/31/2024 | 2.750% | EUR | 87,000 | 122,520 |
Total Foreign Government Obligations
(Cost $726,271) | 756,461 |
|
| U.S. Treasury Obligations 18.0% |
| | | | |
| U.S. Treasury |
| 02/15/2021 | 3.625% | | 400,000 | 413,745 |
| 11/30/2024 | 2.125% | | 430,000 | 415,534 |
| 08/15/2027 | 2.250% | | 300,000 | 287,684 |
| 11/15/2027 | 2.250% | | 303,000 | 290,252 |
| 02/15/2045 | 2.500% | | 20,000 | 18,264 |
Total U.S. Treasury Obligations
(Cost $1,457,960) | 1,425,479 |
| Money Market Funds 69.9% |
| | Shares | Value ($) |
| Columbia Short-Term Cash Fund, 1.738%(d),(e) | 5,553,757 | 5,553,202 |
Total Money Market Funds
(Cost $5,553,713) | 5,553,202 |
Total Investments in Securities
(Cost: $7,737,944) | 7,735,142 |
| Other Assets & Liabilities, Net | | 202,972 |
| Net Assets | 7,938,114 |
At March 31, 2018, securities and/or cash totaling $165,769 were pledged as collateral.
Investments in derivatives
| Forward foreign currency exchange contracts |
Currency to
be sold | Currency to
be purchased | Counterparty | Settlement
date | Unrealized
appreciation ($) | Unrealized
depreciation ($) |
| 18,513,000 JPY | 172,665 USD | HSBC | 04/09/2018 | — | (1,386) |
| 201,000 MXN | 10,661 USD | HSBC | 04/09/2018 | — | (385) |
| 67,000 NOK | 8,550 USD | HSBC | 04/09/2018 | 1 | — |
| 804,000 SEK | 99,725 USD | HSBC | 04/09/2018 | 3,393 | — |
| 15,000 SGD | 11,377 USD | HSBC | 04/09/2018 | — | (65) |
| 76,211 USD | 620,000 SEK | HSBC | 04/09/2018 | — | (1,926) |
| 63,000 AUD | 49,405 USD | Morgan Stanley | 04/09/2018 | 1,018 | — |
| 56,000 CHF | 60,082 USD | Morgan Stanley | 04/09/2018 | 1,476 | — |
| 91,000 DKK | 15,126 USD | Morgan Stanley | 04/09/2018 | 100 | — |
| 815,000 EUR | 1,008,351 USD | Morgan Stanley | 04/09/2018 | 5,105 | — |
| 117,000 GBP | 164,012 USD | Morgan Stanley | 04/09/2018 | — | (181) |
The accompanying Notes to Financial Statements are an integral part of this statement.
| 4 | Columbia Solutions Conservative Portfolio | Annual Report 2018 |
Portfolio of Investments (continued)
March 31, 2018
| Forward foreign currency exchange contracts (continued) |
Currency to
be sold | Currency to
be purchased | Counterparty | Settlement
date | Unrealized
appreciation ($) | Unrealized
depreciation ($) |
| 31,819 USD | 26,000 EUR | Morgan Stanley | 04/09/2018 | 186 | — |
| 44,689 USD | 32,000 GBP | Morgan Stanley | 04/09/2018 | 219 | — |
| Total | | | | 11,498 | (3,943) |
| Long futures contracts |
| Description | Number of
contracts | Expiration
date | Trading
currency | Notional
amount | Value/Unrealized
appreciation ($) | Value/Unrealized
depreciation ($) |
| 10-Year Mini JGB | 6 | 06/2018 | JPY | 90,773,763 | 772 | — |
| Australian 3-Year Bond | 2 | 06/2018 | AUD | 222,348 | 212 | — |
| Euro-Bobl | 1 | 06/2018 | EUR | 132,035 | 1,120 | — |
| Euro-Bund | 2 | 06/2018 | EUR | 319,602 | 5,844 | — |
| Long Gilt | 1 | 06/2018 | GBP | 125,164 | 3,101 | — |
| MSCI EAFE Index | 7 | 06/2018 | USD | 700,210 | — | (12,616) |
| MSCI Emerging Markets Index | 4 | 06/2018 | USD | 237,560 | — | (7,708) |
| S&P 500 E-mini | 8 | 06/2018 | USD | 1,057,200 | — | (58,380) |
| S&P/TSX 60 Index | 1 | 06/2018 | CAD | 181,200 | — | (1,730) |
| U.S. Treasury 10-Year Note | 10 | 06/2018 | USD | 1,217,357 | 9,308 | — |
| U.S. Treasury 5-Year Note | 3 | 06/2018 | USD | 343,971 | 1,077 | — |
| U.S. Treasury Ultra 10-Year Note | 1 | 06/2018 | USD | 131,263 | 1,846 | — |
| Total | | | | | 23,280 | (80,434) |
| Short futures contracts |
| Description | Number of
contracts | Expiration
date | Trading
currency | Notional
amount | Value/Unrealized
appreciation ($) | Value/Unrealized
depreciation ($) |
| Canadian Government 10-Year Bond | (3) | 06/2018 | CAD | (402,514) | — | (3,387) |
| Cleared credit default swap contracts - sell protection |
Reference
entity | Counterparty | Maturity
date | Receive
fixed
rate
(%) | Payment
frequency | Implied
credit
spread
(%)* | Notional
currency | Notional
amount | Value
($) | Upfront
payments
($) | Upfront
receipts
($) | Unrealized
appreciation
($) | Unrealized
depreciation
($) |
| Markit CDX North America High Yield Index, Series 30 | Morgan Stanley | 06/20/2023 | 5.000 | Quarterly | 3.604% | USD | 626,000 | (257) | — | — | — | (257) |
| Markit CDX North America Investment Grade Index, Series 30 | Morgan Stanley | 06/20/2023 | 1.000 | Quarterly | 0.655% | USD | 261,000 | (243) | — | — | — | (243) |
| Total | | | | | | | | (500) | — | — | — | (500) |
| * | Implied credit spreads, represented in absolute terms, utilized in determining the market value of credit default swap agreements on corporate or sovereign issues as of period end serve as an indicator of the current status of the payment/performance risk and represent the likelihood or risk of default for the credit derivative. The implied credit spread of a particular referenced entity reflects the cost of buying/selling protection and may include upfront payments required to be made to enter into the agreement. Wider credit spreads represent a deterioration of the referenced entity’s credit soundness and a greater likelihood or risk of default or other credit event occurring as defined under the terms of the agreement. |
Notes to Portfolio of Investments
| (a) | Principal amounts are denominated in United States Dollars unless otherwise noted. |
| (b) | Principal and interest may not be guaranteed by the government. |
| (c) | Represents privately placed and other securities and instruments exempt from SEC registration (collectively, private placements), such as Section 4(a)(2) and Rule 144A eligible securities, which are often sold only to qualified institutional buyers. The Fund may invest in private placements determined to be liquid as well as those determined to be illiquid. Private placements may be determined to be liquid under guidelines established by the Fund’s Board of Trustees. At March 31, 2018, the value of these securities amounted to $745,677, which represents 9.39% of net assets. |
| (d) | The rate shown is the seven-day current annualized yield at March 31, 2018. |
The accompanying Notes to Financial Statements are an integral part of this statement.
Columbia Solutions Conservative Portfolio | Annual Report 2018
| 5 |
Portfolio of Investments (continued)
March 31, 2018
Notes to Portfolio of Investments (continued)
| (e) | As defined in the Investment Company Act of 1940, an affiliated company is one in which the Fund owns 5% or more of the company’s outstanding voting securities, or a company which is under common ownership or control with the Fund. Holdings and transactions in these affiliated companies during the year ended March 31, 2018 are as follows: |
| Issuer | Beginning
shares | Shares
purchased | Shares
sold | Ending
shares | Realized gain
(loss) —
affiliated
issuers ($) | Net change in
unrealized
appreciation
(depreciation) —
affiliated
issuers ($) | Dividends —
affiliated
issuers ($) | Value —
affiliated
issuers
at end of
period ($) |
| Columbia Short-Term Cash Fund, 1.738% |
| | — | 8,928,373 | (3,374,616) | 5,553,757 | (47) | (511) | 34,595 | 5,553,202 |
Currency Legend
| AUD | Australian Dollar |
| CAD | Canada Dollar |
| CHF | Swiss Franc |
| DKK | Danish Krone |
| EUR | Euro |
| GBP | British Pound |
| JPY | Japanese Yen |
| MXN | Mexican Peso |
| NOK | Norwegian Krone |
| SEK | Swedish Krona |
| SGD | Singapore Dollar |
| USD | US Dollar |
Fair value measurements
The Fund categorizes its fair value measurements according to a three-level hierarchy that maximizes the use of observable inputs and minimizes the use of unobservable inputs by prioritizing that the most observable input be used when available. Observable inputs are those that market participants would use in pricing an investment based on market data obtained from sources independent of the reporting entity. Unobservable inputs are those that reflect the Fund’s assumptions about the information market participants would use in pricing an investment. An investment’s level within the fair value hierarchy is based on the lowest level of any input that is deemed significant to the asset’s or liability’s fair value measurement. The input levels are not necessarily an indication of the risk or liquidity associated with investments at that level. For example, certain U.S. government securities are generally high quality and liquid, however, they are reflected as Level 2 because the inputs used to determine fair value may not always be quoted prices in an active market.
Fair value inputs are summarized in the three broad levels listed below:
| ■ | Level 1 — Valuations based on quoted prices for investments in active markets that the Fund has the ability to access at the measurement date. Valuation adjustments are not applied to Level 1 investments. |
| ■ | Level 2 — Valuations based on other significant observable inputs (including quoted prices for similar securities, interest rates, prepayment speeds, credit risks, etc.). |
| ■ | Level 3 — Valuations based on significant unobservable inputs (including the Fund’s own assumptions and judgment in determining the fair value of investments). |
Inputs that are used in determining fair value of an investment may include price information, credit data, volatility statistics, and other factors. These inputs can be either observable or unobservable. The availability of observable inputs can vary between investments, and is affected by various factors such as the type of investment, and the volume and level of activity for that investment or similar investments in the marketplace. The inputs will be considered by the Investment Manager, along with any other relevant factors in the calculation of an investment’s fair value. The Fund uses prices and inputs that are current as of the measurement date, which may include periods of market dislocations. During these periods, the availability of prices and inputs may be reduced for many investments. This condition could cause an investment to be reclassified between the various levels within the hierarchy.
Certain investments that have been measured at fair value using the net asset value (NAV) per share (or its equivalent) are not categorized in the fair value hierarchy. The fair value amounts presented in the table are intended to reconcile the fair value hierarchy to the amounts presented in the Portfolio of Investments. The Columbia Short-Term Cash Fund seeks to provide shareholders with maximum current income consistent with liquidity and stability of principal. Columbia Short-Term Cash Fund prices its shares with a floating NAV and no longer seeks to maintain a stable NAV.
Investments falling into the Level 3 category are primarily supported by quoted prices from brokers and dealers participating in the market for those investments. However, these may be classified as Level 3 investments due to lack of market transparency and corroboration to support these quoted prices. Additionally, valuation models may be used as the pricing source for any remaining investments classified as Level 3. These models may rely on one or more significant unobservable inputs and/or significant assumptions by the Investment Manager. Inputs used in valuations may include, but are not limited to, financial statement analysis, capital account balances, discount rates and estimated cash flows, and comparable company data.
Under the direction of the Fund’s Board of Trustees (the Board), the Investment Manager’s Valuation Committee (the Committee) is responsible for overseeing the valuation procedures approved by the Board. The Committee consists of voting and non-voting members from various groups within the Investment Manager’s organization, including operations and accounting, trading and investments, compliance, risk management and legal.
The accompanying Notes to Financial Statements are an integral part of this statement.
| 6 | Columbia Solutions Conservative Portfolio | Annual Report 2018 |
Portfolio of Investments (continued)
March 31, 2018
Fair value measurements (continued)
The Committee meets at least monthly to review and approve valuation matters, which may include a description of specific valuation determinations, data regarding pricing information received from approved pricing vendors and brokers and the results of Board-approved valuation control policies and procedures (the Policies). The Policies address, among other things, instances when market quotations are or are not readily available, including recommendations of third party pricing vendors and a determination of appropriate pricing methodologies; events that require specific valuation determinations and assessment of fair value techniques; securities with a potential for stale pricing, including those that are illiquid, restricted, or in default; and the effectiveness of third party pricing vendors, including periodic reviews of vendors. The Committee meets more frequently, as needed, to discuss additional valuation matters, which may include the need to review back-testing results, review time-sensitive information or approve related valuation actions. The Committee reports to the Board, with members of the Committee meeting with the Board at each of its regularly scheduled meetings to discuss valuation matters and actions during the period, similar to those described earlier.
For investments categorized as Level 3, the Committee monitors information similar to that described above, which may include: (i) data specific to the issuer or comparable issuers, (ii) general market or specific sector news and (iii) quoted prices and specific or similar security transactions. The Committee considers this data and any changes from prior periods in order to assess the reasonableness of observable and unobservable inputs, any assumptions or internal models used to value those securities and changes in fair value. This data is also used to corroborate, when available, information received from approved pricing vendors and brokers. Various factors impact the frequency of monitoring this information (which may occur as often as daily). However, the Committee may determine that changes to inputs, assumptions and models are not required as a result of the monitoring procedures performed.
The following table is a summary of the inputs used to value the Fund’s investments at March 31, 2018:
| | Level 1
quoted prices
in active
markets for
identical
assets ($) | Level 2
other
significant
observable
inputs ($) | Level 3
significant
unobservable
inputs ($) | Investments
measured at
net asset
value ($) | Total ($) |
| Investments in Securities | | | | | |
| Foreign Government Obligations | — | 756,461 | — | — | 756,461 |
| U.S. Treasury Obligations | 1,425,479 | — | — | — | 1,425,479 |
| Money Market Funds | — | — | — | 5,553,202 | 5,553,202 |
| Total Investments in Securities | 1,425,479 | 756,461 | — | 5,553,202 | 7,735,142 |
| Investments in Derivatives | | | | | |
| Asset | | | | | |
| Forward Foreign Currency Exchange Contracts | — | 11,498 | — | — | 11,498 |
| Futures Contracts | 23,280 | — | — | — | 23,280 |
| Liability | | | | | |
| Forward Foreign Currency Exchange Contracts | — | (3,943) | — | — | (3,943) |
| Futures Contracts | (83,821) | — | — | — | (83,821) |
| Swap Contracts | — | (500) | — | — | (500) |
| Total | 1,364,938 | 763,516 | — | 5,553,202 | 7,681,656 |
See the Portfolio of Investments for all investment classifications not indicated in the table.
The Fund’s assets assigned to the Level 2 input category are generally valued using the market approach, in which a security’s value is determined through reference to prices and information from market transactions for similar or identical assets.
Derivative instruments are valued at unrealized appreciation (depreciation).
There were no transfers of financial assets between levels during the period.
The accompanying Notes to Financial Statements are an integral part of this statement.
Columbia Solutions Conservative Portfolio | Annual Report 2018
| 7 |
Statement of Assets and Liabilities
March 31, 2018
| Assets | |
| Investments in securities, at value | |
| Unaffiliated issuers (cost $2,184,231) | $2,181,940 |
| Affiliated issuers (cost $5,553,713) | 5,553,202 |
| Foreign currency (cost $13,209) | 13,168 |
| Margin deposits on: | |
| Futures contracts | 129,339 |
| Swap contracts | 36,430 |
| Unrealized appreciation on forward foreign currency exchange contracts | 11,498 |
| Receivable for: | |
| Dividends | 7,252 |
| Interest | 14,610 |
| Foreign tax reclaims | 692 |
| Variation margin for futures contracts | 31,182 |
| Variation margin for swap contracts | 2,852 |
| Expense reimbursement due from Investment Manager | 419 |
| Trustees’ deferred compensation plan | 3,189 |
| Other assets | 1,141 |
| Total assets | 7,986,914 |
| Liabilities | |
| Unrealized depreciation on forward foreign currency exchange contracts | 3,943 |
| Payable for: | |
| Variation margin for futures contracts | 1,020 |
| Compensation of board members | 360 |
| Compensation of chief compliance officer | 1 |
| Audit fees | 33,675 |
| Custodian fees | 5,359 |
| Other expenses | 1,253 |
| Trustees’ deferred compensation plan | 3,189 |
| Total liabilities | 48,800 |
| Net assets applicable to outstanding capital stock | $7,938,114 |
| Represented by | |
| Paid in capital | 7,906,789 |
| Excess of distributions over net investment income | (26,481) |
| Accumulated net realized gain | 113,394 |
| Unrealized appreciation (depreciation) on: | |
| Investments - unaffiliated issuers | (2,291) |
| Investments - affiliated issuers | (511) |
| Foreign currency translations | 700 |
| Forward foreign currency exchange contracts | 7,555 |
| Futures contracts | (60,541) |
| Swap contracts | (500) |
| Total - representing net assets applicable to outstanding capital stock | $7,938,114 |
| Shares outstanding | 790,171 |
| Net asset value per share | 10.05 |
The accompanying Notes to Portfolio of Investments are an integral part of this statement.
| 8 | Columbia Solutions Conservative Portfolio | Annual Report 2018 |
Statement of Operations
For the period from October 24, 2017 (commencement of operations) through March 31, 2018
| Net investment income | |
| Income: | |
| Dividends — affiliated issuers | $34,595 |
| Interest | 14,282 |
| Total income | 48,877 |
| Expenses: | |
| Compensation of board members | 4,168 |
| Custodian fees | 9,377 |
| Printing and postage fees | 822 |
| Audit fees | 33,675 |
| Legal fees | 74 |
| Compensation of chief compliance officer | 1 |
| Other | 3,127 |
| Total expenses | 51,244 |
| Fees waived or expenses reimbursed by Investment Manager and its affiliates | (50,910) |
| Total net expenses | 334 |
| Net investment income | 48,543 |
| Realized and unrealized gain (loss) — net | |
| Net realized gain (loss) on: | |
| Investments — unaffiliated issuers | 9,082 |
| Investments — affiliated issuers | (47) |
| Foreign currency translations | (263) |
| Forward foreign currency exchange contracts | (66,618) |
| Futures contracts | 126,652 |
| Swap contracts | 1,639 |
| Net realized gain | 70,445 |
| Net change in unrealized appreciation (depreciation) on: | |
| Investments — unaffiliated issuers | (2,291) |
| Investments — affiliated issuers | (511) |
| Foreign currency translations | 700 |
| Forward foreign currency exchange contracts | 7,555 |
| Futures contracts | (60,541) |
| Swap contracts | (500) |
| Net change in unrealized appreciation (depreciation) | (55,588) |
| Net realized and unrealized gain | 14,857 |
| Net increase in net assets resulting from operations | $63,400 |
The accompanying Notes to Financial Statements are an integral part of this statement.
Columbia Solutions Conservative Portfolio | Annual Report 2018
| 9 |
Statement of Changes in Net Assets
| | Year Ended
March 31, 2018 (a) |
| Operations | |
| Net investment income | $48,543 |
| Net realized gain | 70,445 |
| Net change in unrealized appreciation (depreciation) | (55,588) |
| Net increase in net assets resulting from operations | 63,400 |
| Distributions to shareholders | |
| Net investment income | (21,515) |
| Net realized gains | (10,560) |
| Total distributions to shareholders | (32,075) |
| Increase in net assets from capital stock activity | 7,896,789 |
| Total increase in net assets | 7,928,114 |
| Net assets at beginning of period | 10,000 |
| Net assets at end of period | $7,938,114 |
| Excess of distributions over net investment income | $(26,481) |
| (a) | Based on operations from October 24, 2017 (fund commencement of operations) through the stated period end. |
The accompanying Notes to Financial Statements are an integral part of this statement.
| 10 | Columbia Solutions Conservative Portfolio | Annual Report 2018 |
Statement of Changes in Net Assets (continued)
| | Year Ended |
| | March 31, 2018 (a) |
| | Shares | Dollars ($) |
| Capital stock activity |
| | | |
| Subscriptions | 792,438 | 7,929,455 |
| Distributions reinvested | 3,175 | 32,035 |
| Redemptions | (6,442) | (64,701) |
| Total net increase | 789,171 | 7,896,789 |
| (a) | Based on operations from October 24, 2017 (fund commencement of operations) through the stated period end. |
The accompanying Notes to Financial Statements are an integral part of this statement.
Columbia Solutions Conservative Portfolio | Annual Report 2018
| 11 |
The following table is intended to help you understand the Fund’s financial performance. Certain information reflects financial results for a single share of a class held for the periods shown. Per share net investment income (loss) amounts are calculated based on average shares outstanding during the period. Total return assumes reinvestment of all dividends and distributions, if any. Total return does not reflect payment of sales charges, if any. Total return and portfolio turnover are not annualized for periods of less than one year. The portfolio turnover rate is calculated without regard to purchase and sales transactions of short-term instruments and certain derivatives, if any. If such transactions were included, the Fund’s portfolio turnover rate may be higher.
| | Year Ended March 31,
2018 (a) |
| Per share data | |
| Net asset value, beginning of period | $10.00 |
| Income from investment operations: | |
| Net investment income | 0.06 |
| Net realized and unrealized gain | 0.03 |
| Total from investment operations | 0.09 |
| Less distributions to shareholders from: | |
| Net investment income | (0.03) |
| Net realized gains | (0.01) |
| Total distributions to shareholders | (0.04) |
| Net asset value, end of period | $10.05 |
| Total return | 0.90% |
| Ratios to average net assets | |
| Total gross expenses(b) | 0.95% (c) |
| Total net expenses(b),(d) | 0.01% (c) |
| Net investment income | 1.45% (c) |
| Supplemental data | |
| Portfolio turnover | 30% |
| Net assets, end of period (in thousands) | $7,938 |
| Notes to Financial Highlights |
| (a) | The Fund commenced operations on October 24, 2017. Per share data and total return reflect activity from that date. |
| (b) | In addition to the fees and expenses that the Fund bears directly, the Fund indirectly bears a pro rata share of the fees and expenses of any other funds in which it invests. Such indirect expenses are not included in the Fund’s reported expense ratios. |
| (c) | Annualized. |
| (d) | Total net expenses include the impact of certain fee waivers/expense reimbursements made by the Investment Manager and certain of its affiliates, if applicable. |
The accompanying Notes to Financial Statements are an integral part of this statement.
| 12 | Columbia Solutions Conservative Portfolio | Annual Report 2018 |
Notes to Financial Statements
March 31, 2018
Note 1. Organization
Columbia Solutions Conservative Portfolio (the Fund), a series of Columbia Funds Series Trust I (the Trust), is a non-diversified fund. The Trust is registered under the Investment Company Act of 1940, as amended (the 1940 Act), as an open-end management investment company organized as a Massachusetts business trust.
On October 23, 2017, Columbia Management Investment Advisers, LLC (the Investment Manager), a wholly-owned subsidiary of Ameriprise Financial, Inc. (Ameriprise Financial), invested $10,000 in the Fund, which represented the initial capital for the Fund at $10 per share.
These financial statements cover the period from October 24, 2017 (commencement of operations) through March 31, 2018. All references to the year ended March 31, 2018 refer to the period from October 24, 2017 through March 31, 2018.
Fund shares
The Trust may issue an unlimited number of shares (without par value). The Fund is sold only to the Columbia Adaptive Retirement Funds and certain collective investment trusts.
Note 2. Summary of significant accounting policies
Basis of preparation
The Fund is an investment company that applies the accounting and reporting guidance in the Financial Accounting Standards Board (FASB) Accounting Standards Codification Topic 946, Financial Services - Investment Companies (ASC 946). The financial statements are prepared in accordance with U.S. generally accepted accounting principles (GAAP), which requires management to make certain estimates and assumptions that affect the reported amounts of assets and liabilities, the disclosure of contingent assets and liabilities at the date of the financial statements and the reported amounts of income and expenses during the reporting period. Actual results could differ from those estimates.
The following is a summary of significant accounting policies followed by the Fund in the preparation of its financial statements.
Security valuation
Debt securities generally are valued by pricing services approved by the Board of Trustees based upon market transactions for normal, institutional-size trading units of similar securities. The services may use various pricing techniques that take into account, as applicable, factors such as yield, quality, coupon rate, maturity, type of issue, trading characteristics and other data, as well as approved independent broker-dealer quotes. Debt securities for which quotations are not readily available or not believed to be reflective of market value may also be valued based upon a bid quote from an approved independent broker-dealer. Debt securities maturing in 60 days or less are valued primarily at amortized cost value, unless this method results in a valuation that management believes does not approximate market value.
Investments in open-end investment companies, including money market funds, are valued at their latest net asset value.
Forward foreign currency exchange contracts are marked-to-market based upon foreign currency exchange rates provided by a pricing service.
Futures and options on futures contracts are valued based upon the settlement price at the close of regular trading on their principal exchanges or, in the absence of transactions, at the mean of the latest quoted bid and ask prices.
Swap transactions are valued through an independent pricing service or broker, or if neither is available, through an internal model based upon observable inputs.
Investments for which market quotations are not readily available, or that have quotations which management believes are not reflective of market value or reliable, are valued at fair value as determined in good faith under procedures approved by and under the general supervision of the Board of Trustees. If a security or class of securities (such as foreign securities) is valued at fair value, such value is likely to be different from the quoted or published price for the security.
Columbia Solutions Conservative Portfolio | Annual Report 2018
| 13 |
Notes to Financial Statements (continued)
March 31, 2018
The determination of fair value often requires significant judgment. To determine fair value, management may use assumptions including but not limited to future cash flows and estimated risk premiums. Multiple inputs from various sources may be used to determine fair value.
GAAP requires disclosure regarding the inputs and valuation techniques used to measure fair value and any changes in valuation inputs or techniques. In addition, investments shall be disclosed by major category. This information is disclosed following the Fund’s Portfolio of Investments.
Foreign currency transactions and translations
The values of all assets and liabilities denominated in foreign currencies are generally translated into U.S. dollars at exchange rates determined at the close of regular trading on the New York Stock Exchange. Net realized and unrealized gains (losses) on foreign currency transactions and translations include gains (losses) arising from the fluctuation in exchange rates between trade and settlement dates on securities transactions, gains (losses) arising from the disposition of foreign currency and currency gains (losses) between the accrual and payment dates on dividends, interest income and foreign withholding taxes.
For financial statement purposes, the Fund does not distinguish that portion of gains (losses) on investments which is due to changes in foreign exchange rates from that which is due to changes in market prices of the investments. Such fluctuations are included with the net realized and unrealized gains (losses) on investments in the Statement of Operations.
Derivative instruments
The Fund invests in certain derivative instruments, as detailed below, to meet its investment objectives. Derivatives are instruments whose values depend on, or are derived from, in whole or in part, the value of one or more securities, currencies, commodities, indices, or other assets or instruments. Derivatives may be used to increase investment flexibility (including to maintain cash reserves while maintaining desired exposure to certain assets), for risk management (hedging) purposes, to facilitate trading, to reduce transaction costs and to pursue higher investment returns. The Fund may also use derivative instruments to mitigate certain investment risks, such as foreign currency exchange rate risk, interest rate risk and credit risk. Derivatives may involve various risks, including the potential inability of the counterparty to fulfill its obligations under the terms of the contract, the potential for an illiquid secondary market (making it difficult for the Fund to sell or terminate, including at favorable prices) and the potential for market movements which may expose the Fund to gains or losses in excess of the amount shown in the Statement of Assets and Liabilities. The notional amounts of derivative instruments, if applicable, are not recorded in the financial statements.
A derivative instrument may suffer a marked-to-market loss if the value of the contract decreases due to an unfavorable change in the market rates or values of the underlying instrument. Losses can also occur if the counterparty does not perform its obligations under the contract. The Fund’s risk of loss from counterparty credit risk on over-the-counter derivatives is generally limited to the aggregate unrealized gain netted against any collateral held by the Fund and the amount of any variation margin held by the counterparty, plus any replacement costs or related amounts. With exchange-traded or centrally cleared derivatives, there is reduced counterparty credit risk to the Fund since the clearinghouse or central counterparty (CCP) provides some protection in the case of clearing member default. The clearinghouse or CCP stands between the buyer and the seller of the contract; therefore, additional counterparty credit risk is failure of the clearinghouse or CCP. However, credit risk still exists in exchange-traded or centrally cleared derivatives with respect to initial and variation margin that is held in a broker’s customer account. While brokers are required to segregate customer margin from their own assets, in the event that a broker becomes insolvent or goes into bankruptcy and at that time there is a shortfall in the aggregate amount of margin held by the broker for all its clients, U.S. bankruptcy laws will typically allocate that shortfall on a pro-rata basis across all the broker’s customers (including the Fund), potentially resulting in losses to the Fund.
In order to better define its contractual rights and to secure rights that will help the Fund mitigate its counterparty risk, the Fund may enter into an International Swaps and Derivatives Association, Inc. Master Agreement (ISDA Master Agreement) or similar agreement with its derivatives contract counterparties. An ISDA Master Agreement is an agreement between the Fund and a counterparty that governs over-the-counter derivatives and typically contains, among other things, collateral posting terms and netting provisions in the event of a default and/or termination event. Under an ISDA Master Agreement, the Fund may, under certain circumstances, offset with the counterparty certain derivative instrument’s payables and/or receivables
| 14 | Columbia Solutions Conservative Portfolio | Annual Report 2018 |
Notes to Financial Statements (continued)
March 31, 2018
with collateral held and/or posted and create one single net payment. The provisions of the ISDA Master Agreement typically permit a single net payment in the event of default (close-out netting), including the bankruptcy or insolvency of the counterparty. Note, however, that bankruptcy or insolvency laws of a particular jurisdiction may impose restrictions on or prohibitions against the right of offset or netting in bankruptcy, insolvency or other events.
Collateral (margin) requirements differ by type of derivative. Margin requirements are established by the clearinghouse or CCP for exchange-traded and centrally cleared derivatives. Brokers can ask for margin in excess of the minimum in certain circumstances. Collateral terms are contract specific for over-the-counter derivatives. For over-the-counter derivatives traded under an ISDA Master Agreement, the collateral requirements are typically calculated by netting the marked-to-market amount for each transaction under such agreement and comparing that amount to the value of any variation margin currently pledged by the Fund and/or the counterparty. Generally, the amount of collateral due from or to a party has to exceed a minimum transfer amount threshold (e.g., $250,000) before a transfer has to be made. To the extent amounts due to the Fund from its counterparties are not fully collateralized, contractually or otherwise, the Fund bears the risk of loss from counterparty nonperformance. The Fund attempts to mitigate counterparty risk by only entering into agreements with counterparties that it believes have the financial resources to honor their obligations and by monitoring the financial stability of those counterparties.
Certain ISDA Master Agreements allow counterparties of over-the-counter derivatives transactions to terminate derivatives contracts prior to maturity in the event the Fund’s net asset value declines by a stated percentage over a specified time period or if the Fund fails to meet certain terms of the ISDA Master Agreement, which would cause the Fund to accelerate payment of any net liability owed to the counterparty. The Fund also has termination rights if the counterparty fails to meet certain terms of the ISDA Master Agreement. In addition to considering counterparty credit risk, the Fund would consider terminating the derivatives contracts based on whether termination would result in a net liability owed from the counterparty.
For financial reporting purposes, the Fund does not offset derivative assets and derivative liabilities that are subject to netting arrangements in the Statement of Assets and Liabilities.
Forward foreign currency exchange contracts
Forward foreign currency exchange contracts are over-the-counter agreements between two parties to buy and sell a currency at a set price on a future date. The Fund utilized forward foreign currency exchange contracts to hedge the currency exposure associated with some or all of the Fund’s securities, to shift foreign currency exposure back to U.S. dollars, to shift U.S. dollar exposure to achieve a representative weighted mix of major currencies in its benchmark, to recover an underweight country exposure in its portfolio and to generate total return through long and short positions versus the U.S. dollar. These instruments may be used for other purposes in future periods.
The values of forward foreign currency exchange contracts fluctuate daily with changes in foreign currency exchange rates. Changes in the value of these contracts are recorded as unrealized appreciation or depreciation until the contract is exercised or has expired. The Fund will realize a gain or loss when the forward foreign currency exchange contract is closed or expires.
The use of forward foreign currency exchange contracts does not eliminate fluctuations in the prices of the Fund’s portfolio securities. The risks of forward foreign currency exchange contracts include movement in the values of the foreign currencies relative to the U.S. dollar (or other foreign currencies) and the possibility that counterparties will not complete their contractual obligations, which may be in excess of the amount reflected, if any, in the Statement of Assets and Liabilities.
Futures contracts
Futures contracts are exchange-traded and represent commitments for the future purchase or sale of an asset at a specified price on a specified date. The Fund bought and sold futures contracts to manage the duration and yield curve exposure of the Fund versus the benchmark, to manage exposure to movements in interest rates, to manage exposure to the securities market and to maintain appropriate equity market exposure while keeping sufficient cash to accommodate daily redemptions. These instruments may be used for other purposes in future periods. Upon entering into futures contracts, the Fund bears risks that it may not achieve the anticipated benefits of the futures contracts and may realize a loss. Additional risks include counterparty credit risk, the possibility of an illiquid market, and that a change in the value of the contract or option may not correlate with changes in the value of the underlying asset.
Columbia Solutions Conservative Portfolio | Annual Report 2018
| 15 |
Notes to Financial Statements (continued)
March 31, 2018
Upon entering into a futures contract, the Fund deposits cash or securities with the broker, known as a futures commission merchant (FCM), in an amount sufficient to meet the initial margin requirement. The initial margin deposit must be maintained at an established level over the life of the contract. Cash deposited as initial margin is recorded in the Statement of Assets and Liabilities as margin deposits. Securities deposited as initial margin are designated in the Portfolio of Investments. Subsequent payments (variation margin) are made or received by the Fund each day. The variation margin payments are equal to the daily change in the contract value and are recorded as variation margin receivable or payable and are offset in unrealized gains or losses. The Fund recognizes a realized gain or loss when the contract is closed or expires. Futures contracts involve, to varying degrees, risk of loss in excess of the variation margin disclosed in the Statement of Assets and Liabilities.
Swap contracts
Swap contracts are negotiated in the over-the-counter market and may be entered into as a bilateral contract or centrally cleared (centrally cleared swap contract). In a centrally cleared swap contract, immediately following execution of the swap contract with a broker, the swap contract is novated to a central counterparty (the CCP) and the CCP becomes the Fund’s counterparty to the centrally cleared swap contract. The Fund is required to deposit initial margin with the futures commission merchant (FCM), which pledges it through to the CCP in the form of cash or securities in an amount that varies depending on the size and risk profile of the particular swap contract. Securities deposited as initial margin are designated in the Portfolio of Investments and cash deposited is recorded in the Statement of Assets and Liabilities as margin deposits. Unlike a bilateral swap contract, for centrally cleared swap contracts, the Fund has minimal credit exposure to the FCM because the CCP stands between the Fund and the relevant buyer/seller on the other side of the contract. Swap contracts are marked-to-market daily and changes in value are recorded as unrealized appreciation (depreciation). The daily change in valuation of centrally cleared swap contracts, if any, is recorded as a receivable or payable for variation margin in the Statement of Assets and Liabilities.
Entering into these contracts involves, to varying degrees, elements of interest, liquidity and counterparty credit risk in excess of the amounts recognized in the Statement of Assets and Liabilities. Such risks involve the possibility that there may be unfavorable changes in interest rates, market conditions or other conditions, that it may be difficult to initiate a swap transaction or liquidate a position at an advantageous time or price which may result in significant losses, and that the FCM or CCP may not fulfill its obligation under the contract.
Credit default swap contracts
The Fund entered into credit default swap contracts to increase or decrease its credit exposure to an index and to manage credit risk exposure. These instruments may be used for other purposes in future periods. Credit default swap contracts are agreements in which one party pays fixed periodic payments to a counterparty in consideration for an agreement from the counterparty to make a specific payment should a specified credit event(s) take place. Although specified credit events are contract specific, credit events are generally defined as bankruptcy, failure to pay, restructuring, obligation acceleration, obligation default, or repudiation/moratorium.
As the purchaser of a credit default swap contract, the Fund purchases protection by paying a periodic interest rate on the notional amount to the counterparty. The interest amount is accrued daily as a component of unrealized appreciation (depreciation) and is recorded as a realized loss upon payment. If a credit event as specified in the contract occurs, the Fund may have the option either to deliver the reference obligation to the seller in exchange for a cash payment of its par amount, or to receive a net cash settlement equal to the par amount less an agreed-upon value of the reference obligation as of the date of the credit event. The difference between the value of the obligation or cash delivered and the notional amount received will be recorded as a realized gain (loss).
As the seller of a credit default swap contract, the Fund sells protection to a buyer and will generally receive a periodic interest rate on a notional amount. The interest amount is accrued daily as a component of unrealized appreciation (depreciation) and is recorded as a realized gain upon receipt of the payment. If a credit event as specified in the contract with the counterparty occurs, the Fund may either be required to accept the reference obligation from the buyer in exchange for a cash payment of its notional amount, or to pay the buyer a net cash settlement equal to the notional amount less an agreed-upon value of the reference obligation (recovery value) as of the date of the credit event. The difference between the value of the obligation or cash received and the notional amount paid will be recorded as a realized gain (loss). The maximum
| 16 | Columbia Solutions Conservative Portfolio | Annual Report 2018 |
Notes to Financial Statements (continued)
March 31, 2018
potential amount of undiscounted future payments the Fund could be required to make as the seller of protection under a credit default swap contract is equal to the notional amount of the reference obligation. These potential amounts may be partially offset by any recovery values of the respective reference obligations or upfront receipts upon entering into the agreement. The notional amounts and market values of all credit default swap contracts in which the Fund is the seller of protection, if any, are disclosed in the Credit Default Swap Contracts Outstanding schedule following the Portfolio of Investments.
As a protection seller, the Fund bears the risk of loss from the credit events specified in the contract with the counterparty. For credit default swap contracts on credit indices, quoted market prices and resulting market values serve as an indicator of the current status of the payment/performance risk. Increasing market values, in absolute terms when compared to the notional amount of the swap, represent a deterioration of the reference entity’s credit soundness and a greater likelihood or risk of default or other credit event occurring as defined under the terms of the contract.
Any upfront payments or receipts by the Fund upon entering into a credit default swap contract is recorded as an asset or liability, respectively, and amortized daily as a component of realized gain (loss) in the Statement of Operations. Credit default swap contracts are valued daily, and the change in value is recorded as unrealized appreciation (depreciation) until the termination of the swap, at which time a realized gain (loss) is recorded.
Credit default swap contracts can involve greater risks than if a fund had invested in the reference obligation directly since, in addition to general market risks, credit default swaps are subject to counterparty credit risk, leverage risk, hedging risk, correlation risk and liquidity risk.
Effects of derivative transactions in the financial statements
The following tables are intended to provide additional information about the effect of derivatives on the financial statements of the Fund, including: the fair value of derivatives by risk category and the location of those fair values in the Statement of Assets and Liabilities; and the impact of derivative transactions over the period in the Statement of Operations, including realized and unrealized gains (losses). The derivative instrument schedules following the Portfolio of Investments present additional information regarding derivative instruments outstanding at the end of the period, if any.
The following table is a summary of the fair value of derivative instruments (not considered to be hedging instruments for accounting disclosure purposes) at March 31, 2018:
| | Asset derivatives | |
Risk exposure
category | Statement
of assets and liabilities
location | Fair value ($) |
| Foreign exchange risk | Unrealized appreciation on forward foreign currency exchange contracts | 11,498 |
| Interest rate risk | Net assets — unrealized appreciation on futures contracts | 23,280* |
| Total | | 34,778 |
| | Liability derivatives | |
Risk exposure
category | Statement
of assets and liabilities
location | Fair value ($) |
| Credit risk | Net assets — unrealized depreciation on swap contracts | 500* |
| Equity risk | Net assets — unrealized depreciation on futures contracts | 80,434* |
| Foreign exchange risk | Unrealized depreciation on forward foreign currency exchange contracts | 3,943 |
| Interest rate risk | Net assets — unrealized depreciation on futures contracts | 3,387* |
| Total | | 88,264 |
| * | Includes cumulative appreciation (depreciation) as reported in the tables following the Portfolio of Investments. Only the current day’s variation margin is reported in receivables or payables in the Statement of Assets and Liabilities. |
Columbia Solutions Conservative Portfolio | Annual Report 2018
| 17 |
Notes to Financial Statements (continued)
March 31, 2018
The following table indicates the effect of derivative instruments (not considered to be hedging instruments for accounting disclosure purposes) in the Statement of Operations for the year ended March 31, 2018:
| Amount of realized gain (loss) on derivatives recognized in income |
| Risk exposure category | Forward
foreign
currency
exchange
contracts
($) | Futures
contracts
($) | Swap
contracts
($) | Total
($) |
| Credit risk | — | — | 1,639 | 1,639 |
| Equity risk | — | 178,608 | — | 178,608 |
| Foreign exchange risk | (66,618) | — | — | (66,618) |
| Interest rate risk | — | (51,956) | — | (51,956) |
| Total | (66,618) | 126,652 | 1,639 | 61,673 |
| |
| Change in unrealized appreciation (depreciation) on derivatives recognized in income |
| Risk exposure category | Forward
foreign
currency
exchange
contracts
($) | Futures
contracts
($) | Swap
contracts
($) | Total
($) |
| Credit risk | — | — | (500) | (500) |
| Equity risk | — | (80,434) | — | (80,434) |
| Foreign exchange risk | 7,555 | — | — | 7,555 |
| Interest rate risk | — | 19,893 | — | 19,893 |
| Total | 7,555 | (60,541) | (500) | (53,486) |
The following table is a summary of the average outstanding volume by derivative instrument for the year ended March 31, 2018:
| Derivative instrument | Average notional
amounts ($)* |
| Futures contracts — long | 5,639,696 |
| Futures contracts — short | 51,795 |
| Credit default swap contracts — sell protection | 1,338,308 |
| Derivative instrument | Average unrealized
appreciation ($)* | Average unrealized
depreciation ($)* |
| Forward foreign currency exchange contracts | 5,029 | (20,516) |
| * | Based on the ending daily outstanding amounts for the year ended March 31, 2018. |
| 18 | Columbia Solutions Conservative Portfolio | Annual Report 2018 |
Notes to Financial Statements (continued)
March 31, 2018
Offsetting of assets and liabilities
The following table presents the Fund’s gross and net amount of assets and liabilities available for offset under netting arrangements as well as any related collateral received or pledged by the Fund as of March 31, 2018:
| | HSBC ($) | Morgan
Stanley ($) (a) | Morgan
Stanley ($) (a) | Total ($) |
| Assets | | | | |
| Centrally cleared credit default swap contracts (b) | - | - | 2,852 | 2,852 |
| Forward foreign currency exchange contracts | 3,394 | 8,104 | | 11,498 |
| Total assets | 3,394 | 8,104 | 2,852 | 14,350 |
| Liabilities | | | | |
| Forward foreign currency exchange contracts | 3,762 | 181 | | 3,943 |
| Total financial and derivative net assets | (368) | 7,923 | 2,852 | 10,407 |
| Total collateral received (pledged) (c) | - | - | - | - |
| Net amount (d) | (368) | 7,923 | 2,852 | 10,407 |
| (a) | Exposure can only be netted across transactions governed under the same master agreement with the same legal entity. |
| (b) | Centrally cleared swaps are included within payable/receivable for variation margin on the Statement of Assets and Liabilities. |
| (c) | In some instances, the actual collateral received and/or pledged may be more than the amount shown due to overcollateralization. |
| (d) | Represents the net amount due from/(to) counterparties in the event of default. |
Security transactions
Security transactions are accounted for on the trade date. Cost is determined and gains (losses) are based upon the specific identification method for both financial statement and federal income tax purposes.
Income recognition
Interest income is recorded on an accrual basis. Market premiums and discounts, including original issue discounts, are amortized and accreted, respectively, over the expected life of the security on all debt securities, unless otherwise noted.
The Fund may place a debt security on non-accrual status and reduce related interest income when it becomes probable that the interest will not be collected and the amount of uncollectible interest can be reasonably estimated. A defaulted debt security is removed from non-accrual status when the issuer resumes interest payments or when collectibility of interest is reasonably assured.
Dividend income is recorded on the ex-dividend date.
Expenses
General expenses of the Trust are allocated to the Fund and other funds of the Trust based upon relative net assets or other expense allocation methodologies determined by the nature of the expense. Expenses directly attributable to the Fund are charged to the Fund.
Federal income tax status
The Fund intends to qualify each year as a regulated investment company under Subchapter M of the Internal Revenue Code, as amended, and will distribute substantially all of its investment company taxable income and net capital gain, if any, for its tax year, and as such will not be subject to federal income taxes. In addition, the Fund intends to distribute in each calendar year substantially all of its ordinary income, capital gain net income and certain other amounts, if any, such that the Fund should not be subject to federal excise tax. Therefore, no federal income or excise tax provision is recorded.
Foreign taxes
The Fund may be subject to foreign taxes on income, gains on investments or currency repatriation, a portion of which may be recoverable. The Fund will accrue such taxes and recoveries, as applicable, based upon its current interpretation of tax rules and regulations that exist in the markets in which it invests.
Columbia Solutions Conservative Portfolio | Annual Report 2018
| 19 |
Notes to Financial Statements (continued)
March 31, 2018
Realized gains in certain countries may be subject to foreign taxes at the Fund level, based on statutory rates. The Fund accrues for such foreign taxes on realized and unrealized gains at the appropriate rate for each jurisdiction, as applicable. The amount, if any, is disclosed as a liability on the Statement of Assets and Liabilities.
Distributions to shareholders
Distributions from net investment income, if any, are declared and paid annually. Net realized capital gains, if any, are distributed at least annually. Income distributions and capital gain distributions are determined in accordance with federal income tax regulations, which may differ from GAAP.
Guarantees and indemnifications
Under the Trust’s organizational documents and, in some cases, by contract, its officers and trustees are indemnified against certain liabilities arising out of the performance of their duties to the Trust or its funds. In addition, certain of the Fund’s contracts with its service providers contain general indemnification clauses. The Fund’s maximum exposure under these arrangements is unknown since the amount of any future claims that may be made against the Fund cannot be determined, and the Fund has no historical basis for predicting the likelihood of any such claims.
Recent accounting pronouncement
Accounting Standards Update 2017-08 Premium Amortization on Purchased Callable Debt Securities
In March 2017, the Financial Accounting Standards Board issued Accounting Standards Update (ASU) No. 2017-08 Premium Amortization on Purchased Callable Debt Securities. ASU No. 2017-08 updates the accounting standards to shorten the amortization period for certain purchased callable debt securities, held at a premium, to be amortized to the earliest call date. The update applies to securities with explicit, noncontingent call features that are callable at fixed prices and on preset dates. The standard is effective for annual periods beginning after December 15, 2018 and interim periods within those fiscal years. At this time, management is evaluating the implication of this guidance and the impact it will have on the financial statement amounts and footnote disclosures, if any.
Note 3. Fees and other transactions with affiliates
Management services fees
The Fund has entered into a Management Agreement with Columbia Management Investment Advisers, LLC (the Investment Manager), a wholly-owned subsidiary of Ameriprise Financial, Inc. (Ameriprise Financial). Under the Management Agreement, subject to the policies set by the Board of Trustees, the Investment Manager provides the Fund with investment research and advice, as well as administrative and accounting services. The Fund does not pay a management fee for the investment advisory or administrative services provided to the Fund, but it may pay taxes, brokerage commissions and nonadvisory expenses.
Other expenses
Other expenses include offering costs which were incurred prior to the shares of the Fund being offered. Offering costs include printing costs. The Fund amortizes offering costs over a period of 12 months from the commencement of operations.
Compensation of board members
Members of the Board of Trustees who are not officers or employees of the Investment Manager or Ameriprise Financial are compensated for their services to the Fund as disclosed in the Statement of Operations. These members of the Board of Trustees may participate in a Deferred Compensation Plan (the Plan) which may be terminated at any time. Obligations of the Plan will be paid solely out of the Fund’s assets, and all amounts payable under the Plan constitute a general unsecured obligation of the Fund.
| 20 | Columbia Solutions Conservative Portfolio | Annual Report 2018 |
Notes to Financial Statements (continued)
March 31, 2018
Compensation of Chief Compliance Officer
The Board of Trustees has appointed a Chief Compliance Officer to the Fund in accordance with federal securities regulations. As disclosed in the Statement of Operations, a portion of the Chief Compliance Officer’s total compensation is allocated to the Fund, along with other allocations to affiliated funds governed by the Board of Trustees, based on relative net assets.
Transfer agency fees
The Fund has a Transfer and Dividend Disbursing Agent Agreement with Columbia Management Investment Services Corp. (the Transfer Agent), an affiliate of the Investment Manager and a wholly-owned subsidiary of Ameriprise Financial, under which the Fund does not pay an annual fee to the Transfer Agent.
Distribution and service fees
The Fund has an agreement with Columbia Management Investment Distributors, Inc. (the Distributor), an affiliate of the Investment Manager and a wholly-owned subsidiary of Ameriprise Financial, for distribution and shareholder services. The Fund does not pay the Distributor a fee for the distribution services it provides to the Fund.
Expenses waived/reimbursed by the Investment Manager and its affiliates
The Investment Manager and certain of its affiliates have contractually agreed to waive fees and/or reimburse expenses (excluding certain fees and expenses described below), through July 31, 2019, unless sooner terminated at the sole discretion of the Board of Trustees, so that the Fund’s net operating expenses, after giving effect to fees waived/expenses reimbursed and any balance credits and/or overdraft charges from the Fund’s custodian, do not exceed the annual rate of 0.01% of the Fund’s average daily net assets.
Under the agreement governing this fee waiver and/or expense reimbursement arrangement, the following fees and expenses are excluded from the waiver/reimbursement commitment, and therefore will be paid by the Fund, if applicable: taxes (including foreign transaction taxes), expenses associated with investments in affiliated and non-affiliated pooled investment vehicles (including mutual funds and exchange-traded funds), transaction costs and brokerage commissions, costs related to any securities lending program, dividend expenses associated with securities sold short, inverse floater program fees and expenses, transaction charges and interest on borrowed money, interest, infrequent and/or unusual expenses and any other expenses the exclusion of which is specifically approved by the Board of Trustees. This agreement may be modified or amended only with approval from the Investment Manager, certain of its affiliates and the Fund. Any fees waived and/or expenses reimbursed under the expense reimbursement arrangements described above are not recoverable by the Investment Manager or its affiliates in future periods.
Note 4. Federal tax information
The timing and character of income and capital gain distributions are determined in accordance with income tax regulations, which may differ from GAAP because of temporary or permanent book to tax differences.
At March 31, 2018, these differences were primarily due to differing treatment for derivative investments, tax straddles, trustees’ deferred compensation, foreign currency transactions and distribution reclassifications. To the extent these differences were permanent, reclassifications were made among the components of the Fund’s net assets in the Statement of Assets and Liabilities. Temporary differences do not require reclassifications.
In the Statement of Assets and Liabilities the following reclassifications were made:
Excess of distributions
over net investment
income ($) | Accumulated
net realized
gain ($) | Paid in
capital ($) |
| (53,509) | 53,509 | — |
Net investment income (loss) and net realized gains (losses), as disclosed in the Statement of Operations, and net assets were not affected by this reclassification.
Columbia Solutions Conservative Portfolio | Annual Report 2018
| 21 |
Notes to Financial Statements (continued)
March 31, 2018
The tax character of distributions paid during the year ended March 31, 2018 was as follows:
Ordinary
income ($) | Long-term
capital gains ($) | Total ($) |
| 21,515 | 10,560 | 32,075 |
Short-term capital gain distributions, if any, are considered ordinary income distributions for tax purposes.
At March 31, 2018, the components of distributable earnings on a tax basis were as follows:
Undistributed
ordinary income ($) | Undistributed
long-term
capital gains ($) | Capital loss
carryforwards ($) | Net unrealized
(depreciation) ($) |
| 29,139 | 27,982 | — | (26,241) |
At March 31, 2018, the cost of all investments for federal income tax purposes along with the aggregate gross unrealized appreciation and depreciation based on that cost was:
Federal
tax cost ($) | Gross unrealized
appreciation ($) | Gross unrealized
(depreciation) ($) | Net unrealized
(depreciation) ($) |
| 7,707,897 | 13,751 | (39,992) | (26,241) |
Tax cost of investments and unrealized appreciation/(depreciation) may also include timing differences that do not constitute adjustments to tax basis.
Management of the Fund has concluded that there are no significant uncertain tax positions in the Fund that would require recognition in the financial statements. However, management’s conclusion may be subject to review and adjustment at a later date based on factors including, but not limited to, new tax laws, regulations, and administrative interpretations (including relevant court decisions). Generally, the Fund’s federal tax returns for the prior three fiscal years remain subject to examination by the Internal Revenue Service.
Note 5. Portfolio information
The cost of purchases and proceeds from sales of securities, excluding short-term investments and derivatives, if any, aggregated to $2,718,331 and $536,576, respectively, for the year ended March 31, 2018, of which $1,734,051 and $273,659, respectively, were U.S. government securities. The amount of purchase and sale activity impacts the portfolio turnover rate reported in the Financial Highlights.
Note 6. Affiliated money market fund
The Fund invests significantly in Columbia Short-Term Cash Fund, an affiliated money market fund established for the exclusive use by the Fund and other affiliated funds (the Affiliated MMF). The income earned by the Fund from such investments is included as Dividends - affiliated issuers in the Statement of Operations. As an investing fund, the Fund indirectly bears its proportionate share of the expenses of the Affiliated MMF. The Affiliated MMF prices its shares with a floating net asset value. In addition, the Board of Trustees of the Affiliated MMF may impose a fee on redemptions (sometimes referred to as a liquidity fee) or temporarily suspend redemptions (sometimes referred to as imposing a redemption gate) in the event its liquidity falls below regulatory limits.
Note 7. Line of credit
The Fund has access to a revolving credit facility with a syndicate of banks led by Citibank, N.A., HSBC Bank USA, N.A. and JPMorgan Chase Bank, N.A. whereby the Fund may borrow for the temporary funding of shareholder redemptions or for other temporary or emergency purposes. The credit facility, which is a collective agreement between the Fund and certain other funds managed by the Investment Manager, severally and not jointly, permits collective borrowings up to $1 billion. Interest is charged to each participating fund based on its borrowings at a rate equal to the higher of (i) the overnight federal funds rate
| 22 | Columbia Solutions Conservative Portfolio | Annual Report 2018 |
Notes to Financial Statements (continued)
March 31, 2018
plus 1.00% or (ii) the one-month LIBOR rate plus 1.00%. Each borrowing under the credit facility matures no later than 60 days after the date of borrowing. The Fund also pays a commitment fee equal to its pro rata share of the amount of the credit facility at a rate of 0.15% per annum. The commitment fee is included in other expenses in the Statement of Operations.
The Fund had no borrowings during the year ended March 31, 2018.
Note 8. Significant risks
Credit risk
Credit risk is the risk that the value of debt securities in the Fund’s portfolio may decline because the issuer may default and fail to pay interest or repay principal when due. Rating agencies assign credit ratings to debt securities to indicate their credit risk. Lower rated or unrated debt securities held by the Fund may present increased credit risk as compared to higher-rated debt securities.
Derivatives risk
Losses involving derivative instruments may be substantial, because a relatively small price movement in the underlying security(ies), commodity, currency or index or other instrument or asset may result in a substantial loss for the Fund. In addition to the potential for increased losses, the use of derivative instruments may lead to increased volatility within the Fund. Derivatives will typically increase the Fund’s exposure to principal risks to which it is otherwise exposed, and may expose the Fund to additional risks, including correlation risk, counterparty risk, hedging risk, leverage risk and liquidity risk.
Interest rate risk
Interest rate risk is the risk of losses attributable to changes in interest rates. In general, if prevailing interest rates rise, the values of debt securities tend to fall, and if interest rates fall, the values of debt securities tend to rise. Actions by governments and central banking authorities can result in increases in interest rates. Increasing interest rates may negatively affect the value of debt securities held by the Fund, resulting in a negative impact on the Fund’s performance and net asset value per share. In general, the longer the maturity or duration of a debt security, the greater its sensitivity to changes in interest rates.
Liquidity risk
Liquidity risk is the risk associated with a lack of marketability of investments which may make it difficult to sell the investment at a desirable time or price. Changing regulatory, market or other conditions or environments (for example, the interest rate or credit environments) may adversely affect the liquidity of the Fund’s investments. The Fund may have to accept a lower selling price for the holding, sell other investments, or forego another, more appealing investment opportunity. Generally, the less liquid the market at the time the Fund sells a portfolio investment, the greater the risk of loss or decline of value to the Fund. A less liquid market can lead to an increase in Fund redemptions, which may negatively impact Fund performance and net asset value per share, including, for example, if the Fund is forced to sell securities in a down market.
Non-diversification risk
A non-diversified fund is permitted to invest a greater percentage of its total assets in fewer issuers than a diversified fund. The Fund may, therefore, have a greater risk of loss from a few issuers than a similar fund that invests more broadly.
Shareholder concentration risk
At March 31, 2018, affiliated shareholders of record owned 100.0% of the outstanding shares of the Fund in one or more accounts. Subscription and redemption activity by concentrated accounts may have a significant effect on the operations of the Fund. In the case of a large redemption, the Fund may be forced to sell investments at inopportune times, including its liquid positions, which may result in Fund losses and the Fund holding a higher percentage of less liquid positions. Large redemptions could result in decreased economies of scale and increased operating expenses for non-redeeming Fund shareholders.
Columbia Solutions Conservative Portfolio | Annual Report 2018
| 23 |
Notes to Financial Statements (continued)
March 31, 2018
Note 9. Subsequent events
Management has evaluated the events and transactions that have occurred through the date the financial statements were issued and noted no items requiring adjustment of the financial statements or additional disclosure.
Note 10. Information regarding pending and settled legal proceedings
Ameriprise Financial and certain of its affiliates have historically been involved in a number of legal, arbitration and regulatory proceedings, including routine litigation, class actions, and governmental actions, concerning matters arising in connection with the conduct of their business activities. Ameriprise Financial believes that the Fund is not currently the subject of, and that neither Ameriprise Financial nor any of its affiliates are the subject of, any pending legal, arbitration or regulatory proceedings that are likely to have a material adverse effect on the Fund or the ability of Ameriprise Financial or its affiliates to perform under their contracts with the Fund. Ameriprise Financial is required to make quarterly (10-Q), annual (10-K) and, as necessary, 8-K filings with the Securities and Exchange Commission (SEC) on legal and regulatory matters that relate to Ameriprise Financial and its affiliates. Copies of these filings may be obtained by accessing the SEC website at www.sec.gov.
There can be no assurance that these matters, or the adverse publicity associated with them, will not result in increased Fund redemptions, reduced sale of Fund shares or other adverse consequences to the Fund. Further, although we believe proceedings are not likely to have a material adverse effect on the Fund or the ability of Ameriprise Financial or its affiliates to perform under their contracts with the Fund, these proceedings are subject to uncertainties and, as such, we are unable to estimate the possible loss or range of loss that may result. An adverse outcome in one or more of these proceedings could result in adverse judgments, settlements, fines, penalties or other relief that could have a material adverse effect on the consolidated financial condition or results of operations of Ameriprise Financial.
| 24 | Columbia Solutions Conservative Portfolio | Annual Report 2018 |
Report of Independent Registered Public Accounting Firm
To the Trustees of Columbia Funds Series Trust I and Shareholders of Columbia Solutions Conservative Portfolio
Opinion on the Financial Statements
We have audited the accompanying statement of assets and liabilities, including the portfolio of investments, of Columbia Solutions Conservative Portfolio (one of the funds constituting Columbia Funds Series Trust I, referred to hereafter as the "Fund") as of March 31, 2018, the related statements of operations and changes in net assets, including the related notes, and the financial highlights for the period October 24, 2017 (commencement of operations) through March 31, 2018 (collectively referred to as the “financial statements”). In our opinion, the financial statements present fairly, in all material respects, the financial position of the Fund as of March 31, 2018, the results of its operations, changes in its net assets, and the financial highlights for the period October 24, 2017 (commencement of operations) through March 31, 2018 in conformity with accounting principles generally accepted in the United States of America.
Basis for Opinion
These financial statements are the responsibility of the Fund’s management. Our responsibility is to express an opinion on the Fund’s financial statements based on our audit. We are a public accounting firm registered with the Public Company Accounting Oversight Board (United States) (“PCAOB”) and are required to be independent with respect to the Fund in accordance with the U.S. federal securities laws and the applicable rules and regulations of the Securities and Exchange Commission and the PCAOB.
We conducted our audit of these financial statements in accordance with the standards of the PCAOB. Those standards require that we plan and perform the audit to obtain reasonable assurance about whether the financial statements are free of material misstatement, whether due to error or fraud.
Our audit included performing procedures to assess the risks of material misstatement of the financial statements, whether due to error or fraud, and performing procedures that respond to those risks. Such procedures included examining, on a test basis, evidence regarding the amounts and disclosures in the financial statements. Our audit also included evaluating the accounting principles used and significant estimates made by management, as well as evaluating the overall presentation of the financial statements. Our procedures included confirmation of securities owned as of March 31, 2018 by correspondence with the custodian, transfer agent and brokers. We believe that our audit provides a reasonable basis for our opinion.
/s/PricewaterhouseCoopers LLP
Minneapolis, Minnesota
May 22, 2018
We have served as auditors of one or more investment companies within the Columbia Funds Complex since 1977.
Columbia Solutions Conservative Portfolio | Annual Report 2018
| 25 |
Federal Income Tax Information
(Unaudited)
The Fund hereby designates the following tax attributes for the fiscal year ended March 31, 2018. Shareholders will be notified in early 2019 of the amounts for use in preparing 2018 income tax returns.
Capital
gain
dividend | |
| $40,469 | |
Capital gain dividend. The Fund designates as a capital gain dividend the amount reflected above, or if subsequently determined to be different, the net capital gain of such fiscal period.
| 26 | Columbia Solutions Conservative Portfolio | Annual Report 2018 |
Shareholders elect the Board that oversees the Fund’s operations. The Board appoints officers who are responsible for day-to-day business decisions based on policies set by the Board. The following table provides basic biographical information about the Fund’s Trustees, including their principal occupations during the past five years, although specific titles for individuals may have varied over the period. The year set forth beneath Length of Service in the table below is the year in which the Trustee was first appointed or elected as Trustee to any Fund currently in the Columbia Funds Complex or a predecessor thereof. Under current Board policy, members serve terms of indefinite duration.
Independent trustees
| Name, address, year of birth | Position held with the Trust and length of service | Principal occupation(s) during the past five years and other relevant professional experience | Number of Funds in the Columbia Fund Complex overseen | Other directorships held by Trustee during the past five years |
Janet Langford Carrig
c/o Columbia Management
Investment Advisers, LLC
225 Franklin Street
Mail Drop BX32 05228
Boston, MA 02110
1957 | Trustee
1996 | Senior Vice President, General Counsel and Corporate Secretary, ConocoPhillips (independent energy company) since September 2007 | 71 | None |
Douglas A. Hacker
c/o Columbia Management
Investment Advisers, LLC
225 Franklin Street
Mail Drop BX32 05228
Boston, MA 02110
1955 | Trustee and Chairman of the Board
1996 | Independent business executive since May 2006; Executive Vice President — Strategy of United Airlines from December 2002 to May 2006; President of UAL Loyalty Services (airline marketing company) from September 2001 to December 2002; Executive Vice President and Chief Financial Officer of United Airlines from July 1999 to September 2001 | 71 | Spartan Nash Company, (food distributor); Nash Finch Company (food distributor) from 2005 to 2013; Aircastle Limited (aircraft leasing); SeaCube Container Leasing Ltd. (container leasing) from 2010 to 2013; and Travelport Worldwide Limited (travel information technology) |
Nancy T. Lukitsh
c/o Columbia Management
Investment Advisers, LLC
225 Franklin Street
Mail Drop BX32 05228
Boston, MA 02110
1956 | Trustee
2011 | Senior Vice President, Partner and Director of Marketing, Wellington Management Company, LLP (investment adviser) from 1997 to 2010; Chair, Wellington Management Portfolios (commingled non-U.S. investment pools) from 2007 to 2010; Director, Wellington Trust Company, NA and other Wellington affiliates from 1997 to 2010 | 71 | None |
David M. Moffett
c/o Columbia Management
Investment Advisers, LLC
225 Franklin Street
Mail Drop BX32 05228
Boston, MA 02110
1952 | Trustee
2011 | Retired. Consultant to Bridgewater and Associates | 71 | Director, CSX Corporation; Genworth Financial, Inc. (financial and insurance products and services); PayPal Holdings Inc. (payment and data processing services); Trustee, University of Oklahoma Foundation; former Director, eBay Inc. (online trading community), 2007-2015; and former Director, CIT Bank, CIT Group Inc. (commercial and consumer finance), 2010-2016 |
John J. Neuhauser
c/o Columbia Management
Investment Advisers, LLC
225 Franklin Street
Mail Drop BX32 05228
Boston, MA 02110
1943 | Trustee
1984 | President, Saint Michael’s College since August 2007; Director or Trustee of several non-profit organizations, including University of Vermont Medical Center; Academic Vice President and Dean of Faculties, Boston College from August 1999 to October 2005; University Professor, Boston College from November 2005 to August 2007 | 71 | Liberty All-Star Equity Fund and Liberty All- Star Growth Fund (closed-end funds) |
Columbia Solutions Conservative Portfolio | Annual Report 2018
| 27 |
TRUSTEES AND OFFICERS (continued)
Independent trustees (continued)
| Name, address, year of birth | Position held with the Trust and length of service | Principal occupation(s) during the past five years and other relevant professional experience | Number of Funds in the Columbia Fund Complex overseen | Other directorships held by Trustee during the past five years |
Patrick J. Simpson
c/o Columbia Management
Investment Advisers, LLC
225 Franklin Street
Mail Drop BX32 05228
Boston, MA 02110
1944 | Trustee
2000 | Of Counsel, Perkins Coie LLP (law firm) since 2015; Partner, Perkins Coie LLP from 1988 to 2014 | 71 | None |
Anne-Lee Verville
c/o Columbia Management
Investment Advisers, LLC
225 Franklin Street
Mail Drop BX32 05228
Boston, MA 02110
1945 | Trustee
1998 | Retired. General Manager, Global Education Industry from 1994 to 1997, President – Application Systems Division from 1991 to 1994, Chief Financial Officer – US Marketing & Services from 1988 to 1991, and Chief Information Officer from 1987 to 1988, IBM Corporation (computer and technology) | 71 | Enesco Group, Inc. (producer of giftware and home and garden decor products) from 2001 to 2006 |
Consultants to the Independent Trustees*
| Name, address, year of birth | Position held with the Trust and length of service | Principal occupation(s) during the past five years and other relevant professional experience | Number of Funds in the Columbia Funds complex overseen | Other directorships held by Trustee during the past five years |
J. Kevin Connaughton
c/o Columbia
Management Investment
Advisers, LLC,
225 Franklin Street
Mail Drop BX32 05228,
Boston, MA 02110
1964 | Independent Trustee Consultant
2016 | Independent Trustee Consultant, Columbia Funds since March 2016; Adjunct Professor of Finance, Bentley University since November 2017; Managing Director and General Manager of Mutual Fund Products, Columbia Management Investment Advisers, LLC from May 2010 to February 2015; President, Columbia Funds from 2009 to 2015; and senior officer of Columbia Funds and affiliated funds from 2003 to 2015 | 71 | Director, The Autism Project since March 2015; former Trustee, New Century Portfolios, March 2015-December 2017; formerly on Board of Governors, Gateway Healthcare, January 2016 – December 2017 |
Natalie A. Trunow
c/o Columbia
Management Investment
Advisers, LLC,
225 Franklin Street
Mail Drop BX32 05228,
Boston, MA 02110
1967 | Independent Trustee Consultant
2016 | Independent Trustee Consultant, Columbia Funds since September 2016; Chief Executive Officer, Millennial Portfolio Solutions LLC (asset management and consulting services) since January 2016; Director of Investments, Casey Family Programs from April 2016 to September 2016; Senior Vice President and Chief Investment Officer, Calvert Investments from August 2008 to January 2016; Section Head and Portfolio Manager, General Motors Asset Management from June 1997 to August 2008 | 71 | Director, Health Services for Children with Special Needs, Inc.; Director, Guidewell Financial Solutions |
| * | J. Kevin Connaughton was appointed consultant to the Independent Trustees effective March 1, 2016. Natalie A. Trunow was appointed consultant to the Independent Trustees effective September 1, 2016. Shareholders of the Funds are expected to be asked to elect each of Mr. Connaughton and Ms. Trunow as a Trustee at a future shareholder meeting. |
| 28 | Columbia Solutions Conservative Portfolio | Annual Report 2018 |
TRUSTEES AND OFFICERS (continued)
Interested trustee affiliated with Investment Manager*
| Name, address, year of birth | Position held with the Trust and length of service | Principal occupation(s) during the past five years and other relevant professional experience | Number of Funds in the Columbia Funds Complex overseen | Other directorships held by Trustee during the past five years |
William F. Truscott
c/o Columbia Management
Investment Advisers, LLC
225 Franklin Street
Boston, MA 02110
1960 | Trustee
2012 | Chairman of the Board and President, Columbia Management Investment Advisers, LLC since May 2010 and February 2012, respectively; Chief Executive Officer, Global Asset Management, Ameriprise Financial, Inc. since September 2012 (previously Chief Executive Officer, U.S. Asset Management & President, Annuities, May 2010-September 2012); Director and Chief Executive Officer, Columbia Management Investment Distributors, Inc. since May 2010 and February 2012, respectively; Chairman of the Board and Chief Executive Officer, RiverSource Distributors, Inc. since 2006; Director, Threadneedle Asset Management Holdings, SARL since 2014; President and Chief Executive Officer, Ameriprise Certificate Company, 2006-August 2012 | 196 | Chairman of the Board, Columbia Management Investment Advisers, LLC since May 2010; Director, Columbia Management Investment Distributors, Inc. since May 2010; former Director, Ameriprise Certificate Company, 2006 - January 2013 |
| * | Interested person (as defined under the 1940 Act) by reason of being an officer, director, security holder and/or employee of the Investment Manager or Ameriprise Financial. |
The Statement of Additional Information has additional information about the Fund’s Board members and is available, without charge, upon request by calling 800.345.6611, visiting columbiathreadneedleus.com/investor/ or contacting your financial intermediary.
Columbia Solutions Conservative Portfolio | Annual Report 2018
| 29 |
TRUSTEES AND OFFICERS (continued)
The Board has appointed officers who are responsible for day-to-day business decisions based on policies it has established. The officers serve at the pleasure of the Board. The following table provides basic information about the Officers of the Fund, including principal occupations during the past five years, although their specific titles may have varied over the period. In addition to Mr. Truscott, who is Senior Vice President, the Fund’s other officers are:
Fund officers
Name,
address and
year of birth | Position and year
first appointed to
position for any Fund
in the Columbia
Funds complex or a
predecessor thereof | Principal occupation(s) during past five years |
Christopher O. Petersen
5228 Ameriprise
Financial Center
Minneapolis, MN 55474
Born 1970 | President and Principal Executive Officer (2015) | Vice President and Lead Chief Counsel, Ameriprise Financial, Inc. since January 2015 (previously, Vice President and Chief Counsel, January 2010 - December 2014; officer of Columbia Funds and affiliated funds since 2007. |
Michael G. Clarke
225 Franklin Street
Boston, MA 02110
Born 1969 | Treasurer (2011), Chief Financial Officer (2009) and Chief Accounting Officer (2015) | Vice President — Mutual Fund Administration, Columbia Management Investment Advisers, LLC, since May 2010; senior officer of Columbia Funds and affiliated funds since 2002. |
Paul B. Goucher
100 Park Avenue
New York, NY 10017
Born 1968 | Senior Vice President (2011) and Assistant Secretary (2008) | Senior Vice President and Assistant General Counsel, Ameriprise Financial, Inc. since January 2017 (previously Vice President and Lead Chief Counsel, November 2008 - January 2017 and January 2013 - January 2017, respectively; and Chief Counsel, January 2010 - January 2013); Vice President, Chief Legal Officer and Assistant Secretary, Columbia Management Investment Advisers, LLC since May 2010. |
Thomas P. McGuire
225 Franklin Street
Boston, MA 02110
Born 1972 | Senior Vice President and Chief Compliance Officer (2012) | Vice President — Asset Management Compliance, Ameriprise Financial, Inc., since May 2010; Chief Compliance Officer, Ameriprise Certificate Company since September 2010. |
Colin Moore
225 Franklin Street
Boston, MA 02110
Born 1958 | Senior Vice President (2010) | Executive Vice President and Global Chief Investment Officer, Ameriprise Financial, Inc., since July 2013; Executive Vice President and Global Chief Investment Officer, Columbia Management Investment Advisers, LLC since July 2013 (previously Director and Global Chief Investment Officer, 2010 - 2013). |
Ryan C. Larrenaga
225 Franklin Street
Boston, MA 02110
Born 1970 | Senior Vice President (2017), Chief Legal Officer (2017) and Secretary (2015) | Vice President and Group Counsel, Ameriprise Financial, Inc. since August 2011; officer of Columbia Funds and affiliated funds since 2005. |
Michael E. DeFao
225 Franklin Street
Boston, MA 02110
Born 1968 | Vice President (2011) and Assistant Secretary (2010) | Vice President and Chief Counsel, Ameriprise Financial, Inc. since May 2010. |
Amy Johnson
5228 Ameriprise
Financial Center
Minneapolis, MN 55474
Born 1965 | Vice President (2006) | Managing Director and Global Head of Operations, Columbia Management Investment Advisers, LLC since April 2016 (previously Managing Director and Chief Operating Officer, 2010 - 2016). |
Lyn Kephart-Strong
5228 Ameriprise
Financial Center
Minneapolis, MN 55474
Born 1960 | Vice President (2015) | President, Columbia Management Investment Services Corp. since October 2014; Vice President & Resolution Officer, Ameriprise Trust Company since August 2009. |
| 30 | Columbia Solutions Conservative Portfolio | Annual Report 2018 |
Board Consideration and Approval of Management Agreement and Subadvisory Agreement
On August 16, 2017, the Board of Trustees (the Board) and the Trustees who are not interested persons (as defined in the Investment Company Act of 1940) (the Independent Trustees) of Columbia Funds Series Trust I (the Trust) unanimously approved, for an initial two-year term, the Management Agreement (the Management Agreement) with Columbia Management Investment Advisers, LLC (the Investment Manager) and the Subadvisory Agreement (the Subadvisory Agreement) between the Investment Manager and Threadneedle International Limited with respect to Columbia Solutions Conservative Portfolio (the Fund), a series of the Trust. As detailed below, the Board’s Advisory Fees and Expenses Committee (the Committee) and the Board met to review and discuss, both among themselves and with the management team of the Investment Manager, materials provided by the Investment Manager and others before determining to approve the Management Agreement and the Subadvisory Agreement (collectively, the Agreements).
In connection with their deliberations regarding the proposed Management Agreement and Subadvisory Agreement, the Committee and the Board evaluated materials requested from the Investment Manager regarding the Fund and the Agreements, and discussed these materials, as well as other materials provided by the Investment Manager in connection with the Board’s most recent annual approval of the continuation of the management agreements with respect to other series of the Trust, with representatives of the Investment Manager at the Committee meeting held on August 15, 2017, and at Board meetings held on June 14, 2017 and August 15, 2017.
The Committee and the Board also consulted with Fund counsel and the Independent Trustees’ independent legal counsel, who advised on various matters with respect to the Committee’s and the Board’s considerations and otherwise assisted the Committee and the Board in their deliberations.
The Committee and the Board considered all information that they, their legal counsel or the Investment Manager believed reasonably necessary to evaluate and to determine whether to recommend for approval or approve the Management Agreement and the Subadvisory Agreement. The information and factors considered by the Committee and the Board in recommending for approval or approving the Management Agreement and the Subadvisory Agreement for the Fund included the following:
| • | The Investment Manager’s agreement to contractually limit or cap total operating expenses for the Fund through July 31, 2019 so that total operating expenses (excluding certain fees and expenses, such as transaction costs and certain other investment related expenses, interest, taxes, and infrequent and/or unusual expenses) would not exceed a specified annual rate, as a percentage of the Fund’s net assets; |
| • | The terms and conditions of the Agreements; |
| • | Information on the Fund’s proposed management fees and anticipated total expenses, including the absence of a management fee for the Fund; |
| • | The current and proposed terms and conditions of other agreements and arrangements with affiliates of the Investment Manager relating to the operations of the Fund, including agreements with respect to the provision of distribution, transfer agency and shareholder services to the Fund; |
| • | Descriptions of various functions performed by the Investment Manager and the Subadviser under the Agreements, including portfolio management and portfolio trading practices; |
| • | Information regarding the reputation, regulatory history and resources of the Investment Manager, including information regarding senior management, portfolio managers and other personnel; and |
| • | Information regarding the capabilities of the Investment Manager and the Subadviser with respect to compliance monitoring services, including an assessment of the Investment Manager’s and the Subadviser’s compliance systems by the Fund’s Chief Compliance Officer. |
Nature, extent and quality of services to be provided under the Agreements
The Committee and the Board considered the nature, extent and quality of services to be provided to the Fund by the Investment Manager, the Subadviser and the Investment Manager’s affiliates under the Agreements and under separate agreements for the provision of distribution, transfer agency and shareholder services, and the resources to be dedicated to
Columbia Solutions Conservative Portfolio | Annual Report 2018
| 31 |
Board Consideration and Approval of Management Agreement and Subadvisory Agreement (continued)
the Fund and the other Columbia Funds by the Investment Manager, the Subadviser and the Investment Manager’s affiliates. The Committee and the Board considered, among other things, the Investment Manager’s ability to attract, motivate and retain highly qualified research, advisory and supervisory investment professionals (including compensation programs for personnel involved in fund management, reputation and other attributes), the portfolio management services provided by those investment professionals, and the quality of the Investment Manager’s and the Subadviser’s investment research capabilities and trade execution services. The Committee and the Board also considered the potential benefits to shareholders of investing in a mutual fund that is part of a fund complex offering exposure to a variety of asset classes and investment disciplines and providing a variety of fund and shareholder services.
The Committee and the Board also considered the professional experience and qualifications of the senior personnel of the Investment Manager and the Subadviser, which included consideration of the Investment Manager’s and the Subadviser’s experience with similarly-structured funds. The Committee and the Board noted the compliance programs of and the compliance-related resources provided to the Fund by the Investment Manager and its affiliates, and considered the Investment Manager’s ability to provide administrative services to the Fund and coordinate the activities of the Fund’s other service providers. The Board also noted that the Board had approved the Subadviser’s code of ethics and compliance program, and that the Chief Compliance Officer of the Funds reports to the Trustees on the Subadviser’s compliance program.
The Committee and the Board also considered the scope of services provided to the Fund by the Investment Manager that would be distinct from and in addition to those provided by the Subadviser in the event that the Investment Manager, in the future, allocated investments to be managed by the Subadviser, including cash flow management, treasury services, risk oversight, investment oversight and Subadviser selection, oversight and transition management.
After reviewing these and related factors, the Committee and the Board concluded, within the context of their overall conclusions, that the expected nature, extent and quality of the services to be provided to the Fund under the Agreements supported the approval of the Agreements.
Investment performance
Because the Fund had not yet commenced operations, the Committee and the Board did not have investment performance to compare to the returns of a group of comparable mutual funds. However, the Committee and the Board expected to consider, in connection with their next review and consideration of the continuation of the Agreements, the investment performance of the Fund in relation to the annualized return for various time periods of both a group of comparable funds, as determined by the independent third-party data provider, and a benchmark.
The Committee and the Board also considered the Investment Manager’s and Subadviser’s performance and reputation generally, the Investment Manager’s historical responsiveness to Board concerns about performance, and the Investment Manager’s willingness to take steps intended to improve performance. After reviewing these and related factors, the Committee and the Board concluded, within the context of their overall conclusions, that the performance of the Investment Manager and the Subadviser were sufficient, in light of other considerations, to warrant the approval of the Agreements.
The Committee and the Board noted that they most recently reviewed the performance of the Columbia Adaptive Risk Allocation Fund, which utilizes an investment approach generally similar to the Fund, in connection with the Board’s most recent annual approval of the continuation of the management agreement with respect to the Columbia Adaptive Risk Allocation Fund at its June 14, 2017 Board meeting, including information about the performance of the Columbia Adaptive Risk Allocation Fund over various time periods, including performance information relative to benchmarks and information that compared the performance of the Columbia Adaptive Risk Allocation Fund to the performance of a group of comparable mutual funds as determined by an independent third party data provider.
Investment management fee rates and other expenses
The Committee and the Board considered the absence of management fees to be charged to the Fund under the Management Agreement and the Subadvisory Agreement, as well as the total expenses expected to be incurred by the Fund. In assessing the reasonableness of the proposed fees under the Agreements, the Committee and the Board considered, among other information, the Fund’s proposed management fee and its expected total expense ratio as a percentage of
| 32 | Columbia Solutions Conservative Portfolio | Annual Report 2018 |
Board Consideration and Approval of Management Agreement and Subadvisory Agreement (continued)
average daily net assets. The Committee and the Board also noted that the Investment Manager will pay the fees of the Subadviser if and when the Investment Manager allocates assets of the Fund to be managed by the Subadviser. The Committee and the Board noted that the Subadviser was not currently expected to manage any assets under the Subadvisory Agreement, but that the Investment Manager could, in the future, allocate investments to be managed by the Subadviser. The Committee and the Board also took into account the proposed fee waiver and expense limitation arrangements that the Investment Manager and the Subadviser would observe during the Fund’s first year.
After reviewing these and related factors, the Committee and the Board concluded, within the context of their overall conclusions, that the management fee rates and expenses of the Fund supported the approval of the Agreements.
Costs of services to be provided and profitability
The Committee and the Board also took note of the absence of management fees and the proposed fee waiver and expense limitation arrangements, and also noted that the Committee and the Board expected to consider the costs of services and the profitability of the Investment Manager and its affiliates in connection with the Committee’s and the Board’s next review and consideration of the continuation of the Agreements. The Committee and the Board also considered court cases in which adviser profitability was an issue in whole or in part, the performance of similarly managed funds, the expected expense ratio of the Fund, and the implementation of expense limitations with respect to the Fund. In addition, the Committee and the Board considered information provided by the Investment Manager regarding the Investment Manager’s financial condition.
After reviewing these and related factors, the Committee and the Board concluded, within the context of their overall conclusions, that the expected profitability to the Investment Manager and its affiliates from their relationships with the Fund supported the approval of the Agreements.
Economies of scale
The Committee and the Board considered the potential existence of economies of scale in the provision by the Investment Manager of services to the Fund, to groups of related funds, and to the Investment Manager’s investment advisory clients as a whole, and whether those economies of scale were expected to be shared with the Fund through breakpoints in the proposed investment management fees or other means, such as expense limitation arrangements and additional investments by the Investment Manager in investment, trading, compliance and other resources.
After reviewing these and related factors, the Committee and the Board concluded, within the context of their overall conclusions, that the absence of management fees and the proposed fee waiver and expense limitation arrangements supported the approval of the Agreements.
Other benefits to the Investment Manager
The Committee and the Board received and considered information regarding “fall-out” or ancillary benefits to be received by the Investment Manager and its affiliates as a result of their relationships with the Fund, such as the engagement of the Investment Manager’s affiliates to provide distribution, transfer agency and shareholder services to the Fund. The Committee and the Board also considered the benefits of research made available to the Investment Manager by reason of brokerage commissions to be generated by the Fund’s securities transactions, and reviewed information about the Investment Manager’s practices with respect to allocating portfolio transactions for brokerage and research services. The Committee and the Board recognized that the Investment Manager’s profitability would be somewhat lower without these benefits.
Conclusion
The Committee and the Board reviewed all of the above considerations in reaching their decisions to recommend for approval or approve the proposed Agreements. In their deliberations, the Trustees did not identify any particular information that was all-important or controlling, and individual Trustees may have attributed different weights to the various factors. Based on their evaluation of all factors that they deemed to be material, including those factors described above, and assisted by the advice of independent legal counsel, the Board, including the Independent Trustees, voting separately, approved the Agreements.
Columbia Solutions Conservative Portfolio | Annual Report 2018
| 33 |
The Fund mails one shareholder report to each shareholder address. If you would like more than one report, please call shareholder services at 800.345.6611 and additional reports will be sent to you.
Proxy voting policies and procedures
The policy of the Board of Trustees is to vote the proxies of the companies in which the Fund holds investments consistent with the procedures as stated in the Statement of Additional Information (SAI). You may obtain a copy of the SAI without charge by calling 800.345.6611; contacting your financial intermediary; visiting columbiathreadneedleus.com/investor/; or searching the website of the Securities and Exchange Commission (SEC) at sec.gov. Information regarding how the Fund voted proxies relating to portfolio securities is filed with the SEC by August 31st for the most recent 12-month period ending June 30th of that year, and is available without charge by visiting columbiathreadneedleus.com/investor/, or searching the website of the SEC at sec.gov.
Quarterly schedule of investments
The Fund files a complete schedule of portfolio holdings with the SEC for the first and third quarters of each fiscal year on Form N-Q. The Fund’s Form N-Q is available on the SEC’s website at sec.gov and may be reviewed and copied at the SEC’s Public Reference Room in Washington, D.C. Information on the operation of the Public Reference Room may be obtained by calling 800.SEC.0330. The Fund’s complete schedule of portfolio holdings, as filed on Form N-Q, can also be obtained without charge, upon request, by calling 800.345.6611.
Additional Fund information
For more information about the Fund, please visit columbiathreadneedleus.com/investor/ or call 800.345.6611. Customer Service Representatives are available to answer your questions Monday through Friday from 8 a.m. to 7 p.m. Eastern time.
Fund investment manager
Columbia Management Investment Advisers, LLC
225 Franklin Street
Boston, MA 02110
Fund distributor
Columbia Management Investment Distributors, Inc.
225 Franklin Street
Boston, MA 02110
Fund transfer agent
Columbia Management Investment Services Corp.
P.O. Box 8081
Boston, MA 02266-8081
| 34 | Columbia Solutions Conservative Portfolio | Annual Report 2018 |
[THIS PAGE INTENTIONALLY LEFT BLANK]
[THIS PAGE INTENTIONALLY LEFT BLANK]
[THIS PAGE INTENTIONALLY LEFT BLANK]
Columbia Solutions Conservative Portfolio
P.O. Box 8081
Boston, MA 02266-8081
Please read and consider the investment objectives, risks, charges and expenses for any fund carefully before investing. For a prospectus, which contains this and other important information about the Fund, go to columbiathreadneedleus.com/investor/. The Fund is distributed by Columbia Management Investment Distributors, Inc., member FINRA, and managed by Columbia Management Investment Advisers, LLC.
Columbia Threadneedle Investments (Columbia Threadneedle) is the global brand name of the Columbia and Threadneedle group of companies. All rights reserved. Columbia Management Investment Distributors, Inc., 225 Franklin Street, Boston, MA 02110-2804
© 2018 Columbia Management Investment Advisers, LLC.
columbiathreadneedleus .com/investor/

Annual Report
March 31, 2018
Columbia Adaptive Retirement Funds
Columbia Adaptive Retirement 2020 Fund
Columbia Adaptive Retirement 2030 Fund
Columbia Adaptive Retirement 2040 Fund
Columbia Adaptive Retirement 2050 Fund
Columbia Adaptive Retirement 2060 Fund
Not FDIC Insured • No bank guarantee • May lose value
Dear Shareholders,
The year 2017 was an extraordinary year in the financial markets. The S&P 500 Index didn’t experience a single down month and returned over 20%. Continuing this trend, January 2018 marked the fastest start for the index ever. Low volatility, which had been a feature of the U.S. equity market for several years, along with the surge in the S&P 500 Index, drove investor sentiment to very high levels. This arguably set the stage for an overdue correction, which we witnessed in February 2018.
A return to volatility
There have been few periods of market upheaval such as were experienced in the first part of 2018. While investors were taken by surprise by the sudden and pronounced market swings, the return to some level of volatility actually marked a resumption of relatively normal market conditions. Having said that, it’s important to distinguish between a good technical correction where excess enthusiasm in the marketplace is being let out, versus a real change in the underlying fundamentals – things like an underperforming economy or weaker corporate earnings. Our view is that the recent market volatility falls into the former category, and the fundamentals remain strong. We’re continuing to see improvements in global economic activity, and we’re seeing corporate earnings expectations continue to rise – and not just because of tax reform.
Consistency is more important than ever
It’s important to keep in mind that when it comes to long-term investing, it’s the destination, not the journey that matters most. If you have a financial goal that you’ve worked out with your financial advisor, and you have a good asset allocation plan to reach it, it’s a question of sticking with your plan rather than become focused on near-term volatility. Bouts of volatility are normal. After all, it’s hard to cross the ocean without hitting an occasional rough patch. You need to focus on the destination.
One final thought. In weathering volatility, it’s the consistency of the return that is essential. Investors who chase higher returns are usually the first to sell when an investment goes through a bad patch, and they therefore don’t tend to benefit from the recovery. More disciplined investors who perhaps panic less or not at all during periods of volatility, tend to have improved long-term results and are more likely to reach their financial goals. Nothing is more important to us than making sure those who have entrusted us to protect and grow their assets are able to do what matters most to them.
Your success is our priority. Talk to your financial advisor about how working with Columbia Threadneedle Investments may help you position your portfolio for consistent, sustainable outcomes, no matter the market conditions.
Sincerely,
Christopher O. Petersen
President, Columbia Funds
The S&P 500 Index, an unmanaged index, measures the performance of 500 widely held, large-capitalization U.S. stocks and is frequently used as a general measure of market performance. Past performance is no guarantee of future results.
Columbia Funds are distributed by Columbia Management Investment Distributors, Inc., member FINRA, and managed by Columbia Management Investment Advisers, LLC.
© 2018 Columbia Management Investment Advisers, LLC. All rights reserved.
Columbia Adaptive Retirement Funds | Annual Report 2018
| 2 |
| 3 |
| 4 |
| 5 |
| 6 |
| 7 |
| 9 |
| 19 |
| 21 |
| 23 |
| 30 |
| 40 |
| 48 |
| 49 |
| 50 |
| 54 |
| 58 |
Columbia Adaptive Retirement Funds | Annual Report 2018
Fund at a Glance
Columbia Adaptive Retirement 2020 Fund
Investment objective
Columbia Adaptive Retirement 2020 Fund (the Fund) seeks capital appreciation and current income.
Portfolio management
Jeffrey Knight, CFA
Lead Portfolio Manager
Managed Fund since October 2017
Joshua Kutin, CFA
Portfolio Manager
Managed Fund since October 2017
Alexander Wilkinson, CFA, CAIA
Portfolio Manager
Managed Fund since October 2017
| Portfolio breakdown (%) (at March 31, 2018) |
| Alternative Strategies Funds | 83.9 |
| Exchange-Traded Funds | 11.8 |
| Money Market Funds | 4.3 |
| Total | 100.0 |
Percentages indicated are based upon total investments. The Fund’s portfolio composition is subject to change.
| 2 | Columbia Adaptive Retirement Funds | Annual Report 2018 |
Fund at a Glance
Columbia Adaptive Retirement 2030 Fund
Investment objective
Columbia Adaptive Retirement 2030 Fund (the Fund) seeks capital appreciation and current income.
Portfolio management
Jeffrey Knight, CFA
Lead Portfolio Manager
Managed Fund since October 2017
Joshua Kutin, CFA
Portfolio Manager
Managed Fund since October 2017
Alexander Wilkinson, CFA, CAIA
Portfolio Manager
Managed Fund since October 2017
| Portfolio breakdown (%) (at March 31, 2018) |
| Alternative Strategies Funds | 83.8 |
| Exchange-Traded Funds | 12.0 |
| Money Market Funds | 4.2 |
| Total | 100.0 |
Percentages indicated are based upon total investments. The Fund’s portfolio composition is subject to change.
Columbia Adaptive Retirement Funds | Annual Report 2018
| 3 |
Fund at a Glance
Columbia Adaptive Retirement 2040 Fund
Investment objective
Columbia Adaptive Retirement 2040 Fund (the Fund) seeks capital appreciation and current income.
Portfolio management
Jeffrey Knight, CFA
Lead Portfolio Manager
Managed Fund since October 2017
Joshua Kutin, CFA
Portfolio Manager
Managed Fund since October 2017
Alexander Wilkinson, CFA, CAIA
Portfolio Manager
Managed Fund since October 2017
| Portfolio breakdown (%) (at March 31, 2018) |
| Alternative Strategies Funds | 83.5 |
| Exchange-Traded Funds | 12.1 |
| Money Market Funds | 4.4 |
| Total | 100.0 |
Percentages indicated are based upon total investments. The Fund’s portfolio composition is subject to change.
| 4 | Columbia Adaptive Retirement Funds | Annual Report 2018 |
Fund at a Glance
Columbia Adaptive Retirement 2050 Fund
Investment objective
Columbia Adaptive Retirement 2050 Fund (the Fund) seeks capital appreciation and current income.
Portfolio management
Jeffrey Knight, CFA
Lead Portfolio Manager
Managed Fund since October 2017
Joshua Kutin, CFA
Portfolio Manager
Managed Fund since October 2017
Alexander Wilkinson, CFA, CAIA
Portfolio Manager
Managed Fund since October 2017
| Portfolio breakdown (%) (at March 31, 2018) |
| Alternative Strategies Funds | 83.4 |
| Exchange-Traded Funds | 12.3 |
| Money Market Funds | 4.3 |
| Total | 100.0 |
Percentages indicated are based upon total investments. The Fund’s portfolio composition is subject to change.
Columbia Adaptive Retirement Funds | Annual Report 2018
| 5 |
Fund at a Glance
Columbia Adaptive Retirement 2060 Fund
Investment objective
Columbia Adaptive Retirement 2060 Fund (the Fund) seeks capital appreciation and current income.
Portfolio management
Jeffrey Knight, CFA
Lead Portfolio Manager
Managed Fund since October 2017
Joshua Kutin, CFA
Portfolio Manager
Managed Fund since October 2017
Alexander Wilkinson, CFA, CAIA
Portfolio Manager
Managed Fund since October 2017
| Portfolio breakdown (%) (at March 31, 2018) |
| Alternative Strategies Funds | 83.4 |
| Exchange-Traded Funds | 12.3 |
| Money Market Funds | 4.3 |
| Total | 100.0 |
Percentages indicated are based upon total investments. The Fund’s portfolio composition is subject to change.
| 6 | Columbia Adaptive Retirement Funds | Annual Report 2018 |
Understanding Your Fund’s Expenses
(Unaudited)
As an investor, you incur two types of costs. There are transaction costs, which may include redemption fees. There are also ongoing costs, which generally include management fees, distribution and/or service fees, and other fund expenses. The following information is intended to help you understand your ongoing costs (in dollars) of investing in the Fund and to help you compare these costs with the ongoing costs of investing in other mutual funds.
Analyzing your Fund’s expenses
To illustrate these ongoing costs, we have provided examples and calculated the expenses paid by investors in each share class of the Fund during the period. The actual and hypothetical information in the table is based on an initial investment of $1,000 at the beginning of the period indicated and held for the entire period. Expense information is calculated two ways and each method provides you with different information. The amount listed in the “Actual” column is calculated using the Fund’s actual operating expenses and total return for the period. You may use the Actual information, together with the amount invested, to estimate the expenses that you paid over the period. Simply divide your account value by $1,000 (for example, an $8,600 account value divided by $1,000 = 8.6), then multiply the results by the expenses paid during the period under the “Actual” column. The amount listed in the “Hypothetical” column assumes a 5% annual rate of return before expenses (which is not the Fund’s actual return) and then applies the Fund’s actual expense ratio for the period to the hypothetical return. You should not use the hypothetical account values and expenses to estimate either your actual account balance at the end of the period or the expenses you paid during the period. See “Compare with other funds” below for details on how to use the hypothetical data.
In addition to the ongoing expenses which the Fund bears directly, the Fund’s shareholders indirectly bear the Fund’s allocable share of the costs and expenses of each underlying fund in which the Fund invests. You can also estimate the effective expenses paid during the period, which includes the indirect fees associated with investing in the underlying funds, by using the amounts listed in the “Effective expenses paid during the period” column.
Compare with other funds
Since all mutual funds are required to include the same hypothetical calculations about expenses in shareholder reports, you can use this information to compare the ongoing cost of investing in the Fund with other funds. To do so, compare the hypothetical example with the 5% hypothetical examples that appear in the shareholder reports of other funds. As you compare hypothetical examples of other funds, it is important to note that hypothetical examples are meant to highlight the ongoing costs of investing in a fund only and do not reflect any transaction costs, such as redemption or exchange fees. Therefore, the hypothetical calculations are useful in comparing ongoing costs only, and will not help you determine the relative total costs of owning different funds. If transaction costs were included in these calculations, your costs would be higher.
| October 1, 2017 — March 31, 2018 |
| | Account value at the
beginning of the
period ($) | Account value at the
end of the
period ($) | Expenses paid during
the period ($) | Fund’s annualized
expense ratio (%) | Effective expenses
paid during the
period ($) | Fund’s effective
annualized
expense ratio (%) |
| | Actual | Hypothetical | Actual | Hypothetical | Actual | Hypothetical | Actual | Actual | Hypothetical | Actual |
| Columbia Adaptive Retirement 2020 Fund |
| Advisor Class | 1,000.00 | 1,000.00 | 1,007.10 (a) | 1,022.76 | 1.76 (a) | 2.06 | 0.41 (a) | 2.10 (a) | 2.46 | 0.49 (a) |
| Institutional 3 Class | 1,000.00 | 1,000.00 | 1,007.10 (a) | 1,022.76 | 1.76 (a) | 2.06 | 0.41 (a) | 2.10 (a) | 2.46 | 0.49 (a) |
| Columbia Adaptive Retirement 2030 Fund |
| Advisor Class | 1,000.00 | 1,000.00 | 1,008.60 (a) | 1,022.76 | 1.76 (a) | 2.06 | 0.41 (a) | 2.10 (a) | 2.46 | 0.49 (a) |
| Institutional 3 Class | 1,000.00 | 1,000.00 | 1,008.60 (a) | 1,022.76 | 1.76 (a) | 2.06 | 0.41 (a) | 2.10 (a) | 2.46 | 0.49 (a) |
| Columbia Adaptive Retirement 2040 Fund |
| Advisor Class | 1,000.00 | 1,000.00 | 1,009.60 (a) | 1,022.71 | 1.80 (a) | 2.11 | 0.42 (a) | 2.10 (a) | 2.46 | 0.49 (a) |
| Institutional 3 Class | 1,000.00 | 1,000.00 | 1,009.60 (a) | 1,022.71 | 1.80 (a) | 2.11 | 0.42 (a) | 2.10 (a) | 2.46 | 0.49 (a) |
| Columbia Adaptive Retirement 2050 Fund |
| Advisor Class | 1,000.00 | 1,000.00 | 1,010.80 (a) | 1,022.71 | 1.80 (a) | 2.11 | 0.42 (a) | 2.11 (a) | 2.46 | 0.49 (a) |
| Institutional 3 Class | 1,000.00 | 1,000.00 | 1,010.80 (a) | 1,022.71 | 1.80 (a) | 2.11 | 0.42 (a) | 2.11 (a) | 2.46 | 0.49 (a) |
Columbia Adaptive Retirement Funds | Annual Report 2018
| 7 |
Understanding Your Fund’s Expenses (continued)
(Unaudited)
| October 1, 2017 — March 31, 2018 |
| | Account value at the
beginning of the
period ($) | Account value at the
end of the
period ($) | Expenses paid during
the period ($) | Fund’s annualized
expense ratio (%) | Effective expenses
paid during the
period ($) | Fund’s effective
annualized
expense ratio (%) |
| | Actual | Hypothetical | Actual | Hypothetical | Actual | Hypothetical | Actual | Actual | Hypothetical | Actual |
| Columbia Adaptive Retirement 2060 Fund |
| Advisor Class | 1,000.00 | 1,000.00 | 1,011.10 (a) | 1,022.71 | 1.81 (a) | 2.11 | 0.42 (a) | 2.11 (a) | 2.46 | 0.49 (a) |
| Institutional 3 Class | 1,000.00 | 1,000.00 | 1,011.10 (a) | 1,022.71 | 1.81 (a) | 2.11 | 0.42 (a) | 2.11 (a) | 2.46 | 0.49 (a) |
| (a) | Based on operations from October 24, 2017 (commencement of operations) through the stated period end. |
Expenses paid during the period are equal to the annualized expense ratio for each class as indicated above, multiplied by the average account value over the period and then multiplied by the number of days in the Fund’s most recent fiscal half year and divided by 365.
Effective expenses paid during the period and the Fund’s effective annualized expense ratio include expenses borne directly to the class plus the Fund’s pro rata portion of the ongoing expenses charged by the underlying funds using the expense ratio of each class of the underlying funds as of the underlying fund’s most recent shareholder report.
Had Columbia Management Investment Advisers, LLC and/or certain of its affiliates not waived/reimbursed certain fees and expenses for each fund, account value at the end of the period would have been reduced.
| 8 | Columbia Adaptive Retirement Funds | Annual Report 2018 |
Portfolio of Investments
Columbia Adaptive Retirement 2020 Fund, March 31, 2018
(Percentages represent value of investments compared to net assets)
Investments in securities
| Alternative Strategies Funds 83.7% |
| | Shares | Value ($) |
| Columbia Commodity Strategy Fund, Institutional 3 Class(a) | 35,035 | 200,397 |
| Columbia Solutions Aggressive Portfolio(a) | 68,473 | 689,528 |
| Columbia Solutions Conservative Portfolio(a) | 329,657 | 3,313,053 |
Total Alternative Strategies Funds
(Cost $4,179,069) | 4,202,978 |
|
| Exchange-Traded Funds 11.8% |
| | |
| iShares JPMorgan USD Emerging Markets Bond ETF | 868 | 97,928 |
| iShares TIPS Bond ETF | 1,767 | 199,759 |
| iShares U.S. Real Estate ETF | 2,612 | 197,128 |
| Vanguard Mortgage-Backed Securities ETF | 1,909 | 98,504 |
Total Exchange-Traded Funds
(Cost $610,044) | 593,319 |
|
| Money Market Funds 4.3% |
| | Shares | Value ($) |
| Columbia Short-Term Cash Fund, 1.738%(a),(b) | 214,131 | 214,110 |
Total Money Market Funds
(Cost $214,130) | 214,110 |
Total Investments in Securities
(Cost: $5,003,243) | 5,010,407 |
| Other Assets & Liabilities, Net | | 8,047 |
| Net Assets | 5,018,454 |
Notes to Portfolio of Investments
| (a) | As defined in the Investment Company Act of 1940, an affiliated company is one in which the Fund owns 5% or more of the company’s outstanding voting securities, or a company which is under common ownership or control with the Fund. Holdings and transactions in these affiliated companies during the year ended March 31, 2018 are as follows: |
| Issuer | Beginning
shares | Shares
purchased | Shares
sold | Ending
shares | Capital gain
distributions —
affiliated
issuers ($) | Realized gain
(loss) —
affiliated
issuers ($) | Net change in
unrealized
appreciation
(depreciation) —
affiliated
issuers ($) | Dividends —
affiliated
issuers ($) | Value —
affiliated
issuers
at end of
period ($) |
| Columbia Commodity Strategy Fund, Institutional 3 Class |
| | — | 53,534 | (18,499) | 35,035 | — | (185) | 3,860 | 321 | 200,397 |
| Columbia Short-Term Cash Fund, 1.738% |
| | — | 5,252,909 | (5,038,778) | 214,131 | — | (1) | (21) | 1,290 | 214,110 |
| Columbia Solutions Aggressive Portfolio |
| | — | 82,185 | (13,712) | 68,473 | 2,961 | 4,761 | 4,519 | 2,942 | 689,528 |
| Columbia Solutions Conservative Portfolio |
| | — | 331,622 | (1,965) | 329,657 | 4,409 | (7) | 15,531 | 8,984 | 3,313,053 |
| Total | | | | | 7,370 | 4,568 | 23,889 | 13,537 | 4,417,088 |
| (b) | The rate shown is the seven-day current annualized yield at March 31, 2018. |
Fair value measurements
The Fund categorizes its fair value measurements according to a three-level hierarchy that maximizes the use of observable inputs and minimizes the use of unobservable inputs by prioritizing that the most observable input be used when available. Observable inputs are those that market participants would use in pricing an investment based on market data obtained from sources independent of the reporting entity. Unobservable inputs are those that reflect the Fund’s assumptions about the information market participants would use in pricing an investment. An investment’s level within the fair value hierarchy is based on the lowest level of any input that is deemed significant to the asset’s or liability’s fair value measurement. The input levels are not necessarily an indication of the risk or liquidity associated with investments at that level. For example, certain U.S. government securities are generally high quality and liquid, however, they are reflected as Level 2 because the inputs used to determine fair value may not always be quoted prices in an active market.
Fair value inputs are summarized in the three broad levels listed below:
| ■ | Level 1 — Valuations based on quoted prices for investments in active markets that the Fund has the ability to access at the measurement date. Valuation adjustments are not applied to Level 1 investments. |
The accompanying Notes to Financial Statements are an integral part of this statement.
Columbia Adaptive Retirement Funds | Annual Report 2018
| 9 |
Portfolio of Investments (continued)
Columbia Adaptive Retirement 2020 Fund, March 31, 2018
Fair value measurements (continued)
| ■ | Level 2 — Valuations based on other significant observable inputs (including quoted prices for similar securities, interest rates, prepayment speeds, credit risks, etc.). |
| ■ | Level 3 — Valuations based on significant unobservable inputs (including the Fund’s own assumptions and judgment in determining the fair value of investments). |
Inputs that are used in determining fair value of an investment may include price information, credit data, volatility statistics, and other factors. These inputs can be either observable or unobservable. The availability of observable inputs can vary between investments, and is affected by various factors such as the type of investment, and the volume and level of activity for that investment or similar investments in the marketplace. The inputs will be considered by the Investment Manager, along with any other relevant factors in the calculation of an investment’s fair value. The Fund uses prices and inputs that are current as of the measurement date, which may include periods of market dislocations. During these periods, the availability of prices and inputs may be reduced for many investments. This condition could cause an investment to be reclassified between the various levels within the hierarchy.
Certain investments that have been measured at fair value using the net asset value (NAV) per share (or its equivalent) are not categorized in the fair value hierarchy. The fair value amounts presented in the table are intended to reconcile the fair value hierarchy to the amounts presented in the Portfolio of Investments. The Columbia Solutions Portfolios serve as investment vehicles for the Columbia Adaptive Retirement Funds and each pursues consistent total returns by seeking to allocate risks across multiple asset classes. Investments in the Columbia Solutions Portfolios may be redeemed on a daily basis without restriction. The Columbia Short-Term Cash Fund seeks to provide shareholders with maximum current income consistent with liquidity and stability of principal. Columbia Short-Term Cash Fund prices its shares with a floating NAV and no longer seeks to maintain a stable NAV.
Investments falling into the Level 3 category are primarily supported by quoted prices from brokers and dealers participating in the market for those investments. However, these may be classified as Level 3 investments due to lack of market transparency and corroboration to support these quoted prices. Additionally, valuation models may be used as the pricing source for any remaining investments classified as Level 3. These models may rely on one or more significant unobservable inputs and/or significant assumptions by the Investment Manager. Inputs used in valuations may include, but are not limited to, financial statement analysis, capital account balances, discount rates and estimated cash flows, and comparable company data.
Under the direction of the Fund’s Board of Trustees (the Board), the Investment Manager’s Valuation Committee (the Committee) is responsible for overseeing the valuation procedures approved by the Board. The Committee consists of voting and non-voting members from various groups within the Investment Manager’s organization, including operations and accounting, trading and investments, compliance, risk management and legal.
The Committee meets at least monthly to review and approve valuation matters, which may include a description of specific valuation determinations, data regarding pricing information received from approved pricing vendors and brokers and the results of Board-approved valuation control policies and procedures (the Policies). The Policies address, among other things, instances when market quotations are or are not readily available, including recommendations of third party pricing vendors and a determination of appropriate pricing methodologies; events that require specific valuation determinations and assessment of fair value techniques; securities with a potential for stale pricing, including those that are illiquid, restricted, or in default; and the effectiveness of third party pricing vendors, including periodic reviews of vendors. The Committee meets more frequently, as needed, to discuss additional valuation matters, which may include the need to review back-testing results, review time-sensitive information or approve related valuation actions. The Committee reports to the Board, with members of the Committee meeting with the Board at each of its regularly scheduled meetings to discuss valuation matters and actions during the period, similar to those described earlier.
For investments categorized as Level 3, the Committee monitors information similar to that described above, which may include: (i) data specific to the issuer or comparable issuers, (ii) general market or specific sector news and (iii) quoted prices and specific or similar security transactions. The Committee considers this data and any changes from prior periods in order to assess the reasonableness of observable and unobservable inputs, any assumptions or internal models used to value those securities and changes in fair value. This data is also used to corroborate, when available, information received from approved pricing vendors and brokers. Various factors impact the frequency of monitoring this information (which may occur as often as daily). However, the Committee may determine that changes to inputs, assumptions and models are not required as a result of the monitoring procedures performed.
The following table is a summary of the inputs used to value the Fund’s investments at March 31, 2018:
| | Level 1
quoted prices
in active
markets for
identical
assets ($) | Level 2
other
significant
observable
inputs ($) | Level 3
significant
unobservable
inputs ($) | Investments
measured at
net asset
value ($) | Total ($) |
| Investments in Securities | | | | | |
| Alternative Strategies Funds | 200,397 | — | — | 4,002,581 | 4,202,978 |
| Exchange-Traded Funds | 593,319 | — | — | — | 593,319 |
| Money Market Funds | — | — | — | 214,110 | 214,110 |
| Total Investments in Securities | 793,716 | — | — | 4,216,691 | 5,010,407 |
See the Portfolio of Investments for all investment classifications not indicated in the table.
There were no transfers of financial assets between levels during the period.
The accompanying Notes to Financial Statements are an integral part of this statement.
| 10 | Columbia Adaptive Retirement Funds | Annual Report 2018 |
Portfolio of Investments
Columbia Adaptive Retirement 2030 Fund, March 31, 2018
(Percentages represent value of investments compared to net assets)
Investments in securities
| Alternative Strategies Funds 83.8% |
| | Shares | Value ($) |
| Columbia Commodity Strategy Fund, Institutional 3 Class(a) | 71,124 | 406,830 |
| Columbia Solutions Aggressive Portfolio(a) | 359,923 | 3,624,419 |
| Columbia Solutions Conservative Portfolio(a) | 443,047 | 4,452,620 |
Total Alternative Strategies Funds
(Cost $8,433,066) | 8,483,869 |
|
| Exchange-Traded Funds 12.0% |
| | |
| iShares JPMorgan USD Emerging Markets Bond ETF | 1,762 | 198,789 |
| iShares TIPS Bond ETF | 3,681 | 416,137 |
| iShares U.S. Real Estate ETF | 5,340 | 403,010 |
| Vanguard Mortgage-Backed Securities ETF | 3,874 | 199,898 |
Total Exchange-Traded Funds
(Cost $1,251,915) | 1,217,834 |
|
| Money Market Funds 4.1% |
| | Shares | Value ($) |
| Columbia Short-Term Cash Fund, 1.738%(a),(b) | 419,440 | 419,399 |
Total Money Market Funds
(Cost $419,430) | 419,399 |
Total Investments in Securities
(Cost: $10,104,411) | 10,121,102 |
| Other Assets & Liabilities, Net | | 8,125 |
| Net Assets | 10,129,227 |
Notes to Portfolio of Investments
| (a) | As defined in the Investment Company Act of 1940, an affiliated company is one in which the Fund owns 5% or more of the company’s outstanding voting securities, or a company which is under common ownership or control with the Fund. Holdings and transactions in these affiliated companies during the year ended March 31, 2018 are as follows: |
| Issuer | Beginning
shares | Shares
purchased | Shares
sold | Ending
shares | Capital gain
distributions —
affiliated
issuers ($) | Realized gain
(loss) —
affiliated
issuers ($) | Net change in
unrealized
appreciation
(depreciation) —
affiliated
issuers ($) | Dividends —
affiliated
issuers ($) | Value —
affiliated
issuers
at end of
period ($) |
| Columbia Commodity Strategy Fund, Institutional 3 Class |
| | — | 106,856 | (35,732) | 71,124 | — | (357) | 7,836 | 651 | 406,830 |
| Columbia Short-Term Cash Fund, 1.738% |
| | — | 10,446,436 | (10,026,996) | 419,440 | — | (1) | (32) | 2,622 | 419,399 |
| Columbia Solutions Aggressive Portfolio |
| | — | 398,176 | (38,253) | 359,923 | 15,540 | 12,697 | 24,185 | 15,444 | 3,624,419 |
| Columbia Solutions Conservative Portfolio |
| | — | 447,427 | (4,380) | 443,047 | 5,923 | (467) | 18,783 | 12,069 | 4,452,620 |
| Total | | | | | 21,463 | 11,872 | 50,772 | 30,786 | 8,903,268 |
| (b) | The rate shown is the seven-day current annualized yield at March 31, 2018. |
Fair value measurements
The Fund categorizes its fair value measurements according to a three-level hierarchy that maximizes the use of observable inputs and minimizes the use of unobservable inputs by prioritizing that the most observable input be used when available. Observable inputs are those that market participants would use in pricing an investment based on market data obtained from sources independent of the reporting entity. Unobservable inputs are those that reflect the Fund’s assumptions about the information market participants would use in pricing an investment. An investment’s level within the fair value hierarchy is based on the lowest level of any input that is deemed significant to the asset’s or liability’s fair value measurement. The input levels are not necessarily an indication of the risk or liquidity associated with investments at that level. For example, certain U.S. government securities are generally high quality and liquid, however, they are reflected as Level 2 because the inputs used to determine fair value may not always be quoted prices in an active market.
Fair value inputs are summarized in the three broad levels listed below:
| ■ | Level 1 — Valuations based on quoted prices for investments in active markets that the Fund has the ability to access at the measurement date. Valuation adjustments are not applied to Level 1 investments. |
The accompanying Notes to Financial Statements are an integral part of this statement.
Columbia Adaptive Retirement Funds | Annual Report 2018
| 11 |
Portfolio of Investments (continued)
Columbia Adaptive Retirement 2030 Fund, March 31, 2018
Fair value measurements (continued)
| ■ | Level 2 — Valuations based on other significant observable inputs (including quoted prices for similar securities, interest rates, prepayment speeds, credit risks, etc.). |
| ■ | Level 3 — Valuations based on significant unobservable inputs (including the Fund’s own assumptions and judgment in determining the fair value of investments). |
Inputs that are used in determining fair value of an investment may include price information, credit data, volatility statistics, and other factors. These inputs can be either observable or unobservable. The availability of observable inputs can vary between investments, and is affected by various factors such as the type of investment, and the volume and level of activity for that investment or similar investments in the marketplace. The inputs will be considered by the Investment Manager, along with any other relevant factors in the calculation of an investment’s fair value. The Fund uses prices and inputs that are current as of the measurement date, which may include periods of market dislocations. During these periods, the availability of prices and inputs may be reduced for many investments. This condition could cause an investment to be reclassified between the various levels within the hierarchy.
Certain investments that have been measured at fair value using the net asset value (NAV) per share (or its equivalent) are not categorized in the fair value hierarchy. The fair value amounts presented in the table are intended to reconcile the fair value hierarchy to the amounts presented in the Portfolio of Investments. The Columbia Solutions Portfolios serve as investment vehicles for the Columbia Adaptive Retirement Funds and each pursues consistent total returns by seeking to allocate risks across multiple asset classes. Investments in the Columbia Solutions Portfolios may be redeemed on a daily basis without restriction. The Columbia Short-Term Cash Fund seeks to provide shareholders with maximum current income consistent with liquidity and stability of principal. Columbia Short-Term Cash Fund prices its shares with a floating NAV and no longer seeks to maintain a stable NAV.
Investments falling into the Level 3 category are primarily supported by quoted prices from brokers and dealers participating in the market for those investments. However, these may be classified as Level 3 investments due to lack of market transparency and corroboration to support these quoted prices. Additionally, valuation models may be used as the pricing source for any remaining investments classified as Level 3. These models may rely on one or more significant unobservable inputs and/or significant assumptions by the Investment Manager. Inputs used in valuations may include, but are not limited to, financial statement analysis, capital account balances, discount rates and estimated cash flows, and comparable company data.
Under the direction of the Fund’s Board of Trustees (the Board), the Investment Manager’s Valuation Committee (the Committee) is responsible for overseeing the valuation procedures approved by the Board. The Committee consists of voting and non-voting members from various groups within the Investment Manager’s organization, including operations and accounting, trading and investments, compliance, risk management and legal.
The Committee meets at least monthly to review and approve valuation matters, which may include a description of specific valuation determinations, data regarding pricing information received from approved pricing vendors and brokers and the results of Board-approved valuation control policies and procedures (the Policies). The Policies address, among other things, instances when market quotations are or are not readily available, including recommendations of third party pricing vendors and a determination of appropriate pricing methodologies; events that require specific valuation determinations and assessment of fair value techniques; securities with a potential for stale pricing, including those that are illiquid, restricted, or in default; and the effectiveness of third party pricing vendors, including periodic reviews of vendors. The Committee meets more frequently, as needed, to discuss additional valuation matters, which may include the need to review back-testing results, review time-sensitive information or approve related valuation actions. The Committee reports to the Board, with members of the Committee meeting with the Board at each of its regularly scheduled meetings to discuss valuation matters and actions during the period, similar to those described earlier.
For investments categorized as Level 3, the Committee monitors information similar to that described above, which may include: (i) data specific to the issuer or comparable issuers, (ii) general market or specific sector news and (iii) quoted prices and specific or similar security transactions. The Committee considers this data and any changes from prior periods in order to assess the reasonableness of observable and unobservable inputs, any assumptions or internal models used to value those securities and changes in fair value. This data is also used to corroborate, when available, information received from approved pricing vendors and brokers. Various factors impact the frequency of monitoring this information (which may occur as often as daily). However, the Committee may determine that changes to inputs, assumptions and models are not required as a result of the monitoring procedures performed.
The following table is a summary of the inputs used to value the Fund’s investments at March 31, 2018:
| | Level 1
quoted prices
in active
markets for
identical
assets ($) | Level 2
other
significant
observable
inputs ($) | Level 3
significant
unobservable
inputs ($) | Investments
measured at
net asset
value ($) | Total ($) |
| Investments in Securities | | | | | |
| Alternative Strategies Funds | 406,830 | — | — | 8,077,039 | 8,483,869 |
| Exchange-Traded Funds | 1,217,834 | — | — | — | 1,217,834 |
| Money Market Funds | — | — | — | 419,399 | 419,399 |
| Total Investments in Securities | 1,624,664 | — | — | 8,496,438 | 10,121,102 |
See the Portfolio of Investments for all investment classifications not indicated in the table.
There were no transfers of financial assets between levels during the period.
The accompanying Notes to Financial Statements are an integral part of this statement.
| 12 | Columbia Adaptive Retirement Funds | Annual Report 2018 |
Portfolio of Investments
Columbia Adaptive Retirement 2040 Fund, March 31, 2018
(Percentages represent value of investments compared to net assets)
Investments in securities
| Alternative Strategies Funds 81.8% |
| | Shares | Value ($) |
| Columbia Commodity Strategy Fund, Institutional 3 Class(a) | 6,939 | 39,695 |
| Columbia Solutions Aggressive Portfolio(a) | 63,588 | 640,330 |
| Columbia Solutions Conservative Portfolio(a) | 16,467 | 165,496 |
Total Alternative Strategies Funds
(Cost $839,971) | 845,521 |
|
| Exchange-Traded Funds 11.9% |
| | |
| iShares JPMorgan USD Emerging Markets Bond ETF | 180 | 20,308 |
| iShares TIPS Bond ETF | 368 | 41,602 |
| iShares U.S. Real Estate ETF | 534 | 40,301 |
| Vanguard Mortgage-Backed Securities ETF | 401 | 20,692 |
Total Exchange-Traded Funds
(Cost $126,345) | 122,903 |
|
| Money Market Funds 4.2% |
| | Shares | Value ($) |
| Columbia Short-Term Cash Fund, 1.738%(a),(b) | 44,129 | 44,124 |
Total Money Market Funds
(Cost $44,128) | 44,124 |
Total Investments in Securities
(Cost: $1,010,444) | 1,012,548 |
| Other Assets & Liabilities, Net | | 21,407 |
| Net Assets | 1,033,955 |
Notes to Portfolio of Investments
| (a) | As defined in the Investment Company Act of 1940, an affiliated company is one in which the Fund owns 5% or more of the company’s outstanding voting securities, or a company which is under common ownership or control with the Fund. Holdings and transactions in these affiliated companies during the year ended March 31, 2018 are as follows: |
| Issuer | Beginning
shares | Shares
purchased | Shares
sold | Ending
shares | Capital gain
distributions —
affiliated
issuers ($) | Realized gain
(loss) —
affiliated
issuers ($) | Net change in
unrealized
appreciation
(depreciation) —
affiliated
issuers ($) | Dividends —
affiliated
issuers ($) | Value —
affiliated
issuers
at end of
period ($) |
| Columbia Commodity Strategy Fund, Institutional 3 Class |
| | — | 10,707 | (3,768) | 6,939 | — | (38) | 765 | 63 | 39,695 |
| Columbia Short-Term Cash Fund, 1.738% |
| | — | 1,084,333 | (1,040,204) | 44,129 | — | (1) | (4) | 283 | 44,124 |
| Columbia Solutions Aggressive Portfolio |
| | — | 67,814 | (4,226) | 63,588 | 2,667 | 1,451 | 4,231 | 2,651 | 640,330 |
| Columbia Solutions Conservative Portfolio |
| | — | 16,564 | (97) | 16,467 | 214 | (14) | 554 | 436 | 165,496 |
| Total | | | | | 2,881 | 1,398 | 5,546 | 3,433 | 889,645 |
| (b) | The rate shown is the seven-day current annualized yield at March 31, 2018. |
Fair value measurements
The Fund categorizes its fair value measurements according to a three-level hierarchy that maximizes the use of observable inputs and minimizes the use of unobservable inputs by prioritizing that the most observable input be used when available. Observable inputs are those that market participants would use in pricing an investment based on market data obtained from sources independent of the reporting entity. Unobservable inputs are those that reflect the Fund’s assumptions about the information market participants would use in pricing an investment. An investment’s level within the fair value hierarchy is based on the lowest level of any input that is deemed significant to the asset’s or liability’s fair value measurement. The input levels are not necessarily an indication of the risk or liquidity associated with investments at that level. For example, certain U.S. government securities are generally high quality and liquid, however, they are reflected as Level 2 because the inputs used to determine fair value may not always be quoted prices in an active market.
Fair value inputs are summarized in the three broad levels listed below:
| ■ | Level 1 — Valuations based on quoted prices for investments in active markets that the Fund has the ability to access at the measurement date. Valuation adjustments are not applied to Level 1 investments. |
The accompanying Notes to Financial Statements are an integral part of this statement.
Columbia Adaptive Retirement Funds | Annual Report 2018
| 13 |
Portfolio of Investments (continued)
Columbia Adaptive Retirement 2040 Fund, March 31, 2018
Fair value measurements (continued)
| ■ | Level 2 — Valuations based on other significant observable inputs (including quoted prices for similar securities, interest rates, prepayment speeds, credit risks, etc.). |
| ■ | Level 3 — Valuations based on significant unobservable inputs (including the Fund’s own assumptions and judgment in determining the fair value of investments). |
Inputs that are used in determining fair value of an investment may include price information, credit data, volatility statistics, and other factors. These inputs can be either observable or unobservable. The availability of observable inputs can vary between investments, and is affected by various factors such as the type of investment, and the volume and level of activity for that investment or similar investments in the marketplace. The inputs will be considered by the Investment Manager, along with any other relevant factors in the calculation of an investment’s fair value. The Fund uses prices and inputs that are current as of the measurement date, which may include periods of market dislocations. During these periods, the availability of prices and inputs may be reduced for many investments. This condition could cause an investment to be reclassified between the various levels within the hierarchy.
Certain investments that have been measured at fair value using the net asset value (NAV) per share (or its equivalent) are not categorized in the fair value hierarchy. The fair value amounts presented in the table are intended to reconcile the fair value hierarchy to the amounts presented in the Portfolio of Investments. The Columbia Solutions Portfolios serve as investment vehicles for the Columbia Adaptive Retirement Funds and each pursues consistent total returns by seeking to allocate risks across multiple asset classes. Investments in the Columbia Solutions Portfolios may be redeemed on a daily basis without restriction. The Columbia Short-Term Cash Fund seeks to provide shareholders with maximum current income consistent with liquidity and stability of principal. Columbia Short-Term Cash Fund prices its shares with a floating NAV and no longer seeks to maintain a stable NAV.
Investments falling into the Level 3 category are primarily supported by quoted prices from brokers and dealers participating in the market for those investments. However, these may be classified as Level 3 investments due to lack of market transparency and corroboration to support these quoted prices. Additionally, valuation models may be used as the pricing source for any remaining investments classified as Level 3. These models may rely on one or more significant unobservable inputs and/or significant assumptions by the Investment Manager. Inputs used in valuations may include, but are not limited to, financial statement analysis, capital account balances, discount rates and estimated cash flows, and comparable company data.
Under the direction of the Fund’s Board of Trustees (the Board), the Investment Manager’s Valuation Committee (the Committee) is responsible for overseeing the valuation procedures approved by the Board. The Committee consists of voting and non-voting members from various groups within the Investment Manager’s organization, including operations and accounting, trading and investments, compliance, risk management and legal.
The Committee meets at least monthly to review and approve valuation matters, which may include a description of specific valuation determinations, data regarding pricing information received from approved pricing vendors and brokers and the results of Board-approved valuation control policies and procedures (the Policies). The Policies address, among other things, instances when market quotations are or are not readily available, including recommendations of third party pricing vendors and a determination of appropriate pricing methodologies; events that require specific valuation determinations and assessment of fair value techniques; securities with a potential for stale pricing, including those that are illiquid, restricted, or in default; and the effectiveness of third party pricing vendors, including periodic reviews of vendors. The Committee meets more frequently, as needed, to discuss additional valuation matters, which may include the need to review back-testing results, review time-sensitive information or approve related valuation actions. The Committee reports to the Board, with members of the Committee meeting with the Board at each of its regularly scheduled meetings to discuss valuation matters and actions during the period, similar to those described earlier.
For investments categorized as Level 3, the Committee monitors information similar to that described above, which may include: (i) data specific to the issuer or comparable issuers, (ii) general market or specific sector news and (iii) quoted prices and specific or similar security transactions. The Committee considers this data and any changes from prior periods in order to assess the reasonableness of observable and unobservable inputs, any assumptions or internal models used to value those securities and changes in fair value. This data is also used to corroborate, when available, information received from approved pricing vendors and brokers. Various factors impact the frequency of monitoring this information (which may occur as often as daily). However, the Committee may determine that changes to inputs, assumptions and models are not required as a result of the monitoring procedures performed.
The following table is a summary of the inputs used to value the Fund’s investments at March 31, 2018:
| | Level 1
quoted prices
in active
markets for
identical
assets ($) | Level 2
other
significant
observable
inputs ($) | Level 3
significant
unobservable
inputs ($) | Investments
measured at
net asset
value ($) | Total ($) |
| Investments in Securities | | | | | |
| Alternative Strategies Funds | 39,695 | — | — | 805,826 | 845,521 |
| Exchange-Traded Funds | 122,903 | — | — | — | 122,903 |
| Money Market Funds | — | — | — | 44,124 | 44,124 |
| Total Investments in Securities | 162,598 | — | — | 849,950 | 1,012,548 |
See the Portfolio of Investments for all investment classifications not indicated in the table.
There were no transfers of financial assets between levels during the period.
The accompanying Notes to Financial Statements are an integral part of this statement.
| 14 | Columbia Adaptive Retirement Funds | Annual Report 2018 |
Portfolio of Investments
Columbia Adaptive Retirement 2050 Fund, March 31, 2018
(Percentages represent value of investments compared to net assets)
Investments in securities
| Alternative Strategies Funds 82.8% |
| | Shares | Value ($) |
| Columbia Commodity Strategy Fund, Institutional 3 Class(a) | 6,839 | 39,121 |
| Columbia Solutions Aggressive Portfolio(a) | 78,810 | 793,611 |
Total Alternative Strategies Funds
(Cost $826,680) | 832,732 |
|
| Exchange-Traded Funds 12.1% |
| | |
| iShares JPMorgan USD Emerging Markets Bond ETF | 179 | 20,195 |
| iShares TIPS Bond ETF | 366 | 41,376 |
| iShares U.S. Real Estate ETF | 531 | 40,075 |
| Vanguard Mortgage-Backed Securities ETF | 399 | 20,588 |
Total Exchange-Traded Funds
(Cost $125,647) | 122,234 |
|
| Money Market Funds 4.3% |
| | Shares | Value ($) |
| Columbia Short-Term Cash Fund, 1.738%(a),(b) | 43,120 | 43,116 |
Total Money Market Funds
(Cost $43,120) | 43,116 |
Total Investments in Securities
(Cost: $995,447) | 998,082 |
| Other Assets & Liabilities, Net | | 7,815 |
| Net Assets | 1,005,897 |
Notes to Portfolio of Investments
| (a) | As defined in the Investment Company Act of 1940, an affiliated company is one in which the Fund owns 5% or more of the company’s outstanding voting securities, or a company which is under common ownership or control with the Fund. Holdings and transactions in these affiliated companies during the year ended March 31, 2018 are as follows: |
| Issuer | Beginning
shares | Shares
purchased | Shares
sold | Ending
shares | Capital gain
distributions —
affiliated
issuers ($) | Realized gain
(loss) —
affiliated
issuers ($) | Net change in
unrealized
appreciation
(depreciation) —
affiliated
issuers ($) | Dividends —
affiliated
issuers ($) | Value —
affiliated
issuers
at end of
period ($) |
| Columbia Commodity Strategy Fund, Institutional 3 Class |
| | — | 10,707 | (3,868) | 6,839 | — | (39) | 754 | 63 | 39,121 |
| Columbia Short-Term Cash Fund, 1.738% |
| | — | 1,085,263 | (1,042,143) | 43,120 | — | (1) | (4) | 279 | 43,116 |
| Columbia Solutions Aggressive Portfolio |
| | — | 81,922 | (3,112) | 78,810 | 3,294 | 1,033 | 5,298 | 3,273 | 793,611 |
| Total | | | | | 3,294 | 993 | 6,048 | 3,615 | 875,848 |
| (b) | The rate shown is the seven-day current annualized yield at March 31, 2018. |
Fair value measurements
The Fund categorizes its fair value measurements according to a three-level hierarchy that maximizes the use of observable inputs and minimizes the use of unobservable inputs by prioritizing that the most observable input be used when available. Observable inputs are those that market participants would use in pricing an investment based on market data obtained from sources independent of the reporting entity. Unobservable inputs are those that reflect the Fund’s assumptions about the information market participants would use in pricing an investment. An investment’s level within the fair value hierarchy is based on the lowest level of any input that is deemed significant to the asset’s or liability’s fair value measurement. The input levels are not necessarily an indication of the risk or liquidity associated with investments at that level. For example, certain U.S. government securities are generally high quality and liquid, however, they are reflected as Level 2 because the inputs used to determine fair value may not always be quoted prices in an active market.
Fair value inputs are summarized in the three broad levels listed below:
| ■ | Level 1 — Valuations based on quoted prices for investments in active markets that the Fund has the ability to access at the measurement date. Valuation adjustments are not applied to Level 1 investments. |
| ■ | Level 2 — Valuations based on other significant observable inputs (including quoted prices for similar securities, interest rates, prepayment speeds, credit risks, etc.). |
| ■ | Level 3 — Valuations based on significant unobservable inputs (including the Fund’s own assumptions and judgment in determining the fair value of investments). |
The accompanying Notes to Financial Statements are an integral part of this statement.
Columbia Adaptive Retirement Funds | Annual Report 2018
| 15 |
Portfolio of Investments (continued)
Columbia Adaptive Retirement 2050 Fund, March 31, 2018
Fair value measurements (continued)
Inputs that are used in determining fair value of an investment may include price information, credit data, volatility statistics, and other factors. These inputs can be either observable or unobservable. The availability of observable inputs can vary between investments, and is affected by various factors such as the type of investment, and the volume and level of activity for that investment or similar investments in the marketplace. The inputs will be considered by the Investment Manager, along with any other relevant factors in the calculation of an investment’s fair value. The Fund uses prices and inputs that are current as of the measurement date, which may include periods of market dislocations. During these periods, the availability of prices and inputs may be reduced for many investments. This condition could cause an investment to be reclassified between the various levels within the hierarchy.
Certain investments that have been measured at fair value using the net asset value (NAV) per share (or its equivalent) are not categorized in the fair value hierarchy. The fair value amounts presented in the table are intended to reconcile the fair value hierarchy to the amounts presented in the Portfolio of Investments. The Columbia Solutions Portfolios serve as investment vehicles for the Columbia Adaptive Retirement Funds and each pursues consistent total returns by seeking to allocate risks across multiple asset classes. Investments in the Columbia Solutions Portfolios may be redeemed on a daily basis without restriction. The Columbia Short-Term Cash Fund seeks to provide shareholders with maximum current income consistent with liquidity and stability of principal. Columbia Short-Term Cash Fund prices its shares with a floating NAV and no longer seeks to maintain a stable NAV.
Investments falling into the Level 3 category are primarily supported by quoted prices from brokers and dealers participating in the market for those investments. However, these may be classified as Level 3 investments due to lack of market transparency and corroboration to support these quoted prices. Additionally, valuation models may be used as the pricing source for any remaining investments classified as Level 3. These models may rely on one or more significant unobservable inputs and/or significant assumptions by the Investment Manager. Inputs used in valuations may include, but are not limited to, financial statement analysis, capital account balances, discount rates and estimated cash flows, and comparable company data.
Under the direction of the Fund’s Board of Trustees (the Board), the Investment Manager’s Valuation Committee (the Committee) is responsible for overseeing the valuation procedures approved by the Board. The Committee consists of voting and non-voting members from various groups within the Investment Manager’s organization, including operations and accounting, trading and investments, compliance, risk management and legal.
The Committee meets at least monthly to review and approve valuation matters, which may include a description of specific valuation determinations, data regarding pricing information received from approved pricing vendors and brokers and the results of Board-approved valuation control policies and procedures (the Policies). The Policies address, among other things, instances when market quotations are or are not readily available, including recommendations of third party pricing vendors and a determination of appropriate pricing methodologies; events that require specific valuation determinations and assessment of fair value techniques; securities with a potential for stale pricing, including those that are illiquid, restricted, or in default; and the effectiveness of third party pricing vendors, including periodic reviews of vendors. The Committee meets more frequently, as needed, to discuss additional valuation matters, which may include the need to review back-testing results, review time-sensitive information or approve related valuation actions. The Committee reports to the Board, with members of the Committee meeting with the Board at each of its regularly scheduled meetings to discuss valuation matters and actions during the period, similar to those described earlier.
For investments categorized as Level 3, the Committee monitors information similar to that described above, which may include: (i) data specific to the issuer or comparable issuers, (ii) general market or specific sector news and (iii) quoted prices and specific or similar security transactions. The Committee considers this data and any changes from prior periods in order to assess the reasonableness of observable and unobservable inputs, any assumptions or internal models used to value those securities and changes in fair value. This data is also used to corroborate, when available, information received from approved pricing vendors and brokers. Various factors impact the frequency of monitoring this information (which may occur as often as daily). However, the Committee may determine that changes to inputs, assumptions and models are not required as a result of the monitoring procedures performed.
The following table is a summary of the inputs used to value the Fund’s investments at March 31, 2018:
| | Level 1
quoted prices
in active
markets for
identical
assets ($) | Level 2
other
significant
observable
inputs ($) | Level 3
significant
unobservable
inputs ($) | Investments
measured at
net asset
value ($) | Total ($) |
| Investments in Securities | | | | | |
| Alternative Strategies Funds | 39,121 | — | — | 793,611 | 832,732 |
| Exchange-Traded Funds | 122,234 | — | — | — | 122,234 |
| Money Market Funds | — | — | — | 43,116 | 43,116 |
| Total Investments in Securities | 161,355 | — | — | 836,727 | 998,082 |
See the Portfolio of Investments for all investment classifications not indicated in the table.
There were no transfers of financial assets between levels during the period.
The accompanying Notes to Financial Statements are an integral part of this statement.
| 16 | Columbia Adaptive Retirement Funds | Annual Report 2018 |
Portfolio of Investments
Columbia Adaptive Retirement 2060 Fund, March 31, 2018
(Percentages represent value of investments compared to net assets)
Investments in securities
| Alternative Strategies Funds 82.8% |
| | Shares | Value ($) |
| Columbia Commodity Strategy Fund, Institutional 3 Class(a) | 6,875 | 39,326 |
| Columbia Solutions Aggressive Portfolio(a) | 79,180 | 797,348 |
Total Alternative Strategies Funds
(Cost $830,592) | 836,674 |
|
| Exchange-Traded Funds 12.1% |
| | |
| iShares JPMorgan USD Emerging Markets Bond ETF | 180 | 20,308 |
| iShares TIPS Bond ETF | 368 | 41,602 |
| iShares U.S. Real Estate ETF | 533 | 40,225 |
| Vanguard Mortgage-Backed Securities ETF | 401 | 20,692 |
Total Exchange-Traded Funds
(Cost $126,255) | 122,827 |
|
| Money Market Funds 4.3% |
| | Shares | Value ($) |
| Columbia Short-Term Cash Fund, 1.738%(a),(b) | 43,294 | 43,289 |
Total Money Market Funds
(Cost $43,293) | 43,289 |
Total Investments in Securities
(Cost: $1,000,140) | 1,002,790 |
| Other Assets & Liabilities, Net | | 7,811 |
| Net Assets | 1,010,601 |
Notes to Portfolio of Investments
| (a) | As defined in the Investment Company Act of 1940, an affiliated company is one in which the Fund owns 5% or more of the company’s outstanding voting securities, or a company which is under common ownership or control with the Fund. Holdings and transactions in these affiliated companies during the year ended March 31, 2018 are as follows: |
| Issuer | Beginning
shares | Shares
purchased | Shares
sold | Ending
shares | Capital gain
distributions —
affiliated
issuers ($) | Realized gain
(loss) —
affiliated
issuers ($) | Net change in
unrealized
appreciation
(depreciation) —
affiliated
issuers ($) | Dividends —
affiliated
issuers ($) | Value —
affiliated
issuers
at end of
period ($) |
| Columbia Commodity Strategy Fund, Institutional 3 Class |
| | — | 10,707 | (3,832) | 6,875 | — | (38) | 758 | 63 | 39,326 |
| Columbia Short-Term Cash Fund, 1.738% |
| | — | 1,087,141 | (1,043,847) | 43,294 | — | (1) | (4) | 280 | 43,289 |
| Columbia Solutions Aggressive Portfolio |
| | — | 81,926 | (2,746) | 79,180 | 3,311 | 954 | 5,324 | 3,290 | 797,348 |
| Total | | | | | 3,311 | 915 | 6,078 | 3,633 | 879,963 |
| (b) | The rate shown is the seven-day current annualized yield at March 31, 2018. |
Fair value measurements
The Fund categorizes its fair value measurements according to a three-level hierarchy that maximizes the use of observable inputs and minimizes the use of unobservable inputs by prioritizing that the most observable input be used when available. Observable inputs are those that market participants would use in pricing an investment based on market data obtained from sources independent of the reporting entity. Unobservable inputs are those that reflect the Fund’s assumptions about the information market participants would use in pricing an investment. An investment’s level within the fair value hierarchy is based on the lowest level of any input that is deemed significant to the asset’s or liability’s fair value measurement. The input levels are not necessarily an indication of the risk or liquidity associated with investments at that level. For example, certain U.S. government securities are generally high quality and liquid, however, they are reflected as Level 2 because the inputs used to determine fair value may not always be quoted prices in an active market.
Fair value inputs are summarized in the three broad levels listed below:
| ■ | Level 1 — Valuations based on quoted prices for investments in active markets that the Fund has the ability to access at the measurement date. Valuation adjustments are not applied to Level 1 investments. |
| ■ | Level 2 — Valuations based on other significant observable inputs (including quoted prices for similar securities, interest rates, prepayment speeds, credit risks, etc.). |
| ■ | Level 3 — Valuations based on significant unobservable inputs (including the Fund’s own assumptions and judgment in determining the fair value of investments). |
The accompanying Notes to Financial Statements are an integral part of this statement.
Columbia Adaptive Retirement Funds | Annual Report 2018
| 17 |
Portfolio of Investments (continued)
Columbia Adaptive Retirement 2060 Fund, March 31, 2018
Fair value measurements (continued)
Inputs that are used in determining fair value of an investment may include price information, credit data, volatility statistics, and other factors. These inputs can be either observable or unobservable. The availability of observable inputs can vary between investments, and is affected by various factors such as the type of investment, and the volume and level of activity for that investment or similar investments in the marketplace. The inputs will be considered by the Investment Manager, along with any other relevant factors in the calculation of an investment’s fair value. The Fund uses prices and inputs that are current as of the measurement date, which may include periods of market dislocations. During these periods, the availability of prices and inputs may be reduced for many investments. This condition could cause an investment to be reclassified between the various levels within the hierarchy.
Certain investments that have been measured at fair value using the net asset value (NAV) per share (or its equivalent) are not categorized in the fair value hierarchy. The fair value amounts presented in the table are intended to reconcile the fair value hierarchy to the amounts presented in the Portfolio of Investments. The Columbia Solutions Portfolios serve as investment vehicles for the Columbia Adaptive Retirement Funds and each pursues consistent total returns by seeking to allocate risks across multiple asset classes. Investments in the Columbia Solutions Portfolios may be redeemed on a daily basis without restriction. The Columbia Short-Term Cash Fund seeks to provide shareholders with maximum current income consistent with liquidity and stability of principal. Columbia Short-Term Cash Fund prices its shares with a floating NAV and no longer seeks to maintain a stable NAV.
Investments falling into the Level 3 category are primarily supported by quoted prices from brokers and dealers participating in the market for those investments. However, these may be classified as Level 3 investments due to lack of market transparency and corroboration to support these quoted prices. Additionally, valuation models may be used as the pricing source for any remaining investments classified as Level 3. These models may rely on one or more significant unobservable inputs and/or significant assumptions by the Investment Manager. Inputs used in valuations may include, but are not limited to, financial statement analysis, capital account balances, discount rates and estimated cash flows, and comparable company data.
Under the direction of the Fund’s Board of Trustees (the Board), the Investment Manager’s Valuation Committee (the Committee) is responsible for overseeing the valuation procedures approved by the Board. The Committee consists of voting and non-voting members from various groups within the Investment Manager’s organization, including operations and accounting, trading and investments, compliance, risk management and legal.
The Committee meets at least monthly to review and approve valuation matters, which may include a description of specific valuation determinations, data regarding pricing information received from approved pricing vendors and brokers and the results of Board-approved valuation control policies and procedures (the Policies). The Policies address, among other things, instances when market quotations are or are not readily available, including recommendations of third party pricing vendors and a determination of appropriate pricing methodologies; events that require specific valuation determinations and assessment of fair value techniques; securities with a potential for stale pricing, including those that are illiquid, restricted, or in default; and the effectiveness of third party pricing vendors, including periodic reviews of vendors. The Committee meets more frequently, as needed, to discuss additional valuation matters, which may include the need to review back-testing results, review time-sensitive information or approve related valuation actions. The Committee reports to the Board, with members of the Committee meeting with the Board at each of its regularly scheduled meetings to discuss valuation matters and actions during the period, similar to those described earlier.
For investments categorized as Level 3, the Committee monitors information similar to that described above, which may include: (i) data specific to the issuer or comparable issuers, (ii) general market or specific sector news and (iii) quoted prices and specific or similar security transactions. The Committee considers this data and any changes from prior periods in order to assess the reasonableness of observable and unobservable inputs, any assumptions or internal models used to value those securities and changes in fair value. This data is also used to corroborate, when available, information received from approved pricing vendors and brokers. Various factors impact the frequency of monitoring this information (which may occur as often as daily). However, the Committee may determine that changes to inputs, assumptions and models are not required as a result of the monitoring procedures performed.
The following table is a summary of the inputs used to value the Fund’s investments at March 31, 2018:
| | Level 1
quoted prices
in active
markets for
identical
assets ($) | Level 2
other
significant
observable
inputs ($) | Level 3
significant
unobservable
inputs ($) | Investments
measured at
net asset
value ($) | Total ($) |
| Investments in Securities | | | | | |
| Alternative Strategies Funds | 39,326 | — | — | 797,348 | 836,674 |
| Exchange-Traded Funds | 122,827 | — | — | — | 122,827 |
| Money Market Funds | — | — | — | 43,289 | 43,289 |
| Total Investments in Securities | 162,153 | — | — | 840,637 | 1,002,790 |
See the Portfolio of Investments for all investment classifications not indicated in the table.
There were no transfers of financial assets between levels during the period.
The accompanying Notes to Financial Statements are an integral part of this statement.
| 18 | Columbia Adaptive Retirement Funds | Annual Report 2018 |
Statement of Assets and Liabilities
March 31, 2018
| | Columbia
Adaptive
Retirement
2020 Fund | Columbia
Adaptive
Retirement
2030 Fund | Columbia
Adaptive
Retirement
2040 Fund |
| Assets | | | |
| Investments in securities, at value | | | |
| Unaffiliated issuers (cost $610,044, $1,251,915, $126,345, respectively) | $593,319 | $1,217,834 | $122,903 |
| Affiliated issuers (cost $4,393,199, $8,852,496, $884,099, respectively) | 4,417,088 | 8,903,268 | 889,645 |
| Receivable for: | | | |
| Capital shares sold | — | — | 13,600 |
| Dividends | 278 | 543 | 57 |
| Expense reimbursement due from Investment Manager | 154 | 161 | 149 |
| Trustees’ deferred compensation plan | 3,185 | 3,193 | 3,179 |
| Other assets | 21,674 | 21,598 | 21,597 |
| Total assets | 5,035,698 | 10,146,597 | 1,051,130 |
| Liabilities | | | |
| Payable for: | | | |
| Management services fees | 62 | 125 | 13 |
| Transfer agent fees | 1 | 23 | 4 |
| Compensation of board members | 360 | 360 | 360 |
| Compensation of chief compliance officer | — | 1 | — |
| Audit fees | 12,052 | 12,052 | 12,052 |
| Other expenses | 1,584 | 1,616 | 1,567 |
| Trustees’ deferred compensation plan | 3,185 | 3,193 | 3,179 |
| Total liabilities | 17,244 | 17,370 | 17,175 |
| Net assets applicable to outstanding capital stock | $5,018,454 | $10,129,227 | $1,033,955 |
| Represented by | | | |
| Paid in capital | 4,999,674 | 10,082,003 | 1,028,594 |
| Excess of distributions over net investment income | (254) | (256) | (253) |
| Accumulated net realized gain | 11,870 | 30,789 | 3,510 |
| Unrealized appreciation (depreciation) on: | | | |
| Investments - unaffiliated issuers | (16,725) | (34,081) | (3,442) |
| Investments - affiliated issuers | 23,889 | 50,772 | 5,546 |
| Total - representing net assets applicable to outstanding capital stock | $5,018,454 | $10,129,227 | $1,033,955 |
| Advisor Class | | | |
| Net assets | $2,509,227 | $5,115,417 | $531,306 |
| Shares outstanding | 250,000 | 509,119 | 52,851 |
| Net asset value per share | $10.04 | $10.05 | $10.05 |
| Institutional 3 Class | | | |
| Net assets | $2,509,227 | $5,013,810 | $502,649 |
| Shares outstanding | 250,000 | 499,000 | 50,000 |
| Net asset value per share | $10.04 | $10.05 | $10.05 |
The accompanying Notes to Financial Statements are an integral part of this statement.
Columbia Adaptive Retirement Funds | Annual Report 2018
| 19 |
Statement of Assets and Liabilities (continued)
March 31, 2018
| | Columbia
Adaptive
Retirement
2050 Fund | Columbia
Adaptive
Retirement
2060 Fund |
| Assets | | |
| Investments in securities, at value | | |
| Unaffiliated issuers (cost $125,647, $126,255, respectively) | $122,234 | $122,827 |
| Affiliated issuers (cost $869,800, $873,885, respectively) | 875,848 | 879,963 |
| Receivable for: | | |
| Dividends | 56 | 56 |
| Expense reimbursement due from Investment Manager | 149 | 149 |
| Trustees’ deferred compensation plan | 3,179 | 3,179 |
| Other assets | 21,598 | 21,598 |
| Total assets | 1,023,064 | 1,027,772 |
| Liabilities | | |
| Payable for: | | |
| Management services fees | 13 | 13 |
| Transfer agent fees | 1 | 2 |
| Compensation of board members | 360 | 360 |
| Audit fees | 12,052 | 12,052 |
| Other expenses | 1,562 | 1,565 |
| Trustees’ deferred compensation plan | 3,179 | 3,179 |
| Total liabilities | 17,167 | 17,171 |
| Net assets applicable to outstanding capital stock | $1,005,897 | $1,010,601 |
| Represented by | | |
| Paid in capital | 999,926 | 1,004,951 |
| Excess of distributions over net investment income | (253) | (253) |
| Accumulated net realized gain | 3,589 | 3,253 |
| Unrealized appreciation (depreciation) on: | | |
| Investments - unaffiliated issuers | (3,413) | (3,428) |
| Investments - affiliated issuers | 6,048 | 6,078 |
| Total - representing net assets applicable to outstanding capital stock | $1,005,897 | $1,010,601 |
| Advisor Class | | |
| Net assets | $502,948 | $507,805 |
| Shares outstanding | 50,000 | 50,499 |
| Net asset value per share | $10.06 | $10.06 |
| Institutional 3 Class | | |
| Net assets | $502,949 | $502,796 |
| Shares outstanding | 50,000 | 50,000 |
| Net asset value per share | $10.06 | $10.06 |
The accompanying Notes to Financial Statements are an integral part of this statement.
| 20 | Columbia Adaptive Retirement Funds | Annual Report 2018 |
Statement of Operations
For the period from October 24, 2017 (commencement of operations) through March 31, 2018
| | Columbia
Adaptive
Retirement
2020 Fund | Columbia
Adaptive
Retirement
2030 Fund | Columbia
Adaptive
Retirement
2040 Fund |
| Net investment income | | | |
| Income: | | | |
| Dividends — unaffiliated issuers | $7,843 | $15,911 | $1,576 |
| Dividends — affiliated issuers | 13,537 | 30,786 | 3,433 |
| Total income | 21,380 | 46,697 | 5,009 |
| Expenses: | | | |
| Management services fees | 9,712 | 19,631 | 1,987 |
| Transfer agent fees | | | |
| Advisor Class | 26 | 74 | 27 |
| Institutional 3 Class | 26 | 29 | 20 |
| Compensation of board members | 4,157 | 4,180 | 4,140 |
| Custodian fees | 515 | 524 | 521 |
| Printing and postage fees | 880 | 880 | 880 |
| Registration fees | 4,268 | 4,268 | 4,268 |
| Audit fees | 12,052 | 12,052 | 12,052 |
| Legal fees | 47 | 95 | 10 |
| Offering costs | 21,088 | 21,014 | 21,014 |
| Compensation of chief compliance officer | 1 | 1 | — |
| Other | 3,167 | 3,188 | 3,151 |
| Total expenses | 55,939 | 65,936 | 48,070 |
| Fees waived or expenses reimbursed by Investment Manager and its affiliates | (47,148) | (48,214) | (46,232) |
| Total net expenses | 8,791 | 17,722 | 1,838 |
| Net investment income | 12,589 | 28,975 | 3,171 |
| Realized and unrealized gain (loss) — net | | | |
| Net realized gain (loss) on: | | | |
| Investments — unaffiliated issuers | 2,408 | 4,653 | 491 |
| Investments — affiliated issuers | 4,568 | 11,872 | 1,398 |
| Capital gain distributions from underlying affiliated funds | 7,370 | 21,463 | 2,881 |
| Net realized gain | 14,346 | 37,988 | 4,770 |
| Net change in unrealized appreciation (depreciation) on: | | | |
| Investments — unaffiliated issuers | (16,725) | (34,081) | (3,442) |
| Investments — affiliated issuers | 23,889 | 50,772 | 5,546 |
| Net change in unrealized appreciation (depreciation) | 7,164 | 16,691 | 2,104 |
| Net realized and unrealized gain | 21,510 | 54,679 | 6,874 |
| Net increase in net assets resulting from operations | $34,099 | $83,654 | $10,045 |
The accompanying Notes to Financial Statements are an integral part of this statement.
Columbia Adaptive Retirement Funds | Annual Report 2018
| 21 |
Statement of Operations (continued)
For the period from October 24, 2017 (commencement of operations) through March 31, 2018
| | Columbia
Adaptive
Retirement
2050 Fund | Columbia
Adaptive
Retirement
2060 Fund |
| Net investment income | | |
| Income: | | |
| Dividends — unaffiliated issuers | $1,561 | $1,566 |
| Dividends — affiliated issuers | 3,615 | 3,633 |
| Total income | 5,176 | 5,199 |
| Expenses: | | |
| Management services fees | 1,970 | 1,978 |
| Transfer agent fees | | |
| Advisor Class | 20 | 24 |
| Institutional 3 Class | 20 | 20 |
| Compensation of board members | 4,140 | 4,140 |
| Custodian fees | 513 | 517 |
| Printing and postage fees | 880 | 880 |
| Registration fees | 4,268 | 4,268 |
| Audit fees | 12,052 | 12,052 |
| Legal fees | 9 | 9 |
| Offering costs | 21,014 | 21,014 |
| Other | 3,152 | 3,151 |
| Total expenses | 48,038 | 48,053 |
| Fees waived or expenses reimbursed by Investment Manager and its affiliates | (46,222) | (46,227) |
| Total net expenses | 1,816 | 1,826 |
| Net investment income | 3,360 | 3,373 |
| Realized and unrealized gain (loss) — net | | |
| Net realized gain (loss) on: | | |
| Investments — unaffiliated issuers | 507 | 500 |
| Investments — affiliated issuers | 993 | 915 |
| Capital gain distributions from underlying affiliated funds | 3,294 | 3,311 |
| Net realized gain | 4,794 | 4,726 |
| Net change in unrealized appreciation (depreciation) on: | | |
| Investments — unaffiliated issuers | (3,413) | (3,428) |
| Investments — affiliated issuers | 6,048 | 6,078 |
| Net change in unrealized appreciation (depreciation) | 2,635 | 2,650 |
| Net realized and unrealized gain | 7,429 | 7,376 |
| Net increase in net assets resulting from operations | $10,789 | $10,749 |
The accompanying Notes to Financial Statements are an integral part of this statement.
| 22 | Columbia Adaptive Retirement Funds | Annual Report 2018 |
Statement of Changes in Net Assets
| | Columbia Adaptive Retirement
2020 Fund | Columbia Adaptive Retirement
2030 Fund |
| | Year Ended
March 31, 2018 (a) | Year Ended
March 31, 2018 (a) |
| Operations | | |
| Net investment income | $12,589 | $28,975 |
| Net realized gain | 14,346 | 37,988 |
| Net change in unrealized appreciation (depreciation) | 7,164 | 16,691 |
| Net increase in net assets resulting from operations | 34,099 | 83,654 |
| Distributions to shareholders | | |
| Net investment income | | |
| Advisor Class | (7,822) | (18,711) |
| Institutional 3 Class | (7,823) | (18,343) |
| Total distributions to shareholders | (15,645) | (37,054) |
| Increase in net assets from capital stock activity | — | 102,627 |
| Total increase in net assets | 18,454 | 149,227 |
| Net assets at beginning of period | 5,000,000 | 9,980,000 |
| Net assets at end of period | $5,018,454 | $10,129,227 |
| Excess of distributions over net investment income | $(254) | $(256) |
| (a) | Based on operations from October 24, 2017 (fund commencement of operations) through the stated period end. |
The accompanying Notes to Financial Statements are an integral part of this statement.
Columbia Adaptive Retirement Funds | Annual Report 2018
| 23 |
Statement of Changes in Net Assets (continued)
| | Columbia Adaptive Retirement
2040 Fund | Columbia Adaptive Retirement
2050 Fund |
| | Year Ended
March 31, 2018 (a) | Year Ended
March 31, 2018 (a) |
| Operations | | |
| Net investment income | $3,171 | $3,360 |
| Net realized gain | 4,770 | 4,794 |
| Net change in unrealized appreciation (depreciation) | 2,104 | 2,635 |
| Net increase in net assets resulting from operations | 10,045 | 10,789 |
| Distributions to shareholders | | |
| Net investment income | | |
| Advisor Class | (2,140) | (2,446) |
| Institutional 3 Class | (2,079) | (2,446) |
| Net realized gains | | |
| Advisor Class | (274) | — |
| Institutional 3 Class | (266) | — |
| Total distributions to shareholders | (4,759) | (4,892) |
| Increase in net assets from capital stock activity | 28,669 | — |
| Total increase in net assets | 33,955 | 5,897 |
| Net assets at beginning of period | 1,000,000 | 1,000,000 |
| Net assets at end of period | $1,033,955 | $1,005,897 |
| Excess of distributions over net investment income | $(253) | $(253) |
| (a) | Based on operations from October 24, 2017 (fund commencement of operations) through the stated period end. |
The accompanying Notes to Financial Statements are an integral part of this statement.
| 24 | Columbia Adaptive Retirement Funds | Annual Report 2018 |
Statement of Changes in Net Assets (continued)
| | Columbia Adaptive Retirement
2060 Fund |
| | Year Ended
March 31, 2018 (a) |
| Operations | |
| Net investment income | $3,373 |
| Net realized gain | 4,726 |
| Net change in unrealized appreciation (depreciation) | 2,650 |
| Net increase in net assets resulting from operations | 10,749 |
| Distributions to shareholders | |
| Net investment income | |
| Advisor Class | (2,309) |
| Institutional 3 Class | (2,286) |
| Net realized gains | |
| Advisor Class | (291) |
| Institutional 3 Class | (288) |
| Total distributions to shareholders | (5,174) |
| Increase in net assets from capital stock activity | 5,026 |
| Total increase in net assets | 10,601 |
| Net assets at beginning of period | 1,000,000 |
| Net assets at end of period | $1,010,601 |
| Excess of distributions over net investment income | $(253) |
| (a) | Based on operations from October 24, 2017 (fund commencement of operations) through the stated period end. |
The accompanying Notes to Financial Statements are an integral part of this statement.
Columbia Adaptive Retirement Funds | Annual Report 2018
| 25 |
Statement of Changes in Net Assets (continued)
| | Columbia Adaptive Retirement
2020 Fund | Columbia Adaptive Retirement
2030 Fund |
| | Year Ended | Year Ended |
| | March 31, 2018 (a) | March 31, 2018 (a) |
| | Shares | Dollars ($) | Shares | Dollars ($) |
| Capital stock activity |
| Advisor Class | | | | |
| Subscriptions | — | — | 10,083 | 102,260 |
| Distributions reinvested | — | — | 36 | 367 |
| Net increase | — | — | 10,119 | 102,627 |
| Total net increase | — | — | 10,119 | 102,627 |
| (a) | Based on operations from October 24, 2017 (fund commencement of operations) through the stated period end. |
The accompanying Notes to Financial Statements are an integral part of this statement.
| 26 | Columbia Adaptive Retirement Funds | Annual Report 2018 |
Statement of Changes in Net Assets (continued)
| | Columbia Adaptive Retirement
2040 Fund | Columbia Adaptive Retirement
2050 Fund |
| | Year Ended | Year Ended |
| | March 31, 2018 (a) | March 31, 2018 (a) |
| | Shares | Dollars ($) | Shares | Dollars ($) |
| Capital stock activity |
| Advisor Class | | | | |
| Subscriptions | 2,844 | 28,600 | — | — |
| Distributions reinvested | 7 | 69 | — | — |
| Net increase | 2,851 | 28,669 | — | — |
| Total net increase | 2,851 | 28,669 | — | — |
| (a) | Based on operations from October 24, 2017 (fund commencement of operations) through the stated period end. |
The accompanying Notes to Financial Statements are an integral part of this statement.
Columbia Adaptive Retirement Funds | Annual Report 2018
| 27 |
Statement of Changes in Net Assets (continued)
| | Columbia Adaptive Retirement
2060 Fund |
| | Year Ended |
| | March 31, 2018 (a) |
| | Shares | Dollars ($) |
| Capital stock activity |
| Advisor Class | | |
| Subscriptions | 496 | 5,000 |
| Distributions reinvested | 3 | 26 |
| Net increase | 499 | 5,026 |
| Total net increase | 499 | 5,026 |
| (a) | Based on operations from October 24, 2017 (fund commencement of operations) through the stated period end. |
The accompanying Notes to Financial Statements are an integral part of this statement.
| 28 | Columbia Adaptive Retirement Funds | Annual Report 2018 |
[THIS PAGE INTENTIONALLY LEFT BLANK]
Columbia Adaptive Retirement Funds | Annual Report 2018
| 29 |
Financial Highlights
Columbia Adaptive Retirement 2020 Fund
The following table is intended to help you understand the Fund’s financial performance. Certain information reflects financial results for a single share of a class held for the periods shown. Per share net investment income (loss) amounts are calculated based on average shares outstanding during the period. Total return assumes reinvestment of all dividends and distributions, if any. Total return does not reflect payment of sales charges, if any. Total return and portfolio turnover are not annualized for periods of less than one year. The portfolio turnover rate is calculated without regard to purchase and sales transactions of short-term instruments and certain derivatives, if any. If such transactions were included, the Fund’s portfolio turnover rate may be higher.
| | Net asset value,
beginning of
period | Net
investment
income | Net
realized
and
unrealized
gain | Total from
investment
operations | Distributions
from net
investment
income |
| Advisor Class |
| Year Ended 3/31/2018(c) | $10.00 | 0.03 | 0.04 | 0.07 | (0.03) |
| Institutional 3 Class |
| Year Ended 3/31/2018(c) | $10.00 | 0.03 | 0.04 | 0.07 | (0.03) |
| Notes to Financial Highlights |
| (a) | In addition to the fees and expenses that the Fund bears directly, the Fund indirectly bears a pro rata share of the fees and expenses of the underlying funds in which the Fund invests. Such indirect expenses are not included in the Fund’s reported expense ratios. |
| (b) | Total net expenses include the impact of certain fee waivers/expense reimbursements made by the Investment Manager and certain of its affiliates, if applicable. |
| (c) | The Fund commenced operations on October 24, 2017. Per share data and total return reflect activity from that date. |
| (d) | Annualized. |
The accompanying Notes to Financial Statements are an integral part of this statement.
| 30 | Columbia Adaptive Retirement Funds | Annual Report 2018 |
Total
distributions to
shareholders | Net
asset
value,
end of
period | Total
return | Total gross
expense
ratio to
average
net assets(a) | Total net
expense
ratio to
average
net assets(a),(b) | Net investment
income
ratio to
average
net assets | Portfolio
turnover | Net
assets,
end of
period
(000’s) |
| |
| (0.03) | $10.04 | 0.71% | 2.14% (d) | 0.41% (d) | 0.58% (d) | 8% | $2,509 |
| |
| (0.03) | $10.04 | 0.71% | 2.14% (d) | 0.41% (d) | 0.58% (d) | 8% | $2,509 |
Columbia Adaptive Retirement Funds | Annual Report 2018
| 31 |
Financial Highlights
Columbia Adaptive Retirement 2030 Fund
| | Net asset value,
beginning of
period | Net
investment
income | Net
realized
and
unrealized
gain | Total from
investment
operations | Distributions
from net
investment
income |
| Advisor Class |
| Year Ended 3/31/2018(c) | $10.00 | 0.03 | 0.06 | 0.09 | (0.04) |
| Institutional 3 Class |
| Year Ended 3/31/2018(c) | $10.00 | 0.03 | 0.06 | 0.09 | (0.04) |
| Notes to Financial Highlights |
| (a) | In addition to the fees and expenses that the Fund bears directly, the Fund indirectly bears a pro rata share of the fees and expenses of the underlying funds in which the Fund invests. Such indirect expenses are not included in the Fund’s reported expense ratios. |
| (b) | Total net expenses include the impact of certain fee waivers/expense reimbursements made by the Investment Manager and certain of its affiliates, if applicable. |
| (c) | The Fund commenced operations on October 24, 2017. Per share data and total return reflect activity from that date. |
| (d) | Annualized. |
The accompanying Notes to Financial Statements are an integral part of this statement.
| 32 | Columbia Adaptive Retirement Funds | Annual Report 2018 |
Total
distributions to
shareholders | Net
asset
value,
end of
period | Total
return | Total gross
expense
ratio to
average
net assets(a) | Total net
expense
ratio to
average
net assets(a),(b) | Net investment
income
ratio to
average
net assets | Portfolio
turnover | Net
assets,
end of
period
(000’s) |
| |
| (0.04) | $10.05 | 0.86% | 1.29% (d) | 0.41% (d) | 0.67% (d) | 9% | $5,115 |
| |
| (0.04) | $10.05 | 0.86% | 1.29% (d) | 0.41% (d) | 0.66% (d) | 9% | $5,014 |
Columbia Adaptive Retirement Funds | Annual Report 2018
| 33 |
Financial Highlights
Columbia Adaptive Retirement 2040 Fund
| | Net asset value,
beginning of
period | Net
investment
income | Net
realized
and
unrealized
gain | Total from
investment
operations | Distributions
from net
investment
income | Distributions
from net
realized
gains |
| Advisor Class |
| Year Ended 3/31/2018(c) | $10.00 | 0.03 | 0.07 | 0.10 | (0.04) | (0.01) |
| Institutional 3 Class |
| Year Ended 3/31/2018(c) | $10.00 | 0.03 | 0.07 | 0.10 | (0.04) | (0.01) |
| Notes to Financial Highlights |
| (a) | In addition to the fees and expenses that the Fund bears directly, the Fund indirectly bears a pro rata share of the fees and expenses of the underlying funds in which the Fund invests. Such indirect expenses are not included in the Fund’s reported expense ratios. |
| (b) | Total net expenses include the impact of certain fee waivers/expense reimbursements made by the Investment Manager and certain of its affiliates, if applicable. |
| (c) | The Fund commenced operations on October 24, 2017. Per share data and total return reflect activity from that date. |
| (d) | Annualized. |
The accompanying Notes to Financial Statements are an integral part of this statement.
| 34 | Columbia Adaptive Retirement Funds | Annual Report 2018 |
Total
distributions to
shareholders | Net
asset
value,
end of
period | Total
return | Total gross
expense
ratio to
average
net assets(a) | Total net
expense
ratio to
average
net assets(a),(b) | Net investment
income
ratio to
average
net assets | Portfolio
turnover | Net
assets,
end of
period
(000’s) |
| |
| (0.05) | $10.05 | 0.96% | 8.70% (d) | 0.42% (d) | 0.72% (d) | 9% | $531 |
| |
| (0.05) | $10.05 | 0.96% | 8.69% (d) | 0.42% (d) | 0.72% (d) | 9% | $503 |
Columbia Adaptive Retirement Funds | Annual Report 2018
| 35 |
Financial Highlights
Columbia Adaptive Retirement 2050 Fund
| | Net asset value,
beginning of
period | Net
investment
income | Net
realized
and
unrealized
gain | Total from
investment
operations | Distributions
from net
investment
income |
| Advisor Class |
| Year Ended 3/31/2018(c) | $10.00 | 0.03 | 0.08 | 0.11 | (0.05) |
| Institutional 3 Class |
| Year Ended 3/31/2018(c) | $10.00 | 0.03 | 0.08 | 0.11 | (0.05) |
| Notes to Financial Highlights |
| (a) | In addition to the fees and expenses that the Fund bears directly, the Fund indirectly bears a pro rata share of the fees and expenses of the underlying funds in which the Fund invests. Such indirect expenses are not included in the Fund’s reported expense ratios. |
| (b) | Total net expenses include the impact of certain fee waivers/expense reimbursements made by the Investment Manager and certain of its affiliates, if applicable. |
| (c) | The Fund commenced operations on October 24, 2017. Per share data and total return reflect activity from that date. |
| (d) | Annualized. |
The accompanying Notes to Financial Statements are an integral part of this statement.
| 36 | Columbia Adaptive Retirement Funds | Annual Report 2018 |
Total
distributions to
shareholders | Net
asset
value,
end of
period | Total
return | Total gross
expense
ratio to
average
net assets(a) | Total net
expense
ratio to
average
net assets(a),(b) | Net investment
income
ratio to
average
net assets | Portfolio
turnover | Net
assets,
end of
period
(000’s) |
| |
| (0.05) | $10.06 | 1.08% | 8.76% (d) | 0.42% (d) | 0.77% (d) | 8% | $503 |
| |
| (0.05) | $10.06 | 1.08% | 8.76% (d) | 0.42% (d) | 0.77% (d) | 8% | $503 |
Columbia Adaptive Retirement Funds | Annual Report 2018
| 37 |
Financial Highlights
Columbia Adaptive Retirement 2060 Fund
| | Net asset value,
beginning of
period | Net
investment
income | Net
realized
and
unrealized
gain | Total from
investment
operations | Distributions
from net
investment
income | Distributions
from net
realized
gains |
| Advisor Class |
| Year Ended 3/31/2018(c) | $10.00 | 0.03 | 0.08 | 0.11 | (0.04) | (0.01) |
| Institutional 3 Class |
| Year Ended 3/31/2018(c) | $10.00 | 0.03 | 0.08 | 0.11 | (0.04) | (0.01) |
| Notes to Financial Highlights |
| (a) | In addition to the fees and expenses that the Fund bears directly, the Fund indirectly bears a pro rata share of the fees and expenses of the underlying funds in which the Fund invests. Such indirect expenses are not included in the Fund’s reported expense ratios. |
| (b) | Total net expenses include the impact of certain fee waivers/expense reimbursements made by the Investment Manager and certain of its affiliates, if applicable. |
| (c) | The Fund commenced operations on October 24, 2017. Per share data and total return reflect activity from that date. |
| (d) | Annualized. |
The accompanying Notes to Financial Statements are an integral part of this statement.
| 38 | Columbia Adaptive Retirement Funds | Annual Report 2018 |
Total
distributions to
shareholders | Net
asset
value,
end of
period | Total
return | Total gross
expense
ratio to
average
net assets(a) | Total net
expense
ratio to
average
net assets(a),(b) | Net investment
income
ratio to
average
net assets | Portfolio
turnover | Net
assets,
end of
period
(000’s) |
| |
| (0.05) | $10.06 | 1.11% | 8.73% (d) | 0.42% (d) | 0.77% (d) | 7% | $508 |
| |
| (0.05) | $10.06 | 1.11% | 8.73% (d) | 0.42% (d) | 0.77% (d) | 7% | $503 |
Columbia Adaptive Retirement Funds | Annual Report 2018
| 39 |
Notes to Financial Statements
March 31, 2018
Note 1. Organization
Columbia Funds Series Trust I, (the Trust) is registered under the Investment Company Act of 1940, as amended (the 1940 Act), as open-end management investment companies. Columbia Funds Series Trust I is organized as a Massachusetts business trust. Information presented in these financial statements pertains to the following series of the Trust (each, a Fund and collectively, the Funds): Columbia Adaptive Retirement 2020 Fund, Columbia Adaptive Retirement 2030 Fund, Columbia Adaptive Retirement 2040 Fund, Columbia Adaptive Retirement 2050 Fund and Columbia Adaptive Retirement 2060 Fund. Each Fund currently operates as a non-diversified fund.
Each Fund is a “fund-of-funds”, investing significantly in affiliated funds managed by Columbia Management Investment Advisers, LLC (the Investment Manager), a wholly-owned subsidiary of Ameriprise Financial, Inc. (Ameriprise Financial), or its affiliates, as well as third-party advised (unaffiliated) funds, including exchange-traded funds (collectively, Underlying Funds).
For information on the Underlying Funds, please refer to each Fund’s current prospectus and the prospectuses of the Underlying Funds, which are available, free of charge, from the Securities and Exchange Commission website, www.sec.gov.
On October 23, 2017, the Investment Manager invested $5 million in Columbia Adaptive Retirement 2020 Fund (250,000 shares for Advisor Class and 250,000 shares for Institutional 3 Class) and $9.98 million in Columbia Adaptive Retirement 2030 Fund (499,000 shares for Advisor Class and 499,000 shares for Institutional 3 Class) and $1 million in Columbia Adaptive Retirement 2040 Fund (50,000 shares for Advisor Class and 50,000 shares for Institutional 3 Class) and $1 million in Columbia Adaptive Retirement 2050 Fund (50,000 shares for Advisor Class and 50,000 shares for Institutional 3 Class) and $1 million in Columbia Adaptive Retirement 2060 Fund (50,000 shares for Advisor Class and 50,000 shares for Institutional 3 Class), which represented the initial capital for each class at $10 per share. Shares of the Funds were first offered to the public on October 24, 2017.
These financial statements cover the period from October 24, 2017 (commencement of operations) through March 31, 2018. All references to the year ended March 31, 2018 refer to the period from October 24, 2017 through March 31, 2018.
Fund shares
The Trust may issue an unlimited number of shares (without par value). Although all share classes generally have identical voting, dividend and liquidation rights, each share class votes separately when required by the Trust’s organizational documents or by law. Different share classes pay different distribution amounts to the extent the expenses of such share classes differ, and distributions in liquidation will be proportional to the net asset value of each share class. Each share class has its own expense and sales charge structure. Each Fund offers each of the share classes identified below.
Advisor Class shares are not subject to sales charges and are generally available only to omnibus retirement plans and certain investors as described in the Funds’ prospectus. Prior to November 1, 2017, Advisor Class shares were known as Class R4 shares.
Institutional 3 Class shares are not subject to sales charges and are generally available only to certain retirement plans as described in the Funds’ prospectus. Prior to November 1, 2017, Institutional 3 Class shares were known as Class Y shares.
Note 2. Summary of significant accounting policies
Basis of preparation
Each Fund is an investment company that applies the accounting and reporting guidance in the Financial Accounting Standards Board (FASB) Accounting Standards Codification Topic 946, Financial Services - Investment Companies (ASC 946). The financial statements are prepared in accordance with U.S. generally accepted accounting principles (GAAP), which requires management to make certain estimates and assumptions that affect the reported amounts of assets and liabilities, the disclosure of contingent assets and liabilities at the date of the financial statements and the reported amounts of income and expenses during the reporting period. Actual results could differ from those estimates.
The following is a summary of significant accounting policies followed by the Funds in the preparation of their financial statements.
| 40 | Columbia Adaptive Retirement Funds | Annual Report 2018 |
Notes to Financial Statements (continued)
March 31, 2018
Security valuation
All equity securities and exchange-traded funds are valued at the close of business of the New York Stock Exchange. Equity securities and exchange-traded funds are valued at the last quoted sales price on the principal exchange or market on which they trade, except for securities traded on the NASDAQ Stock Market, which are valued at the NASDAQ official close price. Unlisted securities or listed securities for which there were no sales during the day are valued at the mean of the latest quoted bid and ask prices on such exchanges or markets.
Investments in the Underlying Funds, with the exception of exchange-traded funds, are valued at the net asset value of the applicable class of the Underlying Fund determined as of the close of the New York Stock Exchange on the valuation date.
Investments for which market quotations are not readily available, or that have quotations which management believes are not reflective of market value or reliable, are valued at fair value as determined in good faith under procedures approved by and under the general supervision of the Board of Trustees. If a security or class of securities (such as foreign securities) is valued at fair value, such value is likely to be different from the quoted or published price for the security.
The determination of fair value often requires significant judgment. To determine fair value, management may use assumptions including but not limited to future cash flows and estimated risk premiums. Multiple inputs from various sources may be used to determine fair value.
GAAP requires disclosure regarding the inputs and valuation techniques used to measure fair value and any changes in valuation inputs or techniques. In addition, investments shall be disclosed by major category. This information is disclosed following the Funds’ Portfolio of Investments.
Security transactions
Security transactions are accounted for on the trade date. Cost is determined and gains (losses) are based upon the specific identification method for both financial statement and federal income tax purposes.
Income recognition
Corporate actions and dividend income are recorded on the ex-dividend date.
The Funds may receive distributions from holdings in equity securities, business development companies (BDCs), exchange-traded funds (ETFs), limited partnerships (LPs), other regulated investment companies (RICs), and real estate investment trusts (REITs), which report information on the tax character of their distributions annually. These distributions are allocated to dividend income, capital gain and return of capital based on actual information reported. Return of capital is recorded as a reduction of the cost basis of securities held. If the Fund no longer owns the applicable securities, return of capital is recorded as a realized gain. With respect to REITs, to the extent actual information has not yet been reported, estimates for return of capital are made by the Fund’s management. Management’s estimates are subsequently adjusted when the actual character of the distributions is disclosed by the REITs, which could result in a proportionate change in return of capital to shareholders.
Awards from class action litigation are recorded as a reduction of cost basis if the Fund still owns the applicable securities on the payment date. If the Fund no longer owns the applicable securities, the proceeds are recorded as realized gains.
Income and capital gain distributions from the Underlying Funds, if any, are recorded on the ex-dividend date.
Expenses
General expenses of the Trust are allocated to the Funds and other funds of the Trust based upon relative net assets or other expense allocation methodologies determined by the nature of the expense. Expenses directly attributable to a Fund are charged to that Fund. Expenses directly attributable to a specific class of shares are charged to that share class.
Columbia Adaptive Retirement Funds | Annual Report 2018
| 41 |
Notes to Financial Statements (continued)
March 31, 2018
Determination of class net asset value
All income, expenses (other than class-specific expenses which are charged directly to that share class, as shown in the Statement of Operations) and realized and unrealized gains (losses) are allocated to each class of a Fund on a daily basis, based on the relative net assets of each class, for purposes of determining the net asset value of each class.
Federal income tax status
For federal income tax purposes, each Fund is treated as a separate entity. The Funds intend to qualify each year as separate regulated investment companies under Subchapter M of the Internal Revenue Code, as amended, and will distribute substantially all of their investment company taxable income and net capital gain, if any, for their tax year, and as such will not be subject to federal income taxes. In addition, the Funds intend to distribute in each calendar year substantially all of their ordinary income, capital gain net income and certain other amounts, if any, such that the Funds should not be subject to federal excise tax. Therefore, no federal income or excise tax provisions are recorded.
Distributions to shareholders
Distributions from net investment income, if any, are declared and paid annually. Net realized capital gains, if any, are distributed at least annually. Income distributions and capital gain distributions are determined in accordance with federal income tax regulations, which may differ from GAAP.
Guarantees and indemnifications
Under the Trust’s organizational documents and, in some cases, by contract, its officers and trustees are indemnified against certain liabilities arising out of the performance of their duties to the Trust or its funds. In addition, certain of the Funds’ contracts with their service providers contain general indemnification clauses. The Funds’ maximum exposure under these arrangements is unknown since the amount of any future claims that may be made against the Funds cannot be determined, and the Funds have no historical basis for predicting the likelihood of any such claims.
Recent accounting pronouncement
Accounting Standards Update 2017-08 Premium Amortization on Purchased Callable Debt Securities
In March 2017, the Financial Accounting Standards Board issued Accounting Standards Update (ASU) No. 2017-08 Premium Amortization on Purchased Callable Debt Securities. ASU No. 2017-08 updates the accounting standards to shorten the amortization period for certain purchased callable debt securities, held at a premium, to be amortized to the earliest call date. The update applies to securities with explicit, noncontingent call features that are callable at fixed prices and on preset dates. The standard is effective for annual periods beginning after December 15, 2018 and interim periods within those fiscal years. At this time, management is evaluating the implication of this guidance and the impact it will have on the financial statement amounts and footnote disclosures, if any.
Note 3. Fees and other transactions with affiliates
Management services fees and underlying fund fees
The Funds have entered into a Management Agreement with Columbia Management Investment Advisers, LLC (the Investment Manager). Under the Management Agreement, the Investment Manager provides each Fund with investment research and advice, as well as administrative and accounting services. The management services fee is an annual fee that is a blend of (i) 0.02% on assets invested in affiliated Underlying Funds that pay a management or advisory fee to the Investment Manager and (ii) 0.47% on its assets that are invested in securities, instruments and other assets not described above, including without limitation affiliated funds that do not pay a management or advisory fee to the Investment Manager, third party funds, derivatives and individual securities.
| 42 | Columbia Adaptive Retirement Funds | Annual Report 2018 |
Notes to Financial Statements (continued)
March 31, 2018
The annualized effective management services fee rates based on each Fund’s average daily net assets for the year ended March 31, 2018 were as follows:
| | Effective management services fee rate (%) |
| Columbia Adaptive Retirement 2020 Fund | 0.45 |
| Columbia Adaptive Retirement 2030 Fund | 0.45 |
| Columbia Adaptive Retirement 2040 Fund | 0.45 |
| Columbia Adaptive Retirement 2050 Fund | 0.45 |
| Columbia Adaptive Retirement 2060 Fund | 0.45 |
In addition to the fees and expenses which the Funds bear directly, the Funds indirectly bear a pro rata share of the fees and expenses of the Underlying Funds in which the Funds invest. Because the Underlying Funds have varied expense and fee levels and the Funds may own different proportions of Underlying Funds at different times, the amount of fees and expenses incurred indirectly by the Funds will vary. These expenses are not reflected in the expenses shown in Statement of Operations and are not included in the ratios to average net assets shown in the Financial Highlights.
Offering costs
Offering costs were incurred prior to the shares of the Funds being offered. Offering costs include, among other things, state registration filing fees and printing costs. Each Fund amortizes offering costs over a period of 12 months from the commencement of operations.
Compensation of board members
Members of the Board of Trustees who are not officers or employees of the Investment Manager or Ameriprise Financial are compensated for their services to the Funds as disclosed in the Statement of Operations. These members of the Board of Trustees may participate in a Deferred Compensation Plan (the Plan) which may be terminated at any time. Obligations of the Plan will be paid solely out of each Fund’s assets, and all amounts payable under the Plan constitute a general unsecured obligation of the Funds.
Compensation of Chief Compliance Officer
The Board of Trustees has appointed a Chief Compliance Officer to the Funds in accordance with federal securities regulations. As disclosed in the Statement of Operations, a portion of the Chief Compliance Officer’s total compensation is allocated to the Funds, along with other allocations to affiliated funds governed by the Board of Trustees, based on relative net assets.
Transfer agency fees
Under a Transfer and Dividend Disbursing Agent Agreement, Columbia Management Investment Services Corp. (the Transfer Agent), an affiliate of the Investment Manager and a wholly-owned subsidiary of Ameriprise Financial, is responsible for providing transfer agency services to the Fund. The Transfer Agent has contracted with DST Asset Manager Solutions, Inc. (DST) to serve as sub-transfer agent. The Transfer Agent pays the fees of DST for services as sub-transfer agent and DST is not entitled to reimbursement for such fees from the Fund (with the exception of out-of-pocket fees).
The Fund pays the Transfer Agent a monthly transfer agency fee based on the number or the average value of accounts, depending on the type of account. In addition, the Fund pays the Transfer Agent a fee for shareholder services based on the number of accounts or on a percentage of the average aggregate value of the Fund’s shares maintained in omnibus accounts up to the lesser of the amount charged by the financial intermediary or a cap established by the Board of Trustees from time to time.
The Transfer Agent also receives compensation from the Fund for various shareholder services and reimbursements for certain out-of-pocket fees. Total transfer agency fees for Institutional 3 Class shares are subject to an annual limitation of not more than 0.02% of the average daily net assets attributable to Institutional 3 Class shares.
Columbia Adaptive Retirement Funds | Annual Report 2018
| 43 |
Notes to Financial Statements (continued)
March 31, 2018
For the year ended March 31, 2018, the Funds’ annualized effective transfer agency fee rates as a percentage of average daily net assets of each class were as follows:
| Fund | Advisor
Class (%) | Institutional 3
Class (%) |
| Columbia Adaptive Retirement 2020 Fund | 0.00 | 0.00 |
| Columbia Adaptive Retirement 2030 Fund | 0.00 | 0.00 |
| Columbia Adaptive Retirement 2040 Fund | 0.01 | 0.01 |
| Columbia Adaptive Retirement 2050 Fund | 0.01 | 0.01 |
| Columbia Adaptive Retirement 2060 Fund | 0.01 | 0.01 |
Distribution and service fees
The Funds have an agreement with Columbia Management Investment Distributors, Inc. (the Distributor), an affiliate of the Investment Manager and a wholly-owned subsidiary of Ameriprise Financial, for distribution and shareholder services. The Funds do not pay the Distributor a fee for the distribution services it provides to the Funds.
Expenses waived/reimbursed by the Investment Manager and its affiliates
The Investment Manager and certain of its affiliates have contractually agreed to waive fees and/or reimburse expenses (excluding certain fees and expenses described below) for the period(s) disclosed below, unless sooner terminated at the sole discretion of the Board of Trustees, so that each Fund’s net operating expenses, including indirect expenses of the Underlying Funds, after giving effect to fees waived/expenses reimbursed and any balance credits and/or overdraft charges from the Funds’ custodian, do not exceed the following annual rate(s) as a percentage of the class’ average daily net assets:
| | Fee Rate Contractual through July 31, 2019 |
| | Advisor
Class (%) | Institutional 3
Class (%) |
| Columbia Adaptive Retirement 2020 Fund | 0.68 | 0.50 |
| Columbia Adaptive Retirement 2030 Fund | 0.68 | 0.50 |
| Columbia Adaptive Retirement 2040 Fund | 0.68 | 0.50 |
| Columbia Adaptive Retirement 2050 Fund | 0.68 | 0.50 |
| Columbia Adaptive Retirement 2060 Fund | 0.68 | 0.50 |
Under the agreement governing these fee waivers and/or expense reimbursement arrangements, the following fees and expenses are excluded from the waiver/reimbursement commitment, and therefore will be paid by the Fund, if applicable: taxes (including foreign transaction taxes), transaction costs and brokerage commissions, costs related to any securities lending program, dividend expenses associated with securities sold short, inverse floater program fees and expenses, transaction charges and interest on borrowed money, interest, infrequent and/or unusual expenses and any other expenses the exclusion of which is specifically approved by the Board of Trustees. This agreement may be modified or amended only with approval from the Investment Manager, certain of its affiliates and the Fund. In addition to the contractual agreement, the Investment Manager and certain of its affiliates have voluntarily agreed to waive fees and/or reimburse Fund expenses (excluding certain fees and expenses described above) so that Fund level expenses (expenses directly attributable to the Fund and not to a specific share class) are waived proportionately across all share classes, but the Fund’s net operating expenses shall not exceed the contractual annual rates listed in the table above. This arrangement may be revised or discontinued at any time. Any fees waived and/or expenses reimbursed under the expense reimbursement arrangements described above are not recoverable by the Investment Manager or its affiliates in future periods.
Note 4. Federal tax information
The timing and character of income and capital gain distributions are determined in accordance with income tax regulations, which may differ from GAAP because of temporary or permanent book to tax differences.
| 44 | Columbia Adaptive Retirement Funds | Annual Report 2018 |
Notes to Financial Statements (continued)
March 31, 2018
At March 31, 2018, these differences were primarily due to differing treatment for trustees’ deferred compensation, re-characterization of distributions for investments, distribution reclassifications and non-deductible expenses. To the extent these differences were permanent, reclassifications were made among the components of the Fund’s net assets in the Statement of Assets and Liabilities. Temporary differences do not require reclassifications.
In the Statement of Assets and Liabilities the following reclassifications were made:
| Fund | Excess of distributions
over net investment
income ($) | Accumulated
net realized
gain ($) | Paid in capital
decrease ($) |
| Columbia Adaptive Retirement 2020 Fund | 2,802 | (2,476) | (326) |
| Columbia Adaptive Retirement 2030 Fund | 7,823 | (7,199) | (624) |
| Columbia Adaptive Retirement 2040 Fund | 795 | (720) | (75) |
| Columbia Adaptive Retirement 2050 Fund | 1,279 | (1,205) | (74) |
| Columbia Adaptive Retirement 2060 Fund | 969 | (894) | (75) |
Net investment income (loss) and net realized gains (losses), as disclosed in the Statement of Operations, and net assets were not affected by these reclassifications.
The tax character of distributions paid during the year ended March 31, 2018 was as follows:
| | Ordinary
income ($) | Long-term
capital gains ($) | Total ($) |
| Columbia Adaptive Retirement 2020 Fund | 15,645 | — | 15,645 |
| Columbia Adaptive Retirement 2030 Fund | 37,054 | — | 37,054 |
| Columbia Adaptive Retirement 2040 Fund | 4,759 | — | 4,759 |
| Columbia Adaptive Retirement 2050 Fund | 4,892 | — | 4,892 |
| Columbia Adaptive Retirement 2060 Fund | 5,174 | — | 5,174 |
Short-term capital gain distributions, if any, are considered ordinary income distributions for tax purposes.
At March 31, 2018, the components of distributable earnings on a tax basis were as follows:
| Fund | Undistributed
ordinary
income ($) | Undistributed
long-term
capital gains ($) | Capital loss
carryforwards ($) | Net unrealized
appreciation ($) |
| Columbia Adaptive Retirement 2020 Fund | 5,312 | 6,558 | — | 7,164 |
| Columbia Adaptive Retirement 2030 Fund | 13,555 | 17,234 | — | 16,691 |
| Columbia Adaptive Retirement 2040 Fund | 1,349 | 2,161 | — | 2,104 |
| Columbia Adaptive Retirement 2050 Fund | 1,185 | 2,404 | — | 2,635 |
| Columbia Adaptive Retirement 2060 Fund | 836 | 2,417 | — | 2,650 |
At March 31, 2018, the cost of all investments for federal income tax purposes along with the aggregate gross unrealized appreciation and depreciation based on that cost was:
| Fund | Tax cost ($) | Gross
unrealized
appreciation ($) | Gross
unrealized
(depreciation) ($) | Net unrealized
appreciation ($) |
| Columbia Adaptive Retirement 2020 Fund | 5,003,243 | 23,889 | (16,725) | 7,164 |
| Columbia Adaptive Retirement 2030 Fund | 10,104,411 | 50,772 | (34,081) | 16,691 |
| Columbia Adaptive Retirement 2040 Fund | 1,010,444 | 5,550 | (3,446) | 2,104 |
| Columbia Adaptive Retirement 2050 Fund | 995,447 | 6,052 | (3,417) | 2,635 |
| Columbia Adaptive Retirement 2060 Fund | 1,000,140 | 6,081 | (3,431) | 2,650 |
Tax cost of investments and unrealized appreciation/(depreciation) may also include timing differences that do not constitute adjustments to tax basis.
Columbia Adaptive Retirement Funds | Annual Report 2018
| 45 |
Notes to Financial Statements (continued)
March 31, 2018
Management of the Funds has concluded that there are no significant uncertain tax positions in the Funds that would require recognition in the financial statements. However, management’s conclusion may be subject to review and adjustment at a later date based on factors including, but not limited to, new tax laws, regulations, and administrative interpretations (including relevant court decisions). Generally, the Funds’ federal tax returns for the prior three fiscal years remain subject to examination by the Internal Revenue Service.
Note 5. Portfolio information
For the year ended March 31, 2018, the cost of purchases and proceeds from sales of securities, excluding short-term investments and derivatives, if any, for each Fund aggregated to:
| | Purchases
($) | Proceeds
from sales
($) |
| Columbia Adaptive Retirement 2020 Fund | 5,153,234 | 371,098 |
| Columbia Adaptive Retirement 2030 Fund | 10,512,617 | 844,162 |
| Columbia Adaptive Retirement 2040 Fund | 1,052,277 | 87,851 |
| Columbia Adaptive Retirement 2050 Fund | 1,028,203 | 77,377 |
| Columbia Adaptive Retirement 2060 Fund | 1,028,382 | 72,951 |
The amount of purchase and sale activity impacts the portfolio turnover rate reported in the Financial Highlights.
Note 6. Affiliated money market fund
Each Fund may invest in Columbia Short-Term Cash Fund, an affiliated money market fund established for the exclusive use by each Fund and other affiliated funds (the Affiliated MMF). The income earned by the Funds from such investments is included as Dividends - affiliated issuers in the Statement of Operations. As an investing fund, each Fund indirectly bears its proportionate share of the expenses of the Affiliated MMF. The Affiliated MMF prices its shares with a floating net asset value. In addition, the Board of Trustees of the Affiliated MMF may impose a fee on redemptions (sometimes referred to as a liquidity fee) or temporarily suspend redemptions (sometimes referred to as imposing a redemption gate) in the event its liquidity falls below regulatory limits.
Note 7. Line of credit
Each Fund has access to a revolving credit facility with a syndicate of banks led by Citibank, N.A., HSBC Bank USA, N.A. and JPMorgan Chase Bank, N.A. whereby the Funds may borrow for the temporary funding of shareholder redemptions or for other temporary or emergency purposes. The credit facility, which is a collective agreement between the Funds and certain other funds managed by the Investment Manager, severally and not jointly, permits collective borrowings up to $1 billion. Interest is charged to each participating fund based on its borrowings at a rate equal to the higher of (i) the overnight federal funds rate plus 1.00% or (ii) the one-month LIBOR rate plus 1.00%. Each borrowing under the credit facility matures no later than 60 days after the date of borrowing. Each Fund also pays a commitment fee equal to its pro rata share of the amount of the credit facility at a rate of 0.15% per annum. The commitment fee is included in other expenses in the Statement of Operations.
No Fund had borrowings during the year ended March 31, 2018.
Note 8. Significant risks
Alternative strategies investment risk
An investment in alternative investment strategies (Alternative Strategies) involves risks, which may be significant. Alternative Strategies may include strategies, instruments or other assets, such as derivatives, that seek investment returns uncorrelated with the broad equity and fixed income/debt markets, as well as those providing exposure to other markets (such as commodity markets), including but not limited to absolute (positive) return strategies. Alternative Strategies may fail to achieve their desired performance, market or other exposure, or their returns (or lack thereof) may be more correlated with the broad equity and/or fixed income/debt markets than was anticipated, and the fund may lose money.
| 46 | Columbia Adaptive Retirement Funds | Annual Report 2018 |
Notes to Financial Statements (continued)
March 31, 2018
Non-diversification risk
A non-diversified fund is permitted to invest a greater percentage of its total assets in fewer issuers than a diversified fund. The Fund may, therefore, have a greater risk of loss from a few issuers than a similar fund that invests more broadly.
Shareholder concentration risk
At March 31, 2018, certain shareholder accounts owned more than 10% of the outstanding shares of one or more of the Funds. Subscription and redemption activity of these accounts may have a significant effect on the operations of the Funds. In the case of a large redemption, the Fund may be forced to sell investments at inopportune times, including its liquid positions, which may result in Fund losses and the Fund holding a higher percentage of less liquid positions. Large redemptions could result in decreased economies of scale and increased operating expenses for non-redeeming Fund shareholders.
The aggregate percentages of shares outstanding held therein were as follows:
| Fund | Percentage of
shares
outstanding
held —
affiliated (%) |
| Columbia Adaptive Retirement 2020 Fund | 100.0 |
| Columbia Adaptive Retirement 2030 Fund | 99.0 |
| Columbia Adaptive Retirement 2040 Fund | 97.2 |
| Columbia Adaptive Retirement 2050 Fund | 100.0 |
| Columbia Adaptive Retirement 2060 Fund | 99.5 |
Note 9. Subsequent events
Management has evaluated the events and transactions that have occurred through the date the financial statements were issued and noted no items requiring adjustment of the financial statements or additional disclosure.
Note 10. Information regarding pending and settled legal proceedings
Ameriprise Financial and certain of its affiliates have historically been involved in a number of legal, arbitration and regulatory proceedings, including routine litigation, class actions, and governmental actions, concerning matters arising in connection with the conduct of their business activities. Ameriprise Financial believes that the Funds are not currently the subject of, and that neither Ameriprise Financial nor any of its affiliates are the subject of, any pending legal, arbitration or regulatory proceedings that are likely to have a material adverse effect on the Funds or the ability of Ameriprise Financial or its affiliates to perform under their contracts with the Funds. Ameriprise Financial is required to make quarterly (10-Q), annual (10-K) and, as necessary, 8-K filings with the Securities and Exchange Commission (SEC) on legal and regulatory matters that relate to Ameriprise Financial and its affiliates. Copies of these filings may be obtained by accessing the SEC website at www.sec.gov.
There can be no assurance that these matters, or the adverse publicity associated with them, will not result in increased Fund redemptions, reduced sale of Fund shares or other adverse consequences to the Funds. Further, although we believe proceedings are not likely to have a material adverse effect on the Funds or the ability of Ameriprise Financial or its affiliates to perform under their contracts with the Funds, these proceedings are subject to uncertainties and, as such, we are unable to estimate the possible loss or range of loss that may result. An adverse outcome in one or more of these proceedings could result in adverse judgments, settlements, fines, penalties or other relief that could have a material adverse effect on the consolidated financial condition or results of operations of Ameriprise Financial.
Columbia Adaptive Retirement Funds | Annual Report 2018
| 47 |
Report of Independent Registered Public Accounting Firm
To the Trustees of Columbia Funds Series Trust I and Shareholders of Columbia Adaptive Retirement 2020 Fund, Columbia Adaptive Retirement 2030 Fund, Columbia Adaptive Retirement 2040 Fund, Columbia Adaptive Retirement 2050 Fund and Columbia Adaptive Retirement 2060 Fund
Opinions on the Financial Statements
We have audited the accompanying statements of assets and liabilities, including the portfolios of investments, of Columbia Adaptive Retirement 2020 Fund, Columbia Adaptive Retirement 2030 Fund, Columbia Adaptive Retirement 2040 Fund, Columbia Adaptive Retirement 2050 Fund and Columbia Adaptive Retirement 2060 Fund (five of the funds constituting Columbia Funds Series Trust I, hereafter collectively referred to as the "Funds") as of March 31, 2018, the related statements of operations and changes in net assets, including the related notes, and the financial highlights for the period October 24, 2017 (commencement of operations) through March 31, 2018 (collectively referred to as the “financial statements”). In our opinion, the financial statements present fairly, in all material respects, the financial position of each of the Funds as of March 31, 2018, the results of each of their operations, the changes in each of their net assets, and each of the financial highlights for the period October 24, 2017 (commencement of operations) through March 31, 2018 in conformity with accounting principles generally accepted in the United States of America.
Basis for Opinions
These financial statements are the responsibility of the Funds’ management. Our responsibility is to express an opinion on the Funds’ financial statements based on our audits. We are a public accounting firm registered with the Public Company Accounting Oversight Board (United States) (“PCAOB”) and are required to be independent with respect to the Funds in accordance with the U.S. federal securities laws and the applicable rules and regulations of the Securities and Exchange Commission and the PCAOB.
We conducted our audits of these financial statements in accordance with the standards of the PCAOB. Those standards require that we plan and perform the audit to obtain reasonable assurance about whether the financial statements are free of material misstatement, whether due to error or fraud.
Our audits included performing procedures to assess the risks of material misstatement of the financial statements, whether due to error or fraud, and performing procedures that respond to those risks. Such procedures included examining, on a test basis, evidence regarding the amounts and disclosures in the financial statements. Our audits also included evaluating the accounting principles used and significant estimates made by management, as well as evaluating the overall presentation of the financial statements. Our procedures included confirmation of securities owned as of March 31, 2018 by correspondence with the custodian and transfer agent. We believe that our audits provide a reasonable basis for our opinions.
/s/PricewaterhouseCoopers LLP
Minneapolis, Minnesota
May 22, 2018
We have served as auditors of one or more investment companies within the Columbia Funds Complex since 1977.
| 48 | Columbia Adaptive Retirement Funds | Annual Report 2018 |
Federal Income Tax Information
(Unaudited)
The Funds hereby designate the following tax attributes for the fiscal year ended March 31, 2018. Shareholders will be notified in early 2019 of the amounts for use in preparing 2018 income tax returns.
| | Capital
gain
dividend |
| Columbia Adaptive Retirement 2020 Fund | $6,886 |
| Columbia Adaptive Retirement 2030 Fund | $18,096 |
| Columbia Adaptive Retirement 2040 Fund | $2,269 |
| Columbia Adaptive Retirement 2050 Fund | $2,524 |
| Columbia Adaptive Retirement 2060 Fund | $2,538 |
Capital gain dividend. The Fund designates as a capital gain dividend the amount reflected above, or if subsequently determined to be different, the net capital gain of such fiscal period.
Columbia Adaptive Retirement Funds | Annual Report 2018
| 49 |
Board Consideration and Approval of Management Agreement and Subadvisory Agreement
On August 16, 2017, the Board of Trustees (the Board) and the Trustees who are not interested persons (as defined in the Investment Company Act of 1940) (the Independent Trustees) of Columbia Funds Series Trust I (the Trust) unanimously approved, for an initial two-year term, Management Agreements (the Management Agreements) with Columbia Management Investment Advisers, LLC (the Investment Manager) and Subadvisory Agreements (the Subadvisory Agreements) between the Investment Manager and Threadneedle International Limited with respect to Columbia Adaptive Retirement 2020 Fund, Columbia Adaptive Retirement 2030 Fund, Columbia Adaptive Retirement 2040 Fund, Columbia Adaptive Retirement 2050 Fund and Columbia Adaptive Retirement 2060 Fund (the Funds), each a series of the Trust. As detailed below, the Board’s Advisory Fees and Expenses Committee (the Committee) and the Board met to review and discuss, both among themselves and with the management team of the Investment Manager, materials provided by the Investment Manager and others before determining to approve the Management Agreements and the Subadvisory Agreements (collectively, the Agreements).
In connection with their deliberations regarding the proposed Management Agreements and Subadvisory Agreements, the Committee and the Board evaluated materials requested from the Investment Manager regarding the Funds and the Agreements, and discussed these materials, as well as other materials provided by the Investment Manager in connection with the Board’s most recent annual approval of the continuation of the management agreements with respect to other series of the Trust, with representatives of the Investment Manager at the Committee meeting held on August 15, 2017, and at Board meetings held on June 14, 2017 and August 15, 2017.
The Committee and the Board also consulted with Fund counsel and the Independent Trustees’ independent legal counsel, who advised on various matters with respect to the Committee’s and the Board’s considerations and otherwise assisted the Committee and the Board in their deliberations.
The Committee and the Board considered all information that they, their legal counsel or the Investment Manager believed reasonably necessary to evaluate and to determine whether to recommend for approval or approve the Management Agreements and the Subadvisory Agreements. The information and factors considered by the Committee and the Board in recommending for approval or approving the Management Agreements and the Subadvisory Agreements for the Funds included the following:
| • | The Investment Manager’s agreement to contractually limit or cap total operating expenses for the Funds through July 31, 2019 so that total operating expenses (excluding certain fees and expenses, such as transaction costs and certain other investment related expenses, interest, taxes, and infrequent and/or unusual expenses) would not exceed a specified annual rate, as a percentage of each Fund’s net assets; |
| • | The terms and conditions of the Agreements; |
| • | Information on the Funds’ proposed management fees and anticipated total expenses, including information comparing the Funds’ anticipated expenses to those of a group of comparable mutual funds, as determined by the Investment Manager; |
| • | The current and proposed terms and conditions of other agreements and arrangements with affiliates of the Investment Manager relating to the operations of the Funds, including agreements with respect to the provision of distribution, transfer agency and shareholder services to the Funds; |
| • | Descriptions of various functions performed by the Investment Manager and the Subadviser under the Agreements, including portfolio management and portfolio trading practices; |
| • | Information regarding the reputation, regulatory history and resources of the Investment Manager, including information regarding senior management, portfolio managers and other personnel; and |
| • | Information regarding the capabilities of the Investment Manager and the Subadviser with respect to compliance monitoring services, including an assessment of the Investment Manager’s and the Subadviser’s compliance systems by the Funds’ Chief Compliance Officer. |
| 50 | Columbia Adaptive Retirement Funds | Annual Report 2018 |
Board Consideration and Approval of Management Agreement and Subadvisory Agreement (continued)
Nature, extent and quality of services to be provided under the Agreements
The Committee and the Board considered the nature, extent and quality of services to be provided to the Funds by the Investment Manager, the Subadviser and the Investment Manager’s affiliates under the Agreements and under separate agreements for the provision of distribution, transfer agency and shareholder services, and the resources to be dedicated to the Funds and the other Columbia Funds by the Investment Manager, the Subadviser and the Investment Manager’s affiliates. The Committee and the Board considered, among other things, the Investment Manager’s ability to attract, motivate and retain highly qualified research, advisory and supervisory investment professionals (including compensation programs for personnel involved in fund management, reputation and other attributes), the portfolio management services provided by those investment professionals, and the quality of the Investment Manager’s and the Subadviser’s investment research capabilities and trade execution services. The Committee and the Board also considered the potential benefits to shareholders of investing in a mutual fund that is part of a fund complex offering exposure to a variety of asset classes and investment disciplines and providing a variety of fund and shareholder services.
The Committee and the Board also considered the professional experience and qualifications of the senior personnel of the Investment Manager and the Subadviser, which included consideration of the Investment Manager’s and the Subadviser’s experience with similarly-structured funds. The Committee and the Board noted the compliance programs of and the compliance-related resources provided to the Funds by the Investment Manager and its affiliates, and considered the Investment Manager’s ability to provide administrative services to the Funds and coordinate the activities of the Funds’ other service providers. The Board also noted that the Board had approved the Subadviser’s code of ethics and compliance program, and that the Chief Compliance Officer of the Funds reports to the Trustees on the Subadviser’s compliance program.
The Committee and the Board also considered the scope of services provided to the Funds by the Investment Manager that would be distinct from and in addition to those provided by the Subadviser in the event that the Investment Manager, in the future, allocated investments to be managed by the Subadviser, including cash flow management, treasury services, risk oversight, investment oversight and Subadviser selection, oversight and transition management.
After reviewing these and related factors, the Committee and the Board concluded, within the context of their overall conclusions, that the expected nature, extent and quality of the services to be provided to the Funds under the Agreements supported the approval of the Agreements.
Investment performance
Because the Funds had not yet commenced operations, the Committee and the Board did not have investment performance to compare to the returns of a group of comparable mutual funds. However, the Committee and the Board expected to consider, in connection with their next review and consideration of the continuation of the Agreements, the investment performance of each Fund in relation to the annualized return for various time periods of both a group of comparable funds, as determined by the independent third-party data provider, and a benchmark.
The Committee and the Board also considered the Investment Manager’s and Subadviser’s performance and reputation generally, the Investment Manager’s historical responsiveness to Board concerns about performance, and the Investment Manager’s willingness to take steps intended to improve performance. After reviewing these and related factors, the Committee and the Board concluded, within the context of their overall conclusions, that the performance of the Investment Manager and the Subadviser were sufficient, in light of other considerations, to warrant the approval of the Agreements.
The Committee and the Board noted that they most recently reviewed the performance of the Columbia Adaptive Risk Allocation Fund, which utilizes an investment approach generally similar to the Funds, in connection with the Board’s most recent annual approval of the continuation of the management agreement with respect to the Columbia Adaptive Risk Allocation Fund at its June 14, 2017 Board meeting, including information about the performance of the Adaptive Risk Allocation Fund over various time periods, including performance information relative to benchmarks and information that compared the performance of the Adaptive Risk Allocation Fund to the performance of a group of comparable mutual funds as determined by an independent third party data provider.
Columbia Adaptive Retirement Funds | Annual Report 2018
| 51 |
Board Consideration and Approval of Management Agreement and Subadvisory Agreement (continued)
Investment management fee rates and other expenses
The Committee and the Board considered the management fees to be charged to the Funds under the Management Agreements and the Subadvisory Agreements, as well as the total expenses expected to be incurred by the Funds. In assessing the reasonableness of the proposed fees under the Agreements, the Committee and the Board considered, among other information, each Fund’s proposed management fee and its expected total expense ratio as a percentage of average daily net assets. The Committee and the Board also noted that the Investment Manager will pay the fees of the Subadviser if and when the Investment Manager allocates assets of the Funds to be managed by the Subadviser. The Committee and the Board noted that the Subadviser was not currently expected to manage any assets under the Subadvisory Agreements, but that the Investment Manager could, in the future, allocate investments to be managed by the Subadviser. The Committee and the Board also took into account the proposed fee waiver and expense limitation arrangements that the Investment Manager and the Subadviser would observe during each Fund’s first year, and the management fees and total expense ratios of comparable funds identified by the Investment Manager for purposes of expense comparison.
After reviewing these and related factors, the Committee and the Board concluded, within the context of their overall conclusions, that the management fee rates and expenses of the Funds supported the approval of the Agreements.
Costs of services to be provided and profitability
The Committee and the Board also took note of the costs the Investment Manager and its affiliates were expected to incur in connection with the services provided and the expected profitability to the Investment Manager and its affiliates from their relationships with the Funds, and also noted that the Committee and the Board expected to consider the costs of services and the profitability of the Investment Manager and its affiliates in connection with the Committee’s and the Board’s next review and consideration of the continuation of the Agreements. The Committee and the Board also considered court cases in which adviser profitability was an issue in whole or in part, the performance of similarly managed funds, the expected expense ratios of the Funds, and the implementation of expense limitations with respect to the Funds. In addition, the Committee and the Board considered information provided by the Investment Manager regarding the Investment Manager’s financial condition.
After reviewing these and related factors, the Committee and the Board concluded, within the context of their overall conclusions, that the anticipated costs of services to be provided and the expected profitability to the Investment Manager and its affiliates from their relationships with the Funds supported the approval of the Agreements.
Economies of scale
The Committee and the Board considered the potential existence of economies of scale in the provision by the Investment Manager of services to the Funds, to groups of related funds, and to the Investment Manager’s investment advisory clients as a whole, and whether those economies of scale were expected to be shared with the Funds through breakpoints in the proposed investment management fees or other means, such as expense limitation arrangements and additional investments by the Investment Manager in investment, trading, compliance and other resources.
After reviewing these and related factors, the Committee and the Board concluded, within the context of their overall conclusions, that the extent to which any economies of scale were expected to be shared with the Funds supported the approval of the Agreements.
Other benefits to the Investment Manager
The Committee and the Board received and considered information regarding “fall-out” or ancillary benefits to be received by the Investment Manager and its affiliates as a result of their relationships with the Funds, such as the engagement of the Investment Manager’s affiliates to provide distribution, transfer agency and shareholder services to the Funds. The Committee and the Board also considered the benefits of research made available to the Investment Manager by reason of brokerage commissions to be generated by the Funds’ securities transactions, and reviewed information about the Investment Manager’s practices with respect to allocating portfolio transactions for brokerage and research services. The Committee and the Board recognized that the Investment Manager’s profitability would be somewhat lower without these benefits.
| 52 | Columbia Adaptive Retirement Funds | Annual Report 2018 |
Board Consideration and Approval of Management Agreement and Subadvisory Agreement (continued)
Conclusion
The Committee and the Board reviewed all of the above considerations in reaching their decisions to recommend for approval or approve the proposed Agreements. In their deliberations, the Trustees did not identify any particular information that was all-important or controlling, and individual Trustees may have attributed different weights to the various factors. Based on their evaluation of all factors that they deemed to be material, including those factors described above, and assisted by the advice of independent legal counsel, the Board, including the Independent Trustees, voting separately, approved the Agreements.
Columbia Adaptive Retirement Funds | Annual Report 2018
| 53 |
Shareholders elect the Board that oversees the Funds’ operations. The Board appoints officers who are responsible for day-to-day business decisions based on policies set by the Board. The following table provides basic biographical information about the Funds’ Trustees, including their principal occupations during the past five years, although specific titles for individuals may have varied over the period. The year set forth beneath Length of Service in the table below is the year in which the Trustee was first appointed or elected as Trustee to any Fund currently in the Columbia Funds Complex or a predecessor thereof. Under current Board policy, members serve terms of indefinite duration.
Independent trustees
| Name, address, year of birth | Position held with the Trust and length of service | Principal occupation(s) during the past five years and other relevant professional experience | Number of Funds in the Columbia Fund Complex overseen | Other directorships held by Trustee during the past five years |
Janet Langford Carrig
c/o Columbia Management
Investment Advisers, LLC
225 Franklin Street
Mail Drop BX32 05228
Boston, MA 02110
1957 | Trustee
1996 | Senior Vice President, General Counsel and Corporate Secretary, ConocoPhillips (independent energy company) since September 2007 | 71 | None |
Douglas A. Hacker
c/o Columbia Management
Investment Advisers, LLC
225 Franklin Street
Mail Drop BX32 05228
Boston, MA 02110
1955 | Trustee and Chairman of the Board
1996 | Independent business executive since May 2006; Executive Vice President — Strategy of United Airlines from December 2002 to May 2006; President of UAL Loyalty Services (airline marketing company) from September 2001 to December 2002; Executive Vice President and Chief Financial Officer of United Airlines from July 1999 to September 2001 | 71 | Spartan Nash Company, (food distributor); Nash Finch Company (food distributor) from 2005 to 2013; Aircastle Limited (aircraft leasing); SeaCube Container Leasing Ltd. (container leasing) from 2010 to 2013; and Travelport Worldwide Limited (travel information technology) |
Nancy T. Lukitsh
c/o Columbia Management
Investment Advisers, LLC
225 Franklin Street
Mail Drop BX32 05228
Boston, MA 02110
1956 | Trustee
2011 | Senior Vice President, Partner and Director of Marketing, Wellington Management Company, LLP (investment adviser) from 1997 to 2010; Chair, Wellington Management Portfolios (commingled non-U.S. investment pools) from 2007 to 2010; Director, Wellington Trust Company, NA and other Wellington affiliates from 1997 to 2010 | 71 | None |
David M. Moffett
c/o Columbia Management
Investment Advisers, LLC
225 Franklin Street
Mail Drop BX32 05228
Boston, MA 02110
1952 | Trustee
2011 | Retired. Consultant to Bridgewater and Associates | 71 | Director, CSX Corporation; Genworth Financial, Inc. (financial and insurance products and services); PayPal Holdings Inc. (payment and data processing services); Trustee, University of Oklahoma Foundation; former Director, eBay Inc. (online trading community), 2007-2015; and former Director, CIT Bank, CIT Group Inc. (commercial and consumer finance), 2010-2016 |
John J. Neuhauser
c/o Columbia Management
Investment Advisers, LLC
225 Franklin Street
Mail Drop BX32 05228
Boston, MA 02110
1943 | Trustee
1984 | President, Saint Michael’s College since August 2007; Director or Trustee of several non-profit organizations, including University of Vermont Medical Center; Academic Vice President and Dean of Faculties, Boston College from August 1999 to October 2005; University Professor, Boston College from November 2005 to August 2007 | 71 | Liberty All-Star Equity Fund and Liberty All- Star Growth Fund (closed-end funds) |
| 54 | Columbia Adaptive Retirement Funds | Annual Report 2018 |
TRUSTEES AND OFFICERS (continued)
Independent trustees (continued)
| Name, address, year of birth | Position held with the Trust and length of service | Principal occupation(s) during the past five years and other relevant professional experience | Number of Funds in the Columbia Fund Complex overseen | Other directorships held by Trustee during the past five years |
Patrick J. Simpson
c/o Columbia Management
Investment Advisers, LLC
225 Franklin Street
Mail Drop BX32 05228
Boston, MA 02110
1944 | Trustee
2000 | Of Counsel, Perkins Coie LLP (law firm) since 2015; Partner, Perkins Coie LLP from 1988 to 2014 | 71 | None |
Anne-Lee Verville
c/o Columbia Management
Investment Advisers, LLC
225 Franklin Street
Mail Drop BX32 05228
Boston, MA 02110
1945 | Trustee
1998 | Retired. General Manager, Global Education Industry from 1994 to 1997, President – Application Systems Division from 1991 to 1994, Chief Financial Officer – US Marketing & Services from 1988 to 1991, and Chief Information Officer from 1987 to 1988, IBM Corporation (computer and technology) | 71 | Enesco Group, Inc. (producer of giftware and home and garden decor products) from 2001 to 2006 |
Consultants to the Independent Trustees*
| Name, address, year of birth | Position held with the Trust and length of service | Principal occupation(s) during the past five years and other relevant professional experience | Number of Funds in the Columbia Funds complex overseen | Other directorships held by Trustee during the past five years |
J. Kevin Connaughton
c/o Columbia
Management Investment
Advisers, LLC,
225 Franklin Street
Mail Drop BX32 05228,
Boston, MA 02110
1964 | Independent Trustee Consultant
2016 | Independent Trustee Consultant, Columbia Funds since March 2016; Adjunct Professor of Finance, Bentley University since November 2017; Managing Director and General Manager of Mutual Fund Products, Columbia Management Investment Advisers, LLC from May 2010 to February 2015; President, Columbia Funds from 2009 to 2015; and senior officer of Columbia Funds and affiliated funds from 2003 to 2015 | 71 | Director, The Autism Project since March 2015; former Trustee, New Century Portfolios, March 2015-December 2017; formerly on Board of Governors, Gateway Healthcare, January 2016 – December 2017 |
Natalie A. Trunow
c/o Columbia
Management Investment
Advisers, LLC,
225 Franklin Street
Mail Drop BX32 05228,
Boston, MA 02110
1967 | Independent Trustee Consultant
2016 | Independent Trustee Consultant, Columbia Funds since September 2016; Chief Executive Officer, Millennial Portfolio Solutions LLC (asset management and consulting services) since January 2016; Director of Investments, Casey Family Programs from April 2016 to September 2016; Senior Vice President and Chief Investment Officer, Calvert Investments from August 2008 to January 2016; Section Head and Portfolio Manager, General Motors Asset Management from June 1997 to August 2008 | 71 | Director, Health Services for Children with Special Needs, Inc.; Director, Guidewell Financial Solutions |
| * | J. Kevin Connaughton was appointed consultant to the Independent Trustees effective March 1, 2016. Natalie A. Trunow was appointed consultant to the Independent Trustees effective September 1, 2016. Shareholders of the Funds are expected to be asked to elect each of Mr. Connaughton and Ms. Trunow as a Trustee at a future shareholder meeting. |
Columbia Adaptive Retirement Funds | Annual Report 2018
| 55 |
TRUSTEES AND OFFICERS (continued)
Interested trustee affiliated with Investment Manager*
| Name, address, year of birth | Position held with the Trust and length of service | Principal occupation(s) during the past five years and other relevant professional experience | Number of Funds in the Columbia Funds Complex overseen | Other directorships held by Trustee during the past five years |
William F. Truscott
c/o Columbia Management
Investment Advisers, LLC
225 Franklin Street
Boston, MA 02110
1960 | Trustee
2012 | Chairman of the Board and President, Columbia Management Investment Advisers, LLC since May 2010 and February 2012, respectively; Chief Executive Officer, Global Asset Management, Ameriprise Financial, Inc. since September 2012 (previously Chief Executive Officer, U.S. Asset Management & President, Annuities, May 2010-September 2012); Director and Chief Executive Officer, Columbia Management Investment Distributors, Inc. since May 2010 and February 2012, respectively; Chairman of the Board and Chief Executive Officer, RiverSource Distributors, Inc. since 2006; Director, Threadneedle Asset Management Holdings, SARL since 2014; President and Chief Executive Officer, Ameriprise Certificate Company, 2006-August 2012 | 196 | Chairman of the Board, Columbia Management Investment Advisers, LLC since May 2010; Director, Columbia Management Investment Distributors, Inc. since May 2010; former Director, Ameriprise Certificate Company, 2006 - January 2013 |
| * | Interested person (as defined under the 1940 Act) by reason of being an officer, director, security holder and/or employee of the Investment Manager or Ameriprise Financial. |
The Statement of Additional Information has additional information about the Funds’ Board members and is available, without charge, upon request by calling 800.345.6611, visiting columbiathreadneedleus.com/investor/ or contacting your financial intermediary.
| 56 | Columbia Adaptive Retirement Funds | Annual Report 2018 |
TRUSTEES AND OFFICERS (continued)
The Board has appointed officers who are responsible for day-to-day business decisions based on policies it has established. The officers serve at the pleasure of the Board. The following table provides basic information about the Officers of the Funds, including principal occupations during the past five years, although their specific titles may have varied over the period. In addition to Mr. Truscott, who is Senior Vice President, the Funds’ other officers are:
Fund officers
Name,
address and
year of birth | Position and year
first appointed to
position for any Fund
in the Columbia
Funds complex or a
predecessor thereof | Principal occupation(s) during past five years |
Christopher O. Petersen
5228 Ameriprise
Financial Center
Minneapolis, MN 55474
Born 1970 | President and Principal Executive Officer (2015) | Vice President and Lead Chief Counsel, Ameriprise Financial, Inc. since January 2015 (previously, Vice President and Chief Counsel, January 2010 - December 2014; officer of Columbia Funds and affiliated funds since 2007. |
Michael G. Clarke
225 Franklin Street
Boston, MA 02110
Born 1969 | Treasurer (2011), Chief Financial Officer (2009) and Chief Accounting Officer (2015) | Vice President — Mutual Fund Administration, Columbia Management Investment Advisers, LLC, since May 2010; senior officer of Columbia Funds and affiliated funds since 2002. |
Paul B. Goucher
100 Park Avenue
New York, NY 10017
Born 1968 | Senior Vice President (2011) and Assistant Secretary (2008) | Senior Vice President and Assistant General Counsel, Ameriprise Financial, Inc. since January 2017 (previously Vice President and Lead Chief Counsel, November 2008 - January 2017 and January 2013 - January 2017, respectively; and Chief Counsel, January 2010 - January 2013); Vice President, Chief Legal Officer and Assistant Secretary, Columbia Management Investment Advisers, LLC since May 2010. |
Thomas P. McGuire
225 Franklin Street
Boston, MA 02110
Born 1972 | Senior Vice President and Chief Compliance Officer (2012) | Vice President — Asset Management Compliance, Ameriprise Financial, Inc., since May 2010; Chief Compliance Officer, Ameriprise Certificate Company since September 2010. |
Colin Moore
225 Franklin Street
Boston, MA 02110
Born 1958 | Senior Vice President (2010) | Executive Vice President and Global Chief Investment Officer, Ameriprise Financial, Inc., since July 2013; Executive Vice President and Global Chief Investment Officer, Columbia Management Investment Advisers, LLC since July 2013 (previously Director and Global Chief Investment Officer, 2010 - 2013). |
Ryan C. Larrenaga
225 Franklin Street
Boston, MA 02110
Born 1970 | Senior Vice President (2017), Chief Legal Officer (2017) and Secretary (2015) | Vice President and Group Counsel, Ameriprise Financial, Inc. since August 2011; officer of Columbia Funds and affiliated funds since 2005. |
Michael E. DeFao
225 Franklin Street
Boston, MA 02110
Born 1968 | Vice President (2011) and Assistant Secretary (2010) | Vice President and Chief Counsel, Ameriprise Financial, Inc. since May 2010. |
Amy Johnson
5228 Ameriprise
Financial Center
Minneapolis, MN 55474
Born 1965 | Vice President (2006) | Managing Director and Global Head of Operations, Columbia Management Investment Advisers, LLC since April 2016 (previously Managing Director and Chief Operating Officer, 2010 - 2016). |
Lyn Kephart-Strong
5228 Ameriprise
Financial Center
Minneapolis, MN 55474
Born 1960 | Vice President (2015) | President, Columbia Management Investment Services Corp. since October 2014; Vice President & Resolution Officer, Ameriprise Trust Company since August 2009. |
Columbia Adaptive Retirement Funds | Annual Report 2018
| 57 |
The Funds mail one shareholder report to each shareholder address. If you would like more than one report, please call shareholder services at 800.345.6611 and additional reports will be sent to you.
Proxy voting policies and procedures
The policy of the Board of Trustees is to vote the proxies of the companies in which the Funds hold investments consistent with the procedures as stated in the Statement of Additional Information (SAI). You may obtain a copy of the SAI without charge by calling 800.345.6611; contacting your financial intermediary; visiting columbiathreadneedleus.com/investor/; or searching the website of the Securities and Exchange Commission (SEC) at sec.gov. Information regarding how the Funds voted proxies relating to portfolio securities is filed with the SEC by August 31st for the most recent 12-month period ending June 30th of that year, and is available without charge by visiting columbiathreadneedleus.com/investor/, or searching the website of the SEC at sec.gov.
Quarterly schedule of investments
The Funds file a complete schedule of portfolio holdings with the SEC for the first and third quarters of each fiscal year on Form N-Q. The Funds’ Form N-Q is available on the SEC’s website at sec.gov and may be reviewed and copied at the SEC’s Public Reference Room in Washington, D.C. Information on the operation of the Public Reference Room may be obtained by calling 800.SEC.0330. The Funds’ complete schedule of portfolio holdings, as filed on Form N-Q, can also be obtained without charge, upon request, by calling 800.345.6611.
Additional Fund information
For more information about the Funds, please visit columbiathreadneedleus.com/investor/ or call 800.345.6611. Customer Service Representatives are available to answer your questions Monday through Friday from 8 a.m. to 7 p.m. Eastern time.
Fund investment manager
Columbia Management Investment Advisers, LLC
225 Franklin Street
Boston, MA 02110
Fund distributor
Columbia Management Investment Distributors, Inc.
225 Franklin Street
Boston, MA 02110
Fund transfer agent
Columbia Management Investment Services Corp.
P.O. Box 8081
Boston, MA 02266-8081
| 58 | Columbia Adaptive Retirement Funds | Annual Report 2018 |
[THIS PAGE INTENTIONALLY LEFT BLANK]
[THIS PAGE INTENTIONALLY LEFT BLANK]
[THIS PAGE INTENTIONALLY LEFT BLANK]
Columbia Adaptive Retirement Funds
P.O. Box 8081
Boston, MA 02266-8081
Please read and consider the investment objectives, risks, charges and expenses for any fund carefully before investing. For a prospectus and summary prospectus, which contains this and other important information about the Funds, go to
columbiathreadneedleus.com/investor/. The Funds are distributed by Columbia Management Investment Distributors, Inc., member FINRA, and managed by Columbia Management Investment Advisers, LLC.
Columbia Threadneedle Investments (Columbia Threadneedle) is the global brand name of the Columbia and Threadneedle group of companies. All rights reserved. Columbia Management Investment Distributors, Inc., 225 Franklin Street, Boston, MA 02110-2804
© 2018 Columbia Management Investment Advisers, LLC.
columbiathreadneedleus.com/investor/
Item 2. Code of Ethics.
| | (a) | The registrant has adopted a code of ethics that applies to the registrant’s principal executive officer, principal financial officer, principal accounting officer or controller, or persons performing similar functions, regardless of whether these individuals are employed by the registrant or a third party. |
| | (b) | During the period covered by this report, there were not any amendments to a provision of the code of ethics adopted in 2(a) above. |
| | (c) | During the period covered by this report, there were no waivers, including any implicit waivers, from a provision of the code of ethics described in 2(a) above that relates to one or more of the items set forth in paragraph (b) of this item’s instructions. |
Item 3. Audit Committee Financial Expert.
The registrant’s Board of Trustees has determined that Douglas A. Hacker, David M. Moffett and Anne-Lee Verville, each of whom are members of the registrant’s Board of Trustees and Audit Committee, each qualify as an audit committee financial expert. Mr. Hacker, Mr. Moffett and Ms. Verville are each independent trustees, as defined in paragraph (a)(2) of this item’s instructions.
Item 4. Principal Accountant Fees and Services.
Fee information below is disclosed for the one series of the registrant whose reports to stockholders are included in this annual filing. Seven series commenced operations on October 25, 2017.
(a) Audit Fees. Aggregate Audit Fees billed by the principal accountant for professional services rendered during the fiscal years ended March 31, 2018 and March 31, 2017 are approximately as follows:
| | | | |
| 2018 | | 2017 | |
| $185,100 | | $ | 74,700 | |
Audit Fees include amounts related to the audit of the registrant’s annual financial statements or services that are normally provided by the accountant in connection with statutory and regulatory filings or engagements for those fiscal years.
(b) Audit-Related Fees. Aggregate Audit-Related Fees billed to the registrant by the principal accountant for professional services rendered during the fiscal years ended March 31, 2018 and March 31, 2017 are approximately as follows:
Audit-Related Fees include amounts for assurance and related services by the principal accountant that are reasonably related to the performance of the audit of the registrant’s financial statements and are not reported in Audit Fees above. In fiscal year 2017, Audit-Related Fees consist of agreed-upon procedures performed for semi-annual shareholder reports. Fiscal year 2017 also includes agreed-upon procedures related to issuance of consents and review of Form N-1A.
During the fiscal years ended March 31, 2018 and March 31, 2017, there were no Audit-Related Fees billed by the registrant’s principal accountant to the registrant’s investment adviser (not including any sub-adviser whose role is primarily portfolio management and is subcontracted with or overseen by another investment adviser) and any entity controlling, controlled by, or under common control with the adviser that provides ongoing services to the registrant for an engagement that related directly to the operations and financial reporting of the registrant.
(c) Tax Fees. Aggregate Tax Fees billed by the principal accountant to the registrant for professional services rendered during the fiscal years ended March 31, 2018 and March 31, 2017 are approximately as follows:
| | | | |
| 2018 | | 2017 | |
| $34,000 | | $ | 18,000 | |
Tax Fees include amounts for the review of annual tax returns, the review of required shareholder distribution calculations and typically include amounts for professional services by the principal accountant for tax compliance, tax advice and tax planning. Fiscal year 2018 and 2017 also include Tax Fees for foreign tax filings.
During the fiscal years ended March 31, 2018 and March 31, 2017, there were no Tax Fees billed by the registrant’s principal accountant to the registrant’s investment adviser (not including any sub-adviser whose role is primarily portfolio management and is subcontracted with or overseen by another investment adviser) and any entity controlling, controlled by, or under common control with the adviser that provides ongoing services to the registrant for an engagement that related directly to the operations and financial reporting of the registrant.
(d) All Other Fees. Aggregate All Other Fees billed by the principal accountant to the registrant for professional services rendered during the fiscal years ended March 31, 2018 and March 31, 2017 are approximately as follows:
All Other Fees include amounts for products and services provided by the principal accountant, other than the services reported in paragraphs (a) through (c) above.
Aggregate All Other Fees billed by the registrant’s principal accountant to the registrant’s investment adviser (not including any sub-adviser whose role is primarily portfolio management and is subcontracted with or overseen by another investment adviser) and any entity controlling, controlled by, or under common control with the adviser that provides ongoing services to the registrant for an engagement that related directly to the operations and financial reporting of the registrant during the fiscal years ended March 31, 2018 and March 31, 2017 are approximately as follows:
| | | | |
| 2018 | | 2017 | |
| $225,000 | | $ | 225,000 | |
In fiscal years 2018 and 2017, All Other Fees primarily consists of fees billed for internal control examinations of the registrant’s transfer agent and investment adviser.
(e)(1) Audit Committee Pre-Approval Policies and Procedures
The registrant’s Audit Committee is required to pre-approve the engagement of the registrant’s independent auditors to provide audit and non-audit services to the registrant and non-audit services to its investment adviser (excluding any sub-adviser whose role is primarily portfolio management and is sub-contracted or overseen by another investment adviser (the “Adviser”) or any entity controlling, controlled by or under common control with the Adviser that provides ongoing services to the Fund (a “Control Affiliate”) if the engagement relates directly to the operations and financial reporting of the registrant.
The Audit Committee has adopted a Policy for Engagement of Independent Auditors for Audit and Non-Audit Services (the “Policy”). The Policy sets forth the understanding of the Audit Committee regarding the engagement of the registrant’s independent accountants to provide (i) audit and permissible audit-related, tax and other services to the registrant (“Fund Services”); (ii) non-audit services to the registrant’s Adviser and any Control Affiliates, that relates directly to the operations and financial reporting of a Fund (“Fund-related Adviser Services”); and (iii) certain other audit and non-audit services to the registrant’s Adviser and its Control Affiliates. A service will require specific pre-approval by the Audit Committee if it is to be provided by the Fund’s independent auditor; provided, however, that pre-approval of non-audit services to the Fund, the Adviser or Control Affiliates may be waived if certain de minimis requirements set forth in the SEC’s rules are met.
Under the Policy, the Audit Committee may delegate pre-approval authority to any pre-designated member or members who are independent board members. The member(s) to whom such authority is delegated must report, for informational purposes only, any pre-approval decisions to the Audit Committee at its next regular meeting. The Audit Committee’s responsibilities with respect to the pre-approval of services performed by the independent auditor may not be delegated to management.
On an annual basis, at a regularly scheduled Audit Committee meeting, the Fund’s Treasurer or other Fund officer shall submit to the Audit Committee a schedule of the types of Fund Services and Fund-related Adviser Services that are subject to specific pre-approval.
This schedule will provide a description of each type of service that is subject to specific pre-approval, along with total projected fees for each service. The pre-approval will generally cover a one-year period. The Audit Committee will review and approve the types of services and the projected fees for the next one-year period and may add to, or subtract from, the list of pre-approved services from time to time, based on subsequent determinations. This specific approval acknowledges that the Audit Committee is in agreement with the specific types of services that the independent auditor will be permitted to perform and the projected fees for each service.
The Fund’s Treasurer or other Fund officer shall report to the Audit Committee at each of its regular meetings regarding all Fund Services or Fund-related Adviser Services provided since the last such report was rendered, including a description of the services, by category, with forecasted fees for the annual reporting period, proposed changes requiring specific pre-approval and a description of services provided by the independent auditor, by category, with actual fees during the current reporting period.
*****
(e)(2) 100% of the services performed for items (b) through (d) above during 2018 and 2017 were pre-approved by the registrant’s Audit Committee.
(f) Not applicable.
(g) The aggregate non-audit fees billed by the registrant’s accountant for services rendered to the registrant, and rendered to the registrant’s investment adviser (not including any sub-adviser whose role is primarily portfolio management and is subcontracted with or overseen by another investment adviser), and any entity controlling, controlled by, or under common control with the adviser that provides ongoing services to the registrant during the fiscal years ended March 31, 2018 and March 31, 2017 are approximately as follows:
| | | | |
| 2018 | | 2017 | |
| $259,000 | | $ | 250,700 | |
(h) The registrant’s Audit Committee of the Board of Directors has considered whether the provision of non-audit services that were rendered to the registrant’s adviser (not including any sub-adviser whose role is primarily portfolio management and is subcontracted with or overseen by another investment adviser), and any entity controlling, controlled by, or under common control with the investment adviser that provides ongoing services to the registrant that were not pre-approved pursuant to paragraph (c)(7)(ii) of Rule 2-01 of Regulation S-X, is compatible with maintaining the principal accountant’s independence.
Item 5. Audit Committee of Listed Registrants.
Not applicable.
Item 6. Investments
| | (a) | The registrant’s “Schedule I – Investments in securities of unaffiliated issuers” (as set forth in 17 CFR 210.12-12) is included in Item 1 of this Form N-CSR. |
Item 7. Disclosure of Proxy Voting Policies and Procedures for Closed-End Management Investment Companies.
Not applicable.
Item 8. Portfolio Managers of Closed-End Management Investment Companies.
Not applicable.
Item 9. Purchases of Equity Securities by Closed-End Management Investment Company and Affiliated Purchasers.
Not applicable.
Item 10. Submission of Matters to a Vote of Security Holders.
There were no material changes to the procedures by which shareholders may recommend nominees to the registrant’s board of directors.
Item 11. Controls and Procedures.
| | (a) | The registrant’s principal executive officer and principal financial officer, based on their evaluation of the registrant’s disclosure controls and procedures as of a date within 90 days of the filing of this report, have concluded that such controls and procedures are adequately designed to ensure that material information required to be disclosed by the registrant in Form N-CSR is accumulated and communicated to the registrant’s management, including the principal executive officer and principal financial officer, or persons performing similar functions, as appropriate to allow timely decisions regarding required disclosure. |
| | (b) | There was no change in the registrant’s internal control over financial reporting that occurred during the registrant’s second fiscal quarter of the period covered by this report that has materially affected, or is reasonably likely to materially affect, the registrant’s internal control over financial reporting. |
Item 12. Disclosure of Securities Lending Activities for Closed-End Management Investment Companies
Not applicable.
Item 13. Exhibits.
(a)(1) Code of ethics required to be disclosed under Item 2 of Form N-CSR attached hereto as Exhibit 99.CODE ETH.
(a)(2) Certifications pursuant to Rule 30a-2(a) under the Investment Company Act of 1940 (17 CFR 270.30a-2(a)) attached hereto as Exhibit 99.CERT.
(a)(3) Not applicable.
(b) Certification pursuant to Rule 30a-2(b) under the Investment Company Act of 1940 (17 CFR 270.30a-2(b)) attached hereto as Exhibit 99.906CERT.
SIGNATURES
Pursuant to the requirements of the Securities Exchange Act of 1934 and the Investment Company Act of 1940, the registrant has duly caused this report to be signed on its behalf by the undersigned, thereunto duly authorized.
| | |
| (registrant) | | Columbia Funds Series Trust I |
| | |
| By (Signature and Title) | | /s/ Christopher O. Petersen |
| | Christopher O. Petersen, President and Principal Executive Officer |
Pursuant to the requirements of the Securities Exchange Act of 1934 and the Investment Company Act of 1940, this report has been signed below by the following persons on behalf of the registrant and in the capacities and on the dates indicated.
| | |
| By (Signature and Title) | | /s/ Christopher O. Petersen |
| | Christopher O. Petersen, President and Principal Executive Officer |
| | |
| By (Signature and Title) | | /s/ Michael G. Clarke |
| | Michael G. Clarke, Treasurer and Chief Financial Officer |